Energy Balance and Weight Control Dr. David L. Gee FCSN 245-Basic Nutrition.
67
Energy Balance and Weight Control Dr. David L. Gee FCSN 245-Basic Nutrition
-
date post
20-Dec-2015 -
Category
Documents
-
view
219 -
download
3
Transcript of Energy Balance and Weight Control Dr. David L. Gee FCSN 245-Basic Nutrition.
Energy Balance and Weight Control
Dr. David L. Gee
FCSN 245-Basic Nutrition
Energy Balance
EB = E(in) - E(out) E(in) = dietary intake of energy E(out) = energy expenditure

Energy Balance:The Key to Weight Change
When E(in) < E(out) Negative energy balance weight loss
When E(in) > E(out) Positive energy balance weight gain
When E(in) = E(out) Zero energy balance no weight change
How do you measure:Energy (in)
Calories = energy required to heat 1 kg
water by 1 degree C. Bomb Calorimeter

©2001 Brooks/Cole, a division of Thomson Learning, Inc. Thomson Learning™ is a trademark used herein under license.

How do you measure: E(out) Direct Calorimetry
measures heat directly bomb calorimeter (for food) room calorimeter
Indirect Calorimetry measures oxygen consumed or carbon dioxide produced
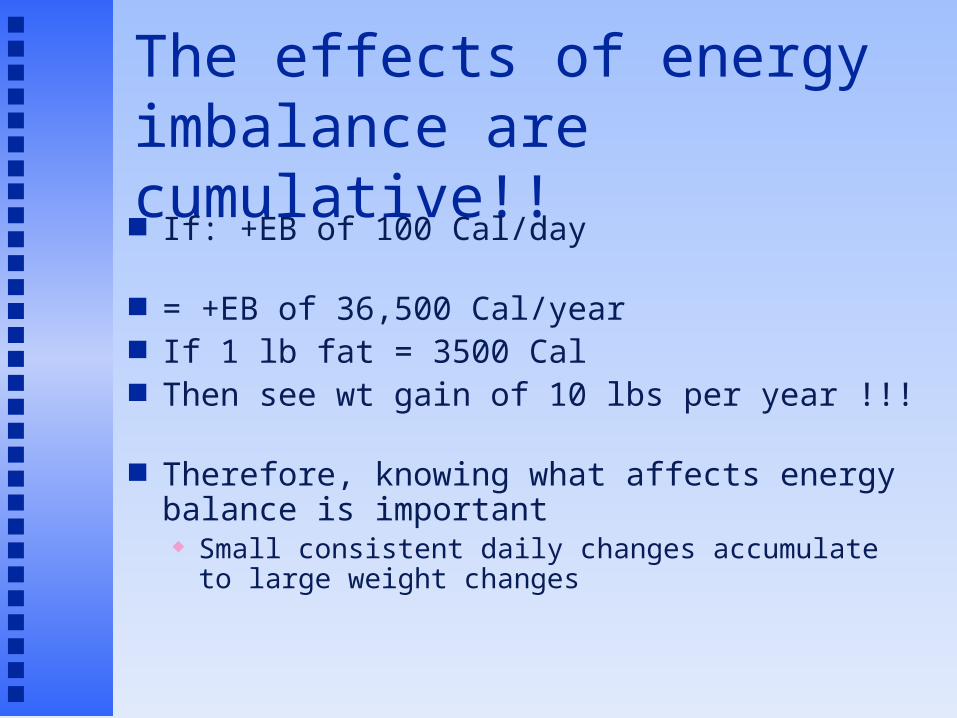
The effects of energy imbalance are cumulative!! If: +EB of 100 Cal/day
= +EB of 36,500 Cal/year If 1 lb fat = 3500 Cal Then see wt gain of 10 lbs per year !!!
Therefore, knowing what affects energy balance is important Small consistent daily changes accumulate to large
weight changes
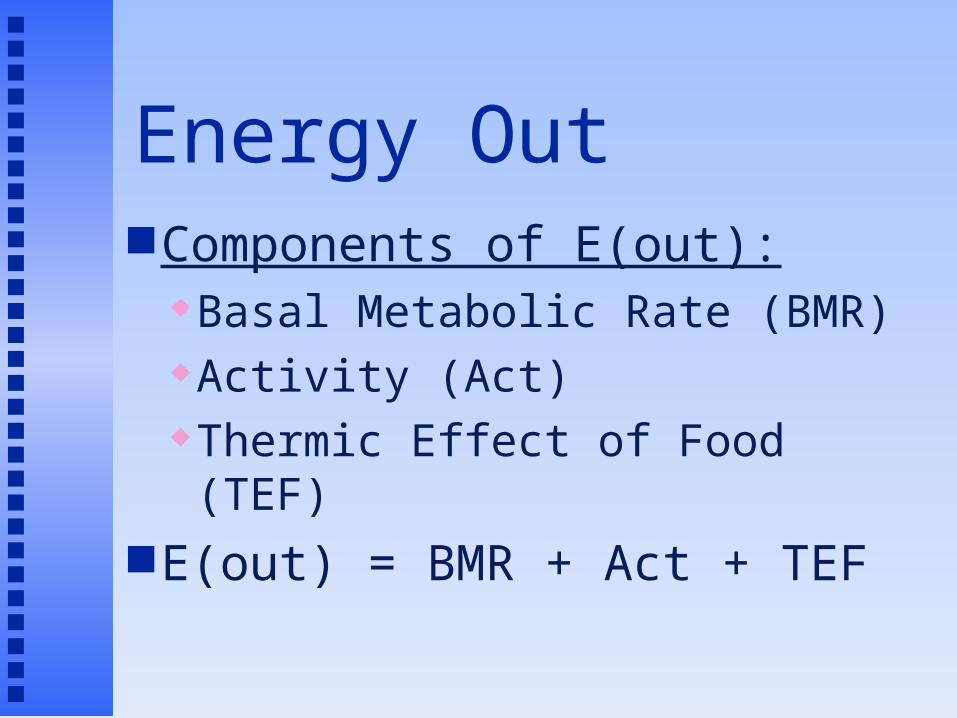
Energy Out Components of E(out):
Basal Metabolic Rate (BMR) Activity (Act) Thermic Effect of Food (TEF)
E(out) = BMR + Act + TEF

Basal Metabolic Rate Energy essential for life support
Circulation Respiration Temperature Maintenance Nerve Transmission Kidney Function, etc

Basal Metabolic Rate Estimation of BMR: BMR = 0.9 - 1 Cal / kg BW / hr Example:
120 lbs / 2.2 lbs/kg = 55 kg BMR = 55 x 1 x 24hr/d BMR = 1320 Cal / day

Basal Metabolic Rate Factors affecting BMR Age
Height
Growth
Body Composition

Basal Metabolic Rate
Factors affecting BMR Fever
Stress
Undernutrition
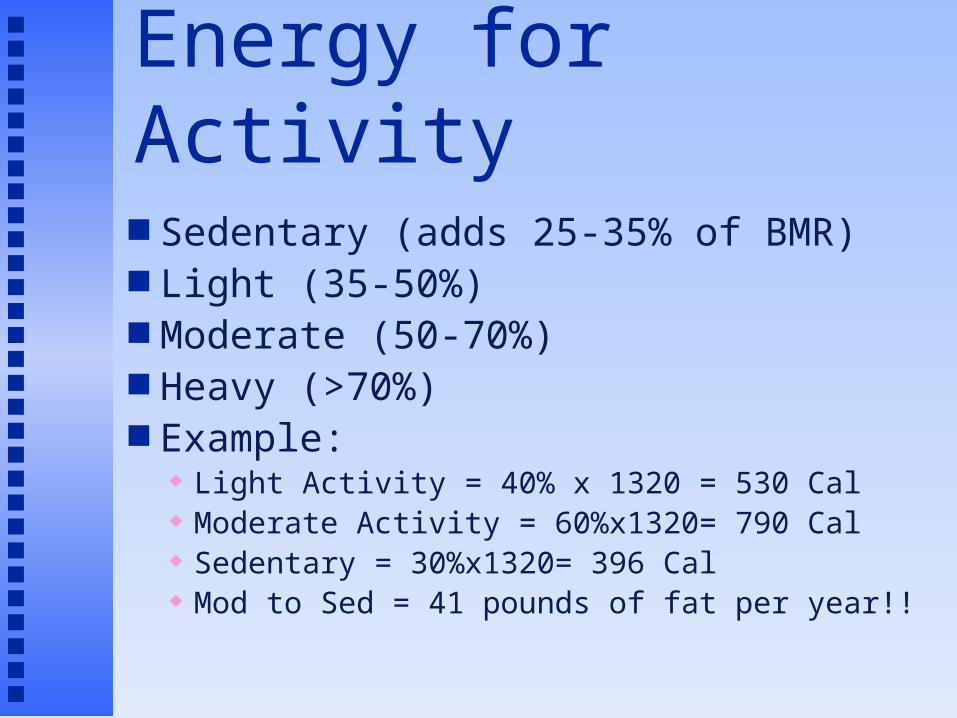
Energy for Activity Sedentary (adds 25-35% of BMR) Light (35-50%) Moderate (50-70%) Heavy (>70%) Example:
Light Activity = 40% x 1320 = 530 Cal Moderate Activity = 60%x1320= 790 Cal Sedentary = 30%x1320= 396 Cal Mod to Sed = 41 pounds of fat per year!!
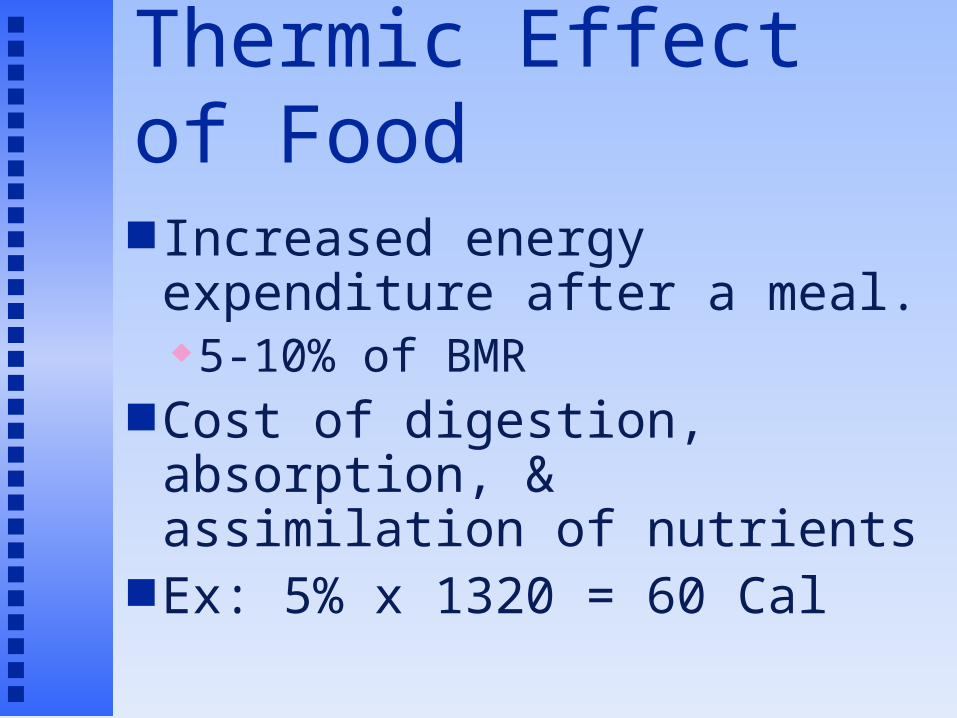
Thermic Effect of Food Increased energy expenditure
after a meal. 5-10% of BMR
Cost of digestion, absorption, & assimilation of nutrients
Ex: 5% x 1320 = 60 Cal
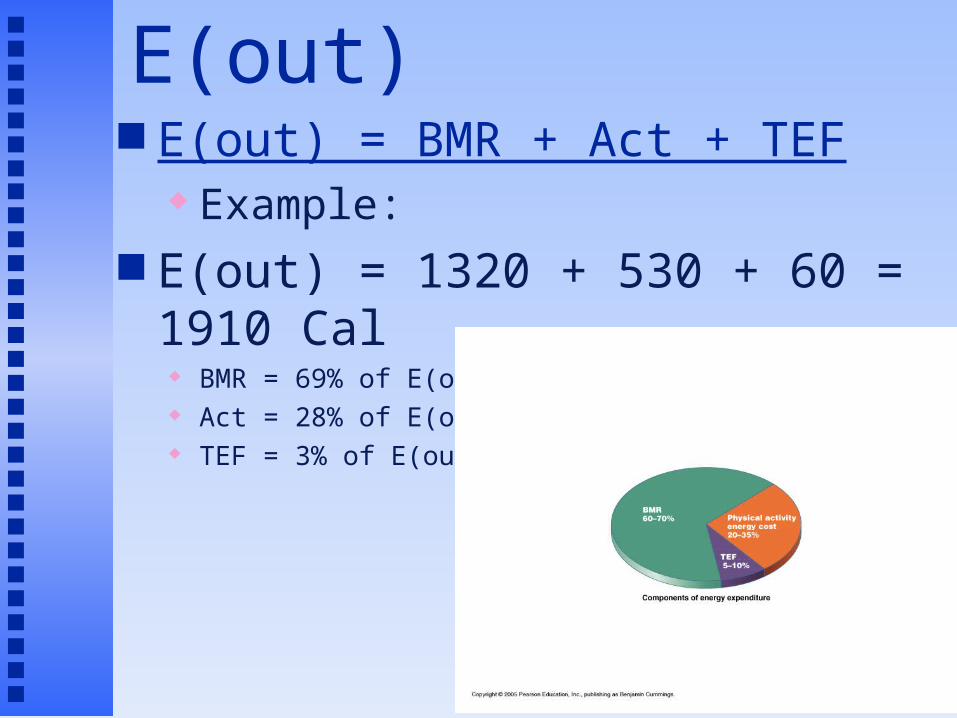
Estimation of E(out) E(out) = BMR + Act + TEF
Example: E(out) = 1320 + 530 + 60 = 1910 Cal
BMR = 69% of E(out) Act = 28% of E(out) TEF = 3% of E(out)
Healthy Weight and the Non-Diet Approach
David L. Gee, PhD
Professor of Food Science and Nutrition
Central Washington University

Prevalence of Overweight in the US 1990: 56% of Americans were overweight
23% were obese 2000: 64% of Americans were overweight
30% were obese At this rate
In 2010: 73% overweight In 2020: 84% overweight In 2030: 96% overweight
Increases in overweight/obesity were seen in: Both males and females All age groups All ethnic groups

The increase in prevalence in people with BMI > 25 was almostEntirely due to increased prevalence of obese!!! Overweight may be a transitional state for most Americans !!!

Ethnicity and Overweight (BMI>27.5) Prevalence
White Black Hispanic Native Am Hawaiian
2427 26
45
31
42
3440
6663
0
10
20
30
40
50
60
70
%
White Black Hispanic Native Am Hawaiian
Male
Female
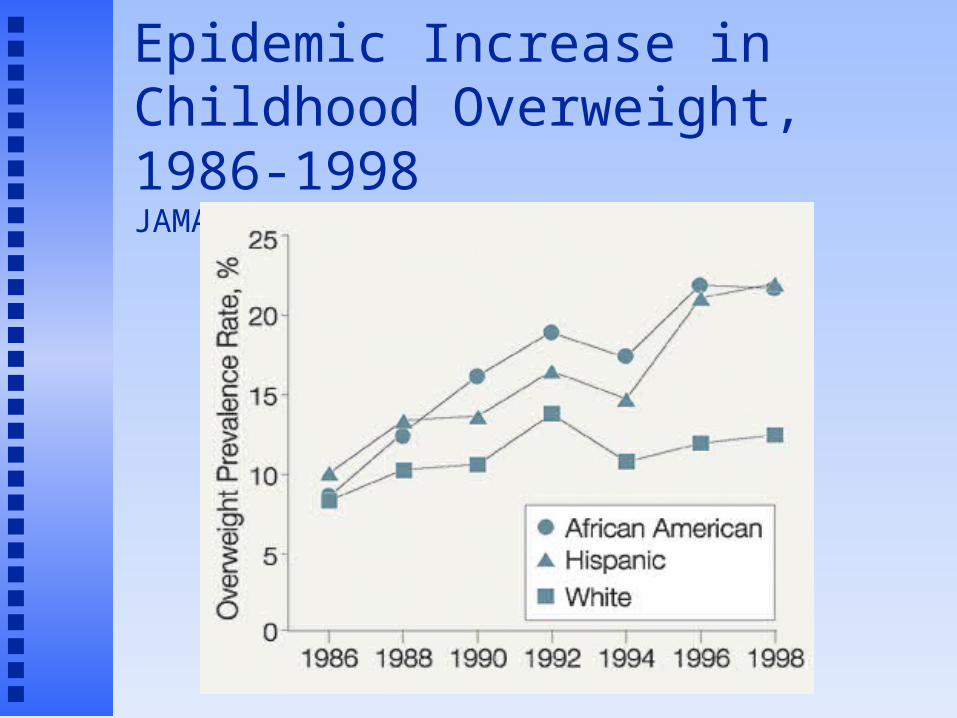
Epidemic Increase in Childhood Overweight, 1986-1998JAMA 286:2845-2848 (2001)
National Longitudinal Survey of Youth 1986-1998 8,270 children, aged 4-12 yrs
Prior studies show it took 30 years for overweight prevalence to double. Current study show doubling time to be less than 12 years. Rate of increase particularly high in African
American and Hispanic children
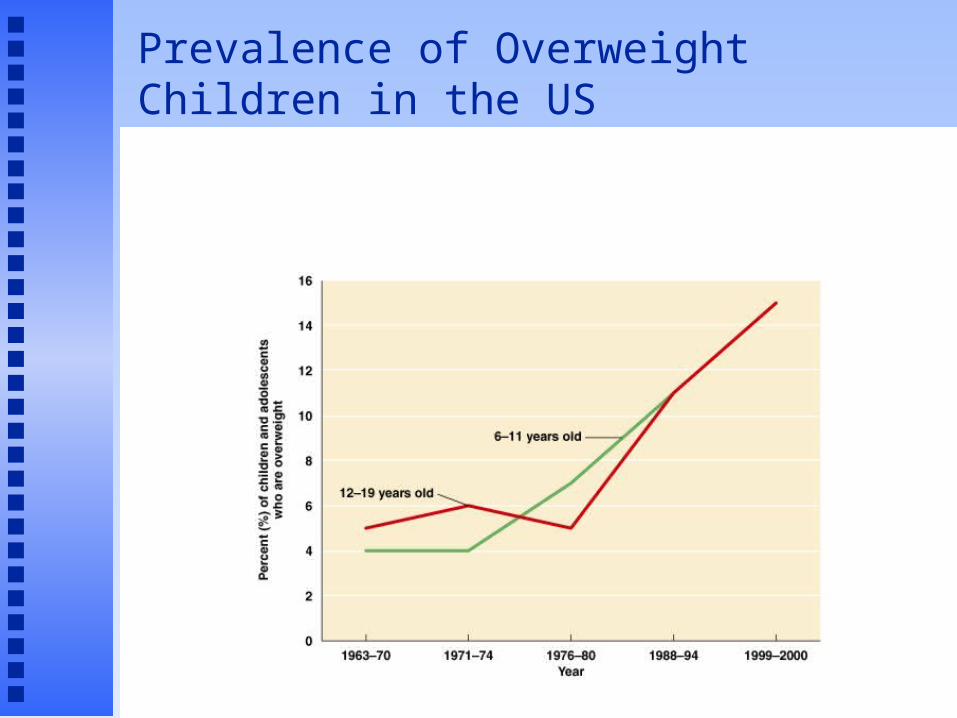
Prevalence of Overweight Children in the US
Epidemic Increase in Childhood Overweight, 1986-1998JAMA 286:2845-2848 (2001)
Prevalence of overweight in children. CDC (2004)
Overweight = above the 95th percentile for BMI based on NHANES II data from 1970’s
For adolescents 12-19 yrs: 1974 = 7.4% 2002 = 15.6%
Genes/Biology vs Environment Overweight is a result of both Adoption studies (biology)
Adopted adults have BMI that are more similar to biological parents than to adoptive parents.
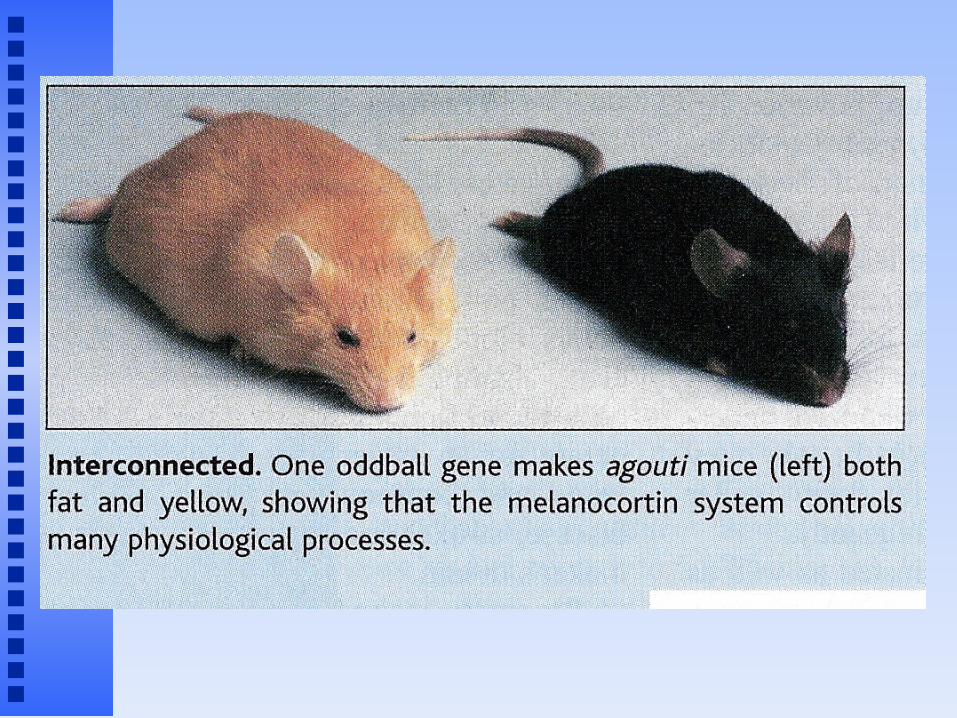
Animal studies (biology) genetically obese rats and mice

Genes/Biology vs Environment (cont.)
Migration studies (environment) Japanese Hawaiian Japanese Californian Japanese
Dietary Change Studies (biology and environment) SW Native Americans

Pima Indians Mexican Pima Indians
subsistence farming & ranching 20% fat diet, 40 hrs/wk physical work
Arizona Pima Indians mechanized agriculture, sedentary lifestyle 40% fat diet
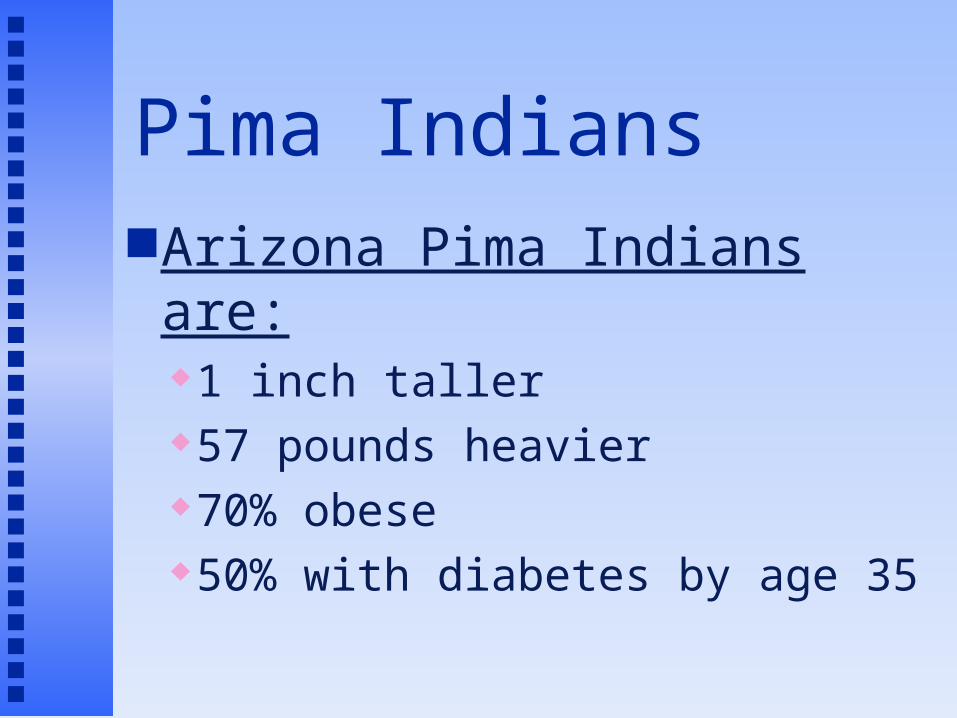
Pima IndiansArizona Pima Indians are:
1 inch taller 57 pounds heavier 70% obese 50% with diabetes by age 35

Genes vs Environment: Conclusions Genes for weight gain
predisposes some individuals towards weight gain.
Environment determines which of those individuals actually gain weight.

Why lose weight?
Obesity is associated with greater risk of: Diabetes Hypertension & stroke Coronary heart disease Most cancers (except lung cancer) Sleep apnea, arthritis, gall stones, ….
Overfat vs Underfit ???? Good question Vast majority of overfat are underfit
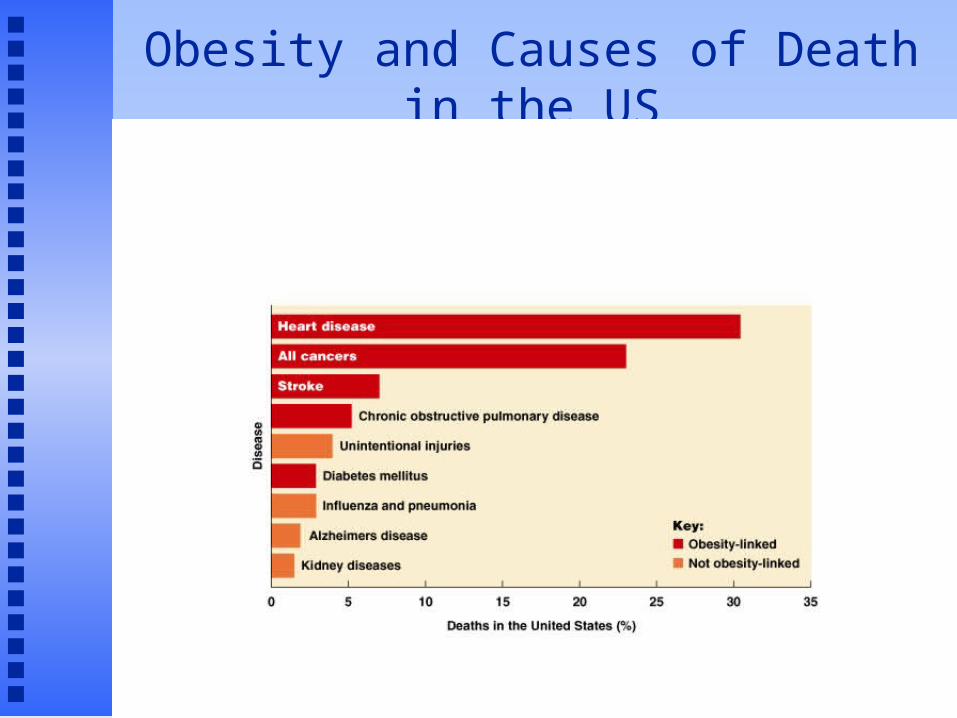
Obesity and Causes of Death in the US

The Obesity Epidemic in America:Who’s responsible?
Personal responsibility Environmental influences
Do we need a “Food Police”? http://www.nytimes.com/2005/06/12/business/yourmon
ey/12food.html?pagewanted=1
What is a “Healthy Weight”?
A broad range of weight which allows for minimal risks for chronic diseases.
Goes beyond using only body weight as a criteria for good health.
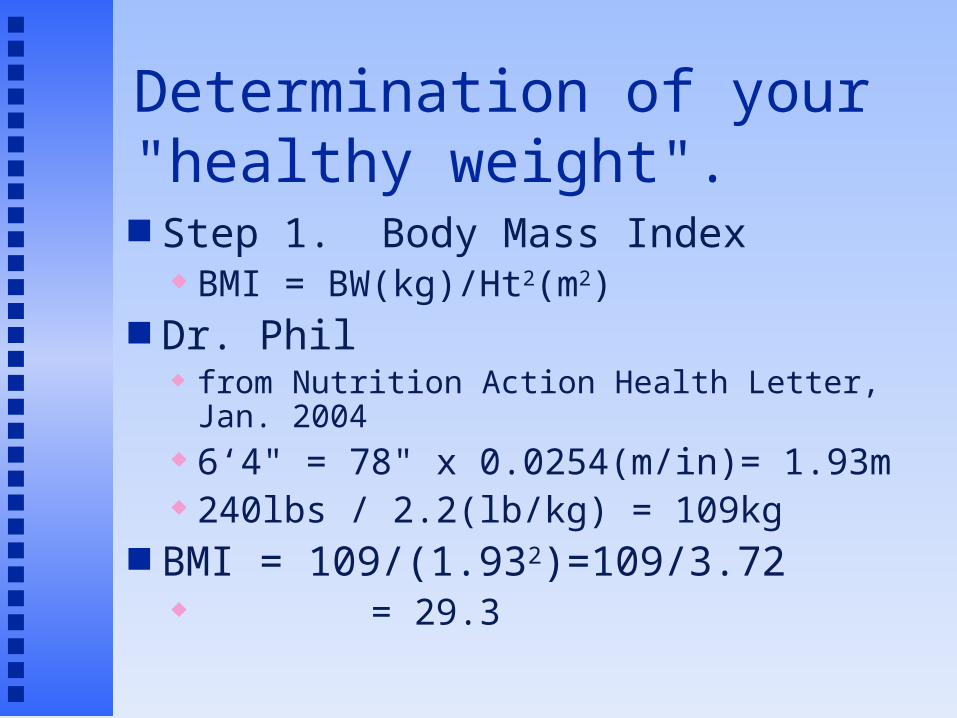
Determination of your "healthy weight". Step 1. Body Mass Index
BMI = BW(kg)/Ht2(m2) Dr. Phil
from Nutrition Action Health Letter, Jan. 2004 6‘4" = 78" x 0.0254(m/in)= 1.93m 240lbs / 2.2(lb/kg) = 109kg
BMI = 109/(1.932)=109/3.72 = 29.3

BMI Classifications
BMI = 19 - 25 => Desirable BMI = 25 - 30 => Overweight BMI = 30 - 35 => Obese, category 1 BMI = 35 - 40 => Obese, category 2 BMI > 40 => Severe obesity “Healthy weight is a broad range of weight…”
For 5’10”, BMI 19-25 = 132 – 174 lbs
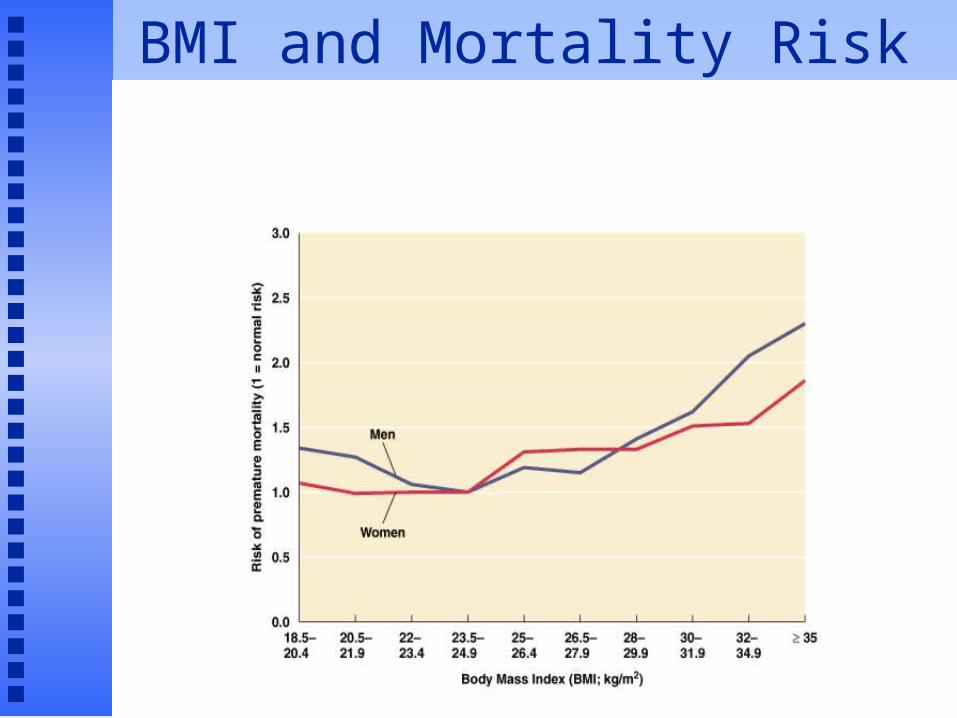
BMI and Mortality Risk


Healthy Weight (cont.)
If your BMI > 25, then consider presence of other health risk factors.

Healthy Weight (cont.) Body Fat Distribution upper body fatness associated with
higher health risks Waist Circumference (1998 NIH)
> 35” for females, > 40” for males

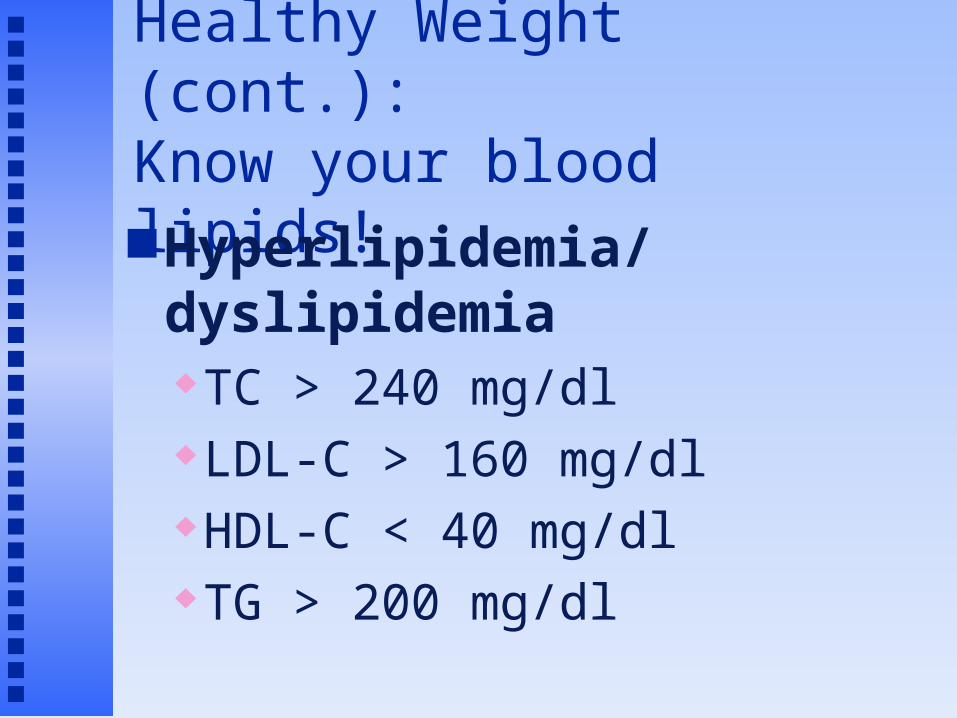
Healthy Weight (cont.):Know your blood lipids! Hyperlipidemia/dyslipidemia
TC > 240 mg/dl LDL-C > 160 mg/dl HDL-C < 40 mg/dl TG > 200 mg/dl
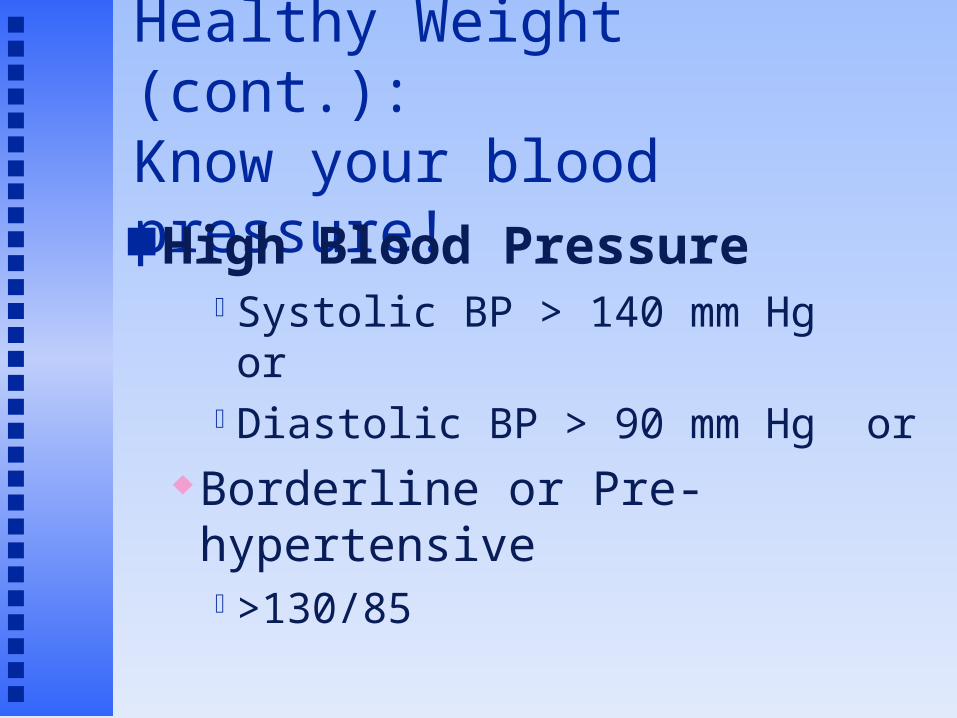
Healthy Weight (cont.):Know your blood pressure! High Blood Pressure
Systolic BP > 140 mm Hg orDiastolic BP > 90 mm Hg or
Borderline or Pre-hypertensive>130/85
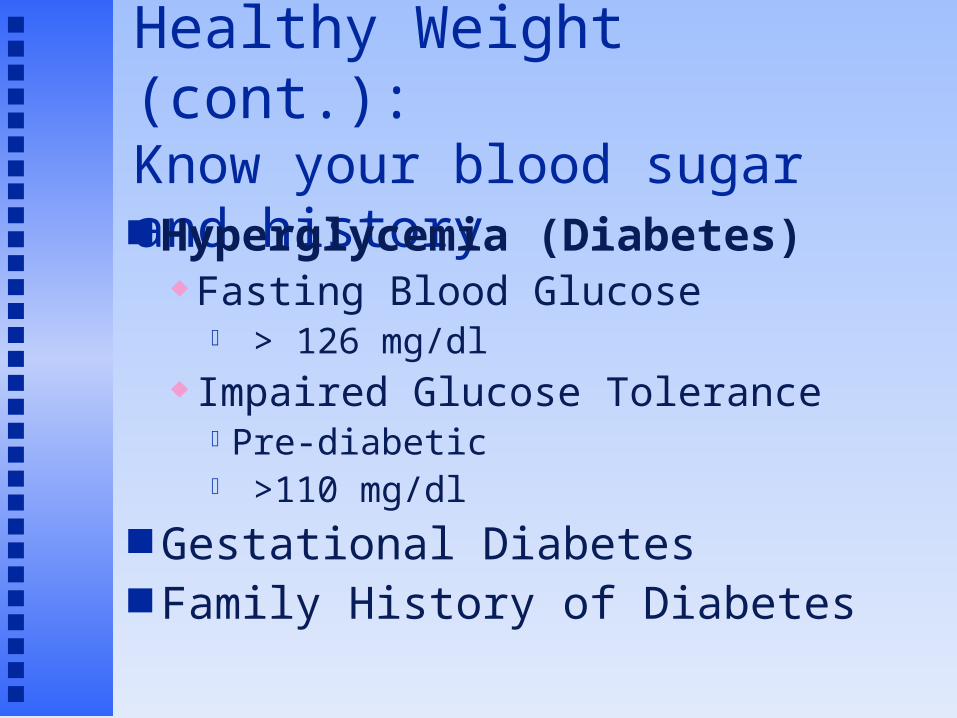
Healthy Weight (cont.):Know your blood sugar and history Hyperglycemia (Diabetes)
Fasting Blood Glucose > 126 mg/dl
Impaired Glucose TolerancePre-diabetic >110 mg/dl
Gestational Diabetes Family History of Diabetes

Healthy Weight Summary
If your BMI is 19-25, you are at a Healthy Weight. Health problems are not weight related
If your BMI is > 25 and you have no other risk factors, you are at a Healthy Weight.
If your BMI is > 25 and you have one or more risk factors, you are NOT at a Healthy Weight. Weight loss is likely to improve your health
Should everybody who is overweight try to lose weight?
Will weight loss improve your quality of life?A Prospective Study of Weight Change and Health-Related
Quality of Life in Women
JAMA Dec. 1999 Nurse’s Health Study
40,098 women, 4 yr longitudinal study Weight changes Quality of life questionnaire
Physical function Vitality Freedom from bodily pain Mental health
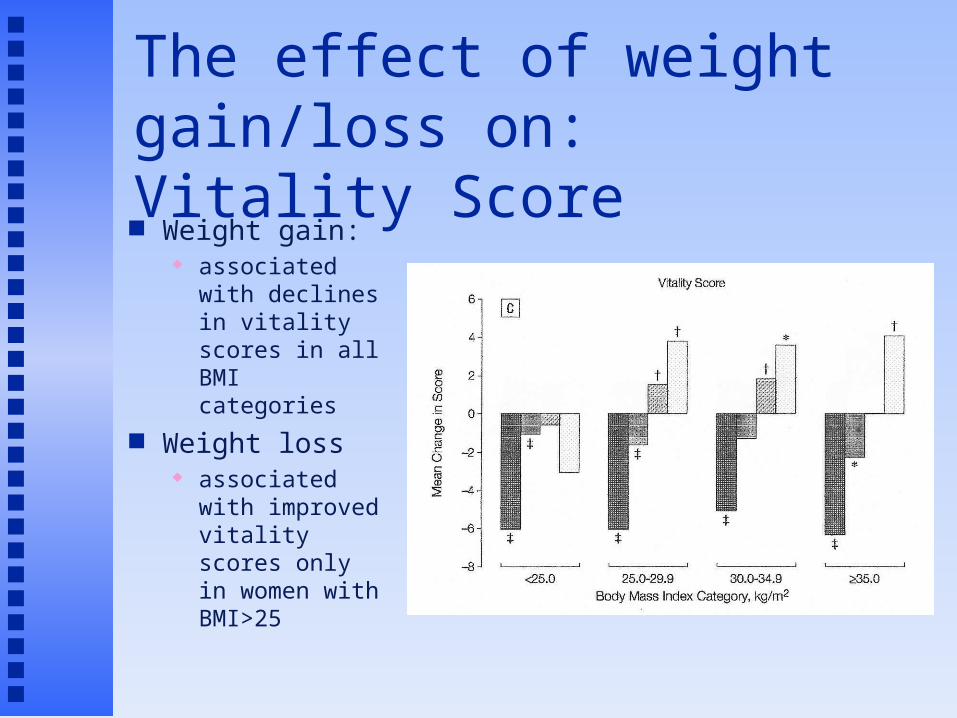
The effect of weight gain/loss on:Vitality Score Weight gain:
associated with declines in vitality scores in all BMI categories
Weight loss associated with
improved vitality scores only in women with BMI>25
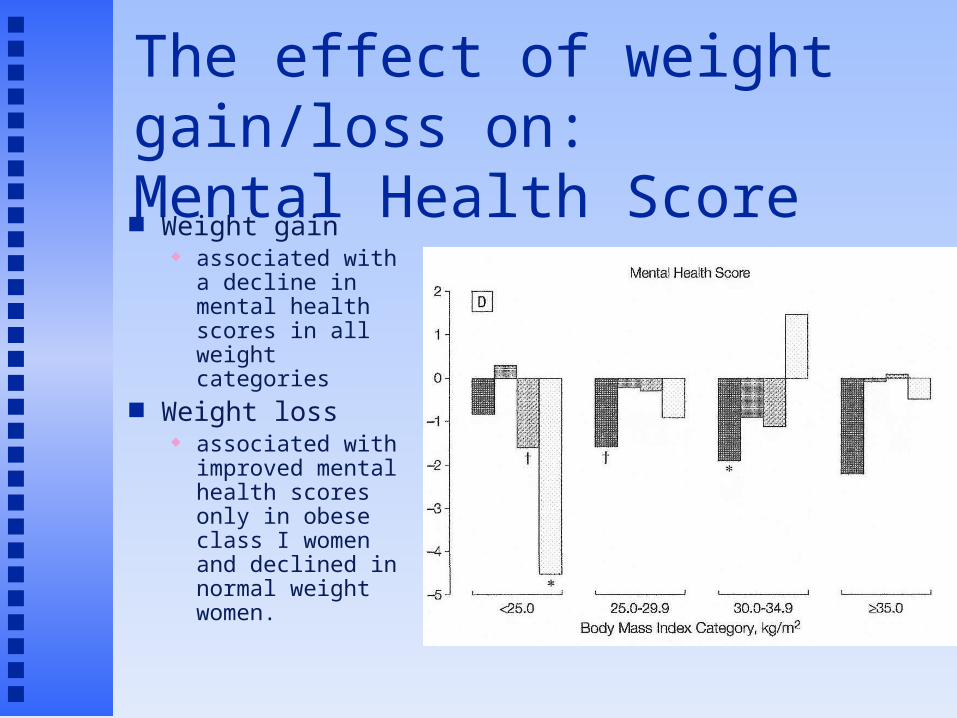
The effect of weight gain/loss on:Mental Health Score Weight gain
associated with a decline in mental health scores in all weight categories
Weight loss associated with
improved mental health scores only in obese class I women and declined in normal weight women.
A Prospective Study of Weight Change and Health-Related Quality of Life in Women.
Conclusions: For women at all BMI categories:
Don’t gain weight Reduced quality of life
For overweight and obese women: Weight loss is generally associated with improved
quality of life
For normal weight women Weight loss does not improve quality of life
May actually reduce quality of life

Do media images affect your idea of
what you should look like?
2000 Grammy Awards
Do media images actually Contribute to weight problems?

Bottom Line on Weight Loss
Lose weight for the right reasons Improve health and your quality of life
Losing weight to attain the ‘perfect body’ May lead to frustration
And, ironically, weight gain
May lead to eating disorders
Dietary Means to a Healthy Weight
Weight loss occurs when in negative energy balance
Weight loss is only half the battle Maintenance of weight loss is the critical
problem
Dietary Means to a Healthy WeightBalanced Reduced Calorie Diet
Characteristics Calories reduced by 500-1000 Cal/day CHO:PRO:FAT = 50-60%: 10-15%: 20-
30%
Examples Weight Watchers, Jenny Craig, Slim Fast
What the research shows: Short-term outcomes
Modest weight loss, improved health
Long-term outcomes Success rate not great

Dietary Means to a Healthy WeightLow Carbohydrate Diets
Characteristics Very low in CHO Restricted intakes of fruit, cereals, pasta, bread, potatoes, rice Caloric intake not specified
Examples Atkins diet
What the research shows: Short-term outcomes
6 month studies, good weight loss, no substantial change in heart disease risk factor, drop-out rate significant
Long-term outcomes No long term studies, health risks?, 1 yr studies show more weight
regain compared to low-fat diets
Dietary Means to a Healthy WeightThe Carbohydrate ‘Restrained’ Diets
Characteristics Lower in CHO than Dietary Guidelines but
higher than Low Carb diets (~40% CHO, 30%FAT, 30%PRO)
Low glycemic index foods encouraged Monounsaturated fats encouraged
Examples Zone Diet, South Beach Diet
What the research shows: Little research available on these diets
Dietary Means to a Healthy WeightHealthy Diet/Non-Diet Approach
Characteristics Focus on quality of the diet, not quantity Attaining good health is primary goal, not weight loss
Examples DASH diet, Dietary Guidelines, Food Guide Pyramid
What the research shows: Short-term outcomes
Slow, limited weight loss, health benefits Long-term outcomes
U. Colorado’s Weight Loss Registry Diet most adopt in order to maintain weight loss
Exercise and Weight Loss U. Colorado’s Weight Loss Registry
Exercised used by nearly 100% Walking the most common form of exercise
Benefits of Exercise Rate of weight loss greater Caloric restriction not as great Quality of weight loss better Proactive choice vs dieting Health benefits independent of weight loss
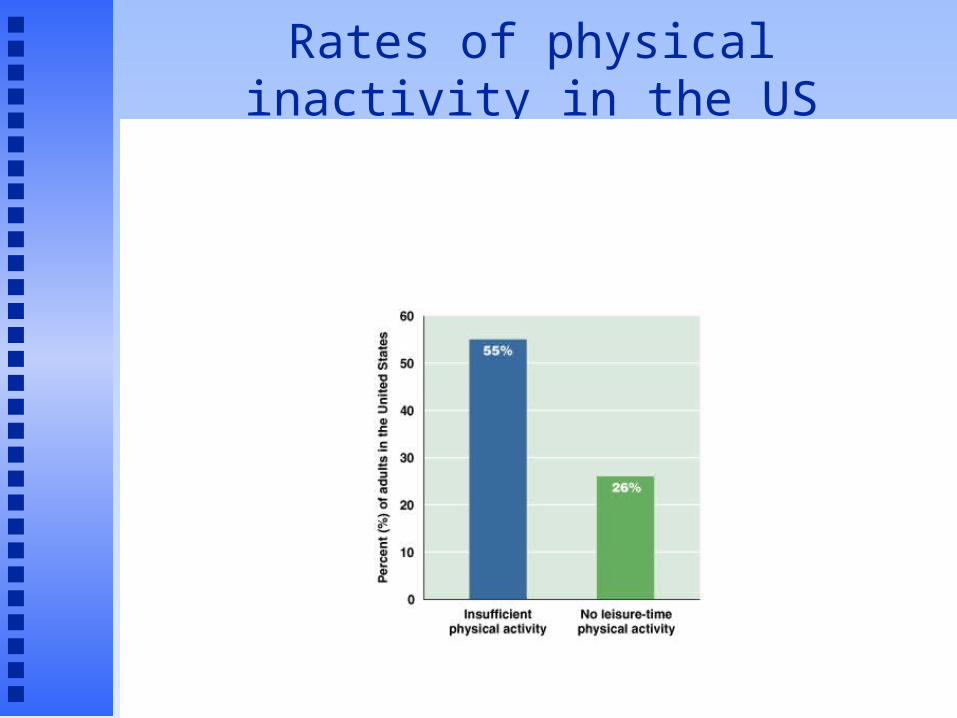
Rates of physical inactivity in the US

Exercise and Weight Loss
Structured Exercise Aerobic Exercise
Burns more calories, more fat Stress duration initially
Strength Training Builds more lean tissue Increases basal metabolic rate

Exercise for Weight Loss:Walking vs Running
Going 4 miles
Walking @ 15min/mile
Jogging @ 8 min/mile
Calories burned 400 Cal 400 Cal
Fuels burned:
CHO:FAT
50:50 75:25
Calories CHO 200 Cal 300 Cal
Calories FAT 200 Cal 100 Cal
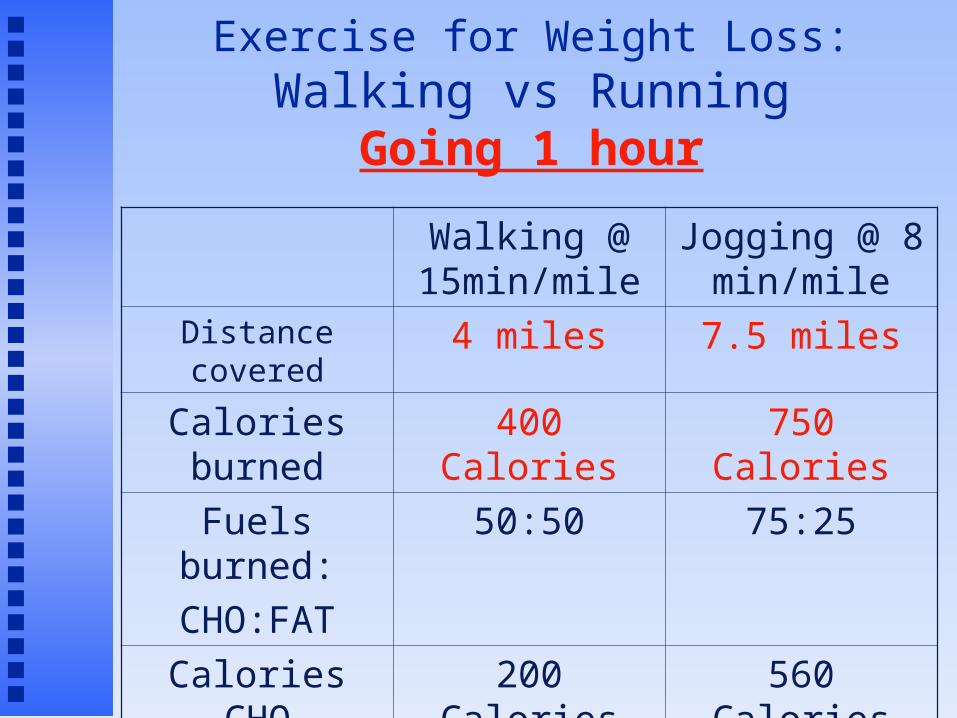
Exercise for Weight Loss:Walking vs Running
Going 1 hour
Walking @ 15min/mile
Jogging @ 8 min/mile
Distance covered 4 miles 7.5 miles
Calories burned 400 Calories 750 Calories
Fuels burned:
CHO:FAT
50:50 75:25
Calories CHO 200 Calories 560 Calories
Calories FAT 200 Calories 190 Calories

Exercise for Weight Loss:Walking vs Running
Conclusions Walking and running burn the same number of
calories over the same distance Walking burns more fat than running over the
same distance Running burns calories at a faster rate and
improves cardiovascular fitness more. Bottom line: Just do it!
Either type of exercise is beneficial

Exercise and Weight Loss
Structured Exercise Characteristics of Successful Programs:
Convenient Enjoyable Safe affordable Subject realizes net benefit over costs

Exercise and Weight Loss
Lifestyle Activity 24 hr day
Sleep/rest = 10 hrs Structured exercise = 1 hr What you do the remaining 13 hrs of the day?
Burn extra 25 Cal/hr = 325 Cal/day = 33 pounds of fat loss per year
Develop a new attitude about being active Pedometers and 10,000 step programs Health benefits significant

Weight Loss/Weight MaintenanceBehavior/Attitude Changes
Pay attention to what you eat Success of weight loss programs
Examine: Triggers for eating
Emotional eating Risky situations
Behavior Modification Programs Track/record eating behaviors Identifies problems Sets goals and establishes rewards Continual reassessment/problem solving
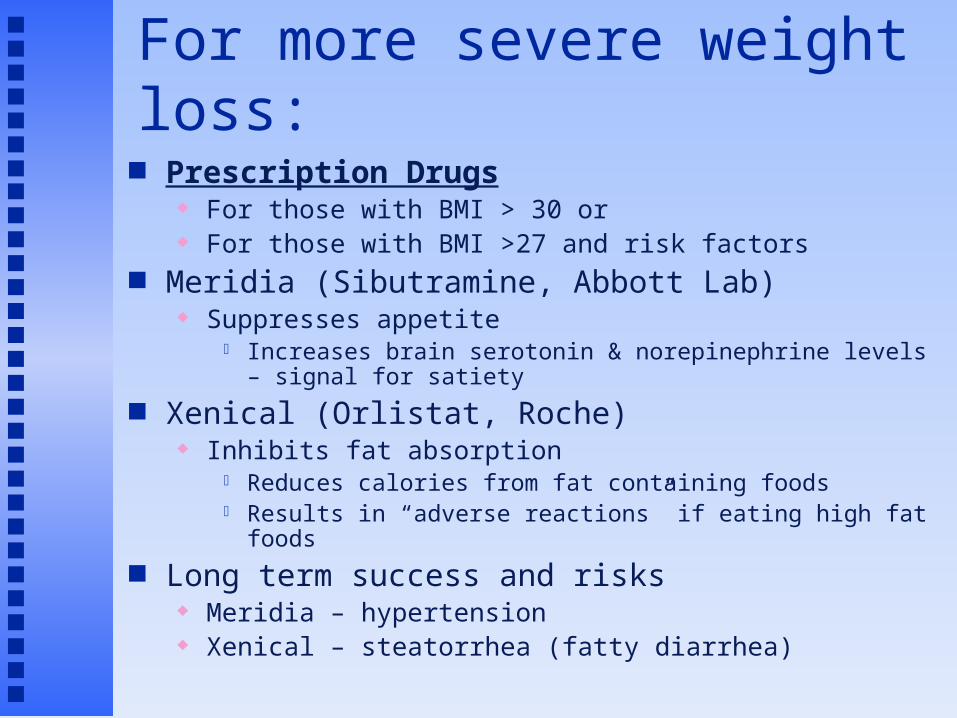
For more severe weight loss:
Prescription Drugs For those with BMI > 30 or For those with BMI >27 and risk factors
Meridia (Sibutramine, Abbott Lab) Suppresses appetite
Increases brain serotonin & norepinephrine levels – signal for satiety
Xenical (Orlistat, Roche) Inhibits fat absorption
Reduces calories from fat containing foods Results in “adverse reactions” if eating high fat foods
Long term success and risks Meridia – hypertension Xenical – steatorrhea (fatty diarrhea)
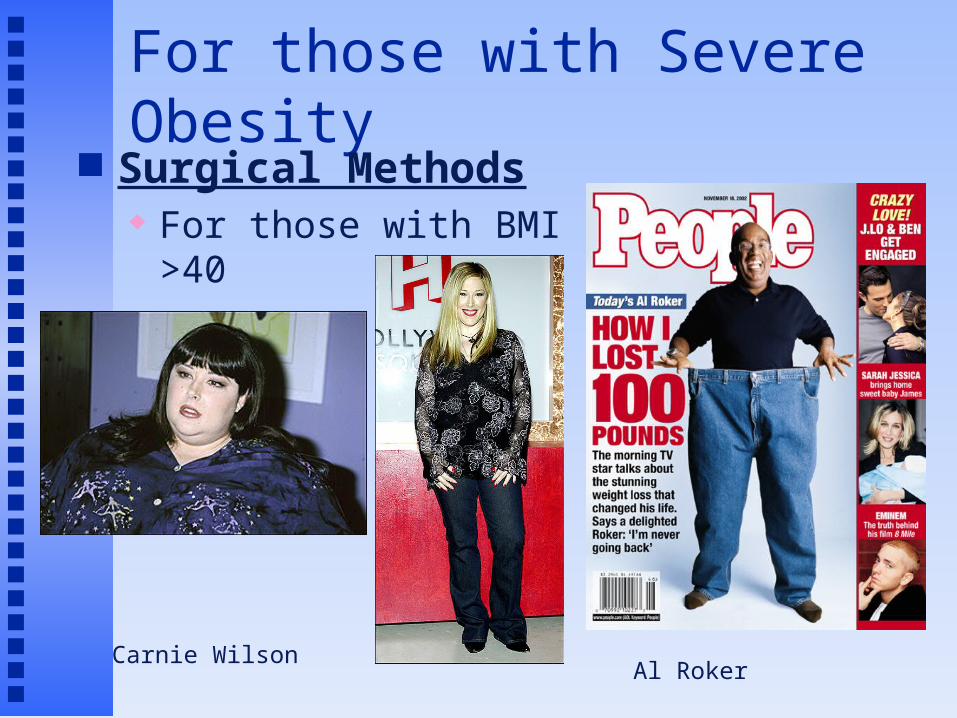
For those with Severe Obesity Surgical Methods
For those with BMI >40
Carnie WilsonAl Roker

For those with Severe Obesity
Gastroplasty Reduces size of stomach by
banding or stapling Gastric Bypass Surgery
Reduces size of stomach Bypasses much of the small
intestine Outcomes
Rapid and substantial weight loss
Side effects Dangers