Impact assessment research of Motion 65 implementation for ...

FINAL REPORT
The City College of New York (CCNY) Campus Energy Assessment JDE #2841089999 Dormitory Authority of the State of New York (DASNY) One Penn Plaza, 52nd Floor New York, NY 10119-0098 January 2010

Job No. 12145/44128
FINAL REPORT
The City College of New York (CCNY) Campus Energy Assessment
JDE #2841089999
Prepared For: Dormitory Authority of the State of New York (DASNY)
One Penn Plaza, 52nd Floor New York, NY 10119-0098
Darek Letkiewicz, P.E., CEM, LEED AP, Vice President O’Brien & Gere Engineers, Inc.
January 2010
The City College of New York (CCNY) – Campus Energy Assessment
Final: January 18, 2010 I:\Nys-Dorm.12145\44128.City-College-Cl\Docs\Reports\Energy Assessment\Report\Final Report\MASTER_CCNY EA Report Final 1_18_10.doc
i
TABLE OF CONTENTS
List of Tables ..................................................................................................................................... iii List of Figures.................................................................................................................................... iv List of Appendices ............................................................................................................................. iv List of Acronyms/Abbreviations ........................................................................................................ v
Acknowledgements ............................................................................................................................. vii Executive Summary .......................................................................................................................... viii 1. Introduction ...................................................................................................................................... 1
1.1. Background.................................................................................................................................. 1 1.2. The Assessment Process .............................................................................................................. 2
2. City College Overview ...................................................................................................................... 4 2.1. General Description ..................................................................................................................... 4 2.2. Energy Use .................................................................................................................................. 5
2.2.1. Utility Billing Data Evaluation ............................................................................................. 5 2.2.2. Electric Account and Meter Summary ................................................................................. 5 2.2.3. Variation of Utility Consumption with Ambient Temperature ............................................ 7 2.2.4. Comparison of Facility Energy Consumption to Other Facilities ...................................... 10 2.2.5. Upcoming Increases in Utility Charges from Reactive Power ........................................... 13
2.3. Impact at City College ............................................................................................................... 14 2.3.1. Power Factor Correction .................................................................................................... 14
3. Assessment of Campus Facilities ................................................................................................... 15 3.1. Overview ................................................................................................................................... 15 3.2. Building Envelope ..................................................................................................................... 17
3.2.1. Roofing Materials ............................................................................................................... 17 3.2.2. Windows ............................................................................................................................. 17 3.2.3. Insulation ............................................................................................................................ 18 3.2.4. Air Infiltration .................................................................................................................... 18
3.3. Lighting ..................................................................................................................................... 19 3.3.1. Lighting Fixtures ................................................................................................................ 19 3.3.2. Interior Night Time Lighting .............................................................................................. 19 3.3.3. Daylight Harvesting Controls ............................................................................................. 20 3.3.4. Occupancy Sensors............................................................................................................. 20 3.3.5. Exterior Lighting ................................................................................................................ 20
3.4. HVAC ........................................................................................................................................ 21 3.4.1. Demand Control Ventilation (DCV) .................................................................................. 21 3.4.2. Reheat Controls .................................................................................................................. 21 3.4.3. Outside Air Economizers ................................................................................................... 21 3.4.4. Window A/C Units ............................................................................................................. 22 3.4.5. Exhaust Air Heat Recovery ................................................................................................ 22
3.5. Building Automation Systems (BAS) ....................................................................................... 23 3.5.1. Comfort Issues .................................................................................................................... 23 3.5.2. Occupied/Unoccupied Temperature Setback Controls....................................................... 23 3.5.3. Fan Cycling ........................................................................................................................ 24 3.5.4. Building Automation System ............................................................................................. 24
3.6. Plumbing/Water Conservation .................................................................................................. 25 3.6.1. Water-Saving Fixtures ........................................................................................................ 25
The City College of New York (CCNY) – Campus Energy Assessment
Final: January 18, 2010 I:\Nys-Dorm.12145\44128.City-College-Cl\Docs\Reports\Energy Assessment\Report\Final Report\MASTER_CCNY EA Report Final 1_18_10.doc
ii
3.6.2. Pneumatic Domestic Water System ................................................................................... 25 3.7. Boiler Plants .............................................................................................................................. 26
3.7.1. Boiler Feedwater Economizers .......................................................................................... 26 3.7.2. Blowdown Heat Recovery .................................................................................................. 26 3.7.3. Steam Trap Maintenance Program ..................................................................................... 26
3.8. Chiller Plants ............................................................................................................................. 27 3.8.1. Maximize Use of Electric Chillers (vs. Steam) .................................................................. 27 3.8.2. Chilled Water Loop Control Issues .................................................................................... 27 3.8.3. Chilled/Cooling Tower Water Temperature ....................................................................... 27
3.9. Campus Utility Distribution ...................................................................................................... 28 3.9.1. General Observations ......................................................................................................... 28 3.9.2. Chilled Water Plant Controls ............................................................................................. 28 3.9.3. Variable Speed Chillers ...................................................................................................... 29 3.9.4. High Temperature Hot Water Circulation Temperature ..................................................... 31 3.9.5. Steam .................................................................................................................................. 31
3.10. Electrical .................................................................................................................................. 31 3.10.1. Motors .............................................................................................................................. 31 3.10.2. Variable Speed Drives (VSDs) ......................................................................................... 32 3.10.3. Power Factor Correction .................................................................................................. 32 3.10.4. Plug Loads/Miscellaneous ................................................................................................ 32
3.11. Special Systems ....................................................................................................................... 34 3.11.1. Laboratory Ventilation and Fume Hoods ......................................................................... 34 3.11.2. Natatoriums ...................................................................................................................... 35 3.11.3. Data Centers ..................................................................................................................... 36
3.12. Retrocommissioning ................................................................................................................ 37 4. Operation and Maintenance .......................................................................................................... 39
4.1. Maintenance and Repair Cost Benchmarks ............................................................................... 39 4.2. Leaks in Piping and Ductwork .................................................................................................. 41 4.3. Abandoned Equipment .............................................................................................................. 41 4.4. Training ..................................................................................................................................... 42 4.5. Archibus Facilities Management Tools ..................................................................................... 42
5. Design and Construction ................................................................................................................ 44 5.1. Construction Project Delivery ................................................................................................... 44 5.2. The Commissioning Process ..................................................................................................... 44 5.3. Owner’s Project Requirements (OPR) ...................................................................................... 45 5.4. Project Turnover ........................................................................................................................ 45
6. Energy Conservation Portfolio ...................................................................................................... 47 6.1. Immediate Actions – Behavior, Operations and Maintenance .................................................. 47 6.2. Near-Term Actions (1 to 5 years) – Energy Conservation Measures (ECMs) .......................... 48
6.2.1. General Opportunities ........................................................................................................ 48 6.2.2. ECM-1 Lighting Fixtures and Controls .............................................................................. 49 6.2.3. ECM-2 Energy Metering and Monitoring .......................................................................... 56 6.2.4. ECM-3 Campus-wide DDC Building Automation System (BAS) .................................... 59 6.2.5. ECM-4 Recommission Central Chiller Plant Controls....................................................... 62 6.2.6. ECM-5 Building HVAC System Retrocommissioning ...................................................... 63 6.2.7. ECM-6 Stream Trap, Monitoring and Maintenance Program ............................................ 63 6.2.8. ECM-7 Boiler Heat Recovery ............................................................................................ 66 6.2.9. ECM-8 Data Center Energy Improvements (NAC and Marshak) ..................................... 67
The City College of New York (CCNY) – Campus Energy Assessment
Final: January 18, 2010 I:\Nys-Dorm.12145\44128.City-College-Cl\Docs\Reports\Energy Assessment\Report\Final Report\MASTER_CCNY EA Report Final 1_18_10.doc
iii
6.3. Long-terms Actions (5 to 15 years) – Infrastructure Renewal .................................................. 69 6.6.1. Approach to Long-term Actions ......................................................................................... 69 6.3.2. Upgrade Laboratory Fume Hoods (Steinman and Marshak) .............................................. 69 6.3.3. NAC Facility Upgrades ...................................................................................................... 69 6.3.4. Replace Domestic Water Supply Pumping System (Marshak) .......................................... 69 6.3.5. Building Envelope Improvements ...................................................................................... 71 6.3.6. Shepard Hall HVAC Renovation ....................................................................................... 76 6.3.7. Renewable Energy, Alternative and Emerging Technologies ............................................ 78
7. References ....................................................................................................................................... 89
List of Tables
2.1-1 Summary of buildings at CCNY 2.2-1 Two Year Consumption History – CCNY Accounts 2.2-2 12 Month fiscal year summary for CCNY 2.3-1 Estimate of kVAr charges at CCNY 3.1-1 Campus facilities assessment opportunity matrix 3.6-1 Pre-EPACT Plumbing fixture water consumption 3.6-2 Post-EPACT Plumbing fixture water consumption 3.9-1 DOE2 Model results for various chiller configurations 4.1-1 Replacement value of CCNY HVAC systems (estimated) 6.2-1 Campus Lighting Summary 6.2-2 Lighting power density by zone type 6.2-3 Baseline lighting load calculation 6.2-4 ECM 1.1 – Reduced nighttime lighting 6.2-5 ECM 1.2 – Upgraded occupancy sensors 6.2-6 ECM 1.3 – Replace exceptional fixtures 6.2-7 ECM 1.4 – Relamping to best practices 6.2-8 Typical prices for example electrical submetering hardware 6.2-9 Metering costs 6.2-10 Incremental and combined savings results from building model with DDC 6.2-11 Near-term Actions (1 to 5 years) – Energy Conservation Measures (ECMs) 6.3-1 Baseline building simulation model summary 6.3-2 Incremental and combined savings results from building model 6.3-3 Envelope upgrade costs 6.3-4 Envelope upgrade summary – campus-wide 6.3-5 Costs for long-term actions (5 to 15 years) 6.3-6 Roof area assessment for solar renewable 6.3-7 CCNY combined utility expenditures 6.3-8 CHP system operation and impact 6.3-9 Sensitivity of CHP savings to natural gas cost with electricity at $0.11/kWh 6.3-10 Costs of applicable renewable and emerging technologies

The City College of New York (CCNY) – Campus Energy Assessment
Final: January 18, 2010 I:\Nys-Dorm.12145\44128.City-College-Cl\Docs\Reports\Energy Assessment\Report\Final Report\MASTER_CCNY EA Report Final 1_18_10.doc
iv
List of Figures
2.2-1 Grouping of buildings on single billing accounts 2.2-2 Variation of energy consumption with ambient temperatures – entire CCNY campus 2.2-3 Variation of natural gas consumption with ambient temperatures – entire CCNY campus 2.2-4 CBECS Distribution for floor area normalized electricity consumption in secondary
education buildings 2.2-5 CBECS Distribution for floor area normalized natural gas consumption in secondary
education buildings 2.2-6 E*PM Results for CCNY entered as an aggregate building 3.9-1 DOE2 Input screen for centrifugal chiller 6.2-1 Schematic diagram of the location of steam traps in a steam system 6.2-2 Examples of steam trap states with integrated sensor 6.2-3 Boiler flue economizer 6.3-1 “Typical” building Model for CCNY envelope evaluations – eQUEST rendering 6.3-2 Comparing normalized electricity consumption model to campus 6.3-3 Comparing normalized electricity demand model to campus 6.3-4 Comparing normalized natural gas consumption model to campus 6.3-5 RETSCREEN PV analysis - 475 kW Total Installed Capacity 6.3-6 RETSCREEN Solar thermal analysis– 8.8 MBtu/hr, 35,000 sf Glazed Collector System 6.3-7 Emerging LED systems
List of Appendices
A CCNY Campus Map B Building Assessments
• Aaron Davis Hall • Baskerville Hall • Bernard and Anne Spitzer School of Architecture • Compton-Goethels Hall • Harris Hall • Howard E. Willie Administration Building • Marshak Science Building • North Academic Center (NAC) • Shepard Hall • Schiff House Child Care Center • Steinman Hall • Structural Biology Center (Park Gym) • Vivarium • Wingate Hall
C CCNY Campus Lighting Survey D Sample Owner’s Project Requirement (OPR) for the Commissioning Process

The City College of New York (CCNY) – Campus Energy Assessment
Final: January 18, 2010 I:\Nys-Dorm.12145\44128.City-College-Cl\Docs\Reports\Energy Assessment\Report\Final Report\MASTER_CCNY EA Report Final 1_18_10.doc
v
List of Acronyms/Abbreviations
AC Alternating Current ACUPCC American College and University Presidents Climate Commitment AHU Air Handling Unit ASHRAE The American Society of Heating, Refrigerating and Air-Conditioning Engineers BAS Building Automated Systems Btu British Thermal Unit CAP Climate Action Plan CBECS Commercial Building Energy Consumption Survey CCNY The City College of New York CHP Combined Heat and Power CRAC Computer Room Air Conditioning CUNY The City University of New York DASNY The Dormitory Authority of the State of New York DC Direct Current DCV Demand Control Ventilation DDC Direct Digital Controls DSIRE Database of State Incentives for Renewables & Efficiency EAM Enterprise Asset Management ECMs Energy Conservation Measures EMS Energy Management Systems EPAct The Energy Policy Act of 1992 ERV Energy Recovery Ventilator GHG Greenhouse Gas GHP Geothermal Heat Pump GPD Gallons Per Day GPM Gallons Per Minute GSF Gross Square Foot HHV Higher Heating Value HVAC heating, ventilating, and air conditioning IPMVP International Performance Monitoring and Verification Protocol kVAR Kilovolt-Ampere Reactive kWh Kilowatt Hour LED Light-Emitting Diode LEED Leadership in Energy and Environmental Design M&V Monitoring and Verification MCC Motor Control Center MMBtu/hr Million British Thermal Units/Hour MSW Municipal Solid Waste MTCO2E Metric Tons of Carbon Dioxide Equivalent MW Megawatts NCDC National Climatic Data Center NEMA National Electrical Manufacturer’s Association NYPA New York Power Authority NYSERDA New York State Energy Research and Development Authority O&M Operation and Maintenance OA Outdoor Air

The City College of New York (CCNY) – Campus Energy Assessment
Final: January 18, 2010 I:\Nys-Dorm.12145\44128.City-College-Cl\Docs\Reports\Energy Assessment\Report\Final Report\MASTER_CCNY EA Report Final 1_18_10.doc
vi
OEM Original Equipment Manufacturer OPR Owner’s Project Requirements PSI Pounds Per Square Inch PV Photovoltaic PVC Polyvinyl Chloride RCx Retrocommissioning SCFM Standard Cubic Feet Per Minute USEPA United States Environmental Protection Agency USGBC United States Green Building Council VAV Variable Air Volume VSD Variable Speed Drive W/sf Watts Per Square Foot

The City College of New York (CCNY) – Campus Energy Assessment
Final: January 18, 2010 I:\Nys-Dorm.12145\44128.City-College-Cl\Docs\Reports\Energy Assessment\Report\Final Report\MASTER_CCNY EA Report Final 1_18_10.doc
vii
Acknowledgements
We acknowledge the following individuals for their participation in The City College of New York’s Campus Energy Assessment: City University of New York Ken Campanelli Arthur Fasolino Esther Hundley Michael Parfomak City College of New York James Alexander Richard Belgrave Vatthana Chin Joseph Daly Holly Kallman John Mauriello Michael Rogovin Robert Santos Richard Slawski George Varian Douglas White Dormitory Authority of the State of New York Richard Stoffels Stefan Thiersch O’Brien & Gere Ghaith Abdullah Nicholas Hinman Michael Madigan Robert Neimeier Parikhit Sinha Stuart Spiegel Ambient Water Treatment Consulting, Inc. Steve Beckenstein CDH Energy Adam Walburger
The City College of New York (CCNY) – Campus Energy Assessment
Final: January 18, 2010 I:\Nys-Dorm.12145\44128.City-College-Cl\Docs\Reports\Energy Assessment\Report\Final Report\MASTER_CCNY EA Report Final 1_18_10.doc
viii
Executive Summary
As a charter signatory to the American College and University Presidents Climate Commitment (ACUPCC), The City College of New York (CCNY) is exercising leadership in addressing climate change by reducing campus energy use and greenhouse gas emissions. At the same time, CCNY is a full participant in The City University of New York (CUNY) Sustainability Initiative, part of Mayor Bloomberg’s PlaNYC for a sustainable city. To satisfy PlaNYC, CUNY has pledged to reduce carbon emissions 30% by 2017 and CCNY is doing its part. In addition to actions that reduce greenhouse gas emissions through changes in behavior, CCNY has committed to implement measures that will reduce energy consumption in existing campus buildings and infrastructure, where approximately 80% of campus energy is consumed. O’Brien & Gere has conducted this Energy Assessment of CCNY campus buildings and infrastructure to identify potential opportunities for reducing energy consumption that will support these commitments. A building-by-building survey focused on the condition of the existing building envelope, lighting systems, heating, ventilating, and air conditioning (HVAC) systems, temperature controls, plumbing, central heating/cooling plants and distribution systems, electrical loads, laboratories, and swimming pools. For each building, system deficiencies and opportunities for energy savings were documented. This screening process identified potential energy conservation measures (ECMs) as a first step toward developing an action plan and a portfolio of projects to be implemented immediately and in the near term (1 to 5 years), and guidance for developing a strategic vision for the long term (5 to 15 years). Immediate Actions – Behavior, Operations and Maintenance Reductions in campus energy use can be achieved at little or no cost through changes in occupant behavior, increased energy awareness, and operation and maintenance practices. CCNY is already affecting changes in this area through the campus’ CCNY Green project by creating a task force to promote a green campus, and by creating working groups to focus on specific areas such as recycling/reuse, sustainable purchasing, and energy conservation through student and faculty actions. Additional actions identified by the Energy Assessment team include the following: • Turn off unnecessary lights, especially in unused offices, closets, classrooms and conference
rooms. • Shut down escalators during periods of low occupancy. • Implement a campus-wide temperature setpoint policy (680 F in winter, 760 F in summer). • Repair/replace door and window weather stripping and seal openings to reduce air infiltration. • Eliminate or provide low-wattage infrared space heaters, utilize computer peripheral switching,
eliminate private office kitchenettes, and address other plug load. • Utilize software that offers network level control over personal computer power management
settings. • Set computers, monitors, printers, copiers and other business equipment to energy-saving features
and turn off at the end of the day. • Purchase equipment with USEPA ENERGY STAR rating whenever possible. • Procure or require vendors to provide ENERGY STAR vending machines that shut down or
operate at reduced energy levels during unoccupied periods.

The City College of New York (CCNY) – Campus Energy Assessment
Final: January 18, 2010 I:\Nys-Dorm.12145\44128.City-College-Cl\Docs\Reports\Energy Assessment\Report\Final Report\MASTER_CCNY EA Report Final 1_18_10.doc
ix
• Improve planned maintenance practices (e.g., repair piping/duct leaks, remove abandoned equipment, more frequent coil cleaning and filter changes and other appropriate measures).
• Optimize chiller plant performance by optimizing chiller sequencing (electric vs. steam) and reset chilled water and condenser water temperatures based on outdoor temperature conditions.
• Reset hot water supply temperatures based on outdoor temperature conditions. • Provide ongoing training of facilities staff in the operation and maintenance of campus systems
and controls. • Utilize water-saving lavatory faucets and toilet flush valves on new construction and renovation
projects. • Ensure that existing utility meters are functioning properly and record consumption data at least
monthly. • Develop periodic energy consumption reports for buildings and systems with direct digital
controls (DDC) controls and data trend reporting capabilities. Near-Term Actions (1 to 5 years) - Energy Conservation Measures (ECMs) Near-term energy conservation measures are focused on driving high-impact cost savings and greenhouse gas reductions. Implementing these projects often addresses deficiencies in campus buildings or infrastructure and requires a moderate level of capital investment. Executing the following portfolio of projects will generate energy savings and greenhouse gas emission reductions that can be measured and maintained to demonstrate CCNY’s progress in meeting the goals of PlaNYC and the Presidents Climate Commitment.
Near-Term Actions (1 to 5 years) - Energy Conservation Measures (ECMs)
ECM No. ECM Description
Annual Electrical Savings (kWh)
Annual Fossil Fuel
Savings (MMBtu)
Annual Energy
Cost Savings
($)
Capital Cost ($)
GHG Reduction (MT CO2e)
Simple Payback
(yr)
1 Lighting Fixtures and Controls 2,300,000 0 $253,000 $3,000,000 856 11.9
2 Energy Metering and Monitoring 0 0 $ -- $500,000 0 n/a
3 Campus-wide DDC Building Automation System 2,400,000 37,500 $744,000 $7,000,000 3,115 9.4
4 Recommission Central Chiller Plant Controls 1,990,000 0 $219,000 $300,000 738 1.4
5 HVAC System Retrocommissioning (Compton-Goethals and Baskerville Halls)
123,000 450 $19,000 $150,000 72 7.9
6 Steam Trap Maintenance Program 0 17,000 $218,000 $150,000 1,008 0.7
7 Boiler Heat Recovery 0 1,600 $21,000 $250,000 95 12.1
8 Data Center Energy Improvements (NAC and Marshak) 333,000 0 $37,000 $150,000 124 4.1
Totals 7,146,000 56,550 $1,511,000 $11,500,000 6,008 7.6
MMBtu = 1,000,000 Btu MTCO2e = Metric tons of CO2 equivalent emissions

The City College of New York (CCNY) – Campus Energy Assessment
Final: January 18, 2010 I:\Nys-Dorm.12145\44128.City-College-Cl\Docs\Reports\Energy Assessment\Report\Final Report\MASTER_CCNY EA Report Final 1_18_10.doc
x
The five top-ranked ECMs based on total greenhouse gas reductions, simple payback, and the cost per metric ton of greenhouse gas reduction are presented below in tabular form.
Long-Term Actions (5 to 15 years) – Infrastructure Renewal As systems and equipment reach the end of their effective useful life, it becomes necessary to replace them to maintain the comfort, health and safety of building occupants. New systems, equipment and controls installed as part of a major renovation or as a stand-alone HVAC upgrade project also
ECMS Ranked by Total GHG Reduction
Ranking ECM No ECM Description GHG Reduction (MT CO2e)
1 3 Campus-wide DDC Building Automation System 3,115
2 6 Steam Trap Maintenance Program 1,008
3 1 Lighting Fixtures and Controls 856
4 4 Recommission Central Chiller Plant Controls 738
5 8 Data Center Energy Improvements (NAC and Marshak) 124
ECMs Ranked by Simple Payback
Ranking ECM No ECM Description Simple Payback (Yr)
1 6 Steam Trap Maintenance Program 0.7
2 4 Recommission Central Chiller Plant Controls 1.4
3 8 Data Center Energy Improvements (NAC and Marshak) 4.1
4 5 HVAC System Retrocommissioning (Compton-Goethals and Baskerville Halls) 7.9
5 3 Campus-wide DDC Building Automation System 9.4
ECMs Ranked by GHG Reduction Cost
Ranking ECM No ECM Description GHG Reduction Cost ($/ MT CO2e)
1 6 Steam Trap Maintenance Program $149
2 4 Recommission Central Chiller Plant Controls $407
3 8 Data Center Energy Improvements (NAC and Marshak) $1,210
4 5 HVAC System Retrocommissioning (Compton-Goethals and Baskerville Halls) $2,083
5 3 Campus-wide DDC Building Automation System $2,250

The City College of New York (CCNY) – Campus Energy Assessment
Final: January 18, 2010 I:\Nys-Dorm.12145\44128.City-College-Cl\Docs\Reports\Energy Assessment\Report\Final Report\MASTER_CCNY EA Report Final 1_18_10.doc
xi
provide an excellent opportunity to realize energy savings and greenhouse gas emissions reductions. While the savings resulting from these infrastructure renewal projects can be significant, the high capital costs associated with this type of project result in longer term payback periods than ECM projects. Long-term greenhouse gas reduction plans require a visionary approach focused on long-term results. They are designed to approach capital programming proactively to align with the campus’ strategic goals and climate action objectives, including the PlaNYC goal of 30% GHG reduction by 2017. Specific projects identified as potential long-term actions include the following:
Emerging, Alternative and Renewable Energy Technologies Long-term climate action planning should consider emerging, alternative and renewable energy technologies as part of a diversified portfolio of GHG reduction projects. For this energy assessment, a screening level evaluation of a number of these technologies was performed, including wind power, solar photovoltaic power generation, solar thermal, combined heat and power, biomass, geothermal, and LED (light-emitting diode) lighting technologies. Electrical and thermal loads, site configuration, site location issues and general sizing issues were used in evaluating the viability of each type of technology considered. A summary of the most promising candidate technologies is presented below. Many of these technologies may be eligible for federal or state incentives that can offset a portion of the project costs. CCNY and CUNY are encouraged to regularly review the Database of State Incentives for Renewables & Efficiency (DSIRE), www.dsireusa.org), an ongoing project of the N.C. Solar Center and the Interstate Renewable Energy Council.
Projects
Annual Electrical Savings (kWh)
Annual Fossil Fuel
Savings (MMBtu)
Annual Energy
Cost Savings
($)
Capital Cost ($)
GHG Reduction (MT CO2e)
Marshak Facility Upgrades (Genesys(1) Option 2 – modified) 1,326,000 49,060 $773,828 $33,100,000 3,396
Steinman Facility Upgrades (AECOM(2)Alternative 1) 13,681,989 -31,060 $1,107,341 $32,431,000 3,237
Replace Pneumatic Domestic Water Supply System (Marshak) 33,000 0 $3,630 $75,000 12
Building Envelope Improvements 580,658 9,100 $180,280 $4,500,000 754
Shepard Hall HVAC Renovation 150,000 350 $20,980 $750,000 76
NAC HVAC Replacement 500,000 30,000 $439,000 $32,000,000 1,962
Totals 16,270,647 57,450 $2,525,059 $102,856,000 9,437
(1) Genesys Engineering, P.C., Marshak Science Tower Supplemental Study, 2009 (2) AECOM, Feasibility Report for Energy Efficiency Opportunities, Steinman Hall, 2009

The City College of New York (CCNY) – Campus Energy Assessment
Final: January 18, 2010 I:\Nys-Dorm.12145\44128.City-College-Cl\Docs\Reports\Energy Assessment\Report\Final Report\MASTER_CCNY EA Report Final 1_18_10.doc
xii
Facilities Operation and Maintenance Effective facilities maintenance practices can contribute to reducing costs at CCNY by preventing premature deterioration of systems and equipment, thereby extending the useful life of buildings and delaying the need for wholesale renovation or replacement. An ongoing planned maintenance program also reduces energy consumption, greenhouse gas impacts, and operating costs. When system operations and energy use are closely monitored on a building-by-building basis, a culture of conservation is fostered. Lack of investment in best practices for facilities maintenance can result in: Reduced equipment life expectancy Poor comfort, occupant complaints, labor issues Unnecessary supplemental energy cost from reliance on personal heaters, fans and air
conditioners Potential damage to paper documents and book collections Increased building energy consumption and operating costs.
With proper training and planning, facilities management staff can carry out an effective maintenance program that extends the life of campus buildings, operates them at or near peak efficiency and results in fewer occupant complaints.
Project Annual
Electrical Savings (kWh)
Annual Fossil Fuel
Savings (MMBtu)
Annual Energy
Cost Savings ($)
Capital Cost ($)
GHG Reduction (MT CO2e)
Roof-mounted Photovoltaic Array (Various Buildings) 724,000 0 $80,000 $3,800,000 269
Solar Thermal Pool Heater (Marshak) 0 3,000 $38,400 $750,000 178
LED Lighting Retrofit 2,400,000 37,500 $744,000 $7,000,000 3,110
Totals 3,124,000 40,500 $862,400 $11,500,000 3,557

The City College of New York (CCNY) – Campus Energy Assessment
Final: January 18, 2010 I:\Nys-Dorm.12145\44128.City-College-Cl\Docs\Reports\Energy Assessment\Report\Final Report\MASTER_CCNY EA Report Final 1_18_10.doc
1
1. Introduction
1.1. Background
The City College of New York (CCNY), the first college of The City University of New York (CUNY), is a comprehensive teaching, research, and service institution dedicated to accessibility and excellence in undergraduate and graduate education. The campus occupies 35 acres along Convent Avenue from 130st Street to 141st Street in Manhattan (seen Appendix A for a campus map). The year 2007 marked the Centennial of the opening of CCNY’s campus on Hamilton Heights in Harlem. In the fall of 2009, the student population was 16,308, an increase of 6% over the previous academic year. As a charter signatory to the American College and University Presidents Climate Commitment (ACUPCC), CCNY is exercising leadership in addressing climate change by reducing campus energy use and greenhouse gas emissions. At the same time, CCNY is a full participant in The City University of New York (CUNY) Sustainability Initiative, part of Mayor Bloomberg’s PlaNYC for a sustainable city. To satisfy PlaNYC, CUNY has pledged to reduce carbon emissions 30% by 2017 and CCNY is doing its part. In addition to actions that reduce greenhouse gas emissions through changes in behavior, CCNY has committed to implement measures that will reduce energy consumption in existing campus buildings and infrastructure, where approximately 80% of campus energy is consumed. As part of CCNY’s development of a 10-year Sustainability Plan [also referred to as a Climate Action Plan (CAP)], CCNY requested that this Campus Energy Assessment be performed so that CCNY can better ascertain the current state of energy related matters at the college, and to identify Energy Conservation Measures (ECMs). The following activities were performed as part of the Campus Energy Assessment: • Survey of designated buildings to identify major energy-consuming systems and equipment • Coordination with AECOM (New York, NY) regarding its involvement with Steinman Hall and
the south heating loop project • Coordination with Genesys Engineering, P.C. (Pelham, NY) regarding its involvement with the
Marshak Science Building and the north heating loop project • Review of available record drawings, maintenance records, prior energy studies, reports, and
recent energy projects • Review of energy procurement records • Conduct and documentation of interviews with CCNY maintenance and operations staff • Calculation of watts per square foot of lighting for each building • Performance of a night survey to determine light levels and unoccupied lighting behaviors • Survey of water fixtures and types • Survey of computer labs and data centers • Review of current utility metering systems and equipment for fossil fuel, electrical, and water
usage, and assessment potential for additional metering • Tabulation and consolidation of field notes by the field team into building-by-building facility
survey documents (Appendix B).
The City College of New York (CCNY) – Campus Energy Assessment
Final: January 18, 2010 I:\Nys-Dorm.12145\44128.City-College-Cl\Docs\Reports\Energy Assessment\Report\Final Report\MASTER_CCNY EA Report Final 1_18_10.doc
2
The intent of the surveys performed was to establish a baseline of the condition of existing systems and equipment, maintenance practices and occupant behavior throughout the campus. Based on these observations, opportunities for improvement were identified in the systems surveyed. From these identified opportunities a select number of ECMs were developed that if implemented would contribute to significantly reducing CCNY campus’ greenhouse gas emissions. The Energy Assessment Report is organized as follows: • Executive Summary – Introduction and report recommendations • Section 1 – Project background and scope of the assessment process • Section 2 – Overview of CCNY’s facilities and historical energy use • Section 3 – Assessment of the conditions observed in the campus buildings • Section 4 – Operation and maintenance observations, issues and recommendations • Section 5 – Design and construction observations, issues and recommendations • Section 6 – Portfolio of identified opportunities for energy conservation and recommendations for
specific projects evaluated and ranked with respect to annual energy savings, metric tons of carbon dioxide (MTCO2) avoided, and implementation costs
• Appendices – Supplemental information: (e.g., existing conditions of buildings, functional areas, and utility systems).
The CAP will use the recommendations listed here to determine the measures that are most viable and will have the most significant impact on carbon emissions. Those measures will be reviewed in more detail within the CAP.
1.2. The Assessment Process
O’Brien & Gere utilized a data gathering team of two student interns and two engineers on site during the month of June, 2009. The interns were students at CCNY, and their experience provided insight into student behaviors and known problem areas on the campus. A walk-through was conducted of building mechanical rooms to look for and document deficiencies while assessing the physical condition of the building’s mechanical systems. An additional walk- through was conducted to provide a representative sampling of the building’s occupied spaces to document unnecessary electrical plug loads, occupant comfort issues, and lighting deficiencies. In addition to walking through each building, informal interviews were conducted with space occupants, security staff, and maintenance staff to identify potential hidden deficiencies that might not be revealed through a physical survey. Construction documents and previous studies were reviewed and interviews with design engineers conducted to supplement field observations. Observations and deficiencies documented by photos and/or written descriptions have been consolidated in Appendix B and are referenced throughout this report. Section 3 outlines common deficiencies that were found throughout the campus and offers qualitative suggestions for improvement of these conditions. In Section 6, a number of the opportunities identified in Section 3 were further evaluated through a process whereby potential energy savings for each alternative was estimated, along with a capital cost for implementation. Energy savings were estimated using a variety of methods including analysis of
The City College of New York (CCNY) – Campus Energy Assessment
Final: January 18, 2010 I:\Nys-Dorm.12145\44128.City-College-Cl\Docs\Reports\Energy Assessment\Report\Final Report\MASTER_CCNY EA Report Final 1_18_10.doc
3
existing weather-dependent energy use patterns, U.S. Department of Energy eQuest whole building simulations, Excel spreadsheet models and other energy analysis tools. The following unit costs (obtained from CUNY) for energy were used in the energy cost saving calculations. The impact of electrical demand charges was not addressed in the ECM calculations. CCNY Electrical ECM Cost Basis $0.11/kilowatt hour (kWh) CCNY Natural Gas ECM Cost Basis $1.28/therm Capital cost estimates for each ECM were developed using a methodology that considers rough order of magnitude costs, often on a cost-per-square-foot basis. Greenhouse gas reductions were calculated using the following factors: Electrical GHG Conversion Factor 0.000371 MTCO2e per kWh Natural Gas GHG Conversion Factor 0.059335 MTCO2e per MMBtu Where: MTCO2e = metric ton of carbon dioxide equivalent emissions. MMBtu/hr = Million British thermal units per hour. Note: Emission factors were obtained from the Greenhouse Gas Protocol Initiative of the World Resources Institute (WRI) and the World Business Council for Sustainable Business Development (WBCSD).

The City College of New York (CCNY) – Campus Energy Assessment
Final: January 18, 2010 I:\Nys-Dorm.12145\44128.City-College-Cl\Docs\Reports\Energy Assessment\Report\Final Report\MASTER_CCNY EA Report Final 1_18_10.doc
4
2. City College Overview
2.1. General Description
The following table provides a summary of the buildings at CCNY, their size, age, and the nature of significant rehabilitation that either has been performed or is planned. Table 2.1-1 Summary of buildings at CCNY.
Total Gross SF
No. of Floors
Date Built Recent Renovations
Aaron Davis Hall 67,720 5 1962
Science Facility (Phase 1) 200,000 5 2013 (est)
Advance Science Research Center (Phase 2) 189,000 5
2014 (est)
Baskerville Hall* 61,450 5 1907
Window Replacement - 1995, Exterior Renovation-1995, Upper Floor Renovation-Presently Underway, NYPA Lighting, Motor and VSD Retrofit-1995
Bernard and Anne Spitzer School of Architecture 182,879 8 1958
Renovation of Former “Y” Building-2009, NYPA Lighting, Motor and VSD Retrofit-1995
Compton-Goethals Hall* 137,929 9 1907
Window Replacement-1995, Exterior Renovation-1995, NYPA Lighting, Motor and VSD Retrofit-1995
Harris Hall* 119,027 8 1907
Window Replacement-1995, Exterior Renovation-1995, NYPA Lighting, Motor and VSD Retrofit-1995
Howard E. Wille Administration Building 55,618 5 1962
Renovated-1980, NYPA Lighting, Motor and VSD Retrofit-1995
Marshak Science Building 620,782 18 1972 Ongoing Renovations-2009, NYPA Lighting, Motor and VSD Retrofit-1995
North Academic Center 885,656 11 1982 NYPA Lighting, Motor and VSD Retrofit-1995 Schiff House Child Care Center 4,704 3 1912 NYPA Lighting, Motor and VSD Retrofit-1995
Shepard Hall* 340,239 12 1907
Window Replacement, Exterior Renovation-1989, NYPA Lighting, Motor and VSD Retrofit-1995
Steinman Hall 318,522 14 1962 Exterior Skin and Windows-1988, NYPA Lighting, Motor and VSD Retrofit-1995
Structural Biology Center 57,847 4 1937 Major Renovations in 1996, 2002 and 2007 Vivarium 6,681 1 2007
Wingate Hall* 61,517 5 1907
Window Replacement-1995, Exterior Renovation, NYPA Lighting, Motor and VSD Retrofit-1995
Total
3,309,571
Source: CCNY Archibus Database * Gothic buildings that are landmark structures

The City College of New York (CCNY) – Campus Energy Assessment
Final: January 18, 2010 I:\Nys-Dorm.12145\44128.City-College-Cl\Docs\Reports\Energy Assessment\Report\Final Report\MASTER_CCNY EA Report Final 1_18_10.doc
5
2.2. Energy Use
2.2.1. Utility Billing Data Evaluation A review of the utility billing data and energy consumption trends for CCNY was performed to evaluate the distribution of energy consumption between different billing accounts at the campus, and to determine the extent of non-building related influences (primarily ambient temperature dependence).
2.2.2. Electric Account and Meter Summary CCNY is served by nine utility billing accounts with 37 different utility meters. Three of the accounts have multiple meters, with the largest account covering 19 meters and multiple buildings. The next largest account covers eight meters dedicated to the North Academic Center, and the third largest account covers four meters. Table 2.2-1 displays the information for eight of the active accounts accessed directly from Consolidated Edison. The account for 247 W 87th St (490118081000009) is no longer active. Annually, CCNY consumes just over 54 million kilowatt hours per year (kWh/year) of electricity, with an aggregate peak demand of 9.5 megawatts (MW). Energy use is split roughly equally between the two largest accounts (44% and 46%), and the remaining 10% is distributed across the others. Electrical demand is more heavily weighted towards the new North Academic Center (51%), while the next largest account is only 37% of the aggregate demand, and the small accounts total 12%. The New York Power Authority (NYPA) summary provided for CCNY for fiscal year July 2007 – July 2008 represented in Table 2.2-2 indicates a similar level of energy consumption, but the demand reported is much higher (on the order of 14 MW compared to 9.5 MW). The utility costs included in the summary indicated that the college spends $6.1 million/year in electricity and $2.2 million/year in natural gas, resulting in average rates for energy at the college of $0.11/kWh for electric and $1.28/therm for natural gas.

The City College of New York (CCNY) – Campus Energy Assessment
Final: January 18, 2010 I:\Nys-Dorm.12145\44128.City-College-Cl\Docs\Reports\Energy Assessment\Report\Final Report\MASTER_CCNY EA Report Final 1_18_10.doc
6
Table 2.2-1. Two Year Consumption History – CCNY Accounts
Act
#49
0118
0858
0001
6
Act
#49
0118
0715
0000
0
Act
#49
0118
0719
0000
2
Act
#49
0118
0818
0000
2
Act
#49
0118
0875
0000
2
Act
#49
0118
0860
0500
3
Act
#49
0118
0847
0000
1
Act
#49
0118
0806
0000
7
All
Acc
ount
s
Demand Energy Demand Energy Demand Energy Demand Energy Demand Energy Demand Energy Demand Energy Demand Energy Demand Energy Start Date End Date Days (kW) (kWh) (kW) (kWh) (kW) (kWh) (kW) (kWh) (kW) (kWh) (kW) (kWh) (kW) (kWh) (kW) (kWh) (kW) (kWh) Jul 26, 2007 Sep 25, 2007 61 5,494 5,253,600 232 99,200 643 301,040 11 378 3 1,008 173 82,400 0 0 3,680 4,154,640 10,237 9,897,009 Sep 25, 2007 Oct 25, 2007 30 5,462 2,160,000 296 86,800 546 265,440 4 720 5 1,494 186 53,120 1.8 90 3,712 2,099,880 10,212 4,672,294 Oct 25, 2007 Nov 27, 2007 33 2,906 1,740,000 212 97,200 542 283,040 3 288 7 1,638 176 53,920 0.1 18 3,856 2,385,960 7,702 4,566,860 Nov 27, 2007 Dec 27, 2007 30 2,754 1,677,600 240 98,000 522 252,240 5 342 11 2,448 173 49,600 0.9 36 3,984 2,216,880 7,690 4,302,082 Dec 27, 2007 Jan 28, 2008 32 2,794 1,665,600 320 122,400 522 252,080 5 1044 11 2,142 150 37,440 2.5 108 3,696 2,211,060 7,501 4,296,581 Jan 28, 2008 Feb 27, 2008 30 2,822 1,728,000 340 126,400 474 236,000 5 720 10 2,358 186 50,240 2.1 234 3,936 2,182,140 7,775 4,331,045 Feb 27, 2008 Mar 27, 2008 29 2,746 1,600,800 276 115,600 531 228,880 3 630 10 2,124 181 49,280 2.5 162 3,792 2,090,640 7,542 4,092,912 Mar 27, 2008 Apr 25, 2008 29 2,578 1,531,200 240 97,600 506 232,080 4 504 9 1,872 171 48,160 0.9 36 3,840 2,032,500 7,349 3,948,723 Apr 25, 2008 May 27, 2008 32 3,904 1,658,400 180 90,000 514 259,440 5 1224 9 1,494 189 54,880 1.6 72 3,632 2,145,120 8,434 4,215,160 May 27, 2008 Jun 25, 2008 29 5,502 2,652,000 172 94,800 630 264,960 3 306 6 1,440 158 44,480 0.5 54 3,616 2,003,880 10,088 5,066,506 Jun 25, 2008 Jul 25, 2008 30 5,554 2,906,400 212 73,200 602 305,040 3 558 4 1,080 166 43,360 0.7 36 3,616 2,080,200 10,158 5,414,478 Jul 25, 2008 Aug 25, 2008 31 5,148 2,433,600 136 72,400 531 293,600 2 468 4 1,206 149 37,600 0.3 36 3,488 2,083,320 9,458 4,926,540 Aug 25, 2008 Sep 24, 2008 30 4,726 2,370,400 144 83,200 580 262,400 4 558 3 990 160 47,840 1.4 72 3,728 2,077,200 9,347 4,847,281 Sep 24, 2008 Oct 24, 2008 30 4,142 1,840,000 156 76,000 508 232,800 7 918 5 1,530 179 53,120 1.6 90 3,744 2,092,920 8,742 4,301,978 Oct 24, 2008 Nov 24, 2008 31 2,902 1,748,000 180 62,800 508 240,800 3 810 10 1,818 173 45,920 2.3 234 3,776 2,219,160 7,554 4,324,194 Nov 24, 2008 Dec 26, 2008 32 2,826 1,791,200 264 103,200 544 251,200 6 1116 9 2,052 171 50,880 1.9 198 3,808 2,257,440 7,630 4,462,090 Dec 26, 2008 Jan 28, 2009 33 2,802 1,781,600 400 308,800 496 262,400 4 1026 10 4,770 160 38,080 1.9 198 3,696 2,188,920 7,571 4,590,563 Jan 28, 2009 Feb 27, 2009 30 2,924 1,796,000 352 136,000 508 238,400 5 990 10 2,268 173 50,560 1.8 216 3,744 2,082,240 7,718 4,311,468 Feb 27, 2009 Mar 30, 2009 31 2,944 1,760,000 304 113,200 498 254,000 2 450 10 2,466 171 52,480 1.9 198 3,792 2,146,860 7,723 4,334,433 Mar 30, 2009 Apr 28, 2009 29 3,586 1,553,600 192 76,400 528 232,800 4 378 9 2,052 165 43,840 1.4 108 3,664 1,957,560 8,149 3,871,301 Apr 28, 2009 May 28, 2009 30 4,970 1,989,600 192 59,200 552 260,400 3 450 7 1,818 171 51,200 1.8 126 3,680 2,035,980 9,577 4,403,381 May 28, 2009 Jun 26, 2009 29 4,456 2,146,400 260 78,800 548 255,200 2 342 4 1,476 155 41,440 1.6 144 3,440 1,898,160 8,867 4,426,373 Jun 26, 2009 Jul 28, 2009 32 4,734 2,762,400 148 68,000 612 299,200 0 0 4 1,566 165 43,200 1.4 126 3,504 2,083,800 9,168 5,262,726 Typical Year 368 5,148 23,972,800 400 1,238,000 612 3,083,200 7 7,506 10 24,012 179 556,160 2 1,746 3,808 25,123,560 9,577 54,062,327 51% 44% 4% 2% 6% 6% 0% 0% 0% 0% 2% 1% 0% 0% 37% 46% 100% 100% Typical Year 7/2008 - 7/2009 5,148 23,972,800 Department of Citywide Administrative Services – Division of Energy Management
The City College of New York (CCNY) – Campus Energy Assessment
Final: January 18, 2010 I:\Nys-Dorm.12145\44128.City-College-Cl\Docs\Reports\Energy Assessment\Report\Final Report\MASTER_CCNY EA Report Final 1_18_10.doc
7
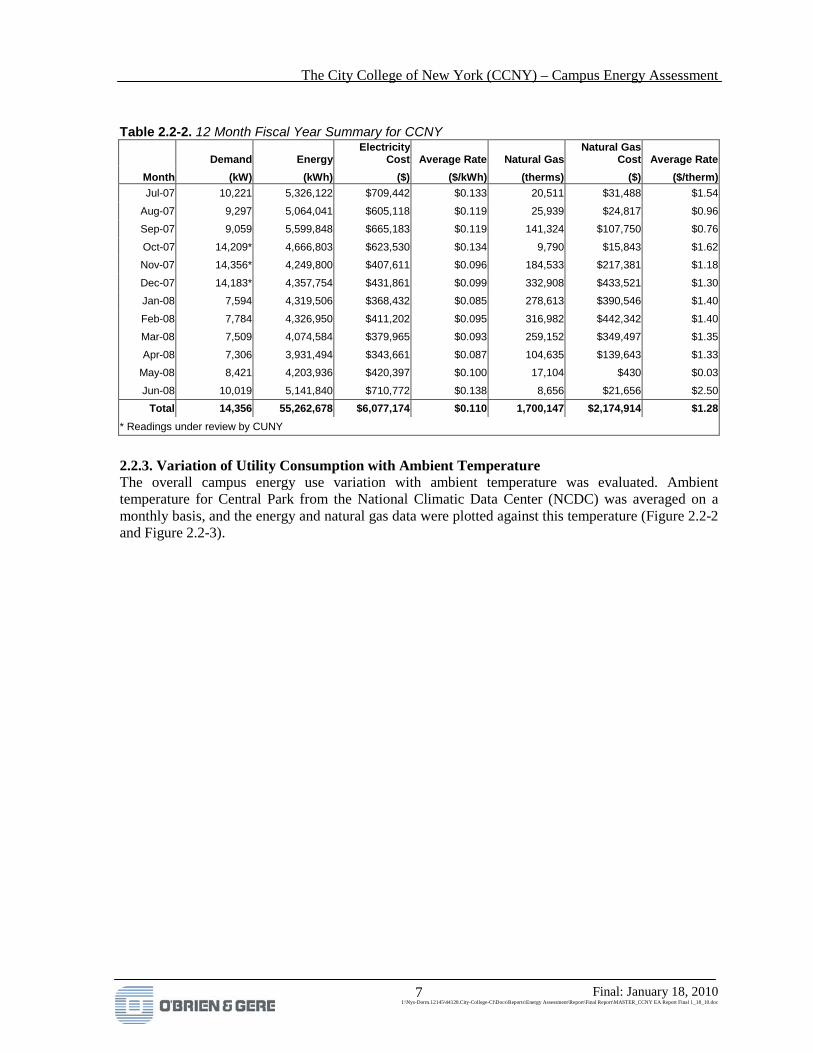
Table 2.2-2. 12 Month Fiscal Year Summary for CCNY
Demand Energy Electricity
Cost Average Rate Natural Gas Natural Gas
Cost Average Rate Month (kW) (kWh) ($) ($/kWh) (therms) ($) ($/therm) Jul-07 10,221 5,326,122 $709,442 $0.133 20,511 $31,488 $1.54
Aug-07 9,297 5,064,041 $605,118 $0.119 25,939 $24,817 $0.96
Sep-07 9,059 5,599,848 $665,183 $0.119 141,324 $107,750 $0.76
Oct-07 14,209* 4,666,803 $623,530 $0.134 9,790 $15,843 $1.62
Nov-07 14,356* 4,249,800 $407,611 $0.096 184,533 $217,381 $1.18
Dec-07 14,183* 4,357,754 $431,861 $0.099 332,908 $433,521 $1.30
Jan-08 7,594 4,319,506 $368,432 $0.085 278,613 $390,546 $1.40
Feb-08 7,784 4,326,950 $411,202 $0.095 316,982 $442,342 $1.40
Mar-08 7,509 4,074,584 $379,965 $0.093 259,152 $349,497 $1.35
Apr-08 7,306 3,931,494 $343,661 $0.087 104,635 $139,643 $1.33
May-08 8,421 4,203,936 $420,397 $0.100 17,104 $430 $0.03
Jun-08 10,019 5,141,840 $710,772 $0.138 8,656 $21,656 $2.50 Total 14,356 55,262,678 $6,077,174 $0.110 1,700,147 $2,174,914 $1.28
* Readings under review by CUNY
2.2.3. Variation of Utility Consumption with Ambient Temperature The overall campus energy use variation with ambient temperature was evaluated. Ambient temperature for Central Park from the National Climatic Data Center (NCDC) was averaged on a monthly basis, and the energy and natural gas data were plotted against this temperature (Figure 2.2-2 and Figure 2.2-3).

The City College of New York (CCNY) – Campus Energy Assessment
Final: January 18, 2010 I:\Nys-Dorm.12145\44128.City-College-Cl\Docs\Reports\Energy Assessment\Report\Final Report\MASTER_CCNY EA Report Final 1_18_10.doc
8
Figure 2.2-1. Groupings of Buildings on Single Billing Accounts
Note: Latest DASNY map does not reflect all areas under construction.

City College of New York (CCNY) – Campus Energy Assessment
Final: January 18, 2010 I:\Nys-Dorm.12145\44128.City-College-Cl\Docs\Reports\Energy Assessment\Report\Final Report\MASTER_CCNY EA Report Final 1_18_10.doc
9
Figure 2.2-3 displays the variation in energy consumption with ambient temperature. The trend displays a classic change point model, with energy increasing as ambient temperature moves away from the thermal balance temperature of 53°F. Below 53°F, the monthly energy use increases at a rate of 23,525 kWh/month/°F typically due to increases in exterior and interior lighting loads (as the decrease in daylight duration is coincident with the decrease in ambient temperature). Other causes for this trend are increases in pump and fan runtime associated with heating operations. Above 53°F, the monthly energy use increases at a rate of 67,547 kWh/month/°F. This increase is due to energy consumption required for space cooling, as well as increased fan and pump runtime. The trend also indicates that 3.9 million kWh/month, or 47.2 million kWh/year, is temperature independent energy consumption (lights, equipment, and constant duty motors for example). This is approximately 85% of the total campus energy consumption. Energy consumption above the thermal balance point totals 6.4 million kWh/year, or 12% of the total campus energy consumption. Energy consumption below the thermal balance point totals 1.7 million kWh/year, or 3% of the total campus energy consumption.
CCNY Energy Use Variation With Ambient
20 40 60 80Ambient Temperature (F)
0
1000000
2000000
3000000
4000000
5000000
6000000
Ener
gy (k
Wh/
mon
th)
kWh/month (TAO < 53.3 F) = 5184429 - 23525 * TAOkWh/month (TAO > 53.3 F) = 338901 + 67457 * TAO
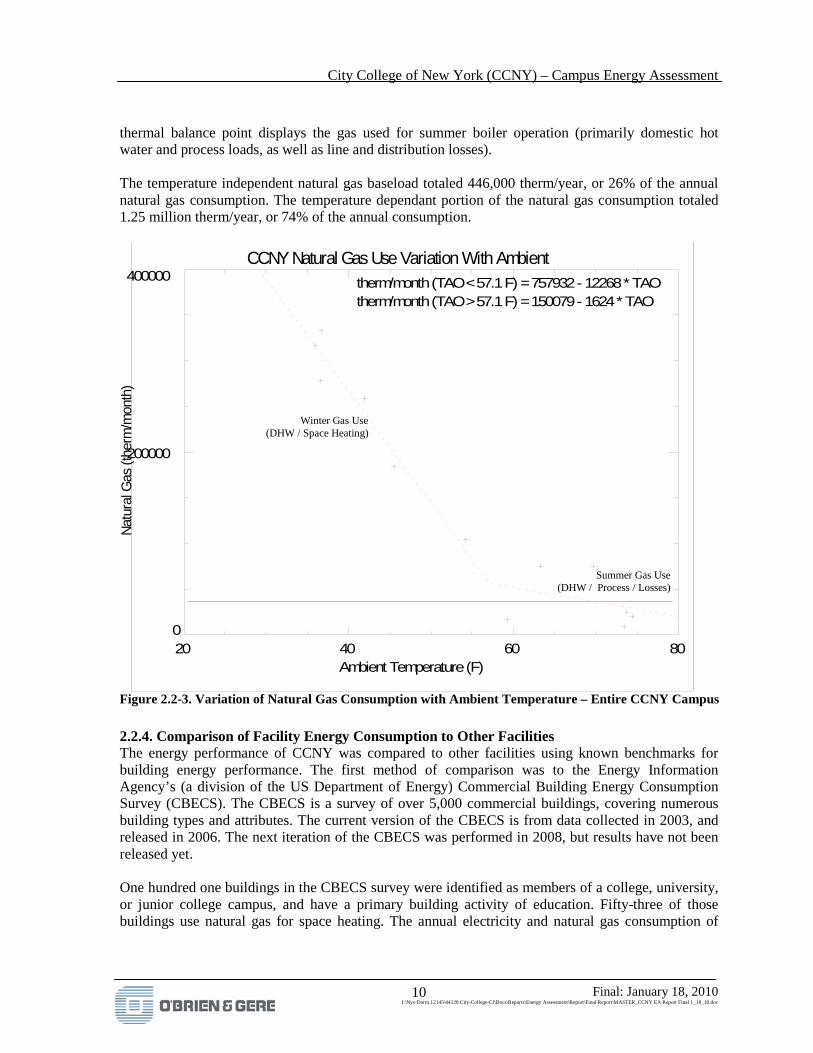
Figure 2.2-2. Variation of Energy Consumption with Ambient Temperature – Entire CCNY Campus A similar analysis was performed on the natural gas consumption for the campus (Figure 2.2-4). The gas use trend again indicated a change-point relation with ambient temperature. The trend below the thermal balance point of 57°F is indicative of the gas use for space heating, while the trend above the
Temperature Independent Baseload
Temperature Dependent (Heating)
Temperature Dependent (Cooling)
City College of New York (CCNY) – Campus Energy Assessment
Final: January 18, 2010 I:\Nys-Dorm.12145\44128.City-College-Cl\Docs\Reports\Energy Assessment\Report\Final Report\MASTER_CCNY EA Report Final 1_18_10.doc
10
thermal balance point displays the gas used for summer boiler operation (primarily domestic hot water and process loads, as well as line and distribution losses). The temperature independent natural gas baseload totaled 446,000 therm/year, or 26% of the annual natural gas consumption. The temperature dependant portion of the natural gas consumption totaled 1.25 million therm/year, or 74% of the annual consumption.
CCNY Natural Gas Use Variation With Ambient
20 40 60 80Ambient Temperature (F)
0
200000
400000
Natu
ral G
as (t
herm
/mon
th)
therm/month (TAO < 57.1 F) = 757932 - 12268 * TAOtherm/month (TAO > 57.1 F) = 150079 - 1624 * TAO
Figure 2.2-3. Variation of Natural Gas Consumption with Ambient Temperature – Entire CCNY Campus
2.2.4. Comparison of Facility Energy Consumption to Other Facilities The energy performance of CCNY was compared to other facilities using known benchmarks for building energy performance. The first method of comparison was to the Energy Information Agency’s (a division of the US Department of Energy) Commercial Building Energy Consumption Survey (CBECS). The CBECS is a survey of over 5,000 commercial buildings, covering numerous building types and attributes. The current version of the CBECS is from data collected in 2003, and released in 2006. The next iteration of the CBECS was performed in 2008, but results have not been released yet. One hundred one buildings in the CBECS survey were identified as members of a college, university, or junior college campus, and have a primary building activity of education. Fifty-three of those buildings use natural gas for space heating. The annual electricity and natural gas consumption of
Summer Gas Use (DHW / Process / Losses)
Winter Gas Use (DHW / Space Heating)

City College of New York (CCNY) – Campus Energy Assessment
Final: January 18, 2010 I:\Nys-Dorm.12145\44128.City-College-Cl\Docs\Reports\Energy Assessment\Report\Final Report\MASTER_CCNY EA Report Final 1_18_10.doc
11
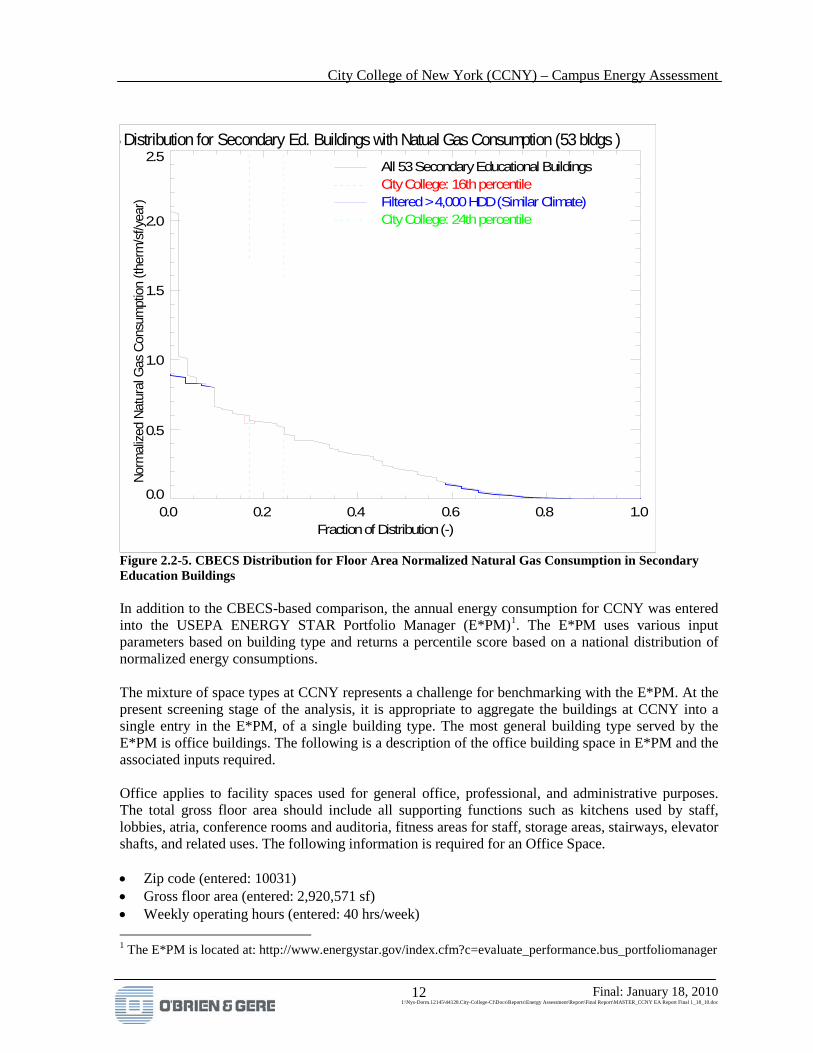
these buildings were normalized based on building floor area to kWh/sf and therm/sf figures for comparison with the actual performance of CCNY. Normalizing the 55 million kWh/year electricity consumption and 1.7 million therm/year in natural gas consumption by the 2.92 million square feet of building area at CCNY results in normalized energy consumptions of 18.9 kWh/sf/year and 0.58 therm/sf/year. Figure 2.2-4 and Figure 2.2-5 display the distribution of the CBECS data for the identified comparable buildings to CCNY. The distribution was evaluated for all secondary education buildings, as well as those located in similar climates with greater than 4,000 heating degree days. As a whole, CCNY ranked between 27th to 32nd percentile on normalized electricity consumption, and 16th to 24th percentile on normalized natural gas consumption. The variation in ranking was due to the inclusion of the climate-based constraint, and resulting smaller sample size. These generally lower rankings indicate that there is reasonably good potential for savings in both electricity and natural gas consumption at CCNY.
CBECS Distribution for Secondary Ed. Buildings (101 bldgs )
0.0 0.2 0.4 0.6 0.8 1.0Fraction of Distribution (-)
0
10
20
30
40
50
Norm
alize
d El
ectri
city
Cons
umpt
ion
(kW
h/sf
/yea
r)
All 53 Secondary Educational BuildingsCity College: 32nd percentileFiltered > 4,000 HDD (Similar Climate)City College: 27th percentile
Figure 2.2-4. CBECS Distribution for Floor Area Normalized Electricity Consumption in Secondary Education Buildings
City College of New York (CCNY) – Campus Energy Assessment
Final: January 18, 2010 I:\Nys-Dorm.12145\44128.City-College-Cl\Docs\Reports\Energy Assessment\Report\Final Report\MASTER_CCNY EA Report Final 1_18_10.doc
12
S Distribution for Secondary Ed. Buildings with Natual Gas Consumption (53 bldgs )
0.0 0.2 0.4 0.6 0.8 1.0Fraction of Distribution (-)
0.0
0.5
1.0
1.5
2.0
2.5No
rmal
ized
Natu
ral G
as C
onsu
mpt
ion
(ther
m/s
f/yea
r)
All 53 Secondary Educational BuildingsCity College: 16th percentileFiltered > 4,000 HDD (Similar Climate)City College: 24th percentile
Figure 2.2-5. CBECS Distribution for Floor Area Normalized Natural Gas Consumption in Secondary Education Buildings In addition to the CBECS-based comparison, the annual energy consumption for CCNY was entered into the USEPA ENERGY STAR Portfolio Manager (E*PM)1
• Zip code (entered: 10031)
. The E*PM uses various input parameters based on building type and returns a percentile score based on a national distribution of normalized energy consumptions. The mixture of space types at CCNY represents a challenge for benchmarking with the E*PM. At the present screening stage of the analysis, it is appropriate to aggregate the buildings at CCNY into a single entry in the E*PM, of a single building type. The most general building type served by the E*PM is office buildings. The following is a description of the office building space in E*PM and the associated inputs required. Office applies to facility spaces used for general office, professional, and administrative purposes. The total gross floor area should include all supporting functions such as kitchens used by staff, lobbies, atria, conference rooms and auditoria, fitness areas for staff, storage areas, stairways, elevator shafts, and related uses. The following information is required for an Office Space.
• Gross floor area (entered: 2,920,571 sf) • Weekly operating hours (entered: 40 hrs/week) 1 The E*PM is located at: http://www.energystar.gov/index.cfm?c=evaluate_performance.bus_portfoliomanager

City College of New York (CCNY) – Campus Energy Assessment
Final: January 18, 2010 I:\Nys-Dorm.12145\44128.City-College-Cl\Docs\Reports\Energy Assessment\Report\Final Report\MASTER_CCNY EA Report Final 1_18_10.doc
13
• Number of workers (students and faculty) on main shift (entered: 15,000 FTE) • Number of personal computers (entered: 5,000 estimated – includes 1,000 laptops) • Percent of gross floor area that is air conditioned (entered: 50% or more) • Percent of gross floor area that is heated (entered: 50% or more) • Annual electricity consumption (entered: 55,262,678 kWh/year) • Annual natural gas consumption (entered: 1,700,147 therm/year)
Based on the inputs to the E*PM, CCNY returned a score of 67/100 (Figure 2-6) – slightly higher than the percentiles returned by the CBECS investigation (which represent the benchmark “average”), but still indicating that the potential for improvement is relatively high. To achieve an ENERGY STAR rating, the college would need to achieve a score of 75/100 or higher. By achieving an overall energy reduction of 10% from combined electricity and natural gas energy conservation measures, CCNY could reach this rating threshold.
Figure 2.2-6. E*PM Results for CCNY Entered As An Aggregate Building
2.2.5. Upcoming Increases in Utility Charges from Reactive Power Under the new General Rule III-X “Reactive Power Demand Charge” Consolidated Edison has been approved to begin charging large customers greater than 1000 kW per billing account in October 2010 and greater than 500 kW per billing account in October 2011 for reactive power charges. For each account with a peak demand greater than the above thresholds, Con Ed will share $1.42/kVAr (kilo-volt-amp-reactive) if the power factor for the account is below PF=0.95 for the billing cycle.

City College of New York (CCNY) – Campus Energy Assessment
Final: January 18, 2010 I:\Nys-Dorm.12145\44128.City-College-Cl\Docs\Reports\Energy Assessment\Report\Final Report\MASTER_CCNY EA Report Final 1_18_10.doc
14
2.3. Impact at City College
The new General Rule III – has an impact on the three large accounts at CCNY with service entrances at W 135th Street & St. Nicholas Terrace (Finley ETA - 612 kW), 140th Street & Convent Avenue (Wingate Hall – 3,808 kW), and 1561 Amsterdam Avenue (North Academic Center – 5,148 kW). Using the new General Rule III-X, and assumptions on the actual power factor for these three accounts, calculations of the new “Reactive Power Demand Charge” were performed. Depending on the assumption of the current power factor, the impact at CCNY on the three large accounts ranges from $66,461/year to $85,044/year.
Table 2.3-1 Estimate of New kVAr Charges At CCNY.
Combined Large Account Demand
Calculated kVAr Charges @ PF = 0.95
Calculated kVAr Charges
@ PF = 0.90
Calculated kVAr Charges
@ PF = 0.85 Month (kW) (kVAr) ($) (kVAr) ($) (kVAr) ($) Jul-08 9,167 3,013 - 4,440 $6,305 5,681 $8,067 Aug-08 9,034 2,969 - 4,375 $6,213 5,599 $7,950 Sep-08 8,394 2,759 - 4,065 $5,773 5,202 $7,387 Oct-08 7,186 2,362 - 3,480 $4,942 4,453 $6,324 Nov-08 7,178 2,359 - 3,476 $4,937 4,449 $6,317 Dec-08 6,994 2,299 - 3,387 $4,810 4,334 $6,155 Jan-09 7,176 2,359 - 3,475 $4,935 4,447 $6,315 Feb-09 7,234 2,378 - 3,504 $4,975 4,483 $6,366 Mar-09 7,778 2,557 - 3,767 $5,349 4,820 $6,845 Apr-09 9,202 3,025 - 4,457 $6,329 5,703 $8,098 May-09 8,444 2,775 - 4,090 $5,807 5,233 $7,431 Jun-09 8,850 2,909 - 4,286 $6,086 5,485 $7,788 Total - $66,461 $85,044
Note: kVAr = reactive power 2.3.1. Power Factor Correction To reduce or eliminate these new utility charges, corrective action can be taken for power factor correction. Power factor correction be applied either at critical distribution point in the College electrical infrastructure (i.e. main service entrances), or at individual large loads. Power factor correction typically takes the form of capacitor banks combined with power electronics to ensure that the power factor correction applied matches the desired level of correction. Typical costs of power factor correction are on the order of $100/kW. For CCNY, this results in a $920,200 system (based on 9,202 kW of peak demand at $100/kW). This cost does not address the installation or engineering required for installation, nor the disruption to buildings for work performed at the main service level of the building. Based on the estimated future kVAR charges, payback on power factor correction equipment alone is 10-13 years, and including installation and engineering; a power factor correction project may never payback inside the equipment lifetime. In addition, reactive power correction does not result in a decrease of energy consumption and greenhouse gas production at the campus level.

City College of New York (CCNY) – Campus Energy Assessment
Final: January 18, 2010 I:\Nys-Dorm.12145\44128.City-College-Cl\Docs\Reports\Energy Assessment\Report\Final Report\MASTER_CCNY EA Report Final 1_18_10.doc
15
3. Assessment of Campus Facilities
3.1. Overview
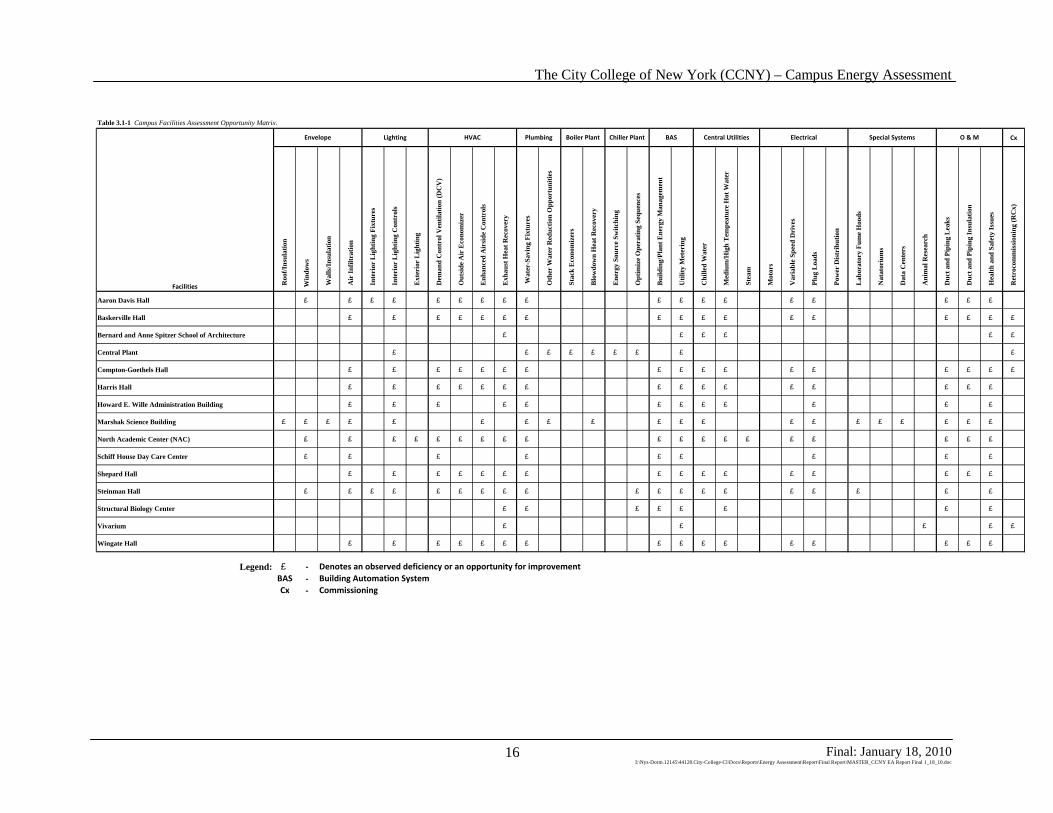
The accompanying Table 3.1-1 on the following page provides a preliminary list of potential energy efficiency improvement opportunities identified in each of the buildings at CCNY as a result of this Campus Energy Assessment. The table is organized by energy efficiency opportunity area and indicates those buildings where opportunities for improvement may be present. The following section provides a brief description of the audit team’s observations and potential energy saving opportunities based on current best practices.
The City College of New York (CCNY) – Campus Energy Assessment
Final: January 18, 2010 I:\Nys-Dorm.12145\44128.City-College-Cl\Docs\Reports\Energy Assessment\Report\Final Report\MASTER_CCNY EA Report Final 1_18_10.doc
16
Table 3.1-1 Campus Facilities Assessment Opportunity Matrix.
Cx
R
oof/I
nsul
atio
n
Win
dow
s
W
alls
/Ins
ulat
ion
A
ir In
filtr
atio
n
In
teri
or L
ight
ing
Fixt
ures
In
teri
or L
ight
ing
Con
trol
s
E
xter
ior
Lig
htin
g
D
eman
d C
ontr
ol V
entil
atio
n (D
CV
)
O
utsi
de A
ir E
cono
miz
er
E
nhan
ced
Air
side
Con
trol
s
E
xhau
st H
eat R
ecov
ery
W
ater
-Sav
ing
Fixt
ures
O
ther
Wat
er R
educ
tion
Opp
ortu
nitie
s
St
ack
Eco
nom
izer
s
B
low
dow
n H
eat R
ecov
ery
E
nerg
y So
urce
Sw
itchi
ng
O
ptim
ize
Ope
ratin
g Se
quen
ces
B
uild
ing/
Plan
t Ene
rgy
Man
agem
ent
U
tility
Met
erin
g
C
hille
d W
ater
M
ediu
m/H
igh
Tem
peat
ure
Hot
Wat
er
St
eam
M
otor
s
V
aria
ble
Spee
d D
rive
s
Pl
ug L
oads
Po
wer
Dis
trib
utio
n
L
abor
ator
y Fu
me
Hoo
ds
N
atat
oriu
ms
D
ata
Cen
ters
A
nim
al R
esea
rch
D
uct a
nd P
ipin
g L
eaks
D
uct a
nd P
ipin
g In
sula
tion
H
ealth
and
Saf
ety
Issu
es
R
etro
com
mis
sion
ing
(RC
x)
Aaron Davis Hall £ £ £ £ £ £ £ £ £ £ £ £ £ £ £ £ £ £
Baskerville Hall £ £ £ £ £ £ £ £ £ £ £ £ £ £ £ £ £
Bernard and Anne Spitzer School of Architecture £ £ £ £ £ £
Central Plant £ £ £ £ £ £ £ £ £
Compton-Goethels Hall £ £ £ £ £ £ £ £ £ £ £ £ £ £ £ £ £
Harris Hall £ £ £ £ £ £ £ £ £ £ £ £ £ £ £ £
Howard E. Wille Administration Building £ £ £ £ £ £ £ £ £ £ £ £
Marshak Science Building £ £ £ £ £ £ £ £ £ £ £ £ £ £ £ £ £ £ £ £
North Academic Center (NAC) £ £ £ £ £ £ £ £ £ £ £ £ £ £ £ £ £ £ £
Schiff House Day Care Center £ £ £ £ £ £ £ £ £
Shepard Hall £ £ £ £ £ £ £ £ £ £ £ £ £ £ £ £
Steinman Hall £ £ £ £ £ £ £ £ £ £ £ £ £ £ £ £ £ £ £
Structural Biology Center £ £ £ £ £ £ £ £
Vivarium £ £ £ £ £
Wingate Hall £ £ £ £ £ £ £ £ £ £ £ £ £ £ £ £
Legend: £ - Denotes an observed deficiency or an opportunity for improvementBAS - Building Automation SystemCx - Commissioning
Lighting BAS Special SystemsHVAC Plumbing Boiler Plant O & M
Facilities
Chiller Plant Central Utilities ElectricalEnvelope

The City College of New York (CCNY) – Campus Energy Assessment
Final: January 18, 2010 I:\Nys-Dorm.12145\44128.City-College-Cl\Docs\Reports\Energy Assessment\Report\Final Report\MASTER_CCNY EA Report Final 1_18_10.doc
17
3.2. Building Envelope
Observations: Since the majority of buildings at CCNY are over 30 years of age, improvements to roofing, windows, insulation and door and window weather stripping present opportunities for energy savings. Opportunities: Generally, building envelope improvements do not present a reasonable payback based on improved energy performance (typically over 10 years). In buildings such as Shepard Hall where renovations are currently planned, it is important to consider the energy benefit of building envelope improvements and capture their contribution to reducing energy use, energy cost, maintenance time and costs, and greenhouse gas impacts.
3.2.1. Roofing Materials Observations: The roofs at CCNY are well maintained and have very few deficiencies, with some exceptions (as noted in the building descriptions in Appendix B). With the exception of the new architecture building, all of the roofs are black or dark colored and are generally in the second half of their life expectancy. Opportunities: For flat roofs, white polyvinyl chloride (PVC) roofing systems make an important contribution to reducing summer cooling loads. The high sustained reflectivity delivered by white PVC roofing membrane reflects more of the incident solar energy which also reduces the air temperature above the roof that may be used for ventilation. Additionally, a white roof reduces the urban heat island effect that contributes to higher temperatures in cities. Vegetative “green roofs” also reduce the heat island effect, although with much higher installation and maintenance costs. It is recommended that, as roofing projects are performed, white PVC roofing be utilized where possible. Roofing projects also provide an opportunity to upgrade or replace the roof insulation systems, further enhancing the energy performance of the building. There are benefits for storm water retention that can be accomplished by what is termed a “blue roof.” This technology can be applied to existing flat roofs and involves modifications to roof drains to retain 2 to 3 inches of water on the roof. A structural analysis of the roof is recommended before deploying this technology.
3.2.2. Windows Observations: With relatively few exceptions, the original single pane windows in the Gothic buildings have been replaced with dual-pane glass, providing improved thermal performance and reduced air infiltration. Aaron Davis Hall, Schiff House Day Care Center, NAC, and Steinman Halls still have their original single pane windows and are candidates for retrofit. Old sashes in the Gothic buildings fit poorly and many are inoperable, so that they may be left open in heating and cooling seasons, which wastes energy. In the newer buildings, dual pane, non-operable windows are typical. In the NAC Building, a recent window replacement utilized single-pane with a reflective film between two plies of glazing. Dual pane glazing that would have reduced heating and cooling transmission losses was not utilized due to structural limitations of the curtain wall assembly. Opportunities: Windows have an important influence on energy use and occupant comfort in exterior perimeter spaces. The heating and cooling effects may only influence the first 10 feet near the windows, but daylight may penetrate up to 25 feet or more if properly designed. As perimeter zone
The City College of New York (CCNY) – Campus Energy Assessment
Final: January 18, 2010 I:\Nys-Dorm.12145\44128.City-College-Cl\Docs\Reports\Energy Assessment\Report\Final Report\MASTER_CCNY EA Report Final 1_18_10.doc
18
area increases as a percentage of total building area, it becomes more important to select an energy efficient window, in order to maximize energy savings and occupant comfort. The second impact of high performance windows is the reduction of building heating and cooling loads which can reduce the capacity and first cost of equipment needed to condition the building. Reduced peak loads means smaller chillers and boilers, smaller ducts, and smaller fans. In addition, since electrical peak loads usually occur on summer days when demand charges are highest, windows that reduce peak loads can result in energy demand cost savings as well. Triple- and quadruple-glazed windows became commercially available in the 1980s as a response to the desire for more energy-efficient windows. There are physical and economic limits to the number of glass panes that can be added to a window assembly. However, as each additional pane of glass adds to the insulating value of the assembly, it also reduces the visible light transmission and the solar heat gain coefficient. Additional panes of glass increase the weight and thickness of the unit, which can impact mounting and handling. Operable windows should be avoided where central HVAC systems are present. While operable windows may provide a local comfort or ventilation benefit, the performance of the central HVAC system can be adversely affected, potentially resulting in higher energy costs. To prevent windows from being opened while central heating and cooling systems running it may be advisable to permanent secure the windows in a closed position. Generally, tradeoffs may be required to find the correct window for any application, but it is important that energy performance be considered when windows are selected. Dual-pane windows with thermal breaks, high performance weather stripping, and a low-e coating should be considered.
3.2.3. Insulation Observations: Generally, building insulation upgrades have not been conducted at CCNY in recent years. While adding insulation to walls and roofs can improve a building’s energy performance, it typically can’t be cost-justified as a stand-alone energy measure. Opportunities: There is a popular misconception that additional insulation will always provide a return on investment. The reality is that insulation suffers from diminishing returns. Adding more insulation will yield more savings, but incremental additions of insulation do not yield the same incremental savings. For example, going from a wall with a composite value of R10 to a wall with a composite value of R20 will cut the energy usage in half (approximately 3.5 Btu/sf from 7 Btu/sf on a hot day), but adding another layer of R-10 to go from R-20 to R-30 insulation will not result in that same savings, but rather less than half of what was saved going from R-10 to R-20 (approximately 1.2 Btu/sf on a hot day). Also, in New York, where the climate produces many mild days in the spring and fall, insulation value decreases even further. As a result of diminishing returns, it is not advisable to just add more insulation to energy deficient buildings. In order to maintain return on investment, generally nothing over R-30 is advised. However, a minimum of R-20 composite value is suggested in order to stay within the maximum return on investment.
3.2.4. Air Infiltration Observations: Air infiltration is a substantial problem in buildings with older windows or single pane glass (such as the NAC). In buildings with central air conditioning, open windows can have a negative impact on temperature control and waste energy. Shepard Hall has central air conditioning,

The City College of New York (CCNY) – Campus Energy Assessment
Final: January 18, 2010 I:\Nys-Dorm.12145\44128.City-College-Cl\Docs\Reports\Energy Assessment\Report\Final Report\MASTER_CCNY EA Report Final 1_18_10.doc
19
but poor space temperature control in some areas results in the occupants’ need to use operable windows for personal comfort. Opportunities: Infiltration can be one of the leading causes of discomfort and energy use in a building. Additionally, uncontrolled permeation of outside air into a building means an introduction of moisture, dirt, and otherwise unwanted influences on the building that could be filtered or resolved by a properly designed HVAC system before they could reach an occupant. Repairing or replacing window and door weather stripping, sealing openings in the exterior building envelope and providing vestibules and revolving doors are strategies that can be engaged to reduce unnecessary building air infiltration on campus.
3.3. Lighting
3.3.1. Lighting Fixtures Observations: Most of the lighting on campus has been updated in the last 15 years by either the campus-wide NYPA lighting project or as part of building renovations. In the NAC and elsewhere, some spaces were found to be over lit based on an evaluation of the lighting fixtures and calculated watts per square foot in the subject areas. In the NAC, it is possible that this was the result of fixtures being replaced one for one without recalculating the resulting light levels in the space. Appendix C includes a summary of fixture types, spare footages of types of spaces served, an estimated lighting load, as prepared by O’Brien & Gere during this energy assessment. Opportunities: Opportunities fall into two categories: energy efficient fixtures and the appropriate use of lighting. While most lighting fixtures were replaced as part of the NYPA lighting retrofit project in 1995, some opportunity remains to replace fixtures with more efficient units. Efficient lighting reduces electrical energy costs year-round and space cooling costs in summer. Corridor lights on exterior walls with full height windows were on during daylight hours. Lighting occupancy sensors were not observed in mechanical spaces. Reducing the operating hours of unnecessary lighting reduces electrical energy costs year-round and space cooling costs in summer. Interior lighting represents a large portion of the energy consumption at CCNY. During the site assessment, several representative spaces were examined for quantity and type of lighting fixture. At the time of the 1995 lighting retrofit project, nearly all of the older T-12 and magnetic ballast fixtures were replaced with T-8 and electronic ballasts, and many transient zones such as offices and classrooms were outfitted with wall mounted occupancy sensors. Table 6.2-1 displays the observed lighting density at CCNY on a per building basis, as well as some general observations as to the per building variation in lighting operation. At the time of this writing, The Dormitory Authority of the State of New York (DASNY) has six additional lighting projects underway on the CCNY campus.
3.3.2. Interior Night Time Lighting Observations: CCNY requires interior night lighting to satisfy the safety and security needs of students and faculty. The majority of lighting in classrooms and offices is well-controlled to match demand and occupancy. Some minor discrepancies are noted in the appendices.

The City College of New York (CCNY) – Campus Energy Assessment
Final: January 18, 2010 I:\Nys-Dorm.12145\44128.City-College-Cl\Docs\Reports\Energy Assessment\Report\Final Report\MASTER_CCNY EA Report Final 1_18_10.doc
20
Opportunities: Night time lighting within a building should serve one or more of the following purposes during unoccupied periods: • Emergency exit lighting • Security function • Lit path to switching • Safety (around equipment or other potentially dangerous obstacles). Lighting that is energized within buildings during unoccupied hours should be reviewed to determine if it serves one of the above functions, if it does not, it should have controls or switching that allows it to be turned off.
3.3.3. Daylight Harvesting Controls Observations: The 1995 NYPA lighting upgrade project incorporated occupancy controls, did not address potential opportunities to utilize light level sensors to reduce lighting levels when sufficient sunlight is present, particularly in exterior building corridors. Opportunities: Natural light is a desirable amenity, and many spaces at CCNY have exterior walls with full height windows where the available daylight entering the space alone provides satisfactory lighting levels under most weather conditions. It is possible to reduce lighting costs through controls that shut off or dim existing electric lights in the presence of adequate natural light in these perimeter spaces. Since these controls were not observed at CCNY, there may be an opportunity to integrate this technology into existing buildings on campus, particularly in exterior corridors with full-height windows such as those found in NAC. In recent years, methods and technologies have merged to use this daylight to reduce electric lighting. Daylight is brought into the building by side lighting with windows, or top lighting with skylights, light monitors, or clerestory windows or light tubes, depending upon the application.
3.3.4. Occupancy Sensors Observations: Occupancy sensor indoor lighting control detect activity within a certain area. They provide convenience by turning lights on automatically when someone enters a room. They reduce lighting energy use by turning lights off soon after the last occupant has left the room. At CCNY, occupancy sensors were observed in classrooms, offices and large common areas such as cafeterias, having been installed under the NYPA project in 1995. The sensors used were generally of the infrared variety, which some occupants dislike and have requested to be removed. Standardizing on ultrasonic sensors and slowly replacing older sensors has started to occur. The newer ultrasonic sensor technologies respond to sound and motion and are less likely to turn off when there are occupants present in the space. A survey of the campus was performed at night to assess the effectiveness of the occupancy controls. An after-hours lighting survey indicated there were opportunities for night time lighting energy savings. Opportunities: Opportunities exist for additional occupancy controls at CCNY in those areas that were not addressed under the NYPA program, such as corridors and mechanical spaces. Changing out occupancy sensors for newer ultrasonic versions would provide greater occupant acceptance.
3.3.5. Exterior Lighting Observations: CCNY requires exterior night lighting to satisfy the safety and security needs of students and faculty. Additional lighting is provided to provide visual accents and to highlight the

The City College of New York (CCNY) – Campus Energy Assessment
Final: January 18, 2010 I:\Nys-Dorm.12145\44128.City-College-Cl\Docs\Reports\Energy Assessment\Report\Final Report\MASTER_CCNY EA Report Final 1_18_10.doc
21
architectural features of campus buildings. While these systems are designed for night time, some exterior lights were observed to be on during the day. Opportunities: Like many building elements, exterior lighting design requires function to be the primary concern, and energy costs to be secondary. Since exterior lighting provides an element for security and safety in addition to way-finding, function is especially important. At a minimum, exterior lights should be controlled so that they turn off when they are not needed, such as during the day.
3.4. HVAC
3.4.1. Demand Control Ventilation (DCV) Observations: To meet the requirements of American College and University Presidents Climate Commitment SHRAE Standard 62 “Ventilation for Acceptable Indoor Air Quality,” most HVAC systems are designed to supply ventilated air based on assumed, rather than actual, occupancy. This often results in over-ventilation. Opportunities: Zone ventilation control with DCV removes the traditional dependence that ventilation has had on space conditioning load. It is now possible to control fresh air and space conditioning to a zone independently using the same variable air volume (VAV) box. The result is that the designer does not have to oversize outside air intake capacity to handle low load conditions. It is recommended that demand control ventilation be used to save significant energy when compared to traditional VAV approaches.
3.4.2. Reheat Controls Observations: Terminal reheat coils in the HVAC supply air ductwork and terminal boxes typically provide space heating in winter and room temperature control in summer. At CCNY, the hot water system serving the reheat coils is disabled in the summer which eliminates the ability of the system to control individual space temperatures. While this eliminates wasteful simultaneous heating and cooling, it causes widespread overcooling or undercooling of the spaces and occupant discomfort in summer. Prior to the elimination of summer heating, the reheat coils added so much heat to the buildings that the central chilled water plant could not meet load at times during the summer. Opportunities: In a well designed system, there should be no need for terminal air reheating. Simply removing reheats creates unintended consequences. It is recommended that alternative approaches be used to control summer zone temperatures, such as VAV and supply air temperature reset.
3.4.3. Outside Air Economizers Observations: Economizers at CCNY are generally only available by manual control on days when outside air temperatures are low enough to permit it. Oftentimes, outside air dampers are left open when economizing should not be occurring creating additional load on the system, and still other times, economizers are not utilized when they should be. Because of the haphazard status of the economizer operation it would be difficult to calculate the potential energy savings attributed to fixing the economizers. Opportunities: Economizers save energy in buildings by using outside air for cooling when conditions are appropriate (temperature and humidity of the outside air).

The City College of New York (CCNY) – Campus Energy Assessment
Final: January 18, 2010 I:\Nys-Dorm.12145\44128.City-College-Cl\Docs\Reports\Energy Assessment\Report\Final Report\MASTER_CCNY EA Report Final 1_18_10.doc
22
Due to internal heat loads associated with people, equipment and lighting, most large commercial buildings require year-round cooling. One tool that helps alleviate this excess heat gain is an economizer system. Since the only energy an economizer uses is for blower operation, an economizer system in conjunction with a traditional HVAC system can significantly reduce energy consumption by drawing in or pushing out the outdoor air. This “free” cooling that the economizer provides can be utilized during mild and cold weather periods. Economizing, although sometimes referred to as “free,” does have a capital cost associated with it, although generally the paybacks are relatively short in climates that have several months of weather in the 50 to 65 degree F range, such as New York City. It is recommended that all air handling on campus be equipped to utilize an automatic economizer function whenever it practical.
3.4.4. Window A/C Units Observations: Window units and spot coolers are prevalent in many locations throughout CCNY. Opportunities: The use of window units as an alternative to central air conditioning systems may be undesirable for one or more of the following reasons: • No economizer function to take advantage of mild days • No centralized controls to implement energy saving strategies such as unoccupied temperature
setback • No interface to heating systems to prevent simultaneous heating and cooling • Poor structural supports may pose a safety hazard • Units located in an occupied space are noisy • Electrical systems may not be designed for the electrical load required by room air conditioners • Excessive air filtration around unit perimeter • Units may be old and inefficient. With a few exceptions, widespread use of room air conditioning units should generally be discouraged and more efficient central HVAC systems used in their place. Central systems provide opportunities for energy and cost efficient control strategies such as occupied/unoccupied temperature settings, economizer cooling and remote monitoring of space temperatures.
3.4.5. Exhaust Air Heat Recovery Observations: Exhaust air heat recovery systems were not observed in any of the buildings at CCNY, including those recently constructed. Opportunities: Typical office buildings utilize 15-20% outside air as a percentage of total supply air volumes. Denser occupancies and special occupancies such as classrooms, theaters, labs, cafeterias, gymnasiums, pools, and medical spaces utilize even higher percentages of outside air. The New York State Energy Conservation Construction Code requires that any non-toxic exhaust over 2000 cubic feet per minute (cfm) be equipped with energy recovery. Attempting to recover waste heat from air volumes of less than 2000 cfm typically results in payback time periods usually not considered to be favorable.

The City College of New York (CCNY) – Campus Energy Assessment
Final: January 18, 2010 I:\Nys-Dorm.12145\44128.City-College-Cl\Docs\Reports\Energy Assessment\Report\Final Report\MASTER_CCNY EA Report Final 1_18_10.doc
23
Newer technologies offer published heat recovery efficiencies of up to 90%. However, achieving 90% efficiency may not be practical and each case should be reviewed carefully. Typically, at least 50% efficiency can be achieved by even the simplest technologies (such as run-around loops), and 85% efficiency is not uncommon when outdoor air temperatures are between 55° F and 35° F, which is common in New York. In existing installations, the cost-effectiveness of heat recovery is largely determined by the relative locations of the air exhaust and intake points. Where these are consolidated and in close proximity, exhaust heat recovery may be cost-effective. It is recommended that heat recovery be considered wherever there is space for this equipment and it can be feasibly connected. New building construction or major building rehabilitation projects particularly offer opportunities to consider and incorporate heat recovery options.
3.5. Building Automation Systems (BAS)
3.5.1. Comfort Issues Observations: Very few building occupants surveyed at CCNY reported that they were satisfied with the temperature of their personal spaces. Individual complaints varied widely, with most complaining of being too cold in summer. Typically these issues are rooted in problems within the building temperature control systems. When occupant complaints are not addressed, occupants seek out alternatives to achieve desired comfort levels, such as electric heaters, window air conditioners, and operable windows. Ultimately the occupant-chosen solutions contribute new issues, such as tripping circuit breakers due to the load from electric heaters, and increased heating and cooling loads from open windows. Opportunities: Personal comfort is by definition subjective. While ASHRAE Standard 55 defines criteria for indoor personal comfort, it is considered acceptable when 90% of the space occupants are satisfied. Occupant comfort complaints often indicate problems with central HVAC systems. When controls are not performing, facilities staff spends time responding to complaints, leaving less time for essentials maintenance tasks. Overheating and overcooling also wastes energy. Implementation of a central Building Automation System (BAS) to monitor space conditions and the operating status of HVAC equipment would provide maintenance technicians with tools to manage upset conditions and address the root causes of the temperature control issues.
3.5.2. Occupied/Unoccupied Temperature Setback Controls Observations: CCNY does not presently change space temperature settings at night and other times when the buildings are unoccupied. Opportunities: Reducing unoccupied space temperatures in winter and increasing them in summer can provide significant annual energy savings in buildings throughout CCNY campus. Areas that are continuously occupied would obviously be excluded from this strategy, but these represent a small percentage of the total campus square footage. Temperature setback control strategies can be achieved by installing automatic controls and programming the temperature schedules according to anticipated occupancy patterns. The short-term impact of individual space temperature changes on large central air handling units and chillers would be minimal. Reducing indoor temperature in winter decreases the temperature difference between indoors and outdoors, which directly reduces heat loss from a building. Reduced energy loss requires less energy from the central utilities plant. Energy

The City College of New York (CCNY) – Campus Energy Assessment
Final: January 18, 2010 I:\Nys-Dorm.12145\44128.City-College-Cl\Docs\Reports\Energy Assessment\Report\Final Report\MASTER_CCNY EA Report Final 1_18_10.doc
24
savings are typically 2% of space heating energy per degree of temperature setback. Setting the temperature lower just a few degrees can significantly reduce heating and cooling costs. It is recommended that setback controls be considered wherever it is practical at CCNY. When implementing this strategy, consideration must be given to interior humidity levels when the buildings are unoccupied and to the amount of time it takes to return the building to its occupied setpoint from the unoccupied setback temperature.
3.5.3. Fan Cycling Observations: Currently, most of the exhaust fans surveyed at CCNY run continuously. Opportunities: In energy-efficient designs, exhaust fans typically only run when the building is occupied. Shutting down fans reduces the amount of makeup air that must be heated or cooled and eliminates the electrical energy of the fan motor itself. This type of control strategy must consider the potential impact of fan shutdown on other parts of the HVAC system such as air handling units, building pressurization, lab hoods, and similar equipment issues. Caution must also be given when eliminating exhaust from bathrooms and other spaces with odors or sources of airborne contaminants.
3.5.4. Building Automation System Observations: Individual buildings at CCNY generally do not have sophisticated direct digital controls (DDC), and there is no central BAS serving the overall campus. Opportunities: Compared with simple pneumatic temperature control systems whose primary function is to just monitor and maintain room temperatures, BAS are utilized to optimize performance of the mechanical systems within any given building or group of buildings. The BAS can control a monitor and control a much larger number of individual points with no limit to the sophistication of the control sequences. The following are all typical strategies that should be employed by a BAS at CCNY:
• Optimize variable volume pumping and air handling systems.
• Provide feedback that confirms the status of control points, such as end switches on actuators.
• Provide for monitoring of HVAC equipment.
• Provide operating trend data to observe process variations and troubleshoot problems.
• Provide real-time energy usage data and estimated energy costs so that facility operators can monitor building performance, predict maintenance issues and make necessary adjustments to how facilities run.
• Provide calculations and predict optimal start and stop times for equipment, in order to maximize setback times and minimize discomfort by pulling down or warming up spaces to anticipate occupancy.
• Interface with the campus maintenance automation program (Archibus) to provide automated service requests and closure, based on alarms and manufacturer’s suggested operation and maintenance procedures.
In cases where existing HVAC systems are at or near the end of their useful life, upgrading to a BAS by itself is not recommended. The consideration of BAS as part of any major HVAC system, renovation, including integration as part of a campus-wide system is strongly recommended.

The City College of New York (CCNY) – Campus Energy Assessment
Final: January 18, 2010 I:\Nys-Dorm.12145\44128.City-College-Cl\Docs\Reports\Energy Assessment\Report\Final Report\MASTER_CCNY EA Report Final 1_18_10.doc
25
3.6. Plumbing/Water Conservation
3.6.1. Water-Saving Fixtures Observations: Generally, some toilet and lavatory fixtures at CCNY were installed as part of original building construction and some have been upgraded in accordance with the Energy Policy Act (EPACT) of 1992. Opportunities: Fixtures installed prior to 1994 that are still in use typically use considerably more water that those installed in subsequent years. To quantify the water use reduction potential in sanitary use, the existing fixtures can be classified as follows Tables 3.6-1 and 3.6-2, based on the age of the building. Table 3.6-1. Pre-EPACT plumbing fixture water consumption. Year of Building Construction Water Consumption Pre-1977 4.5-5.0 gallons / flush toilet 1977 to mid 1990s 3.5 gallons / flush Mid-1990s to present 1.6 gallons / flush toilet, 1.0 gallon / flush urinals Sinks (all years) 3.5-5.0 gallons / minute Shower heads (all years) 3.5-5.0 gallons / minute Table 3.6-2. Post-EPACT plumbing fixture water consumption
Fixture Water Consumption Toilet 1.6 gallons / flush toilet Urinals 1.0 gallons / flush Shower heads 2.5 gallons / min at 80 PSI Lavatory faucets 2.5 gallons / min at 80 PSI Kitchen faucets 2.5 gallons / min at 80 PSI In an effort to reduce water consumption, it is recommended that a phased plan be developed to replace plumbing fixtures over 15 years old at CCNY. Where existing bathrooms are in need of renovation, fixture replacement would be easily accomplished. Where no renovations are proposed, it may be necessary to replace toilets and lavatories with new water-efficient fixtures as a standalone project.
3.6.2. Pneumatic Domestic Water System Observations: Domestic water in the Marshak Science Building is delivered to the upper floors using a system that stores water under pneumatic pressure and delivers it to points of use using centrifugal water pumps. This system is original equipment that is leaking and generally in poor repair. The water pumps run continuously, regardless of load. The storage tanks occupy a large area in the basement of Marshak that would be available for alternate uses if a new system were installed. Opportunity: Upgrading this system with a new booster pumping system with higher head pumps and variable speed pump controls based on load would reduce energy costs with the added benefit of providing constant water pressure, regardless of flow demand.
The City College of New York (CCNY) – Campus Energy Assessment
Final: January 18, 2010 I:\Nys-Dorm.12145\44128.City-College-Cl\Docs\Reports\Energy Assessment\Report\Final Report\MASTER_CCNY EA Report Final 1_18_10.doc
26
3.7. Boiler Plants
3.7.1. Boiler Feedwater Economizers Observations: Of the five steam boilers in the NAC steam plant, only Boilers #1 and #6 are equipped with economizing heat exchangers that utilize recovered stack waste energy to preheat boiler feedwater, with Boiler #1 presently out of service. Opportunities: Installing feedwater economizers in the stacks of Boilers #2, #3 and #4 would significantly increase the thermal efficiency of the plant.
3.7.2. Blowdown Heat Recovery Observations: Additional plant efficiency can be obtained by recovering the waste heat and flash steam contained in hot boiler blowdown before it is discharged to the sanitary sewer. Opportunities: Recovered flash steam at low pressure can be used in the new deaerator.
3.7.3. Steam Trap Maintenance Program Observations: CCNY presently lacks a steam trap maintenance program. Opportunities: Steam traps are vital components in any steam systems. They are designed to remove condensate from the steam distribution piping and heat exchange equipment. They also remove noncondensable gases, which impede heat transfer and result in corrosion. System debris, improper sizing, and improper application are common causes of steam trap failure. A well-maintained steam system will typically experience a 10% trap failure in a one year period. To minimize the type of loss associated with steam trap failures, a concerted effort must be applied to managing the steam trap population. A steam trap management program should incorporate the following activities: 1. Train personnel, 2. Locate and identify every trap, 3. Assess the operating condition of every trap at least annually, 4. Develop and maintain a trap database, 5. Respond to assessment findings. A steam trap assessment should be conducted by personnel with knowledge in the operation and selection of steam traps. Therefore, training is critical to the success of the management program. The steam trap assessment should cover: 1. Trap operation, 2. Trap selection (type and size), 3. Trap installation, and 4. Condensate return.

The City College of New York (CCNY) – Campus Energy Assessment
Final: January 18, 2010 I:\Nys-Dorm.12145\44128.City-College-Cl\Docs\Reports\Energy Assessment\Report\Final Report\MASTER_CCNY EA Report Final 1_18_10.doc
27
3.8. Chiller Plants
3.8.1. Maximize Use of Electric Chillers (vs. Steam) Observations: There is a general misunderstanding among some of the chilled water plant operators that the steam turbine-driven centrifugal chillers are less costly to operate than the variable speed drive electrical units. Perhaps this is based on the fact that the boilers operate year-round and that steam has historically been the main source of energy for chilled water production. Opportunities: Bringing a steam turbine chiller on line is a more complicated process than an electric chiller, and while the campus receives a cash incentive for shedding electrical load during periods of peak electrical demand, the short duration of this changeover may not be cost-effective. Improved operator training would help inform operators of the true cost differentials between the two prime movers and may influence behavior toward a more efficient operation. There is presently a project underway that will add a new 2,000 ton steam turbine driven chiller to handle the additional loads associated with the new science buildings.
3.8.2. Chilled Water Loop Control Issues Observations: The new chilled water plant in the NAC has a primary/secondary chilled water pumping arrangement with the chillers on the primary loop supplying chilled water to the secondary loop. The chillers are designed to produce chilled water at 42°F. The secondary loop is designed to deliver the 42°F chilled water to the campus buildings through a variable speed pumping arrangement. For effective control, the system design requires that the flow in the secondary loop be less that the primary loop. In the NAC system, the secondary loop flow appears to be consistently higher than the primary loop causing heated return water to bypass the chillers in the primary loop. Under these conditions the 42°F chilled water mixes with secondary loop return water, and the resulting supply temperature to the system can be as high as 48°F. This wastes chiller energy and prevents the building on the system from receiving the required water temperatures and flows. Opportunities: It is our understanding that this system has never been fully commissioned. This process should be completed, including the required training of all operating personnel. It may also be beneficial to engage a controls house to provide ongoing maintenance assistance to keep the plant operating as designed.
3.8.3. Chilled/Cooling Tower Water Temperature Observations: With the changeover from steam turbine chillers to electrical centrifugal machines, only out of the 10 cooling towers now need to operate to maintain condenser water inlet temperatures in summer. Chiller energy performance improves with reduced condensing water temperatures, especially in spring, fall and winter when lower tower water leaving temperatures can be achieved without additional tower fan operation. Tower leaving water temperatures are presently maintained at 70°F, which provides an opportunity for improving chiller efficiency at essentially no cost. This measure must be implemented with care, as there may be equipment served by the tower water system that does require a higher tower water temperature. Opportunities: Reducing condenser water temperature by as little as 3°F can improve chiller efficiency by as much as 3%. Additionally, cooling towers must be properly maintained. Currently, the cooling towers are operating at approximately 70% capacity and require maintenance.

The City College of New York (CCNY) – Campus Energy Assessment
Final: January 18, 2010 I:\Nys-Dorm.12145\44128.City-College-Cl\Docs\Reports\Energy Assessment\Report\Final Report\MASTER_CCNY EA Report Final 1_18_10.doc
28
3.9. Campus Utility Distribution
3.9.1. General Observations Observations: There are three primary concerns in any campus distribution system: leaks, controls, and metering. At CCNY, all three of these concerns represent opportunities for improved facilities operations. Opportunities: When leaks are present in a building, they are often discovered, reported, and fixed. When leaks occur in an underground campus distribution system, they have the potential to go unnoticed for long periods of time, and can often become major problems. Leaks are also discussed in Section 4.2 under operation and maintenance issues. While no direct energy savings would result from the installation of additional meters, they provide the ability to apportion costs to different buildings and departments. Metering also provided a direct means for verifying savings that result from the implementation of energy projects and documentation of progress toward greenhouse gas reduction targets. It is recommended that meters for electrical power at variable speed drives (VSDs) or motor control centers (MCCs), for utility natural gas, domestic water, steam, heating hot water and chilled water be considered for inclusion in future capital projects. HVAC controls at individual buildings have a large impact on the operation of the central utilities that serve them particularly chilled water and high temperature hot water systems. These individual systems are best managed through a central BAS, as outlined in Section 3.5.4. When buildings all demand utilities in their own manner, central utility plants may overreact resulting in poor energy performance.
3.9.2. Chilled Water Plant Controls Observations: Currently the chilled water system at CCNY consists of a primary pumping loop, a secondary pumping loop, and tertiary pumps for some buildings. Buildings that have tertiary pumps are typically not controlled correctly and over-draw the secondary loop, which then starves buildings that do not have tertiary pumps and reduces overall system pressure. Since the secondary loop pumps are controlled by system pressure, they automatically ramp up, regardless of cooling load, when a tertiary pump over-draws. In a situation where tertiary pumps over draw the secondary loop (which happens routinely), the secondary loop flow will exceed the flow in the primary loop and create a mixing situation that reduces efficiency, net cooling effect, and the system’s ability to dehumidify buildings that already have dehumidification issues because of a lack of designed reheat. Opportunities: For chilled water systems, controls should be provided that allow for each chiller to have its own constant speed (primary) pump that is on only when the chiller is on, in order to eliminate low flow and surge situations. On the demand side of the chilled water system, each building should have its own tertiary pump that is designed to provide the flow and pressure required strictly for that building in order to separate building issues from campus utility issues. The campus loop (or secondary loop) should have its own pumps that are controlled based on the flow requirements of each building that increase or decrease according to campus demand with a loop bypass valve to smooth the control loop appropriately and minimize issues caused by overshoot.

The City College of New York (CCNY) – Campus Energy Assessment
Final: January 18, 2010 I:\Nys-Dorm.12145\44128.City-College-Cl\Docs\Reports\Energy Assessment\Report\Final Report\MASTER_CCNY EA Report Final 1_18_10.doc
29
Meters should be placed at each building and at the central plant that calculate total flow and Btu usage using a combination of flow meters and temperature transmitters. These readings will help the plant operators understand what buildings have the highest demands, so the distribution of energy can be properly managed. In addition to the three primary concerns for utility distribution, chilled water distribution must also consider temperature. The key to resolving this issue is consistency. Every building should be designed to accept and use the same chilled water temperature, because the chilled water plant should only be providing one temperature. In order to maximize flexibility, the chilled water plant should be designed to deliver reasonably low chilled water temperatures (40 to 43°F) and the buildings should be designed to cool and dehumidify with reasonably high chilled water temperatures (44 to 45°F). Additionally, the plant should be designed to handle relatively high return chilled water temperatures (58 to 59°F) and the buildings should be designed to return relatively low chilled water temperatures (55 to 56°F). These design parameters will allow for a range of control schemes throughout the year that can be used to save energy, and allow the central plant to operate more efficiently.
3.9.3. Variable Speed Chillers Observations: The two 2,000 ton electrical centrifugal chillers installed as part of the 2005 chiller plant upgrade are equipped with variable speed compressor motor drives for improved part-load performance. Opportunities: Electrical centrifugal chillers represent the most efficient method of producing chilled water using a vapor compression refrigeration cycle when they are appropriately sized. Several factors both during design calculations (such as built-in sizing factors) and during actual operation (cooling load lower than design calculation) result in these chillers operating under non-optimum conditions that result in lower than ideal cooling efficiency. These issues are compounded when the chiller operates as part of a central plant to meet the cooling requirement of a district chilled water system such as exists at CCNY. Diversity (or non-coincidence in peak load) between buildings combined with an operational schedule and occupancy schedule for the buildings that does not coincide with the peak temperature day (or design day) result in the operation of chillers that are oversized for the cooling load. Intelligent chiller dispatches that closely matches the operating load to the next increment in chiller capacity can regain some of the efficiency loss from part load operation. Beyond chiller dispatch, chillers with variable speed drives on the compressors themselves represent the most efficient chiller control currently in use. A variable speed centrifugal chiller is able to slow the compressor down with decreasing load to maintain near the full load efficiency across a wide range of cooling load. To capture the potential impact of over-sizing of a chilled water system on annual energy consumption, a DOE2 model of a 250,000 SF mid-rise building located in New York City was utilized. The building construction and glazing parameters are based on the minimum guidelines from ASHRAE 90.1-2004, and are typical of new construction in the New York City area.

The City College of New York (CCNY) – Campus Energy Assessment
Final: January 18, 2010 I:\Nys-Dorm.12145\44128.City-College-Cl\Docs\Reports\Energy Assessment\Report\Final Report\MASTER_CCNY EA Report Final 1_18_10.doc
30
The central plant for the model consisted of two equally size centrifugal chillers, with an efficiency of 0.68 kW/ton2
Figure 3.9-1
at design conditions. The model was evaluated using capacity ratios for each of the chillers of 1.0 (perfectly sized), 1.5 (50% oversized), and 2.0 (100% oversized). The model was also run using the variable speed compressor option for a centrifugal chiller ( and Table 2).
Figure 3.9-1. DOE2 Input Screen for Centrifugal Chiller (Capacity Ratio = 1.0 and VSD Used)
Table 3.9-1 DOE2 Model Results For Various Chiller Configurations.
The model results indicated that if the baseline chiller sizing is twice what the operating capacity is (100% oversizing), then adding variable speed to the same sized chillers under the same conditions (Model Run #6) can provide as much as 30% energy savings, and places the new oversized variable 2 In DOE2 kW/ton is expressed as energy input ratio (EIR) that has units of BTU input/BTU output, or the inverse of COP. The EIR corresponding to 0.68 kW/ton is 0.1923 BTU input/BTU output.
Annual Chiller System
Efficiency (kWh) (% Diff) (kWh) (% Diff) (kWh) (% Diff) (kWh) (% Diff) (kWh) (kWh/SF) (kW/ton)
Baseline (#3)
Constant Speed Chillers (100% oversized) 2 100% 200% 2,483,330
0% 410,484 0% 12,377
0% 422,860 0% -
- 1.09
1 Constant Speed Chillers (Proper Sizing)
2 50% 100% 2,285,649 -8% 293,879
-28% 8,211 -34% 302,090
-29% (120,771) (0.48)
0.78
2 Constant Speed Chillers (50% oversized)
2 75% 150% 2,384,663 -4% 350,988
-14% 10,463 -15% 361,452
-15% (61,408) (0.25)
0.94
3 Constant Speed Chillers (100% oversized)
2 100% 200% 2,483,330 0% 410,484
0% 12,377 0% 422,860
0% - -
1.09
4 Variable Speed Chillers (Proper Sizing)
2 50% 100% 2,192,905 -12% 201,305
-51% 7,947 -36% 209,251
-51% (213,609) (0.85)
0.54
5 Variable Speed Chillers (50% oversized)
2 75% 150% 2,268,068 -9% 234,557
-43% 10,082 -19% 244,639
-42% (178,221) (0.71)
0.63
6 Variable Speed Chillers (100% oversized)
2 100% 200% 2,355,575 -5% 282,793
-31% 11,933 -4% 294,726
-30% (128,134) (0.51)
0.76
Total Model Energy Run Description
Qty Chillers
Sizing Ratio (ea)
Total Sizing
Savings (Cooling &
Heat Rej. Only) Combined Space Cooling & Heat
Rejection Heat Rejection
Energy Space Cooling
Energy
The City College of New York (CCNY) – Campus Energy Assessment
Final: January 18, 2010 I:\Nys-Dorm.12145\44128.City-College-Cl\Docs\Reports\Energy Assessment\Report\Final Report\MASTER_CCNY EA Report Final 1_18_10.doc
31
speed chillers in the same order of magnitude for annual energy cost as chillers sized for the cooling load (Model Run #1). For the example building in the model, these energy savings are on the order of 0.5 kWh/sf/year, or 5.5¢/sf/year using the average cost of electricity for CCNY. As CCNY has several variable speed drive chiller machines, this level of savings may not be achievable, but operators should implement a dispatch schedule for the chillers that incorporates fully loaded base chillers and variable speed peaking chillers, to optimize the annual operating efficiency of the central plant chilled water system.
3.9.4. High Temperature Hot Water Circulation Temperature Observations: Currently, high temperature hot water is circulated to every building on the CCNY campus other than Schiff House and the Marshak Science Building. Each building then takes and converts the high temperature hot water into the appropriate heating medium to supply individual air handlers and terminal units with heat. Most of the buildings utilize hot water systems whose top temperature does not exceed 180°F. However, Steinman Hall requires steam as a heating medium. There is a project underway to replace the existing heat exchangers so that lower temperature medium temperature hot water can be utilized to make steam. However, in order to make steam with high temperature hot water, the temperature on the hot water must be maintained higher than if it were being converted to 180°F hot water, regardless of the heat exchangers. Opportunities: In order to reduce energy, hot water temperatures are typically reduced to match the severity of the load. So on extremely cold days the water is very hot, and on days when there is little need for heat the hot water temperature can be reduced significantly. This reduces the energy that is required to heat the entire mass of the system, in addition to allowing for more precise control and preventing over-heating. A project is presently underway that would reduce the HTHW supply temperature to 300 degrees F. It is recommended that steps be taken to allow for temperature setback depending on heating load. There is also a project underway to convert the HTHW system from an open cascade system to a system using closed loop heat exchangers. HTHW piping in the North Campus is presently being replaced, along with new building heat exchangers.
3.9.5. Steam Observations: Steam leaks and un-returned condensate were found throughout the CCNY campus. Opportunities: Leaks need to be repaired. Generally, these situations lead to increased energy usage and additional make-up water consumption. Because the make-up water at CCNY has been poorly treated for long periods of time, the distribution systems have deteriorated and developed more leaks. In short, unrepaired leaks lead to additional leaks.
3.10. Electrical
3.10.1. Motors Observations: The Energy Policy Act of 1992 (EPAct) covering the efficiency of industrial motors became effective October 24, 1997. Most motors installed prior to this date that are still in service do not meet these standards and present opportunities for energy savings. Opportunities: As motors fail or are replaced as part of a scheduled maintenance project, installing new National Electrical Manufacturer’s Association (NEMA) Premium Efficiency motors is

The City College of New York (CCNY) – Campus Energy Assessment
Final: January 18, 2010 I:\Nys-Dorm.12145\44128.City-College-Cl\Docs\Reports\Energy Assessment\Report\Final Report\MASTER_CCNY EA Report Final 1_18_10.doc
32
recommended. While the payback period of 8 to 14 years may not satisfy an immediate investment, it may make economic sense if a motor is near the end of its useful life. These savings may not apply to original equipment manufacturer (OEM) motors that do not have standard NEMA Frame styles. Existing motors that are oversized for the loads they serve operate at lower efficiencies at part load. Prior to replacing a motor, it is recommended that the brake horsepower requirements of the existing installation be checked by measuring the motor amp draw under load using an electrical multimeter. A properly sized smaller motor operating near its rated horsepower is more efficient that an oversized motor operating at part load.
3.10.2. Variable Speed Drives (VSDs) Observations: Under a program funded through NYPA that was completed in 1995, there was a campus-wide project that replaced existing large fan and pump motors with premium efficiency units controlled by VSDs. There are few remaining locations with motors of significant size serving fans or pumps where this technology can be applied at CCNY today. Opportunities: During this energy assessment many variable speed motor controls were observed to be operating in “Manual” mode. This means that the motor controls do not respond to changes in load based on output from the HVAC controls, thereby reducing potential energy savings. This practice should be discouraged and root problems with automatic controls should be addressed. Lack of support service and spare parts availability with the existing VSDs suggest that these should be replaced in conjunction with any proposed HVAC equipment or controls upgrades at CCNY.
3.10.3. Power Factor Correction Observations: Correcting power factor can provide savings when the utility imposes a low power factor penalty in its rate structure. Generally, the savings will not be significant. Opportunities: Savings can result by installing capacitors to improve power factor. The resulting cost savings depends upon the initial power factor, the resulting power factor, motor horsepower rating and loading, and how the penalty is calculated by the utility.
3.10.4. Plug Loads/Miscellaneous Observations and opportunities for electrical demand and consumption reductions in plug loads were identified as part of the individual building assessments provided in Appendix B. The following summarizes these observations. Space Heaters Observations: Currently, there is widespread use of electric space heaters at CCNY for personal comfort in both summer and winter. These heaters typically have an electrical output of 900 to 1500 watts. Opportunities: A number of manufacturers offer low-wattage heaters configured as footrests or radiant panels for use under office desks. If high-output heaters were replaced with electric radiant heating panels having an output of 100-150 watts, significant energy savings would result. Providing improved space temperature control in both summer and winter could eliminate the use of many of these heaters altogether. Heaters used during the summer cooling season are especially problematic, in that they consume electrical power when the cost is highest and they create unnecessary space cooling loads. It is recommended that the necessary HVAC changes occur to enable the occupants to remove these space heaters.
The City College of New York (CCNY) – Campus Energy Assessment
Final: January 18, 2010 I:\Nys-Dorm.12145\44128.City-College-Cl\Docs\Reports\Energy Assessment\Report\Final Report\MASTER_CCNY EA Report Final 1_18_10.doc
33
Smart Strips for Office Computer Workstations Observations: Computer peripherals, like monitors, printers and scanners, continue to use energy, even after they are turned off. Opportunities: Smart strips offer a power strip that offers excellent power surge protection and line noise filtering in addition to sensing how much power your computer peripherals use. When the Smart Strip senses that the computer is off, it automatically shuts off the associated peripherals, preventing them from drawing an idle current. Depending on the number of peripherals, Smart Strips have a payback of as little as six weeks. Vending Machine Energy Issues Observations: At the time of the field survey, refrigerated and non-refrigerated vending machines on campus were observed to be a mix of energy star and standard units. Opportunities: Refrigerated and non-refrigerated vending machines can reduce electrical energy consumed during unoccupied periods. By September 2010, all of the vending machines on campus are planned to be replaced with ENERGY STAR compliant models that incorporate power down features, motion sensors and LED lighting. In non-refrigerated machines, the controls turn off the vending machine lighting when no one is in the vicinity after a preset interval. In refrigerated machines, the controls turn off machine lights and the refrigeration compressor after completion of the cooling cycle. For beverage coolers, the cooling system will repower on a preset interval of one to three hours to keep products cold. These controls are not used on machines vending perishable foods, such as dairy products. For refrigerated vending machine controls: Per Unit Sensor Cost: $ 200 Annual kWh reduction: 2,256 For non-refrigerated vending machine controls: Per Unit Sensor Cost: $ 100 Annual kWh reduction: 473 When contracts for vending machines at the campus are negotiated, the energy performance of the equipment should be specified in the terms of the agreement. At a minimum, ENERGY STAR vending machines should be required. Developing a model agreement that all CUNY campuses can use when procuring vending machines is recommended. Personal Office Kitchenettes Observations: Trends among campus site assessments point to the use of private microwaves, refrigerators, toaster ovens, and coffee pots when central kitchenettes are not available. Opportunities: The utilization of multiple appliances in such a manner creates a demand that is greater than needed for the occupants of the space. Additionally, office electrical circuits are rarely designed to accommodate all of the necessary plug loads to accommodate this demand. It is recommended that a kitchenette with ENERGY STAR-rated appliances be provided for every 15 to 25 offices in order to reduce unnecessary plug loads.

The City College of New York (CCNY) – Campus Energy Assessment
Final: January 18, 2010 I:\Nys-Dorm.12145\44128.City-College-Cl\Docs\Reports\Energy Assessment\Report\Final Report\MASTER_CCNY EA Report Final 1_18_10.doc
34
3.11. Special Systems
3.11.1. Laboratory Ventilation and Fume Hoods Observations: The survey of laboratory fume hoods in Steinman Hall and the Marshak Science Building (Marshak) where 95% of the fume hoods on campus are located, revealed that hood performance is greatly affected by the makeup air and other HVAC systems is the buildings. Opportunities: The primary function of a fume hood is to provide for the safety of its users. To meet codes, minimum air flow velocities must be maintained across all hood sashes. Hood face velocities must be periodically tested to demonstrate compliance. The design challenge becomes how to meet these requirements in the most energy efficient way possible. At Marshak, most of the fume hood design issues are being addressed in a capital project that is in progress at the time of this writing. Active vs. Inactive Hoods In some situations this is as simple as removing hoods in spaces that do not require them, either because the room is unoccupied or because the room occupancy has changed. In other situations, multiple hoods can be combined to one larger hood with lower airflow requirements. In any of these situations, a comprehensive study of the use of fume hoods is required to verify their use and need. Unused Hoods Open hoods in an unoccupied space are a common issue wherever hoods are used. It is important for CCNY staff to continue to train laboratory occupants to understand that keeping hoods open is not only a waste of energy, but it also impacts safety. When open and operating, hoods should maintain code-required face velocities regardless of sash height. When not in use, hoods should be off and closed. This is an important operational consideration that costs nothing to implement, resulting in instantaneous energy savings. Low-Flow Hoods With advancement in hood design, hood manufacturers now incorporate features that independently verify that their hoods achieve acceptable face velocities, even at lower air flows. It is also possible to retrofit existing hoods to perform at low flow when unattended. Upon completion of any retrofit or hood replacement project, hoods must be tested for compliance with ASHRAE 110 and passed. Motor-driven rear baffles in the hood retrofit kits maintain a stable vortex within the hood to prevent spillage at low velocity. These require periodic inspection of the motors and damper linkages. Occupancy-based Hood Controls This option can be used where allowed by local codes. In many cases, airflow rates can be reduced by up to 50% regardless of sash position when occupancy is verified by an accepted sensor. Strobic Fans Another way to reduce energy associated with fume hoods is to reduce energy on the exhaust system by increasing fan efficiency. Because of the chemicals in the airstream, exit velocity and discharge height are important to every lab hood system. Rather than use extended stack heights that increase pressure loss on exhaust systems, strobic fans can be installed (as have been in Marshak), where appropriate, which are designed to increase the height of the fan discharge plume. The potential for re-entrainment of lab exhausts in building makeup air intakes should be evaluated before designs are
The City College of New York (CCNY) – Campus Energy Assessment
Final: January 18, 2010 I:\Nys-Dorm.12145\44128.City-College-Cl\Docs\Reports\Energy Assessment\Report\Final Report\MASTER_CCNY EA Report Final 1_18_10.doc
35
finalized, whether for a new building, or where a building or floor is being renovated and reprogrammed. Exhaust Heat Recovery Finally, another way to reduce energy associated with fume hoods is to reduce the energy associated with conditioning the make-up air. Essentially this approach requires some form of energy recovery from the exhaust stream. Energy recovery from a lab exhaust system is a difficult process that needs to be approached carefully to prevent cross contamination of the air streams, as well as prevent additional static pressure in the exhaust stream from reducing the overall effectiveness of the exhaust.
3.11.2. Natatoriums Dehumidification with Pool Water Heat Recovery Observations: The heating and ventilating system for the natatorium (indoor pool) in Marshak was recently replaced and upgraded to a system that now draws a portion of its makeup air from the building, thereby reducing the heating and cooling load of the pools. Opportunities: There was a recommendation in the 2004 Energy Master Plan study report prepared by Genesys to replace the old heating and ventilating unit with a dehumidification unit that recovers a portion of the energy of compression to heat the pool water. It appears that this energy-saving measure was not pursued as part of the pool ventilation system upgrade. According to ASHRAE (1999b): “Humans are very sensitive to relative humidity. Fluctuations in relative humidity outside the 40 to 60% range can increase levels of bacteria, viruses, fungi and other factors that reduce air quality. For swimmers, 50 to 60% relative humidity is most comfortable. High relative humidity levels are destructive to building components. Mold and mildew can attack wall, floor, and ceiling coverings; and condensation can degrade many building materials. In the worst case, the roof could collapse due to corrosion from water condensing on the structure.” Natatoriums with fixed outdoor air ventilation rates without dehumidification generally have seasonally fluctuating space temperature and humidity level. Since these systems usually cannot maintain constant humidity conditions, they may facilitate mold and mildew growth and poor indoor air quality. In addition, varying activity level will also cause the humidity level to vary and thus change the demand on ventilation air. Pool Covers Observations: The pool was recently fitted with a retractable pool cover that effectively reduces the evaporative heating load on the pool, the humidity gain to the pool environment and the associated energy loads. Opportunities: This cover prevents evaporative cooling (70%) and ventilation/air movement (27%), which account for roughly 97% of the pool’s total heat loss. Water Filtration and Treatment Observations: The filtration and treatment system for the pool in the Marshak Science Building is old and in need of replacement.
The City College of New York (CCNY) – Campus Energy Assessment
Final: January 18, 2010 I:\Nys-Dorm.12145\44128.City-College-Cl\Docs\Reports\Energy Assessment\Report\Final Report\MASTER_CCNY EA Report Final 1_18_10.doc
36
Opportunities: In efficient pool design, chemical saving techniques are utilized to implement low-cost maintenance and proper treatment. One such technique is ultra-violet sanitizing, which reduces chemical needs and simplifies the chemistry in the pool. Additionally, controls are sometimes added to account for variations in bather occupancy and reduce the over-use of chemicals when pool demand is inconsistent. Generally, a review of the existing pool filtration and treatment should be conducted by a pool expert, and recommendations should be made on ways to reduce chemicals and increase sanitization effectiveness. Forms of chemical treatment should be evaluated so that if bulk storage of liquid disinfectant (chlorine) is selected, compliance with state chemical bulk storage regulations, and with appropriate health and safety regulations, can be incorporated during design. Pool Air and Water Temperatures Observations: The pool in Marshak is generally maintained at a fairly low water temperature. Opportunities: Generally, as a means of saving energy and reducing dehumidification loads, it is recommended that pool temperatures be kept as low as comfortable for the type of use that it is designed for. ASHRAE recommends the following pool and air temperatures, based on usage: Typical Natatorium Design Conditions Type of Pool Air Temperature °F Water Temperature °F Relative Humidity % Recreational 75 to 84 75 to 94 50 to 60 Therapeutic 81 to 84 84 to 95 50 to 60 Competition 79 to 84 75 to 82 50 to 60 Diving 81 to 84 81 to 90 50 to 60 Whirlpool/spa 81 to 84 36 to 104 50 to 60 There may be opportunities to supplement pool heating with a solar thermal water heating system.
3.11.3. Data Centers Observations: The CCNY contracted Custom Computer Specialists, Inc. (Custom) to perform a data center assessment for its two data centers located in the NAC and Marshak Buildings. The goal of this assessment was two-fold. Firstly, to understand fully the capacity of the data centers (the infrastructure) to support CCNY’s mission-critical loads, the availability (uptime potential) to provide business continuity to its user community and the condition of key facility components and systems supporting the critical loads. Secondly, to provide CCNY IT management with the appropriate information to make informed decisions on how to restructure and supplement their existing resources to close identified gaps between the current environment and one better suited to improved reliability/availability, support for increased growth potential and a higher level of energy efficiency. Opportunities: Custom assessed the data centers’ current capacities, demand requirements, projected technology changes and growth projections, and contrasted its findings with current industry best-practices. This exercise resulted in recommendations for modifications of, and additions to, existing infrastructure, to enable CCNY to remediate potential service challenges, maximize its existing growth potential, better conform to current data center design principles and elevate its energy efficiency maturity level. NAC Data Center CCNY intends to upgrade its NAC data center which was designed and built a number of years ago and is supported by an aged cooling and power infrastructure. It currently houses IT equipment

The City College of New York (CCNY) – Campus Energy Assessment
Final: January 18, 2010 I:\Nys-Dorm.12145\44128.City-College-Cl\Docs\Reports\Energy Assessment\Report\Final Report\MASTER_CCNY EA Report Final 1_18_10.doc
37
owned and operated by the CCNY IT department as well as IT equipment owned and under the management of entities other than CCNY IT. Marshak Data Center CCNY plans to utilize a server room currently located in the Marshak Building to provide some level of disaster recovery for its NAC primary data center, as well as to support other unspecified functions. Opportunities for improved performance include: • Improve cooling, with appropriate redundancy, to address ‘hot-spots’ reported in localized areas
of the data center and to support immediate operational and long-term growth and availability requirements
• Improve layout to improve cooling and maximize the efficiency of the dedicated space and accommodate current and future information technology assets and associated growth activities
• Improve power infrastructure to ensure conformance to industry best-practices and future capacity availability
• Higher systems availability and improved fault tolerance through appropriate redundancy to compensate for harsh operating conditions and planned maintenance periods
• Remote monitoring of data center support infrastructure • Monitoring, trending and reporting of ongoing space, power and cooling demand, and
consumption rate of existing spare capacities • Energy efficiency to help achieve lower operational costs and CCNY carbon footprint reduction
goals • Ability to affect future change in a highly flexible, short lead-time and efficient fashion.
3.12. Retrocommissioning
Retrocommissioning (RCx) is the application of the commissioning process to existing buildings. Depending upon the age of the building, RCx can often resolve problems that occurred during design or construction, or address problems that have developed during the building’s life. Buildings frequently undergo operational and occupancy changes that challenge mechanical, electrical and control systems, hindering optimal performance. Overall, RCx improves a building’s O&M procedures and enhances overall performance. As with building commissioning, retrocommissioning when performed correctly can provide significant benefits for the owner such as: • Improves energy performance (5-15% savings) • Improves equipment performance • Increases asset value • Improves thermal comfort and indoor air quality • Provides training opportunities for building maintenance staff • Provides improved building documentation (Systems Manual) • Issues are addressed by a commissioning team whose primary focus is value, benefits, needs and
quality.

The City College of New York (CCNY) – Campus Energy Assessment
Final: January 18, 2010 I:\Nys-Dorm.12145\44128.City-College-Cl\Docs\Reports\Energy Assessment\Report\Final Report\MASTER_CCNY EA Report Final 1_18_10.doc
38
Buildings that have existing DDC control systems, such as Compton-Goethals and Baskerville Halls, are good candidates for retrocommissioning.

The City College of New York (CCNY) – Campus Energy Assessment
Final: January 18, 2010 I:\Nys-Dorm.12145\44128.City-College-Cl\Docs\Reports\Energy Assessment\Report\Final Report\MASTER_CCNY EA Report Final 1_18_10.doc
39
4. Operation and Maintenance
4.1. Maintenance and Repair Cost Benchmarks
Forecasts of maintenance and repair costs often rely on an objective reference point or “benchmark.” Derived from surveys or statistical models, these are usually expressed in terms of cost per square foot or cost over replacement value. These benchmarks can be used as a basis for comparing costs at a college campus where the building inventory is large and diverse, but these estimates must be used with caution and a clear understanding of the underlying assumptions and reporting practices. Actual cost data drawn from a specific industry can be compelling to those working in that industry. A number of organizations survey their membership for just this reason. Some of the reports that are commonly cited include the following: Benchmarks, International Facility Management Association, Houston, TX: Published periodically. BOMA Experience Exchange Report, Building Owners and Managers Association International,
Washington, DC: Published annually. Comparative Costs and Staffing Report for Colleges and Universities, The Association of Higher
Education Facility Officers, APPA, Alexandria, VA: Published every two years. Facility Managers Round Table (FMRT), FM Benchmarking, FMLink Group, LLC, P.O. Box 59557,
Potomac, MD 20859-9557: Online benchmarking tool. 38th Annual Maintenance and Operations Cost Study for Colleges, American School and University
Magazine, Penton Media Inc., April 1, 2009. When citing survey statistics it is good practice to review the actual survey questions behind the numbers. For example, at most facilities, maintenance and repair expenditures are divided among annual operating budgets (usually preventative maintenance and smaller repair tasks) and projects funded from capital accounts (major repairs, renovations and special projects). The CUNY Maintenance Management Program accounts for maintenance and repair expenses using the following standard account codes: Expense Code Description 10-000 Administration and Management 20-000 Cleaning and Custodial (Routine) 30-000 Labor and Custodial (Non-Routine) 40-000 Special Waste Disposal 50-000 Operations, Preventative Maintenance, Minor Repairs (Routine) 60-000 Repairs (Non-Routine) 70-000 Roads and Grounds 80-000 Facility Program Modifications (Alteration projects funded by grants and
special allocations)

The City College of New York (CCNY) – Campus Energy Assessment
Final: January 18, 2010 I:\Nys-Dorm.12145\44128.City-College-Cl\Docs\Reports\Energy Assessment\Report\Final Report\MASTER_CCNY EA Report Final 1_18_10.doc
40
Expense Code Description 90-000 Facility Program Modifications (Alteration projects initiated by academic
departments) 100-000 Facility Aesthetic Modifications (Common Area Improvement Projects) 110-000 Facility Catch-up Modifications (Correction Problems Related to Facility
Condition and Functionality Review of data from the referenced sources suggests that benchmarking survey results are widely variable and difficult to compare. A survey conducted by FM Link found that about 80 % of its respondents reported maintenance costs between $0.80 and $3.90 per gross square foot (gsf). The median cost from this survey was $1.69 per gsf. This cost did not include custodial, grounds keeping, alteration projects, facility catch-up modifications, and non-routine repair costs. The Facility Managers Round Table (FMRT) survey of 2004 included a total of 94 unique sites with a median size of about 1,400,000 million square feet yielding the following results: Expense Category Median Cost Utilities $2.17/ gsf Custodial $1.33/Cleanable SF Maintenance $1.69/ gsf Parking and Paving $1,529/Acre Grounds Keeping $3,405/Acre Security $0.73/ gsf Mail Services $0.22/ gsf Environmental Health and Safety $0.35/ gsf Fixed Building Costs $3.71/ gsf The 38th Annual Maintenance and Operations Cost Study for Colleges (2009) surveyed a wide range of educational facilities and reported median costs for the following expense categories: Expense Category Median Cost per gsf Salaries $2.39 Benefits $0.72 Total Energy/Utilities $1.90 Total Equipment and Supplies $0.23 Vehicle Maintenance $0.04 Other $0.21 Total Maintenance and Operations $5.49 There is a relationship between total equipment replacement value and the annual system operation and maintenance costs. As with any operating system, a small percentage of the value of the system or piece of equipment can be expected to be expended on an annual basis to keep the system in good running order. The following table presents square foot values for the replacement value of HVAC systems at CCNY as well as the subsystems comprising them. Total campus values for CCNY were derived by multiplying the square foot values by 3,000,000, which is the approximate gross square footage of all of the buildings at CCNY.

The City College of New York (CCNY) – Campus Energy Assessment
Final: January 18, 2010 I:\Nys-Dorm.12145\44128.City-College-Cl\Docs\Reports\Energy Assessment\Report\Final Report\MASTER_CCNY EA Report Final 1_18_10.doc
41
Table 4.1-1. Replacement Value of CCNY HVAC Systems (estimated) Item Replacement Cost ($/sf.) Total Replacement Value
Chilled water piping systems $6 $18,000,000 Hot water piping systems $6 $18,000,000 Ductwork systems $8 $24,000,000 HVAC equipment and controls $10.50 $35,500,000 Central air handlers $2 $6,000,000 DDC controls $3 $9,000,000 Chillers $2 $6,000,000 Boilers $1 $3,000,000 Total HVAC $35 $105,000,000 Source: FMLink Facility Management Using this model, the total replacement value of HVAC systems at CCNY is approximately $105 million. The relationship between total replacement value and annual maintenance cost at a campus such as CCNY is greatly influenced by factors such as the age and condition of the systems and equipment and the amount of time spent on reactive or emergency maintenance versus planned maintenance activities (corrective and preventative). Non-maintenance activities performed by trade employees that do not maintain or extend the life of campus facilities or capital maintenance should be considered outside the normal maintenance budget. While this energy assessment did not evaluate operation and maintenance practices in detail, the observed condition of HVAC systems and equipment at CCNY suggests that these activities have not been performed at a level consistent with industry best practices. Inadequate maintenance contributes to poor occupant comfort, increased energy consumption, poor indoor environmental quality, more frequent equipment failures, unplanned capital expenditures, reduced occupant productivity and health and safety issues. With this understanding, support for maintenance activities at CCNY needs to be assessed with respect to comparable public and private campuses. Benefits derived from an effective operation and maintenance program include: • an increase in the effective useful life of equipment • decrease in the amount of management time associated with the maintenance function • direct reduction in costs of maintenance and other operating functions • decrease in energy consumption and associated GHG associated impacts.
4.2. Leaks in Piping and Ductwork
Leaks in piping systems were numerous at CCNY. Many have been in existence for so long that rubber funnels have been affixed under them that attach to a hose and go to the nearest drain. In addition to energy costs associated with leaks, there are also costs resulting from water damage and potential mold growth. Of course, mold also represents a potential health and safety risk.
4.3. Abandoned Equipment
Abandoned equipment was observed in a number of buildings at CCNY. Because this is an easy deficiency to correct, and because space is at such a premium in all of the buildings on campus, abandoned equipment should be removed.
The City College of New York (CCNY) – Campus Energy Assessment
Final: January 18, 2010 I:\Nys-Dorm.12145\44128.City-College-Cl\Docs\Reports\Energy Assessment\Report\Final Report\MASTER_CCNY EA Report Final 1_18_10.doc
42
4.4. Training
Operating and maintaining campus HVAC equipment and control systems is a complex technical discipline that requires ongoing training and education to keep staff informed, engaged and effective. As an educational institution, CCNY should understand that up-to-date knowledge in an ever-changing technical field is essential. Continuing advances in building technologies, changes in building codes, staff changes, updates to buildings, and a desire to increase the performance of the buildings and the staff that run them, are all reasons to have a defined program budget and provide ongoing education to facilities staff. There are a number of low- or no-cost facilities training opportunities that may be available to CCNY personnel. Many equipment manufacturers are willing to inform and instruct their customers in the use and application of their products. This step also can be incorporated into construction project and equipment delivery contacts, to be verified during the contract management and commissioning processes. Also, it is understood that monthly training sessions in the use of the Archibus facilities database application are included as part of the annual license fee. There are facilities management tools and report templates available through Archibus that can be useful to facilities management personnel. Lastly, several of the maintenance personnel at CCNY have over 20 years of experience at the campus. Senior personnel should have the opportunity to share this experience with junior staff in a classroom setting.
4.5. Archibus Facilities Management Tools
CCNY currently uses an Archibus system for some of its facility management. However, several functions of this program are currently not being used. As an initial step, a campus-wide inventory of all HVAC and electrical equipment is recommended. For each major piece of equipment, the critical maintenance activities and frequencies should be established and tracked from year to year. The Archibus system was developed as a tool to manage maintenance budgets and track manpower utilization. Using the Archibus facilities management tools to schedule and track routine maintenance activities will help to manage work volume, minimize operating costs, document actual labor effectiveness and generate cost expenditure reports than can be used for planning purposes. The lack of an inventory means the equipment can go unmaintained until it fails and then requires major maintenance or replacement. Using Archibus building operations and preventative maintenance tools can provide the following benefits: Building Operations Management Benefits • Improve performance of internal and outsourced service providers by prioritizing tasks and
avoiding work backlogs • Enables evaluation of work order requests to optimize labor/materials and minimize operating
costs • Simplifies the work forecast and budgeting processes by easily accessing historic data • Tracks preventive maintenance programs to validate expenditures and comply with internal
standards or regulatory mandates
The City College of New York (CCNY) – Campus Energy Assessment
Final: January 18, 2010 I:\Nys-Dorm.12145\44128.City-College-Cl\Docs\Reports\Energy Assessment\Report\Final Report\MASTER_CCNY EA Report Final 1_18_10.doc
43
Preventive Maintenance (PM) Benefits • Streamlines and automates the PM process to improve operational efficiency • Minimize operational equipment downtime and costly repairs • Extends useful service life of physical assets resulting in reduced capital outlays • Improves planning by capturing metrics such as costs, resource usage, service provider
workloads/performance, and equipment maintenance history • Delivers cost-efficient, closed loop Enterprise Asset Management (EAM) as part of the
integrated, Web-based Archibus product suite. Using the Archibus system can also manage work orders and effectively schedule recurring work.
The City College of New York (CCNY) – Campus Energy Assessment
Final: January 18, 2010 I:\Nys-Dorm.12145\44128.City-College-Cl\Docs\Reports\Energy Assessment\Report\Final Report\MASTER_CCNY EA Report Final 1_18_10.doc
44
5. Design and Construction
5.1. Construction Project Delivery
It was reported to the Energy Assessment team that the project delivery process at CCNY typically does not involve the CCNY facilities staff. Those charged with operating and maintaining a building once it is turned over to the campus can bring vital insights into the design process regarding what approaches have been successful at the campus and where problems have occurred. It is recommended that the CCNY building project delivery process include CCNY facilities operations and maintenance staff. As participants in the building design, commissioning and operations process, facilities staff can contribute ideas that can lead to a more maintainable building that makes more effective use of labor and materials. One of the most difficult processes in building at CCNY (and throughout CUNY) is that it is difficult to define the term “owner.” Although CCNY occupies and maintains the buildings, DASNY typically procures the contracts to design and construct the buildings, and the City and CUNY system pay the utility bills for the buildings. Depending on the state of building design, construction, and occupancy, any of these entities at some point in time may be considered the “owner.” Each of these entities may have different perspectives resulting in conflicting priorities when it comes to building development. The key is for each of these parties to consider the needs of the end users (CCNY students, faculty and staff), and those who will be operating and maintaining the building at every step in the project delivery process. The present policy is for all new construction projects to meet or exceed the requirements for a USGBC LEED (United States Green Building Council Leadership in Energy and Environmental Leadership) Silver Rating. Satisfying this requirement does not necessarily ensure that the building is significantly more energy efficient than a code compliant building. It is recommended that higher targets for energy efficiency, such as 30% to 40% better than ASHRAE 90.1 2004, the minimum standard for a code-compliant building, be established for new construction and renovation projects. There are a number of aspects of the new building project delivery process that have contributed to building maintenance issues at CCNY. Many of these may be addressed on the context of the commissioning process, where CCNY’s specific maintenance preferences and training needs would be addressed.
5.2. The Commissioning Process
The commissioning process is intended to verify that building systems are operating as intended and as designed prior to turnover of the building to the owner. The premise for commissioning is quality control for the design and construction process, and ensures that the owner receives the promised building by enabling the owner (through the commissioning agent) to convey the owner’s priorities to the design and construction team, and to stay on message throughout the development of the building. Other benefits to owners of a successful commissioning process include: • Provides oversight so that design and construction satisfies the Owner’s Project Requirements
(OPR).

The City College of New York (CCNY) – Campus Energy Assessment
Final: January 18, 2010 I:\Nys-Dorm.12145\44128.City-College-Cl\Docs\Reports\Energy Assessment\Report\Final Report\MASTER_CCNY EA Report Final 1_18_10.doc
45
• Confirms that building systems perform as designed before the owner accepts the building. • Transfers knowledge from phase to phase and among project participants. • Reduces project cost by preventing rework • Improves thermal comfort and indoor air quality • Enhances training opportunities for building maintenance staff • Reduces building operating costs by 8-20% (based on data from the U.S. Green Building
Council). • Captures “lessons learned” from previous projects • Issues are addressed by a commissioning team whose primary focus is value, benefits, needs and
quality. The key to commissioning is an understanding of owner requirements by the commissioning authority and the vested interest of the owner in seeing those requirements met. DASNY, CUNY, and each of the individual campuses have a stake in projects and their completion. Since each party may have different goals and priorities with relation to these projects, the outcome of commissioning may vary depending on who holds the commissioning contract and who is overseeing the work of the commissioning authority, that is, who legally fulfills the role of “Owner.” Currently, DASNY procures and oversees commissioning for CUNY and CCNY. Generally, DASNY is responsible for the construction process, including procurement and project management.
5.3. Owner’s Project Requirements (OPR)
ASHRAE Guideline 0 – The Commissioning Process recommends that the owner’s project requirements be documented in such a way that building teams can understand and use them to inform the process from design through construction and project turnover. The OPR is not the same as the basis of design, in that it focuses on what the owner expects the project design and construction team to deliver in terms of comfort, energy efficiency, aesthetics, training, documentation, systems manuals, and other owner needs and objectives. The OPR can be developed in a workshop setting, early in the pre-design process, and should involve representatives from the architectural firm, engineers, construction manager, vendors and suppliers (if possible), end users, owner’s representatives, and facilities maintenance staff. A general sample draft of an OPR for CCNY is provided in Appendix D. Standards for construction and renovation should be developed for all campus projects in the future. Each “owner” – DASNY, CUNY, and CCNY should have input to the standards and they should all have a vested interest in confirming and documenting the adherence to these standards. An OPR is a good first step to developing these standards.
5.4. Project Turnover
According to the perspective of facilities staff, the process for building turnover has not been effective at distributing project documentation developed and obtained during the building development and construction process. As minimum requirements, each project (whether a new building or equipment replacement) should produce and turn over commissioning binders, Operation and Maintenance manuals, as-built drawings, as-built sequences of operation, recommended maintenance procedures, and one-line diagrams.

The City College of New York (CCNY) – Campus Energy Assessment
Final: January 18, 2010 I:\Nys-Dorm.12145\44128.City-College-Cl\Docs\Reports\Energy Assessment\Report\Final Report\MASTER_CCNY EA Report Final 1_18_10.doc
46
In addition to document turnover, training in the systems and equipment must also occur. Currently, training provided with construction projects apparently is not meeting the needs of facility staff. On some smaller projects in Steinman and Marshak, no training reportedly is occurring, resulting in equipment that the facilities staff does not know how to properly maintain and operate. Every construction project large or small should include training requirements in the contract scope, training materials as project deliverables, and confirmed by training records as part of the commissioning process.
The City College of New York (CCNY) – Campus Energy Assessment
Final: January 18, 2010 I:\Nys-Dorm.12145\44128.City-College-Cl\Docs\Reports\Energy Assessment\Report\Final Report\MASTER_CCNY EA Report Final 1_18_10.doc
47
6. Energy Conservation Portfolio
6.1. Immediate Actions – Behavior, Operations and Maintenance
Significant reductions in campus energy use can be achieved at little or no additional cost through changes in occupant behavior, increased energy awareness and operation and maintenance practices. CCNY is already affecting changes in this area through the campus’ CCNY Green project by engaging faculty and students, building awareness, developing educational programs and purchasing policies (ENERGY STAR appliances and similar products). Additional actions identified by the Energy Assessment team include the following: Turn off unnecessary lights, especially in unused offices, closets, classrooms and conference rooms.
Lights in common areas and corridors were observed to be on when no one was present. Turning off lights reduces energy costs with no capital expenditure.
Shut down escalators when not needed. In addition to saving energy, shutting down escalators during period of light occupancy can reduce wear and tear on the escalator machinery, reducing maintenance costs as well. When new or replacement elevators are proposed, consideration should be given to selecting the most efficient equipment possible.
Implement a campus-wide temperature setpoint policy (680F in winter, 760F in summer).
Implementing a temperature setpoint policy and communicating it to students and faculty increases awareness that behavior affects energy use in campus facilities. Implementing this policy may require changing building occupants’ expectations, but the potential for energy savings is substantial, and the cost would be minimal.
Repair/replace door and window weather stripping and seal openings to reduce air infiltration. Older exterior door seals were observed to be in poor repair; some openings in walls and roofs were not sealed. Reduced air infiltration will improve local occupant comfort and reduce heating/cooling costs.
Eliminate or provide low-wattage infrared space heaters, utilize computer peripheral switching, eliminate private office kitchenettes, and similar steps to reduce plug loads.
Many electrical plug loads were identified that could be reduced or eliminated through behavioral changes or at minimal cost. These included addressing items such as space heaters, vending machines, computer peripherals, and private office kitchenettes. Reducing or eliminating unnecessary electrical plug loads saves electrical costs year-round and reduces air conditioning loads during summer months.
Utilize software that offers network level control over PC power management settings. Set computers, monitors, printers, copiers and other business equipment to energy-saving features and turn off at the end of the day. Purchase equipment with the ENERGY STAR rating whenever possible.

The City College of New York (CCNY) – Campus Energy Assessment
Final: January 18, 2010 I:\Nys-Dorm.12145\44128.City-College-Cl\Docs\Reports\Energy Assessment\Report\Final Report\MASTER_CCNY EA Report Final 1_18_10.doc
48
Procure or require vendors to provide ENERGY STAR vending machines that shut down or operate at reduced energy levels during unoccupied periods. Improve planned maintenance practices (repair piping/duct leaks, remove abandoned equipment, more frequent coil cleaning and filter changes, and similar practices)
Leaks in the piping and ductwork systems were observed throughout the campus. Many air handling unit (AHU) heating and cooling coils were partially clogged with dirt on the airside. Failure to repair pipe leaks creates safety issues, wastes energy, and reduces the effective life of the equipment.
Optimize chiller plant performance by optimizing chiller sequencing (electric vs. steam) and reset chilled water and condenser water temperatures based on outdoor temperature conditions.
Short circuiting was observed in the secondary chilled water loop, causing the supply temperature to the loads on the loop to rise above the desired delivery temperature. Eliminating chilled water short-circuiting will improve HVAC performance at individual buildings and improve chilled water plant efficiency. It is considerably more costly to produce chilled water in the central plant using steam in turbine drive chillers versus electrical power in the variable speed drive chillers. Additional operator training and real-time chilled water cost per ton information from the control system help chilled water plant personnel to operate the plan at peak efficiency.
Reset hot water supply temperatures based on outdoor temperature conditions.
Higher water temperatures require more energy consumption per Btu to generate than lower water temperatures. Old heat exchangers and a need for steam creates a need for higher temperature hot water that would typically be required.
Provide ongoing training of facilities staff in the operation and maintenance of campus systems and controls.
There does not appear to be a formal training program for maintenance personnel. A trained maintenance staff understands the underlying principles behind the systems under their care and has the tools to operate the systems at peak efficiency. A more aggressive training policy also ensures that maintenance capabilities are maintained despite staff turnover.
Replace older plumbing fixtures with water-saving lavatory faucets and toilet flush valves.
While not cost-effective as a stand-alone initiative, fixture upgrades should be performed in conjunction with any general renovations that affect bathroom facilities at CCNY.
6.2. Near-Term Actions (1 to 5 years) – Energy Conservation Measures (ECMs)
6.2.1. General Opportunities To establish persistent energy savings and reductions in greenhouse gas emissions, it is recommended that CCNY consider adopting the following fundamental objectives: 1. Gain a better understanding of campus energy use, energy-using systems and behaviors.
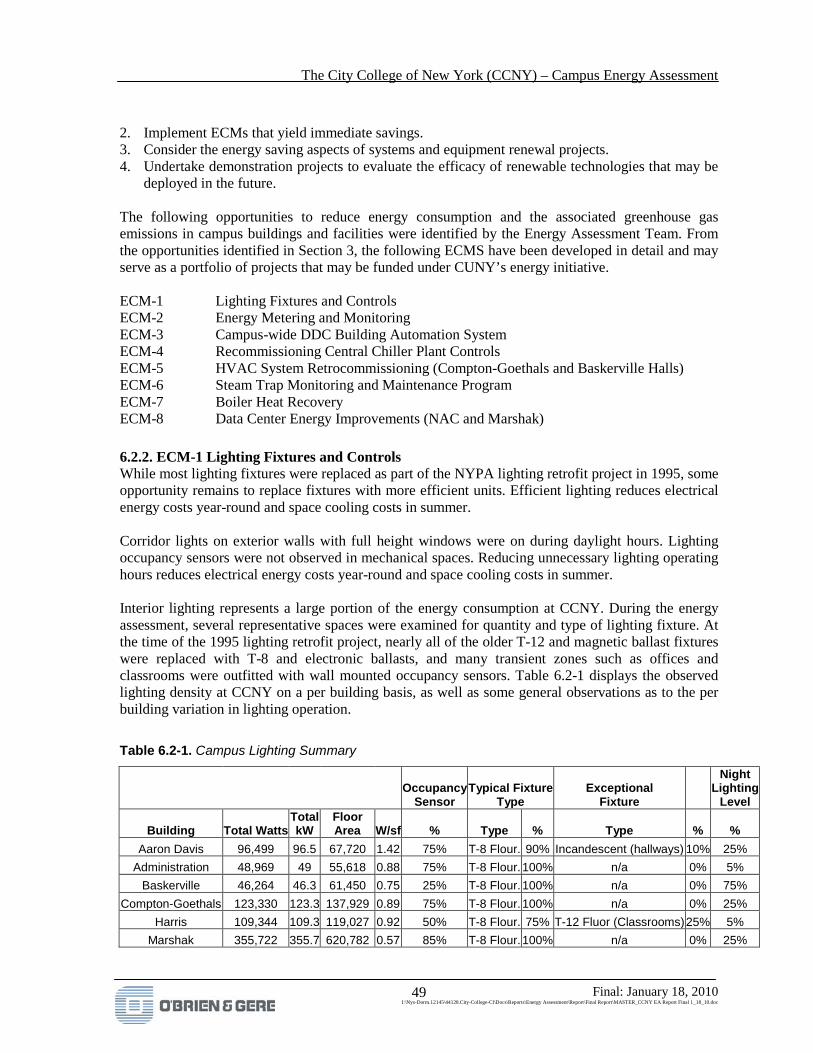
The City College of New York (CCNY) – Campus Energy Assessment
Final: January 18, 2010 I:\Nys-Dorm.12145\44128.City-College-Cl\Docs\Reports\Energy Assessment\Report\Final Report\MASTER_CCNY EA Report Final 1_18_10.doc
49
2. Implement ECMs that yield immediate savings. 3. Consider the energy saving aspects of systems and equipment renewal projects. 4. Undertake demonstration projects to evaluate the efficacy of renewable technologies that may be
deployed in the future. The following opportunities to reduce energy consumption and the associated greenhouse gas emissions in campus buildings and facilities were identified by the Energy Assessment Team. From the opportunities identified in Section 3, the following ECMS have been developed in detail and may serve as a portfolio of projects that may be funded under CUNY’s energy initiative. ECM-1 Lighting Fixtures and Controls ECM-2 Energy Metering and Monitoring ECM-3 Campus-wide DDC Building Automation System ECM-4 Recommissioning Central Chiller Plant Controls ECM-5 HVAC System Retrocommissioning (Compton-Goethals and Baskerville Halls) ECM-6 Steam Trap Monitoring and Maintenance Program ECM-7 Boiler Heat Recovery ECM-8 Data Center Energy Improvements (NAC and Marshak)
6.2.2. ECM-1 Lighting Fixtures and Controls While most lighting fixtures were replaced as part of the NYPA lighting retrofit project in 1995, some opportunity remains to replace fixtures with more efficient units. Efficient lighting reduces electrical energy costs year-round and space cooling costs in summer. Corridor lights on exterior walls with full height windows were on during daylight hours. Lighting occupancy sensors were not observed in mechanical spaces. Reducing unnecessary lighting operating hours reduces electrical energy costs year-round and space cooling costs in summer. Interior lighting represents a large portion of the energy consumption at CCNY. During the energy assessment, several representative spaces were examined for quantity and type of lighting fixture. At the time of the 1995 lighting retrofit project, nearly all of the older T-12 and magnetic ballast fixtures were replaced with T-8 and electronic ballasts, and many transient zones such as offices and classrooms were outfitted with wall mounted occupancy sensors. Table 6.2-1 displays the observed lighting density at CCNY on a per building basis, as well as some general observations as to the per building variation in lighting operation.
Table 6.2-1. Campus Lighting Summary
Occupancy
Sensor Typical Fixture
Type Exceptional
Fixture
Night Lighting
Level
Building Total Watts Total kW
Floor Area W/sf % Type % Type % %
Aaron Davis 96,499 96.5 67,720 1.42 75% T-8 Flour. 90% Incandescent (hallways) 10% 25% Administration 48,969 49 55,618 0.88 75% T-8 Flour. 100% n/a 0% 5%
Baskerville 46,264 46.3 61,450 0.75 25% T-8 Flour. 100% n/a 0% 75% Compton-Goethals 123,330 123.3 137,929 0.89 75% T-8 Flour. 100% n/a 0% 25%
Harris 109,344 109.3 119,027 0.92 50% T-8 Flour. 75% T-12 Fluor (Classrooms) 25% 5% Marshak 355,722 355.7 620,782 0.57 85% T-8 Flour. 100% n/a 0% 25%
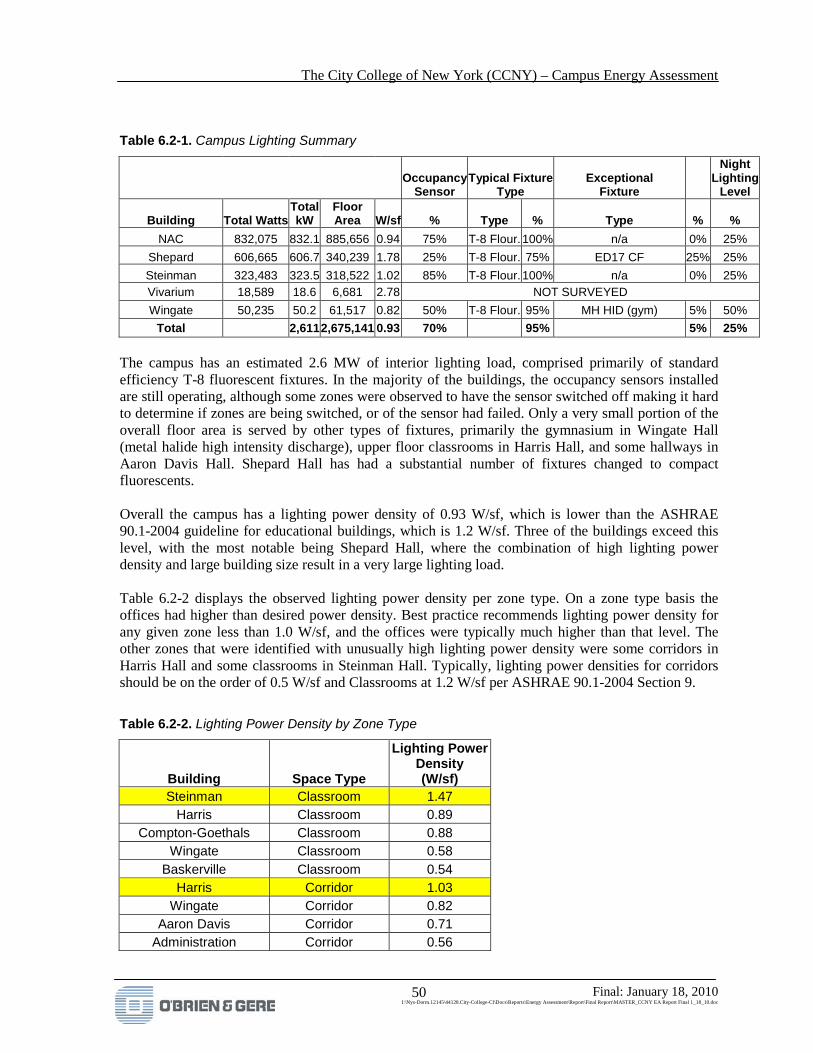
The City College of New York (CCNY) – Campus Energy Assessment
Final: January 18, 2010 I:\Nys-Dorm.12145\44128.City-College-Cl\Docs\Reports\Energy Assessment\Report\Final Report\MASTER_CCNY EA Report Final 1_18_10.doc
50
Table 6.2-1. Campus Lighting Summary
Occupancy
Sensor Typical Fixture
Type Exceptional
Fixture
Night Lighting
Level
Building Total Watts Total kW
Floor Area W/sf % Type % Type % %
NAC 832,075 832.1 885,656 0.94 75% T-8 Flour. 100% n/a 0% 25% Shepard 606,665 606.7 340,239 1.78 25% T-8 Flour. 75% ED17 CF 25% 25% Steinman 323,483 323.5 318,522 1.02 85% T-8 Flour. 100% n/a 0% 25% Vivarium 18,589 18.6 6,681 2.78 NOT SURVEYED Wingate 50,235 50.2 61,517 0.82 50% T-8 Flour. 95% MH HID (gym) 5% 50%
Total 2,611 2,675,141 0.93 70% 95% 5% 25% The campus has an estimated 2.6 MW of interior lighting load, comprised primarily of standard efficiency T-8 fluorescent fixtures. In the majority of the buildings, the occupancy sensors installed are still operating, although some zones were observed to have the sensor switched off making it hard to determine if zones are being switched, or of the sensor had failed. Only a very small portion of the overall floor area is served by other types of fixtures, primarily the gymnasium in Wingate Hall (metal halide high intensity discharge), upper floor classrooms in Harris Hall, and some hallways in Aaron Davis Hall. Shepard Hall has had a substantial number of fixtures changed to compact fluorescents. Overall the campus has a lighting power density of 0.93 W/sf, which is lower than the ASHRAE 90.1-2004 guideline for educational buildings, which is 1.2 W/sf. Three of the buildings exceed this level, with the most notable being Shepard Hall, where the combination of high lighting power density and large building size result in a very large lighting load. Table 6.2-2 displays the observed lighting power density per zone type. On a zone type basis the offices had higher than desired power density. Best practice recommends lighting power density for any given zone less than 1.0 W/sf, and the offices were typically much higher than that level. The other zones that were identified with unusually high lighting power density were some corridors in Harris Hall and some classrooms in Steinman Hall. Typically, lighting power densities for corridors should be on the order of 0.5 W/sf and Classrooms at 1.2 W/sf per ASHRAE 90.1-2004 Section 9.
Table 6.2-2. Lighting Power Density by Zone Type
Building Space Type
Lighting Power Density (W/sf)
Steinman Classroom 1.47 Harris Classroom 0.89
Compton-Goethals Classroom 0.88 Wingate Classroom 0.58
Baskerville Classroom 0.54 Harris Corridor 1.03
Wingate Corridor 0.82 Aaron Davis Corridor 0.71
Administration Corridor 0.56

The City College of New York (CCNY) – Campus Energy Assessment
Final: January 18, 2010 I:\Nys-Dorm.12145\44128.City-College-Cl\Docs\Reports\Energy Assessment\Report\Final Report\MASTER_CCNY EA Report Final 1_18_10.doc
51
Table 6.2-2. Lighting Power Density by Zone Type
Building Space Type
Lighting Power Density (W/sf)
Baskerville Corridor 0.42 Administration Corridor 3rd Floor 1.21 Aaron Davis Corridor II 4.33
Compton-Goethals Corridors 0.94 Steinman Corridors 0.82 Wingate Mechanical 0.6
Baskerville Mechanical 0.54 Administration Mechanical 0.49
Compton-Goethals Mechanical 0.41 Harris Mechanical 0.41
Aaron Davis Mechanical 0.33 Steinman Mechanical 0.29
Baskerville Office 1.53 Compton-Goethals Office 1.37
Harris Office 1.17 Wingate Office 1.08
Administration Office 0.96 Aaron Davis Office 0.78
Steinman Office 0.72 Many of the buildings were noted as having an average level of lighting that was on during unoccupied hours. This was estimated at 25% of the campus lighting load, or approximately 660 kW of continuous lighting operation. Some buildings (Administration and Harris) were identified as having nearly all the lights off except corridor lights (estimated at 5% of the lighting load), and two buildings (Wingate and Baskerville) were identified as having a very high percentage of lights on after hours (between 50-75%). ECM 1.0 - Baseline for Savings Based on these observations, the annual energy consumption of area lighting loads at CCNY was determined to be 14.1 million kWh/year, as summarized in Table 6.2-3 below.
Table 6.2-3. Baseline Lighting Load Calculation
Period Lighting Power Hours Energy Daytime – Occupied 6 AM – 10 PM, 6 days/week With Occupancy Sensors
1,828 kW 4,243 hours/year 7,755,816 kWh
Daytime – Occupied 6 AM – 10 PM, 6 days/week Without Occupancy Sensors
783 kW 4,992 hours/year 3,910,496 kWh
Nighttime – Unoccupied 457 kW 3,768 hours/year 1,721,809 kWh

The City College of New York (CCNY) – Campus Energy Assessment
Final: January 18, 2010 I:\Nys-Dorm.12145\44128.City-College-Cl\Docs\Reports\Energy Assessment\Report\Final Report\MASTER_CCNY EA Report Final 1_18_10.doc
52
Table 6.2-3. Baseline Lighting Load Calculation
Period Lighting Power Hours Energy 10 PM – 6 AM, 6 days/week All day Sunday With Occupancy Sensors Nighttime – Unoccupied 10 PM – 6 AM, 6 days/week All day Sunday Without Occupancy Sensors
196 kW 3,768 hours/year 737,918 kWh
Totals 14,126,039 kWh ECM 1.1 – Reduced Nighttime Lighting The first opportunity identified with area lighting is elimination of more nighttime lighting operation during the unoccupied period. For life and personal safety reasons, some lighting needs to operate continuously, such as hallways, stairwells, and elevator lobbies. These areas can be addressed by re-wiring some fixtures to operate continuously, and controlling the remainder (either switched or occupancy sensor controlled). If a target goal of 10% of the peak connected lighting load, which represents the percentage of hallways and transition areas at the college, were established for the current unoccupied period the campus would save nearly would save nearly 1.5 million kWh/year, and $162,000/year using the average rate of energy of 0.11/kWh (see Table 6.2-4).
Table 6.2-4. ECM 1.1 – Reduced Nighttime Lighting
Period Lighting Power Hours Energy Daytime – Occupied 6 AM – 10 PM, 6 days/week With Occupancy Sensors
1,828 kW 4,243 hours/year 7,755,816 kWh
Daytime – Occupied 6 AM – 10 PM, 6 days/week Without Occupancy Sensors
783 kW 4,992 hours/year 3,910,496 kWh
Nighttime – Unoccupied 10 PM – 6 AM, 6 days/week All day Sunday With Occupancy Sensors
183 kW 3,768 hours/year 688,724 kWh
Nighttime – Unoccupied 10 PM – 6 AM, 6 days/week All day Sunday Without Occupancy Sensors
78 kW 3,768 hours/year 295,167 kWh
Totals 12,650,203 kWh Baseline 14,126,039 kWh Energy Savings 1,475,836 kWh (10%) Cost Savings $162,342

The City College of New York (CCNY) – Campus Energy Assessment
Final: January 18, 2010 I:\Nys-Dorm.12145\44128.City-College-Cl\Docs\Reports\Energy Assessment\Report\Final Report\MASTER_CCNY EA Report Final 1_18_10.doc
53
ECM 1.2 – Additional / Update Occupancy Sensors The second opportunity identified with area lighting is to expand and update the use of occupancy sensors in the buildings, into areas where there either are no sensors, or the installed sensors are no longer working. Newer ultrasonic sensor technologies provides less nuisance shutting off of lights while occupants are present. The ASHRAE 90.1-2004 performance rating method allows for a 10-15% reduction in runtime when using occupancy sensors, compared to a baseline switched system. As the majority of uncontrolled areas at CCNY are lit continuously, it is reasonable to assume that further use of occupancy sensors will reduce the overall campus lighting load by 15%, through a reduction in runtime. Table 6.2-5 indicates the additional savings achievable by increasing occupancy sensors into the remaining 30% of the spaces without the sensors.
Table 6.2-5. ECM 1.2 – Upgraded Occupancy Sensors
Period Lighting Power Hours Energy Daytime – Occupied 6 AM – 10 PM, 6 days/week With Occupancy Sensors
1,828 kW 4,243 hours/year 7,755,816 kWh
Daytime – Occupied 6 AM – 10 PM, 6 days/week With Occupancy Sensors
783 kW 4,243 hours/year 3,323,921 kWh
Nighttime – Unoccupied 10 PM – 6 AM, 6 days/week All day Sunday With Occupancy Sensors
183 kW 3,768 hours/year 688,724 kWh
Nighttime – Unoccupied 10 PM – 6 AM, 6 days/week All day Sunday With Occupancy Sensors
78 kW 3,768 hours/year 295,167 kWh
Totals 12,063,629 kWh Baseline (ECM 1.1) 12,650,203 kWh Energy Savings 586,574 kWh (5%) Cost Savings $64,523
ECM 1.3 – Replace Exceptional Fixtures with Higher Efficiency Lighting Flush mounted and suspended fluorescent lighting are by far the most prevalent lighting fixtures on the campus. These lighting fixtures represented a high efficiency system at the time of installation, and now represent a standard efficiency lighting system. However, there were some areas identified that have fixtures that are inefficient sources of light. Some of these areas are: • Metal halide fixtures in Wingate Hall Gym

The City College of New York (CCNY) – Campus Energy Assessment
Final: January 18, 2010 I:\Nys-Dorm.12145\44128.City-College-Cl\Docs\Reports\Energy Assessment\Report\Final Report\MASTER_CCNY EA Report Final 1_18_10.doc
54
• Incandescent fixtures in Aaron Davis Hall corridors • T-12 fluorescent fixtures in Harris Hall classrooms. These fixtures can be replaced with modern, more efficient fixtures appropriate for the space and location of the fixtures. Incandescent fixtures in Aaron Davis Hall can be replaced with compact fluorescent cans. T-12 fixtures in Harris Hall can be replaced with modern T-8 or T-5 equivalent side fixtures. The metal halide fixtures in the Wingate Hall Gym can be replaced with 6-lamp high bay T-8 fluorescent fixtures. Savings from these upgrades were determined by assuming that the new fixtures would bring the lighting power density in affected areas down to 1.0 W/sf. Table 6.2-6 indicates that a combined 46 kW reduction in installed lighting power can be achieved across the campus by replacing these exceptional fixtures with efficient counterparts. This results in a 214,000 kWh/year energy savings and $23,511/year incremental energy cost savings. As a follow-up to this screening level, evaluation opportunities should be evaluated building-by-building and space-by-space.
Table 6.2-6. ECM 1.3 – Replace Exceptional Fixtures
Period Lighting Power Hours Energy Daytime – Occupied 6 AM – 10 PM, 6 days/week With Occupancy Sensors
1,782 kW 4,243 hours/year 7,559,509 kWh
Daytime – Occupied 6 AM – 10 PM, 6 days/week With Occupancy Sensors
783 kW 4,243 hours/year 3,323,921 kWh
Nighttime – Unoccupied 10 PM – 6 AM, 6 days/week All day Sunday With Occupancy Sensors
178 kW 3,768 hours/year 671,291 kWh
Nighttime – Unoccupied 10 PM – 6 AM, 6 days/week All day Sunday With Occupancy Sensors
78 kW 3,768 hours/year 295,167 kWh
Totals 11,849,888 kWh Baseline (ECM 1.2) 12,063,629 kWh Energy Savings 213,740 kWh (2%) Cost Savings $23,511
Combined, lighting ECM-1.1 through ECM-1.3, which leverage the existing fixtures with minimal replacements, total 2.3 million kWh/year in savings, with an associated energy cost savings of $250,000/year. Implementation of these ECMs will involve new circuiting of some light fixtures, additional sensors, addition of relay based controls for sections of lighting, etc. Estimated project cost for these upgrades could be as high as $3,00,000 ($1.25/sf), resulting in a payback, at the high-end, of 11 years.
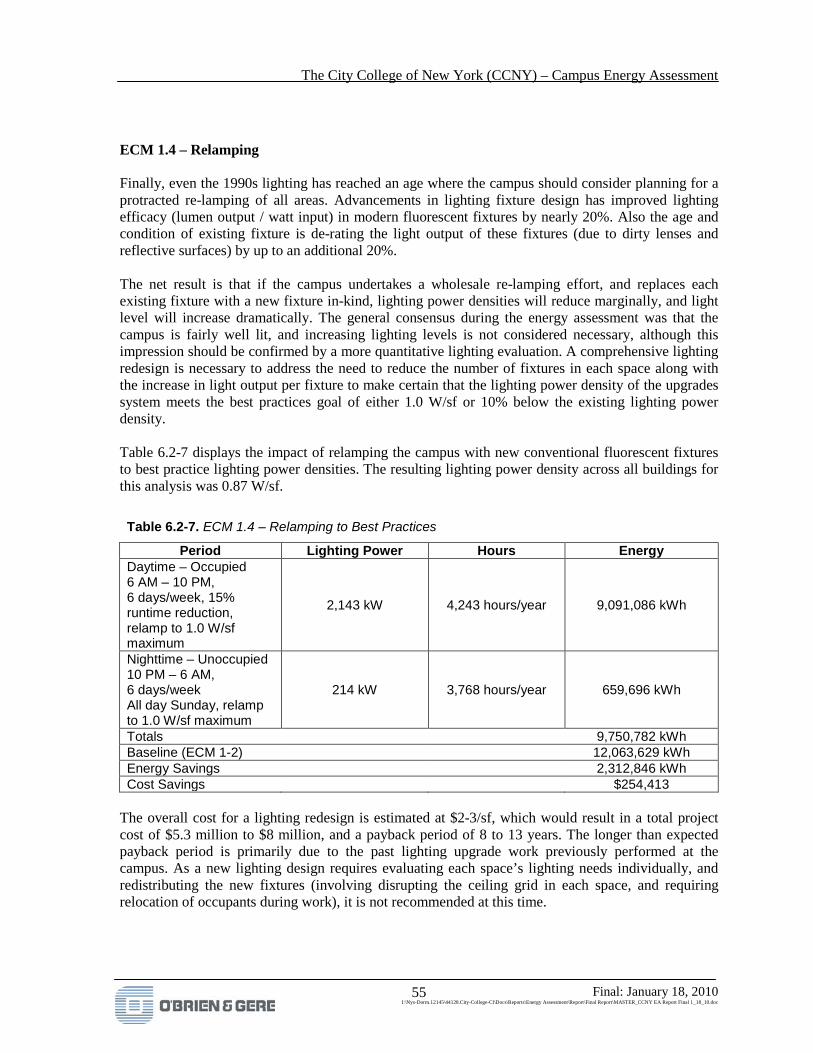
The City College of New York (CCNY) – Campus Energy Assessment
Final: January 18, 2010 I:\Nys-Dorm.12145\44128.City-College-Cl\Docs\Reports\Energy Assessment\Report\Final Report\MASTER_CCNY EA Report Final 1_18_10.doc
55
ECM 1.4 – Relamping Finally, even the 1990s lighting has reached an age where the campus should consider planning for a protracted re-lamping of all areas. Advancements in lighting fixture design has improved lighting efficacy (lumen output / watt input) in modern fluorescent fixtures by nearly 20%. Also the age and condition of existing fixture is de-rating the light output of these fixtures (due to dirty lenses and reflective surfaces) by up to an additional 20%. The net result is that if the campus undertakes a wholesale re-lamping effort, and replaces each existing fixture with a new fixture in-kind, lighting power densities will reduce marginally, and light level will increase dramatically. The general consensus during the energy assessment was that the campus is fairly well lit, and increasing lighting levels is not considered necessary, although this impression should be confirmed by a more quantitative lighting evaluation. A comprehensive lighting redesign is necessary to address the need to reduce the number of fixtures in each space along with the increase in light output per fixture to make certain that the lighting power density of the upgrades system meets the best practices goal of either 1.0 W/sf or 10% below the existing lighting power density. Table 6.2-7 displays the impact of relamping the campus with new conventional fluorescent fixtures to best practice lighting power densities. The resulting lighting power density across all buildings for this analysis was 0.87 W/sf.
Table 6.2-7. ECM 1.4 – Relamping to Best Practices
Period Lighting Power Hours Energy Daytime – Occupied 6 AM – 10 PM, 6 days/week, 15% runtime reduction, relamp to 1.0 W/sf maximum
2,143 kW 4,243 hours/year 9,091,086 kWh
Nighttime – Unoccupied 10 PM – 6 AM, 6 days/week All day Sunday, relamp to 1.0 W/sf maximum
214 kW 3,768 hours/year 659,696 kWh
Totals 9,750,782 kWh Baseline (ECM 1-2) 12,063,629 kWh Energy Savings 2,312,846 kWh Cost Savings $254,413
The overall cost for a lighting redesign is estimated at $2-3/sf, which would result in a total project cost of $5.3 million to $8 million, and a payback period of 8 to 13 years. The longer than expected payback period is primarily due to the past lighting upgrade work previously performed at the campus. As a new lighting design requires evaluating each space’s lighting needs individually, and redistributing the new fixtures (involving disrupting the ceiling grid in each space, and requiring relocation of occupants during work), it is not recommended at this time.

The City College of New York (CCNY) – Campus Energy Assessment
Final: January 18, 2010 I:\Nys-Dorm.12145\44128.City-College-Cl\Docs\Reports\Energy Assessment\Report\Final Report\MASTER_CCNY EA Report Final 1_18_10.doc
56
6.2.3. ECM-2 Energy Metering and Monitoring The first step in controlling energy consumption and resulting costs at CCNY is to measure and track the energy consumption of the individual buildings on campus using building level submeters. Submeters allow energy use patterns for each building to be developed on a much more detailed level than is achievable with monthly utility consumption. Data from submeters is typically collected continuously at 15 minute intervals, which allows variations in energy consumption to be evaluated based on time-of-use, rather than net quantities. Submetering can be implemented using meters for both electricity consumption (energy meters) and thermal loads (Btu or steam meters). Submeters can also be installed on other support systems such as condensate returns or boiler makeup water, as a way of automatically recording performance parameters that may deviate from normal operation during an upset condition. A campus wide submetering effort will also position the college to validate the impact of future ECMs through Monitoring and Verification (M&V) programs. Many M&V standards, such as the International Performance Monitoring and Verification Protocol (IPMVP), require submetering to meet the savings calculation requirements of the standard. Finally, if implemented at the proper level of detail, the college may use submetering as a method of monitoring, or even billing, individual departments for their energy consumption. This can result in a higher adoption rate of low cost behavior-driven ECMs, as the impact of energy conserving behaviors will directly reward each department via lower energy charges. Applicability of Electrical Submeters In a campus environment, electrical submeters are typically installed to monitor electricity consumption of either individual buildings, or specific areas (e.g. lab areas, server rooms) or equipment (e.g. chillers, cooling towers) inside individual buildings. The utility bill analysis for CCNY indicated that eight electric utility accounts using 36 separate utility meters are used by Con Edison to provide utility level metering at the campus. In some instances at CCNY, two separate utility services on different utility accounts serve the same building, preventing disaggregating of utility energy on a building-by-building basis. Submetering can bridge this information gap, and allow an electricity consumption history to be developed for each building. The submetered data can then be analyzed for variations in energy use patterns either with time, such as load profiles, which is useful in demand curtailment projects. The submetered data can also be analyzed for variations against an independent variable such as ambient temperature, which is useful in developing the relationship between temperature dependant cooling and heating loads, and temperature independent equipment and process loads. Submetered data can also be used to extend the “campus-wide” benchmarking down to the building level. This will allow for internal ranking of each of the campus buildings, for prioritizing energy efficient upgrade projects. The typical cost for an electrical submeter sized for a building service entrance is $2,500-$3,000/submeter for equipment (as shown in Table 6.2-8), and an estimated $1,500/meter for installation. Metering the 36 service entrances at CCNY will have an estimated cost of $162,000. Additional costs are required for integration with a campus wide BAS, or for the addition of a dedicated submetering data management system.

The City College of New York (CCNY) – Campus Energy Assessment
Final: January 18, 2010 I:\Nys-Dorm.12145\44128.City-College-Cl\Docs\Reports\Energy Assessment\Report\Final Report\MASTER_CCNY EA Report Final 1_18_10.doc
57
Table 6.2-8. Typical Prices for Example Electrical Submetering Hardware Component Example Product Estimated Price Meter & Display PMI ION 6200 $1,000 Current Transducers (CTs) (3) 2000:5 A, 600 V Bus bar
rated $1,500
Network communication device Control Solutions' Babel Buster 10/100 Modbus/TCP translator
$500
Total $3,000 / submeter Applicability of Thermal Submeters Like many campuses, CCNY uses a central plant system to distribute chilled and hot water to the buildings for space conditioning. At CCNY, electric centrifugal chillers (primarily) produce chilled water and natural gas-fired boilers produce steam that is converted to hot water via heat exchangers. The central plant provides hot and chilled water to the buildings on campus. A Btu meter should be located at the service entrance from the central plant for each building to capture the heating and cooling energy delivered to each building. A Btu meter consists of two temperature sensors with one sensor each placed on the supply piping out to the building and on the return pipe from the building, and a flow meter that measures the fluid flow corresponding to the measured temperature difference. Often these measurements are connected to a Btu meter head that performs the heat transfer calculation and reports the thermal use directly to the BAS or other monitoring system. The typical cost of a Btu meter is on the order of $1,500/meter, but varies with the size of the flow meter required. In retrofit applications, it is often desirable to use a Btu meter that features an insertion style flow meter that can be “hot-tapped” into the piping without the need to shut down and drain the system. Temperature sensors should be located in thermowells (which can also be “hot-tapped”). Cost for installing the fittings for a Btu meter are on the order of $1,500/meter. Installing two Btu meters (one each for chilled and hot water) on all 14 buildings at CCNY will cost approximately $84,000. Other Metering Locations In addition to metering the electricity and thermal consumption on a per building basis, it is recommended that a full submetering effort be dedicated to the central plant. The central plant embodies the largest point source use of energy at the campus, and variations in energy consumption at the central plant (electricity for the chillers, natural gas for the boilers, and domestic makeup water for both systems) can have dramatic cost consequences. The following locations are recommended for submetering for the central plant: • chiller electrical service • cooling tower electrical service • primary pump electrical service • primary loop Btu meter • boiler natural gas meter • boiler makeup water • boiler feed water

The City College of New York (CCNY) – Campus Energy Assessment
Final: January 18, 2010 I:\Nys-Dorm.12145\44128.City-College-Cl\Docs\Reports\Energy Assessment\Report\Final Report\MASTER_CCNY EA Report Final 1_18_10.doc
58
Installing these seven meters will allow for the actual efficiency of each primary central plant system to be measured directly. By measuring and tracking efficiency of the central plant components, intelligent decisions for operation of the plant can be made, rather than relying on rules of thumb and estimates of operating efficiency across different operating modes. The estimated cost of incrementing the central plant for submetering is on the order of $25,000. The cost is highly dependent on the number of separate electrical services serving the chillers. If multiple electrical meters are required for the chillers, then the cost will increase proportionally. Data Collection and Presentation In order for benefits of submetering to be realized, the data collected must be made accessible to all the necessary stakeholders, and not languish in a data base. Many of the manufacturers of electrical submetering equipment (e.g. ITRON, PMI, EMON, and others), offer software to regularly poll the submeters and aggregate the data automatically. Inclusion of the Btu meters, and other natural gas and water meters, may require further system integration, and third party energy reporting software such as EnergyCap (www.energycap.com). Total Cost The total cost for a comprehensive submetering effort to collect electricity, fuel and thermal use on a whole building level was estimated. Typical per meter costs are shown in Table 6.2-9, totaling $270,000, but unknown installation and system integration issues warrant a contingency adder of $230,000, for a total project cost of $500,000. Spreading this cost across the 14 main campus buildings, results in a floor area normalized cost of $1.74/sf. The submetering system has some re-occurring costs, such as annual maintenance and calibration, which is typically $200-400/metered point. Maintenance and calibration services for CCNY are estimated at $15,000 - $30,000/year based on the number of metering points identified (71 total meters). Table 6.2-9. Metering Costs
Submeter Type Location Quantity
Unit Cost Installed Total
Electricity (energy, demand)
Building Service Entrances (adjacent to Con Ed Metering Points) 36 $4,500 $162,000
Btu (chilled & hot water)
Secondary piping supply and returns to each building located at boiler house,
28 $3,000 $84,000
Natural Gas Boiler house main gas service 1 $5,000 $5,000
Water Boiler makeup water header, Boiler feedwater header 2 $1,500 $3,000
Electricity (energy, demand)
Chiller plant main service, Cooling Tower main service, Primary Pump main service
3 $4,500 $13,500
Btu (chilled & hot water)
Chiller plant primary supply and return header 1 $3,000 $3,000
The City College of New York (CCNY) – Campus Energy Assessment
Final: January 18, 2010 I:\Nys-Dorm.12145\44128.City-College-Cl\Docs\Reports\Energy Assessment\Report\Final Report\MASTER_CCNY EA Report Final 1_18_10.doc
59
Table 6.2-9. Metering Costs Submeter
Type Location Quantity Unit Cost Installed Total
Added installation, integration, contingency $229,500
Totals $500,000
6.2.4. ECM-3 Campus-wide DDC Building Automation System (BAS) Campus buildings constructed or significantly renovated prior to 1990 do not have building-wide DDC or energy management systems (EMS). Converting from existing analog pneumatic controls to DDC provides opportunities for scheduling equipment operation and space temperatures based on occupancy, providing CO2-based ventilation controls, metering and monitoring, and recording of energy usage trends. Significant energy savings can result. DDC provides more effective control of HVAC systems by providing accurately sensed input data as the basis for control. Electronic sensors for measuring the common HVAC parameters of temperature, humidity and pressure are inherently more accurate than their pneumatic predecessors. Since the logic of a control loop is now included in the software, this logic can be readily changed. A simple logic circuit on a printed control board can now replace pneumatic tubing and line level relay control logic. Legacy pneumatic controls use compressed air to drive actuators coupled to air dampers and valves, as well as control supply, mixed, return, and space temperatures via proportional pneumatic thermostats. Much of this existing equipment has either failed and has been abandoned in place and is near the end of its usable life, with replacement parts becoming scarce. There are many energy-efficient control strategies employed in pneumatic logic that can be easily duplicated in DDC logic. Many of these control strategies once existed at CCNY some manner. Again, due to failure, lack of maintenance, or overall age of the existing controls, they are no longer fully implemented. In this sense, DDC is far more flexible in changing reset schedules, setpoints and the overall control logic. Advanced users are apt to apply more complex strategies, implement energy saving features, and optimize their system performance since there is less cost associated with these changes than there would be when the logic is distributed to individual components. Even extremely simplified DDC control schemes can provide energy savings compared to the baseline represented by a failing pneumatic control system where components are poorly controlled (if at all), and equipment runs continuously regardless of loading. DDC uses microprocessor-based controls to implement the control logic to equipment. In place of pneumatic pressure (which is a proxy for the primary measurement being performed) as the feedback signal, DDC control uses analog (resistance, current loop, and voltage) sensors and digital sensors (OPTO on/off) to directly measure space and airstream temperature, humidity, and equipment operating status. Whereas the driving force in a pneumatic control system is compressed air, the driving force in a DDC control system is servo style electric motors (in the case of VAV dampers, outdoor air dampers, and other low-torque loads). Where more force is required, localized pneumatics that are controlled by a DDC output are utilized. These large torque loads typically occur all in one location (such as a large fan room or central plant chiller/boiler room), reducing the length and volume of compressed air piping used for controls. This provides an ancillary benefit of DDC control, namely the reduction in compressed air leakage from reduced piping lengths, which will result in energy savings at the air compressor.

The City College of New York (CCNY) – Campus Energy Assessment
Final: January 18, 2010 I:\Nys-Dorm.12145\44128.City-College-Cl\Docs\Reports\Energy Assessment\Report\Final Report\MASTER_CCNY EA Report Final 1_18_10.doc
60
The benefits of DDC over the current pneumatic control technologies in place at CCNY are that DDC improves the effectiveness of control of dampers, valves, and terminal equipment; allows for equipment and discrete portions of the building to change to an “unoccupied” mode where equipment remains in the standby mode until required to operate; and allows for implementation of advance control algorithms to further enhance energy savings. In addition to advanced control schemes, operational improvements are also candidates for opportunity for efficiency improvements with DDC. Alarms can be transmitted to multiple personnel, and escalate up the chain of command as appropriate to ensure that local alarms are responded to. Trending capabilities allow maintenance and engineering staff to troubleshoot system and control problems, log historic operating patterns for comparison and make better-informed decisions with regard to what is normal and aberrant behavior of the equipment. Trend log data can be used to track the performance of the equipment over time, and used to detect potential problems prior to being detected by the occupants, which will cut down on the volume of work orders generated from comfort complaints. Run times of various equipment can be monitored and alarms/messages can be generated when a lead/lag changeover occurs or if it is time to conduct routine maintenance. Several ECM options are available once DDC has been implemented at the college. A building simulation model (energy model) was developed to evaluate these DDC control options compared to the existing controls or lack thereof. The simulation model was of a “typical” 250,000 sf building at CCNY, and was created to represent the current construction and conditions observed during the energy assessments, across the variety of buildings at CCNY. Input for the building simulation model was based from field observations, and the response of the model was compared to the utility billing data for the campus as a whole, normalized for floor area. Where inputs could not be determined from field observations, default values and estimates based on past experience were used to fill the gaps in information. The model was constructed using the eQUEST 3.61 building simulation software, which is based on the DOE2.2 simulation engine. More detail on the simulation model inputs is available in Section 6.3 under building envelop improvements, where the same model was used to evaluate the envelope upgrades. The DDC ECMs evaluated are (in order of increasing system complexity): • Thermostat Setback in the Unoccupied Period • HVAC Fan Scheduling in the Unoccupied Period • Supply Air Reset • Delta Enthalpy Economizers • Demand Control Ventilation • All ECMs rolled up to represent best practice. A brief description of each ECM model follows: Thermostat Setback in the Unoccupied Period – Thermostats can be programmed to integrate building wide temperature setpoints into the DDC control algorithms. The model was evaluated at 74ºF cooling setpoint during the occupied period and a 80ºF setpoint during the unoccupied period. Heating setpoints were models at 72ºF during the occupied period and 66ºF during the unoccupied period. Typical thermostats used in a DDC system have a zone adjustment on the thermostat which is programmable from the central controller. The zone adjustment is typically on the order of ±3ºF, to allow for occupant comfort on a zone by zone basis.
The City College of New York (CCNY) – Campus Energy Assessment
Final: January 18, 2010 I:\Nys-Dorm.12145\44128.City-College-Cl\Docs\Reports\Energy Assessment\Report\Final Report\MASTER_CCNY EA Report Final 1_18_10.doc
61
HVAC Fan Scheduling in the Unoccupied Period – The existing fan controls (start/stop or VSD speed) can be integrated into the DDC system. The DDC can then either shut down, or slow down the supply and return fans during periods of lower occupancy as load decreases. Supply Air Reset – The DDC can adjust supply air temperature at VAV AHUs based on outdoor air temperature. Typical control algorithms adjust the supply temperature upwards by up to 10ºF (from 55ºF to 65ºF) as ambient temperature decrease from the design temperature of 95ºF. Delta Enthalpy Economizers – Economizers in the past have typically been controlled solely on ambient temperature, resulting in missed opportunity to displace cooling performed by the central plant with cooling performed by outside air. During the economizer cycle, the outside air dampers open fully, to allow maximum outside air flow to the space. The chilled water coils can add additional cooling capacity if necessary to meet the space cooling loads. A dual enthalpy economizer uses an ambient air enthalpy sensor (one per building) and return air enthalpy sensor (one per major AHU), and compares the difference between the two. If the enthalpy difference indicates that fresh air can provide cooling (either sensible or latent), then the economizer is utilized. This ECM requires that all outdoor air dampers be serviced and repairs made to all actuators, linkages, etc, and that outdoor air (OA) damper maintenance be performed on a continuous basis. Demand Control Ventilation – In the past, conventional HVAC design has incorporated a fixed outside air volume based on the maximum occupancy of the space, and does not address the fact that occupancy (and therefore the required ventilation level) changes across the day. DCV can be performed by measuring CO2 levels (as a proxy for occupancy) on a zone-by-zone basis, or by measuring return CO2 levels (average occupancy of all zones returned). There are several methods of determining occupancy levels from CO2, but the most common is to simply control space CO2 levels to 1000 parts per million (ppm) by continuously adjusting the outdoor air damper positions. Similar to the economizer ECM, DCV requires functioning outside air dampers, and will require annual calibration of the CO2 sensors to be effective. Table 6.2-10 displays the results of the DDC-based ECMs analyzed. In general, all DDC ECMs that impacted the volume of fresh air will have a substantial impact at CCNY. Scheduling the supply air fans, demand controlled ventilation, and supply air reset all had dramatic impacts on the heating load, with impacts between 20-40% of the nominal heating load. Scheduling the supply fans also had a dramatic impact on energy savings due to the decreased runtime hours. Supply air reset, enthalpy economizers, and demand controlled ventilation all had a modest impact on cooling. The best practice of all ECMs combined had a smaller impact than the sum of the individual measures due to the interactive impacts. The model project that all measures combined could have as much as a 9.8% impact on electricity and 55% impact on natural gas if these control deficiencies are prevalent campus wide. More likely, 50% of the campus spaces are lacking most or all of these controls, and the site-wide savings from DDC would be on the order of half of the projected savings (4.9% electricity, and 25% natural gas). This places the impact of DDC at CCNY in the same magnitude as other best practice estimates of savings – near 25% energy cost savings.
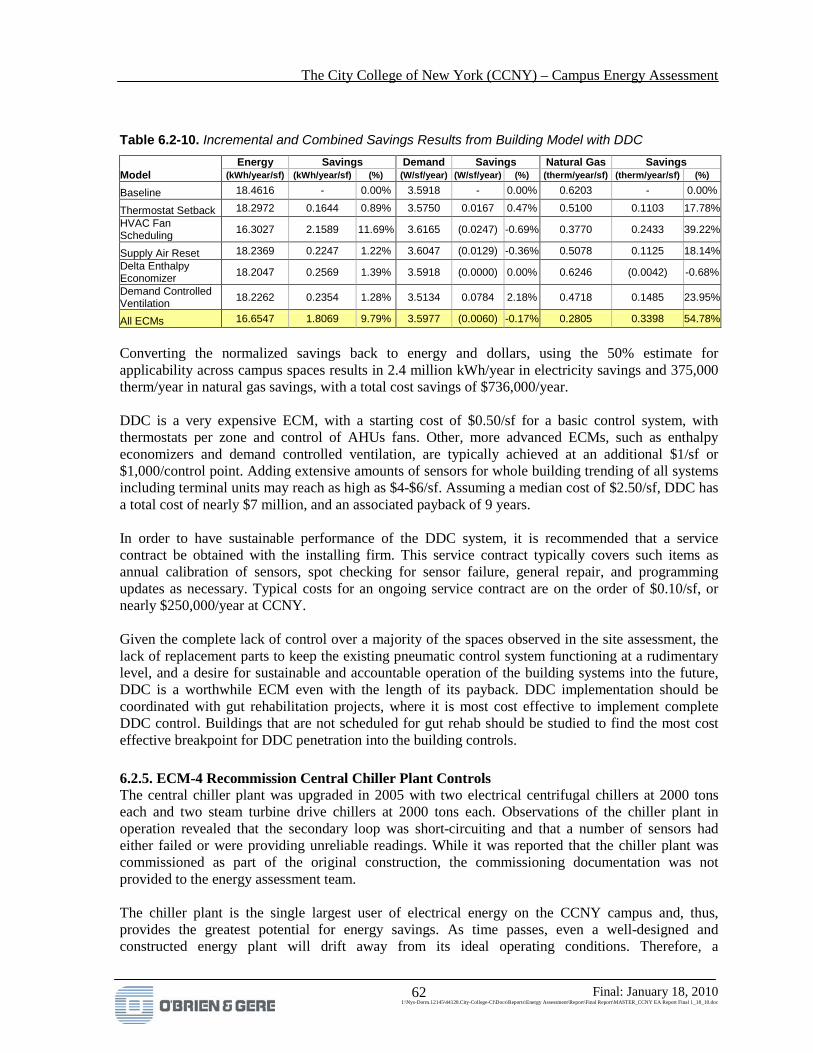
The City College of New York (CCNY) – Campus Energy Assessment
Final: January 18, 2010 I:\Nys-Dorm.12145\44128.City-College-Cl\Docs\Reports\Energy Assessment\Report\Final Report\MASTER_CCNY EA Report Final 1_18_10.doc
62
Table 6.2-10. Incremental and Combined Savings Results from Building Model with DDC Energy Savings Demand Savings Natural Gas Savings Model (kWh/year/sf) (kWh/year/sf) (%) (W/sf/year) (W/sf/year) (%) (therm/year/sf) (therm/year/sf) (%)
Baseline 18.4616 - 0.00% 3.5918 - 0.00% 0.6203 - 0.00%
Thermostat Setback 18.2972 0.1644 0.89% 3.5750 0.0167 0.47% 0.5100 0.1103 17.78% HVAC Fan Scheduling 16.3027 2.1589 11.69% 3.6165 (0.0247) -0.69% 0.3770 0.2433 39.22%
Supply Air Reset 18.2369 0.2247 1.22% 3.6047 (0.0129) -0.36% 0.5078 0.1125 18.14% Delta Enthalpy Economizer 18.2047 0.2569 1.39% 3.5918 (0.0000) 0.00% 0.6246 (0.0042) -0.68%
Demand Controlled Ventilation 18.2262 0.2354 1.28% 3.5134 0.0784 2.18% 0.4718 0.1485 23.95%
All ECMs 16.6547 1.8069 9.79% 3.5977 (0.0060) -0.17% 0.2805 0.3398 54.78%
Converting the normalized savings back to energy and dollars, using the 50% estimate for applicability across campus spaces results in 2.4 million kWh/year in electricity savings and 375,000 therm/year in natural gas savings, with a total cost savings of $736,000/year. DDC is a very expensive ECM, with a starting cost of $0.50/sf for a basic control system, with thermostats per zone and control of AHUs fans. Other, more advanced ECMs, such as enthalpy economizers and demand controlled ventilation, are typically achieved at an additional $1/sf or $1,000/control point. Adding extensive amounts of sensors for whole building trending of all systems including terminal units may reach as high as $4-$6/sf. Assuming a median cost of $2.50/sf, DDC has a total cost of nearly $7 million, and an associated payback of 9 years. In order to have sustainable performance of the DDC system, it is recommended that a service contract be obtained with the installing firm. This service contract typically covers such items as annual calibration of sensors, spot checking for sensor failure, general repair, and programming updates as necessary. Typical costs for an ongoing service contract are on the order of $0.10/sf, or nearly $250,000/year at CCNY. Given the complete lack of control over a majority of the spaces observed in the site assessment, the lack of replacement parts to keep the existing pneumatic control system functioning at a rudimentary level, and a desire for sustainable and accountable operation of the building systems into the future, DDC is a worthwhile ECM even with the length of its payback. DDC implementation should be coordinated with gut rehabilitation projects, where it is most cost effective to implement complete DDC control. Buildings that are not scheduled for gut rehab should be studied to find the most cost effective breakpoint for DDC penetration into the building controls.
6.2.5. ECM-4 Recommission Central Chiller Plant Controls The central chiller plant was upgraded in 2005 with two electrical centrifugal chillers at 2000 tons each and two steam turbine drive chillers at 2000 tons each. Observations of the chiller plant in operation revealed that the secondary loop was short-circuiting and that a number of sensors had either failed or were providing unreliable readings. While it was reported that the chiller plant was commissioned as part of the original construction, the commissioning documentation was not provided to the energy assessment team. The chiller plant is the single largest user of electrical energy on the CCNY campus and, thus, provides the greatest potential for energy savings. As time passes, even a well-designed and constructed energy plant will drift away from its ideal operating conditions. Therefore, a

The City College of New York (CCNY) – Campus Energy Assessment
Final: January 18, 2010 I:\Nys-Dorm.12145\44128.City-College-Cl\Docs\Reports\Energy Assessment\Report\Final Report\MASTER_CCNY EA Report Final 1_18_10.doc
63
recommissioning of the chiller plant controls is recommended. There are approximately 500 control points in the existing DDC control system for the chiller plant, and it can be expected that a number of these will fail or require recalibration every year. A systematic recommissioning process could also incorporate additional control that could utilize existing chilled water flow meters and power monitoring sensors to monitor and optimize plant efficiency. Assuming that recommissioning would save an estimated 10% of the plant energy use through improved operating efficiency; the resulting savings would be nearly 2 million kWh/year. At an estimated cost of $300,000, the simple payback would be in approximately 1.4 years.
6.2.6. ECM-5 Building HVAC System Retrocommissioning Few buildings on campus were commissioned at the time of construction and most were observed not to be operating as originally intended. As building use changes, occupant loads shift and existing equipment ages, operations continuously drift away from their ideal operating state. As this occurs, energy efficiency and occupant comfort deteriorate as well. Retrocommissioning (RCx) may be able to bring a building back to its original operating condition, improve occupant comfort and energy performance. Throughout the CCNY campus the operating sequences of HVAC equipment (such as temperatures, flows, valve and damper position) are generally poorly documented. With design operating conditions either misunderstood or unknown, facilities staff operate equipment by making assumptions that may or not be correct. Retrocommissioning can provide additional documentation, such as a Systems Manual that describes the building operating sequences and can serve a basis for training technicians who will be operating and servicing the building. Buildings on the CCNY campus that are good candidates for retrocommissioning are those with existing DDC controls that have been in operation for several years. Compton-Geothals (138,000 gsf) and Baskerville Halls (61,000 gsf) fall into this category. Assuming a median energy savings of 16% per year resulting from the retrocommissioning, and a median cost of $0.75 per square foot, the resulting energy savings would be 123,179 kWh of electrical energy and 451 Dth of fossil fuel.
6.2.7. ECM-6 Stream Trap, Monitoring and Maintenance Program Steam traps are vital components in any steam systems. Steam traps establish the proper separation of steam and condensate, so that steam is always available to meet heating loads, and condensate is removed and directed back to the condensate return system. Even under no-load and low-load conditions, steam condenses in the supply piping, producing condensate that can be entrained in the steam coil or heat exchanger thereby impeding heat transfer and resulting in corrosion. Leaky steam traps allow steam to pass to the condensate side of the system without providing a thermal benefit. Regular maintenance of steam traps pays for itself in reduced steam waste and eliminates unsafe steam plumes from condensate systems. The three main styles of steam traps are3
• Mechanical traps operate by using the difference in density between steam and condensate. A float within the trap detects the variance in weight between a gas and a liquid.
:
3 Source: Armstrong Steam University
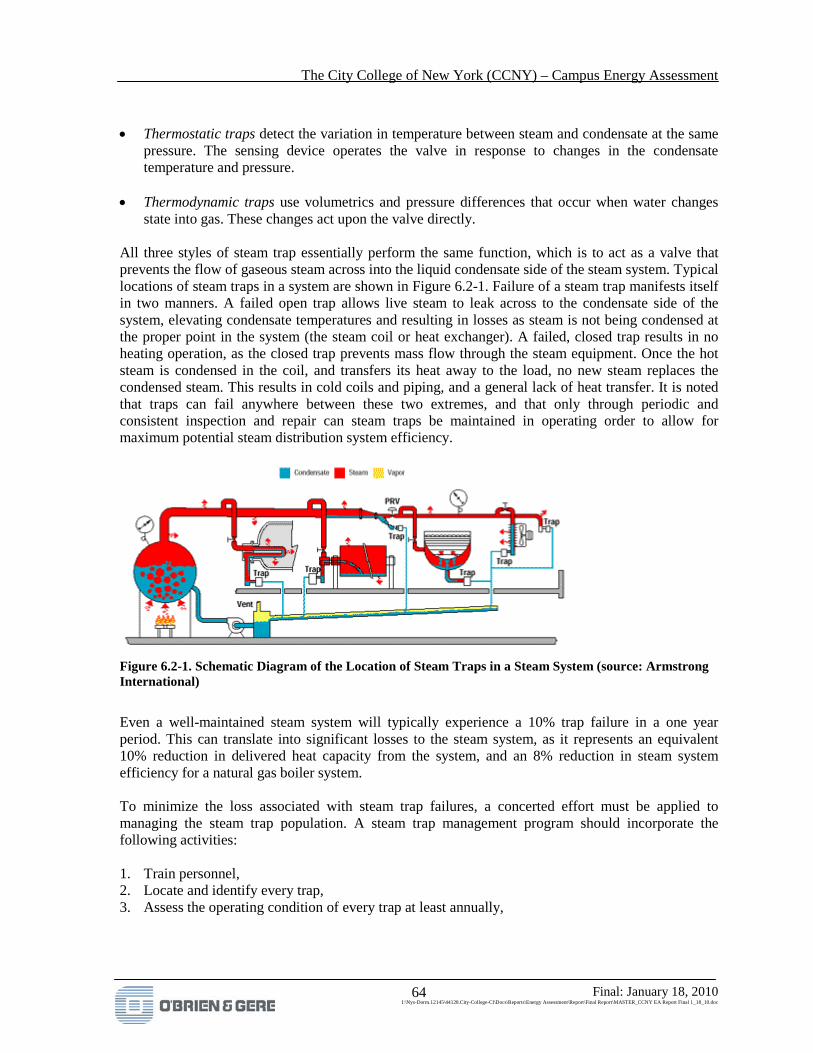
The City College of New York (CCNY) – Campus Energy Assessment
Final: January 18, 2010 I:\Nys-Dorm.12145\44128.City-College-Cl\Docs\Reports\Energy Assessment\Report\Final Report\MASTER_CCNY EA Report Final 1_18_10.doc
64
• Thermostatic traps detect the variation in temperature between steam and condensate at the same pressure. The sensing device operates the valve in response to changes in the condensate temperature and pressure.
• Thermodynamic traps use volumetrics and pressure differences that occur when water changes
state into gas. These changes act upon the valve directly. All three styles of steam trap essentially perform the same function, which is to act as a valve that prevents the flow of gaseous steam across into the liquid condensate side of the steam system. Typical locations of steam traps in a system are shown in Figure 6.2-1. Failure of a steam trap manifests itself in two manners. A failed open trap allows live steam to leak across to the condensate side of the system, elevating condensate temperatures and resulting in losses as steam is not being condensed at the proper point in the system (the steam coil or heat exchanger). A failed, closed trap results in no heating operation, as the closed trap prevents mass flow through the steam equipment. Once the hot steam is condensed in the coil, and transfers its heat away to the load, no new steam replaces the condensed steam. This results in cold coils and piping, and a general lack of heat transfer. It is noted that traps can fail anywhere between these two extremes, and that only through periodic and consistent inspection and repair can steam traps be maintained in operating order to allow for maximum potential steam distribution system efficiency.
Figure 6.2-1. Schematic Diagram of the Location of Steam Traps in a Steam System (source: Armstrong International)
Even a well-maintained steam system will typically experience a 10% trap failure in a one year period. This can translate into significant losses to the steam system, as it represents an equivalent 10% reduction in delivered heat capacity from the system, and an 8% reduction in steam system efficiency for a natural gas boiler system. To minimize the loss associated with steam trap failures, a concerted effort must be applied to managing the steam trap population. A steam trap management program should incorporate the following activities: 1. Train personnel, 2. Locate and identify every trap, 3. Assess the operating condition of every trap at least annually,
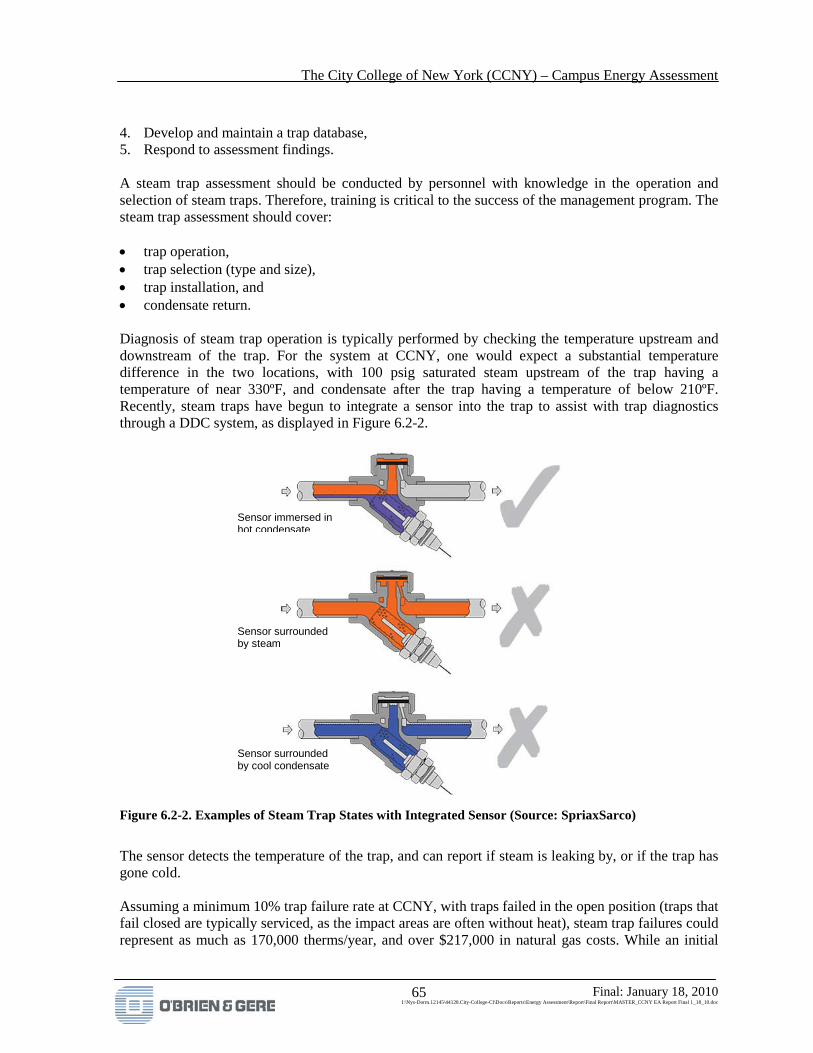
The City College of New York (CCNY) – Campus Energy Assessment
Final: January 18, 2010 I:\Nys-Dorm.12145\44128.City-College-Cl\Docs\Reports\Energy Assessment\Report\Final Report\MASTER_CCNY EA Report Final 1_18_10.doc
65
4. Develop and maintain a trap database, 5. Respond to assessment findings. A steam trap assessment should be conducted by personnel with knowledge in the operation and selection of steam traps. Therefore, training is critical to the success of the management program. The steam trap assessment should cover: • trap operation, • trap selection (type and size), • trap installation, and • condensate return. Diagnosis of steam trap operation is typically performed by checking the temperature upstream and downstream of the trap. For the system at CCNY, one would expect a substantial temperature difference in the two locations, with 100 psig saturated steam upstream of the trap having a temperature of near 330ºF, and condensate after the trap having a temperature of below 210ºF. Recently, steam traps have begun to integrate a sensor into the trap to assist with trap diagnostics through a DDC system, as displayed in Figure 6.2-2.
Figure 6.2-2. Examples of Steam Trap States with Integrated Sensor (Source: SpriaxSarco)
The sensor detects the temperature of the trap, and can report if steam is leaking by, or if the trap has gone cold. Assuming a minimum 10% trap failure rate at CCNY, with traps failed in the open position (traps that fail closed are typically serviced, as the impact areas are often without heat), steam trap failures could represent as much as 170,000 therms/year, and over $217,000 in natural gas costs. While an initial
Sensor immersed in hot condensate
Sensor surrounded by steam
Sensor surrounded by cool condensate
The City College of New York (CCNY) – Campus Energy Assessment
Final: January 18, 2010 I:\Nys-Dorm.12145\44128.City-College-Cl\Docs\Reports\Energy Assessment\Report\Final Report\MASTER_CCNY EA Report Final 1_18_10.doc
66
steam trap assessment may cost over $150,000 (estimated at $0.08/sf), savings from such an assessment would cover the cost of the assessment in the first year. Every successive assessment will have reduced cost, as a database of “good” and “problem” traps are developed, and priority given to the areas that need it most. The long-term cost of trap maintenance could be as low as half the upfront cost/year, which would result in positive cash flow from steam trap maintenance of $67,000/year.
6.2.8. ECM-7 Boiler Heat Recovery Three of the five steam boilers in the NAC heating plant do not have feedwater economizers. None of the boilers recover energy from boiler blowdown. Feedwater economizers preheat boiler feedwater using hot boiler flue gas. Recovering energy from boiler blowdown before it is discharged to drain can further reduce feedwater heating requirements. The central steam plant configuration at CCNY converts a large majority of the steam produced to high temperature hot water that is circulated to the buildings, where an isolation heat exchanger converts the high temperature hot water to a more moderate temperature for use by the terminal heating equipment and other hot water coils. Since the high temperature heat exchangers are located near the boiler room, the majority of the steam does not leave the central plant. This results in a large percentage of the condensate from the steam system being recovered, and returned to the boiler feedwater system. Due to relatively short steam piping length in the system, the quantity of condensate returned to the system is estimated at 90% (10% makeup water fraction). Using the above estimate for condensate return/makeup water fraction, and the annual fuel consumption of the boiler plant, a calculation of the total makeup water volume used was performed using the following parameters: Natural Gas Use 1,700,147 Therms/year Steam Production 136,012 MMBTU/year Steam @ 80% Efficiency Steam Production 129.5 Million lb/year Steam @ 1050 Btu/lb Makeup Water Volume 1.55 Million gal/year Makeup Water @ 10% Every gallon of makeup water consumed by the steam system requires 1,160 Btu/lb (9,674Btu/gallon) to produce steam at 100 psig, while every pound of condensate (estimated at 180ºF) requires 1,040 Btu/lb (9,674 Btu/gallon). Producing steam from makeup water requires nearly 11% more energy input than producing steam from the warmer condensate. To reduce the cost of the makeup water load, a boiler flue gas economizer could be installed on the existing boiler system. The economizer recovers excess heat in the exhaust flue to pre-heat the makeup water prior to mixing the makeup water with feedwater in the receiver. Typically, makeup water can be heated from 60ºF to 180ºF (similar to the condensate temperature) with a boiler economizer, which will result in a corresponding decrease in boiler gas consumption of 16,192 therm/year. Based on the average cost of natural gas of $1.28/therm, this decrease from a boiler economizer results in a cost savings of $20,725. The estimated installation cost of the boiler economizer is $250,000, resulting in a payback of 12 years. A schematic of the boiler flue gas economizer is shown in Figure 6.2-3.

The City College of New York (CCNY) – Campus Energy Assessment
Final: January 18, 2010 I:\Nys-Dorm.12145\44128.City-College-Cl\Docs\Reports\Energy Assessment\Report\Final Report\MASTER_CCNY EA Report Final 1_18_10.doc
67
Figure 6.2-3. Boiler Flue Gas Economizer
6.2.9. ECM-8 Data Center Energy Improvements (NAC and Marshak) A recently completed assessment of the data centers in NAC and Marshak by Custom Computer Specialists, Inc. suggested a number of operational and facility infrastructure improvements that would result in significant energy savings. Deficiencies were found with the current room layouts, cooling systems, raised floors, power systems, lighting, racks, cabling, fire protection, safety and energy systems. The consultant recommended modifications to both data center locations and provided qualitative guidance regarding potential implementation costs and savings. A more detailed analysis would be necessary to quantify projected savings and costs. The Energy Assessment Team has attempted to quantify rough order of magnitude costs and savings for inclusion of these improvements as an ECM. The recommended improvements include the following: • Improve HVAC air supply and return air effectiveness. • Eliminate “hot spots” • Implement a hot aisle/cold aisle strategy
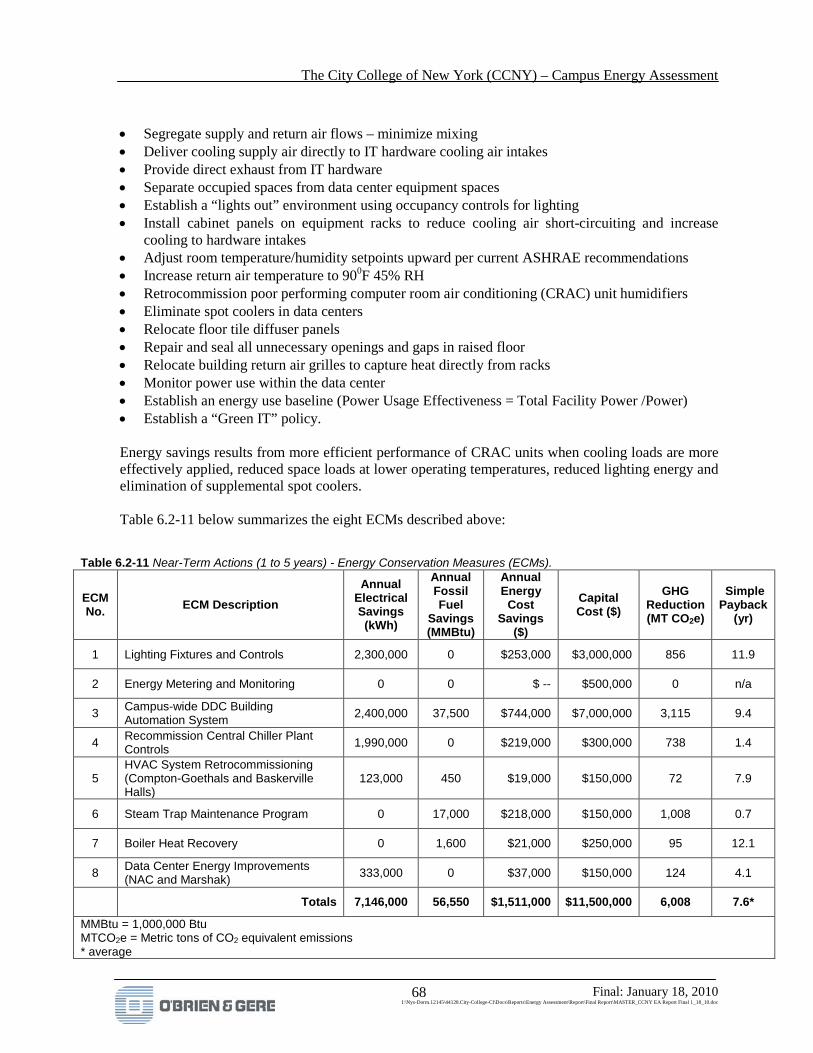
The City College of New York (CCNY) – Campus Energy Assessment
Final: January 18, 2010 I:\Nys-Dorm.12145\44128.City-College-Cl\Docs\Reports\Energy Assessment\Report\Final Report\MASTER_CCNY EA Report Final 1_18_10.doc
68
• Segregate supply and return air flows – minimize mixing • Deliver cooling supply air directly to IT hardware cooling air intakes • Provide direct exhaust from IT hardware • Separate occupied spaces from data center equipment spaces • Establish a “lights out” environment using occupancy controls for lighting • Install cabinet panels on equipment racks to reduce cooling air short-circuiting and increase
cooling to hardware intakes • Adjust room temperature/humidity setpoints upward per current ASHRAE recommendations • Increase return air temperature to 900F 45% RH • Retrocommission poor performing computer room air conditioning (CRAC) unit humidifiers • Eliminate spot coolers in data centers • Relocate floor tile diffuser panels • Repair and seal all unnecessary openings and gaps in raised floor • Relocate building return air grilles to capture heat directly from racks • Monitor power use within the data center • Establish an energy use baseline (Power Usage Effectiveness = Total Facility Power /Power) • Establish a “Green IT” policy. Energy savings results from more efficient performance of CRAC units when cooling loads are more effectively applied, reduced space loads at lower operating temperatures, reduced lighting energy and elimination of supplemental spot coolers. Table 6.2-11 below summarizes the eight ECMs described above:
Table 6.2-11 Near-Term Actions (1 to 5 years) - Energy Conservation Measures (ECMs).
ECM No. ECM Description
Annual Electrical Savings (kWh)
Annual Fossil Fuel
Savings (MMBtu)
Annual Energy
Cost Savings
($)
Capital Cost ($)
GHG Reduction (MT CO2e)
Simple Payback
(yr)
1 Lighting Fixtures and Controls 2,300,000 0 $253,000 $3,000,000 856 11.9
2 Energy Metering and Monitoring 0 0 $ -- $500,000 0 n/a
3 Campus-wide DDC Building Automation System 2,400,000 37,500 $744,000 $7,000,000 3,115 9.4
4 Recommission Central Chiller Plant Controls 1,990,000 0 $219,000 $300,000 738 1.4
5 HVAC System Retrocommissioning (Compton-Goethals and Baskerville Halls)
123,000 450 $19,000 $150,000 72 7.9
6 Steam Trap Maintenance Program 0 17,000 $218,000 $150,000 1,008 0.7
7 Boiler Heat Recovery 0 1,600 $21,000 $250,000 95 12.1
8 Data Center Energy Improvements (NAC and Marshak) 333,000 0 $37,000 $150,000 124 4.1
Totals 7,146,000 56,550 $1,511,000 $11,500,000 6,008 7.6*
MMBtu = 1,000,000 Btu MTCO2e = Metric tons of CO2 equivalent emissions * average
The City College of New York (CCNY) – Campus Energy Assessment
Final: January 18, 2010 I:\Nys-Dorm.12145\44128.City-College-Cl\Docs\Reports\Energy Assessment\Report\Final Report\MASTER_CCNY EA Report Final 1_18_10.doc
69
6.3. Long-terms Actions (5 to 15 years) – Infrastructure Renewal
6.6.1. Approach to Long-term Actions Long-term greenhouse gas reduction plans take a visionary approach focused on driving long-term results. They are designed to approach capital programming proactively to align with strategic goals and the campus’s mission. Long-term energy conservation plans require a higher capital investment and they can generate excellent results that can be measured and maintained. Specific projects identified as potential long-term include major upgrades of existing buildings and applications of renewable energy technologies where appropriate. Long-term plans may include the following.
6.3.2. Upgrade Laboratory Fume Hoods (Steinman and Marshak) The laboratory fume hoods in Marshak and Steinman Halls have been investigated for energy savings by Genesys (2004, 2009) and AECOM (2009), respectively, as part of overall facility upgrade studies. Projects are underway in both buildings to address HVAC infrastructure improvements, energy performance, and laboratory fume hood operations. In Marshak, 184 laboratory fume hoods were retrofit with low-flow hood kits and eight high-entrainment strobic fans were installed. Additional proposed improvements at Marshak include the installation of eight makeup air units on the core bulkheads, general exhaust for laboratory spaces, DDC controls, four new central station variable volume air handling units, new VAV boxes with reheat coils, new chilled beam terminal units, heat exchangers for free cooling, system testing balancing and commissioning. New variable flow laboratory hoods are also being considered. Connecting Marshak to the campus HTHW piping system, eliminating the need for local boilers is also a possibility. In Steinman, there are 42 laboratory fume hoods that run at constant volume without existing controls. Eight constant volume hood exhaust fans operate continuously, regardless of hood use or sash position. Currently under review by CUNY and CCNY is an AECOM recommendation for new fume hood controls and exhaust fans to reduce unnecessary exhaust, which would be expected to result in heating and cooling energy savings.
6.3.3. NAC Facility Upgrades The age and condition of the HVAC systems in the NAC will require extensive repair or overall replacement in the near future. A full DDC system should be included as part of the renovation.
6.3.4. Replace Domestic Water Supply Pumping System (Marshak) The compressed air-assisted domestic water supply pumping system in Marshak is large, old, inefficient, and near the end of its useful life. The water pumps in the present system operate continuously at constant speed, and one pump was observed to have a significant leak in the discharge pipe. A new electrical booster pump system with VSDs and pressure controls would provide more uniform water delivery while reducing energy consumption. Marshak is 18 stories tall, and the water supply system must have adequate water pressure (assume 40 psig) to serve the domestic water needs of the 18th floor. This is presently accomplished through a system that consists of two large hydro-pneumatic storage tanks in the basement and multiple water pressure booster pumps that pump water from the municipal water supply into the tanks at a pressure of approximately 160 psig.
The City College of New York (CCNY) – Campus Energy Assessment
Final: January 18, 2010 I:\Nys-Dorm.12145\44128.City-College-Cl\Docs\Reports\Energy Assessment\Report\Final Report\MASTER_CCNY EA Report Final 1_18_10.doc
70
Assuming a student and faculty population of 2,200 (based on an average student population density for the campus) in the building, and an average daily water consumption rate of 50 gallons per day (based on the National Standard Plumbing Code, 2009) per occupant, the water consumption rate is estimated to be 110,000 gallons per day. This is equivalent to an average rate of 76 gallons per minute (gpm). The pressure requirements of the system are estimated as follows: Municipal water supply pressure: 75 pounds per square inch (psi) (assumed) Static head (18 floors): 270 feet = 117 psi Friction head: 14 feet = 6 psi Required head at 18th floor: 40 psig Pump discharge head: 163 psi = 377 ft. Pumping head: (163 psi – 75 psi) x 2.31 ft head/psi = 203 ft. The present system requires pumping energy to deliver water to the building along with compressed air to maintain static pressure on the system: Average pumping power (kW) = 100 x QH (.746) 3960 n Where: Q = average flow = 76 gpm H = pumping head = 203 ft. n = pump/motor efficiency = 65% Average pumping power (kW) = 100 x 76 x 203 x .746 = 4.47 kW 3960 x 65 Estimated compressed air energy: 10% diversity factor x 110,000 gallon/day x 10 compression factor = 14,700 cf/day 7.48 gallon/cf 14,700 = 10.2 scfm / 5 scfm/kW 24 x 60 Where: scfm = standard cubic feet per minute At 5 scfm/kW, 10.2 scfm = 2.0 kW Total base case energy = 4.47 + 2.0 = 6.47 kW Assume a variable speed booster pump package saves 40% of the pumping energy and 10% of the compressed air energy: Variable speed booster pumping energy = 60% x 4.47 = 2.7 kW Estimated annual electrical energy savings = (6.47 – 2.7) x 8760 hours/year = 33,025 kWh/year
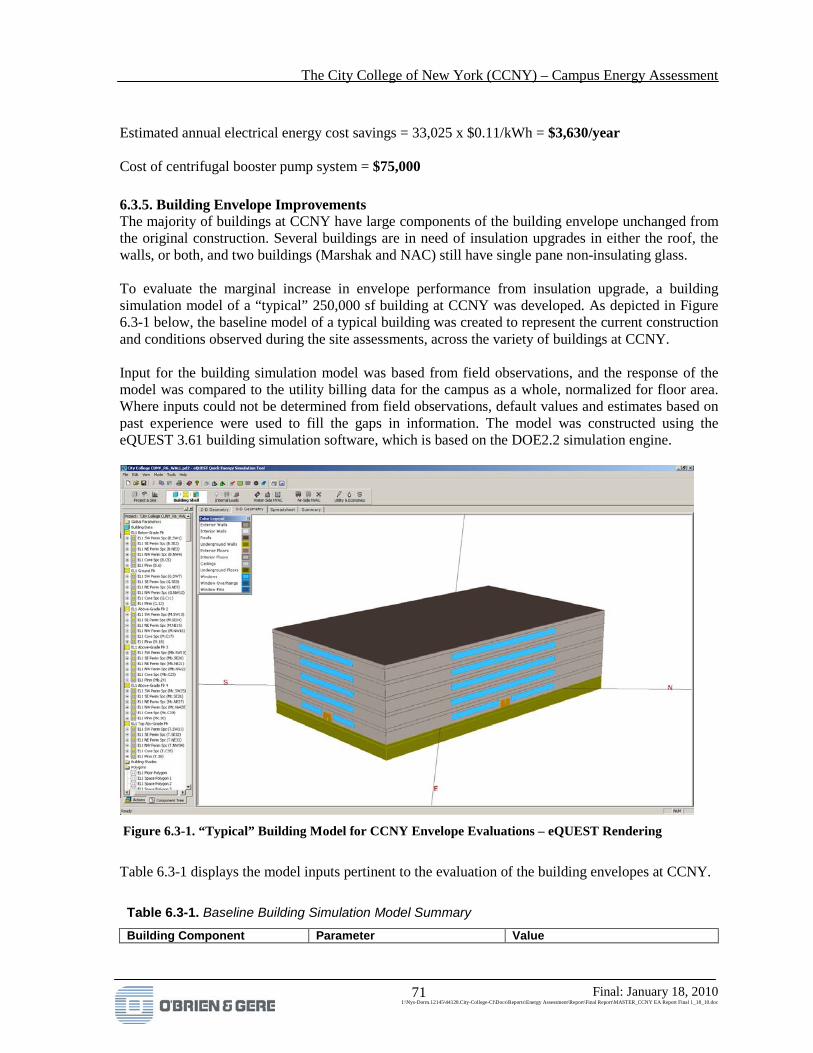
The City College of New York (CCNY) – Campus Energy Assessment
Final: January 18, 2010 I:\Nys-Dorm.12145\44128.City-College-Cl\Docs\Reports\Energy Assessment\Report\Final Report\MASTER_CCNY EA Report Final 1_18_10.doc
71
Estimated annual electrical energy cost savings = 33,025 x $0.11/kWh = $3,630/year Cost of centrifugal booster pump system = $75,000
6.3.5. Building Envelope Improvements The majority of buildings at CCNY have large components of the building envelope unchanged from the original construction. Several buildings are in need of insulation upgrades in either the roof, the walls, or both, and two buildings (Marshak and NAC) still have single pane non-insulating glass. To evaluate the marginal increase in envelope performance from insulation upgrade, a building simulation model of a “typical” 250,000 sf building at CCNY was developed. As depicted in Figure 6.3-1 below, the baseline model of a typical building was created to represent the current construction and conditions observed during the site assessments, across the variety of buildings at CCNY. Input for the building simulation model was based from field observations, and the response of the model was compared to the utility billing data for the campus as a whole, normalized for floor area. Where inputs could not be determined from field observations, default values and estimates based on past experience were used to fill the gaps in information. The model was constructed using the eQUEST 3.61 building simulation software, which is based on the DOE2.2 simulation engine.
Figure 6.3-1. “Typical” Building Model for CCNY Envelope Evaluations – eQUEST Rendering
Table 6.3-1 displays the model inputs pertinent to the evaluation of the building envelopes at CCNY.
Table 6.3-1. Baseline Building Simulation Model Summary Building Component Parameter Value

The City College of New York (CCNY) – Campus Energy Assessment
Final: January 18, 2010 I:\Nys-Dorm.12145\44128.City-College-Cl\Docs\Reports\Energy Assessment\Report\Final Report\MASTER_CCNY EA Report Final 1_18_10.doc
72
Table 6.3-1. Baseline Building Simulation Model Summary Building Component Parameter Value Geometry Floor Area
Orientation Number of Stories
250,194 sf NE 5 above ground
Walls Surface Area Construction U-value
55,166 sf U=0.076 Representative of : metal frame, R-13 batt, masonry exterior and masonry wall with air gap and 1-inch rock wool fill
Roofs Surface Area Construction U-value
41,670 sf U = 0.061 Representative of: metal frame, R-13 insulation between framing, built up roof or, batt insulation at attic floor with unconditioned attic and roof above.
Windows Glazing Fraction Surface Area Construction U-value
20% 9,826 sf metal frame operable, single pane, clear glass U=1.05
Infiltration Air-change method 0.11 SCFM/sf 2,992 SCFM total
HVAC Type Supply Air Flow Fresh Air Flow Heating Setpoint Cooling Setpoint
HW/CW VAV 287,514 SCFM (1.15 SCFM/sf) 42,435 SCFM (0.170 SCFM/sf) 15% OA fraction 72°F 74°F
Occupancy Total People 2,571 people (100 sf/person) Lighting Power Density Area Lighting Only 0.98 W/sf Equipment Power Density Misc Equipment
Cooking Equipment Office Equipment Self Contained Refrigeration Total of Internal Loads
0.3 W/sf 0.1 W/sf 0.3 W/sf 0.1 W/sf
0.8 W/sf Figure 6.3-2, Figure 6.3-3 and Figure 6.3-4 display the variation of floor area normalized electricity consumption, demand, and natural gas use with ambient temperature, and compare the model response to the overall trend for the aggregation of utility trends at the campus. Overall, the response of the model agrees with the trends observed at the campus. Variations between the campus and model trends are due to a mix of blending of the campus buildings into a single aggregate for comparison, and variations in the level of control (the model acts as a perfectly controlled system, and the campus acts in a somewhat uncontrolled manner due to operator interaction, and overall poor control from pneumatic systems).

The City College of New York (CCNY) – Campus Energy Assessment
Final: January 18, 2010 I:\Nys-Dorm.12145\44128.City-College-Cl\Docs\Reports\Energy Assessment\Report\Final Report\MASTER_CCNY EA Report Final 1_18_10.doc
73
Model Electricity Consumption Compared to Campus Electricity
-
0.50
1.00
1.50
2.00
2.50
20 30 40 50 60 70 80
Ambient Temperature (F)
Elec
trici
ty C
onsu
mpt
ion
(kW
h/SF
/mon
th)
Model Output
Campus Utility Bill
Figure 6.3-2. Comparing Normalized Electricity Consumption Model to Campus
Model Demand Compared to Campus Demand
-
1.00
2.00
3.00
4.00
5.00
6.00
20 30 40 50 60 70 80
Ambient Temperature (F)
Dem
and
(W/S
F/m
onth
)
Model Output
Campus Utility Bill.
Figure 6.3-3. Comparing Normalized Electricity Demand Model to Campus

The City College of New York (CCNY) – Campus Energy Assessment
Final: January 18, 2010 I:\Nys-Dorm.12145\44128.City-College-Cl\Docs\Reports\Energy Assessment\Report\Final Report\MASTER_CCNY EA Report Final 1_18_10.doc
74
Model Natural Gas Consumption Compared to Campus Natural Gas
-
0.02
0.04
0.06
0.08
0.10
0.12
0.14
0.16
20 30 40 50 60 70 80
Ambient Temperature (F)
Natu
ral G
as C
onsu
mpt
ion
(ther
m/S
F/m
onth
)
Model Output
Campus Utility Bill.
Figure 6.3-4. Comparing Normalized Natural Gas Consumption Model to Campus
Using the typical model as our baseline for comparison, several options for upgrading envelope components at CCNY were developed. The options investigated were: • Upgrade walls to R-19 batt insulation • Upgrade walls to R-6 rigid foam interior insulation • Upgrade walls to R-19 batt + R-6 rigid foam interior insulation • Upgrade roof by adding R-18 rigid foam exterior insulation applied either over framing, or at attic
floor. • Upgrade windows from single-pane clear without thermal break to double-pane low-e insulating
glass with thermal break • Reduction in infiltration by 50% due to weatherization • Rolled up impact of upgrading walls, roofs, windows, and weatherization to show interactive
impact. Table 6.3-2 displays the results of the different building envelope options analyzed. In general, the building envelope upgrades have a higher impact on natural gas use for heating than on cooling (energy and demand). Savings from insulation were a fractional percentage for energy, on the order of 1% to 1.5% for demand and natural gas. Upgrading windows had the largest incremental impact on energy, demand, and natural gas consumption. Reducing infiltration via weatherization provided savings similar to the lower level insulation upgrades. The combination of all measures indicated that for electricity savings, the aggregate result of all of the ECMs is not as great as the sum of the individual measures, but the natural gas data implied that the improvement from the ECMs was very near equal to the sum of the individual ECMs.
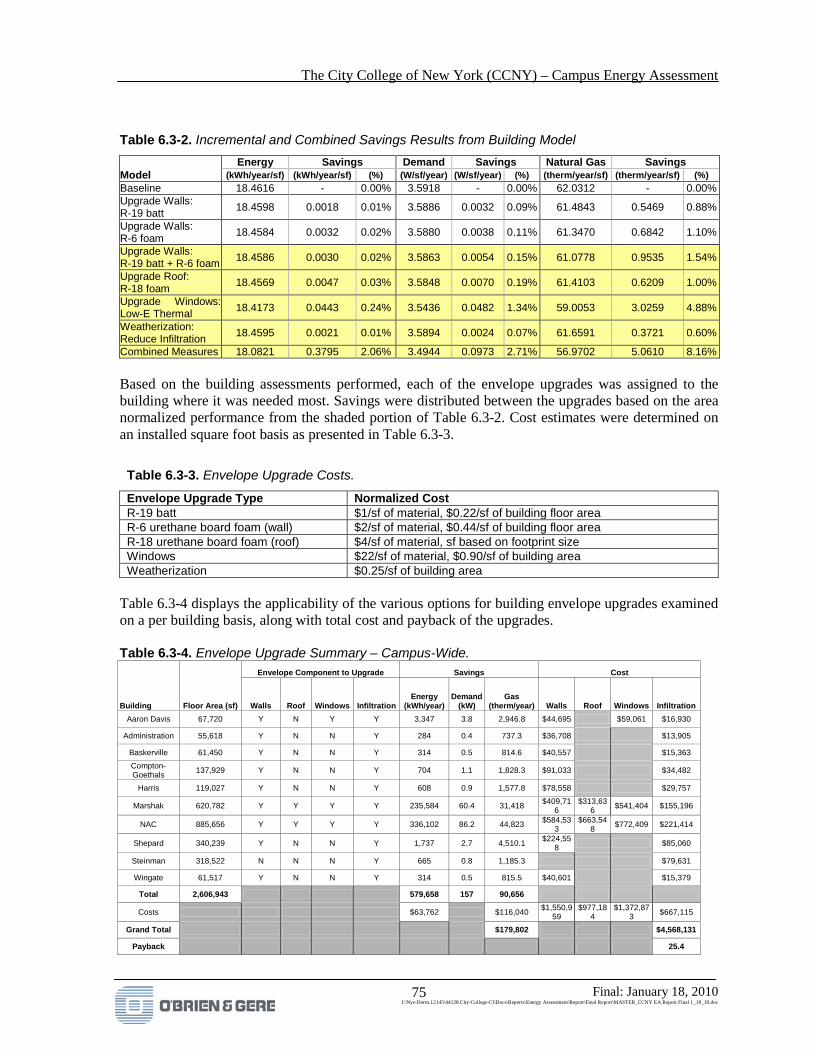
The City College of New York (CCNY) – Campus Energy Assessment
Final: January 18, 2010 I:\Nys-Dorm.12145\44128.City-College-Cl\Docs\Reports\Energy Assessment\Report\Final Report\MASTER_CCNY EA Report Final 1_18_10.doc
75
Table 6.3-2. Incremental and Combined Savings Results from Building Model Energy Savings Demand Savings Natural Gas Savings Model (kWh/year/sf) (kWh/year/sf) (%) (W/sf/year) (W/sf/year) (%) (therm/year/sf) (therm/year/sf) (%) Baseline 18.4616 - 0.00% 3.5918 - 0.00% 62.0312 - 0.00% Upgrade Walls: R-19 batt 18.4598 0.0018 0.01% 3.5886 0.0032 0.09% 61.4843 0.5469 0.88%
Upgrade Walls: R-6 foam 18.4584 0.0032 0.02% 3.5880 0.0038 0.11% 61.3470 0.6842 1.10%
Upgrade Walls: R-19 batt + R-6 foam 18.4586 0.0030 0.02% 3.5863 0.0054 0.15% 61.0778 0.9535 1.54%
Upgrade Roof: R-18 foam 18.4569 0.0047 0.03% 3.5848 0.0070 0.19% 61.4103 0.6209 1.00%
Upgrade Windows: Low-E Thermal 18.4173 0.0443 0.24% 3.5436 0.0482 1.34% 59.0053 3.0259 4.88%
Weatherization: Reduce Infiltration 18.4595 0.0021 0.01% 3.5894 0.0024 0.07% 61.6591 0.3721 0.60%
Combined Measures 18.0821 0.3795 2.06% 3.4944 0.0973 2.71% 56.9702 5.0610 8.16% Based on the building assessments performed, each of the envelope upgrades was assigned to the building where it was needed most. Savings were distributed between the upgrades based on the area normalized performance from the shaded portion of Table 6.3-2. Cost estimates were determined on an installed square foot basis as presented in Table 6.3-3.
Table 6.3-3. Envelope Upgrade Costs.
Envelope Upgrade Type Normalized Cost R-19 batt $1/sf of material, $0.22/sf of building floor area R-6 urethane board foam (wall) $2/sf of material, $0.44/sf of building floor area R-18 urethane board foam (roof) $4/sf of material, sf based on footprint size Windows $22/sf of material, $0.90/sf of building area Weatherization $0.25/sf of building area
Table 6.3-4 displays the applicability of the various options for building envelope upgrades examined on a per building basis, along with total cost and payback of the upgrades. Table 6.3-4. Envelope Upgrade Summary – Campus-Wide.
Envelope Component to Upgrade Savings Cost
Building Floor Area (sf) Walls Roof Windows Infiltration Energy
(kWh/year) Demand
(kW) Gas
(therm/year) Walls Roof Windows Infiltration Aaron Davis 67,720 Y N Y Y 3,347 3.8 2,946.8 $44,695 $59,061 $16,930
Administration 55,618 Y N N Y 284 0.4 737.3 $36,708 $13,905
Baskerville 61,450 Y N N Y 314 0.5 814.6 $40,557 $15,363 Compton-Goethals 137,929 Y N N Y 704 1.1 1,828.3 $91,033 $34,482
Harris 119,027 Y N N Y 608 0.9 1,577.8 $78,558 $29,757
Marshak 620,782 Y Y Y Y 235,584 60.4 31,418 $409,716
$313,636 $541,404 $155,196
NAC 885,656 Y Y Y Y 336,102 86.2 44,823 $584,533
$663,548 $772,409 $221,414
Shepard 340,239 Y N N Y 1,737 2.7 4,510.1 $224,558 $85,060
Steinman 318,522 N N N Y 665 0.8 1,185.3 $79,631
Wingate 61,517 Y N N Y 314 0.5 815.5 $40,601 $15,379
Total 2,606,943 579,658 157 90,656
Costs $63,762 $116,040 $1,550,959
$977,184
$1,372,873 $667,115
Grand Total $179,802 $4,568,131
Payback 25.4
The City College of New York (CCNY) – Campus Energy Assessment
Final: January 18, 2010 I:\Nys-Dorm.12145\44128.City-College-Cl\Docs\Reports\Energy Assessment\Report\Final Report\MASTER_CCNY EA Report Final 1_18_10.doc
76
By applying the appropriate envelope upgrades to each building, CCNY would save on the order of $179,800/year in energy savings. Total capital cost required to meet this savings level is over $4.5 million dollars, and the resulting payback on envelope upgrades is 25.4 years. The costs presented represent the incremental cost of energy efficient building upgrades, and do not represent the entire construction project cost associated with the ECM (such as the actual roof material and installation itself). Also, it is noted that savings are based on current control schemes and operation of the campus. Adding additional ECMs in the form of overall energy reduction (W/sf), or controls to provide energy saving operation such as setback and better variable speed AHU fan control (where possible) will extended the payback period on envelope upgrades, as the overall heating and cooling loads will be reduced.
6.3.6. Shepard Hall HVAC Renovation With the relocation of students and staff from Shepard Hall to the new Bernard and Anne Spitzer School of Architecture (SSA) Building, there is an opportunity to renovate the vacated space with a new HVAC system and controls to remedy the problems of poor space temperature control and energy-efficiency. There are several key elements that should be considered in any design to renovate this space. Primary energy concerns are: • Wide variance in occupancy and outside air ventilation requirements • Operable windows • Potentially varying occupancy types – computer labs, classrooms, offices, etc. • No chilled water in winter (use outdoor air economizer cycle) • Extreme summer diversity (little to no summer occupancy) • No existing building DDC. Primary comfort concerns are: • No available summer reheat • Potentially wide variance in occupancy resulting in a wide range of heating/cooling loads and
capacity needs • Potentially poor envelope (depending upon the scope of architectural renovations). Primary maintenance concerns are:
• Terminal equipment within occupied spaces do not receive proper maintenance or filter changes • Central equipment in mechanical rooms must have proper access for maintenance • Abandoned equipment within the building mechanical space should be removed. Because the building has had a window replacement in the last 15 years that utilized operable windows, it is important to develop systems that incorporate window use by occupants in the building operating scheme. Essentially, HVAC systems should automatically react when the windows are open, by zone. Additionally, the system should incorporate zone controls that do not require terminal reheat coils to control space temperature. An outdoor air economizer is considered essential for cost-
The City College of New York (CCNY) – Campus Energy Assessment
Final: January 18, 2010 I:\Nys-Dorm.12145\44128.City-College-Cl\Docs\Reports\Energy Assessment\Report\Final Report\MASTER_CCNY EA Report Final 1_18_10.doc
77
effective operation in a climate such as New York City with many days when the outside air is cooler than the inside design temperature and can be used in place of mechanical cooling. For the classroom and office areas, a central VAV system with perimeter hot water fin tube radiators and dedicated makeup air with heat recovery is recommended. Within the last 5 to 10 years, several innovations in controls and equipment have occurred to make this system more energy-efficient than VAV systems installed even a few years ago:
1. Energy Recovery Ventilators (ERVs) utilize equipment such as energy wheels, heat pipes, or heat other heat exchange technology, to retrieve energy from waste streams created by a need for ventilation.
2. Trane’s CDQ (Cool, Dry, Quiet) pre-treats air to significantly reduce humidity without reducing air temperature (as is done with a typical cooling coil). This technology eliminates the need for re-heat coils in the spaces while addressing the common issue of over-cooling and high humidity that results in VAV systems with no summer re-heat.
3. DCV measures indicators of air quality (most often CO2) to determine the need for outside air in any zone, and can then control the zone dampers in conjunction with the outside air damper position to minimize outside air and maximize energy savings.
4. Advancements in DDC (direct digital controls) can now monitor the position of operable windows and adjust the HVAC systems appropriately.
Additionally, a central VAV system addresses the building specific concerns associated with Shepard Hall and the CCNY campus:
1. Perimeter hot water baseboard radiation provides heat where it is needed (at the envelope) and, when controlled correctly, can be turned off as needed for any given zone. Additionally, because baseboard heating is designed for high durability, heavier gauge materials make this equipment applicable to the classroom spaces.
2. Eliminating perimeter fan coil units means no filter changes or maintenance within occupied spaces. Central equipment in properly sized mechanical rooms will greatly reduce the maintenance concerns currently associated this building, resulting in paybacks from energy efficiency and reduced O&M costs.
3. Centralized equipment can make use of mechanical rooms that are currently occupied by abandoned mechanical equipment, thereby increasing usable square footage and opening up area near windows.
4. There is a high turn-down available to accommodate the significantly reduced summer occupancy.
Spaces with year-round cooling loads, such as data centers and computer labs, should use dedicated cooling equipment to minimize the impact of high internal loads on the remainder of the building. It is especially important that systems that provide year-round cooling be provided with an economizer function. The cost of a VAV system with perimeter fin tube radiation will be higher in price than a building with strictly fan coils and a central exhaust/make-up air system, approximately $3 to $5 per square foot ($450,000-$750,000). The cost of additional controls to incorporate the operable windows will add another $1 per square foot (about $150,000). The cost for an energy recovery and dehumidification unit will cost less than $1 per square foot ($70,000 to $100,000). The total
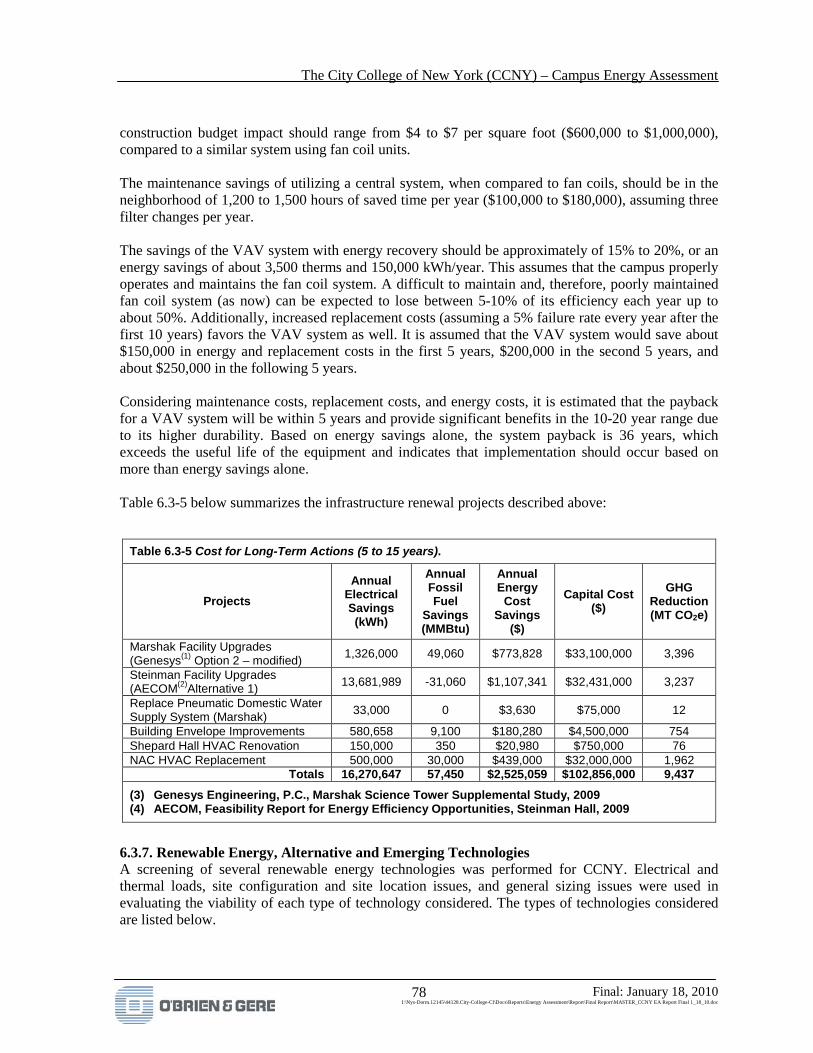
The City College of New York (CCNY) – Campus Energy Assessment
Final: January 18, 2010 I:\Nys-Dorm.12145\44128.City-College-Cl\Docs\Reports\Energy Assessment\Report\Final Report\MASTER_CCNY EA Report Final 1_18_10.doc
78
construction budget impact should range from $4 to $7 per square foot ($600,000 to $1,000,000), compared to a similar system using fan coil units. The maintenance savings of utilizing a central system, when compared to fan coils, should be in the neighborhood of 1,200 to 1,500 hours of saved time per year ($100,000 to $180,000), assuming three filter changes per year. The savings of the VAV system with energy recovery should be approximately of 15% to 20%, or an energy savings of about 3,500 therms and 150,000 kWh/year. This assumes that the campus properly operates and maintains the fan coil system. A difficult to maintain and, therefore, poorly maintained fan coil system (as now) can be expected to lose between 5-10% of its efficiency each year up to about 50%. Additionally, increased replacement costs (assuming a 5% failure rate every year after the first 10 years) favors the VAV system as well. It is assumed that the VAV system would save about $150,000 in energy and replacement costs in the first 5 years, $200,000 in the second 5 years, and about $250,000 in the following 5 years. Considering maintenance costs, replacement costs, and energy costs, it is estimated that the payback for a VAV system will be within 5 years and provide significant benefits in the 10-20 year range due to its higher durability. Based on energy savings alone, the system payback is 36 years, which exceeds the useful life of the equipment and indicates that implementation should occur based on more than energy savings alone. Table 6.3-5 below summarizes the infrastructure renewal projects described above:
6.3.7. Renewable Energy, Alternative and Emerging Technologies A screening of several renewable energy technologies was performed for CCNY. Electrical and thermal loads, site configuration and site location issues, and general sizing issues were used in evaluating the viability of each type of technology considered. The types of technologies considered are listed below.
Table 6.3-5 Cost for Long-Term Actions (5 to 15 years).
Projects Annual
Electrical Savings (kWh)
Annual Fossil Fuel
Savings (MMBtu)
Annual Energy
Cost Savings
($)
Capital Cost ($)
GHG Reduction (MT CO2e)
Marshak Facility Upgrades (Genesys(1) Option 2 – modified) 1,326,000 49,060 $773,828 $33,100,000 3,396
Steinman Facility Upgrades (AECOM(2)Alternative 1) 13,681,989 -31,060 $1,107,341 $32,431,000 3,237
Replace Pneumatic Domestic Water Supply System (Marshak) 33,000 0 $3,630 $75,000 12
Building Envelope Improvements 580,658 9,100 $180,280 $4,500,000 754 Shepard Hall HVAC Renovation 150,000 350 $20,980 $750,000 76 NAC HVAC Replacement 500,000 30,000 $439,000 $32,000,000 1,962
Totals 16,270,647 57,450 $2,525,059 $102,856,000 9,437
(3) Genesys Engineering, P.C., Marshak Science Tower Supplemental Study, 2009 (4) AECOM, Feasibility Report for Energy Efficiency Opportunities, Steinman Hall, 2009

The City College of New York (CCNY) – Campus Energy Assessment
Final: January 18, 2010 I:\Nys-Dorm.12145\44128.City-College-Cl\Docs\Reports\Energy Assessment\Report\Final Report\MASTER_CCNY EA Report Final 1_18_10.doc
79
Wind Power Wind turbines convert the kinetic energy in the wind into mechanical power. The mechanical power can be used for specific tasks (such as pumping water) or a generator can convert the mechanical power into electricity. The wind turns the blades, which spin a shaft, which connects to a generator and makes electricity. Modern wind turbines fall into two basic groups: the horizontal-axis style, and the vertical axis design (like the eggbeater-style Darrieus model). Horizontal-axis wind turbines typically either have two or three blades. Screening assessment: Due to limited open spaces at ground level, large building obstructions surrounding the campus and the need to elevate the turbines on towers to locate the turbines in free flowing air for maximum performance, electricity generation from wind was not considered feasibile. Photovoltaics Photovoltaic (PV) technology uses semiconductor materials such as silicon to convert sunlight directly into electricity. Solar cells are the basic building blocks of the complete system. To provide useful amounts of power, solar cells are wired together to create solar panels. The PV systems also require an inverter that converts the direct current (DC) electricity produced by the system into alternating current (AC) electricity. The amount of power that a PV panel will deliver is proportional to the amount of sunlight that falls on it. PV systems need to be located where there is an unobstructed view of the sky, typically facing south. The ideal location for PV system is on rooftops, eliminating the need to allocate campus space at ground level for these systems. They are modular, noiseless, and require little maintenance. Screening assessment: Limited space at ground level makes CCNY a viable location for rooftop PV arrays. PV also is a summer peaking generation source, which will allow CCNY to moderate a portion of its summertime peak demand. Reducing peak demand not only has beneficial cost implications, but helps to stabilize the local utility grid by reducing delivery stress on the system during the peak hours of electricity consumption, a critical concern in New York City. Monitoring of the building level electricity load for actual peak demand will be necessary during the design phase for the PV system, to determine that the system is sized to not export power back to the utility if required by the prevailing regulation and interconnection requirements. PV can be considered as a renewable resource for CCNY. Solar Water Heating Solar thermal water heating systems can provide hot water for commercial use. The solar system pre-heats the water to the maximum hot water supply temperature. They are normally operated as a supplementary system to the conventional heat source. There are three main types of solar collectors as described below:
• Unglazed flat plate: The collectors consist of tubes run within a uncovered dark surface.
• Glazed flat plate: The collectors consist of tubes run over a dark surface that are covered in glass or clear plastic.
• Evacuated tube: The collectors consist of tubes contain a fluid to be heating by the sun that are held under vacuum to prevent heat loss.
The City College of New York (CCNY) – Campus Energy Assessment
Final: January 18, 2010 I:\Nys-Dorm.12145\44128.City-College-Cl\Docs\Reports\Energy Assessment\Report\Final Report\MASTER_CCNY EA Report Final 1_18_10.doc
80
The unglazed flat plates are the least efficient and lowest cost, the glazed flat plate are more efficient with a higher cost, and the evacuated tube collectors are the most efficient collector, but are most expensive. Screening assessment: Solar hot water systems can be installed on rooftops, similar to the PV arrays. As a higher education facility, CCNY has a modest hot water load, on the order of 2 gallons/person/day, or at least 30,000 gallons/day. The drawback of solar hot water systems is the need for hot water storage, as the availability of the solar resource may not coincide with the water use profile. It is recommended that storage sized for at least 50% of the daily flow be installed to provide some time delay to the collection system. Also, if not properly designed, solar hot water systems can have excessive pumping power, which may offset a portion of the fuel savings from the hot water production with electricity consumption for pumps. Solar hot water for domestic water heating and for supplemental pool water heating in Marshak can be considered for CCNY as a renewable energy offset to fossil fuel heating sources. Combined Heat and Power Combined heat and power (CHP) is the sequential generation of electric and thermal energy from a common energy source. CHP systems recover heat that normally would be wasted when generating only electricity, and reduce fuel consumption that would otherwise be used to produce one or more of the following: steam, hot water, space and processing heating, desiccant dehumidification, or cooling. CHP offers advantages in efficiency and much lower air pollution than conventional technologies. In conventional conversion of fuel to electricity, over two thirds of the energy input is discarded as heat to the environment. By recovering this heat, CHP systems achieve efficiencies of 60% to 80%, an improvement over the average 33% efficiency of conventional fossil-fueled power plants. Higher efficiencies reduce air emissions, including carbon dioxide. Screening assessment: CHP systems operate most efficiently if a consistent thermal load is available to be displaced along with the electricity generation. The utility billing analysis indicated that CCNY is producing on the order of 5,300 lb/hour (or 5.5 MMBtu/h) of steam during the summer. For most efficient operation, the CHP system should be sized to meet this thermal load and, therefore, operate at full electrical capacity year round. Additional opportunity for increased CHP power production is available if the campus increases utilization of the steam turbine chillers during the summer months. CHP can be considered for CCNY as a renewable resource, but only if the prevailing economics based on the current and future electricity and natural gas rates, and purchasing decisions are found to be favorable. Biomass-Fired Boiler Biomass combustion facilities can burn many types of biomass fuel, including wood, agricultural residues, wood pulping liquor, municipal solid waste (MSW) and refuse-derived fuel. Combustion technologies convert biomass fuel into several forms of useful energy for commercial uses; hot air, hot water, steam, and electricity. Although burning biomass emits CO2, the carbon released will have been absorbed from the atmosphere during the growth period, thereby biomass is considered a carbon neutral fuel overall.
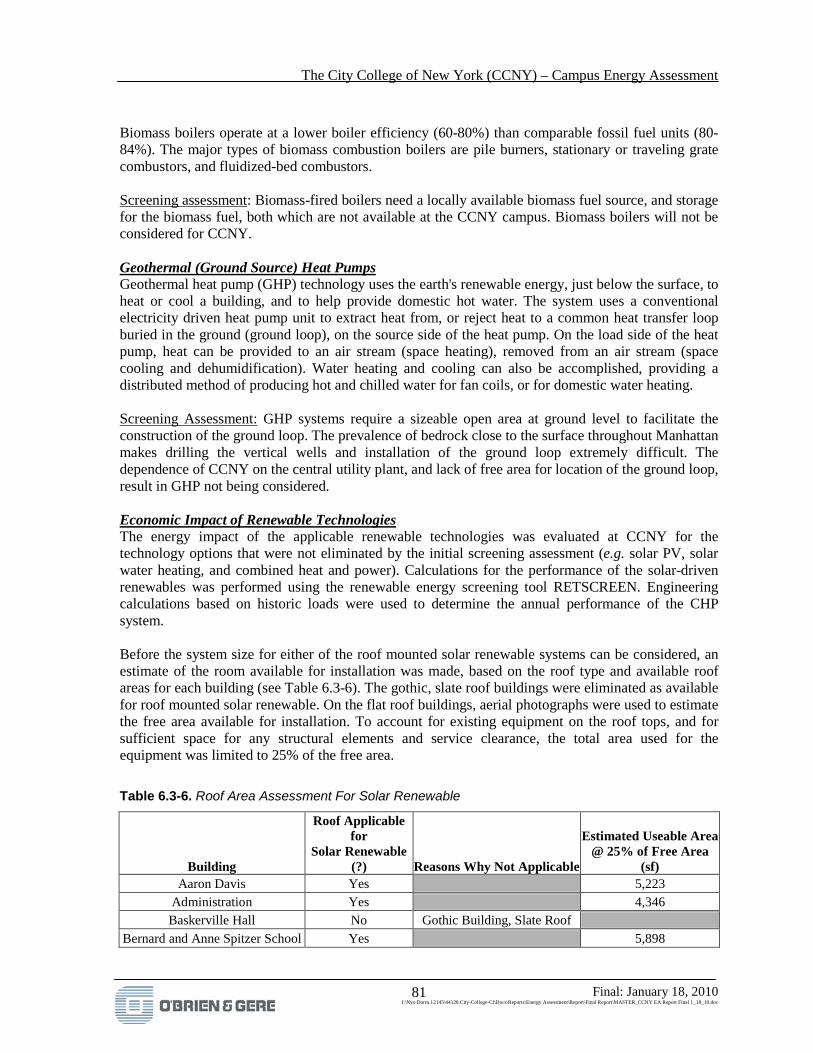
The City College of New York (CCNY) – Campus Energy Assessment
Final: January 18, 2010 I:\Nys-Dorm.12145\44128.City-College-Cl\Docs\Reports\Energy Assessment\Report\Final Report\MASTER_CCNY EA Report Final 1_18_10.doc
81
Biomass boilers operate at a lower boiler efficiency (60-80%) than comparable fossil fuel units (80-84%). The major types of biomass combustion boilers are pile burners, stationary or traveling grate combustors, and fluidized-bed combustors. Screening assessment: Biomass-fired boilers need a locally available biomass fuel source, and storage for the biomass fuel, both which are not available at the CCNY campus. Biomass boilers will not be considered for CCNY. Geothermal (Ground Source) Heat Pumps Geothermal heat pump (GHP) technology uses the earth's renewable energy, just below the surface, to heat or cool a building, and to help provide domestic hot water. The system uses a conventional electricity driven heat pump unit to extract heat from, or reject heat to a common heat transfer loop buried in the ground (ground loop), on the source side of the heat pump. On the load side of the heat pump, heat can be provided to an air stream (space heating), removed from an air stream (space cooling and dehumidification). Water heating and cooling can also be accomplished, providing a distributed method of producing hot and chilled water for fan coils, or for domestic water heating. Screening Assessment: GHP systems require a sizeable open area at ground level to facilitate the construction of the ground loop. The prevalence of bedrock close to the surface throughout Manhattan makes drilling the vertical wells and installation of the ground loop extremely difficult. The dependence of CCNY on the central utility plant, and lack of free area for location of the ground loop, result in GHP not being considered. Economic Impact of Renewable Technologies The energy impact of the applicable renewable technologies was evaluated at CCNY for the technology options that were not eliminated by the initial screening assessment (e.g. solar PV, solar water heating, and combined heat and power). Calculations for the performance of the solar-driven renewables was performed using the renewable energy screening tool RETSCREEN. Engineering calculations based on historic loads were used to determine the annual performance of the CHP system. Before the system size for either of the roof mounted solar renewable systems can be considered, an estimate of the room available for installation was made, based on the roof type and available roof areas for each building (see Table 6.3-6). The gothic, slate roof buildings were eliminated as available for roof mounted solar renewable. On the flat roof buildings, aerial photographs were used to estimate the free area available for installation. To account for existing equipment on the roof tops, and for sufficient space for any structural elements and service clearance, the total area used for the equipment was limited to 25% of the free area.
Table 6.3-6. Roof Area Assessment For Solar Renewable
Building
Roof Applicable for
Solar Renewable (?) Reasons Why Not Applicable
Estimated Useable Area @ 25% of Free Area
(sf) Aaron Davis Yes 5,223
Administration Yes 4,346 Baskerville Hall No Gothic Building, Slate Roof
Bernard and Anne Spitzer School Yes 5,898

The City College of New York (CCNY) – Campus Energy Assessment
Final: January 18, 2010 I:\Nys-Dorm.12145\44128.City-College-Cl\Docs\Reports\Energy Assessment\Report\Final Report\MASTER_CCNY EA Report Final 1_18_10.doc
82
Building
Roof Applicable for
Solar Renewable (?) Reasons Why Not Applicable
Estimated Useable Area @ 25% of Free Area
(sf) of Architecture
Compton-Goethals Hall No Gothic Building, Slate Roof Harris Hall No Gothic Building, Slate Roof
Marshak Science Building Yes 9,707 North Academic Center Yes 19,897
Schiff House Child Care Center No Insufficient Free Roof Area Shepard Hall No Gothic Building, Slate Roof
Steinman Hall No Gothic Building, Slate Roof Structural Biology Center Yes 4,080
Vivarium No Insufficient Free Roof Area Wingate Hall No Gothic Building, Slate Roof
Total 49,151 A total of 49,000 sf was estimated to be available for roof mounted solar renewable units. This area was used as the upper limit of installed array size when sizing the systems with RETSCREEN. The solar PV system was based on the GE Mono-SI-AP-110 array that has an 11.3% conversion efficiency (based on the DC power output). A total of 475 kW can be produced using 45,287 sf of collector area. The array is assumed to be tilted 42º from horizontal, facing south, with no obstructions. Based on an average installed cost of $8,000/kW, the cost of the PV system is $3.8 million. Annual electricity production from the PV array total 724,070 kWh/year, which is only 1.3% of the annual campus electricity consumption. Generation from PV results in $79,625, resulting in a 48 year payback period. The RETSCREEN output for the PV analysis is shown in Figure 6.3-5.
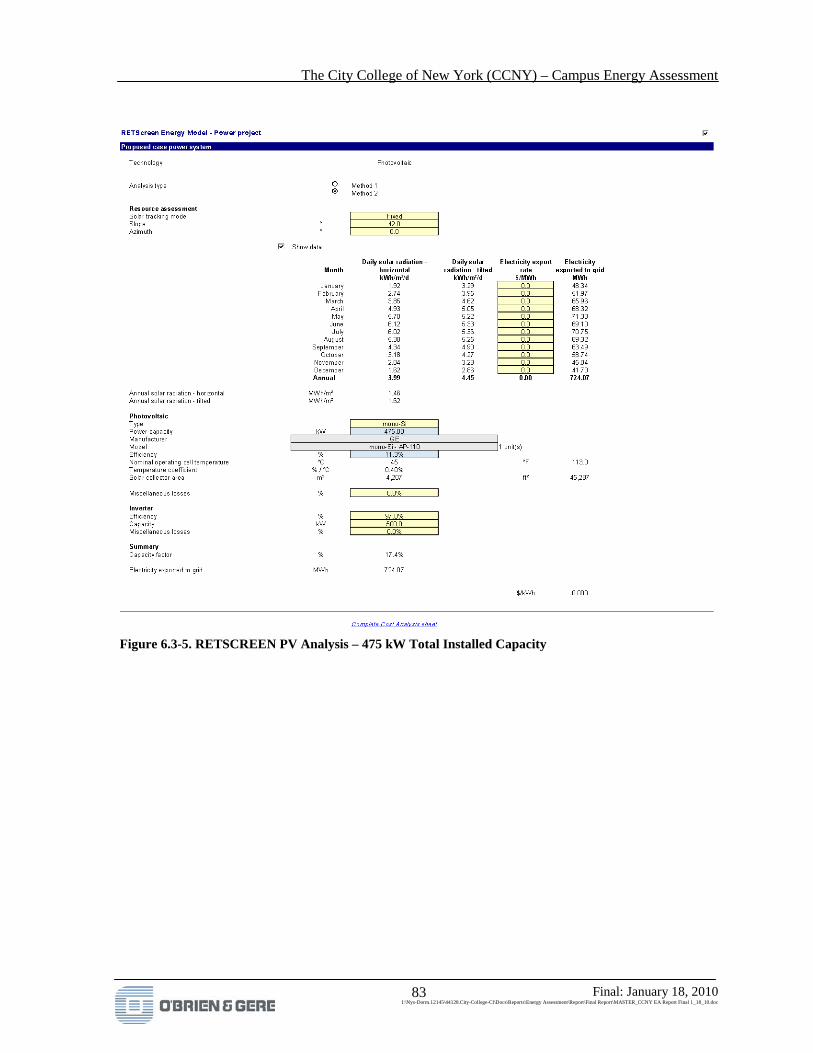
The City College of New York (CCNY) – Campus Energy Assessment
Final: January 18, 2010 I:\Nys-Dorm.12145\44128.City-College-Cl\Docs\Reports\Energy Assessment\Report\Final Report\MASTER_CCNY EA Report Final 1_18_10.doc
83
Figure 6.3-5. RETSCREEN PV Analysis – 475 kW Total Installed Capacity

The City College of New York (CCNY) – Campus Energy Assessment
Final: January 18, 2010 I:\Nys-Dorm.12145\44128.City-College-Cl\Docs\Reports\Energy Assessment\Report\Final Report\MASTER_CCNY EA Report Final 1_18_10.doc
84
The solar water heater system evaluated was based on a Sun-systems Synox 9000-si glazed solar collector. The gross area of each collector is about 20 sf, and up to 2,000 collectors will fit inside the allocated roof area, but sizing runs indicated that 1,700 units would be sufficient to fully meet the projected hot water load. RETSCREEN indicated that for the closest load profile to CCNY, 9,300 students4
4 187,000 sf floor area total for Structural Biology Center, School of Architecture, Marshak, Administration, NAC, and Aaron Davis at 200 sf/person = 9,352 total occupancy
consume about 17,000 gallons/day, or 1.8 gallon/day/person. The hot water load met by the solar hot water system was based on the estimated occupancy of the buildings where the collectors will be located, at 200 sf/person. Without the solar collector system, the campus was calculated to consume 30,003 therm/year for domestic water loads and, with the solar water heating system, natural gas dropped to 53 therm/year, as shown in Figure 6.3-6. This is a reduction of 29,950 therm/year with a cost savings of $37,437/year. The solar system will require a substantial amount of pumping energy, estimated at 3 W/sf of collector area. For the 35,000 sf combined collector system proposed, this equals 105 kW of pumping power, and an increase in 67,000 kWh/year or $7,370/year. These parasitic loads offset a portion of the gas savings, resulting in a net savings of $30,067/year. Glazed plate collector systems have an installed cost of $550/square meter ($51/sf). At this cost, the 35,000 sf collector system at CCNY has a cost of $1.82 million. Additional costs for storage tanks, and high rise plumbing, and tight installation quarters can add an additional $250,000 – bringing the total system cost to near $2 million, and a simple payback period of 66 years.

The City College of New York (CCNY) – Campus Energy Assessment
Final: January 18, 2010 I:\Nys-Dorm.12145\44128.City-College-Cl\Docs\Reports\Energy Assessment\Report\Final Report\MASTER_CCNY EA Report Final 1_18_10.doc
85
Figure 6.3-6. RETSCREEN Solar Thermal Analysis – 8.8 MBtu/hr, 35,000 sf Glazed Collector System
For the CHP system analysis, engineering calculations based on the monthly utility data for the CCNY campus were used to evaluate the annual savings and cost implications. The following is the basis of design for the CHP system analyzed: • Natural gas fired internal combustion engine generator • Steady State Generation Efficiency 28% higher heating value (HHV) • 1-MW gross electrical production • Ebullient cooling for direct 120 psig steam production @ 2.5 lb/kWh • Steady state CHP Efficiency 50% HHV.

The City College of New York (CCNY) – Campus Energy Assessment
Final: January 18, 2010 I:\Nys-Dorm.12145\44128.City-College-Cl\Docs\Reports\Energy Assessment\Report\Final Report\MASTER_CCNY EA Report Final 1_18_10.doc
86
The CHP system was operated in thermal load following, producing as much steam as possible to offset the baseload natural gas consumption at the campus. Table 6.3-7 displays the historic utility information used to establish the baseline for comparison.
Table 6.3-7. CCNY Combined Utility Expenditures Historic Combined Campus Utilities
Demand EnergyElectricity
CostAverage
RateNatural
GasSteam
LoadNatural Gas
CostAverage
RateMonth (kW) (kWh) ($) ($/kWh) (therms) (MLB) ($) ($/therm)Jul-07 10,221 5,326,122 709,442$ 0.133$ 20,511 1,563 31,488$ 1.54$
Aug-07 9,297 5,064,041 605,118$ 0.119$ 25,939 1,976 24,817$ 0.96$ Sep-07 9,059 5,599,848 665,183$ 0.119$ 141,324 10,768 107,750$ 0.76$ Oct-07 14,209 4,666,803 623,530$ 0.134$ 9,790 746 15,843$ 1.62$ Nov-07 14,356 4,249,800 407,611$ 0.096$ 184,533 14,060 217,381$ 1.18$ Dec-07 14,183 4,357,754 431,861$ 0.099$ 332,908 25,364 433,521$ 1.30$ Jan-08 7,594 4,319,506 368,432$ 0.085$ 278,613 21,228 390,546$ 1.40$ Feb-08 7,784 4,326,950 411,202$ 0.095$ 316,982 24,151 442,342$ 1.40$ Mar-08 7,509 4,074,584 379,965$ 0.093$ 259,152 19,745 349,497$ 1.35$ Apr-08 7,306 3,931,494 343,661$ 0.087$ 104,635 7,972 139,643$ 1.33$
May-08 8,421 4,203,936 420,397$ 0.100$ 17,104 1,303 430$ 0.03$ Jun-08 10,019 5,141,840 710,772$ 0.138$ 8,656 660 21,656$ 2.50$
Total 14,356 55,262,678 6,077,174$ 0.110$ 1,700,147 1,700,147 2,174,914$ 1.28$ Cost 8,252,088$
Note: Steam Load (MLB) = 1,000 pounds of steam at 120 psig The 1 MW CHP system can eliminate natural gas consumption from the boilers for four months of the year, and reduce electricity consumption of the campus by 8.6 million kWh. The CHP system operates at an annual efficiency of 47% HHV. Due to the relatively high cost of natural gas compared to electricity at the site, the annual cost savings of the CHP are at best neutral, with the current calculations indicating a loss of nearly $86,000/year from operation of the system, as displayed in Table 6.3-8.
Table 6.3-8. CHP System Operation and Impact
Steam Energy Demand Gas Steam Energy Demand Gas Steam Energy Demand GasMonth (Mlb) (kWh) (kW) (therm) (Mlb) (kWh) (kW) (therm) (Mlb) (kWh) (kW) (therm)
Jul-07 1,800 720,000 1,000 87,763 1,563 720,000 1,000 87,763 - 4,606,122 9,221 - Aug-07 1,800 720,000 1,000 87,763 1,800 720,000 1,000 87,763 176 4,344,041 8,297 2,314 Sep-07 1,800 720,000 1,000 87,763 1,800 720,000 1,000 87,763 8,968 4,879,848 8,059 117,699 Oct-07 1,800 720,000 1,000 87,763 746 720,000 1,000 87,763 - 3,946,803 13,209 - Nov-07 1,800 720,000 1,000 87,763 1,800 720,000 1,000 87,763 12,260 3,529,800 13,356 160,908 Dec-07 1,800 720,000 1,000 87,763 1,800 720,000 1,000 87,763 23,564 3,637,754 13,183 309,283 Jan-08 1,800 720,000 1,000 87,763 1,800 720,000 1,000 87,763 19,428 3,599,506 6,594 254,988 Feb-08 1,800 720,000 1,000 87,763 1,800 720,000 1,000 87,763 22,351 3,606,950 6,784 293,357 Mar-08 1,800 720,000 1,000 87,763 1,800 720,000 1,000 87,763 17,945 3,354,584 6,509 235,527 Apr-08 1,800 720,000 1,000 87,763 1,800 720,000 1,000 87,763 6,172 3,211,494 6,306 81,010
May-08 1,800 720,000 1,000 87,763 1,303 720,000 1,000 87,763 - 3,483,936 7,421 - Jun-08 1,800 720,000 1,000 87,763 660 720,000 1,000 87,763 - 4,421,840 9,019 -
Total 21,600 8,640,000 1,000 1,053,154 18,671 8,640,000 1,000 1,053,154 110,864 46,622,678 13,356 1,455,086 Cost 1,348,037$ 5,128,495$ 1,862,510$ Combined Efficency 50% 47%Net Savings (86,954)$
CHP System Performance With Load Following Campus Performance With CHP OperatingCHP System Performance Without Load Following
Budget costs for CHP systems are on the order of $5,000/kW, so the 1 MW system analyzed is on the order of $5 million installed. Savings are highly dependent on variations in the utility rates applied to the CHP system. A $0.05/therm change in the average cost of natural gas for the CHP system down to $1.23/therm has nearly a $125,000/year impact on the level of savings, and moves the economics to $40,000/year energy savings. Sensitivity of CHP savings to natural gas cost/therm is shown in Table 6.3-9.

The City College of New York (CCNY) – Campus Energy Assessment
Final: January 18, 2010 I:\Nys-Dorm.12145\44128.City-College-Cl\Docs\Reports\Energy Assessment\Report\Final Report\MASTER_CCNY EA Report Final 1_18_10.doc
87
Table 6.3-9. Sensitivity of CHP savings to Natural Gas Cost with Electricity at $0.11/kWh
Cost of Natural Gas ($/therm)
Annual CHP Savings from 1 MW System at CCNY ($)
$1.00 $615,353
$1.10 $364,529
$1.20 $113,705
$1.23 $38,458
$1.28 $(86,954)
$1.30 $(137,119) CHP systems receive a dedicated natural gas service and corresponding natural gas rate. The electric rate of the building where the CHP system is located (for CCNY this is the NAC) also would be impacted. The NAC would be converted over to a standby tariff and pay contract and as-used demand charges (to cover any events where the CHP system was not operating). Given the purchasing issues with developing a gas procurement contract that results in long term positive cash flow from the CHP system, which is difficult given the low electricity rates available to CCNY through New York Power Authority (NYPA), installing a CHP system is not recommended at this time. Emerging Technologies – LED Lighting LED or Solid State Lighting Systems represent the “cutting edge” of lighting technologies. LEDs have been efficient and long lasting as indicator lights in electronics for years, but using LEDs to create stable white light for general lighting presents new challenges. As an emerging technology, there are a wide variety of suppliers of commercial LED lighting attempting to be the “first to market,” resulting in a number of unknown or unproven products available. Reflecting this current state of the market are the positions of incentive program administrators such as the New York State Energy Research and Development Authority (NYSERDA), which will only provide incentives for LED fixtures that are currently listed with the USEPA/DOE’s ENERGY STAR program. The listed ENERGY STAR fixtures currently cover recessed canister style lighting, and not 2’x2’ or 2’x4’ troffer lighting typically found in commercial spaces and prevalent across the CCNY campus. Current Cost Economics of ENERGY STAR Rated LED Fixtures The economics of retrofitting existing lighting with an ENERGY STAR approved LED fixture was examined. The LED fixture considered was a Cooper Lighting HALO LED recessed canister downlight, and was compared to a comparable compact fluorescent fixture (see Figure 6.3-7). Given the high replacement cost of the LED modules (at present day costs), these LED lamps are not cost effective given a 15 year fixture life.
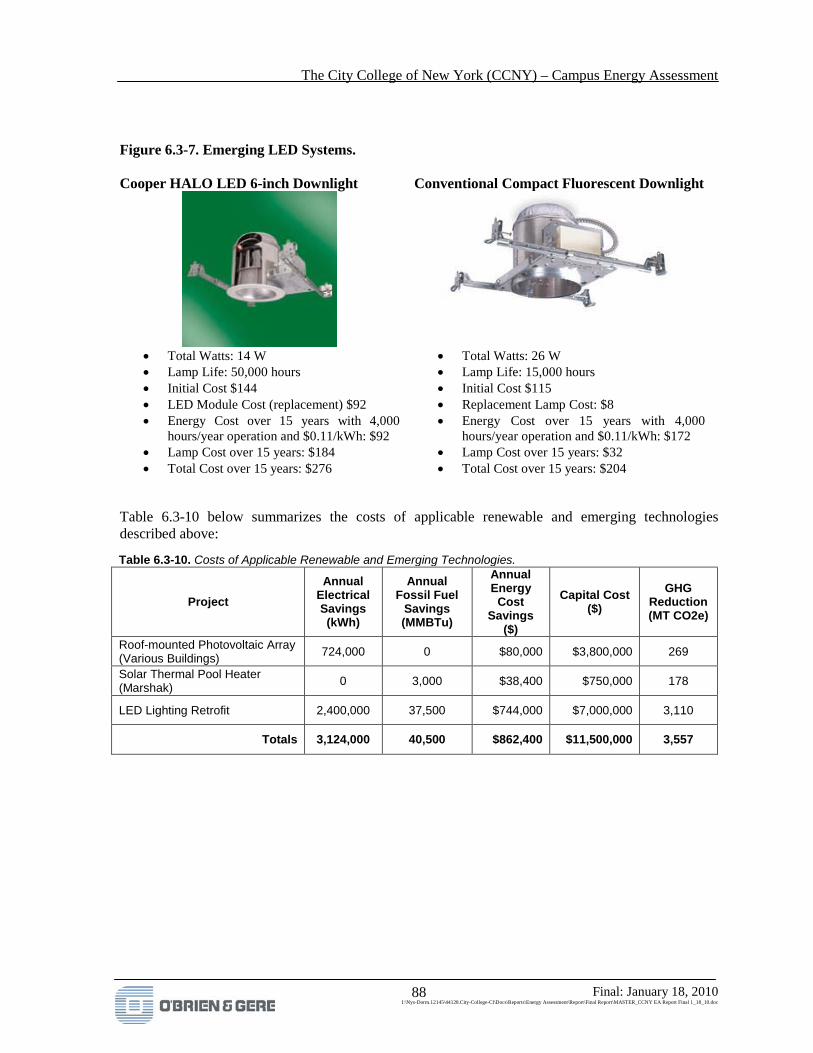
The City College of New York (CCNY) – Campus Energy Assessment
Final: January 18, 2010 I:\Nys-Dorm.12145\44128.City-College-Cl\Docs\Reports\Energy Assessment\Report\Final Report\MASTER_CCNY EA Report Final 1_18_10.doc
88
Figure 6.3-7. Emerging LED Systems.
Cooper HALO LED 6-inch Downlight
Conventional Compact Fluorescent Downlight
• Total Watts: 14 W • Lamp Life: 50,000 hours • Initial Cost $144 • LED Module Cost (replacement) $92 • Energy Cost over 15 years with 4,000
hours/year operation and $0.11/kWh: $92 • Lamp Cost over 15 years: $184 • Total Cost over 15 years: $276
• Total Watts: 26 W • Lamp Life: 15,000 hours • Initial Cost $115 • Replacement Lamp Cost: $8 • Energy Cost over 15 years with 4,000
hours/year operation and $0.11/kWh: $172 • Lamp Cost over 15 years: $32 • Total Cost over 15 years: $204
Table 6.3-10 below summarizes the costs of applicable renewable and emerging technologies described above:
Table 6.3-10. Costs of Applicable Renewable and Emerging Technologies.
Project Annual
Electrical Savings (kWh)
Annual Fossil Fuel
Savings (MMBTu)
Annual Energy
Cost Savings
($)
Capital Cost ($)
GHG Reduction (MT CO2e)
Roof-mounted Photovoltaic Array (Various Buildings) 724,000 0 $80,000 $3,800,000 269
Solar Thermal Pool Heater (Marshak) 0 3,000 $38,400 $750,000 178
LED Lighting Retrofit 2,400,000 37,500 $744,000 $7,000,000 3,110
Totals 3,124,000 40,500 $862,400 $11,500,000 3,557

The City College of New York (CCNY) – Campus Energy Assessment
Final: January 18, 2010 I:\Nys-Dorm.12145\44128.City-College-Cl\Docs\Reports\Energy Assessment\Report\Final Report\MASTER_CCNY EA Report Final 1_18_10.doc
89
7. References
38th Annual Maintenance and Operations Cost Study for Colleges, American School and University Magazine, Penton Media Inc., April 1, 2009.
ASHRAE 62 Ventilation for Acceptable Indoor Air Quality American College and University Presidents’ Climate Commitment (ACUPCC). 2007. Implementation Guide: Information and Resources for Participating Institutions. (Available at: http://www.presidentsclimatecommitment.org/). Association for the Advancement of Sustainability in Higher Education (AASHE). Climate Planning
for Campuses: A How to Guide (available at: http://www.aashe.org) Benchmarks, International Facility Management Association, Houston, TX: Published periodically. BOMA Experience Exchange Report, Building Owners and Managers Association International,
Washington, DC: Published annually. Building Condition Assessment for City College – Harris Hall North and South Wings, Stone and
Webster Engineering Corporation (1995) Building Condition Assessment for City College – North Campus Tunnels, Stone and Webster
Engineering Corporation (1995) Building Condition Assessment for City College – Administration Building, Stone and Webster
Engineering Corporation (1995) Building Condition Assessment for City College – North Academic Building (volume 1 and 2), Stone
and Webster Engineering Corporation (1993) Building Condition Assessment for City College – Aaron Davis Hall, Stone and Webster Engineering
Corporation (1995) Comparative Costs and Staffing Report for Colleges and Universities, The Association of Higher
Education Facility Officers, APPA, Alexandria, VA: Published every two years. Campus-Wide Condition Assessment Summation of Buildings, Site, and Utilities for City College,
Stone and Webster Engineering Corporation (1996) Computerized Facility Integration, L.L.C. (CFI) (available at
http://www.gocfi.com/archibus/archibus-building.htm) CCNY Strategic Plan for the First Decade of the 21st Century CCNY Green Website (Available at http://www1.ccny.cuny.edu/facdltystaff/ccnygreen/about.cfm)

The City College of New York (CCNY) – Campus Energy Assessment
Final: January 18, 2010 I:\Nys-Dorm.12145\44128.City-College-Cl\Docs\Reports\Energy Assessment\Report\Final Report\MASTER_CCNY EA Report Final 1_18_10.doc
90
City College of New York, Marshak Science Building, Master Plan Study, DASNY Project No. 95749, Genesys Engineering, P.C., (2004)
DASNY Energy Performance Program (EPP), Marshak Science Tower Supplemental Study, City
College of New York, Genesys Engineering, P.C., (December 2009) Feasibility Report for Energy Efficiency Opportunities, City College of New York, Steinman Hall,
AECOM, (August 2009) Facility Managers Round Table (FMRT), FM Benchmarking, FMLink Group, LLC, P.O. Box 59557,
Potomac, MD 20859-9557: Online benchmarking tool. FM Link, Facilities Management, Surveys (available at www.fmlink.com) Mather, Darryl. 2005. The Maintenance Scorecard. Industrial Press, New York, NY. PlaNYC: A Greener, Greater New York. April 22, 2007. (Available at:
http://www.nyc.gov/html/planyc2030/html/home/home.shtml) State of New York Executive Chamber. 2007. Executive Order No. 111: Directing State Agencies to
be More Energy Efficient and Environmentally Aware. (Available at: http://www.nyserda.org/Programs/exorder111.asp).
World Resources Institute and World Business Council for Sustainable Development
(WRI/WBCSD). 2004. The Greenhouse Gas Protocol: A Corporate Accounting and Reporting Standard. (Available at: http://www.ghgprotocol.org).

APPENDIX A
CCNY Campus Map

APPENDIX B
Building Assessments
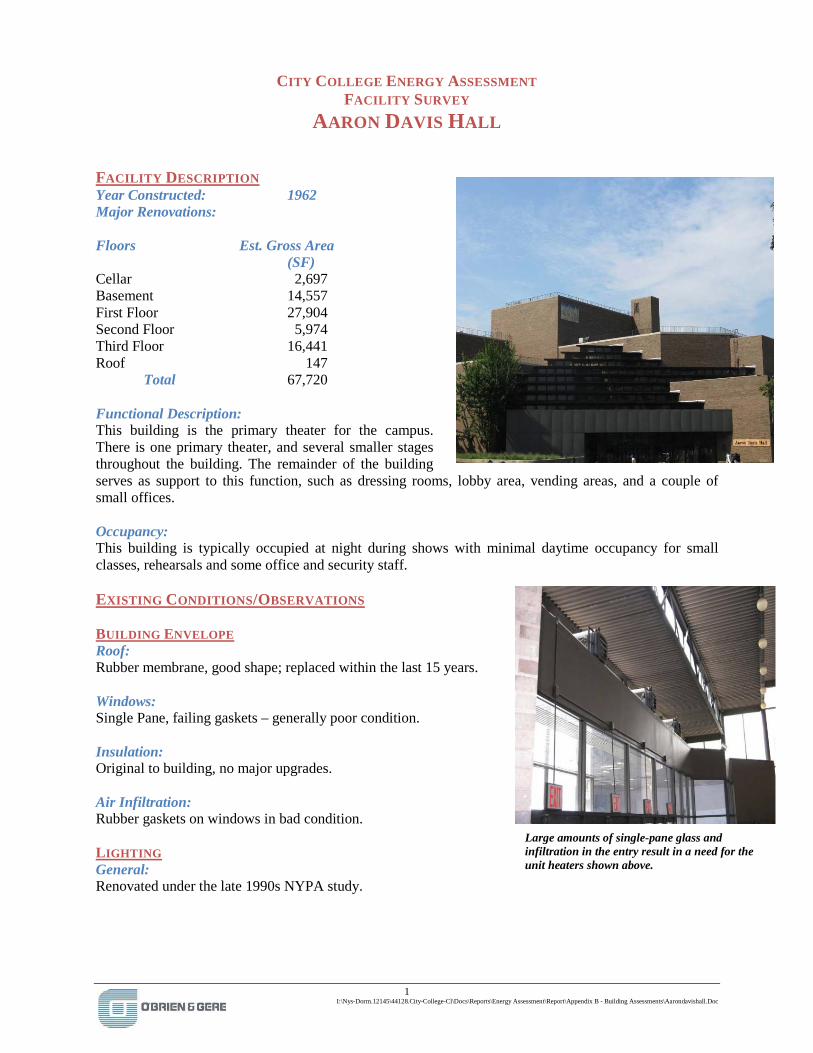
1 I:\Nys-Dorm.12145\44128.City-College-Cl\Docs\Reports\Energy Assessment\Report\Appendix B - Building Assessments\Aarondavishall.Doc
CITY COLLEGE ENERGY ASSESSMENT FACILITY SURVEY
AARON DAVIS HALL
Year Constructed: 1962 FACILITY DESCRIPTION
Major Renovations: Floors Est. Gross Area (SF) Cellar 2,697 Basement 14,557 First Floor 27,904 Second Floor 5,974 Third Floor 16,441 Roof 147
Total 67,720 Functional Description: This building is the primary theater for the campus. There is one primary theater, and several smaller stages throughout the building. The remainder of the building serves as support to this function, such as dressing rooms, lobby area, vending areas, and a couple of small offices. Occupancy: This building is typically occupied at night during shows with minimal daytime occupancy for small classes, rehearsals and some office and security staff.
EXISTING CONDITIONS/OBSERVATIONS
Roof: BUILDING ENVELOPE
Rubber membrane, good shape; replaced within the last 15 years. Windows: Single Pane, failing gaskets – generally poor condition. Insulation: Original to building, no major upgrades. Air Infiltration: Rubber gaskets on windows in bad condition.
General: Renovated under the late 1990s NYPA study.
LIGHTING
Large amounts of single-pane glass and infiltration in the entry result in a need for the unit heaters shown above.

2 I:\Nys-Dorm.12145\44128.City-College-Cl\Docs\Reports\Energy Assessment\Report\Appendix B - Building Assessments\Aarondavishall.Doc
Lighting Fixture Types: Corridor lighting includes 3 bulb, 17 watt T8 lighting. Rooms in the cellar level have 24” x 48” 3 bulb, T8 lighting. The building also has a significant amount of inefficient incandescent lighting. The majority of rooms have fluorescent coupled with incandescent fixtures. In common areas, incandescent lighting was found as well. Lighting Control Opportunities (day lighting, occupancy, scheduling): The entrance hall could be on daylight sensors. This area has a high level of window exposure and is well lit due to sunlight. Occupancy sensors were found, but most rooms had manual switches. This provides opportunity for occupancy sensors in areas where there are none. Night Survey: Common area lighting was on during the night survey. HVAC General: Based on the condition of the equipment, there may be an HVAC retrofit opportunity for this building. Air Handling Units: In the Cellar mechanical room, AC-1 & R-1 were present. The units were functioning, but were observed to need replacement due to current conditions. In the Roof mechanical room, AC-3, AC-4, AC-5 and AC-6 were present. AC-3 and AC-5 both appeared to have had the cooling coils replaced. These air handlers also had hot water supply leaks before the heating coil. AC-6 was observed to have a leak in the heater coil. Air handler return air temperatures (degrees F): AC-1 – 71.4 AC-2 – 62.5 AC-3 – 54.9 AC-4 – 61.2 AC-5 – 62.4 AC-6 – 70.7 AC-8 – 68.0 The air returning from the rooms was typically well below 70 degrees F, and even below 55 degrees F in one situation, indicating extreme overcooling of the spaces. In further conversations with the maintenance staff, it was discovered that this overcooling was due to the construction of the Bernard and Anne Spitzer School of Architecture building. This is a temporary condition that is expected to be rectified once construction activities are completed. Reheat coils: There is minimal reheat capability in this building, due to minimal zoning and wide-open areas. Outside Air Economizers: Most of the control dampers for the air handling units are broken or malfunctioning. Any economizing that is performed is performed manually. Window A/C units: None in this building.

3 I:\Nys-Dorm.12145\44128.City-College-Cl\Docs\Reports\Energy Assessment\Report\Appendix B - Building Assessments\Aarondavishall.Doc
TEMPERATURE CONTROL Comfort Issues: On the day the building was assessed, the building’s air was observed to be very cold on what was a reasonable low temperature day. The security staff indicated that the entire building was always “cold.” DDC vs. Analog: Mostly malfunctioning pneumatic controls. Compressors running nearly constantly. Nearly all of the AHUs have control and damper issues. Temperature setback/occupancy schedules: Despite this building being partially occupied during peak cooling hours, there are no apparent set-back controls to manipulate temperatures in large unoccupied areas. PLUMBING/DOMESTIC WATER Water-saving fixtures: Fixtures are original to the building. Water heaters: No information. MOTORS, FANS AND PUMPS Fans: Numerous return fans in the roof mechanical space were observed to have missing belts along with exposed drive units with no safety covers. Pumps: Several coil pumps were pulled apart and being serviced at the time of the survey. PLUG LOADS/MISCELLANEOUS Computers: Computers can be put on smart strips in main office. Space Heaters: None found. Vending Machines: Several in the basement level (5-6). Miscellaneous: Laundry room has washer and dryer (Kenmore, timed). Costume shop has washer and dryer, 1 humidifier (set to 40), a refrigerator and a microwave. “Green room” has large refrigerator. GENERAL OBSERVATIONS The building has a significant amount of incandescent lighting. Light upgrades present an ECM opportunity. The window exposure presents an opportunity to upgrade to dual pane with thermal barrier. Condition of weather stripping and gasket material appears to be very poor allowing for air infiltration. On the roof, an air intake duct cover was observed to be removed, allowing inclement weather to impact the ductwork.

4 I:\Nys-Dorm.12145\44128.City-College-Cl\Docs\Reports\Energy Assessment\Report\Appendix B - Building Assessments\Aarondavishall.Doc
Leaks: Mechanical Equipment Room (MER) on roof has many piping leaks. Other: Self-contained, hot-water unit heaters above lobby area. Health and Safety Issues: Uncovered air intake duct on roof; missing belt guards; leaking hot water piping.
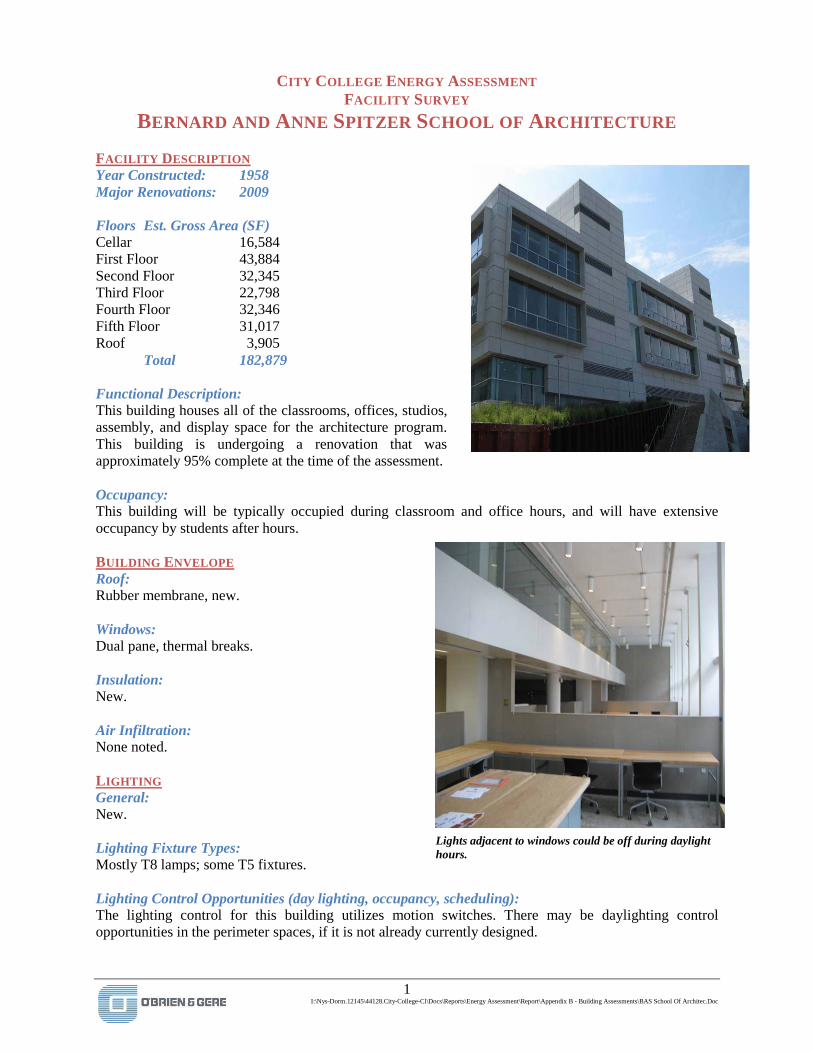
1 I:\Nys-Dorm.12145\44128.City-College-Cl\Docs\Reports\Energy Assessment\Report\Appendix B - Building Assessments\BAS School Of Architec.Doc
CITY COLLEGE ENERGY ASSESSMENT FACILITY SURVEY
BERNARD AND ANNE SPITZER SCHOOL OF ARCHITECTURE
Year Constructed: 1958 FACILITY DESCRIPTION
Major Renovations: 2009 Floors Est. Gross Area (SF) Cellar 16,584 First Floor 43,884 Second Floor 32,345 Third Floor 22,798 Fourth Floor 32,346 Fifth Floor 31,017 Roof 3,905
Total 182,879 Functional Description: This building houses all of the classrooms, offices, studios, assembly, and display space for the architecture program. This building is undergoing a renovation that was approximately 95% complete at the time of the assessment. Occupancy: This building will be typically occupied during classroom and office hours, and will have extensive occupancy by students after hours.
Roof: BUILDING ENVELOPE
Rubber membrane, new. Windows: Dual pane, thermal breaks. Insulation: New. Air Infiltration: None noted.
General: LIGHTING
New. Lighting Fixture Types: Mostly T8 lamps; some T5 fixtures. Lighting Control Opportunities (day lighting, occupancy, scheduling): The lighting control for this building utilizes motion switches. There may be daylighting control opportunities in the perimeter spaces, if it is not already currently designed.
Lights adjacent to windows could be off during daylight hours.

2 I:\Nys-Dorm.12145\44128.City-College-Cl\Docs\Reports\Energy Assessment\Report\Appendix B - Building Assessments\BAS School Of Architec.Doc
Night Survey: Not applicable HVAC General: Serviceability of equipment is a concern. Several of the air handlers are in mechanical rooms with less than 8-foot tall ceilings, which is then shortened by ductwork. Units in the penthouses are accessed by ladder, making it very difficult to transport the proper tools or filters for maintenance. Air Handling Units: New Carrier air handling units have been provided throughout the building. Fan coil units: There are dozens of fan coil units throughout the building and can be very difficult to maintain. Reheat coils: Not applicable. Outside Air Economizers: The new air handlers should be utilizing outside air economizers per the energy code. TEMPERATURE CONTROL Comfort Issues: Improper placement of thermostats (such as behind a bookshelf) may cause comfort issues in these new spaces. DDC vs. Analog: The controls for this building are DDC. It is unknown whether they will be monitored at the main plant. Temperature Setback/Occupancy Schedules: Setback schedules are anticipated for this building. PLUMBING/DOMESTIC WATER: Water-saving fixtures: Fixtures are new. Water heaters: Were not installed at the time of inspection. GENERAL OBSERVATIONS: An aggressive maintenance plan is recommended for this building. The facilities staff is anticipating maintenance issues due to lack of access. Other: Not applicable. Health and Safety Issues: Recommendation to consider the number of people needed to perform maintenance in this building because of limited access and potential hazards similar to confined spaces. Maintenance on the fan coils may need to be performed by two people due to the weight of the covers.

3 I:\Nys-Dorm.12145\44128.City-College-Cl\Docs\Reports\Energy Assessment\Report\Appendix B - Building Assessments\BAS School Of Architec.Doc
The penthouse mechanical rooms should be reviewed to provide proper access. In some cases doors open to 5 to 8 foot drops. It appears that personnel have jumped from certain doorways onto ductwork in order to get into some of these spaces. It is recommended that these spaces be reviewed for definition as OSHA confined spaces, or applicability of OSHA regulations for worker safety.
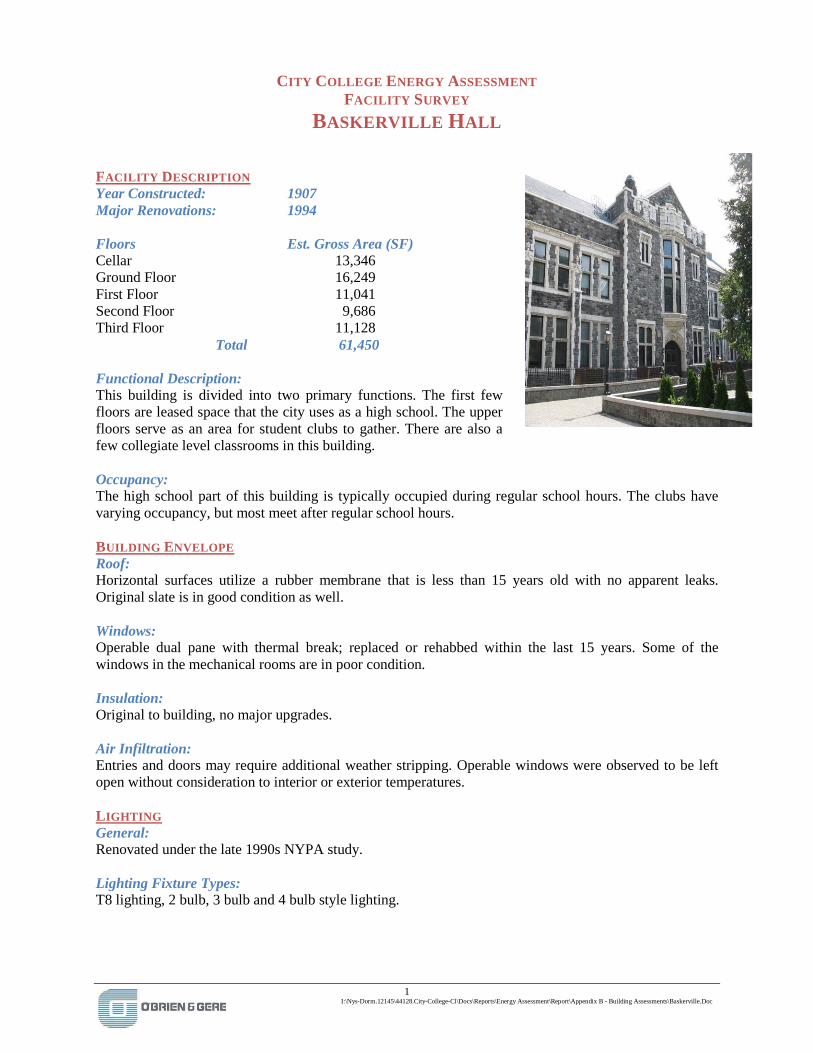
1 I:\Nys-Dorm.12145\44128.City-College-Cl\Docs\Reports\Energy Assessment\Report\Appendix B - Building Assessments\Baskerville.Doc
CITY COLLEGE ENERGY ASSESSMENT FACILITY SURVEY
BASKERVILLE HALL
Year Constructed: 1907 FACILITY DESCRIPTION
Major Renovations: 1994 Floors Est. Gross Area (SF) Cellar 13,346 Ground Floor 16,249 First Floor 11,041 Second Floor 9,686 Third Floor 11,128
Total 61,450 Functional Description: This building is divided into two primary functions. The first few floors are leased space that the city uses as a high school. The upper floors serve as an area for student clubs to gather. There are also a few collegiate level classrooms in this building. Occupancy: The high school part of this building is typically occupied during regular school hours. The clubs have varying occupancy, but most meet after regular school hours. BUILDING ENVELOPE Roof: Horizontal surfaces utilize a rubber membrane that is less than 15 years old with no apparent leaks. Original slate is in good condition as well. Windows: Operable dual pane with thermal break; replaced or rehabbed within the last 15 years. Some of the windows in the mechanical rooms are in poor condition. Insulation: Original to building, no major upgrades. Air Infiltration: Entries and doors may require additional weather stripping. Operable windows were observed to be left open without consideration to interior or exterior temperatures. LIGHTING General: Renovated under the late 1990s NYPA study. Lighting Fixture Types: T8 lighting, 2 bulb, 3 bulb and 4 bulb style lighting.
2 I:\Nys-Dorm.12145\44128.City-College-Cl\Docs\Reports\Energy Assessment\Report\Appendix B - Building Assessments\Baskerville.Doc
Lighting Control Opportunities (day lighting, occupancy, scheduling): Occupancy sensors present in some areas. Opportunities exist for occupancy sensors available for new construction in the 2nd and 3rd floor. Night Survey: Most of the lights were on in this building at night. HVAC General: There has been a major HVAC renovation in this building within the last 10 years. However, new mechanical equipment was designed in spaces that make accessing it very difficult. Maintenance staff refers to the equipment as “ship in a bottle.” New architectural updates to the clubs have not considered HVAC. Air Handling Units: Air handlers AC-1 and AC-2 were in positive pressure, as designed. Opportunity for coil maintenance exists. The positive pressure air handlers create a very difficult and possibly dangerous working situation if the units are running, so even the most routine maintenance requires unit shutdowns. Reheat coils: Reheat coils in this building are disabled during summer months resulting in over-cooling of many spaces. Outside Air Economizers: The primary air handlers are in operable condition. It is unknown as to whether they are economizing correctly. Window A/C Units: Several in the club areas (5-6). TEMPERATURE CONTROL Comfort Issues: The high school seemed to be maintaining temperatures reasonably. The club areas were undergoing renovation, but no renovations to HVAC were being performed. DDC vs. Analog: Pneumatic leaks on copper tubing throughout building as a result of cut tubes and uncapped ends. DDC controls on the new air handlers. Temperature setback/occupancy schedules: There does not appear to be setback controls to manipulate temperatures in large unoccupied areas. PLUMBING/DOMESTIC WATER: Water-saving fixtures: New fixtures in the high school. Fixtures in the club areas are original to the building. Water heaters: Hot water heater (electric) for summer use. Heat exchangers for winter use. MOTORS, FANS AND PUMPS Fans: No noticeable deficiencies.

3 I:\Nys-Dorm.12145\44128.City-College-Cl\Docs\Reports\Energy Assessment\Report\Appendix B - Building Assessments\Baskerville.Doc
Pumps: Observed significant pump leaks in the mechanical pump room. Motors: Previous motor replacement project performed in the late 1990s. PLUG LOADS/MISCELLANEOUS: Computers: Computers are present throughout the high school on the basement and first floor; there is no significant computer usage in the clubs. Space Heaters: None found. Vending Machines: None found. Miscellaneous: Not applicable. GENERAL OBSERVATIONS: Construction in the building has stopped, reportedly as a result of non-compliance to building code. As of now, the building has numerous pneumatic leaks throughout the building as a result of breaks in lines throughout the floors. Compressors cycle on and off at a rate of 12 to 18 times per hour. Dampers were set in “winter” operation in the month of June. Controls issues are apparent throughout. Dampers are not working correctly. Leaks: Significant pump leaks in the mechanical room. Immediate attention is recommended. Other: Not applicable. Health and Safety Issues: There is water from a leaking rain leader dripping on an electrical cabinet in a basement mechanical room. A rubber mat has been placed in front of the panel. A metal “drip guard” has been placed over an electric motor in the mechanical room. It appears that there are at least half a dozen leaking joints in the associated section of piping. In addition, a “leak catching apparatus” has been fashioned, utilizing a large piece of yellow plastic and a rubber hose to further direct leaks.
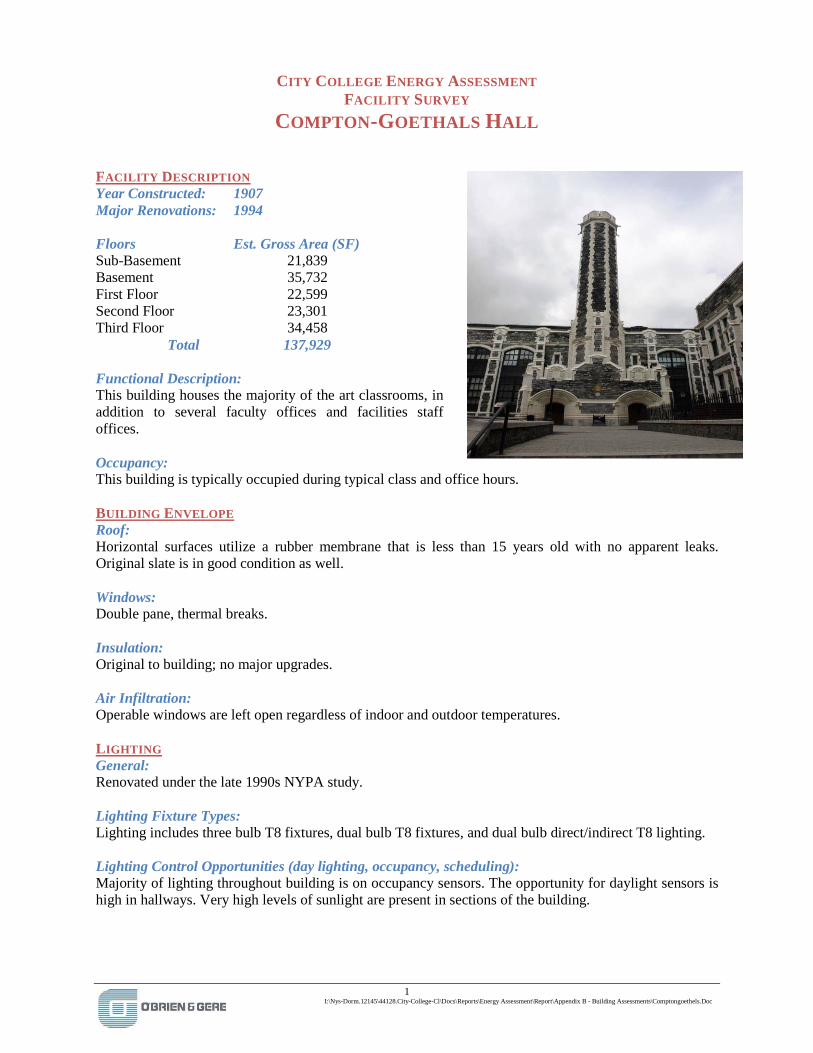
1 I:\Nys-Dorm.12145\44128.City-College-Cl\Docs\Reports\Energy Assessment\Report\Appendix B - Building Assessments\Comptongoethels.Doc
CITY COLLEGE ENERGY ASSESSMENT FACILITY SURVEY
COMPTON-GOETHALS HALL
Year Constructed: 1907 FACILITY DESCRIPTION
Major Renovations: 1994 Floors Est. Gross Area (SF) Sub-Basement 21,839 Basement 35,732 First Floor 22,599 Second Floor 23,301 Third Floor 34,458
Total 137,929 Functional Description: This building houses the majority of the art classrooms, in addition to several faculty offices and facilities staff offices. Occupancy: This building is typically occupied during typical class and office hours. BUILDING ENVELOPE Roof: Horizontal surfaces utilize a rubber membrane that is less than 15 years old with no apparent leaks. Original slate is in good condition as well. Windows: Double pane, thermal breaks. Insulation: Original to building; no major upgrades. Air Infiltration: Operable windows are left open regardless of indoor and outdoor temperatures. LIGHTING General: Renovated under the late 1990s NYPA study. Lighting Fixture Types: Lighting includes three bulb T8 fixtures, dual bulb T8 fixtures, and dual bulb direct/indirect T8 lighting. Lighting Control Opportunities (day lighting, occupancy, scheduling): Majority of lighting throughout building is on occupancy sensors. The opportunity for daylight sensors is high in hallways. Very high levels of sunlight are present in sections of the building.
2 I:\Nys-Dorm.12145\44128.City-College-Cl\Docs\Reports\Energy Assessment\Report\Appendix B - Building Assessments\Comptongoethels.Doc
Night Survey: Reasonable amounts of common area lighting were on during the night survey. HVAC General: There has been a major HVAC equipment renovation completed within the last 20 years. However, terminal equipment was generally not upgraded proportionally. Air Handling Units: Fourth floor mechanical room contains unit number AC-1; it was nearly inaccessible, and the automatic filter could be maintenanced. Duct insulation was damaged because of poor access. Interior unit insulation was splitting and peeling. Poor access for maintenance has resulted in a need to replace this unit prematurely. Supply fan VFD is running at 70% speed in manual; the associated return fan is running at 100% in manual. These conditions result in inappropriate pressurization and airflow. Unsure if the manual operation of fans impacts the smoke-control system. Basement mechanical room contains AC-2 and AC-3. Air handlers were observed to be reasonably new (10-15 years) in basement mechanical room. Reheat coils: Reheat coils in this building are disabled during summer months resulting in over-cooling of many spaces. Outside Air economizers: The primary air handlers are in operable condition. It is unknown as to whether they are economizing correctly. Window A/C units: None in this building. TEMPERATURE CONTROL Comfort Issues: Occupants claimed that the building was cold in the summer and warm in the winter, and generally over-conditioned. Additionally, there are several trunks of duct not flowing any air, possibly due to closed fire dampers. DDC vs. Analog: DDC controls were installed within the last 15 years. The lack of re-heat coils and manual operation of fans is greatly impacting the controllability of this building. Temperature setback/occupancy schedules: Potential opportunity for setback schedules. PLUMBING/DOMESTIC WATER: Water-saving fixtures: Fixtures were updated per the U.S. Energy Policy Act of 1992. Water heaters: Electric water heater for the summer months and medium temperature to hot domestic water heat exchangers for the winter months.

3 I:\Nys-Dorm.12145\44128.City-College-Cl\Docs\Reports\Energy Assessment\Report\Appendix B - Building Assessments\Comptongoethels.Doc
MOTORS, FANS AND PUMPS Fans: No deficiencies noted. Pumps: No deficiencies noted. Motors: Previous motor replacement project performed in the late 1990s. PLUG LOADS/MISCELLANEOUS: Computers: Computers can be put on smart strips in offices. Space Heaters: Many in offices. Vending Machines: None. Miscellaneous: Not applicable. GENERAL OBSERVATIONS: Leaks: None noted. Health and Safety Issues: None noted.

1 I:\Nys-Dorm.12145\44128.City-College-Cl\Docs\Reports\Energy Assessment\Report\Appendix B - Building Assessments\Harris.Doc
CITY COLLEGE ENERGY ASSESSMENT FACILITY SURVEY HARRIS HALL
Year Constructed: 1907 FACILITY DESCRIPTION
Major Renovations: 1994 Floors Est. Gross Area (SF) Cellar 24,320 Ground Floor 26,222 First Floor 17,954 Second Floor 17,592 Third Floor 17,445 Fourth Floor 13,859 Fifth Floor 1,089 Tower 546 Total 119,027 Functional Description: This building serves as classroom and office space to the healthcare programs on campus. Occupancy: This building is typically occupied during regular business hours and has some conference rooms with variable occupancy. BUILDING ENVELOPE Roof: Horizontal surfaces utilize a rubber membrane that is less than 15 years old with no apparent leaks. Original slate is in good condition as well. Windows: Dual pane with thermal break. Insulation: Original to building, no major upgrades. LIGHTING General: Renovated under the late 1990s NYPA study. Lighting Fixture Types: Dual bulb T8s, no reflector. Dual bulb T8s throughout. Lighting varies between office space and classroom space. Classrooms on third floor still have T12 lighting fixtures, (rooms 313, 301). First floor office 106 included dual bulb T4 reflective fixtures. Lighting Control Opportunities (day lighting, occupancy, scheduling): Lighting in offices and classrooms include occupancy sensors. Opportunities for occupancy sensors as well as daylight sensors are observed on all floors of the building. In corridors and stairways, daylight sensors pose an opportunity due to sunlight penetration.

2 I:\Nys-Dorm.12145\44128.City-College-Cl\Docs\Reports\Energy Assessment\Report\Appendix B - Building Assessments\Harris.Doc
Night Survey: Some offices and classrooms had nighttime lighting, but generally the lighting is controlled well. HVAC General: This building has received widesweeping renovations within the last 15 years. Opportunities exist for better contol and maintenance of equipment. Air Handling Units: Fourth floor mechanical room includes unit ACH-1 operating at 44.0 hertz (Hz) on a cold day. RF-H1 and EF-H1 were both wide open. Return running at 25Hz and exhaust fan running at 60Hz. Fifth floor mechanical room includes AHU-6 & RF-6. AHU-6 was observed to be rebuilt. The coils on this unit could be maintenanced. The unit was operating in Manual Bypass mode. Fourth floor fan room includes RF-5 & AHU-5 as well as a smaller MagicAire air handling unit. AHU-5 was rebuilt. Opportunity for filter maintenance. Fourth floor ACH-2, hot water coil damaged. Unit running at 60Hz and filters were water logged. First floor mechanical room includes AHU-4 & RF-4. AHU-4 could be maintenanced. Ground floor mechanical room includes AHU-3 & RF-3. AHU-3 was observed to have standing water and could be maintenanced. Cellar level mechanical room includes AH-1 & RF-1. AH-1 could be maintenanced. Cellar mechanical room #2 includes AHU-2 & RF-2. AHU-2 could be maintenanced. Reheat coils: All reheat coils in this building are disabled during summer months, resulting in over-cooling of many spaces. Outside Air Economizers: The primary air handlers are in poor operating condition; no automatic economizers are available. Window A/C units: A few in some of the offices. TEMPERATURE CONTROL Comfort Issues: This building is generally cold and uncomfortable with wide-ranging complaints of either too hot or too cold at all times of the year. DDC vs. Analog: The controls in this building are pneumatic and are in poor condition. Temperature Setback/Occupancy Schedules: Opportunity exists for better controls to manipulate temperatures throughout the building.

3 I:\Nys-Dorm.12145\44128.City-College-Cl\Docs\Reports\Energy Assessment\Report\Appendix B - Building Assessments\Harris.Doc
PLUMBING/DOMESTIC WATER: Water-saving fixtures: Fixtures are original to the building. Water heaters: Electric water heater for the summer, and medium temperature hot water heaters for the summer. MOTORS, FANS AND PUMPS Fans: RF-4 - Manual override. RF-1 – VFD broken, on bypass. Pumps: No noticeable deficiencies. Motors: Previous motor replacement project performed in the late 1990s. PLUG LOADS/MISCELLANEOUS: Computers: Computers can be put on smart strips in main office; some offices still utilizing CRT monitors. Space Heaters: Some found in offices, 5-6 total. Vending Machines: None found. Miscellaneous: Designed kitchenette appears to have reduced the need for various appliances in the offices. GENERAL OBSERVATIONS: Perimeter fan coils and heating units are often used as shelving, resulting in poor airflow. Leaks: Some piping leaks in mechanical rooms. Other: Not applicable. Health and Safety Issues: None found.

1 I:\Nys-Dorm.12145\44128.City-College-Cl\Docs\Reports\Energy Assessment\Report\Appendix B - Building Assessments\HEW Admin Bldg.Doc
CITY COLLEGE ENERGY ASSESSMENT FACILITY SURVEY
HOWARD E. WILLE ADMINISTRATION BUILDING
Year Constructed: 1962 FACILITY DESCRIPTION
Major Renovations: 1980? Floors Est. Gross Area (SF) Basement 10,250 First Floor 20,663 Second Floor 15,573 Third Floor 6,615 Mechanical Roof 2,517
Total 55,618 Functional Description: This building serves as the primary administration area for the campus; it consists of strictly offices. Occupancy: This building is typically occupied during typical business hours and has some conference rooms with variable occupancy.
Roof: BUILDING ENVELOPE
Built-up roof with, no noticeable leaks. Windows: Dual pane with thermal break. Insulation: Original to building, with no major upgrades.
General: LIGHTING
Renovated under the late 1990s NYPA study. Lighting Fixture Types: Generally T8 lighting. Some over-lit areas at displays. Lighting Control Opportunities (day lighting, occupancy, scheduling): Some opportunity for occupancy sensors; about 80% of the building is already appropriately controlled. Night Survey: No noticeable lighting interior to the building during the night survey.
Some display areas are over-lite.

2 I:\Nys-Dorm.12145\44128.City-College-Cl\Docs\Reports\Energy Assessment\Report\Appendix B - Building Assessments\HEW Admin Bldg.Doc
HVAC General: Renovations within the occupied space in this building have been mostly architectural. The primary central mechanical systems are well maintained and in no immediate need of service or replacement, but the zoning and terminal equipment all needs to be reviewed further, and the zoning needs to be updated to match architectural renovations. Air Handling Units: One primary multi-zone AHU in the penthouse mechanical room. Reheat coils: Reheat coils in this building are disabled during summer months, resulting in over-cooling of many spaces. Outside Air Economizers: The primary air handler is in operable condition. It is unknown as to whether it is economizing correctly. Window A/C units: None in this building. TEMPERATURE CONTROL Comfort Issues: This building is generally cold all summer, and has numerous zoning issues, as a result of construction that has resulted in poor control. DDC vs. Analog: The controls in this building are pneumatic and well maintained within the primary mechanical spaces. Control at the room level is in need of renovation. Temperature setback/occupancy schedules: Opportunity for setback controls to manipulate temperatures throughout the building. PLUMBING/DOMESTIC WATER: Water-saving fixtures: Fixtures are original to the building. Water heaters: Gas-fired domestic water heaters and medium temperature hot water heaters. MOTORS, FANS AND PUMPS Fans: No noticeable deficiencies. Pumps: No noticeable deficiencies. Motors: Previous motor replacement project performed in the late 1990s.

3 I:\Nys-Dorm.12145\44128.City-College-Cl\Docs\Reports\Energy Assessment\Report\Appendix B - Building Assessments\HEW Admin Bldg.Doc
PLUG LOADS/MISCELLANEOUS: Computers: Computers can be put on smart strips in main office. Space Heaters: Found in many offices. Vending Machines: None found. Miscellaneous: Make-shift kitchenette has been installed in an area that appears to have been designed as an office. GENERAL OBSERVATIONS: Perimeter fan coils and heating units are often used as shelving, resulting in poor airflow. Leaks: None found. Other: Not applicable. Health and Safety Issues: None found.

1 I:\Nys-Dorm.12145\44128.City-College-Cl\Docs\Reports\Energy Assessment\Report\Appendix B - Building Assessments\Marshak.Doc
CITY COLLEGE ENERGY ASSESSMENT FACILITY SURVEY
MARSHAK SCIENCE BUILDING
Year Constructed: 1972 FACILITY DESCRIPTION
Major Renovations: Ongoing Floors Est. Gross Area (SF) Cellar 1,703 Lower Level 116,637 Basement Mezzanine 12,395 Ground Floor 78,409 Plaza Level 24,134 Second Floor 30,841 Third Floor 30,841 Fourth Floor 30,841 Fifth Floor 30,841 Sixth Floor 30,841 Seventh Floor 30,841 Eighth Floor 30,841 Ninth Floor 30,841 Tenth Floor 30,841 Eleventh Floor 30,841 Twelfth Floor 30,841 Thirteenth Floor 30,841 Mechanical Roof 14,541 Upper Roof 2,871
Total 620,782 Functional Description: This building serves as the primary science building for the campus with the majority of the building being comprised laboratory, classroom, and office space. It also houses athletic facilities, including a pool, gymnasium, and ancillary spaces, such as locker rooms and sports training facilities. Occupancy: This building has a wide variety of occupancy times due to scientific research activities, sporting events, and student classes. Generally, the building is generally occupied on weekdays from 6 AM until 10 PM with intermittent use on weekends. BUILDING ENVELOPE: Roof: The tower roof has been patched and repaired over the last 10 years as a result of building renovations. The concourse level (plaza) is reportedly leaking. Windows: Dual pane with thermal break; some are operable. To address structural issues in the building, a project is presently underway to install a new exterior building envelope (including windows) between the existing windows and the exterior face of the building.

2 I:\Nys-Dorm.12145\44128.City-College-Cl\Docs\Reports\Energy Assessment\Report\Appendix B - Building Assessments\Marshak.Doc
Insulation: Recessed windows assemblies fill the structural concrete openings in the building façade. Where there is HVAC equipment at the building exterior, there are panels with polystyrene insulation 1-inch thick. The additional glass façade that is being added to the building exterior will add additional insulation value and reduce conductive and infiltration heat loss through the wall assemblies. Air Infiltration: The original make-up air intakes serving the laboratory areas with fume hoods have been sealed, leading to a highly negative pressure within the building. As a result of these negative pressure conditions, excessive air infiltration was observed coming from the building exterior, resulting in localized cold spots in winter and uncontrolled humidity conditions and moisture condensation. A building renovation project is underway to install eight new makeup air units on the core bulkheads to address these conditions. LIGHTING: General: Renovated under the late 1990s NYPA study. Lighting Fixture Types: Dual bulb T8s fluorescent fixtures with electronic ballasts throughout. Lighting Control Opportunities (day lighting, occupancy, scheduling): The majority of the building is currently using occupancy sensors (approximately 85%). A large portion of the remainder of the building could utilize this technology. Night Survey: Common area lighting was on during the night survey. At the time of the walk-through (summer), few labs were occupied during overnight hours. It is expected that during typical class times that more labs would be utilized. HVAC: General: The HVAC systems in the building presently have inadequate make-up air volumes and access to existing equipment is poor. Because of the number of lab spaces and mechanical systems in this building, there are many small projects that have been undertaken without consideration to their impact on overall system performance. Because of this, the building does not currently perform as a cohesive system, but rather many individual (often competing) systems. A building renovation project is underway to install new HVAC systems and DDC controls to address these conditions. Air Handling Units: The building has a mix of new and old air handling units observed to be abandoned, in good condition, or in poor condition and at the end of their life expectancy. Many units were found that were difficult to access for filter changes and coil cleaning. New Air Handling Units: AH-Gross Anatomy (see notes below) AC-6 AC-6a HV-9 HV-10
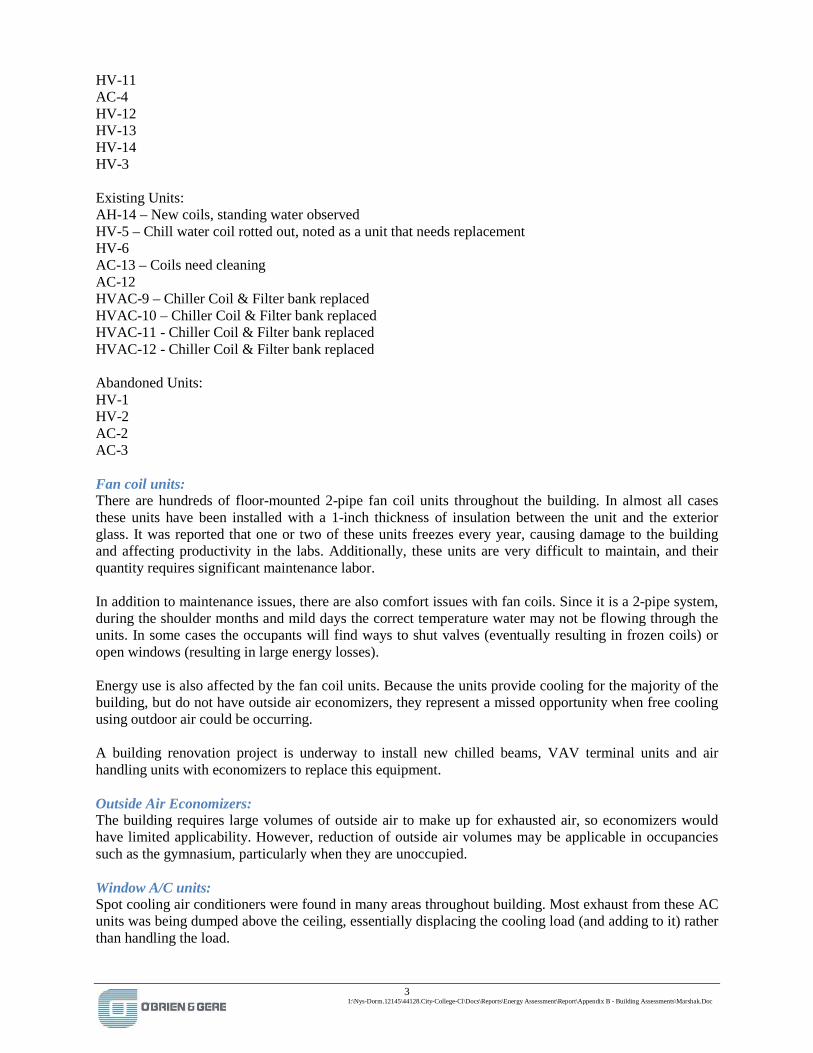
3 I:\Nys-Dorm.12145\44128.City-College-Cl\Docs\Reports\Energy Assessment\Report\Appendix B - Building Assessments\Marshak.Doc
HV-11 AC-4 HV-12 HV-13 HV-14 HV-3 Existing Units: AH-14 – New coils, standing water observed HV-5 – Chill water coil rotted out, noted as a unit that needs replacement HV-6 AC-13 – Coils need cleaning AC-12 HVAC-9 – Chiller Coil & Filter bank replaced HVAC-10 – Chiller Coil & Filter bank replaced HVAC-11 - Chiller Coil & Filter bank replaced HVAC-12 - Chiller Coil & Filter bank replaced Abandoned Units: HV-1 HV-2 AC-2 AC-3 Fan coil units: There are hundreds of floor-mounted 2-pipe fan coil units throughout the building. In almost all cases these units have been installed with a 1-inch thickness of insulation between the unit and the exterior glass. It was reported that one or two of these units freezes every year, causing damage to the building and affecting productivity in the labs. Additionally, these units are very difficult to maintain, and their quantity requires significant maintenance labor. In addition to maintenance issues, there are also comfort issues with fan coils. Since it is a 2-pipe system, during the shoulder months and mild days the correct temperature water may not be flowing through the units. In some cases the occupants will find ways to shut valves (eventually resulting in frozen coils) or open windows (resulting in large energy losses). Energy use is also affected by the fan coil units. Because the units provide cooling for the majority of the building, but do not have outside air economizers, they represent a missed opportunity when free cooling using outdoor air could be occurring. A building renovation project is underway to install new chilled beams, VAV terminal units and air handling units with economizers to replace this equipment. Outside Air Economizers: The building requires large volumes of outside air to make up for exhausted air, so economizers would have limited applicability. However, reduction of outside air volumes may be applicable in occupancies such as the gymnasium, particularly when they are unoccupied. Window A/C units: Spot cooling air conditioners were found in many areas throughout building. Most exhaust from these AC units was being dumped above the ceiling, essentially displacing the cooling load (and adding to it) rather than handling the load.

4 I:\Nys-Dorm.12145\44128.City-College-Cl\Docs\Reports\Energy Assessment\Report\Appendix B - Building Assessments\Marshak.Doc
Boilers: The existing building heating plant is seven years old and consists of two steam boilers, each with capacity of 22,000 pounds per hour of steam production (640 boiler horsepower). A small portion of the steam is used in laboratories for experiments and for sterilization of lab equipment. Generally, the plant is in good condition, but it runs year-round and is over sized for the summer load in the building. Distribution Systems: The ductwork and condenser water piping systems in the building are in poor condition. The interior fiberglass duct lining has deteriorated over time, and is being blown into the space in the form of a black dust that can been seen throughout the building around diffusers. DASNY undertook a project to replace the condenser water system within the last 15 years, but the new piping and towers were never used (according to conversations with facilities staff). Evaporative Cooling Towers: The cooling tower on the roof is a Marley NC Series tower with heat rejection capacity of 1,200 tons (3,600 gpm). The tower provides condenser water to secondary cooling located throughout the upper floors and to a smaller chiller located in the lower mechanical room. The evaporative coolers serve the cold storage units on each of the lab floors as well as some building specific chillers. The towers would benefit from improved water treatment and maintenance. Gross Anatomy HVAC: The gross anatomy lab has a dedicated air handling and chilled water system that is less than 10 years old. The air handling unit is in need of maintenance. Coils have clogged and airflow is continually declining to the lab space. The professor in charge of the lab is concerned about humidity and moisture control issues within the lab if the airflow is not restored to appropriate levels.
The lighting control within the space should be reexamined for unoccupied hours. HVAC: The current heating and ventilation systems for the pool are providing inadequate moisture removal in the space and needs to be reexamined. The current humidity levels in the space do not meet ASHRAE requirements. Pool Heating and Circulation: The heat exchanger and pumps have been recently replaced. However, the chlorination and treatment equipment is quite corroded and beyond its effective useful life.
POOL AND ASSOCIATED SYSTEMS: General: The 25 meter pool currently utilizes a pool cover to minimize the space dehumidification and pool heating requirements. Lighting:
Within the last three years, a total of one hundred eighty-four fume hoods were retrofit with low flow kits. Additionally, variable volume strobic fans were added to the central hood exhaust system to respond to continually changing exhaust requirements within the spaces. Upon completion of the project, hoods were tested for compliance with ASHRAE 110 and passed. Motor-driven rear baffles
LABORATORY VENTILATION AND FUME HOODS: Fume Hoods:

5 I:\Nys-Dorm.12145\44128.City-College-Cl\Docs\Reports\Energy Assessment\Report\Appendix B - Building Assessments\Marshak.Doc
in the hood retrofit kits maintain a stable vortex within the hood to prevent spillage at low velocity.
The hood exhaust systems have been renovated on a number of occasions over the life of the building. The most recent major renovation included combining the exhausts to common strobic fans with redundant back-ups. The proposed make-up air system will provide conditioned outside air to balance the exhaust from the building. TEMPERATURE CONTROL:
These require periodic inspection of the motors and damper linkages. Ventilation: The ventilation and make-up air for the labs has been an issue in the building since its construction. The original design called for untreated make-up air that was introduced into a wall cavity between the labs (with fresh-water piping in the wall) which led to a large quantity of freezing in the first year of building operation. The solution to stopping the freezing was to cover the ventilation air intakes, resulting in a general lack of ventilation in the building. Additionally, the ever-increasing negative pressure in the building is impacting the ability to exhaust the hoods properly, which has led to a multitude of hood exhaust projects. A building renovation project is underway to install eight new makeup air units on the core bulkheads to address these conditions. Exhaust systems:
Comfort Issues: Occupant complained of being uncomfortable in summer and winter. A number of the first floor spaces have no air conditioning and the pool humidity migrates to surrounding areas, making them humid and uncomfortable. The upper floor labs are rarely in a comfortable temperature range without the use of temporary equipment, such as electric heaters or spot coolers. Additionally, some spaces use operable windows to mitigate the space temperature. DDC vs. Analog: The vast majority of the building is operated via pneumatic controls that are in poor condition. Some of the newer renovations have utilized DDC control. None of the new DDC control can be monitored remotely, making it difficult to monitor temperature conditions and equipment operation. Temperature setback/occupancy schedules: Opportunities exist in the building for unoccupied temperature setback schedules and fan cycling based on building occupancy. PLUMBING/DOMESTIC WATER: Water-saving fixtures: Lavatories, toilets and urinals are original to the building and do not reflect current best practices for water efficiency. MOTORS, FANS AND PUMPS: Fans: The fans in the upper mechanical rooms are generally well maintained despite a lack of proper maintenance access. See above for lab exhaust fans.
Spot coolers are common throughout the building.

6 I:\Nys-Dorm.12145\44128.City-College-Cl\Docs\Reports\Energy Assessment\Report\Appendix B - Building Assessments\Marshak.Doc
Pumps: The chilled water pumps are currently nonfunctional. The building currently relies on the central plant to provide the required pumping for its cooling needs. Facilities reports that repeated attempts have been made to try and get these pumps operating appropriately with no reasonable results. Because the central plant chilled water pumps must overcome the pressure required to pump up the entire height of Marshak, the chilled water pump failures are currently effecting the chilled water distribution for the entire campus because the central plant is required to provide a much higher water pressure than would be needed if these pumps were working correctly. The heating plant pumps are relatively new and in good condition. Motors: The majority of the motors have been replaced under previous renovations and the motor upgrade by NYPA within the last 15 years. PLUG LOADS/MISCELLANEOUS: Computers: Offices and laboratories all have computers that could utilize smart strips. Space Heaters: Electric space heaters were found throughout the building in offices and labs. Vending Machines: There is a student lounge area in the building that has a variety of vending machines. Miscellaneous: Throughout the building there are refrigerators, water coolers, and microwaves that have been added post-design. Generally, it is anticipated that a great deal of these could be consolidated if kitchenettes were added on every floor. GENERAL OBSERVATIONS: Issues associated with the building envelope, HVAC, laboratory hoods, make-up air, fan-coil units are presently being addressed as part of a major renovation program planned for Marshak. Leaks: There are minor miscellaneous piping leaking throughout the classrooms, labs, offices, and common areas. There are also significant leaks in the building envelope, including the building expansion joints and plaza roof. Health and Safety Issues: The primary health concern for this building is the proper operation of fume hoods. Projects are currently underway to retrofit existing hoods or provide new units to address this.

1 I:\Nys-Dorm.12145\44128.City-College-Cl\Docs\Reports\Energy Assessment\Report\Appendix B - Building Assessments\NAC.Doc
CITY COLLEGE ENERGY ASSESSMENT FACILITY SURVEY
NORTH ACADEMIC CENTER (NAC)
Year Constructed: 1982 FACILITY DESCRIPTION
Major Renovations: 1994 Floors Est. Gross Area (SF) Basement 38,716 First Floor 165,887 Second Floor 132,823 Third Floor 111,759 Fourth Floor 114,590 Fifth Floor 96,841 Sixth Floor 90,967 Seventh Floor 68,584 Eighth Floor 38,518 Ninth Floor 26,480 Roof 491
Total 885,656 Functional Description: This building serves as the primary classroom and office building for the campus, as well as the central utility plant, public safety, and dining facilities. Occupancy: This building is generally occupied only during normal business hours, with the exception of the public safety offices, which are occupied 24 hours a day. BUILDING ENVELOPE Roof: This roof has no visible leaks and is in good condition. Windows: Single plane, plexiglass with failing weather stripping. New single pane windows were recently added to the cafeteria. Insulation: Original to the building, no significant renovations have occurred. Air Infiltration: The amount of failing weather stripping on windows is significant throughout the building. Complaints of feeling a breeze while walking by windows were common. LIGHTING General: Renovated under the late 1990s NYPA study.

2 I:\Nys-Dorm.12145\44128.City-College-Cl\Docs\Reports\Energy Assessment\Report\Appendix B - Building Assessments\NAC.Doc
Lighting Fixture Types: Dual bulb T8s in most offices and classrooms. Single bulb T8s with cans in most hallways and common areas. Lighting Control Opportunities (day lighting, occupancy, scheduling): There are significant opportunities for daylighting control in the common areas of the building, which are often near windows that could provide all of the necessary light needed for the space. Additionally, some of the common areas are extremely over-lit, reaching as high as 120 foot-candles. Night Survey: Common area lighting was on during the night survey, but generally offices and classrooms were very well controlled. HVAC General: This building houses the most accessible mechanical equipment on campus. However, the equipment is nearing the end of its useful life. There have been several attempts to extend the life of primary equipment (such as replacing chilled water coils), but generally equipment will continue to fail in this building until it is completely replaced (similar to what was done to the chiller plant). Air Handling Units: Most of the primary air handling equipment has corrosion and is uncontrolled. The majority of dampers have non-functional actuators that are operated manually by the campus controls staff, as required to provide an economizer function for the building. Additionally, many of the variable frequency drives suffer from lack of maintenance and the majority of them are in full bypass. Boilers: There are 5 high pressure boilers (4 operable): Boiler #1 – out of service Boiler #2 – 100,000 pounds per hour of steam (pph) Boiler #3 – 100,000 pph Boiler #4 – 50,000 pph Boiler #5 – 20,000 pph The boiler plant runs in the summer to account for the kitchen domestic hot water load and any steam-driven chilling that sometimes occurs. Originally the entire boiler plant was designed to also run year-round to serve re-heat coils, and domestic hot water throughout the campus. However, the re-heat system has been disabled and the summer steam load has been greatly reduced. The smallest boiler is relatively small and has high turn-down. However, there is no definitive data on the efficiency of the boiler when it runs at low loads (during the summer months) at 7,000 pph for the kitchen. Additionally, there are no definitive loads for the kitchen to be able to say how much of the 7,000 pph that is produced actually reaches the kitchen, and how much is lost through leaks and distribution. There may be an opportunity to provide heat generation for the kitchen and reduce the summer load significantly. There are no incoming meters on make-up water or steam production, which would be required to make an appropriate estimate of steam cost. Generally, it is understood that a good deal of make-up water has been required in this system, especially in the past few years as piping continues to fail because of an inappropriate make-up water system. Several steam condensate returns were piped to drain or have leaks. Renovations are underway to repair water treatment systems within the boiler plant.
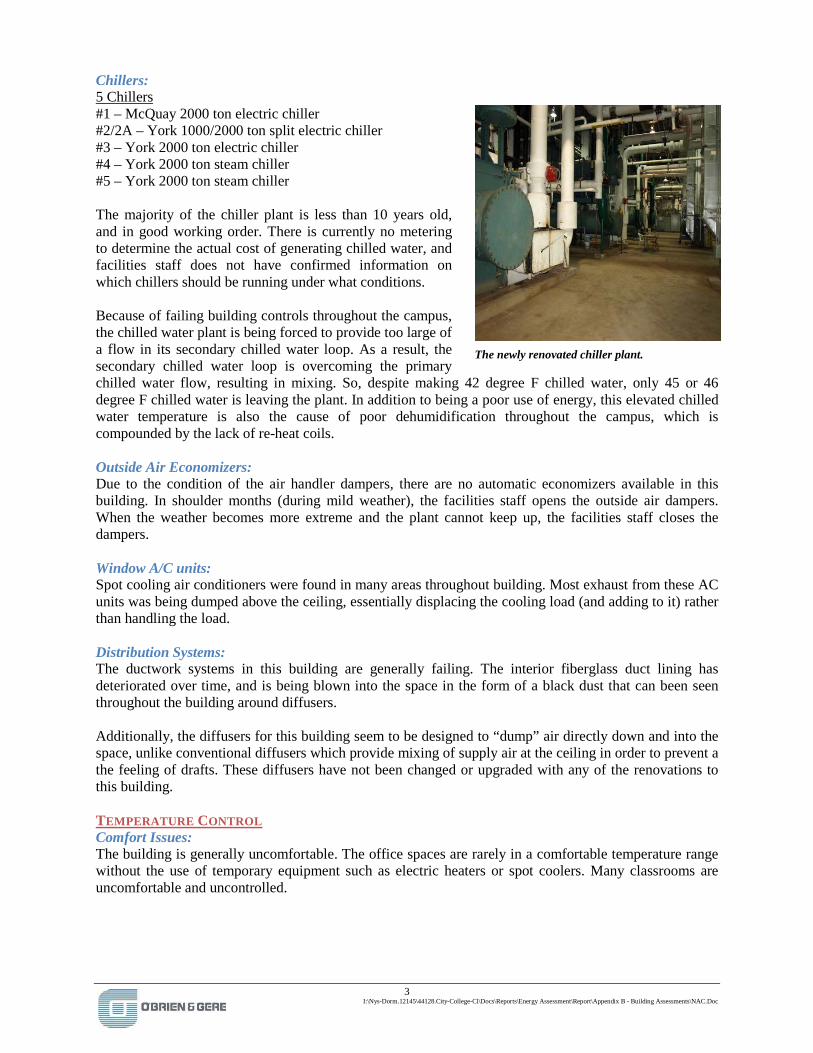
3 I:\Nys-Dorm.12145\44128.City-College-Cl\Docs\Reports\Energy Assessment\Report\Appendix B - Building Assessments\NAC.Doc
Chillers:
#1 – McQuay 2000 ton electric chiller 5 Chillers
#2/2A – York 1000/2000 ton split electric chiller #3 – York 2000 ton electric chiller #4 – York 2000 ton steam chiller #5 – York 2000 ton steam chiller The majority of the chiller plant is less than 10 years old, and in good working order. There is currently no metering to determine the actual cost of generating chilled water, and facilities staff does not have confirmed information on which chillers should be running under what conditions. Because of failing building controls throughout the campus, the chilled water plant is being forced to provide too large of a flow in its secondary chilled water loop. As a result, the secondary chilled water loop is overcoming the primary chilled water flow, resulting in mixing. So, despite making 42 degree F chilled water, only 45 or 46 degree F chilled water is leaving the plant. In addition to being a poor use of energy, this elevated chilled water temperature is also the cause of poor dehumidification throughout the campus, which is compounded by the lack of re-heat coils. Outside Air Economizers: Due to the condition of the air handler dampers, there are no automatic economizers available in this building. In shoulder months (during mild weather), the facilities staff opens the outside air dampers. When the weather becomes more extreme and the plant cannot keep up, the facilities staff closes the dampers. Window A/C units: Spot cooling air conditioners were found in many areas throughout building. Most exhaust from these AC units was being dumped above the ceiling, essentially displacing the cooling load (and adding to it) rather than handling the load. Distribution Systems: The ductwork systems in this building are generally failing. The interior fiberglass duct lining has deteriorated over time, and is being blown into the space in the form of a black dust that can been seen throughout the building around diffusers. Additionally, the diffusers for this building seem to be designed to “dump” air directly down and into the space, unlike conventional diffusers which provide mixing of supply air at the ceiling in order to prevent a the feeling of drafts. These diffusers have not been changed or upgraded with any of the renovations to this building. TEMPERATURE CONTROL Comfort Issues: The building is generally uncomfortable. The office spaces are rarely in a comfortable temperature range without the use of temporary equipment such as electric heaters or spot coolers. Many classrooms are uncomfortable and uncontrolled.
The newly renovated chiller plant.
4 I:\Nys-Dorm.12145\44128.City-College-Cl\Docs\Reports\Energy Assessment\Report\Appendix B - Building Assessments\NAC.Doc
DDC vs. Analog: The vast majority of the building is operated on pneumatic controls that are in a state of disrepair. Some of the newer renovations have utilized DDC control, but the only new work that can be seen at central facilities is the chiller plant. Temperature Setback/Occupancy Schedules: This building does not have the capability of temperature setback. KITCHEN SYSTEMS: General: The plug loads in the kitchen are extensive. A substantial amount of the domestic water heating is performed with electricity, and the cooling units are generally air-cooled and dump the waste heat into the space, adding to the cooling load. Significant energy savings opportunities are present in the kitchen; such as exhaust hood controls, reduction of electric heating, and management of waste heat from coolers. Plumbing: The grease traps for the kitchen are in a state of disrepair which has led to extensive leaks and potential for mold growth. HVAC: The kitchen hoods run constantly, despite the kitchen only being active for a few hours a day. LIBRARY: General: Throughout the library there are hot and cold spots, but generally the space is uncomfortable. The card catalog areas are extremely warm and stuffy throughout the summer, but the general population areas are generally overcooled to a point where occupants have stuffed an exit door with newspaper trying to keep cold air from penetrating into the space. Special Collections: The special collections area of the library houses many expensive, rare, and even one of kind books, and should be reviewed with regard to preservation. The occupants track the humidity and temperature with local devices that show an extremely wide range of temperatures (65 to 80° F) and humidity (30% - 75% RH). Typically, when dealing with perishable documents, the temperature and humidity are kept low to prevent mold growth (under 70° F and 50% RH). DATA CENTERS: General: The data centers in this building are generally treated as any other room in terms of mechanical services. There are a couple areas where there are several servers in a room with nothing more than the central HVAC systems and fans to cool them. PLUMBING/DOMESTIC WATER: Water-saving fixtures: Fixtures are original to the building. Water heaters: There are multiple medium temperature fired domestic water heaters in this building. MOTORS, FANS AND PUMPS Fans: Generally the fans in this building are well maintained.
5 I:\Nys-Dorm.12145\44128.City-College-Cl\Docs\Reports\Energy Assessment\Report\Appendix B - Building Assessments\NAC.Doc
Pumps: Generally the pumps in this building are well maintained. Motors: The majority of the motors have been replaced under previous renovations and the motor upgrade by NYPA within the last 15 years. PLUG LOADS/MISCELLANEOUS: Computers: Offices and laboratories all have computers that could utilize smart strips. Space Heaters: Electric space heaters were found throughout the building in offices and labs. Vending Machines: There are a large number of vending machines on the main floor in the common areas of this building. Miscellaneous: Throughout the building there are refrigerators, water coolers, and microwaves that have been added post-design. Generally it is anticipated that a great deal of these could be consolidated if kitchenettes were added on every floor. GENERAL OBSERVATIONS: This building will require widespread renovations in the next 10 years on nearly all of its systems. It is important to develop a phased plan now that will incorporate all of the necessary changes and have a final product in mind. If small projects are performed without regard to the greater building systems and how these changes impact the plant, more problems could occur. Leaks: There are a fair number of piping leaks within the mechanical rooms. There are a number of condensate drain pans that leak and create flooding. Additionally there are some leaks in the library through the envelope because of improper paving of the quad. Other: It is anticipated that there are malfunctioning fire dampers throughout the building that are causing airflow issues. Health and Safety Issues: The primary health concern for this building is the improper operation of cooling coil drain pans. Because these pans are in the air stream, is it important that they drain correctly and do not allow the growth of bacteria that can be distributed throughout the building.
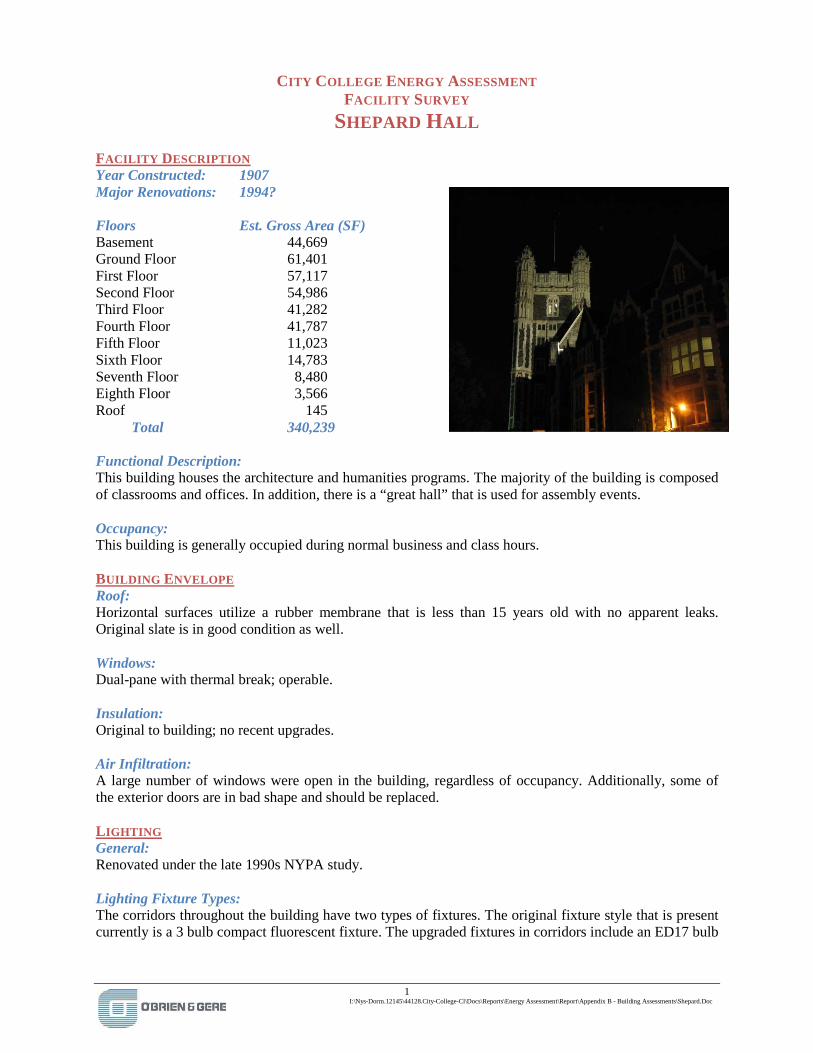
1 I:\Nys-Dorm.12145\44128.City-College-Cl\Docs\Reports\Energy Assessment\Report\Appendix B - Building Assessments\Shepard.Doc
CITY COLLEGE ENERGY ASSESSMENT FACILITY SURVEY
SHEPARD HALL
Year Constructed: 1907 FACILITY DESCRIPTION
Major Renovations: 1994? Floors Est. Gross Area (SF) Basement 44,669 Ground Floor 61,401 First Floor 57,117 Second Floor 54,986 Third Floor 41,282 Fourth Floor 41,787 Fifth Floor 11,023 Sixth Floor 14,783 Seventh Floor 8,480 Eighth Floor 3,566 Roof 145
Total 340,239 Functional Description: This building houses the architecture and humanities programs. The majority of the building is composed of classrooms and offices. In addition, there is a “great hall” that is used for assembly events. Occupancy: This building is generally occupied during normal business and class hours. BUILDING ENVELOPE Roof: Horizontal surfaces utilize a rubber membrane that is less than 15 years old with no apparent leaks. Original slate is in good condition as well. Windows: Dual-pane with thermal break; operable. Insulation: Original to building; no recent upgrades. Air Infiltration: A large number of windows were open in the building, regardless of occupancy. Additionally, some of the exterior doors are in bad shape and should be replaced.
The corridors throughout the building have two types of fixtures. The original fixture style that is present currently is a 3 bulb compact fluorescent fixture. The upgraded fixtures in corridors include an ED17 bulb
LIGHTING General: Renovated under the late 1990s NYPA study. Lighting Fixture Types:

2 I:\Nys-Dorm.12145\44128.City-College-Cl\Docs\Reports\Energy Assessment\Report\Appendix B - Building Assessments\Shepard.Doc
with a 100W rating. The upgraded fixtures are used in about 25% of the building while the original 3 bulb florescent units represent the other 75%. Classrooms have a 2-bulb fluorescent T8 fixture. Lighting Control Opportunities (day lighting, occupancy, scheduling): Most lighting is switched; occupancy sensor upgrades are available where there are none. Daylight sensors might be implemented anywhere there is a high level of glass exposure, such as most of the classrooms. Night Survey: Common area and great hall lighting was on during the night survey. HVAC General: Mechanically, this building should be straightforward for heating and cooling. However, the multitude of operable windows combined with the lack of functioning controls and difficult to maintain equipment makes this building uncomfortable. Air Handling Units: This building’s air handling units mainly serve as fresh air, rather than comfort cooling. Generally, these units are beyond their useful life, or have recently been replaced in such a manner that requires maintenance personnel into potentially hazardous situations. Fan Coil Units: There are hundreds of 2-pipe fan coil units throughout the building. These units are very difficult to maintain, and the sheer volume of them represents a significant maintenance challenge. In addition to maintenance issues, there are also comfort issues with fan coils. Since it is a 2-pipe system, during the shoulder months and mild days the correct temperature water may not be flowing through the units. In some cases the occupants will find ways to shut valves (eventually resulting in frozen coils) or open windows (resulting in large energy losses). Energy use is also affected by the fan coil units. Because the units provide cooling for the majority of the building, but do not have outside air economizers, they represent a large drain on energy when free cooling could be occurring. The vast majority of these units are in a state of disrepair and need to be removed. Outside Air Economizers: Generally, other than the fan coil units, this building is nearly 100% outside air, so economizers are not typically applicable. Window A/C units: Spot cooling air conditioners were found in many areas throughout building. Most exhaust from these AC units was being dumped above the ceiling, essentially displacing the cooling load (and adding to it) rather than treating the load. TEMPERATURE CONTROL Comfort Issues: The building is generally uncomfortable. The office areas are rarely in a comfortable temperature range without the use of temporary equipment, such as electric heaters or spot coolers. Additionally, some spaces use operable windows to mitigate the space temperature.
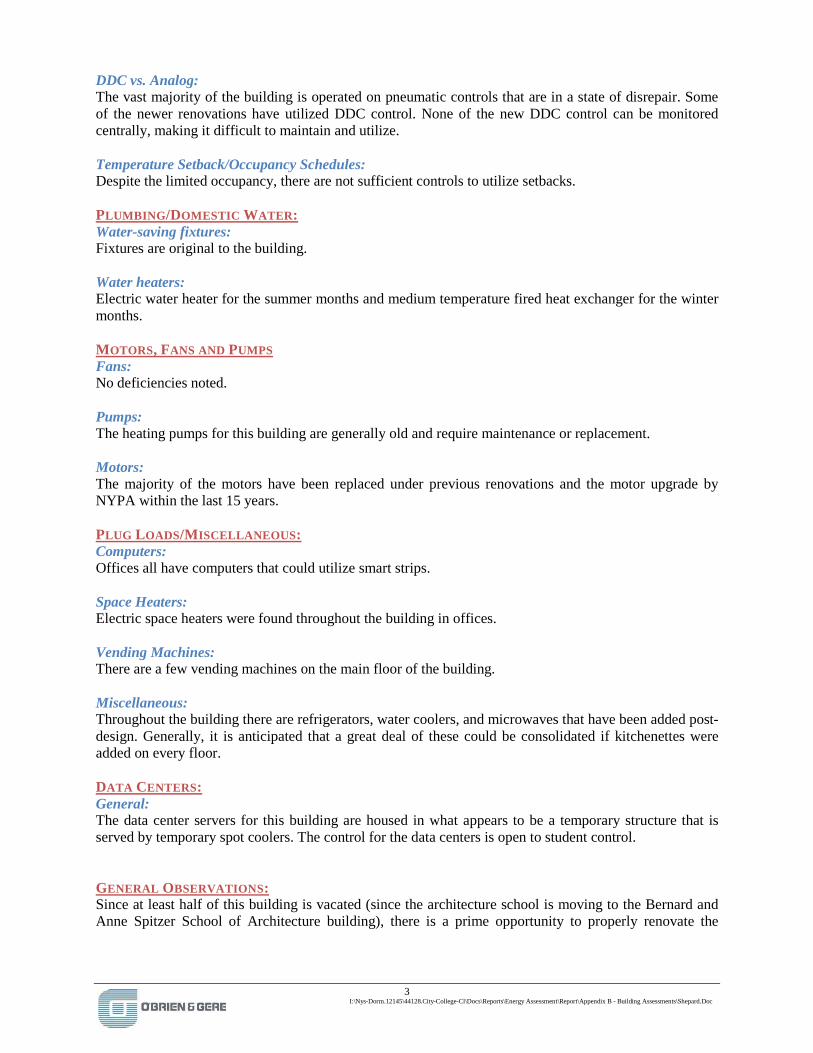
3 I:\Nys-Dorm.12145\44128.City-College-Cl\Docs\Reports\Energy Assessment\Report\Appendix B - Building Assessments\Shepard.Doc
DDC vs. Analog: The vast majority of the building is operated on pneumatic controls that are in a state of disrepair. Some of the newer renovations have utilized DDC control. None of the new DDC control can be monitored centrally, making it difficult to maintain and utilize. Temperature Setback/Occupancy Schedules: Despite the limited occupancy, there are not sufficient controls to utilize setbacks. PLUMBING/DOMESTIC WATER: Water-saving fixtures: Fixtures are original to the building. Water heaters: Electric water heater for the summer months and medium temperature fired heat exchanger for the winter months. MOTORS, FANS AND PUMPS Fans: No deficiencies noted. Pumps: The heating pumps for this building are generally old and require maintenance or replacement. Motors: The majority of the motors have been replaced under previous renovations and the motor upgrade by NYPA within the last 15 years. PLUG LOADS/MISCELLANEOUS: Computers: Offices all have computers that could utilize smart strips. Space Heaters: Electric space heaters were found throughout the building in offices. Vending Machines: There are a few vending machines on the main floor of the building. Miscellaneous: Throughout the building there are refrigerators, water coolers, and microwaves that have been added post-design. Generally, it is anticipated that a great deal of these could be consolidated if kitchenettes were added on every floor. DATA CENTERS: General: The data center servers for this building are housed in what appears to be a temporary structure that is served by temporary spot coolers. The control for the data centers is open to student control.
Since at least half of this building is vacated (since the architecture school is moving to the Bernard and Anne Spitzer School of Architecture building), there is a prime opportunity to properly renovate the
GENERAL OBSERVATIONS:

4 I:\Nys-Dorm.12145\44128.City-College-Cl\Docs\Reports\Energy Assessment\Report\Appendix B - Building Assessments\Shepard.Doc
vacated spaces. The elimination of fan coil units and consolidation of HVAC equipment into maintainable areas can impact the future comfort of its spaces. Leaks: There are several minor leaks in the basement pump room. Other: There are several pieces of large abandoned equipment and empty mechanical space in the basement of this building. Health and Safety Issues: The air handlers in this building are installed in such tight places that access to them is very difficult. Generally access needs to be a more prominent concern for future renovations in this building.

1 I:\Nys-Dorm.12145\44128.City-College-Cl\Docs\Reports\Energy Assessment\Report\Appendix B - Building Assessments\Shiff House Child CC.Doc
CITY COLLEGE ENERGY ASSESSMENT FACILITY SURVEY
SCHIFF HOUSE CHILD CARE CENTER
Year Constructed: 1912 FACILITY DESCRIPTION
Major Renovations: 1980? Floors Est. Gross Area (SF) Basement 1,115 First Floor 2,668 Second Floor 921
Total 4,704 Functional Description: This building provides on-campus daycare services. Occupancy: This building is typically occupied during normal office hours. BUILDING ENVELOPE Roof: Shingle roof, in good condition. Replaced within the last 15 years. Windows: Dual pane with thermal break. Insulation: Sagging insulation in basement, otherwise no noticeable deficiencies, despite the insulation being original to the building Air Infiltration: Operable windows are often used to temper over-heating. Door seals should be replaced. Some windows in a garage that has been turned into a class room need replacement to reduce infiltration. LIGHTING General: Renovated under the late 1990s NYPA study. Lighting Fixture Types: Dual bulb T8 lighting 1’x4’ lengths. Lighting Control Opportunities (day lighting, occupancy, scheduling): Limited occupancy sensor usage. Opportunities for occupancy and daylight sensors observed. Night Survey: Not applicable. HVAC
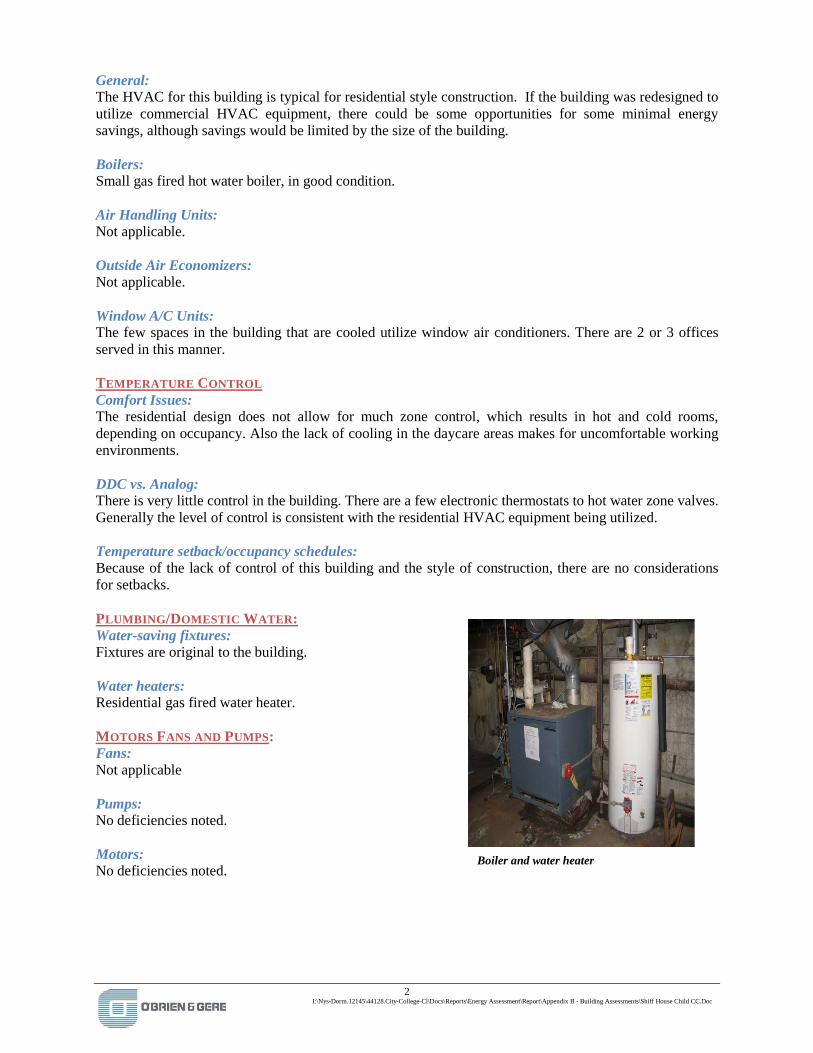
2 I:\Nys-Dorm.12145\44128.City-College-Cl\Docs\Reports\Energy Assessment\Report\Appendix B - Building Assessments\Shiff House Child CC.Doc
General: The HVAC for this building is typical for residential style construction. If the building was redesigned to utilize commercial HVAC equipment, there could be some opportunities for some minimal energy savings, although savings would be limited by the size of the building. Boilers: Small gas fired hot water boiler, in good condition. Air Handling Units: Not applicable. Outside Air Economizers: Not applicable. Window A/C Units: The few spaces in the building that are cooled utilize window air conditioners. There are 2 or 3 offices served in this manner. TEMPERATURE CONTROL Comfort Issues: The residential design does not allow for much zone control, which results in hot and cold rooms, depending on occupancy. Also the lack of cooling in the daycare areas makes for uncomfortable working environments. DDC vs. Analog: There is very little control in the building. There are a few electronic thermostats to hot water zone valves. Generally the level of control is consistent with the residential HVAC equipment being utilized. Temperature setback/occupancy schedules: Because of the lack of control of this building and the style of construction, there are no considerations for setbacks.
Water-saving fixtures: PLUMBING/DOMESTIC WATER:
Fixtures are original to the building. Water heaters: Residential gas fired water heater. MOTORS FANS AND PUMPSFans:
:
Not applicable Pumps: No deficiencies noted. Motors: No deficiencies noted.
Boiler and water heater
3 I:\Nys-Dorm.12145\44128.City-College-Cl\Docs\Reports\Energy Assessment\Report\Appendix B - Building Assessments\Shiff House Child CC.Doc
PLUG LOADS/MISCELLANEOUS: Computers: Computers can be put on smart strips in main offices. Space Heaters: Several found in the garage that was converted into a classroom. Vending Machines: Not applicable. Miscellaneous: Not applicable. GENERAL OBSERVATIONS: Because of the residential nature of this building and the small size, the energy saving opportunities here will be minimal. Leaks: None found. Other: Not applicable. Health and Safety Issues: None found.
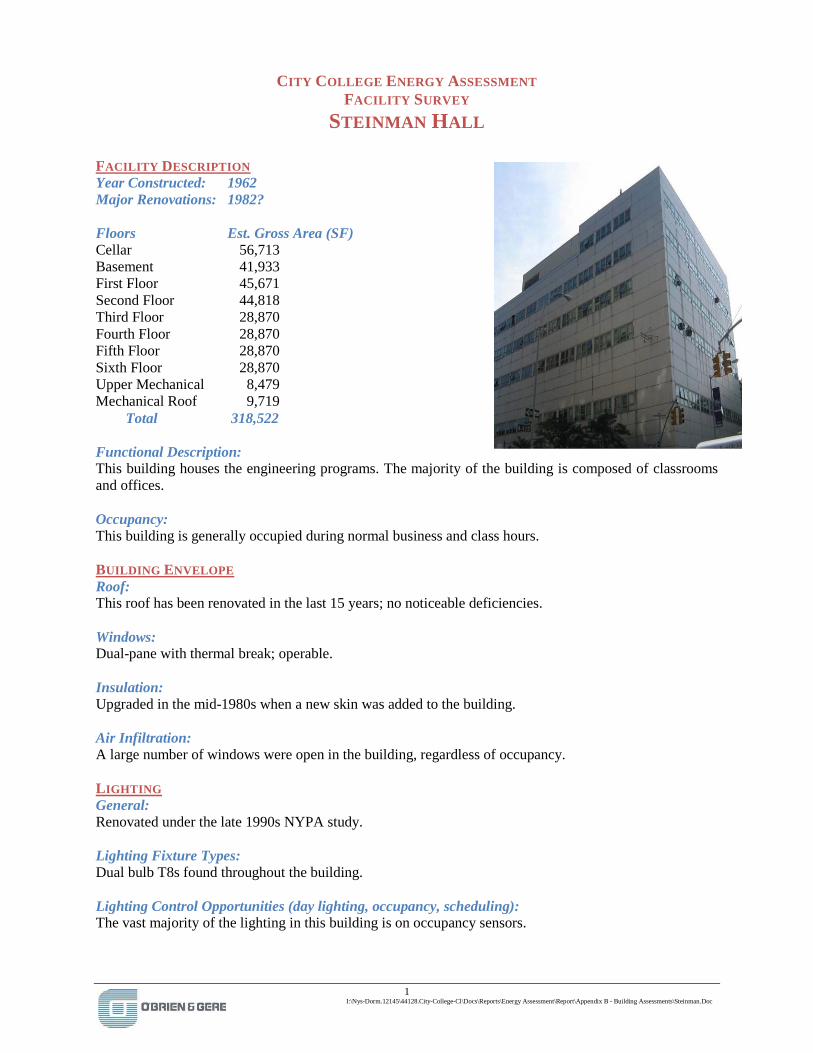
1 I:\Nys-Dorm.12145\44128.City-College-Cl\Docs\Reports\Energy Assessment\Report\Appendix B - Building Assessments\Steinman.Doc
CITY COLLEGE ENERGY ASSESSMENT FACILITY SURVEY
STEINMAN HALL
Year Constructed: 1962 FACILITY DESCRIPTION
Major Renovations: 1982? Floors Est. Gross Area (SF) Cellar 56,713 Basement 41,933 First Floor 45,671 Second Floor 44,818 Third Floor 28,870 Fourth Floor 28,870 Fifth Floor 28,870 Sixth Floor 28,870 Upper Mechanical 8,479 Mechanical Roof 9,719
Total 318,522 Functional Description: This building houses the engineering programs. The majority of the building is composed of classrooms and offices. Occupancy: This building is generally occupied during normal business and class hours. BUILDING ENVELOPE Roof: This roof has been renovated in the last 15 years; no noticeable deficiencies. Windows: Dual-pane with thermal break; operable. Insulation: Upgraded in the mid-1980s when a new skin was added to the building. Air Infiltration: A large number of windows were open in the building, regardless of occupancy. LIGHTING General: Renovated under the late 1990s NYPA study. Lighting Fixture Types: Dual bulb T8s found throughout the building. Lighting Control Opportunities (day lighting, occupancy, scheduling): The vast majority of the lighting in this building is on occupancy sensors.
2 I:\Nys-Dorm.12145\44128.City-College-Cl\Docs\Reports\Energy Assessment\Report\Appendix B - Building Assessments\Steinman.Doc
Night Survey: Common area lighting was on during the night survey. HVAC General: Mechanically, this building should be straight forward to heat and cool. However, the multitude of operable windows combined with the lack of functioning controls and airflow makes this building very uncomfortable without the use of window air conditioners and electric heaters. At the time of the assessment, a study was being performed by AECOM to further assess the issues with this building’s mechanical systems. Air Handling Units: This building’s air handling units are generally in good condition, with the exception of AHU-1 and AHU-2, both of which had noticeable repaired leaks on their coils from multiple freeze ups, and standing water in the drain pans. Outside Air Economizers: Generally, other than the fan coil units, this building is nearly 100% outside air, so economizers are not typically applicable. Window A/C Units: Spot cooling air conditioners and window air conditioners were found in many areas throughout the building. At least two thirds of the office areas had additional cooling of some sort. TEMPERATURE CONTROL Comfort Issues: The building is generally uncomfortable. The office areas are rarely in a comfortable temperature range without the use of temporary equipment, such as electric heaters or spot coolers. Additionally, some spaces use operable windows to mitigate the space temperature. DDC vs. Analog: The majority of the building is operated on pneumatic controls that are in a state of disrepair. Temperature Setback/Occupancy Schedules: There are not sufficient controls to utilize setbacks. PLUMBING/DOMESTIC WATER Water-saving fixtures: Fixtures are original to the building. Water heaters: Electric water heater for the summer months and medium temperature fired heat exchanger for the winter months.
3 I:\Nys-Dorm.12145\44128.City-College-Cl\Docs\Reports\Energy Assessment\Report\Appendix B - Building Assessments\Steinman.Doc
MOTORS, FANS AND PUMPS Fans: No deficiencies noted. Pumps: No deficiencies noted. Motors: The majority of the motors have been replaced under previous renovations and the motor upgrade by NYPA within the last 15 years. PLUG LOADS/MISCELLANEOUS Computers: Offices all have computers that could utilize smart strips. Space Heaters: Electric space heaters were found throughout the building in offices. Vending Machines: There are a few vending machines on the main floor of the building. Miscellaneous: Throughout the building there are refrigerators, water coolers, and microwaves that have been added post-design. Generally, it is anticipated that a great deal of these could be consolidated if kitchenettes were added on every floor. GENERAL OBSERVATIONS There have been several studies to evaluate the HVAC and general comfort in this building. One report that was reviewed notes that 60% of all the diffusers in the building provide either negligible or no air at all. There is a sign in the front entry of the building that essentially tells all occupants that they are very likely to be uncomfortable in this building. New renovations to the building generally do not account for changes to the existing systems because they are in such a state of dysfunction. Leaks: None found. Other: Not applicable. Health and Safety Issues: There is unsafe use of extension cords throughout the building. Microwaves, toaster ovens, refrigerators, coffee pots, electric heaters, computers, printers, fax machines and window air conditioners are found in offices, often with just a few outlets in each space, leading to use of multiple extension cords, in addition to the unsafe electrical conditions that they may cause when multiple pieces of equipment are used at once.

1 I:\Nys-Dorm.12145\44128.City-College-Cl\Docs\Reports\Energy Assessment\Report\Appendix B - Building Assessments\Structbio.Doc
CITY COLLEGE ENERGY ASSESSMENT FACILITY SURVEY
STRUCTURAL BIOLOGY CENTER (PARK GYM)
Year Constructed: 1937 FACILITY DESCRIPTION
Major Renovations: 1996, 2002, and 2006 Floors Est. Gross Area (SF) Sub-Basement 12,714 Basement 22,183 Ground Floor 8,692 First Floor 14,258
Total 57,847 Functional Description: This building is a rental property that houses a research facility for experiments with large magnets. Occupancy: This building has a wide range of occupancy, depending on the experiments that are being conducted.
Roof: BUILDING ENVELOPE
Rubber membrane, in good condition, Replaced within the last 12 years. Windows: Dual pane with thermal breaks. Insulation: Original to building; no major upgrades. Air Infiltration: Weather stripping in good condition.
General: LIGHTING
Facilities are undergoing upgrades to continually change lighting to the latest technology. Lighting Fixture Types: Lighting is being phased out over time from T12s to T8s and T5s; most are T8. Lighting Control Opportunities (day lighting, occupancy, scheduling): Occupancy sensors may yield minor savings, but there are very limited applications because occupants are already energy conscious (they turn their lights out when they are not in their offices).
The catwalk overlooking the NMR’s shows a very well maintained facility.
2 I:\Nys-Dorm.12145\44128.City-College-Cl\Docs\Reports\Energy Assessment\Report\Appendix B - Building Assessments\Structbio.Doc
Night Survey: Not applicable. HVAC General: This building’s HVAC is highly controlled and very well maintained. The tolerances for the experiments are only +/- 1 degree F over a 12 hour period. Most of the HVAC equipment is under 10 years old. Because tolerances are so tight, energy is typically a secondary consideration in this facility. Air Handling Units: The majority of the air is delivered to what is considered “lab space,” so there may be some limitations as to what air can be recirculated. Air handling equipment for the latest addition is electric heat and DX cooling. Generally, there are issues with control because they use variable volume air flow with electric heat and DX cooling, leading to coil frosting and electric coil failure. At the time of this energy assessment, electric coils that were less than 5 years old were being replaced due to failure. Boilers: There are 4 light commercial cast iron boilers that serve the year-round heating load in this facility. They are in good shape and well maintained. Chillers: This building primarily utilizes DX cooling for environmental control. However, several small (3 ton) chillers are used for process cooling. Reheat coils: This building utilizes full re-heat control, year round. Outside Air economizers: The vast majority of the systems in this building are 100% outside air. Window A/C units: None in this building. TEMPERATURE CONTROL Comfort Issues: No deficiencies noted. DDC vs. Analog: All of the controls in this building are DDC. However, there are two generations of controls that do not interact cohesively (York and Automated Logic). Temperature Setback/Occupancy Schedules: Because experiments occur at all times of the day, setback is not applicable. PLUMBING/DOMESTIC WATER Water-saving fixtures: Fixtures have been upgraded during renovations. Water heaters: Gas-fired water heater.
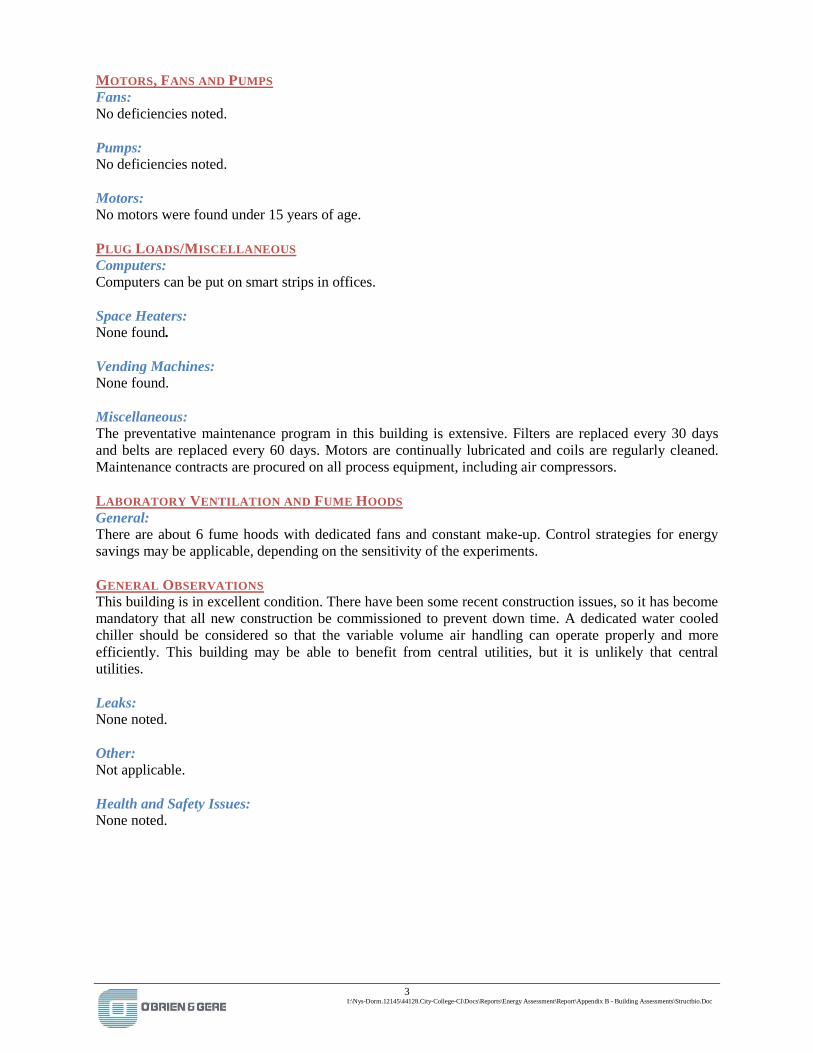
3 I:\Nys-Dorm.12145\44128.City-College-Cl\Docs\Reports\Energy Assessment\Report\Appendix B - Building Assessments\Structbio.Doc
MOTORS, FANS AND PUMPS Fans: No deficiencies noted. Pumps: No deficiencies noted. Motors: No motors were found under 15 years of age. PLUG LOADS/MISCELLANEOUS Computers: Computers can be put on smart strips in offices. Space Heaters: None found. Vending Machines: None found. Miscellaneous: The preventative maintenance program in this building is extensive. Filters are replaced every 30 days and belts are replaced every 60 days. Motors are continually lubricated and coils are regularly cleaned. Maintenance contracts are procured on all process equipment, including air compressors. LABORATORY VENTILATION AND FUME HOODS General: There are about 6 fume hoods with dedicated fans and constant make-up. Control strategies for energy savings may be applicable, depending on the sensitivity of the experiments. GENERAL OBSERVATIONS This building is in excellent condition. There have been some recent construction issues, so it has become mandatory that all new construction be commissioned to prevent down time. A dedicated water cooled chiller should be considered so that the variable volume air handling can operate properly and more efficiently. This building may be able to benefit from central utilities, but it is unlikely that central utilities. Leaks: None noted. Other: Not applicable. Health and Safety Issues: None noted.

1 I:\Nys-Dorm.12145\44128.City-College-Cl\Docs\Reports\Energy Assessment\Report\Appendix B - Building Assessments\Vivarium.Doc
THE CITY COLLEGE OF NEW YORK (CCNY) CAMPUS ENERGY ASSESSMENT
FACILITY SURVEY VIVARIUM
Year Constructed: 2007 FACILITY DESCRIPTION
Major Renovations: n/a Floors Est. Gross Area (SF) First Floor 6,681
Total 6,681 Functional Description: The Vivarium was constructed to temporarily house animal specimens while permanent facilities were being constructed as part of campus renovations and the new science building on the south campus. Occupancy: This building is typically occupied from 7 AM until 7 PM by building staff. Some areas house animals at all hours. BUILDING ENVELOPE Roof: The building is constructed of pre-insulated metal sandwich panels, typical of pre-engineered buildings. Good thermal and vapor barrier performance. Windows: None Insulation: Original to building; no major upgrades. Air Infiltration: New construction; no issues. LIGHTING General: New efficient 2’ by 4’ T-8 fluorescent lighting fixtures with electronic ballasts, timers and occupancy controls. Lighting Control Opportunities (day lighting, occupancy, scheduling): None Night Survey: Not surveyed. HVAC General:

2 I:\Nys-Dorm.12145\44128.City-College-Cl\Docs\Reports\Energy Assessment\Report\Appendix B - Building Assessments\Vivarium.Doc
The all-electric HVAC system is two years old and is not served by the central chilled water, steam or hot water systems. Air Handling Units: There are two independent air handling units, with the second unit having insufficient capacity to heat the facility under low ambient temperature conditions. During a failure last winter (2008), water pipes froze. Reheat coils: There is minimal reheat capability in this building. Outside Air Economizers: Present. Window A/C units: None in this building. TEMPERATURE CONTROL Comfort Issues: None. DDC vs. Analog: Full DDC control system monitored by Siemens Building Technologies. Temperature setback/occupancy schedules: No setbacks due to animal environmental requirements. PLUMBING/DOMESTIC WATER Water-saving fixtures: Toilet fixtures and lavatories are low-consumption units. Water heaters: Electric point-of-use type (10). MOTORS, FANS AND PUMPS Fans: Fume hood exhaust fans – intermittent operation. Pumps: None. Motors: New premium efficiency motors with drives where appropriate. PLUG LOADS/MISCELLANEOUS Computers: Computers can be put on smart strips in office area; Space Heaters: None found.

3 I:\Nys-Dorm.12145\44128.City-College-Cl\Docs\Reports\Energy Assessment\Report\Appendix B - Building Assessments\Vivarium.Doc
Vending Machines: None Miscellaneous: Large electrical hot water consumption for cleaning cages. GENERAL OBSERVATIONS When the need for space in the Vivarium decreases, resulting in underutilized areas, there will be an opportunity to reduce outside air to these areas (10 – 15 air changes per hour). Leaks: None observed Other: Self-contained, hot water unit-heaters above lobby area. Health and Safety Issues: None observed.
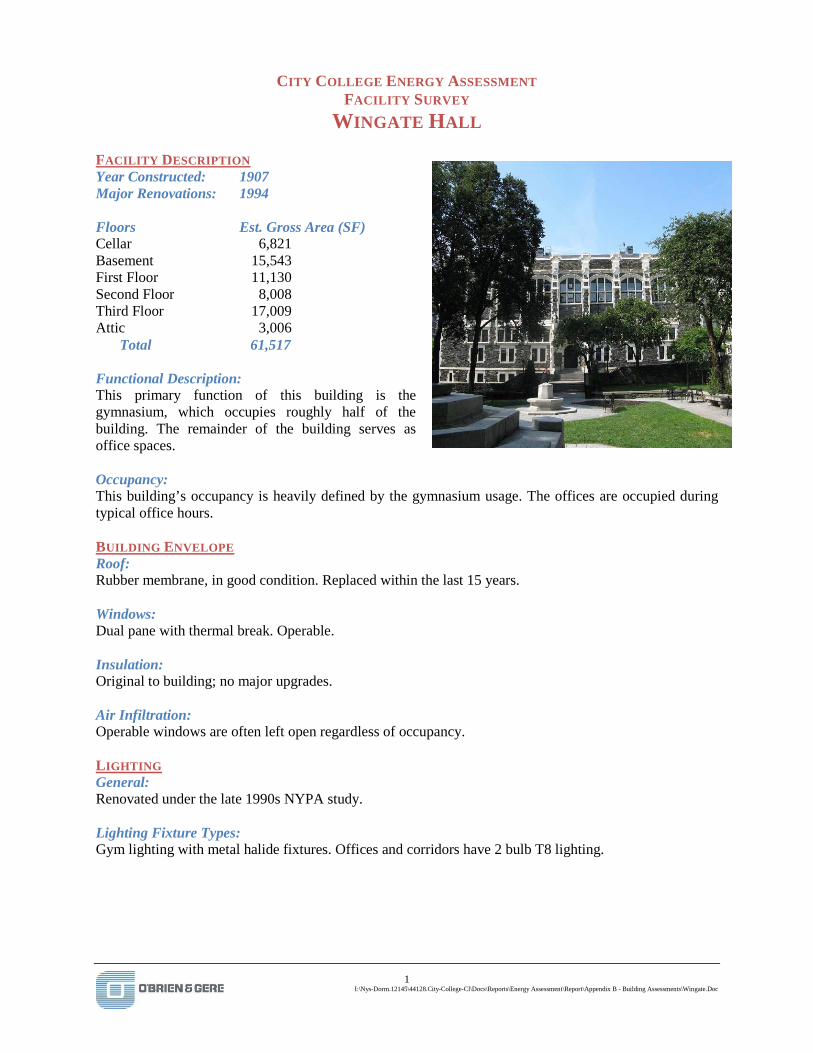
1 I:\Nys-Dorm.12145\44128.City-College-Cl\Docs\Reports\Energy Assessment\Report\Appendix B - Building Assessments\Wingate.Doc
CITY COLLEGE ENERGY ASSESSMENT FACILITY SURVEY
WINGATE HALL
Year Constructed: 1907 FACILITY DESCRIPTION
Major Renovations: 1994 Floors Est. Gross Area (SF) Cellar 6,821 Basement 15,543 First Floor 11,130 Second Floor 8,008 Third Floor 17,009 Attic 3,006
Total 61,517 Functional Description: This primary function of this building is the gymnasium, which occupies roughly half of the building. The remainder of the building serves as office spaces. Occupancy: This building’s occupancy is heavily defined by the gymnasium usage. The offices are occupied during typical office hours. BUILDING ENVELOPE Roof: Rubber membrane, in good condition. Replaced within the last 15 years. Windows: Dual pane with thermal break. Operable. Insulation: Original to building; no major upgrades. Air Infiltration: Operable windows are often left open regardless of occupancy. LIGHTING General: Renovated under the late 1990s NYPA study. Lighting Fixture Types: Gym lighting with metal halide fixtures. Offices and corridors have 2 bulb T8 lighting.

2 I:\Nys-Dorm.12145\44128.City-College-Cl\Docs\Reports\Energy Assessment\Report\Appendix B - Building Assessments\Wingate.Doc
Lighting Control Opportunities (day lighting, occupancy, scheduling): Control of the gymnasium lighting should be researched and occupancy sensors should be added to offices that do not already have them. Night Survey: The lighting for this building was mostly on during the night walk through. HVAC General: The HVAC systems for this building are in very poor condition. This building should be reviewed to determine if a full-scale renovation is feasible. Air Handling Units: In the cellar mechanical room there are 2 units, one for the offices and one for the gymnasium. The gymnasium unit is strictly heating and ventilation and the office unit has air conditioning. Generally, both units are beyond their useful life and are in need of replacement. The office unit recently had a cooling coil replacement. Reheat coils: Not applicable. Outside Air Economizers: The air handling unit dampers are in such a state of disrepair that automatic economizing is not feasible. Window A/C units: Air conditioning was recently added to the gymnasium via 12 window air conditioners. Spot coolers are also located in several offices. TEMPERATURE CONTROL Comfort Issues: Cooling is generally an issue for this building. The previous lack of air conditioning in the gymnasium was probably a large portion of this issue. DDC vs. Analog: All of the controls in this building are pneumatic, and most of them are non-functional. Temperature Setback/Occupancy Schedules: This building does not have controls capable of providing temperature setback. PLUMBING/DOMESTIC WATER Water-saving fixtures: Fixtures are original to the building. Water heaters: Medium temperature hot water fired domestic water heaters for winter use and electric water heaters for summer use. MOTORS, FANS AND PUMPS Fans: No deficiencies noted.

3 I:\Nys-Dorm.12145\44128.City-College-Cl\Docs\Reports\Energy Assessment\Report\Appendix B - Building Assessments\Wingate.Doc
Pumps: No deficiencies noted. Motors: Motors were replaced during the 1990s NYPA study. PLUG LOADS/MISCELLANEOUS Computers: Computers can be put on smart strips in offices. Space Heaters: There are one or two space heaters in this building. Vending Machines: Not applicable. Miscellaneous: Not applicable. GENERAL OBSERVATIONS The addition of air conditioning to the gymnasium would have been an opportunity to replace the air handling unit serving this space. Leaks: Mechanical room has several piping leaks around valves and coil connections. Other: Not applicable. Health and Safety Issues: None noted.

APPENDIX C
CCNY Campus Lighting Survey

CCNY Lighting Survey Summary
OfficeMechanical Space Classrooms CorridorsCorridors II * Great Hall Other areas Building TotalAaron Davis 1,520 4,403 4,361 900 56,536 67,720 Administration 30,446 4,992 1,584 3,591 15,005 55,618 Baskerville 13,926 3,243 13,594 8,847 16,008 55,618 Compton‐Goethals 14,786 14,946 30,318 10,170 67,709 137,929 Harris 33,098 19,006 14,561 11,904 40,458 119,027 Marshak 579,434 NAC 159,467 113,062 91,807 16,608 96,227 408,485 885,656 Shepard 38,788 26,997 73,212 28,826 9,609 14,942 147,866 340,239 Steinman 61,559 29,779 128,569 20,144 78,471 318,522 Vivarium 4,369 3,170 870 8,409 Wingate 12,612 5,683 486 3,389 39,347 61,517 Campus Total 370,571 225,281 352,547 106,703 110,327 14,942 869,885 2,050,255 Percentage 18% 11% 17% 5% 5% 1% 42%
Note: <MARSHAK SPACE NOT CLASSIFIED
O'Brien & Gere I:\Nys‐Dorm.12145\44128.City‐College‐Cl\Docs\Reports\Energy Assessment\Report\Appendix C ‐ Lighting\Lighting Summary‐final report.xls\Sheet1

Fixture Type Fixture Wattage Fixtures Qty. Conn. Load Space Function Area (SF) Rep. Load (W/SF) Total Area Total Lighting LoadAaron Davis3 Bulb T8 (24"x48") 78 6 468 Office 600 0.78 1,520 1,185.60 2 Bulb T8 54 4 216 Mechanical Space 650 0.33 4,403 1,463.15 N/A 0 0 ‐ Classrooms ‐ 2 Bulb T8 (24"x24") 33 9 297 Corridors 420 0.71 4,361 3,083.85 75W Incandescent bulb 75 27 2,025 Corridors II * 468 4.33 900 3,894.23
Average Other areas Other energy usage1.54 56,536 86,872.84
Total Wattage 96,499.68
Fixture Type Fixture Wattage Fixtures Qty. Conn. Load Space Function Area (SF) Rep. Load (W/SF) Total Area Total Lighting LoadAdminstration Building2 Bulb 48" T8 54 20 1,080 Office 1,125 0.96 30,446 29,228.16 N/A 0 0 ‐ Classroom ‐ ‐ ‐ 2 Bulb 48" T8 54 12 648 Corridors 1,150 0.56 1,584 892.55 2 Bulb 24" T8 29 7 203 Corridor 3rd Floor 168 1.21 3,591 4,339.13 2 Bulb 12"x48" T8 54 13 702 Mechanical Space 1,440 0.49 4,992 2,433.60
Average Other areas Other energy usage0.80 15,005 12,076.44
Total Wattage 48,969.88
Fixture Type Fixture Wattage Fixtures Qty. Conn. Load Space Function Area (SF) Rep. Load (W/SF) Total Area Total Lighting LoadBaskerville4 Bulb T8 109 4 436 Office 285 1.53 13,926 21,304.34 2 Bulb T8 60 8 480 Classroom 882 0.54 13,594 7,398.10 2 Bulb T8 70 4 280 Mechanical 518 0.54 3,243 1,752.97 1 Bulb T8 39 4 156 Corridors 1 375 0.42 8,847 3,680.35
Average Other areas Other energy usage0.76 16,008 12,128.39
Total Wattage 46,264.15
Fixture Type Fixture Wattage Fixtures Qty. Conn. Load Space Function Area (SF) Rep. Load (W/SF) Total Area Total Lighting LoadCompton‐Goethals3 Bulb T8 78 28 2,184 Office 1,600 1.37 14,786 20,182.89 3 Bulb T8 78 6 468 Classrooms 532 0.88 30,318 26,670.72 2 Bulb T8 54 6 324 Mechanical 800 0.41 14,946 6,053.13 1 Bulb T8 35 30 1,050 Corridors 1,113 0.94 10,170 9,597.53
Average Other areas Other energy usage0.90 67,709 60,826.54
Total Wattage 123,330.81
* Corridors II - Lighting in these corridors are limited to incandescent lighting.
O'Brien & Gere I:\Nys‐Dorm.12145\44128.City‐College‐Cl\Docs\Reports\Energy Assessment\Report\Appendix C ‐ Lighting\Lighting Summary‐final report.xls\Sheet1

Fixture Type Fixture Wattage Fixtures Qty. Conn. Load Space Function Area (SF) Rep. Load (W/SF) Total Area Total Lighting LoadHarris Hall24"x24" 3 bulb T8 43 6 258 Office 220 1.17 33,098 38,814.93 2 Bulb T8 50 8 400 Mechanical Space 980 0.41 14,561 5,943.27 Dual (quad bulb) T8 Recessed Lighting 50 38 1,900 Corridors 1,842 1.03 11,904 12,278.83 24"x24" 3 bulb T8 50 8 400 Classrooms 450 0.89 19,006 16,894.22
Average Other areas Other energy usage0.88 40,458 35,413.56
Total Wattage 109,344.81
Fixture Type Fixture Wattage Fixtures Qty. Conn. Load Space Function Area (SF) Rep. Load (W/SF) Total Area Total Lighting LoadWingate Hall1 Bulb T8 35 4 140 Office 130 1.08 12,612 13,582.15 1 Bulb T8 35 8 280 Classrooms 486 0.58 486 280.00 1 Bulb T8 35 28 980 Corridors 1,200 0.82 3,389 2,767.68 2 Bulb T8 60 16 960 Mechanical 1,600 0.60 5,683 3,409.80
Average Other areas Other energy usage0.77 39,347 30,196.08
Total Wattage 50,235.72
Day CareFix. Type No. of Fix. WATT/Fix. WATT Total9W CF 3 11 333F17T8 15 43 6451F34T8 1 37 372F32T8 9 60 5403F32T8 7 88 616
Total WATTs/Building 1,871
O'Brien & Gere I:\Nys‐Dorm.12145\44128.City‐College‐Cl\Docs\Reports\Energy Assessment\Report\Appendix C ‐ Lighting\Lighting Summary‐final report.xls\Sheet1
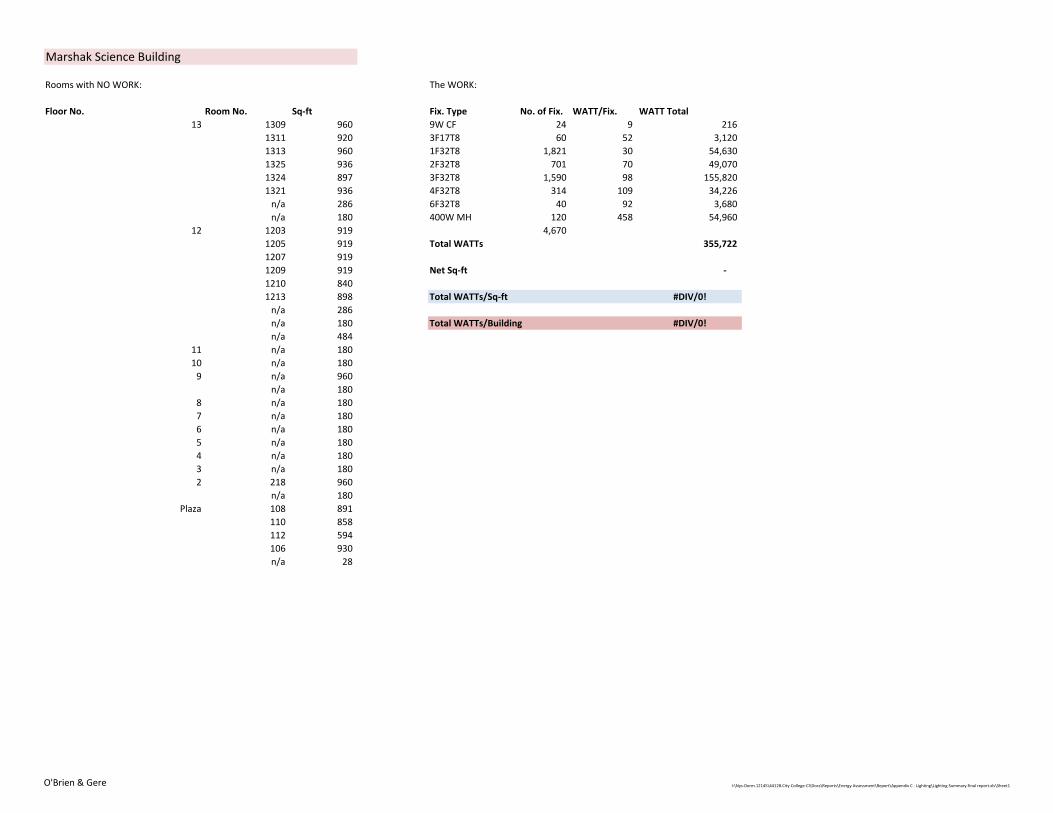
Marshak Science Building
Rooms with NO WORK: The WORK:
Floor No. Room No. Sq‐ft Fix. Type No. of Fix. WATT/Fix. WATT Total13 1309 960 9W CF 24 9 216
1311 920 3F17T8 60 52 3,120 1313 960 1F32T8 1,821 30 54,630 1325 936 2F32T8 701 70 49,070 1324 897 3F32T8 1,590 98 155,820 1321 936 4F32T8 314 109 34,226 n/a 286 6F32T8 40 92 3,680 n/a 180 400W MH 120 458 54,960
12 1203 919 4,670 1205 919 Total WATTs 355,722 1207 919 1209 919 Net Sq‐ft ‐ 1210 840 1213 898 Total WATTs/Sq‐ft #DIV/0!n/a 286 n/a 180 Total WATTs/Building #DIV/0!n/a 484
11 n/a 180 10 n/a 180 9 n/a 960
n/a 180 8 n/a 180 7 n/a 180 6 n/a 180 5 n/a 180 4 n/a 180 3 n/a 180 2 218 960
n/a 180 Plaza 108 891
110 858 112 594 106 930 n/a 28
O'Brien & Gere I:\Nys‐Dorm.12145\44128.City‐College‐Cl\Docs\Reports\Energy Assessment\Report\Appendix C ‐ Lighting\Lighting Summary‐final report.xls\Sheet1

Floor No. Room No. Sq‐ft117 1,578 118 504 116 1,023 115 693 114 594
St. Level 31B 135 31A 126 29D 138 29E 45
Vestibule 678 ST02 69 1, 1A 1,325 2, 2A 3,504 21D 65
Vestibule 451 3, 3A 3,516 23B 208 4, 4A 336 n/a 611
Vestibule 471 41 34 SC6 195
40, 40A 109 SC7 161 45 206
44, 44A 90 S14H 810
Up. Locker R‐M 645 n/a 1,122 J‐M 90 I‐M 640 M2 130
Sub‐Base unexcav. 1,586
TOTAL No Work Sq‐ft 41,348
TOTAL Building Sqft (ext) 620,782
Net Sq‐ft 579,434
O'Brien & Gere I:\Nys‐Dorm.12145\44128.City‐College‐Cl\Docs\Reports\Energy Assessment\Report\Appendix C ‐ Lighting\Lighting Summary‐final report.xls\Sheet1

Fixture Type Fixture Wattage Fixtures Qty. Conn. Load Space Function Area (SF) Rep. Load (W/SF) Total Area Total Lighting LoadNAC Building4F32T8/TAN 56 2 112 Office 101 1.11 159,467 176,834.69 4F32T98/TAN 56 16 896 Classroom 766 1.17 91,807 107,387.82 CFQ26W 50 148 7,400 Corridor 1st fl. 3,824 1.94 16,608 32,138.91 1F32T8 37 22 814 Corridors 1,484 0.55 96,227 52,782.20 2F32T8 65 50 3,250 Mechanical space 8,569 0.38 113,062 42,881.49
Average Other areas Other energy usage1.03 408,485 420,050.17
Total Wattage 832,075.29
Fixture Type Fixture Wattage Fixtures Qty. Conn. Load Space Function Area (SF) Rep. Load (W/SF) Total Area Total Lighting LoadShepard HallCFT40W biax (2) 72 20 1,440 Office 491 2.93 38,788 113,757.07 CFT40W biax (2) 72 20 1,440 Classroom Type I (75 491 2.93 54,909 161,036.58 ED17 bulb (MV/HID) 70 4 280 Classroom Type II (25 491 0.57 18,303 10,437.56 CFT50W biax (3) 162 10 1,620 Corridors Type I (75% 1,826 0.89 28,826 25,573.55 ED17 bulb (MV/HID) 70 13 910 Corridors Type II (25% 2,255 0.40 9,609 3,877.49 2F32T8 60 8 480 Mechanical space 865 0.55 26,997 14980.99Total load per DASNY contract # 6510-1116-2390 (1996) 42,286 Great Hall 14,942 2.83 14,942 42,286.00
Average Other areas Other energy usage1.59 147,866 234,716.17
REFERENCE DATAPercent of total sqft 75% 25%Classrooms 73,212 54,909 18,303 Total Wattage 606,665.40 Corridors 38,434 28,826 9,609
Great Halltotal load per fixt.
12,796 12,796 3,040 3,040
76 152 228 152 152 228 912 912 304 498
7,000 42,286
O'Brien & Gere I:\Nys‐Dorm.12145\44128.City‐College‐Cl\Docs\Reports\Energy Assessment\Report\Appendix C ‐ Lighting\Lighting Summary‐final report.xls\Sheet1

Fixture Type Fixture Wattage Fixtures Qty. Conn. Load Space Function Area (SF) Rep. Load (W/SF) Total Area Total Lighting LoadSteinman Hall4F32T8 109 2 218 Office 303 0.72 61,559 44,289.97 2F32T8 60 34 2,040 Classroom 1,384 1.47 128,569 189,509.22 2F32T8 60 7 420 Corridors 515 0.82 20,144 16,428.12 2F32T8 60 9 540 Mechanical space 1,875 0.29 29,779 8,576.35
Average Other areas Other energy usage0.82 78,471 64,679.61
Total Wattage 323,483.27
Fixture Type Fixture Wattage Fixtures Qty. Conn. Load Space Function Area (SF) Rep. Load (W/SF) Total Area Total Lighting LoadVivarium4F32T8 109 2 218 Office/Laboratories 66 3.29 4,369 14,376.48
4F32T8 109 5 545 Corridors 201 2.72 870 2,364.84 2F32T8 60 24 1,440 Mechanical space 2,470 0.58 3,170 1,848.10
Average Other areas Other energy usage2.20 none none
Total Wattage 18,589.42
O'Brien & Gere I:\Nys‐Dorm.12145\44128.City‐College‐Cl\Docs\Reports\Energy Assessment\Report\Appendix C ‐ Lighting\Lighting Summary‐final report.xls\Sheet1

APPENDIX D
Sample Owner’s Project Requirement (OPR) for the
Commissioning Process

I:\Nys-Dorm.12145\44128.City-College-Cl\Docs\Reports\Energy Assessment\Report\Appendix D - Sample OPR\OPR.Doc
…with offices in 25 major metropolitan areas and growing. www.obg.com
Sample Owner’s Project Requirements (OPR) for the Commissioning Process
Architectural:
1. Minimum building composite R-Value of “20” 2. Windows – Dual pane, thermal breaks, low-e film, non-operable, Maximum U-Value of “0.5”
a) Spaces with operable windows require switches that shut off mechanical conditioning equipment to the space when they are open.
3. Mechanical spaces (including shafts), “10%” of total building square footage, minimum room height of 12’to bottom of structure, minimum access of 30” wide by 7’ tall access to all pieces of equipment, access doors, and actuators (includes sprinkler equipment, plumbing and HVAC)
4. Electrical spaces, “4%” of total building square footage, code required access met, no water distribution within electrical spaces
5. Access to an electrical or mechanical space via a conventional ladder (permanent or portable) is prohibited. All equipment spaces are to be accessed by stairs or a ship’s ladder (at a minimum).
6. Proper access to all valves located within wet-walls, either through access doors or full mechanical rooms (if required)
7. Code Compliance: NYC, IBC, Energy Code, and OSHA 8. Building Energy Model, compared against Benchmark buildings of similar type (can be excluded for
buildings and renovations under 10,000 sq.ft.) 9. LEED certified minimum
Maintenance and Operations:
1. Equipment list (by A/E) to be entered into Archibus (by owner) 2. Preventative Maintenance plan, including but not limited to: required spare parts, frequency of
maintenance, lubrication schedules, potential safety issues, and required tools to perform maintenance 3. Training (by A/E and/or equipment representatives), including but not limited to: where the utilities are
fed from (electrical panel, central chilled water, central hot water, or local utilities), how to isolate the equipment from utilities, how each system operates under normal conditions, how to maintain the equipment and perform preventative maintenance, any trouble-shooting information that may be helpful
4. Controls Training by the controls vendor for an 8 hour classroom session and a minimum of 2 weeks availability for questions and answers on any new building
5. Valve list (all control valves, size, type, location) 6. Steam Trap List - size, type, location 7. Utilize smart strips for computer ancillary equipment (by owner)
Construction and Design Management:
1. Provide “enhanced” commissioning (commissioning of design and construction) for all projects 2. Include facilities staff often and early in design considerations 3. Ensure standards are met
Electrical:
1. Generators are to be installed at either ground level or in a basement, with appropriate consideration for maintenance and large replacement parts
2. Proper (code required) access shall be provided for all electrical panels 3. Metering on each building 4. Lighting:
a) Watt/Sq.ft. density range for all room usage types 1) Corridors: .5-.7 2) Classrooms: .6-1
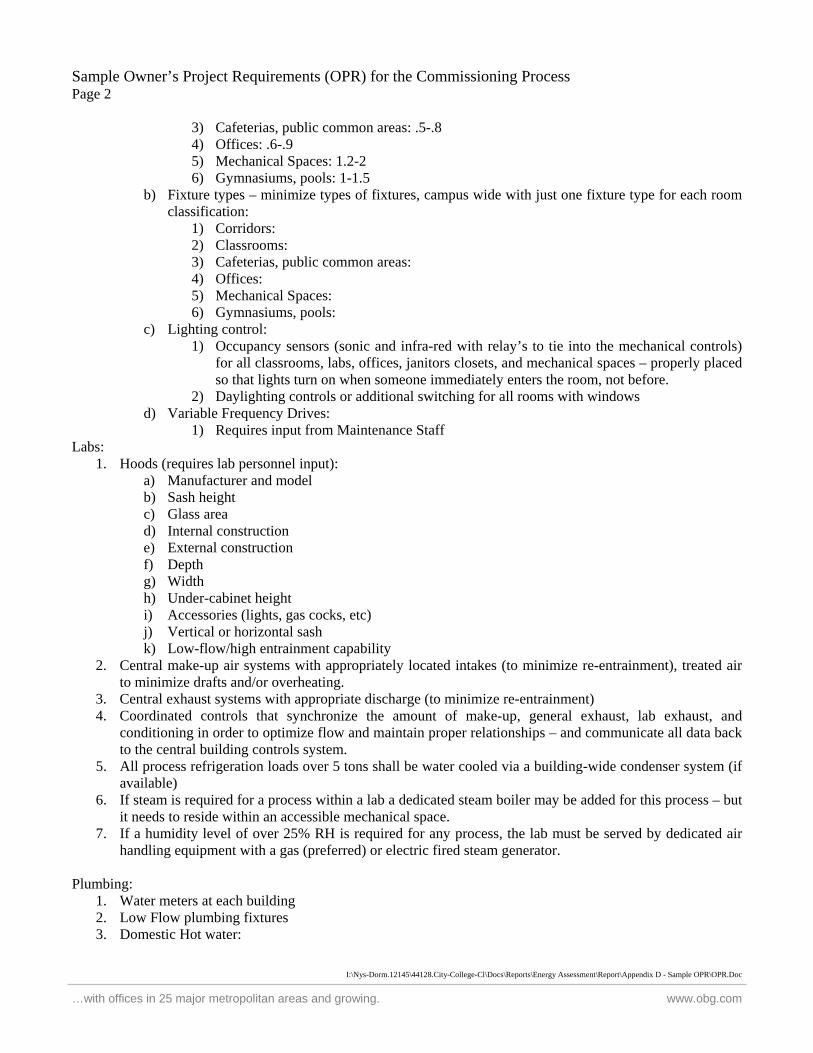
Sample Owner’s Project Requirements (OPR) for the Commissioning Process Page 2
I:\Nys-Dorm.12145\44128.City-College-Cl\Docs\Reports\Energy Assessment\Report\Appendix D - Sample OPR\OPR.Doc
…with offices in 25 major metropolitan areas and growing. www.obg.com
3) Cafeterias, public common areas: .5-.8 4) Offices: .6-.9 5) Mechanical Spaces: 1.2-2 6) Gymnasiums, pools: 1-1.5
b) Fixture types – minimize types of fixtures, campus wide with just one fixture type for each room classification:
1) Corridors: 2) Classrooms: 3) Cafeterias, public common areas: 4) Offices: 5) Mechanical Spaces: 6) Gymnasiums, pools:
c) Lighting control: 1) Occupancy sensors (sonic and infra-red with relay’s to tie into the mechanical controls)
for all classrooms, labs, offices, janitors closets, and mechanical spaces – properly placed so that lights turn on when someone immediately enters the room, not before.
2) Daylighting controls or additional switching for all rooms with windows d) Variable Frequency Drives:
1) Requires input from Maintenance Staff Labs:
1. Hoods (requires lab personnel input): a) Manufacturer and model b) Sash height c) Glass area d) Internal construction e) External construction f) Depth g) Width h) Under-cabinet height i) Accessories (lights, gas cocks, etc) j) Vertical or horizontal sash k) Low-flow/high entrainment capability
2. Central make-up air systems with appropriately located intakes (to minimize re-entrainment), treated air to minimize drafts and/or overheating.
3. Central exhaust systems with appropriate discharge (to minimize re-entrainment) 4. Coordinated controls that synchronize the amount of make-up, general exhaust, lab exhaust, and
conditioning in order to optimize flow and maintain proper relationships – and communicate all data back to the central building controls system.
5. All process refrigeration loads over 5 tons shall be water cooled via a building-wide condenser system (if available)
6. If steam is required for a process within a lab a dedicated steam boiler may be added for this process – but it needs to reside within an accessible mechanical space.
7. If a humidity level of over 25% RH is required for any process, the lab must be served by dedicated air handling equipment with a gas (preferred) or electric fired steam generator.
Plumbing:
1. Water meters at each building 2. Low Flow plumbing fixtures 3. Domestic Hot water:
Sample Owner’s Project Requirements (OPR) for the Commissioning Process Page 3
I:\Nys-Dorm.12145\44128.City-College-Cl\Docs\Reports\Energy Assessment\Report\Appendix D - Sample OPR\OPR.Doc
…with offices in 25 major metropolitan areas and growing. www.obg.com
a) Each building shall utilize a heat exchanger to convert 260 degree F high temperature hot water from the central plant (NAC) to 140 degree F hot water to service the building with domestic hot water. No storage is to be utilized for this system – all hot water shall be made on demand. If lower temperature water is required at the fixtures (for safety) then mixing is to occur at point of use – water temperature is not to be reduced at the heat exchanger to less than 140 degrees F (all mixing valves are to be appropriately accessible, labeled, and controlled). The heat exchanger shall have a maximum pressure drop of “x” PSI on the plant side and utilize no more than a 20 degree F delta on the plant side.
b) Summer Domestic water heaters sized for the building load (gas-fired preferred) HVAC:
1. Each building is to have a set of Variable speed Tertiary chilled water pumps, controlled by the central plant (NAC) controls system to provide appropriate chilled water flow and pressure to the building.
2. The Tertiary pumps are to be optimized so that if the system is enabled at least one chilled water valve is 90% open. (the system is not to be over-pumped)
3. All chilled water control valves are to be of the 2-way type 4. Any building with a winter cooling load greater than 50 tons shall utilize a winterized cooling tower for
winter economizer. 5. All building chilled water generation and spot-cooling shall be minimized, all winter cooling over 5 tons
is to be done via economizers (via closed-circuit cooling towers) where available. 6. Computer labs and other non-server room applications that require winter cooling shall be served from a
dedicated unit (which serves only areas that require year-round cooling) with economizer capabilities. 7. Server rooms (any computer room with more than 2 servers in it) will be served by redundant computer
room units with dedicated refrigeration systems (independent of all campus systems). a) All environmental equipment for server rooms shall be exterior to the room, to prevent damage
from leaks and maximize access by maintenance personnel. b) All controls for server units shall have 100% communication and control via the central facilities
controls systems. c) Any units requiring winter cooling shall utilize an air-side economizer.
8. The chilled water temperature from the central plant is to be assumed to be 45 degrees F and shall be designed to leave each building at 55 degrees F.
9. Prior to HVAC system design, the mechanical designer shall submit the cooling and heating loads to the central plant supervisor (John Mariello) to ensure that there is appropriate capacity available. If additional capacity is required it is to be added to the central plant – building specific utilities for environmental control is unacceptable.
10. Each building shall utilize a heat exchanger to convert 260 degree F high temperature hot water from the central plant (NAC) to 180 degree hot water to service the building with heating water. The heat exchanger shall have a maximum pressure drop of “x” PSI on the plant side and utilize no more than a 20 degree F delta on the plant side. The use of steam for building environmental conditioning is prohibited.
11. No system shall be designed to include summer re-heating (summer heating is not available) – summer boilers shall not be used in this capacity.
12. Terminal heating and air-handler pre-heating systems are to be served by separate redundant pumping systems.
13. All terminal heating units are to be recessed and controlled via fan operation with constant hot water flow. The use of control valves to manipulate heat flow in terminal heating units is prohibited. Terminal heating may only be used in vestibules or mechanical spaces. Fan-coil units, 2-pipe or 4-pipe are not to be used for conditioning of classrooms or otherwise occupied spaces without the direct consent of the facilities chief supervisor.

Sample Owner’s Project Requirements (OPR) for the Commissioning Process Page 4
I:\Nys-Dorm.12145\44128.City-College-Cl\Docs\Reports\Energy Assessment\Report\Appendix D - Sample OPR\OPR.Doc
…with offices in 25 major metropolitan areas and growing. www.obg.com
14. In buildings with high humidity concerns or outside airflows over 1000 CFM or buildings over 5000 square feet, dedicated make-up air units with heat-recovery are to be used to reduce relative humidity of incoming outside air, and maintain space relative humidity under 60% in summer conditions. In buildings over 5000 square feet the make-up air unit is to be sized no less than 20% of the total supply airflow for the building.
15. Air handling units: a) Double-wall/washable b) All Air handlers over 1000 CFM shall have an economizer function – all units (regardless of
CFM) that require winter cooling shall have an economizer. c) Minimum pre-filters of 30% (MERV 7) efficiency and bag filters (24”x24”x21” long) with a
minimum efficiency of 65% bag filters d) Any Air handling unit with a filter bank that is over 6 feet tall shall have an access door large
enough to accommodate an appropriately sized ladder to reach higher filters, and the mechanical room shall be designed to allow access to this door with an appropriately sized ladder.
e) All draw-thru configuration, blow through configuration is unacceptable. In situations where blow-through units are unavoidable then access doors downstream of the fan are to open inward
f) All fans and belts are to have guards within the units so that the unit may be entered safely while the unit is energized
g) All actuators and sensors are to be electronic h) All supply fans serving more than 1000 square feet and multiple zones are to have VFD’s with
optimized pressure control, so at least one VAV is at least 90% open i) All return fans that serve air handlers with supply fan VFD’s shall have independently controlled
VFD’s to maintain a neutral or slightly negative static pressure at the inlet of the air handler. In economizer mode the return fan is to control so that a floor 3/4 the height of the building (9th floor of a 12 story building) is maintained at a neutral pressure with relationship to the outdoor barometric pressure. Tracking return fan speed with supply fan speed is prohibited.
j) All chilled water coils are to utilize stainless steel, double-walled, sloped-to-drain drain pains. k) In air handling units where there is a walk-in enclosure, piping shall not interfere with the door
swing of access doors l) Access doors are not sufficient if there is piping in front of them or blocking the access they
provide. m) Humidifiers are not permitted on air handlers providing comfort conditioning for spaces not
containing a process (lab space). n) Ventilation Control - The design ventilation load (as calculated per ASHRAE 62.2, or the most
stringent applicable code requirements) shall be listed on the drawings as the design ventilation point. The balancer and controls contractor shall determine at what point the outside air dampers need to be positioned in order to achieve design ventilation CFM when the fan is at 100%. Each unit shall have the ability to be scheduled into an “un-occupied” mode where the outside air dampers go closed.
a) All air handlers that have some zones with CO2 control shall modulate the outside air dampers according to demand. If all zones with CO2 control that a unit serves are satisfied the outside air damper may close an amount equal to the current amount that the fan has reduced speed (a fan at 30 Hz or 50% speed will allow the outside air damper to close 50%). If any single zone with CO2 control is 100% open and still not satisfied then the outside air damper may open an additional 10% (10% of the total CFM of outside air).
b) Air handlers with all zones having CO2 control may modulate the outside air damper closed if all zones are satisfied. The outside air dampers shall modulate so that no single zone is more than 90% open and calling for additional ventilation.

Sample Owner’s Project Requirements (OPR) for the Commissioning Process Page 5
I:\Nys-Dorm.12145\44128.City-College-Cl\Docs\Reports\Energy Assessment\Report\Appendix D - Sample OPR\OPR.Doc
…with offices in 25 major metropolitan areas and growing. www.obg.com
c) Air handlers with no zones having CO2control shall maintain the design ventilation damper setpoint unless the building has been scheduled to “un-occupied”, or the unit is in economizer mode and the dampers are opening beyond the design setpoint.
o) Access doors shall be provided to view both sides of each coil, to change filters, to access mixing box dampers, and to access any fans within the unit.
16. Zones: a) Designed to serve areas of similar loading with a target of 400 square feet per zone. No single
room may vary in load more than 15% from any other room within the same zone. b) Offices over 400 Square feet shall have their own zone. c) Each classroom shall have its own zone d) Each classroom shall be equipped with a CO2 sensor that assists in control of its associated VAV
box. e) Any zone over 1000 square feet or an occupancy greater than 10 people shall be equipped with a
CO2 sensor that assists in control of its associated VAV box f) Each VAV box that has a CO2 sensor shall vary from 100% open to fully closed. Upon a call for
cooling or a CO2 reading above setpoint the VAV box shall open. If both temperature and CO2 setpoints are satisfied then the VAV box shall close.
g) Each VAV box without CO2 control shall vary from a minimum ventilation position to 100% design.
h) Each zone shall have a total airflow of no less than 1 CFM/sq.ft. of space served. Corner offices and conference rooms shall have a total airflow of no less than 2 CFM/sq.ft. of space served.
i) Any zone with perimeter radiation is to be controlled via the VAV zone controller to ensure no simultaneous heating and cooling is occurring.
17. The net positive airflow of any single building should not exceed 5% of the total supply volume. 18. Controls:
a) All controls shall be Direct Digital Control b) All controls shall communicate directly to the facilities central plant via BACNet, and shall
communicate in BACNet at the controller level, in accordance with ASHRAE 135, and confirmed by BACNet testing laboratories (at the time of this report, this includes, Alerton, Automatic Logic, Johnson, Siemens, and Delta Controls).
c) All controls shall be web based with one server per building and a minimum of 3 licenses. d) All setpoints shall be adjustable, with a toggle switch to be returned to basis of design. e) A screen with an alarm table shall be developed with a list of all alarms. From this table each
alarm shall be able to be configurable to generate an output to the campus Archibus system, including a pick-box for facilities to determine which alarms generate outputs.
f) Chilled water shall be normally closed g) Hot water valves shall be normally open h) Upon a freeze alarm valves go to normal position. i) The following alarms shall be developed (as a minimum):
a. VFD failure b. Fan failure c. Freezing temperature on coil discharges d. Filter pressure drop (adjustable) e. Low discharge temp f. High discharge temp g. Room Temp (+/- 7 degrees from setpoint, adjustable)
j) All controls shall have the following graphics for each building (as a minimum): 1) A Primary selection screen, with individual links to each schematic screen. 2) A chilled water schematic detailing (at a minimum):

Sample Owner’s Project Requirements (OPR) for the Commissioning Process Page 6
I:\Nys-Dorm.12145\44128.City-College-Cl\Docs\Reports\Energy Assessment\Report\Appendix D - Sample OPR\OPR.Doc
…with offices in 25 major metropolitan areas and growing. www.obg.com
a. Chilled Water temperature entering the building b. Chilled water temperature entering and leaving each AHU c. Tertiary Chilled water pumps status and speed d. Tertiary loop pressure e. All chilled water valve positions
3) A hot water schematic detailing (at a minimum): a. Entering and leaving temperature and pressure of the plant HTHW b. Hot water temperature entering and leaving each AHU c. Hot water temperature entering and leaving each Heat Exchanger d. Each AHU hot water valve position e. Hot water pumps status and speed f. The position of the most open hot water valve
4) A schematic for each Air Handler detailing (at a minimum): a. Damper positions – including return air, outside air, relief air, and supply air (if
applicable) b. Valve positions and water temperatures (entering and leaving the unit) c. Mode – economizer, occupied, unoccupied, morning warm-up d. Air temperatures: Entering and leaving air temperatures on all coils, return air,
outside air, mixed air, and supply air e. Supply fan status and speed (if applicable) f. Position of the most open VAV box (if applicable) g. Static pressure downstream of the supply fan (~2/3 the total system length) h. Return fan status and speed (if applicable) i. Static pressure at the inlet of the air handler j. Filter pressure drop
5) A zone selection screen with links to each zone, that details (at a minimum): a. Zone temperature b. Zone setpoints (heating and cooling) c. VAV box position (if applicable) d. Re-heat valve position (if applicable) e. Zone discharge air temperature (if a re-heat coil is applied) f. Finned-tube valve position (if applicable) g. Notification if the zone is calling for heating or cooling
k) The following Documentation shall be provided on all projects, as a minimum: 1) Valve Tags 2) As-built sequence of operations 3) As-built duct shop drawings 4) As-built piping drawings 5) Approved submittals – Field confirmed that what was submitted was supplied 6) Commissioning binders (with all testing data) 7) Basis of Design (prepared by the engineer) 8) Job Specific Owner’s Project Requirements 9) Operation and maintenance manuals 10) Screen shots from the DDC system showing the final graphics for each AHU running in
normal operation


![50 PEDAGOGY MCQS · October 1, 2019 [50 PEDAGOGY MCQS – PAK MCQS PK] PAK MCQS PK Page 5 B. Formative assessment C. Summative assessment D. Contemporary assessment 65. According](https://static.fdocuments.in/doc/165x107/5e45f1c959717e58fe1604c5/50-pedagogy-mcqs-october-1-2019-50-pedagogy-mcqs-a-pak-mcqs-pk-pak-mcqs-pk.jpg)