Energy and Resource Consultants,...
27
1 Energy and Resource Consultants, Inc. VALUING CHANGES IN MORBIDITY: WTP VERSUS COI MEASURE Robert D. Rowe Lauraine G. Chestnut Energy and Resource Consultants, Inc. P.O. Drawer O Boulder, Colorado 80306 (303) 449-5515 1.0 INTRODUCTION This paper uses economic theory to examine behavior to mitigate adverse health effects and to compare cost of illness (COI) and willingness to pay (WTP) measures of damages. It also provides estimates of conceptually correct WTP economic benefit measures for changes in asthma severity. These WTP measures are compared to COI measures, varia- tions of which are frequently used to value changes in adverse health symptoms. Con- sistency checks on these WTP estimates, obtained through a contingent valuation bidding approach, are developed and discussed. While much research has focused upon valuing changes in mortality, limited empirical work has been completed for valuing changes in morbidity (Chestnut and Violette, 1984). Morbidity is, however, among the major concerns in setting many health, safety and environmental control regulations. The Clean Air Act of 1977 is one such example where standards are to be set to protect the health of sensitive populations. In most instances, the health impacts of concern relate to morbidity rather than mortality. Among the most frequently used approaches to valuing changes in morbidity has been the COI approach following or modifying the original work of Rice (1966). Reviews of this approach and applications can be found in Hu and Sandifer (1981), Institute of Medicine (1981), and Chestnut and Violette (1984). Recent prominent applications include Rice and Cooper (1976), Manuel et al. (1983), and Hartunian et al. (1981). The general COI approach to valuing changes in illness from changes in a policy or standard, is to obtain epidemiological estimates of the changes in the expected level of illness and then to estimate a change in work loss and medical related expenditures due to the change in illness. Typically, COI estimates are made for the existing level of illness, then a X% change in illness is predicted to result in an X% change in COI. COI approaches are frequently used due to the relative availability of data to conduct the analysis, but they have serious limitations including: 1. The epidemiology estimates upon which they are based have not typically accounted for mitigating behavior. For example, if air pollu- tion increases, individuals may change their activity patterns or other expenditures in order to reduce their exposure or to mitigate the adverse health effects. This may cause epidemiology estimates to show fewer changes in health effects than would otherwise have occurred. The costs of these behavioral and expenditure changes are not incorp- orated in COI estimates.
Transcript of Energy and Resource Consultants,...
1
Energy and Resource Consultants, Inc.
VALUING CHANGES IN MORBIDITY: WTP VERSUS COI MEASURE
Robert D. Rowe Lauraine G. Chestnut
Energy and Resource Consultants, Inc.P.O. Drawer O
Boulder, Colorado 80306(303) 449-5515
1.0 INTRODUCTION
This paper uses economic theory to examine behavior to mitigate adverse health effectsand to compare cost of illness (COI) and willingness to pay (WTP) measures of damages.It also provides estimates of conceptually correct WTP economic benefit measures forchanges in asthma severity. These WTP measures are compared to COI measures, varia-tions of which are frequently used to value changes in adverse health symptoms. Con-sistency checks on these WTP estimates, obtained through a contingent valuation biddingapproach, are developed and discussed.
While much research has focused upon valuing changes in mortality, limited empiricalwork has been completed for valuing changes in morbidity (Chestnut and Violette,1984). Morbidity is, however, among the major concerns in setting many health, safetyand environmental control regulations. The Clean Air Act of 1977 is one such examplewhere standards are to be set to protect the health of sensitive populations. In mostinstances, the health impacts of concern relate to morbidity rather than mortality.
Among the most frequently used approaches to valuing changes in morbidity has been theCOI approach following or modifying the original work of Rice (1966). Reviews of thisapproach and applications can be found in Hu and Sandifer (1981), Institute of Medicine(1981), and Chestnut and Violette (1984). Recent prominent applications include Riceand Cooper (1976), Manuel et al. (1983), and Hartunian et al. (1981).
The general COI approach to valuing changes in illness from changes in a policy orstandard, is to obtain epidemiological estimates of the changes in the expected level ofillness and then to estimate a change in work loss and medical related expenditures dueto the change in illness. Typically, COI estimates are made for the existing level ofillness, then a X% change in illness is predicted to result in an X% change in COI.
COI approaches are frequently used due to the relative availability of data to conductthe analysis, but they have serious limitations including:
1. The epidemiology estimates upon which they are based have nottypically accounted for mitigating behavior. For example, if air pollu-tion increases, individuals may change their activity patterns or otherexpenditures in order to reduce their exposure or to mitigate theadverse health effects. This may cause epidemiology estimates to showfewer changes in health effects than would otherwise have occurred.The costs of these behavioral and expenditure changes are not incorp-orated in COI estimates.

Energy and Resource Consultants, Inc.
2. COI estimates typically are not able to incorporate values for theeffect of illness upon one’s lifestyle or discomfort.
3. Often insufficient data exist for a complete COI estimate.
The focus in this paper is on the importance of the first two limitations. Section 2.0presents an economic model of behavior that describes incentives to undertake mitigat-ing behavior and breaks down WTP into individual damage components, which provides atheoretical comparison between WTP and COI measures. Section 3.0 briefly discussesthe surveys used to provide an application of the analysis and presents selected results.Because these estimates are generated through a contingent valuation (CV) approach,they may be subject to hypothetical inaccuracy (Cummings et al., 1984; Rowe andChestnut, 1983). Therefore, a consistency check procedure was developed and imple-mented.
In summary, the analysis finds that WTP measures for changes in asthma are on the orderof 1.5 to 3 times estimated COI. The consistency checks demonstrate that the 79 per-cent of the CV WTP bids were likely to be accurate for the purposes of the analysis.
2.0 AN ECONOMIC MODEL OF VALUE AND MITIGATING BEHAVIOR
A health production function model is developed based upon the models by Harringtonand Portney (1982) and Gerking et al. (1983) and is used to illustrate the level of defen-sive expenditures and activities the individual will choose to undertake, how epidemio-logical analyses can be affected when defensive expenditures are ignored, and the com-ponents of WTP and, therefore, how WTP and COI measures theoretically compare.
2.1 MODEL SUMMARY
For those who wish to skip the mathematical model, we first present a summary of itsimplications. They include:
1. The model uses many simplifying assumptions, not all of which areeasily accepted. Generalizations of the model (discussed in Rowe andChestnut, 1984) greatly add to complexity, but do not change the basicconclusions outlined below.
2. Individuals will engage in defensive efforts to minimize adverse healtheffects to the point where marginal benefits equal the marginal costs intime and money for defensive efforts. The benefits of defensive effortsinclude improvement in utility (well-being); medical costs no longerincurred, and the opportunity cost of time no longer spent sick. Theamount of defensive efforts undertaken depends upon the effectivenessof these efforts and their associated costs.
3. An individual’s WTP to reduce risks of adverse health effects associatedwith exposures to air pollution is expected to include values related tothe following damage categories:
i. Medical expenditures for treatment of illness.
- 2 -

DISCLAIMER
Although prepared with EPA funding, this report hasneither been reviewed nor approved by the U.S.Environmental Protection Agency for publication as anEPA report. The contents do not necessarily reflect theviews or policies of the U.S. Environmental ProtectionAgency, nor does mention of trade names or commercialproducts constitute endorsement or recommendation foruse.


Energy and Resource Consultants, Inc.
ii. Disutility associated with foregone income due to time off fromwork, lower wages or lower productivity at work due to illness.
iii. Disutility of loss of ability to participate in desired leisure activi-ties, household chores, child care and other activities.
iv. Disutility of discomfort due to illness.
v. Disutility of mitigating behavior to prevent illness (preventivehealth care expenditures, inconvenience of activity changes,including when and where to work, recreate and live, etc.).
4. COI estimates, based upon medical costs and workloss (categories 1 and2) for health incidents measured by epiemiological studies, will under-state WTP to reduce health impacts by missing the value of defensivebehavior taken to reduce adverse health incidents and by ignoring thediscomfort and change in lifestyle incurred as a result of adverse healthincidents.
2.2 THE MODEL
The basic premise of the health production function models, as applied to health analy-ses, is that the individual can be expected to take action to protect or enhance his or herhealth (Grossman, 1972). People do not necessarily accept the effects of pollution pass-ively, but may respond with action that will mitigate the health effects that otherwisewould have occurred.
The individual’s well-being, or utility, is assumed to be a function of the goods and ser-vices consumed and his or her state of health. The direct effects of the individual’s stateof health on utility would include pain and discomfort experienced during an illness.
U = U (X,H)
Where:
(2.1)
U= the individual’s utility in a given time period
X = goods, services and leisure activities the individual consumes that are un-related to his or her health, Ux > 0
H = the individual’s state of health, UH > 0
The individual’s state of health (H) is a function of defensive expenditures and healthenhancing activities undertaken, including such things as preventive medical care, exer-cise, and diet; exogenously determined levels of pollution; and biological, social and eco-nomic characteristics of the individual, such as congenital conditions, age and education,that influence the effectiveness with which he or she can maintain a given state ofhealth. The level of defensive expenditures is chosen by the individual and is a functionof pollution and social and economic characteristics of the individual. A simplifyingassumption used here is that defensive expenditures and activities affect utility onlythrough their effect on health. In reality many of these activities and expendituresjointly produce utility in other ways as well, such as the enjoyment of tennis or swimmingproduced jointly with the health benefit.
- 3 -

Energy and Resource Consultants, Inc.
H = H(D,P,Z)
Where:
(2.2)
D =P =
defensive expenditures and activities, HD > 0
Z =pollution, Hp > 0biological, social and economic characteristics of the individual, HZ > 0
Time spent sick and medical expenditures made in response to illness enter into the indi-vidual’s budget constraint because they affect the amount of time and money the indivi-dual has for other goods, services and activities, but they do not directly enter the indi-vidual’s utility function. These medical expenditures do not prevent additional illness,but may mitigate the discomfort and activity interference of illness that occurs.
Ts = Ts(H) (2.3)
M = M(Ts)
Where:
(2.4)
Ts =M=
time spent sick, TsH > 0medical expenditures in response to illness, MTs> 0
The individual faces the following time and budget constraints.
X*Px + D*Pd + M*Pm = w*Tw + I (2.5)
(2.6)X*Tx + D*Td + M*Tm + Ts + Tw = T
Where:
Pi = price per unit of i, for i=x, d, and mTi = time per unit of i, for i=x, d, and mTw = time spent workingw = the individual’s wage rateI = nonwage incomeT = total time available
Equations 2.5 and 2.6 can be combined into a “full income” constraint by assuming thatall time is valued at the wage rate and defining a combined dollar and time cost: Qi = Pi+ w*Ti. Using w as the value for all time assumes that individuals choose to work to thepoint where the marginal benefits of working (the wage earned) just equal the marginalcosts in terms of the value of time lost from other activities. (This is a simplifyingassumption that could be relaxed in a more complex model.) The full income constraintis:
(2.7)
(2.8)
X*Qx + D*Qd + M*Qm + w*Ts = w*T + I
Substituting with Equations 2.2, 2.3 and 2.4, the Lagrangian is:
L = U(X, H(D, P, Z)) - A(X*Qx + D*Qd + M(Ts(H(D, P, Z)))*Qm+ w*Ts(H(D, P, Z)) - w*T - I)
- 4 -

Energy and Resource Consultants, Inc.
The first order conditions are as follows with subscripts denoting partial derivatives.
(2.9)
(2.10)
(2.11)
The first order condition for defensive activities and expenditures (Equation 2.10) indi-cates that the utility maximizing individual will engage in defensive efforts to the pointwhere the marginal benefit equals the marginal cost. In this case the marginal benefit isthe dollar value of the improvement in utility obtained with an additional unit of defen-sive efforts (UH*HD/ A ) plus the medical expenditures that no longer have to be in-curred as a result of a unit increase in defensive efforts (MTs*TsH*HD*Qm), plus theopportunity cost of time no longer spent sick as a result of a unit increase in defensiveefforts (w*TsH*H~). The marginal cost is the unit cost of defensive efforts includingboth money and time (Qd). This means that the amount of defensive efforts undertakenwill depend on the effectiveness of these efforts in maintaining health and on the costsand discomfort associated with time spent sick, as well as on the direct costs of thedefensive efforts.
Willingness to pay for changes in pollution can be defined with the indirect utility func-tion. Willingness to pay is the change in income that would hold utility constant whenpollution changes. The indirect utility function is:
V = V(I, P, w, Qd, Qm, Qx) (2.12)
One way to express willingness to pay for changes in pollution is to assume that the wagerate and other prices do not vary with pollution and to ask how income has to change inorder to keep V constant as P changes. This defines an income compensated demandcurve for P and the derivative of this function with respect to P gives the marginal will-ingess to pay for P. This demand curve can be denoted as I’(P) and it is defined such that
V(I’, P) = VO (2.13)
where VO is some fixed level of V and wages and other prices are constant. The totalderivative of (2.13) is equal to 0 since VO is a constant. Therefore, the total derivativeof V with respect to P is:
This can be written as:
(2.14)
- 5 -

Energy and Resource Consultants, Inc.
(2.15)
which says that the change in I that would hold V constant when P changes is equal to thenegative of the ratio of the marginal utility of P to the marginal utility of I. This is anexpression for willingness to pay for marginal changes in pollution.
Another expression for willingness to pay for changes in pollution can be obtained bysubstituting from the first order condition for defensive efforts into VP and VI.
(2.16)
(2.17)
Substituting for UH from Equation (2.10) and simplifying:
(2.18)
This says that willingness to pay for a marginal change in pollution is equal to the costsof defensive efforts (D) that would (or would no longer) be needed to maintain health at agiven level. Notice that, given the assumptions of the model, this expression for willing-ness to pay is the same regardless of the associated direct utility effects, changes inmedical expenditures or changes in time spent sick. This would no longer be accurate ifthe first order condition for defensive efforts did not hold or if the assumption that theonly effect of D on utility is through H were not correct.
Harrington and Portney (1982) point out that cross sectional epidemiological studies thatestimate a dose response relationship between health and pollution exposures withoutconsidering defensive behavior, will be estimating the total derivative of H(D, P, Z) withrespect to pollution rather than the partial derivative. The total derivative of H withrespect to P is:
(2.19)
For an increase in P, the first term can be expected to be positive (indicating an increasein health) while the second term can be expected to be negative (indicating a decrease inhealth). The observed effect of pollution on health is therefore less than what wouldoccur without defensive efforts (i.e., if the first term were zero) and the benefits ofpreventing or reducing pollution are understated if defensive efforts are ignored.
Medical expenditures and time lost from work due to illness comprise the typical “cost ofillness” estimate for changes in pollution. These costs are related to the total change inhealth that occurs as a result of a change in pollution. Therefore a cost of illness esti-mate for changes in pollution can be expressed in terms of the model as:
(2.20)
- 6 -

Energy and Resource Consultants, Inc.
Where:
C = the cost of illness
Note that the first term on the right hand side uses the wage rate as the opportunity costof all time spent sick. This is an overstatement of what is usually included in cost ofillness estimates, since these typically include only time lost from work. A typical costof illness estimate can therefore be expected to be less than or equal to Equation 2.20.
The following discussion parallels the presentation of Harrington and Portney (1982) andexamines the relationship between this expression for cost of illness and willingness topay for changes in pollution.
From Equation (2.10) we know that:
(2.21)
Therefore:
(2.22)
Substituting from (2.19) and solving for the expression derived for willingness to pay forchanges in pollution in (2.18):
(2.23)
On the basis of equation 2.23, willingness to pay for changes in pollution can be expectedto exceed cost of illness because the second and third terms can be expected to increaseWTP. The second term is the change in defensive expenditures associated with a changein pollution, and the third term is the dollar equivalent of the direct change in utility(i.e., the pain and discomfort) associated with the change in pollution. For example, anincrease in pollution can be expected to cause the individual to increase defensive expen-ditures and to have a negative effect on the individual’s utility due to the discomfort ofincreased illness.
3.0 SURVEY DESIGN AND RESULTS
3.1 THE SURVEYS
The applied research was designed to supplement research underway at the UCLA Schoolof Medicine (Gong et al. 1984) concerning the effects of air pollution on people withasthma. Three sets of survey instruments were used: The epidemiology instruments onasthma severity, respiratory status, medicine use and behavioral data; the economicsurvey daily diary of perceptions and activities; and the economic survey generalquestionnaire on background activities and WTP.
- 7 -

Energy and Resource Consultants, Inc.
The Epidemiology Analysis
UCLA researchers collected data for over 90 subjects with diagnosed asthma over an ele-ven month period from January 1983 through November 1983. All of the subjects livedthroughout the study period in Glendora, California, a town in the San Gabriel Valley eastof Los Angeles where state and federal standards for ambient ozone and other pollutantsare frequently exceeded.or her asthma symptoms.
During the study period, each subject kept a daily record of hisThese were measured in three different ways: 1) Subjects
rated their daytime and nighttime symptoms in several categories on a 1 to 7 severityscale; 2) Subjects took twice daily readings of their pulmonary peak flow; and 3) Subjectsused, as needed, an inhaler that recorded the amount of medication used. Every twoweeks the subjects were given more extensive tests and answered questions about anyillnesses they may have had or other things that may have affected their asthma duringthe two week period. Air pollution levels were taken from the South Coast Air QualityManagement District station #60. Weather conditions and the amount of pollens, fungalspores, and potential aeroallergens were also measured at the on-site facility. See Gonget al. (1984) for additional details.
The Economic Surveys
The economic study was designed to obtain additional information from the UCLA panelwithout interfering with the UCLA study. Subjects age 16 and over (the adult group) wereasked to complete the daily diary at home each day for four weeks and to complete thegeneral questionnaire during their last visit to the UCLA facility. The parents of sub-jects under 16 years old were asked to complete the general questionnaire only. Sixty-four of the then current 65 adults and all eighteen parents of the panelists under 16agreed to participate.
The Daily Diary. The purpose of the diary was to supplement the information gatheredby UCLA concerning daily asthma symptoms with data about how the subject may havechanged his or her activities in response to or in anticipation of worse than normalasthma symptoms. There were several questions addressed through the diary including:
Do individuals perceive air pollution as affecting their asthma and dotheir perceptions about air pollution accurately correlate with ambientconditions?
When individuals anticipate having a bad day due to air pollution, dothey alter their behavior to reduce or minimize the effects? Thisdefensive behavior affects epidemiologic estimates and represents achange in well-being often ignored in analyses of morbidity effects.
The General Questionnaire. The purpose of the general questionnaire was to identifyways in which asthma affects people’s well-being, and to estimate economic measures ofchanges in well-being associated with changes in the frequency of asthma symptoms.One goal was to compare COI estimates to WTP estimates. The questionnaire consistedof seven sections. The first six addressed asthma effects on medical expenditures, workand school, leisure, chores and residential choice. Part VII of the questionnaire asked therespondents to rank in importance the categories of benefits they might receive if theirasthma improved. These categories followed from the questions in the previous sectionsand included lower medical expenditures, higher wages or productivity, more flexibilityabout where to live, better chance to participate in leisure activities, and less pain andsuffering or discomfort. After the ranking, repondents were asked how much they would
- 8 -

Energy and Resource Consultants, Inc.
be willing to pay in additional taxes each year for a program that would reduce their badasthma days by one-half. Evaluation of zero bids, the medical cost data and rankingquestions were used to analyze the internal consistency of an individual’s WTPresponses. The final question was household income. Other socioeconomic variableswere available through the UCLA questionnaires.
3.2 DAILY DIARY RESULTS
The diary results are not the focus of this paper, but a summary of preliminary results(reported in detail in Rowe et al., 1984, and Rowe and Chestnut, 1984), serves to illus-trate the potential importance of mitigating behavior in epidemiology and COI studies.
Each of 64 adult respondents completed the diary for an average 27.8 days resulting in atotal of 1779 observations (or person-days). Individuals started completing the diaryanywhere between October 12 and November 2, 1983 depending upon their schedule ofvisits to the UCLA Glendora facility. Due to being in the fall of the year and the unusualamount of rain, there were only 13 days with peak hourly ozone readings in excess of 12pphm (the federal standard) in the Glendora area during the study period, although peakhourly readings above 30 pphm are not uncommon in the summer and early fall in thisarea.
In summary, the diary result showed:
1. Asthmatics revealed accurate perceptions concerning changes in airpollution levels.
2. On days when the peak hourly ozone level was at the standard of 12pphm, 20 percent of the sample felt air pollution might adversely affecttheir asthma that day.
3. When asthmatics believed air pollution might adversely affect theirasthma, they were twice as likely to expect a bad asthma day in termsof undesirable asthma symptoms.
4. When asthmatics felt air pollution may or did lead to a bad asthma day,as compared to days when they neither expected a bad day nor expectedair pollution to adversely affect their asthma, they reduced their choresby 14 to 18 percent, reduced their active leisure and inactive indoorleisure by 13 to 17 percent, experienced .56 hours more work loss, andspent in excess of 25 percent more time in inactive outdoor leisure,nonleisure and sick.
3.3 GENERAL QUESTIONNAIRE RESULTS
Medical Expenditures
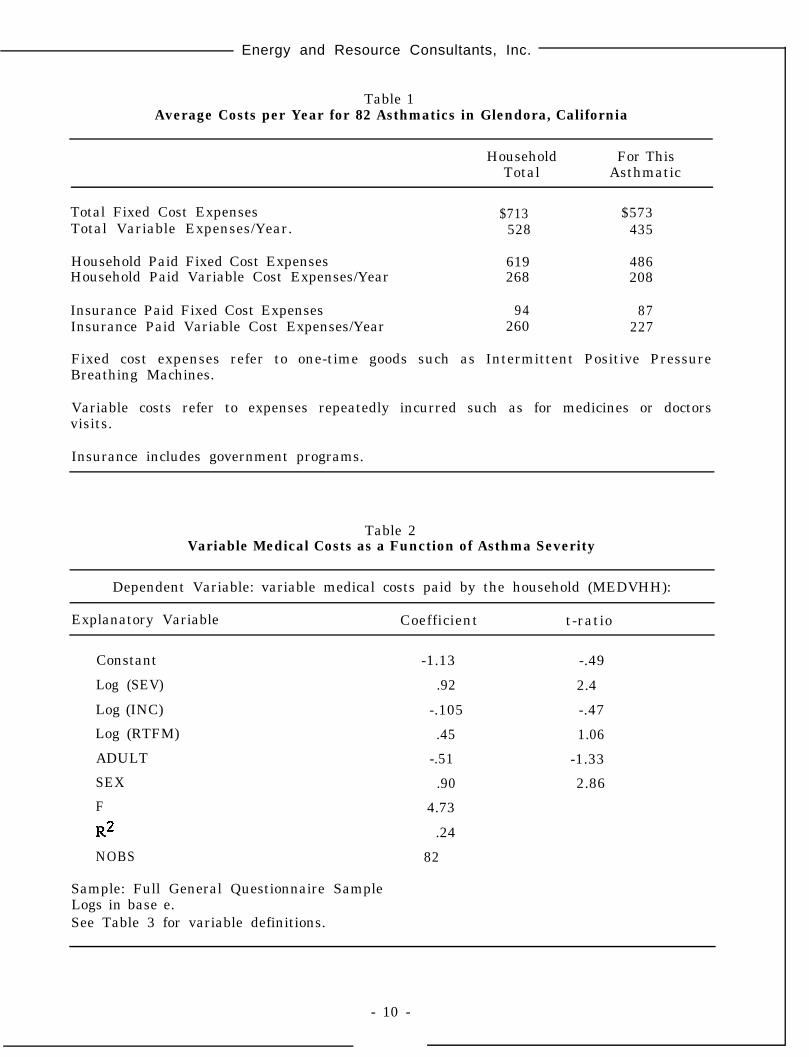
Expenditure data were collected on medical supplies, equipment and special treatmentprograms. These data were separated into fixed and variable costs and adjusted by thenumber of asthmatics in the household. Information on doctor and hospital visits wasobtained from the respondents and from the UCLA data files? Sample averages arereported in Table 1.
- 9 -
Energy and Resource Consultants, Inc.
Table 1Average Costs per Year for 82 Asthmatics in Glendora, California
Household For ThisTotal Asthmatic
Total Fixed Cost Expenses $713Total Variable Expenses/Year.
$573528 435
Household Paid Fixed Cost Expenses 619 486Household Paid Variable Cost Expenses/Year 268 208
Insurance Paid Fixed Cost Expenses 94 87Insurance Paid Variable Cost Expenses/Year 260 227
Fixed cost expenses refer to one-time goods such as Intermittent Positive PressureBreathing Machines.
Variable costs refer to expenses repeatedly incurred such as for medicines or doctorsvisits.
Insurance includes government programs.
Table 2Variable Medical Costs as a Function of Asthma Severity
Dependent Variable: variable medical costs paid by the household (MEDVHH):
Explanatory Variable Coefficient t-ratio
Constant -1.13 -.49
Log (SEV) .92 2.4
Log (INC) -.105 -.47
Log (RTFM) .45 1.06
ADULT -.51 -1.33
SEX .90 2.86
F 4.73
R2 .24
NOBS 82
Sample: Full General Questionnaire SampleLogs in base e.See Table 3 for variable definitions.
- 10 -

Energy and Resource Consultants, Inc.
Estimated variable medical costs paid by the household and attributed to the respondent,including medications, treatments, doctors and hospitals, were regressed against asthmaseverity (SEV) and selected socioeconomic variables (Table 2). Significant in the regres-sion results is that the elasticity of variable medical costs with respect to severity is justless than one, indicating that variable costs increase just less than proportionally toseverity. A variable for whether or not the respondent had insurance was never signifi-cant when included and had minimal effect on the other coefficients.
Work and School
Seven adult respondents felt their asthma affected their job status in terms of whetherthey were employed full-time or not (three were employed part-time and four not atall). These individuals ranked asthma effects on work significantly more important thandid the remainder of the sample. (See ranking discussion below). Of the 47 respondentsemployed full or part-time, 20 felt their choice of job was affected by their asthma, withmost taking a less stressful job so as not to aggravate their asthma. Twelve respondentsfelt their asthma affected their income. Including the four respondents unemployed dueto asthma, income was affected for 25 percent of the population. These respondents hadhigher asthma severity than the rest of the sample. In summary, more severe asthma islikely to affect short term and long term earning potential.
Turning to students, nearly two of every three felt their asthma affected their perfor-mance in school, particularly their extracurricular activities (63 percent of all students)and their grades (40 percent of all students).
Non-Paid Chores and Leisure
Eighty percent of the adult asthmatics felt that their asthma affected their ability toperform chores that they routinely do, but do not get paid for. Nineteen percent (10respondents) hired individuals on a regular basis to perform chores, which they would notdo if their asthma were less severe.for these services.
These individuals spent an average $1,478 per yearThese individuals also had significantly higher average severity rela-
tive to the remainder of the sample. A simple log linear relationship between the dollarcosts of chores hired and severity for these individuals finds a statistically significantelasticity of .88, i.e., a 10 percent increase in severity results in a 8.8 percent increasein the costs of chores hired out in part due to asthma. These individuals also later rankedreducing activity affects from reducing asthma to be much more important than for theremainder of the sample (See rankings below).
Asthma affects leisure activities for nearly 75 percent of the respondents. The respon-dents indicated that most often they change their activities or spend less time in leisureactivities while occasionally doing the same activities at a different time of day.
Rankings
Respondents were asked to rank, in descending order of importance, five benefits theymight receive from reduced asthma. The ranking and CV portion of the questionnairesare included as an appendix. The ranking question was a final step in preparing respon-dents for the total willingness to pay question and, in combination with estimated medi-cal costs, provides a validation check on the WTP responses. The ranking responses aresummarized in Table 4a. Assigning a cardinal value system of one when, a category is
- 1 1 -

Energy and Resource Consultants, Inc.
Table 3
Definition of Variables
Name Definition Source
SEV
INC
AGE
SEX
MEDVHH
Age
Sex; 0 = male, 1 = female
Variable medical costs/year paid by the house-hold for this asthmatic (Doctors, hospitals,medicines, etc.)
RTFM Respondent’s share of total household asthma(0-100%)
GDAY Highest day rating on UCLA scale stillconsidered to be a good asthma day
NBAD Number of bad days/year - number of dayswhere the daily asthma rating is greater (worse)than GDAY
NBADR 1/2 NBAD = Number of days reduced in WTPscenarios
ADULT Is the respondent on adult (16+ years)yes= 1, no = 0
TAXBID WTP response to reduce bad asthma days inhalf through a tax vehicle
NOBS Number of observations used in the analysis
Severity of asthma based upon respondents reportedmonthly Frequency times Intensity (Reported on UCLAinstruments) summed over the calendar year
UCLA
Income General
UCLA
UCLA
General
General
Diary andGeneral
UCLA
General
General
UCLA = UCLA Survey InstrumentsDiary = Economic Survey Daily Diary InstrumentGeneral = Economic General Questionnaire
- 12 -

Energy and Resource Consultants, Inc.
Table 4Results of the Ranking
a. Rankings
OverallCategory
Discomfort
ActivitiesEffects
# times Ranked
# times notMean SE of the RankedRank Score Mean* 1st 2nd 3rd 4th 5th ( = 6)
1 2.16 .16 40 19 11 1 4 7
2 2.89 .18 22 20 12 13 3 12
Medical 3 tie 3.63 .20 12 14 19 8 5 24costs
Work Loss
ResidentialChoice
3 tie 3.79 .20 7 20 14 11 2 28
5 4.88 .15 1 6 9 10 16 40
b. t-ratios** on pairwise comparisons of Average Scores
Discomfort
Activities
Medical Costs
Work Loss
Residential Choice
Discomfort Activities Med. Costs Work Loss
- -
3.0 - -
5.7 2.7 - -
6.4 4.5 .6 - -
12.4 8.5 5.0 4.4
- 13 -

Energy and Resource Consultants, Inc.
ranked first and five when a category is ranked fifth, and six if the category is notranked, yields the overall mean ranking.
Part (b) of Table 4 presents t-test results for the hypothesis that the mean scores areidentical. The t-tests reject the hypothesis that the mean scores are identical except formedical costs and work loss. Discomfort and asthma effects on leisure and recreationactivities were clearly ranked above medical costs and work loss, which were ranked veryclosely to each other. Medical costs and work loss represent the effects of illness thatare typically reflected in cost of illness measures. The low ranking for residential flexi-bility should be cautiously interpreted because it is based upon the responses of a groupof asthmatics who live in a very high air pollution area. They have not moved in order toreduce their exposure to air pollution, which may aggravate their asthma, and they maynot be representative of other asthmatics in this regard.
The ranking results were also analyzed using an ordinal value system giving the prob-ability that one category was ranked higher than another. The results substantiate thosein Table 4b, but are statistically somewhat less significant. Discomfort is still statis-tically significantly ranked above all other alternatives.
Logit regression analyses examining whether an individual would rank one category asmore important than another (all combinations were examined) as a function of asthmaseverity and other socioeconomic variables were generally statistically insignificant.Similarly, linear discriminant functions (Klecka, 1980) predicting which of the five cate-gories would be ranked first were statistically insigificant. However, a linear discrim-inant analysis examining whether an individual ranked a lifestyle (discomfort or leisureeffects) or COI (medical costs, work loss) category first showed promise and is reportedin Table 5. Approximately sixty percent of the individual observations could be classifiedusing this approach. As age, family size and number of bad asthma days increase,asthmatics were more likely to rank a COI damage first; while as increases in income,being an adult (versus child), and increases in the respondent’s share of total householdasthma lead to increased likelihood of ranking a lifestyle category first.
Tax Bid Analysis
The following contingent valuation question was asked: “If federal, state or local govern-ments set up programs that could reduce pollens, dusts, air pollutants, and other factorsthroughout this area that might reduce your (and your household’s) bad asthma days byhalf, but would cost you increased tax dollars, what would be the maximum increase intaxes each year that you and your household would be willing to pay and still support sucha program?”
A payment card with alternative dollar amounts accompanied the question. The questionappeared generally to be well received with 68 non-zero responses, 13 zero responses andone refusal. Upon evaluation of the responses, some zero observations were retained anda few non-zero bids deleted resulting in a mean bid for 65 observations of $401 per yearwith a standard error of the mean of $85. The mean estimated variable medical costspaid by the household for this group of respondents was $272.00 with a standard error ofthe mean equal to $27.62. The average number of bad asthma days was 38 per year.
A model relating the tax bid to the number of bad asthma days reduced (1/2 the numberof bad days = NBADR) and the level of intensity at which the respondent differentiatedbetween a good and bad asthma day, GDAY, is reported in Table 6. The sample is dis-cussed below. The model suggests that WTP increases at about one-half the rate of the
- 14 -

Energy and Resource Consultants, Inc.
Table 5
Standardized Discriminant Function Coefficients andClassification Results on Ranking Data
I. Cannonical Discriminant Function between Group 1 and Group 2 (see Section II fordefinitions)
Variable Coefficient I
ADULT -.40
FAMILY SIZE .70
RTFM -.51
INCOME -.01
AGE .66
NBAD2 .47
II. Predicted Group Membership
Group 1 Individuals who ranked a cost of illness category first (medical costs, workloss)
Group 2 Individuals who ranked a quality of life category first (discomfort, reducedactivities)
Group 1 Group 2
Actual number of observations 19 62
Predicted number in Group 1 13 (68.4%) 26 (41.9%)
Predicted number in Group 2 6 (31.6%) 36 (58.1%)
Overall Prediction Power 60.5% of individuals were correctly classified.
I No statistical significance is assigned to individual coefficients. A (+) sign indicatesincreased probability of ranking a group 1 category first, a (-) sign indicates increasedprobability of ranking a Group 2 category first.
2 Results with SEV instead of NBAD are similar but the overall percent of correctclassification is reduced to 58 percent.
- 15 -

Energy and Resource Consultants, Inc.
Table 6
Tax Bid Regression and Predicted WTP Values for a50 Percent Reduction in Bad Asthma Days
a. Regression Model
Dependent Variable Log (Tax Bid)
Explanatory Variable Coefficients t-ratio
Constant
Log (NBADR)
Log (GDAY)
Log (MEDVHH)
Log (INC)
SEX
N OBS
F
R*
.2834 .078
.565 4.25
.973 1.43
-.0433 -.280
.292 .896
-.416 -.899
65
5.276
.3090
b. Predicted WTP Values ($'s)
GDAY
No. of Bad Days Reduced
1 5 15 50
1 (no symptoms) $22 $54 $101 $199
2 (very mild symptoms) 43 106 198 391
3 (mild symptoms) 64 158 294 580
4 (moderate symptoms) 84 209 389 767
Logs in base e
Variable names defined in Table 3
Predicted WTP values calculated for males at the sample means for income and variablemedical costs.
- 16 -

Energy and Resource Consultants, Inc.
number of bad days reduced and increases almost linearly with the defined level of inten-sity of what was viewed by respondents as a good or bad asthma day. The low statisticalsignificance on the Log (GDAY) coefficient may reflect the fact that a linear index wasused to define GDAY; although the growth in the intensity of effects from "no symp-toms” to “moderate symptoms”, may be non-linear, and could in alternative specifica-tions be respecified as four zero-one variables.
Care must be taken in interpreting the tax bid regression model results. The regressionestimates a WTP curve for a 50 percent reduction in bad asthma days estimated acrossindividuals with different asthma severity (or different levels of bad asthma days). As aresult, the regression curve does not trace out an individual WTP curve, but a locus ofpoints representing the WTP to reduce asthma in half for each NBAD level. For exam-ple, it traces out the WTP to reduce five bad days for individuals with ten total bad days,WTP to reduce ten bad days for individuals with twenty total bad days, and so forth. TheWTP value to reduce five bad days, however, may be different for those individuals withten or twenty total bad days. If WTP by an individual increases at a decreasing rate withthe number of bad days reduced (i.e., with an increase in good days) and the WTP toreduce X bad days is the same for all individuals, regardless of the baseline total numberof bad asthma days experienced, then the underlying WTP curves of different individualsall fall on the regression function. More likely, WTP to reduce X bad days (i.e., improveby X good days) increases with the baseline number of bad days experienced and theunderlying individual WTP curves are flatter than the regression line as illustrated inFigure 1. It is important to note, however, that the shape of the underlying WTP curvescannot be determined from this data.
A major issue in contingent valuation (CV) studies has been the credibility of the valuesreceived through hypothetical questions (Cummings et al., 1984). This survey instrumentwas designed to specifically examine the plausibility of the CV responses by examiningzero and large bids and by comparing the tax bid, medical costs, rankings and otherresponses. Of the 82 respondents, one refused to respond to the tax bid question and onegave a bid exceeding his stated income. These responses were deleted. Twelve zeroresponses were given. Based upon a typical zero bid follow-up question (see theAppendix) eleven bids would have been deleted, but subsequent analysis indicated thatfive of these bids were probably valid because the individual’s asthma condition was suchthat he or she had zero or one bad day in the last year and very low medical costs.Therefore, reducing bad asthma days by half could appropriately be valued at zero. Theremaining seven zero bids were by respondents with at least $150 per year in variablemedical costs, nine bad asthma days and who gave a rejection response to the zero bidfollow-up questions. These were deleted from further analysis. Four non-zero bids werealso deleted because for those individuals NBAD equalled zero, while the bid exceeded$100 per year, indicating that the bid must be for something other than to reduce thenumber of bad asthma days.
All 68 remaining WTP responses were analyzed with the following consistency check. Itwas first assumed that a 50 percent reduction in bad asthma days would yield a 46 per-cent reduction in variable medical costs (.92 from Table 1 times 50 percent). WTP shouldtherefore exceed .46 of the individual’s variable medical costs. Further, if changes inmedical costs are ranked third, for example, total WTP should exceed .46 of variablemedical costs by at least a factor of three, if changes in each of the above ranked cate-gories are valued at or more highly than changes in medical costs. If changes in medicalcosts are ranked fifth then total WTP should exceed .46 of variable medical costs by afactor of five or more and so forth.
- 17 -

Energy and Resource Consultants, Inc.
Figure 1
Potential Relationship Between the Estimated WTP Function and theUnderlying Individual WTP Functions
W-i-PA = Estimated WTP function across respondents for a 50 percent reduction inNBAD
WTPi = WTP function for an individual with NBAD = i
NBAD = Number of bad asthma days.
- 18 -
19
Energy and Resource Consultants, Inc.
There are at least two important limitations to the consistency check analysis. First,while the individual may be attempting to give accurate and reasonable estimates fortheir medical costs and underlying values for changes in asthma, measurement error mayresult in failure of the consistency check. The second limitation is discussed below.
Of the 68 individuals with responses analyzed with the consistency check, 37 providedmedical cost, tax bids and rankings that were consistent with the above assumptions, andanother 16 were consistent using a reduction in medical costs of 25 percent or allowing a33 percent measurement error in either the tax bid or medical cost estimates.
This brings up the second limitation in the consistency check. The WTP bids are basedupon a 50 percent change in bad asthma days, while the estimated reduction in medicalcosts are based upon a 50 percent change in severity measured as the sum of monthlyfrequency times the intensity of asthma symptoms. For an individual with a large num-ber of bad asthma days, a 50 percent reduction in bad asthma days and in overall asthmaseverity may be quite similar. The correlation between 50 percent changes in thesemeasures is likely to lessen as the number of bad asthma days decreases. For this reason,the alternative of 25 percent of medical costs was used in the second application of theconsistency check.3 We view this as a weakness in our application, rather than the gen-eral design, of the consistency check procedure. Overall, 78 percent of the WTPresponses (including zero bids) could be evaluated as “probably reasonable.”
Of the fifteen non-zero WTP responses that did not pass either application of the con-sistency check or were viewed
$as of “uncertain quality,” four observations were discarded
as likely to be “unreasonable.
In summary, the use of consistency checks based upon other data generated in thequestionnaires is a promising approach in CV instruments to determine “reasonable” and“unreasonable” responses. They also help to illustrate in an application such as thiswhere the valuation issue is very familiar and important to respondents, that the over-whelming majority of CV responses appear to be of reasonable quality.
Another CV methods finding concerns the design of the payment card used on the tax bidWTP question (see the Appendix). The card presented four columns of numbers. Eachcolumn presented a linear progression of values.$10 increments.
Column 1 increased from $0 to $50 byColumn 2 increased from $75 to $200 in $25 increments. Column 3
increased from $300 to $1000 in $100 increments and column 4 increased from $2000 to$10,000 in $1,000 increments. This allowed a wide range to be covered without a largenumber of values listed on the card or starting bid problems, but does introduce a hetero-skedastic measurement error into the process of selecting a value.
Respondents were asked to select a value on the payment card or give any otheramount. Only two respondents provided values that were not listed. These values ($250,$1500) occurred between the last value of one column and the first value on the nextcolumn. Further, of the 68 respondents who gave nonzero bids, 40 (58 percent) gavevalues listed at the top or bottom of the column, with 31 of these (45 percent) givingvalues listed at the bottom of columns 1, 2 or 3. This seems to suggest that the valuejumps between columns were too large (50 to 100 percent jumps) and that the reportedmaximum willingness to pa(i.e., adding values of $60, $250, $1,500, etc.). It also suggests that a paired logit analy-
may have increased with smaller breaks between columns
sis of the bids, such as used by Loehman and De (1982), may be an appropriate method forbetter estimating the WTP relationship.

20
Energy and Resource Consultants, Inc.
Comparisons using the payment card approach and other bidding formats, reported inCummings et al. (1984), have found the payment cards to yield substantially lower valuesrelative to bidding procedures. In that light, it is again possible the bids reported heremay be understatements of WTP.
Comparing COI and WPT Economic Measures of Health Damage
In this section we briefly address the ratio of WTP to COI measures from the perspectiveof the affected individual and the perspective of society based upon evidence in thisstudy.
The rankings provide the first simple evidence that WTP measures will exceed COI mea-sures for the affected individual. If changes in discomfort and leisure activity effectsfrom changes in asthma are both ranked, and therefore valued, more highly than changesin medical costs, and changes in medical costs and work loss are ranked, and thereforevalued, approximately equally, then the total WTP (the aggregate value of all damagecategories) can be expected to be at least twice COI.
An alternative approach, again from the perspective of the affected individual, is tocompare the total WTP tax bid for a 50 percent reduction in bad asthma days to esti-mated changes in medical costs for a 50 percent reduction in bad asthma days and, fol-lowing the rankings, make the assumption that work loss equals medical costs for achange in asthma. This leads to a WTP/COI ratio of 1.61. This can be expected tounderstate the true ratio due to differences in the manner in which the COI and WTPvalues were estimated (Rowe and Chestnut, 1984). Other approaches to measuring theWTP/COI ratio examined in Rowe and Chestnut (1984) suggest that the ratio may be ashigh as 3.7, or that a COI measure may only be capturing 27 percent of total WTP forchanges in asthma severity. If full medical costs or work loss costs are not included inthe COI measure, which is frequently the case due to data limitations, a COI measuremay be capturing an even smaller portion of total WTP.
Society incurs costs and may hold values for reductions in health incidences beyond thosecosts and benefits incurred by the individual. Society directly incurs the full medicalcosts including those paid by insurance or government programs, while the individualtypically incurs less than the full medical costs associated with his illness. Further,society directly incurs lost work productivity when an individual is away from workwhereas, due to paid sick leave, the individual may perceive minimal personal loss.Others in society may also hold values related to reduced sickness, and reduced effectsof sickness for those who are affected. This is reflected in the research of Needleman(1976), where WTP by others to prevent an individual’s death increased total WTP by 25to 100 percent.
To obtain an estimate of the WTP/COI ratio from a social perspective, we take the indi-vidual WTP and COI values and escalate them by estimated social costs and benefits. Ona sample wide basis, households directly pay about one half of variable medical costswhile insurance or other programs paid the rest. Therefore the total social medical costcomponent of WTP and COI is approximately double that of the individual. This surveyprovides no information to gauge the social versus individual costs related to work loss.Therefore, for the sake of analysis and following the medical cost doubling, we assumetotal social work loss costs are double the individual’s perceived work loss costs. Insummary, the estimated social COI measure is calculated to be roughly double theindividual’s COI measure. Social WTP can also be expected to exceed individual WTP forother reasons. The estimated ratio WTP/COI for society is dependent upon the assump-

Energy and Resource Consultants, Inc.
tions about the willingness to pay by others in society to reduce an individual’s asthma,which we call Z. Using the above assumption on social incurred medical costs and workloss and assuming Z equals zero, the WTP/COI ratio ranges from 1.31 to 2.35. AssumingZ equals 50 percent of the individual’s WTP, the social WTP/COI ratio increases tobetween 1.55 and 2.6.
The calculation of WTP/COI ratios undertaken here must be interpreted as suggestivedue to measurement error and the assumptions used. With these caveats in mind, theanalysis suggests that WTP measures for asthma are in the range of 1.5 to 3 times COImeasures, as we have defined COI measures, using either the perspective of an individualor society. The difference is primarily due to substantial values held for activity effectsand discomfort.
The results for WTP/COI ratios are for reductions in asthma severity and may not berepresentative of this ratio for other types of illnesses. We hypothesize that, due todifferences in the magnitude of medical costs relative to income constraints and thelikely magnitude of work loss, the ratio would be larger for minor health effects such aseye and throat irritation, and smaller for major illnesses such as angina or cancer.
- 2 1 -

Paper prepared for the American Economic Association/Association of Environmentaland Resource Economists Joint Meetings, Dallas, Texas, December 27-30, 1984. Thiswork was funded by the U.S. EPA Contract # 60-01-6543 and the California AirResources Board Control # A2-118-32. We appreciate the assistance and input of AnnFisher, Sylvia Champomier, Douglass Shaw, Don Waldman, Dane Westerdahl, BartOstro, Henry Gong, Anne Coulson, and John Dermond. Detailed research results canbe found in Rowe and Chestnut (1984 a, b).
There may be a slight upward bias in the variable medical cost estimates. See Roweand Chestnut (1984) for details on the calculation of medical costs.
In defense of the discussion leading to the second application of the consistency checkwith 25 percent medical costs, the average number of bad asthma days was 54 forthose passing the check with 46 percent of medical costs, 27 for those passing with 25percent of medical costs and 10 for those where neither application of the consistencycheck worked.
Of the four observations which were deleted, two had bids exceeding $1,000 but NBADequal to or less than three and two had bids less than or equal to $50 but NBADexceeding 75. In both cases, the bids were at least ten times larger or smaller thanyearly variable medical costs.
The estimated change in medical cost for a 50 percent change in bad asthma daysequals .92 (percent change in medical costs from a percent change in asthma, SeeTable 6) times .5 (50 percent change in asthma) x $272 (average variable medicalcosts), or $125. Assuming the workloss thanupon the rankings), COI = $250. WTP/COI = $401/$250 = 1.61.
e equals the change medical costs, (based
Energy and Resource Consultants, Inc.
Footnotes

Energy and Resource Consultants, Inc.
BIBLIOGRAPHY
Chestnut, L.G. and D.V. Violette. Estimates of Willingness to Pay for Changes inPollution-Induced Morbidity. Draft Final Report prepared for the U.S.Environmental Protection Agency, Washington, D.C., 1984.
Crocker, T.D., W. Schulze, S. Ben-David, and A.V. Kneese. Methods Development forAssessing Air Pollution Control Benefits. Vol I: Experiments in theEconomics of Air Pollution Epidemiology EPA-600/5-79-001a. Prepared forthe Office of Research and Development, U.S. Environmental ProtectionAgency, Washington, D.C., February, 1979.
Cummings, R.G., D.S. Brookshire, and W.D. Schulze. Valuing Environmental Goods: AState of the Arts Assessment of the Contingent Valuation Method. DraftReport for the U.S. Environmental Protection Agency, Washington, D.C., May1984.
Gerking, S.D., L.R. Stanley, and W.N. Weirick. An Economic Analysis of Air Pollution andHealth: The Case of St. Louis. Prepared by the Department of Economicsand the Institute for Policy Research, University of Wyoming, for the U.S.Environmental Protection Agency, Washington, D.C., 1983.
Gong, Henry, Donald P. Taskin, Gary H. Spivey and Anne H. Coulson. “RelationshipBetween Air Quality and the Respiratory Status of Asthmatics in An Area ofHigh Oxident Pollution in Los Angeles County,” A Research Grant Proposal tothe California Air Resources Board. UCLA School of Medicine and PublicHealth, 1982.
Harrington, W. and P.R. Portney. “Valuing the Benefits of Improved Human Health.”Mimeo, Resources for the Future, Washington, D.C., 1982.
Hartunian, N.S., C.N. Smart, and M.S. Thompson. “The Incidence and Economic Costs ofCancer, Motor Vehicle Injuries, Coronary Heart Disease, and Stroke: A Com-parative Analysis,"1249-1260.
American Journal of Public Health 70 (December 1980):
Hu, T., and F.H. Sandifer. Synthesis of Cost of Illness Methodology Prepared for theNational Center for Health Services Research, Department of Health andHuman Services, Washington, D.C., February, 1981.
Institute of Medicine. Costs of Environment-Related Health Effects: A Plan for Con-tinuing Study. Washington, D.C.: National Academy Press. January 1981.
Klecka, William R. Discriminant Analyses. Stage Publications, Beverly Hills, CA, 1980.
Loehman, E.T. and V.H. De. "Application of Stochastic Choice Modeling to Policy Analy-sis of Public Goods: A Case Study of Air Quality Improvements,” Review ofEconomics and Statistics 64 (August 1982): 474-480.

Energy and Resource Consultants, Inc.
Manuel, E.H., Jr., R.L. Horst, Jr., K.M. Brennan, J.M. Hobart, C.D. Harvey, J.T. Bentley,M.C. Duff, D.E. Klingler and J.K. Tapiero. Benefits Analysis of AlternativeNational Ambient Air Quality Standards for Particulate Matter. Final Reportprepared for the Office of Air Quality Planning and Standards, U.S. Environ-mental Protection Agency, Research Triangle Park, North Carolina, March,1983.
Needleman, L. “Valuing Other People’s Lives,” Manchester School of Economics andSocial Studies 44 (December 1976): 309-342.
Ostro, B. “The Effects of Air Pollution on Work Loss and Morbidity,” Journal of Envi-ronmental Economics and Measurement 10 (December 1983): 371-382.
Rice, D.P. Estimating the Cost of Illness. Health Economics Series Number 6, U.S.Department of Health, Education and Welfare, Public Health Service,Washington, D.C., 1966.
Rowe, Robert D. and Lauraine G. Chestnut. Oxidants and Asthmatics in Los Angeles: ABenefits Analysis. Energy and Resource Consultants Draft Report to the U.S.EPA office of policy analysis. Washington, D.C., September, 1984.
Rowe, Robert D., Lauraine G. Chestnut and W. Douglass Shaw. “Oxidants andAsthmatics in Los Angeles: A Benefits Analysis," Proceedings Air PollutionControl Association International Specialty Conference on Evaluation ofOzone/Oxidants Standards. Houston, TX, 1984.
Rowe, Robert D. and Lauraine G. Chestnut. “Valuing Environmental Commodities:Revisited,” Land Economics, 1983, 59(4): 404-410.

Energy and Resource Consultants, Inc.
APPENDIX
PART VII. OTHER
QUESTION 29. Please turn to the page titled Question 29. Here are some possible benefits you mightreceive from having your asthma improve. Please take your time and rank them frommost important to least important. Exclude any that are of no importance.
Most important
Least important
RANKING
a.
b.
c .
d.
e.
CATEGORIES
Lower expenditure on doctors, hospitals,medicines, special equipment and services.Higher productivity at work or ability to gethigher wages and salaries.More flexibility about where to live.
Better chance to participate in desiredleisure, recreation and social activities.Less pain and suffering.
(SKIP QUESTION 30 IF STUDENT LIVING AT HOME)
QUESTION 30. a. Please turn to the page titled Question 30a. If federal, state, or local governmentsset up programs that could reduce pollens, dusts, air pollutants and other factorsthroughout this area that might reduce your (and your household’s) Bad AsthmaDays by half, but would cost you increased tax dollars, what would be the maxi-mum increase in taxes each year that you and your household would be willing topay and still support such a program? The list of dollar amounts is only to helpyou. Please feel free to select a listed amount or give any other amount.
$/Year.
(ASK 30b IF RESPONSE TO 30a WAS $0.0 OR RESPONDENTAMOUNT, OTHERWISE SKIP TO QUESTION 31).
REFUSED TO CHOOSE ANY DOLLAR
b. Please turn to the page titled Question 30b. Which of the following reasons bestexplains your answer to the previous question #30a?
a. Having Bad Asthma Days half as often would not be worth anyincrease in taxes. (1)
b. Our taxes are already too high.c. I don’t believe any such program could reduce my Bad Asthma
(2)
Days by half.(3)
d. I should not have to pay for such programs; they should be (4)undertaken by government and industry without any increase intaxes.
e. Other (PLEASE SPECIFY) (5)


![DRAGON'S LAIR G e n e v i e v e D i d i o n K - 8 M a y 2 ... · upcoming events ee]a ee]a a ee]a a ee]a ee]a a a ee]a ee]a ee]a ee]a ee]a ee]a ee]a ee]a ee]a dragon's lair g e n](https://static.fdocuments.in/doc/165x107/5edb079c09ac2c67fa68b1f0/dragons-lair-g-e-n-e-v-i-e-v-e-d-i-d-i-o-n-k-8-m-a-y-2-upcoming-events-eea.jpg)