Energy and industry - World Bank
20
Energy and industry Without altered policies, pollution from fossil fuel generation of electric power will rise tenfold in the next forty years, from vehicles more than fivefold, and from industrial emissions and wastes also more than fivefold as demand for industrial goods multiplies. Low-waste and "clean" technologies and practices are capable of reducing local pollution levels appreciably as output expands. Options are also emerging for reducing carbon dioxide emissions in the long term through the use of renewable energy sources and through greater efficiency in energy production and use. To encourage the adoption of such technologies, governments need to pursue policies that improve the efficiency with which energy is used. These policies include the elimination of subsidies for power generation and, in many countries, for vehicle fuels and coal. Efficiency reforms help reduce pollution while raising a country's economic output. Policies designed to curb pollution directly, using economic incentives, laws, and regulations, are also necessary. s developing economies grow, they will begin to catch up with the levels of energy consumption and industrial production of high-income coun- tries. In today's industrial countries the main pe- riod of industrialization saw rapidly increasing pollution. How far can the developing countries avoid repeating that experience and benefit from the ways in which the richer countries have learned to reduce pollution from energy use and industrial production even as output expands? At present, the omens are poor. Chapter 2 con- cluded that current levels of air pollution, water pollution, and hazardous wastes in developing countries pose serious threats to human health, productivity, and welfare. These types of pollution arise mainly from the use of energy and from in- dustrial production. If growth continues at present rates or higheras it must if poverty is to dimin- ishthen, on present trends, increased energy use and industrial production will add enormously to pollution. The consumption of commercial energy in de- veloping countries is rising rapidly and will soon dominate energy markets worldwide (Figure 6.1). Despite oil price shocks and financial crises, it tn- 114 pled between 1970 and 1990 and now accounts for 27 percent of the world total. Even if developing countries' demand for primary energy were to grow at a rate 1 to 2 percentage points lower than the trend growth rate, demand is likely to exceed 100 million barrels a day of oil equivalent (mbdoe) by 2010 and perhaps 200 mbdoe by 2030. Yet per capita consumption in these countries would re- main much lower than in industrial countries. The production and consumption of industrial goods have also increased rapidly in developing countries. In many, the historical and current pace of industrial growth has outstripped that of indus- trial countries and will continue to do so as per capita incomes rise. As incomes rise, the structure of consumption will also change. Manufactures have a high income elasticity of demand, and the structural shifts brought about by development are likely to put heavy pressure on the environment. The growth of manufacturing in developing coun- tries averaged 8.0 percent in 1965-80 and 6.0 per- cent in 1980-90, compared with 3.1 and 3.3 percent in the industrial countries for those periods (see World Development Indicators, Table 2). Manufac- turing output will probably rise threefold in the
Transcript of Energy and industry - World Bank
Energy and industry
Without altered policies, pollution from fossil fuel generation of electric power will rise tenfold in the next forty
years, from vehicles more than fivefold, and from industrial emissions and wastes also more than fivefold as
demand for industrial goods multiplies.Low-waste and "clean" technologies and practices are capable of reducing local pollution levels appreciably as
output expands. Options are also emerging for reducing carbon dioxide emissions in the long term through the
use of renewable energy sources and through greater efficiency in energy production and use. To encourage the
adoption of such technologies, governments need to pursue policies that improve the efficiency with which energyis used. These policies include the elimination of subsidies for power generation and, in many countries, forvehicle fuels and coal. Efficiency reforms help reduce pollution while raising a country's economic output.
Policies designed to curb pollution directly, using economic incentives, laws, and regulations, are also necessary.
s developing economies grow, they will begin tocatch up with the levels of energy consumptionand industrial production of high-income coun-tries. In today's industrial countries the main pe-riod of industrialization saw rapidly increasingpollution. How far can the developing countriesavoid repeating that experience and benefit fromthe ways in which the richer countries havelearned to reduce pollution from energy use andindustrial production even as output expands?
At present, the omens are poor. Chapter 2 con-cluded that current levels of air pollution, waterpollution, and hazardous wastes in developingcountries pose serious threats to human health,productivity, and welfare. These types of pollutionarise mainly from the use of energy and from in-dustrial production. If growth continues at presentrates or higheras it must if poverty is to dimin-ishthen, on present trends, increased energy useand industrial production will add enormously topollution.
The consumption of commercial energy in de-veloping countries is rising rapidly and will soondominate energy markets worldwide (Figure 6.1).Despite oil price shocks and financial crises, it tn-
114
pled between 1970 and 1990 and now accounts for27 percent of the world total. Even if developingcountries' demand for primary energy were togrow at a rate 1 to 2 percentage points lower thanthe trend growth rate, demand is likely to exceed100 million barrels a day of oil equivalent (mbdoe)by 2010 and perhaps 200 mbdoe by 2030. Yet percapita consumption in these countries would re-main much lower than in industrial countries.
The production and consumption of industrialgoods have also increased rapidly in developingcountries. In many, the historical and current paceof industrial growth has outstripped that of indus-trial countries and will continue to do so as percapita incomes rise. As incomes rise, the structureof consumption will also change. Manufactureshave a high income elasticity of demand, and thestructural shifts brought about by development arelikely to put heavy pressure on the environment.The growth of manufacturing in developing coun-tries averaged 8.0 percent in 1965-80 and 6.0 per-cent in 1980-90, compared with 3.1 and 3.3 percentin the industrial countries for those periods (seeWorld Development Indicators, Table 2). Manufac-turing output will probably rise threefold in the

Developing countries will soon become the largestnarket for comni'rial energy
Figure 6.1 Energy consumption, by countrygroup: an "energy-efficient" scenario,1970-2030
Total consumption
Millions of barrels of oil equivalent per day
400
Per capita consumption
Barrels of oil equivalent per year
50
1970 1980 1990 2000 2010 2020 2030
1970 1980 1990 2000 2010 2020 2030
o OECD countries0 Eastern Europe and former U.S.S.R.
Developing countries
Note: The scenario assumes growth in total consumptionof one to two percentage points below the trend rate.Source: Anderson 1991a.
next twenty years and fivefold in the next thirty.In relation to energy use, the most serious prob-
lems faced by developing countries are the localeffects of emissions of particulate matter (dust andsmoke), the use of leaded fuels, and the indoor airpollution arising from the use of biomass fuels. Ina growing number of places sulfur dioxide, nitro-gen oxides, unburned hydrocarbons, and carbonmonoxide also need attention. Industrial activity
generates most of these pollutants, as well as efflu-ents and wastes, which are becoming more nu-merous, toxic, and exotic as industrialization pro-ceeds. Like industrial countries, developingcountries also need policies for dealing with"global pollutants" such as CFCs and greenhousegases.
In trying to skip the most polluting stages ofindustrialization, developing countries have somespecial advantages. They are able to draw on ad-vances in technology and management practicesalready made in industrial countries, under thepressure of increasingly strict pollution controls.And because they are expanding rapidly, they aregenerally building new generating and industrialplants rather than refitting existing ones. Theyshould therefore be able, with investment, to gostraight to low-polluting practices. Developingcountries are more likely to gain from such advan-tages if they encourage international trade and in-vestment and if they adopt environmental taxes,laws, and regulations that make cleaner practicesprofitable and polluting ones unprofitable, thuscreating a commercial interest in a cleanenvironment.
Energy
Figure 6.2 shows the main sources and uses ofworld energy. For developing countries, biomass,used mainly by households, is the largest source ofenergy, and efficiency in its use will be importantin controlling air pollution. Coal, oil, and gas arethe next largest sources. Hydroelectric power pro-vides 6 percent of the energy needs of developingcountries, while nuclear power provides less than1 percent.
As Chapter 1 pointed out, fears that the worldmay be running out of fossil fuels are unfounded.The world's proven reserves of oil and gas in 1950stood at 30 billion tons of oil equivalent (btoe);today they exceed 250 btoe, notwithstanding a to-tal world consumption of 100 btoe over the forty-year period. Proven reserves of coal rose from 450to 570 btoe in the same period. Reserves of naturalgas have expanded more than fivefold since 1965(despite a threefold increase in production duringthe period). They now amount to more than 100btoe, almost as much as the world's proven oilreserves; supplies in developing countries arestrong and improving. Estimates of "ultimately re-coverable" fossil fuel reserves worldwide are morethan 600 times the present annual rate of extrac-tion. All told, fossil fuel resources are probably
115

With development, commercial energy replacestraditional biomass fuels
Figure 6.2 Sources and consumptionof energy(pe'rccut)
Sources of all energy, 1987
Developing countries
L OilD CoalU Natural gasU Nuclear energyU HydropowerU Biomass
34
U Households andservices
U TransportU IndustryU Electricity
23
Industrial countries
6
Consumption of commercial energy, 1988
Eight developing countriesa
19
37
22
a. Brazil, China, India, Indonesia, Malaysia, Pakistan,Philippines, and Thailand. These countries account for morethan 50 percent of total energy and 35 percent of oilconsumed in developing countries. (Detailed data are notavailable for all developing countries.)Sources: For energy sources, Hall, background paper. Forconsumption, OECD 1990; Imran and Barnes 1990.
sufficient to meet world energy demands for thenext century, perhaps longer.
Policies to mitigate the effect on the environ-ment of energy production and consumption taketwo complementary approaches. The first uses116
economic instruments and institutional reforms toencourage the more efficient use of energy. Thesecond is either to develop technologies that re-duce the polluting effects of conventional fuels orto use less-polluting substitutes. In discussing en-ergy use for electric power generation and fortransportthe two most rapidly growing catego-riesthis chapter examines three scenarios: an"unchanged practices" scenario, with no environ-mental policies in place; a scenario that employseconomic and institutional reforms to improve theefficiency with which fossil fuels are used; and ascenario that progressively adopts environmen-tally beneficial technologies. A combination of thesecond and third not only reduces local pollutionappreciably but also improves economic efficiency.
But using cleaner fossil fuels and technologiesand improving efficiency will not by themselvessolve the long-term problem of stabilizing carbondioxide accumulations in the atmosphere (seeChapter 8). That will require a much greater use ofnuclear or of renewable energy. This chapter(which concentrates mainly on local pollution) willshow that solar energy, biomass, and other renew-ables are developing rapidly as environmentallyand commercially viable energy sources.
Electric power generation from fossil fuels
More than half the world's consumption of coaland 30 percent of fossil fuel consumption go togenerate electricity. Fossil-fired power stations, inturn, account for two-thirds of the world's electricpower-generating capacity, currently 2.6 millionmegawatts. In the 1980s electric power generationrose by 60 percent in industrial countries and bymore than 110 percent in developing countries(where demand is expanding at 8 percent a yearand requires roughly 50,000 megawatts of addedcapacity each year). Under an "unchanged prac-tices" scenario, in which pollution abatementtechnologies are not widely deployed, emissionsof pollutants will increase more than fourfold inthe next twenty years and tenfold in the next forty.Good policies would make this grimy prospectavoidable.
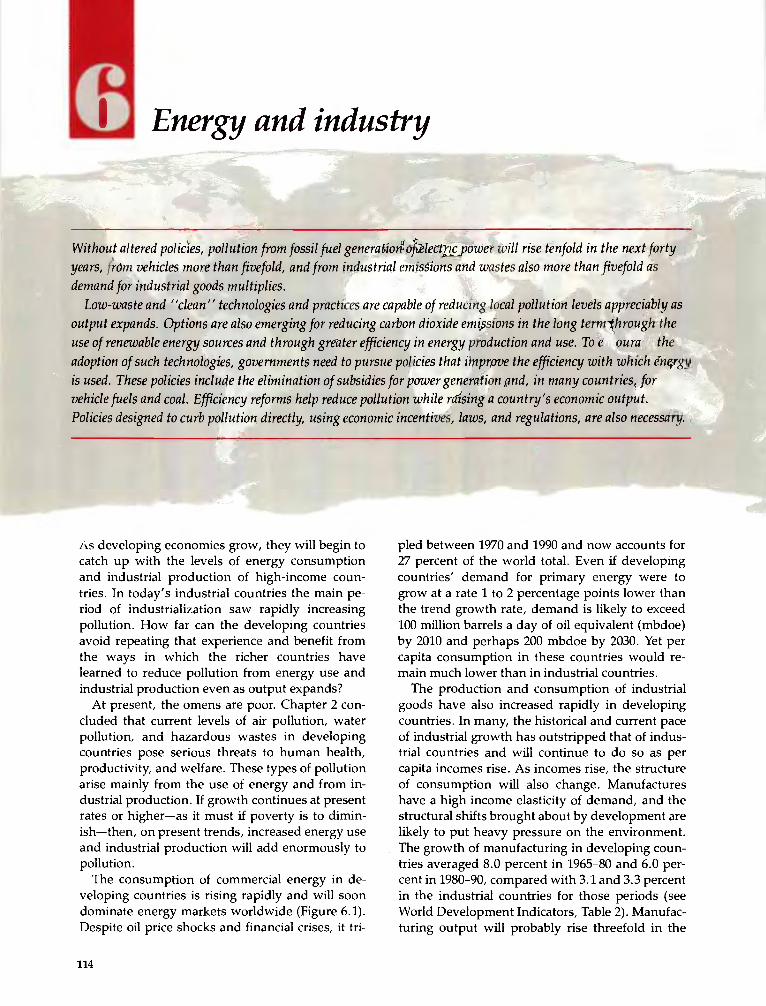
ECONOMIC AND INSTITUTIONAL REFORM. A sec-ond scenario considered in this section looks at thepossible effects of price increases and institutionalreforms. At present, underpricing of electricity isthe rule, not the exception, in most developingcountries. Prices, on average, are barely more thanone-third of supply costs and are half those in in-dustrial countries (Figure 6.3). Whereas average
14Industrial countries
tariffs in the OECD countries rose by 1.4 percent ayear in real terms between 1979 and 1988, they fellby 3.5 percent a year in developing countries.
Such low prices do not reflect improvements inthe efficiency with which electric utilities supplytheir customers. On the contrary, losses duringtransmission and distribution, partly throughtheft, run at high levels: 31 percent of generationin Bangladesh, 28 percent in Pakistan, and 22 per-cent in Thailand and the Philippines. (In theUnited States only 8 percent of electricity is lostduring transmission, in Japan, 7 percent.) Theselosses, the equivalent of about 75,000 megawattsof capacity and 300 terawatt hours (300 billion kilo-watt hours) a year, represent a loss to developingcountries of approximately $30 billion a yearthrough increased supply costs. Worse, by the endof the century, on present trends, aggregate losseswould double.
The reasons for persistent underpricing arelargely institutional. The points made in Chapter 5about the management of water utilities applywith equal force to electric utilities. Governmentsfrequently intervene in the day-to-day operationsof utilities, and they worry that price increases willexacerbate inflation. Utility managers and theirboards may have little say in pricing or investmentdecisions. Lack of accountability and transparencyleads to poor management, either of the utilitiesthemselves or of the state fuel companies that fre-quently supply them.
Subsidizing the price of electricity has both eco-nomic costs and environmental effects. Low pricesgive rise to excessive demands and, by undermin-ing the revenue base, reduce the ability of utilitiesto provide and maintain supplies; developingcountries use about 20 percent more electricitythan they would if consumers paid the true margi-nal cost of supply. Underpricing electricity alsodiscourages investment in new, cleaner tech-nologies.
Because of the need to service the borrowingincurred to build new generating capacity, somedeveloping countries are now starting to raise elec-tricity tariffs. Some are considering or (in a fewcases) implementing privatization programs, usu-ally in the hope of tapping capital markets to buildnew capacity. Price increases may be easier incountries in which parts of the energy industry areprivatized, and management is also likely to beimproved.
CONSERVATION. Sensible energy prices affectnot just the generation of energy but also its use byindustry and households. They create incentives
Many developing countries sell electricityat well below cost
Figure 6.3 Tariffs for electric power, 1988
Dollars per kilowatt hour
0.10
0.08
0.06
OECD Deve oping Brazil India Mexicocountries countriesa
a. Weighted average of tariffs in sixty-three countries.Marginal supply costs are generally $0.10 or more perkilowatt hour.Source: World Bank forthcoming.
for industry to use waste heatfor example,through cogeneration, which combines powergeneration with the use of residual thermal energyfor other purposesand to improve efficiency inheating, motive power, refrigeration, and lighting.
A paradox of the energy market is that end usersof electricity often appear to require much higherrates of return on the installation of more energy-efficient equipment than those that electric powerproducers require on new plant. This has led somecountries to introduce subsidies for new types ofenergy-saving investments by electricity cus-tomers, paid either by the government or (as inseveral U.S. states) by the electric utilities them-selves. Better information in the form of labeling oradvisory services to help customers make moreinformed decisions is also required. In developingcountries industrial advisory services have some-
117
0.04
0.02
0

times identified ways of reducing energy con-sumption per unit of output and other costs. Suchinitiatives are important for improving energy eff i-ciency, but their success, too, will depend greatlyon prices that reflect the full economic and envi-ronmental costs of energy. These will, in them-selves, help to make energy-efficient technologiesfinancially more attractive to industry andindividuals.
TECHNOLOGIES. By providing strong incentivesto generate and use electricity in more efficientways, price and institutional reforms have the ad-vantage of encouraging reductions in all pollutingemissions (including carbon dioxide) per unit ofoutput. However, low-polluting methods of gen-eration are also required to reduce pollution signif-icantly. The third scenario developed below there-fore combines the efficiency reforms discussedabove with the gradual adoption of environmen-tally improved technologies and practices.
Technological advance has put developing coun-tries in a better position to reduce all forms of p01-lution from electric power generation than the in-dustrial countries were in as recently as twentyyears ago. In industrial countries the capital stocktakes about thirty years to turn over, and retrofit-ting is costly. Because developing countries aremaking new investments, they have the oppor-tunity to install less-polluting plant right away.
There are, broadly, four technological optionsfor reducing harmful emissions: (a) changing thefuel by switching to low-sulfur coals, oil, and gas;(b) cleaning the coal before combustion; (c) con-trolling emissions; and (d) using existing fuelsmore efficiently, mainly by adopting advanced,high-efficiency, low-emissions technologies. Box6.1 summarizes recent assessments and costs ofthese options. When coal is used, it is not unusualto find two or three approaches used in combina-tionfor instance, to address the rather differentproblems posed by particulates, sulfur dioxide,and nitrogen oxides.
COAL. Coal-fired stations are currently the mainsource of emissions from power stations becausethey make up more than half of total thermal gen-erating capacity and because of the high sulfurcontent of coal in many regions. Combustion effi-ciencies are often poor, and modern emissionscontrol technologies are not widely deployed; thisgives rise to high emission rates of particulates andsulfur dioxide. The technological developmentsdescribed in Box 6.1 mean that options are nowavailable or emerging for reducing all significant
118
Box 6.1 Innovations in emissions control andefficiency in power generation from fossil fuels
Smokestack pollution from power stations can begreatly reduced by clean coal- and oil-burning technol-ogies or by using natural gas. Box table 6.1 shows typi-cal emissions characteristics. For coal several technolo-gies are available or emerging. The first three are incommercial use, and the others are in advanced stagesof development.
Coal-cleaning technologies to reduce nonburningmineral matter (ash). These methods can also removethe 10-30 percent of the sulfur content that is chem-ically bound in the inorganic form (notably, pyrites).The cleaned coal has a higher heat value and puts alower ash load on the boiler.
Mechanical and electrical devices for removingparticulates. These devices, introduced in industrialcountries over the past forty years, can remove morethan 99 percent of particulate matter. Improvements incombustion technologies and thermal efficiencies havealso eliminated carbon monoxide emissions, which arenow rarely classified as a significant pollutant frompower stations in the industrial market economies.
Flue gas desulfurization technologies ("scrub-bers"). These methods, also in commercial use, arecapable of removing more than 90 percent of sulfurousemissions, albeit at some cost. Methods are also beingdeveloped for reducing emissions of nitrogen oxides byusing catalysts and lowering combustion temperaturesand avoiding excess air supply to the boilers.
Fluidized bed combustion, in which crushed coalis fluidized with sand, its own ash, or limestone bysupporting the particles on a strong rising current ofair. The contact of the sulfur compounds with the lime-stone enables the sulfur to be removed from the fur-nace directly. Flue gas desulfurization is not needed,and sulfur dioxide abatement efficiencies are as high as90 percent. Better control of furnace temperatures alsoenables nitrogen oxides to be reduced significantly,while the turbulence of the fluidized bed leads to moreefficient combustion.
Integrated coal gasification combined-cycle tech-nologies with fluidized bed combustion. These either
pollutants from coal (other than carbon dioxide) tolow levels per unit of output. The costs of the op-tions vary, as the last column of Box table 6.1shows, but are not so great as to compromise theability of developing countries to meet their grow-ing demands if they pursue rational abatementpolicies.
GAS. Switching to natural gas, where it is eco-nomically available, carries many environmentaladvantages. Its use offers reductions in particu-

gasify the coal before burning it to drive gas turbines oruse the hot gases from a pressurized version of a flu-idized bed combustion chamber. In both cases appre-
Box table 6.1 Controlling pollution through improved technology for electric power generation
ciable improvements in thermal efficiency have beenobtained in pilot schemes, with further reductions ofsulfur dioxide and nitrogen oxide emissions.
Note: SO2, sulfur dioxide; NO,, nitrogen oxides. Figures for coal and residual fuel oil are based on 3 percent sulfur content.In relation to base case. The percentages are based on generation costs of 5 cents per kilowatt hour, excluding transmission and distribution.A combined cycle plant uses both gas and steam turbines to drive the generators. The gas turbines are powered by the hot gases emerging
directly from the combustion chamber. Steam is also raised in the combustion chamber and by utilizing the still-hot exhaust gases from the gasturbines. The improvements in efficiency arise from the thermodynamic advantages of higher inlet temperatures to the heat engine (turbine).
Varies with relative costs of oil and coal.In relation to conventional oil boiler without controls.
Sources: Based on OECD 1987a and 1989; Asian Development Bank 1991; Bates and Moore, background paper; Anderson 1991a.
lates and sulfur dioxide of more than 99.9 percentin relation to conventional coal-fired boilers withpoor or no emissions control technologies. The useof combined-cycle gas-fired stations also bringssome reductions in emissions of nitrogen oxide perunit of energy produced. Current efficiencies (theproportion of energy converted into electricityfrom the fuel) of combined-cycle gas units areabout 45 percent and could rise to more than 50percentalmost twice those of conventional coal-fired stations thirty-five years ago. Construction
times are also short (roughly four years). For manycountries gas offers the prospect of both cheaperelectric power generation and less local pollution.
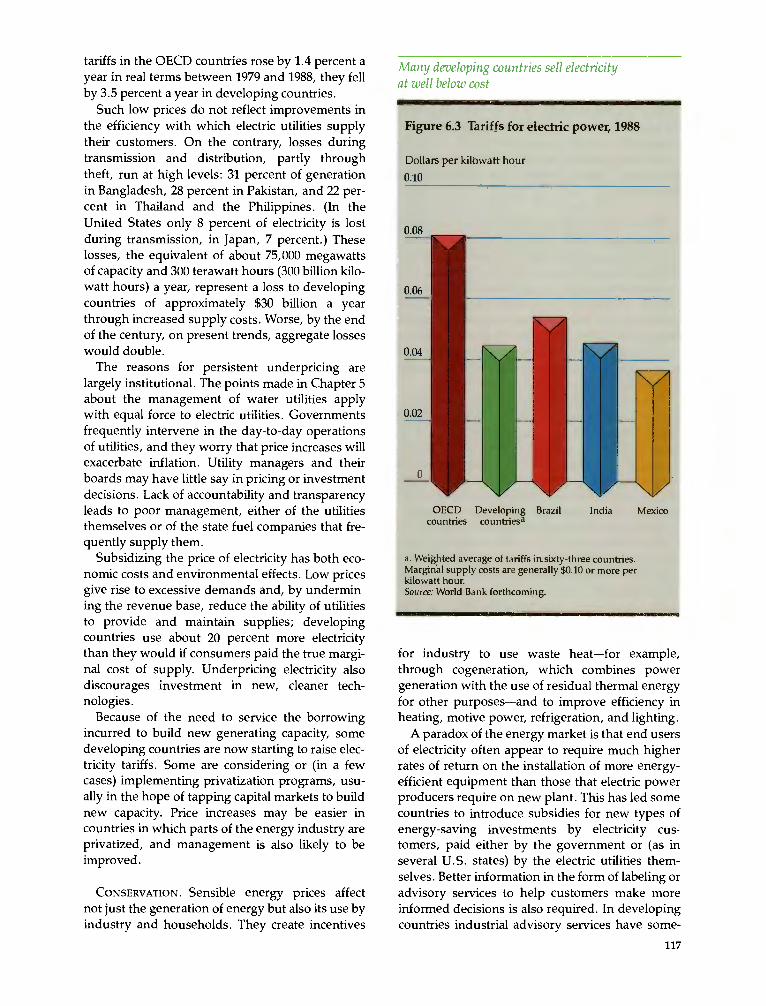
These developments in the efficient use of natu-ral gas for electric power generation have coin-cided with a remarkable increase in proven re-serves over the past twenty-five years (Figure 6.4).In addition to proven reserves, there are several"unconventional" sources of methane that arethought to be vastly greater than conventional re-serves in some countriesfor example, coal-bed
119
Fuel and plant type Emissions control
Percentage abatement inrelation to base case Thermal
efficiency(percent)
Added costs aspercentage of
generationcosts'
Particulatematter SO2 NO,
Base
Coal, conventional boiler None 0 0 0 34.0
With improvements and controlsCoal
Conventional boiler Mechanical cleaning 90 0 0 34.0 <1(cyclone)
Conventional boiler Fabric ("baghouse")filters
>99 0 0 34.0 2-4
Conventional boiler Electrostaticprecipitators (ESP)
>99 0 0 34.0 2-4
Conventional boiler ESP/coal cleaning >99 10-30 0 34.0 4-6Conventional boiler ESP/S02 controls >99 90 0 34.0 12-15Conventional boiler ESP/ SO2 and NO,
controls>99 90 90 33.1 17-20
Fluidized bed combustion ESP >99 90 56 33.8Pressurized fluidized bed ESP >99 93 50 38.9
combustion/combinedcycle5
<0-2
Integrated coal gasification)combined cycle5
None >99 99 50 38.0
Residual fuel oilConventional boiler None 97 30 12 35.2Conventional boiler ESPISO2 controls >99.9 93 12 35.2 1012°Combined cycle5 ESP/S02 and NO,
controls>99.9 93 90 34.4 13I5
Natural gasConventional boiler None >99.9 >99.9 37 35.2Conventional boiler NO, controls >99.9 >99.9 45 35.2 <0Combined cycle5 None >99.9 >99.9 62 44.7
Discoveries of natural gas have risen appreciably
Figure 6.4 Proven reserves of natural gas,selected years, 1965-90
Billions of tons of oil equivalent
50
Source: British Petroleum Company 1991.
methane; "tight gas" formations in which the gasis held in rocks of low permeability and rock-frac-turing techniques are required to bring about use-ful production; and some as yet uneconomical re-serves such as shale gas deposits. The costs ofexploiting natural gas reserves vary according tocircumstances but have generally declined. Margi-nal costs in developing countries range from one-quarter to three-quarters of the cost of steam coal,the cheapest imported alternative energy source.
A major barrier to development has been thehigh fixed costs of exploration and production andof establishing a basic pipeline network. For thosecountries that have a natural gas resource but haveyet to exploit it, the development of gas-firedpower station projects can provide the commer-cially justified starting point for the developmentof a widespread gas industry. Trade in natural gaswill also be important from both commercial andenvironmental perspectives; there is enormousscope both for the shipment of liquefied naturalgas to the main demand centers and for pipelineexports of gas from the former U.S.S.R., Europe,the Middle East, and North Africa.
120
FUEL OIL. Polluting emissions from the use offuel oil for electric power generation can similarlybe reduced to very low levels. Emissions of partic-ulate matter are intrinsically much lower for oilthan for coal and can be virtually eliminated byusing the technologies described in Box 6.1. Theuse of low-sulfur fuel oil or flue gas desulfuriza-tion can reduce emissions of sulfur dioxide bymore than 90 percent. Catalytic methods are alsoavailable for significantly reducing nitrogen oxidesin exhaust gases. The costs of controlling emis-sions from oil-fired plant are lower than those forcoal.
REGULATION. To encourage electric utilities toemploy pollution-reducing technologies, govern-ments generally use regulation. This has been ef-fective (although not always cost-effective) in in-dustrial countries because there the pollutioncomes from a relatively small number of easilymonitored point sources. In addition, the utilitiesare monopolies, are already regulated, and areperhaps more responsive to regulation than totaxes. This situation may change with the growthof private ownership of power plants; pollutiontaxes (on, for example, sulfur emissions) wouldhelp to encourage plants to adopt more cost-effec-tive means of abatement.
Regulation has typically involved setting abate-ment standards. It is fortunate that the technologyfor addressing one of the most serious pollutionproblems of electric power productionemissionsof particulate matteris relatively simple and inex-pensive. Increased use of gas-fired power stationswill be important in this respect. Where coal is thepreferred fuel, constructing tall chimneys, sitingpower stations away from large population cen-ters, and using the emissions control devices dis-cussed in Box 6.1 all help to reduce disamenity andhazards to health from its combustion. They addless than 2 percent to total supply costs and maybe associated with reductions in costs. China, forexample, has numerous small coal-fired powerplants that emit three to eight times more particu-lates per kilowatt hour generated than do largeplants yet have 30 percent higher capital costs, 60percent higher operating costs, and lower efficien-cies than large plants. Given the costs to life andhealth of particulate matter emissions (Chapter 2)and the modest costs of reducing the emissions tolow levels, the case for working toward high stan-dards of abatement is unambiguous.
Unless natural gas is economically available, set-ting emissions standards for nitrogen oxides andsulfur dioxide will require a more critical examina-
1965 1980 1990
El Western Europe Latin America
El Eastern Europe and former U.S.S.R.El Asia, Australia, and New Zealand U AfricaEl Middle East U North America

Demand for electric power will grow, but pollution can be curbed and costs reduced
Figure 6.5 Expansion of electric power in developing countries: pollution effects andinvestment requirement under three scenarios, 1990-2030
Index (1990=100)
1,200
Emissions of pollutantsa
tion of tradeoffs (as was done, for example, in Po-land; see Figure 3.3). Extensive studies in Europeand North America have found that the damagefrom these pollutants varies greatly with region.Much can be accomplished by using coal-cleaningtechnologies and low-sulfur fuels. Costs can alsobe reduced by a proper phasing of investments. Inindustrial countries the costs of flue gas desulfur-ization are declining with experience; alter-natively, it may be more cost-effective to postponedecisions until advanced coal combustion technol-ogies or new gas deposits are fully commercial-ized.
The three scenarios
Figure 6.5 illustrates the three scenarios discussedin this section.
In the "unchanged practices" scenario, envi-
Annual investment requirement
Note: NOR, nitrogen oxides; PM, particulate matter; SO sulfur oxides. Assumptions are as follows: growth of per capita income andpopulation as in Chapter 1; per capita income elasticity, 1.5; price elasticity, -0.5; pollution abatement technologies and costs as in Box6.1; initial average electricity prices as in Figure 6.3; and initial managerial and institutional inefficiencies that imply costs 50 percenthigher than with good practices.
The upper two curves are indexes for all pollutants, which increase together.Marginal cost pricing is phased in over twenty-five years, and losses in transmissions distribution and unused capacity are reduced
to "best-practice" levels.Abatement technologies are phased in over twenty years.
Source:Anderson and Cavendish, background paper.
ronmental policies are not in place, and rising de-mands for electric power are met at the cost of anexponential rise in pollution.
In the second scenario, reforms to rectify theprice inefficiencies and problems of accountabilitynoted above are phased in gradually over twenty-five years. Pollution still rises (although moreslowly), but there is less waste of capital, fuel, andoperating resources in supply and less waste ofenergy in consumptiona clear case of good eco-nomic policies being good for the environment.The investment costs of expansion are lower (thesecond panel of Figure 6.5) and could even declinefor a period as output expands, as a result of im-proved capacity utilization and reductions inlosses. The net benefits of electricity supply arealso higher. Efficiency in energy production anduse thus reduces pollution while raising incomesand welfare.
121
1,000 A800
600
pr
00200 sox-
PM NO
0
1990 2000 2010 2020 2030 1990 2000 2010 2020 2030
- 'Unchanged practices' scenarioScenario with efficiency reforms b
Scenario with efficiency reforms and pollution abatement measures C
Billions of dollars
1,200
1,000
800
600
400
200
0

In the third scenario, in addition to energyefficiency, environmentally improved technologiesand practices are gradually incorporated into thecapital stock. Pollution rises initially on account oflags and difficulties in introducing new policiesand practices but eventually declines as output ex-pands. The savings in investment arising from im-provements in prices and institutional arrange-ments far outweigh any extra costs of pollutionabatement.
Renewable and nuclear energy
Fossil fuels will continue to be the predominantenergy source for the next several decades, andthe main task ahead will be to use them in eco-nomically and environmentally satisfactory ways.But if the threat of greenhouse warming made itnecessary to restrict the use of fossil fuels, couldthe world's demands for commercial energy stillbe met? More efficient use of fossil fuels and aswitch from coal to fuels lower in carbon couldsubstantially reduce emissions of carbon dioxideper unit of output. Beyond that, the options wouldbe nuclear energy or renewable energy (primarilysolar energy, biomass, geothermal energy, hydro-power, and wind).
As Figure 6.2 showed, nuclear power providesless than 1 percent of the energy used in develop-ing countries. That share seems unlikely to risesignificantly. Quite apart from the abundance offossil fuel reserves, which will act to depress de-mand for all alternatives, nuclear power has twohandicaps: its costs and its environmental risks.Discoveries of fossil fuel reserves and progress inproduction and conversion technologies havehelped to hold down the prices of fossil fuels. Atthe same time, the costs of nuclear stations haverisen for a variety of reasons: long lead times anddelays in seeking approval, meeting environmen-tal safeguards, and constructing the plants; thecosts and risks of disposing of radioactive wastes;and the prospective costs of decommissioningplants. Recent estimates (OECD 1989) show thatfossil fuels still have lower costs than nuclearpower, except perhaps at low discount rates.
While the costs of nuclear power have in-creased, developments in renewable energy in the1970s and 1980sin solar, wind, and biomass en-ergy, in particularhave led to remarkable cost re-ductions in these technologies. There is now agrowing awareness that renewable energy is anabundant resource that can be harnessed.
Each year the earth's surface receives from thesun about ten times as much energy as is stored in122
the whole of the world's fossil fuel and uraniumreserves. This energythe equivalent of 15,000times the world's primary energy demandcan becaptured in solar-thermal systems, which produceheat for electric power generation and for domesticand commercial uses, or with photovoltaic sys-tems, which produce electric power directly fromsunlight. Both types of scheme have been consid-ered for the production of hydrogen, which couldbe used as a transport, domestic, or industrial fuel.Solar energy can also be stored by growing plantsand, in the form of biomass, may be used as afeedstock for the production of commercial fuelsand electric power.
In the past there have always been two commer-cial drawbacks to solar schemes: the amount ofland they require and their costs. Both are declin-
Producing solar power would occupy relatively littleland area
Figure 6.6 Land used to cultivate selectedcrops worldwide and hypothetical landrequirements for production of solar energy,1989
Millions of hectares
0 50 100 150 200 250 300 350
Grapes
Coffee
Sugar cane
Potatoes
Groundnuts
Solar farms a
Seed cotton
Soybeans
Rice
WheatCoarsegrainsb
The bar shows the area that would be required in theoryto meet world demand for commercial energy using onlysolar energy. It assumes that solar farms would be in areaswith insolations of 2,000 kilowatt hours per square meter peryear, the net conversion efficiency is 10 percent, primaryenergy demand is 8 billion tons of oil equivalent, 50 percentof primary energy goes to electricity, and conversion factorsare 12,000 and 4,000 kilowatt hours per ton of oil equivalentfor nonelectric and electric energy, respectively.
Barley, maize, millet, oats, rye, and sorghum.Source: FAQ 1990b.
ing. In developing countries solar insolation isroughly 6,500 times the annual consumption ofcommercial energy. At current conversion efficien-cies of 15 percent, less than 0.1 percent of thesecountries' land area would be required to meet, intheory, the whole of their primary energy require-ments. In industrial countries the fraction of landarea is 0.5 percent. These areas are less than thosecurrently occupied by hydroelectric reservoirsworldwide and are very small in relation to thearea under crops (see Figure 6.6). In fact, the landintensities of solar schemes average only one-twentieth those of hydroelectric schemes andsometimes considerably lessthey are less thanone-hundredth that of the Aswan High Dam, forexample. Moreover, the ideal locations will oftenbe sparsely populated arid areas, and the technol-ogy is modular and allows flexibility in the choiceof sites. Thus, solar schemes suffer minimally ornot at all from three problems that sometimes be-set hydroelectric schemesthe inundation of ar-able or forested lands, ecological side effects, andthe displacement of people.
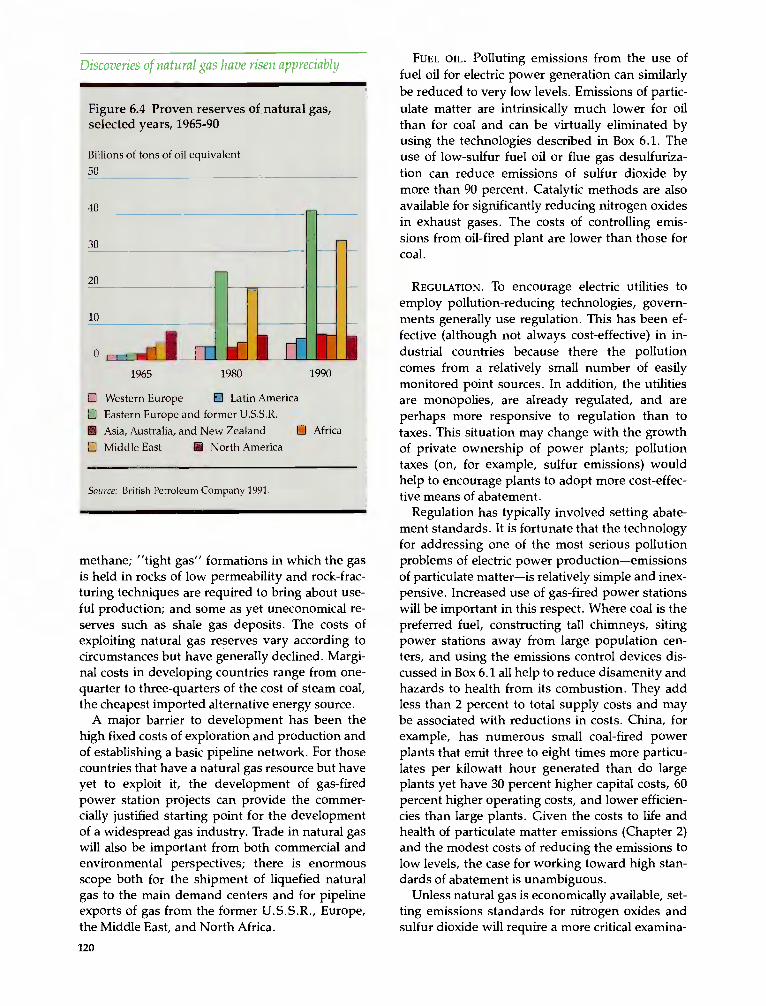
The costs of all commercial forms of renewableenergy have declined remarkably over the pasttwo decades (as they did in the earlier part of thiscentury for electric power generation from fossilfuels; see Figure 6.7). The costs of solar energy
Increased efficiency has reduced costs greatlyin this century
Figure 6.7 Electric power generation: costand thermal efficiency in the United States,1900-90
Cost(1990 dollars per Thermal efficiencykilowatt hour) (percent)
401.40
1.20
1.00
0.80
0.60
0.40
0.20
Cost
Thermal efficiency- 20
- 30
- 10
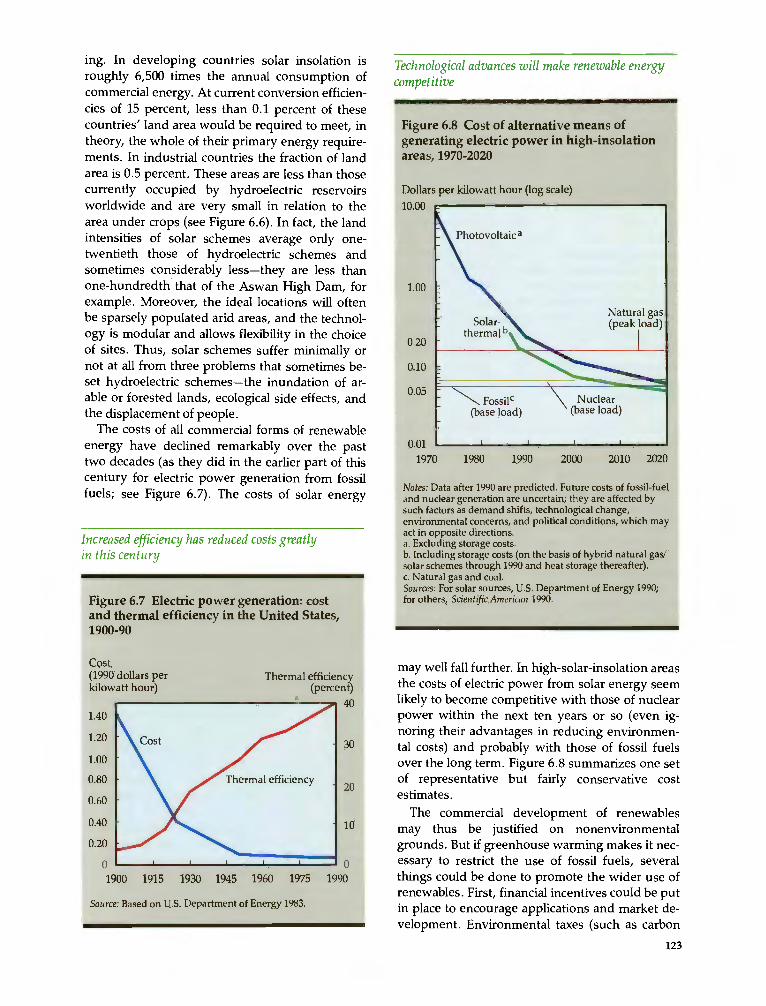
Technological advances will make renewable energycompetitive
Figure 6.8 Cost of alternative means ofgenerating electric power in high-insolationareas, 1970-2020
Dollars per kilowatt hour (log scale)
10.00
1.00
0.20
0.10
0.05
0.01
Photovoltaic a
Natural gas(peak load)
FOSsilC Nuclear(base load) (base load)
1970 1980 1990 2000 2010 2020
Notes: Data after 1990 are predicted. Future costs of fossil-fueland nuclear generation are uncertain; they are affected bysuch factors as demand shifts, technological change,environmental concerns, and political conditions, which mayact in opposite directions.
Excluding storage costs.Including storage costs (on the basis of hybrid natural gas!
solar schemes through 1990 and heat storage thereafter).Natural gas and coal.
Sources: For solar sources, U.S. Department of Energy 1990;for others, Scientific American 1990.
may well fall further. In high-solar-insolation areasthe costs of electric power from solar energy seemlikely to become competitive with those of nuclearpower within the next ten years or so (even ig-noring their advantages in reducing environmen-tal costs) and probably with those of fossil fuelsover the long term. Figure 6.8 summarizes one setof representative but fairly conservative costestimates.
The commercial development of renewablesmay thus be justified on nonenvironmentalgrounds. But if greenhouse warming makes it nec-essary to restrict the use of fossil fuels, severalthings could be done to promote the wider use ofrenewables. First, financial incentives could be putin place to encourage applications and market de-velopment. Environmental taxes (such as carbon
123
0 0
1900 1915 1930 1945 1960 1975 1990
Source: Based on U.S. Department of Energy 1983.
taxes) on fossil fuels would favor renewables andencourage private research and development(R&D). Second, industrial countries, in particular,could allocate a greater share of their national en-ergy R&D portfolios to renewables. Up to now,R&D has been heavily skewed in favor of nuclearpower. The member countries of the InternationalEnergy Agency (lEA) allocate 60 percent of theirR&D budgets (which totaled $7.3 billion in 1989) tonuclear power, 15 percent to coal, oil, and gas, and19 percent to electric power transmission andother areas but only 6 percent to renewables. Inter-national collaboration on research in renewableenergy also merits support. Several developingcountriesincluding Brazil, China, India, andThailandalready have the nucleus of good re-search programs. Third, applications in develop-ing countries could be encouraged by expandingthe Global Environment Facility and concessionalfinance (see Chapter 9).
Vehicle fuels
Pollution caused by fuels used in transport is ris-ing rapidly in developing countries as passengerand freight traffic increases. Transport fuels ac-count for more than 55 percent of developingcountries' total oil consumption, which has grownby 50 percent since 1980, as against 10 percent inthe OECD economies.
In the cities of developing countries vehicles area significant source of airborne toxic pollutants,accounting for up to 95 percent of lead. Three fac-tors make pollution from vehicles more seriousthan in industrial countries. First, many vehiclesare in poor condition, and lower-quality fuels areused. Second, motor vehicles are concentrated in afew large cities. In Mexico and Thailand about halfthe vehicle fleet operates in the capital city, and inBrazil a quarter of the fleet operates in São Paulo.Third, a far larger percentage of the populationmoves and lives in the open air and is thus moreexposed to automotive pollutants. The poor areusually the most affected. They and their childrenare more likely to walk than to ride, and they arethus exposed to noxious fumes and to lead, whichis known to affect mental development and theneurological system. Lead and other pollutantsalso contaminate food in open-air restaurants,which are frequented by the poor.
The OECD countries have had some success incontrolling the main pollutants from motor vehi-cles. Increasingly stringent regulations have led tochanges in the design of engines, in emissions
124
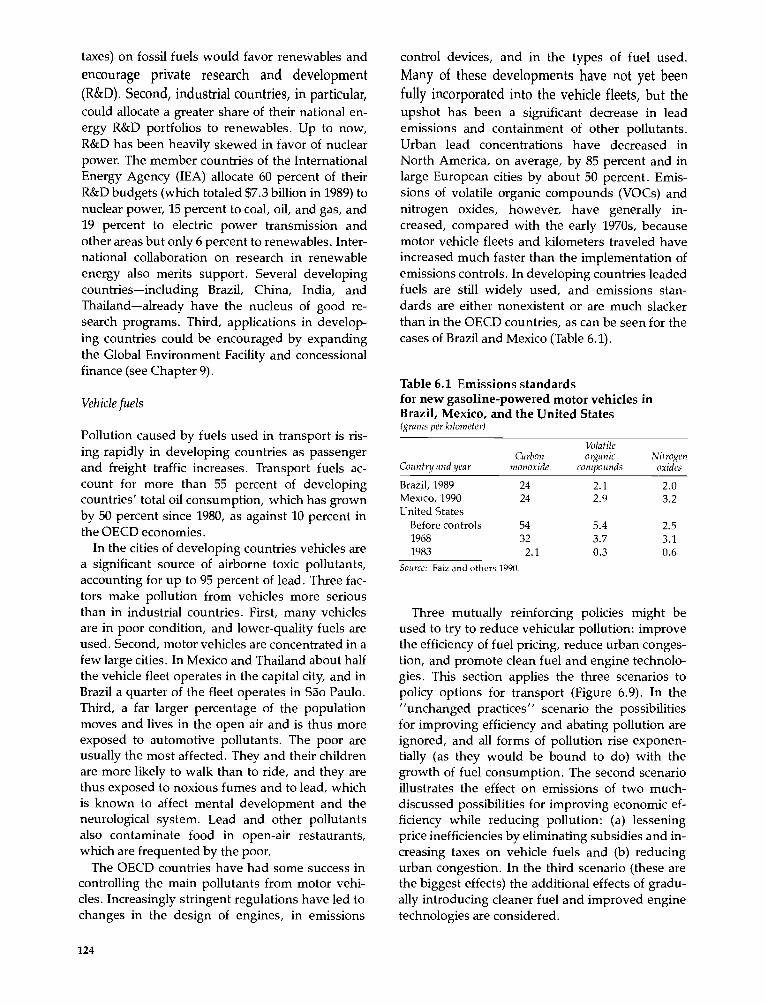
control devices, and in the types of fuel used.Many of these developments have not yet beenfully incorporated into the vehicle fleets, but theupshot has been a significant decrease in leademissions and containment of other pollutants.Urban lead concentrations have decreased inNorth America, on average, by 85 percent and inlarge European cities by about 50 percent. Emis-sions of volatile organic compounds (VOCs) andnitrogen oxides, however, have generally in-creased, compared with the early 1970s, becausemotor vehicle fleets and kilometers traveled haveincreased much faster than the implementation ofemissions controls. In developing countries leadedfuels are still widely used, and emissions stan-dards are either nonexistent or are much slackerthan in the OECD countries, as can be seen for thecases of Brazil and Mexico (Table 6.1).
Table 6.1 Emissions standardsfor new gasoline-powered motor vehicles inBrazil, Mexico, and the United States
Source: Faiz and others 1990.
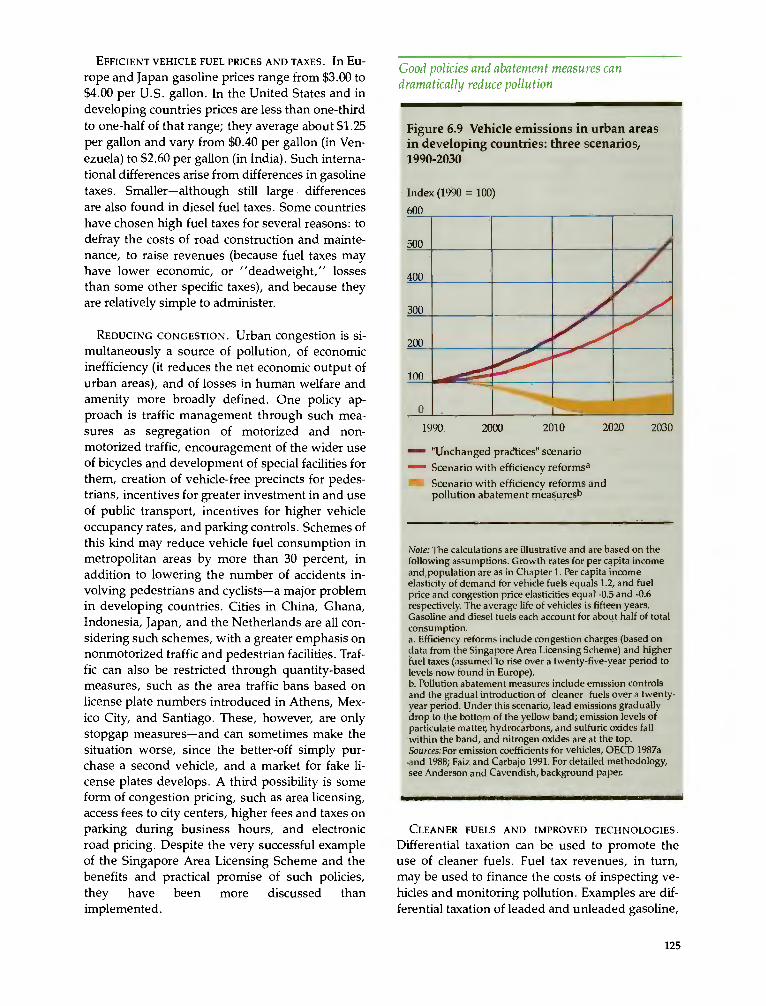
Three mutually reinforcing policies might beused to try to reduce vehicular pollution: improvethe efficiency of fuel pricing, reduce urban conges-tion, and promote clean fuel and engine technolo-gies. This section applies the three scenarios topolicy options for transport (Figure 6.9). In the"unchanged practices" scenario the possibilitiesfor improving efficiency and abating pollution areignored, and all forms of pollution rise exponen-tially (as they would be bound to do) with thegrowth of fuel consumption. The second scenarioillustrates the effect on emissions of two much-discussed possibilities for improving economic ef-ficiency while reducing pollution: (a) lesseningprice inefficiencies by eliminating subsidies and in-creasing taxes on vehicle fuels and (b) reducingurban congestion. In the third scenario (these arethe biggest effects) the additional effects of gradu-ally introducing cleaner fuel and improved enginetechnologies are considered.
(grams per kilometer)
VolatileCarbon organic Nitrogen
Country and year monoxide compounds oxides
Brazil, 1989 24 2.1 2.0Mexico, 1990 24 2.9 3.2United States
Before controls 54 5.4 2.51968 32 3.7 3.11983 2.1 0.3 0.6
EFFICIENT VEHICLE FUEL PRICES AND TAXES. In Eu-
rope and Japan gasoline prices range from $3.00 to$4.00 per U.S. gallon. In the United States and indeveloping countries prices are less than one-thirdto one-half of that range; they average about $1.25per gallon and vary from $0.40 per gallon (in Ven-ezuela) to $2.60 per gallon (in India). Such interna-tional differences arise from differences in gasolinetaxes. Smalleralthough still largedifferencesare also found in diesel fuel taxes. Some countrieshave chosen high fuel taxes for several reasons: todefray the costs of road construction and mainte-nance, to raise revenues (because fuel taxes mayhave lower economic, or "deadweight," lossesthan some other specific taxes), and because theyare relatively simple to administer.
REDUCING CONGESTION. Urban congestion is si-multaneously a source of pollution, of economicinefficiency (it reduces the net economic output ofurban areas), and of losses in human welfare andamenity more broadly defined. One policy ap-proach is traffic management through such mea-sures as segregation of motorized and non-motorized traffic, encouragement of the wider useof bicycles and development of special facilities forthem, creation of vehicle-free precincts for pedes-trians, incentives for greater investment in and useof public transport, incentives for higher vehicleoccupancy rates, and parking controls. Schemes ofthis kind may reduce vehicle fuel consumption inmetropolitan areas by more than 30 percent, inaddition to lowering the number of accidents in-volving pedestrians and cyclistsa major problemin developing countries. Cities in China, Ghana,Indonesia, Japan, and the Netherlands are all con-sidering such schemes, with a greater emphasis onnonmotorized traffic and pedestrian facilities. Traf-fic can also be restricted through quantity-basedmeasures, such as the area traffic bans based onlicense plate numbers introduced in Athens, Mex-ico City, and Santiago. These, howeveL are onlystopgap measuresand can sometimes make thesituation worse, since the better-off simply pur-chase a second vehicle, and a market for fake li-cense plates develops. A third possibility is someform of congestion pricing, such as area licensing,access fees to city centers, higher fees and taxes onparking during business hours, and electronicroad pricing. Despite the very successful exampleof the Singapore Area Licensing Scheme and thebenefits and practical promise of such policies,they have been more discussed thanimplemented.
Good policies and abatement measures candramatically reduce pollution
Figure 6.9 Vehicle emissions in urban areasin developing countries: three scenarios,1990-2030
Index (1990 = 100)
600
500
400
300
200
100
0
'Unchanged practices" scenarioScenario with efficiency reformsaScenario with efficiency reforms andpollution abatement measuresb
Note: The calculations are illustrative and are based on thefollowing assumptions. Growth rates for per capita incomeand population are as in Chapter 1. Per capita incomeelasticity of demand for vehicle fuels equals 1.2, and fuelprice and congestion price elasticities equal -0.5 and -0.6respectively. The average life of vehicles is fifteen years.Gasoline and diesel fuels each account for about half of totalconsumption.
Efficiency reforms include congestion charges (based ondata from the Singapore Area Licensing Scheme) and higherfuel taxes (assumed to rise over a twenty-five-year period tolevels now found in Europe).
Pollution abatement measures include emission controlsand the gradual introduction of cleaner fuels over a twenty-year period. Under this scenario, lead emissions graduallydrop to the bottom of the yellow band; emission levels ofparticulate matter, hydrocarbons, and sulfuric oxides fallwithin the band, and nitrogen oxides are at the lop.Sources:For emission coefficients for vehicles, OECD 1987aand 1988; Faiz and Carbajo 1991. For detailed methodology,see Anderson and Cavendish, background paper.
CLEANER FUELS AND IMPROVED TECHNOLOGIES.
Differential taxation can be used to promote theuse of cleaner fuels. Fuel tax revenues, in turn,may be used to finance the costs of inspecting ve-hicles and monitoring pollution. Examples are dif-ferential taxation of leaded and unleaded gasoline,
125
1990 2001) 2010 2020 2030

fuel price surcharges based on the sulfur contentof diesel fuel, and lower taxes on "clean" fuelssuch as compressed natural gas. Some empiricalevidence from the United States and the recentexperience of the United Kingdom with tax ex-emptions on unleaded fuels shows that the choiceof fuel is highly sensitive to price. The same wouldprobably be true of tax incentives for the adoptionof emissions control devicesfor example, cataly-tic converters on gasoline engines and the particu-late "traps" being developed for diesels. Experi-ence suggests, however, that for a policy to beeffective, any tax incentives would need to be com-plemented by regulations regarding standards andemissions testing (see Box 3.4).
Household energy
About half of the world's people cook all or someof their meals with biomass fuels. Until the twen-tieth century such fuelsmainly firewoodpro-vided most of the world's energy. Today biomassin all its forms (wood, agricultural and forestryresidues, and dung) meets about 14 percent of theworld's energy demands. More than 80 percent isconsumed in developing countries (see Figure6.2), where it still accounts for 35 percent of energysuppliesmore than is met by coal, oil, gas, orhydropower. Biomass is used not only for cookingbut also in small-scale service industries, agri-cultural processing, and the manufacture of bricks,tiles, cement, and fertilizers. Such uses can be sub-stantial, especially in and around towns and cities.
The use of biomass fuels for cooking gives rise tohigh levels of indoor air pollution (Chapter 2). It isalso a source of ecological damage: the use of dungand crop residues depletes soil productivity, anddeforestation often causes soil erosion. Finally, thepoor thermal efficiency of biomass helps to explainthe relatively high energy intensities of many low-income developing countries and their high car-bon dioxide and particulate emissions in relationto energy use.
Making the transition from reliance on biomassto commercial fuels will be slow and difficult, andthere is no obvious way of hastening the process.Some countries subsidize kerosene; this leads tosome extra substitution, but people also buy ex-cess amounts and retail it as a (very polluting) sub-stitute for diesel fuels. Haiti, in contrast, taxes ker-osene, which has discouraged its use. Substitutionis further handicapped by poor infrastructure, dis-persed populations, and poor delivery services inmany regions, notably in Africa.
126
One promising strategy is to devise less-pollut-ing ways of burning biomass. Several countrieshave developed and disseminated improved bio-mass stoves over the past two decades, althoughwith mixed success. Much has been learned, how-ever, and continued support for these efforts willbe important (Box 6.2). The installation of chim-neys has increased the popularity of the stovesfor example, in China, where 100 million im-proved stoves have been introduced.
When the transition is from biomass to coal orlignite, as in China and Turkey, it introduces out-door pollution on a scale just as serious as thatencountered, for example, by Sheffield, Pitts-burgh, the Ruhr, and many other industrial areasfifty years ago. The histories of these places showthat the reduction of outdoor pollution fromhousehold fuels depends on two developments.The first is a shift toward oil, gas, electricity, anddistrict heating; for many cities this will take sev-eral decades. The second is the use of cleanercoals, such as anthracite, for which particulateemissions are roughly one-twentieth those of rawbituminous coal. China, where residential andcommercial consumption of coal totals more than200 million tons a year and nearly doubled in the1980s, is weighing this option. Cleaner coal-burn-ing technologies in district heating plants andsmall-scale commercial enterprises will also be re-quired and may help to reduce costs by improvingefficiency.
Reducing indoor and outdoor pollution fromhousehold use of biomass fuels and coal in devel-oping countries presents one of the more difficultproblems of development and will take two orthree decades to addresspossibly longer. As withpollution from other forms of energy use, it cannotbe solved by efficiency alone, important thoughthis will be. It will depend above all on the growthof per capita incomes and on the successful devel-opment of commercial energy.
Industry
Three factors intensify the environmental prob-lems associated with rapid industrial develop-ment. First, as emissions from existing activitiesincrease, they pass the point at which they can bereadily assimilated by the environment. Second,as industrial towns expand, more people are ex-posed to pollution. Third, within industry thestructure shifts away from activities that are mod-erately polluting, such as textiles, wood products,and food processing, and toward others with
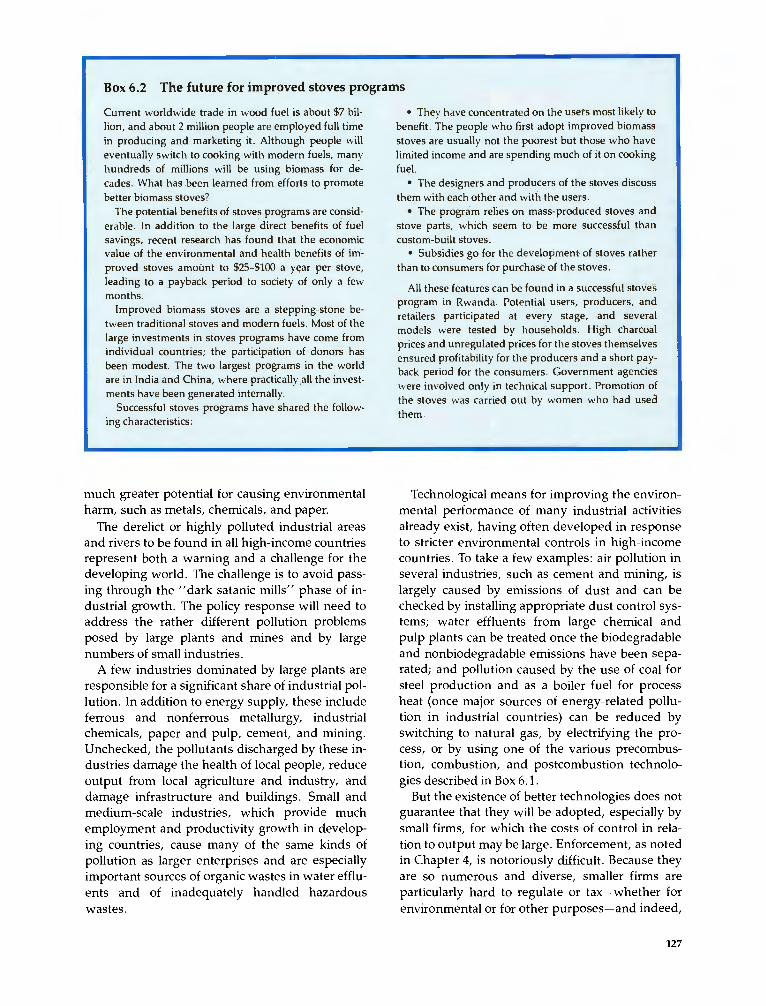
Box 6.2 The future for improved stoves programs
Current worldwide trade in wood fuel is about $7 bil-lion, and about 2 million people are employed full timein producing and marketing it. Although people willeventually switch to cooking with modern fuels, manyhundreds of millions will be using biomass for de-cades. What has been learned from efforts to promotebetter biomass stoves?
The potential benefits of stoves programs are consid-erable. In addition to the large direct benefits of fuelsavings, recent research has found that the economicvalue of the environmental and health benefits of im-proved stoves amount to $25-$100 a year per stove,leading to a payback period to society of only a fewmonths.
Improved biomass stoves are a stepping-stone be-tween traditional stoves and modern fuels. Most of thelarge investments in stoves programs have come fromindividual countries; the participation of donors hasbeen modest. The two largest programs in the worldare in India and China, where practically all the invest-ments have been generated internally.
Successful stoves programs have shared the follow-ing characteristics:
They have concentrated on the users most likely tobenefit. The people who first adopt improved biomassstoves are usually not the poorest but those who havelimited income and are spending much of it on cookingfuel.
The designers and producers of the stoves discussthem with each other and with the users.
The program relies on mass-produced stoves andstove parts, which seem to be more successful thancustom-built stoves.
Subsidies go for the development of stoves ratherthan to consumers for purchase of the stoves.
All these features can be found in a successful stovesprogram in Rwanda. Potential users, producers, andretailers participated at every stage, and severalmodels were tested by households. High charcoalprices and unregulated prices for the stoves themselvesensured profitability for the producers and a short pay-back period for the consumers. Government agencieswere involved only in technical support. Promotion ofthe stoves was carried out by women who had usedthem.
much greater potential for causing environmentalharm, such as metals, chemicals, and paper.
The derelict or highly polluted industrial areasand rivers to be found in all high-income countriesrepresent both a warning and a challenge for thedeveloping world. The challenge is to avoid pass-ing through the "dark satanic mills" phase of in-dustrial growth. The policy response will need toaddress the rather different pollution problemsposed by large plants and mines and by largenumbers of small industries.
A few industries dominated by large plants areresponsible for a significant share of industrial p01-lution. In addition to energy supply, these includeferrous and nonferrous metallurgy, industrialchemicals, paper and pulp, cement, and mining.Unchecked, the pollutants discharged by these in-dustries damage the health of local people, reduceoutput from local agriculture and industry, anddamage infrastructure and buildings. Small andmedium-scale industries, which provide muchemployment and productivity growth in develop-ing countries, cause many of the same kinds ofpollution as larger enterprises and are especiallyimportant sources of organic wastes in water efflu-ents and of inadequately handled hazardouswastes.
Technological means for improving the environ-mental performance of many industrial activitiesalready exist, having often developed in responseto stricter environmental controls in high-incomecountries. To take a few examples: air pollution inseveral industries, such as cement and mining, islargely caused by emissions of dust and can bechecked by installing appropriate dust control sys-tems; water effluents from large chemical andpulp plants can be treated once the biodegradableand nonbiodegradable emissions have been sepa-rated; and pollution caused by the use of coal forsteel production and as a boiler fuel for processheat (once major sources of energy-related pollu-tion in industrial countries) can be reduced byswitching to natural gas, by electrifying the pro-cess, or by using one of the various precombus-tion, combustion, and postcombustion technolo-gies described in Box 6.1.
But the existence of better technologies does notguarantee that they will be adopted, especially bysmall firms, for which the costs of control in rela-tion to output may be large. Enforcement, as notedin Chapter 4, is notoriously difficult. Because theyare so numerous and diverse, smaller firms areparticularly hard to regulate or taxwhether forenvironmental or for other purposesand indeed,
127

Table 6.2 Costs of pollution abatement, United States, 1989
Source: U.S.Bureau of the Census 1990 and 1991.
most are not even recorded in establishmentsurveys.
Costs and the scope for cost reductions
The technologies thus often exist, but the costs aresometimes still high, especially for small com-panies. For industry as a whole, capital invest-ment in pollution abatement accounted for about 5percent of total industrial investment in Germany,Japan, and the United States in the late 1970s andearly 1980s (although it had risen to 17 percent inJapan in the early 1970s). Table 6.2 shows that inabsolute terms the heaviest cost burden in theUnited States fell on the chemicals, petroleum, pri-mary metals, and paper industries. (Note that ex-penditures are quite small in relation to the totalvalue of outputin the range of 0.3-1.5 percent.)
These figures overstate the likely burden ofabatement expenditures on industries in develop-ing countries, at least for large plants. The earlieststeps in pollution control tend to be the least ex-pensive. Up to 60-80 percent of pollution can beeliminated with only small increases in costs.Thereafter, the additional ("marginal") cost risessharply as the degree of abatement is increased; incontrast, the benefits of each new step in abate-ment are large at first and then taper off. Emis-sions standards in some industrial countries havereached the point at which the costs of additionalabatement rise sharply while the benefits increaseonly slowly. Developing countries are at an earlierstage.
Emissions often can be sharply reduced at noextra cost by installing technologies already in
128
common use in industrial countries. There, emis-sions from large industrial plants fell even beforethe main surge of investment in pollution controlsthat followed the passage of key legislation in thelate 1960s and early 1970sa good example of in-novations leading, rather than following, laws andregulations.
Industries in developing countries have the ad-vantage of making new investments rather thanreplacing old equipment. In industrial countriesbasic changes in production processes often can-not easily be accommodated in existing plant. As aresult, industrial countries have tended to controlemissions mainly by adding on technologies. Lessthan a quarter of capital expenditures on pollutioncontrol for German manufacturing firms during1975-84 was devoted to changes in productionprocesses as distinct from the installation of end-of-pipe controls. When a new plant is being built,however, it is usually more cost-effective to adoptproduction processes that recycle residuals or gen-erate less wastethe so-called "low-waste" pro-cesses. These, combined with improved operatingprocedures that reduce leaks and spills, canachieve substantial reductions in industrial emis-sions. Table 6.3, based on a study of German in-dustry, illustrates the potential for reducing haz-ardous wastes by means of such changes. Box 6.3gives an example of how technological changeshave brought about greater efficiency and loweremissions in the pulp and paper industry. Recentsurveys by the United Nations Industrial Develop-ment Organization (UNIDO 1991) and others haveshown that possibilities for reducing both wastesand costs simultaneously are widespread.
Sector
Total investment in new plant and equipment Annual cost of pollution abatement
Millionsof dollars
Share forpollutionabatement(percent)
Type ofabatement(percent) Millions
of dollars
As share oftotal valueof out put(percent)
Type ofabatement(percent)
Air Water Air Water
Food and beverages 8,330 3 20 70 1,056 0.3 13 63Textiles 2,280 1 33 56 136 0.3 14 59Paper 10,070 8 49 32 1,449 1.1 27 47Chemicals 13,480 9 32 50 3,509 1.3 23 46Petroleum 3,330 13 35 55 2,170 1.5 58 27Rubber 4,570 2 64 20 403 0.4 21 25Stone, clay, and glass 2,870 3 75 18 592 0.9 56 14Primary metals 5,660 7 53 34 1,931 1.3 46 27Fabricated metals 4,610 3 33 47 896 0.6 14 43Machinery 8,050 2 59 32 572 0.2 14 30Electrical equipment 8,660 2 35 50 729 0.4 14 42Transport equipment 9,970 3 54 29 1,000 0.3 21 32All manufacturing 97,190 4 42 42 15,626 0.5 30 37

Table 6.3 Potential for waste reductionthrough low-waste practices, Germany
In developing countries end-of-pipe controlsshould be less important because their industrialsectors are expanding rapidly. Each new invest-ment offers an opportunity to incorporate cost-ef-fective pollution control. In ten years' time newplants will account for more than half of the indus-trial output of developing countries and in twentyyears for practically all of it. Thus policies that leadto the adoption of a proper combination of low-waste processes and end-of-pipe controls shouldpermit developing countries to reduce emissions
from large industrial plants (as output expands) ata lower cost than is being incurred by industrialcountries.
Policy
At the earliest stages of policy development thecrucial considerations must be, first, to ensure thatthe initial measures are unambiguous and easilyenforced and, second, to concentrate on thoseemissions and wastes that cause the most damage,particularly to health.
DIFFICULTIES OF ENFORCEMENT. The standardsimposed by industrial countries may set reason-able long-term goals, but developing countriesrarely have the means or the need to adopt themimmediately. Instead, each country must deter-mine its own priorities. Emissions standards needto be set in the light of a balance between the mar-ginal costs of the damage caused by the main pol-lutants and the marginal costs of reducing suchemissions.
A common practice has been to adopt emissionsstandards promulgated in industrial countries andthen to negotiate with firms about enforcement.
Box 6.3 Benign technological change: the manufacture of wood pulp
Until the mid-1970s most (67 percent) of the world'swood pulpthe principal raw material for paper man-ufacturewas produced by chemical means. Mechani-cal processes accounted for 25 percent and combina-tions of the two (semichemical processes) for theremainder. Each method has technical and environ-mental advantages and disadvantages. Mechanicalprocesses produce a high yield of low-strength fiber.They require relatively large inputs of energy butotherwise have little impact on the environment.Chemical processes have lower energy requirementsbut also lower yields. The fibers are strong and high inquality; they are, however, dark and are usuallybleached with chlorine, which then presents a disposalproblem. Chemical methods also generate large vol-umes of biological oxygen demand (BOD) and sulfuremissions unless appropriate environmental controlsare installed.
The largest paper market is that for newsprint,which used to be made from a combination of 15-25percent chemical pulp and 75-85 percent mechanicalpulp. The jump in energy prices in the mid-1970spushed up the cost of mechanical pulp, and the price ofchemical pulp also rose because of stricter environmen-
tal controls and high prices for wood and chemicals.Manufacturers then turned to pulp produced by ther-momechanical methods, which have yields and energyrequirements similar to those of mechanical processesbut produce a stronger fiber that does not have to bebleached with chlorine. The volume of BOD generatedis moderate. By using thermomechanical pulp in theirmix, newsprint manufacturers were able to reducetheir raw material costs by 5 percent or more.
This cost advantage, and the need for new invest-ment to meet a shortage of pulp capacity, combined tobring about a rapid increase in thermomechanical pulp-ing plants. In 1974 there were only four thermome-chanical mills in the world. By the end of 1977 therewere fifty, with another thirty under construction or onorder. Chemical processes still dominate the industry,but almost half of the pulping capacity added in OECDcountries during the 1980s consisted of thermome-chanical plants. Thermomechanical pulping offers clearadvantages to developing countrieslower capitalcosts, less technological complexity, and less environ-mental impact than with chemical processes, andstronger and better-quality fiber than that produced bymechanical plants.
129
Type of waste
Amount ofwaste, 1983
(millions of tons)
Potential wastereduction(percent)
Sulfurous (acids, gypsum) 2.2 80Emulsion 0.5 40-50Dyes and paint residues 0.3 60-70Solvents 0.3 60-70Galvanic sludges 0.2 60-70Salt slags 0.2 100Other wastes 1.2 LowTotal 4.9 50-60
Source: OECD 1991, p. 197.

This places enormous stresses on the honesty ofofficials. Enterprises will be uncertain about theenvironmental standards that they are expected tomeet and unhappy about perceived differences intreatment between themselves and their competi-tors. Indeed, uneven enforcement may turn for-eign investors into supporters of tough and effec-tive environmental standards. For example, fear ofpublic censure has made foreign investors inChile's copper mining industry more willing thanlocal enterprises to invest in sophisticated environ-mental controls.
Whatever instruments are chosen, they must becompatible with the administrative capacities ofthe regulatory agencies. Unenforced standards oruncollected fines are worse than useless: they un-dermine confidence in environmental controls andencourage enterprises to look for ways of avoidingpenalties rather than reducing pollution. Experi-ence shows that five conditions (all institutionallydemanding) are essential if policies are to have theintended effect: a local framework for negotiationbetween polluting and polluted parties; a clearand publicly available statement of the standardsset and agreements reached; a means of monitor-ing and spot-checking pollution; a means of pe-nalizing defaulters; and fair and equal applicationof the laws and regulations to all parties.
Scarce administrative resources should be di-rected first to the control of emissions from largeindustrial plants and minesthe most concen-trated sources of pollution. Policies will be effec-tive only with the (perhaps reluctant) cooperationof the enterprises responsible for these plants.Even the U.S. Environmental Protection Agency,which oversees the most sophisticated environ-mental monitoring system in the world, is forcedto rely on self-reported data on emissions for thevast majority of sources and pollutants. Develop-ing countries might thus benefit by concentratingtheir monitoring resources on spot checks to vali-date such self-reported data and on a baseline sys-tem designed to collect data in the most heavilypolluted areas. Enforcement actions must be seenas one element in a dialogue between regulatorsand enterprises, the objective of which is to im-prove the environmental performance of theplants under scrutiny.
Such a dialogue is particularly difficult whenboth parties are government agencies. Public en-terprises account for a substantial part of produc-tion in the most-polluting industries. They accountfor all Tanzania's fertilizer, cement, and iron andsteel production and for almost 83 percent of its
130
pulp and paper output. In India, Mexico, and Ven-ezuela all oil refining and distribution and a largeshare of basic metals production are in statehands; about 94 percent of mining production inIndia is in the public sector. In Turkey 95 percent ofmining output, about 60 percent of chemicals pro-duction, and 70 percent of basic metals productioncome from public enterprises. State-owned firmsmake up an important part of the mining, petro-leum, basic metals, and chemicals sectors in Ar-gentina and Brazil. These firms, like private sectormonopolies, are often also sheltered from importcompetition and consequently do not face thesame pressures to minimize costs as do competi-tive private firms. Incentive-based pollution con-trol policies are less likely than mandated controlsto be effective in inducing these firms to reduceemissions. The ineffectiveness of economic incen-tives in inducing public enterprises with soft bud-get constraints to reduce emissions is well illus-trated by the case of Poland, and the effectivenessof controls by the case of Cubatão in Brazil (Box6.4).
Community participation can help augment offi-cial enforcement. A recent survey of enterprises inBangladesh, for example, found that riverside vil-lages have proved surprisingly willing and able tonegotiate agreements with upstream polluters onmonetary compensation and first-stage effluenttreatment. With better information and legal sup-port, such local arrangements could provide cost-effective means of both supporting central regula-tors and holding them to account.
MARKET-BASED INCENTIVES. As environmentalpolicies evolve, there is a good case for makingmore use of market-based incentives, as discussedin Chapter 3. These policies reduce the costs ofcompliance, are often administratively simplerthan regulatory policies, and provide a financialincentive for innovation in developing pollutioncontrols and low-waste technologies and practices.They can also be refined (without great cost) inpractical and important ways. For example, undera system of nonlinear fees and fines recently intro-duced in Eastern Europe, the charge is increasedin Poland by ten timesif discharges exceed somespecified level.
Experience in industrial countries shows thatdischarges of industrial wastewater into publicsewers are quite sensitive to charges for the vol-ume of emissions and effluent concentration. Inthe Netherlands, for example, water pollutioncharges succeeded in reducing emissions once the
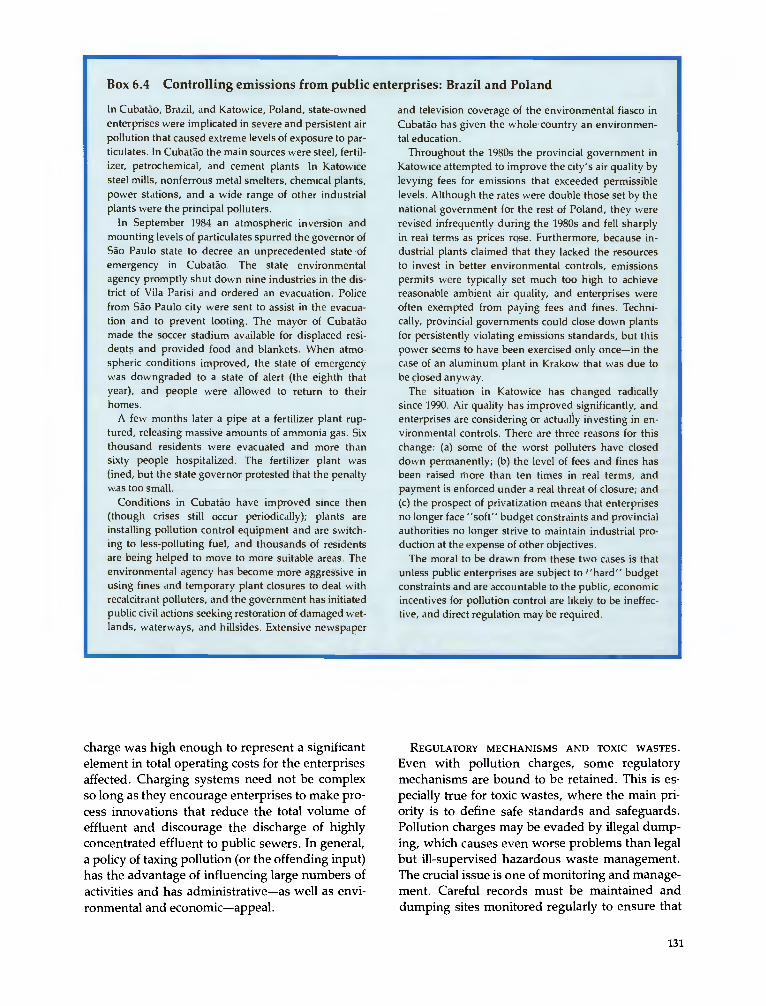
Box 6.4 Controlling emissions from public enterprises: Brazil and Poland
In Cubatão, Brazil, and Katowice, Poland, state-ownedenterprises were implicated in severe and persistent airpollution that caused extreme levels of exposure to par-ticulates. In Cubatão the main sources were steel, fertil-izer, petrochemical, and cement plants. In Katowicesteel mills, nonferrous metal smelters, chemical plants,power stations, and a wide range of other industrialplants were the principal polluters.
In September 1984 an atmospheric inversion andmounting levels of particulates spurred the governor ofSão Paulo state to decree an unprecedented state ofemergency in Cubatão. The state environmentalagency promptly shut down nine industries in the dis-trict of Vila Parisi and ordered an evacuation. Policefrom São Paulo city were sent to assist in the evacua-tion and to prevent looting. The mayor of Cubataomade the soccer stadium available for displaced resi-dents and provided food and blankets. When atmo-spheric conditions improved, the state of emergencywas downgraded to a state of alert (the eighth thatyear), and people were allowed to return to theirhomes.
A few months later a pipe at a fertilizer plant rup-tured, releasing massive amounts of ammonia gas. Sixthousand residents were evacuated and more thansixty people hospitalized. The fertilizer plant wasfined, but the state governor protested that the penaltywas too small.
Conditions in Cubatão have improved since then(though crises still occur periodically); plants areinstalling pollution control equipment and are switch-ing to less-polluting fuel, and thousands of residentsare being helped to move to more suitable areas. Theenvironmental agency has become more aggressive inusing fines and temporary plant closures to deal withrecalcitrant polluters, and the government has initiatedpublic civil actions seeking restoration of damaged wet-lands, waterways, and hillsides. Extensive newspaper
and television coverage of the environmental fiasco inCubatão has given the whole country an environmen-tal education.
Throughout the 1980s the provincial government inKatowice attempted to improve the city's air quality bylevying fees for emissions that exceeded permissiblelevels. Although the rates were double those set by thenational government for the rest of Poland, they wererevised infrequently during the 1980s and fell sharplyin real terms as prices rose. Furthermore, because in-dustrial plants claimed that they lacked the resourcesto invest in better environmental controls, emissionspermits were typically set much too high to achievereasonable ambient air quality, and enterprises wereoften exempted from paying fees and fines. Techni-cally, provincial governments could close down plantsfor persistently violating emissions standards, but thispower seems to have been exercised only oncein thecase of an aluminum plant in Krakow that was due tobe closed anyway.
The situation in Katowice has changed radicallysince 1990. Air quality has improved significantly, andenterprises are considering or actually investing in en-vironmental controls. There are three reasons for thischange: (a) some of the worst polluters have closeddown permanently; (b) the level of fees and fines hasbeen raised more than ten times in real terms, andpayment is enforced under a real threat of closure; and(c) the prospect of privatization means that enterprisesno longer face "soft" budget constraints and provincialauthorities no longer strive to maintain industrial pro-duction at the expense of other objectives.
The moral to be drawn from these two cases is thatunless public enterprises are subject to "hard" budgetconstraints and are accountable to the public, economicincentives for pollution control are likely to be ineffec-tive, and direct regulation may be required.
charge was high enough to represent a significantelement in total operating costs for the enterprisesaffected. Charging systems need not be complexso long as they encourage enterprises to make pro-cess innovations that reduce the total volume ofeffluent and discourage the discharge of highlyconcentrated effluent to public sewers. In general,a policy of taxing pollution (or the offending input)has the advantage of influencing large numbers ofactivities and has administrativeas well as envi-ronmental and economicappeal.
REGULATORY MECHANISMS AND TOXIC WASTES.
Even with pollution charges, some regulatorymechanisms are bound to be retained. This is es-pecially true for toxic wastes, where the main pri-ority is to define safe standards and safeguards.Pollution charges may be evaded by illegal dump-ing, which causes even worse problems than legalbut ill-supervised hazardous waste management.The crucial issue is one of monitoring and manage-ment. Careful records must be maintained anddumping sites monitored regularly to ensure that
131

Box 6.5 Regulating hazardous wastes: an innovative approach in Thailand
To control hazardous wastes from industrial sources,the Thailand Development Research Institute has pro-posed the creation of an autonomous Industrial Envi-ronment Fund. In line with the "polluter-pays" princi-ple, the fund would be financed from waste chargesthat would first be estimated for each industry andlater verified by environmental auditing. The chargewould be set at a level that covers the cost of transport,treatment, and disposal of hazardous wastes and pro-vides a margin for running the program. A charge of1,000 baht per ton on the 600,000 tons of industrialhazardous wastes projected for 1991 would raise 600million baht. This is only 0.3 percent of the GDP origi-nating in the 17,000 industrial plants in Thailand thatgenerate hazardous wastes, or 1.5 percent of netprofits.
The proceeds would be used to establish and operate
central treatment and disposal facilities for hazardouswastes collected from factories. Factories would de-posit with the fund their waste charges for the entireyear. Plants that attained lower waste per unit of out-put, as verified by accredited private environmentalauditing firms, would then be eligible for rebates. Theoperation of the treatment and disposal facilities wouldbe contracted out to private waste management firmsthrough competitive bidding.
The main message of this initiative is that pollutioncontrol costs can be minimized if the incentives areright. The more efficient an industry's production pro-cess, the less waste it generates and the less it pays forwaste treatment and disposal. The scheme would thusgive industry an incentive to reduce wastes and wouldencourage the development of business opportunitiesin hazardous waste management.
groundwater supplies are not being infiltrated bytoxic materials leaching from the sites. This impliesan administrative cost that may sometimes be be-yond the capacity of environmental control agen-cies. In such cases an alternative is to combine reg-ulation with market-based incentives. The lattercan draw on indirect policies such as taxes on pol-luting inputs, product charges, deposit-refundschemes, and performance bonds. The role of theregulatory authority is to compile informationabout sources of emissions for the pollutants beingcontrolled and to design the mix of policies thatcan reduce emissions from these sources cost-ef-fectively. A scheme that applies to hazardouswastes some of the characteristics of a deposit-re-fund arrangement has been proposed for Thailand(Box 6.5).
Industrial zoning is another example of regula-tion that cannot easily be replaced by pricingmechanisms. The key argument for zoning is thatthere are economies in dealing with environmentalproblems when plants are concentrated in oneplace. Furthermore, it is difficult to ensure thatspatial differences in pollution charges are suffi-cient to achieve an efficient concentration or dis-persion of plants. Although zoning is a blunt in-strument, it may be the best way of handlingspatial differences in the environmental damagecaused by particular forms of pollution.
ADVISORY SERVICES. One effective way to influ-ence small firms is through extension and advisory
132
services for industries. For example, the PollutionControl Cell of the National Productivity Councilin India's Ministry of Labor works on solutionsthat both reduce pollution and improve profits.Effective ways have been found to reduce emis-sions and water use in electroplating, food pro-cessing, bleaching and dyeing, mini-cementplants, pulp and paper, drugs, and tanneries. Co-operative approaches can sometimes be helpful.For example, in Hyderabad a group of forty smallcompanies set up a common wastewater treatmentplant that they operate jointly on a nonprofit basis.In Gujarat 400 small companies did the same.Such arrangements are cheaper than individualtreatment facilities at each plant, and it is easier tooperate, maintain, and monitor one large facilitythan numerous scattered small ones.
Conclusions
In considering how to reconcile the expansion ofenergy and industrial activities in developingcountries with the goals of reducing pollution toacceptably low levels, this chapter has made fourpoints.
Options are available for reducing energy andindustrial pollution per unit of output by factors often, hundreds, and sometimes more, dependingon the case.
The investment and operating costs are not solarge as to compromise economic growth in devel-oping countries. For priority areas such as particu-

lates, lead, and industrial effluents and wastes,investment costs are low. Indeed, pollution abate-ment has often been accompanied by reductions incosts. Pollution control costs can be further re-duced by setting standards appropriately and bychoosing the instruments of policy wisely. Offset-ting these costs are the many benefits of pollutionabatement, including a healthier population and abetter quality of life in cities, which will help toimprove economic prospects.
Response times can be long, however, evenwhen policies are agreed on and implemented.The rapid rate of investment may, paradoxically,reduce response times (and costs) in developingcountries, since less-polluting practices can morereadily be incorporated into new investment.
Greater efficiency, whether in the productionand use of energy or in the production and use ofmanufactured goods, can make significant contri-butions to pollution abatement.
133