
Energy and Exergy Analysis of a Simple Gas Turbine Cycle ...
11
Mechanical Engineering Research; Vol. 8 No. 1; 2018 ISSN 1927-0607 E-ISSN 1927-0615 Published by Canadian Center of Science and Education 30 Energy and Exergy Analysis of a Simple Gas Turbine Cycle with Wet Compression E. H. Betelmal 1 & S. A. Farhat 1 1 Department of Mechanical Engineering, Tripoli University, Faculty of engineering, Tripoli, Libya Correspondence: E. H. Betelmal, Department of Mechanical Engineering, Tripoli University, Faculty of engineering, Tripoli, Libya. E-mail: [email protected] Received: February 28, 2018 Accepted: March 24, 2018 Online Published: April 4, 2018 doi:10.5539/mer.v8n1p30 URL: https://doi.org/10.5539/mer.v8n1p30 Abstract A thermodynamic model of the wet compressor in a simple gas turbine cycle was investigated in this paper. A suitable quantity of water was injected into the compressor-stages where it evaporated. Subsequently, the steam and air were heated in the combustion chamber and expanded in the turbine. The wet compressor (WC) has become a reliable way to reduce gas emissions and increase gas turbine efficiency. In this study, the operational data of the simple gas turbine and the maximum amount of water that can be injected into the compressor were assessed, as well as a comparison between the dry compression, the wet compression and the isentropic compression. The performance variation due to water spray in the compressor and the effect of varying ambient temperature on the performance of gas turbine (thermal efficiency, power) was investigated, and the results are compared to the results of the same cycle with a dry compressor. The analytical formula of exergy destruction and results show that exergy destruction increases with water injection. The programming of the performance model for the gas turbine was developed utilizing the software IPSEpro. The results of the gas turbine with a wet compressor demonstrates a 12% reduction in the compressor exit temperature up to isentropic temperature. The compressor work decreased by 11% when using a wet compressor, this lead to an improvement in power output and efficiency However, the wet compressor increases the specific fuel consumption and heat rate of the gas turbine. There are limitations in the amount of steam that can be injected, 0.4 kg/s of water was the optimum amount injected into the compressor. Keywords: gas turbine, exergy analysis, exergy destruction, IPSEpro., wet compressor 1. Introduction The world's wealthiest countries assumed obligated commitments to reduce greenhouse gas emissions under the Kyoto Protocol. The agreement requires these countries to consider ways to minimize adverse effects on developing countries of these actions, transmitted through trade (Babiker, Reilly, & Jacoby, 2000). In recent years, various methods have been tested for improving the gas turbines performance. A thermodynamic model of wet compression in the simple gas turbine cycle is established in this paper. The performance of gas turbine cycles can be improved by injecting a suitable quantity of water into the compressor (Agrawal, Maharana, & Badarinarayan, 2012). The real beneficial energy loss cannot be determined by the first law of thermodynamics because the real plant inefficiencies are not related to energy loss but to exergy destruction. Exergy analysis and the exergy destruction of each component of the gas turbine have been investigated as it can be used as a common measure of research quality along with quantity. Exergy decreases in this component due to the increase in entropy related to the evaporation of water. The benefits of water injection mostly rely on the increased heat capacity of the air-vapor mixture and the reduced power required by the compressor (Carrero, De Paepe, Bram, & Contino, 2017). The combustion properties of different gaseous hydrocarbon mixtures at wet conditions did not vary significantly from each other except for the laminar burning velocity (Agrawal, Maharana, & Badarinarayan, 2012). Wet Compression is perfectly suited for upgrading the peak load machine. A power increase can help take full advantage of high peak load electricity prices and therefore offers attractive financial payback options (Energy, n.d.). Wet Compression is designed to increase the power output of the gas turbine by reducing the work and an increasing mass flow throughout the turbine. These benefits can lead to the ability to produce more power in peaking and baseload operation. Wet compressor injection flow rates are typically expressed as a percentage of air intake usually from 0.5 to 2 percent. Rarely, this number can go higher.
Transcript of Energy and Exergy Analysis of a Simple Gas Turbine Cycle ...

Mechanical Engineering Research; Vol. 8 No. 1; 2018 ISSN 1927-0607 E-ISSN 1927-0615
Published by Canadian Center of Science and Education
30
Energy and Exergy Analysis of a Simple Gas Turbine Cycle with Wet Compression
E. H. Betelmal1 & S. A. Farhat1 1 Department of Mechanical Engineering, Tripoli University, Faculty of engineering, Tripoli, Libya Correspondence: E. H. Betelmal, Department of Mechanical Engineering, Tripoli University, Faculty of engineering, Tripoli, Libya. E-mail: [email protected] Received: February 28, 2018 Accepted: March 24, 2018 Online Published: April 4, 2018 doi:10.5539/mer.v8n1p30 URL: https://doi.org/10.5539/mer.v8n1p30 Abstract A thermodynamic model of the wet compressor in a simple gas turbine cycle was investigated in this paper. A suitable quantity of water was injected into the compressor-stages where it evaporated. Subsequently, the steam and air were heated in the combustion chamber and expanded in the turbine. The wet compressor (WC) has become a reliable way to reduce gas emissions and increase gas turbine efficiency. In this study, the operational data of the simple gas turbine and the maximum amount of water that can be injected into the compressor were assessed, as well as a comparison between the dry compression, the wet compression and the isentropic compression. The performance variation due to water spray in the compressor and the effect of varying ambient temperature on the performance of gas turbine (thermal efficiency, power) was investigated, and the results are compared to the results of the same cycle with a dry compressor. The analytical formula of exergy destruction and results show that exergy destruction increases with water injection. The programming of the performance model for the gas turbine was developed utilizing the software IPSEpro. The results of the gas turbine with a wet compressor demonstrates a 12% reduction in the compressor exit temperature up to isentropic temperature. The compressor work decreased by 11% when using a wet compressor, this lead to an improvement in power output and efficiency However, the wet compressor increases the specific fuel consumption and heat rate of the gas turbine. There are limitations in the amount of steam that can be injected, 0.4 kg/s of water was the optimum amount injected into the compressor. Keywords: gas turbine, exergy analysis, exergy destruction, IPSEpro., wet compressor 1. Introduction The world's wealthiest countries assumed obligated commitments to reduce greenhouse gas emissions under the Kyoto Protocol. The agreement requires these countries to consider ways to minimize adverse effects on developing countries of these actions, transmitted through trade (Babiker, Reilly, & Jacoby, 2000). In recent years, various methods have been tested for improving the gas turbines performance. A thermodynamic model of wet compression in the simple gas turbine cycle is established in this paper. The performance of gas turbine cycles can be improved by injecting a suitable quantity of water into the compressor (Agrawal, Maharana, & Badarinarayan, 2012). The real beneficial energy loss cannot be determined by the first law of thermodynamics because the real plant inefficiencies are not related to energy loss but to exergy destruction. Exergy analysis and the exergy destruction of each component of the gas turbine have been investigated as it can be used as a common measure of research quality along with quantity. Exergy decreases in this component due to the increase in entropy related to the evaporation of water. The benefits of water injection mostly rely on the increased heat capacity of the air-vapor mixture and the reduced power required by the compressor (Carrero, De Paepe, Bram, & Contino, 2017). The combustion properties of different gaseous hydrocarbon mixtures at wet conditions did not vary significantly from each other except for the laminar burning velocity (Agrawal, Maharana, & Badarinarayan, 2012). Wet Compression is perfectly suited for upgrading the peak load machine. A power increase can help take full advantage of high peak load electricity prices and therefore offers attractive financial payback options (Energy, n.d.). Wet Compression is designed to increase the power output of the gas turbine by reducing the work and an increasing mass flow throughout the turbine. These benefits can lead to the ability to produce more power in peaking and baseload operation. Wet compressor injection flow rates are typically expressed as a percentage of air intake usually from 0.5 to 2 percent. Rarely, this number can go higher.
mer.ccsenet.org Mechanical Engineering Research Vol. 8, No. 1; 2018
31
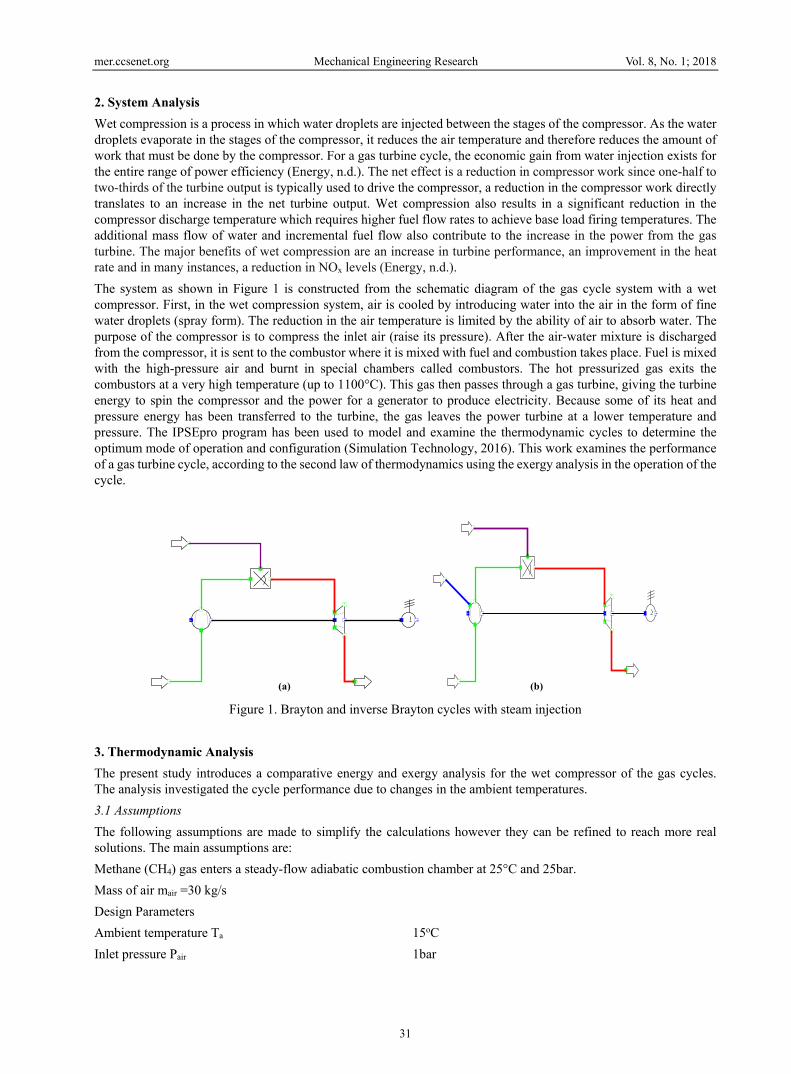
2. System Analysis Wet compression is a process in which water droplets are injected between the stages of the compressor. As the water droplets evaporate in the stages of the compressor, it reduces the air temperature and therefore reduces the amount of work that must be done by the compressor. For a gas turbine cycle, the economic gain from water injection exists for the entire range of power efficiency (Energy, n.d.). The net effect is a reduction in compressor work since one-half to two-thirds of the turbine output is typically used to drive the compressor, a reduction in the compressor work directly translates to an increase in the net turbine output. Wet compression also results in a significant reduction in the compressor discharge temperature which requires higher fuel flow rates to achieve base load firing temperatures. The additional mass flow of water and incremental fuel flow also contribute to the increase in the power from the gas turbine. The major benefits of wet compression are an increase in turbine performance, an improvement in the heat rate and in many instances, a reduction in NOx levels (Energy, n.d.). The system as shown in Figure 1 is constructed from the schematic diagram of the gas cycle system with a wet compressor. First, in the wet compression system, air is cooled by introducing water into the air in the form of fine water droplets (spray form). The reduction in the air temperature is limited by the ability of air to absorb water. The purpose of the compressor is to compress the inlet air (raise its pressure). After the air-water mixture is discharged from the compressor, it is sent to the combustor where it is mixed with fuel and combustion takes place. Fuel is mixed with the high-pressure air and burnt in special chambers called combustors. The hot pressurized gas exits the combustors at a very high temperature (up to 1100°C). This gas then passes through a gas turbine, giving the turbine energy to spin the compressor and the power for a generator to produce electricity. Because some of its heat and pressure energy has been transferred to the turbine, the gas leaves the power turbine at a lower temperature and pressure. The IPSEpro program has been used to model and examine the thermodynamic cycles to determine the optimum mode of operation and configuration (Simulation Technology, 2016). This work examines the performance of a gas turbine cycle, according to the second law of thermodynamics using the exergy analysis in the operation of the cycle.
Figure 1. Brayton and inverse Brayton cycles with steam injection
3. Thermodynamic Analysis The present study introduces a comparative energy and exergy analysis for the wet compressor of the gas cycles. The analysis investigated the cycle performance due to changes in the ambient temperatures. 3.1 Assumptions The following assumptions are made to simplify the calculations however they can be refined to reach more real solutions. The main assumptions are: Methane (CH4) gas enters a steady-flow adiabatic combustion chamber at 25°C and 25bar. Mass of air mair =30 kg/s Design Parameters Ambient temperature Ta 15oC Inlet pressure Pair 1bar
(a) (b)

mer.ccsenet.org Mechanical Engineering Research Vol. 8, No. 1; 2018
32
The input data for compressor Compressor isentropic efficiency ηs 0.87 Compressor mechanical efficiency ηm 0.98 Pressure ratio P2/P1 18 Pressure drop in the combustion chamber (∆P) 0.1 bar The input data for turbine: Turbine mechanical efficiency ηm 0.99 Turbine isentropic efficiency ηs 0.9 Turbine inlet exhaust gas temperature Tmax 1100 ºC The characteristics of heat exchanger are: Pressure drop of the hot temperature side 0.1 bar Pressure drop of the low temperature side 0.1 bar The temperature increase of the air during the compression is:
sactual P
PT
dT ηγ
γ
/1)(
1
1
2
1
21
−
=
−
− (1)
T1: Compressor inlet Temperature [K] T2: Compressor outlet Temperature [K] dT1-2: Temperature different between 1 and 2 P1: Compressor inlet pressure P2: Compressor outlet pressure
The pressure ratio 23 /PP can be obtained directly from the combustion chamber pressure loss
= 1 − ∆ (2)
The overall efficiency of the combined cycle ( ) is calculated using the following equation.
= ∗ (3)
Where: PG is the power of the gas turbine 4. Exergy Destruction in the Components of Combined Cycle The complex thermodynamic analysis of combined cycle has been based on the second law of thermodynamics because the conventional first law analysis of any thermodynamic system has the capability to determine the energy distribution across the system boundaries but does not explain the means of energy degradation that cause decreases in the power output of the system. The exergy analyses for the gas turbine components have been conducted to determine the energy loss caused by irreversible processes. Exergy analysis usually predicts the thermodynamic performance of an energy system and the efficiency of the system components by quantifying the entropy generation of the components. This analysis provides a tool for the optimal design and operation of complex thermal systems. The exergy and irreversibility equations for each component are written as follows [7], Compressor: The exergy and irreversibility in compressor is given by ∆ = ∗ ℎ ) + ∗ ℎ ) − + ) ∗ ℎ − 298 ∗ ∗ ) + ∗ ) − + ) ∗ (4)
= ∗ [ + ) ∗ − [ ∗ ) + ∗ )]] (5)

mer.ccsenet.org Mechanical Engineering Research Vol. 8, No. 1; 2018
33
Combustion Chamber: As an approximation, the virtual power is used to calculate the exergy of the combustor component. The exergy balance of this component and exergy loss due to irreversibility in the combustion chamber is given by:
. = + (6) ⋅ = (7)
Where
= + − (8)
And = average (T3, T2) 4.1 Turbine The exergy loss due to irreversibility in gas turbine is given by:
= ℎ − ℎ ) − − ) (9) = − ) (10)
Where
− ) = − (11)
And
= ) (12)
5. Discussion of the Results Based upon the methodology developed and the thermodynamic equations shown, the effect of ambient condition on the performance and on the destruction of exergy due to irreversibility in various components of the gas turbine, with and without water injection into the compressor is displayed graphically. The following figures show the change the performance of the gas turbine with changing ambient temperature and compression ratio. Exergy destruction is obtained from the exergy analysis. Figure 2 shows the compressor discharge temperature increasing because of increasing ambient temperature. The minimum compressor discharge temperature may reach an isentropic temperature, which can be obtained by using a wet compressor (0.4 kg), the result shows the compressor exit temperature is reduced by 12 % from the compressor without water injection.
Figure 2. The compressor discharge temperature as a function of ambient temperature in three cases
0
100
200
300
400
500
600
15 20 25 30 35 40 45
TEM
PERA
TURE
(0 C)
AMBIENT TEPERATURE (0C)
Compressor discharge temperature
Wet compressor Isentropic compressor Dryl compressor

mer.ccsenet.org Mechanical Engineering Research Vol. 8, No. 1; 2018
34
The variation of the compressor exit temperature with the water mass injected at a different compression ratio is shown in figure 3.
Figure 3. The compressor exit temperature as a function of water mass flow and a pressure ratio
The following figure shows an increase in the compressor work as the ambient temperature is increased. These figures show a significant decrease in the compressor with the use of water injection and this leading to improvement in cycle power output.
Figure 4. Compressor work as a function of ambient temperature in three cases
0
100
200
300
400
500
600
0.2 0.4 0.6 0.8 1 1.2
TEM
PERA
TURE
(0 C)
WATER MASS FLOW (Kg) at Ta= 45 0C
Compressor Discharge Temperature
P2/P1 =10 P2/P1 =12 P2/P1 =14 P2/P1 =16 P2/P1 =18 P2/P1 =20
0
2000
4000
6000
8000
10000
12000
14000
16000
15 20 25 30 35 40 45
COM
PRES
SOR
WOR
K (K
W)
AMBIENT TEMPERATURE (0C)
Compressor Work
Wet compressor work mw = 0.4 Isentropic Work Dry Work
mer.ccsenet.org Mechanical Engineering Research Vol. 8, No. 1; 2018
35
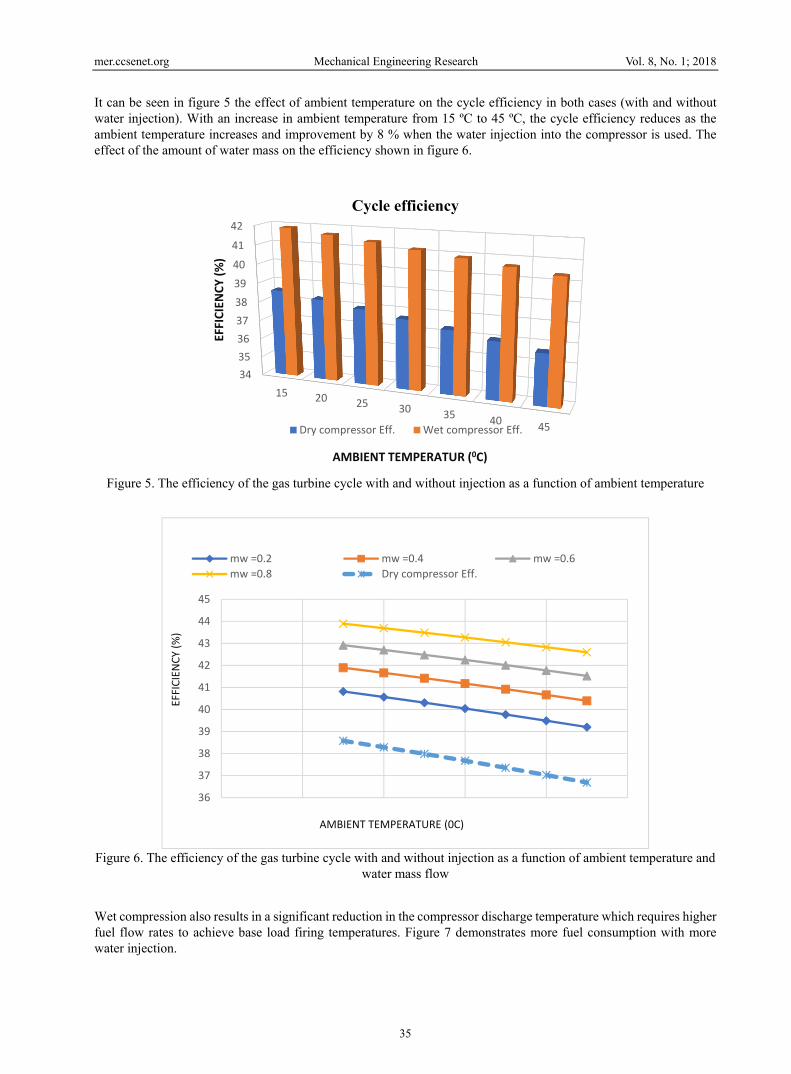
It can be seen in figure 5 the effect of ambient temperature on the cycle efficiency in both cases (with and without water injection). With an increase in ambient temperature from 15 ºC to 45 ºC, the cycle efficiency reduces as the ambient temperature increases and improvement by 8 % when the water injection into the compressor is used. The effect of the amount of water mass on the efficiency shown in figure 6.
Figure 5. The efficiency of the gas turbine cycle with and without injection as a function of ambient temperature
Figure 6. The efficiency of the gas turbine cycle with and without injection as a function of ambient temperature and
water mass flow Wet compression also results in a significant reduction in the compressor discharge temperature which requires higher fuel flow rates to achieve base load firing temperatures. Figure 7 demonstrates more fuel consumption with more water injection.
343536373839404142
15 20 25 30 35 40 45
EFFI
CIEN
CY (%
)
AMBIENT TEMPERATUR (0C)
Cycle efficiency
Dry compressor Eff. Wet compressor Eff.
36
37
38
39
40
41
42
43
44
45
EFFI
CIEN
CY (%
)
AMBIENT TEMPERATURE (0C)
mw =0.2 mw =0.4 mw =0.6mw =0.8 Dry compressor Eff.

mer.ccsenet.org Mechanical Engineering Research Vol. 8, No. 1; 2018
36
Figure 7. The fuel consumption as a function of ambient temperature and water mass flow
Figures 8 shows the improvement in the power output is up to 14 % in the gas turbine
Figure 8. Power output with ambient temperature (with and without injection)
The variation of the power output with ambient temperature and compression ratio is shown in figure 9. At a high-pressure ratio of 20, the power output is lower and as the pressure ratio decreases, the power increases. There is a similar behavior in the power output that can be seen in figure 10, as the water mass used for injection increases, the power generation increases.
0.46
0.48
0.5
0.52
0.54
0.56
0.58
0.6
0 10 20 30 40 50 60
FUEL
MAA
S FL
OW (K
g/S)
AMBIENT TEMPERATURE (0C)
Fuel mass flow
mw =0.2 mw =0.4 mw =0.6 mw =0.8
0
2000
4000
6000
8000
10000
12000
14000
0 10 20 30 40 50 60
POW
ER O
UTPU
T (K
W)
AMBIENT TEMPERATURE (0C)
Power output
Wet compressor power output Dry power output

mer.ccsenet.org Mechanical Engineering Research Vol. 8, No. 1; 2018
37
Figure 9. The power output of the cycle with ambient temperature at different pressure ratio
Figure 10. The power output of the cycle with ambient temperature at different water mass flow
P…
P…
P…
8000
9000
10000
11000
12000
15 20 25 30 35 40 45
POW
ER O
UTPU
T (K
W)
AMBIENT TEMPERATURE (0C)
Cycle Power Output
P2/P1=12 P2/P1 =14 P2/P1 =16 P2/P1 =18 P2/P1 =20
mw = 0.2
mw = 0.6
mw = 1
0
2000
4000
6000
8000
10000
12000
14000
15 20 25 30 35 40 45
WAT
ER M
ASS F
LOWPO
WER
OUT
PUT
(KW
)
AMBIENT TEMPERATURE (0C)
Cycle Power Output
mw = 0.2 mw = 0.4 mw = 0.6 mw = 0.8 mw = 1

mer.ccsenet.org Mechanical Engineering Research Vol. 8, No. 1; 2018
38
Figure 11. Exergy destruction of the gas turbine components with ambient temperature
The exergy of the compressor is affected by the quantity of water that is injected into the compressor. Figure 12 shows the exergy loss in the compressor with variation in the water mass flow and ambient temperature. There is a clear effect of the water mass flow on the exergy loss in the compressor. When a high amount of water is injected (1kg/s), the exergy loss in the compressor will be higher and as the water mass injection reduces to 0.2 kg/s the exergy loss will be minimized.
Figure 12. Exergy destruction of the compressor with ambient temperature at different water mass flow
Figures 13 shows the exergy loss in the compressor with variation in the compressor pressure ratio and ambient temperature. There is a clear effect of the compressor pressure ratio of exergy loss in the compressor. Exergy destruction in the compressor is larger for a higher-pressure ratio (20) and higher amounts of water injection and as the compression ratio decreases (10), the exergy loss is minimized. At any condition as the compressor pressure ratio increases, the exergy loss increases
0100020003000400050006000700080009000
10000
EXER
GY D
ESTR
UCTI
ON (K
W)
AMBIENT TEMPERATURE (0C)
Exergy destruction15 20 25 30 35 40 45
0
500
1000
1500
2000
15 20 25 30 35 40 45
EXER
GY D
ESTR
UCTI
ON (K
W)
AMBIENT TEMPERATURE (0C)
Compressor Exergy Destruction
mw= 0.2 mw= 0.4 mw= 0.6 mw= 0.8 mw= 1

mer.ccsenet.org Mechanical Engineering Research Vol. 8, No. 1; 2018
39
Figure 13. Exergy destruction of the compressor with ambient temperature at different pressure ratio
On the other hand, to get optimum performance while not increasing the exergy destruction significantly, the water mass injected must be the right amount.
Figure 14. Exergy destruction of the compressor with ambient temperature
6. Conclusion The simulation program IPSEpro has been applied successfully to the gas turbine cycle using conventional thermodynamic analysis involving an application of the first law of thermodynamics, also known as energy analysis. Exergy analysis is a thermodynamic analysis technique based on the second law of thermodynamics. The production of electricity and efficiency are highest at cooler times of the day and lowest at the hottest time of the day when they are needed most. Wet compression is a process in which water droplets are injected in between the stages of the compressorof a gas turbine, increasing the flow rate through the turbine. This causes an increase in the power output of a gas turbine and an increase in the electrical efficiency, thus that the power output of the gas turbine with steam injection will be higher than the common gas turbine. A wet compressor of the gas turbine can reach an electrical efficiency of up to 42, this improvement in the efficiency has been accomplished without regeneration. Based on the
0
500
1000
1500
2000
0.2 0.4 0.6 0.8 1 1.2
EXER
GY D
ESTR
UCTI
ON (K
W)
WATER MASS FLOW (Kg/S)
Compressor Exergy Destruction
P2/P1 =10 P2/P1 =12 P2/P1 =14 P2/P1 =16 P2/P1 =18 P2/P1 =20
0
200
400
600
800
1000
1200
15 20 25 30 35 40 45
EXER
GY D
ESTR
UCTI
ON (K
W)
AMBIENT TEMPERATURE (0C)
Exergy Destruction at P2/P1 =18
dry compressor mw= 0.4 mw= 0.2

mer.ccsenet.org Mechanical Engineering Research Vol. 8, No. 1; 2018
40
above analysis, there are limitations on the amount of water that can be injected into the compressor, the following conclusions are made at different ambient conditions (pressure ratio and ambient temperature), • Water cools the compressor and the cycle performance is dramatically improved. • The exergy analysis gives a real picture on the losses which occur in the different plant components. • More exergy losses occur in the compressor due to irreversibility and this must be reduced with advanced
modern technology. • There are clear effects in exergy losses with the changing in the pressure ratio. At higher pressure ratio, the
exergy losses in the compressor are higher. • The optimum turbine inlet temperature and pressure ratio should be the next focus of study for minimizing the
total exergy losses in all the components. Reference Agrawal, S., Maharana, S. K., & Badarinarayan, K. S. (2012). Thermodynamic Performance Analysis of a
Combined Cycle System with Wet Compression. EST-M, 1(2). Babiker, M., Reilly, J. M., & Jacoby, H. D. (2000). The Kyoto Protocol and developing countries. Energy Policy,
28(8), 525-536. https://doi.org/10.1016/S0301-4215(00)00033-1 Cadavid, Y., Amell, A., Alzate, J., Bermejo, G., & Ebratt, G. A. (2018). Analysis of Water–Fuel Ratio Variation in a
Gas Turbine With a Wet-Compressor System by Change in Fuel Composition. Journal of Engineering for Gas Turbines and Power, 140(5), 052602. https://doi.org/10.1115/1.4038137
Carrero, M. M., De Paepe, W., Bram, S., & Contino, F. (2017). Thermodynamic analysis of water injection in a micro gas turbine: Sankey and Grassmann diagrams. Energy Procedia, 105, 1414-1419. https://doi.org/10.1016/j.egypro.2017.03.527
Energy. (n.d.). In Siemens, Ingenuity for life. Retrieved from www.siemens.com/Energy Jolly, S. (2002). Wet Compression—A Powerful Means of Enhancing Combustion Turbine Capacity. Power-Gen
International, 1-12. Kler, A. M., Zakharov, Y. B., & Potanina, Y. M. (2017). Estimate for interstage water injection in air compressor
incorporated into gas-turbine cycles and combined power plants cycles. Thermophysics and Aeromechanics, 24(3), 483-491.
Simulation Technology. (2016). IPSEpro Process Simulator (Manual Version 7). Sonntag, R. E., & Van Wylen, G. J. (1971). Introduction to thermodynamics: classical and statistical (No. 621.01
S6). Copyrights Copyright for this article is retained by the author(s), with first publication rights granted to the journal. This is an open-access article distributed under the terms and conditions of the Creative Commons Attribution license (http://creativecommons.org/licenses/by/4.0/).


![Exergy analysis of the Szewalski cycle with a waste …...eters of the Szewalski binary vapour cycle was performed by Kowalczyk et al.[3], who presented the energy and exergy analysis](https://static.fdocuments.in/doc/165x107/5f36873b62461f4a731f3996/exergy-analysis-of-the-szewalski-cycle-with-a-waste-eters-of-the-szewalski-binary.jpg)

