
Energy and environmental optimization of some - DiVA Portal
63
Energy and environmental optimization of some aspects of EAF practice with novel process solutions Andrei Chychko Doctoral Thesis Division of Materials Process Science Department of Materials Science and Engineering Royal Institute of Technology SE-10044 Stockholm, Sweden Akademisk avhandling som med tillststånd av Kungliga Tekniska Högskolan i Stockholm, framlägges för offentlig gransking för avläggande av teknologie doktorsexamen, Fredag den 8 Oktober 2010, kl.10.00 i F3 Lindstedtsvägen 26, KTH, Stockholm. ISRN KTH/MSE--10/41--SE+THMETU/AVH ISBN 978-91-7415-721-5
Transcript of Energy and environmental optimization of some - DiVA Portal

Energy and environmental optimization of some
aspects of EAF practice with novel process solutions
Andrei Chychko
Doctoral Thesis
Division of Materials Process Science
Department of Materials Science and Engineering
Royal Institute of Technology
SE-10044 Stockholm, Sweden
Akademisk avhandling som med tillststånd av Kungliga Tekniska Högskolan i Stockholm, framlägges för offentlig gransking för avläggande av teknologie
doktorsexamen, Fredag den 8 Oktober 2010, kl.10.00 i F3 Lindstedtsvägen 26, KTH, Stockholm.
ISRN KTH/MSE--10/41--SE+THMETU/AVH
ISBN 978-91-7415-721-5

Andrei Chychko Energy and environmental optimization of some aspects of EAF practice with novel process solutions
Division of Materials Process Science Department of Materials Science and Engineering School of Industrial Engineering and Management Royal Institute of Technology SE-10044 Stockholm Sweden ISRN KTH/MSE--10/41--SE+THMETU/AVH ISBN 978-91-7415-721-5 ©The author All rights reserved

I
Abstract
The objective of the present thesis is to optimize the electric arc furnace (EAF) practice from
an environmental view point. Two aspects that meet the requirements of the secondary
steelmaking industries today, viz. Mo alloying with maximum retainment of the alloying
element in molten steel and optimization of foaming by carbonate addition with a view to
optimize the energy need of the process. Both these aspects would also have a significant
impact on the process economy.
Iron molybdate (Fe2MoO4) has been synthesized from commercial grade materials and
proposed as a new potential precursor for steel alloying with Mo. The thermal stabilities of
different molybdates, viz. Fe2MoO4, CaMoO4 and MgMoO4, were studied using
thermogravimetry analysis (TGA). It was found that Fe2MoO4 is the most stable one and
doesn’t evaporate in Ar atmosphere when heating up to 1573 K.
The synthesis of Fe2MoO4 requires high temperature (1373 K) and long holding time (up to
16 hours). In a view of this, the possibilities for in-situ formation of Fe2MoO4 and CaMoO4
from their precursor mixtures were studied with the aid of high-temperature X-ray
diffraction (XRD) and TGA analysis. Laboratory and industrial trials on steel alloying with
Mo were conducted using precursor mixtures as sources of Mo. It was found that the
mixture, which contains FeOx, MoO3 and C (Fe2MoO4 precursor), can provide the Mo yield
up to 98 % at both the laboratory as well as industrial trials. The Mo yields even in the case
of C+MoO3 and C+MoO3+CaO mixtures were around 93 % in these trials. The higher yield
for the MoO3+C+FeOx mixture was attributed to the stabilization of Mo in the precursor
(marked by the decrease in the Gibbs energy of Mo) and the readiness to dissolve in the steel
bath.
The heat effect of the slag foaming with carbonates addition was studied at 1623 and 1673 K
with the aid of thermal analysis technique with a new crucible design. Experiments were
conducted by adding limestone and dolomite pieces of defined shapes (together with iron
sinkers) in molten slag and monitoring the temperature changes accompanying the
decomposition of carbonates. It was found that the decomposition energies for dolomite and
limestone for the studied slag composition are in the range 56-79 % of theoretical values,

II
which is linked to the energy saving effect of slag foaming. No influence of sample shape on
decomposition energy was found both for limestone and dolomite.
The kinetics of slag foaming by limestone particles was studied at 1773 K with the aid of X-
ray imaging system. A model was proposed to describe the decrease in foam height with
time on the basis of CaO shell formation during decomposition reaction.
The energy impact of limestone and raw dolomite addition was examined in a 100-ton EAF.
It was found that, in the case of addition of carbonates after the scrap is completely molten;
the endothermic heat effects for limestone and dolomite (2255 and 2264 kJ/kg respectively)
were only 70 % from theoretical values. This is indicative of the resistance to heat transfer
due to increased foaming.
Keywords: Fe2MoO4 synthesis, CaMoO4 formation, steel alloying, Mo yield, industrial test,
molybdates stabilities, MoO3 evaporation, slag foaming, limestone decomposition, EAF,
energy saving, thermal analysis, raw dolomite; high temperature XRD.
III
Acknowledgements
First, I am thankful to my supervisor Dr. Lidong Teng for his guidance, help with
calculations, fruitful discussions and suggestions through all the stages of my investigation.
I would like to express my sincere gratitude to my co-supervisor, Professor Seshadri
Seetharaman. His continuous help and support guided me through all my work in KTH. I
appreciate his optimistic encouragement, humor, clear thinking and openness, which helped
me a lot.
I would like to thank Doctor Mselly Nzotta for his valuable help with planning and
organizing the industrial scale trials, as well as with the analysis of the steel samples at
Uddeholms AB, Hagfors, Sweden.
I am thankful to Professor A.K. Lahiri from Indian Institute of Science, Bangalore. Your
constructive criticism and valuable suggestions are gratefully appreciated.
My gratitude goes to Doctor Yurij Plevachuk from Ivan Franko National University (Lviv,
Ukraine) for his help with high-temperature XRD investigations.
Also, I would like to thank Associate professor Taishi Matsushita (KTH) for his help with
the X-Ray imaging system, and Professor Nurni N. Viswanathan (Indian Institute of
Technology, Bombay) for his suggestions about data interpretations from slag foaming
experiment.
I wish to thank Mr. Peter Kling for his help and excellent technical support during my
experimental work at KTH.
I would like to thank all of my friends for their kind help and unforgettable time during my
work in KTH.
I am thankful to Swedish Institute (SI) for giving me the opportunity for my staying in
Sweden.
Financial support from the Swedish Strategic Foundation for Environmental Research
(MISTRA) via Swedish Steel Producers Association (Jernkontoret), and young investigator

IV
award from Davis University for attending the 13th International IUPAC Conference are
gratefully acknowledged.
Andrei Chychko
Stockholm, August 2010
V
Supplements
This thesis is based on the following papers:
Supplement 1: MoO3 evaporation studies from binary systems towards choice of Mo
precursors in EAF
A. Chychko, L. Teng, and S. Seetharaman
Steel Research international, In press, 2010
Supplement 2: Synthesis and characterization of Fe2MoO4 as a precursor material for
Mo alloying in steel
A. Chychko, L. Teng, M. Nzotta and S. Seetharaman
Steel Research international, Sent for publication in July 2010
Supplement 3: Fe2MoO4 as a precursor material for Mo alloying in steel (Part II): Up-
scaling test
A. Chychko, L. Teng, M. Nzotta and S. Seetharaman
Steel Research international, Sent for publication in July 2010
Supplement 4: Foaming in Electric Arc Furnace Part I: Laboratory Studies of Enthalpy
changes of Carbonate Additions to Slag Melts
A. Chychko and S. Seetharaman
Metallurgical and Materials Transactions B, Sent for publication in
March 2010
Supplement 5: Foaming in Electric Arc Furnace Part II: Foaming visualization and
Comparison with Plant trials
A. Chychko, L. Teng, and S. Seetharaman
Metallurgical and Materials Transactions B, Sent for publication to in
March 2010
VI
Supplement 6: Process for making a steel melt containing carbide forming elements from
iron based raw material and a mineral containing the carbide forming
element, an alloy mixture and use of a mineral containing
L. Teng, M. Nzotta, S. Seetharaman, A. Chychko, J.-O. Andersson
Patent application № 1050721-8 received on 01.07.2010
Parts of the work have also been presented at the following conferences:
The heat effects of the slag foaming caused by carbonates decomposition A. Chychko and S. Seetharaman
13th International IUPAC Conference on High Temperature Materials Chemistry University of California, Davis, CA, USA, 15-18th September 2009 Energy Saving effect of slag foaming by carbonate additions in EAF Process
A. Chychko, L. Teng, and S. Seetharaman
Workshop on utilization of steelmaking slags with by-product recovery
Krakow, Poland, 10-11th May 2010
The determination of the total heat effect of slag foaming in an EAF
A. Chychko and S. Seetharaman
Seetharaman-seminar ”Materials processing towards properties”, Sigtuna, Sweden, 14-15th
June 2010
The author’s contributions to the supplements of the thesis:
Supplement 1: Literature survey, experimental work, data analysis, major part of the writing
Supplement 2: Literature survey, experimental work, data analysis, major part of the writing
Supplement 3: Literature survey, experimental work, data analysis, major part of the writing
Supplement 4: Literature survey, experimental work, data analysis, major part of the writing
Supplement 5: Literature survey, experimental work, data analysis, major part of the writing
Supplement 6: Experimental work, data analysis

VII
Contents
Abstract ...................................................................................................................................... I
Acknowledgements ................................................................................................................ III
Supplements............................................................................................................................. V
1. Introduction .......................................................................................................................... 1
1.1 Mo addition ..................................................................................................................... 2
1.2 Slag foaming ................................................................................................................... 3
2. Background of the study ....................................................................................................... 4
2.1 Fundamental aspects of steel alloying with Mo ............................................................. 4
2.1.1. Criteria for choosing alternate Mo sources, advantages and disadvantages ........... 4
2.1.2. The evaporation of MoO3 from different alloying sources of Mo .......................... 5
2.2. Slag foaming practice in an electric arc furnace (EAF) ................................................ 7
2.2.1. Chemical reactions leading to slag foaming in EAF .............................................. 7
2.2.2. The influence of the slag foaming on the EAF efficiency ...................................... 8
2.3. Strategy and objectives in the present thesis ................................................................. 8
3. Experimental work ............................................................................................................. 11
3.1 Thermogravimetry (TGA) ............................................................................................ 11
3.2 Gas chromatography (GC) ............................................................................................ 13
3.3 High-temperature X-Ray diffraction (XRD) ................................................................ 14
3.4 Steel alloying experiments ............................................................................................ 14
3.4.1. Small scale experiments in laboratory .................................................................. 14
3.4.2. Industrial trials ...................................................................................................... 17
3.5. Heat effect of slag foaming measurements .................................................................. 18
3.6. X-Ray radiography system .......................................................................................... 21
3.7. Plant trials on slag foaming ......................................................................................... 22
4. Results and discussion ........................................................................................................ 24
4.1. The development of new precursor for steel alloying with Mo .................................. 24

VIII
4.1.1. CaMoO4, MgMoO4 and Fe2MoO4 stabilities with respect to evaporation and
oxidation .......................................................................................................................... 24
4.1.2. The possibilities of CaMoO4, MgMoO4 and Fe2MoO4 in-situ formation from
industrial grade materials ................................................................................................ 25
4.1.3. The investigation of CaMoO4 and Fe2MoO4 precursors reduction processes ...... 29
4.1.4. Laboratory trials on steel alloying from 16-g- to 500-g-scale experiments ......... 32
4.1.5. Industrial trials on steel alloying in 3 ton induction furnace ................................ 34
4.2. Slag foaming caused by carbonates decomposition .................................................... 36
4.2.1. Thermodynamic modeling results ......................................................................... 36
4.2.2. Measured energies of decomposition for natural limestone and dolomite ........... 37
4.2.3. Plant data analysis ................................................................................................. 42
4.2.4. Studies on the kinetics of slag foaming and modeling of the foam height changes
......................................................................................................................................... 44
5. Summary and conclusions .................................................................................................. 49
6. Future work......................................................................................................................... 51
References .............................................................................................................................. 52

1
1. Introduction
Metallurgy is an important part of modern engineering science, which provides the mankind
with metals which are materials with unique properties. The appearance of steelmaking
initiated a huge acceleration in the development of our civilization. Ferrous metallurgy is
one of the most energy- and resource consuming part of the industry. In recent times, many
ecological problems are traced to this voluminous industry with huge production of different
steel grades. This necessitates improvement and even redesigning of traditional
technologies, marking a “revolution” in steelmaking.
This work was carried out as a part of the national project of Eso-Steel production, in which
the Division of Materials Process Science is an active participant with the objective,
“Retention, recovery and recycling of valuable metals”. The project aims at tailoring the
existing processes and come up with new process solutions for an optimization of the steel
production towards a better environment. The recovery and reutilization of valuable metals
for steel alloying, viz. Mo, Cr, V, Mn and even Fe in steelmaking routes is the main goal.
The process concepts would be based on thermodynamic and kinetic considerations of high-
temperature processes. The Eco-steel production concept, aims at the maximum utilization
of waste materials and byproducts (secondary resources) into steel production cycle and
subsequent lowering in the consumption of natural resources and nature pollution.
The present work deals with electric arc furnace (EAF) process optimization towards energy
and material saving by suitable modifications of the current technology. The criteria for
these solutions are easiness of implementation, as well as resource- or energy efficiency
improvements.
The research work on which the present dissertation is based consists of two big parts. The
first part focuses on the studies for Mo yield improvement. And the second part focuses on
slag foaming benefits, arising from direct addition of limestone or dolomite to an EAF. The
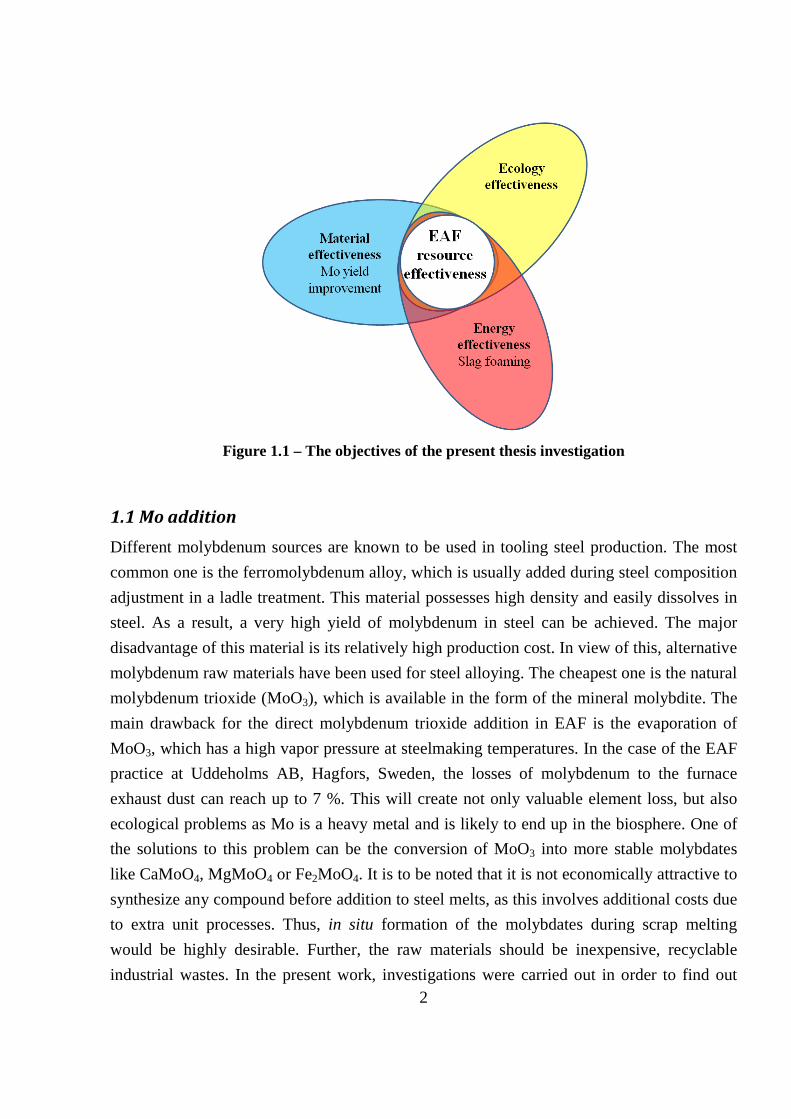
strategy diagram of the thesis work is presented in Figure 1.1. As mentioned earlier, the
prime aim is to achieve a more efficient and ecological usage of resources during EAF steel
production. Such efficiency arises from the direct utilization of natural or waste materials in
the EAF process. For example, in the production of tool steel, Mo addition is carried out by
choosing suitable precursors which enable an elimination of the prior production of
ferromolybdenum alloy. Similarly, adjusting the basicity is carried out using limestone
instead of CaO eliminating the calcination step.
2
Figure 1.1 – The objectives of the present thesis investigation
1.1 Mo addition
Different molybdenum sources are known to be used in tooling steel production. The most
common one is the ferromolybdenum alloy, which is usually added during steel composition
adjustment in a ladle treatment. This material possesses high density and easily dissolves in
steel. As a result, a very high yield of molybdenum in steel can be achieved. The major
disadvantage of this material is its relatively high production cost. In view of this, alternative
molybdenum raw materials have been used for steel alloying. The cheapest one is the natural
molybdenum trioxide (MoO3), which is available in the form of the mineral molybdite. The
main drawback for the direct molybdenum trioxide addition in EAF is the evaporation of
MoO3, which has a high vapor pressure at steelmaking temperatures. In the case of the EAF
practice at Uddeholms AB, Hagfors, Sweden, the losses of molybdenum to the furnace
exhaust dust can reach up to 7 %. This will create not only valuable element loss, but also
ecological problems as Mo is a heavy metal and is likely to end up in the biosphere. One of
the solutions to this problem can be the conversion of MoO3 into more stable molybdates
like CaMoO4, MgMoO4 or Fe2MoO4. It is to be noted that it is not economically attractive to
synthesize any compound before addition to steel melts, as this involves additional costs due
to extra unit processes. Thus, in situ formation of the molybdates during scrap melting
would be highly desirable. Further, the raw materials should be inexpensive, recyclable
industrial wastes. In the present work, investigations were carried out in order to find out

3
suitable Mo compound, formed from commercial ingredients as an economically viable
alternative for Mo addition to steel melts in the EAF.
1.2 Slag foaming
The beneficial effects of slag foaming in EAF practice are well-known. They include, for
example: thermal insulation of the arc and steel surface, noise reduction, metal protection
from nitrogen dissolution etc.
Slag foaming has been studied systematically for more than 50 years since Cooper and
Kitchener introduced a new theory of slag foam stability [1-2]. During the past 20 years, a
great deal of attention has been paid to foam stability investigations, an important mile stone
being the concept of slag foaming index [3], in view of the importance in EAF steelmaking.
In the EAF process, thermal insulation of the arc by slag foam plays a key role in process
efficiency. Traditionally, slag is foamed by carbon injection into liquid steel-slag interface.
The process is well-known and has been studied for many years. Alternative way for foam
creation can be direct addition of carbonates, for example limestone or dolomite. This way
can offer some benefits, such as better reaction control, the possibilities to create good foam
even during stainless steel making, and the utilization of CO2 as additional deoxidizer.
However, it can be concluded from the literature survey, that the slag foaming with
carbonates is not usual in steelmaking practice. It is traditionally believed that such reactions
(which are endothermic) are not favorable for energy balance of the total process since they
require additional heat for the decomposition process. However, there is no available data on
heat balance for slag foaming by carbonates decomposition. On the other hand, if the
process of lime production can be considered as a part of steelmaking route, it is clear that
limestone calcination in a separate furnace will require the same amount of energy but
without possible additional benefits, like slag foaming or CO2 utilization. Thus, direct
addition of carbonates to EAF could offer an interesting alternative.
In the present work, an attempt was made to study the energy effect of slag foaming caused
by carbonates decomposition both in laboratory scale and application of the same to
industrial scale. The investigations of slag foaming include several parts: the major one
describes the laboratory experiments where the thermal effects are measured and modeled
(Supplement 4). Separate parts deal with X-ray visualization studies of carbonate-based
foaming and analysis of the results from industrial EAF practice, where the advantages of
foaming by carbonate addition are evaluated (Supplement 5).

4
2. Background of the study
2.1 Fundamental aspects of steel alloying with Mo
2.1.1. Criteria for choosing alternate Mo sources, advantages and disadvantages
At least two factors should be considered to improve the yield of Mo. First, the substance
has to be stable at high temperatures to avoid fast evaporation of Mo in the form of any
gaseous spices. Another important criterion for the choice of Mo-precursor should be the
easiness of dissolution in steel melt. A very stable compound is likely to float on the steel
surface and can get assimilated in the slag phase instead of reacting with steel, thus lowering
the yield of Mo in the steel bath. The first criterion can be evaluated on the base of
thermodynamic data on substances stabilities, while the second one involves kinetics and
requires experimental investigations.
It is known that MoO2 has much lower equilibrium partial pressure than that of MoO3 even
at high temperatures [4]. Hence, reduction of MoO3 to MoO2 could minimize the loss of Mo
to the vapor phase. MoO2 can be further stabilized in the condensed phase by lowering the
Gibbs energy through the formation of a stable compound. In the present work,
investigations were carried out in order to examine the suitability of Fe2MoO4, formed from
commercial ingredients as an economically viable alternative for Mo addition to steel melts
in the EAF.
According to Fe-Mo-O ternary phase diagram at 1273 K [5], Fe and Mo form two ternary
oxides, viz. 2FeO⋅MoO2 (Fe2MoO4) and 2FeO⋅3MoO2 (Fe2Mo3O8). In the present context,
the thermodynamic stabilities of both these compounds are considered as both can be
potential molybdenum precursors. The formation of these oxides can be described by the
equations:
2FeO(s) + MoO2(s) = Fe2MoO4(s) (2.1)
2FeO(s) + 3MoO2(s) = Fe2Mo3O8(s) (2.2)
The Gibbs energies of formation the various Mo compounds and the oxides of carbon
(which are relevant for the reduction reactions) per one mole of O2, as functions of
temperature up to 1500 K, as retrieved from Thermocalc SGTE Solutions database v.4 are
presented in Figure 2.1. The data on the Gibbs energies of formation of Fe2Mo3O8 and
Fe2MoO4 were taken from [6].
5
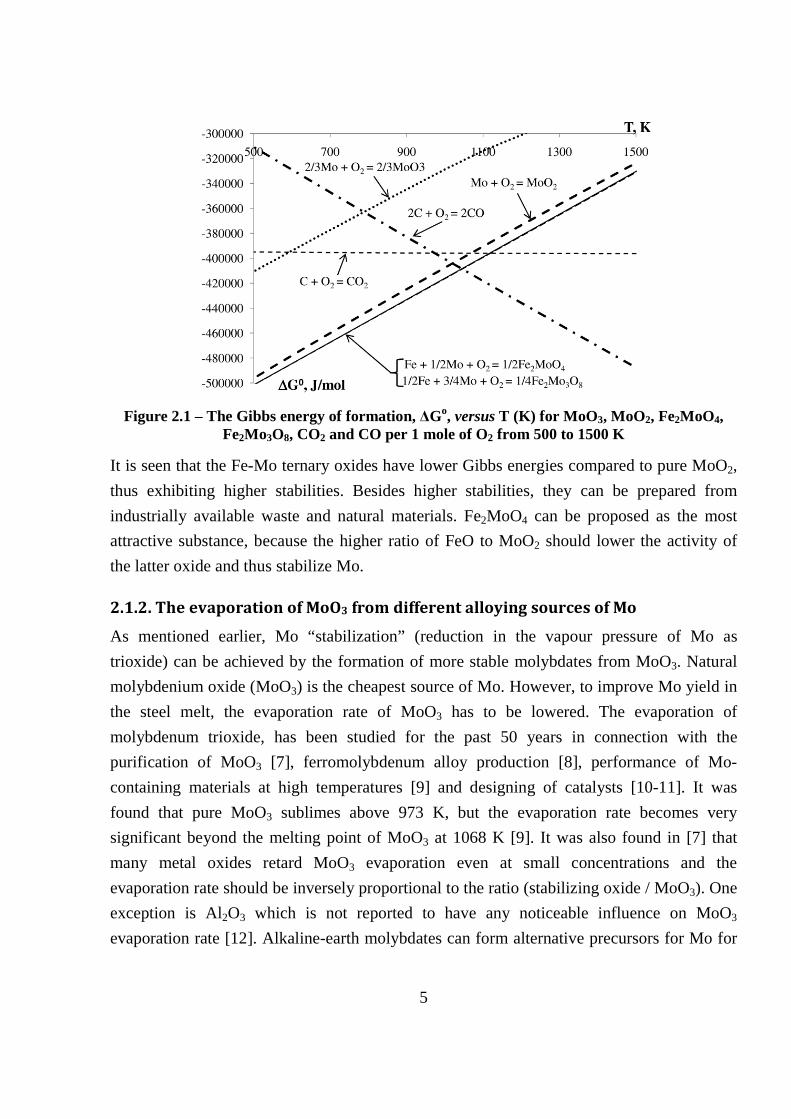
Figure 2.1 – The Gibbs energy of formation, ∆Go, versus T (K) for MoO 3, MoO2, Fe2MoO4, Fe2Mo3O8, CO2 and CO per 1 mole of O2 from 500 to 1500 K
It is seen that the Fe-Mo ternary oxides have lower Gibbs energies compared to pure MoO2,
thus exhibiting higher stabilities. Besides higher stabilities, they can be prepared from
industrially available waste and natural materials. Fe2MoO4 can be proposed as the most
attractive substance, because the higher ratio of FeO to MoO2 should lower the activity of
the latter oxide and thus stabilize Mo.
2.1.2. The evaporation of MoO3 from different alloying sources of Mo
As mentioned earlier, Mo “stabilization” (reduction in the vapour pressure of Mo as
trioxide) can be achieved by the formation of more stable molybdates from MoO3. Natural
molybdenium oxide (MoO3) is the cheapest source of Mo. However, to improve Mo yield in
the steel melt, the evaporation rate of MoO3 has to be lowered. The evaporation of
molybdenum trioxide, has been studied for the past 50 years in connection with the
purification of MoO3 [7], ferromolybdenum alloy production [8], performance of Mo-
containing materials at high temperatures [9] and designing of catalysts [10-11]. It was
found that pure MoO3 sublimes above 973 K, but the evaporation rate becomes very
significant beyond the melting point of MoO3 at 1068 K [9]. It was also found in [7] that
many metal oxides retard MoO3 evaporation even at small concentrations and the
evaporation rate should be inversely proportional to the ratio (stabilizing oxide / MoO3). One
exception is Al2O3 which is not reported to have any noticeable influence on MoO3
evaporation rate [12]. Alkaline-earth molybdates can form alternative precursors for Mo for

6
steel alloying [4]. Magnesium and calcium molybdates can easily be prepared by the
sintering of MoO3 with appropriate oxides at temperatures higher than 873 K [13].
The thermodynamic calculations were performed to analyze the relevant stabilities of
different molybdates toward MoO3 evaporation. Only cheap oxides were considered during
such analysis. The following reactions describe MoO3 losses from the substances:
CaMoO4(s)=CaO+MoO3(g) (2.3)
MgMoO4(s)=MgO+MoO3(g) (2.4)
FeMoO4(s)=FeO+MoO3(g) (2.5)
The results of Gibbs energy of decomposition calculations are presented at Figure 2.2.
Figure 2.2 – Calculated standard Gibbs energy changes of the molybdates decomposition as a
function of temperature: 1-CaMoO4; 2-MgMoO4; 3-FeMoO4
It can be concluded that CaMoO4 posses the highest stability and consequently, low MoO3
vapour pressure. On this basis, it can be concluded that Fe2MoO4, CaMoO4 and MgMoO4
possess the highest stabilities toward Mo spices evaporation and can be chosen as alternative
Mo sources for steel alloying. Investigations carried out on the evaporation of MoO3 from
alkali-earth molybdates by Kazenas [14] showed that many molybdates evaporate as a
mixture of initial salt and MoO3 derivatives, which requires experimental investigations of
the evaporation rates. An important requirement for a good precursor for Mo addition to
steel melts is the dissolution rate of the precursor should be fast. The higher stability of the
compound may lead to a lower dissolution rate of Mo in the steel leading to “floating” of the
compound on the surface, leading to lower Mo yields. Thus, many factors can affect the
7
yield of Mo during steel alloying and the further experimental investigations are required to
choose the most suitable Mo precursor.
2.2. Slag foaming practice in an electric arc furnace (EAF)
2.2.1. Chemical reactions leading to slag foaming in EAF
There are two types of reactions which can be used for slag foaming. The most familiar one
is the carbon oxidation by oxygen dissolved in the metal:
[C] + [O] = {CO} (2.6)
This reaction is exothermic and sometimes is difficult to control. For example, it can cause
too vigorous foaming in oxygen-blowing furnaces. This reaction has been studied for many
years and will not be considered in the present work.
Another type of slag foaming reactions is the decomposition of carbonates or other
substances, which can produce gases at high temperature:
CaCO3(s) = (CaO) + {CO2} (2.7)
CaCO3⋅MgCO3(s) = (CaO) + (MgO) + 2{CO2} (2.8)
This kind of foaming does not require extra O2 and C addition and could be used in ultra low
carbon or stainless steel production. Various foaming agents like calcium carbonate and
nitrate were studied toward gas generation. [15]. These reactions do not have resident time
because they are limited only by heat transfer to the system (these reactions are generally
endothermic), which is usually much faster than mass transfer. The detailed study of the
kinetics of slag foam height caused by marble sphere decomposition in borate melts at 1196
K was carried out by Chu and colleagues [16]. It was found that small-sized granules make
higher foaming layer; but foam life was shorter, while large-sized granules make thinner
foam layer but longer foam life time. These authors also found that, in the case of slag
foaming by limestone, there is an influence of slag composition on decomposition kinetics.
It was attributed to the dissolution rate of CaO shell, formed during CaCO3 decomposition.
Further, when the CaO porous shell was thicker, the bubble size of CO2 released was
smaller, which should also affect the foam stability. Comparing the decomposition of
limestone and dolomite in Na2B4O7-CaO-MgO melts at 1173 K, Niu et al. found that same
size dolomite sphere provided slightly longer foam life than one from limestone [17]. The
difference was explained by the different crystal structure of minerals.

8
2.2.2. The influence of the slag foaming on the EAF efficiency
It is to be noted that foam creation requires an additional heat for both decomposition
reaction and heating of the gaseous products. On the other hand, well-foamed slag should
improve the efficiency of EAF process. The electric arc plasma has a temperature from 5000
to 20 000 K [18], and it is obvious that the good insulation of the arc by slag foam plays a
key role in process efficiency. According to Fedina et al [19], if only half of the electric arc
length is in the slag, the part of energy, which is transferred from the arc to the liquid metal
will be only 31-42 %. However, if the arc is totally immersed into the slag, the metal bath
will receive 50 % of the arc power and consequently, the coefficient of energy usage will
increase from 52-66 to 80-93 %. The same authors have also been reported that, in the case
of higher slag foam, the efficiency of the CO post-combustion also increases. At the same
time, the input power can also be increased because of higher arc stability, which results in
the decrease of the whole heat duration and consequent heat losses. Finally, the energy
saving effect of 10-30 kWh/ton was reported in the case of well-controlled slag foaming for
150 ton electric arc furnace. Fruehan suggests that energy transfer efficiency improves from
40% without a foaming slag to 60-90 % efficiency when the slag is foamed [20].
Richard et al. [21] developed a model to describe the melting process and chemical reactions
in an EAF depending on reagents and energy additions. The energy model considers the
radiation and convective heat transfer, taking place between different zones, the furnace
components, and the arc. They assumed, using available data, that if the arc is fully covered
by the foaming slag, almost 70% of the arc energy will be blocked from reaching the wall
and instead transported to the steel. This is especially important for oxygen refining period
when there is no solid scrap around the arc. Authors [22] reported that in an EAF around 18
% of the energy from the arc is delivered directly to the steel, 2 % is absorbed by the
electrode, and 80 % is scattered around in the form of radiation. The calculated radiation
intensity from the arc is decreased from 10 to 3.5 MW/m2 within the double radius of each
electrode (600 mm) in the center of the bath, and to 0.125 MW/m2 at the furnace wall.
It can be concluded from the literature survey, that there are no systematic results on the
influence of slag foaming processes on the total energy balance of EAF.
2.3. Strategy and objectives in the present thesis
The first part of the current PhD project aimed for the creation of the cheap alternative
source for steel alloying with Mo. To achieve the aim, the reasons of the poor yield from
mineral concentrate of MoO3 were analyzed and thermodynamic modeling was performed in

9
order to choose more suitable precursors of Mo. Two main criteria were considered during
the thermodynamic analysis: 1) the vapor pressure of MoO3 as a function of temperature; 2)
the thermodynamic stability of a substance. The selection of the raw materials was limited to
waste and cheap sources of other elements, which could be used for the preparation of more
suitable precursors for steel alloying with Mo.
After choosing the most suitable molybdates as candidates for Mo sources, more detailed
thermogravimetry investigations were performed on the molybdates thermal stability to
confirm the results of thermodynamic analysis.
During the next stage, it was interesting to achieve in-situ formation of Fe2MoO4 and other
molybdates when mixing initial components and heat them together during scrap melting. It
was also attractive in a view of cost lowering, as it can simplify the process of alloying
material production and combine it together with EAF practice. To study the possibilities for
in-situ formation of CaMoO4, MgMoO4 and Fe2MoO4 from their precursor mixtures, a
number of methods were used, such as thermogravimetry (TGA), gas chromatograph (GC),
high-temperature X-ray diffraction (HT-XRD) and laboratory trials on steel alloying.
With the knowledge obtained from these studies, laboratory experiments of Mo-addition
were performed in a small induction furnace in 16-g-scale. It was found that, among the
molybdates studied, Fe2MoO4 provided the highest yield. The materials with the most
promising characteristics were tested in a larger scale laboratory and, finally, in industrial
scale experiments and compared with MoO3 as a reference material. The sequence of
investigation, all the methods used and material tested are shown in the Figure 2.3.
The second part of the thesis is devoted to slag foaming investigations. To the author’s
knowledge there was no experimental technique to measure the total heat balance of slag
foaming process. Therefore, the design and validation of such a technique became the most
important part in the slag foaming work. Besides the technique, the kinetic studies of slag
foaming and industrial data analysis were performed in order to confirm the observations
from the laboratory studies. The research plan and instruments for the investigation on heat
balance of slag foaming are shown in Figure 2.4.

10
Figure 2.3 – Research plan and instruments for a new Mo source development
Figure 2.4 – Research plan and instruments for the investigation on heat balance of slag foaming

11
3. Experimental work
Materials. Pure iron powder (less than 200 mesh, 99 %), C (mold graphite powder, 99.9 %,
< 0.5 mm), MoO3 (99+ %), MoO2 (99 %), Fe2O3 (97+ %), CaMoO4 (99.8 %), MgMoO4
(99.9 %), CaO (99.9 %) and MgO (99+ %) were supplied from Alfa Aesar company. Fe2O3
was preheated at 473 K for 4-6 hours to remove residual H2O, while CaO and MgO powders
were preheated at 1073 K for 24 hours to remove residual H2O and CO2. Ar gas (purity
99.999 %), CO and technical air were supplied by AGA gas company, Stockholm.
Fe2MoO4 used in the present work as reference material was synthesized from a mixture of
(Fe2O3+Fe+MoO3) by the method used by Morales et. al. [23]. A mixture of commercial-
grade Fe2O3 and molybdenite concentrate, supplied by Uddeholms AB, were used instead of
Fe2MoO4 for the large scale trials (and also in some laboratory scale experiments). The latter
mixture is denoted as “Fe2MoO4 precursor” in this work. The possibilities of Fe2MoO4
formation from the mixture after more than 16 h heating at 1373 K was successfully
confirmed by XRD analysis.
The dolomite mineral (21 % MgO, 29 % CaO, 2.3 % SiO2, 0.44 % Al2O3+FeO and the rest
is CO2) was delivered by Dokshytsy mines in Belarus and limestone was provided by SSAB,
Oxelösund, Sweden. Thermogravimetric studies on the decomposition of the limestone
sample showed a mass loss of 43.3 %. This corresponds approximately to the loss of
stoichiometric amount of CO2 indicating that the content of CaCO3 in the limestone is at
least 98.4 %. The purity of the materials was also established by XRD analysis.
For the preparation of the master slag during slag foaming experiments, CaO (98 %), SiO2
(99 %), MgO (99+%) and Al2O3 (98 %) were obtained from Sigma Aldrich and Riedel-de-
Haёn companies, while FeO was prepared in-situ by mixing Fe2O3 with Fe thoroughly and
pressing them into a pellet. Pure iron used for making the crucibles was obtained from
ARMCO. Argon gas, purity 99.999 % was supplied by AGA gas, Stockholm. The Ar gas
was purified by gas-cleaning system as follows. In order to remove the moisture, the gas was
passed through silica gel columns and Mg(ClO4)2. CO2 was absorbed by ascarite and traces
of oxygen were removed by passing the gas through copper and magnesium turnings at 823
K and 773 K, respectively.
3.1 Thermogravimetry (TGA)
The TGA experiments were performed in SETARAM TG-24 double-furnace unit with 0.001
mg detection limit. A schematic diagram of the unit is presented in Figure 3.1.

12
Figure 3.1 – A schematic diagram of the TG-24 unit: 1-beam balance; 2-carrier gas inlet; 3-
graphite furnace; 4-crucible; 5-thermocouple; 6-vacuum pump outlet; 7-gas outlet; 8-connectors to controllers and a computer
Additionally, some of the mixtures were investigated in SETARAM-92 single furnace unit
with the same accuracy.
Alumina crucibles of 8 mm inner diameter and 15 mm in height were used. The TGA
analyses were carried out in Ar gas and the flow rate was varied from 46 (TG-24) to 300
(TG-92) ml/min. In the most of the experiments, the samples were heated in a non-
isothermal mode at a heating rate of 10 K per minute up to the target temperatures and kept
at these temperatures over a period of 10 min in order to observe the mass changes as a
function of time. The observed changes were confirmed by weighing the substances before
and after the experiments.
Some thermogravimetric analyses were also carried out in the isothermal mode. In these
cases, a heating rate of 40 K per minute was used to reach the target temperature. The
decomposition of CaMoO4 was investigated at 1573, 1673, 1733, 1773 and 1823 K. In the
case of MgMoO4, the measurements were carried out at 1173, 1273, 1373, 1473 and 1573 K.
The experimental parameters such as the amounts of the precursors and the durations of the
treatment were tailored to the objectives of the individual experiments. The various

13
precursors, investigated in the present work, the experimental parameters, and relative mass
changes are presented in Table 3.1.
Table 3.1 – Initial compositions of mixtures and relative mass changes after TGA experiments (heating rate 10 K per minute, followed by holding at 1373 K)
Sample number
Components content, wt. % Mixture mass, mg
Holding time, min
Final mass decre-ase, %
MoO3 CaO MgO CaCO3
[a] C Fe2O3
FeOx [b]
TG-1 100 73.6 10 95.5 TG-2 72.0 28.0 479 10 1.67 TG-3 78.3 21.7 484 10 0.84 TG-4 57.8 42.2 445 10 17.5 TG-5 80.0 20.0 70.5 15 40.9 TG-6 61.0 23.7 15.3 69.4 15 24.3 TG-7 18.4 81.6 63.0 10 12.2 TG-8 46.1[b] 5.0 48.9[b] 1325 10 11.5 [a] - mineral calcite was used; [b] - commercial FeOx and MoO3 raw materials were supplied by Uddeholm AB, Hagfors, Sweden.
3.2 Gas chromatography (GC)
Evolved gas analysis experiments offered the possibility of identifying the gaseous reaction
products and thereby understand the reaction mechanisms. This was carried out by gas
chromatography used in the dynamic mode. The method was used to monitor the reaction
between the commercial grade components in the mixture of Fe2O3, MoO3 and excess
carbon (mixture for Fe2MoO4 precursors with excess carbon) by following the off gas
composition up to a maximum temperature of 1373 K. According to the mixture
composition, Fe2Mo should be the final product of reduction. A Shimadzu gas
chromatograph (GC-2014 AT) with thermal conductivity detector (TCD) was employed in
the present investigation. Packed stainless steel polar column with molecular sieves (3 mm
i.d. and 2 m length) from Bergman Labora company, Sweden was used in the gas
chromatograph. Ar was used to flush the tube at a constant flow rate (15 ml/min). The
column was preconditioned for 2 hours at 423 K before the experiment. Hydrogen was used
as a carrier gas for the column during the experiment. The analysis was performed with the
column temperature of 423 K, injector temperature of 473 K, and sampling gas flow rate of
10 ml/min. The peaks, corresponding to Ar and CO were identified before the experiment by
using the pure gases.
14
The reaction mixture (73.5 g) was placed above a porous alumina disc fused at the centre of
a vertical quarts tube of 35 mm i.d. and 1000 mm length. The mixture was heated in a
vertical furnace, equipped with Eurotherm © controller up to 1373 K with a heating rate 7 K
per min. After reaching the maximum temperature of 1373 K, the mixture was kept at the
constant temperature for around 200 min. During whole experiment, the Ar and CO peaks
were recorded and then analyzed using the software, supplied by the GC producer. The
samples were examined by XRD after the experiment.
3.3 High-temperature X-Ray diffraction (XRD)
In the case of the mixture of Fe2MoO4 precursors, it was necessary to find out the lowest
temperature of formation of Fe2MoO4 as well as to identify the intermediate products. In
order to investigate this, high-temperature X-ray diffraction studies of the Fe2MoO4
precursor mixture (corresponding to the sample TG-8, Table 3.1) were carried out using
X'Pert PRO-PW:3040/60 X-ray diffractometer. In this experiment, a heating rate of 10 K
/min was employed and Cu Kα radiation was used. Ar atmosphere was used for all the
experiments. All the measurements were started after 10 min dwelling time at each
temperature (773, 873, 973 and 1073 K) and the total exposure time was 30 min for each
scan.
3.4 Steel alloying experiments
3.4.1. Small scale experiments in laboratory
During the first step, the laboratory experiments on molybdenum yield were carried out by
adding oxide mixtures to a steel bath, kept in a crucible and heated in a laboratory induction
furnace in argon atmosphere. Around 16 g of steel melt was produced during each
experimental heat. Both alumina and spinel crucibles were used for the laboratory
experiments.
The design of the experimental arrangement is schematically presented in the Figure 3.2.
The temperature of the metal was measured by an optical pyrometer, monitoring the
radiation through a silica rod. The pyrometer output was fed to a PC datalogger. The
temperature was controlled to an accuracy of ± 10 K by adjusting the power manually.
Maximum power was used to heat the samples rapidly up to 2073 K in order to ensure
complete melting of the sample. After this, the power was decreased to keep the metal at a
constant temperature between 1873 and 1923 K.

15
Figure 3.2 – The design of a small induction furnace for the 16-g-scale trials with alloying mixtures: 1-tubes for input/output of Ar gas; 2-silicon stoppers; 3-quartz optical fiber; 4-
crucible inside heat insulator; 5-water cooled induction coil; 6-furnace tube; 7-optical pyrometer
Each source of Mo, studied in the present work during 16-g-scale trials, was first mixed and
ground together with the stoichiometric amount of graphite powder in an agate mortar. The
compositions of the alloying mixtures are listed in Table 3.2.
Table 3.2 – The compositions of alloying materials used for the 16-g-scale steel alloying trials
Mixture N
Components and their content, % Mass of mixture
added per 16 g of iron charge, g
ST-1 C-15.3; CaMoO4-84.7 0.787 ST-2 C-16.4; MgMoO4-83.6 0.733 ST-3 C-20.0; MoO3-80.0 0.600 ST-4 C-15.3; MoO3-61.0; CaO-23.7 0.787 ST-5 C-16.4; MoO3-65.5; MgO-18.2 0.733 ST-6 C-15.0; Fe2MoO4-85.0 1.067 ST-7 C-15.8; MoO2-84.2 0.507 ST-8 C-12.5; Fe2MoO4 precursor-87.5 1.279
Each mixture was then placed in a crucible between two tablets of pure iron, pressed from
iron powder. The crucible was covered with a lid to keep the contents from spilling out in
case of strong stirring during induction heating or vigorous reaction.
16
The duration of holding time was at least 5-6 min in order to ensure complete reaction. It
was found during experiments with Fe2MoO4+C mixture that longer holding time (up to 20
min) did not have any impact on the yield of Mo. At the end of the experiment, the metal
was gradually cooled down by power decrease. After the attainment of room temperature, all
the samples were weighed and subjected to chemical analysis using X-ray fluorescence
(XRF) spectroscopy.
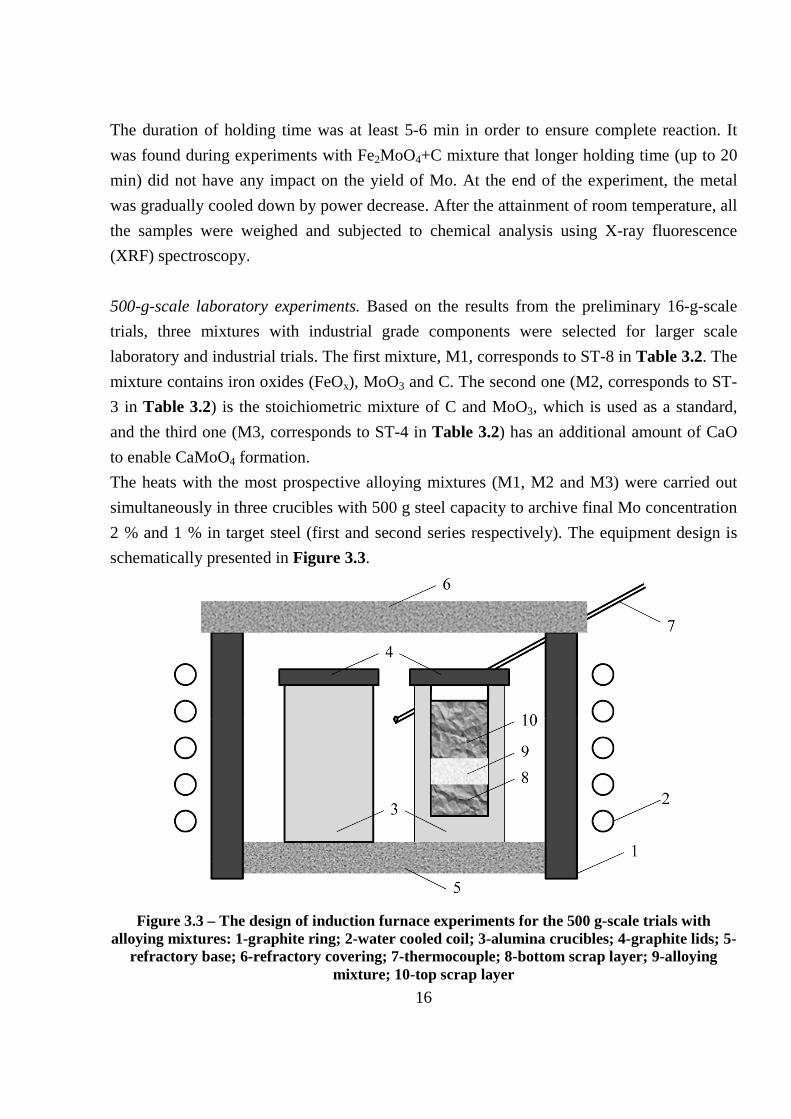
500-g-scale laboratory experiments. Based on the results from the preliminary 16-g-scale
trials, three mixtures with industrial grade components were selected for larger scale
laboratory and industrial trials. The first mixture, M1, corresponds to ST-8 in Table 3.2. The
mixture contains iron oxides (FeOx), MoO3 and C. The second one (M2, corresponds to ST-
3 in Table 3.2) is the stoichiometric mixture of C and MoO3, which is used as a standard,
and the third one (M3, corresponds to ST-4 in Table 3.2) has an additional amount of CaO
to enable CaMoO4 formation.
The heats with the most prospective alloying mixtures (M1, M2 and M3) were carried out
simultaneously in three crucibles with 500 g steel capacity to archive final Mo concentration
2 % and 1 % in target steel (first and second series respectively). The equipment design is
schematically presented in Figure 3.3.
Figure 3.3 – The design of induction furnace experiments for the 500 g-scale trials with alloying mixtures: 1-graphite ring; 2-water cooled coil; 3-alumina crucibles; 4-graphite lids; 5-
refractory base; 6-refractory covering; 7-thermocouple; 8-bottom scrap layer; 9-alloying mixture; 10-top scrap layer
17
During the experiments, the alloying mixtures were charged between 2 layers (130 g and
370 g respectively) of small sized steel scrap in a crucible, casted from alumina cement.
Three crucibles were heated simultaneously inside a graphite ring during each heat. A
graphite cover was also used above each crucible to ensure low oxygen potential above the
steel surface. The arrangement was covered by porous refractory bricks in order to provide
good heat insulation. In order to monitor the temperature in the vicinity of the crucibles, a
thermocouple was placed inside the graphite ring between the crucibles close to their top. By
controlling the input electric power, the temperature was increased at the rate of about 10 K
per minute up to 1863-1873 K. The crucibles with the contents were soaked at the
experimental temperature for 20 min and then cooled down by decreasing the power.
There was no inert gas protection during this experiment, as the graphite ring and covers
could protect the samples. After cooling, the steel samples were extracted from crucibles,
weighed and analyzed by XRF method. The compositions of the initial mixtures and their
amounts are shown in Table 3.3.
Table 3.3 – The compositions of alloying materials used for the 500 g-scale steel alloying trials
Mixture N Components and their content, % Mass of mixture added per 500 g of
steel charge, g first series second series
M1 (ST-8) C-12.5; Fe2MoO4 precursor-87.5 36.0 19.9 M2 (ST-3) C-20.0; MoO3-80.0 16.6 8.9 M3 (ST-4) C-15.3; MoO3-61.0; CaO-23.7 22.2 12.3
3.4.2. Industrial trials
Initial materials. All raw materials and equipment for the industrial trials were provided by
Uddeholms AB, Hagfors, Sweden. The mixtures and components were weighed on the
balances with 1 kg detection limit. The mixing was made in a rotary mixer with 75 kg
capacity. If it was not possible to put all the initial materials in the mixer for a single batch,
the components of a mixture were divided in 2 portions. The amounts of initial materials,
used for experimental trials, are shown in Table 3.4.
It should be noted that grinding of the initial materials was not performed during this
investigation. However, for the heat H6, only small pieces of iron oxide (mostly less than 2
cm in size) were collected to make the mixture with approximately the same amount of
initial materials as for the heats H1 and H2 (Table 3.4). Totally 6 portions of alloying
mixtures were prepared for the experimental trials.
18
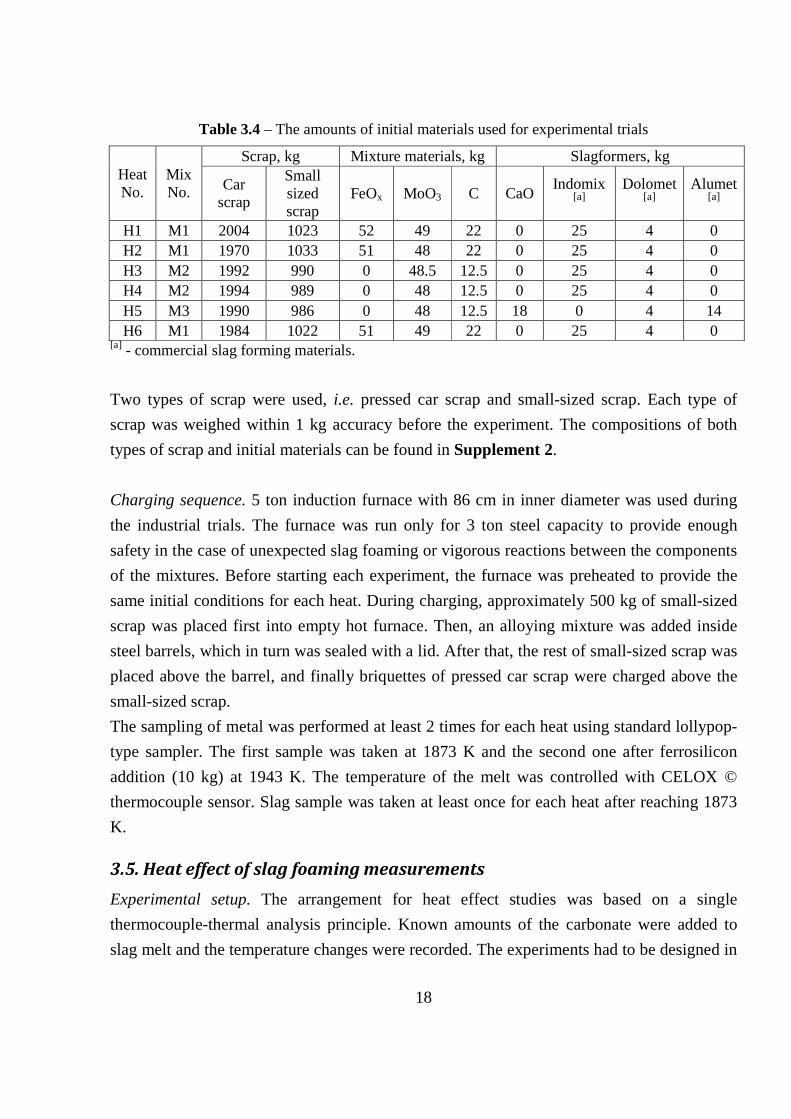
Table 3.4 – The amounts of initial materials used for experimental trials
Heat No.
Mix No.
Scrap, kg Mixture materials, kg Slagformers, kg
Car scrap
Small sized scrap
FeOx MoO3 C CaO Indomix
[a] Dolomet
[a] Alumet
[a]
H1 M1 2004 1023 52 49 22 0 25 4 0 H2 M1 1970 1033 51 48 22 0 25 4 0 H3 M2 1992 990 0 48.5 12.5 0 25 4 0 H4 M2 1994 989 0 48 12.5 0 25 4 0 H5 M3 1990 986 0 48 12.5 18 0 4 14 H6 M1 1984 1022 51 49 22 0 25 4 0
[a] - commercial slag forming materials.
Two types of scrap were used, i.e. pressed car scrap and small-sized scrap. Each type of
scrap was weighed within 1 kg accuracy before the experiment. The compositions of both
types of scrap and initial materials can be found in Supplement 2.
Charging sequence. 5 ton induction furnace with 86 cm in inner diameter was used during
the industrial trials. The furnace was run only for 3 ton steel capacity to provide enough
safety in the case of unexpected slag foaming or vigorous reactions between the components
of the mixtures. Before starting each experiment, the furnace was preheated to provide the
same initial conditions for each heat. During charging, approximately 500 kg of small-sized
scrap was placed first into empty hot furnace. Then, an alloying mixture was added inside
steel barrels, which in turn was sealed with a lid. After that, the rest of small-sized scrap was
placed above the barrel, and finally briquettes of pressed car scrap were charged above the
small-sized scrap.
The sampling of metal was performed at least 2 times for each heat using standard lollypop-
type sampler. The first sample was taken at 1873 K and the second one after ferrosilicon
addition (10 kg) at 1943 K. The temperature of the melt was controlled with CELOX ©
thermocouple sensor. Slag sample was taken at least once for each heat after reaching 1873
K.
3.5. Heat effect of slag foaming measurements
Experimental setup. The arrangement for heat effect studies was based on a single
thermocouple-thermal analysis principle. Known amounts of the carbonate were added to
slag melt and the temperature changes were recorded. The experiments had to be designed in

such a way that a quantification of the enthalpy changes
accuracy. The experimental set up is shown in
Figure 3.4 – The experimental setthermocouple inside protective tube
walls; 4 – crucible support tubethermocontroller; 7 – heat isolation
An alumina reaction tube (50
inside a vertical furnace equipped
maximum temperature of 1923 K. The furnace was controlled by a Eurotherm PID regulator
to an accuracy of ± 2 K with a
thermocouple for furnace temperature control was placed
tube at the level of slag surface. This arrangement was suitable as the local decrease in
temperature due to carbonate addition to the slag melt had very little impact on
control. Preliminary experiments with two thermocouples revealed that the temperature
inside the reaction tube, measured at the cent
not affected by more than 1
of the furnace control. This could ensure that the furnace control arrangement would not
have any serious impact on the present measurements of slag temperature by the
19
such a way that a quantification of the enthalpy changes could be enabled with reasonable
The experimental set up is shown in Figure 3.4.
The experimental set-up: 1 – iron crucible with slag insidele inside protective tube; 3 – outer thermocouple between crucible and
rucible support tube; 5 – Al2O3 reaction tube; 6 – thermocouple for PID heat isolation; 8 – conical cap from iron wires to protect top of the thermocouple projection; 9 –fallen samples
An alumina reaction tube (50 mm I.D., 60 mm O.D. and 1200 mm long) was positioned
inside a vertical furnace equipped with super kanthal heating elements capable of attaining a
maximum temperature of 1923 K. The furnace was controlled by a Eurotherm PID regulator
K with a Rh/Pt-30 % - Rh/Pt-6 % thermocouple as the sensor. The
thermocouple for furnace temperature control was placed on the outer side of the reaction
tube at the level of slag surface. This arrangement was suitable as the local decrease in
due to carbonate addition to the slag melt had very little impact on
control. Preliminary experiments with two thermocouples revealed that the temperature
inside the reaction tube, measured at the center point by thermocouple 3 (
t affected by more than 1-2 K during carbonate additions, which was within the accuracy
. This could ensure that the furnace control arrangement would not
have any serious impact on the present measurements of slag temperature by the
ld be enabled with reasonable
crucible with slag inside; 2 – inner uter thermocouple between crucible and furnace
thermocouple for PID from iron wires to protect top of the fallen samples
mm I.D., 60 mm O.D. and 1200 mm long) was positioned
with super kanthal heating elements capable of attaining a
maximum temperature of 1923 K. The furnace was controlled by a Eurotherm PID regulator
6 % thermocouple as the sensor. The
on the outer side of the reaction
tube at the level of slag surface. This arrangement was suitable as the local decrease in
due to carbonate addition to the slag melt had very little impact on furnace
control. Preliminary experiments with two thermocouples revealed that the temperature
er point by thermocouple 3 (Figure 3.4), was
which was within the accuracy
. This could ensure that the furnace control arrangement would not
have any serious impact on the present measurements of slag temperature by the core

20
thermocouple inside the iron crucible during carbonate additions, especially in the early
stages of measurements.
Specially designed crucibles, made of ARMCO iron were used in the present study (Figure
3.4). The main feature of these crucibles is the closed-end projection inside the crucible for
thermocouple, which enables more precise measurement of the temperature changes of the
slag after a sample addition. The crucible was positioned inside the reaction tube so that it
was in the even temperature zone of the furnace. The liquid slag surface was exposed to the
cold zone of the furnace, so that a constant radiation flux was established inside the furnace.
In order to protect iron crucible, purified argon gas was introduced into the furnace.
Since the radiation from a surface is proportional to the 4th power of temperature, higher
experimental temperature would be preferable for the experiments. However, the maximum
experimental temperature, viz. 1723 K is limited by the melting point of pure iron at 1786 K.
It was important to have a homogeneous slag phase of low viscosity in order to monitor the
temperature changes fast. The master slag of the following composition was chosen after
systematic study of the composition and liquidus temperature dependencies for a number of
slag systems [24-25]: CaO - 31 %; SiO2 - 31 %; MgO - 7 %; Al2O3 - 6 %; FeO - 25 %.
According to literature [25], this composition should have the liquidus temperature around
1473 K. A slag of approximately the same composition has the liquidus temperature 1448 K
[24].
Samples preparation. Both spherical and wedge samples were prepared from natural
materials (Figure 3.5).
Preliminary experiments showed that the experimental results were not reproducible if the
carbonates, which were lighter than the slag floated on the slag surface. In order to measure
the total heat effect due to the decomposition of the sample and to get reproducible results, it
was found necessary that the carbonate samples sunk to the bottom of the crucible as fast as
possible. In order to facilitate this, the samples were tied to sinker tablets of pure iron using
thin pure iron wires. A small conical cap made of iron wire was attached to the top of the
thermocouple tube inside the crucible as shown in Figure 3.4. This arrangement effectively
prevented the samples landing on top of the thermocouple tube and the experiments were
found to be reproducible.
Three decomposition temperatures were tested: 1623, 1673 and 1723 K. After attaining the
experimental temperature, each slag was kept in the crucible for 4-5 hours before starting the
experiment in order to ensure complete melting and mixing of the slag components, thereby

the homogeneity of the slag. More detailed description of the experimental setup and
procedure can be found in
Figure 3.5 – Samples: a
3.6. X-Ray radiography
X-ray radiographic experiments were performed in order to observe the kinetic
formation. The visualization experiments were conducted on Philips BV
A schematic diagram of the experimental set up is presented in
The furnace assembly (Thermal Technology Inc.), with a maximum temperature of 2300 K,
was equipped with graphite heating elements
the furnace was controlled by a Eurotherm temperature regulator within ± 2 K.
system consisted of a CCD camera with digital noise reduction. A detailed description of the
apparatus is presented in earlier reports from the present division [
i.d. 36 mm and 60 mm height was used to hold the slag. T
chosen for the synthetic slag studied at
%, SiO2 – 32.5 %. The synthetic slag amount was 34.5 g.
21
the homogeneity of the slag. More detailed description of the experimental setup and
procedure can be found in Supplement 3.
– spherical limestone; b – wedge limestone;iron tablets
Ray radiography system
ray radiographic experiments were performed in order to observe the kinetic
formation. The visualization experiments were conducted on Philips BV
A schematic diagram of the experimental set up is presented in Figure
The furnace assembly (Thermal Technology Inc.), with a maximum temperature of 2300 K,
was equipped with graphite heating elements and alumina reaction tube. The temperature of
the furnace was controlled by a Eurotherm temperature regulator within ± 2 K.
system consisted of a CCD camera with digital noise reduction. A detailed description of the
apparatus is presented in earlier reports from the present division [
i.d. 36 mm and 60 mm height was used to hold the slag. The following composition was
chosen for the synthetic slag studied at 1773 K: Al2O3 – 20.0 %, MnO
32.5 %. The synthetic slag amount was 34.5 g.
the homogeneity of the slag. More detailed description of the experimental setup and
limestone; c – wedge dolomite; d –
ray radiographic experiments were performed in order to observe the kinetics of foam
formation. The visualization experiments were conducted on Philips BV-26 imaging system.
Figure 3.6.
The furnace assembly (Thermal Technology Inc.), with a maximum temperature of 2300 K,
alumina reaction tube. The temperature of
the furnace was controlled by a Eurotherm temperature regulator within ± 2 K. The imaging
system consisted of a CCD camera with digital noise reduction. A detailed description of the
apparatus is presented in earlier reports from the present division [26]. Alumina crucible of
he following composition was
20.0 %, MnO – 15.0 %, CaO – 32.5

The particles of natural limestone were
container, attached to a silica rod. The process was continuously recorded on video, after
which the single screenshots were analyzed
can be found in Supplement
3.7. Plant trials on slag foaming
The plant trials were conducted in a 100
(produced by Danieli ©) at Belarusian Steel Works (BMZ). Most of the heats had
approximately 1 hour tap
investigation of the influence of dolomite and limestone additions on an energy balance of a
heat in an EAF was performed in 2 steps. During the first stage, statistical methods of data
analysis were employed. To find out the influen
demand in 100-ton EAF, the heat reports with raw plant data of more than 8000 heats,
conducted at Belarusian Steel Works in 2008
performed to fetch only the heats wit
can have influence on energy demand (all heats without technical time
– 120 ± 3 ton, two basket scrap charge, etc.).
22
Figure 3.6 – X-ray radiography set up
The particles of natural limestone were introduced into the slag at
container, attached to a silica rod. The process was continuously recorded on video, after
which the single screenshots were analyzed. More detailed information about the experiment
Supplement 4.
on slag foaming
The plant trials were conducted in a 100-ton EAF furnace with 75 MWh power supply
(produced by Danieli ©) at Belarusian Steel Works (BMZ). Most of the heats had
approximately 1 hour tap-to-tap time and 90-95 % of steel
investigation of the influence of dolomite and limestone additions on an energy balance of a
heat in an EAF was performed in 2 steps. During the first stage, statistical methods of data
analysis were employed. To find out the influence of limestone and dolomite on the energy
ton EAF, the heat reports with raw plant data of more than 8000 heats,
conducted at Belarusian Steel Works in 2008, were collected. After tha
performed to fetch only the heats with a certain range of other important parameters, which
can have influence on energy demand (all heats without technical time
120 ± 3 ton, two basket scrap charge, etc.).
into the slag at 1773 K in a paper
container, attached to a silica rod. The process was continuously recorded on video, after
More detailed information about the experiment
ton EAF furnace with 75 MWh power supply
(produced by Danieli ©) at Belarusian Steel Works (BMZ). Most of the heats had
steel scrap in a charge. The
investigation of the influence of dolomite and limestone additions on an energy balance of a
heat in an EAF was performed in 2 steps. During the first stage, statistical methods of data
ce of limestone and dolomite on the energy
ton EAF, the heat reports with raw plant data of more than 8000 heats,
, were collected. After that, the filtering was
h a certain range of other important parameters, which
can have influence on energy demand (all heats without technical time-breaks, charge mass

23
To clarify the influence of carbonates among more than 100 parameters on energy
consumption, all the heats were normalized to the middle values of parameters. The
normalization includes the elimination of the “noice” influence of the parameters with the
known impact to the energy demand. More detailed information about normalization
procedure can be found in Supplement 4.
As the relative time of carbonate addition in EAF can influence the energy consumptions,
the parameter tQ, describing the dimensionless time of carbonate addition, was introduced
for each heat as:
%1001 ⋅⋅
⋅=∑
=carbtottot
n
i
carbi
carbi
QmQ
mQt
, (3.1)
where Qicarb – integral energy consumption by the moment of addition of i portion of
carbonate, J; micarb – mass of i portion of carbonate added, kg; Qtot – total energy
consumption for a heat, J; mtotcarb – total mass of carbonate, added during a heat, kg.
The parameter tQ characterizes the relative time of carbonate addition in relation to whole
heat duration. Then, all the heats were divided into 2 groups: first – with early addition of
carbonates (tQ < 33 %) and second – with late addition (tQ > 50 %). Finally, the correlations
between energy demands and carbonates consumptions were found for both of the groups.
As later addition of carbonates was found to favor the energy efficiency of EAF, 9 trial heats
were performed during second step of plant investigation to prove the advantage of later
dolomite addition (limestone was not available at the plant during trials). The trial heats
were conducted with the fixed consumptions of raw dolomite and lime. The heats had to be
run one-by-one without any interruption or technical time breaks within the trial period. The
same type of scrap (car and carbon steel scrap) was used for all of the heats during the
experiment. The slag chemistry and amount were kept very nearly the same. It was found
after slag analysis, that slag bacisity, defined as (% CaO)/(% SiO2) was about 2 and FeO
concentration was in the range of 19-23 % for all of the heats. All heats were tapped after
reaching the steel bath temperature of 1893 K.

24
4. Results and discussion
4.1. The development of new precursor for steel alloying with Mo
4.1.1. CaMoO4, MgMoO4 and Fe2MoO4 stabilities with respect to evaporation and
oxidation
Fe2MoO4 stability by TGA. Pure iron molybdate (Fe2MoO4) was tested both in argon and air
atmosphere while heating up to 1573 K with 10 K per minute rate. The results are shown in
Figure 4.1. During heating in air, Fe2MoO4 is subjected to oxidation, which starts after 573-
673 K and results in the mass increase followed by decrease. The peak of mass increase,
compared to initial mass of Fe2MoO4, is around 12 % which can be explained by the
oxidation of Fe2MoO4 into MoO3 and Fe2O3 mixture according to the equation:
Fe2MoO4 + O2 = Fe2O3 + MoO3 (4.1)
According to stoichiometry, the process should lead to the 11.8 % of mass increase. After
reaching of 1173 K, the mass of mixture starts to decrease, probably due to the subsequent
MoO3 evaporation from the mixture. By the end of the experiment, the total mass changes
indicate the evaporation of approximately 43 % of MoO3, formed as a result of iron
molybdate oxidation by air.
It should be noted that there is no mass change for Fe2MoO4 during the same heat treatment
in the argon atmosphere, and this substance seems to be very stable source of molybdenium
in the absence of oxygen (Figure 4.1).
Figure 4.1 – The mass change of Fe2MoO4 during heating in different atmosphere: 1 –
Fe2MoO4 in air atmosphere; 2 – Fe2MoO4 in argon atmosphere; 3 – temperature profile
25
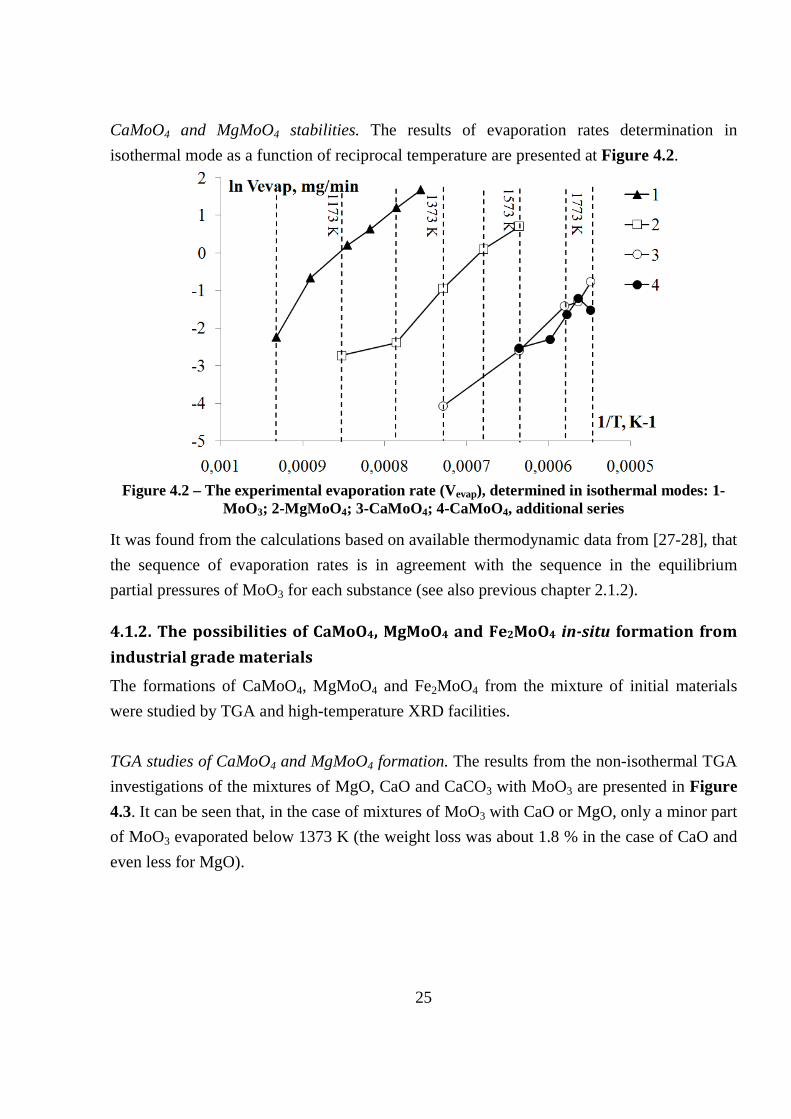
CaMoO4 and MgMoO4 stabilities. The results of evaporation rates determination in
isothermal mode as a function of reciprocal temperature are presented at Figure 4.2.
Figure 4.2 – The experimental evaporation rate (Vevap), determined in isothermal modes: 1-
MoO3; 2-MgMoO4; 3-CaMoO4; 4-CaMoO4, additional series
It was found from the calculations based on available thermodynamic data from [27-28], that
the sequence of evaporation rates is in agreement with the sequence in the equilibrium
partial pressures of MoO3 for each substance (see also previous chapter 2.1.2).
4.1.2. The possibilities of CaMoO4, MgMoO4 and Fe2MoO4 in-situ formation from
industrial grade materials
The formations of CaMoO4, MgMoO4 and Fe2MoO4 from the mixture of initial materials
were studied by TGA and high-temperature XRD facilities.
TGA studies of CaMoO4 and MgMoO4 formation. The results from the non-isothermal TGA
investigations of the mixtures of MgO, CaO and CaCO3 with MoO3 are presented in Figure
4.3. It can be seen that, in the case of mixtures of MoO3 with CaO or MgO, only a minor part
of MoO3 evaporated below 1373 K (the weight loss was about 1.8 % in the case of CaO and
even less for MgO).

26
Figure 4.3 – The mass changes for pure MoO3 (1) and its mixtures with CaO and MgO by
TGA studies: 1-MoO3; 2-CaO+MoO3 (∆∆∆∆m multiplied by 50); 3-MgO+MoO3 (∆∆∆∆m multiplied by 100); T–temperature ramp in K (on right hand side Y-axis)
It can be concluded from Figure 4.3, that the formation of corresponding molybdates goes
much faster than the evaporation of pure MoO3. This is in conformity with the results of
high temperature XRD in the case of CaO-MoO3.
TGA studies of Fe2MoO4 formation.
TGA studies of the binary mixtures showed that in the case of MoO3+C mixture two steps of
mass change were observed (ca 900 and 1250 K respectively, line 3, Figure 4.4), which can
be explained by intermediate MoO2 formation and agrees both with mass balance calculation
and other investigations [27]. The reaction is fast enough to be almost completed within 10
min of holding at 1373 K.
The mass decrease for the Fe2O3+C mixture starts after 900 K (line 2, Figure 4.4) and goes
without noticeable intermediate steps The reaction rate is much less than that for (MoO3+C)
mixture and the reduction is not complete within 10 min of holding time at 1373 K.
In the case of Fe2MoO4 synthesis, the mass change profile has 2 steps (line 1, Figure 4.4).
The final mass decrease was 11.45 % while the theoretical value should be 11.65 %
corresponding to the reduction of Fe2O3 and MoO3 in the mixture by carbon to FeO and
MoO2 respectively with CO formation. The reduction is reasonably fast and, as it was found
from the mass change profile that the reactions were complete within 6 min after reaching
the temperature of 1373 K at a heating rate of 10 K per minute.

Figure 4.4 – The mass changes for different mixtures observed by TGA studiesFe2MoO4 synthesis; 2- Fe
The first step of approximately 2.8 % of mass decrease after 900 K can be mostly attributed
to the reduction of Fe(III) to Fe(II) in the mixture, which should lead to 3.1 % decrease in
mass if the mixture composi
phase of 8.65 % mass decrease after 1200 K can be
Mo(IV) compounds from Mo(VI), which should lead to
that first, Fe2O3 is reduced by carbon to FeO, followed by the reduction
and finally, Fe2MoO4 would be formed. MoO
with MoO2 having even a lower melting temperature [
reduction of Mo(VI) to Mo(IV) takes place at higher temperatures than for
C+MoO3 mixture. The reaction sequence with respect to the formation of
precursor mixture can thus be described by the following equations:
Fe2O3 + C = 2FeO + CO (above 7
MoO3 + C = MoO2 + CO (above 1173 K)
SEM investigation, carried out for the
showed non-uniform structure with irregular
show any noticeable amount of Fe
crystals together with traces of other Mo compounds with Fe:Mo ratios 2:3 and 1:1 were
found.
Thus, there was no evidence in the TGA experiments of the formation of Fe
mixture according to the reaction (27
The mass changes for different mixtures observed by TGA studiesFe2O3+C; 3- MoO3+C (∆∆∆∆m multiplied by 0.2)
approximately 2.8 % of mass decrease after 900 K can be mostly attributed
to the reduction of Fe(III) to Fe(II) in the mixture, which should lead to 3.1 % decrease in
mass if the mixture composition and reaction stochiometry were considered. The second
phase of 8.65 % mass decrease after 1200 K can be linked mostly to the formation of
Mo(IV) compounds from Mo(VI), which should lead to 8.3 % decrease. It can be expected,
ed by carbon to FeO, followed by the reduction
would be formed. MoO3 melts above 1068 K and can form an eutectic
having even a lower melting temperature [4]. However, the second step of
to Mo(IV) takes place at higher temperatures than for
mixture. The reaction sequence with respect to the formation of
precursor mixture can thus be described by the following equations:
+ C = 2FeO + CO (above 773-973 K)
+ CO (above 1173 K)
SEM investigation, carried out for the Fe2MoO4 precursors mixture after TGA study,
uniform structure with irregular-shaped small crystals. EDS analysis did not
amount of Fe2MoO4 crystals. In contrast, a large amount
crystals together with traces of other Mo compounds with Fe:Mo ratios 2:3 and 1:1 were
evidence in the TGA experiments of the formation of Fe
mixture according to the reaction (4.4) within the short time of soaking at 1373 K
The mass changes for different mixtures observed by TGA studies: 1- mixture for
multiplied by 0.2); 4- temperature profile
approximately 2.8 % of mass decrease after 900 K can be mostly attributed
to the reduction of Fe(III) to Fe(II) in the mixture, which should lead to 3.1 % decrease in
tion and reaction stochiometry were considered. The second
linked mostly to the formation of
3 % decrease. It can be expected,
ed by carbon to FeO, followed by the reduction of MoO3 to MoO2
melts above 1068 K and can form an eutectic
]. However, the second step of the
to Mo(IV) takes place at higher temperatures than for the binary
mixture. The reaction sequence with respect to the formation of Fe2MoO4 from the
precursor mixture can thus be described by the following equations:
(4.2)
(4.3)
s mixture after TGA study,
shaped small crystals. EDS analysis did not
crystals. In contrast, a large amount of MoO2
crystals together with traces of other Mo compounds with Fe:Mo ratios 2:3 and 1:1 were
evidence in the TGA experiments of the formation of Fe2MoO4 from the
the short time of soaking at 1373 K:

28
MoO2 + 2FeO = Fe2MoO4 (4.4)
The comparison of these results with the synthesis of Fe2MoO4, where the samples were
heated for 16 h at 1373 K, indicates that longer soaking times and higher temperatures may
be required for the formation of Fe2MoO4.
High temperature XRD studies on CaMoO4 formation from CaO and MoO3 mixture. While
there are no noticeable differences in the XRD diffraction peaks of the samples measured at
298 and 773 K, the peak of CaMoO4 for plane of (112) index was quite prominent at 873 K.
After reaching 973 K, all the reflections were in agreement with the database values
corresponding to indices for the various planes of CaMoO4 (Figure 4.5), thus confirming
that the final product was pure CaMoO4.
Figure 4.5 – XRD patterns for the mixture of CaO with MoO3 mixture at 973 K (1) and the
diffraction indices for different planes of CaMoO4 from XRD database (2)
These observations confirmed that the formation of CaMoO4 starts even at 873 K and is
completed by 973 K. In a view of the less-encouraging results, the XRD studies were not
carried in the case of MgMoO4.
High temperature XRD studies on Fe2MoO4 formation from precursor mixture. There are no
serious differences between XRD peaks at room temperature and 773 K. However, some
small changes in XRD peaks are observed at 873 K as compared to room temperature,
probably due to the chemical reactions getting started. The major phase, found after reaching

29
973 K was MoO2. The peaks of the samples were almost the same at 973 and 1073 K, and
MoO2 seems to be the major component of the Fe2MoO4 precursors mixture treatment,
together with the small amounts of iron oxides FeO, Fe3O4 and Fe2Mo3O8 (Figure 4.6).
Figure 4.6 – XRD patterns for the mixture for Fe2MoO4 precursor at 1073 K: 1-patterns; 2-
MoO2 markers; 3-Fe2Mo3O8 markers; 4-FeO markers; 5-Fe3O4 markers
This means that the reduction of MoO3 started around 873 K and the formation of MoO2 is
finished before reaching 973 K. On the other hand, there was no fast reaction between MoO2
and FeO at 1073 K as there were no XRD peaks corresponding to Fe2MoO4 found at such
temperatures after 10 min holding. These results are in conformity with the TGA results.
Thus, it can be concluded that the reaction of MoO3 reduction by carbon includes at least 2
steps. First one is a fast reaction resulting in the formation of MoO2 before 973 K, while the
second stage of MoO2 reaction with FeO proceeds much slower and requires more than 10
min holding time at 1273-1473 K.
4.1.3. The investigation of CaMoO4 and Fe2MoO4 precursors reduction processes
Non-isothermal TGA studies. The results of TGA investigations on C+MoO3+FeOx,
C+MoO3 and C+MoO3+CaO mixtures in argon atmosphere with the heating rate 10 K/min
are shown in Figure 4.7. All the mixtures were constructed to provide full reduction of
MoO3 to metallic Mo. For both mixtures, the reduction proceeds in 2 steps with the same
starting temperatures for the first step (900 K).
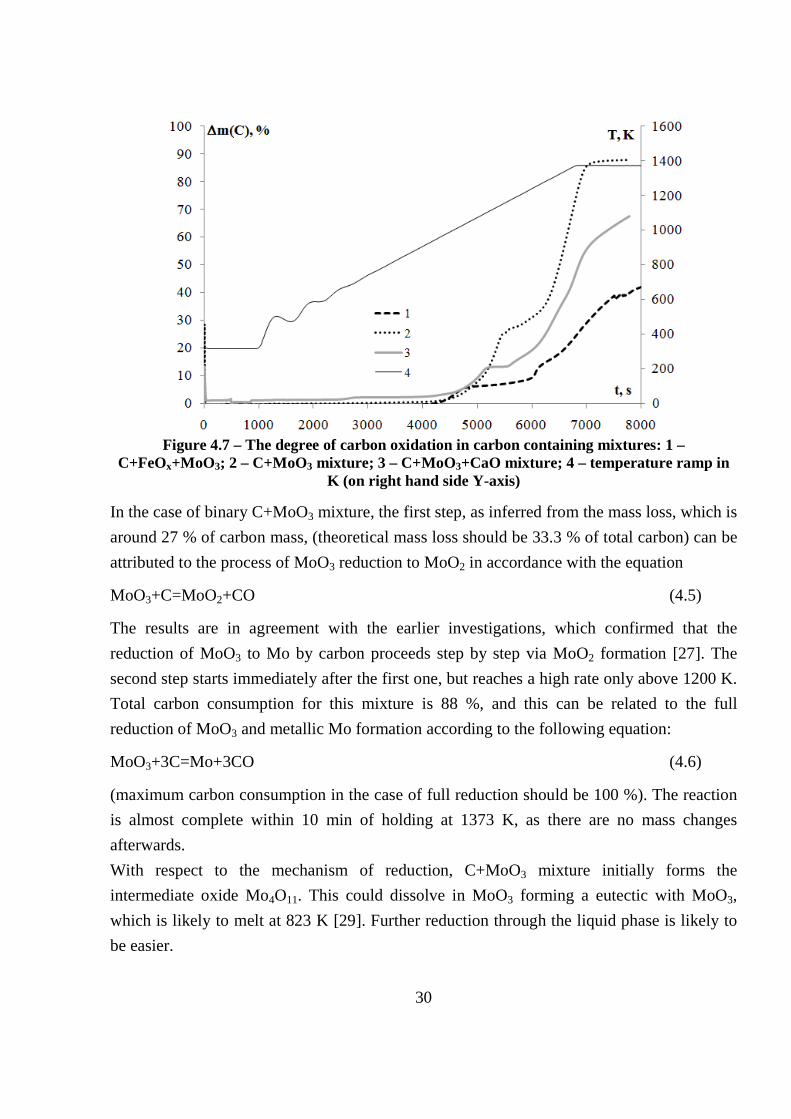
30
Figure 4.7 – The degree of carbon oxidation in carbon containing mixtures: 1 –
C+FeOx+MoO3; 2 – C+MoO3 mixture; 3 – C+MoO3+CaO mixture; 4 – temperature ramp in K (on right hand side Y-axis)
In the case of binary C+MoO3 mixture, the first step, as inferred from the mass loss, which is
around 27 % of carbon mass, (theoretical mass loss should be 33.3 % of total carbon) can be
attributed to the process of MoO3 reduction to MoO2 in accordance with the equation
MoO3+C=MoO2+CO (4.5)
The results are in agreement with the earlier investigations, which confirmed that the
reduction of MoO3 to Mo by carbon proceeds step by step via MoO2 formation [27]. The
second step starts immediately after the first one, but reaches a high rate only above 1200 K.
Total carbon consumption for this mixture is 88 %, and this can be related to the full
reduction of MoO3 and metallic Mo formation according to the following equation:
MoO3+3C=Mo+3CO (4.6)
(maximum carbon consumption in the case of full reduction should be 100 %). The reaction
is almost complete within 10 min of holding at 1373 K, as there are no mass changes
afterwards.
With respect to the mechanism of reduction, C+MoO3 mixture initially forms the
intermediate oxide Mo4O11. This could dissolve in MoO3 forming a eutectic with MoO3,
which is likely to melt at 823 K [29]. Further reduction through the liquid phase is likely to
be easier.

31
In the case of C+MoO3+CaO mixture, the reduction sequence appears to be different. The
mass change for the first stage is only half in compared to the corresponding step in the case
of C+MoO3 mixture. This would imply that MoO3 is only partially reduced. Further, the rate
of reduction of intermediates by carbon during the second stage is less compared to the
carbon mixture with pure MoO3. This is attributed to the formation of species like CaMoO3
and CaMoO4 which are likely to retard further reduction to molybdenum metal.
For C+FeOx+MoO3 mixture, at least 2 steps can be observed on mass change curve. The first
one is around 6 % of total carbon demand and can be attributed to the reduction of Fe(III) in
the mixture. It is clear from the Figure 4.7, that further reduction by carbon is much slower
in comparison with C+MoO3 mixture, probably because of formation of stable intermediate
compounds.
Since the evaporation of pure MoO3 is significant only above 1070 K (Figure 4.3), the
reduction by carbon (after 900 K) or reaction with CaO (after 873 K) will precede the
evaporation step thus stabilizing Mo in the condensed phase.
Gas chromatograph (GC) studies. Gas chromatograph studies were carried out only for
Fe2MoO4 precursor mixture. The results of composition changes of gas, passed through the
heated mixture are shown in Figure 4.8 as a function of furnace temperature.
Figure 4.8 – The gas composition changes as a function of mixture temperature: 1 – CO peak
intensity; 2 – Ar peak intensity; 3 –temperature profile

32
It can be seen in the Figure 4.8 that argon concentration starts to decrease just above 800 K,
probably due to the dilution of gas mixture with CO2 formed by carbon oxidation (this could
not be detected by GC) during the experiment. After 1110 K, a sharp increase in CO
concentration is observed. The evolution of CO reaches its maximum at approximately 1300
K and then starts to decrease. The decrease lasts for the whole experiment, probably due to
the large volume of the reactor tube and small gas flow rate.
The XRD patterns of the product of Fe2MoO4 reduction after GC experiment are shown in
Figure 4.9.
Figure 4.9 – The XRD patterns of the products after gas chromatograph experiment: 1-
Mo18C7; 2-Mo2C; 3-C; 4-Fe7Mo3; 5-Mo
It is clear from Figure 4.9 that the XRD peaks for the solid products of GC experiment
indicate the presence of metallic Mo, intermetallic Fe7Mo3 and carbides Mo2C and Mo18C7.
The partial formation of carbides during long heating can be explained by a certain amount
of excess carbon in the mixture.
4.1.4. Laboratory trials on steel alloying from 16-g- to 500-g-scale experiments
16-g-scale laboratory experiments. During the 16-g-scale experiments, most of the samples
showed the concentration of Mo around 2 % after the trials. There was no noticeable
crucible contamination as well as metal loses in any form. To compare the results from
different heats, molybdenum yield was estimated from each sample analysis. Analysis from
different parts of the sample showed similar Mo contents, confirming thereby that the Mo
distribution in the sample was uniform. The molybdenum yield could be calculated as the
ratio of molybdenum mass in the metal sample to the mass of molybdenum in the initial
mixture:

33
[ ][ ] %100%
%⋅
⋅⋅
=mixmix
metmetMo mMo
mMoη, (4.7)
where [%Mo]met – molybdenum content in a metal sample, mmet – metal sample mass,
[%Mo]mix – molybdenum content in alloying mixture, mmix – alloying mixture mass.
The experiments showed that, after 4-5 min after reaching 1923 K, the steel samples were
homogeneous, the mixture was completely consumed and the yield of Mo reached the values
up to 98 %. This indicated that the dissolution of molybdenum in liquid iron is fast enough
and nearly completed during the melting of the iron tablets. It should also be mentioned that
the mass changes observed before and after the experiments by weighing the crucibles were
in good agreement with the mass balance of the full reduction of molybdenum source by
carbon with metallic Mo formation for both completely and partially melted samples. The
comparison of average values of molybdenum yield for different molybdenum precursor,
tested in present work, is shown in the Table 4.1.
Table 4.1 – The average values of molybdenum yield, obtained from the different molybdenum sources in 16-g-scale test
Mixture Molybdenum precursor Number of reliable
experiments Average value of the yield, %
ST-1 CaMoO4+C 3 93.0 ST-3 MoO3+C 4 93.3 ST-4 CaO+MoO3+C 3 92.0 ST-5 MgO+MoO3+C 4 6.6 ST-6 Fe2MoO4+C 2 98.2 ST-7 MoO2+C 3[a] 93.2 ST-8 Fe2MoO4 precursor+C 1 95.4 ST-8 Fe2MoO4 precursor +C 3[a] 96.2
[a]-experiments with spinel crucibles
The results showed that both prepared Fe2MoO4 and Fe2MoO4 precursor mixture provided
the highest yield during laboratory steel trials, which can be explained by the absence of
molybdenum evaporation from this alloying material in argon atmosphere. These results are
in agreement with thermogravimetric studies, described in previous chapter. It should also
be noted that both Fe2MoO4 and Fe2MoO4 precursor mixtures easily react with iron during
melting. The product particles were found to be strongly adhering to the iron surface in the
case of partially melted samples, which indicated the affinity between iron surface and the
precursor. On the contrary, in the case of CaMoO4, as well as precursors mixtures

34
CaO+MoO3 and MgO + MoO3, the products didn’t have any adhesion to the metal surface
and could easily be separated from the metal after the experiment.
500-g-scale laboratory experiments. The 500-g-scale experiments were carried out as the
second stage of the process development. Post-experiment observations revealed that the
metal had completely melted without any appreciable evidences of crucibles contaminations.
The results of the Mo yield calculations after the samples analysis are shown in Table 4.2.
Table 4.2 – The values of molybdenum yield, obtained during 500-g-scale experiment
Mixture N
Components and their content, % Mo yield, %
1st series 2nd series M1 C-12.5; Fe2MoO4–precursor-87.5 97.7 98.2 M2 C-20.0; MoO3-80.0 93.0 89.7[a] M3 C-15.3; MoO3-61.0; CaO-23.7 76.6 86.7
[a] -There was a leakage of steel from this crucible and the Mo yield obtained is not reliable.
The results showed that M1 (Fe2MoO4 precursor+C) mixture provides the highest yield,
which is in agreement with the smaller scale experiments. The yield from MoO3+C mixture
is approximately the same as for 16-g-scale trials, while for CaO+MoO3+C mixture the yield
is considerably lower. The poor yield and scattering of the results during 500-g-scale trials
for the M3 mixture may be attributed to incomplete reaction between the components of the
mixture and steel.
4.1.5. Industrial trials on steel alloying in 3 ton induction furnace
In the case of plant trials at 3 ton scale, it could be concluded by monitoring the power
consumption that the melting of the scrap started after 30-40 min after small-sized scrap
charging. The heating rate was estimated from this to be 35-50 K per min, which is 3-5 times
higher than for the 500-g-scale laboratory trials. At the same time, considerable flame was
observed, most probably due to CO evolution from the furnace. This was not observed
during usual heats with similar type of scrap but without such alloying mixtures addition.
It should be noted that most of the samples, which were taken after complete scrap melting
but before silicon addition, had poor quality (hollow metal), which resulted in limited
possibilities for chemical analysis. Mainly, the samples after ferrosilicon addition were
considered during the investigation. After the chemical analysis of the samples, the yield of
Mo was calculated for each heat using the formula (4.7). Additionally, the mass of liquid

35
slag was calculated based on known amount of CaO input and CaO concentration in final
slag:
slagCaO
iii
slag w
wmm
∑ ⋅=
, (4.8)
where mslag – slag mass, mi –mass of added material i, wi – CaO content in the added
material i, wslagCaO – CaO content in slag after addition. The results of steel samples analysis
and molybdenum yield together with other parameters calculations are presented in Table
4.3. The slag compositions of the experimental heats are presented in Table 4.4. It is seen
from the Table 4.3 that the concentrations of Mo in slag were very low for all of the heats.
Table 4.3 – The results of steel samples analysis and molybdenum yield calculations
Heat No.
Mix No.
Metal composition, % Calculated parameters
Mo C Mn Si Liquid
steel, kg Slag mass,
kg Mo yield,
% H1 M1 0.9 0.065 0.17 0.13 2936 63.9 89.2 H2 M1 0.91 0.077 0.39 0.29 2917 52.4 91.5 H3 M2 0.94 0.083 0.2 0.15 2894 54.3 92.8 H4 M2 0.93 0.05 0.14 0.015 2891 65.3 92.6 H5 M3 0.93 0.046 0.14 0.002 2884 82.8 92.4 H6 M1 0.992 0.079 0.21 0.26 2922 60.8 97.8
Table 4.4 – The results of slag analysis for the experimental trials
Heat No.
Mix No.
Slag composition, % CaO FeO MnO Al2O3 SiO2 MgO Cr2O3 MoO3
H1 M1 23.6 21.3 15.1 19.1 10.0 4.07 2.97 0.0623 H2 M1 28.8 11.0 12.0 15.9 15.9 7.77 2.32 0.0740 H3 M2 27.8 14.7 13.1 18.0 13.5 5.77 3.12 0.0628 H4 M2 23.1 22.8 13.8 20.8 7.24 3.97 1.47 0.0817 H5 M3 24.2 22.6 13.0 19.5 7.49 7.18 2.05 0.0675 H6 M1 24.8 18.2 14.4 18.2 11.5 5.05 1.87 0.0570
MoO3+C+FeOx mixture (M1). In the case of this MoO3+C+FeOx mixture, 3 heats were
performed with the same charging mixture and the Mo yields were quite scattered depending
on the mixture preparation. For the heats H1(M1) and H2(M1) Mo yield was 89.2 % and
91.5 % respectively. For these heats, large initial pieces of iron oxide were used. Some of
the pieces were more that 10 cm in size. Further, poor mixing because of mixer overloading

36
and partial loss of materials when mixing them without lid could be the reason for the lowest
yield in the case of the first heat H1(M1).
Since it was presumed that larger pieces of iron oxide would result in incomplete formation
of iron molybdate in the mixture due to the low surface area to volume ratio, for the heat
H6(M1) mainly small pieces (below 2 cm in diameter) were taken during mixture
preparation. The yield of Mo for H6(M1) heat reached 97.8 %.
MoO3+C mixture (M2). According to the plant results, the Mo yield for the heat H3(M2) is
92.8 % and for H4(M2), it is 92.6 % and the results are reproducible. The same values
(around 93 %) of Mo yield were obtained during the laboratory tests with 16 g and 500 g
crucible capacities (Tables 4.1 and 4.2).
MoO3+C+CaO mixture (M3). The Mo yield of the heat H5(M3) is 92.4% and the mixture
was tested in only one heat. This yield is closed to the lab results with 16 g heat size (Table
4.1). The lowest Mo yield for the lab results were observed in the case of 500 g crucible
capacity (Table 4.2) experiments. This could be due to the experimental design adopted and
consequent insufficient dissolution of the molybdate formed without getting dissolved in the
metal bath. The high yield of Mo during heat H5 shows that such mixtures might also be
promising as Mo precursors in EAF. Further trials to investigate this are currently under
progress.
4.2. Slag foaming caused by carbonates decomposition
4.2.1. Thermodynamic modeling results
In order to estimate the energy saving effect, the amount of heat, required for the process of
both decomposition and heating of the products from 298 to 1673 K need to be estimated.
The heat capacities were taken into account by using the equation (4.9):
)11
(10)(103
1)(10
2
1)(
12
531
32
621
22
312
2
1TT
dTTcTTbTTadTCT
T
p −⋅−−⋅⋅+−⋅⋅+−= −−∫
, (4.9)
where a, b, c and d are the terms in heat capacity equation, J/K2⋅mol, J/K3⋅mol, J/mol and
J/K4⋅mol respectively.The calculations were also checked using Thermocalc software
(Version S, SGTE Solutions database v.4). The calculated values of decomposition energies
are presented in Table 4.5.

37
Table 4.5 – The results of the calculations of the heat demand for the carbonates decomposition and products heating from 298 to 1673 K
Source of calculations
Dolomite energy demand, J/g Limestone energy demand, J/g
∆Hr298
Products heating
Total ∆Hr1127
Products heating
Total
Thermocalc software
(Version S, SGTE Solutions
database v.4)
- - 3203.3 - - 3225.0
Calculations based on
literature data [30]
1545.4 1568.3[c] 3213.7 1569.1 1059.9[a]
+ 689.9[b]
3318.9
[a] - heating CaCO3 from 298 to 1127 K [b] - heating CaO and CO2 from 1127 to 1673 K [c] - heating CaO, MgO and CO2 from 298 to 1673 K
For further discussions, the calculations carried out by the author based on the Cp values
reported in [30] are used.
4.2.2. Measured energies of decomposition for natural limestone and dolomite
Calibration curves. In the case of well-stirred liquid bath, the temperature decrease,
followed by cold body immersing, should be the same at any point in the liquid and be
dependent only upon the amount of heat transferred. Thus, the rate of temperature changes
should be related only to the heat flux from the slag to the body surface [31]. However, the
experimental profiles of slag temperature change after the addition of the calibration pieces
of iron of the same mass showed different values of temperature drop as well as different
initial slope of the curves (Figure 4.10). The result may have to be explained by the
relatively high values of slag viscosity, which would increase further due to the temperature
decrease after the samples addition. Due to the increase of viscosity and small crucible size,
the convective heat transport may not play a major role in heat distribution inside the slag. In
this case, the rate of temperature decrease in any particular position inside slag should
depend on the relative position of thermocouple to the sample and furnace wall. As the
distance between thermocouple and furnace wall is fixed, again, the rate of temperature
changes should be only a function of distance between the falling sample and thermocouple.
And in the case of the same positions it should be possible to compare the heat effects by the
areas above temperature curves.

38
In the present results, it was also found that the temperature profiles are in agreement with
the model of a sphere heating from the initial temperature Tc to the outer temperature T0.
The analytical solution of this task is considered in [31]. These authors proposed the
following equation for this problem:
2
22
sin)1(2
1
00
R
tn
n
n
eR
rn
nr
RTTT
πκππ
−∞
=∑
−+=, (4.10)
where T - current temperature, T0 - surface temperature, R - sphere radius, r - distance from
the center, t – time, s; κ - thermodiffusivity coefficient, m2/s.
pC
K
ρκ =
, (4.11)
where K – thermal conductivity, W/(m⋅K); ρ - slag density, kg/m3; Cp – slag heat capacity,
J/(kg⋅K).
By using the equation (4.10), one can obtain the description of temperature profile for any
distance from the center of the sphere. From preliminary estimations [31], the experimental
slag heat conductivity was found to be 0.15 W/(m⋅K). Using the following boundary
conditions (at t=0 and r=0 Tc=T0-∆Tmax; at any t and r=R T=T0) together with data on slag
heat conductivity, density and heat capacity, it is possible to estimate the change of
temperature inside a sphere with time. The results of the comparison between calculated and
experimental temperature changes for the calibration experiments with iron tablets are also
shown in Figure 4.10. As a first approximation ∆Tmax was assumed to be equal to the
maximum temperature drop, observed during experiments.
It is clear from Figure 4.10, that, with the lapse of a short time after the dropping of the iron
tablet (t>0.04⋅r2/κ), the change in temperature is in agreement with the model curve. This
would validate that the process of heat transfer can be described by the model of sphere
heating, if time t > 0.04⋅r2/κ.
Thermal analysis. Each experimental curve for sample addition was matched with a
corresponding calibration one of same initial slope in the same series. The examples are
shown in Figure 4.11.

39
Figure 4.10 – The relation between calculated (1-3) and experimental (4-7) temperature profiles for calibration curves at 1673 K: 1 – r/R=0.80; 2 – r/R=0.84; 3 – r/R=0.90. r/R –
dimensionless radius, or the relative distance of a point to the sphere center. Slag properties: thermal conductivity – 0.15 Watt/(m⋅⋅⋅⋅K); density – 3000 kg/m3; heat capacity – 1225 J/(kg⋅⋅⋅⋅K);
∆∆∆∆Tmax – 40 K; R – 0.01 m.
The heat effects of dolomite and limestone decomposition were calculated in relation to
“iron equivalent” by comparison of the areas above calibration and experimental curves
according to the equation:
1
12
S
SSQQ Fefoam
−⋅=
, (4.12)
where Qfoam – heat effect of slag foaming (which corresponds to the endothermic heat due to
the decomposition plus the heat insulation effect due to foam formation), QFe – heat required
for heating of calibration piece of iron to experimental temperature, S1 – the area above the
most suitable calibration curve, S2 – the area above the experimental curve. The amount of
heat, required for iron to be heated, was calculated on the basis of equations (4.9) and (4.13)
[30]:
∑∑∫ ∆+=− tr
T
T
pTT HdTCHH2
1
12
, (4.13)
where HT – substance enthalpy at the temperature T, J/mol; CP – the heat capacity of the
substance, J/K⋅mol; ∆Htr – the enthalpy change for a phase transition, J/mol.

40
a) b)
c) d)
Figure 4.11 – The examples of experimental (1) and calibration (2) curves for dolomite and limestone at 1673 K: a - 1.6141 g of wedge limestone; b – 1.7051 g of round limestone; c – 1.705 g of round dolomite; d – 1.4235 g of wedge dolomite; dash line (3) represents the temperature
decrease according to the model in equation (7) at ∆∆∆∆T=40 K and r=0.7-0.8
The total heat effect of slag foaming due to carbonates decomposition was evaluated on the
basis of the following assumptions:
- the dissolution of CaO and MgO results in 1 mm decrease in diameter for 15 min staying in
slag at 1673 K. Only CaO dissolution has appreciable effect on the system enthalpy change
and the enthalpy change for solid CaO dissolution is - 936 J/g for CaO for the experimental
slag composition at 1673 K as it was found in HS Chemistry software. According to some
investigations, for the similar slag basicity and FeO content [32], the rate of dissolution of
MgO from burned dolomite is few times slower comparing to CaO;
- additions of carbonates do not affect slag properties significantly. Viscosity calculations,
performed with the aid of the models in literature [33], showed that the additions of 3 g of
dolomite and 3 g of limestone should result in decrease of the slag viscosity of
approximately 4.3 % at 1723 K, 4.5 % at 1673 K and 4.7 % at 1623 K. There are no
noticeable changes in slag density at the same time as estimated by the density model
developed in the present laboratory [34];
41
- the area above the thermal analysis curve is largely proportional to the amount of heat,
required both for heating and decomposition of the sample if the relative position of the
sample and thermocouple is the same for all of experiments;
- the only mass change during slag foaming was due to the escape of CO2 gas. The mass
balance for each crucible was checked before and after an experiment. For the temperatures
1623-1673 K, the mass difference was no more than 5 % from the expected mass change.
However, at 1723 K, the agreement became very poor and the results of heat effect
measurements showed big scatter. And a significant amount of oxide powder was found
scattered outside crucibles after the experiment probably caused by the splashing of the slag.
This can only be explained by a vigorous reaction of decomposition at this temperature.
Hence, the results for 1723 K were not considered, and for 1673 K, the results with the
values of decomposition energy, which were found to be 20 % lower than the average value,
were excluded from the consideration to avoid any possible errors. More detailed
information about curve matching technique, assumptions and initial data can be found in
the Supplement 3. The measured and calculated total heats for the carbonates
decomposition, together with possible dissolution effect for CaO, are presented in Table 4.6.
Table 4.6 – Calculated and measured heat effects of dolomite and limestone decomposition
Substance T, K
Calculated carbonate
decomposition energy, kJ/kg
Measured heat of carbonates
decomposition, kJ/kg
Measured heat of carbonates
decomposition, % from
calculated values
Measured heat of carbonates
decomposition together with CaO dissolution effect[a] , % from calculated
values Min Max From To From To
Dolomite 1623 3146.6 1731.9 2187.6 53.0 69.5 56.3 71.8 1673 3213.7 1801.6 2370.5 54.9 74.0 59.3 78.8 1723 3281.5 492.7 689.8 15.0 21.0 - -
Limestone 1623 3251.7 2005.3 2278.8 58.9 66.9 63.2 73.0 1673 3318.9 1896.4 2180.9 55.6 62.8 61.7 70.2 1723 3386.9 492.7 689.8 14.5 20.4 - -
[a]- the effect for CaO dissolution was calculated assuming 1 mm decrease in diameter (for spherical
shape) or in sizes (for wedge shape) of the samples within 15 min of the experiment duration. The
enthalpy of CaO dissolution was calculated to be 936 kJ/kg.
The results showed that the experimental values of decomposition energies are in the range
of 55-74 % from the theoretical ones. The enthalpy of CaO dissolution would affect the

42
values by 59-79 % for dolomite and 62-70 % for limestone from theoretical energy demand
at 1673 K. It should be noted that at 1623 K, no decrease in samples size was observed, thus,
the CaO dissolution effect should be much smaller. Further, the energy of decomposition
seems to be approximately the same both for dolomite and limestone, which differ by about
2 times in CaO content. The differences between measured and calculated values of
carbonates decomposition energies are attributed mostly to the energy saving effect of slag
foaming on total energy balance.
4.2.3. Plant data analysis
As it was found from the analysis of the data on the first step of the plant investigation, both
raw dolomite and limestone lead to increase in energy demand in an EAF. However, the
effect is different depending on relative time for carbonate addition. If carbonate is added
during early stage of heat (when tQ < 33 %), when the specific energy consumption is around
2 times higher compare to the addition of carbonates into EAF at the later stage (Figure
4.12). In the case of later addition (when tQ > 50 %), the heat effects for limestone and
dolomite (2255 and 2264 kJ/kg respectively, Figures 4.12c and 4.12d) are quite close to the
values, determined during laboratory experiments (Supplement 4). That means the saving of
at least 30 % of energy, required for carbonate decomposition, when carbonates are added at
the later stage of a heat (liquid steel bath) in an EAF.
On the second step of the plant trials, the studies were focused on the dolomite influence on
the energy consumption. Two series of trial heats (totally 9 heats with the controlled
amounts of lime and dolomite) were conducted. The parameters and results of the trial (1st-
2nd series) and reference (3rd series) heats are presented in Table 4.7 and the mean values of
the results – in Table 4.8.
It was found from the trial heats with later dolomite addition that the partial substitution of
lime with raw dolomite does not lead to the increase in energy consumption. At the same
time, it is also important to keep a certain amount of slag on the metal surface, otherwise the
energy demand can even increase even if the specific consumption of lime will be low
(series N 2).
One additional benefit from the dolomite usage in an EAF is the CO2 involvement as an
oxidant gas in the process. If dolomite is decomposed inside the slag, it can act as an
additional oxidant gas for carbon in steel:
[C] + {CO2} = 2{CO} (4.14)

43
Further, in-situ CaO formation and additional mixing because of gas evolution can promote
other reactions. For example, plant trial results showed a small but definite further-lowering
of phosphorus concentration to about 0.0033 % in steel in the case of partial lime
substitution with dolomite.
Table 4.7 – The parameters of the trial and reference heats
Series N
Heat N
Slagformers supply, kg Normalyzed energy
demand, J/ton (x10-9)
Arc operation time, min
Liquid steel
weight, ton
Oxygen supply, m3/ton
Fuel gas
supply, m3/ton
Lime Burned
dolomite Raw
dolomite
1
1 3559
980 1.375 41 114 3119 977 2 3500
1080 1.354 40 113 3217 970
3 3621
1070 1.316 42 116 2903 945 4 3634
1070 1.533 44 106 2950 919
2
5 3041
1200 1.457 45 110 2846 1078 6 3030
980 1.461 47 114 3065 1148
7 3064
840 1.266 48 108 3176 1097 8 3030
770 1.310 44 120 3148 1180
9 3039
640 1.574 46 109 3164 1172
3
10 3561 0
1.172 44 111 3143 932 11 3802 207
1.344 43 109 2994 1089
12 3704 191
1.218 43 114 2881 1069 13 3904 0
1.065 44 120 3058 1090
14 3932 186
1.461 43 109 3398 1283 15 3915 81
1.663 47 103 3155 1153
16 3936 89
1.671 47 112 3433 1190 17 3839 89
1.517 46 108 3258 1182
18 3834 575
1.560 45 105 3035 1083 19 3467 555
1.288 44 118 3124 1108
Table 4.8 – The mean values of the trial and reference heats
Series N
Lime, kg/ton
Dolomite, kg/ton
Total slagformers,
kg/t
Heat duration, min
Fuel gas,
m3/ton
Oxygen, m3/ton
Normalyzed energy,
J/ton (x10-9) 1 31.9 9.4 36.6[b] 41.6 952.8 3047.3 1.394 2 27.1 7.9 31.1 46 1135 3079.8 1.413 3 34.3 2.2[a] 36.5 44.6 1118.1 3147.9 1.396
[a] - for the reference heats only burned dolomite was used in addition to lime; [b] - the value was calculated by taking into account the raw dolomite mass change after
decomposition.

44
a) b)
c) d)
Figure 4.12 – Dolomite and limestone influence on the energy demand per liquid steel ton in EAF with different addition time: a – litestone, tQ < 33 %; b – dolomite, tQ < 33 %; c –
limestone, tQ > 50 %; d – dolomite, tQ > 50 %
4.2.4. Studies on the kinetics of slag foaming and modeling of the foam height
changes
Typical X-ray images obtained in the present study with the addition of 1-3 mm fractions of
limestone are shown in Figure 4.13. The slag volume under the foam in these figures has
been divided into two parts: the upper one, termed the “foaming layer”, had a thickness of
the order of 3-6 mm corresponding to 25 – 50 % of the of the total slag depth. The thickness
of the foaming layer was found in the present experiments to be dependent on the depth of
immersion of the carbonate particles into the slag. The second layer was found to be beneath
the upper layer, extending down to the crucible bottom. These two layers are also marked in
Figure 4.13.

45
Figure 4.13 – The image of slag foaming, observed in X-ray imaging system: 1 – slag bottom
layer; 2 – “foaming layer”; 3 – slag foam
According to the structural classification of slag foams, as presented by earlier workers [2],
the foaming layer can be attributed to “non-drained spherical-bubble foam” and situated
between bulk liquid and polyhedral drained foam. In the current work, the foaming layer is
considered to have uniform temperature in a view of the strong stirring. The slag bottom
layer functions as the heat transfer medium between crucible bottom as well as the sides and
the foaming layer due to the temperature gradient. The dimensionless Rayleigh number,
calculated for the bottom layer in the present experimental system is in the range of 1000-
7000, which shows that the convection heat transfer in slag doesn’t play significant role
[35].
In the present work, an attempt was made to describe the foaming phenomenon by the model
approach, developed by the present author. In the model (termed here as “shell” model), the
rate of the foaming reaction is determined by the rate of heat transfer between foaming layer
and decomposition reaction front position within a granule of limestone. According to Hills
[36], the heat transfer is the major factor, affecting the decomposition of limestone and such
a model seems to be more suitable for the foaming descriptions.
The lowering of the average temperature of the foaming layer for a certain time interval is
governed by the balance of energy required for carbonate decomposition and delivered from
the bottom layer and crucible walls by heat transfer and is calculated as:
..22
)(
lf
trdec
VCp
QQT
ρ−
=∆, (4.16)

46
where Cp2 – slag heat capacity, J/(kg⋅K); ρ2 – slag density, kg/m3; Vf.l. – the volume of
foaming layer, m3; Qdec and Qtr – the amounts of energy consumed for carbonate
decomposition and transferred from the bottom layer respectively, which can be calculated
as:
))(( 12..2 ttTTKh
SQ lfbwtr −−=
, (4.17)
where S – the slag surface area, m2; K2 – slag thermal conductivity, W/m⋅K; Tbw – slag
temperature at the bottom and at the walls, K; t2-t1 – time interval duration, s; h – the depth
of bottom layer, m. Since the contact area between foaming layer and crucible walls is
smaller than with bulk slag, the heat transfer from the crucible walls to foaming layer was
neglected in order to simplify the calculations.
Because of fast decomposition process, it is assumed that CaO remained undissolved and the
thickness of CaO shell increases as the reaction proceeds. The temperature of limestone
decomposition is constant and equal to 1171 K at the atmospheric pressure.
Slag heat conductivity should be in the range of 0.15-0.5 W/(m⋅K) for the systems, with
compositions close to those chosen in present experiments [25]. The heat conductivity value
of 0.15 W/(m⋅K) was found to give a good agreement in describing experimental
temperature profiles, and, thus, was chosen for the model.
The heat transfer from bulk slag to spherical surface of particle can be calculated [35]:
))((4 12..2 ttTTRKQ surflfsl −−= π , (4.18)
where Tsurf – the surface temperature of CaO/CaCO3 granule, K; R – sphere diameter, m.
The heat transfer within the CaO shell can be described as [35]:
)11
(
))((4 12
Rr
ttTTKQ decsurf
effCaO
sp
−
−−=
π
, (4.19)
The influence of CaO porosity on the effective thermal conductivity ( effCaOK ) can be estimated
by using Maxwell-Eucken expression [37]:
P
PKK CaO
effCaO β+
−=1
1
, (4.20)

47
where P – estimated porosity (which is admittedly approximate); β – a pore shape factor,
which was taken as 2/3 for randomly dispersed cylindrical pores. The porosity was
calculated as the ratio:
b
ebPρ
ρρ −=
, (4.21)
where ρb – bulk density of the material; ρe – density, determined experimentally.
It was found that the limestone samples didn’t change their size after decomposition; hence
the density of CaO layer was calculated from measured density of limestone considering no
volume change during decomposition. Initial parameters used for modeling are presented in
Table 4.9. Assuming that Qsl = Qsp = Qdec, and that the heat of limestone decomposition
(Qdec) includes both change in reaction enthalpy and substances heating, it is possible to find
intermediate temperature Tsurf and thus the amount of heat transferred inside the particle for
each time interval. The calculations were repeated for each 1 second interval to recalculate
the temperature of “foaming layer”, CaO shell thickness and decomposition rates. The
sample of limestone was approximated to the spherical particles of the following size
distribution fraction, viz. 0.5 mm radius particles – 20 % (by mass), 1.0 mm – 60 %, 1.5 mm
– 20 %. The calculations were performed simultaneously for a stated amount of each
fraction. The results from the shell model approach is presented in Figure 4.14.
Table 4.9 – The values of parameters, used for modeling of the kinetics of slag foaming
Thermophysical parameter Value Source Thermophysical parameter Value Source
Slag density, kg/m3 3000 [33] [b] Thermal conductivity of
bulk CaO, W/m⋅K 0.69 [16]
Slag heat capacity, J/kg⋅K 1238.4 TS [b] Thermal conductivity of
slag, W/m⋅K 0.15 [17]
Limestone decomposition energy, kJ/kg
3400 [b] CaO effective thermal conductivity, W/m⋅K
0.224[a]
"Foaming layer" depth, m 6.0⋅10-3 [a] Limestone decomposition
temperature, K 1171 K [16]
Limestone density, kg/m3 2700 [a] Slag viscosity, Pa⋅s 0.756 TS [b] [a]- values determined either experimentally or estimated directly from experimental data; [b]- values calculated using known models and available data or Thermoslag © software (TS).
The discontinuities in the curve for the model (Figure 4.14) are caused by combining the
results from three fractions of sharply-defined size (0.5, 1.0 and 1.5 mm). In real system the
size distribution of particles is continuous which should result in more smooth profile.

48
Figure 4.14 – Comparison of the superficial gas flowrate changes, calculated by “shell” model
(line 1) and experimental foam height changes (line 2)
It was found, by comparison between calculated CO2 flow rate and registered foam height
(Figure 4.15), that the foaming index is around 0.37 s for system studied, which is much
lower than that predicted from Fruehan model [3] and more close to the values, obtained by
Niu et al. for CaCO3 decomposition in borate melt (1.02-1.32 s) [17].
Figure 4.15 – The relation between predicted CO2 flowrate (“shell” model ) and measured
foam height
This may be expected since Fruehan model is valid for static conditions while the present
experiments as well as the results of Niu et al. [17] are under dynamic conditions.
These results support the conclusions from [38-39] about limited possibilities of foaming
index concept when describing slag foaming produced by chemical reactions.

49
5. Summary and conclusions
Fe2MoO4 was prepared by using commercial grade materials in inert Ar atmosphere.
Thermogravimetry, gas chromatography and high temperature XRD studies of Fe2MoO4
formation showed that the reactions in initial mixture start after 873 K and include at least 2
stages. The first stage can be attributed to the Fe2O3 reduction to form FeO, while the second
one can be linked to the reduction of MoO3 to MoO2. The formation of Fe2MoO4 from
MoO2 and FeO requires higher temperatures or longer soaking time at 1373 K. The
investigations of the direct reduction of the mixture of Fe2MoO4 precursors to metallic
phases by adding excess carbon using gas chromatograph analysis showed that the reduction
proceeds in 2 steps. During the first one, only CO2 could be detected while CO formation
was noticed during the second step of reduction.
The evaporation rate of pure MoO3 was studied by TGA and compared with the evaporation
rates from mixtures of MoO3 with CaO, CaCO3, MgO. It was found that MoO3 can be
stabilized by mixing with CaO, MgO or CaCO3 and heating the mixtures, which would
result in the formation of the respective molybdate. The formation of CaMoO4 from the
mixtures of MoO3 with CaO or CaCO3 starts after 773 K (as confirmed by high temperature
X-ray diffraction studies) and is completed around 973 K.
The Mo yield by use of three different Mo alloying mixtures (MoO3+C; MoO3+C+FeOx; and
MoO3+C+CaO) was tested both in laboratory and industrial experiments. During laboratory
experiment, both in 16- and 500-g-scale trials, Fe2MoO4 precursor mixture
(MoO3+C+FeOx), showed the Mo yield is up to 98 %, which can be explained by the
absence of molybdenium evaporation from this substance.
During industrial trials, it was found that for the Fe2MoO4 precursor mixture
(MoO3+C+FeOx), the Mo yield was scattered between 89 % and 98 % depending on the
granules size of iron oxide. The highest Mo yield of 97.8 % was achieved only by use of
small-sized iron oxide and it is close to the results found during laboratory experiments (98
%). For the mixture of (MoO3+C), the yield was found to be around 93 % both for
laboratory and industrial treatment. In the case of the mixture M3 (MoO3+C+CaO), the Mo
yield is 92.4 % obtained from industrial trials which is much higher than that obtained from
laboratory studies which is only 77 %.
50
A new crucible design for a single thermocouple thermal analysis was used for studying the
heat effect of slag foaming with carbonates addition by following the temperature changes.
The method enables the study of the full decomposition inside the slag. The technique was
tested in the case of dolomite and limestone decompositions in the temperature range of
1623-1723 K with a slag of the composition: CaO - 31 %; SiO2 - 31 %; MgO - 7 %; Al2O3 -
6 %; FeO - 25 %. The lower temperature of the measurement was limited by poor heat
conductivity of the slag, while the upper limit was set by very high speed of the
decomposition of the carbonates, which can result in partial slag splashing and/or unreacted
carbonate particles blowing out of the crucible.
The heat effects of dolomite and limestone decompositions were determined at 1623 and
1673 K. No influence of sample shape on decomposition energy was found for both
limestone and dolomite at 1623 and 1673 K. There is no appreciable influence of carbonate
type as well. It was found that the decomposition energies for dolomite and limestone for the
studied slag composition are in the range 56-79 % of theoretical values, which is attributed
to the energy saving effect of slag foaming.
The kinetics of slag foaming by limestone particles was studied at 1773 K with the aid of X-
ray imaging system. A heat transfer model was implemented to describe the decrease in
foam height with time on the basis of the lowering of the average temperature and CaO shell
formation during decomposition reaction.
The energy impacts for limestone and raw dolomite additions were studied in 100-ton EAF.
It was found that, in the case of carbonate addition to liquid steel bath, the heat effects for
limestone and dolomite (2255 and 2264 kJ/kg respectively) were 70 % of the theoretical
values. Carbonate additions along with scrap charging were found to result in larger energy
losses. It was found from the trial heats with dolomite addition to liquid steel bath that the
partial substitution of lime with raw dolomite does not lead to the increase in energy
consumption.

51
6. Future work
It is planned to test the influence of the size of iron oxide pieces on the yield of Mo in 5 ton
induction furnace at Uddeholms AB, Hagfors, Sweden. After that, the yield of Mo during
steel alloying in 60 ton EAF will be tested at the same company.
The reduction of mixture MoO3 and FeOx by carbon will also be studied. The current results
show that two separate steps of mass changes were found during the reduction. It will be
interesting to recognize the nature of these steps and discover intermediate products in the
process. To achieve these aims, high temperature XRD experiments are planned in Ivan
Franko National University (Lviv, Ukraine).
52
References
1. C.F. Cooper and J.A. Kitchener: J. Iron and Steel Institute, 1959, vol. 193, pp. 48-55.
2. C.F. Cooper and J.A. Kitchener: Quarterly reviews Chem. Soc., 1959, vol. 13, pp. 71-97.
3. R.J. Fruehan and K. Ito: Metallurgical and Materials Transactions B, 1989, vol. 20B, pp.
509-514.
4. Kirk-Othmer: Encyclopedia of Chemical Technology, 4th ed., Vol. 9., 1952.
5. H. Kleykamp and V. Schauer: J. Less-Common Met., 81 (1981), 229.
6. K. Koyama, M. Morishita, T. Harada, and N. Maekawa: Metallurgical and Materials
Transactions B, 34B (2003), No 5, 653.
7. A.N. Zelikman: Metallurgy of rare metals, Jerusalem, 1966.
8. L. Norberg and B. Rydstad: Jernkontorets annaler, 160 (1976), No 4, 191.
9. T. Saburi, H. Murata, T. Suzuki, Y. Fujii, and K. Kiuchi: J. of Plasma and Fusion
Research, 78 (2002), No 1, 3.
10. L. Zhang: Applied catalysis A – General, 117 (1994), No 2, 163.
11. L. Dazhuang, Z. Jianhong, T. Huimin, and H. Dongxia: Reaction Kinetics and Catalysis
Letters, 62 (1997), No 2, 347.
12. D. Liu and J. Li: Chemical Reaction Engineering and Technology, 5 (1989), No 3, 19.
13. E.M. Levin and H.F. McMurdie: Phase diagrams for ceramists. Supplement, Columbus,
The American Ceramic society, 1975.
14. E.K. Kazenas: Termodinamika ispareniya dvoinyh oksidov, Moskow, Nauka, 2004.
15. R.J. Fruehan and J. Kerr: Metallurgical and Materials Transactions B, 2004, vol. 35, pp.
643-50.
16. S. Chu, Q. Niu, K. Wu, and Y. Wang: ISIJ international, 2000, vol. 40, pp. 549-53.
17. Q. Niu, S. Chu, K. Wu, and Y. Wang: The Chinese Journal of Process Engineering,
2001, vol. 1, pp. 262-267.
18. C.B. Howard: Modern Welding Technology, 4th ed., NJ, Prentice Hall, 1998.
19. V.V. Fedina, O.I. Malahova, and A.V. Sazonov: Sovremennye naukoemkie tehnologii,
2005, vol. 2, pp. 71-72.
20. R.J. Fruehan: The Making, Shaping and Treating of Steel, 11th ed., AISE Steel
Foundation, Pittsburgh, 1998, 767 p.
21. D.M. Richard, C. MacRosty, and L.E. Swartz: // Ind. Eng. Chem. Res., 44 (2005), 8067–
8083.

53
22. D. Guo and G.A. Irons: Proceedings of the Third International Conference on CFD in
the Minerals Process Industries; CSIRO, Melbourne, Australia, 2003; pp 651-659.
23. R. Morales, I. Arvanitidis, D. Sichen, and S. Seetharaman: Metallurgical and Materials
Transactions B, 33B (2002), 589.
24. E.F. Osborn and M. Arnulf: Phase equilibria among oxides in steelmaking. – Mass,
Addison-Wesley publishing company, 1965, 236 p.
25. Slag Atlas, 2nd ed., VDEh Verlag Stahleisen GmbH, Düsseldorf, Germany, 1995, 636 p.
26. Z.T. Zhang, T. Matsushita, W.C. Li, and S. Seetharaman: Metallurgical and Materials
Transactions B, 2006, vol. 37B, pp. 421-29.
27. S.M. Grigor'ev and V.P. Kolyada: Stal', (1996). No 12, 32.
28. I. Barin, O. Knacke, and O. Kubaschewski: Thermochemical properties of inorganic
substances, Berlin-Heidelberg-New York, Springer-Verlag, 1973.
29. C.K. Gupta: Chemical Metallurgy: Principles and Practice, Weinheim, Wiley-VCH,
2003.
30. Handbook of chemistry and physics / R.C. Weast, 55th ed., Cleveland, CRC press, 1974-
1975, pp. D58-D59.
31. H.S. Carslaw and J.C. Jaeger: Conduction of Heat in Solids, 2nd ed., Oxford, At the
Clarendon press, 1959, pp. 230-234.
32. M. Nobuhiro, S. Hiroyuki, and K. Shin-Ya: Bulletin of the Institute for Advanced
Materials Processing Building, IMRAM, Tohoku University, Japan, 2007, vol. 63, pp.
40-45.
33. S. Jung and R.J. Fruehan: ISIJ International, 2000, vol. 40, pp. 348–55.
34. M. Persson, J. Zhang, and S. Seetharaman: Steel Research International, 2007, vol. 78,
pp. 290-98.
35. F.D. Incropera and D.P. DeWitt: Fundamentals of heat and mass transfer, N.Y., Wiley,
2006, 997 p.
36. A.W.D. Hills: Metallurgical and Materials Transactions B, 1975, vol. 6B, pp. 481-82.
37. F. Lin and J.D. Ford: Canadian journal of chemical engineering, 1984, vol. 62, pp. 125-
34.
38. A. Kapilashrami, A.K. Lahiri, M. Gornerup, and S. Seetharaman: Metallurgical and
Materials Transactions B, 1989, vol. 20B, pp. 145-48.
39. Kapilashrami, M. Gornerup, A.K. Lahiri, and S. Seetharaman: Metallurgical and
Materials Transactions B, 2006, vol. 37B, pp. 109-11.


