ENERGY AND ECONOMIC VALUE OF NON- RECYCLED PLASTICS …€¦ · · 2014-04-17EEC Study of...
33
EEC Study of non-recycled plastics-August 2011 1 ENERGY AND ECONOMIC VALUE OF NON- RECYCLED PLASTICS (NRP) AND MUNICIPAL SOLID WASTES (MSW) THAT ARE CURRENTLY LANDFILLED IN THE FIFTY STATES A study by N.J. Themelis, M.J. Castaldi, J. Bhatti, and L. Arsova August 16, 2011
Transcript of ENERGY AND ECONOMIC VALUE OF NON- RECYCLED PLASTICS …€¦ · · 2014-04-17EEC Study of...

EEC Study of non-recycled plastics-August 2011
1
ENERGY AND ECONOMIC VALUE OF NON-RECYCLED PLASTICS (NRP) AND MUNICIPAL
SOLID WASTES (MSW) THAT ARE CURRENTLY LANDFILLED IN THE FIFTY STATES
A study by
N.J. Themelis, M.J. Castaldi, J. Bhatti, and L. Arsova
August 16, 2011
EEC Study of non-recycled plastics-August 2011
2
ENERGY AND ECONOMIC VALUE OF NON-RECYCLED PLASTICS (NRP) AND MUNICIPAL SOLID WASTES (MSW) THAT ARE CURRENTLY
LANDFILLED IN THE FIFTY STATES
EXECUTIVE SUMMARY
Mechanical recycling of plastics has continued to grow in the United States, with 2.1 million tons of plastics recycled in 2009. This includes recovery of used plastics from polyethylene terephthalate (PET), high density polyethylene (HDPE) bottles, non-bottle rigid containers, and some flexible packaging. However, despite the efforts of many communities to source-separate plastics, less than 15% of the U.S. post-consumer plastics are being diverted from landfills by means of recycling and energy recovery. Therefore, while continuing its efforts to increase plastics recycling, the American Chemistry Council (ACC) is also seeking ways to recover more of the energy value of non-recycled plastics (NRP) in the form of electricity, heat, or petrochemical feedstock. Landfilling of NRP constitutes a loss of a valuable energy resource. Capturing the energy value of non-recycled plastics will contribute to sustainable development and enhance national energy security.
The Plastics Division of ACC requested the Earth Engineering Center of Columbia University (EEC) to quantify the amount of plastics discarded in each state and their disposition to materials recovery (recycling), energy recovery in waste-to-energy plants (WTE), and to landfills. EEC was also asked to calculate the energy value of NRP currently going to landfills and identify ways for recovering the energy content of this valuable energy resource.
Key Findings
The results of this study showed that 6.5% of the used plastics generated in the U.S. are recycled, 7.7% are combusted with energy recovery, and the remaining 85.8% are landfilled. The states closest to sustainable waste management of plastics in 2008, by complementing recycling with energy recovery, are Connecticut, Massachusetts, Hawaii, Maine, Virginia, and Minnesota; the diversion rates of NRP from landfills in these states, by recycling and combustion with energy recovery, range from 65% for Connecticut to 32% for Minnesota.
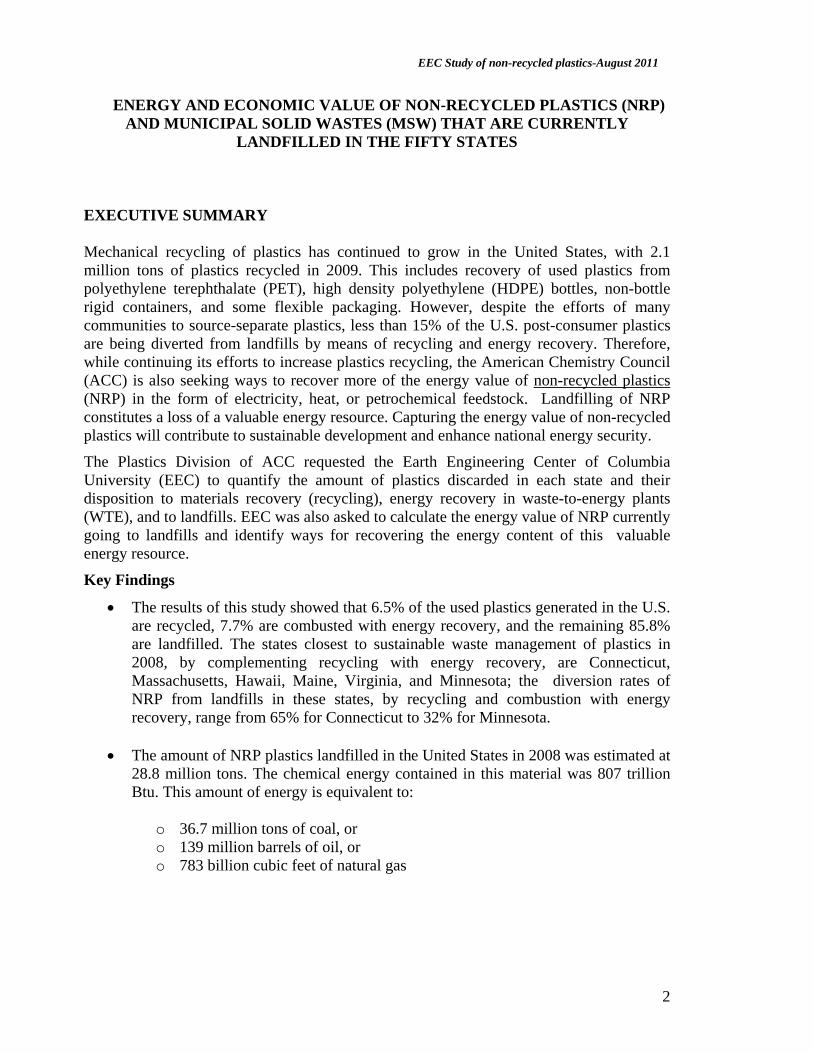
The amount of NRP plastics landfilled in the United States in 2008 was estimated at 28.8 million tons. The chemical energy contained in this material was 807 trillion Btu. This amount of energy is equivalent to:
o 36.7 million tons of coal, or o 139 million barrels of oil, or o 783 billion cubic feet of natural gas

EEC Study of non-recycled plastics-August 2011
3
Hypothetically, if all the NRP that are currently landfilled were source-separated and converted by pyrolysis to a fuel oil, they would produce an estimated 87 million barrels of oil per year (3.6 billion gallons), enough to power six million cars for one year.
If all the NRP that are landfilled annually were to be source-separated and used as fuel in specially designed power plants, the electricity produced would be 52 million MWh, enough to supply 5.2 million households. This would also reduce U.S. coal consumption by as much as 34 million tons.
Hypothetically, if 100% of the landfilled municipal solid wastes (MSW) were diverted from landfills to new WTE power plants, they would reduce coal consumption by 108 million tons and produce 162 million MWh of electricity, enough to power 16.2 million households for one year.
This study also examined the effect of new WTE capacity on reducing coal consumption in states that now import large amounts of coal. As stated above, one ton of MSW used as fuel in new WTE plants would produce the energy equivalent of about 0.4 tons of coal. Accordingly, 25% diversion of MSW currently landfilled to new WTE plants would avoid the mining of 27 million tons of coal and as much as 270 million tons of overburden; 100% diversion of current landfilling by means of new WTE capacity would reduce coal mining by 108 million tons of coal, nearly 10% of the U.S. coal consumption.
Lastly, increased WTE capacity would reduce the carbon footprint of waste management in the U.S. For example, a 25% diversion of mixed biomass and NRP in MSW from landfills to new WTE facilities will result in greenhouse gas (GHG) reduction of 35 to 70 million tons of carbon dioxide equivalent, depending on the degree of landfill capture in present landfills.

EEC Study of non-recycled plastics-August 2011
4
TABLE OF CONTENTS
EXECUTIVE SUMMARY 2
TABLE OF CONTENTS 4
LIST OF FIGURES 5
LIST OF TABLES 5
INTRODUCTION 6 1.1 The need for this project 6 1.2 The project team 6 1.3 Scope of work 7 1.4 Methodology 8
2 ESTIMATE OF U.S. GENERATION OF PLASTIC WASTES 8
3 ESTIMATE OF MSW RECYCLED, COMBUSTED AND LANDFILLED IN EACH STATE 9
4 ESTIMATE OF PLASTICS RECYCLED, COMBUSTED, AND LANDFILLED IN EACH STATE 12
4.1 Tons of plastic wastes generated in each state 12 4.2 Tons of plastic wastes recycled in the U.S. 12 4.3 Tons of plastic wastes recycled in each state 13 4.4 Tons of plastic combusted in each state 15 4.5 Estimate of plastic wastes landfilled 15 4.6 Results of calculations 15
5 POTENTIAL FOR ENERGY RECOVERY FROM NRP THAT ARE NOW LANDFILLED 18
5.1 Energy value of non-recycled plastics 18 5.2 Energy equivalence of NRP to coal, oil, and natural gas 19 5.3 Transforming of NRP to oil by means of pyrolysis 23 5.4 Potential of using source-separated NRP in dedicated power plants 24 5.6 Greenhouse gas (GHG) benefit of increasing WTE capacity 26
CONCLUSIONS 29
REFERENCES 30
APPENDIX 1 31 a) Characterization of U.S. Plastic Stream 31 b) Coal consumption and imports by state 32 c) 33 c) Annual electricity consumption in U.S.: 10,656 kWh/household 33

EEC Study of non-recycled plastics-August 2011
5
LIST OF FIGURES
Figure 1 Plastic wastes generated and recycled since 1960 6
Figure 2 The EEC Hierarchy of Waste Management 7
Figure 3 Comparison of EPA “Facts and Figures” and SOG data 10
Figure 4 Tons of MSW landfilled in fifty states 11
Figure 5 Fraction of plastic recovered as materials or energy in each state 16
Figure 6 Position of each state on the "ladder" of sustainable management of plastics 17
Figure 7 Comparison of heating value of NRP to that of other fuels 20
Figure 8 Potential for replacing coal in states landfilling more NRP 22
Figure 9 Potential for replacing coal in states landfilling less NRP 22
Figure 10 Potential for NRP to replace coal in states that import coal 23
Figure 11 Potential for synthetic oil production by pyrolysis of source separated NRP 24
Figure 12 Potential for replacing coal by diverting 100 % and 25 % of MSW from landfilling to WTE 25
Figure 13 Tons of coal imported and tons of NRP-MSW mix landfilled in the fifty states 26
Figure 14 GHG benefit of diverting 25% and 100% of MSW landfilled to WTE 27
Figure 15 Electricity production by diverting 25% and 100% of present landfilling to new WTE facilities 28
Figure 16 Value of electricity produced by diverting 25% of present landfilling to new WTE facilities 28
LIST OF TABLES
Table 1 Generation, recycling, and disposal of plastics in the U.S. in 2008 9
Table 2 MSW composition studies at various states 9
Table 3 MSW generated, recycled, combusted and landfilled in the fifty states 11
Table 4 Estimate of 2008 Plastic Recycling by EPA and ACC 12
Table 5 2008 distribution of MSW recycled and MRF capacity in the fifty states 13
Table 6 Calculation of Lower Heating Value of Non-recyclable Plastics in Municipal Solid Waste 19
Table 7 Fossil fuel equivalent quantities to tons of NRP landfilled in each state 20
Table 8 Composition of plastic waste stream of California (2003) 31
Table 9 2009 U.S. coal consumption and production by state, 32

EEC Study of non-recycled plastics-August 2011
6
INTRODUCTION
1.1 The need for this project
Over the years, the rate of plastics recycling in the United States has increased, reaching 2.1 million tons by 2009; the progress made in recycling plastics and the obstacles in recycling some plastic packaging are described in detail in the Columbia University M.S. thesis of Jawad Bhatti (15). The American Chemistry Council (ACC) is seeking ways to reduce the amount of plastics landfilled and complement mechanical recycling by recovering the energy value from the millions of tons of post-consumer plastics that are currently being landfilled.
As the United States seeks alternative fuel sources, projects like this – which help quantify the scale and availability of an energy source – are crucial to helping identify renewable fuel sources for policy makers.
Figure 1 Plastic wastes generated and recycled since 1960 (20)
The ACC is seeking to quantify the energy value and potential economic value of non-recycled plastics (NRP) that are mixed in municipal solid wastes (MSW) and currently not used for energy recovery via thermal treatment technologies (e.g. mass burn, RDF, SRF, gasification, pyrolysis, etc.). Since plastics have an energy value higher than coal, landfilling of non-recycled plastic wastes constitutes a loss of an important energy resource. The Earth Engineering Center of Columbia University was engaged by ACC to conduct a scientific study of this subject, the results of which are presented in this Report.
1.2 The project team
The Earth Engineering Center of Columbia University (EEC; ref. 16) is an academic research group recognized internationally for its extensive research and publication record on materials and energy recovery from solid wastes. EEC also conducts the bi-annual
Plastics Generated & Recovered in MSW (millions of tons)
Plastics Generated
Plastics Recovered

EEC Study of non-recycled plastics-August 2011
7
BioCycle/Columbia survey of waste generation and management, the results of which are used by EPA in estimating greenhouse gas (GHG) effects of waste management (17). EEC has also collaborated with the Office of Energy Conservation and Recovery of EPA in the development of the new EPA web page on Energy Recovery from Wastes.
Since its foundation in 1997, EEC has sponsored dozens of graduate research theses on all aspects of waste management, especially those relating to reducing the carbon footprint of waste management by recovering energy, in the form of electricity, heat and fuels. This research has led to many scientific and technical papers (5). EEC has a wide global presence through its Waste-to-Energy Research and Technology Council (WTERT, www.wtert.org) an academic-industrial consortium sponsored by the major waste management companies in the U.S. and abroad. WTERT has sister organizations in Brazil (www.wtert.br), China (www.wtert.cn), Germany (www.wtert.eu), Greece (www.wtert.gr), and Japan (www.wtert.jp). Other units are under development in Argentina, Chile, France, Italy, India and the U.K.
The guiding principle of all EEC research is that responsible management of wastes must be based on science and the best available technology and not on ideology and economics that exclude environmental costs. The Research Associates of EEC include Columbia engineers from various disciplines as well as specialists from other universities and organizations, on whom EEC can call for technical advice as required. Figure 2 shows the Hierarchy of Sustainable Waste Management developed by EEC (18).
Figure 2 The EEC Hierarchy of Waste Management (18)
1.3 Scope of work
The stated objectives of this study were to identify and collect information on non-recycled plastics (NRP) that are currently landfilled in the 50 states of the Union; and then quantify the potential energy and economic value of recovering all this material.

EEC Study of non-recycled plastics-August 2011
8
1.4 Methodology
The EPA 2008 report of post-consumer plastics divides used plastics into several categories that add up to a total of 30.2 million tons. However, the actual tonnage may be higher, because of imports from China and other countries. Our extrapolation of data from a detailed characterization of plastics in the MSW of California to the U.S. population showed that the U.S. generation of used plastics in 2008 was at least 33.6 million tons which is the tonnage used in this study.
The national amount of discarded plastics in 2008 (33.6 million tons) was then apportioned among the fifty states by population. The distribution of recycled plastic volumes among the fifty states was based on state total recycling rates and also on total capacity of Materials Recovery Facilities (MRF) within a state. In most cases, the calculated values of tons of plastic recycled in a state by these two methods were in good agreement.
The tonnage of plastics combusted with energy recovery in states that have WTE plants was calculated by assuming that the reported MSW to WTE plants contained 10% plastic; this was a conservative estimate in view of published characterization studies in several states and the EPA estimate of plastics concentration in the MSW stream (see Section 2). Finally, the tonnage of plastics landfilled in a state was obtained by subtracting plastics recycled and combusted from the estimate of plastics discarded in each state:
Tons of NRP to LF = tons of plastics discarded - tons plastics recycled - tons of plastic combusted in WTE plants
The results of the study showed that of the 33.6 million tons of post-consumer plastics, 2.2 million tons (6.5% of total plastics in MSW) were recycled, 2.6 million tons (7.7%) were combusted with energy recovery, and 28.9 million tons (85.8%) were landfilled.
2 ESTIMATE OF U.S. GENERATION OF PLASTIC WASTES Table 1 shows that the EPA reported (19) that about 30 million tons of used plastics were generated in the U.S. On the other hand, various MSW composition studies conducted across the nation (Table 2, ref. 1-12) have shown that municipal solid wastes (MSW) contain anywhere from 9.6% (California) to 17% (New York) of non-recycled plastics (NRP). Also, EPA has reported that, on the average, U.S. MSW contains 12% plastics; if this number is applied to the recorded tonnage of MSW landfilled and combusted (296 million) in the U.S. (Columbia/BioCycle State of Garbage survey of 2008 data; ref. 14), the calculated tonnage of non-recycled plastics would be 35.5 million tons. Adding to this amount the estimated 2.1 million tons of recycled plastics brings the total generation of plastics in MSW to 37.6 million. These numbers indicate that the EPA estimate of 30 million tons is somewhat low. As noted earlier, in this study we assumed that the plastic generated was halfway between these two numbers, at 33.6 million tons. Apportioning this tonnage among the fifty states, on the basis of population, is in agreement with the reported generation of about four million tons of plastic wastes in California (see Table 8 of APPENDIX 1).

EEC Study of non-recycled plastics-August 2011
9
Table 1 Generation, recycling, and disposal of plastics in the U.S. in 2008 in thousand tons (20)
Generated Recycled Landfilled/ WTE
Durable Goods 10,520 390 10,130
Non‐durable Goods:
Cups and plates 780 Negligible
Trash bags 930 Negligible
Other non‐durables 4,810 negligible
Total non‐durables 6,520 6,520
Containers/packaging:
Bottles/jars, PET 2,680 730
Bottles/jars, HDPE 750 220
Other containers 1,900 280
Bags, sacks, wraps 3,960 390
Other packaging 3,720 110
Total containers/packaging 13,010 1,730 11,280
Total plastics 30,050 2,120 27,930
Table 2 MSW composition studies at various states (1-12)
State Year Paper Glass Metals Plastics Organic
California1 2008 17.30% 1.40% 4.60% 9.60% 32.40%
Connecticut2 2010 25.90% 2.10% 4.50% 14.70% 26.70%
Delaware 3 2007 25.70% 2.40% 5.20% 11.10% 25.10%
Georgia4 2005 38.70% 3.70% 5.40% 15.80% 27.10%
Minnesota5 2000 34.30% 2.80% 5.10% 11.40% 25.70%
New York 6 2010 27.00% 3.00% 6.00% 17.00% 24.00%
Iowa7 2005 26.17% 1.36% 3.74% 11.78% 17.46%
Maryland 8 2006 27.00% 2.60% 3.80% 14.40% 45.90%
Oregon 9 2009 16.99% 1.95% 5.45% 11.56% 50.21%
Pennsylvania 10 2003 33.30% 3.00% 5.40% 11.30% 34.20%
Washington 11 2009 19.20% 2.40% 6.30% 11.40% 27.20%
3 ESTIMATE OF MSW RECYCLED, COMBUSTED AND LANDFILLED IN EACH STATE
In order to estimate the tons of plastic wastes recycled, combusted and landfilled in each State, we need to know the disposition of MSW in each state. The only source of state-by-state data is the Columbia/BioCycle "State of Garbage" survey. It is based on detailed

EEC Study of non-recycled plastics-August 2011
10
questionnaires sent to the waste management departments of each state and subsequent analysis of these data. In 2008, the fifty states reported to the Columbia/BioCycle survey that a total of 270 million tons of MSW was disposed in U.S. landfills, while the EPA estimated (7) that only 136 million tons were landfilled in the same year. It should be noted that the EPA departments dealing with greenhouse gas (GHG) emissions of waste management use the Columbia/BioCycle numbers. The Earth Engineering Center and also the Energy Recovery Council has brought this serious discrepancy to the attention of EPA management; currently EPA is soliciting stakeholder input “regarding the efficacy and scope of the MSW Characterization Report called “Municipal Solid Waste in the United States”. This information will be used to develop new measurement definitions and protocols for measurement of these materials. This effort could lead to the creation of a new measurement report that EPA will make publicly available.
Figure 3 Comparison of EPA “Facts and Figures” and SOG data (ref.19; EPA did not report MSW data for 2004 and there was no Columbia/BioCycle national survey in 2003)
Figure 4 shows the reported tons landfilled in each state. Table 3 shows the distribution of MSW into recycling, WTE and landfilling in each state, as reported to the Columbia/BioCycle national survey of 2008 data.

EEC Study of non-recycled plastics-August 2011
11
Figure 4 Tons of MSW landfilled in fifty states
Table 3 MSW generated, recycled, combusted and landfilled in 2008 (14)
State Population Total tons of MSW
Tons MSW recycled
Tons MSW to WTE
Tons MSW landfilled
Alabama 4,661,900 5,287,330 472,000 316,659 4,498,671 Alaska 686,293 643,253 28,646 0 614,607 Arizona 6,500,180 6,784,535 917,373 0 5,801,208 Arkansas 2,855,390 4,696,134 483,896 0 3,711,017 California 36,756,666 61,210,578 24,724,726 627,039 28,216,903 Colorado 4,939,456 7,475,820 540,141 0 6,824,960 Connecticut 3,501,252 3,489,034 607,691 2,190,873 387,542 Delaware 873,092 1,032,201 168,701 0 741,143 DC 591,833 1,031,083 21,142 12,791 997,150 Florida 18,328,340 23,335,009 2,403,281 3,770,416 17,161,312 Georgia 9,685,744 11,529,102 682,266 41,350 10,765,486 Hawaii 1,288,198 3,718,002 574,294 589,982 2,297,680 Idaho 1,523,816 1,668,578 150,172 0 1,518,406 Illinois 12,901,563 16,650,811 1,003,390 0 15,150,000 Indiana 6,376,792 9,455,000 480,176 586,493 8,012,706 Iowa 3,002,555 3,894,330 924,364 69,537 2,652,855 Kansas 2,802,134 3,473,325 727,853 0 2,597,584 Kentucky 4,269,245 6,335,476 1,185,541 63,700 4,827,483 Louisiana 4,410,796 5,835,476 29,800 259,000 4,981,510 Maine 1,316,456 1,186,854 333,132 607,463 217,290 Maryland 5,633,597 6,551,880 1,461,164 847,659 3,461,764
Massachusetts 6,497,967 8,350,000 2,300,000 3,133,200 2,236,800 Michigan 10,003,422 14,011,339 844,328 1,081,011 12,086,000 Minnesota 5,220,393 10,326,122 2,589,954 1,187,600 6,530,938 Mississippi 2,938,618 2,698,238 129,839 0 2,553,238 Missouri 5,911,605 4,851,821 951,860 0 3,899,961 Montana 967,440 1,438,084 66,662 0 1,317,324

EEC Study of non-recycled plastics-August 2011
12
Nebraska 1,783,432 2,565,379 322,500 0 2,242,879 Nevada 2,600,167 3,614,681 229,128 0 3,299,832 New Hampshire 1,315,809 1,244,365 89,739 254,040 877,148 New Jersey 8,682,661 13,169,025 2,012,583 1,400,000 7,842,764 New Mexico 1,984,356 2,031,891 230,865 0 1,755,747 New York 19,490,297 16,925,888 3,060,363 3,681,134 9,556,442 North Carolina 9,222,414 8,630,060 668,498 107,837 7,264,586 North Dakota 641,481 736,872 26,695 0 687,394 Ohio 11,485,910 13,252,219 2,037,688 0 10,337,719 Oklahoma 3,642,361 4,394,393 170,000 0 4,224,393 Oregon 3,790,060 4,632,513 1,421,850 181,666 2,689,119 Pennsylvania 12,448,279 17,043,945 4,677,083 1,951,447 9,666,692 Rhode Island 1,050,788 1,014,846 101,883 0 864,583 South Carolina 4,479,800 4,448,935 914,056 212,118 3,155,304 South Dakota 804,194 699,039 71,041 0 565,148 Tennessee 6,214,888 5,414,776 251,112 74,327 5,039,337 Texas 24,326,974 29,164,982 2,634,275 0 22,170,707 Utah 2,736,424 2,580,879 51,159 126,739 2,241,353 Vermont 621,270 584,467 120,499 33,246 394,610 Virginia 7,769,089 14,858,903 2,716,198 2,135,407 9,627,472 Washington 6,549,224 7,420,559 1,461,403 332,301 4,986,236 West Virginia 1,814,468 2,110,381 337,661 0 1,772,720 Wisconsin 5,627,967 5,150,553 831,552 51,250 3,727,151 Wyoming 532,668 839,060 43,745 0 729,647 Total 304,059,724 389,488,026 69,283,968 25,926,285 269,780,521
4 ESTIMATE OF PLASTICS RECYCLED, COMBUSTED, AND LANDFILLED
IN EACH STATE
4.1 Tons of plastic wastes generated in each state
The estimated total tons of plastics generated in the U.S. (33.6 million tons) were apportioned to each state on the basis of its population.
4.2 Tons of plastic wastes recycled in the U.S.
The American Chemistry Council (21) estimated that the recycled non-durable plastics in 2008 amounted to 1.82 million tons (Table 4). Adding to this number the 0.39 million estimate of recycled durable plastics by EPA (20) resulted in the total of 2.2 million tons of plastics recycled in 2008, which was the number used in this study.
Table 4 Estimate of 2008 Plastic Recycling by EPA (20) and ACC (21)
Component of plastic stream Tons %
PET bottles 722,000 32.60%
HDPE bottles 490,000 22.20%
PP bottles 13,500 0.60%

EEC Study of non-recycled plastics-August 2011
13
Bags/films 416,000 18.80%
Non-bottle rigid plastics 180,000 8.10%
ACC total of recycled non-durable goods 1,821,500 82.40%
EPA estimate of recycling of durable goods 390,000 17.60%
Total tons of plastics recycled 2,211,500 100.00%
4.3 Tons of plastic wastes recycled in each state
The estimated 2.2 million tons of plastic recycled in the U.S. were distributed among the states in two ways:
a) According to the ratio of
tons of MSW recycled in state/ tons of MSW recycled in the U.S.
For the purposes of this report, it was assumed that states that recycle a large fraction of their MSW, such as paper, glass, aluminum and ferrous objects, also have comparable recycling programs for their mixed plastics.
b) A detailed calculation was made of the Materials Recovery Facilities (MRF) capacity in each state. The total plastic recycled was then apportioned according to the ratio
tons of MRF capacity in state/tons of U.S. MRF capacity.
Table 5 shows the calculated numbers of "% of U.S. recycling" and “% of U.S. MRF capacity” for the fifty states. The results of distribution (a) and (b) were compared and for most states were in good agreement. The average of the (a) and (b) values for each state was taken as the best estimate of tons of plastic recycled in the state.
Table 5 2008 distribution of MSW recycled and MRF capacity in the fifty states
State Tons recycled (SOG 2010)
% of total U.S. recycling
Tons of MRF capacity (Berenyi)
% of U.S. MRF capacity
Alabama 472,000 0.70% 236,000 1.10%
Alaska 28,646 0.00% 24,530 0.11%
Arizona 917,373 1.30% 474,613 2.21%
Arkansas 483,896 0.70% 14,619 0.07%
California 24,724,726 35.70% 2,848,096 13.26%
Colorado 540,141 0.80% 452,375 2.11%
Conn. 607,691 0.90% 414,932 1.93%
Delaware 168,701 0.20% 61,034 0.28%
DC 21,142 0.00% 3,380 0.02%
Florida 2,403,281 3.50% 1,066,021 4.96%
Georgia 682,266 1.00% 341,134 1.59%
Hawaii 574,294 0.80% 77,038 0.36%
Idaho 150,172 0.20% 94,958 0.44%

EEC Study of non-recycled plastics-August 2011
14
Illinois 1,003,390 1.40% 1,035,719 4.82%
Indiana 480,176 0.70% 240,087 1.12%
Iowa 924,364 1.30% 419,214 1.95%
Kansas 727,853 1.10% 336,000 1.56%
Kentucky 1,185,541 1.70% 124,754 0.58%
Louisiana 29,800 0.00% 29,800 0.14%
Maine 333,132 0.50% 80,886 0.38%
Maryland 1,461,164 2.10% 859,380 4.00%
Mass. 2,300,000 3.30% 604,100 2.81%
Michigan 844,328 1.20% 387,004 1.80%
Minnesota 2,589,954 3.70% 464,658 2.16%
Mississippi 129,839 0.20% 24,000 0.11%
Missouri 951,860 1.40% 536,013 2.50%
Montana 66,662 0.10% 9,324 0.04%
Nebraska 322,500 0.50% 129,000 0.60%
Nevada 229,128 0.30% 114,564 0.53%
New Hampshire 89,739 0.10% 75,417 0.35%
New Jersey 2,012,583 2.90% 1,515,169 7.05%
New Mexico 230,865 0.30% 14,976 0.07%
New York 3,060,363 4.40% 2,229,235 10.38%
North Carolina 668,498 1.00% 319,100 1.49%
North Dakota 26,695 0.00% 24,000 0.11%
Ohio 2,037,688 2.90% 541,469 2.52%
Oklahoma 170,000 0.20% 44,760 0.21%
Oregon 1,421,850 2.10% 572,180 2.66%
Pennsylvania 4,677,083 6.80% 1,003,510 4.67%
Rhode Island 101,883 0.10% 97,000 0.45%
South Carolina 914,056 1.30% 273,629 1.27%
South Dakota 71,041 0.10% 49,823 0.23%
Tennessee 251,112 0.40% 218,388 1.02%
Texas 2,634,275 3.80% 979,581 4.56%
Utah 51,159 0.10% 91,250 0.42%
Vermont 120,499 0.20% 67,603 0.31%
Virginia 2,716,198 3.90% 577,405 2.69%
Washington 1,461,403 2.10% 735,510 3.42%
West Virginia 337,661 0.50% 13,769 0.06%
Wisconsin 831,552 1.20% 535,409 2.49%
Wyoming 43,745 0.10% NA NA
Total 69,283,968 100.00% 21,482,414 100.00%

EEC Study of non-recycled plastics-August 2011
15
4.4 Tons of plastic combusted in each state
As was shown earlier, the measured plastic content of MSW is between 9.6% and 17%. As stated earlier, this study assumed that the reported MSW to WTE facilities in each state contained 10% plastic wastes.
4.5 Estimate of plastic wastes landfilled
The tons of non-recycled plastics landfilled in each state were calculated by subtracting the plastics recycled and combusted from the plastics generated in each state.
4.6 Results of calculations
The results of this study showed that 6.5% of the plastic generated is recycled, 7.7% is combusted with energy recovery and 85.7% is landfilled. A state-by-state comparison of how much plastic is recycled, recovered for energy, and landfilled in each state is shown in graphical form in Figure 5 and Figure 6. It can be seen that the states at the top of the graph, and thus closest to sustainable waste management, are Connecticut, Massachusetts, Hawaii, Maine, Virginia, and Minnesota. It should be noted that states that have WTE capacity also have relatively high rates of plastic recycling.

EEC Study of non-recycled plastics-August 2011
16
Figure 5 Fraction of plastic recovered as materials or energy in each state

EEC Study of non-recycled plastics-August 2011
17
Figure 6 Position of each state on the "ladder" of sustainable management of plastics

EEC Study of non-recycled plastics-August 2011
18
5 POTENTIAL FOR ENERGY RECOVERY FROM NRP THAT ARE NOW LANDFILLED
There are three main ways for recovering the energy value in NRP:
1) Pyrolysis of source-separated plastics that are currently landfilled. A recent study by the Earth Engineering Center for Flexible Packaging Association showed that some pyrolysis technologies are reaching commercialization in the United States and the conversion of non-recycled plastics directly to fuel oil is becoming a reality.
2) Use of source-separated plastics as fuel in dedicated power plants and/or as a fuel at cement kilns and industrial and commercial boilers, in place of fossil fuels.
3) Increasing U.S. WTE capacity: Since NRP are currently mixed in municipal solid
wastes (MSW), one way to recover their chemical energy is by increasing the U.S. waste-to-energy (WTE) capacity from its present level of about 10% of the post-recycled MSW (27 million tons). This will have two distinct benefits: Energy will be recovered both from plastics and from the other combustible materials in MSW, and there will be a reduction of the greenhouse gas (GHG) emissions associated with landfilling. For example, replacing 25% of the current U.S. landfilling by new WTE capacity (i.e., 68 million tons of MSW) will result in the annual production of about 41 million MWh of electricity, sufficient for 4.1 million households.
5.1 Energy value of non-recycled plastics
A critical part of this study was to quantify the chemical heat contained in mixed plastic wastes (i.e., calorific value) that are currently being landfilled. Table 6 is based on data provided by the Energy Information Administration of the Department of Energy (DOE-EIA) and includes the heat content of various components of the non-recycled plastics (ref. 15, 25) and the tons of NRP generated as per the EPA report (Table 1, ref. 19). It should be noted that the DOE-EIA estimates are based on calorific values of actual non-recycled plastics, i.e. those containing a certain amount of other materials and some moisture that lower the heating value of the resin. This analysis showed that the Lower Heating Value (LHV), i.e., not including the latent heat of condensation of water vapor in the combustion gases, of non-recycled plastics is about 32 MJ/kilogram (Table 6).

EEC Study of non-recycled plastics-August 2011
19
Table 6 Calculation of Lower Heating Value of Non-recyclable Plastics in Municipal Solid Waste (MSW; ref. 15, 20)
Materials Million Btu per Ton
MJ/kg Tons in NRP
stream
% in NRP MJ/kg NRP
Polyethylene terephthalate (PET)
20.5 24 3,740 12.40% 2.93
High density polyethylene (HDPE) 38 44 5350 17.8% 7.76
Polyvinyl chloride (PVC) 16.5 19 1,660 5.50% 1.05
Low density polyethylene/ Linear low density polyethylene (LDPE/LLDPE)
24 28 5,880 19.60% 5.39
Polypropylene (PP) 38 44 4,190 13.90% 6.08
Polystyrene (PS) 35.6 41 2,620 8.70% 3.56
Other 22 25 6,610 22.00% 5.55
Total NRP 30,050 100% 31.96
5.2 Energy equivalence of NRP to coal, oil, and natural gas
The value of 31.96 MJ/kg (Table 6) corresponds to 14,000 Btu/lb (28 million Btu/ton) and was used in the following calculations. In comparison, the fossil fuels used in the U.S. have the following LHV values:
Natural gas: 20,300 Btu/lb Crude oil: 18,400 Btu/lb Non-recycled plastics (NRP) 14,000 Btu/lb Petroleum coke: 12,700 Btu/lb U.S. coals: 9,800-11,200 Btu/lb Wood: 6,000 Btu/lb
Figure 7 is a bar chart comparing the heating values of these fuels.

EEC Study of non-recycled plastics-August 2011
20
Figure 7 Comparison of heating value of NRP to that of other fuels
Table 7 shows the tons of coal, barrels of oil and cubic feet of natural gas of equivalent heating value to the tons of NRP currently landfilled in each state. The heating values used in calculating the equivalence were as follows:
1 ton NRP: 28 million Btu; 1 ton coal: 22 million Btu; 1 barrel oil: 5.8 million Btu; 1000 standard cubic feet of natural gas: 1.03 million Btu
Table 7 Fossil fuel equivalent quantities to tons of NRP landfilled in each state
State Tons of NRP to landfills
MBtu lost in NRP
landfilled (at 28 million Btu/ton)
Tons of coal equivalent to NRP heating value
Barrels of oil equivalent to NRP heating
value
Natural gas equivalent to NRP heating value, in 1000
standard cubic feet
Alabama 463,972 12,991,226 590,510 2,239,867 12,612,841 Alaska 74,133 2,075,735 94,352 357,885 2,015,277 Arizona 679,543 19,027,205 864,873 3,280,553 18,473,015 Arkansas 307,106 8,598,966 390,862 1,482,580 8,348,511 California 3,461,357 96,918,008 4,405,364 16,710,001 94,095,154 Colorado 514,199 14,397,560 654,435 2,482,338 13,978,214 Connecticut 137,019 3,836,538 174,388 661,472 3,724,794 Delaware 90,691 1,781,170 80,962 307,098 1,729,291 DC 63,613 2,539,355 115,425 437,820 2,465,393 Florida 1,555,831 43,563,272 1,980,149 7,510,909 42,294,439 Georgia 1,037,964 29,062,991 1,321,045 5,010,861 28,216,496 Hawaii 70,309 1,968,651 89,484 339,423 1,911,311 Idaho 161,164 4,512,599 205,118 778,034 4,381,164 Illinois 1,356,959 37,994,853 1,727,039 6,550,837 36,888,207
0 5000 10000 15000 20000 25000
Non‐ recycled Plastics
U.S. coal
U.S. coal
Crude oil
Natural gas
Petroleum coke
Energy value of NRP compared to the fossil fuels used in the U.S. (lower heating value, Btu/lb)

EEC Study of non-recycled plastics-August 2011
21
Indiana 626,154 17,532,320 796,924 3,022,814 17,021,669 Iowa 288,798 8,086,357 367,562 1,394,200 7,850,832 Kansas 280,966 7,867,055 357,593 1,356,389 7,637,918 Kentucky 440,220 12,326,155 560,280 2,125,199 11,967,141 Louisiana 459,521 12,866,593 584,845 2,218,378 12,491,838 Maine 75,316 2,108,854 95,857 363,596 2,047,431 Maryland 470,770 13,181,556 599,162 2,272,682 12,797,627 Massachusetts 337,427 9,447,950 429,452 1,628,957 9,172,767 Michigan 964,192 26,997,366 1,227,153 4,654,718 26,211,035 Minnesota 393,313 11,012,766 500,580 1,898,753 10,692,006 Mississippi 321,446 9,000,490 409,113 1,551,809 8,738,340 Missouri 610,826 17,103,116 777,414 2,948,813 16,604,967 Montana 105,373 2,950,442 134,111 508,697 2,864,507 Nebraska 185,382 5,190,692 235,941 894,947 5,039,506 Nevada 277,853 7,779,887 353,631 1,341,360 7,553,288 New Hampshire 114,730 3,212,441 146,020 553,869 3,118,875 New Jersey 710,290 19,888,115 904,005 3,428,985 19,308,849 New Mexico 214,852 6,015,849 273,448 1,037,215 5,840,630 New York 1,623,437 45,456,246 2,066,193 7,837,284 44,132,278 North Carolina 981,457 27,480,792 1,249,127 4,738,068 26,680,381 North Dakota 69,239 1,938,705 88,123 334,259 1,882,238 Ohio 1,209,295 33,860,247 1,539,102 5,837,974 32,874,026 Oklahoma 397,517 11,130,480 505,931 1,919,048 10,806,291 Oregon 348,913 9,769,566 444,071 1,684,408 9,485,016 Pennsylvania 1,055,040 29,541,121 1,342,778 5,093,297 28,680,700 Rhode Island 109,555 3,067,542 139,434 528,887 2,978,196 South Carolina 445,367 12,470,281 566,831 2,150,048 12,107,068 South Dakota 85,200 2,385,591 108,436 411,309 2,316,108 Tennessee 664,223 18,598,232 845,374 3,206,592 18,056,536 Texas 2,596,488 72,701,665 3,304,621 12,534,770 70,584,141 Utah 284,250 7,959,004 361,773 1,372,242 7,727,188 Vermont 59,970 1,679,149 76,325 289,508 1,630,242 Virginia 572,424 16,027,866 728,539 2,763,425 15,561,035 Washington 629,797 17,634,308 801,559 3,040,398 17,120,688 West Virginia 194,444 5,444,440 247,475 938,697 5,285,865 Wisconsin 576,298 16,136,349 733,470 2,782,129 15,666,359 Wyoming 57,498 1,609,937 73,179 277,575 1,563,045 Total 28,811,702 806,727,655 36,669,439 139,090,975 783,230,733
Figure 8 and Figure 9 show the tons of coal equivalent to tons of NRP landfilled in states that import a large amount of coal. Figure 10 is based on Table 9 Table 9 2009 U.S. coal consumption and production by state, in APPENDIX 1 and shows the states that import coal, the tons of coal imported, and the tons of NRP that could be used to replace an equal amount of coal that is now imported.

EEC Study of non-recycled plastics-August 2011
22
Figure 8 Potential for replacing coal in states landfilling more NRP
Figure 9 Potential for replacing coal in states landfilling less NRP
0500,000
1,000,0001,500,0002,000,0002,500,0003,000,0003,500,0004,000,0004,500,000
California
Texas
New
York
Florida
Illinois
Ohio
Pen
nsylvania
Geo
rgia
North Carolina
Michigan
New
Jersey
Arizona
Tennessee
Washington
Indiana
Missouri
Wisconsin
Virginia
Colorado
Maryland
Alabam
a
Louisiana
South Carolina
Ken
tucky
Oklahoma
Minnesota
Tons of Coal Replaced by diverting NRP from Landfills
by 100% diversion of NRP from landfill by 25% diversion of NRP from landfill
050,000100,000150,000200,000250,000300,000350,000400,000450,000
Oregon
Massachusetts
Mississippi
Arkansas
Iowa
Utah
Kansas
Nevada
New
Mexico
West Virginia
Neb
raska
Idaho
Connecticut
New
Ham
pshire
Rhode Island
Montana
Delaw
are
South Dakota
Maine
Alaska
Haw
aii
North Dakota DC
Vermont
Wyoming
Tons of Coal Replaced by diverting NRP from Landfills
by 100% diversion of NRP from landfill by 25% diversion of NRP from landfill

EEC Study of non-recycled plastics-August 2011
23
Figure 10 Potential for NRP to replace coal in states that import coal
5.3 Transforming of NRP to oil by means of pyrolysis
Non-recycled plastics can be source-separated and converted to a crude oil or other types of fuel oil by a thermal treating technique called pyrolysis. Several companies are developing various processes that can pyrolyze NRP into synthetic oils (e.g. Envion, Climax Global Energy, Agilyx, JBI). A conservative estimate is that these processes, when fully industrialized, can convert one ton of NRP to 3 barrels of oil. Hypothetically, the 29 million tons of NRP in the MSW stream that are now landfilled could be converted to 87 million barrels of oil. This corresponds to 3.6 billion gallons, which would be enough fuel to power six million cars for one year. Figure 11 shows the potential of converting the non-recycled plastics to synthetic oil, for each State.
The economic value of 87 million barrels of synthetic oil, at current oil prices, would be 8.7 billion dollars.

EEC Study of non-recycled plastics-August 2011
24
Figure 11 Potential for synthetic oil production by pyrolysis of source separated NRP
5.4 Potential of using source-separated NRP in dedicated power plants
Another way to use source-separated non-recycled plastics is by combustion in specially designed power plants to produce electricity. New waste-to-energy plants produce over 0.6 MWh per ton of MSW. However, NRP have an average calorific value (32 MJ/kg) that is, three times higher than the typical MSW. Therefore, it is estimated that NRP-dedicated power plants would be able to produce a net of 1.8 MWh per ton of NRP combusted. For a hypothetical 100% utilization of source-separated NRP in such power plants, the net electricity produced would be about 52 million MWh, sufficient for supplying 5.2 million households.
5.5 Increased utilization of NRP by means of increased U.S. waste-to-energy capacity
This study showed that 2.6 million tons of NRP are used beneficially in 87 waste-to-energy facilities across the nation that combust MSW and produce electricity. This amount represents only 7.7% of the total plastic generated in the U.S. since most of the NRP in MSW are not source-separated. An obvious way to increase the energy recovery of plastic is to increase the national WTE capacity. This section examines the potential of increasing the existing WTE capacity and what it would mean for the displacement of coal.
On the average, the existing WTE plants in the U.S. produce electricity (0.5 MWh/ton MSW) that avoids the mining of 1/3 ton of coal per ton of MSW combusted. These plants were built nearly twenty years ago and by now the technology has advanced to the point that new WTE facilities can produce a net of 0.6 MWh/ton of MSW, which corresponds to

EEC Study of non-recycled plastics-August 2011
25
replacing about 0.4 tons of coal per ton of MSW fuel. Hypothetical diversion of the 270 million tons of MSW that are currently landfilled (Table 3) would result in the generation of 162 million MWh, sufficient to supply 16.2 million households and reduce coal consumption by 108 million tons. Figure 12 shows graphically the replacement of coal consumption, state-by-state, by replacing 100% or 25% of the current landfilling by waste-to-energy.
Using a "home-grown" fuel in place of imported coal will be of particular interest to states that import large amounts of coal and export large quantities of MSW to other states for landfilling. Figure 13 is partly based on Table 9 of APPENDIX 1 ("2009 U.S. coal consumption and production by state") and shows the states that import coal, the tons of coal imported, and the tons of MSW landfilled, either within the state or in other states. For these states, there is an additional advantage of installing WTE capacity and using a home grown fuel, thus reducing the importation of coal.
Figure 12 Potential for replacing coal by diverting 100 % and 25 % of MSW from landfilling to WTE

EEC Study of non-recycled plastics-August 2011
26
Figure 13 Tons of coal imported and tons of NRP-MSW mix landfilled in the fifty states
5.6 Greenhouse gas (GHG) benefit of increasing WTE capacity In addition to recovering the energy content of plastics contained in MSW, increasing the WTE capacity of the U.S. will also result in a significant reduction of the emission of greenhouse gas (GHG) effect. One ton of MSW diverted from landfilling to WTE reduces GHG emissions by 0.5 to 1 ton of carbon dioxide equivalent, depending on the degree of landfill gas capture. Figure 14 shows the beneficial GHG effect, in each state, of combusting 25% and 100% of MSW that is presently landfilled. Several states have recognized this environmental advantage of WTE. Most recently, Maryland enacted legislation that moved WTE to Tier 1 of renewable energy sources, alongside wind and solar energy.

EEC Study of non-recycled plastics-August 2011
27
Figure 14 GHG benefit of diverting 25% and 100% of MSW landfilled to WTE
As noted earlier, the net production of electricity from new WTE facilities in the U.S. is estimated at 0.6 MWh per ton of MSW combusted. Figure 15 shows the projected production of electricity in each state by diverting 25% and 100% of the present landfilling to new WTE facilities. Because of the rising costs of fossil fuels and the fact that over 50% of the energy contained in MSW is biogenic and thus renewable energy, the value of new WTE electricity is estimated at $100/MWh.
Figure 16 shows the economic value of the WTE electricity that can be produced from WTE in each state. By utilizing just 25% of the current MSW that is landfilled via new WTE capacity would result in the annual production of 40 million MWh of electricity, sufficient for the needs of about 4 million households. The value of this energy, at an assumed $100/MWh, is four billion dollars. Eventual replacement of all U.S. landfilling by WTE would result in annual production of 160 million MWh of electricity, enough to supply 16 million households.

EEC Study of non-recycled plastics-August 2011
28
Figure 15 Electricity production by diverting 25% and 100% of present landfilling to new
WTE facilities
Figure 16 Value of electricity (at $100/MWh) produced by diverting 25% of present
landfilling to new WTE facilities

EEC Study of non-recycled plastics-August 2011
29
CONCLUSIONS
The results of this study showed that 6.5% of the used plastics generated in the U.S. are recycled, 7.7% are combusted with energy recovery, and the remaining 85.8% are landfilled. The states closest to sustainable waste management of plastics in 2008, by complementing recycling with energy recovery, are Connecticut, Massachusetts, Hawaii, Maine, Virginia, and Minnesota; the diversion rates of NRP from landfills in these states, by recycling and combustion with energy recovery, range from 65% for Connecticut to 32% for Minnesota.
The amount of NRP plastics landfilled in the United States in 2008 was estimated at 28.8 million tons. The chemical energy contained in this material was 807 trillion Btu. This amount of energy is equivalent to:
o 36.7 million tons of coal, or o 139 million barrels of oil, or o 783 billion cubic feet of natural gas
Hypothetically, if all the NRP that are currently landfilled were source-separated
and converted by pyrolysis to a fuel oil, they would produce an estimated 87 million barrels of oil per year (3.6 billion gallons), enough to power six million cars for one year.
If all the NRP that are landfilled annually were to be source-separated and used as fuel in specially designed power plants, the electricity produced would be 52 million MWh, enough to supply 5.2 million households. This would also reduce U.S. coal consumption by as much as 34 million tons.
Hypothetically, if 100% of the landfilled municipal solid wastes (MSW) were diverted from landfills to new WTE power plants, they would reduce coal consumption by 108 million tons and produce 162 million MWh of electricity, enough to power 16.2 million households for one year.
This study also examined the effect of new WTE capacity on reducing coal consumption in states that now import large amounts of coal. As stated above, one ton of MSW used as fuel in new WTE plants would produce the energy equivalent of about 0.4 tons of coal. Accordingly, 25% diversion of MSW currently landfilled to new WTE plants would avoid the mining of 27 million tons of coal and as much as 270 million tons of overburden; 100% diversion of current landfilling by means of new WTE capacity would reduce coal mining by 108 million tons of coal, nearly 10% of the U.S. coal consumption.
Lastly, increased WTE capacity would reduce the carbon footprint of waste management in the U.S. For example, a 25% diversion of mixed biomass and NRP

EEC Study of non-recycled plastics-August 2011
30
in MSW from landfills to new WTE facilities will result in greenhouse gas (GHG) reduction of 35 to 70 million tons of carbon dioxide equivalent, depending on the degree of landfill capture in present landfills.
REFERENCES 1. Cascadia Consulting Group. California 2008 Statewide Waste Characterization Study.; 2009.
2. DSM Environmental Services I, Cascadia Consulting Group undefined Mid-Atlantic Solid Waste Consultants. Connecticut State-wide Solid Waste Composition and Characterization Study, Final Report.; 2010.
3. Cascadia Consulting Group. Delaware Solid Waste Authority Statewide Waste Characterization Study, 2006-2007.; 2007:2006-2007.
4. Beck RW. GEORGIA STATEWIDE WASTE CHARACTERIZATION STUDY.; 2005.
5. Beck RW. FINAL REPORT STATEWIDE MSW COMPOSITION STUDY.; 2000.
6. Department of Environmental Conservation, "Solid Waste Composition and Characterization-MSW Materials Composition in New York State". Available at: http://www.dec.ny.gov/chemical/65541.html [Accessed February 2011].
7. Beck RW, "Iowa Statewide Waste Characterization Study", 2006.
8. SCS Engineers, "Waste Composition Sampling & Analysis Study", 2009.
9. Oregon Department of Environmental Quality, "Oregon Statewide Waste Composition 2009 Field Data", 2009:2-5.
10. Beck RW, "Statewide Waste Composition Study", 2003.
11. Cascadia Consulting Group, "2009 Washington Statewide Waste Characterization Study", 2010.
12. Recycling Connection Corporation, "2009 Wisconsin state-wide waste characterization study", 2010.
13. Arsova, L., R. Van Haaren, N. Goldstein, S. Kaufman, and N. J. Themelis "The State of Garbage in America". BioCycle. December 2008. www.jgpress.com/archives/_free/001782.html>
14. Van Haaren, Rob, Nickolas Themelis, and Nora Goldstein, "The State of Garbage in America (2010 National Survey)", BioCycle, p.16-23), October 2010.
15. Bhatti, Jawad A., "Current state and potential for increasing plastics recycling in the U.S.", MS Thesis, Earth and Environmental Engineering, Columbia University, May 2010
www.seas.columbia.edu/earth/wtert/sofos/bhatti_thesis.pdf
16. Earth Engineering Center, Columbia University, www.eecny.org
17. EPA 2011 GHG Inventory Report; www.epa.gov/climatechange/emissions/usinventoryreport.html

EEC Study of non-recycled plastics-August 2011
31
18. Kaufman S.M., and N. J. Themelis, “Using a Direct Method to Characterize and Measure Flows of Municipal Solid Waste in the United States”, Journal of the Air and Waste Management Association, Volume 59, p.1386-1390, December 2009.
19. Themelis, N.J. and S.M. Kaufman, "Improving Methods of MSW Measurement", BioCycle, p.34-37, Jan. 2010.
20. U.S. EPA, "Municipal Solid Waste Generation, Recycling , and Disposal in the United States : Facts and Figures for 2008", 1-12, 2008; www.epa.gov/osw/nonhaz/municipal/pubs/msw2009rpt.pdf
21. American Chemistry Council, "2009 U.S. National Post-Consumer Plastics Bottle Recycling Report", 2009.
22. Moore Recycling Associates, "2009 National Postconsumer Recycled Plastic Bag & Film Report", 2011:1-8.
23. Moore Recycling Associates, "2009 National Report on Postconsumer Non-Bottle Rigid Plastic Recycling", 2011:1-12.
24. California Department of Resources Recycling and Recovery (CalRecycle). " 2003 Waste Characterization Study" http://www.calrecycle.ca.gov/plastics/
25. U.S. EIA/DOE "Methodology for Allocating Municipal Solid Waste to Biogenic and Non-Biogenic Energy" http://www.eia.doe.gov/cneaf/solar.renewables/page/mswaste/msw_report.html
26. EIA/DOE, http://www.eia.doe.gov/oiaf/aeo/conf/pdf/luppens.pdf
27. www.commodityintelligence.com/images/2010/feb/2feb/bayan%202010%20Guidance.pdf
APPENDIX 1
a) Characterization of U.S. Plastic Stream One of the most detailed characterizations of the plastic waste stream was carried out in California in 2003 and is shown in Table 8.
Table 8 Composition of plastic waste stream of California (2003)
Type of plastic waste Tons in
disposed MSW % of
plastic stream
PETE Containers 199,644 5.2%
HDPE Containers 157,779 4.1%
Miscellaneous Plastic Containers 163,008 4.3%
Plastic Trash Bags 361,997 9.5%

EEC Study of non-recycled plastics-August 2011
32
b) Coal consumption and imports by state
Table 9 shows tons of coal consumed, coal mined, and coal imported by state.
Table 9 2009 U.S. coal consumption and production by state,
in million short tons (EIA)
Plastic Grocery and Other Merchandise Bags
123,405 3.2%
Non-Bag Commercial and Industrial Packaging Film
194,863 5.1%
Film Products 113,566 3.0%
Other Film 554,002 14.5%
Durable Plastic Items 834,970 21.9%
Other and Composite Plastic 1,104,719 29.0%
Total plastic waste stream 3,807,952 100.0%
State Tons coal consumed
Tons coal mined
Tons coal imported
Alabama 27.6 20.6 7
Arizona 20.8 8 12.8
Arkansas 15 15
Delaware 1.4 1.4
Florida 23.5 23.5
Georgia 32.8 32.8
Illinois 53.7 33 20.7
Indiana 54.5 36.2 18.3
Iowa 22.6 22.6
Kansas 20.8 20.8
Louisiana 15.7 3.8 11.9
Maryland 9.8 2.8 7
Massachusetts 3.9 3.9
Michigan 35.3 35.3
Minnesota 17.4 17.4
Mississippi 8.4 2.8 5.6

EEC Study of non-recycled plastics-August 2011
33
c)
c)
c) Annual electricity consumption in U.S.: 10,656 kWh/household
(www.eia.doe.gov/emeu/reps/enduse/er01_us_tab1.html)
Missouri 42.7 42.7
Nebraska 14.2 14.2
Nevada 3.8 3.8
New Hampshire 1.2 1.2
New Jersey 2.5 2.5
New York 6.1 6.1
North Carolina 26.4 26.4
Ohio 51.1 26.3 24.8
Oklahoma 21 1.4 19.6
Oregon 1.9 1.9
South Carolina 14.1 14.1
South Dakota 2.1 2.1
Tennessee 19.5 2.3 17.2
Texas 95.4 39 56.4
Washington 5 5
Wisconsin 22.2 22.2
U.S. total 933.8 176.2 757.6