Energy and Buildings - Massachusetts Institute of...
9
Energy and Buildings 49 (2012) 479–487 Contents lists available at SciVerse ScienceDirect Energy and Buildings j ourna l ho me p age: www.elsevier.com/locate/enbuild Using pattern recognition to identify habitual behavior in residential electricity consumption Joana M. Abreu a,∗ , Francisco Câmara Pereira b , Paulo Ferrão c a MIT Portugal Program, Centre for Innovation, Technology and Policy Research – IN+, Instituto Superior Técnico, Technical University of Lisbon, Av. Rovisco Pais 1, 1049-001 Lisbon, Portugal b Department of Informatics Engineering, Faculty of Sciences and Technology, Coimbra University, Singapore-MIT Alliance for Research and Technology, S16-05-08, 3 Science Drive 2, Singapore 117543, Singapore c Instituto Superior Técnico, Technical University of Lisbon, Av. Rovisco Pais, 1, 1049-001 Lisbon, Portugal a r t i c l e i n f o Article history: Received 20 December 2011 Received in revised form 18 February 2012 Accepted 28 February 2012 Keywords: Electricity patterns Household Baselines Routines Pattern recognition a b s t r a c t Recognizing habitual behavior and providing feedback in context are key to empower individuals to take control over residential electricity consumption. Yet, it is a challenge to change habitual behavior, embedded in everyday routines. This paper intends to discover whether habitual behavior can be identi- fied by pattern recognition techniques. The data source is an experiment similar to a utility led advanced metering infrastructure implementation. The analysis discovers: (1) persistent daily routines and (2) patterns of consumption or baselines typical of specific weather and daily conditions. Approximately 80% of household electricity use can be explained within these two patterns, with several applicable “profiles” for this population, including: unoccupied baseline, hot working days, temperate working days, cold working days, and cold weekend days. The proposed methodology demonstrates that it is possible to use pattern recognition methodologies to recognize habitual electricity consumption behavior given the intrinsic characteristics of the family. This approach could be useful to improve small scale forecast, and as a mechanism to enable the provision of tailor-made information to the families. © 2012 Elsevier B.V. All rights reserved. 1. Introduction and motivation Energy use by individuals in the privacy of their homes is influ- enced by very diverse factors. van Raaij and Verhallen [1] in their research in the 1980s, recognize several factors that drive house- hold electricity consumption behavior, such as energy-related attitudes, personality, socio-demographic factors, building char- acteristics, energy prices, feedback and general information about energy use. In their analysis of the problem, these researchers sug- gest that routines can become alternative predictors of electricity consumption [1] because routines or habits may resist the cogni- tive and financial drive and still prevail over rational alternatives [2]. A consequence of the debate about implications of routines in electricity consumption is whether tailored information delivered in context of household habits can contribute to decrease (or shape) household electricity use (or in abstract, energy use). Bridging the gap between technology/information and routines, the analytical approach developed in this paper will look at a semi-automatic ∗ Corresponding author. Tel.: +351 933 419 042. E-mail address: [email protected] (J.M. Abreu). method to provide information that can be used to promote new usage habits. Our approach is to benchmark current real time elec- tricity consumption with historical best practices, established by the family for weather and other loading conditions such as week- ends, weekdays and months. These experimental methodologies were developed upon the data collected through an experiment, which for the purposes of this analysis closely resembles a utility led automated meter infrastructure implementation. In our case, the experiment includes a total of 15 homes. The main findings include a method that positively pinpoints the daily routines for a particular household. A second outcome of the analysis is to enable a greater sophistication in feedback mechanisms, which may begin to give back information that can benchmark real time consumption with “normal” consumption for a particular day-type. Individuals could compare their best pattern of consumption with the worst or the average, depending on the objectives of the feedback program. The underlying theory supporting the research is change of habits, driven by feedback: there is evidence that personalized action-driven feedback is a drive for behavior change for some individuals [2,3]. Our methodology extracts patterns of activity that depend on the loading conditions (i.e.: external conditions such as temperature and working days or weekends). A possible 0378-7788/$ – see front matter © 2012 Elsevier B.V. All rights reserved. doi:10.1016/j.enbuild.2012.02.044
Transcript of Energy and Buildings - Massachusetts Institute of...

Uc
Ja
Pb
2c
a
ARRA
KEHBRP
1
erhaaegct[
eihga
0d
Energy and Buildings 49 (2012) 479–487
Contents lists available at SciVerse ScienceDirect
Energy and Buildings
j ourna l ho me p age: www.elsev ier .com/ locate /enbui ld
sing pattern recognition to identify habitual behavior in residential electricityonsumption
oana M. Abreua,∗, Francisco Câmara Pereirab, Paulo Ferrãoc
MIT Portugal Program, Centre for Innovation, Technology and Policy Research – IN+, Instituto Superior Técnico, Technical University of Lisbon, Av. Rovisco Pais 1, 1049-001 Lisbon,ortugalDepartment of Informatics Engineering, Faculty of Sciences and Technology, Coimbra University, Singapore-MIT Alliance for Research and Technology, S16-05-08, 3 Science Drive, Singapore 117543, SingaporeInstituto Superior Técnico, Technical University of Lisbon, Av. Rovisco Pais, 1, 1049-001 Lisbon, Portugal
r t i c l e i n f o
rticle history:eceived 20 December 2011eceived in revised form 18 February 2012ccepted 28 February 2012
eywords:lectricity patternsousehold
a b s t r a c t
Recognizing habitual behavior and providing feedback in context are key to empower individuals totake control over residential electricity consumption. Yet, it is a challenge to change habitual behavior,embedded in everyday routines. This paper intends to discover whether habitual behavior can be identi-fied by pattern recognition techniques. The data source is an experiment similar to a utility led advancedmetering infrastructure implementation.
The analysis discovers: (1) persistent daily routines and (2) patterns of consumption or baselines typicalof specific weather and daily conditions. Approximately 80% of household electricity use can be explained
aselinesoutinesattern recognition
within these two patterns, with several applicable “profiles” for this population, including: unoccupiedbaseline, hot working days, temperate working days, cold working days, and cold weekend days.
The proposed methodology demonstrates that it is possible to use pattern recognition methodologiesto recognize habitual electricity consumption behavior given the intrinsic characteristics of the family.This approach could be useful to improve small scale forecast, and as a mechanism to enable the provisionof tailor-made information to the families.
. Introduction and motivation
Energy use by individuals in the privacy of their homes is influ-nced by very diverse factors. van Raaij and Verhallen [1] in theiresearch in the 1980s, recognize several factors that drive house-old electricity consumption behavior, such as energy-relatedttitudes, personality, socio-demographic factors, building char-cteristics, energy prices, feedback and general information aboutnergy use. In their analysis of the problem, these researchers sug-est that routines can become alternative predictors of electricityonsumption [1] because routines or habits may resist the cogni-ive and financial drive and still prevail over rational alternatives2].
A consequence of the debate about implications of routines inlectricity consumption is whether tailored information deliveredn context of household habits can contribute to decrease (or shape)
ousehold electricity use (or in abstract, energy use). Bridging theap between technology/information and routines, the analyticalpproach developed in this paper will look at a semi-automatic∗ Corresponding author. Tel.: +351 933 419 042.E-mail address: [email protected] (J.M. Abreu).
378-7788/$ – see front matter © 2012 Elsevier B.V. All rights reserved.oi:10.1016/j.enbuild.2012.02.044
© 2012 Elsevier B.V. All rights reserved.
method to provide information that can be used to promote newusage habits. Our approach is to benchmark current real time elec-tricity consumption with historical best practices, established bythe family for weather and other loading conditions such as week-ends, weekdays and months. These experimental methodologieswere developed upon the data collected through an experiment,which for the purposes of this analysis closely resembles a utilityled automated meter infrastructure implementation. In our case,the experiment includes a total of 15 homes.
The main findings include a method that positively pinpointsthe daily routines for a particular household. A second outcomeof the analysis is to enable a greater sophistication in feedbackmechanisms, which may begin to give back information that canbenchmark real time consumption with “normal” consumption fora particular day-type. Individuals could compare their best patternof consumption with the worst or the average, depending on theobjectives of the feedback program.
The underlying theory supporting the research is change ofhabits, driven by feedback: there is evidence that personalized
action-driven feedback is a drive for behavior change for someindividuals [2,3]. Our methodology extracts patterns of activitythat depend on the loading conditions (i.e.: external conditionssuch as temperature and working days or weekends). A possible
4 nd Buildings 49 (2012) 479–487
am
adWT
mamao
sccssitacit
2
ifqpctiht
mtpad
oocsvrti
o(ws“ttrd
d
80 J.M. Abreu et al. / Energy a
pplication of such information is to provide personalized bench-arking against real time consumption.The inspiration for this type of analysis is developed by Cal-
brese [4] and Eagle [5]. In the case of Calabrese [4], they use eigenecomposition and clustering analysis to infer human activity fromiFi hot spot sensors distributed across Massachusetts Institute of
echnology (MIT) campus.An example of inferring activity patterns from indirect sensing
echanisms through datamining comes from the works of Eaglend Pentland [5]. In their “reality mining” project, the team usesobile cell-id and bluetooth data from 100 students’ cell-phones
s sources of activity, which is then datamined to develop a modelf activity and mobility in campus.
Two recent works by Santin [6] and Yu [7] have made use ofimilar techniques as the one presented in this paper but withompletely different approaches. Santin’s study is focused on dis-overing heating habits through survey analysis, while Yu ‘s [7]tudy relies on building data and their characteristics (e.g. buildingignal envelope and type of appliances) to develop clusters of build-ngs with the same level of electricity consumption. The novelty ofhe present work is the focus and scope: it focuses on the householdnd yet keeps the perspective about how the information gatheredan be applied to large populations, with the objective of gatheringntelligence and capacity to act by providing tailor-made services:ailor made feedback or segmentation.
. Discovery of the daily routines
The most significant steps of the methodology are explainedn the following paragraphs (for an overview, see Fig. 1). Theramework comprehends the collection of both quantitative andualitative household information. The quantitative dataset com-rises electricity readings, which comprehend total electricityonsumption in 15-min periods. This dataset requires the installa-ion of electronic meters in the households. The qualitative datasets based upon the responses and narratives provided by the house-old occupants, when subject to surveys and interviews done byhe researcher.
The first step starts with decomposing the signal into its funda-ental frequencies, using fast Fourier transform (represented by
he box spectral analysis). This analysis highlights the most intenseeriods, throughout the dataset, and gives evidence of the unit ofnalysis. For that reason, household time-series were organized inays or groups of 24 h (Fig. 1: unit of analysis).
After grouping the data into the most common periods, the sec-nd step is to identify the periods of recurrent behaviors, whichccur every day. This discovery process is the result of the appli-ation of principal components analysis and rotation of the mostignificant eigenvectors (Fig. 1: eigenvector decomposition andarimax rotation). The patterns of recurrent behavior, that cor-espond to the groups of variables that correlate the most withhe significant eigenvectors, were matched with the interviews tonterpret the results (Fig. 1: match 1).
The final output creates baselines specific of a combinationf loading conditions, by clustering the eigenvector coefficientsFig. 1: clustering). The load curves generated are then confrontedith the information collected from the interviews. In this sense,
pecific patterns of electricity use are confronted with reports ofgoing on vacation or weekends off” or with evidence of “we begano heat the house” in a specific week or day. Therefore, relying onhe interview data we could verify whether the baselines had a cor-
espondence with the household electricity consumption habits iniverse circumstances, throughout the year (Fig. 1: match 2).To summarize, the methodology proposed is able to create twoifferent outputs:
Fig. 1. Diagram explaining the process of discovering the daily routines and base-lines specific of loading conditions.
(a) Daily electricity consumption patterns – which correspond toevery-day routines: the major patterns or recurrent behaviors,common to the majority of the days of the dataset.
(b) Loading specific baselines – baselines or routines that are com-mon to groups of days that are characterized by similar loadingconditions across the year, which depend on external load con-ditions. We discover consumption and contextual patterns forspecific loading conditions by clustering eigenvector coeffi-cients of daily signals.
2.1. Unit of analysis
Electricity consumption readings were sampled at 15-min inter-vals. As with earlier work [4], fast Fourier transform was used todecompose the time series into its fundamental frequencies. Thefrequency approximating the 24-h period is the strongest (or sec-ond strongest, see Table 1) and as a result, that period became theunit of analysis. Therefore, a day-vector is composed by 24 readings,which span from 0:00 to 23:00. Secondary frequencies could also
be identified, at shorter periods: every 2–3 h. These likely reflectengines that turn on or off periodically (e.g.: refrigerators or airconditioners).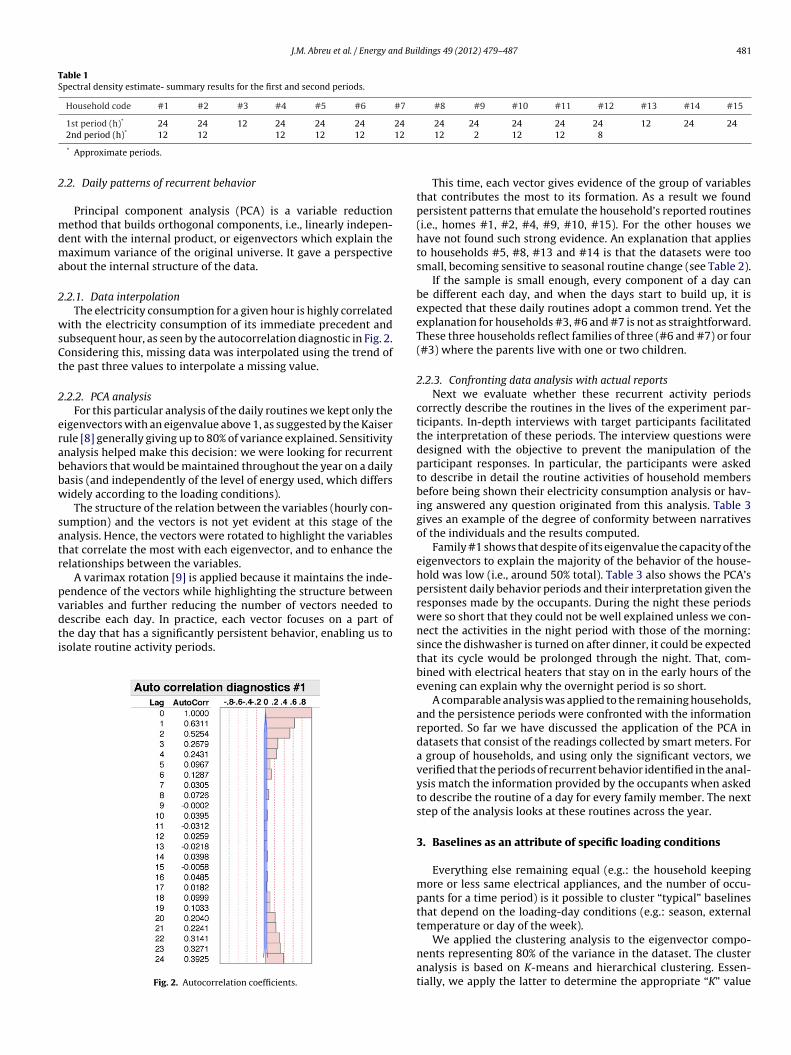
J.M. Abreu et al. / Energy and Buildings 49 (2012) 479–487 481
Table 1Spectral density estimate- summary results for the first and second periods.
Household code #1 #2 #3 #4 #5 #6 #7 #8 #9 #10 #11 #12 #13 #14 #15
1st period (h)* 24 24 12 24 24 24 24 24 24 24 24 24 12 24 2412
2
mdma
2
wsCt
2
erabbw
satr
pvdti
2nd period (h)* 12 12 12 12 12
* Approximate periods.
.2. Daily patterns of recurrent behavior
Principal component analysis (PCA) is a variable reductionethod that builds orthogonal components, i.e., linearly indepen-
ent with the internal product, or eigenvectors which explain theaximum variance of the original universe. It gave a perspective
bout the internal structure of the data.
.2.1. Data interpolationThe electricity consumption for a given hour is highly correlated
ith the electricity consumption of its immediate precedent andubsequent hour, as seen by the autocorrelation diagnostic in Fig. 2.onsidering this, missing data was interpolated using the trend ofhe past three values to interpolate a missing value.
.2.2. PCA analysisFor this particular analysis of the daily routines we kept only the
igenvectors with an eigenvalue above 1, as suggested by the Kaiserule [8] generally giving up to 80% of variance explained. Sensitivitynalysis helped make this decision: we were looking for recurrentehaviors that would be maintained throughout the year on a dailyasis (and independently of the level of energy used, which differsidely according to the loading conditions).
The structure of the relation between the variables (hourly con-umption) and the vectors is not yet evident at this stage of thenalysis. Hence, the vectors were rotated to highlight the variableshat correlate the most with each eigenvector, and to enhance theelationships between the variables.
A varimax rotation [9] is applied because it maintains the inde-endence of the vectors while highlighting the structure between
ariables and further reducing the number of vectors needed toescribe each day. In practice, each vector focuses on a part ofhe day that has a significantly persistent behavior, enabling us tosolate routine activity periods.Fig. 2. Autocorrelation coefficients.
12 2 12 12 8
This time, each vector gives evidence of the group of variablesthat contributes the most to its formation. As a result we foundpersistent patterns that emulate the household’s reported routines(i.e., homes #1, #2, #4, #9, #10, #15). For the other houses wehave not found such strong evidence. An explanation that appliesto households #5, #8, #13 and #14 is that the datasets were toosmall, becoming sensitive to seasonal routine change (see Table 2).
If the sample is small enough, every component of a day canbe different each day, and when the days start to build up, it isexpected that these daily routines adopt a common trend. Yet theexplanation for households #3, #6 and #7 is not as straightforward.These three households reflect families of three (#6 and #7) or four(#3) where the parents live with one or two children.
2.2.3. Confronting data analysis with actual reportsNext we evaluate whether these recurrent activity periods
correctly describe the routines in the lives of the experiment par-ticipants. In-depth interviews with target participants facilitatedthe interpretation of these periods. The interview questions weredesigned with the objective to prevent the manipulation of theparticipant responses. In particular, the participants were askedto describe in detail the routine activities of household membersbefore being shown their electricity consumption analysis or hav-ing answered any question originated from this analysis. Table 3gives an example of the degree of conformity between narrativesof the individuals and the results computed.
Family #1 shows that despite of its eigenvalue the capacity of theeigenvectors to explain the majority of the behavior of the house-hold was low (i.e., around 50% total). Table 3 also shows the PCA’spersistent daily behavior periods and their interpretation given theresponses made by the occupants. During the night these periodswere so short that they could not be well explained unless we con-nect the activities in the night period with those of the morning:since the dishwasher is turned on after dinner, it could be expectedthat its cycle would be prolonged through the night. That, com-bined with electrical heaters that stay on in the early hours of theevening can explain why the overnight period is so short.
A comparable analysis was applied to the remaining households,and the persistence periods were confronted with the informationreported. So far we have discussed the application of the PCA indatasets that consist of the readings collected by smart meters. Fora group of households, and using only the significant vectors, weverified that the periods of recurrent behavior identified in the anal-ysis match the information provided by the occupants when askedto describe the routine of a day for every family member. The nextstep of the analysis looks at these routines across the year.
3. Baselines as an attribute of specific loading conditions
Everything else remaining equal (e.g.: the household keepingmore or less same electrical appliances, and the number of occu-pants for a time period) is it possible to cluster “typical” baselinesthat depend on the loading-day conditions (e.g.: season, externaltemperature or day of the week).
We applied the clustering analysis to the eigenvector compo-nents representing 80% of the variance in the dataset. The clusteranalysis is based on K-means and hierarchical clustering. Essen-tially, we apply the latter to determine the appropriate “K” value

482 J.M. Abreu et al. / Energy and Buildings 49 (2012) 479–487
Table 2Number of reading-days by household.
#7
446
ffi
(
Ttcaitaamha
3
t1attmitics8htcass
TP
Household code #1 #2 #3 #4 #5 #6
Number of days 434 441 377 441 112 432
or K-means. For each case we look for the ideal parameters, butollowed the general criteria of having meaningful lower and max-mum limits:
(a) We chose fifteen as the lower cluster size hoping to combinedays, in one cluster, atypical of the rest of the year (due toheat/cold waves or special days). We found that this condi-tion would still keep out odd days or outliers. Decreasing thelimit even further would fragment the clusters, and would deterpattern analysis.
b) We chose one hundred and fifty as the higher cluster size inthe hope of clustering together “normal behavior for temperatedays”. Exceptions were made for small datasets, for which itmade sense to separate clusters that would otherwise be kepttogether: hence the decision was to evaluate small differencesgiven the fact that the duration of their experiment was shorter.The maximum and minimum cluster size, in this case, was eightand thirty, respectively.
he minimum cluster size that initializes K for the K-means clus-ering algorithm is six – for similar sized datasets the clusteringonditions were not adapted to each dataset. A post-clusteringnalysis is then performed where each day is classified accord-ng to loading conditions. The attributes (or loading conditions)hat classify each day are: average daily temperature, weekendsnd official holidays; these were bundled together and constitutenother descriptive characteristic of the data: working days andonth of the year. As an example, the clustering results for house-
old #1 are discussed in detail in the next sections. A full discussionbout the whole household group is summarized in Section 4.
.1. Household #1
For household #1 the clustering conditions are Euclidian dis-ance of 0.2 and minimum and maximum cluster sizes of 15 and50 days, respectively. The process to select these limits was iter-tive. However, there were also other reasons based in the facthat in one hand we did not want to isolate a cluster so smallhat would have limited probability of being repeated again. The
aximum limit was included almost a third of the days presentn the dataset and approximately 5 months seamed large enougho describe the majority of the variability present for specific load-ng conditions (e.g. temperate days or weekends). The number oflusters was robust because a change in the parameters would notignificantly affect results. Six eigenvectors are representative of0% of variance in the data. The dataset includes 434 days of 24ourly electricity readings. The result of clustering the eigenvec-or coefficients generates five clusters (Fig. 3). In a brief overview,
luster 3 comes forward because it represents 35% of the datasetnd shows a steady low consumption baseline, cluster 4, groupsignificantly less (9%) but it gives evidence of high nocturnal con-umption occurring mostly over weekends during winter, whileable 3eriods of recurrent behavior for household #1 (composed by 2 working adults).
Eigenvalue Tot. var. (%) Period Routin
6.42 26.73 4–6 AM Persis3.11 12.97 3–5 PM Repea
machi2.54 10.58 8–11 PM Both o
#8 #9 #10 #11 #12 #13 #14 #15
185 359 308 428 523 108 67 408
cluster 2, represents 11% but differs from the remaining clusters byits higher electricity consumption during afternoons.
To interpret the clusters, each day of the dataset was classifieda priori according to maximum daily temperature, day of the week(weekend – including official holidays or working days), and month.A graphical representation of a cluster comes along with informa-tion about the number of days clustered (cluster size) and witha load curve showing the average value of consumption and cor-responding error deviation to the consumption centroid for eachhour.
This graph comes alongside with three other pictures that pro-vide the context for each cluster: the distribution of maximumdaily temperatures found in the cluster (on the right of the clus-ter graph), a pie chart showing the proportion of the number ofdays per month, and a pie chart showing the proportion of week-ends against working days. For household #1, a cluster by clusterdiscussion will be done next.
3.1.1. Cluster 0As shown in Fig. 4, 151 days compose cluster 0. It reflects a load
curve of low to medium electricity consumption. The relative vari-ation of the error about the cluster centroids is small. It is morerepresentative of warmer days (the maximum daily temperature is23 ◦C), and in particular, it occurs mostly during summer, autumnand spring. The days included in this cluster are well distributedamongst weekend and weekdays. The cluster seems to represent“electrical consumption” for a warm temperate day, but includestemperatures typical of the summer (maximum of 40 ◦C).
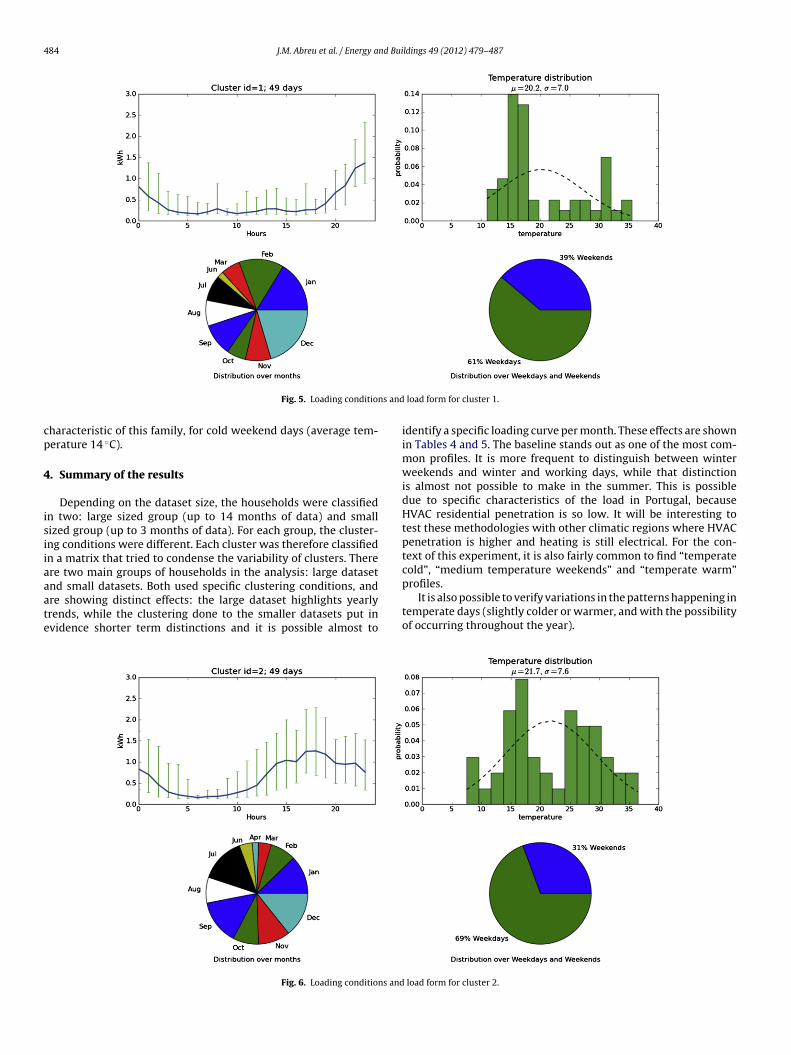
3.1.2. Cluster 1As shown in Fig. 5, cluster 1 aggregates 49 days and is par-
ticularly significant of electricity consumption in the winter. Theevening peak is wider than in cluster 0, and it comprehends morewinter days. It stretches overnight and could represent moderatespace heating and the functioning of large appliances to make useof the electricity savings period. The temperature distribution is yetskewed to the left (high frequency of cooler temperatures, between10 ◦C and 19 ◦C). The error across the hourly centroid curve is largerin particular in the late evening. It seems to correspond for the loadof “temperate days” for moderate outdoor temperature.
3.1.3. Cluster 2Cluster 2 groups 49 days that are more common in the autumn
and early summer (Fig. 6). The most relevant evidence of load curveis its high consumption during afternoons, which could representdays when the household is occupied after lunch, when the laundryand dishwashing machines are left on or even when air condition-
ing is left on to cool off the house for the when the occupants returnhome after work. These options were all mentioned as reportedbehaviors by the occupants of the house. Its relevance in the coolermonths of November and December might be representative ofe activities as reported during the interview
tent period that happens when there is no electrical activity during the night.tedly, one of the occupant’s comes home for lunch and turns on the washingne. “Bimby” (a self cooking pan) stays on during the afternoon to prepare dinnerccupants arrive late at home; dinner, dishwasher.

J.M. Abreu et al. / Energy and Buildings 49 (2012) 479–487 483
ntroid
si
3
dbwblitaim
Fig. 3. Cluster ce
imilar behaviors, only for heating purposes. Yet there is a largerncidence base for the temperature distribution.
.1.4. Cluster 3As shown in Fig. 7, cluster 3 is large cluster that includes 150
ays, or about 34.6% of the total number of days. It embodies theaseline of the house, in particular, the load curve that occurshen the house is unoccupied. The appliances that make this
aseline are cooling appliances (refrigerators) and other deviceseft on stand by or off mode. The temperature distribution charts robust, mostly clustered under the normal distribution line, but
he base temperature chart is large, which means the profile occurslmost independently of the temperature, yet, it is more frequentn warmer months. The distribution across months is wide, butore the cluster is more frequent in the spring, early autumn and
Fig. 4. Loading conditions and
s, household #1.
especially summer. The household is much less likely to run thehome at a baseline level in the winter months.
3.1.5. Cluster 4The number of days grouped by this cluster is 35 (Fig. 8). It
is characterized by high electricity consumption in the evening.The temperature distribution is skewed to the right, instead ofshowing a robust middle term variation, as would the distribu-tion that characterizes cluster 3. The irregular distribution of thetemperature chart suggests larger variation of consumption, whichis reflected by larger error about the cluster centroids. We see
increased consumption in mid-day (between 13:00 and 14:00) andevening (between 19:00 and 02:00). The month range is betweenNovember and February, with weekend and holiday day-type daysproportionally high in comparison to weekdays. The load curve isload form for cluster 0.
484 J.M. Abreu et al. / Energy and Buildings 49 (2012) 479–487
ns and
cp
4
isiiaaate
Fig. 5. Loading conditio
haracteristic of this family, for cold weekend days (average tem-erature 14 ◦C).
. Summary of the results
Depending on the dataset size, the households were classifiedn two: large sized group (up to 14 months of data) and smallized group (up to 3 months of data). For each group, the cluster-ng conditions were different. Each cluster was therefore classifiedn a matrix that tried to condense the variability of clusters. Therere two main groups of households in the analysis: large dataset
nd small datasets. Both used specific clustering conditions, andre showing distinct effects: the large dataset highlights yearlyrends, while the clustering done to the smaller datasets put invidence shorter term distinctions and it is possible almost toFig. 6. Loading conditions and
load form for cluster 1.
identify a specific loading curve per month. These effects are shownin Tables 4 and 5. The baseline stands out as one of the most com-mon profiles. It is more frequent to distinguish between winterweekends and winter and working days, while that distinctionis almost not possible to make in the summer. This is possibledue to specific characteristics of the load in Portugal, becauseHVAC residential penetration is so low. It will be interesting totest these methodologies with other climatic regions where HVACpenetration is higher and heating is still electrical. For the con-text of this experiment, it is also fairly common to find “temperatecold”, “medium temperature weekends” and “temperate warm”
profiles.It is also possible to verify variations in the patterns happening intemperate days (slightly colder or warmer, and with the possibilityof occurring throughout the year).
load form for cluster 2.

J.M. Abreu et al. / Energy and Buildings 49 (2012) 479–487 485
s and
ataw
5
Uncs
Fig. 7. Loading condition
Table 5 summarizes the most common profiles that result ofpplying the methodology to smaller datasets. In this case, theechnique can help distinguish load profiles typical of a month,nd at some extent, even differences between working days andeekends in each month.
. Limitations
Autocorrelation can become a limitation in time series analysis.
sing eigenvector coefficients each day is represented by a combi-ation of time series signals. As a consequence, we are no longeromparing similar time attributes, but instead we compare wholeignals. This fact makes the analysis more robust.Fig. 8. Loading conditions and
load form for cluster 3.
Another limitation of the process is using average daily outdoortemperature as an attribute. The adaptive comfort literature [10]proves that degree days or the variation of the temperature of theday according to a value previously established according to theseason and climate and geography of the place should be tested inplace of temperature because humans adapt and do not make thesame decisions (of heating and cooling the house in different sea-sons for the same temperature). It is also possible that using heatingdegree-days and cooling degree-days as classifiers will improve
interpretation (decreasing the number of climate related bins tointerpret).A limitation of the study is the lack of interpretative explana-tion about which habits and appliances should be responsible to
load form for cluster 4.

486 J.M. Abreu et al. / Energy and Buildings 49 (2012) 479–487
Table 4Distribution of clusters across consumption profiles: large datasets.
Hsh. Winter Temperate weather Summer Baseline
Colder temp. Medium Warmer temp.
Wkd Wkr EqP Wkd Wkr EqP Wkd Wkr EqP Wkd Wkr EqP Wkd Wkr EqP
#1 x x x x x#2 x x x x x x#3 x x x x#4 x x x x x#6 x x x x x x#7 x x x x x x#9 x x x x x x#10 x x#11 x x x x x x#12 x x x x x x#15 x x x x x
Freq. 9 6 3 1 1 4 4 1 6 3 2 4 1 0 3 9
Rank 1st 2nd 4th 6th 6th 3rd 3rd 6th 2nd 4th 5th 3rd 6th 7th 4th 1st
Hsh: household code; Wkd: increased proportion of weekend and holidays; Wrk: increased proportion of working days; EqP: approximately equivalent proportion betweenweekend and weekdays (eq. proportion is 71%:29%).
Table 5Distribution of clusters across consumption profiles: small datasets.
Hsh August/September September/October October November December January Baseline
Wkd Wkr EqP Wkd Wkr EqP Wkd Wkr EqP Wkd Wkr EqP Wkd Wkr EqP Wkd Wkr EqP
#5 x x x x#8 x x x x x x#13 x x x x x#14 x x
H creasew
prhp“Aoocg
6
ahctddst
ehiopati
sh: household code; Wkd: increased proportion of weekend and holidays; Wrk: ineekend and weekdays (eq. proportion is 71%:29%).
roduce the loading identified in the analysis. It is clear that cross-eferencing the load curves with the type of appliances used in theouse and reported seasonal behavior would improve the inter-retation of the load curves. It could help identify practices andculprits” (i.e.: energy intensive appliances that mark load shape).n experiment is the consequence of an experimental design andf the questions planned in the beginning of the study, and the lackf resolution that would enable this cross reference analysis is aonsequence of the initial design. Such analysis is an interestingap to explore in future research.
. Conclusions
Results show that it is possible to automatically (and undernonymity) extract and group persistent routine patterns inouseholds. This information is useful as a way to discriminateonsumption profiles in a population of a geographical area. Givenhe possibility that these patterns may change according to social-emographic characteristics such information is useful to helpesign better incentives (or other regulator mechanisms) for loadhaping, and services that can be tailored to the characteristics ofhe populations.
The second main highlight of the research is the ability to studyvery individual family and cluster together groups of days thatave similar baselines in common. Every day of the universe was
dentified by its loading characteristics, which are then interpreted
nce the days are clustered together into groups. The results areersonalized baselines that have a certain probability to occur forny given day. Following the process described in the paper, forhe majority of the households of the experiment, it is possible todentify the profiles that correspond to the following patterns:d proportion of working days; EqP: approximately equivalent proportion between
1st baseline or the electricity consumed by vampire loads (stand-bys, off modes) and large appliances (refrigerators) without thepresence of the occupants.1st cold weekend days, which are profiles that occur in the winterover the weekend.2nd cold working days. This baseline occurs mostly during the win-ter, and reflects the impact of electrical heating in the evenings.2nd temperate days is a profile that can happen in any season andreflects the behavior of the occupants when there is no need forheating or air conditioning.
As put in evidence by the approach presented in this paper, patternrecognition analysis can be refined to characterize the response ofhouseholds to specific conditions, given the intrinsic characteristicsof the family, and it may be useful to help predict what families donext.
An alternative application of this approach is in the field ofimproving feedback provided to households about electricity con-sumption. In this case, comparisons of real time consumption couldbe made with the “best” consumption pattern of the recent–past forthe same loading conditions. The development of this type of feed-back mechanism could enable tailor-made suggestions that reflectthe actual conditions of the household.
Acknowledgements
The authors acknowledge advice by Jorge Vasconcelos MITPortugal Program and Inês Lima Azevedo, Carnegie Melon Uni-versity. This research was supported by the Portuguese ScienceFoundation (SFRH/BD 40595/2007) and the German company Yel-loStrom, B.V.

nd Bui
R
J.M. Abreu et al. / Energy a
eferences
[1] F. van Raaij, T. Verhallen, A behavioral model of residential energy use, Journalof Economic Psychology 3 (1983) 39–63.
[2] W. Heijs, Household energy consumption, in: W. Heijs (Ed.), Household EnergyConsumption. Habitual Behavior and Technology, Springer, 2006.
[3] S. Darby, Smart metering: what potential for householder engagement? Build-
ing Research & Information 38 (October (5)) (2010) 442–457.[4] F. Calabrese, J. Reades, C. Ratti, Eigenplaces: Segmenting Space through DigitalSignatures, 2010.
[5] N. Eagle, A. (Sandy) Pentland, Reality mining: sensing complex social systems,Personal and Ubiquitous Computing 10 (November (4)) (2005) 255–268.
[
ldings 49 (2012) 479–487 487
[6] O. Santin, Behavioral patterns and user profiles related to energy consumptionfor heating, Energy and Buildings 43 (2011) 2662–2672.
[7] Z. Yu, B. Fung, F. Haghighat, H. Yoshino, E. Morofsky, A systematic procedureto study the influence of occupant behavior on building energy consumption,Energy and Buildings 43 (2011) 1409–1417.
[8] I. Witten, E. Frank, Data Mining Practical Machine Learning Tools and Tech-niques, second ed., Morgan Kaufmann, San Francisco, 2005, p. 524.
[9] J. Maroco, Análise Estatística com o PASW Statistics. Pero Pinheiro: ReportNumber, 2010, p. 953.
10] B. Moujalled, R. Cantin, G. Guarracino, Comparison of thermal comfort algo-rithms in naturally ventilated office buildings, Energy and Buildings 40 (12)(2008) 2215–2223.