Energy access scenarios to 2030 for the power sector in...
16
Discussion Energy access scenarios to 2030 for the power sector in sub-Saharan Africa Morgan Bazilian a, * , Patrick Nussbaumer a , Hans-Holger Rogner b , Abeeku Brew-Hammond c , Vivien Foster d , Shonali Pachauri e , Eric Williams b , Mark Howells f , Philippe Niyongabo g , Lawrence Musaba h , Brian Ó Gallachóir i , Mark Radka j , Daniel M. Kammen d a United Nations Industrial Development Organization, Vienna, Austria b International Atomic Energy Agency, Vienna, Austria c The Energy Center, KNUST, Kumasi, Ghana d The World Bank, Washington DC, USA e International Institute for Applied Systems Analysis, Laxemberg, Austria f KTH Technical University, Stockholm, Sweden g African Union Commission, Addis Ababa, Ethiopia h Southern African Power Pool, Harare, Zimbabwe i University College Cork, Cork, Ireland j United Nations Environment Programme, Paris, France article info Article history: Received 19 September 2011 Received in revised form 31 October 2011 Accepted 1 November 2011 JEL classification: C1 Q41 Q47 Keywords Energy access Power system planning Electricity scenarios abstract In order to reach a goal of universal access to modern energy services in Africa by 2030, consideration of various electricity sector pathways is required to help inform policy-makers and investors, and help guide power system design. To that end, and building on existing tools and analysis, we present several ‘high-level’, transparent, and economy-wide scenarios for the sub-Saharan African power sector to 2030. We construct these simple scenarios against the backdrop of historical trends and various interpretations of universal access. They are designed to provide the international community with an indication of the overall scale of the effort required e one aspect of the many inputs required. We find that most existing projections, using typical long-term forecasting methods for power planning, show roughly a threefold increase in installed generation capacity occurring by 2030, but more than a tenfold increase would likely be required to provide for full access e even at relatively modest levels of electricity consumption. This equates to approximately a 13% average annual growth rate, compared to a historical one (in the last two decades) of 1.7%. Ó 2011 Elsevier Ltd. All rights reserved. 1. Introduction The provision of reliable, secure, and affordable energy services are central to addressing many of today’s global development challenges, including poverty, inequality, climate change, food security, health and education. They are also required for wealth creation and economic development. The link between energy and the Millennium Development Goals (MDGs) has been discussed extensively in the literature (e.g., Modi et al., 2005; AGECC, 2010) and energy poverty is acknowledged as undermining achievement of the MDGs. The obstacles to widespread energy access, and specifically electricity access, are largely well known (i.e., financing, planning, governance, and human and institutional capabilities), yet not trivial to overcome. While there are no fundamental tech- nical obstacles preventing universal energy access, there is, however, a lack of effective institutions, good business models, transparent governance, and appropriate legal and regulatory frameworks. This work is aimed at improving understanding about the scale of reaching universal access to electricity services in sub- Saharan Africa (SSA) and clarifying the role of the international community. It is, of course, only one aspect of the information required. Current actions to eliminate energy poverty are falling short both in terms of scale and pace. In fact, if current trends continue, more people in Africa will be without access to modern energy services in 2030 than today (IEA, UNDP and UNIDO, 2010). Changing this requires global political commitment that goes * Corresponding author. E-mail address: [email protected] (M. Bazilian). Contents lists available at SciVerse ScienceDirect Utilities Policy journal homepage: www.elsevier.com/locate/jup 0957-1787/$ e see front matter Ó 2011 Elsevier Ltd. All rights reserved. doi:10.1016/j.jup.2011.11.002 Utilities Policy 20 (2012) 1e16
Transcript of Energy access scenarios to 2030 for the power sector in...

Discussion
Energy access scenarios to 2030 for the power sector in sub-Saharan Africa
Morgan Bazilian a,*, Patrick Nussbaumer a, Hans-Holger Rogner b, Abeeku Brew-Hammond c,Vivien Foster d, Shonali Pachauri e, Eric Williams b, Mark Howells f, Philippe Niyongabo g,Lawrence Musaba h, Brian Ó Gallachóir i, Mark Radka j, Daniel M. Kammen d
aUnited Nations Industrial Development Organization, Vienna, Austriab International Atomic Energy Agency, Vienna, Austriac The Energy Center, KNUST, Kumasi, Ghanad The World Bank, Washington DC, USAe International Institute for Applied Systems Analysis, Laxemberg, AustriafKTH Technical University, Stockholm, SwedengAfrican Union Commission, Addis Ababa, Ethiopiah Southern African Power Pool, Harare, ZimbabweiUniversity College Cork, Cork, IrelandjUnited Nations Environment Programme, Paris, France
a r t i c l e i n f o
Article history:Received 19 September 2011Received in revised form31 October 2011Accepted 1 November 2011
JEL classification:C1Q41Q47
KeywordsEnergy accessPower system planningElectricity scenarios
a b s t r a c t
In order to reach a goal of universal access to modern energy services in Africa by 2030, consideration ofvarious electricity sector pathways is required to help inform policy-makers and investors, and help guidepower systemdesign. To thatend, andbuildingonexisting tools andanalysis,wepresent several ‘high-level’,transparent, and economy-wide scenarios for the sub-Saharan African power sector to 2030. We constructthese simple scenarios against the backdrop of historical trends and various interpretations of universalaccess. They are designed to provide the international community with an indication of the overall scale ofthe effort required e one aspect of the many inputs required. We find that most existing projections, usingtypical long-term forecasting methods for power planning, show roughly a threefold increase in installedgeneration capacity occurring by 2030, butmore than a tenfold increasewould likely be required to providefor full access e even at relatively modest levels of electricity consumption. This equates to approximatelya 13% average annual growth rate, compared to a historical one (in the last two decades) of 1.7%.
� 2011 Elsevier Ltd. All rights reserved.
1. Introduction
The provision of reliable, secure, and affordable energy servicesare central to addressing many of today’s global developmentchallenges, including poverty, inequality, climate change, foodsecurity, health and education. They are also required for wealthcreation and economic development. The link between energy andthe Millennium Development Goals (MDGs) has been discussedextensively in the literature (e.g., Modi et al., 2005; AGECC, 2010)and energy poverty is acknowledged as undermining achievementof the MDGs. The obstacles to widespread energy access, and
specifically electricity access, are largely well known (i.e., financing,planning, governance, and human and institutional capabilities),yet not trivial to overcome. While there are no fundamental tech-nical obstacles preventing universal energy access, there is,however, a lack of effective institutions, good business models,transparent governance, and appropriate legal and regulatoryframeworks. This work is aimed at improving understanding aboutthe scale of reaching universal access to electricity services in sub-Saharan Africa (SSA) and clarifying the role of the internationalcommunity. It is, of course, only one aspect of the informationrequired.
Current actions to eliminate energy poverty are falling shortboth in terms of scale and pace. In fact, if current trends continue,more people in Africa will be without access to modern energyservices in 2030 than today (IEA, UNDP and UNIDO, 2010).Changing this requires global political commitment that goes* Corresponding author.
E-mail address: [email protected] (M. Bazilian).
Contents lists available at SciVerse ScienceDirect
Utilities Policy
journal homepage: www.elsevier .com/locate/ jup
0957-1787/$ e see front matter � 2011 Elsevier Ltd. All rights reserved.doi:10.1016/j.jup.2011.11.002
Utilities Policy 20 (2012) 1e16

beyond abstract political statements and sets out actions andassociated benchmarks (Bazilian et al., 2010b). To that end, a goalof achieving sustainable energy for all, with a 2030 target ofproviding universal access to modern energy services, was putforth to the international community in 2010 by the UnitedNations Secretary-General’s Advisory Group on Energy andClimate Change (AGECC, 2010)1. Supporting this goal, the UnitedNations General Assembly declared 2012 as the International Yearfor Sustainable Energy for All2. Thus, the time is ripe for scaling-upefforts.
To help inform debate, investment, and more detailed analysis,we focus on the economy-wide3 electricity sector, and review theliterature and present several simple and transparent scenarios forthe sub-Saharan African (SSA) power sector to 2030. We mainlyfocus on those countries with very low rates of access to electricityservices and so generally exclude the Republic of South Africa (RSA)from the analysis. The scenarios are simple because we generallyemploy simplified power system planning and forecastingmethods, and focus primarily on one metric, namely, installedgeneration capacity. (As a result, issues of cost are generally outsidethe scope of this paper.) They are transparent because we clearlyidentify all inputs and parameters, as well as present ranges for ourassumptions. We focus on generation capacity as a useful metric tocommunicate the issue, as it is more easily understandable toa non-specialist audience than, say, electricity demand. (In otherwords, it is easier to discuss electricity supply issues in terms ofpower plants (i.e., MW) than electrical power (i.e., TWh).) Thiswork is aimed at helping at improving understanding about thescale of reaching universal access to electricity services in SSA andthe resultant decision-making processes. Hence, it serves to refineinput assumptions, parameters, and the nature of outputs fromfuture, more detailed analysis, while informing decision-makingtoday.
Section 2 briefly reviews the related literature and discussesvarious approaches for energy planning and demand projections. Italso touches upon the associated issues of capacity building anddata paucity. In Section 3, a concise historical overview of powersystems in Africa is presented4. Related published or on-goingmodeling efforts are described in Section 4. In Section 5, wepresent some simple energy access scenarios. Finally, Section 6presents conclusions. As the approach in this paper is at a rela-tively high level of abstraction, we provide extensive referencesthroughout (where there a many references, we generally cite themin footnotes). We also provide additional and complementaryanalysis in the Annexes (1e5) related to alternative estimates forgeneration requirements, costing, and more detailed analysesspecific to household electricity needs5.
2. Energy planning
Comprehensive energy systems planning aims at ensuring thatenergy-related policy and investment decisions consider all
possible energy supply and demand side options, and are consis-tent with broader national goals (e.g., sustainable development)6. Anecessary prerequisite, however, is the existence of national energyplanning capability (capacity). Energy planning capacity increasesa country’s ability to anticipate and respond to the rapid changesoccurring, and new issues and opportunities arising. The value ofthis asset increases over time, as experts gain experience inapplying their skills, build the local knowledge base and forgerelationships with stakeholders from diverse sectors. Inadequatenational planning capability and consequent poor policy andinvestment decisions in the past have led to disparate level ofaccess to modern energy services. Energy planning is also a matterthat extends beyond national borders, especially for smallercountries with underdeveloped energy resource potentials (e.g.,hydropower) or where sharing infrastructure with neighbourswould provide economies-of-scale.
There is a large ongoing discussion around market reform andliberalization in SSA power systems. (As an ilustration of this,Eberhard et al. (2011) dedicate an entire chapter on reformingState-owned enterprises.) Over the last 20 years many developingcountries have adopted far-reaching policies that encourage liber-alization and privatization, often at the behest of major interna-tional funders and development organizations.While these policieshave often improved the “health” of individual national utilities,with very few exceptions they have not led to dramatic increases inenergy access, for the simple reason that meeting the electricityneeds of the poorest is not very profitable for utilities. This debatecoincided with the same dialogue that occurred in the OECD overthe last two decades; in these industrialised countries it too has hadvery mixed results. The clear benefits of liberalizing these mostlyfragile markets are unclear, where it has been ideologically pushedon to these countries, it is often to their detriment, despite goodintentions7.
Likemany facetsofpublicpolicy, energypolicyhasbeen informedby recourse to analytical models8. However, the outputs, temporaland spatial scope, sophistication, language, assumptions, systemboundaries, and theoretical frameworks of these analytical tools varydramatically. Thus, the results of these analyses require someconsiderable level of filtration and translation in order to appropri-ately inform design and implementation of government policy.Apropos of this, Munson (2004) notes that there is a, “disconnectbetween the questions policymakerswant answered and the resultsprovided by modelling exercises”. Power system analyses can be
1 Twoother targets, informedbyAGECCand furtherconsultation, togethercomprisea wider sustainable energy goal. The other two are: to double the historic rate ofimprovement in energy efficiency, and double the percentage of renewable energy inthe overall fuel mix by 2030.
2 For more information: http://www.sustainableenergyforall.org.3 The analysis includes all sectors of the economy. This is a required clarification
as many pieces of related analysis only consider household energy demand.4 In general we focus on historical data from the past 20 years.5 The results in the various Annexes are not directly comparable as they employ
different methodologies, parameters, etc.
6 The literature on energy planning is vast (See e.g., Alarcon-Rodriguez et al.,2010; Alcamo, 1984; Allan and Billinton, 1988; Andersson, 1988; Antunes et al.,2004; Balachandra and Chandru, 1999; Barda et al., 1990; Berry and Hirst, 1990;Boulanger and Bréchet, 2005; Dijk and Kok, 1987; D’Sa, 2005; El-Fouly et al.,2008; Elshafei, 1979; Garcia et al., 2008; Ghanadan and Koomey, 2005; Güven,1994; Hart and Jacobson, 2011; Heinrich et al., 2007; Kobos et al., 2006; Pokhareland Chandrashekar, 1998; Psarras et al., 1990; Rachmatullah et al., 2007; Rath-Nageland Voss, 1981; Samouilidis and Berahas, 1983; Shrestha and Bhattarai, 1994; Silvaand Nakata, 2009; Spinney and Watkins, 1996; St. Denis and Parker, 2009; Turkson,1990; Voropai and Ivanova, 2002, and Wu et al., 2000).
7 See e.g., Arango and Larsen, 2011; Auriol and Blanc, 2009; Dubash, 2003;Gillwald, 2005; Gratwick and Eberhard, 2008; Gualberti et al., 2009; Habtetsionand Tsighe, 2007; Haselip, 2007; Haselip and Hilson, 2005; Haselip and Potter,2010; Jamasb, 2006; Malgas and Eberhard, 2011; Mebratu and Wamukonya,2007; Nagayama, 2007; Nagayama, 2009; Nagayama and Kashiwagi, 2007;Nyoike, 2002; Patlitzianas et al., 2006; Pineau, 2007; Sioshansi, 2006; Turksonand Wohlgemuth, 2001; Williams and Ghanadan, 2006, and Zhang et al., 2005.
8 Creating a taxonomy of the various energy models is difficult, although there isa wide literature available (e.g., IPCC, 2001; Weyant, 2004; Edenhofer, 2005;Nakata, 2004; Barker et al., 2006, and Fisher et al., 2007). Reviews are available(see Huntington (2002) or Nakata (2004)) which focus on the primary energymodels used in practice (e.g., WASP, POLES, PRIMES, MARKAL, AMIGA, MERGE,MESSAGE, LEAP, NEMS, ENPEP, MIT-EPPA, G3, GTEM, and MACRO).
M. Bazilian et al. / Utilities Policy 20 (2012) 1e162
considered a sub-set of energy system modelling. For the powersector, integrated resource planning models (IRP) are often used9.
Power system analyses, management and planning are usedover various timeframes e from sub-second (load balancing) toseveral decades (capacity expansion). The planning methodologiesemployed and the aims of the analytical work vary accordingly. Wefocus on the long-term, i.e. over a 5e20 year time horizon, thefoundation of which is normally a set of electricity (or energy)demand projections. Electricity capacity expansion planninggenerally tends to be based on some type of least-cost optimisationgiven various constraints that mirror existing physical infrastruc-ture conditions, access to finance, public policy regarding envi-ronment protection or energy security considerations. Manymodern mathematical techniques ranging from fuzzy logic, toevolutionary programming, to mixed integer linear programmingand multi-objective optimisation are in general use in governmentplanning offices and utilities worldwide10. A trend towardsaccommodating various aspects of uncertainty and liberalizedmarkets is apparent in recent research in this subject. However, formost power systems in sub-Saharan Africa, a high level of meth-odological sophistication may not be required to get underwaywith generation and infrastructure planning.
A clear issue that emerges in energy planning relates to datapaucity and quality (Bazilian et al., 2010a). Energy modeling, whichlies at the heart of most planning processes, tends to be very data-intensive, which creates obstacles for many countries (Howellset al., 2010). A reliable and comprehensive information base isrequired to set targets and monitor outcomes, to design strategiesand policies, to make evidence-based decisions, and to enableconsumers to make informed choices11. Moreover, poor and incon-sistent national statistics limit cross-country analysis and under-mine efforts to implement global or regional programmes. Still,a lack of data, should not be used as a justification for delayingbuilding national energy planning capability and developing energyplans. Missing data can be derived from first principles or estimates,and used as placeholders until better data become available12.
2.1. Energy demand projections
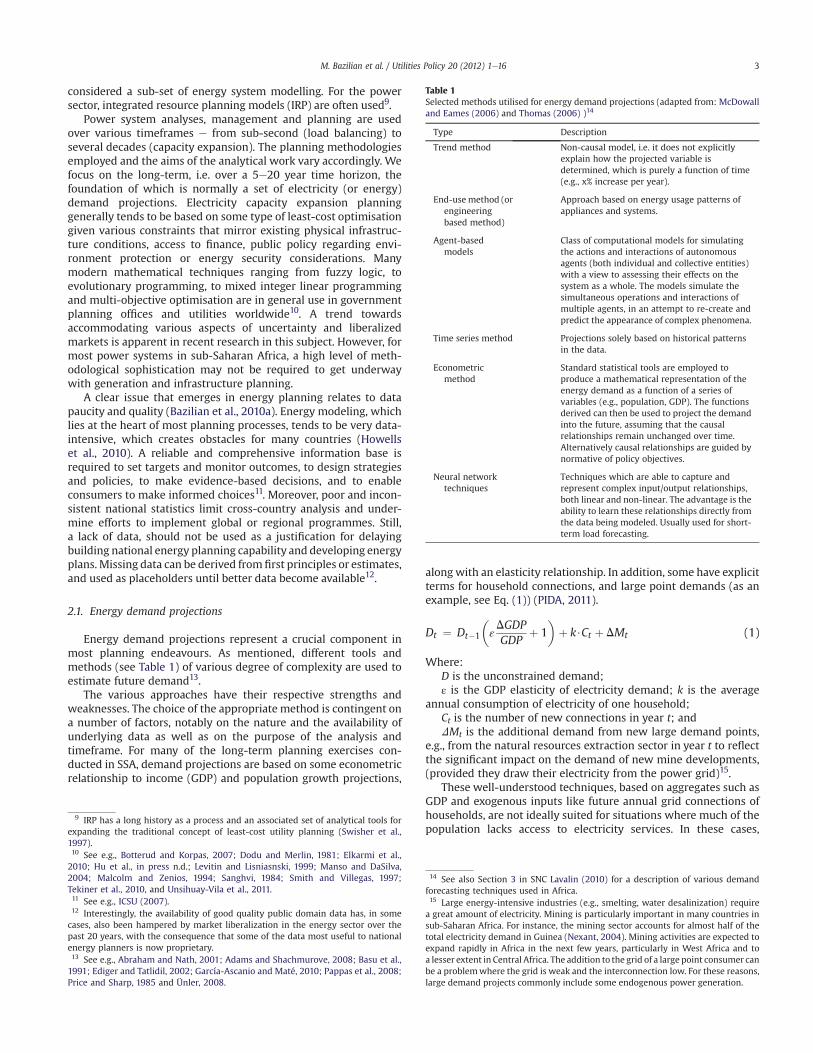
Energy demand projections represent a crucial component inmost planning endeavours. As mentioned, different tools andmethods (see Table 1) of various degree of complexity are used toestimate future demand13.
The various approaches have their respective strengths andweaknesses. The choice of the appropriate method is contingent ona number of factors, notably on the nature and the availability ofunderlying data as well as on the purpose of the analysis andtimeframe. For many of the long-term planning exercises con-ducted in SSA, demand projections are based on some econometricrelationship to income (GDP) and population growth projections,
alongwith an elasticity relationship. In addition, some have explicitterms for household connections, and large point demands (as anexample, see Eq. (1)) (PIDA, 2011).
Dt ¼ Dt�1
�ε
DGDPGDP
þ 1�þ k$Ct þ DMt (1)
Where:D is the unconstrained demand;ε is the GDP elasticity of electricity demand; k is the average
annual consumption of electricity of one household;Ct is the number of new connections in year t; andDMt is the additional demand from new large demand points,
e.g., from the natural resources extraction sector in year t to reflectthe significant impact on the demand of new mine developments,(provided they draw their electricity from the power grid)15.
These well-understood techniques, based on aggregates such asGDP and exogenous inputs like future annual grid connections ofhouseholds, are not ideally suited for situations where much of thepopulation lacks access to electricity services. In these cases,
Table 1Selected methods utilised for energy demand projections (adapted from: McDowalland Eames (2006) and Thomas (2006) )14
Type Description
Trend method Non-causal model, i.e. it does not explicitlyexplain how the projected variable isdetermined, which is purely a function of time(e.g., x% increase per year).
End-usemethod (orengineeringbased method)
Approach based on energy usage patterns ofappliances and systems.
Agent-basedmodels
Class of computational models for simulatingthe actions and interactions of autonomousagents (both individual and collective entities)with a view to assessing their effects on thesystem as a whole. The models simulate thesimultaneous operations and interactions ofmultiple agents, in an attempt to re-create andpredict the appearance of complex phenomena.
Time series method Projections solely based on historical patternsin the data.
Econometricmethod
Standard statistical tools are employed toproduce a mathematical representation of theenergy demand as a function of a series ofvariables (e.g., population, GDP). The functionsderived can then be used to project the demandinto the future, assuming that the causalrelationships remain unchanged over time.Alternatively causal relationships are guided bynormative of policy objectives.
Neural networktechniques
Techniques which are able to capture andrepresent complex input/output relationships,both linear and non-linear. The advantage is theability to learn these relationships directly fromthe data being modeled. Usually used for short-term load forecasting.
9 IRP has a long history as a process and an associated set of analytical tools forexpanding the traditional concept of least-cost utility planning (Swisher et al.,1997).10 See e.g., Botterud and Korpas, 2007; Dodu and Merlin, 1981; Elkarmi et al.,2010; Hu et al., in press n.d.; Levitin and Lisniasnski, 1999; Manso and DaSilva,2004; Malcolm and Zenios, 1994; Sanghvi, 1984; Smith and Villegas, 1997;Tekiner et al., 2010, and Unsihuay-Vila et al., 2011.11 See e.g., ICSU (2007).12 Interestingly, the availability of good quality public domain data has, in somecases, also been hampered by market liberalization in the energy sector over thepast 20 years, with the consequence that some of the data most useful to nationalenergy planners is now proprietary.13 See e.g., Abraham and Nath, 2001; Adams and Shachmurove, 2008; Basu et al.,1991; Ediger and Tatlidil, 2002; García-Ascanio and Maté, 2010; Pappas et al., 2008;Price and Sharp, 1985 and Ünler, 2008.
14 See also Section 3 in SNC Lavalin (2010) for a description of various demandforecasting techniques used in Africa.15 Large energy-intensive industries (e.g., smelting, water desalinization) requirea great amount of electricity. Mining is particularly important in many countries insub-Saharan Africa. For instance, the mining sector accounts for almost half of thetotal electricity demand in Guinea (Nexant, 2004). Mining activities are expected toexpand rapidly in Africa in the next few years, particularly in West Africa and toa lesser extent in Central Africa. The addition to the grid of a large point consumer canbe a problemwhere the grid is weak and the interconnection low. For these reasons,large demand projects commonly include some endogenous power generation.
M. Bazilian et al. / Utilities Policy 20 (2012) 1e16 3

a different type of approach is needed, for example solving fora future goal and back-casting, rather than forecasting based onhistorical trends. Ensuring that the type of analysis is appropriatefor the policy and investment questions is essential16. It has beenargued that in a severely supply-constrained electricity system,demand projections are less important than capacity expansionplanning and associated finance. In other words, in typical devel-oping country situations additional supply would create its owndemand (Langlois et al., 2011).
3. Historical energy trends
Sub-Saharan Africa suffers acutely from a lack of access toelectricity and poor quality of supply, in terms of cost and reliability,where it does exist. There are approximately 580 million people onthe continent without access (IEA, UNDP and UNIDO, 2010) e thebulk of them living in rural areas. Overall the electrification rate inSSA is around 30% (60% urban; 14% rural) (IEA, UNDP and UNIDO,2010). Full analysis of the energy landscape for Africa is availablefrom several sources (e.g., Foster and Briceño-Garmendia, 2010;and Eberhard et al., 2011 17). The recent power system academicliterature on the topic of Africa is dominated by discussions aroundsolar power in North Africa. Also, much of the literature on thepower sector in SSA is not surprisingly focused on the Republic of
South Africa (RSA)18. However, there has been a steady group ofdedicated researchers focusing on SSA19 or on particular SSAcountries20. Still, there is a relatively small existing literature onscenarios for the power sector in sub-Saharan Africa21.
The total average per capita annual consumption in SSA(excluding RSA22) is around 155 kWh (based on 2008 EIA data)23.These figures are minute compared to South Africa (4770 kWh/percapita) or Organisation for Economic Co-operation and Develop-ment (OECD) countries24. To get a sense of the scale, Eberhard et al.(2011) note that, “Installed capacity [in Africa] will need to grow bymore than 10 percent annually just to meet Africa’s suppresseddemand25, keep pacewith projected economic growth, and provideadditional capacity to support efforts to expand electrification.-Most new capacity would be used to meet non-residentialdemands from the commercial and industrial sectors.”
Fig. 1. MWs installed per one million people by region (Eberhard et al., 2011).
16 The challenge is that funding bodies often insist that sophisticated models beused in analyzing potential investments, and take comfort in tools and approachesmore suitable for OECD countries.17 In addition, the Africa Infrastructure Country Diagnostic Programme (AICD) isan especially important contribution to knowledge in this area. The Africa Infra-structure Country Diagnostic (AICD) was an unprecedented knowledge program onAfrica’s infrastructure that grew out of the pledge by the G8 Summit of 2005 atGleneagles to substantially increase ODA assistance to Africa. The AICD study wasfounded on the recognition that sub-Saharan Africa (SSA) suffers from a very weakinfrastructural base, and that this is a key factor in the SSA region failing to realizeits full potential for economic growth, international trade, and poverty reduction(see http://www.infrastructureafrica.org).
18 See e.g., Auriol and Blanc, 2009; Davidson and Mwakasonda, 2004; Davis, 1998;Graeber and Spalding-Fecher; 2000, Inglesi-Lotz, 2011; Inglesi-Lotz and Blignaut, inpress n.d.; Meyer and Greyvenstein, 1991; Odhiambo, 2009; Pereira et al., 2011;Sigauke and Chikobvu, in press n.d.; Steinbuks and Foster, 2010; Tewari andShah, 2003; Thom, 2000; Winkler, 2005; Ziramba, 2008; Eskom, 2009; GoSA,2010; World Bank, 2007 and Bazilian et al., 2011.19 See e.g., Ben-Yaacov, 1979; Bugaje, 2006; Chineke and Ezike, 2010; Deichmannet al., 2011; Girod and Percebois, 1998; Gnansounou et al., 2007; Inglesi, 2010;Karekezi and Kimani, 2002; Lazenby and Jones, 1987; Maboke and Kachienga,2008; Murphy, 2001; Pineau, 2008; Sebitosi, 2008; Sebitosi and Okou, 2010;Sebitosi et al., 2006a; Sebitosi et al., 2006b; Turkson and Wohlgemuth, 2001;Wolde-Rufae, 2006 and UNECA and UNEP, 2007.20 See e.g., Akinlo, 2009; Amobi, 2007; Buchholz and Da Silva, 2010; Gujba et al.,2011; Kouakou, 2011; Mangwengwende, 2002; Mbohwa, n.d.; Neelsen and Peters,2011; Nhete, 2007; Nyoike, 2002; Pineau, 2002; Pineau, 2007; Norad, 2009 andRowlands, 1994.21 See e.g., Adam and Moodley, 1993; Bekker et al., 2008; Brew-Hammond andKemausuor, 2009; Deichmann et al., 2011; Garrett, 1994; Gnansounou et al., 2007;Gujba et al., 2011; Maboke and Kachienga, 2008; Winkler et al., 2009; Karakezi,2006; Davidson, 2002; Davidson, 2004 and Sparrow et al., 2003.22 We often focus on SSA without South Africa to give a more focused perspectiveon energy access; as South Africa has around a 75% rate of access to electricity.23 This figure is for the entire economy. Eberhard et al. (2011) cites this as 124kWh/capita (perhaps the discrepancy arises due to different base year data sets).24 e.g., Chile: 3327 kWh/per capita; Germany: 7148 kWh/per capita; USA: 13,647kWh/per capita (IEA, 2011).25 Suppressed demand refers to the difference between notional demand andsupply (Eberhard et al., 2011; p.55).
M. Bazilian et al. / Utilities Policy 20 (2012) 1e164

Fig. 1 shows the total electricity generation capacity installedper million persons (MW/mln) in various regions. It is recognisedthat this is a relatively rough metric as it does not take into accounta number of crucial parameters, including: transmission anddistribution (T&D) losses, load patterns, locational constraints,intermittency, temporal reserve, availability, operating efficiency,and outage rates. Compared to other world regions, the ratio ofelectricity generation capacity per million inhabitants is low inAfrica, particularly in sub-Saharan Africa26. The figure for Sub-Saharan Africa (excluding RSA) was roughly 129 MW/mln in 2008only considering people with electricity access; if the entire pop-ulation is included, the total is about 40 MW/mln.
In terms of electrification of the underserved, history providescompelling evidence that significant increases in the percentages ofhouseholds with access to electricity can be achieved over rela-tively short periods of time. As an illustrative example, electrifica-tion rose sharply in a number of countries, such as the USA and UKearly in the 20th century, and in China, Brazil, and Thailand morerecently (see Fig. 2). In the case of Thailand, the percentage of thepopulationwith access to electricity went from about 25% to almost100% in a decade. Still, most countries take at least three decades tomake this transition e and most quite a bit longer. In all thesecountries, electrification, particularly of rural areas, was accordeda high national priority because of economic development or equityobjectives.
While several countries in SSA have show dramatic growth(around four-fold) over the last two decades, these mostly startedfroma relatively small installed capacity. Themajority of countries inthe region have had sluggish growth, or even a decline in installedcapacity27.Onaverage, installedelectricitycapacity inSSA (excludingRSA) grew relatively steadily at around 1.7% per annum. A closer lookat the rate of historical growth (or contraction) in African countries(see Fig. 3) is useful for several reasons. First, it illustrates that there isno discernible pattern of any overall increase of the growth rate overtime.Onemight suppose thatwithgrowingrecognitionof the crucial
importance of energy, and electricity in particular, efforts to boostgenerating capacity would have been more pronounced in recentyears. This notwithstanding, there are early signs that some accel-eration in the expansion of Africa’s generation capacity may betaking place. Data on donor commitments to power projects suggestthat during the last five years an annual average of 3 GW of genera-tion projects have been committed. Furthermore, the Annual Reportof the Infrastructure Consortium for Africa 2010 notes that membercommitments to energy projects in Sub-Saharan Africa rose fromUSD 1.2 billion in 2006 to USD 8.0 billion in 2010.
Second, whilst it shows a very wide range of values28, thegrowth rate is generally between 0 and 10%, with the bulk beingbetween 0 and 5%. Third, the variability of the change in installedcapacity is high, and is decreasing with time, particularly duringrecent years. And fourth, the graphical representation indicatesthat larger systems (depicted as red dots in the Figure) (that is,countries with greater existing capacity and transmission anddistribution grids), tend to expand their capacity faster than docountries with medium and small electricity systems. In fact, withfew exceptions countries with smaller electricity systems (dots inblue in the graph) have relatively low growth, or even sometimesnegative growth, particularly at the end of the 1990s.
Of course, the countries and regions of SSA are acutely aware ofenergy access issues, both in terms of quantity and quality, andhave been developing national targets and regional plans. UNDPand WHO (2009) calculated that 68 developing countries haveelectricity targets. Brew-Hammond (2010) reviews several sets ofambitious energy access targets as agreed by the regional group-ings within the region.
4. Outlook for Africa
4.1. Existing electricity demand projections
In this section, we briefly consider some of the data sets andprojections for the power sector in Africa. For an initial sense ofscale, using EIA data, Africa has a current installed generatingcapacity in 2008 of about 122 GW, SSA had 75 GW, and SSA
Fig. 2. Evolution of household electrification over time in selected countries (Pachauri et al., 2011).
26 As illustrative examples of the installed capacity per million of population:Chad and Rwanda: 3 MW/mln; Ethiopia: 10 MW/mln; Cameroon: 54 MW/mln;Ghana: 72 MW/mln; Cape Verde: 150 MW/mln; Namibia: 192 MW/mln; SouthAfrica: 854 MW/mln.27 And these are not countries nearing full electrification. 28 Ranging from �50% to þ157%.
M. Bazilian et al. / Utilities Policy 20 (2012) 1e16 5

(excluding RSA) had 31 GW29. This compares roughly to 28 GW inArgentina in the same year.
Africa is included in the major energy outlooks from the Inter-national Energy Agency (IEA), the US Department of Energy’sEnergy Information Agency (EIA), British Petroleum (BP), andothers. Each data set has different levels of descriptive information,coverage, and aggregation30.We primarily relied on the EIA data setas it was the most transparent and complete in terms of accessiblecountry time-series data. It is useful to look at results of these high-level global modeling exercises to get a sense of the numbers beingfed into the “global energy dialogue”.
As an example, the IEA (2010) projects total installed capacityfor all of Africa at between 270e291 GW in 2030. Depending onone’s assumptions about the ratio of SSA and RSA to the Africancontinent, these figures imply approximately 70e80 GW in SSA(without RSA) in 2030.
Most of the African sub-regions have carried out forecastingexercises for peak energy demand31, commonly both in terms ofpeak demand (or generation capacity) and consumption (orgeneration) (See e.g., Nexant, 2004 and 2009). Those projectionsare normally based on studies conducted at the national level.Despite forecasting methods that vary considerably, the regional
plans and related documents entail a wealth of quantitative infor-mation that is all too often underutilized in further analysis andplanning.
The New Partnership for Africa’s Development (NEPAD),Southern African Development Community (SADC), the Forum ofEnergy Ministers in Africa (FEMA), Economic Community Of WestAfrican States (ECOWAS), East African Community (EAC), and theCommission de la Communauté Economique et Monétaire del’Afrique Centrale (CEMAC), amongst others, have produced strat-egies for electrification and increasing access to modern fuels.
A closer look at some of the regional forecasts in the interests ofcomparison is useful. A SAPP electricity demand forecast to 2025shows a projected annual growth of about 2% (SAPP, 2010); theannual growth rates are projected to be higher outside RSA. Nexant(2004) shows projected WAPP average growth to 2020 of 7.6%(ranging from 5e12.6%). The EAC/EAPP Demand Forecasts (SNCLavalin, 2010) show very large ranges in forecasted annual growth.They provide very detailed analysis of each country’s nationalforecasts and then extend them to 2038 where appropriate. Inter-estingly, the forecasts formany of the countries show the same kindof exponential growth we explore in Section 5 in their ‘high’scenarios, and reflect more typical trend or regression-based fore-casts for “low and base” cases (SNC Lavalin, 2010). Fig. 4 shows, asan example, the forecast to 2038 (in MW) for peak demand inKenya32, including showing sharp growth in the “High Case” from1 GW to over 18 GW to 2038.
Eberhard et al. (2011) develop several scenarios to 2015 forAfrica. They considered three types of demand: market, suppressed
-30
-20
-10
0
10
20
30
40
50
1989
1990
1991
1992
1993
1994
1995
1996
1997
1998
1999
2000
2001
2002
2003
2004
2005
2006
2007
2008
Ch
an
ge in
in
stalled
electricity cap
acity in
SS
A co
un
tries (th
ree-year flo
atin
g averag
e) [%
]
Fig. 3. Rate of increase (or decrease) in installed electricity capacity (with three year floating average) in SSA countries arranged by tertile (red, black and blue dots featurescountries with relatively large, medium, and small generating capacity, respectively, in 2008). Data: authors’ compilation from EIA.
29 Thus, SSA accounts for about 61% of the African continent’s total installedelectricity capacity (RSA is, in turn, about 59% of the resulting SSA figure). SSA isapproximately 1.7% of the world total installed electricity capacity (0.6%, excludingRSA). We use these ratios to derive SSA figures (and SSA excluding RSA) fromscenarios that normally treat the African continent as a whole.30 These three sources generally are well aligned in their historic data with the EIAfigures marginally lower than IEA and BP, likely for reasons of accounting aroundimports and exports.31 To compare to those studies that consider peak demand, a heuristic can beemployed by decreasing these figures by 10%.
32 The MAED model was used for the original demand projections. This reliesheavily on GDP growth forecasts e See Section 5 for more on this.
M. Bazilian et al. / Utilities Policy 20 (2012) 1e166

and social to help create three scenarios (constant access, regionaltarget and national targets). The overall average annual electricitydemand growth rate was estimated at 5.8%.
The objectives of the Study on Programme for InfrastructureDevelopment in Africa (PIDA, 2011), due to be finalized in early2012, are to enable African decision-makers to, inter alia, establishan infrastructure development programme articulated aroundpriorities and phases and, prepare an implementation strategy andprocess including, in particular, a priority action plan.
The peak demand projections from initial PIDA (for the Africancontinent) shows an average 6.7% growth (with regional annualgrowth rates ranging from about 6e9%) over the period2009e2040. The initial results assume that the access rate willincrease from 42% in 2009 to 65% in 2030; these rates are projectedto be similar in 2040.
The Global Energy Assessment (GEA) developed global energyscenarios that include universal energy access by 2030 as one of thenormative objectives (Riahi et al., 2011). As part of this effort,a detailed access modeling within the MESSAGE33 model frame-work focuses on the key world regions where the lack of access iscurrently the most acute, including all of sub-Saharan Africa. Theresults will be presented both for economy as a whole (Annex 3), aswell as a focus on household and rural electrification (see Annex 4).
The African Development Bank (2008) undertook a universalaccess scenario assessment through 2030. Table 2 shows the resultsof the capacity additions estimated. Without South Africa the totalequals 102 GW e approximately an average of 6% annual growth.
Each of these exercises uses different country coverage, differentsector definitions, varying underpinning assumptions, etc. For thisreason the figures are difficult to compare and thus, difficult forpolicy-makers to understand as complementary pieces ofinformation.
4.2. Generation technology portfolios
In this sub-section, we take a closer look at the various projec-tions in terms of technology and energy resources. We give specialattention to renewable energy potentials, following the sustainableenergy goal proposed by the United Nations, in order to give a senseof scale to the possibilities.
Eberhard et al. (2011) report that over 900 TWh (approximately220 GW installed capacity) of economically viable hydropowerpotential in Africa remains unexploited, located primarily in theDemocratic Republic of Congo, Ethiopia, Cameroon, Angola,Madagascar, Gabon, Mozambique, and Nigeria. Similarly, theIntergovernmental Panel on Climate Change (IPCC) estimates thetechnical hydropower potential at 1174 TWh (or 283 GW ofinstalled capacity), only eight percent of which has been developed.Interestingly, this unused potential is about ten times the currentinstalled generating capacity in SSA if RSA is excluded. Tappinghydropower sources could help greatly in achieving full access aswe discuss in Section 5.
The newly formed International Renewable Energy Agency(IRENA) is now designing future renewable energy scenarios. Thefocus of their work will be on providing detailed, regional specifictechnology information with a clear focus on renewable energy.Table 3 also indicates that the technical potential for renewables isenormous, and largely untapped, in Africa (IRENA, 2011). The
Fig. 4. Peak demand forecasts for Kenya (SNC Lavalin, 2010) to 2038.
Table 2Universal access scenario to 2030 (African Development Bank, 2008).
Generating capacity [GW] Total
Net Replacement
Northern Africa: 5 Nations 60 22 82South Africa 47 30 77Sub-Saharan Africa: 41 Nations 82.5 19 102Island states: 6 Nations 2.5 1.5 4Africa 192 72 265
33 Model for Energy Supply Strategy Alternatives and their General Environmentalimpact (Messner and Strubegger, 1995 and Riahi et al., 2007).
M. Bazilian et al. / Utilities Policy 20 (2012) 1e16 7
accounting of biomass remains contentious; still, even usingconservative assumptions, the potentials are significant.
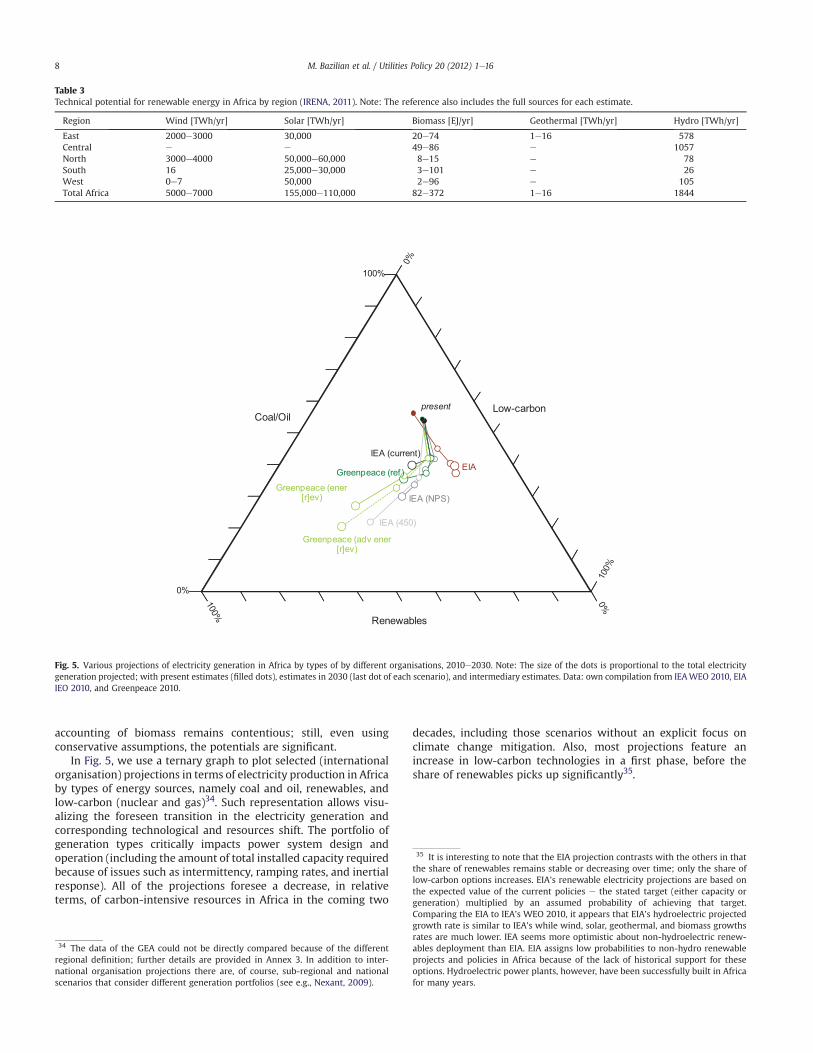
In Fig. 5, we use a ternary graph to plot selected (internationalorganisation) projections in terms of electricity production in Africaby types of energy sources, namely coal and oil, renewables, andlow-carbon (nuclear and gas)34. Such representation allows visu-alizing the foreseen transition in the electricity generation andcorresponding technological and resources shift. The portfolio ofgeneration types critically impacts power system design andoperation (including the amount of total installed capacity requiredbecause of issues such as intermittency, ramping rates, and inertialresponse). All of the projections foresee a decrease, in relativeterms, of carbon-intensive resources in Africa in the coming two
decades, including those scenarios without an explicit focus onclimate change mitigation. Also, most projections feature anincrease in low-carbon technologies in a first phase, before theshare of renewables picks up significantly35.
Table 3Technical potential for renewable energy in Africa by region (IRENA, 2011). Note: The reference also includes the full sources for each estimate.
Region Wind [TWh/yr] Solar [TWh/yr] Biomass [EJ/yr] Geothermal [TWh/yr] Hydro [TWh/yr]
East 2000e3000 30,000 20e74 1e16 578Central e e 49e86 e 1057North 3000e4000 50,000e60,000 8e15 e 78South 16 25,000e30,000 3e101 e 26West 0e7 50,000 2e96 e 105Total Africa 5000e7000 155,000e110,000 82e372 1e16 1844
IEA (NPS)
IEA (current)
present
IEA (450)
EIAGreenpeace (ref )Greenpeace (ener
[r]ev)
Greenpeace (adv ener [r]ev)
0%
100%
Coal/OilLow-carbon
Renewables
Fig. 5. Various projections of electricity generation in Africa by types of by different organisations, 2010e2030. Note: The size of the dots is proportional to the total electricitygeneration projected; with present estimates (filled dots), estimates in 2030 (last dot of each scenario), and intermediary estimates. Data: own compilation from IEAWEO 2010, EIAIEO 2010, and Greenpeace 2010.
34 The data of the GEA could not be directly compared because of the differentregional definition; further details are provided in Annex 3. In addition to inter-national organisation projections there are, of course, sub-regional and nationalscenarios that consider different generation portfolios (see e.g., Nexant, 2009).
35 It is interesting to note that the EIA projection contrasts with the others in thatthe share of renewables remains stable or decreasing over time; only the share oflow-carbon options increases. EIA’s renewable electricity projections are based onthe expected value of the current policies e the stated target (either capacity orgeneration) multiplied by an assumed probability of achieving that target.Comparing the EIA to IEA’s WEO 2010, it appears that EIA’s hydroelectric projectedgrowth rate is similar to IEA’s while wind, solar, geothermal, and biomass growthsrates are much lower. IEA seems more optimistic about non-hydroelectric renew-ables deployment than EIA. EIA assigns low probabilities to non-hydro renewableprojects and policies in Africa because of the lack of historical support for theseoptions. Hydroelectric power plants, however, have been successfully built in Africafor many years.
M. Bazilian et al. / Utilities Policy 20 (2012) 1e168
5. Simple scenarios to 2030
5.1. Scenarios
Using simple heuristics, we calculate electricity generationcapacity required in SSA (excluding RSA) to 2030 under variouselectricity access level assumptions (see Table 4). It is important tonote that these scenarios are not limited to household demand, butfor the entire economy. In the first two scenarios we separate thenumber of people without access (electricity poor) from those withaccess (non electricity-poor)36, and each category arrives ata different level of access in 2030. In the two other scenarios theentire 2030 population is brought to a single average level of access.Of course, such results are highly stylized andwould, in themselves,not properly consider issues such as: intermittency of variousenergy sources, load factors, reliability, availability, interconnec-tion, system operation, ramping, etc. (We employ a different, yetequally transparent, methodology in Annex 1, which providesa similar scale of result.)
The results of this exercise are astonishing in terms of therequired growth rates and installed capacity. As an example, just toreach the our Moderate Access case where the population hasbetween 200e400 MW/mln requires a total of around 374 GW ofinstalled capacity e about twelve times current levels. This impliesaround a 13% annual growth rate for the next 20 years as comparedto 1.7% for the past 20 years. The other scenarios show that bringingaccess to the projected SSA (excluding RSA) population in 2030would take approximately 500 GW to reach an average of 400 MW/mln (Full Access)and to reach800MW/mln (the current rateof RSAe
Full Enhanced Access) would double this requirement. We recognisethat our results assume much higher levels of access than much ofthe literature that focuses solely on “basic needs” at the householdlevel37. Annexes 4 and 5 briefly explore elements of such a scenario.
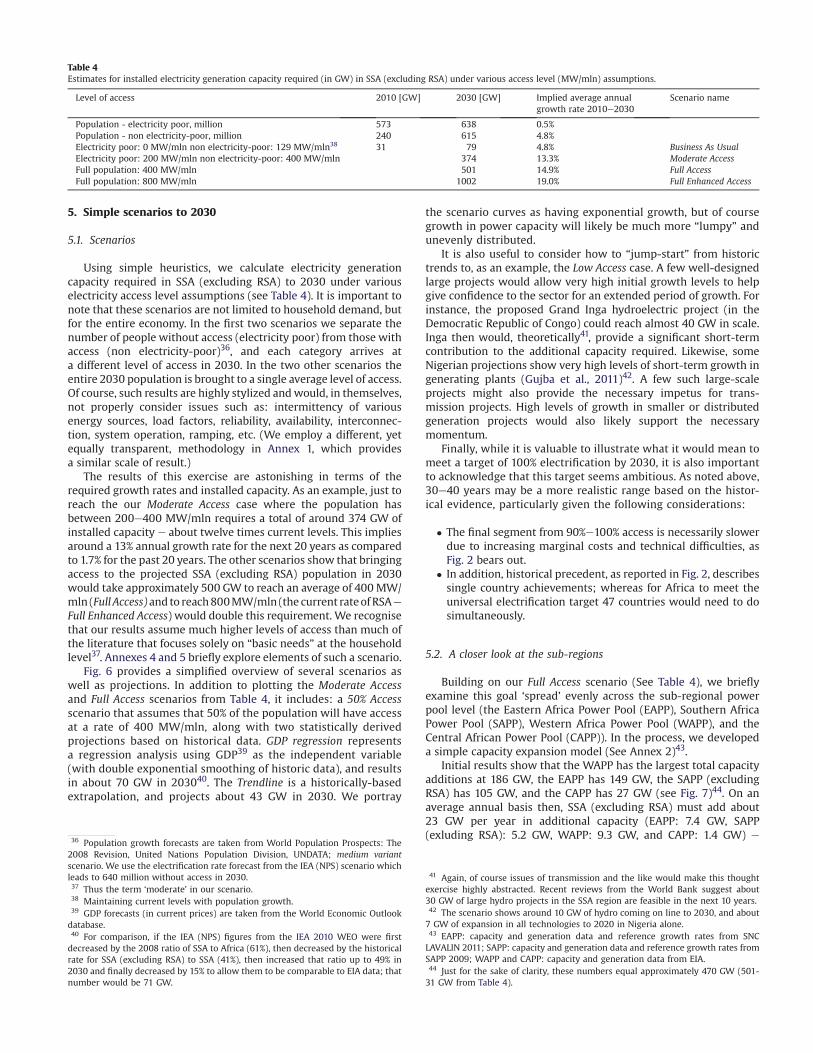
Fig. 6 provides a simplified overview of several scenarios aswell as projections. In addition to plotting the Moderate Accessand Full Access scenarios from Table 4, it includes: a 50% Accessscenario that assumes that 50% of the population will have accessat a rate of 400 MW/mln, along with two statistically derivedprojections based on historical data. GDP regression representsa regression analysis using GDP39 as the independent variable(with double exponential smoothing of historic data), and resultsin about 70 GW in 203040. The Trendline is a historically-basedextrapolation, and projects about 43 GW in 2030. We portray
the scenario curves as having exponential growth, but of coursegrowth in power capacity will likely be much more “lumpy” andunevenly distributed.
It is also useful to consider how to “jump-start” from historictrends to, as an example, the Low Access case. A few well-designedlarge projects would allow very high initial growth levels to helpgive confidence to the sector for an extended period of growth. Forinstance, the proposed Grand Inga hydroelectric project (in theDemocratic Republic of Congo) could reach almost 40 GW in scale.Inga then would, theoretically41, provide a significant short-termcontribution to the additional capacity required. Likewise, someNigerian projections show very high levels of short-term growth ingenerating plants (Gujba et al., 2011)42. A few such large-scaleprojects might also provide the necessary impetus for trans-mission projects. High levels of growth in smaller or distributedgeneration projects would also likely support the necessarymomentum.
Finally, while it is valuable to illustrate what it would mean tomeet a target of 100% electrification by 2030, it is also importantto acknowledge that this target seems ambitious. As noted above,30e40 years may be a more realistic range based on the histor-ical evidence, particularly given the following considerations:
� The final segment from 90%e100% access is necessarily slowerdue to increasing marginal costs and technical difficulties, asFig. 2 bears out.
� In addition, historical precedent, as reported in Fig. 2, describessingle country achievements; whereas for Africa to meet theuniversal electrification target 47 countries would need to dosimultaneously.
5.2. A closer look at the sub-regions
Building on our Full Access scenario (See Table 4), we brieflyexamine this goal ‘spread’ evenly across the sub-regional powerpool level (the Eastern Africa Power Pool (EAPP), Southern AfricaPower Pool (SAPP), Western Africa Power Pool (WAPP), and theCentral African Power Pool (CAPP)). In the process, we developeda simple capacity expansion model (See Annex 2)43.
Initial results show that the WAPP has the largest total capacityadditions at 186 GW, the EAPP has 149 GW, the SAPP (excludingRSA) has 105 GW, and the CAPP has 27 GW (see Fig. 7)44. On anaverage annual basis then, SSA (excluding RSA) must add about23 GW per year in additional capacity (EAPP: 7.4 GW, SAPP(exluding RSA): 5.2 GW, WAPP: 9.3 GW, and CAPP: 1.4 GW) e
Table 4Estimates for installed electricity generation capacity required (in GW) in SSA (excluding RSA) under various access level (MW/mln) assumptions.
Level of access 2010 [GW] 2030 [GW] Implied average annualgrowth rate 2010e2030
Scenario name
Population - electricity poor, million 573 638 0.5%Population - non electricity-poor, million 240 615 4.8%Electricity poor: 0 MW/mln non electricity-poor: 129 MW/mln38 31 79 4.8% Business As UsualElectricity poor: 200 MW/mln non electricity-poor: 400 MW/mln 374 13.3% Moderate AccessFull population: 400 MW/mln 501 14.9% Full AccessFull population: 800 MW/mln 1002 19.0% Full Enhanced Access
36 Population growth forecasts are taken from World Population Prospects: The2008 Revision, United Nations Population Division, UNDATA; medium variantscenario. We use the electrification rate forecast from the IEA (NPS) scenario whichleads to 640 million without access in 2030.37 Thus the term ‘moderate’ in our scenario.38 Maintaining current levels with population growth.39 GDP forecasts (in current prices) are taken from the World Economic Outlookdatabase.40 For comparison, if the IEA (NPS) figures from the IEA 2010 WEO were firstdecreased by the 2008 ratio of SSA to Africa (61%), then decreased by the historicalrate for SSA (excluding RSA) to SSA (41%), then increased that ratio up to 49% in2030 and finally decreased by 15% to allow them to be comparable to EIA data; thatnumber would be 71 GW.
41 Again, of course issues of transmission and the like would make this thoughtexercise highly abstracted. Recent reviews from the World Bank suggest about30 GW of large hydro projects in the SSA region are feasible in the next 10 years.42 The scenario shows around 10 GW of hydro coming on line to 2030, and about7 GW of expansion in all technologies to 2020 in Nigeria alone.43 EAPP: capacity and generation data and reference growth rates from SNCLAVALIN 2011; SAPP: capacity and generation data and reference growth rates fromSAPP 2009; WAPP and CAPP: capacity and generation data from EIA.44 Just for the sake of clarity, these numbers equal approximately 470 GW (501-31 GW from Table 4).
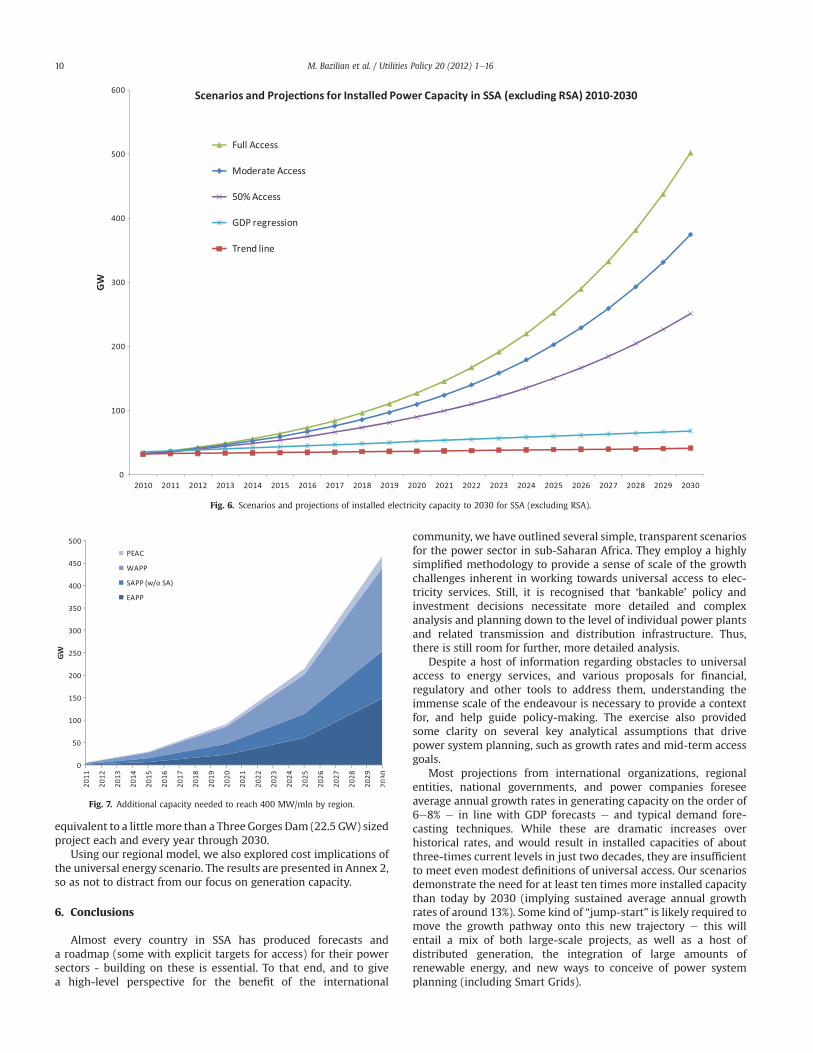
equivalent to a little more than a Three Gorges Dam (22.5 GW) sizedproject each and every year through 2030.
Using our regional model, we also explored cost implications ofthe universal energy scenario. The results are presented in Annex 2,so as not to distract from our focus on generation capacity.
6. Conclusions
Almost every country in SSA has produced forecasts anda roadmap (some with explicit targets for access) for their powersectors - building on these is essential. To that end, and to givea high-level perspective for the benefit of the international
community, we have outlined several simple, transparent scenariosfor the power sector in sub-Saharan Africa. They employ a highlysimplified methodology to provide a sense of scale of the growthchallenges inherent in working towards universal access to elec-tricity services. Still, it is recognised that ‘bankable’ policy andinvestment decisions necessitate more detailed and complexanalysis and planning down to the level of individual power plantsand related transmission and distribution infrastructure. Thus,there is still room for further, more detailed analysis.
Despite a host of information regarding obstacles to universalaccess to energy services, and various proposals for financial,regulatory and other tools to address them, understanding theimmense scale of the endeavour is necessary to provide a contextfor, and help guide policy-making. The exercise also providedsome clarity on several key analytical assumptions that drivepower system planning, such as growth rates and mid-term accessgoals.
Most projections from international organizations, regionalentities, national governments, and power companies foreseeaverage annual growth rates in generating capacity on the order of6e8% e in line with GDP forecasts e and typical demand fore-casting techniques. While these are dramatic increases overhistorical rates, and would result in installed capacities of aboutthree-times current levels in just two decades, they are insufficientto meet even modest definitions of universal access. Our scenariosdemonstrate the need for at least ten times more installed capacitythan today by 2030 (implying sustained average annual growthrates of around 13%). Some kind of “jump-start” is likely required tomove the growth pathway onto this new trajectory e this willentail a mix of both large-scale projects, as well as a host ofdistributed generation, the integration of large amounts ofrenewable energy, and new ways to conceive of power systemplanning (including Smart Grids).
Fig. 6. Scenarios and projections of installed electricity capacity to 2030 for SSA (excluding RSA).
Fig. 7. Additional capacity needed to reach 400 MW/mln by region.
M. Bazilian et al. / Utilities Policy 20 (2012) 1e1610

The role of the international community is best employed tohelp encourage the cooperative movement of the disparate piecestowards a common goal, and to supply the necessary technical andinvestment tools. As an example, a reliable and comprehensiveinformation base is required to set targets and monitor outcomes,to design strategies and policies, to make evidence-based decisions,and to enable consumers to make informed choices. Providingaccess to energy services is a concrete problem, with clearlydiscernible benefits; this, along with its current political prioriti-zation offers ample opportunity for international efforts.
Acknowledgements
We would like to thank a number of colleagues for theirsupport: Solomon Abebe (UCB), Vijay Iyer (WB), Keywan Riahi andYu Nagai (IIASA), Brian Murphy (EIA), Jacques Moulot (AfDB), DolfGielen (IRENA), Kandeh Yumkella and Alois Mhlanga (UNIDO),Charlie Heaps (SEI), Padraig McManus and John Shine (ESB), andReid Detchon (UNF).
Annex 1. An energy consumption-based calculation foruniversal energy access
We also explored an alternative, and equally transparent,approach to project forward generation capacity requirements forSSA (excluding South Africa) for the period out to 2030. Themethodology takes as a starting point the 2008 electricityconsumption levels in that region of 155 kWh45 per capita. We thenassume that with full access, electricity demand will grow by 2030to consumption levels achieved in other regions where full accessalready exists. Specifically we assume that 2008 electricityconsumption levels in Northern Africa (1285 kWh per capita46) willbe achieved by SSA (excluding South Africa) by the year 2030. Thisconsumption level is clearly significantly higher than current levels,but remains considerably lower than levels elsewhere and is thusconsidered a reasonable first estimate.
Combining this 1285 kWh per capita assumption with pop-ulation projections allows us to calculate annual electricity demandin 2030 for SSA (excluding South Africa). We used two UN pop-ulation scenarios, namely medium variant and constant fertilityscenario47 and the resulting electricity demand grows from119 TWh in 2008 to 1390 and 1593 TWh by 2030 respectively foreach population growth scenario.
The electricity generation capacity required to meet thisdemand is dependent on the average annual electricity system loadfactor. The load factor over the period 1990e2008 for SSA(excluding South Africa) has varied from 31% to 47%48. In thisanalysis it is assumed that the load factor will increase to 50% by2015 and remain at that level until 2030. The reason for using 50% isthat it represents the average load factor for North Africa for theperiod 2000e2008.
Using this approach, the electricity capacity increases from31 GW in 2008 to roughly 317 GW (medium variant) or 364 GW(constant fertility) in 2030 e well aligned with the results fromTable 4. It is also worth noting, these projections for 2030 arebetween 4.2 and 4.8 times higher than the IEA NPS (WEO, 2010)projections for the region.
Annex 2. Regional costs
In addition to the description of the model (and results) in themain text, we present some cost estimates in this Annex. Themodel begins with a generic load duration curve (LDC) witha shape derived from LDCs presented in SNC Lavalin (2010). Thegeneric LDC is then fitted to each region’s capacity and genera-tion output so that it matches the region’s overall capacity factor.The model uses LDCs to determine the least-cost mix of newbaseload and peaking capacity to meet electricity demandgrowth. Based on regional projections for new capacity (e.g.,hydro, gas or coal) in Eberhard et al. (2011) we defined a baseloadtechnology for each region using cost and performance charac-teristics from EIA (2011).
Transmission and distribution (T&D) investments are critical forany expanding electricity system, but particularly for systems thatare expanding to meet universal access goals. We developeda simple heuristic based on forecasts from Eberhard et al. (2011) forthe necessary T&D investments per MW of new capacity for eachregion, and applied the factors to our regional projections ofcapacity. As 2030 approaches, though, the T&D infrastructure needswill likely begin to lessen as the networks become more extensive;therefore, we assume that the T&D factors for each region willlinearly decline 25% by 2030, subject to a minimum factor based onSouth Africa’s T&D requirements.
For all of SSA (excluding RSA), the total investment cost(generation capacity plus T&D) of reaching the 400 MW/mlnuniversal access goal is roughly USD 740 billion NPV (5% discountrate). Operating costs add another $130 billion NPV. The averageannual investment in generating capacity is thus USD 49 billion andin T&D is USD 24 billion. The WAPP has the highest average annualinvestment requirements at USD 21 billion, and the CAPP has thelowest at USD 3 billion (see Fig. A2.1). These figures are far higherthan those normally found in the literature (i.e., IEA, 2010). Fora review of investment costs see Bazilian et al. (2010c).
This universal access scenario for SSA results in regional costsper MWh that are largely consistent with those reported byEberhard et al. (2011) (which reflect the period 2005 to 2015). Wefind that the levelised costs for SAPP (excluding RSA), South Africa,
Fig. A2.1. Average annual investment needed to reach 400 MW/mln by region.
45 We use IEA 2010 Key Energy Statistics Report to calculate electricityconsumption in Sub-Saharan Africa (without South Africa) as 119 TWh andcombine it with the 2008 population of 772 million.46 Using data from IEA (2011). The range in electricity consumption in NorthernAfrica in 2008 was considerable, varying from 744 kWh per capita in Morocco to3,920 kWh in Libya (with high electricity intensive energy industry activity linkedto the oil sector).47 The medium variant scenario results in 12% per annum growth in electricitydemand over the period 2008 - 2030. This is twice the growth rates in North Africa(5% per annum on average) over the previous 20 years but not significantly higherthan growth there in the past ten years (7% per annum).48 Based on EIA data. The load factor in Sub-Saharan Africa has increased from 43%in 1990 to 55% in 2008. When South Africa data is excluded, the load factor variedfrom 31% to 47% over this period.
M. Bazilian et al. / Utilities Policy 20 (2012) 1e16 11

and CAPP are all below $100/MWh. The levelised cost for EAPP is$116/MWh and for WAPP is at a rather high $166/MWh. The thirdcolumn is the levelised cost over the period to 2030 (Fig. A2.2).
Annex 3. Global energy assessment economy-wide accessscenarios
We present in this Annex, several scenarios for economy-wideuniversal access to electricity for all of SSA (Riahi et al., 2011).Fig. A3.1 shows baseline and universal access cases under twodifferent climate scenariosewith andwithout climate policye andthe resultant generation technology portfolios. These figuresassume fairly low-levels of access to electricity, and include RSA, sothey are difficult to compare to our results. The GEA model runs inregions, and thus it is difficult to remove one country from theassessment. Still, under certain assumptions one can assume that ifwe subtracted RSA from these figures, that they would lie some-where between our GDP regression forecasts, and our ModerateAccess scenario.
Annex 4. Global energy assessment scenario for basic servicesto the household sector
For the purposes of quantification, two alternative levels ofdemand are assumed as the minimum required for ensuring accessat the household level. These correspond to two different electricityservice levels49. The MESSAGEeACCESS model defines electrifica-tion in terms of the basic minimum required to meet householdneeds. Future rates of electrification in the model are driven byfuture income growth. Fig. A4.1 shows rates of access in the baseyear and projections to 2030 for a scenario with no new policies orresources for improving the rate of electrification, and another witha universal rural electricity access target. In sub-Saharan Africa,rural electrification in 2005 was less than 10%. Following a trendwith increasing GDP per capita, in the no new policies scenario, thisis projected to increase to only 15% according to the analysis based
on the MESSAGE-ACCESS model by 203050. It was estimated thatthe additional generation capacity required by 2030 to achieveuniversal rural electrification in sub-Saharan Africa is between 14and 20 GW51.
Annex 5. OSeMOSYS scenario for basic services to thehousehold sector
We explored another “basic household energy services”scenario using the free and open-source OSeMOSYS52 tool todevelop an assessment of the extra capacity requirements forproviding access to (all of) SSA by 2030. It was primarily based on,and extends aspects of (WB, 2011) as well as other sources53. Inorder to determine the minimum costs required to undertake theelectrification, a scenario was run to investigate reaching universalaccess in Sub-Saharan Africa where only low volumes of electricityto be used by newly electrified homes54.This is useful as it helps toindicate minimum expenditure levels on the one hand. On theother, should development occur faster, higher costs incurred mayconceivably be covered by extra income generated during associ-ated economic growth. Starting with the existing energy system,the effort assumes that most grid connections would take place inurban centers, while off-grid connections would be outside thosecenters.
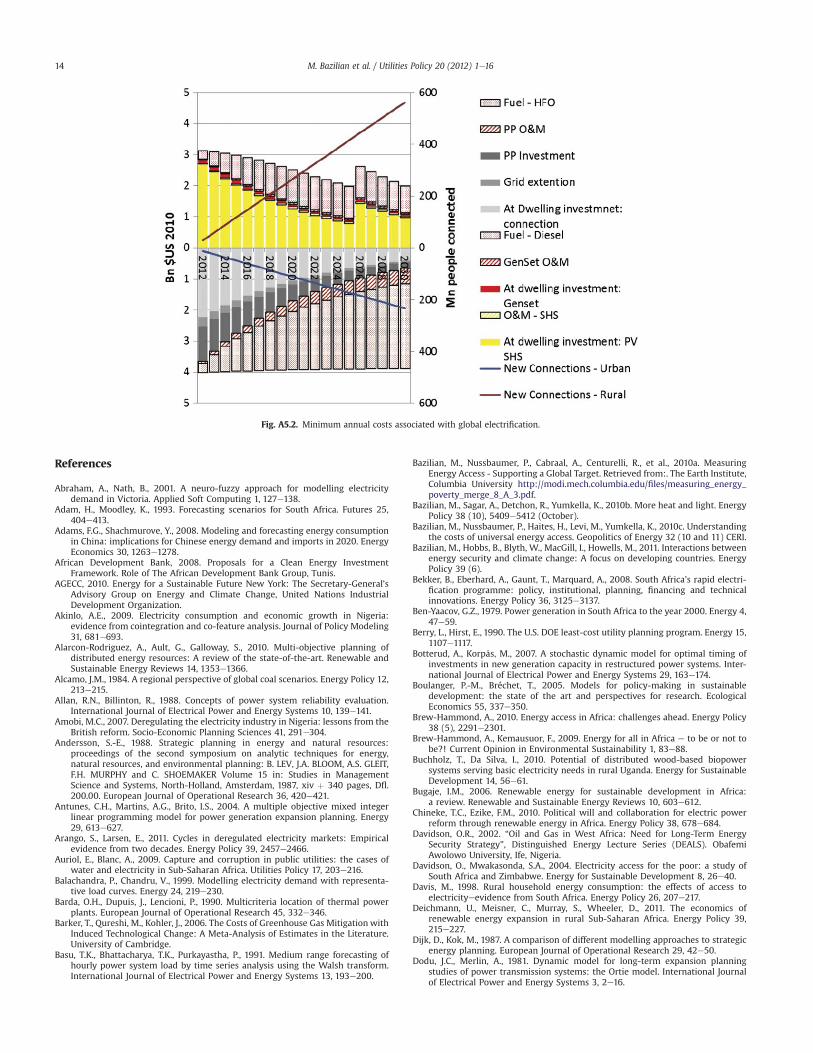
Essentially at the “peaky” household usage patterns expected55:low capital cost, high running cost power system investments areoften most economic to meet new demand. Levelised (IEA, 2010)with a 10% discount rate, four household access options are indi-cated by Fig. A5.1. Note that when grid connection is expensive,providing electricity to remote homes can be cheaply achievedwithdiesel generatorse a commonpractice in SSA (Howells et al., 2005).In other instances, when the diesel price is high (often due tosignificant transport charges), photovoltaic (PV) solar homesystems (SHSs) are competitive. In particular, this occurs in remoterural areas56. In this analysis it is assumed that 50% of the time thiswas the case for off-grid connections - and PV SHS systems werethus chosen by the model57.
To reach a target of basic household-level universal access,about 5.9 and 2.5 rural and urban houses require connectingannually. To do so, around USD 3.4 billion would be spend annuallyfor off-grid efforts, and USD 4.4 billion for grid-based connections.
Fig. A2.2. Comparison of the full cost per MWh in our universal access scenario tocosts reported in Eberhard et al. (2011). Note that our costs include annualized capitalinvestments in generating capacity and T&D, as well as fixed and variable operatingcosts.
49 1.) A minimal access case: each household has one conventional light bulb(40 W), and one out of three households has a television set (60 W); on theassumption that these are used for 3 hours a day, this amounts to approximately 65kWh per household per year. 2.) A sustainable universal access case: consumptionis assumed to be 250 W for 4 hours per day for lighting, and other applications as inthe Tanzanian reference study of Modi et al. (2005), amounting to 420 kWh perhousehold per year.
50 For details regarding core assumptions of GDP and population growth in theGEA-M scenario used as the base for the universal access scenario analysis see(Riahi et al., 2011).51 Again, this aspect of the GEA exercise focused only on household demand,unlike the rest of this paper, which considers the full economy.52 The OSeMOSYS model is open source and freely available and can be accessedfrom www.osemosys.org. (See also: Howells et al. in press.53 Additional load curve data were estimated from Lloyd et al. (2004) and Howellset al. (2006) and cost data from (IEA, 2010a). Technology choices were based onminimizing total life cycle costs (see Howells et al., in press). Based on a UN BAUprojection of 1.5 billion living on the continent with a 50-50 urban-rural split(UNDESA, 2009), assuming current electrification proportions (IEA, 2011), and 5people per home approximately 47 million urban and 113 million rural homes needelectrifying.54 A meager 100 kWh per month in an urban home, and 20 kWh per month ina rural home (Kaufman, 2000 and Bazilian et al., 2010a).55 A load factor of around 25% was assumed based on Lloyd et al. (2004).56 Above USD1.6/l in this analysis. Note that the crude oil price was assumed to beat USD 70/bbl, with other fuels costed (on an energy basis) relative to that. Salientfor the calculations reported here: HFO was 85% of the crude price, diesel for bulkgeneration twice that, and for distributed generation three times that.57 Note that many other off-grid options were not considered in this analysis dueto the deliberately transparent and meta-nature of the thought experiment.However future work should account for several shortcomings of this, including therich variety of options available in a continent as heterogeneous as Africa.
M. Bazilian et al. / Utilities Policy 20 (2012) 1e1612

The relative cost splits are given in constant terms by Fig. A5.2. Off-grid expenditures and connections are indicated above the X-axis(and on-grid, below). The costs decrease over time as they arediscounted. As the PV SHS’s are assumed to last for 10 years, annualinvestment costs double in real terms in 2026 as initial investmentsmade from 2012 on need replacing. Note that while the on-gridconnections decrease in constant terms, they do so slowly. This isbecause each year the fuel bill increases, as (unlike the PV off-gridsystems) each new connection implies more electricity needsgenerating - and that from fossil (based heavy fuel oil (HFO))sources. So each year that bill cumulates58.
Tomeet these targets approximately 12 GWof off-grid SHS’s anddiesel gen-sets would be deployed. While on-grid, at least 30 GWoflow-cost, low load-factor oil based plants would be added. Inter-estingly, these are all investments that carry a low risk to the
investor. The technologies are mature, available ‘off the shelf’ andrequire low lead times for their deployment. With the positivemessage that this task is not insurmountable, next steps requirea far more nuanced analysis. This would involve correctly assessingthe trade-offs between grid and off-grid options, the role of smartgrids to help organically integrate growing micro, mini, nationaland regional grids. And, within this context how best to unlockAfrica’s vast renewable and other potential, to make environmen-tally compatible sources to fuel a growing continent, while notforgetting the urgency of the task.
Fig. A3.1. GEA scenarios with resultant generation types to 2030 (Riahi et al., 2011).
Fig. A4.1. Access rates for two scenarios (IIASA, 2011).
Fig. A5.1. Levelised costs of providing electricity to newly electrified low-volumeconsumers.
58 Note that on-grid connection costing here includes: 1.the cost of the householdconnection, 2.costs of extending the transmission system, 3.costs for new gridbased power plant construction (accounting for an assumed 20% system losses) aswell as annual operating and fuel costs. Note also that on-grid connections aresignificantly more expensive than off grid connections, as higher volumes ofcheaper electricity are assumed to be consumed.
M. Bazilian et al. / Utilities Policy 20 (2012) 1e16 13
References
Abraham, A., Nath, B., 2001. A neuro-fuzzy approach for modelling electricitydemand in Victoria. Applied Soft Computing 1, 127e138.
Adam, H., Moodley, K., 1993. Forecasting scenarios for South Africa. Futures 25,404e413.
Adams, F.G., Shachmurove, Y., 2008. Modeling and forecasting energy consumptionin China: implications for Chinese energy demand and imports in 2020. EnergyEconomics 30, 1263e1278.
African Development Bank, 2008. Proposals for a Clean Energy InvestmentFramework. Role of The African Development Bank Group, Tunis.
AGECC, 2010. Energy for a Sustainable Future New York: The Secretary-General’sAdvisory Group on Energy and Climate Change, United Nations IndustrialDevelopment Organization.
Akinlo, A.E., 2009. Electricity consumption and economic growth in Nigeria:evidence from cointegration and co-feature analysis. Journal of Policy Modeling31, 681e693.
Alarcon-Rodriguez, A., Ault, G., Galloway, S., 2010. Multi-objective planning ofdistributed energy resources: A review of the state-of-the-art. Renewable andSustainable Energy Reviews 14, 1353e1366.
Alcamo, J.M., 1984. A regional perspective of global coal scenarios. Energy Policy 12,213e215.
Allan, R.N., Billinton, R., 1988. Concepts of power system reliability evaluation.International Journal of Electrical Power and Energy Systems 10, 139e141.
Amobi, M.C., 2007. Deregulating the electricity industry in Nigeria: lessons from theBritish reform. Socio-Economic Planning Sciences 41, 291e304.
Andersson, S.-E., 1988. Strategic planning in energy and natural resources:proceedings of the second symposium on analytic techniques for energy,natural resources, and environmental planning: B. LEV, J.A. BLOOM, A.S. GLEIT,F.H. MURPHY and C. SHOEMAKER Volume 15 in: Studies in ManagementScience and Systems, North-Holland, Amsterdam, 1987, xiv þ 340 pages, Dfl.200.00. European Journal of Operational Research 36, 420e421.
Antunes, C.H., Martins, A.G., Brito, I.S., 2004. A multiple objective mixed integerlinear programming model for power generation expansion planning. Energy29, 613e627.
Arango, S., Larsen, E., 2011. Cycles in deregulated electricity markets: Empiricalevidence from two decades. Energy Policy 39, 2457e2466.
Auriol, E., Blanc, A., 2009. Capture and corruption in public utilities: the cases ofwater and electricity in Sub-Saharan Africa. Utilities Policy 17, 203e216.
Balachandra, P., Chandru, V., 1999. Modelling electricity demand with representa-tive load curves. Energy 24, 219e230.
Barda, O.H., Dupuis, J., Lencioni, P., 1990. Multicriteria location of thermal powerplants. European Journal of Operational Research 45, 332e346.
Barker, T., Qureshi, M., Kohler, J., 2006. The Costs of Greenhouse Gas Mitigation withInduced Technological Change: A Meta-Analysis of Estimates in the Literature.University of Cambridge.
Basu, T.K., Bhattacharya, T.K., Purkayastha, P., 1991. Medium range forecasting ofhourly power system load by time series analysis using the Walsh transform.International Journal of Electrical Power and Energy Systems 13, 193e200.
Bazilian, M., Nussbaumer, P., Cabraal, A., Centurelli, R., et al., 2010a. MeasuringEnergy Access - Supporting a Global Target. Retrieved from:. The Earth Institute,Columbia University http://modi.mech.columbia.edu/files/measuring_energy_poverty_merge_8_A_3.pdf.
Bazilian, M., Sagar, A., Detchon, R., Yumkella, K., 2010b. More heat and light. EnergyPolicy 38 (10), 5409e5412 (October).
Bazilian, M., Nussbaumer, P., Haites, H., Levi, M., Yumkella, K., 2010c. Understandingthe costs of universal energy access. Geopolitics of Energy 32 (10 and 11) CERI.
Bazilian, M., Hobbs, B., Blyth, W., MacGill, I., Howells, M., 2011. Interactions betweenenergy security and climate change: A focus on developing countries. EnergyPolicy 39 (6).
Bekker, B., Eberhard, A., Gaunt, T., Marquard, A., 2008. South Africa’s rapid electri-fication programme: policy, institutional, planning, financing and technicalinnovations. Energy Policy 36, 3125e3137.
Ben-Yaacov, G.Z., 1979. Power generation in South Africa to the year 2000. Energy 4,47e59.
Berry, L., Hirst, E., 1990. The U.S. DOE least-cost utility planning program. Energy 15,1107e1117.
Botterud, A., Korpås, M., 2007. A stochastic dynamic model for optimal timing ofinvestments in new generation capacity in restructured power systems. Inter-national Journal of Electrical Power and Energy Systems 29, 163e174.
Boulanger, P.-M., Bréchet, T., 2005. Models for policy-making in sustainabledevelopment: the state of the art and perspectives for research. EcologicalEconomics 55, 337e350.
Brew-Hammond, A., 2010. Energy access in Africa: challenges ahead. Energy Policy38 (5), 2291e2301.
Brew-Hammond, A., Kemausuor, F., 2009. Energy for all in Africa e to be or not tobe?! Current Opinion in Environmental Sustainability 1, 83e88.
Buchholz, T., Da Silva, I., 2010. Potential of distributed wood-based biopowersystems serving basic electricity needs in rural Uganda. Energy for SustainableDevelopment 14, 56e61.
Bugaje, I.M., 2006. Renewable energy for sustainable development in Africa:a review. Renewable and Sustainable Energy Reviews 10, 603e612.
Chineke, T.C., Ezike, F.M., 2010. Political will and collaboration for electric powerreform through renewable energy in Africa. Energy Policy 38, 678e684.
Davidson, O.R., 2002. “Oil and Gas in West Africa: Need for Long-Term EnergySecurity Strategy”, Distinguished Energy Lecture Series (DEALS). ObafemiAwolowo University, Ife, Nigeria.
Davidson, O., Mwakasonda, S.A., 2004. Electricity access for the poor: a study ofSouth Africa and Zimbabwe. Energy for Sustainable Development 8, 26e40.
Davis, M., 1998. Rural household energy consumption: the effects of access toelectricityeevidence from South Africa. Energy Policy 26, 207e217.
Deichmann, U., Meisner, C., Murray, S., Wheeler, D., 2011. The economics ofrenewable energy expansion in rural Sub-Saharan Africa. Energy Policy 39,215e227.
Dijk, D., Kok, M., 1987. A comparison of different modelling approaches to strategicenergy planning. European Journal of Operational Research 29, 42e50.
Dodu, J.C., Merlin, A., 1981. Dynamic model for long-term expansion planningstudies of power transmission systems: the Ortie model. International Journalof Electrical Power and Energy Systems 3, 2e16.
Fig. A5.2. Minimum annual costs associated with global electrification.
M. Bazilian et al. / Utilities Policy 20 (2012) 1e1614

D’sa, A., 2005. Integrated resource planning (IRP) and power sector reform indeveloping countries. Energy Policy 33, 1271e1285.
Dubash, N.K., 2003. Revisiting electricity reform: the case for a sustainable devel-opment approach. Utilities Policy 11, 143e154.
Eberhard, A., Rosnes, O., Shkaratan, M., Vennemo, H., 2011. Africa’s Power Infra-strucutre. The World Bank.
Edenhofer, O., 2005. Energy and Climate Policy. In Options for Future Climate Policy.INTACT, Berlin.
Ediger, V.S., Tatlidil, H., 2002. Forecasting the primary energy demand in Turkey andanalysis of cyclic patterns. Energy Conversion and Management 43, 473e487.
EIA [Energy Information Administration], 2011. International Energy Statistics.http://www.eia.gov/cfapps/ipdbproject/IEDIndex3.cfm?tid¼2&pid¼2&aid¼7Accessed September.
El-Fouly, T.H.M., Zeineldin, H.H., El-Saadany, E.F., Salama, M.M.A., 2008. A newoptimization model for distribution substation siting, sizing, and timing.International Journal of Electrical Power and Energy Systems 30, 308e315.
Elkarmi, F., Abu-Shikhah, N., Abu-Zarour, M., 2010. An investigation of the effect ofchanges of planning criteria on power system expansion planning with a casestudy of the Jordanian power system. Energy Policy 38, 6320e6329.
Elshafei, A.N., 1979. Energy planning in the Arab world. Energy Policy 7, 242e252.Energy Information Administration (EIA), 2010. International Energy Outlook 2010
Washington DC, USA.Eskom, 2009. Integrated Resource Plan for Electricity South Africa.Fisher, B.S.,Nakicenovic,N., Alfsen, K., CorfeeMorlot, J., de la Chesnaye, F., Hourcade, J.-
Ch., Jiang, K., Kainuma,M., La Rovere, E., Matysek, A., Rana, A., Riahi, K., Richels, R.,Rose, S., van Vuuren, D., Warren, R., 2007. 3.1 Emissions scenarios. In (bookchapter): Issues related tomitigation in the long termcontext. In: Climate Change2007: Mitigation. Contribution of Working Group III to the Fourth AssessmentReport of the Inter-governmental Panel on Climate Change.
Foster, V., Briceño-Garmendia, C., 2010. Africa’s Infrastructure: A time for trans-formation. Agence Française de Développement and the World Bank.
Garcia, E., Schweickardt, G., Andreoni, A., 2008. A new model to evaluate thedynamic adaptation of an electric distribution system. Energy Economics 30,1648e1658.
García-Ascanio, C., Maté, C., 2010. Electric power demand forecasting using intervaltime series: a comparison between VAR and iMLP. Energy Policy 38, 715e725.
Garrett, M.J., 1994. Exploring the futures of Africa: Bibliography and guide toinformation resources. Futures 26, 912e943.
Ghanadan, R., Koomey, J.G., 2005. Using energy scenarios to explore alternativeenergy pathways in California. Energy Policy 33, 1117e1142.
Gillwald, A., 2005. Good intentions, poor outcomes: Telecommunications reform inSouth Africa. Telecommunications Policy 29, 469e491.
Girod, J., Percebois, J., 1998. Reforms in sub-saharan Africa’s power industries.Energy Policy 26, 21e32.
Gnansounou, E., Bayem, H., Bednyagin, D., Dong, J., 2007. Strategies for regionalintegration of electricity supply in West Africa. Energy Policy 35, 4142e4153.
Government of South Africa (GoSA). Department of Energy, 2010. ExecutiveSummary of the Draft Integrated Electricity Resource Plan for South Africa -2010 to 2030.
Graeber, B., Spalding-Fecher, D.R., 2000. Regional integrated resource planning andits role in regional electricity co-operation and development in Southern Africa.Energy for Sustainable Development 4, 32e37.
Gratwick, K.N., Eberhard, A., 2008. Demise of the standard model for power sectorreform and the emergence of hybrid power markets. Energy Policy 36,3948e3960.
Gualberti, G., Alves, L., Micangeli, A., Da Graça Carvalho, M., 2009. Electricityprivatizations in Sahel: A U-turn? Energy Policy 37, 4189e4207.
Gujba, H., Mulugetta, Y., Azapagic, A., 2011. Power generation scenarios for Nigeria:An environmental and cost assessment. Energy Policy 39, 968e980.
Güven, Ç, 1994. Energy planning under import restrictions. European Journal ofOperational Research 72, 518e528.
Habtetsion, S., Tsighe, Z., 2007. Energy sector reform in Eritrea: initiatives andimplications. Journal of Cleaner Production 15, 178e189.
Hart, E.K., Jacobson, M.Z., 2011. A Monte Carlo approach to generator portfolioplanning and carbon emissions assessments of systems with large penetrationsof variable renewables. Renewable Energy 36, 2278e2286.
Haselip, J., 2007. Optimising reform: the sustainability of electricity market liber-alisation in less developed countries. Journal of Cleaner Production 15, 109e111.
Haselip, J., Hilson, G., 2005. Winners and losers from industry reforms in thedeveloping world: experiences from the electricity and mining sectors.Resources Policy 30, 87e100.
Haselip, J., Potter, C., 2010. Post-neoliberal electricity market [`]re-reforms’ inArgentina: Diverging from market prescriptions? Energy Policy 38, 1168e1176.
Heinrich, G., Howells, M., Basson, L., Petrie, J., 2007. Electricity supply industrymodelling for multiple objectives under demand growth uncertainty. Energy32, 2210e2229.
Howells, M., Alfstad, T., Victor, D., Goldstein, G., Remme, U., 2005. A model ofhousehold energy services in a low-income rural African village. Energy Policy33, 1833e1851.
Howells, M., Victor, D.G., Gaunt, T., Elias, R., Alfstad, T., 2006. Beyond free electricity:The costs of electric cooking in poor households and a market-friendly alter-native. Energy Policy 34, 3351e3358.
Howells, M., Jonsson, S., Käck, E., Lloyd, P., Bennett, K., Leiman, A., Conradie, B., 2010.Calabashes for kilowatt-hours: Rural energy and market failure. Energy Policy38, 2729e2738.
Howells, M., Rogner, H., Strachan, N., Heaps, C., Huntington, H., Kypreos, S.,Hughes, A., Silveira, S., DeCarolis, J., Bazillian, M., and Roehrl, A., OSeMOSYS:The Open Source Energy Modeling System. An introduction to its ethos,structure and development. Energy Policy, Corrected Proof, Available online31 July, in press.
Hu, Q., Huang, G., Cai, Y. and Huang, Y. Feasibility-based inexact fuzzy programmingfor electric power generation systems planning under dual uncertainties.Applied Energy, Corrected Proof, in press.
Huntington, H., Weyant, J., 2002. Modelling Energy markets and Climate ChangePolicy. EMF.
ICSU, 2007. Sustainable Energy for sub-Saharan Africa. Regional Office for Africa.Seychelles.
IEA, UNDP, and UNIDO, 2010. Energy Poverty e How to make modern energy accessuniversal? Special excerpt of theWorld Energy Outlook 2010 for the UN GeneralAssembly on the Millennium Development Goals. International Energy Agency,Paris.
IEA, 2010a. The projected costs of generating electricity e 2010 update. OECD, Paris.IEA, 2011. 2011 Key World Energy Statistics Paris.Inglesi, R., 2010. Aggregate electricity demand in South Africa: Conditional forecasts
to 2030. Applied Energy 87, 197e204.Inglesi-Lotz, R., 2011. The evolution of price elasticity of electricity demand in South
Africa: A Kalman filter application. Energy Policy 39, 3690e3696.Inglesi-Lotz, R. and Blignaut, J. N. South Africa’s electricity consumption: A sectoral
decomposition analysis. Applied Energy, Corrected Proof. Integrated ResourcePlanning (IRP). Pretoria, Department of Minerals and Energy, in press.
IPCC, 2001. Climate Change 2001: Mitigation. Contribution of Working Group III tothe Third Assessment Report of the Inter-governmental Panel on ClimateChange.
IRENA, 2011. Scenarios and Strategies for Africa. IRENA-Africa High-Level Consul-tations on Partnership on Accelerating Renewable Energy Uptake for Africa’sSustainable Development.
Jamasb, T., 2006. Between the state and market: Electricity sector reform indeveloping countries. Utilities Policy 14, 14e30.
Karakezi, S., 2006. African Energy Sector: Priority Issues, a background paper for theForum of Energy Ministers in Africa for CSD-14, April.
Karekezi, S., Kimani, J., 2002. Status of power sector reform in Africa: impact on thepoor. Energy Policy 30, 923e945.
Kaufman, S., 2000. Rural Electrification with Solar Energy as a Climate ProtectionPolicy. http://www.repp.org/repp_pubs/pdf/rurElec.pdf Renewable EnergyProject.No. 9.January.
Kobos, P.H., Erickson, J.D., Drennen, T.E., 2006. Technological learning and renew-able energy costs: implications for US renewable energy policy. Energy Policy34, 1645e1658.
Kouakou, A.K., 2011. Economic growth and electricity consumption in Cote d’Ivoire:Evidence from time series analysis. Energy Policy 39, 3638e3644.
Langlois, L., Rogner, H.H., Pacher, H., and Howells, M. 2011. Notes on the Evolution ofElectricity Markets and Expansion Planning. Forthcoming (submitted to EnergyPolicy).
Lazenby, J.B.C., Jones, P.M.S., 1987. Hydroelectricity in West Africa: its future role.Energy Policy 15, 441e455.
Levitin, G., Lisnianski, A., 1999. Optimal multistage modernization of power systemsubject to reliability and capacity requirements. Electric Power SystemsResearch 50, 183e190.
Lloyd, P., Dick, A., Howells, M.I., 2004. The energy profile of a rural community.Journal of Energy in Southern Africa 15 (3), 80e87.
Maboke, S.N., Kachienga, M.O., 2008. Power Transmission Investment Analysis: ANew Financial Evaluation Framework for South Africa. The Electricity Journal 21,58e70.
Malcolm, S., Zenios, S., 1994. Robust Optimization for Power Systems CapacityExpansion under Uncertainty. The Journal of the Operational Research Society45 (9), 1040e1049. Sep., 1994.
Malgas, I., Eberhard, A., 2011. Hybrid power markets in Africa: Generation planning,procurement and contracting challenges. Energy Policy 39, 3191e3198.
Mangwengwende, S.E., 2002. Tariffs and subsidies in Zimbabwe’s reforming elec-tricity industry: steering a utility through turbulent times. Energy Policy 30,947e958.
Manso, L.a.F., Leite Da Silva, A.M., 2004. Probabilistic criteria for power systemexpansion planning. Electric Power Systems Research 69, 51e58.
Mbohwa, C., 2002. Zimbabwe: An Assessment of the Electricity Industry and WhatNeeds to Be Done. The Electricity Journal 15, 82e91.
McDowall, W., Eames, M., 2006. Forecasts, scenarios, visions, backcasts and road-maps to the hydrogen economy: A review of the hydrogen futures literature.Energy Policy 34 (11), 1236e1250.
Mebratu, D., Wamukonya, N., 2007. Electricity sector reform in Africa: key lessonsand emerging trends. Journal of Cleaner Production 15, 163e165.
Messner, S., Strubegger, M., 1995. User’s Guide for MESSAGE III. WP-95-96. Inter-national Institute for Applied Systems Analysis, Laxenburg, Austria.
Meyer, J.P., Greyvenstein, G.P., 1991. The influence of an increase in electricity tariffson the viability of heat pumps against direct heating for large consumers of hotwater in South Africa. Energy Economics 13, 238e244.
Modi, V., McDade, S., Lallement, D., Saghir, J., 2005. Energy Services for theMillennium Development Goals. Energy Sector Management Assistance Pro-gramme, United Nations Development Programme, UN Millennium Project, andWorld Bank. http://www.unmillenniumproject.org/documents/MP_Energy_Low_Res.pdf Available at:
M. Bazilian et al. / Utilities Policy 20 (2012) 1e16 15
Munson, Richard, 2004, April. Predicting Energy Futures. The Electricity Journal,70e79.
Murphy, J.T., 2001. Making the energy transition in rural east Africa: Is leapfroggingan alternative? Technological Forecasting and Social Change 68, 173e193.
Nagayama, H., 2007. Effects of regulatory reforms in the electricity supply industryon electricity prices in developing countries. Energy Policy 35, 3440e3462.
Nagayama, H., 2009. Electric power sector reform liberalization models and electricpower prices in developing countries: An empirical analysis using internationalpanel data. Energy Economics 31, 463e472.
Nagayama, H., Kashiwagi, T., 2007. Evaluating electricity sector reforms in Argen-tina: lessons for developing countries? Journal of Cleaner Production 15,115e130.
Nakata, T., 2004. Energy Economic Models and the Environment. Progress in Energyand Combustion Science 30, 417e475.
Neelsen, S., Peters, J., 2011. Electricity usage in micro-enterprises e Evidence fromLake Victoria, Uganda. Energy for Sustainable Development 15, 21e31.
Nexant, 2004. West Africa Regional Transmission Stability Report. USAID, ECOWAS.Nexant, 2009. SAPP Regional Generation and Transmission Expansion Plan Study.
SAPP.Nhete, T.D., 2007. Electricity sector reform in Mozambique: a projection into the
poverty and social impacts. Journal of Cleaner Production 15, 190e202.Norad, 2009. A Fast Track Comparative Analysis of the Various Power Generation
Options Available to Liberia. Norway.Nyoike, P., 2002. Is the Kenyan electricity regulatory board autonomous? Energy
Policy 30, 987e997.Odhiambo, N.M., 2009. Electricity consumption and economic growth in South
Africa: A trivariate causality test. Energy Economics 31, 635e640.Pachauri, S., Brew-Hammond, A., Barnes, D.F., Bouille, D.H., Gitonga, S., Modi, V.,
Prasad, G., Rath, A., Zerriffi, H., 2011. Energy Access for Development. In: TheGlobal Energy Assessment: Toward a More Sustainable Future. IIASA, Laxen-burg, Austria and Cambridge University Press, Cambridge, United Kingdom andNew York, NY, USA.
Pappas, S.S., Ekonomou, L., Karamousantas, D.C., Chatzarakis, G.E., Katsikas, S.K.,Liatsis, P., 2008. Electricity demand loads modeling using AutoRegressiveMoving Average (ARMA) models. Energy 33, 1353e1360.
Patlitzianas, K.D., Doukas, H., Kagiannas, A.G., Askounis, D.T., 2006. A reformstrategy of the energy sector of the 12 countries of North Africa and the EasternMediterranean. Energy Conversion and Management 47, 1913e1926.
Pereira, M.G., Sena, J.A., Freitas, M.a.V., Silva, N.F.D., 2011. Evaluation of the impact ofaccess to electricity: A comparative analysis of South Africa, China, India andBrazil. Renewable and Sustainable Energy Reviews 15, 1427e1441.
PIDA, 2011. Draft documentation of the Programme for Infrastructure Developmentin Africa.
Pineau, P.-O., 2002. Electricity sector reform in Cameroon: is privatization thesolution? Energy Policy 30, 999e1012.
Pineau, P.-O., 2007. How sustainable is policy incoherence? A rationalist policyanalysis of the Cameroonian electricity reform. Journal of Cleaner Production15, 166e177.
Pineau, P.-O., 2008. Electricity sector integration in West Africa. Energy Policy 36,210e223.
Pokharel, S., Chandrashekar, M., 1998. A multiobjective approach to rural energypolicy analysis. Energy 23, 325e336.
Price, D.H.R., Sharp, J.A., 1985. Investigation of the impact of changes in demand fore-castingmethod on the financial performance of an electricity supply undertaking.International Journal of Electrical Power and Energy Systems 7, 131e137.
Psarras, J., Capros, P., Samouilidis, J.E., 1990. Multicriteria analysis using a large-scaleenergy supply LP model. European Journal of Operational Research 44,383e394.
Rachmatullah, C., Aye, L., Fuller, R.J., 2007. Scenario planning for the electricitygeneration in Indonesia. Energy Policy 35, 2352e2359.
Rath-Nagel, S., Voss, A., 1981. Energy models for planning and policy assessment.European Journal of Operational Research 8, 99e114.
Riahi, K., Gruebler, A., Nakicenovic, N., 2007. Scenarios of long-term socio-economicand environmental development under climate stabilization. TechnologicalForecasting and Social Change 74 (7), 887e935.
Riahi, K., Dentener, F., Gielen, D., Grubler, A., Jewell, J., Klimont, Z., Krey, V.,McCollum, D., Pachauri, S., Rao, S., van Ruijven, B., van Vuuren, D.P., Wilson, C.,2011. Energy Pathways for Sustainable Development. In: The Global EnergyAssessment: Toward a More Sustainable Future. IIASA, Laxenburg, Austria andCambridge University Press, Cambridge UK.
Rowlands, I.H., 1994. International influences on electricity supply in Zimbabwe.Energy Policy 22, 131e143.
Samouilidis, J.E., Berahas, A., 1983. Energy policy modelling in developing andindustrializing countries. European Journal of Operational Research 13, 2e11.
Sanghvi, A.P., 1984. Least-cost energy strategies for power system expansion.Energy Policy 12, 75e92.
SAPP, 2010. SAPP Demand Forecasts. Table 2. Zimbabwe.Sebitosi, A.B., 2008. Energy efficiency, security of supply and the environment in
South Africa: Moving beyond the strategy documents. Energy 33, 1591e1596.Sebitosi, A.B., Okou, R., 2010. Re-thinking the power transmission model for sub-
Saharan Africa. Energy Policy 38, 1448e1454.Sebitosi, A.B., Pillay, P., Khan, M.A., 2006a. An analysis of off grid electrical systems in
rural Sub-Saharan Africa. Energy Conversion and Management 47, 1113e1123.
Sebitosi, A.B., Pillay, P., Khan, M.A., 2006b. An approach to rural distributionnetwork design for sub-Saharan Africa. Energy Conversion and Management 47,1101e1112.
Shrestha, R.M., Bhattarai, G.B., 1994. Utility planning implications of electricity lossreduction in developing countries: The case of Nepal. Energy Policy 22,531e537.
Sigauke, C. and Chikobvu, D. Prediction of daily peak electricity demand in SouthAfrica using volatility forecasting models. Energy Economics, Corrected Proof, inpress.
Silva, D., Nakata, T., 2009. Multi-objective assessment of rural electrification inremote areas with poverty considerations. Energy Policy 37, 3096e3108.
Sioshansi, F.P., 2006. Electricity market reform: What has the experience taught usthus far? Utilities Policy 14, 63e75.
Smith, R.A., Villegas, A.M., 1997. A comparative analysis of various optimizationmodels for electricity capacity expansion. International Transactions in Opera-tional Research 4, 35e44.
Lavalin, S.N.C., 2010. Regional Power System master Plan. EAC and EAPP.Sparrow, F.T., Bowen, B.H., Aouam, T., 2003. Technology Options in West Africa’s
Electricity Generation Expansion Planning for 2003 to 2013.Spinney, P.J., Watkins, G.C., 1996. Monte Carlo simulation techniques and electric
utility resource decisions. Energy Policy 24, 155e163.St. Denis, G., Parker, P., 2009. Community energy planning in Canada: The role of
renewable energy. Renewable and Sustainable Energy Reviews 13, 2088e2095.Steinbuks, J., Foster, V., 2010. When do firms generate? Evidence on in-house
electricity supply in Africa. Energy Economics 32, 505e514.Swisher, J., Januzzi, G., Redlinger, R., 1997. Tools and Methods for Integrated
Resource Planning. UNEP. Risoe, Denmark.Tekiner, H., Coit, D.W., Felder, F.A., 2010. Multi-period multi-objective electricity
generation expansion planning problem with Monte-Carlo simulation. ElectricPower Systems Research 80, 1394e1405.
Tewari, D.D., Shah, T., 2003. An assessment of South African prepaid electricityexperiment, lessons learned, and their policy implications for developingcountries. Energy Policy 31, 911e927.
Thom, C., 2000. Use of grid electricity by rural households in South Africa. Energyfor Sustainable Development 4, 36e43.
Thomas, W., 2006. Shell Scenarios. SEI perspective’s From Abroad, Ireland.Turkson, J., Wohlgemuth, N., 2001. Power sector reform and distributed generation
in sub-Saharan Africa. Energy Policy 29, 135e145.Turkson, J.K., 1990. Planning for the energy sector in Ghana Emerging trends and
experiences. Energy Policy 18, 702e710.UNDESA [United Nations Department of Economic and Social Affairs], 2009. World
Urbanisation Prospects.The 2009 Revsion. http://esa.un.org/unpd/wup/index.htm.
UNDP and WHO, 2009. Report on energy access in developing countries: review ofLDCs and SSAs. UN, New York.
UNECA and UNEP, 2007. Making Africa’s Power Sector Sustainable - An Analysis ofPower Sector Reforms in Africa. United Nations Economic Commission forAfrica, Addis Ababa, Ethiopia.
Ünler, A., 2008. Improvement of energy demand forecasts using swarm intelli-gence: The case of Turkey with projections to 2025. Energy Policy 36,1937e1944.
Unsihuay-Vila, C., Marangon-Lima, J.W., Zambroni De Souza, A.C., Perez-Arriaga, I.J.,2011. Multistage expansion planning of generation and interconnections withsustainable energy development criteria: A multiobjective model. InternationalJournal of Electrical Power and Energy Systems 33, 258e270.
Voropai, N.I., Ivanova, E.Y., 2002. Multi-criteria decision analysis techniques inelectric power system expansion planning. International Journal of ElectricalPower and Energy Systems 24, 71e78.
Weyant, J.P. (Ed.), 2004. EMF introduction and overview. Alternative technologystrategies for climate change policy. Energy Economics Special Issue, vol. 26,pp. 501e755.
Williams, J.H., Ghanadan, R., 2006. Electricity reform in developing and transitioncountries: A reappraisal. Energy 31, 815e844.
Winkler, H., 2005. Renewable energy policy in South Africa: policy options forrenewable electricity. Energy Policy 33, 27e38.
Winkler, H., Hughes, A., Haw, M., 2009. Technology learning for renewable energy:Implications for South Africa’s long-termmitigation scenarios. Energy Policy 37,4987e4996.
Wolde-Rufael, Y., 2006. Electricity consumption and economic growth: a time seriesexperience for 17 African countries. Energy Policy 34, 1106e1114.
World Bank, 2007. National Electrification Coverage Plan: Kenya. Earth Institute.Columbia University, USA.
WB [World Bank], 2011. Africa Infrastructure Country Diagnostic e ElectricitySpending Needs Model. http://www.infrastructureafrica.org/tools/models/electricity-spending-needs-model Accessed September.
Wu, Y.J., Chung, W., Fuller, J.D., 2000. Decomposing multi-regional dynamic energyprocess models. Applied Energy 66, 225e235.
Zhang, Y., Parker, D., Kirkpatrick, C., 2005. Competition, regulation and privati-sation of electricity generation in developing countries: does the sequencingof the reforms matter? The Quarterly Review of Economics and Finance 45,358e379.
Ziramba, E., 2008. The demand for residential electricity in South Africa. EnergyPolicy 36, 3460e3466.
M. Bazilian et al. / Utilities Policy 20 (2012) 1e1616