
Energies 2009 energies - MDPI Open Access Journals Platform
24
Energies 2009, 2, 1-24; doi:10.3390/en20100001 energies ISSN 1996-1073 www.mdpi.com/journal/energies Article Energy Inputs in Food Crop Production in Developing and Developed Nations David Pimentel 5126 Comstock Hall, Cornell University, Ithaca, NY 14853, USA; E-mail: [email protected] Received: 18 November 2008; in revised form: 5 January 2009 / Accepted: 13 January 2009 / Published: 16 January 2009 Abstract: Detailed energy outputs and inputs were assessed for the following crops, cultured in the U.S. and developing countries: corn, wheat, rice, soy, potato, cassava, tomato, citrus and apple. In addition, the labor input for each crop was analyzed. Keywords: Agriculture, crops, developed and developing countries, energy, food, renewable energy Introduction More than 3.7 billion people are malnourished in the world today [1]. This is the largest number and percentage of malnourished humans ever recorded. The world human population is currently at more than 6.7 billion and nearly a quarter million people are added to the population daily [2]. Based on the current rate of increase, the world population is projected to double to approximately 13 billion in less than 60 years [2]. By 2050, a population of 9.5 billion is projected [2]. Reports from the Food and Agriculture Organization of the United Nations and the U.S. Department of Agriculture, as well as from numerous other international organizations, confirm the serious nature of the global food shortages [3]. For example, the per capita availability of world cereal grains has been declining for the past 24 years (Figure 1). Although grains make up about 80% of the world's food supply, approximately half of the world’s population cannot afford grains. For this reason, prices of grains have not increased greatly during the past decade. However, because of biofuel production, especially corn ethanol, food shortages and food prices have recently increased from 10% to 50% [4]. OPEN ACCESS
Transcript of Energies 2009 energies - MDPI Open Access Journals Platform

Energies 2009, 2, 1-24; doi:10.3390/en20100001
energies ISSN 1996-1073
www.mdpi.com/journal/energies Article
Energy Inputs in Food Crop Production in Developing and Developed Nations
David Pimentel
5126 Comstock Hall, Cornell University, Ithaca, NY 14853, USA; E-mail: [email protected]
Received: 18 November 2008; in revised form: 5 January 2009 / Accepted: 13 January 2009 /
Published: 16 January 2009
Abstract: Detailed energy outputs and inputs were assessed for the following crops,
cultured in the U.S. and developing countries: corn, wheat, rice, soy, potato, cassava,
tomato, citrus and apple. In addition, the labor input for each crop was analyzed.
Keywords: Agriculture, crops, developed and developing countries, energy, food,
renewable energy
Introduction
More than 3.7 billion people are malnourished in the world today [1]. This is the largest number and
percentage of malnourished humans ever recorded. The world human population is currently at more
than 6.7 billion and nearly a quarter million people are added to the population daily [2]. Based on the
current rate of increase, the world population is projected to double to approximately 13 billion in less
than 60 years [2]. By 2050, a population of 9.5 billion is projected [2].
Reports from the Food and Agriculture Organization of the United Nations and the U.S. Department
of Agriculture, as well as from numerous other international organizations, confirm the serious nature
of the global food shortages [3]. For example, the per capita availability of world cereal grains has
been declining for the past 24 years (Figure 1). Although grains make up about 80% of the world's
food supply, approximately half of the world’s population cannot afford grains. For this reason, prices
of grains have not increased greatly during the past decade. However, because of biofuel production,
especially corn ethanol, food shortages and food prices have recently increased from 10% to 50% [4].
OPEN ACCESS

Energies 2009, 2
2
Figure 1. World per capita grain production from 1960 to 2000 [88].
As the world population continues to expand, greater pressure is being placed on resources essential
for food production, including fossil energy. The human population grows exponentially, while food
production increases arithmetically. The result is the current food deficit. The World Health
Organization reports that nearly 60% of the world population is malnourished – the largest number in
world history. Degradation and depletion of land, water, energy, and biological resources vital to
agriculture, have continued unabated, further restricting agricultural production [5]. Recent increases
in crop yields have occurred in fossil-fuel dependent agriculture in developed countries, but intensive
agricultural techniques contribute in some cases to environmental degradation, such as soil erosion [5].
This article assesses the current use of energy in developed and developing countries in their food
crop production systems, including some systems dependent on hand labor and draft animal power.
Energy Resources
People rely on various sources of energy and power. These sources range from human, animal,
wind, tidal, and water energy to wood, coal, gas, oil, solar, and nuclear sources of fuel and power.
Using fossil fuel resources enables a nation to feed an increasing number of humans, and improves the
general quality of life in many ways, including protection from malnourishment and numerous other
diseases [6].
About 473 quads (1 quad = 1015 BTU = 1.05 x 10¹⁸ Joules) from fossil and renewable energy
sources are used worldwide per year [7]. The current high rate of energy expenditure is related directly
to many factors, including rapid population growth, urbanization, and high resource-consumption
rates. Increased energy use also contributes to environmental degradation [5]. Energy use has been
growing at a rate even faster than the rate of growth of the world population. From 1970 to 1995,
energy use has been doubling every 30 years whereas the world population has been doubling every
40- 0 years [2, 7]. In the near future, energy use is projected to double every 32 years while the
population is projected to double in about 50 - 60 years [2, 7].
About 60% of all the solar energy captured by photosynthesis and incorporated in biomass
production worldwide is used by humans (Pimentel, unpublished data). This amount of energy, though
very large (approximately 720 quads), is inadequate to meet human needs. To compensate for the high
demand, about 413 quads of fossil energy (oil, gas, and coal) are utilized each year worldwide [7]. Of
Energies 2009, 2
3
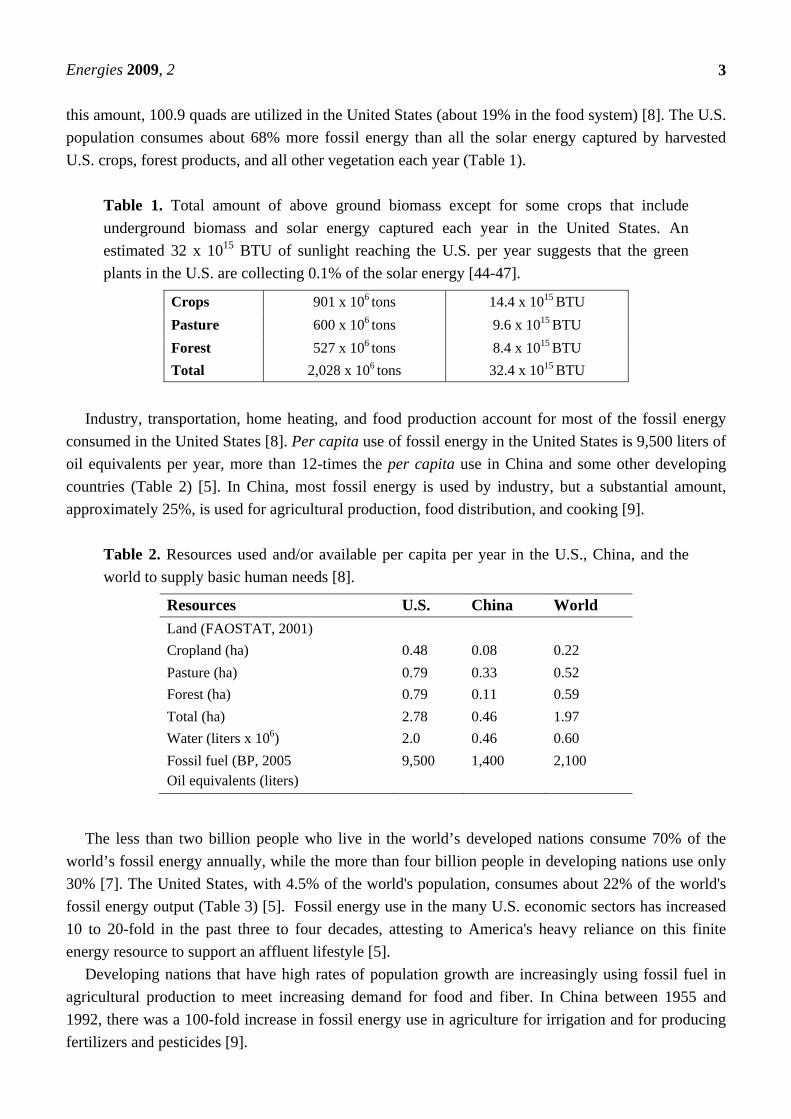
this amount, 100.9 quads are utilized in the United States (about 19% in the food system) [8]. The U.S.
population consumes about 68% more fossil energy than all the solar energy captured by harvested
U.S. crops, forest products, and all other vegetation each year (Table 1).
Table 1. Total amount of above ground biomass except for some crops that include
underground biomass and solar energy captured each year in the United States. An
estimated 32 x 1015 BTU of sunlight reaching the U.S. per year suggests that the green
plants in the U.S. are collecting 0.1% of the solar energy [44-47].
Crops 901 x 106 tons 14.4 x 10¹⁵ BTU
Pasture 600 x 106 tons 9.6 x 10¹⁵ BTU
Forest 527 x 106 tons 8.4 x 10¹⁵ BTU
Total 2,028 x 106 tons 32.4 x 10¹⁵ BTU
Industry, transportation, home heating, and food production account for most of the fossil energy
consumed in the United States [8]. Per capita use of fossil energy in the United States is 9,500 liters of
oil equivalents per year, more than 12-times the per capita use in China and some other developing
countries (Table 2) [5]. In China, most fossil energy is used by industry, but a substantial amount,
approximately 25%, is used for agricultural production, food distribution, and cooking [9].
Table 2. Resources used and/or available per capita per year in the U.S., China, and the
world to supply basic human needs [8].
Resources U.S. China World
Land (FAOSTAT, 2001)
Cropland (ha) 0.48 0.08 0.22
Pasture (ha) 0.79 0.33 0.52
Forest (ha) 0.79 0.11 0.59
Total (ha) 2.78 0.46 1.97
Water (liters x 106) 2.0 0.46 0.60
Fossil fuel (BP, 2005 Oil equivalents (liters)
9,500 1,400 2,100
The less than two billion people who live in the world’s developed nations consume 70% of the
world’s fossil energy annually, while the more than four billion people in developing nations use only
30% [7]. The United States, with 4.5% of the world's population, consumes about 22% of the world's
fossil energy output (Table 3) [5]. Fossil energy use in the many U.S. economic sectors has increased
10 to 20-fold in the past three to four decades, attesting to America's heavy reliance on this finite
energy resource to support an affluent lifestyle [5].
Developing nations that have high rates of population growth are increasingly using fossil fuel in
agricultural production to meet increasing demand for food and fiber. In China between 1955 and
1992, there was a 100-fold increase in fossil energy use in agriculture for irrigation and for producing
fertilizers and pesticides [9].

Energies 2009, 2
4
Table 3. Annual fossil and solar energy use in the U.S. and world (quads = 1015 BTU) [8].
Fuel U.S. World Petroleum 40.1 168 Natural gas 23.0 103 Coal 22.3 115 Nuclear 8.2 28 Biomass 3.0 30 Hydroelectric power 3.4 27 Geothermal and wind power 0.4 0.8 Biofuels 0.5 0.9 Total 100.9 472.7
Yet, worldwide fertilizer production has declined more than 22% per capita during the last decade
probably due to fossil fuel shortages, high prices, as well as economic transitions in Eastern Europe
and developing countries [10]. The long term projections of the availability of fossil energy resources
for fertilizers and for all other purposes are discouraging because of the limited quantities of
fossil fuels.
The world supply of oil and natural gas is projected to last about 40 - 60 years [11-14]. Coal is
projected to last 50 to 100 years [5, 11]. However, these estimates are based on current consumption
rates and current population numbers. If all people in the world enjoyed a standard of living and
consumed energy at a rate similar to that of the average American, and the world population continued
to grow at a rate of 1.2%, the world's fossil fuel reserves would last only about 17 years.
If we continue to hope that new discoveries of oil will postpone when oil and natural gas disappear,
this is wishful thinking. A recent report indicates that the world is consuming 27 billion barrels of oil
annually. However, the rate of discovery has fallen to only seven billion barrels (W. Youngquist,
Professional Geologist, Eugene, Oregon, personal communication 2000). Thus, humans are burning
nearly four times as much oil as they find each year worldwide.
Youngquist [11] reports that current oil and gas exploration drilling data have not borne out some of
the earlier optimistic estimates of the amount of these resources yet to be found in the United States.
Both the production rate and proven reserves continue to decline. Domestic oil and gas are imported in
ever increasing amounts yearly [8], indicating that neither is now sufficient for domestic needs and
supplies. Domestic oil and natural gas production will be substantially less in 15 years than it is today.
Analyses suggest that as of 2008 the United States has consumed about 90% of the recoverable oil that
was ever in the ground and that we are currently consuming the last 10% of our oil [8]. The United
States is now importing more than 63% of its oil. This puts the U.S. economy at risk due to fluctuating
oil prices, volatile political situations, such as the 1973 oil crisis and the current Iraq War.
By using available renewable energy technologies, such as biomass and wind power, an estimated
200 quads of renewable energy could be produced worldwide using 20% to 26% of the land area (Yao
Xlang-Jun, personal communication, Cornell University, 1998) [15]. It should be noted that 200 quads
is less than half of the energy currently consumed. Producing the 200 quads of renewable energy may
require transferring some important pasture and forest land to energy production. A self-sustaining
renewable energy system producing 200 quads of energy per year would be insufficient for the current

Energies 2009, 2
5
population of 6.7 billion people in the world at the current fossil energy consumption rate [5]. A
sustainable energy program might be possible for a sustainable population of only two billion people,
but not the current 6.7 billion people in the world [15].
Food Crop Production, Energy Inputs and Economic Costs
A total of 12 crops were selected for this analysis of energy inputs and economic costs of food
production systems in developed and developing countries. The selected crops, which include rice,
corn, wheat, soybeans, cassava and potato, provide most of the world’s food supply. Earlier we
mentioned that cereal grains make up about 80% of the world’s food and it should be mentioned that
cassava, potato, and sweet potato play an important role in providing food for more than two billion
people [16]. Apples, oranges, and tomatoes were included for examples of desirable crops that provide
limited nutrients worldwide.
Corn
The Food and Agriculture Organization [17] and others [18] report that corn is one of the world’s
major cereal crops. Under favorable environmental conditions, corn is one of the most productive
crops per unit area of land. An analysis of energy inputs and yields suggests that the high yields of
intensive corn production are in part related to the large inputs of fertilizers, irrigation, and pesticides.
Investing many hours of labor, a person can produce corn using little fossil energy (Table 4). Corn
production by hand in Indonesia requires about 634 hours of labor and five hours of bullock power per
hectare, an energy expenditure of 4.0 million kcal. With a corn yield of 1,200 kg/ha in Indonesia (6.9
million kcal), the energy input:output ratio is 1:1.08 (Table 4). Note that the energy input is slightly
higher than it might be if the energy for the bullock power were withdrawn. The bullocks mostly
consume forage and little or no fossil energy is needed for the animals.
Table 4. Energy inputs of corn production per hectare in India and Indonesia.
Inputs Quantity kcal x 1000Labor 634 hrsa 1,170g
Bullock (pair) 200 hrsh 1,300b
Machinery 10 kgc 185d
Nitrogen 71 kgf 1,200e
Phosphorus 36 kgf 145e
Manure 600 kga 961b
Seeds 33.6 kgf 121d
TOTAL 5,082Corn yield = 1,721 kga 6,200d
Kcal input: output = 1:1.08
a) Djauhari et al. (1988) [48]; b) Tripathi and Sah (2001) [34]; c) Estimated; d) Pimentel (1980) [22]; e)
FAO (1999) [49]; g) R. S. Doughty (unpublished); h) Per capita use of fossil energy in Indonesia is about
369 liters of oil equivalents per year (BP, 2005 ) [33]; i) Jeer Organization (1990) [50]

Energies 2009, 2
6
The energetics of mechanized corn production are distinctly different from those of labor-intensive
food-crop production. Corn production in the United States today is typical of intensive crop
production technology. The total input of human power is only 11.4 hrs per hectare compared with 634
hrs in the labor-intensive system in India and Indonesia discussed previously (Tables 4 and 5). In the
U.S. system, approximately 25% of the total energy is consumed in labor-reducing mechanization
(Table 5).
Table 5. Energy inputs and costs of corn production per hectare in the United States.
Inputs Quantity kcal x 1000 Costs $ Labor 11.4 hrsa 462b 148.20c Machinery 55 kgd 1,018e 103.21f Diesel 40 Li 405j 20.80g
Nitrogen 155 kga 2,480k 85.25l Phosphorus 79 kga 328m 48.98n Potassium 84 kga 274o 26.04p Lime 1,120 kgq 315r 19.80 Seeds 21 kgd 520d 74.81s Irrigation 8.1 cmt 320u 123.00v Herbicides 6.2 kgw 620z 124.00 Insecticides 2.8 kgx 280z 56.00 Electricity 13.2 kWhy 34aa 0.92 Transport 204 kgbb 169cc 61.20 TOTAL 8,228 $926.97 Corn yield 9,400 kg/hadd 33,840 Kcal input: output
1:4.11
a) NASS, 2003 [51]; b) It is assumed that a person works 2,000 hrs per year and utilizes an average of 8,000
liters of oil equivalents per year; c) It is assumed that labor is paid $13 an hour; d) Pimentel and Pimentel,
1996 [52]; e) Prorated per hectare and 10 year life of the machinery. Tractors weigh from 6 to 7 tons and
harvesters 8 to 10 tons, plus plows, sprayers, and other equipment; f) Hoffman et al., 1994 [53]; g) Wilcke
and Chaplin, 2000 [54]; h) Input 11, 400 kcal per liter; i) Estimated; j) Input 10,125 kcal per liter; k) Patzek,
2004 [55]; l) Cost $.55 per kg; m) Input 4,154 kcal per kg; n) Cost $.62 per kg; o) Input 3,260 kcal per kg; p)
Cost $.31 per kg; q) Brees, 2004 [56]; r) Input 281 kcal per kg; s) USDA, 1997 [57]; t) USDA, 1997 [58]; u)
Batty and Keller, 1980 [59]; v) Irrigation for 100 cm of water per hectare costs $1,000 (Larsen et al., 2002)
[60]; w) Larson and Cardwell, 1999 [61]; x) USDA, 2002 [62]; y) USDA, 1991 [63]; z) Input 100,000 kcal
per kg of herbicide and insecticide; aa) Input 860 kcal per kWh and requires 3 kWh thermal energy to
produce 1 kWh electricity; bb) Goods transported include machinery, fuels, and seeds that were shipped an
estimated 1,000 km; cc) Input 0.83 kcal per kg per km transported; dd) Average. USDA, 2006; USCB, 2004-
2005 [19, 64]
In the U.S. system, the total fossil fuel input is estimated to be 8.2 million kcal/ha (Table 5). The
corn yield is also high, about 9,400 kg/ha, or the equivalent of 34 million kcal/ha of food energy. This
results in an input:output ratio of 1:4.11.

Energies 2009, 2
7
The fossil energy inputs into U.S. corn production are primarily from oil for machinery and natural
gas for fertilizers. Nitrogen fertilizer, which requires natural gas for production, represents the largest
single input, about 30% of the total fossil energy inputs (Table 5).
While corn yields are higher in the intensive system than for hand-produced corn, the economic
investment is $927/ha, compared with less than $100 per hectare in the hand-produced system
(Table 5).
Wheat
Wheat and rice are the two most important cereal crops grown in the world today, and more humans
eat wheat than any other cereal grain. Wheat is produced employing diverse techniques with energy
sources ranging from human labor, to animal power to mechanization. As with corn production, energy
inputs and yields vary with each wheat production system.
For example, wheat farmers in Kenya use human power (Table 6). Total energy input in this system
is about 1.9 million kcal which provides a harvest of about 6.4 million kcal in wheat (Table 6), for an
energy input:output ratio of about 1:3.31.
Table 6. Energy inputs of wheat production per hectare in Kenya.
Inputs Quantity kcal x 1000
Labor 684 hrsb,e 165d
Machinery 10 kgg 185c
Diesel 35 Lg 350c
Nitrogen 22 kgb 352a
Phosphorus 58 kgb 234a
Seeds 202 kgb 606c
Transportation 200 kgb 51c
TOTAL 1,943
Wheat yield = 1,788 kge 6,437 kcal input: output = 1:3.31
a) Surendra et al., (1989) [65]; b) Hassan et al., (1993) [66]; c) Pimentel (1980) [22]; d) Per capita use of
fossil energy in Kenya is estimated to be 520 liters of oil equivalents per year based on African data (BP,
2005) [33]; e) Longmire and Lugogo (1989) [67]; f) Kurian (1992) [68]; g) Estimated.
Wheat production in the United States requires more than twice the fossil energy inputs as the low
input Kenyan production system (4.2 million kcal) (Tables 6 and 7). Large machinery powered by
fossil fuels replaces the animal power and dramatically reduces the labor input from 684 hrs for Kenya
to only 7.8 hrs for the U.S. system (Tables 6 and 7). The heavy use of fertilizers and other inputs
increased wheat yields to 2,990 kg/ha (Table 7). The input: output ratio in the U.S. for wheat
production, approximately 1: 2.57, is lower than that in Kenya.

Energies 2009, 2
8
Table 7. Energy inputs of wheat production per hectare in the United States.
Inputs Quantity kcal x 1000 Labor 7.8 hrsa 312d Machinery 50 kge 925e
Diesel 100 Lb 1,000e Nitrogen 68.4 kgc 1,094e
Phosphorus 33.7 kgc 143e Potassium 2.1 kgc 6f
Seeds 60 kga 218f
Herbicides 4 kga 400g Insecticides 0.5 kga 5g
Electricity 14 kWha 12e Transport 198 kga 67e
TOTAL 4,182 Wheat yield 2,900 kg/ha 10,765
kcal input: output 1:2.57
a) Pimentel and Pimentel, 2008 [5]; b) Karpenstein and Shaeffer, 1998 [69]; c) USDA, 1997 [57]; d) It is
assumed that a person works 2,000 hrs per year and utilizes an average of 8,000 liters of oil equivalents per
year; e) Estimated; f) FAO, 1999 [28]; g) 100,000 kcal/kg
Rice
Rice is the staple food for an estimated 3 billion people, who live primarily in developing countries.
This heavy consumption makes an analysis of various rice production technologies particularly
relevant.
Table 8. Energy inputs of draft animal-produced rice per hectare in the Valley of Garhwal
Himalaya, India.
Inputs Quantity kcal x 1000
Labor 1,703 hrsa 2,380c
Bullocks 328 hrsa 357a
Machinery 2.5 kgb 5f
Nitrogen 12.3 kga 197d
Phosphorus 2.5 kga 113d
Manure 3,056 kga 5,071a
Seeds 44 kga 160a
Pesticides 0.3 kga 30d
TOTAL 8,313
Rice yield = 1,831 kga 6,591b
kcal input: output = 1: 0.79
a) Tripathi & Sah, (2001) [34]; b) Estimated; c) Per capita fossil energy use in the India is 280 liters of oil
equivalents per year (BP, 2005) [33]; d) FAO (1999) [49]; e) The total for fertilizers reported in Tripathi &
Sah (2001) [34] was $1.60, we allocated $1.30 for nitrogen; f) Pimentel, (1980) [22]
Energies 2009, 2
9
The rice production system practiced by Indian farmers using human labor and bullocks requiring
1,703 hrs of human labor and 328 hrs of bullock labor (Table 8). Energy inputs in this rice system
total about 6.6 million kcal. The total rice yield is 1,831 kg/ha (6.6 million kcal), resulting in an energy
input:output ratio of about 1: 0.79 (Table 8). This energy ratio could be much higher if the energy for
the bullocks were removed from the assessment. This would be a reasonable adjustment, if the
bullocks do not depend on fossil energy, but feed on forage and little or no grain.
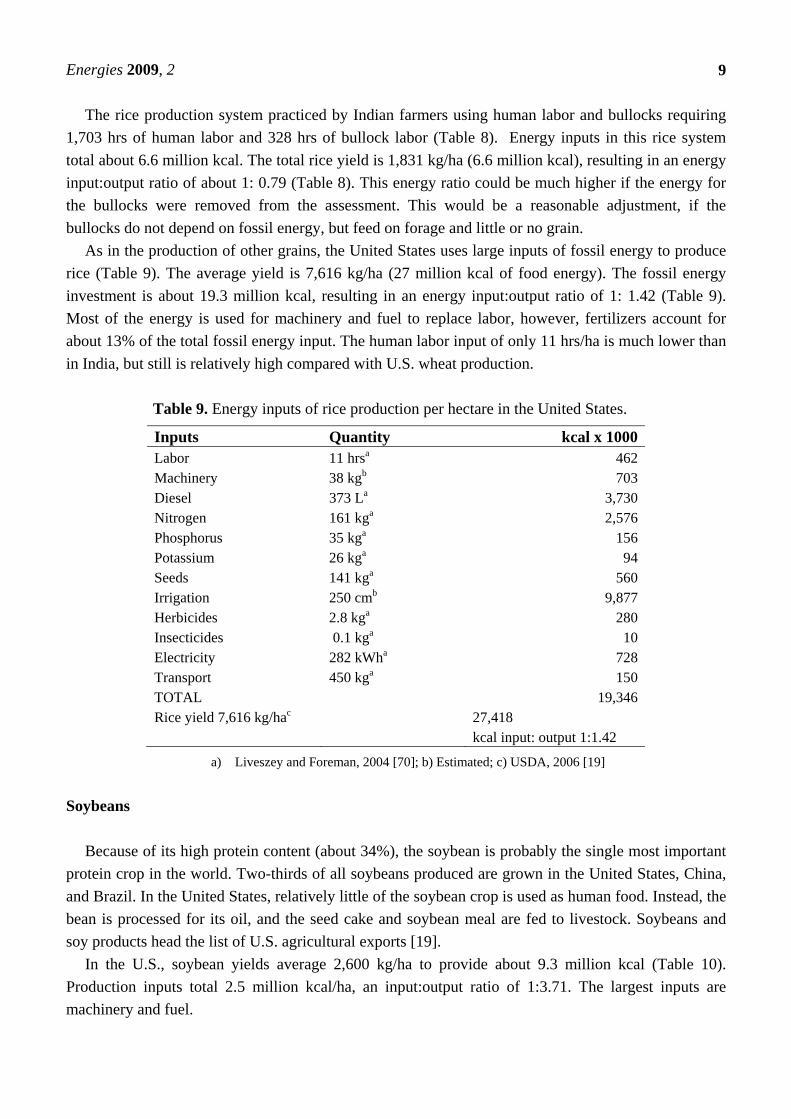
As in the production of other grains, the United States uses large inputs of fossil energy to produce
rice (Table 9). The average yield is 7,616 kg/ha (27 million kcal of food energy). The fossil energy
investment is about 19.3 million kcal, resulting in an energy input:output ratio of 1: 1.42 (Table 9).
Most of the energy is used for machinery and fuel to replace labor, however, fertilizers account for
about 13% of the total fossil energy input. The human labor input of only 11 hrs/ha is much lower than
in India, but still is relatively high compared with U.S. wheat production.
Table 9. Energy inputs of rice production per hectare in the United States.
Inputs Quantity kcal x 1000 Labor 11 hrsa 462 Machinery 38 kgb 703 Diesel 373 La 3,730 Nitrogen 161 kga 2,576 Phosphorus 35 kga 156 Potassium 26 kga 94 Seeds 141 kga 560 Irrigation 250 cmb 9,877 Herbicides 2.8 kga 280 Insecticides 0.1 kga 10 Electricity 282 kWha 728 Transport 450 kga 150 TOTAL 19,346 Rice yield 7,616 kg/hac 27,418
kcal input: output 1:1.42
a) Liveszey and Foreman, 2004 [70]; b) Estimated; c) USDA, 2006 [19]
Soybeans
Because of its high protein content (about 34%), the soybean is probably the single most important
protein crop in the world. Two-thirds of all soybeans produced are grown in the United States, China,
and Brazil. In the United States, relatively little of the soybean crop is used as human food. Instead, the
bean is processed for its oil, and the seed cake and soybean meal are fed to livestock. Soybeans and
soy products head the list of U.S. agricultural exports [19].
In the U.S., soybean yields average 2,600 kg/ha to provide about 9.3 million kcal (Table 10).
Production inputs total 2.5 million kcal/ha, an input:output ratio of 1:3.71. The largest inputs are
machinery and fuel.

Energies 2009, 2
10
Table 10. Energy inputs in soybean production per hectare in the U.S.
Inputs Quantity kcal x 1000 Labor 6 hrsa 240b Machinery 20 kgc 360d,e
Diesel 38.8 La 444f
Nitrogen 3.7 kgg 59h
Phosphorus 37.8 kgg 156i
Potassium 14.8 kgg 48j
Limestone 2000 kgo 562c Seeds 56 kga 450k Herbicides 1.7 kga 170d Electricity 10 kWhc 29l Transport 150 kgm 16n TOTAL 2,524 Soybean yield 2,600 kg/hap 9,360
kcal input: output 1:3.71
a) Metzger, 2002 [71]; b) It is assumed that a person works 2,000 hrs per year and utilizes
an average of 8,000 liters of oil equivalents per year; c) Pimentel and Pimentel, 2008 [5]; d)
Machinery is prorated per hectare and a 10-year life of the machinery. Tractors weigh from
6 to 7 t and harvesters from 8 to 10 tons, plus plows, sprayers, and other equipment; e)
College of Agri., Consumer & Environ. Sciences, 1997 [72]; f) Input 11,400 kcal per liter;
g) Economic Research Statistics, 1997 [73]; h) Patzek, 2004 [55]; i) Input 4,154 kcal per
kg; j) Input 3,260 kcal per kg; k) Pimentel et al., 2002 [20]; l) Input 860 kcal per kWh and
requires 3 kWh thermal energy to produce 1 kWh electricity; m) Goods transported include
machinery, fuels, and seeds that were shipped an estimated 1,000 km; n) Input 0.34 kcal per
kg per km transported; o) Mississippi State University Extension Service, 1999 [74]; p)
USDA, 2006 [19]
Legumes need less nitrogen than other crops because under most conditions soybeans and other
legumes biologically fix their own nitrogen. The biological fixation process carried out by soil
microbes uses about 5% of the light energy captured by the soybean plants, but saves the energy that
would otherwise be used for nitrogen fertilizer production. Supplying 100 kg per hectare of
commercial nitrogen fertilizer to replace the nitrogen fixed by soybeans would necessitate spending
1.6 million kcal of fossil energy. The labor input in the U.S. was only 6 hrs/ha (Table 10), while in the
Philippines it is reported to be 744 hrs [20].
Potato
The white potato is one of the 15 most heavily consumed plant foods in the world today. Even in
the United States, where a wide variety of vegetables is available, more potatoes are eaten than any
other vegetable – about 22 kg of potato per person per year [19]. Potatoes contain protein (1.5 to
2.5%), are high in vitamin C and potassium, and offer a good source of carbohydrates.

Energies 2009, 2
11
In a high intensity potato production system, production per hectare is several times greater than
that of other carbohydrate producing crops. More importantly, protein production per hectare is 2 to 3
times greater than for other crops.
Based on data from the United States, the largest inputs are for machinery and fuel (Table 11). The
third largest input is for fertilizers. The total energy inputs are about 15.0 million kcal/ha and the
potato yield is nearly 44,000 kg/ha (25.2 million kcal of food energy) (Table 11). The resulting input:
output ratio is 1: 2.76. The high water content of potatoes (80%) makes transport relatively
energy costly.
Table 11. Energy inputs in potato production per hectare in the U.S.
Inputs Quantity kcal x 1000
Labor 35 hrsa 1,600c Machinery 50 kgb 925e
Diesel 350 Lb 3,990f
Nitrogen 319 kgb 5,104g
Phosphorus 241 kgb 1,085h
Potassium 196 kgb 627i
Sulfur 95 kgb 572e Seeds 24 kgb 30e Herbicides 6.7 kgb 670e Insecticides 9.0 kgb 900e Fungicides 10 kgb 10,000e Electricity 47 kWhd 40j Transport 2,000 kgk 94l TOTAL 14,817 Potato yield 44,000 kg/ham 25,168
kcal input: output 1: 2.76
a) Pimentel et al., 2002 [20]; b) Patterson, 2002 [75]; c) It is assumed that a person works
2,000 hrs per year and utilizes an average of 8,000 liters of oil equivalents per year; d)
Pimentel and Pimentel, 2008 [5]; e) Pimentel, 1980 [22]; f) Input 11,400 kcal per liter; g)
Patzek, 2004 [55]; h) Input 4,154 kcal per kg; i) Input 3,260 kcal per kg; j) Input 860 kcal
per kWh and requires 3 kWh thermal energy to produce 1 kWh electricity; k) Goods
transported include machinery, fuels, and seeds that were shipped an estimated 1,000 km; l)
Input 0.34 kcal per kg per km transported; m) USDA, 2006 [19]
Cassava
Cassava is an important food crop worldwide, especially in Africa, Asia, and Latin America. It is
one of the highest-producing crops in terms of carbohydrate per hectare, but one of the lowest in terms
of protein per hectare. The crop can be grown in low-fertility soils.
The data for cassava production data are from Nigeria (Table 12). In this case, the yield is 19,000
kg/ha, (71.9 million kcal/ha). With an input of 9.5 million kcal/ha, the resulting input:output ratio is 1:
7.57 (Table 12). The labor input in this cassava system is high, 1,632 hrs/ha.

Energies 2009, 2
12
Table 12. Energy inputs for cassava production per hectare in Nigeria.
Inputs Quantity kcal x 1000 Labor 1,632 hrsa 3,050c Draft animal (buffalo) 200 hrsb 495b Machinery 5 kgb 93d Nitrogen 90 kge 1,440f Phosphorus 45 kge 19g Potassium 45 kge 16h Manure 2,500 kgi 4,146b Cassava sticks (planting) 6,000 sticks b (120 bundles) b 268 b
TOTAL 9,527 Cassava yield 19,000 kgj 71,940 kcal input:output = 1:7.57
a) CIAT, 1996 [76]; b) Estimated; c) Estimated that each person uses 340 liters of oil equivalents per year.
This is based on the average per capita use of fossil energy in Nigeria (British Petroleum, 2005) [33]; d)
Pimentel, 1980. [22]; e) Ano and Ikwelle, (2008) [77]; f) 16,000 kcal/kg; g) 4,200 kcal/kg; h) 3,600 kcal/kg;
i) Fening, et al., 2005 [78]; j) Agbaje and Akinlosotu, 2004 [79]
Tomato
Tomatoes are valued nutritionally for vitamin C (23 mg per 100 g of fresh tomato), vitamin A
and iron.
Table 13. Energy inputs of tomato production per hectare in the United States.
Inputs Quantity kcal x 1000 Labor 184 hrsa 1,600e Machinery 100 kgb 925f Diesel 250 Lc 2,850 f Nitrogen 75 kgg 1,200c Phosphorus 196 kgg 96c Potassium 308 kgg 100c Lime 1,120 kgg 358c Seedlings 32,000a 600c Herbicides 1.5 kgd 150f
Insecticides 0.72 kgd 72 f Fungicides 32.3 kgd 3,230 f Electricity 232 kWhc 200c Transportation 691 kgc 80c TOTAL 20,578 Tomato yield = 80,000 kgh 16,000 kcal output/kcal input = 1: 0.78
a) Kelly et al. (1995) [80]; b) Estimated machinery; c) Pimentel and Pimentel (2008) [5]; d) USDA (1997).
[57]; e) It is assumed that a person works 2,000 hrs per year and utilizes an average of 10,200 liters of oil
equivalents per year; f) Pimentel (1980) [22]; g) Ohio State (2008) [81]; h) USDA, 2006 [19].

Energies 2009, 2
13
The labor input for tomatoes in the United States is high, about 184 hrs/ha (Table 13). Most of the
energy input are for machinery and fuel, and fertilizers are the third largest input. The tomato yield is
80,000 kg/ha, providing 16.0 million kcal of food energy. With a fossil energy input of 20.6 million
kcal, the resulting input:output ratio is 1:0.78 (Table 13).
Oranges
Oranges are a valuable fruit in U.S. agriculture costing about $3,000 per hectare for production
[19]. Although oranges and other citrus fruits have more than double the vitamin C content of white
potatoes, U.S. citizens obtain half of their vitamin C from white potatoes and half from citrus. The
production of oranges requires 20.0 million kcal/ha of fossil energy (Table 14). The return in food
energy is 22.3 million kcal, with an input:output ratio of 1: 1.11.
Table 14. Energy inputs of citrus production per hectare in the United States.
Inputs Quantity kcal x 1000 Labor 200 hrsa 10,000b Machinery 50 kgc 585d Diesel 337 La 4,700d Nitrogen 196 kga 3,136d Phosphorus 98 kga 294d Potassium 196 ka 314d Lime 1,120 kga 353d Herbicides 0.8 kga 8e Insecticides 0.3 kga 300e Fungicides 1.5 kga 150e Electricity 40 kWha 129d Transport 228 kga 59d TOTAL 20,028 Citrus yield 48,000 kg/haf
22,300
kcal input: output 1:1.11
a) Reitz, 1980; Fluck, 1992; Ozkan et al., 2004 [82-84]; b) A person in the U.S. uses 9,450 liters of oil
equivalents per year and works 2,000 hours per year. Thus, it was calculated that the labor input in this citrus
system utilized 10,000 kcal; c) Estimated; d) Pimentel, 1980 [22]; e) 100,000 kcal per kg of pesticide; f)
USDA, 2007 [85]
Apples
Apples are an economically valuable crop in the United States costing about $7,700 per hectare to
produce [19]. In the United States, petroleum products are used to operate machinery in apple
orchards. The inputs for this machinery account for a large percentage of the total energy input (Table
15). Pesticides contribute nearly 60% of the total energy input in apple production.
The labor input of 400 hrs/ha expended in apple production is high compared with that of most
other food crops grown in the United States. Most of the labor input occurs during harvesting. The

Energies 2009, 2
14
total labor input is about 20.0 million kcal/ha. The total apple yield is 54,000 kg/ha, providing 30.3
million kcal of food energy. The input:output ratio is 1: 0.18.
Table 15. Energy inputs of apple production per hectare in the United States.
Inputs Quantity kcal x 1000 Labor 400 hrsa 20,000b Machinery 88 kga 1,029c Diesel 2,000 Ld 40,000c Nitrogen 50 kge 800d Phosphorus 114 kga 627f Potassium 114 kga 231g Lime 682 kga 1,438h Herbicides 6 kgi 6c Insecticides 47 kgi 47,000c Fungicides 49 kga 49,000c Electricity 40 kWhi 129j
Transport 3,000 kgk 102l TOTAL 166,356 Apple yield 54,000 kg/hae
30,294
kcal input: output 1:0.18
a) Mon and Holland, 2005 [86]; b) A person in the U.S. uses 9,450 liters of oil equivalents per year and
works 2,000 hours per year. Thus, it was calculated that the labor input in this apple system utilized 20,000
kcal; c) Pimentel, 1980 [22]; d) Estimated; e) USDA, 2007 [85]; f) 55,000 kcal/kg; g) 2,026 kcal/kg; h) 2,290
kcal/kg; i) Funt, 1980 [87]; j) Calculated; k) Machinery, fuel, and lime transported; l) 0.34 kcal/kg
Apple production in the United States is more energy intensive than orange production (Tables 14
and 15). From the standpoint of vitamin C content, oranges have about 50 milligrams (mg) per 100 g.
However, apples contain only 3 mg per 100 g of vitamin C. Thus, vitamin C is produced more
efficiently with oranges compared with apples.
Irrigated Crops
Producing food crops employing irrigation requires enormous amounts of water and fossil energy to
pump and apply the fresh water [21]. For example, a corn crop grown in an arid region requires about
1,000 mm of irrigated water. This is ten thousand cubic meters or 2.6 million U.S. gallons per hectare.
To pump this water from a depth of only 30.5 m (100 feet) and apply it requires about 20.5 million
kcal of fossil energy.
In the case of irrigated corn, which is planted on half of U.S. irrigated land, the total energy input is
about 20.5 million kcal per hectare, more than 2.5 times the 8.2 million kcal required for the same
yield of rainfed corn. This agrees with an investigation of irrigated and rainfed corn yields in
Nebraska [22].
In addition to increased energy for irrigation, the economic costs of production also rise in an
irrigated production system.

Energies 2009, 2
15
Economics of Food Crop Production
The price value of several crops in developing countries and developed countries averages about
12¢ per kg [20].
Corn is produced more cheaply in the U.S. (8¢/kg) than in Indonesia (10¢/kg), whereas rice is
produced more cheaply in India (11¢/kg) than in the U.S. (21¢) [20]. Wheat production costs are
similar in the U.S. and India. Of course, no mention has been made of the relative incomes and
purchasing power in each nation. This would change the perspective significantly
Despite the fact that farm wages are extremely low in developing countries, ranging from 6¢ to 50¢
per hour, labor is the primary cost for food production in developing countries because of the great
number of hours invested in production. Labor input in developing countries ranges from 600 to 1,800
hours per hectare [20]. The primary costs in U.S. food crop production are for mechanization,
fertilizers, and pesticides. When irrigation is employed, the cost is 2 to 3 times the cost of all the other
inputs in U.S. food crop production [5].
World Food and Role of Fossil Energy
The significant achievement of using fossil energy to increase crop yields, the cereals in particular,
started in 1950 with the advent of the Green Revolution [5]. During the 1950s, plant breeders bred
wheat, rice, corn, and other cereal crops to have short stature so that large quantities of fertilizers,
especially nitrogen, could be applied in production. The short stature is essential to prevent from
falling over (lodging), which results in nearly a 100% loss of the crop.
Changes in Crop Yields
The 20 to 50-fold increase in fertilizers, pesticides, and irrigation (all fossil energy dependent)
increased U.S. cereal crop yields per hectare between 3 and 4 times between 1950 and 1980 [23,24].
For example, fertilizer use on corn increased from about 5 kg/ha in 1945 to about 150 kg/ha (30 times),
while corn yields increased by about 4 times [5]. The increase in yields during the 30-year period from
1950 to 1980 was about 3% per year. Since 1980, however, cereal crop yield increases have declined
to only about 1% per year [19,25]. Crops have limits to the amounts of fertilizers and pesticides that
they can use and tolerate. In fact, nitrogen fertilizer application rates of approximately 500 kg/ha or
more are toxic to the crop and cause yields to decline [26].
Measured in terms of cereals produced per capita worldwide, food crop production has declined
since 1984 (Figure 1). Shortages of resources, such as cropland, freshwater, and fertilizers, have
contributed to slowing food production, including cereal grain production, and consequently the
availability of food per capita [5]. Cereals are an extremely important food source because they
provide 80% of the world’s food. There are several factors that account for the reported decline in food
available per capita. As the world population increases at an exponential rate of 1.2% [27], the non-
exponential rate of food production increase is only about 1% [28]. In 75 countries, less grain was
produced at the end of the 1980’s than at the beginning [29]. It is apparent that the food supply cannot
keep up with the increase in the world population (currently at 6.7 billion).

Energies 2009, 2
16
If the world population increases to 7.8 billion in about 10 years, yields will have to be increased by
33% just to maintain the current inadequate food supply levels [30]. For the entire world to enjoy a
European level of food consumption, yields would have to increase by an additional 70%. These
calculations are based on no increase in cropland area for cereal crops. If the increased yields were
equally a result of both increased cropland and yield, average yields would have to increase from 2.5
t/ha and reach a level of 4.3 t/ha. This kind of increase almost certainly requires an intensification of
farming practices and heavy reliance on fossil energy [30]. Improved distribution of food in the world
would help the poor.
Per capita use of fertilizers worldwide during the past decade declined 22% [31-32], while available
cropland resources per capita decreased more than 20% [5]. A total of 560 million ha of the 1,500
million ha of cropland worldwide are seriously degraded [30]. Irrigated land area in developing
countries declined about 10% over the past decade [21]. A total of 20% of the irrigated croplands
worldwide suffer from salinization – a result of poor irrigation and drainage practices [30]. Although
cereal yields per hectare are slowly increasing, by about 1% per year, human numbers and demand are
increasing at a greater rate than food production [5].
As mentioned, the major factor reducing per capita cereal production is the rapid rate of increase in
the world population [27]. The end result of the reduced rate of increase in crop yields and increasing
human numbers is malnutrition. Earlier we indicated that the World Health Organization reports that
more than 3.7 billion people are malnourished and the numbers continue to increase [1]. Regions of the
world where population growth is highest are also regions where per capita food production is lowest.
Role of Fossil Energy in Crop Production
The total amount of fossil energy consumed in the world is about 473 quads (Table 3) [7].
Approximately 70% are used in developed countries and 30% are used in developing countries [33].
The population in developed countries is less than 2 billion while more than 4 billion live in
developing countries [27].
Approximately 40 quads of fossil energy are consumed to supply food for people in developed
countries, however, only about 16 quads of this are used for agricultural production. The 16 quads
represent both crop and livestock production [5]. The remaining 24 quads in developed countries are
used for food processing, packaging, distribution, and preparation. In developing countries,
approximately 16 quads are consumed in agricultural production. Most of the cooking in developing
countries is carried out using biomass energy (fuelwood, crop residues, and dung) [5]. From 2 to 3 kcal
of biomass energy are used to prepare 1 kcal of food in developing countries [5, 34]. Therefore, total
energy in the food system in developing countries is between 48 and 75 quads per year.
Crop production in both developed and developing countries requires from 2 to 166 million kcal/ha
(See tables). In developed countries, the fossil energy inputs for machinery to reduce the labor input
are high, whereas in the developing countries the fossil energy inputs for labor are high (See tables).
Note that fossil energy inputs for labor are listed in terms of an average per capita fossil fuel
consumption. Most of the fossil energy used in food crop production in both developed and developing
countries is in the form of oil and natural gas. Oil is essential for farm machinery and natural gas is
vital for the production of nitrogen fertilizers.

Energies 2009, 2
17
The total energy in the food system in developed countries is approximately 4 kcal invested to
supply 1 kcal of food, while in developing countries the ratio is approximately 1 kcal invested to
supply 1 kcal of food [5]. In developed countries people utilize an average of 3,500 kcal of food per
person per day, whereas people in developing countries use 2,400 kcal of food per day per person [35].
This 1,100 fewer kcal utilized per person per day in developing countries reflects many young people
in developing countries receiving fewer calories per day.
Renewable Energy and Future Agricultural Production
The United States is currently consuming more than 100 quads (22%) of world’s 473 quads of fossil
energy (Table 3) [8]. Using a mix of renewable energy technologies, the land required to locate these
technologies is estimated to be more than 0.5 ha per capita to match half of the current fossil energy
consumption in the United States [36]. With a current U.S. population of 330 million, this would mean
that about the same amount of land area would have to be devoted to energy production as is currently
devoted to crop production.
The land area required for the production of renewable energy varies considerably. For example, to
produce 10,000 kWh of electricity per capita in the United States using biomass from a sustainable
forest would require 2.2 ha per person per year of forest per year [36]. However, the same amount of
electricity can be produced employing photovoltaic technologies using 0.3 ha per person per year.
Producing a kWh of electricity using current photovoltaic technology is about 4 times more expensive
(25¢/kWh) than producing a kWh from a sustainable forest [36].
Liquid fuel needs for tractors and other farm machinery land types might be met using hydrogen or
pyrolytic oil produced from wood [37]. Nitrogen can be produced using electrical discharge to convert
atmospheric nitrogen to nitrate. However, about 47,840 kcal of energy are required to produce a
kilogram of nitrogen by this method, compared to only 16,000 kcal required using fossil energy
dependent technologies. Using current renewable energy technologies, a quantity of energy produced
using renewable technologies costs from 5 to 10 times more than an equivalent quantity from fossil
energy sources.
Science and Technology
Over time science and technology have been instrumental in increasing industrial and agricultural
production, improving transportation and communications, advancing human health care and in
general improving many aspects of human life. However, much of this success is based on the
availability of natural resources of the earth and in particular, cheap energy.
In no area is this more evident than in agricultural production. No known or future technology
could, for example, double the quantity of world's cropland available nor increase the amount of fresh
water for production. Granted, synthetically produced fertilizers are effective in enhancing the fertility
of eroded croplands, but their production relies on the diminishing supply of fossil fuels. And in
countries like the United States and China, there will be rapidly diminishing returns with the further
application of fertilizers.

Energies 2009, 2
18
The increase in the size and speed of fishing vessels has not resulted in increases in fish catch [5].
For example, in eastern Canada, over fishing became so severe that about 80,000 fisherman have no
fish to catch, and the entire industry has collapsed [5].
Consider also that as the population increases, fresh water must be shared by more individuals as
well as with the growing agriculture industry [21]. No available technology can double the flow of the
Colorado River. Shrinking ground water resources in vast aquifers cannot be refilled by human
technology. Only rainfall can replenish fresh water supplies.
Improved technologies, including the more effective management and use of resources, will
increase food production. If technology alone were the answer, where is this technology and why has it
not been employed, now that cereal grain production per capita continues to decline, as it has for the
past 24 years, and as cropland continues to be lost to soil erosion [5]? Technology cannot produce an
unlimited flow of the vital natural resources that are the raw material for sustained food production.
Biotechnology can potentially result in agricultural advances, provided that its genetic transfer
ability is wisely used. For example, the genetic modification of some crops, such as rice, to have high
levels of iron and beta carotene would improve the nutrition of millions of people in the future,
particularly in developing countries [38]. In addition, the possibility exists in the future for biological
nitrogen fixation to be incorporated in crops, such as corn and wheat. However, biotechnology that
started more than 25 years ago has not stemmed the decline in per capita food production, including
grain production, during the past 24 years. Currently, more than 40% of the research effort in
biotechnology is devoted to the development of herbicide resistance in crops [39]. This herbicide-
tolerance technology does not increase crop yields, but rather generally increases the use of chemical
herbicides and the pollution of the environment. Indeed, this “labor saving technology” could result in
increasing labor and decreasing crop yields in the future as weed species acquire additional herbicide
resistance [40]. A potential threat to the world food supply and to cereal grains in particular, is that
more people in the world are consuming more meat, milk, and eggs than previously. Moderate
amounts of meat, milk, and eggs in the diet of the world’s poor would help curb malnutrition. Balance
must be achieved and livestock numbers must grow at a rate that does not threaten the human grain
supply. The objective should be to maintain the benefits of livestock to small farmers in developing
countries because of their value in providing milk, meat, and draft animal power [41]. However, if the
demand for meat, milk, and eggs is met through an increase in grain-fed livestock, then the effective
demand per capita for grain will increase even faster because livestock production is less efficient than
crop production. For instance, to produce 1 kg of beef requires on average 13 kg of grain and 30 kg of
forage. The fossil energy input per 1 kcal of beef protein is 40 kcal, however, the fossil energy input
per 1 kcal of plant protein is only 8 kcal [42].
Conclusions
As detailed by the Population Reference Bureau [2], maintenance of the present rate of population
growth will produce a doubling of global population from more than 6.7 billion today to 13 billion in
approximately 60 years. Increasing population pressure on natural resources continues to amplify
cropland, water, energy, and biological resource degradation. Currently, even with a seemingly
adequate supply of fossil fuels, nearly 4 billion people are malnourished. If the population continues to

Energies 2009, 2
19
increase as projected and the supply of fossil fuels decline, and distribution problems continue, the
prospect for increasing agricultural production to supply sufficient food to the growing population is
not encouraging. Improvement in food distribution would help, but more food is desperately needed.
Population growth met crop yield growth in the mid-1980’s, but cereal-grain food produced per
capita worldwide is now declining worldwide. The developed world, including the United States,
witnessed remarkable crop productivity increases from 1950’s through the 1980’s. These increases
were the result of the adoption of intensive agricultural practices that rely primarily on fossil fuel
dependent inputs such as fertilizers, pesticides, and irrigation. In some countries, the use of fossil
energy has increased more than 100-fold as compared to use in the early 1950’s. Many developing
countries are utilizing some fertilizers, pesticides, and irrigation, but in most of these countries the use
of large machinery is limited and the labor displacing effects are socially intolerable.
The availability of fossil fuel, productive cropland, fresh water, and fertilizer resources is also
critical to food production. At a time when food production and distribution need to increase
dramatically to meet the needs of a rapidly expanding population, resources essential to agricultural
production are being depleted and degraded. Currently, the developed world, with less than 2 billion
people, utilizes 70% of the world’s fossil energy, while the developing world, with more than 4 billion
people, uses only 30%. Worldwide, cropland per capita declined 20% during the past decade. During
this same period, more than 100 million hectares of cropland were degraded and lost to wind and water
erosion. Land degradation, especially erosion, is intensifying worldwide, especially in developing
countries where the rural poor remove crop residues for cooking fuel and expand agricultural
production onto marginal lands not suited for cultivation. In arid regions, farmers must use irrigation
water. However, available irrigated cropland per capita has declined about 10% during the past decade
due to the effects of population growth, salinization, waterlogging, and depletion of ground water
resources [43]. In addition, on the 1.5 billion hectares of cropland worldwide [30], fertilizer use per
capita has declined 22% during the past decade [32].
Scientists suggest that as fossil energy availability per capita declines during the next 50 years,
renewable energy sources will increasingly become an available option to replace the gradually
declining fossil fuels (Personal communication with Andrew Ferguson, Optimum Population Trust,
UK, 2008). Although significant technological advances will be made, the economic costs of
renewable energy technologies will be significantly higher than fossil fuel technologies and will
require land and water resources for energy production.
Science and technology have been instrumental in increasing agricultural production in the past
decades and we expect that science will help improve crop and livestock production in the future.
However, much of this success in productivity is based on the availability of natural resources of the
earth.
If current trends in human population growth and fossil fuel consumption continue into the future,
projections for tomorrow’s nutritional needs are not encouraging. Yet, if humans heed warning signs
of the present and take steps to address these issues, then the future holds promise of adequate food for
all [15]. Achieving such an adequate food supply requires worldwide cooperation and dedication. Only
with a worldwide commitment to improve economic and environmental policies, increase political
stability, and stabilize the world population will we achieve an agricultural system that will both
sustain a healthy human population and maintain the vital ecological integrity of the earth.

Energies 2009, 2
20
Acknowledgement
This research was supported in part by the Podell Emeriti Award at Cornell University.
References
1. WHO. Malnutrition Worldwide. World Health Organization, 2005. http://www.mikeschoice.com/
reports/malnutrition_worldwide.htm (accessed on 12/7/07).
2. PRB. World Population Data Sheet. Population Reference Bureau: Washington, DC, 2008.
3. MacInnis, L. UN sets up task force to tackle global food crisis. International Herald Tribune.
2008. Available at http://www.iht.com/articles/reuters/2008/04/29/europe/OUKWD-UK-FOOD-
UN-TASKFORCE.php (accessed on 5/15/08).
4. Pimentel, D. Biofuels, Solar and Wind as Renewable Energy Systems: Benefits and Risks.
Springer: Dordrecht, The Netherlands, 2008; p. 504.
5. Pimentel, D.; Pimentel, M. Food, Energy and Society. CRC Press. Taylor and Francis Group:
Boca Raton, Florida, 2008.
6. Pimentel, D.; Cooperstein, S.; Randell, H.; Filiberto, D.; Sorrentino, S.; Kaye, B.; Nicklin, C.;
Yagi, J.; Brian, J.; O’Hern, J.; Habas, A.; Weinstein, C. Ecology of Increasing Diseases:
Population Growth and Environmental Degradation. Hum. Ecol. 2007, 35, 653-668.
7. International Energy Annual. 2007. International Energy Annual. World Energy Overview.
http://www/e/ia/doe.gov/iea/overview.html (accessed on 5/15/08).
8. USCB. Statistical Abstract of the United States, 2007. U.S. Census Bureau, U.S. Government
Printing Office: Washington, DC.
9. Pimentel, D.; Wen, D. China and the World: Population, Food and Resource scarcity. In Dare to
Dream: Vision of 2050 Agriculture in China; Tso, T.C., Kang, H., Eds.; China Agricultural
University Press: Beijing, 2004; Chapter 8, pp. 103-116.
10. FAO. 2008. Food and Agriculture Organization of the United Nations. Current World Fertilizer
Trends and Outlook to 2011/12. ftp://ftp.fao.org/agl/agll/docs/cwfto11.pdf (Accessed on 5/15/08).
11. Youngquist, W. GeoDestinies. The inevitable Control of Earth Resources over Nations and
Individuals. National Book Company: Portland, Oregon, 1997.
12. Youngquist, W.; Duncan, R.C. North American Gas: Data Show Supply Problems. Nat. Resour.
Res. 2003, 12, 229-240.
13. Ivanhoe, L.F. World Oil Supply – Production, Reserves, and EOR. Hubbert Center Newsletter #
2000/1-1, 2000.
14. Campbell, C.J. Hubbert Peak Oil Production. 2008. http://www.hubbertpeak.com/Campbell/
(accessed on 5/27/08).
15. Pimentel, D.; Bailey, O.; Kim, P.; Mullaney, E.; Calabrese, J.; Walman, F.; Nelson, F.; Yao, X.
Will the Limits of the Earth's Resources Control Human Populations? Environ. Dev. Sustain.
1999, 1, 19.
16. Scott, G.J.; Rosegrant, M.W; Ringler, M.W. Roots and Tubers for the 21st Century: Trends,
Projections and Policy Options. Food, Agriculture and the Environment Discussion Paper 31.
International Food Policy Research Institute, 2000.

Energies 2009, 2
21
17. FAO. Quarterly Bulletin of Statistics. Food and Agriculture Organization, United Nations: Rome,
Italy: 10, 1997.
18. Cereal. Cereal Production Table. http://www.answers.com/topic/cereal-3 (accessed on 6/4/08).
19. USDA. Agricultural Statistics, 2006. U.S. Department of Agriculture. U.S. Government Printing
Office: Washington, DC, 2006.
20. Pimentel, D.; Doughty, R.; Carothers, C.; Lamberson, S.; Bora, N.; Lee, K. Energy inputs in crop
production in developing and developed countries. In Food Security and Environmental Quality
in the Developing World; Lal, R., Hansen, D., Uphoff, N., Slack, S., Eds.; CRC Press: Boca
Raton, 2002; pp. 129-151.
21. Postel, S. Pillar of Sand: Can the Irrigation Miracle last? W.W. Norton: New York, 1999.
22. Pimentel, D. Handbook of Energy Utilization in Agriculture, CRC Press: Boca Raton, FL, 1980.
23. USDA. Agricultural Statistics 1950. U.S. Department of Agriculture, U.S. Government Printing
Office: Washington, DC, 1950.
24. USDA Agricultural Statistics 1980. U.S. Department of Agriculture, U.S. Government Printing
Office: Washington, DC, 1980.
25. USDA Agricultural Statistics, U.S. Department of Agriculture, Washington, DC, 1990.
26. Martinez, J.; Guiraud, G. A lysimeter study of the effects of a ryegrass catch crop during a winter
wheat – maize rotation on nitrogen leaching and on the following crop. J. Soil Sci. 1990, 41, 5-16.
27. PRB. World Population Data Sheet, 2007. Population Reference Bureau: Washington, DC.
28. FAO Food Balance Sheets, Food and Agriculture Organization. United Nations, Rome, Italy,
1999.
29. Dasgupta, P. The economics of food. In Feeding a World Population of More than Eight Billion
People, Waterlow, D.G., Armstrong, L.F., Riley R., Eds.; Oxford University Press: New York,
1998, 19.
30. Greenland, D.J.; Gregory, P.J.; Nye, P.H. Land resources and constraints to crop production. In:
Feeding a World Population of More than Eight Billion People, Waterlow, D.G., Armstrong,
L.F., Riley R., Eds.; Oxford University Press: New York, 1998, 39.
31. Heffer, P.; Prud’Homme, M. Outlook for World Fertilizer Demand, Supply, and Supply/Demand
Balance. 2008. Available at http://journal.tubitak.gov.tr/agriculture/issues/tar-08-32-3-2-0803-
38.pdf (accessed on 5//29/08)
32. FAO. Soil Fertility and Plant Nutrition, 2008. hppt://www/fao/org/ag/agl/agll/prtplnu_publ.stm
(accessed on 5/29/08).
33. BP. BP Statistical Review of World Energy. British Petroleum: London, 2005.
34. Tripathi, R.S.; Sah, V.K. Material and energy flows in high-hill, mid-hill and valley farming
systems of Garhwal Himalaya. Agr. Ecosyst. Environ. 2001, 86, 75-91.
35. FAO. Food and Agricultural Organization of the United Nations. FAO: Rome, 2004.
36. Pimentel, D.; Pleasant, A.; Barron, J.; Gaudioso, J.; Pollock, N.; Chae, E.; Kim, Y.; Lassiter, A.;
Schiavoni, C.; Jackson, A.; Lee, M.; Eaton, A. U.S. energy conservation and efficiency: Benefits
and costs. Environ. Dev. Sustain. 2004, 6, 279-305.
37. Pimentel, D. The Limitations of Biomass Energy. In Encyclopedia of Physical Science and
Technology. 3rd Edition; Meyers, R., Ed.; Academic Press: San Diego, 2001; Volume 2, pp.159-
171.

Energies 2009, 2
22
38. McCouch, S.R. Is biotechnology an answer? In Wiebe, K., Ballenger, N., Pinstrup-Andersen, P.,
Eds.; Who will be fed in the 21st century? IFPRI, ERS, and AAEA: Washington, DC: 2001.
39. Paoletti, M.G.; Pimentel, D. Genetic engineering in agriculture and the environment. BioScience
1996, 46, 665.
40. Brown, L.R.; Flavin, C.; French, H.F.; Starke, L. State of the World 1999. W. W. Norton and Co.:
New York, 1999.
41. Fitzhugh, H.A. Global agenda for livestock research. British Society of Animal Science
Occasional Publication, 1998; pp. 11-17.
42. Pimentel, D.; Pimentel, M. Sustainability of meat-based and plant-based diets and the
environment. Am. J. Clin. Nutr. (suppl) 2003, 78, 660S-663S.
43. Howell, T.A. Enhanced water use efficiency in irrigated agriculture. Agron. J. 2001, 93, 281-289.
44. Jölli, D.; Giljum, S. Unused Biomass Extraction in Agriculture, Forestry and Fishery. SERI
Studies No. 3. Sustainable Europe Research Institute: Vienna, 2005.
45. National Agricultural Statistical Services Crop Production. September 7, 2007. United Stated
Department of Agriculture. September 8, 2007. http://www.usda.gov/nass/PUBS/
TODAYRPT/crop0907.txt (accessed on 1/29/08).
46. Crop Harvest. Biological System Engineering: Crop Systems. Washington State University.
September 19, 2007. http://www.bsyse.wsu.edu/cropsyst/manual/parameters/crop/harvest.htm
(accessed on 1/29/08).
47. Forest Service. The Forest Inventory and Analysis RPA Assessment Tables. U.S. Forest Service.
U.S. Department of Agriculture: Washington, DC. 2007.
48. Djauhari, A.; Djulin, A.; Soejono, I. Maize Production in Java: Prospects for Improved Farm-
Level Production Technology. CGPRT Centre: Indonesia, 1988.
49. FAO. Agricultural Statistics, hhtp://apps.fao.org/cgi-bin/nph-db.pl?subset-agriculture Food and
Agriculture Organization, United Nations, 1999.
50. Jeer Organization, 1990. http://www/jeer.org/reports/energy/3-power.htm (accessed on 3/23/08)
51. NASS. National Agricultural Statistics Service, 2003. http://usda.mannlib.cornell.edu (accessed
on 11/05/04).
52. Pimentel, D.; Pimentel, M. Food, Energy and Society, Colorado University Press, Boulder,
Colorado, 1996.
53. Hoffman, T.R.; Warnock, W.D.; Hinman, H.R. Crop Enterprise Budgets, Timothy-Legume and
Alfalfa Hay, Sudan Grass, Sweet Corn and Spring Wheat under Rill Irrigation, Kittitas County,
Washington, Farm Business Reports EB 1173, Washington State University, Pullman, WA, 1994.
54. Wilcke, B.; Chaplin, J. Fuel saving ideas for farmers. Minnesota/Wisconsin Engineering Notes.
2000. http://www.bae.umn.edu/extens/ennotes/enspr00/fuelsaving.htm (accessed on 9/2/2004)
55. Patzek, T. W. Thermodynamics of the corn-ethanol biofuel cycle. Crit. Rev. Plant Sci. 2004, 23,
519-567.
56. Brees, M. Corn silage budgets for Northern, Central and Southwest Missouri, 2004.
http://www.agebb.missouri.edu/mgt/budget/fbm-0201.pdf (accessed on 9/1/2004).
57. USDA. 1997 Census of agriculture. U.S. Department of Agriculture, 1997. http://www.ncfap.org
(accessed on 8/28/2002).
Energies 2009, 2
23
58. USDA. Farm and ranch irrigation survey (1998). 1997 Census of Agriculture. Volume 3, Special
Studies, Part 1. p.280.
59. Batty, J.C.; Keller, J. Energy Requirements for Irrigation. In Handbook Of Energy Utilization in
Agriculture; Pimentel, D., Ed.; CRC Press: Boca Raton, FL, 1980; pp. 35-44.
60. Larsen, K.; Thompson, D.; Harn, A. Limited and Full Irrigation Comparison for Corn and Grain
Sorghum. 2002. http://www.colostate.edu/Depts/SoilCrop/extension/Newsletters/2003/Drought/
sorghum.html (Accessed on 9/2/2002).
61. Larson, W.E.; Cardwell, V.B. History of U.S. Corn Production. University of Minnesota:
Minneapolis, 1999.
62. USDA. Agricultural Statistics. U.S. Department of Agriculture. U.S. Government Printing Office:
Washington, DC, 2002.
63. USDA. Corn-State. Costs of Production. U.S. Department of Agriculture, Economic Research
Service, Economics and Statistics System, Washington, DC. Stock #94018, 1991.
64. USCB. Statistical Abstract of the United States, 2004-2005. U.S. Census Bureau, U.S.
Government Printing Office: Washington, DC.
65. Surendra, S.; Madhu, P.S.; Rana, R.S.; Mittal, V.K.; Rup, B. Energy and cost regulation for
cultivation of rice (Oryza sativa) – wheat (Tritichum aestivum)- maize (mays) – wheat rotations,
Indian J. Agr. Sci. 1989, 59, 558.
66. Hassan, R.M.; Mwangi, W.; Karanja. D. 1993 Wheat Supply in Kenya: Production Technologies,
Sources of Inefficiency, and Potential for Productivity Growth, CIMMYT Economics Working
Papers, 93-02, 1993.
67. Longmire, J.; Lugogo, J. The economics of small-scale wheat production technologies for Kenya,
CIMMYT Working Papers, 89/01, 1989.
68. Kurian, G.T. Encyclopedia of the Third World. Fourth Edition. Facts on File: New York, 1992.
69. Karpenstein, M.; Shaeffer, K. Tritical for technical uses, cultivated in sustainable cropping
system. Juskiw, P., Ed.; Proceedings Oral Presentation 4th International Triticale Symposium in
Red Deer, Alberta, Canada, July 26 – 31, 1998; Lacombe, Canada, 1998; pp. 273-277.
70. Liveszey, J.; Foreman, L. Characteristics and Production Costs of U.S. Rice Farms. Electronic
Report from the Economic Research Service, U.S. Department of Agriculture, Resource
Economics Division: Washington, DC, 2004.
71. Metzger, S. Preliminary report comparing tolerant and non-herbicide tolerant soybeans in east-
central North Dakota, 2002. http://www.ag.ndsu.nodak.edu/carrt/ 03%20Annual%20Report/
Herbicide%20Tolerant%20andNon.htm (accessed on 4/13/08)
72. College of Agricultural, Consumer and Environmental Sciences. Machinery Cost Estimates:
Summary of Operations. University of Illinois at Urbana-Champaign, 1997.
http://www.aces.uiuc.edu/~vo-ag/custom.htm (accessed on 11/8/01).
73. Economic Research Statistics. Soybeans: Fertilizer Use by State. Agricultural Chemical Usage:
1996 Field Crops Summary, 1997. http://usda.mannlib.cornell.edu/data-sets/inputs/
9X171/97171/agch0997.txt (accessed on 11/11/01).
74. Mississippi State University Extension Service. Agronomy Notes, 1999.
http://msucares.com/newsletters/agronomy/1999/199910.html (accessed on 7/10/06).

Energies 2009, 2
24
75. Patterson, P.E. Estimating cost of potato production in Idaho, 2002.
http//www.ag.uidhao.edu/potao/research/files/Volume%2034/Volume%2034_9320Estimating%2
0Cost%20of%20Potato.pdf. (accessed on 4/14/08)
76. CIAT 1996. Cassava Production, Processing, and Marketing in Vietnam. In Proceedings of
Workshop, Hanoi, Vietnam, October 29-31, 1992; Howler, R.H., Ed.; CIAT: Bangkok, Thailand.
[email protected], December 2, 1999.
77. Ano, A.O.; Ikwelle, M.C. Evaluation of the effect of application of algifol (foliar fertilizer) on
yield of cassava. National Root Crops Institute: Nigeria, Umudike, PMB 7006, Umuahia, Nigeria,
2008.
78. Fening, J.O.; Gyapong, T.A.; Ampontuah, E.O.; Yeboah, E.; Gaisie, E. Fertilizing for profit: the
case of cassava cultivation in Ghana. Trop. Sci. 2005, 45, 97-99.
79. Agbaje, G.O.; Akinlosotu, T.A. Influence of NPK fertilizer on tuber yield of early and late-
planted cassava in a forest alfisol of south-western Nigeria. Afr. J. Biotechnol. 2004, 3, 547-551.
80. Kelly, T.C.; Lu, V.C.; Abdul-Baki, A.A.; Teasdale, J.R. Economics of a hairy vetch mulch system
for producing fresh-market tomatoes in the mid-Atlantic region. J Am. Soc. Hortic. Sci. 1995, 120,
854-860.
81. Ohio State. 1999 Processing Tomato Production Economics. http://ohioline.osu.edu/e-
budget/99toma.html (accessed on 4/15/08).
82. Reitz, H. Energy use in citrus production and harvesting. In Handbook of Energy Utilization in
Agriculture. Pimentel, D., Ed.; CRC Press: Boca Raton, FL, 1980; pp. 285-289.
83. Fluck, R.C. Energy for Florida oranges, 1992. http://www/p2pays.org/ref%5C08/07655.pdf.
(accessed on 5/12/08).
84. Ozkan, B.; Akaoz, H.; Karadeniz, F. Energy requirement and economic analysis of citrus
production in Turkey. Energy Convers. Manage. 2004, 45, 1821-1830.
85. USDA. Agricultural Statistics. U.S. Department of Agriculture. Government Printing Office:
Washington, DC, 2007.
86. Mon, P.N.; Holland, D.W. Organic apple production in Washington State: an input-output
analysis. Renewable Agric.Food Syst. 2005, 21, 134-141.
87. Funt, R.C. Energy use in low, medium, and high density apple orchards—Eastern U.S.. In
Handbook of Energy Utilization in Agriculture, Pimentel, D., Ed.; CRC Press, Boca Raton, FL,
1980; pp. 235–246.
88. USDA. Agricultural Statistics. U.S. Department of Agriculture. Government Printing Office:
Washington, DC, 1960-2000.
© 2009 by the authors; licensee Molecular Diversity Preservation International, Basel, Switzerland.
This article is an open-access article distributed under the terms and conditions of the Creative
Commons Attribution license (http://creativecommons.org/licenses/by/3.0/).


![Energies 2015 OPEN ACCESS energies - MDPI · 2015. 3. 26. · The Engineering Sciences Data Unit (ESDU) 70015 [9] provides a compilation of flat plate lift and drag as a function](https://static.fdocuments.in/doc/165x107/60b99ef6465c414a254f2a6e/energies-2015-open-access-energies-mdpi-2015-3-26-the-engineering-sciences.jpg)
