ENERGETICS OF TWO WINTERING RAPTORS - … · ENERGETICS OF TWO WINTERING RAPTORS ... EFFORTS to...
12
ENERGETICS OF TWO WINTERING RAPTORS JAMESR. KOPLIN, MICHAEL W. COLLOPY, • ALBERT R. BAMMANN, 2 AND HOWARD LEVENSON 3 School of Natural Resources, Humboldt State University, Arcata, California 95521 USA ABSTRACT.--We present a deterministic model for predicting daily energy expenditure of two raptors--femaie American Kestrels (Falco sparverius)and Whim-tailed Kites (Elanus leucurus)-- wintering in coastalnorthwestern California. Inputs to the model include body mass, air temper- ature, photoperiod, energy expenditure of flight, and relative portions of the daytime spent in flight and nonflight activities. A simplified version of the model applicable to birds spendingless than 20% of the day in flight and inflating daily energy expenditure by 6% or less is alsopresented. Inputs to the simplifiedversioninclude body mass, air temperature, energyexpenditure of flight, and relative portions of the 24-h day spent in flight and nonflight activities. Input data were estimated directly and indirectly. The validity of the model was tested by comparing predicted energy expenditure with energy expenditure estimated by observed food consumption of wild birds. The model predicted that individual female kestrels would expend 42.0-61.0 kcai (2.04 to 2.96 W) daily and that individual kites would expend 105.6-118.3 kcal (5.12 to 5.74 W) daily. Daily energy expenditure estimated by food consumption averaged 42.9 and 113.1 kcai (2.08 and 5.49 Vv')per individual kestrel and kite, respectively.The degree of correspondence between model prediction and field estimation of energy expenditure of kites was considered adequatefor model validation. Even though the model predictions bracketedthe field estimation of energy expenditure of kestrels, however, the model predictions were considered to be too high because of an erroneous temperatureinput, and the field estimationwas considered to be too low becauseof an erroneous estimate of the biomass of an important group of prey. Correcting theseerrors indicated that the daily energy expenditureof kestrelsshould average 48.7 kcai (2.36 W) per individual. Using the correctedenergy expenditure as a standard for female kestrels and the field estimate of energy expenditure as a standard for kites, the predictive accuracy of the versions of the model was evaluated relative to the predictive accuracyof 11 other models. Three of thesemodels, including the two versions presented here, producedestimates that were within 5% of the mean standard value. Eight of the models under-approximatedthe mean standard value by 10.3-49.5%; the other two over-approximated the mean standard value by 14.8 and 36.9%. Received 13 August 1979, accepted 21 April 1980. EFFORTS to approximate the energetics of free-living birds ideally should include consideration of variations in energy expenditures associated with biological and ecologicalinfluences (King 1974). A corollary to this proposition is that the approx- imations attempted should include information on all the influences involved. Ap- proximations made on wintering birds therefore should include information on vari- ations in energy expenditure associatedwith variations in air temperature, thermal radiation, wind, and humidity (the "climate space"of birds: Porter and Gates 1969); location and use of environmental resources; social and competitive interactions; and antipredator activities. This is a report of the derivation and field test of a deterministic model developed to predict energy expenditures of two species of falconiform birds, the American Kestrel (Falco sparverius) and the White-tailed Kite (Elanus leucurus), wintering • Presentaddress: School of Natural Resources, University of Michigan, Ann Arbor, Michigan 48104 USA. • Presentaddress: Bureau of Land Management, 230 Collins Road, Boise, Idaho 83702 USA. :•Present address: Museum of Natural History, University of Kansas, Lawrence, Kansas 66045USA. 795 The Auk 97: 795-806. October 1980
Transcript of ENERGETICS OF TWO WINTERING RAPTORS - … · ENERGETICS OF TWO WINTERING RAPTORS ... EFFORTS to...
ENERGETICS OF TWO WINTERING RAPTORS
JAMES R. KOPLIN, MICHAEL W. COLLOPY, • ALBERT R. BAMMANN, 2 AND HOWARD LEVENSON 3
School of Natural Resources, Humboldt State University, Arcata, California 95521 USA
ABSTRACT.--We present a deterministic model for predicting daily energy expenditure of two raptors--femaie American Kestrels (Falco sparverius) and Whim-tailed Kites (Elanus leucurus)-- wintering in coastal northwestern California. Inputs to the model include body mass, air temper- ature, photoperiod, energy expenditure of flight, and relative portions of the daytime spent in flight and nonflight activities. A simplified version of the model applicable to birds spending less than 20% of the day in flight and inflating daily energy expenditure by 6% or less is also presented. Inputs to the simplified version include body mass, air temperature, energy expenditure of flight, and relative portions of the 24-h day spent in flight and nonflight activities.
Input data were estimated directly and indirectly. The validity of the model was tested by comparing predicted energy expenditure with energy expenditure estimated by observed food consumption of wild birds. The model predicted that individual female kestrels would expend 42.0-61.0 kcai (2.04 to 2.96 W) daily and that individual kites would expend 105.6-118.3 kcal (5.12 to 5.74 W) daily. Daily energy expenditure estimated by food consumption averaged 42.9 and 113.1 kcai (2.08 and 5.49 Vv') per individual kestrel and kite, respectively. The degree of correspondence between model prediction and field estimation of energy expenditure of kites was considered adequate for model validation. Even though the model predictions bracketed the field estimation of energy expenditure of kestrels, however, the model predictions were considered to be too high because of an erroneous temperature input, and the field estimation was considered to be too low because of an erroneous estimate of the biomass of an important group of prey. Correcting these errors indicated that the daily energy expenditure of kestrels should average 48.7 kcai (2.36 W) per individual. Using the corrected energy expenditure as a standard for female kestrels and the field estimate of energy expenditure as a standard for kites, the predictive accuracy of the versions of the model was evaluated relative to the predictive accuracy of 11 other models. Three of these models, including the two versions presented here, produced estimates that were within 5 % of the mean standard value. Eight of the models under-approximated the mean standard value by 10.3-49.5%; the other two over-approximated the mean standard value by 14.8 and 36.9%. Received 13 August 1979, accepted 21 April 1980.
EFFORTS to approximate the energetics of free-living birds ideally should include consideration of variations in energy expenditures associated with biological and ecological influences (King 1974). A corollary to this proposition is that the approx- imations attempted should include information on all the influences involved. Ap- proximations made on wintering birds therefore should include information on vari- ations in energy expenditure associated with variations in air temperature, thermal radiation, wind, and humidity (the "climate space" of birds: Porter and Gates 1969); location and use of environmental resources; social and competitive interactions; and antipredator activities.
This is a report of the derivation and field test of a deterministic model developed to predict energy expenditures of two species of falconiform birds, the American Kestrel (Falco sparverius) and the White-tailed Kite (Elanus leucurus), wintering
• Present address: School of Natural Resources, University of Michigan, Ann Arbor, Michigan 48104 USA.
• Present address: Bureau of Land Management, 230 Collins Road, Boise, Idaho 83702 USA. :• Present address: Museum of Natural History, University of Kansas, Lawrence, Kansas 66045 USA.
795 The Auk 97: 795-806. October 1980

796 KO?LIN ET -•L. [Auk, Vol. 97
in coastal northwestern California. The model makes use of the methodology and research of Kendeigh and his coworkers (Kendeigh et al. 1977) on existence metab- olism (EM); the research of Lasiewski (1963), LeFebvre (1964), Tucker (1968, 1972), and Gessaman (pers. comm.) on energetics of avian flight; and the research of many avian physiologists on standard and basal metabolism (SM and BM) (recently re- viewed by Calder and King 1974 and Kendeigh et al. 1977).
Inputs to the model include: (1) body mass, (2) amounts of time birds are engaged in flight and nonflight activities, (3) air temperature, (4) photoperiod, and (5) the multiple of basal metabolism expressing energy expenditure of flight. Output from the model is "daily energy expenditure" (DEE sensu King 1974) or "daily energy budget" (DEB sensu Grodzinski et al. 1975, Kendeigh et al. 1977) per bird. The model may be summarized and symbolized by equation 1:
DEB = NFA [(EMro) - (1 - P)(SMr,•)] + FA [(BM)(P)(FC)I + (1 - P)(SMr,,a) (1)
where: NFA = duration of diurnal nonflight activities as a proportion of the photoperiod (daylength) (NFA = 1 - FA),
FA -- duration of flight activities as a proportion of the photoperiod (FA = 1 - NFA),
EMra = existence metabolism of nonpasserine birds during winter as a function of average daily air temperature (Ta):
EMra = EMooc + (Ta)(b) (2)
where: b = EMaooc -EMooc. 30 '
EM3ooc = 1.455 W ø'6'256 (3) EMooc = 4.235 W © (4)
W = body mass in g
SMr,,, = standard metabolism of nonpasserine birds during winter at night as a function of average night time air temperature (T,,,):
SMr,• = SMooc - (b)(T,•) (5) where: SMooc = 1.810W ø'5944 (6)
b = 0.0457 W ø"886 (7)
at the lower critical temperature (T•½), SM = BM:
T•c = 47.17 W -ø.•8ø9 (8)
BM -- basal metabolism
BM = 0.4616W ø'7a4ø (9)
P = photoperiod as a proportion of the 24-h day. FC -- flight coefficient; the multiple of BM expressing energy expendi-
ture of flight.
DEB, BM, and all expressions of SM and EM are in kcal' bird -•' day -•. Equation (2) is a linear interpolation to T• of the allometric equations (3) and (4) of Kendeigh et al. (1977) for predicting EM of nonpasserine birds at 0øC and 30øC for 10 -+ h photoperiods during winter. Equation (2) is a generalization of an earlier energetics model (Koplin 1972); a modification of the energetics model of Weiner and Glowa-

October 1980] Wintering Raptor Energetics 7 9 7
cinski (1975), derived from allometric equations based on fewer data (Kendeigh 1970); and, except for their use of Kendeigh's (1970) earlier equations, is identical to the energetics model of Wiens and Innis (1973, 1974). Equations (5), (6), (7), and (8) are from Kendeigh et al. (1977) for nonpasserine birds during winter and at night. Equation (9) is Aschoff and Pohl's (1970) allometric equation for resting BM of nonpasserine birds.
There are two components to EMra: diurnal nonflight activity and nocturnal rest. Flight of kestrels and kites is a diurnal activity; therefore, the energy expenditure of flight should be prorated with the diurnal nonflight component of EMra; equation (1) does this. The component (EMro) - (SMr,•)(1 - P) calculates the total energy expenditure of diurnal nonflight activity by deducting the energy expenditure of nocturnal rest, (SMr,•a)(1 - P), from EMro. The coefficient NFA is a correction factor to simulate the portion of DEB attributable to diurnal nonflight activity. The component FA[(BM)(P)(FC)] predicts the portion of DEB attributable to diurnal flight activity. The coefficient P prorates BM, a daily rate, to the photoperiod portion of the 24-h day; FA further prorates BM to that portion of the photoperiod spent in flight. FC is a multiple of BM; the product (BM)(FC) represents the energy expenditure of flight. The portion of DEB attributable to nocturnal rest is predicted by the component (1 - P)(SMr,•a). The coefficient (1 - P) is a correction factor prorating SMr•, a daily rate, to the portion of the 24-h day that is dark.
For birds spending 20% or less of the photoperiod in flight activities, as was the case for kestrels and kites wintering in coastal northwestern California (Table 2), a simplified version of equation (1) providing predictions exceeding those of equation (1) by 6% or less is:
DEB = NFA'(EMr•,) + FA'[(BM)(FC)] (10)
where: NFA' = portion of the 24-h day spent in nonflight activities (nocturnal rest plus diurnal nonflight activities); (NFA' = 1 - FA ').
FA' = portion of the 24-h day spent in flight; (FA' = 1 - NFA'). DEB, EMro, BM, and FC are as previously defined.
Equation (10) is based on limiting constraints of FA and NFA in equation (1). Thus, as FA goes to 0, NFA goes to 1 and equation (1) simplifies to equation (2). Under these conditions the necessity for an explicit estimate of nocurnal rest is superfluous, because, even though unknown, it is implicitly incorporated into equa- tion (2) and therefore does not need to be known. Alternatively, as FA goes to 1, NFA goes to 0 and equation (1) simplifies to two components, the energy expendi- tures of flight and nocturnal rest. Under these conditions, an explicit estimate of nocturnal rest is paramount. Consequently, as FA goes from 1 to 0 (or as NFA goes from 0 to 1) the necessity of an explicit estimate of the energy expenditure of noc- turnal rest becomes progressively less important.
Equations (1) and (10) thus account for variations in energy expenditure associated with variations in air temperature and with location and use of environmental re- sources. To the extent that they are associated with flight activities and/or minimal diurnal nonflight activities, equations (1) and (10) also account for energy expendi- tures of social and competitive interactions and antipredator activities. Equations (1) and (10) do not account for energy expenditures of growth, reproduction, and molt, nor the influences of wind, thermal radiation, and humidity.

798 KOPLIN ET •,L. [Auk, Vol. 97
TABLE 1. Comparison of predicted and measured EMr• for seven species of falconiform birds. Paired t-test (13 df) = 0.11; P = 0.91.
W T, EMr, (kcal/day) a Species (Body mass g) (Temperature øC) Predicted b Measured
Accipiter striatus 99 15.2 37.1 39.1 A. striatus 108 17.2 37.4 37.6 A. striatus 108 15.5 38.7 42.9 A. striatus 108 13.9 40.0 36.2 A. striatus 107 16.5 37.7 33.0 Falco sparverius 126 8.2 48.4 40.8 F. columbarius 174 9.0 57.0 64.5 F. columbarius 173 12.0 54.0 50.6 F. columbarius 172 12.6 53.2 50.0 F. tinnunculus 194 13.1 56.4 58.9 F. tinnunculus 196 13.2 56.6 53.2 F. mexicanus 497 12.0 97.2 84.0 F. cherrug 1,036 11.8 147.0 184.0 Buteo jamaicensis 1,389 12.6 171.6 162.5
S.I. conversion: I kcal/day = 4.85 x 10 2 watt (W). Equation (2).
METHODS
Use of equation (2) to predict energy expenditure of nonflight activities was tested by a paired statistical comparison of values of EM•. a predicted by the equation with values of EM.ra measured experimentally (Table 1). Pairs of predicted and measured EMr• were obtained for individual birds with an average body mass (W) at an average air temperature (To). Experimental values of EMra were obtained by energy balance measurements on birds housed in rooms 3.3 m long by 2.6 m wide and 2.9 m high. With
the exception of room size, temperature, and light control, methodology for measuring EM.r• was similar to that used by Kendeigh (1949), i.e. the difference between energy content of food consumed and energy content of egesta of birds maintained at constant body mass for periods of 3 or more days. Birds were fed ground, eviscerated rat (stomach and intestinal tract removed), eviscerated rabbit, or beef heart. Energy content of food and egesta was measured in an adiabatic bomb calorimeter. All experimental measurements were made during the winter; temperatures in the rooms, ventilated to the outside through screened windows, were monitored continuously by thermographs. Experimental To was calculated by summing thermograph records at hourly intervals and dividing the sum by the number of hours in each experiment. Natural light filtering through windows in the rooms was the source of light during the experiments. Thus, temperature and light conditions were as close to natural as experimental conditons allowed.
Inputs to equations (1) and (10) were estimated directly and indirectly. NFA and FA (NFA' and FA •) were estimated directly by dawn-to-dusk field observations totalling approximately 300 h of individual kestrels and approximately 400 h of individual kites (Table 2). Field observations were made of birds wintering on agricultural lands in the vicinity of Arcata and Eureka, Humboldt County, California. T• was estimated directly by averaging daily maximum and minimum temperatures occurring between sunset plus 0.5 h and sunrise minus 0.5 h. P was estimated directly by averaging and adding 1 h to the daily amount of time elapsing between sunrise and sunset. Data on temperatures and photoperiod were obtained from the U.S. Weather Bureau in Eureka; the data were averaged over the 92-day period between mid-November and mid-February, which we considered to be the winter season. Body mass (W) was estimated indirectly from the literature for kestrels, and indirectly from the literature and from unpublished data on live birds and in various museums for kites. FC was estimated indirectly by com- paring the ratio of available data on the energy expenditures of flight to BM of nonpasserine birds (Table 3).
The validity of the model was tested by comparing DEB predicted by equation (1) with DEB estimated on the basis of observed food consumption by free-living birds (Tables 4 and 5). Information on types and amounts of prey eaten by free-living birds was obtained in connection with observations of daily flight and nonflight activities (Table 5 and Appendix).
The predictive accuracy of the two versions of our energetics model relative to the predictive accuracy of other energetics models was evaluated by comparing DEB predictions of the models to standard DEB

October 1980] Wintering Raptor Energetics 799
TABLE 2. Flight (FA) and nonflight (NFA) activities of female American Kestrels and White-tailed Kites wintering on agricultural lands in coastal northwestern California during the average 11-h photoperiod.
Percent of photoperiod
Activities American Kestrels a White-tailed Kites b
Perched ( NFA ) Searching 74.7 60.1 Inactive 8.6 16.6 Eating 3.6 3.0 Other 6.5 0.8
Subtotal 93.4 80.5
Flying (FA ) Directional 2.5 9.1"
Hovering 3.4 8.9 Other 0.7 1.5
Subtotal 6.6 19.5
TOTAL 100.0 100.0
Based on a total of 316.7 h of continuous observation of 7 birds, 4 during the winter of 1972-73 and 3 during the winter of 1973-74. Based on a total of 441.2 h of continuous observation of four birds during the winter of 1973-74. Flight to and from the nocturnal roost, which was not found; daily duration estimated to average 1 h.
values (Table 6). Fortunately, our studies provided estimates of all information needed as inputs by the full complement of energetics models evaluated. Information needed in addition to that required for our model included energy-balance data on captive animals (Table 1) and detailed data on time and activity budgets (Table 2). All allometric equations for predicting BM, SM, and EM were expressed in terms of mean body mass (Table 4). BM was increased by a factor of 1.091 for kestrels and 1.078 for kites in models predicting BM with the allometric equation of Lasiewski and Dawson (1967) for nonpasserine birds. Where possible, only those behavioral and physiological aspects pertinent to kestrels and kites wintering in coastal northwestern California were considered in predictions by other models. That is, only behavioral acts such as flight, eating, preening, etc. and physiological processes such as temperature regulation were included in predictions by other models. Behavioral acts such as hopping, singing, etc. and physiological processes such as reproduction were omitted from predictions by other models.
RESULTS AND DISCUSSION
Fourteen measurements of EMr• were obtained from seven species of falconi- forms ranging in size from a Sharp-shinned Hawk (Accipiter striatus) (about 100 g) to a Red-tailed Hawk (Buteo jamaicensis) (about 1,400 g) (Table 1). T,, ranged from 8.2øC to 17.2øC during the measurements; hourly temperatures differed from Ta by a maximum of + 5.0øC. Photoperiod ranged from 10 to 12 h. The null hypothesis that no differences existed between pairs of predicted and measured values of EMra was accepted at the 0.05 level of significance. Thus, it was concluded that, under conditions similar to those in the laboratory, linear interpolation of equations (3) and (4) for predicting EMr, between 0øC and 30øC for wintering falconiforms is a realistic approximation of the birds' total nonflight energy expen- diture.
Kestrels and kites averaged 10.3 h and 8.9 h, respectively, in nonflight activities and 0.7 h and 2.1 h, respectively, in flight activities during the daily photoperiod (Table 2). Birds were assumed to be at rest during the dark, which averaged 13 h daily.
FC, the ratio of energy expenditure of flight to BM, ranged from 12.0 to 14.5 and averaged 13.7 for five species of nonpasserine birds ranging in mass from 3 g to approximately 400 g (Table 3). Flight energy calculated by the empirical equation
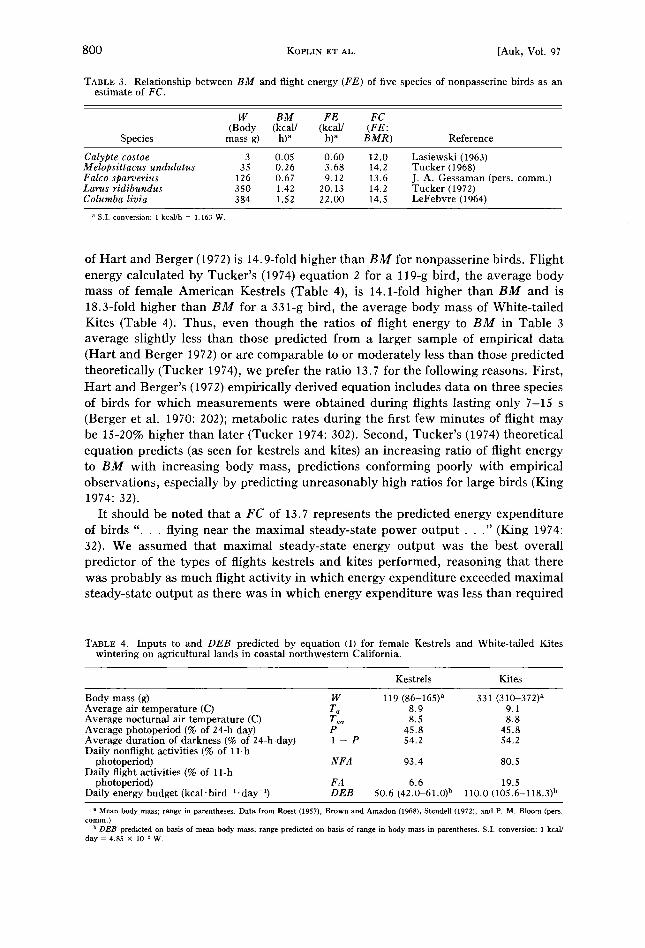
800 KOPL•N ET AL. [Auk, Vol. 97
TABLE 3. Relationship between BM and flight energy (FE) of five species of nonpasserine birds as an estimate of FC.
W BM FE FC
(Body (kcal/ (kcal/ (FE: Species mass g) h) a h) a BMR) Reference
Calypte costae 3 0.05 0.60 12.0 Lasiewski (1963) Melopsittacus undulatus 35 0.26 3.68 14.2 Tucker (1968) Falco sparverius 126 0.67 9.12 13.6 J.A. Gessaman (pers. comm.) Larus ridibundus 350 1.42 20.13 14.2 Tucker (1972) Columba livia 384 1.52 22.00 14.5 LeFebvre (1964)
• S.I. conversion: 1 kcal]h = 1.163 W.
of Hart and Berger (1972) is 14.9-fold higher than BM for nonpasserine birds. Flight energy calculated by Tucker's (1974) equation 2 for a 119-g bird, the average body mass of female American Kestrels (Table 4), is 14.1-fold higher than BM and is 18.3-fold higher than BM for a 331-g bird, the average body mass of White-tailed Kites (Table 4). Thus, even though the ratios of flight energy to BM in Table 3 average slightly less than those predicted from a larger sample of empirical data (Hart and Berger 1972) or are comparable to or moderately less than those predicted theoretically (Tucker 1974), we prefer the ratio 13.7 for the following reasons. First, Hart and Berger's (1972) empirically derived equation includes data on three species of birds for which measurements were obtained during flights lasting only 7-15 s (Berger et al. 1970: 202); metabolic rates during the first few minutes of flight may be 15-20% higher than later (Tucker 1974: 302). Second, Tucker's (1974) theoretical equation predicts (as seen for kestrels and kites) an increasing ratio of flight energy to BM with increasing body mass, predictions conforming poorly with empirical observations, especially by predicting unreasonably high ratios for large birds (King 1974: 32).
It should be noted that a FC of 13.7 represents the predicted energy expenditure of birds "... flying near the maximal steady-state power output . . ." (King 1974: 32). We assumed that maximal steady-state energy output was the best overall predictor of the types of flights kestrels and kites performed, reasoning that there was probably as much flight activity in which energy expenditure exceeded maximal steady-state output as there was in which energy expenditure was less than required
TABLE 4. Inputs to and DEB predicted by equation (1) for female Kestrels and White-tailed Kites wintering on agricultural lands in coastal northwestern California.
Kestrels Kites
Body mass (g) W 119 (86-165) a 331 (310-372) a Average air temperature (C) T, 8.9 9.1 Average nocturnal air temperature (C) T,,a 8.5 8.8 Average photoperiod (% of 24-h day) P 45.8 45.8 Average duration of darkness (% of 24-h day) 1 - P 54.2 54.2 Daily nonflight activities (% of 11-h
photoperiod) NFA 93.4 80.5 Daily flight activities (% of 11-h
photoperiod) F A 6.6 Daily energy budget (kcal'bird-•.day -') DEB 50.6 (42.0-61.0) b
19.5
110.0 (105.6-118.3) b
a Mean body mass; range in parentheses. Data from Roest (1957), Brown and Areadon (1968), Stendell (1972), and P.M. Bloom (pers. comra.).
b DEB predicted on basis of mean body mass; range predicted on basis of range in body mass in parentheses. S.I. conversion: 1 kcal] day = 4,85 x 10 • W.

October 1980] Wintering Raptor Energetics 801
TABLr 5. DEB calculated on the basis of observed food intake for female American Kestrels and White- tailed Kites wintering in coastal northwestern California. See appendix for details on weights and calorific equivalents of prey. a
Kestrels Kites
Number prey killed/day Vertebrates 2.2 3.1 Invertebrates 46.5 --
Biomass of prey killed/day (g) Vertebrates 21.6 76.6 Invertebrates 12.6 --
Energy ingested (kcal/day) Vertebrates 30.3 137.9 Invertebrates 20.1 --
Energy assimilated (kcal/day) Vertebrates 25.6 113.1 Invertebrates 17.3 --
TOTAL energy assimilated = DEB (kcal.bird •'day 1) 42.9 (2.08 W) 113.1 (5.49 W)
a Kites were observed to consume California voles (Microtus californicus) and western harvest mice (Reithrodontomys megalotis). Kestrels were observed to consume Lepidoptera larvae and adults, grasshoppers, earthworms, various Coleoptera, California voles, harvest mice, vagrant shrews (Sorex ragtans), garter snakes (Thamnophis sirtalis), red-legged frogs (Rana aurora), and Pacific tree frogs (Hyla regilla). Ingested energy corrected to account for the fact that kestrels and kites both usually eviscerated small mammal prey before consumption. Assimilation efficiency assumed to 0.82 for small mammals and 0.86 for other vertebrates and invertebrates, based on efficiencies obtained during feeding experiments.
for maximal steady-state output. Both species averaged 30-50 flights per day. Each flight lasted from a few seconds to about 45 min, and averaged 1-4 min. All flights involved ascending from perches or the ground, many involved hovering, and some involved transporting prey from the ground to elevated perches--types of flight exceeding maximal steady-state energy expenditure (Tucker 1968, 1974). All flights also involved descending from aerial heights or perches, some involved soaring or "kiting," and a few involved long-distance movements between roosts and hunting areas•types of flight requiring less than maximal steady-state energy expenditure (Tucker 1968, 1974; Pennycuick 1971).
Expressed in terms of the range in body mass of the birds, DEB approximated by the energetics model (Table 4) bracketed DEB estimated by food consumption (Table 5). In terms of mean body mass, however, the model predicted DEB 18.0% higher for kestrels and 2.7% lower for kites than DEB estmated by food consump- tion. The discrepancy between DEB approximated by the model in terms of mean body mass and DEB estimated by food consumption for kites is considered to be inconsequential. Presumably, the discrepancy is attributable to sampling errors in body mass of kites, a total of only four of which were monitored in the field, and/ or in weights of prey of kites in the field; a slight energy-expending imbalance among the three elements of the "climate space" unaccounted for in our model; or to some combination of these three phenomena. In any event, the model and existing inputs to the model are considered to provide a realistic approximation of DEB for White- tailed Kites living under winter conditions in coastal northwestern California.
The relatively small discrepancy between model prediction and field estimation of DEB for kites suggests that the relatively large discrepancy between model pre- diction and field estimation of DEB for kestrels is related to erroneous inputs to the model, a sizable energy-conserving imbalance among the elements of the climate space unaccounted for in our model, erroneous field estimates of food consumption, or to some combination of the three phenomena, but not to any important inade-

802 KOPLIN ET AL. [Auk, Vol. 97
quacies of the energetics model. The field estimate of food consumption was based on information from only seven kestrels. Thus, it is possible that body mass of the seven birds averaged less than 119 g, resulting in a realistic but low field estimate of DEB. A bias of the magnitude needed to account for the total discrepancy, however, would necessitate body masses of the seven birds involved to cluster at the very lower limit of body mass known for female kestrels, an extremely unlikely possibility. An indication of the prospect of obtaining such an extreme sample mean is provided by the only body masses of local female kestrels we were able to find-- two HSU museum specimens (111 g and 116 g) and an injured live bird (130 g)-- which averaged exactly 119 g. Nevertheless, it is possible that body mass of the seven birds averaged somewhat less than 119 g, accounting for some of the discrep- ancy.
A sizable energy-conserving imbalance among elements of the climate space of kestrels in the field is another possibility that may account for the discrepancy between model prediction and field estimation of DEB. We consider this possibility unlikely for several reasons. First, and most important, White-tailed Kites and kestrels were exposed to similar climatic conditions; as previously indicated, if there existed a climatically related alteration in DEB of kites, it operated to expend, not to conserve, energy. Second, a climatically related conservation of energy would have to have resulted from absorption of solar radiation. During the 184 days of the winters of 1972-73 and 1973-74, there was sunshine an average of only 44% of the time possible, resulting in a mean of 4.8 h of sunshine daily, and there was sunshine during the whole photoperiod on only 19 days (Local Climatic Data, U.S. Weather Bureau, Eureka). Furthermore, even when there was sunshine, the sun was at a low angle; at the latitude of 44ø30'N, its warming influence was minimal during the winter. Thus, even though solar radiation may have had a conserving influence on daily energy expenditure of kestrels, we feel that influence could not have ac- counted for an 18.0% conservation of daily energy expenditure.
We feel that a conservative error in our estimates of T• and T,,•, accounted for part of the discrepancy between model approximation and field estimates of DEB for female kestrels. T•, and T,,•, are based on outside air temperatures; kestrels, however, are known to roost in cavities, crevices, recesses, etc. (Brown and Amadon 1968, personal observation), situations in which air temperatures undoubtedly are warmer than outside. The magnitude of the difference is indicated by studies of incubating kestrels (Gessaman and Findell 1979). Average night-time temperatures in nest boxes of incubating kestrels ranged from 4.5 to 16.0øC and were 4.0-5.0øC warmer than temperatures outside (Gessaman pers. comm.). Daily maximum and minimum air temperatures in California averaged 12.1øC and 5.7øC, respectively, during the two 92-day winters kestrels were studied in the field. If temperature in the nocturnal roosts of the birds averaged 4.5øC warmer than outside, then T•, should be 11.2øC and r.a 13.0øC. On the basis of these inputs, the energetics model predicts DEB to be 48.7 kcal/day (2.36 W) for a 119-g bird. We consider this approximation to be more realistic for female kestrels than the approximation in Table 4. Nevertheless, the corrected approximation is still 13.5% higher than DEB estimated by food consumption (Table 5), indicating the existence of one or more additional errors.
The most likely possibility to account for the remaining discrepancy between model approximation and field estimation of DEB for kestrels is a conservative error in our estimate of the weights of prey, especially of unidentified invertebrates (Ap-

October 1980] Wintering Raptor Energetics 803
TABLE 6. Comparison of accuracy of energetics models for predicting DEB for female American Kestrels and White-tailed Kites wintering in coastal northwestern California. Arranged in decreasing order of accuracy.
DEB predicted a DEB/BM
Kes- Kes- Method of trels Kites trels Kites Mean prediction b Source/comment
48.7 113.1 3.16 3.46 3.31 -- Standard values 50.7 110.0 3.29 3.37 3.33 Equation (1) Present study 46.1 112.0 2.99 3.43 3.21 A Holmes et al. (1979) 51.4 113.8 3.44 3.49 3.47 Equation (10) Present study 41.1 106.8 2.67 3.27 2.97 A Wakely (1978) 56.9 106.6 2.40 3.27 2.84 A Withers (1977) 52.1 137.5 3.38 4.21 3.80 B Mosher and Matray (1974) 46.0 85.4 2.99 2.62 2.81 B West and DeWolfe (1974) 46.4 81.1 3.01 2.48 2.75 Equation (2) Wiens and Innis (1973, 1974),
Wiener and Glowacinski (1975) 38.2 92.1 2.48 2.82 2.65 B Kushlan (1977) 70.8 145.7 4.60 4.46 4.53 C King (1974) 23.4 86.5 1.52 2.65 2.09 A Tarboton (1978) 22.0 67.0 1.43 2.05 1.75 A Walter (1979) 25.6 54.6 1.66 1.67 1.67 A Dwyer (1975)
a S.I. conversion: 1 kcal/day = 4.85 x 10 • W. b A, time-activity budget combined with published allometric equations for predicting BM and/or SM. B, time-activity budget combined
with energy-balance studies on captive animals•from Table 1, measured metabolism - 2.2731Wø'•ø5•; W = body mass in g; "measured metabolism" comparable to Mosher and Matray's (1974) "resting metabolic rate," West and DeWolfe's (1977) "caged existence requirements," and Kushlan's (1977) "aviary existence metabolism." C, daily energy expenditure, DEE = 2.4345 Wø'7ø52; W = body mass in g.
pendix), consumed in the field. Thus, an underestimate in the mean live weight of individual unidentified invertebrates of only 0.08 g (i. e. a live weight of 0.20 g rather than 0.12 g per individual--Appendix), a very likely possibility, could account for the remaining 13.5% discrepancy.
In summary, because of the similarity between model prediction and field esti- mation of DEB for White-tailed Kites and because most of the discrepancy between model prediction and field estimation of DEB for female kestre!s is likely attributable to an error in our field estimates of weights of an important class of prey consumed, we feel that our energetics model provides a more realistic approximation of DEB for kestrels than the estimate based on observed food consumption. Because of errors in temperature inputs to the energetics model, however, we feel the DEB in Table 4 for 119-g kestrels is too high. Although we have no means of providing corrected estimates of the temperature inputs other than those previously indicated, we can predict limits. Thus, the value in Table 4 is considered to be the upper limit. The lower limit would occur if kestrels roosted at night under conditions of thermalneu- trality.
At thermalneutrality, equation (8) predicts T,, for a 119-g nonpasserine to be 19.9øC (at thermalneutrality T,•, = T•c); under these conditions Ta would be 16.0øC and DEB 46.0 (2.23 W)/bird. The value we postulated earlier (48.7 kcal [2.36 W]/ bird) lies almost midway between these limits, and in the absence of a better pre- diction is accepted as the most reasonable approximation of DEB for female kestrels wintering in coastal northwestern California.
If the DEB just approximated for female kestrels is accepted as a standard for birds weighing 119 g and if the DEB estimated by food consumption is accepted as a standard for kites weighing 331 g, it is possible to evaluate the predictive accuracy of the two versions of our energetics model relative to the predictive accuracy of other models (Table 6). Accordingly, equations (1) and (10) and the model of Holmes

804 KOPLIN ET AL. [Auk, Vol. 97
et al. (1979) are most accurate, predicting values averaging within 5.0% of the mean standard value. The models of Mosher and Matray (1974) and King (1974) over- approximated the mean standard value by 14.8 and 36.9%. The remaining models under-approximated the mean standard value by 10.3-49.5%. Thus, it may be concluded that the two versions of our energetics model approximate the expected energy expenditure of the two falconiforms wintering in coastal northwestern Cal- ifornia as accurately as the most accurate of other models evaluated and more accurately than most models evaluated. We wish to emphasize that the foregoing comparisons are offered not as an attempt to affirm or refute the validity of energetics models other than ours, but rather as an indication of the applicability of a group of models to predict energy expenditure of a specific taxon of animals living under a specific set of environmental conditions.
ACKNOWLEDGMENTS
We thank James A. Gessaman for permission to use unpublished information on the energy expenditure of an American Kestrel flown in a wind tunnel. We also thank J. A. Gessaman, Eugene A. LeFebvre, and William R. Dawson for comments on an oral presentation of preliminary results of this study before the joint meeting of the Cooper and Wilson Ornithological Societies in 1975. We are very grateful to J. A. Gessaman and an anonymous reviewer for a much-needed review of this paper. Carl T. Benz, Erick G. Campbell, Theodore Snyder, William W. White, Jeffrey M. Gardetto, Donald Lee, Wallace Prestidge, Lyell Chittenden, Richard K. Willis, Jerome M. Thomas, and Michael A. Ferguson provided valuable assistance in the laboratory. Joel Coenenburg, James F. Miller, Jeffrey B. Froke, Larry K. Norris, John A. Beam, Grant Marcom, and Roger Guinee aided greatly in the field.
LITERATURE CITED
ASCHOFF, J., & H. POHL. 1970. Rhythmic variations in energy metabolism. Fed. Proc., Fed. Amer. Soc. Exp. Biol. 29: 1541-1552.
BERGER, M., J. S. HART, & O. Z. ROY. 1970. Respiration, oxygen consumption and heart rate in some birds during rest and flight. Z. vergl. Physiologie 66:201-214.
BROWN, L., & D. AMADON. 1968. Eagles, hawks and falcons of the world, vols. 1 and 2. New York, McGraw-Hilt.
C^LDER, W. A., & J. R. I•NG. 1974. Thermal and caloric relations of birds. Pp. 260413 in Avian biology, vol. 4 (D. S. Farner and J. R. King, Eds.). New York, Academic Press.
COLLOPY, M. W. 1975. Behavioral and predatory dynamics of kestrels wintering in the Arcata Bottoms. Unpublished M.S. thesis, Arcata, California, Humboldt State Univeristy.
DWYER, T. J. 1975. Time budget of breeding gadwalls. Wilson Bull. 87: 335-343. GESSAMAN, J. A., & P. R. FINDELL. 1979. Energy cost of incubation in the American Kestrel. Comp.
Biochem. Physiol. 63A: 57-62. GRODZINSKI, W., R. Z. KLEKOWSKI, & A. DUNCAN. 1975. Methods for ecological energetics. IBP
Handbood No. 24. Blackwell Sci. Publ.
H^RT, J. S., & M. BERGER. 1972. Energetics, water economy and temperature regulation during flight. Proc. Intern. Ornithol. Congr. 15: 189-199.
HOLMES, R. T., C. P. BLACK, & T. W. SHERRY. 1979. Comparative population bioenergetics of three insectivorous passerines in a deciduous forest. Condor 81: 9-20.
KENDEIGH, S.C. 1949. Effect of temperature and season on energy resources of the English Sparrow. Auk 66: 113-127.
ß 1970. Energy requirements for existence in relation to size of bird. Condor 72: 60-65. -, V. R. DOL'NIK, & V. M. GAVRILOV. 1977. Avian energetics. Pp. 127-204 in Granivorous birds
in ecosystems (J. Pinowski and S.C. Kendeigh, Eds.). New York, Cambridge Univ. Press. KING, J. R. 1974. Seasonal allocation of time and energy resources in birds. Pp. 4-85 in Avian energetics
(R. A. Paynter, Ed.). Publ. Nuttall Ornithol. Club, No. 15. KOPLIN, J. R. 1972. Measuring predator impact of woodpeckers on spruce beetles. J. Wildl. Mgmt. 36:
308-320.
KUSHLAN, J. A. 1977. Population energetics of the American White Ibis. Auk 94: 114-122.

October 1980] Wintering Raptor Energetics 805
LASIEWSKI, R. C. 1963. Oxygen consumption of torpid, resting, active and flying hummingbirds. Phys- iol. Zool. 36: 122-140.
, & W. R. DAWSON. 1967. A re-examination of the relation between standard metabolic rate and body weight in birds. Condor 69: 13-23.
LEFEBVRE, g. A. 1964. The use of D20 •8 for measuring energy metabolism in Columba livia at rest and in flight. Auk 81: 403416.
MOSHER, J. m., & P. F. MATRAY. 1974. Size dimorphism: a factor in energy savings for broad-winged hawks. Auk 91: 325-341.
PENNYCIJICK, C. J. 1971. Soaring behaviour and performance of some East African birds, observed from a motor-glider. Ibis 114: 178-218.
PORTER, W. P., & D. M. GATESß 1969. Thermodynamic equilibria of animals and environment. Ecol. Monogr. 39: 227-244.
ROEST, A. I. 1957. Notes on the American Sparrow Hawk. Auk 74: 1-19. STENDELL, R. C. 1972. The occurrence, food habits, and nesting strategy of White-tailed Kites in
relation to a fluctuating vole population. Unpublished Ph.D. dissertation, Berkeley, California, University of California.
TARBOTON, W. R. 1978. Hunting and the energy budget of the Black-shouldered Kite. Condor 80: 88- 91.
TUCKER, V. A. 1968. Respiratory exchange and evaporative water loss in the flying budgerigar. J. Exp. Biol. 48: 67-87.
ß 1972. Metabolism during flight in the Laughing Gull, L. atricilla. Amer. J. Physiol. 222: 237- 245.
ß 1974. Energetics of natural avian flight. Pp. 298-328 in Avian energetics (R. A. Paynter, Ed.). Publ. Nuttall Ornithol. Club, No. 15.
WAKELY, J. S. 1978. Activity budget, energy expenditures, and energy intake of nesting Ferruginous Hawks. Auk 95: 667-676.
WALTER, H. 1979. Eleonora's Falcon, adaptations to prey and habitat in a social raptor. Chicago, Illinois, Univ. Chicago Press.
WEINER, J. & Z. GLOWACINSKI. 1975. Energy flow through a bird community in a deciduous forest in southern Poland. Condor 77: 233-242.
WEST• G. C., & B. B. DEWOLFE. 1974. Populations and energetics of taiga birds near Fairbanks, Alaska. Auk 91: 757-775.
WIENS, J. m., & Gß S. INNIS. 1973. Estimation of energy flow in bird communities. II. A simulation model of activity budgets and population bioenergetics. Proc. 1973 Summer Computer Simulation Conference, Montreal.
, & --. 1974. Estimation of energy flow in bird communities: a population bioenergetics model. Ecology 55: 730-746.
WITHERS, P. C. 1977. Energetic aspects of reproduction by the Cliff Swallow. Auk 94: 718-725.

806 KOPLIN ET AL. [Auk, Vol. 97
APPENDIX. Average weight, calorific content, and number of prey consumed by female American Kes- trels and White-tailed Kites wintering in northwestern California. Weights of small mammals are for eviscerated individuals; parenthetical values are weights of intact individuals. a
Prey
Mean number
consumed/day Mean
Mean live Mean calorific Kestrels Kites weight dry weight content (number (number (g/indi- (g/indi- (kcal/g prey = prey = vidual) vidual) dry wt.) b 1,533) 168)
Lepidoptera 0.69 0.21 5.83 0.27 -- Orthoptera 1.10 0.39 5.61 0.31 -- Coleoptera 0.67 0.18 5.72 8.80 -- Lumbricidae 0.40 0.07 4.62 6.00 -- Unidentified invertebrates 0.12 0.05 5.72 31.11 -- Microtus californicus 26.6 9.58 5.00 0.34 2.80
(34.0) (10.80) Reithodontomys megalotis 7.1 2.62 5.00 0.09 0.30
(9.0) (2.95) Sorex vagrans 3.9 1.39 5.00 0.75 --
(4.9) (1.60) Fringillidae 20.0 6.00 6.00 0.05 -- Thamnophis sirtalis 11.7 3.98 4.10 0.12 -- Rana aurora 16.5 3.28 4.10 0.21 -- Hyla regilla 4.6 0.60 4.10 0.68 --
a Weights of small mammals were measured: M. californicus, n = 177; R. megalotis, n - 64; S. vagrans, n - 14. All other weights except unidentified invertebrates obtained from the literature (Collopy 1975). Weights of unidentified invertebrates visually estimated relative to size of identifiable invertebrates. Calorific data determined by calorimetry or from the literature (Collopy 1975). Daily consumption rates based on observations totaling 316.7 h for kestrels and 441.2 h for kites. Prey selection by kites verified by analysis of 76 pellets, which contained the skulls of 82 voles and 9 harvest mice.
b S.I. conversion: 1 kcal - 4.187 kilojoule (kJ).