ENEL PUBLISHES 2021 SECOND QUARTER AND FIRST HALF …
19
Media Relations Investor Relations T +39 06 8305 5699 T +39 06 8305 7975 [email protected] [email protected] enel.com enel.com 1 Enel SpA – Registered Office: 00198 Rome – Italy - Viale Regina Margherita 137 – Companies Register of Rome and Tax I.D. 00811720580 - R.E.A. 756032 – VAT Code 15844561009 – Stock Capital Euro 10,166,679,946 fully paid-in. ENEL PUBLISHES 2021 SECOND QUARTER AND FIRST HALF GROUP OPERATING DATA REPORT Rome, July 22 nd , 2021 – Enel S.p.A. (“Enel") published its Quarterly Bulletin (“Report"), with the Group’s operating data relating to the second quarter and first half of 2021. The Report, which is published ahead of the approval by the Enel Board of Directors and the disclosure of the performance and financial data contained in Enel’s periodic financial reports, is aimed at further strengthening Enel’s transparency towards the financial community, in line with best practices in the most advanced markets. The Report attached to this press release is available to the public at Enel’s registered office, on the Enel website (www.enel.com), and - together with this press release - through the authorised storage mechanism "eMarket Storage" (www.emarketstorage.com).
Transcript of ENEL PUBLISHES 2021 SECOND QUARTER AND FIRST HALF …

Media Relations Investor Relations
T +39 06 8305 5699 T +39 06 8305 7975
[email protected] [email protected]
enel.com enel.com
1
Enel SpA – Registered Office: 00198 Rome – Italy - Viale Regina Margherita 137 – Companies Register of Rome and Tax I.D. 00811720580 - R.E.A. 756032 – VAT Code 15844561009 – Stock Capital Euro 10,166,679,946 fully paid-in.
ENEL PUBLISHES 2021 SECOND QUARTER AND FIRST HALF GROUP OPERATING DATA REPORT
Rome, July 22nd, 2021 – Enel S.p.A. (“Enel") published its Quarterly Bulletin (“Report"), with the Group’s operating data relating to the second quarter and first half of 2021.
The Report, which is published ahead of the approval by the Enel Board of Directors and the disclosure of the performance and financial data contained in Enel’s periodic financial reports, is aimed at further strengthening Enel’s transparency towards the financial community, in line with best practices in the most advanced markets.
The Report attached to this press release is available to the public at Enel’s registered office, on the Enel website (www.enel.com), and - together with this press release - through the authorised storage mechanism "eMarket Storage" (www.emarketstorage.com).

First Half
Quarterly Bulletin

Quarterly bulletinOperating data H1 2021
1
Index
1. Global Power Generation
2. Global Infrastructure & Networks
3. Retail
4. Disclaimer

Global Power GenerationOperating data H1 2021
2
H1 2020
103 TWh
H1 2021
111 TWh
67% emission free 65% emission free
Emission free share of production1,2Installed capacity (GW) and production evolution1
Conventional GenerationRenewables Production (TWh)
1. Rounded figures. Includes capacity and production from renewable managed assets.
2. Considers nuclear + renewable (consolidated & managed).
46.4 49.9
39.8 39.0
86.2 88.9
-10. 0
10.0
30.0
50.0
70.0
90.0
110.0
H1 2020 H1 2021
47
56
51
60
103 111
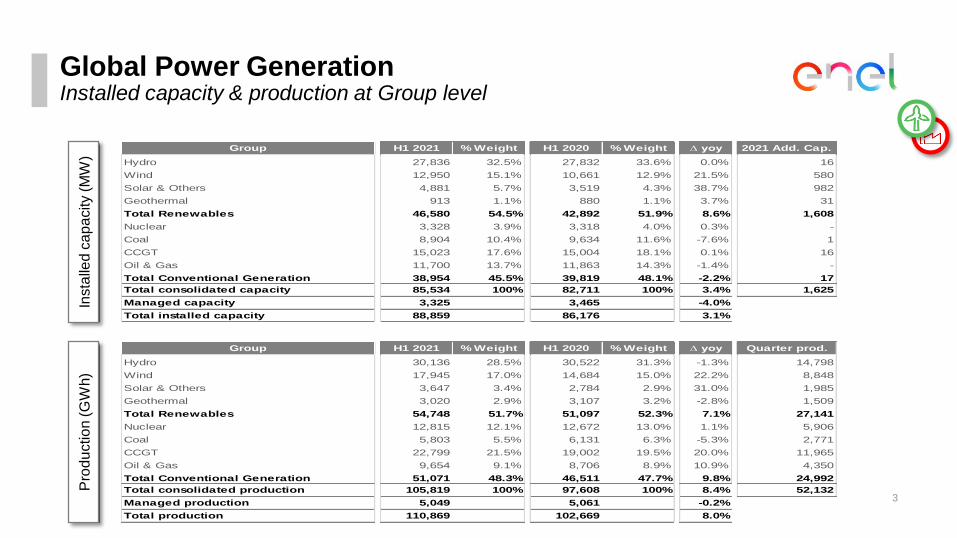
Global Power GenerationInstalled capacity & production at Group level
3
Insta
lled
ca
pa
city (
MW
)P
rod
uctio
n (G
Wh)
Group H1 2021 % Weight H1 2020 % Weight ∆ yoy 2021 Add. Cap.
Hydro 27,836 32.5% 27,832 33.6% 0.0% 16
Wind 12,950 15.1% 10,661 12.9% 21.5% 580
Solar & Others 4,881 5.7% 3,519 4.3% 38.7% 982
Geothermal 913 1.1% 880 1.1% 3.7% 31
Total Renewables 46,580 54.5% 42,892 51.9% 8.6% 1,608
Nuclear 3,328 3.9% 3,318 4.0% 0.3% -
Coal 8,904 10.4% 9,634 11.6% -7.6% 1
CCGT 15,023 17.6% 15,004 18.1% 0.1% 16
Oil & Gas 11,700 13.7% 11,863 14.3% -1.4% -
Total Conventional Generation 38,954 45.5% 39,819 48.1% -2.2% 17
Total consolidated capacity 85,534 100% 82,711 100% 3.4% 1,625
Managed capacity 3,325 3,465 -4.0%
Total installed capacity 88,859 86,176 3.1%
Group H1 2021 % Weight H1 2020 % Weight ∆ yoy Quarter prod.
Hydro 30,136 28.5% 30,522 31.3% -1.3% 14,798
Wind 17,945 17.0% 14,684 15.0% 22.2% 8,848
Solar & Others 3,647 3.4% 2,784 2.9% 31.0% 1,985
Geothermal 3,020 2.9% 3,107 3.2% -2.8% 1,509
Total Renewables 54,748 51.7% 51,097 52.3% 7.1% 27,141
Nuclear 12,815 12.1% 12,672 13.0% 1.1% 5,906
Coal 5,803 5.5% 6,131 6.3% -5.3% 2,771
CCGT 22,799 21.5% 19,002 19.5% 20.0% 11,965
Oil & Gas 9,654 9.1% 8,706 8.9% 10.9% 4,350
Total Conventional Generation 51,071 48.3% 46,511 47.7% 9.8% 24,992
Total consolidated production 105,819 100% 97,608 100% 8.4% 52,132
Managed production 5,049 5,061 -0.2%
Total production 110,869 102,669 8.0%
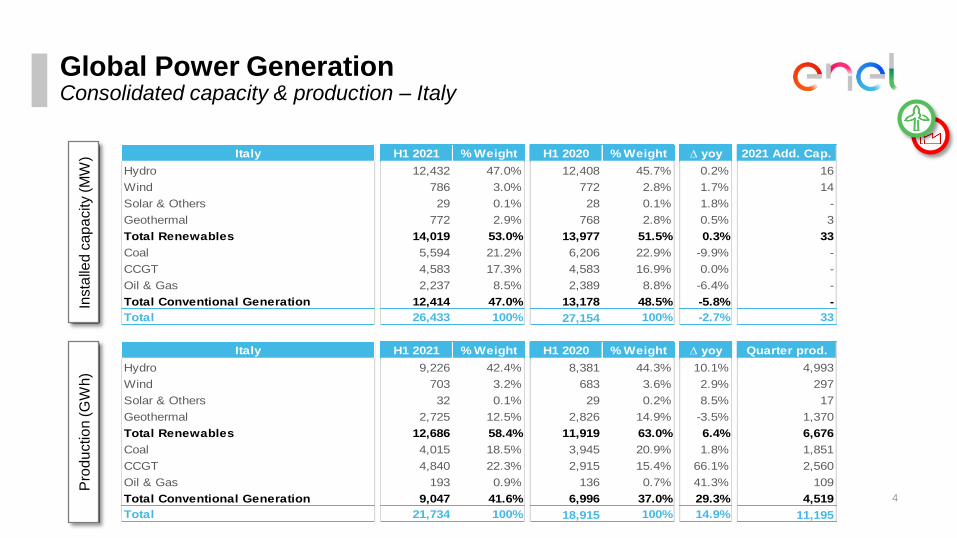
Global Power GenerationConsolidated capacity & production – Italy
4
Insta
lled
ca
pa
city (
MW
)P
rod
uctio
n (G
Wh)
Italy H1 2021 % Weight H1 2020 % Weight ∆ yoy 2021 Add. Cap.
Hydro 12,432 47.0% 12,408 45.7% 0.2% 16
Wind 786 3.0% 772 2.8% 1.7% 14
Solar & Others 29 0.1% 28 0.1% 1.8% -
Geothermal 772 2.9% 768 2.8% 0.5% 3
Total Renewables 14,019 53.0% 13,977 51.5% 0.3% 33
Coal 5,594 21.2% 6,206 22.9% -9.9% -
CCGT 4,583 17.3% 4,583 16.9% 0.0% -
Oil & Gas 2,237 8.5% 2,389 8.8% -6.4% -
Total Conventional Generation 12,414 47.0% 13,178 48.5% -5.8% -
Total 26,433 100% 27,154 100% -2.7% 33
Italy H1 2021 % Weight H1 2020 % Weight ∆ yoy Quarter prod.
Hydro 9,226 42.4% 8,381 44.3% 10.1% 4,993
Wind 703 3.2% 683 3.6% 2.9% 297
Solar & Others 32 0.1% 29 0.2% 8.5% 17
Geothermal 2,725 12.5% 2,826 14.9% -3.5% 1,370
Total Renewables 12,686 58.4% 11,919 63.0% 6.4% 6,676
Coal 4,015 18.5% 3,945 20.9% 1.8% 1,851
CCGT 4,840 22.3% 2,915 15.4% 66.1% 2,560
Oil & Gas 193 0.9% 136 0.7% 41.3% 109
Total Conventional Generation 9,047 41.6% 6,996 37.0% 29.3% 4,519
Total 21,734 100% 18,915 100% 14.9% 11,195
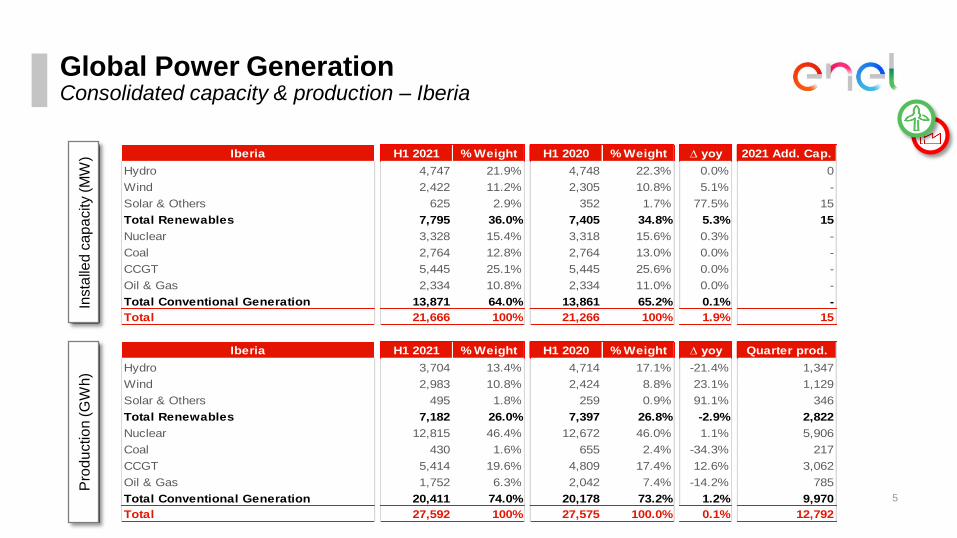
Global Power GenerationConsolidated capacity & production – Iberia
5
Insta
lled
ca
pa
city (
MW
)P
rod
uctio
n (G
Wh)
Iberia H1 2021 % Weight H1 2020 % Weight ∆ yoy 2021 Add. Cap.
Hydro 4,747 21.9% 4,748 22.3% 0.0% 0
Wind 2,422 11.2% 2,305 10.8% 5.1% -
Solar & Others 625 2.9% 352 1.7% 77.5% 15
Total Renewables 7,795 36.0% 7,405 34.8% 5.3% 15
Nuclear 3,328 15.4% 3,318 15.6% 0.3% -
Coal 2,764 12.8% 2,764 13.0% 0.0% -
CCGT 5,445 25.1% 5,445 25.6% 0.0% -
Oil & Gas 2,334 10.8% 2,334 11.0% 0.0% -
Total Conventional Generation 13,871 64.0% 13,861 65.2% 0.1% -
Total 21,666 100% 21,266 100% 1.9% 15
Iberia H1 2021 % Weight H1 2020 % Weight ∆ yoy Quarter prod.
Hydro 3,704 13.4% 4,714 17.1% -21.4% 1,347
Wind 2,983 10.8% 2,424 8.8% 23.1% 1,129
Solar & Others 495 1.8% 259 0.9% 91.1% 346
Total Renewables 7,182 26.0% 7,397 26.8% -2.9% 2,822
Nuclear 12,815 46.4% 12,672 46.0% 1.1% 5,906
Coal 430 1.6% 655 2.4% -34.3% 217
CCGT 5,414 19.6% 4,809 17.4% 12.6% 3,062
Oil & Gas 1,752 6.3% 2,042 7.4% -14.2% 785
Total Conventional Generation 20,411 74.0% 20,178 73.2% 1.2% 9,970
Total 27,592 100% 27,575 100.0% 0.1% 12,792

Global Power GenerationConsolidated capacity & production – Latin America
6
Insta
lled
ca
pa
city (
MW
)P
rod
uctio
n (G
Wh)
Latin America H1 2021 % Weight H1 2020 % Weight ∆ yoy Quarter prod.
Hydro 17,123 49.4% 17,321 53.5% -1.1% 8,430
Wind 4,005 11.5% 2,532 7.8% 58.2% 2,342
Solar & Others 1,534 4.4% 1,382 4.3% 11.0% 756
Geothermal 133 0.4% 118 0.4% 12.4% 70
Total Renewables 22,794 65.7% 21,353 66.0% 6.7% 11,598
Coal 1,359 3.9% 1,531 4.7% -11.3% 703
CCGT 9,507 27.4% 8,745 27.0% 8.7% 4,977
Oil & Gas 1,026 3.0% 732 2.3% 40.1% 615
Total Conventional Generation 11,891 34.3% 11,008 34.0% 8.0% 6,294
Total 34,686 100.0% 32,362 100.0% 7.2% 17,893
Latin America H1 2021 % Weight H1 2020 % Weight ∆ yoy 2021 Add. Cap.
Hydro 10,585 47.1% 10,580 49.5% 0.1% -
Wind 2,402 10.7% 1,556 7.3% 54.4% 273
Solar & Others 2,020 9.0% 1,676 7.8% 20.5% 219
Geothermal 69 0.3% 41 0.2% 69.0% 28
Total Renewables 15,076 67.1% 13,852 64.8% 8.8% 521
Coal 546 2.4% 664 3.1% -17.8% 1
CCGT 4,165 18.5% 4,168 19.5% -0.1% -
Oil & Gas 2,682 11.9% 2,693 12.6% -0.4% -
Total Conventional Generation 7,393 32.9% 7,525 35.2% -1.8% 1
Total 22,469 100.0% 21,377 100% 5.1% 522

Global Power GenerationConsolidated capacity & production – Rest of Europe
7
Insta
lled
ca
pa
city (
MW
)P
rod
uctio
n (G
Wh)
Rest of Europe H1 2021 % Weight H1 2020 % Weight ∆ yoy 2021 Add. Cap.
Hydro 19 0.3% 19 0.3% -0.2% -
Wind 956 15.0% 895 14.2% 6.9% -
Solar & Others 130 2.0% 123 2.0% 5.1% 6
Total Renewables 1,105 17.3% 1,037 16.5% 6.6% 6
CCGT 829 13.0% 809 12.9% 2.6% 16
Oil & Gas 4,447 69.7% 4,447 70.7% 0.0% -
Total Conventional Generation 5,276 82.7% 5,255 83.5% 0.4% 16
Total 6,381 100% 6,293 100% 1.4% 22
Rest of Europe H1 2021 % Weight H1 2020 % Weight ∆ yoy Quarter prod.
Hydro 27 0.3% 17 0.2% 62.0% 6
Wind 1,034 9.5% 1,073 11.3% -3.7% 431
Solar & Others 87 0.8% 84 0.9% 3.2% 55
Total Renewables 1,148 10.6% 1,174 12.4% -2.3% 492
CCGT 3,038 27.9% 2,532 26.6% 20.0% 1,366
Oil & Gas 6,684 61.5% 5,796 61.0% 15.3% 2,842
Total Conventional Generation 9,721 89.4% 8,328 87.6% 16.7% 4,208
Total 10,869 100% 9,503 100% 14.4% 4,700
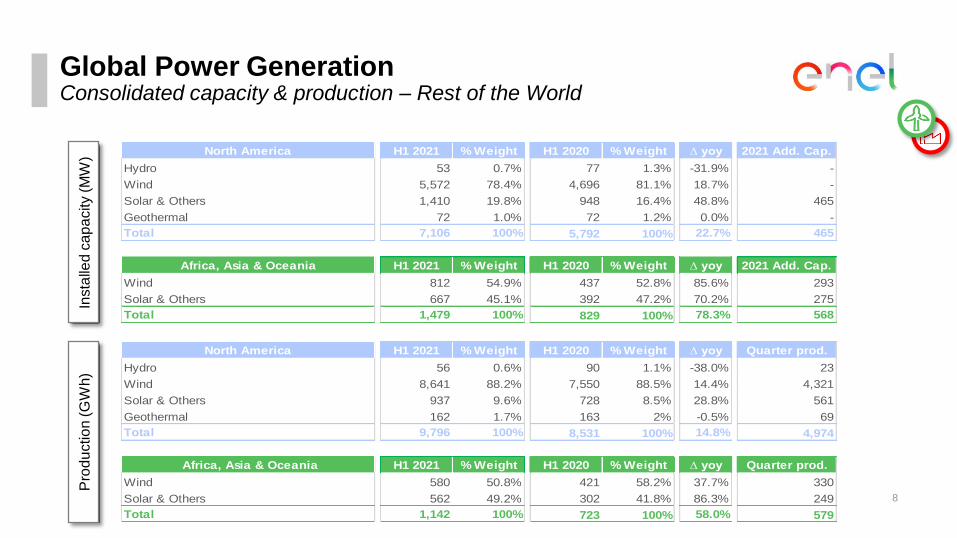
Global Power GenerationConsolidated capacity & production – Rest of the World
8
Insta
lled
ca
pa
city (
MW
)P
rod
uctio
n (G
Wh)
North America H1 2021 % Weight H1 2020 % Weight ∆ yoy 2021 Add. Cap.
Hydro 53 0.7% 77 1.3% -31.9% -
Wind 5,572 78.4% 4,696 81.1% 18.7% -
Solar & Others 1,410 19.8% 948 16.4% 48.8% 465
Geothermal 72 1.0% 72 1.2% 0.0% -
Total 7,106 100% 5,792 100% 22.7% 465
Africa, Asia & Oceania H1 2021 % Weight H1 2020 % Weight ∆ yoy 2021 Add. Cap.
Wind 812 54.9% 437 52.8% 85.6% 293
Solar & Others 667 45.1% 392 47.2% 70.2% 275
Total 1,479 100% 829 100% 78.3% 568
North America H1 2021 % Weight H1 2020 % Weight ∆ yoy Quarter prod.
Hydro 56 0.6% 90 1.1% -38.0% 23
Wind 8,641 88.2% 7,550 88.5% 14.4% 4,321
Solar & Others 937 9.6% 728 8.5% 28.8% 561
Geothermal 162 1.7% 163 2% -0.5% 69
Total 9,796 100% 8,531 100% 14.8% 4,974
Africa, Asia & Oceania H1 2021 % Weight H1 2020 % Weight ∆ yoy Quarter prod.
Wind 580 50.8% 421 58.2% 37.7% 330
Solar & Others 562 49.2% 302 41.8% 86.3% 249
Total 1,142 100% 723 100% 58.0% 579

Global Infrastructure & NetworksOperating data H1 2021
9
Electricity distributed (TWh)1 End users (mn)1
231.1 245.7
1. 2020 restated figures.
2. Latin America breakdown – H1 2021: Argentina 8.2 TWh, Brazil: 40 TWh, Chile: 8 TWh, Colombia: 7 TWh and Peru: 4.1 TWh. H1 2020: Argentina: 8.1 TWh, Brazil: 37.6
TWh, Chile: 7.8 TWh, Colombia: 6.7 TWh and Peru: 3.7 TWh.
3. Latin America breakdown – H1 2021: Argentina 2.5 mn, Brazil: 18.3 mn, Chile: 2.0 mn, Colombia: 3.7 mn and Peru: 1.5 mn. H1 2020: Argentina: 2.5 mn, Brazil: 17.9 mn,
Chile: 2.0 mn, Colombia: 3.6 mn and Peru: 1.4 mn.
74.0 74.8
IberiaItaly Rest of EuropeLatin America2,3
+0.8+6%
101.0 106.4
58.8 64.2
63.9 67.3
7.4 7.8
H1 2020 H1 2021
31.4 31.5
12.2 12.3
27.4 27.9
2.9 3.0
H1 2020 H1 2021

Retail at Group levelOperating data H1 2021
10
Power customers (mn)Energy sold (TWh)
145.0 152.1
Free market Regulated
+5%+1.1
(1.8)
68.2 67.3
76.8 84.8
H1 2020 H1 2021
17.3 18.4
H1 2020 H1 2021
46.8 45.0
H1 2020 H1 2021
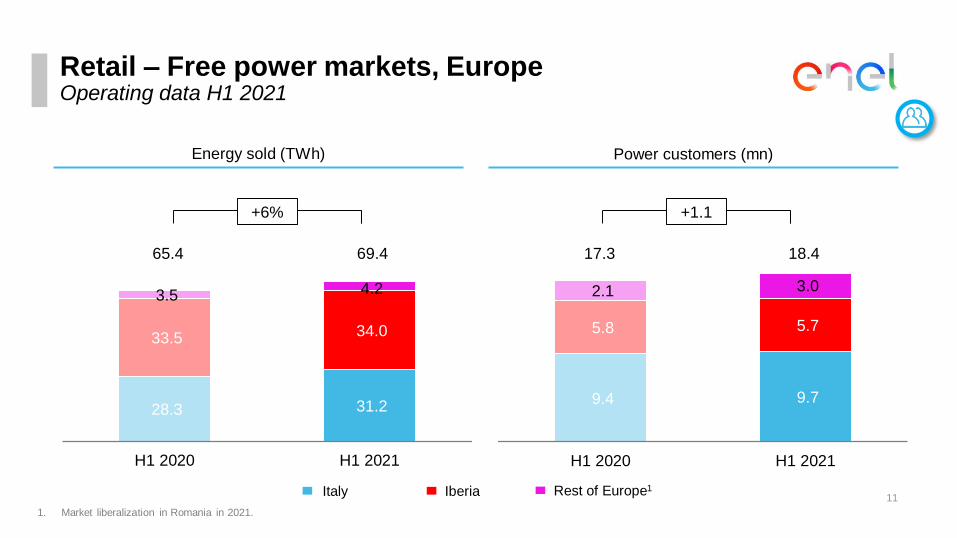
Retail – Free power markets, EuropeOperating data H1 2021
11
Power customers (mn)Energy sold (TWh)
65.4 69.4 17.3 18.4
IberiaItaly Rest of Europe1
+1.1+6%
1. Market liberalization in Romania in 2021.
28.3 31.2
33.5 34.0
3.5 4.2
H1 2020 H1 2021
9.4 9.7
5.8 5.7
2.1 3.0
H1 2020 H1 2021

Retail – Regulated power markets, EuropeOperating data H1 2021
12IberiaItaly Rest of Europe1
Power customers (mn)Energy sold (TWh)
21.2 19.8 19.4 17.0
(2.4)(7%)
1. Market liberalization in Romania in 2021.
14.9 14.2
5.5 5.4
0.9 0.1
H1 2020 H1 2021
13.7 12.5
4.8 4.5
0.9
H1 2020 H1 2021
4.7
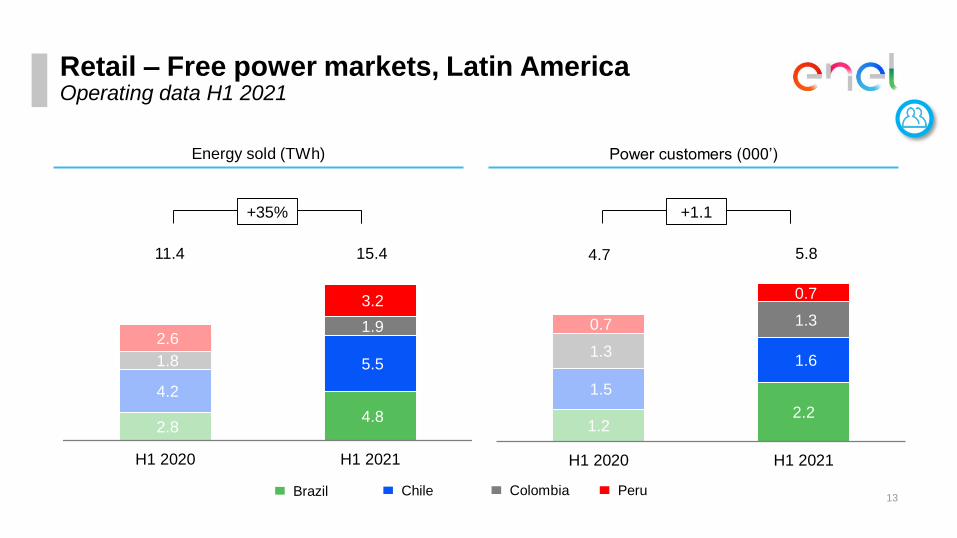
Retail – Free power markets, Latin AmericaOperating data H1 2021
13Brazil Chile Colombia Peru
Power customers (000’)Energy sold (TWh)
11.4 15.4 5.8
+1.1+35%
2.8 4.8
4.2
5.5 1.8
1.9 2.6
3.2
H1 2020 H1 2021
1.22.2
1.5
1.6 1.3
1.3 0.7
0.7
H1 2020 H1 2021
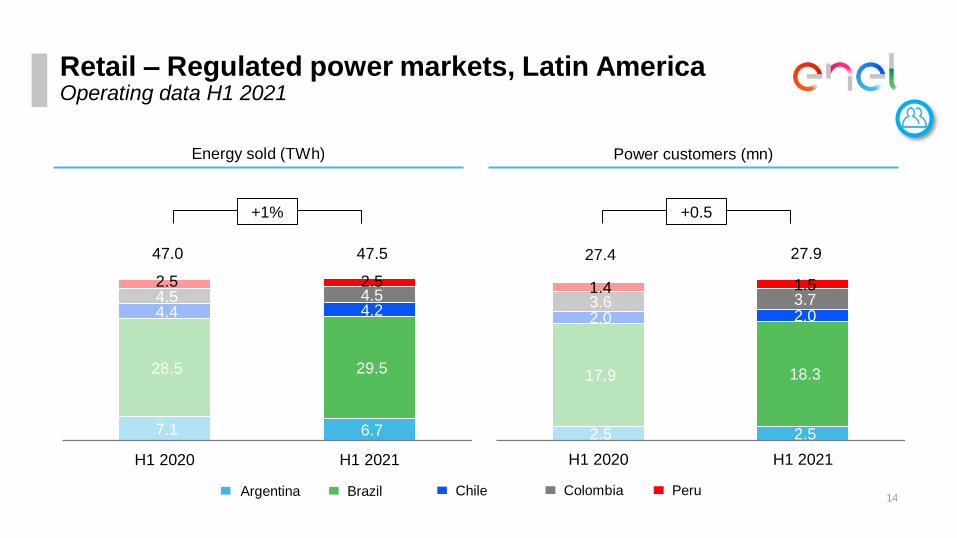
Retail – Regulated power markets, Latin AmericaOperating data H1 2021
14BrazilArgentina Chile Colombia Peru
Power customers (mn)Energy sold (TWh)
47.0 47.5 27.927.4
+0.5+1%
7.1 6.7
28.5 29.5
4.4 4.2 4.5 4.5 2.5 2.5
H1 2020 H1 2021
2.5 2.5
17.9 18.3
2.0 2.0 3.6 3.7 1.4 1.5
H1 2020 H1 2021
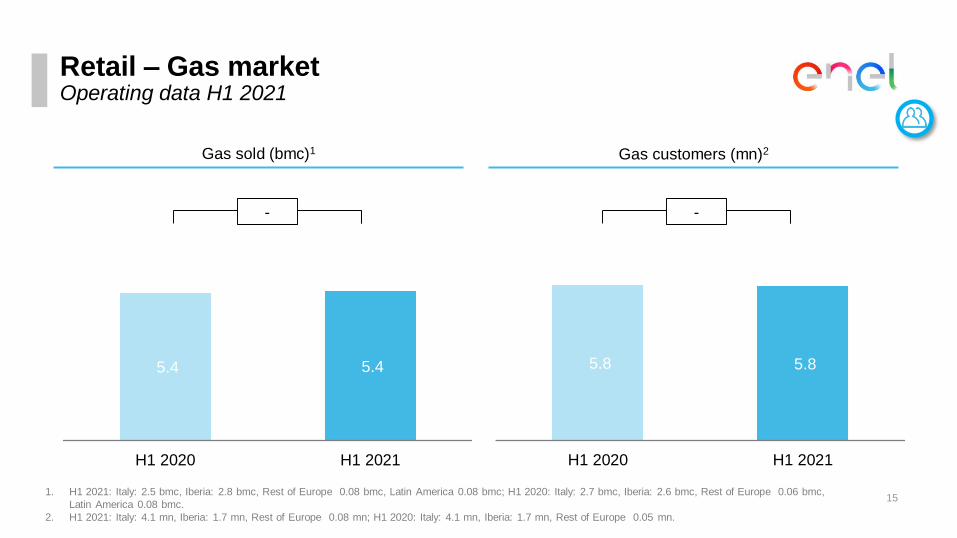
Retail – Gas marketOperating data H1 2021
15
Gas customers (mn)2Gas sold (bmc)1
1. H1 2021: Italy: 2.5 bmc, Iberia: 2.8 bmc, Rest of Europe 0.08 bmc, Latin America 0.08 bmc; H1 2020: Italy: 2.7 bmc, Iberia: 2.6 bmc, Rest of Europe 0.06 bmc,
Latin America 0.08 bmc.
2. H1 2021: Italy: 4.1 mn, Iberia: 1.7 mn, Rest of Europe 0.08 mn; H1 2020: Italy: 4.1 mn, Iberia: 1.7 mn, Rest of Europe 0.05 mn.
--
5.4 5.4
H1 2020 H1 2021
5.8 5.8
H1 2020 H1 2021

Disclaimer
16
The information contained in this presentation does not purport to be comprehensive and has not
been independently verified by any independent third party.
This presentation does not constitute a recommendation regarding the securities of the Company.
This presentation does not contain an offer to sell or a solicitation of any offer to buy any securities
issued by Enel S.p.A. or any of its subsidiaries.

Quarterly bulletin H1 2021Contact us
Contacts
Email [email protected]
Phone +39 06 8305 7975
Monica GirardiHead of Group Investor Relations
Investor Relations teamFederico Baroncelli
Serena Carioti
Federica Dori
Matteo Marengon
Federica Pozzi
Fabrizio Ragnacci
Noemi Tomassi
Emanuele Toppi
17
Channels
Website
Enel.com
iOS Android
Investor Relations App