Endline Report
27
Water is Life International Wa(SHG) Pilot Program Endline Survey Report March 2016 Report prepared by Elizabeth Poulsen | [email protected] Wa(SHG) Project Manager: Stephenie Chatfield | [email protected] WiLi Executive Director: David Harding | [email protected] Water is Life, International (WiLi) | P.O. Box 540318 | Orlando, FL 32854 | (407) 716-4214
-
Upload
elizabeth-poulsen -
Category
Documents
-
view
184 -
download
0
Transcript of Endline Report
Water is Life International Wa(SHG) Pilot Program
Endline Survey Report March 2016
Report prepared by Elizabeth Poulsen | [email protected] Wa(SHG) Project Manager: Stephenie Chatfield | [email protected]
WiLi Executive Director: David Harding | [email protected] Water is Life, International (WiLi) | P.O. Box 540318 | Orlando, FL 32854 | (407) 716-4214

iWa(SHG) Endline Survey Report – March 2016 | ii
Table of Contents Introduction ....................................................................................................................................... 1
Methodology ...................................................................................................................................... 1
Limitations .................................................................................................................................... 2
Summary of Results ......................................................................................................................... 2
Demographic Information about Survey Respondents ............................................................... 2
Personal Sanitation ....................................................................................................................... 2
Water Treatment Knowledge and Practices ............................................................................. 3
Hand-Washing Knowledge and Practices ................................................................................ 3
Incidence of Diarrheal Disease ..................................................................................................... 4
Latrine Ownership ........................................................................................................................ 5
Recommendations ............................................................................................................................ 5
Conclusions ....................................................................................................................................... 5
Appendix A: Program Logical Framework ...................................................................................... 6
Appendix B: Complete Baseline and Endline Survey Data ............................................................. 9
Appendix C: Survey Instrument (Questionnaire) ........................................................................... 21
Acronyms CLA Cluster-Level Association
KAP Knowledge, Attitudes, and Practices
SHG Self-Help Group
WaSH Water, Sanitation, and Hygiene
Wa(SHG) Wili’s Water, Sanitation, and Hygiene Self-Help Group Program
WiLi Water is Life, International

iWa(SHG) Endline Survey Report – March 2016 | 1
Introduction More than 70 percent of Ethiopia’s population lives without improved sanitation coverage. This, coupled with poor sanitation behaviors, contributes to a high prevalence of water-borne disease which disproportionately affects rural populations. Water is Life, International (Wili) aims to address this health burden through their Wa(SHG) program, which focuses primarily on changing personal sanitation and hygiene behaviors, with a secondary focus on providing bio-sand water filters. Wili’s interventions will primarily be implemented to and through an existing network of Self-Help Groups (SHGs), organized by Cluster-Level Associations (CLAs). Partner organizations for the Wa(SHG) program include Tearfund, Ethiopian Kale Heywet Church, Ethiopian Guenet Church, Desert Rose Consultancy, and the Ethiopian Kale Heywet Church WET Center.
Wili conducted a pilot phase of the Wa(SHG) program from March 2015-February 2016 in the Dale and Shebedino Districts of the Awasa township in southern Ethiopia (see Figure 1). The overall goal of this pilot phase was to test the effectiveness of the Wa(SHG) program, with a focus on improving personal hygiene behaviors, alleviating the burden of water-borne diseases, and improving the basic sanitation of program participants. A number of tools will assess whether this pilot phase was successful; this report details the data uncovered through baseline and endline KAP (knowledge, attitudes, and practices) surveys.
Figure 1: The Wa(SHG) project took place in the Dale and Shebedino districts of the Awasa township in southern Ethiopia. (Image sources: commons.wikimedia.org, forecedmigration.org)
Methodology The KAP surveys were designed to measure the overall project goal, as well as one of the
project’s four objectives; the full list of objectives are detailed in the program’s logical framework, in Appendix A. This goal and objective (and their corresponding indicators) that this report will discuss are as follows:
Program Goal/Impact: To test the implementation of a participatory WaSH training program through the SHG network in order to improve personal hygiene behaviors, alleviate the burden of water-borne diseases, and to improve the basic sanitation of individuals in Ethiopia.
Indicator 1: Personal sanitation behaviors

iWa(SHG) Endline Survey Report – March 2016 | 2
Indicator 2: Incidence of diarrheal disease
Indicator 3: SHG members that have latrines
Program Objective 2: SHG members have an increased level of awareness and knowledge of personal WaSH issues
Indicator 2.1: Knowledge of critical hand-washing times
Indicator 2.2: Awareness of disease-transmission and basic hygiene practices
A total of 219 baseline and 210 endline KAP surveys were conducted, representing about 20 percent of the total number of intended direct beneficiaries (1,000 people), and 5 percent of total intended direct and indirect beneficiaries (4,500 people). The survey was conducted using pen-and-paper questionnaires, by a team of enumerators who visited randomly selected households in the program districts. All respondents indicated their consent to participate in the survey after being informed about the survey purpose and their right to decline to participate.
LimitationsMuch of the information gathered through the survey was self-reported: in many cases,
there was no way for the enumerator to verify whether the respondent was telling the truth (e.g., disease incidence, water treatment practices, personal hygiene practices, etc.). In these cases, it is possible that the respondent may have wished to present the “right” answer, rather than the truthful one, due to an (understandable) fear of judgment by the enumerator.
Additionally, English translations for open answers to survey questions (e.g., explanations for selecting “other”) were not available for the endline data. Fortunately, this did not significantly limit analysis.
Summary of Results This section will detail key results of the baseline and endline surveys, with a focus on the program indicators previously outlined. For a detailed depiction of the answers to all of the questions asked in the survey, including disaggregation by gender and rural/urban location (when applicable), see Appendix B.
DemographicInformationaboutSurveyRespondents In both the baseline and endline surveys, the majority of respondents were female (85% and 68% in each respective survey). Most were married (77% and 81%), and between the ages of 18-40 (70% and 68%). About half of the households had between 4-6 people, while a third had 7-9 people, and around 15 percent had 1-3 people; 3 percent of households had over 10 people. Between 77-86 percent of the households said that the male head of household could read, while 55-64 percent said that the female head of household could read.
PersonalSanitation As outlined in the previous section of this report, the first indicator that will help to measure the overall goal of the Wa(SHG) program is “personal sanitation behaviors.” The KAP survey included a number of questions realting to this indicator, regarding water treatment and hand-washing knowledge and practices.

iWa(SHG) Endline Survey Report – March 2016 | 3
WaterTreatmentKnowledgeandPractices As seen in Figure 2, there was a clear increase in the number of respondents who could identify at least one way to treat water. Interestingly, the most-commonly cited method for treating water changed from baseline to endline, with solar disinfection mentioned most commonly in the baseline, and settling mentioned most frequently in the endline (see Appendix B for more details). There was a slight increase in the number of respondents who said that they did something to make their water safer to drink (58% to 64%), though this number is still relatively low.
There was a dramatic decrease in the number of respondents who said that household members always drink untreated water (see Figure 3), indicating that water treatments practices are, in fact, probably increasing. There were no major age or gender differences in the reported frequency of drinking untreated water, but it is still much more common in rural areas (70%) than urban areas (2%). Of respondents who sometimes do not treat their water, this lack of treatment is most likely to occur during the rainy season, or when there is a lack of money (this was more commonly mentioned in the endline survey than the baseline). There was a drastic decrease in the number of respondents who said they did not know how to treat their water (42% to 2%), that they did not have a method to (41% to 3%), or that they forgot (26% to 3%). However, nearly a third of respondents in the endline survey said that they sometimes did not treat their water because of a bad taste or a bad smell.
Hand-WashingKnowledgeandPractices In both the baseline and endline surveys, most respondents named several instances in which they usually wash their hands, including before and after eating, before preparing food, and after handling trash. There was a noticeable increase in those who said they washed their hands after latrine use (as seen in Figure 4); reporting hand-washing after defecation also increased noticeably. Encouragingly, there was also a dramatic increase in the number of respondents who reported washing their hands with soap (36% to 76%), though 31 percent of respondents in rural areas still do not wash their hands with soap.
0%
20%
40%
60%
80%
100%
Female Male Rural Urban
Baseline Endline
Figure 2: Percent of respondents who can identify at least one way to treat water. (Overall: Baseline, 83%; Endline, 95%)
0%
20%
40%
60%
80%
100%
Baseline Endline
Always Sometimes Never
Figure 3: Reported frequency with which household members drink untreated water
0%
20%
40%
60%
80%
100%
Female Male Rural Urban
Baseline Endline
Figure 4: Percent of respondents who say they wash their hands after latrine use. (Overall: Baseline, 59%; Endline, 88%)

iWa(SHG) Endline Survey Report – March 2016 | 4
As seen in Figure 5, there was also a dramatic increase in the number of households that had soap present in a hand-washing area or near their latrine. This data was based on first-hand observation by the survey enumerators, and thus is likely to be even more reliable than the self-reported hygiene behaviors.
For those who said that they don’t wash their hands with soap, the most commonly cited reasons for this were that it’s “not a common practice here,” or “negligence/laziness.”
IncidenceofDiarrhealDisease The second goal-level indicator for the Wa(SHG) program is incidence of diarrheal disease; incidence of malaria will also be discussed briefly, even though it is not a major focus of the program.
There was a decrease in the percent of respondents who reported that a family member had experienced diarrhea in the two weeks proceeding the baseline survey (23%) versus the endline survey (10%), indicating that the Wa(SHG) program activities were indeed successful in achieving their goal. However, there is a possibility that this change is attributable to something other than Wili’s programming, for instance if there were other related interventions occurring in the program region, or if there are normally seasonal fluctuations in diarrheal disease incidence, etc.
There was also an increase in the percentage of respondents who correctly identified causes of diarrhea; interestingly though, there was not much increase in those who mentioned “dirty water” as a cause of diarrhea, and the percentage of those who mentioned dirty water in rural areas actually went down. In the endline survey, knowledge for all causes of diarrhea was higher in urban areas, and was higher among women as compared to male respondents.
Similarly, knowledge regarding prevention of diarrhea increased from baseline to endline, with especially noticeable increases among those who mentioned “wash hands with soap” (45% to 64%) and “treat water” (38% to 55%). However, as with many other indicators, disaggregating these figures by rural versus urban area provides a more nuanced view: while nearly all respondents in urban areas connected hand-washing and water treatment with diarrheal disease, less than half of those in rural areas did so (see Figure 6). Covering food and preparing food properly were also mentioned frequently in the endline survey.
The reported incidence of malaria decreased slightly from baseline to endline (9% to 3%). Knowledge regarding malaria causes and prevention did not change dramatically, although respondents were less likely to name incorrect causes of malaria in the endline survey, and they were slightly more likely to mention eliminating breeding sites and using oil/lotion/herbs on
0%
50%
100%
Baseline Endline
Rural Urban
Figure 5: Soap is present in household. (Overall: Baseline, 23%; Endline, 81%)
57% Decrease in diarrheal
disease incidence
0%
50%
100%
"Washhands
withsoap"
"Treatwater"
Rural Urban
Figure 6: Two named ways of preventing diarrheal disease (from endline survey)

iWa(SHG) Endline Survey Report – March 2016 | 5
skin as prevention measures in the endline survey. Interestingly, as with knowledge regarding diarrhea prevention, female endline survey respondents were more likely to name correct causes and prevention measures for malaria than were male respondents.
LatrineOwnership Unfortunately, both in the baseline and endline surveys, there are inconsistencies in the data relating to latrine ownership. For example, even though 99 percent of endline survey respondents stated that their family owns a latrine, half of the respondents stated that they share a latrine with at least one other family, with many respondents sharing latrines with over seven families. It is possible that respondents still considered a latrine to be under their ownership even if it is shared, but this is not clear.
Additionally, there is variation in the recorded type of latrine owned by respondents: in the baseline survey, 97 percent of respondents in urban areas stated that they had a pit latrine with a slab, while 90 percent of urban respondents in the endline survey reported having a flush or pour flush latrine. This could be due to an error in data entry, or (less likely) due to a very different sampling strategy used in the baseline versus endline survey. Of course, it is also possible (though also not likely) that nearly all households in the urban areas constructed a flush latrine within the last year.
Recommendations While the endline survey shows a similar magnitude of improvement in rural and urban areas, it clearly indicates that the biggest gap in knowledge, practices, and health outcomes remains in the rural areas. Therefore, future programming may wish to focus primarily or exclusively on rural regions.
Additionally, since levels of knowledge relating to hygienic practices and water-borne diseases are consistently higher among women than men, future programming could aim to target men and women equally, rather than placing a heavier focus on women (as is a common practice in many development programs). However, if it is determined that focusing on women would help the program benefits to reach a higher number of people (e.g., children), then focusing on women may in fact be appropriate.
Conclusions Without further information regarding other programming taking place in the region
and other contextual details, it is difficult to definitively state that the positive trends outlined in this report are due to Wili’s Wa(SHG) program. However, this assessment does provide strong evidence that this is probably the case. Not only are Wili’s (probable) program effects diverse—spanning knowledge, practices, and health outcomes—but the magnitude of change is also remarkable, especially given the limited timeframe of the pilot phase. The project team and Wili leadership should be congratulated for a job well done, and should regard their plans for future programming with increased confidence.

iWa(SHG) Endline Survey Report – March 2016 | 6
Appendix A: Program Logical Framework
Objectives Indicators Evidence RisksorAssumptions
Goal/Impact
Totesttheimplementationof
aparticipatoryWaSHtraining
programthroughtheSHG
networkinordertoimprove
personalhygienebehaviors,
alleviatetheburdenofwater-
bornediseases,andto
improvethebasicsanitationof
individualsinEthiopia
• Personalsanitationbehaviors
• Incidenceofdiarrhealdisease
• SHGmembersthat
havelatrines
KAPSurvey
Purpose(s)/Outcome(s)
1. Improvedfacilitationskills
andcapacityof12FLFsand
membersof12CLA
members
1.1 Individualperformanceduring
program
implementation
ProgramRecords
• Discovery/participatory
learningmodelwillbemore
effectivethandidactic
learningmodel
• FLFsandCLAmemberswill
beeffectivefacilitators
2. SHGmembershavean
increasedlevelof
awarenessandknowledge
ofpersonalWaSHissues
2.1 Knowledgeofcriticalhandwashingtimes
2.2 Awarenessofdiseasetransmissionand
basichygiene
practices
KAPSurvey,
ParticipantSurveys,
FacilitatorReflections
• SHGmemberswanttolearn
aboutWaSH
• SHGmembersconsistently
attendgroupmeetingsand
receivetrainings
3. SHGmemberstake
meaningfulactionto
improvetheWaSH
conditionoftheirfamilies,
homes,andcommunities
3.1 Presenceoftippy-tapsinhomes
3.2 Presenceofsoap3.3 Presenceoflatrines
inhomes
3.4 Changeinpersonalsanitationand
hygienebehaviors
IndividualActions
Plans,Participant
Surveys
• SHGmembersare
empoweredwithintheir
householdtotakeaction
• SHGmembershaveaccessto
financialresourcestomake
changes
4. Bio-sandfiltersarelocallyavailableandpurchasedby
SHGmembers
4.1PresenceofBSFsin
homes
4.2Intentiontopurchase
BSF
BSFM&E,Individual
ActionPlans
• SHGmembersareinterested
inbuyingabio-sandfilter
• SHGmembershavethe
financialresourcestobuybio-
sandfilters

iWa(SHG) Endline Survey Report – March 2016 | 7
Outputs
1. TwelveFLFsandtwelveCLAmembersare
trainedinparticipatory
facilitationskills
Certificatein
Foundational
FacilitationSkills
ProgramRecords
Participantswillbeinterested
andcompletetheentire
course
2. OnethousandSHGmembersaresupported
andtrainedinWaSH
Awarenessand
implementingactions
plans
Attendanceatweekly
trainings
DesiretolearnWaSH
Awareness
Completedand
implementedAction
Plans
WeeklyAttendance
Sheets,Participant
Surveys,Facilitator
Reflections,Individual
ActionPlans
Water-bornediseasesarea
healthburden
Sanitationandhygiene
resources(eg.Soap,bottles,
chlorinestabs,etc.)locally
availableandaffordable
IndividualsandSHGshavethe
capacitytotakecommunity
action(eg.Buildinglatrines)
3. Twolocallyestablishedbio-sandfilter
manufacturersserving
thecommunitiesand
SHGs
Presenceofbio-sand
filtermanufacturing
shop
Salesrecord
BSFM&E,Individual
ActionPlans
SHGmembershavethe
financialresourcestobuy
bio-sandfilters
Materialsnecessaryfor
manufacturinglocally
availableandaffordable
4. Programsuccessfully
monitoredand
evaluatedinamanner
thatpromotes
excellenceandlearning
Baselineandterminal
KAPsurveyreport
Weeklymonitoring
bookletskeptand
completed
KAPSurvey,
Monitoringmaterials

iWa(SHG) Endline Survey Report – March 2016 | 8
Activities
Output1
1. DevelopandproduceaFoundational
FacilitationSkillsmodule
2. Providethetrainingmoduleto12identified
FLFsand12CLArepresentatives
Output2
1. AdaptWaSHAwarenesstrainingcurriculumto
theSHGcontextandproducematerials
2. Identify12FLFsand12CLArepresentativesto
betrained
3. Train12FLFsinToTofWaSHcurriculum,
buildingonthefoundationalfacilitationskills
training
4. SupportthetrainingofCLAmembersinWaSH
curriculum
5. SupportthetrainingofSHGmembersin
WaSHcurriculum
6. Tracktheestablishmentandimplementation
ofActionPlans
Output3
1. Identifyandcapacitatetwolocal
manufacturerstoproducebio-sandfilters
2. Includehouseholdwatertreatmentoptions,
includingbio-sandfilters,inWaSHcurriculum
Output4
1. Designmonitoringandevaluationtoolsand
formats
2. TranslatematerialstoAmharic
3. Trainprogramstaffonmonitoringplan
4. ConductbaselineandterminalKAPsurveys
5. Analyzemonitoringandevaluationdata
NecessaryresourcesavailableinEthiopia
FLFsandCLAmembersschedulesaccommodatea
multipledaytraining
NecessaryresourcesavailableinEthiopia
ProperpermissionsallowforeditingofWaSH
Awarenessmaterials
StronglyestablishedCLAsexistintargetarea
FLFshavetimetoreceivethistraining
FLFshavetimetogivetrainingtoCLAmembers
CLAmembershavetimetogivetrainingtoSHGsover
aperiodof12weeks
Effectivemonitoringsystemestablished
Localmanufacturerwillwanttolearnanewskilland
committodevelopinganewbusiness
NecessaryresourcesavailableinEthiopia
Monitoringformatsarepracticalforintended
purposes
Staffmakestimetodoregularmonitoring

iWa(SHG) Endline Survey Report – March 2016 | 9
Appendix B: Complete Baseline and Endline Survey Data
HouseholdDemographicsBaseline Endline
Total(n=219)
Female(n=186)
Male(n=33)
Rural(n=129)
Urban(n=90)
Total(n=210)
Female(n=158)
Male(n=44)
Rural(n=140)
Urban(n=70)
Genderoftherespondent Female 85% 78% Male 15% 22% Whatisyourmaritalstatus? Single 9% 7% Married 77% 81% Separated/Divorced 4% 2% Widow/er 10% 9% Howoldareyounow?(average) 37 36 Agebracketoftherespondent 12-17 3% 2% 18-40 70% 68% 41-59 20% 25% 60+ 7% 5% Whoistherespondent?(relationshipwithinthehousehold)
Wife 80% 72% Husband 13% 20% Daughter 3% 4% Son 2% 4% Grandparent 1% 0% Other 1% 0% Howmanypeoplearelivinginthehousehold?(average)
1-3 15% 16% 4-6 51% 49% 7-9 31% 32% 10-12 3% 2% Maleheadofhouseholdcanread 77% 70% 94% 86% 84% 91%Femaleheadofhouseholdcanread 55% 36% 82% 64% 56% 82%

iWa(SHG) Endline Survey Report – March 2016 | 10
HouseholdWaterSupplyandPracticesBaseline Endline
Total(n=219)
Female(n=186)
Male(n=33)
Rural(n=129)
Urban(n=90)
Total(n=210)
Female(n=158)
Male(n=44)
Rural(n=140)
Urban(n=70)
Whousuallycollectswaterforthefamily?
Adultwomen 41% 55% 21% 56% 69% 30%Girls 33% 34% 32% 34% 27% 48%Boys 13% 5% 23% 7% 2% 16%Adultmen 7% 3% 12% 3% 2% 6%Delivered 4% 1% 8% 0% 0% 0%Other 2% 2% 3% 0% 0% 0%Distancebetweendwellingandsourceofdrinkingwater
Within500m 58% 27% 95% 77% 66% 98%500m-1km 22% 36% 5% 18% 26% 1%1km-3km 11% 21% 0% 5% 8% 0%Morethan3km 9% 17% 0% 0% 0% 0%Minutesspentcollectingwater(round-trip)
Under30 53% 24% 94% 71% 57% 99%30mins-1hour 13% 18% 5% 17% 25% 1%1-2hours 21% 36% 0% 7% 10% 0%
2+hours 13% 22% 1% 5% 8% 0%
HouseholdWaterTreatmentandStorage
Baseline EndlineTotal
(n=219)Female(n=186)
Male(n=33)
Rural(n=129)
Urban(n=90)
Total(n=210)
Female(n=158)
Male(n=44)
Rural(n=140)
Urban(n=70)
Numberoflargejerrycanscollectedeachdayforentirehousehold
1 1% 1% 2 39% 42% 3-4 29% 35% 4+ 31% 22%

iWa(SHG) Endline Survey Report – March 2016 | 11
Namedwaysofmakingwatersafer Solardisinfection 36% 16% Boiling 35% 51% Settling 23% 61% Liquidchlorine 20% 46% Other 19% 14% Clothfilter 16% 34% None 16% 1% Chlorinetablets 13% 38% Ceramicfilter 8% 9% Membranefilter 7% 22% Bio-sandfilter 1% 12% Coagulant/flocculent 0% 7% Canidentifyatleastonewaytotreatwater 83% 82% 84% 71% 99% 95% 96% 91% 92% 100%
Respondentgavepermissionforenumeratortoobservethemgettingacupofdrinkingwaternormallyservedtochildren
Yes 96% 97% No 3% 2% Didn'thave 1% 1% (Observed)Samplewascollectedsafely 63% 62% 65% 57% 70% 83% 81% 86% 74% 100%Sourceofwatersample Publicstandpipe 61% 72% 44% 69% 91% 27%Pipedconnectiontohh 19% 6% 38% 28% 3% 73%Protecteddugwell 8% 13% 0% 0% 0% 0%Borehole 2% 4% 0% 1% 2% 0%Bottledwater 2% 3% 1% 1% 1% 0%Rainwater 2% 1% 0% 0% 0% 0%Protectedspring 1% 0% 1% 0% 0% 0%Tanker 1% 0% 1% 0% 0% 0%Unprotecteddugwell 0% 0% 0% 0% 0% 0%Unprotectedspring 0% 0% 0% 0% 0% 0%

iWa(SHG) Endline Survey Report – March 2016 | 12
Other 16% 0% 16% 2% 3% 0%(Observed)Watercontainerwascovered/closed 81% 95%
(Observed)Watercontainerwasclean 67% 87% (Observed)Watercontainerwasoutofreachofanimals 68% 87%
Waterwascollectedsafely(nohands)andwasstoredinacontainerthatwasclean,covered,andoutofreachofanimals
44% 31% 62% 75% 65% 96%
(Observed)Typeofcontainerused Jerrycanwithlid 74% 90% Jerrycan 18% 4% Bucket 3% 1% Gallonjug 2% 1% Ceramicpot 1% 1% Bucketwithtap 1% 4% Largedrum 0% Other 0% Respondentsaidtheydidsomethingtomakewatersafertodrink
Yes 58% 64% No 35% 35% Donotknow 7% 1% Howrespondentsaystheymadewatersafertodrink(onlyrespondentswhoresponded"yes"topreviousquestion)
Solardisinfection 33% 8% Boiling 22% 13% Settling 19% 26% Chlorinetablets 11% 11% Liquidchlorine 6% 22% Other 3% 1% Ceramicfilter 3% 1% Membranefilter 2% 3%
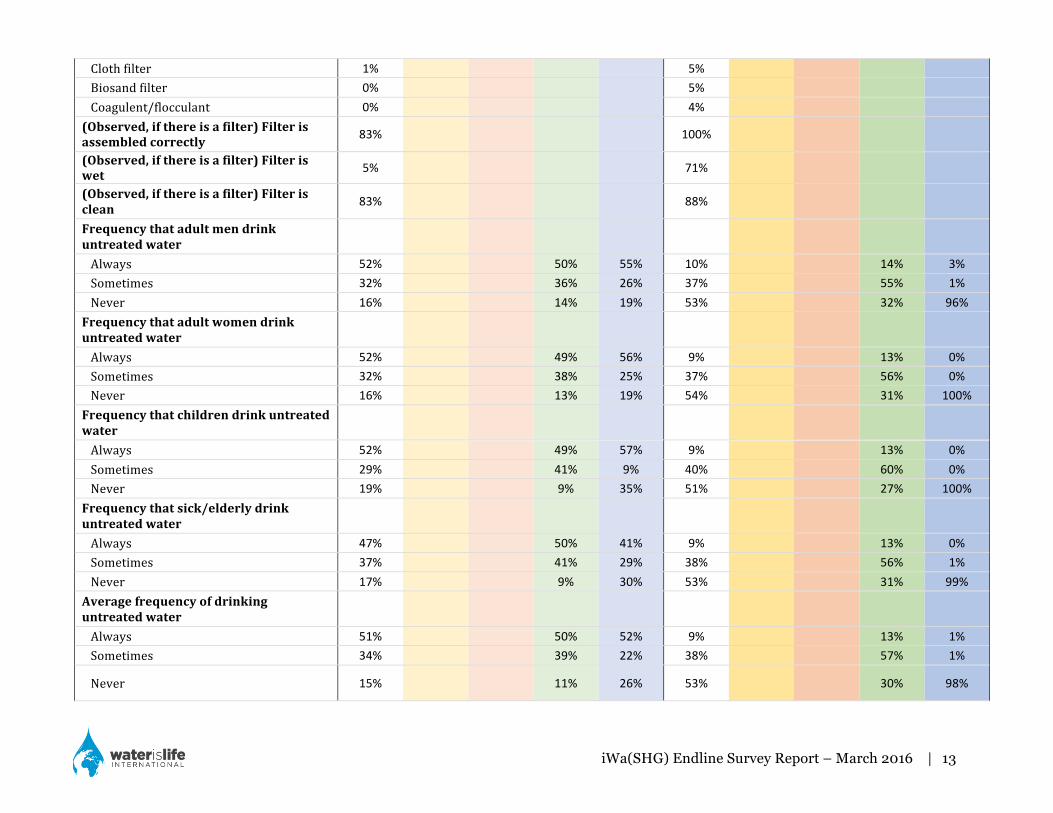
iWa(SHG) Endline Survey Report – March 2016 | 13
Clothfilter 1% 5% Biosandfilter 0% 5% Coagulent/flocculant 0% 4% (Observed,ifthereisafilter)Filterisassembledcorrectly 83% 100%
(Observed,ifthereisafilter)Filteriswet 5% 71%
(Observed,ifthereisafilter)Filterisclean 83% 88%
Frequencythatadultmendrinkuntreatedwater
Always 52% 50% 55% 10% 14% 3%Sometimes 32% 36% 26% 37% 55% 1%Never 16% 14% 19% 53% 32% 96%Frequencythatadultwomendrinkuntreatedwater
Always 52% 49% 56% 9% 13% 0%Sometimes 32% 38% 25% 37% 56% 0%Never 16% 13% 19% 54% 31% 100%Frequencythatchildrendrinkuntreatedwater
Always 52% 49% 57% 9% 13% 0%Sometimes 29% 41% 9% 40% 60% 0%Never 19% 9% 35% 51% 27% 100%Frequencythatsick/elderlydrinkuntreatedwater
Always 47% 50% 41% 9% 13% 0%Sometimes 37% 41% 29% 38% 56% 1%Never 17% 9% 30% 53% 31% 99%Averagefrequencyofdrinkinguntreatedwater
Always 51% 50% 52% 9% 13% 1%Sometimes 34% 39% 22% 38% 57% 1%
Never 15% 11% 26% 53% 30% 98%

iWa(SHG) Endline Survey Report – March 2016 | 14
Whenrespondentsaystheydonottreatwater(multipleanswersallowed)
Rainyseason 28% 43% 7% 24% 32% 9%Never 22% 5% 48% Other 19% 15% 21% 12% 14% 9%Dryseason 16% 16% 17% 15% 19% 7%Respondentalwaystreatswater 16% 13% 28% 23% 4% 42% 45% 30% 28% 71%Whennotime 9% 4% 17% 1% 0% 3%Whennomoney 2% 2% 2% 18% 16% 20%Reasonsrespondentgivesfornottreatingwater(multipleanswersallowed)
Doesnotknowhow 42% 44% 34% 7% 50% 2% 1% 5% 3% 0%Donothaveamethodto 41% 3% Forgot 26% 6% Badtaste 16% 34% Other 12% 28% Badsmell 12% 31% Thinkswaterisclean 8% * Requirestoomuchmoney 8% 1% Requirestoomuchtime 5% 1% Broken 1% 0% Reasonsrespondentgivesfortreatingwater(multipleanswersallowed)
Preventsdisease 75% 87% Makeswatersafe 69% 81% Other 17% 3% Free 2% 0% Someonetoldmeto 1% 2%

iWa(SHG) Endline Survey Report – March 2016 | 15
SanitationPracticesBaseline Endline
Total(n=219)
Female(n=186)
Male(n=33)
Rural(n=129)
Urban(n=90)
Total(n=210)
Female(n=158)
Male(n=44)
Rural(n=140)
Urban(n=70)
Familyownslatrine 98% 99% Whohelpedconstructlatrine Self 68% 65% Localauthority/Gov't 27% 25% NGO 3% 16% SHG 1% 2% Other 1% 1% Typeoflatrine Pitlatrinewithslab 70% 51% 97% 48% 67% 9%Pitlatrinewithoutslab 28% 48% 1% 20% 29% 0%Flush/pourflush 1% 2% 0% 30% 1% 90%Composting 1% 0% 1% 1% 1% 1%Latrinedrainingtocanal/creek/river 1% 0% 1% 1% 1% 0%Other 0% 0% 0% 1% 0% 0%Distancebetweenlatrineandhouse Lessthan50m 88% 82% 97% 92% 87% 100%Morethan50m 12% 18% 3% 8% 13% 0%Numberoffamiliessharinglatrine(ifnolatrineinhousehold)
2-4 32% 31% 33% 36% 21% 45%5-7 28% 52% 19% 27% 36% 22%7+ 40% 17% 49% 37% 46% 33%Wherefamilymembersgofordefecation(ifnolatrine)
Publiclatrine 37% 41% Creek/canal/river 32% 0% Neighbor'slatrine 11% 0% Other 11% 45% Plasticbag 5% 0% Digahole,bush/backyard/field 5% 14%

iWa(SHG) Endline Survey Report – March 2016 | 16
Mainreasonwhyfamilycannotconstructalatrine(ifnolatrine)
Notapriority 56% 0% Defecationisnotanissue 17% 6% Other 17% 83% Tooexpensive 6% 6% Alotofspacetodefecatehere 6% 0% Nospaceforconstruction 0% 6%
DiseaseMorbidity/MortalityandManagement
Baseline EndlineTotal
(n=219)Female(n=186)
Male(n=33)
Rural(n=129)
Urban(n=90)
Total(n=210)
Female(n=158)
Male(n=44)
Rural(n=140)
Urban(n=70)
Someoneinfamilyhashaddiarrheainlasttwoweeks
23% 35% 7% 10% 13% 2%
Ageoffamilymemberwhohaddiarrhea 0-5yearsold 17% 25% 6-17yearsold 31% 25% 18-59yearsold 42% 50% 60+yearsold 10% 0% Someoneinhhdiedwithinlast6monthsduetodiarrhea
2% 3% 0% 1% 1% 0%
Ageofmemberofhhwhodied 0-5yearsold 0% 0% 6-17yearsold 25% 100% 18-59yearsold 75% 0% 60+yearsold 0% 0% Causesofdiarrheanamedbyrespondents(multipleanswersallowed)
Dirtyfood 60% 63% 47% 41% 38% 76% 76% 73% 67% 94%Dirtywater 59% 60% 53% 57% 63% 64% 66% 59% 50% 92%Poorhygiene 48% 49% 41% 44% 54% 64% 68% 48% 57% 77%Flies 47% 45% 56% 40% 57% 70% 68% 70% 62% 84%

iWa(SHG) Endline Survey Report – March 2016 | 17
Germs 43% 42% 47% 43% 43% 50% 54% 30% 31% 89%Dirtyhands 39% 38% 47% 34% 47% 56% 58% 41% 41% 87%Opendefecation 21% 22% 16% 18% 26% 45% 49% 32% 26% 81%Other 6% 6% 6% 9% 2% 3% 4% 0% 5% 0%Rain 5% 3% 16% 9% 0% 7% 8% 2% 4% 14%Partofchild'sgrowth 2% 2% 3% 2% 2% 5% 4% 5% 2% 11%Witchcraft 0% 0% 0% 0% 0% 1% 1% 0% 0% 1%Donotknow 0% 0% 0% 0% 0% 0% 0% 0% 0% 0%Respondentcorrectlyidentifiesatleastonecauseofdiarrhea(dirtyfood,dirtywater,flies,germs,dirtyhands,oropendefecation)
92% 92% 91% 89% 96% 98% 98% 98% 97% 100%
Waysofpreventingdiarrheanamedbyrespondents(multipleanswersallowed)
Coverfood 58% 54% 75% 60% 54% 71% 75% 52% 57% 99%Drinkcleanwater 55% 54% 59% 53% 57% 74% 78% 57% 65% 93%Washhandswithsoap 45% 47% 34% 28% 69% 64% 66% 52% 46% 99%Latrineuse 44% 40% 66% 47% 40% 73% 71% 80% 68% 84%Preparefoodproperly(cooking,washing) 42% 42% 44% 36% 50% 51% 54% 34% 30% 94%Treatwater 38% 35% 56% 42% 33% 55% 55% 48% 36% 94%Storewatersafely 38% 40% 28% 21% 63% 60% 66% 36% 41% 99%Noopendefecation 30% 31% 25% 22% 41% 54% 58% 34% 34% 94%Prayer 12% 12% 16% 14% 10% 3% 4% 0% 2% 4%Gototraditionalhealer 8% 8% 13% 12% 2% 2% 2% 0% 1% 3%Other 7% 8% 3% 10% 2% 1% 2% 0% 2% 0%Donotknow 1% 1% 3% 2% 0% 1% 1% 3% 2% 0%Respondentcorrectlyidentifiesatleastonewayofpreventingdiarrhea(coverfood,drinkcleanwater,washhandswithsoap,latrineuse,preparefoodproperly,treatwater,storewatersafely,noopendefecation)
98% 97% 100% 96% 100% 99% 98% 100% 98% 100%
Someoneinfamilyhashadmalariainlasttwoweeks
9% 2% 19% 3% 2% 3%

iWa(SHG) Endline Survey Report – March 2016 | 18
Ageoffamilymemberwhohadmalaria 0-5yearsold 16% 25% 6-17yearsold 37% 50% 18-59yearsold 42% 25% 60+yearsold 5% 0% Someoneinfamilydiedwithinlast6monthsduetomalaria
0% 1% 1% 0%
Ageofhhmemberwhodiedduetomalaria
0-5yearsold 0% 0% 6-17yearsold 100% 0% 18-59yearsold 0% 100% 60+yearsold 0% 0% Causesofmalarianamedbyrespondents(multipleanswersallowed)
Mosquitobites 78% 78% 78% 87% 64% 87% 92% 77% 88% 86%Dirtywater 44% 48% 25% 22% 74% 27% 31% 11% 9% 63%Rain/water 21% 18% 41% 35% 1% 9% 9% 5% 4% 19%Sunshine 17% 18% 13% 10% 27% 15% 18% 5% 1% 43%Dirtyfood 17% 20% 3% 7% 32% 15% 18% 5% 2% 41%Flies 14% 16% 6% 8% 23% 23% 21% 30% 19% 31%Bush/grasses 12% 13% 6% 6% 21% 26% 32% 7% 9% 60%Other 12% 12% 9% 14% 9% 2% 3% 0% 4% 0%Witchcraft 1% 2% 0% 0% 3% 0% 0% 0% 0% 0%Waysofpreventingmalarianamedbyrespondents(multipleanswersallowed)
Useofbednets 89% 88% 97% 88% 91% 90% 92% 80% 89% 91%Eliminatemosquitobreedingsite 72% 72% 75% 77% 64% 85% 91% 66% 88% 86%Useofsmoke 39% 38% 44% 35% 44% 26% 27% 25% 27% 24%Properhygiene 37% 38% 28% 26% 52% 39% 40% 25% 22% 71%Nottakingdirtywater/food 27% 31% 6% 16% 44% 19% 22% 2% 3% 51%Other 6% 7% 3% 10% 1% 4% 4% 2% 6% 0%Useoil/lotion/herbsonskin 1% 1% 0% 0% 3% 10% 11% 5% 0% 30%

iWa(SHG) Endline Survey Report – March 2016 | 19
Stopwitchcraft 0% 1% 0% 1% 0% 1% 1% 0% 0% 3%Respondentcorrectlyidentifiesatleastwayofpreventingmalaria(usingbednet,eliminatingbreedingsites,useofsmoke,usingoil/lotion/herbsonskin)
95% 95% 97% 93% 98% 95% 97% 84% 94% 97%
Hand-washingPracticesBaseline Endline
Total(n=219)
Female(n=186)
Male(n=33)
Rural(n=129)
Urban(n=90)
Total(n=210)
Female(n=158)
Male(n=44)
Rural(n=140)
Urban(n=70)
Timesthatrespondentssaytheyusuallywashhands
Beforeeating 97% 97% 94% 95% 100% 90% 91% 84% 86% 99%Aftereating 88% 89% 84% 80% 100% 68% 72% 50% 54% 97%Beforefoodpreparation 79% 82% 59% 80% 82% 78% 83% 55% 69% 93%Afterhandlingtrash 63% 63% 63% 64% 62% 65% 70% 41% 55% 84%Afterlatrineuse 59% 56% 75% 61% 57% 88% 88% 84% 82% 99%Afterdefecation 39% 35% 59% 46% 29% 60% 63% 43% 43% 94%Beforefeedingchild 31% 30% 34% 31% 30% 47% 49% 34% 31% 0%Afterhandlinganimals 19% 19% 13% 28% 6% 31% 31% 25% 20% 54%Afterhandlingbaby'sdiaper/feces 13% 12% 19% 12% 14% 37% 39% 20% 19% 74%Other 5% 5% 3% 7% 1% 6% 7% 5% 9% 0%Whatrespondentssaytheyusuallyusewhenwashinghands
Wateronly 61% 66% 32% 58% 66% 10% 12% 7% 15% 1%Waterandsoap 36% 32% 58% 37% 34% 76% 75% 80% 69% 91%Waterandash 3% 2% 10% 6% 0% 13% 13% 12% 16% 7%Waterandsand/leaves 0% 0% 0% 0% 0% 0% 0% 0% 0% 0%Other 0% 0% 0% 0% 0% 0% 0% 0% 0% 0%Mainfactorthatpreventsfamilyfromusingsoap(onlyrespondentswhosaidtheydon'tusesoap)
Notacommonpracticehere 44% 45% 30% 41% 48% 27% 30% 18% 32% 0%Negligence/laziness 30% 30% 30% 25% 36% 40% 38% 55% 45% 13%

iWa(SHG) Endline Survey Report – March 2016 | 20
Tooexpensive 8% 6% 30% 14% 0% 13% 15% 9% 14% 13%Wateralonecleansesthehands 8% 9% 0% 3% 16% 0% 0% 0% 0% 0%Other 5% 5% 0% 8% 0% 17% 15% 18% 9% 63%Takestime 5% 4% 10% 8% 0% 2% 3% 0% 0% 13%(Observed)Househasahand-washingfacility
No 61% 65% 57% 16% 22% 2%Waterandsoapathand-washingarea 16% 13% 20% 40% 36% 48%Onlywater(nosoap)athand-washingarea 12% 14% 9% 2% 1% 3%
Waterandsoapinornearlatrine 7% 4% 11% 41% 38% 47%Onlywater(nosoap)inornearlatrine 4% 4% 3% 2% 1% 0%Soapispresentinhousehold(waterandsoapathand-washingareaornearlatrine)
23% 17% 31% 81% 74% 95%

iWa(SHG) Endline Survey Report – March 2016 | 21
Appendix C: Survey Instrument (Questionnaire)
SuSurvey
PostOfficeBox540318|Orlando,FL32854|407.716.4214|www.waterIslifeinternational.org
KAPSurveyonWaSHandHouseholdWaterTreatmentMethods
INFORMEDCONSENT
Goodmorning/goodafternoon.Mynameis__________________.Iampartofateamofpeoplewhoareassessingwaterpracticesinyourcommunity.Ourteamwillbeinterviewingdifferenthouseholdsinyourarea.Yourlocalleadershavegranteduspermissiontoconductthisstudy,andyourhousehasbeenrandomlyselectedtoparticipate.Youhavebeenaskedtoparticipateinthisstudybecauseyourpersonalviewsandexperiencesasacommunitymemberareimportanttous.Ifyouparticipate,Iwillaskyouquestionsaboutyourdrinkingwaterandwaterusehabits.Theinterviewwilltakeapproximately30minutes.Nooneexceptmewillknowthatitwasyouwhoansweredthesequestions.Wouldyouliketoparticipate?
A Interviewer B SurveyNumber C Date D Time E Location(Woreda,Kebele,SubCity,Village) Section1:HOUSEHOLDDEMOGRAPHICS
1. Genderoftherespondent 1[]Female 2[]Male2. Whatisyourmaritalstatus? 1[]Single 2[]Married
3[]Separated/Divorced 4[]Widow/er3. Howoldareyounow? ________years4. Agebracketoftherespondent 1[]12-17yo 2[]18-40yo
3[]41-59yo 4[]60yoandabove5. Whoistherespondent?(relationshipwithin
thehousehold)1[]Wife 2[]Husband3[]Daughter 4[]Son5[]Grandparent 6[]Other:
6. Howmanypeoplearelivinginthehousehold? ________people
AgeBracket Male Female Total7. 0–5yearsold 8. 6–17yearsold 9. 18–59yearsold 10. 60+yearsold 11. Canthemaleheadofhouseholdread? 1[]Yes 2[]No12. Canthefemaleheadofhouseholdread? 1[]Yes 2[]No13. Whatisyoureducationalbackground? 1[]Can’tread/write 2[]1–6years
3[]7–9years 4[]10–12years5[]Collegeandabove
Section2:HOUSEHOLDWATERSUPPLYANDPRACTICES
14. Whousuallycollectswaterforthefamily? 1[]Adultmen 2[]Boys 3[]Delivered4[]Adultwomen 5[]Girls 6[]Other:
15. Howfarfromyourdwellingisthesourceof 1[]within500m 2[]500m–1km

iWa(SHG) Endline Survey Report – March 2016 | 22
SuSurvey
PostOfficeBox540318|Orlando,FL32854|407.716.4214|www.waterIslifeinternational.org
yourdrinkingwater? 3[]1km–3km 4[]Morethan3km16. Howmanyminutesdoyouspendcollecting
waterfromthesource(round-trip)?1[]within30mins 2[]30mins–1hour3[]1hour–2hours 4[]Morethan2hours
17. Howmanylargejerrycansofwaterarecollectedeachdayfortheentirehousehold?(Jerrycan=20L)
1[]1jerrycan 2[]2jerrycans2[]3–4jerrycans 4[]morethan4jerry
cansSection3:HOUSEHOLDWATERTREATMENTANDSTORAGE
18. Canyoutellmeallthewaysyouknowtomakewatersafetodrinkinyourhome?(Multipleanswer,ask“Anyothers?”)
1[]Boiling 2[]Settling 3[]Solardisinfection
4[]Chlorinetablets
5[]Membranefilter
6[]Ceramicfilter
7[]LiquidChlorine
8[]Biosandfilter
9[]Coagulant/flocculent
10[]Clothfilter 11[]None 12[]Other:19. MayIobserveyougivingmeacupofyour
currentdrinkingwaterforchildrenfromthishousehold?
1[]Yes 2[]No3[]Donothave
20. OBSERVE:Wassamplecollectedsafely(nottouchingwaterwithhands)?
1[]Yes 2[]No
21. Whatsourcedidthiswatercomefrom? 1[]Pipedconnectioninhh
2[]Publicstandpipe
3[]Protecteddugwell
4[]Borehole 5[]Rainwater 6[]Tanker7[]Protectedspring
8[]Unprotecteddugwell
9[]Bottledwater
10[]Unprotectedspring
11[]Other:
22. OBSERVE:Isthecontainercovered/closed? 1[]Yes 2[]No23. OBSERVE:Isthecontainerclean? 1[]Yes 2[]No24. OBSERVE:Isthecontaineroutofreachof
animals?1[]Yes 2[]No
25. OBSERVE:Whatcontainerisusedfordrinkingwater?
1[]Bucket 2[]Jerrycan3[]Jerrycanwithlid 4[]Gallonjug5[]Bucketwithtap 6[]Ceramicpot7[]Largedrum 8[]Other:
26. Didyoudoanythingtomakethewatersafertodrink?
1[]Yes 2[]No(ifNO,proceedtoQ31)3[]Donotknow
27. Howdidyoumakethiswatersafertodrink? 1[]Boiling 2[]Settling 3[]Solardisinfection
4[]Chlorinetablets
5[]Membranefilter
6[]Ceramicfilter
7[]LiquidChlorine
8[]Biosandfilter
9[]Coagulant/flocculent
10[]Clothfilter 11[]Other:28. Iffilter,OBSERVE:isthefilterassembled
correctly?1[]Yes 2[]No
29. Iffilter,OBSERVE:isthefilterwet? 1[]Yes 2[]No

iWa(SHG) Endline Survey Report – March 2016 | 23
SuSurvey
PostOfficeBox540318|Orlando,FL32854|407.716.4214|www.waterIslifeinternational.org
30. Iffilter,OBSERVE:isthefilterclean? 1[]Yes 2[]No Howoftendo: 31. -adultmendrinkuntreatedwater? 1[]Always 2[]Sometimes 3[]Never32. -adultwomendrinkuntreatedwater? 1[]Always 2[]Sometimes 3[]Never33. -childrendrinkuntreatedwater? 1[]Always 2[]Sometimes 3[]Never34. -sick/elderlydrinkuntreatedwater? 1[]Always 2[]Sometimes 3[]Never35. WhendoyouNOTtreatyourwater?
(multipleanswersallowed)1[]Dryseason 2[]Rainyseason 3[]Whenno
money4[]Whennotime
5[]Ialwaystreatwater
6[]Other:
36. WhydoyouNOTtreatyourwater?(multipleanswersallowed)
1[]Badtaste 2[]Badsmell 3[]Forgot4[]Requirestoomuchmoney
5[]Donotknowhow
6[]Takestoomuchtime
7[]Broken 8[]Donothaveamethodto
9[]Other:
37. Whydoyoutreatyourwater?(multipleanswersallowed)
1[]Makeswatersafe
2[]Preventsdisease
3[]Someonetoldmeto
4[]Free 5[]Other:Section4:SANITATIONPRACTICES
38. Doesyourfamilyownalatrine? 1[]Yes 2[]No(ifNO,proceedtoQ42)39. IfYES,whohelpedyouconstructthelatrine? 1[]Self 2[]Localauthority/Govt
3[]NGO 4[]SHG5[]Other:
40. IfYES,whichtypeoflatrinedoyouhave? 1[]Flush/pourflush 2[]Compostinglatrine3[]Pitlatrinewithslab 4[]Pitlatrinewithoutslab5[]Latrinedrainingtocanal/creek/river
6[]Other:
41. IfYES,howfaristhelatrinefromyourhouse?(Then,proceedtoQ45)
1[]Within50meters
2[]Morethan50meters
42. Ifsharinglatrinewithothers,howmanyfamiliesaresharing?
1[]2-4families 2[]5-7families3[]Morethan7families
43. IfNOlatrine,wheredoyourfamilymembersgofordefecation?(Ticktheonethatthefamilyusuallypractices)
1[]Neighbor’slatrine 2[]Publiclatrine3[]Plasticbag 4[]Digahole4[]Bush/backyard/field 5[]Creek/canal/river6[]Other:
44. IfNOlatrine,whatcouldbetheMAINreasonwhyyourfamilycannotconstructalatrine?(Ticktheonemainreason)
1[]Tooexpensive 2[]Notapriority3[]Nospaceforconstruction
4[]Alotofspacetodefecatehere
5[]Defecationisnotanissue
6[]Other:
Section5:DISEASEMORBIDITY/MORTALITYANDMANAGEMENT
45. Inthelast2weeks,hasanyoneinyourfamilyhaddiarrhea?(Notethatdiarrheaisdefinedasthepassingofstool3timesormorein24hourswhetheritiswatery,bloody,mucoid,orwater-
1[]Yes 2[]No(Ifno,gostraighttoQ47)

iWa(SHG) Endline Survey Report – March 2016 | 24
SuSurvey
PostOfficeBox540318|Orlando,FL32854|407.716.4214|www.waterIslifeinternational.org
washlike)46. IfYES,howoldisthefamilymemberwhohad
diarrhea?___________1[]0-5yearsold 2[]6-17yearsold3[]18-59yearsold 4[]60andabove
47. Hasanyoneinyourhouseholddiedduetodiarrheaforthelast6months?
1[]Yes 2[]No(Ifno,proceedtoQ49)
48. IfYES,howoldwasthatmemberofthehousehold?__________
1[]0-5yearsold 2[]6-17yearsold3[]18-59yearsold 4[]60andabove
49. Whatdoyouthinkcanbethecauseofdiarrhea?(Tickallthattherespondentmentionsbutdonotinfluencehis/herresponse)
1[]Rain 2[]Dirtyhands 3[]Witchcraft4[]Flies 5[]Dirtyfood 6[]Dirtywater7[]Germs 8[]Partof
child’sgrowth9[]Poorhygiene
10[]Opendefecation
11[]Donotknow
12[]Other:
50. Howdoyouthinkdiarrheacanbeprevented?(Tickallthattherespondentmentionsbutneverinfluencehis/herresponses)
1[]Prayer 2[]Latrineuse 3[]Treatwater4[]Donotknow
5[]Coveringfood
6[]Drinkcleanwater
7[]Noopendefecation
8[]Storewatersafely
9[]Washhandswithsoap
10[]Preparefoodproperly(cooking,washing)
11[]Gototraditionalhealer
12:Other:
51. Inthelast2weeks,hasanyoneinyourfamilyhadmalaria?
1[]Yes 2[]No(Ifno,gostraighttoQ53)
52. IfYES,howoldisthefamilymemberwhohadmalaria?___________
1[]0-5yearsold 2[]6-17yearsold3[]18-59yearsold 4[]60andabove
53. Hasanyoneinyourhouseholddiedduetomalariaforthelast6months?
1[]Yes 2[]No(Ifno,proceedtoQ55)
54. IfYES,howoldwasthatmemberofthehousehold?__________
1[]0-5yearsold 2[]6-17yearsold3[]18-59yearsold 4[]60andabove
55. Whatdoyouthinkisthecauseofmalaria?(Tickallthattherespondentmentionsbutdonotinfluence)
1[]Rain/water 2[]Sunshine 3[]Witchcraft4[]Flies 5[]Dirtyfood 6[]Dirtywater7[]Mosquitobites
8[]Bush/grasses
9[]Other:
56. Whatdoyouthinkisthebestwaytoprotectyourselffrommalaria?(Tickallthattherespondentmentionsbutneverinfluencehis/herresponses)
1[]Properhygiene
2[]Useofsmoke
3[]Stopwitchcraft
4[]Useoil/lotion/herbsonskin
5[]Nottakingdirtywater/food
6[]Eliminatemosquitobreedingsite
7[]Useofbednets
8[]Other:
Section6:HANDWASHINGPRACTICES
57. Pleasetellmethetimesyouusuallywashyourhands?(ONLYtickwhattherespondentsays.)
1[]Beforeeating
2[]Afterlatrineuse
3[]Beforefeedingchild
4[]Aftereating 5[]Afterdefecation
6[]Afterhandlingtrash
7[]Beforefood 8[]After 9[]After

iWa(SHG) Endline Survey Report – March 2016 | 25
SuSurvey
PostOfficeBox540318|Orlando,FL32854|407.716.4214|www.waterIslifeinternational.org
preparation handlingbaby’sdiaper/feces
handlinganimals
10[]Other:58. Whatdoyouusuallyuseinwashinghands?
(Tickthemostcommonlypracticed)1[]Wateronly 2[]Water
andsoap3[]Waterandsand/leaves
4[]Waterandash 5[]Other:59. Iftheansweris1(wateronly),Whatisthe
MAINfactorthatpreventsyourfamilyfromusingsoap?
1[]Washingwithsoaptakestime
2[]Soapisnotacommonpracticehere
3[]Negligence/laziness 4[]Tooexpensive5[]Wateralonecleansesthehand
6[]Other:
60. OBSERVATIONONLY:Isthereanyhandwashingfacilityavailablearoundthehome?
1[]Therearewaterandsoapnearorwithinthelatrine
2[]ThereisONLYwaternearorwithinthelatrine
3[]Therearewaterandsoapatadesignatedhandwashingarea
4[]ThereisONLYwateratadesignatedhandwashingarea
5[]Thereisnoavailablewashingstation
NOTES:
ü Reviewthequestionnaireü Ensurethatyoudidnotskip/forgetanyoftherequiredfieldsü Thanktherespondentforthis/herparticipation