Endline Report for the Self-Supporting Rural Development ...
49
Endline Report for the Self-Supportin g Rural Development Project with Saemaul Undong's Participatory A pp roach in M y anmar 김부열, 최승주 Development Studies Series 05
Transcript of Endline Report for the Self-Supporting Rural Development ...

Endline Report for the Self-Supporting Rural Development Project withSaemaul Undong's Participatory Approach in Myanmar김부열, 최승주
Development Studies Series 05


Endline Report for the Self-Supporting Rural Development Project with Saemaul Undong's Participatory Approach in Myanmar
Booyuel Kim1)
Syngjoo Choi2)
Introduction
The Self-Supporting Rural Development Project with Saemaul Undong's Participatory
Approach (hereafter SMU) in Myanmar, implemented jointly by Korea International
Cooperation Agency (KOICA) and the Ministry of Agriculture, Livestock, and Irrigation
(MOALI) from 2014 to 2019, is the largest rural development project in Southeast Asia
implemented by KOICA. Excluding the budget for the construction of the Saemaul Undong
Training Institute in Myanmar, the project is worth more than 10 billion Korean won
(equivalent to USD 9 million), which includes the budget for the implementation of rural
community development projects in 100 pilot villages across nine regions in Myanmar over
three years.
As the scale of KOICA's development projects has expanded dramatically, and projects
with large budgets of over 10 billion won, including Myanmar's rural community
development projects, have increased significantly, there have been increasing discussions
on how to evaluate various projects implemented by KOICA. The evaluation method used
by KOICA can be described as Process Evaluation using Project Design Matrix(PDM),
which summarizes the logical framework based on the Theory of Change. While the PDM
evaluated in the order of inputs, activities, outputs, outcomes, and impacts has the
1) Associate Professor, Graduate School of Environmental Studies, Seoul National University, [email protected] 2) Professor of Economics, Seoul National University, [email protected]

4
advantage of being particularly useful for process evaluation, it assumes a causal
relationship between inputs/activities and outcomes/impacts and thus cannot be scientifically
proven.
In an effort to address these limitations of process evaluation, impact evaluation
method focused on identifying causal relationships has received increasing attention. Abhijit
Banerjee (University of MIT), Esther Duflo (University of MIT), and Michael Kremer
(University of Harvard) have conducted impact evaluations applying a randomized
controlled trial (RCT) to various development projects since the mid-1990s. They have also
received the 2019 Nobel Prize in Economics for their contributions to poverty alleviation
and development policies based on scientific evidence derived from impact evaluation
findings.
National aid agencies such as USAID and DFID, and inter-governmental organizations
such as the World Bank and the Asian Development Bank have been actively conducting
impact evaluations of their development projects. In particular, the World Bank has
established the Development Impact Evaluation Initiative (DIME) in order to evaluate their
major projects. KOICA also carried out an impact evaluation, along with process
evaluation, when implementing the Myanmar rural community development project in line
with these international evaluation trends. The Myanmar Rural Development Project Impact
Evaluation Study is meaningful in that it is the first large-scale impact evaluation research
conducted by KOICA.3)
The rest of the report is as follows. Chapter 2 summarizes the background of the
impact evaluation of the KOICA Myanmar Rural Development Project, Chapter 3 discusses
the impact evaluation methodology, and Chapter 4 analyzes the main results of the impact
evaluation. Finally, in Chapter 5, we provide recommendations for policymakers who are
planning to implement a large-scale impact evaluation study such as the Myanmar rural
development project.
The summary of the impact evaluation results of the Myanmar rural development
project is as follows. There was no statistically significant impact on social capital, which
was set as one of the main outcome variables, but the Myanmar rural development project
improved the living environment in the village, increased access to microfinance, and
increased income. Since a randomized controlled trial, comparing randomly selected
3) KOICA's first impact evaluation efforts was the evaluation of drinking water improvement projects conducted in Volta, Ghana, West Africa from 2012 to 2014 (Cha et al., 2015). Cha, Seungman, Douk Kang, Benedict Tuffuor, Gyuhong Lee, Jungmyung Cho, Jihye Chung, Myongjin Kim, Hoonsang Lee, Jaeeun Lee, and Chunghyeon Oh. "The effect of improved water supply on diarrhea prevalence of children under five in the Volta region of Ghana: a cluster-randomized controlled trial." International journal of environmental research and public health 12, no. 10 (2015): 12127-12143.

Endline Report for the Self-Supporting Rural Development Project with Saemaul Undong's Participatory Approach in Myanmar 5
treatment villages to control villages, was not possible for this impact evaluation study,
two behavioral experiments were implemented.
KOICA's rural development project in Southeast Asia reflects the experience of
Saemaul Undong in Korea, and includes a differential incentive structure that pays
incentives to villages with better performance through competition among project villages.
The behavioral experiments attempted to analyze whether the inter-village competition, a
key mechanism of the KOICA rural development projects, affected the increase of social
capital in the villages. In Myanmar, where the level of social capital was remarkably high
from the baseline, we could not observe any effect of the inter-village competition from
the behavioral experiments.4)
Background
KOICA has invested an extraordinarily large budget into its Project Management
Consulting (PMC) contract while developing the rural development project in Myanmar.
Since the Myanmar rural development project was the largest in scale among the rural
development projects that KOICA carried out in five Southeast Asian countries, there was
a demand within KOICA that the Myanmar project was accompanied by a strict
evaluation. A total of four surveys (one baseline survey, two midline surveys and one
endline survey) were conducted for 100 pilot villages in nine regions. Table 1 lists the
100 pilot villages divided into village tracks, townships, and regions.
Table 1. List of 100 SMU Villages
4) In case of behavioral experiments, the study was designed as a comparative study of two countries, Myanmar and Cambodia. The Pre-Analysis Plan for this study titled “The Impact of Inter-Village Competition and Leadership on Collective Action: Experimental Evidence from Myanmar and Cambodia” was uploaded on the AEA RCT Registry on May 7, 2019. https://www.socialscienceregistry.org/trials/4180.
No. Village Name Village Tract Township Region1 Zeephyukone Yan Aung Myin Dekhinathiri NayPyiTaw2 Pauktaw Yan Aung Myin Dekhinathiri NayPyiTaw3 Tatpoe Yan Aung Myin Dekhinathiri NayPyiTaw4 Ywarma (YAM) Yan Aung Myin Dekhinathiri NayPyiTaw5 Ywarma (YM) Ywar Ma Dekhinathiri NayPyiTaw6 Myaukkyaungs Ywar Ma Dekhinathiri NayPyiTaw7 Taungkyaungs Ywar Ma Dekhinathiri NayPyiTaw8 KyarKoo (Wes Ywar Ma Dekhinathiri NayPyiTaw9 KyarKoo (Eas Ywar Ma Dekhinathiri NayPyiTaw
10 Shwepyi Ywar Ma Dekhinathiri NayPyiTaw

6
No. Village Name Village Tract Township Region11 Chai Chai Dekhinathiri NayPyiTaw12 Maetee Chai Dekhinathiri NayPyiTaw13 Shwekeinn Shwe keinn Dekhinathiri NayPyiTaw14 Kyaukeinn Shwe keinn Dekhinathiri NayPyiTaw15 Kywetae Shwekeinn Dekhinathiri NayPyiTaw16 Gusaesu (Sae Gusaesu Dekhinathiri NayPyiTaw17 Tharyarsu Gusaesu Dekhinathiri NayPyiTaw18 Padaukkone Gusaesu(saesu) Dekhinathiri NayPyiTaw19 Magyikone Gusaesu(saesu) Dekhinathiri NayPyiTaw20 Gwaydaukyoe Guu Sel Su Dekhinathiri NayPyiTaw21 Kyesar U Gusaesu(saesu) Dekhinathiri NayPyiTaw22 Doenwe Doenwe Dekhinathiri NayPyiTaw23 Ywarthit Doenwe Dekhinathiri NayPyiTaw24 Yede Doenwe Dekhinathiri NayPyiTaw25 Aungthukha Kyar Pin Dekhinathiri NayPyiTaw26 Htantapin Kyar Pin Dekhinathiri NayPyiTaw27 Nyaungkone Kyun Tatpet Dekhinathiri NayPyiTaw28 Saesu (Kyunt Kyauntatpe Dekhinathiri NayPyiTaw29 Maezalekone Maezalekone Pyinmana NayPyiTaw30 Kyaunkone Ywarthit Pyinmana NayPyiTaw31 Ywarthar Ywarthar Pyinmana NayPyiTaw32 Ngakaungkan Ngakaungkan Pyinmana NayPyiTaw33 Gonemininn Taegyigone Zebuthiri NayPyiTaw34 Shartaw Thae Gyikone Zebuthiri NayPyiTaw35 Taegyikone Taegyigone Zebuthiri NayPyiTaw36 Kyankhinsu Yonepin Lewe NayPyiTaw37 Thawmawkone Thawmawkone Lewe NayPyiTaw38 Kyaunkone (L Thawmawkone Lewe NayPyiTaw39 Kanthar Thawmawkone Lewe NayPyiTaw40 Yanking (E) Ayelar Lewe NayPyiTaw41 Luyoetaung Konlon Taunggyi Shan42 Phayarmae Konlon Taunggyi Shan43 Benkanywarma Konlon Taunggyi Shan44 Nyaungzin Konlon Taunggyi Shan45 Kyautsu Konlon Taunggyi Shan46 Tharminekhan Tharminekhan Kalaw Shan47 Latpanpin Thikhaung Kalaw Shan48 Oattakan Thikhaung Kalaw Shan49 Poneinn Heho Kalaw Shan50 Naunglawe Kyouk Htat Kalaw Shan51 Daungyway Daungyway Amarapura Mandalay52 Mintekone Sin bo Amarapura Mandalay53 Nandar Nandar Patheingyi Mandalay54 Nweni Nyein Chan Thar Zan Patheingyi Mandalay55 Banttin Banttin Patheingyi Mandalay56 Latthit Latthit Patheingyi Mandalay

Endline Report for the Self-Supporting Rural Development Project with Saemaul Undong's Participatory Approach in Myanmar 7
No. Village Name Village Tract Township Region57 Shwepyaeyin Shwepyaeyin Nwarhtoegyi Mandalay58 Htangua (Sou Htangua Nwarhtoegyi Mandalay59 Htanzin (Sou Htangua Nwarhtoegyi Mandalay60 Kanphyu (E) Latkaunggyi Matayar Mandalay61 Butar Butar Chaung Oo Sagaing62 Shwedarkya Nyaung Pin Thar Chaung Oo Sagaing63 Sulaekone Sulaekone Chaung Oo Sagaing64 Inma King Mon Taw Chaung Oo Sagaing65 Yargyitaw Wayar Chaung Oo Sagaing66 Kutokone Kutokone Myaung Sagaing67 Kyar O Kyar O Myaung Sagaing68 Tamasaykan Tamasaykan Myaung Sagaing69 Kyauk O Kyouk O Minkin Sagaing70 Kanpyar (E) Kanpyar Myinmu Sagaing71 Zayatsait Kyaungpankone Pathein Ayarwaddy72 Kanniphyar Kanni Pathein Ayarwaddy73 Phayargyikon Paukkone Pathein Ayarwaddy74 Tikeswan Koesu Pathein Ayarwaddy75 Kwatpyingyi Linnwungyi Pathein Ayarwaddy76 Nyaungchaung Kyonegyi Kangyidauk Ayarwaddy77 Kwinyargyi Kwinyargyi Kangyidauk Ayarwaddy78 Sarphyusu (K Myinkaseik Kangyidauk Ayarwaddy79 Ywarthitkone Michaungtayar Kangyidauk Ayarwaddy80 Kyaunchaung Khonezinkone Kangyidauk Ayarwaddy81 Pyitawthar ( Kali Bago Bago82 Deweinn Ahtetzaingganainggyi Bago Bago83 Taungthusu Katwinchan Bago Bago84 Saynyaungpin Outcity (East) Bago Bago85 Ywarma (Mayi Mayin Bago Bago86 Waegyi Waegyi Kyauktan Yangon87 Ahtetkhamat Khmat Khayan Yangon88 Nankhalae Latpan Tonegwa Yangon89 Yoewa Myaungtakar Hmawbe Yangon90 Yintaikwin Yintaikwin Taikgyi Yangon91 Daykin Daykin Paung Mon92 Oatkan Oatkan Paung Mon93 Ahauk Ahauk Paung Mon94 Kadine Kadine Paung Mon95 Kawhtaw Kawhtaw Paung Mon96 Kaningdar Kanaingdar Dawei Tanintharyi97 Zahar Zahar Dawei Tanintharyi98 Maungmaeshau Maungmaeshaung Dawei Tanintharyi99 Tharyarkone Tharyarkone Lounglone Tanintharyi
100 Maemaw Thabyar Lounglone Tanintharyi

8
However, it was not possible to carry out an impact evaluation to prove the causality
of KOICA's rural development project by conducting a survey only on the 100 project
villages. The initial settings of the evaluation only allowed process evaluation based on
before-and-after analysis.
While KOICA was deeply aware of the need for an impact evaluation based on a
rigorous design, there was no specific discussion of what procedures are required to carry
out these impact evaluations, how the evaluation studies should be designed, and how the
budget should be reflected.
In order to conduct an impact evaluation, the impact evaluation lab of the KDI School
of Public Policy and Management signed a contract with the KOICA. In consultation with
the MOALI, we identified 50 control villages while the first year of the Myanmar Rural
Community Development Project was underway in the 100 SMU villages. The Agricultural
Department of MOALI selected the 50 comparison villages that share similar characteristics
to the 100 pilot villages within the same townships. The 50 control villages are listed in
Table 2.
Table 2. List of 50 Comparison Villages
No. Village Name Village Tract Township Region
1 Ma Pu Pin Kyun Oo Pyinmana Nay Pyi Taw
2 Lae Luu I Le Lu Aing Pyinmana Nay Pyi Taw
3 Zaung Chan Kone Nga Kaung Kan Pyinmana Nay Pyi Taw
4 A Lyin Lo Ah Lyin Lo Zebuthiri Nay Pyi Taw
5 Pan Tin Pyaung Gaung Gyi Lewe Nay Pyi Taw
6 Tha Man Pin Aye Lar Lewe Nay Pyi Taw
7 Thae Kaw Lay Thea Kaw Gyi Lewe Nay Pyi Taw
8 Kan Oo Pay Tone Hmyaung Lewe Nay Pyi Taw
9 Ma Dot Pin Ma Tawt Pin Lewe Nay Pyi Taw
10 Ta Lote Pin Ta Loke Pin Lewe Nay Pyi Taw
11 Kone Paw Su Pay Tone Hmyaung Lewe Nay Pyi Taw
12 Zee Kone Yae Oe Sin Lewe Nay Pyi Taw
13 Nyaung Pin Thar Si Paing Lewe Nay Pyi Taw
14 Hman Taw Thet Kei Chin Lewe Nay Pyi Taw
15 Watt Ka Mu Wet Ka Mu Lewe Nay Pyi Taw
16 Kyoe Pin Kyoet Pin Lewe Nay Pyi Taw
17 Nan Aww Kun Long Taunggyi Shan
18 Thein Inn Kun Long Taunggyi Shan
19 Narr Hit Kun Long Taunggyi Shan
20 Myat Sat (North) Baw Nin Kalaw Shan
21 Taung Pat Thi Hkawng Kalaw Shan

Endline Report for the Self-Supporting Rural Development Project with Saemaul Undong's Participatory Approach in Myanmar 9
Usually, the baseline survey is conducted on both the treatment and control groups
prior to the project implementation. In case of the Myanmar rural development project, the
control villages were selected during the first year of project implementation, and thus we
could not conduct interviews for the pilot villages and control villages simultaneously.
For this reason, we first signed a contract with the Good Neighbors Myanmar branch
to conduct the baseline survey for 100 pilot villages. In December 2015, we collected data
for a census of 18,000 households through a household survey conducted in 100 pilot
villages across nine regions. Through systematic random sampling method, we selected
5,500 households which is 30% of the total number of households and conducted the
baseline survey on February 2016.5)
No. Village Name Village Tract Township Region
22 Nyaung Pin Khar Shae Baw Nin Kalaw Shan
23 Thar Hla Aye Ta Moke Soe Amarapura Mandalay
24 Kan Kwe Nay Rit Sa Ya Patheingyi Mandalay
25 Taung Ta Tine Shae Taung Tatine Shay Patheingyi Mandalay
26 Oak Twin Oke Twin Nwar Htoe Gyi Mandalay
27 Tha Pyay Kone Let Kaung Gyi Matayar Mandalay
28 Htar Wae Inn Ku Lar Gyi Chaung Oo Sagaing
29 Shwe Kuu Shwe Gu Chaung Oo Sagaing
30 Phwar Saw Hpwar Saw Myaung Sagaing
31 Inngyin Taung Inn Kyin Taung Minkin Sagaing
32 Sat Pyar Kyin Kan Taw Myin Mu Sagaing
33 Tike Gyi Kone Tike Gyi Kone Pathein Ayeyarwaddy
34 Pyin Ka Toe Kone Pyin Ka Doe Kone Pathein Ayeyarwaddy
35 Kyauk Chaung Kyi Kyauk Chaung Gyi Pathein Ayeyarwaddy
36 Yoe Gyi Tha Bawt Ngu Kangyi Dauk Ayeyarwaddy
37 Ka Twin Chan Tha Bawt Ngu Kangyi Dauk Ayeyarwaddy
38 Thae Gyi Kone Kyon Gyi Kangyi Dauk Ayeyarwaddy
39 Pyi Taw Aye Ma Yin Bago Bago
40 Ka Twin Chan Ka Twin Chan Bago Bago
41 Thae Gyi Kone Ah Htet Zaing Ga Naing Gyi Bago Bago
42 That Kal Gyin Thet Kei Kone Kha Yan Yangon
43 Tha Yet Taw War Net Chaung Bu Tar Hmawbi Yangon
44 Oak Kan Kan Kone Oke Kan Kan Kone Tike Gyi Yangon
45 Kyar Bo Kyar Bo Paung Mon
46 Nyaung Kone Lay Nyaung Kone Lay Paung Mon
47 Bai Laung Htan Pin Chaung Gyi Paung Mon
48 Thae Pone Thar Yar Kone Launglone Tanintharyi
49 Za Lon Za Lun Htarwae Tanintharyi
50 Kyauk Yat Kyauk Yat Htarwae Tanintharyi

10
The Good Neighbors Myanmar branch, which conducted the baseline survey at that
time, signed a contract to conduct a total of four surveys (one baseline, two midline, and
one endline) for 100 pilot villages and survey costs for control villages were not included
in the budget. The Development Research Team of KDI School of Public Policy and
Management signed a contract with the Myanmar Survey Research (MSR), which provided
consultation services when the Good Neighbor Myanmar Branch conducted the baseline
survey for pilot villages. MSR also conducted the baseline survey for 3,000 households of
50 comparison villages (60 households per village).
There were discussions on how to coordinate the midline and endline data collections,
given the different agencies conducting the baseline survey of 100 pilot villages and 50
control villages. We terminated the survey service contract with the Good Neighbors
Myanmar Branch for 100 pilot villages and changed the contract with the MSR to conduct
both the midline and endline surveys for 100 pilot villages and 50 control villages. MSR
conducted the midline and endline surveys for 5,500 households in 100 pilot villages, and
3,000 households in 50 control villages (in total 8,500 households in 150 villages) in
February 2018 and May 2019, respectively.
Through this, evaluation of Myanmar's rural community development project, which
was based on a before and after comparison process evaluation and performance evaluation,
could be developed into an impact evaluation setting by employing the
difference-in-differences method. The difference-in-difference analysis compares the change
from baseline to endline between the treatment and control groups.
Figure 1 visually describes the difference-in-difference analysis. It seems that the
characteristics between treatment and comparison villages prior to the intervention are
different. However, their slopes are parallel meaning that the treatment and comparison
villages share the same trend. The effect of the intervention is calculated by subtracting
the difference in changes between the treatment and comparison villages. The
difference-in-difference method is widely used in impact evaluation studies in settings
where RCT is not possible.
5) It is important to extract a representative sample that reflects the characteristics of the population. In a poll conducted before the US presidential election in 1936, Landon, then a Republican candidate, was expected to win a big vote over Roosevelt, but the result was the opposite. Poll was conducted from car and landline owners during the Great Depression, who were economically rich Republican supporters. If the sample is not representative of the population, it is difficult to infer the population parameter accurately from the sample statistics. In the Myanmar SMU Project Baseline Survey, representative samples could be extracted through census data collection as well as systematic random sampling. Choi, E. Seul, and Booyuel Kim. "A Beginner's Guide to Randomized Evaluations in Development Economics." Seoul Journal of Economics 29.4 (2016): 529-552.

Endline Report for the Self-Supporting Rural Development Project with Saemaul Undong's Participatory Approach in Myanmar 11
Figure 1. Example of Difference-in-Difference
In case of the Myanmar rural development project, we do not have information prior
to the intervention, and thus it is not possible to test the parallel trend assumption6) which
is the key assumption for using difference-in-difference analysis. The endogenous selection
of the 100 pilot villages and the ex-post selection of the comparison villages can be
considered as the limitation of the Myanmar rural development project.
In order to overcome this limitation, the research team included a within village RCT
component in order to explain the key mechanism of the Myanmar rural development
project. First, we identified the inter-village competition structure as a characteristic of the
Myanmar rural development project, which is clearly distinguished from the existing rural
development projects (CDD). Then, we introduced two lab-in-the-field experiments – (i)
Public Goods Game and (ii) Joint Investment Game. We randomly assigned the sampled
households into two groups under each game. In February 2018, the public goods game
was conducted on 8,500 households during the midline survey, and the joint investment
game was conducted during the endline survey in May 2019. While the lab-in-the-field
experiment is not an impact evaluation study that directly analyzes the effectiveness of a
rural development project in Myanmar, the design allows us to examine the effect of the
6) Parallel trend assumption means that the treatment and comparison groups would have followed a same trajectory without the intervention/treatment.

12
core mechanism of Korean CDD projects (differentiated incentive system based on
inter-village competition) under a rigorous randomized controlled trial (RCT) design.
Myanmar Rural Community-driven Development Project
Myanmar has the per capita income of US$ 1,326 (World Bank, 2018), making it one
of the poorest countries in ASEAN. Myanmar has high income inequality between urban
and rural areas, and suffer from poor rural environment due to lack of investment in the
agricultural sector. Accordingly, the Myanmar government, together with the KOICA,
implemented the Myanmar rural community development project of $ 22 million for a total
of 5 years from 2014 based on the experience of the Saemaul Undong in South Korea.
In case of the Myanmar rural community development project, we set key performance
indicators (KPI) in three areas: (i) capacity building project; (ii) village environment
improvement project; (iii) income generation project. Then, we evaluate 100 villages every
year and rank them from first to 100th.
The main performance indicators for the capacity building project were the number of
capacity building meetings, number of training sessions, participants in training, and
participants in excursions to A-ranking villages in other regions. The main performance
indicators for the village environment improvement project were (i) residents' participation
in the fund; (ii) provision of labor; (iii) land provision; and (iv) the number of households
participating in the village environment improvement project. Lastly, the main performance
indicators for the income generation project were (i) the increase of the village
development fund; (ii) the participants in the micro-loans; and (iii) the number of new
projects that were evaluated.
The performance of each village, measured through the key performance indicators for
each project, was calculated annually and each village was ranked based on the calculation.
Based on their ranking from the previous year, differential support was provided, which is
the key characteristic of the Myanmar rural development project.
Table 3. Key Performance Indicators
Objective Key Performance Indicators1. Capacity Building Number of meeting
Number of technical/ educational trainingNumber of traineeNumber of villagers visit to other advanced villagesNumber of public information on project movement

Endline Report for the Self-Supporting Rural Development Project with Saemaul Undong's Participatory Approach in Myanmar 13
At the beginning of the first year of the project, all 100 villages received the same
amount of $ 20,000 as the village development fund. Based on the performance of the
first year, the top 30 villages were ranked A, the next 40 villages were ranked B, and the
bottom 30 villages were ranked C. Based on this ranking, village development funds were
differentially provided.
The top 30 villages, A-ranked villages, received $ 40,000, which is twice the first
year's village development fund. The B-ranked villages received $ 30,000, an increase of $
10,000 from the first year. The C-ranked villages received $ 20,000, the same amount as
in the first year. After completing the second-year project, the village development fund
was distributed in the same way in the third year.
Table 4. Differential Incentive System by Year
Year Rank Village Development Fund
Number of Villages Total Budget
2016(First Year)
- $20,000 100 $2,000,000
2017(Second Year)
A $40,000 30 $1,200,000
B $30,000 40 $1,200,000
C $20,000 30 $600,000
2018(Third Year)
A $40,000 30 $1,200,000
B $30,000 40 $1,200,000
C $20,000 30 $600,000
2019
A $15,000 30 $450,000
B $10,000 40 $400,000
C $5,000 30 $150,000
Total $9,000,000
Objective Key Performance Indicators2. Environment Improvement
% of project work completed in a year based on the original planVillagers’ fund contributionVillagers’ labor contributionNumber of participant householdsVillagers’ land/ materials contribution
3. Income Generation Fund increment by means of interestNumber of microfinance participant householdsAdoption of new business and technologies

14
After the third year of implementation, the Ministry of Agriculture and Livestock of
Myanmar and KOICA no longer managed the rural community development project, and
individual villages voluntarily continued their village development project. In addition, a
bonus incentive of $ one million was set up so that the third-year project could be carried
out steadily and the rural community development project could be continued. In the third
year, A-ranking villages receive an additional $ 15,000, B-ranking villages receive a $
10,000 bonus, and C-ranking villages receive $5,000. 100 pilot villages participating in the
rural development project receive a minimum of $ 65,000 and a maximum of $ 115,000
as village development fund from 2016 to 2019, and the total budget amounts to $ 9
million.
In summary, KOICA's Rural Development Project in Myanmar, based on the
experience of Saemaul Undong in Korea, focused on (i) improving village leaders and
community members’ capacity, (ii) improving village environment such as roads and
drinking water, and (iii) income generation activities through micro-loan projects. Besides,
key performance indicators were set for each objective, 100 villages were objectively
ranked based on the indicators, and differentiated incentives were provided based on each
village’s ranking. This inter-village competition system is a unique feature which
distinguishes the Myanmar rural development project from other community-driven
development projects.
Impact Evaluation Methodology
Potential Outcome Model
In the field of social science, the existing empirical studies often relies on simple
correlation analysis, which not systematic nor rigorous. Accordingly, Leamer (1983)
proposed a sensitivity analysis to examine if consistent results follow from different models
and assumptions. However, this approach was insufficient to prove a causal relationship.7)
In the field of empirical economics since the late 1990s, many researchers recognized
the importance of rigorous research design such as instrumental variables (IV) and
randomized controlled trials (RCT) (Angrist and Pischke, 2010).
7) The sensitivity analysis proposed by Leamer examines if similar results are found after changing the specification or functional form.

Endline Report for the Self-Supporting Rural Development Project with Saemaul Undong's Participatory Approach in Myanmar 15
Among study designs that demonstrate a rigorous causal relationship, the RCT method
has received particular attention (Duflo and Kremer, 2005; Duflo et al. 2007). The
randomized controlled trial method was already recognized as a rigorous research
methodology for a long time in the medical field, and this research methodology was
introduced in the social science field, especially in the economic field, in the late 1990s.
It is difficult to prove the causality of a specific project simply by comparing before
and after the implementation. If we try to prove causality by comparing the people
participating in the project and those not participating in the project, there could be a
selection bias issue because the people who participated in the project may not share
similar characteristics from those who did not participate. In order to prove a causal
relationship, we need a “counterfactual” and Rubin (1974) explained this using the
Potential Outcome Model.8)
The potential outcome model proposed by Rubin assumes the counterfactual outcome
by looking at the treatment effect and the selection bias. First, an individual i can either
be assigned to a treatment or not which is shown by Di = {0, 1}. The outcome variable
of interest is Yi, and we are interested in the impact of the treatment (Di) on Yi. If an
individual i received the treatment (Di = 1), the outcome can be denoted as Y1i. If
individual i did not receive the treatment (Di = 0), the outcome can be denoted as Y0i.
<Equation 1> The treatment effect on i = Y1i - Y0i
In reality, individual i can only face one condition of either receiving the treatment or
not. If an individual i receives the treatment, we will not be able to observe the
counterfactual outcome which is Y0i. Since we cannot observe both Y1i or Y0i at the
same time, the equation will look as follows:
<Equation 2> Yi = Y0i + (Y1i - Y0i) * Di
This is called the Fundamental Problem of Causal Inference. Since we cannot observe
the counterfactual, if we compare the average outcomes for the treatment group and the
control group, we will be looking at the following:
<Equation 3> E[Yi|Di = 1] - E[Yi|Di = 0] = E[Y1i|Di = 1] - E[Y0i|Di = 0]
8) Counterfactual shows the results that would have happened to participants if they have not participated in the program.
16
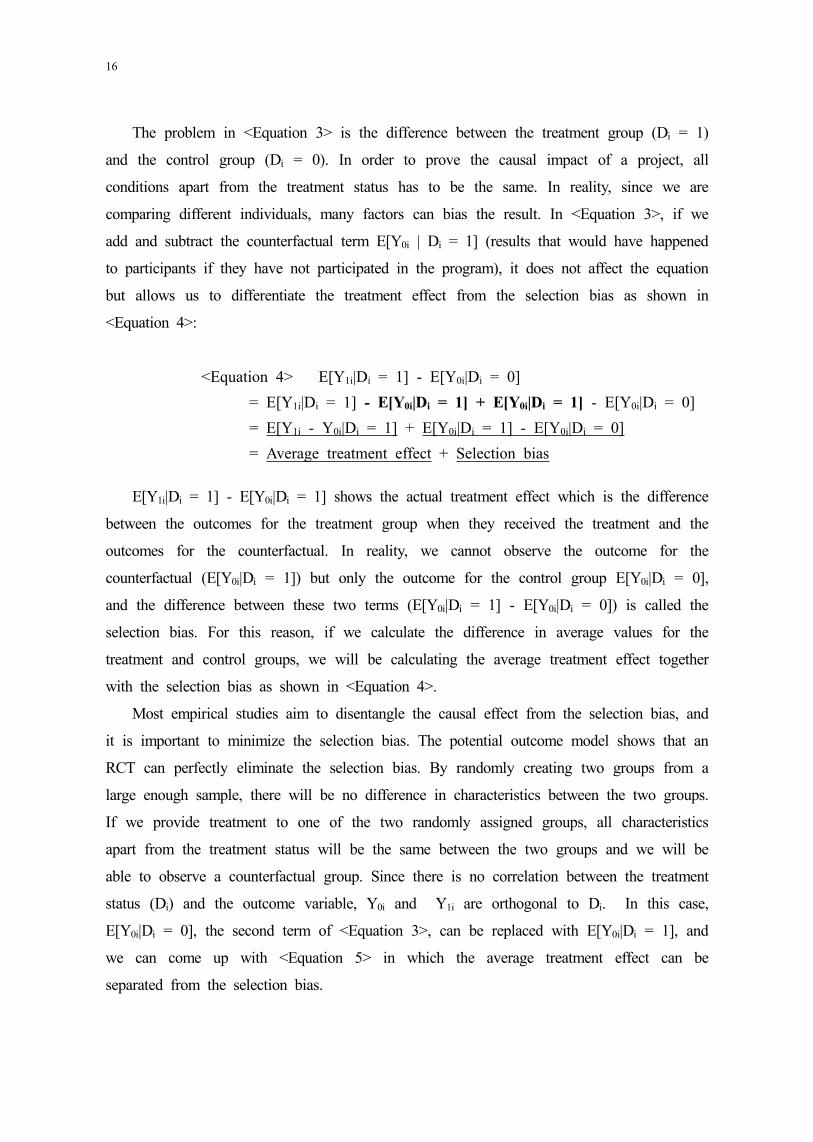
The problem in <Equation 3> is the difference between the treatment group (Di = 1)
and the control group (Di = 0). In order to prove the causal impact of a project, all
conditions apart from the treatment status has to be the same. In reality, since we are
comparing different individuals, many factors can bias the result. In <Equation 3>, if we
add and subtract the counterfactual term E[Y0i | Di = 1] (results that would have happened
to participants if they have not participated in the program), it does not affect the equation
but allows us to differentiate the treatment effect from the selection bias as shown in
<Equation 4>:
<Equation 4> E[Y1i|Di = 1] - E[Y0i|Di = 0]
= E[Y1i|Di = 1] - E[Y0i|Di = 1] + E[Y0i|Di = 1] - E[Y0i|Di = 0]
= E[Y1i - Y0i|Di = 1] + E[Y0i|Di = 1] - E[Y0i|Di = 0]
= Average treatment effect + Selection bias
E[Y1i|Di = 1] - E[Y0i|Di = 1] shows the actual treatment effect which is the difference
between the outcomes for the treatment group when they received the treatment and the
outcomes for the counterfactual. In reality, we cannot observe the outcome for the
counterfactual (E[Y0i|Di = 1]) but only the outcome for the control group E[Y0i|Di = 0],
and the difference between these two terms (E[Y0i|Di = 1] - E[Y0i|Di = 0]) is called the
selection bias. For this reason, if we calculate the difference in average values for the
treatment and control groups, we will be calculating the average treatment effect together
with the selection bias as shown in <Equation 4>.
Most empirical studies aim to disentangle the causal effect from the selection bias, and
it is important to minimize the selection bias. The potential outcome model shows that an
RCT can perfectly eliminate the selection bias. By randomly creating two groups from a
large enough sample, there will be no difference in characteristics between the two groups.
If we provide treatment to one of the two randomly assigned groups, all characteristics
apart from the treatment status will be the same between the two groups and we will be
able to observe a counterfactual group. Since there is no correlation between the treatment
status (Di) and the outcome variable, Y0i and Y1i are orthogonal to Di. In this case,
E[Y0i|Di = 0], the second term of <Equation 3>, can be replaced with E[Y0i|Di = 1], and
we can come up with <Equation 5> in which the average treatment effect can be
separated from the selection bias.
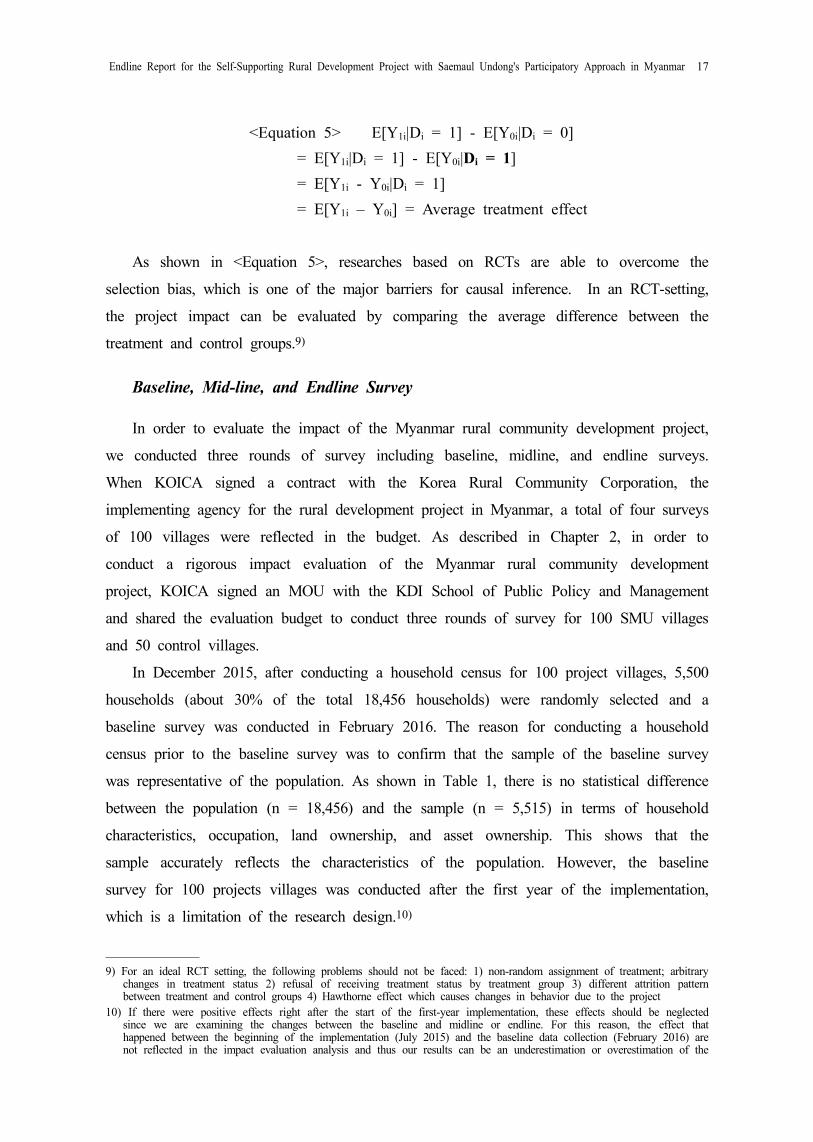
Endline Report for the Self-Supporting Rural Development Project with Saemaul Undong's Participatory Approach in Myanmar 17
<Equation 5> E[Y1i|Di = 1] - E[Y0i|Di = 0]
= E[Y1i|Di = 1] - E[Y0i|Di = 1]
= E[Y1i - Y0i|Di = 1]
= E[Y1i – Y0i] = Average treatment effect
As shown in <Equation 5>, researches based on RCTs are able to overcome the
selection bias, which is one of the major barriers for causal inference. In an RCT-setting,
the project impact can be evaluated by comparing the average difference between the
treatment and control groups.9)
Baseline, Mid-line, and Endline Survey
In order to evaluate the impact of the Myanmar rural community development project,
we conducted three rounds of survey including baseline, midline, and endline surveys.
When KOICA signed a contract with the Korea Rural Community Corporation, the
implementing agency for the rural development project in Myanmar, a total of four surveys
of 100 villages were reflected in the budget. As described in Chapter 2, in order to
conduct a rigorous impact evaluation of the Myanmar rural community development
project, KOICA signed an MOU with the KDI School of Public Policy and Management
and shared the evaluation budget to conduct three rounds of survey for 100 SMU villages
and 50 control villages.
In December 2015, after conducting a household census for 100 project villages, 5,500
households (about 30% of the total 18,456 households) were randomly selected and a
baseline survey was conducted in February 2016. The reason for conducting a household
census prior to the baseline survey was to confirm that the sample of the baseline survey
was representative of the population. As shown in Table 1, there is no statistical difference
between the population (n = 18,456) and the sample (n = 5,515) in terms of household
characteristics, occupation, land ownership, and asset ownership. This shows that the
sample accurately reflects the characteristics of the population. However, the baseline
survey for 100 projects villages was conducted after the first year of the implementation,
which is a limitation of the research design.10)
9) For an ideal RCT setting, the following problems should not be faced: 1) non-random assignment of treatment; arbitrary changes in treatment status 2) refusal of receiving treatment status by treatment group 3) different attrition pattern between treatment and control groups 4) Hawthorne effect which causes changes in behavior due to the project
10) If there were positive effects right after the start of the first-year implementation, these effects should be neglected since we are examining the changes between the baseline and midline or endline. For this reason, the effect that happened between the beginning of the implementation (July 2015) and the baseline data collection (February 2016) are not reflected in the impact evaluation analysis and thus our results can be an underestimation or overestimation of the

18
Table 1: Assessment of sample representativeness
Number of household Occupation Land Household Asset
Total Female Single(dummy)
Non-farming
(dummy)
Sown area (2013-14, acre) Live-stock Agricultura
l machineCar or
MotorcycleTailor
machine
POPULATION (N = 18,456 households)
Mean 4.01 2.07 0.04 0.50 2.90 12.78 0.19 0.01 0.002
(SD) (1.67) (1.12) (0.20) (0.50) (5.85) (107.56) (0.55) (0.14) (0.05)
SAMPLE (n = 5,515 households)
Mean 3.98 2.06 0.04 0.49 2.94 12.49 0.19 0.01 0.002
(SD) (1.67) (1.12) (0.20) (0.50) (5.85) (107.56) (0.55) (0.14) (0.04)
T -1.40 -0.90 -0.75 -0.93 0.41 -0.20 0.54 0.42 -0.53
(p-value) (0.16) (0.37) (0.45) (0.35) (0.68) (0.84) (0.59) (0.67) (0.60)
Source: 2016 Census and Baseline Data from KOICA Saemaul Undong (SMU) Project in MyanmarNotes: Standard deviations and p-values are reported in parentheses.
While preparing for the baseline survey of 100 villages, the research team discussed
the selection of control villages with the Ministry of Agriculture, Livestock and Agriculture
of Myanmar. In the Nay Pyi Taw region, which has a total of 40 project villages, a total
of 16 control villages were selected from 3 townships. From Bago, Mon, Tanintharyi, and
Yangon regions, each of which has 6 project villages, 3 control villages were selected
from each region.
In Ayeyarwaddy, Mandalay, Sagaing, and Shan regions, there were 10 project villages
in each region. 6 control villages were selected from Ayeyarwaddy and Shan regions, and
5 villages were selected from Mandalay and Sagaing regions. In December 2016, baseline
survey was conducted for 3,000 households (60 households from each village).
If the project villages and control villages were randomly selected before the project
started, the main characteristics between the two groups would have been similar on
average. However, 100 project villages were selected prior to the selection of the control
villages, and the difference in characteristics between the treatment and the control villages
is inevitable. Table 2 shows the difference in means in terms of demographic and
socio-economic status of households, and community characteristics between treatment and
control villages.
No statistically significant difference was found between the two groups in terms of
demographic characteristics, including female household head, household head's age, and
true effect.
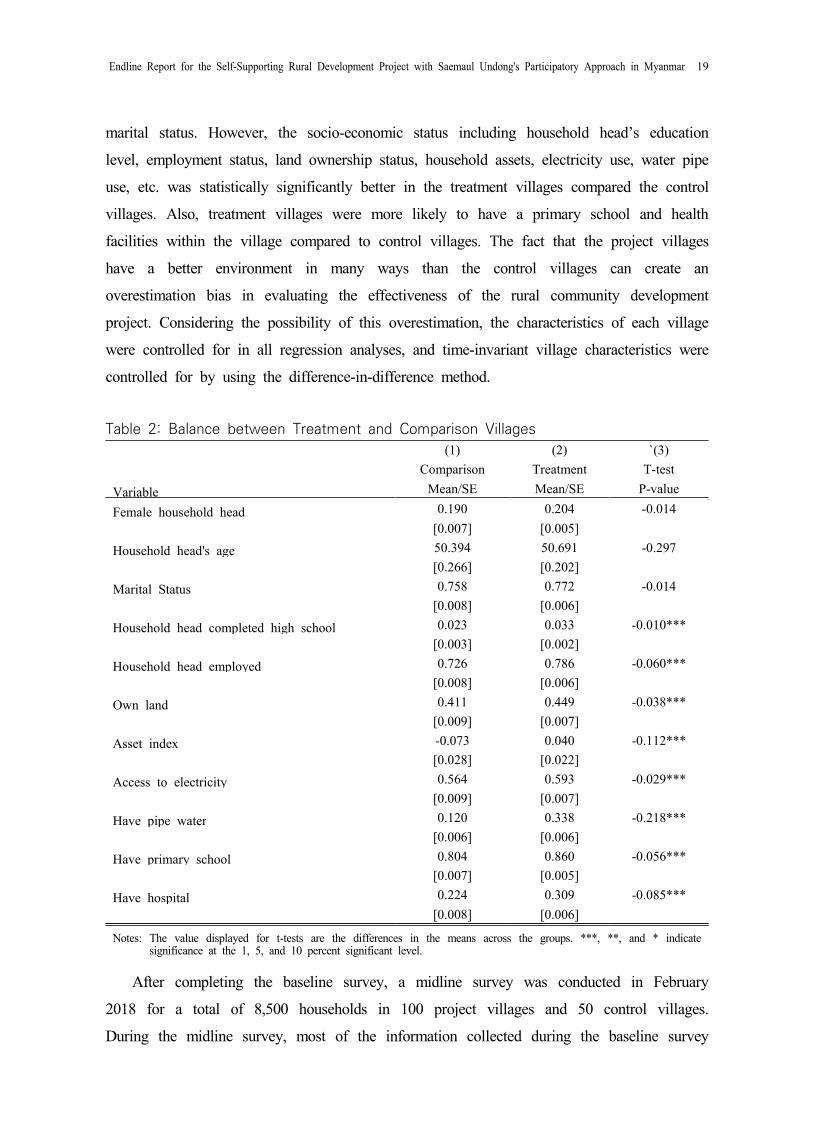
Endline Report for the Self-Supporting Rural Development Project with Saemaul Undong's Participatory Approach in Myanmar 19
marital status. However, the socio-economic status including household head’s education
level, employment status, land ownership status, household assets, electricity use, water pipe
use, etc. was statistically significantly better in the treatment villages compared the control
villages. Also, treatment villages were more likely to have a primary school and health
facilities within the village compared to control villages. The fact that the project villages
have a better environment in many ways than the control villages can create an
overestimation bias in evaluating the effectiveness of the rural community development
project. Considering the possibility of this overestimation, the characteristics of each village
were controlled for in all regression analyses, and time-invariant village characteristics were
controlled for by using the difference-in-difference method.
Table 2: Balance between Treatment and Comparison Villages
(1) (2) `(3)
Comparison Treatment T-test
Variable Mean/SE Mean/SE P-value
Female household head 0.190 0.204 -0.014
[0.007] [0.005]
Household head's age 50.394 50.691 -0.297
[0.266] [0.202]
Marital Status 0.758 0.772 -0.014
[0.008] [0.006]
Household head completed high school 0.023 0.033 -0.010***
[0.003] [0.002]
Household head employed 0.726 0.786 -0.060***
[0.008] [0.006]
Own land 0.411 0.449 -0.038***
[0.009] [0.007]
Asset index -0.073 0.040 -0.112***
[0.028] [0.022]
Access to electricity 0.564 0.593 -0.029***
[0.009] [0.007]
Have pipe water 0.120 0.338 -0.218***
[0.006] [0.006]
Have primary school 0.804 0.860 -0.056***
[0.007] [0.005]
Have hospital 0.224 0.309 -0.085***
[0.008] [0.006]
Notes: The value displayed for t-tests are the differences in the means across the groups. ***, **, and * indicate significance at the 1, 5, and 10 percent significant level.
After completing the baseline survey, a midline survey was conducted in February
2018 for a total of 8,500 households in 100 project villages and 50 control villages.
During the midline survey, most of the information collected during the baseline survey
20
was repeatedly asked, and a module on women's leadership and behavioral experiments
were conducted to measure social capital.
In order to analyze the impact of differential incentive system based on inter-village
competition, one of the key mechanisms of the Myanmar rural community development
project, on social capital, a public goods game which involves inter-village competition was
introduced. Lastly, after the third year of project implementation, we conducted the endline
survey in May 2019. During the endline survey, we collected the same information
collected during the previous rounds of surveys, and also conducted another behavioral
experiment to measure if inter-village competition improves joint investment with
uncertainty.
In summary, the Myanmar rural community development project is the first among
KOICA projects to systematically conduct a large-scale impact evaluation which involves
three rounds of data collection. The first evaluation plan which was to conduct a
before-and-after analysis without selecting control villages developed into a more rigorous
difference-in-difference method by selecting control villages ex-post. Also, we were able to
carry out an RCT-based impact evaluation by conducting two behavioral experiments
during the midline and endline data collection.
WB Measuring Social Capital
In order to evaluate the effectiveness of the rural community development project in
Myanmar, we aimed to analyze the increase of social capital in the villages as a
short-term outcome and the increase of household income as a mid- to long-term outcome.
We used the survey questionnaire from “Measuring Social Capital” developed by the
World Bank (Grootaert et al. 2002; Grootaert et al. 2004) to measure social capital. In
particular, we asked questions related to 1) Groups and Networks, 2) Trust and Solidarity,
3) Collective Action and Cooperation, 4) Information and Communication, and 5) Social
Cohesion and Inclusion.
Difference-in-Differences
The impact evaluation study of the Myanmar rural community development project
applies the difference-in-differences method to identify the program’s causal impact. 11)
Difference-in-difference is a methodology widely used in social science in order to
11) For more information on difference-in-difference strategy, refer to Gertler et al. (2016).

Endline Report for the Self-Supporting Rural Development Project with Saemaul Undong's Participatory Approach in Myanmar 21
rigorously identify the causal relationship. For the difference-in-difference method, we first
need to identify the control and treatment groups and compare the before-and-after changes
of key outcome variables (including level of social capital and household income) between
the treatment and control groups. The first difference is comparing the before and after,
and the second difference is comparing the treatment and control groups.
The key assumption of difference-in-difference strategy is that the treatment group
follows a similar trajectory compared to the control group prior to the intervention, even if
the baseline characteristics of the treatment and control groups are different. By satisfying
this assumption, we can control for time-varying trends that are commonly applied to the
treatment group and the control group as well as time-invariant differences between the
treatment group and the control group. Thus, the causal effect of the policy or program
can be identified.
The regression equation for the difference-in-difference method is as follows. is the
outcome variable for individual i, in village j, at time period t, is a dummy variable that
equals to 1 if individual i lives in a treatment village. is a dummy variable that equals to
0 for baseline value and 1 for post-intervention value. is a control vector that includes
the demographic and socio-economic characteristics of the respondent.
Coefficient shows the difference between treatment and control groups, and coefficient
shows the difference between before and after the intervention. We are primarily interested
in the value for , the coefficient for the interaction term between and . If the Myanmar
rural community development project had a positive impact on social capital and income,
the coefficient will be statistically significant.
Since we conducted three rounds of survey for the Myanmar rural community
development project, we include midline and endline dummies instead of a post dummy,
and each of these dummies are interacted with the treatment dummy. In sum, we examine
the short-term impact of the project by looking at - the interaction term between
treatment and midline dummies, and the long-term impact by looking at – the interaction
term between treatment and endline dummies.

22
Lab-in-the-Field Experiments
The impact evaluation of the Myanmar rural community development project includes
the difference-in-difference approach that compares the average change over time in the
treatment and control groups, as well as an randomized control experiment (RCT)
component by conducting behavioral experiments to measure the impact of the inter-village
competition. Two types of behavioral experiments were conducted – (i) public goods
experiment during the midline survey; and (ii) joint investment experiment during the
endline survey.
When measuring trust and collective action, the core concept of social capital, with
self-reported questionnaires, a social desirability bias may occur in a socially desirable
direction. In order to more closely measure social capital, which is a key outcome variable
of this project, a behavioral experiment was introduced to measure trust and collective
action through individual’s action instead of self-reported answers. The public goods game
measures how much individuals donate for public goods of their community in the
presence of free riding incentives. The joint investment experiment measures whether an
individual will invest in a joint investment project when the success probability of the
project depends on the number of participants.
The public goods game is described in detail in Appendix 1. During the midline
survey, 5,000 kyat was distributed to survey participants and they were asked to make a
donation out of the 5,000 kyat for their village. We handed out two envelopes - one
envelope with a “you” sign with 5,000 kyat, and another with a “village” sign which was
empty. After making the donation to the village envelope, we asked the survey participants
to hand in the village envelope to the enumerators. In case survey participants did not
donate any amount, they were allowed to hand in an empty envelope to the enumerators.
Since respondents could face social pressure if they make decisions in front of the
enumerators, we asked the respondents to make the decision in a separate room. We
randomly selected half of the survey participants, and conducted inter-village public goods
game. Similar to the evaluation method of the Myanmar rural community development
project, based on the amount of average donation 100,000 kyat was provided to the top 50
villages, and 50,000 kyat was provided to the next 50 villages. We analyzed whether
inter-village competition affects decisions to donate for public goods.
For the joint investment experiment, we created groups of 14 participants in each
village and asked if they would like to invest in the joint investment project. Participants

Endline Report for the Self-Supporting Rural Development Project with Saemaul Undong's Participatory Approach in Myanmar 23
receive 2,000 kyat, and if they decide not to participate in the joint investment project,
they can keep the endowment for themselves. If the participant decides to participate in
the joint investment project, they will have a chance to receive 4,000 kyat depending on
the success probability. If the project fails, they lose the initial endowment of 2,000 kyat.
As shown in Figure 3, the success probability of the joint investment project depends on
the number of participants in their group that decide to invest in the project. If no one
decides to participate in the project, the success probability is zero over 25 (or 0%), If all
14 participants decide to invest, the success probability is 14 over 25 (which equals to
56%). If all participants decide to invest under an uncertain circumstance, the expected
return from investing in the joint investment project (2,240 kyat) exceeds the return from
not investing (2,000 kyat).
Figure 3. Success Probability of Joint Investment Project
When individuals with credit constraints are unable to start new businesses, joint
investments based on mutual trust and cooperation can help overcome the existing
constraints and promote new businesses to increase income. Joint investment is one of the
key mechanisms for income generation in rural communities. Since individuals face
uncertainties when investing in a joint project, trust and collective action among members
are important and the joint investment experiment is designed to measure this social
capital.
Similar to the public goods experiment, the top 50 villages with the highest number of
investors in the joint investment experiment receive 100,000 kyat as incentives, and the
next 50 villages receive 50,000 kyat which can be used for village development. We
examine the impact of inter-village competition on the likelihood to invest in a joint
investment project with uncertainty.
24
Results
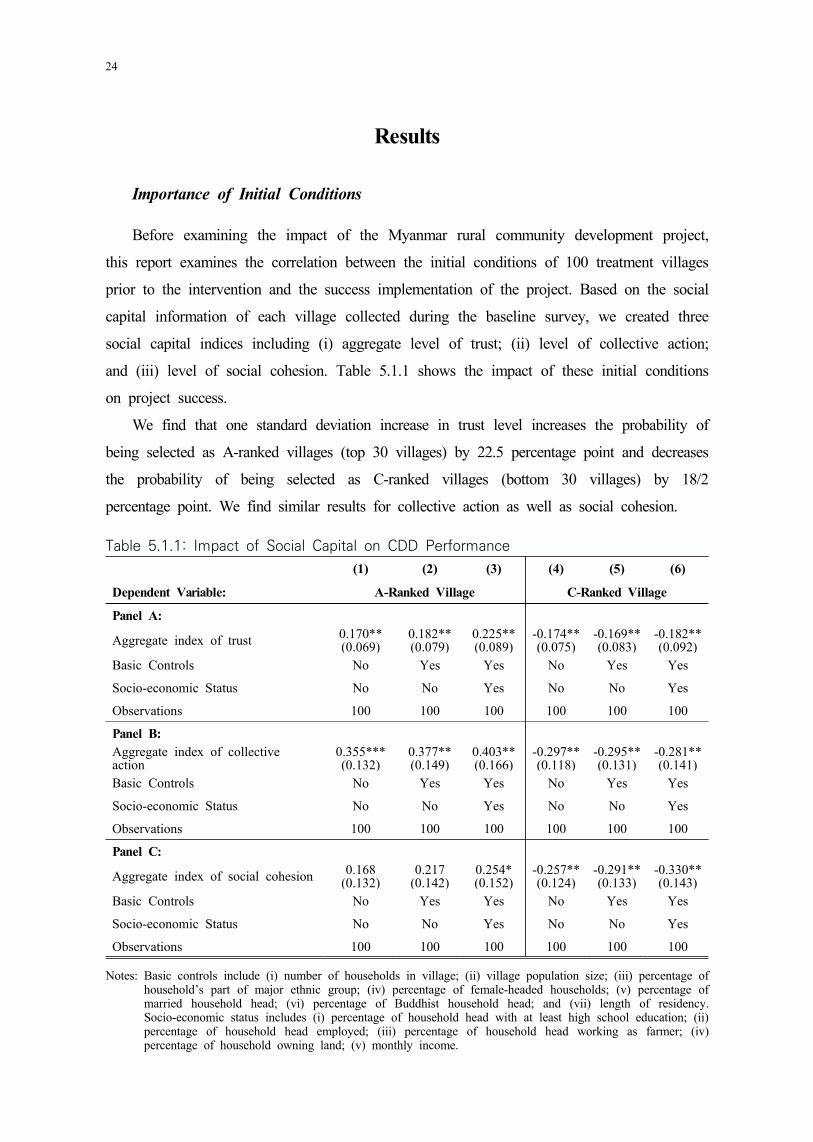
Importance of Initial Conditions
Before examining the impact of the Myanmar rural community development project,
this report examines the correlation between the initial conditions of 100 treatment villages
prior to the intervention and the success implementation of the project. Based on the social
capital information of each village collected during the baseline survey, we created three
social capital indices including (i) aggregate level of trust; (ii) level of collective action;
and (iii) level of social cohesion. Table 5.1.1 shows the impact of these initial conditions
on project success.
We find that one standard deviation increase in trust level increases the probability of
being selected as A-ranked villages (top 30 villages) by 22.5 percentage point and decreases
the probability of being selected as C-ranked villages (bottom 30 villages) by 18/2
percentage point. We find similar results for collective action as well as social cohesion.
Table 5.1.1: Impact of Social Capital on CDD Performance
(1) (2) (3) (4) (5) (6)
Dependent Variable: A-Ranked Village C-Ranked Village
Panel A:
Aggregate index of trust 0.170**(0.069)
0.182**(0.079)
0.225**(0.089)
-0.174**(0.075)
-0.169**(0.083)
-0.182**(0.092)
Basic Controls No Yes Yes No Yes Yes
Socio-economic Status No No Yes No No Yes
Observations 100 100 100 100 100 100
Panel B: Aggregate index of collective action
0.355***(0.132)
0.377**(0.149)
0.403**(0.166)
-0.297**(0.118)
-0.295**(0.131)
-0.281**(0.141)
Basic Controls No Yes Yes No Yes Yes
Socio-economic Status No No Yes No No Yes
Observations 100 100 100 100 100 100
Panel C:
Aggregate index of social cohesion 0.168(0.132)
0.217(0.142)
0.254*(0.152)
-0.257**(0.124)
-0.291**(0.133)
-0.330**(0.143)
Basic Controls No Yes Yes No Yes Yes
Socio-economic Status No No Yes No No Yes
Observations 100 100 100 100 100 100
Notes: Basic controls include (i) number of households in village; (ii) village population size; (iii) percentage of household’s part of major ethnic group; (iv) percentage of female-headed households; (v) percentage of married household head; (vi) percentage of Buddhist household head; and (vii) length of residency. Socio-economic status includes (i) percentage of household head with at least high school education; (ii) percentage of household head employed; (iii) percentage of household head working as farmer; (iv) percentage of household owning land; (v) monthly income.

Endline Report for the Self-Supporting Rural Development Project with Saemaul Undong's Participatory Approach in Myanmar 25
Similarly, villages with higher level of social capital are more likely to receive “A”
for two consecutive years, while those villages with lower social capital are more likely to
receive “C” for two consecutive years. One standard deviation increase in trust level is
associated with 15.8 percentage point increase in the probability of being selected as
A-ranked villages for two consecutive years, and a 10.7 percentage point decrease in the
probability of being selected as C-ranked villages for two consecutive years. We find
stronger impact for collective action. One standard deviation increase in collective action
level is associated with 23.4 percentage point increase in the probability of being selected
as A-ranked villages for two consecutive years and 34.6 percentage point decrease in the
probability of being selected as C-ranked villages for two consecutive years. Since
A-ranked villages in the first year are also likely to receive A-ranking in the second year,
we see similar results for Table 5.1.1 and Table 5.1.2.
Table 5.1.2: Social Capital on Performance of AA/CC Villages
(1) (2) (3) (4) (5) (6) AA Villages CC VillagesPanel A:
Aggregate index of trust 0.126* 0.140* 0.158* -0.122*** -0.111* -0.107*
(0.0691) (0.0755) (0.0803) (0.0429) (0.0562) (0.0631)
Basic controls o o o o
Socio-economic status o o
Observations 100 100 100 100 100 100
Panel B:
Aggregate index of collective action 0.201** 0.223** 0.244** -0.313*** -0.318*** -0.283**
(0.0930) (0.0998) (0.103) (0.109) (0.111) (0.116)
Basic controls o o o o
Socio-economic status o o
Observations 100 100 100 100 100 100
Panel C:
Aggregate index of social cohesion 0.212** 0.236** 0.234** -0.278* -0.296** -0.346***
(0.0883) (0.100) (0.111) (0.141) (0.137) (0.126)
Basic controls o o o o
Socio-economic status o o
Observations 100 100 100 100 100 100
Notes: Basic controls include (i) number of households in village; (ii) village population size; (iii) percentage of household’s part of major ethnic group; (iv) percentage of female-headed households; (v) percentage of married household head; (vi) percentage of Buddhist household head; and (vii) length of residency. Socio-economic status includes (i) percentage of household head with at least high school education; (ii) percentage of household head employed; (iii) percentage of household head working as farmer; (iv) percentage of household owning land; (v) monthly income.

26
However, as shown in Table 5.1.3 self-reported level of social capital is not correlated
with villages that received C in the first year but improved to B or A in the second year
or villages that received A in the first year but downgraded to B or C in the second year.
This finding suggests that while initial conditions are important for project success, other
factors such as leadership, teamwork, and governance can help overcome the unfavorable
initial conditions.
Table 5.1.3: Social Capital on Improvement or Downgrading of Village Performance
(1) (2) (3) (4) (5) (6)
Improving Villages(C to B or A)
Downgraded Villages(A to B or C)
Panel A:
Aggregate index of trust -0.0206 -0.0172 -0.0518 0.0476 0.0294 0.0492
(0.0477) (0.0571) (0.0658) (0.0464) (0.0460) (0.0467)
Basic controls o o o o
Socio-economic status o o
Observations 100 100 100 100 100 100
Panel B:Aggregate index of collective action -0.00366 0.0164 -0.0265 0.107* 0.0607 0.0437
(0.0752) (0.0799) (0.0867) (0.0567) (0.0573) (0.0611)
Basic controls o o o o
Socio-economic status o o
Observations 100 100 100 100 100 100
Panel C:Aggregate index of social cohesion 0.0134 0.0169 0.0353 -0.0459 -0.0352 -0.00540
(0.0524) (0.0666) (0.0684) (0.118) (0.103) (0.0972)
Basic controls o o o o
Socio-economic status o o
Observations 100 100 100 100 100 100
Notes: Basic controls include (i) number of households in village; (ii) village population size; (iii) percentage of household’s part of major ethnic group; (iv) percentage of female-headed households; (v) percentage of married household head; (vi) percentage of Buddhist household head; and (vii) length of residency. Socio-economic status includes (i) percentage of household head with at least high school education; (ii) percentage of household head employed; (iii) percentage of household head working as farmer; (iv) percentage of household owning land; (v) monthly income.
DD Estimation Results
By analyzing the three waves of data using the difference-in-difference strategy, we
examine the impact of the Myanmar rural community development project on social capital
and income generation. In order to examine the impact of the project on the level of trust,
we used 5-likert scale variables including (i) most people who live in this village can be

Endline Report for the Self-Supporting Rural Development Project with Saemaul Undong's Participatory Approach in Myanmar 27
trusted; (ii) in this village, it is unlikely someone will take advantage of you; (iii) trust in
strangers; (iv) trust in local government officials; (v) trust in central government officials;
and (vi) level of trust in this village improved. The interaction term between the midline
dummy and treatment dummy shows the impact at the midline, and the interaction term
between the endline dummy and treatment dummy shows the impact at the endline.
According to Table 5.2.1, while there are no changes in level of trust among village
members (column 1-3), there is an increase in trust level of local and central government
officers (column 4-5). This finding suggests the need for having a close relationship with
local and central officers (including MOALI) for successful implementation of the project.
The average trust level within the village (column) has increased by 0.199 standard
deviation at midline compared to the baseline, and by 0.139 standard deviation at endline
compared to the baseline. This shows that there has been an increase in trust level
throughout the project implementation.
Table 5.2.1: Trust in Different People
(1) (2) (3) (4) (5) (6)
Most people who live in this village
can be trusted.
In this village, it is
unlikely someone will
take advantage of
you.
Trust in strangers
Trust in local government
officials
Trust in central
government officials
Level of trust in this village
improved.
Midline * SMU -0.008 0.014 0.017 0.068*** 0.091*** 0.199***
(0.012) (0.021) (0.011) (0.020) (0.017) (0.032)
Endline * SMU -0.026* 0.000 0.006 0.059*** 0.106*** 0.139***
(0.014) (0.021) (0.019) (0.019) (0.017) (0.037)
SMU 0.030** 0.015 -0.018 -0.057*** -0.102*** 0.001
(0.012) (0.014) (0.011) (0.016) (0.014) (0.028)
Midline 0.045*** -0.017 0.038*** 0.020 0.020 -0.100***
(0.012) (0.020) (0.011) (0.016) (0.014) (0.027)
Endline 0.071*** -0.078*** 0.130*** 0.030* 0.027* 0.014
(0.012) (0.020) (0.015) (0.017) (0.015) (0.031)
Basic Controls O O O O O O
Region Fixed Effect O O O O O O
Constant 0.881*** 0.772*** 0.116*** 0.863*** 0.878*** 0.478***
(0.017) (0.032) (0.027) (0.031) (0.031) (0.037)
Observations 25,361 25,361 25,361 25,361 25,361 25,361
R-squared 0.021 0.016 0.028 0.028 0.036 0.047
Notes: For column (1) – (5), 5-Likert scale variables are converted into dummy variables. Control variables include female-headed household, marital status of household head, household head’s religion, education level of household head, land ownership, and residency length. Region fixed effects are included and standard errors are clustered at village-level.

28
In Table 5.2.2, we examine the impact of the Myanmar rural community development
project on collective action. In order to measure the level of collective action, we ask
respondents the following questions - (i) in the past 12 months, if they have worked with
others in your village/neighborhood to do something for the benefit of the community; (ii)
if more than half of people in this village/neighborhood contribute time or money toward
common development; and (iii) if there was a water supply problem in this community,
how likely it is that people will cooperate to try to solve the problem. While we do not
find any statistically significant impact on collective action, we find that village members
living in treatment villages are more likely to contribute their time and money for their
village development by 0.085 standard deviation compared to those living in control
villages. However, this impact disappears in the endline.
Table 5.2.2: Collective Action
(1) (2) (3)
In the past 12 months, have you worked with others in
your village/neighborhood to do something for the benefit
of the community?
More than half of people in this village/neighborhood contribute time or money
toward common development
If there was a water supply problem in this community, how likely is it that people
will cooperate to try to solve the problem?
Midline * SMU 0.013 0.085*** 0.004
(0.013) (0.021) (0.010)
Endline * SMU 0.008 0.022 -0.004
(0.013) (0.024) (0.012)
SMU 0.009 0.037** 0.024***
(0.011) (0.015) (0.007)
Midline 0.009 -0.097*** 0.002
(0.014) (0.021) (0.011)
Endline -0.008 -0.055*** 0.001
(0.013) (0.020) (0.013)
Basic Controls O O O
Region FE O O O
Constant 0.902*** 0.789*** 0.911***
(0.033) (0.031) (0.015)
Observations 24,522 25,361 25,361
R-squared 0.027 0.031 0.011
Notes: For column (3), 5-Likert scale variable is converted into a dummy variable. Control variables include female-headed household, marital status of household head, household head’s religion, education level of household head, land ownership, and residency length. Region fixed effects are included and standard errors are clustered at village-level.

Endline Report for the Self-Supporting Rural Development Project with Saemaul Undong's Participatory Approach in Myanmar 29
In Table 5.2.3, we look at the impact of the project on social cohesion. Specifically,
we investigate its impact on (i) how strong the feeling of togetherness or closeness in
their village/neighborhood is; (ii) if any differences cause problems; and (iii) if there are
any community activities in which they are not allowed to participate. We find that the
project did not have any impact on social cohesion.
Table 5.2.3: Social Cohesion
(1) (2) (3)
VARIABLESHow strong is the feeling of togetherness or closeness in your village/neighborhood?
Do any differences cause problems?
Are there any community activities in which you are not allowed to participate?
Midline * SMU -0.003 -0.013 0.003
(0.006) (0.024) (0.003)
Endline * SMU -0.009 0.004 0.007
(0.008) (0.018) (0.004)
SMU 0.016*** -0.020* -0.003**
(0.005) (0.011) (0.001)
Midline 0.025*** 0.114*** -0.013***
(0.007) (0.022) (0.003)
Endline 0.016* 0.047*** -0.020***
(0.008) (0.017) (0.005)
Constant 0.933*** 0.058*** 0.992***
(0.012) (0.022) (0.004)
Basic Controls O O O
Region FE O O O
Observations 25,361 25,361 25,361
R-squared 0.005 0.037 0.006
Notes: For column (1), 5-Likert scale variable is converted into a dummy variable. Control variables include female-headed household, marital status of household head, household head’s religion, education level of household head, land ownership, and residency length. Region fixed effects are included and standard errors are clustered at village-level.
In Table 5.2.4, we examine if the project improves the availability of public goods in
the village. We examined the availability of (i) garbage collection service; (ii) public
sewage system; (iii) public standpipe; and (iv) public transport system. Since garbage
collection and public sewage systems were part of the improving environment projects, we
see a large impact on the availability of these two services as expected. The availability of
garbage collection service increased by 0.263 standard deviation at the midline, and by
0.299 standard deviation at the endline. The availability of public sewage system increased
by 0.33 standard deviation at the midline, and by 0.22 standard deviation at the endline.
Many villages also reported to have installed public water tanks but we do not see a

30
statistically significant impact. Finally, public transport system was not part of the rural
community development project and thus we see statistically insignificant impact with
coefficient close to 0.
Table 5.2.4: Provision of Public Goods
(1) (2) (3) (4)Garbage Collection
ServicePublic Sewage
System Public Standpipe Public Transport System
Midline * SMU 0.263*** 0.330*** 0.049 -0.000
(0.043) (0.041) (0.048) (0.075)
Endline * SMU 0.299*** 0.220*** -0.037 -0.009
(0.076) (0.058) (0.049) (0.111)
SMU 0.026 0.003 0.122*** 0.163**
(0.017) (0.007) (0.030) (0.072)
Midline 0.022 0.052** 0.058* -0.049
(0.016) (0.021) (0.033) (0.059)
Endline 0.170*** 0.279*** -0.001 0.061
(0.054) (0.048) (0.032) (0.091)
Constant -0.108 -0.068 -0.068* 0.163
(0.077) (0.067) (0.038) (0.130)
Basic Controls O O O O
Region FE O O O O
Observations 25,361 25,361 25,361 25,361
R-squared 0.250 0.247 0.089 0.081
Notes: The dependent variables in column (1) – (3) ask the fraction of community served by the service and the variables are converted into dummy variables so that 1 equals to most of the community being served by the service. Control variables include female-headed household, marital status of household head, household head’s religion, education level of household head, land ownership, and residency length. Region fixed effects are included and standard errors are clustered at village-level.
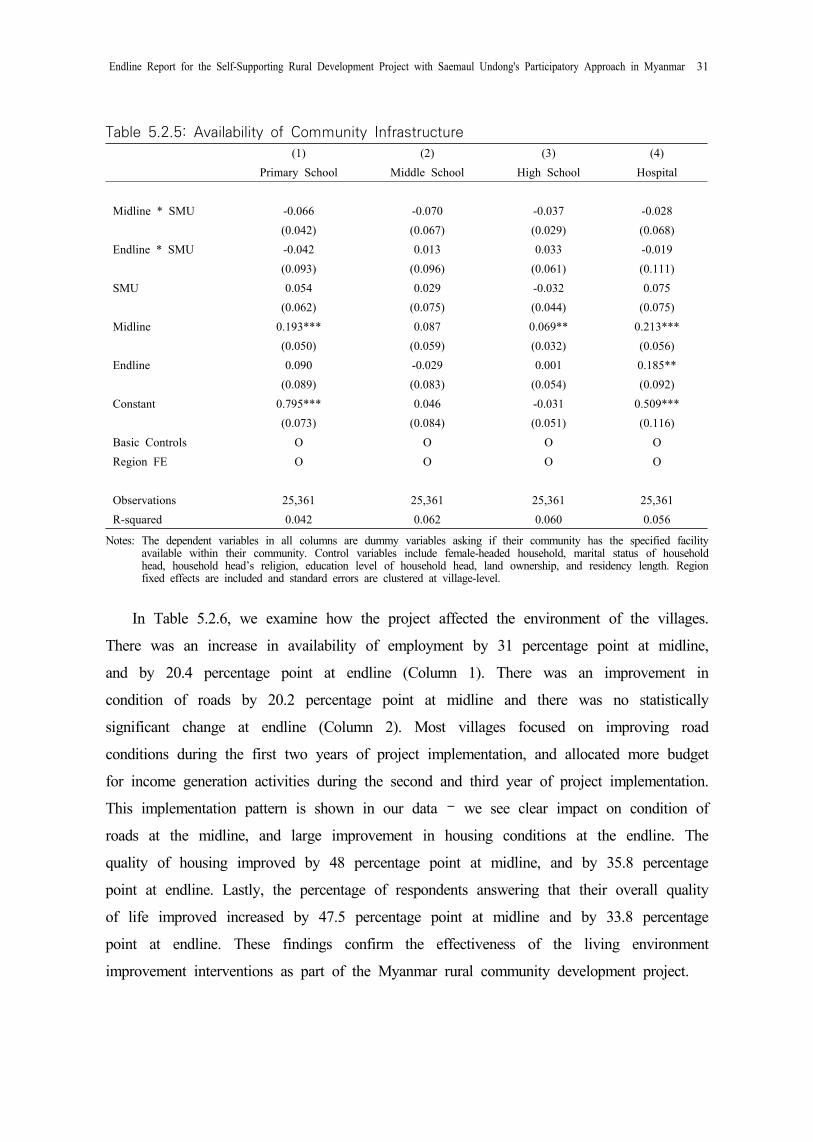
Similarly, the project did not aim to increase the availability of schools or hospitals,
and thus as shown in Table 5.2.5, we do not see any impact on availability of schools or
hospitals.
Endline Report for the Self-Supporting Rural Development Project with Saemaul Undong's Participatory Approach in Myanmar 31
Table 5.2.5: Availability of Community Infrastructure
(1) (2) (3) (4)
Primary School Middle School High School Hospital
Midline * SMU -0.066 -0.070 -0.037 -0.028
(0.042) (0.067) (0.029) (0.068)
Endline * SMU -0.042 0.013 0.033 -0.019
(0.093) (0.096) (0.061) (0.111)
SMU 0.054 0.029 -0.032 0.075
(0.062) (0.075) (0.044) (0.075)
Midline 0.193*** 0.087 0.069** 0.213***
(0.050) (0.059) (0.032) (0.056)
Endline 0.090 -0.029 0.001 0.185**
(0.089) (0.083) (0.054) (0.092)
Constant 0.795*** 0.046 -0.031 0.509***
(0.073) (0.084) (0.051) (0.116)
Basic Controls O O O O
Region FE O O O O
Observations 25,361 25,361 25,361 25,361
R-squared 0.042 0.062 0.060 0.056
Notes: The dependent variables in all columns are dummy variables asking if their community has the specified facility available within their community. Control variables include female-headed household, marital status of household head, household head’s religion, education level of household head, land ownership, and residency length. Region fixed effects are included and standard errors are clustered at village-level.
In Table 5.2.6, we examine how the project affected the environment of the villages.
There was an increase in availability of employment by 31 percentage point at midline,
and by 20.4 percentage point at endline (Column 1). There was an improvement in
condition of roads by 20.2 percentage point at midline and there was no statistically
significant change at endline (Column 2). Most villages focused on improving road
conditions during the first two years of project implementation, and allocated more budget
for income generation activities during the second and third year of project implementation.
This implementation pattern is shown in our data – we see clear impact on condition of
roads at the midline, and large improvement in housing conditions at the endline. The
quality of housing improved by 48 percentage point at midline, and by 35.8 percentage
point at endline. Lastly, the percentage of respondents answering that their overall quality
of life improved increased by 47.5 percentage point at midline and by 33.8 percentage
point at endline. These findings confirm the effectiveness of the living environment
improvement interventions as part of the Myanmar rural community development project.

32
Table 5.2.6: Impact on Community Characteristics
(1) (2) (3) (4)
Availability of employment
Condition of roads
Quality of housing
Overall quality of life
Midline * SMU 0.310*** 0.202** 0.480*** 0.475***
(0.070) (0.095) (0.056) (0.062)
Endline * SMU 0.204** 0.093 0.358*** 0.338***
(0.090) (0.103) (0.073) (0.070)
SMU 0.191*** 0.121 -0.064 0.023
(0.059) (0.084) (0.052) (0.049)
Midline 0.256*** 0.641*** 0.197*** 0.108*
(0.063) (0.080) (0.060) (0.056)
Endline 0.367*** 0.785*** 0.467*** 0.347***
(0.090) (0.091) (0.075) (0.067)
Constant 3.168*** 3.592*** 3.581*** 3.530***
(0.091) (0.098) (0.084) (0.070)
Basic Controls O O O O
Region FE O O O O
Observations 25,361 25,361 25,361 25,361
R-squared 0.099 0.182 0.165 0.122
Notes: The dependent variables of columns (1) – (4) are 5-Likert scale variables and are converted into dummy variables. Each dummy variable equals to 1 when the respondents answerd ‘improved’ or ‘strongly improved’. Control variables include female-headed household, marital status of household head, household head’s religion, education level of household head, land ownership, and residency length. Region fixed effects are included and standard errors are clustered at village-level.
The main outcome variable for the Myanmar rural community development project is
income generation. The major activity for income generation was microfinance. Village
members of treatment villages started different income generation activities by borrowing
micro-loans. Table 5.2.7 shows that at midline access to microfinance increased by 48.5
percentage point and by 35.2 percentage point at endline. While there was no significant
impact on employment, household income increased by 22.3 percentage point at midline
and by 23.9 percentage point at endline. These results show that the income generation
project had an impact of greatly improving household income, and the results are
significant throughout the midline as well as endline.

Endline Report for the Self-Supporting Rural Development Project with Saemaul Undong's Participatory Approach in Myanmar 33
Table 5.2.7: Impact on Income Generation
(1) (2) (3)
Access to microfinance Employed Log of income
Midline * SMU 0.485*** -0.029 0.223***
(0.051) (0.029) (0.052)
Endline * SMU 0.352*** -0.049 0.239**
(0.046) (0.031) (0.095)
SMU -0.266*** 0.075*** -0.030
(0.041) (0.013) (0.059)
Midline -0.270*** -0.396*** 0.174***
(0.049) (0.029) (0.055)
Endline 0.030 -0.349*** 0.116
(0.047) (0.0271) (0.085)
Constant 0.648*** 0.683*** 6.935***
(0.050) (0.035) (0.088)
Basic Controls O O O
Region FE O O O
Observations 25,361 25,361 21,139
R-squared 0.143 0.133 0.090
Notes: The dependent variable in column (1) is whether the household had access to microfinance, village credit union or financial cooperative such as ROSCA (Rotating Saving and Credit Association) in their village or in the neighboring villages in the past 12 months. The dependent variable in column (2) is whether the household head is currently employed. The dependent variable in column (3) is the log of total income of the household including regular and seasonal income.
In summary, the rural community development project in Myanmar had an impact of
increasing level of social capital, and the availability of public goods including garbage
collection services and public sewage systems. The overall quality of life also greatly
improved and household income also increased. This result shows that the project was
successful in meeting the initial project objectives. Due to the limitation of the research
design, it is impossible to show perfect causation of the project. At the same time, we
control for time-invariant variables in our analysis, and thus the results can be considered
as robust impact evaluation findings.
Lab-in-the-Field Results
For the analysis of the behavioral experiments results, we will be following the
pre-analysis plan and analyze the Myanmar results together with the Cambodia results. In
this report, we will be looking at the results of the public goods game conducted during
the midline survey.
The overall impact evaluation of the Myanmar rural community development project
was conducted with a difference-in-difference analysis comparing the treatment villages and

34
the control village. Considering the limitations of the research design, we also introduced
an RCT-based behavioral experiments to analyze the impact of the differential incentive
system on social capital. We randomly assigned the households in both the treatment and
control villages into two groups – (i) competition group where we introduce inter-village
competition component during the behavioral experiments; and (ii) non-competition group.
The first step in analyzing an RCT-based study is to determine whether the mean
characteristics of the treatment and control groups are balanced. Table 5.3.1 shows that the
treatment and comparison groups of the public goods game have similar characteristics on
average. Column 3 shows that the treatment and control groups are balanced in terms of
(i) female-headed households; (ii) marital status; (iii) education level of household head;
(iv) ethnicity; (v) religion; (vi) land ownership; (vii) length of residency; (viii) employment
status of household head; (ix) household head as farmer; and (x) asset index. The
percentage of household head with at least primary school education is slightly higher in
the treatment group (31.3%) compared to the (29.4%). Similarly, Table 5.3.2 shows that
the treatment and comparison groups of the joint investment game have similar
characteristics on average.
Table 5.3.1: Randomization Balance: Public Goods Experiment
(1) (2) (3)
Non-Competition Competition T-Test
Variable Mean/SE Mean/SE Coefficient/SE
Female-Headed Household 0.531 0.534 0.00238
[0.013] [0.013] (0.0108)
Married Household Head 0.763 0.776 0.0121
[0.008] [0.008] (0.00913)Household Head with at least primary school education 0.294 0.313 0.0189*
[0.015] [0.014] (0.00997)Household Head as Major Ethnicity 0.866 0.864 -0.00247
[0.026] [0.026] (0.00740)Buddhist Household Head 0.971 0.973 0.00219
[0.009] [0.008] (0.00357)Household owning land 0.463 0.473 0.0101
[0.018] [0.018] (0.0108)Length of residency over 45 years 0.436 0.431 -0.00511
[0.012] [0.012] (0.0107)Household Head Employed 0.581 0.587 0.00671
[0.016] [0.016] (0.0107)Household Head as Farmer 0.301 0.310 0.00908
[0.015] [0.016] (0.00998)Asset Index -0.010 0.010 0.0200 [0.072] [0.070] (0.0353)

Endline Report for the Self-Supporting Rural Development Project with Saemaul Undong's Participatory Approach in Myanmar 35
Table 5.3.2: Randomization Balance: Joint Investment Experiment
(1) (2) (3)
Control Competition T-Test
Variable Mean/SE Mean/SE Coeff./SE
Female-Headed Household0.491 0.490 -0.000892
[0.014] [0.016] (0.0134)
Married Household Head0.790 0.791 0.00188
[0.008] [0.010] (0.0109)
Household Head with at least primary school education
0.299 0.311 0.0121
[0.012] [0.016] (0.0123)
Household Head as Major Ethnicity0.835 0.841 0.00634
[0.028] [0.026] (0.00988)
Buddhist Household Head0.979 0.972 -0.00629
[0.010] [0.010] (0.00405)
Household owning land0.497 0.515 0.0181
[0.018] [0.019] (0.0134)
Length of residency over 45 years0.478 0.469 -0.00962
[0.013] [0.015] (0.0134)
Household Head Employed0.621 0.634 0.0135
[0.015] [0.019] (0.0130)
Household Head as Farmer0.124 0.133 0.00917
[0.010] [0.011] (0.00892)
Asset Index-0.005 0.014 0.0188
[0.066] [0.074] (0.0443)
Table 5.3.3 shows that the impact of inter-village competition is limited. The
coefficient for the competition dummy is 0.00483 (column 2) which is close to 0 and
insignificant. While the percentage of donation for the non-competition group in comparison
villages is 65.5 percent, the percentage of donation is higher in the SMU villages by 14.6
percentage point (22.3%). This implies that the level of social capital in the SMU villages
is higher than that in the comparison villages which is an indirect evidence of the impact
of the Myanmar rural community development project on social capital.
Similarly, the inter-village competition does not have any significant impact on
investment decision during the joint investment game (Column 4). At the same time,
households in the SMU villages are 1.96 percentage point more likely to invest in the
joint investment game compared to households in the comparison villages. In case of the
joint investment experiment, most of the survey participants (93.3%) decided to invest
during the experiment and there is limited room for the inter-village competition.

36
Table 5.3.3: Impacts of Inter-village Competition on Public Goods and Joint Investment
(1) (2) (3) (4)
Village Donation (%) Decided to Invest
Competition 0.00402 0.00483 0.0141** -0.000658
(0.00550) (0.0101) (0.00565) (0.0128)
SMU 0.146*** 0.0194**
(0.0227) (0.00906)
Competition * SMU -0.00123 0.0223
(0.0121) (0.0141)
Observations 8,515 8,515 8,371 8,371
R-squared 0.080 0.127 0.010 0.013
Mean of dependent variable 0.755 0.655 0.945 0.933
Robust standard errors are in parentheses. Control variables include (i) ethnicity of a household head; (ii) female-headed household; (iii) married household head; (iv) Buddhist household head; (v) length of residency over 45 years; (vi) household head with at least high school education; (vii) household head employed; (viii) household head working as a farmer; (ix) household owning land; (x) asset index; (xi) community has access to market; (xii) community has public transport system; (xiii) community has primary school; and (xiv) community has hospital. *** p<0.01, ** p<0.05, * p<0.1
To summarize the results of the behavioral experiment, the inter-village competition
does not significantly affect the donation made during the public goods experiment and the
investment decision during joint investment experiment. Due to the high giving culture of
Myanmar, it is important to consider that there is limited room for the impact of
competition on the percentage of donation or decision to invest.
In case of SMU villages, the percentage of donation to the village joint fund and the
percentage investing in joint investment project under uncertainty was statistically
significantly higher than that of the control village. It can be interpreted as evidence that
the level of social capital is higher in SMU villages than control villages. Lastly, the
behavioral experiments for designed for two countries including Myanmar and Cambodia.
In the Pre-Analysis Plan, the research team planned to analyze both Cambodia and
Myanmar. While the lack of impact of the inter-village competition in Myanmar may have
resulted from the high level of social capital in the country (the ceiling effect), we may
expect positive impact of inter-village competition in Cambodia due to the low level of
social capital in the country. While we have not included the results for Cambodia in this
report, there is a positive impact of inter-village competition on the percentage of donation
and decision to invest. The impact of inter-village competition was especially shown among
SMU villages possibly since households in the SMU villages have experienced differential
incentive system based on inter-village competition.

Endline Report for the Self-Supporting Rural Development Project with Saemaul Undong's Participatory Approach in Myanmar 37
Discussion
The Myanmar rural community development project is the largest impact evaluation
study implemented by KOICA. At the same time, the impact evaluation design suffers
from some limitations, and this section provides suggestions for future impact evaluation
studies.
Random selection of project villages
When discussing the master plan with the recipient country regarding the
implementation of a development project, different decisions need to be made including the
selection of project villages. Ideally, selection of recipient households should be based on
humanitarian perspective. However, political, economic, cultural and social factors are
considered when deciding the project villages. For this reason, it is difficult to argue for
random selection of project villages for a rigorous impact evaluation. At the same time,
many recipient countries are interested in a rigorous evaluation of a project in order to
expand and continue development projects.
When discussing the master plan for development projects with recipient countries, we
can consider two types of impact evaluation based on randomized controlled trial. First,
after considering different aspects, we can reduce the candidate for project villages to
twice, and randomly select half of the candidate villages. As an alternative way, we can
select project villages and randomly select half of the villages to receive the intervention
and implement the intervention in the remaining villages after the end of the impact
evaluation study. In this case, the project will be implemented in all of the recipient
villages at a different timeline. One important point is that we should discuss with the
recipient countries that we can implement a rigorous impact evaluation design without
changing the master plan.
The Millennium Villages Project is a large-scale rural community development project
implemented from 2005 to 2015 benefiting 500,000 people in 10 African countries with a
budget over 200 billion won. The project aimed to achieve the Millennium Development
Goals related to agriculture, education, health, hygiene, environment, and capacity building,
and reached great progress in eradicating poverty and achieving the Millennium
Development Goals (Sachs, 2018; Mitchell et al. 2018). When selecting the project villages
in the beginning, the project failed to select control villages which was regarded as a
38
limitation in scientifically evaluating the project (Clemens and Demombynes, 2011). If the
Millennium Village Project could have been scientifically tested based on a strict impact
evaluation design, the project would have spread to other African and developing countries
after the end of the project.
In case of the KOICA Myanmar rural community development project, we conducted a
difference-in-difference method as we were not able to randomly select the control villages.
Although it can be evaluated as an improvement of the Millennium Villages Project, it is
still difficult to conduct a rigorous evaluation as the baseline characteristics between the
treatment and control villages are not balanced. KOICA and the Myanmar government
decided to implement the second five-year Rural Community Development Project from
2022. If we randomly select the project villages as well as the beneficiaries prior to the
implementation of the project, we expect to have an advanced impact evaluation design
compared to the first five-year project evaluation.
Implementation of Impact Evaluation
There was no discussion on the impact evaluation of the Myanmar rural community
development project until 2015, and the rural community development project was
spontaneously added. For this reason, the implementation of the baseline survey was
postponed and there was a gap of 10-months between the baseline data collection of
project villages and that of control villages. Apart from these research-related limitations,
there were other difficult situations while implementing the impact evaluation. In this
section, we critically evaluate the implementation of the impact evaluation, and provide
recommendations for future impact evaluation projects.
For the Myanmar rural community development project, Korea Rural Community
Corporation served as the implementing agency in the field (PC), and Korea Institute for
Development Strategy managed the project (PM). The Korea Institute for Development
Strategy covered personnel expenses and travel expenses related to the impact evaluation
and helped the research team carry out the project. At the same time, data collection
expenses were covered by the Korea Rural Community Corporation. As described above,
the survey budget, which was reflected in the budget of the Korea Rural Community
Corporation, only considered the survey cost for 100 project villages. The cost for the
remaining 50 villages was supported by the KDI School of Public Policy and Management.
At that time, the KOICA managed the impact evaluation work for the Myanmar rural
community development project by the Rural Development Team. As the Rural

Endline Report for the Self-Supporting Rural Development Project with Saemaul Undong's Participatory Approach in Myanmar 39
Development Team disappeared after the restructuring of KOICA, the impact evaluation
work was transferred to the newly established Department of Economic and Social
Development. Subsequently, the impact evaluation work was finally transferred to Southeast
Asia Team. The impact evaluation work was coordinated by the department in charge of
the project, not the evaluation team of KOICA, and the KOICA office in Myanmar
actively supported the Korea Rural Community Corporation, implementing agency in the
field, and the impact evaluation field work. In other words, the implementing system of
the impact evaluation research has been fragmented, and had to rely on the goodwill of
PC, PM, KOICA headquarters, and KOICA local offices.
The impact evaluation research design is closely connected to the implementation
method, and thus it is effective for the implementing agency (PC) to take charge of the
impact evaluation project. At the same time, the independence of the impact evaluation
study may be questioned when the implementing agency conducts the evaluation. Therefore,
under the assumption that the PM is empowered to have a practical influence on the PC,
it is advisable for the PM to manage the impact evaluation work. Similarly, in the case of
the representative flagship project impact assessment promoted by KOICA, it is necessary
to consider the impact assessment work in the KOICA evaluation office rather than the
impact assessment work conducted by the department responsible for the actual business
within KOICA. Similarly, in case of an impact evaluation of the flagship project by
KOICA, it is recommended for the KOICA evaluation office, instead of the implementing
office, to conduct the impact evaluation work. It is not necessary to conduct impact
evaluation study for all of the projects by KOICA. Most of the projects can be evaluated
using the process evaluation method or PDM.
In summary, for KOICA projects undergoing rigorous impact evaluation, the PM (not
the implementing agency) should independently conduct the impact evaluation project. Also,
the project should be managed by the evaluation office of the KOICA, while other
KOICA offices and field offices support the project.
Feedback Method of Impact Evaluation
The feedback process, which enhances the efficient implementation of impact evaluation
findings into policies, is the fundamental reason for conducting impact evaluation.
(Sanderson, 2002; Parsons, 2002). However, one of the important issues to consider when
establishing evidence-based policies is how to balance the rigor of impact evaluation and
the timeliness of the feedback. The more rigorous impact evaluation results are pursued,

40
the longer it takes for the evaluation results to be derived. In particular, understanding the
long-term effect of a specific project or program literally takes a long time. From the
standpoint of enforcing programs and policies, policymakers are likely to prefer a real-time
feedback.
In the case of the Myanmar rural community development project, the baseline survey
was conducted in 2016 and the endline survey was completed in 2019. It took about 4
years to complete the baseline survey, midline survey, and endline survey, and in the
process, a feedback process was not established to reflect the results of the impact
evaluation. Due to the nature of the impact evaluation, the impact evaluation results can
only be found after the completion of the endline survey. At the same time, we regret that
we were not able to regularly share the summary statistics or pre-post analysis of the
project with the implementing agencies.
In the future, when conducting a large-scale impact evaluation research on the KOICA
flagship development project, it is necessary to approach the evaluation results in a
systematic manner. It is also necessary to institutionalize from the beginning of the project
how to provide timely feedbacks on the impact evaluation, which is conducted over a long
period of time, while analyzing rigorous causal evidence through a randomized controlled
trial method. Considering that the impact evaluation results can be derived after the end of
the project, we can consider sharing the summary statistics, before and after analysis, and
correlation analysis immediately after the baseline survey through meetings and seminars.
At the same time, it will be desirable for the KOICA evaluation office to institutionalize
the feedback process.
Conclusion
This impact evaluation report evaluates the Myanmar rural community development
project implemented jointly by the Korea International Cooperation Agency (KOICA) and
the Ministry of Agriculture, Livestock, and Irrigation (MOALI) over the past five years
(2014-2019). The effectiveness of the project is analyzed by combining an experimental
and quasi-experimental evaluation method. During the beginning of the project, it was not
possible to set up a control group and perform a rigorous randomized controlled trial. As
we set up the control villages ex-post to perform a strict impact evaluation, we conducted
a difference-in-difference, which is a quasi-experimental evaluation method. Also, we
randomly assigned sampled households into two groups in order to understand the effect of

Endline Report for the Self-Supporting Rural Development Project with Saemaul Undong's Participatory Approach in Myanmar 41
differential incentive payment through inter-village competition, which is a key mechanism
of the Korean rural community development project.
The results of the impact evaluation are as follows. First, we empirically tested if
villages with higher social capital are likely to perform better in implementing the
community-driven development project than other villages. We found that villages with
higher level of social capital are more likely to be selected as A-ranked villages for the
first two years, while villages with low level of trust are more likely to be selected as
C-ranked villages for the first two years. However, this level of existing social capital
cannot explain the pattern for the villages where performances were improved or
downgraded. This finding implies that other factors such as the role played by local
leaders, village development project governance, or implementation process of the project
may be more important in explaining the changes in implementation success of village
development projects.
In order to examine the impact of the Myanmar rural community development project,
we also conducted a difference-in-difference analysis using the baseline, midline and
endline surveys conducted in both the treatment and control villages. The project increased
the level of social capital by 0.2 standard deviation and improved the level of trust
towards local and central government officials as well as collective action among village
members. There were also improvements in road and housing conditions as well as the
availability of public goods including garbage collection services and public sewage
systems. Regarding the income generation projects, there was a great increase in access to
microfinance, and household income increased by 22-24%. In summary, the
difference-in-difference approach shows that the project increased the level of social capital,
living environment and household income.
Lastly, the behavioral experiment results show that inter-village competition, which is
the key mechanism for the Korean rural community development project, does not have a
statistically significant impact. Myanmar has consistently ranked at the top of the World
Giving Index, which shows the strong giving culture in Myanmar. The initially high level
of social capital in Myanmar suggests that there is limited room for impact of CDD
projects on building social capital in the country. For this reason, we are planning to
analyze the behavioral experiment results jointly for Myanmar and Cambodia as written in
the Pre-Analysis Plan.
The Myanmar Rural Community Development Project has great significance in that it
is the first large-scale impact evaluation research conducted by KOICA. A number of

42
problems were identified in the process of planning the impact evaluation, but together
with KOICA, KOICA Myanmar Office, Korea Rural Community Corporation, Korea
Development Strategy Institute, and KDI School of Public Policy and Management, we
were able to successfully complete the five-year impact evaluation study. In the future,
when conducting such a large-scale impact evaluation study, it is needed to improve the
following points – (i) randomly selecting treatment and control villages prior to the start
of the project; (ii) the governance system to efficiently conduct the impact evaluation
study, and (iii) the feedback process that meets balance between rigorousness and
timeliness. If we improve the afore-mentioned points, we expect that KOICA will play a
leading role in aid effectiveness and evidence-based policy making among international
donor agencies.
References
Angrist, Joshua, and Jorn-Steffen Pischke. 2010. “The Credibility Revolution in Empirical Economics: How Better Research Design is Taking the Con out of Econometrics,” Journal of Economic Perspectives 24(2): 3-30.
Cha, Seungman, et al. 2015. “The effect of improved water supply on diarrhea prevalence of children under five in the Volta region of Ghana: a cluster-randomized controlled trial.” International journal of environmental research and public health 12(10): 12127-12143.
Choi, E. Seul, and Booyuel Kim. 2016. "A Beginner's Guide to Randomized Evaluations in Development Economics." Seoul Journal of Economics 29(4): 529-552.
Clemens, M.A. and Demombynes, G., 2011. “When does rigorous impact evaluation make a difference? The case of the Millennium Villages,” Journal of Development Effectiveness, 3(3), pp.305-339.
Duflo, Esther, Rachel Glennerster, and Michael Kremer. 2007. “Using randomization in development economics research: A toolkit,” Handbook of development economics 4: 3895-3962.
Duflo, Esther, and Michael Kremer. 2005. “Use of randomization in the evaluation of development effectiveness,” Evaluating development effectiveness, 7: 205-231.
Gertler, Paul J., Sebastian Martinez, Patrick Premand, Laura B. Rawlings, and Christel MJ Vermeersch. Impact Evaluation in Practice. The World Bank, 2016.
Grootaert, C., Narayan, D., Jones, V. N., and Woolcock, M. 2004. “Measuring Social Capital: An Integrated Questionnaire.” World Bank working paper 18.
Grootaert, C., and Van Bastelaer, T. 2002. “Instruments of the Social Capital Assessment Tool.” In Understanding and Measuring Social Capital: A multidisciplinary tool for practitioners. Washington, D.C.: World Bank Publications.
Leamer, Edward. 1985. “Sensitivity Analyses Would Help,” American Economic Review, 75(3):308-313.

Endline Report for the Self-Supporting Rural Development Project with Saemaul Undong's Participatory Approach in Myanmar 43
Mitchell S, Gelman A, Ross R, et al. 2018. “The Millennium Villages Project: a retrospective, observational, endline evaluation,” Lancet Glob Health 2018;6: e500–13.
Parsons, Wayne. 2002. "From muddling through to muddling up-evidence based policy making and the modernisation of British Government." Public Policy and Administration 17.3: 43-60.
Rubin, Donald. 1974. “Estimating causal effects of treatments in randomized and nonrandomized studies,” Journal of Educational Psychology, 66(5): 688-701.
Sachs, Jeffrey D. 2018. “Lessons from the Millennium Villages Project: a personal perspective,” Lancet Global Health 2018;6: e472-e474.
Sanderson, Ian. 2002. "Evaluation, policy learning and evidence‐based policy making." Public administration 80.1: 1-22.

44
Appendix 1
Public Goods Experiment Instruction
We invite you to one brief exercise before the survey starts. This exercise
involves real money reward.
We will give you two envelopes. One envelope printed with “YOU” contains
5000 Myanmar Kyat (25 bills of 200 Kyat), and the other one printed with
“VILLAGE” is empty. You will be asked to make a donation out of the 5000 Kyat
to your village. Your donation to the village will be used for your community - for
example improving the road, public schools, or public hospitals. Note that your
decision will be kept strictly private and confidential.
● “YOU” envelope ● “VILLAGE” envelope
● Initially with 5000 Kyat ● Initially empty
● This is for yourself ● This is for donation
Once you decide on the amount of money to donate to your village, please go to
an isolated area and reallocate the amount from the “YOU” envelope to the
“VILLAGE” envelope. Please remember that you can choose not to donate any
amount to the village. The remaining amount in the “YOU” envelope becomes your
money reward. After you keep the “YOU” envelope in a safe place, please bring
back the “VILLAGE” envelope to the enumerator and enter the “amount of your donation” in the tablet. Please make sure the amount in the “VILLAGE” envelope
matches the amount entered in the tablet.
The other survey participants of your village will make similar decisions. At the
end of the survey, we will calculate the total amount of donation made by the
VILLAGEYOU

Endline Report for the Self-Supporting Rural Development Project with Saemaul Undong's Participatory Approach in Myanmar 45
participants of your village.
In addition to the total amount of donation, your village will have an opportunity
of earning extra money. 150 villages in Myanmar including your village will join a
competition through the amount of donation. We will rank 150 villages in terms of
the average amount of donation made by participants. If your village belongs to the
group of the top 50 villages (ranked between 1st and 50th), your village will earn
100,000 Myanmar Kyat. If your village belongs to the group of the next 50 villages
(ranked between 51st and 100th), your village will earn 50,000 Myanmar Kyat. If
your village belongs to the group of the bottom 50 villages (ranked between 101st
and 150th), your village will receive no extra bonus. If your village and other villages
made same average amount of donation, we will randomly decide the ranking of your
village and other villages. These extra money rewards will be added to the total
village donation.
Two months after completing the survey, the village assembly meeting will be
organized. At that time we will revisit your village and deliver your village chief the
total amount of donation made by the participants of your village plus any extra
money your village earns. Again, no one in your village will know how much you
keep for yourself or donate for the village

46
Appendix 2
Instruction for Joint Investment Experiment
Thank you very much for your time to participate in this survey. As a token of
appreciation, you are given 2,000 Kyat. Please, check whether you have 2,000 Kyat.
This is your money and you can use it for your personal use. Please, put this
envelope in your personal closet in your room and come back here to participate in
the survey.
We invite you to one brief task before the survey starts. Each task involves real
money reward.
In this task you will be given 2,000 Myanmar Kyat. You will be asked to decide
how to use this money between two options. You can either keep this money for
your personal use or invest this money to a joint project in which the other
participants of your village can join. The total number of participants who make this
decision in your group is 14.
If you decide to keep this money for your personal use, your earnings in this task
is simply 2,000 Kyat.
If you decide to invest this money to a joint project, your earnings in this task
will depend on whether a joint project succeeds or fails. If the project succeeds, you
will earn two times of 2,000 Kyat (that is, 4,000 Kyat). If it fails, you will earn
nothing (that is, 2,000 Kyat that you invested will be lost).
The chance of the project succeeding will depend on how many participants out
of 14 participants invest their money to the project. Specifically, the chance of the
project succeeding will be equal to the ratio of the number of investors to 25:
[Explanation of Probability Concept with Beans]
Please prepare 14 white beans, 25 black beans, and a plastic bag. Please explain first
that the participant can think of the white beans as “participants in his/her village that
invest their money,” and the total number of beans should equal to 25 in any case. If
higher number of participants invest their money, winning probability increases. If there are

Endline Report for the Self-Supporting Rural Development Project with Saemaul Undong's Participatory Approach in Myanmar 47
higher number of white beans in the bag, the probability of picking a white bean
increases.
1. Put one white bean and 24 black beans in the bag (this case means that you are
the only investor in your group and all of the others do not invest). Then, shuffle the
beans without looking inside the bag. Ask a survey participant how likely it is to
select the white bean out of 25 beans?
(1) Very unlikely
(2) Unlikely
(3) Equal chance
(4) Likely
(5) Very Likely
Answer should be (1) Very unlikely or (2) Unlikely
2. Put 5 white beans and 20 black beans in the bag (This case means that five
participants including you in your group invest and nine other participants do not
invest). Then, shuffle the beans without looking inside the bag. Ask the following
question to the survey participant: “Compared to the previous case where we only
have one white bean in the bag, do you think the probability of picking a white bean
increased or decreased?”
(1) Increased
(2) Stay the same
(3) Decreased
Answer should be (1) Increased
3. Put 10 white beans and 15 black beans in the bag (This case means that ten
participants including you in your group invest and four other participants do not
invest). Then, shuffle the beans without looking inside the bag. Ask the following
question to the survey participant: “Compared to the previous case where we have
five white beans, do you think the probability of picking a white bean increased or
decreased?”
(1) Increased
(2) Stay the same
(3) Decreased
Answer should be (1) Increased

48
4. Put 7 white beans and 18 black beans in the bag (This case means that seven
participants including you in your group invest and seven other participants do not
invest). Then, shuffle the beans without looking inside the bag. Ask the following
question to the survey participant: “Compared to the previous case where we have 10
white beans, do you think the probability of picking a white bean increased or
decreased?”
(1) Increased
(2) Stay the same
(3) Decreased
Answer should be (3) Decreased
5. Put 14 white beans and 11 black beans in the bag (This case means that all
participants including you in your group invest). Then, shuffle the beans without
looking inside the bag. Ask the following question to the survey participant:
“Compared to the previous case where we have 7 white beans, do you think the
probability of picking a white bean increased or decreased?”
(1) Increased
(2) Stay the same
(3) Decreased
Answer should be (1) Increased
If the participant incorrectly answered more than 3 out of 5 questions, please repeat
1-5 above. Please ask if the participant understands the probability concept. If yes,
please explain the following point and practice with the respondent:
If more participants decide to invest during the joint investment game, this case
is similar to increasing the number of white beans in the bag.
The respondent should randomly select a bean from a non-transparent plastic
bag with one white bean and 24 black beans five times with replacement (This
case means that you are the only investor in your group and all of the others
do not invest. Also, your leader donates none). After the five-time practice, tell
the participant that it is very unlikely to succeed the joint investment project in
this case.
The respondent should randomly select a bean from a non-transparent plastic
bag with 14 white bean and 11 black beans five times with replacement (This

case means that all participants including you in your group invest). After the
five-time practice, tell the participant that it is still possible that you lose your
investment even if all 14 participants decide to invest.
In addition to your earnings, your village will have an opportunity of earning money.
150 villages in Myanmar including your village will join a competition through the amount
of joint investment. We will rank 150 villages in terms of the total amount of joint
investment made by 14 participants in each of the 150 villages. If your village belongs to
the group of the top 50 villages (ranked between 1st and 50th), your village will earn
100,000 Myanmar Kyat. If your village belongs to the group of the next 50 villages
(ranked between 51st and 100th), your village will earn 50,000 Myanmar Kyat. If your
village belongs to the group of the bottom 50 villages (ranked between 101st and 150th),
your village will receive no money. If your village and other villages made same average
amount of joint investment, we will randomly decide the ranking of your village and other
villages.
Therefore, before making your decision, you may need to think about how many
participants would invest their money to a joint project. Note that your decision will be
kept strictly private and confidential.
The other survey participants in your group will make the same kind of decisions. If
the decisions of all participants are made, we will calculate the chance of the project
succeeding. In case you invested, your earnings will be determined according to this
chance.
Once you complete the survey, you are going to receive 1,000 Kyat as a token of
appreciation. At the end of the survey in your village, we will revisit your house and
deliver this amount of 1,000 Kyat and the amount of money you earned in case you
invested and the project succeeded. Again, no one in your village will know about your
decision.
Two months after completing the entire survey in 150 villages, we will revisit your
village and deliver your SMU Chairman (in the treatment villages) or the village chief (in
the control villages) the total amount of bonus money in case your village earned.