ENDED MARCH 31, 2016 Q1 2016 - grandcityproperties.comq1 2015 q1 2016 q1 2015 q1 2016 icr dscr 5.8...
84
1 CONDENSED INTERIM CONSOLIDATED FINANCIAL STATEMENTS FOR THE THREE MONTH PERIOD ENDED MARCH 31, 2016 Q1 2016
Transcript of ENDED MARCH 31, 2016 Q1 2016 - grandcityproperties.comq1 2015 q1 2016 q1 2015 q1 2016 icr dscr 5.8...
1
CONDENSED INTERIM
CONSOLIDATED FINANCIAL
STATEMENTSFOR THE THREE MONTH PERIOD
ENDED MARCH 31, 2016
Q1 2016

1
IMPRINT
Publisher: Grand City Properties S.A.24, Avenue Victor HugoL-1750 Luxembourg
phone: +352 28 77 87 86e-mail: [email protected]
CONDENSED INTERIM CONSOLIDATED FINANCIAL STATEMENTS
FOR THE THREE MONTH PERIOD ENDED MARCH 31, 2016
2

3
CONTENT
BOARD OF DIRECTORS‘ REPORT 04 – 49
INTERIM CONSOLIDATED STATEMENT OF COMPREHENSIVE INCOME 50 – 53
INTERIM CONSOLIDATED STATEMENT OF FINANCIAL POSITION 54 – 57
INTERIM CONSOLIDATED STATEMENT OF CHANGES IN EQUITY 58 – 59
INTERIM CONSOLIDATED STATEMENT OF CASH FLOWS 60 – 63
CONDENSED NOTES TO THE INTERIM CONSOLIDATED FINANCIAL STATEMENTS 64 – 80

4
BO
AR
D O
F D
IRE
CT
OR
S’ R
EP
OR
T
KEY FINANCIALS Dec 2014 Dec 2015 Mar 2016
TOTAL ASSETS (€’000) 2,629,058 4,688,903 5,206,022
Dec 2014 Dec 2015 Mar 2016
EPRA NAV (€’000) 1,439,386 2,066,201 2,182,615
Dec 2014 Dec 2015 Mar 2016
TOTAL EQUITY (€’000) 1,041,650 2,172,295 2,402,037
EPRA NAV INCL HYBRID NOTES (€’000)
Dec 2014 Dec 2015 Mar 2016
1,439,386 2,544,347 2,663,142
Dec 2014 Dec 2015 Mar 2016
LOAN-TO-VALUE 45% 42% 40%
Dec 2014 Dec 2015 Mar 2016
EQUITY RATIO 40% 46% 46%
PORTFOLIO SIZE (IN UNITS)
Dec 2014 Dec 2015 Mar 2016 May 2016
43,000 76,000 78,000 80,000

5
1-12/2015 1-3/2015 1-3/2016
NET PROFIT (€’000) 393,570 80,298 90,457
1-12/2015 1-3/2015 1-3/2016
EPS (BASIC) (€) 2.71 0.63 0.47
1-12/2015 1-3/2015 1-3/2016
EPS (DILUTED) (€) 2.35 0.53 0.43
FFO I (€’000)
1-3/2015 change 1-3/2016
25,208 50% 37,710
FFO I AFTER HYBRID NOTES ATTRIBUTION,
PER SHARE (€)
1-3/2015 change 1-3/2016
0.20 10% 0.22
1-3/2015 change 1-3/2016
EBITDA (€’000) 93,872 30% 122,478
1-3/2015 change 1-3/2016
ADJUSTED EBITDA (€’000) 34,244 56% 53,261
RENTAL AND OPERATING INCOME (€'000)
1-3/2015 change 1-3/2016
65,608 54% 100,751

6
BO
AR
D O
F D
IRE
CT
OR
S’ R
EP
OR
T
SUCCESS DRIVEN FROM INTERNAL AND EXTERNAL GROWTH
ACHIEVEMENTS – OPERATIONS
Dec 2014 Dec 2015 May 2016Mar 2016
PORTFOLIO GROWTH IN UNITS
14,000Third party
units
94,000
RENTAL AND OPERATING INCOME IN € MILLION
43,000
76,00080,00078,000
FY 2014
€217 m FY 2015Q1 2016
annualized
May 2016 annualized run rate
(May*12)
€423 m
€333 m
€403 m
7
FY 2014 FY 2015 Q1 2016 annualized
May 2016 annualized run rate (May*12)
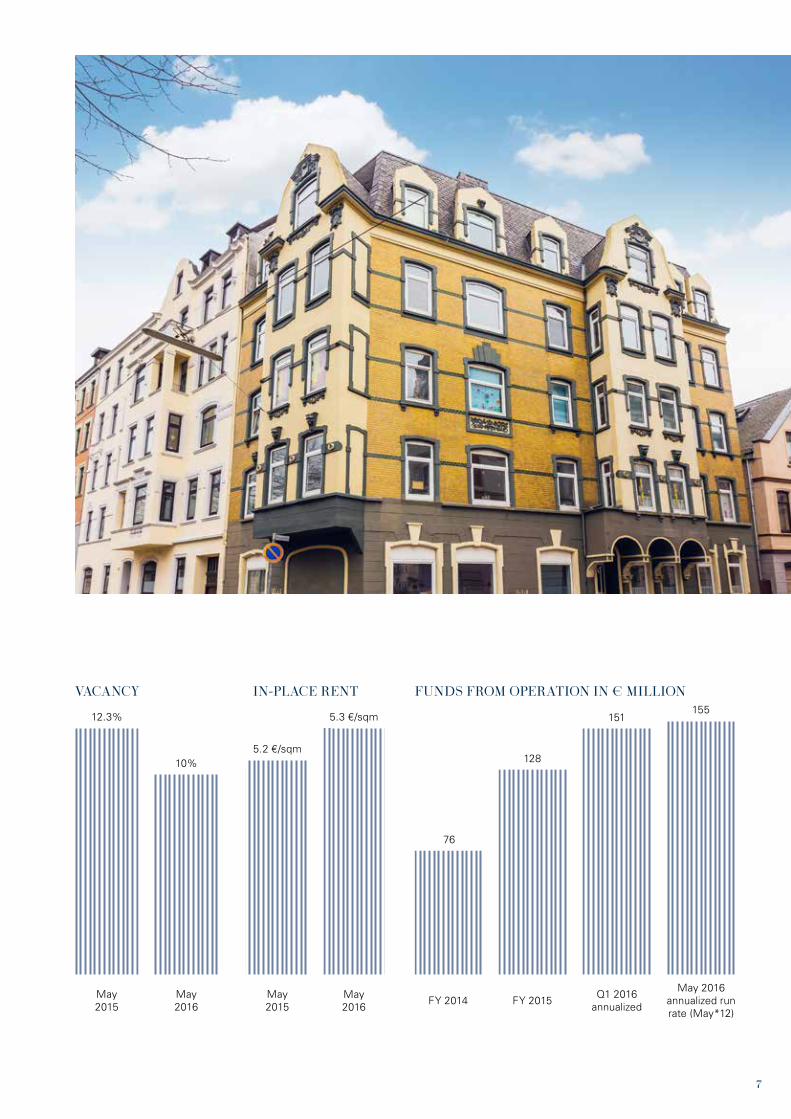
76
128
151155
FUNDS FROM OPERATION IN € MILLIONVACANCY
May 2015
May 2015
May 2016
May 2016
12.3%
5.2 €/sqm10%
5.3 €/sqm
IN-PLACE RENT
8
BO
AR
D O
F D
IRE
CT
OR
S’ R
EP
OR
T
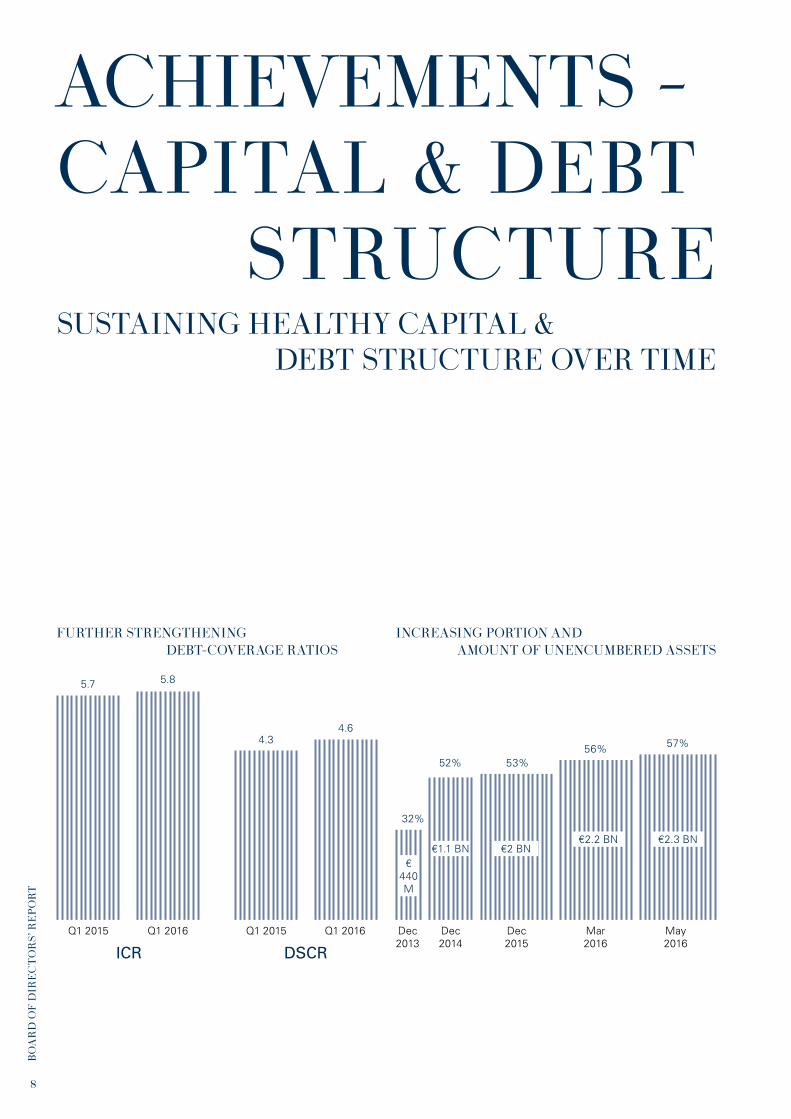
FURTHER STRENGTHENING DEBT-COVERAGE RATIOS
INCREASING PORTION AND AMOUNT OF UNENCUMBERED ASSETS
ACHIEVEMENTS – CAPITAL & DEBT STRUCTURESUSTAINING HEALTHY CAPITAL & DEBT STRUCTURE OVER TIME
Q1 2015 Q1 2015Q1 2016 Q1 2016
ICR DSCR
5.8
4.6
5.7
4.3
Dec 2013
Dec 2014
Dec 2015
Mar 2016
May 2016
€ 440 M
€1.1 BN €2 BN€2.2 BN €2.3 BN
32%
52% 53%56% 57%

9
HIGH EQUITY RATIO DERIVED FROM HIGH PROFITABILITY AND LOW LEVERAGE
47%
40%
46%
Dec 2013
Dec 2014
Dec 2015
Mar2016
SUSTAINING A CONSERVATIVE DEBT STRUCTURE (LTV)
Dec 2013 Dec 2014 Dec 2015
50% Company BOD policy
Mar 2016
40%42%
45%
36%
46%

10
BO
AR
D O
F D
IRE
CT
OR
S’ R
EP
OR
T
ACHIEVEMENTS – CAPITAL MARKETS ACTIVITIES
3,500
3,000
2,500
2,000
1,500
1,000
500
0
2012
New issuance Aggregate
2013 2014 2015 Feb 2016
115
1,200
450
S&PBB+
S&PBBB-
Moody’sBaa2
S&PBBB
Feb 2014 Jul 2015
CORPORATE CREDIT RATINGSTRONG ACCESS TO CAPITAL IN € MILLION
950
411
11

12
BO
AR
D O
F D
IRE
CT
OR
S’ R
EP
OR
T
LETTER OF THE MANAGEMENT BOARD
13
DEAR SHAREHOLDERS,
We are pleased to present the financial report for the first three months of 2016, maintaining our strong operational performance and high profitability. Our portfolio has further increased to 80 thousand units from 76 thousand in the be-ginning of 2016, carried-out through several accretive deals in our key strategic locations.
The strong operational platform, together with our experi-enced rental teams, successfully increased our occupancy levels in 2016. As of May 2016, the vacancy level was re-duced to below 10% of rentable area, down from 12.3% in May 2015. The success of the rental teams is reflected in once again setting a new lettings record, outperforming the strong results of 2015. The occupancy increase steams from innovative marketing techniques to attract prospective tenants with a main focus on increasing visibility. The rental teams gain local market knowledge, adapting the product to the neighborhood and local market demand by, among oth-er things, building playgrounds and creating family friendly events such as our recent Easter egg hunt, adaptations of staircases and apartments for elderly people, and we contin-ue to support local social associations by providing rent free facilities for their purposes.
An important element in our success to increase our occu-pancy was through our Service Center’s ability to significant-ly reduce tenant fluctuation, which again was mainly due to their high quality service and resulting tenant satisfaction. Thus, we are very proud to announce that at the end of March 2016 GCP’s Service Center was acknowledged by a TÜV certification, Germany’s leading international technical service provider, certifying our proven service quality and confirming that we meet the highest European DIN stan-dards. GCP’s market leading Service Center offers 24/7, 365 days a year availability through toll-free numbers for prospec-tive and existing tenants.
GCP continued strong in 2016 with its fruitful momentum in the capital markets, enabling us to further optimize our debt structure which resulted in a decrease of the cost of debt to 1.6%. In February 2016 we issued Series F convertible bonds of €450 million and a coupon rate of 0.25% with a maturity of six years. In line with previous issuances, the issuance was significantly oversubscribed. Additionally, at the beginning of 2016, the full conversion of the Series C convertible bonds into equity was completed which conse-quently strengthened our debt and capital structure, opening up further opportunities for GCP’s growth. Since initial listing in 2012 we raised over €3.1 billion, diversifying the funding sources through issues of bonds, convertible bonds, equity and hybrid notes.
The results of the first quarter of 2016 validated once again the strength of our operational platform and our ability to materialize the embedded potential in our portfolio. Looking forward into 2016, we are confident in our ability to main-tain the positive momentum into the foreseeable future. Our abundant financial firepower will support our accretive exter-nal portfolio growth in the future. Moreover, with a current FFO I run rate of €155 million, our portfolio has the potential to further increase the operational bottom line significantly during the next years through further increasing occupan-cies and rents, without relying on additional external growth. Therefore, the Company is well-positioned to continue out-performing the market and will continue creating sustainable value to our shareholders.
Daniel MalkinDirector
Refael ZamirDirector, CFO
Simone Runge-BrandnerDirector
Christian WindfuhrCEO

14
BO
AR
D O
F D
IRE
CT
OR
S’ R
EP
OR
T
HIGHLIGHTS
1-3/2016 1-3/2015
€’000
Rental and operating income 100,751 65,608
EBITDA 122,478 93,872
Adjusted EBITDA 53,261 34,244
Profit for the period 90,457 80,298
EPS (basic) in € 0.47 0.63
EPS (diluted) in € 0.43 0.53
FFO I 37,710 25,208
FFO I after hybrid notes attribution, per share in € 0.22 0.20
FFO II 37,710 25,208
Interest Coverage Ratio 5.8 5.7
Debt Service Coverage Ratio 4.6 4.3
PROFITABILITY HIGHLIGHTS

15
Mar 2016 Dec 2015
€’000
Cash and liquid assets 649,577 388,925
Total Assets 5,206,022 4,688,903
Investment Property 1) 4,025,288 3,859,511
Total Equity 2,402,037 2,172,295
EPRA NAV including hybrid notes 2,663,142 2,544,347
EPRA NAV 2,182,615 2,066,201
Total loans and borrowings 802,440 846,900
Straight bonds 1,046,603 1,045,413
Convertible bond Series C 2) - 122,576
Convertible bond Series F 3) 426,191 -
Loan To Value 40% 42%
Equity Ratio 46% 46%
FINANCIAL POSITION HIGHLIGHTS
1) including advanced payment and balance of inventories2) As of Jan 2016 Convertible Bond Series C has been converted3) Series F bonds issued in February 2016
16
BO
AR
D O
F D
IRE
CT
OR
S’ R
EP
OR
T
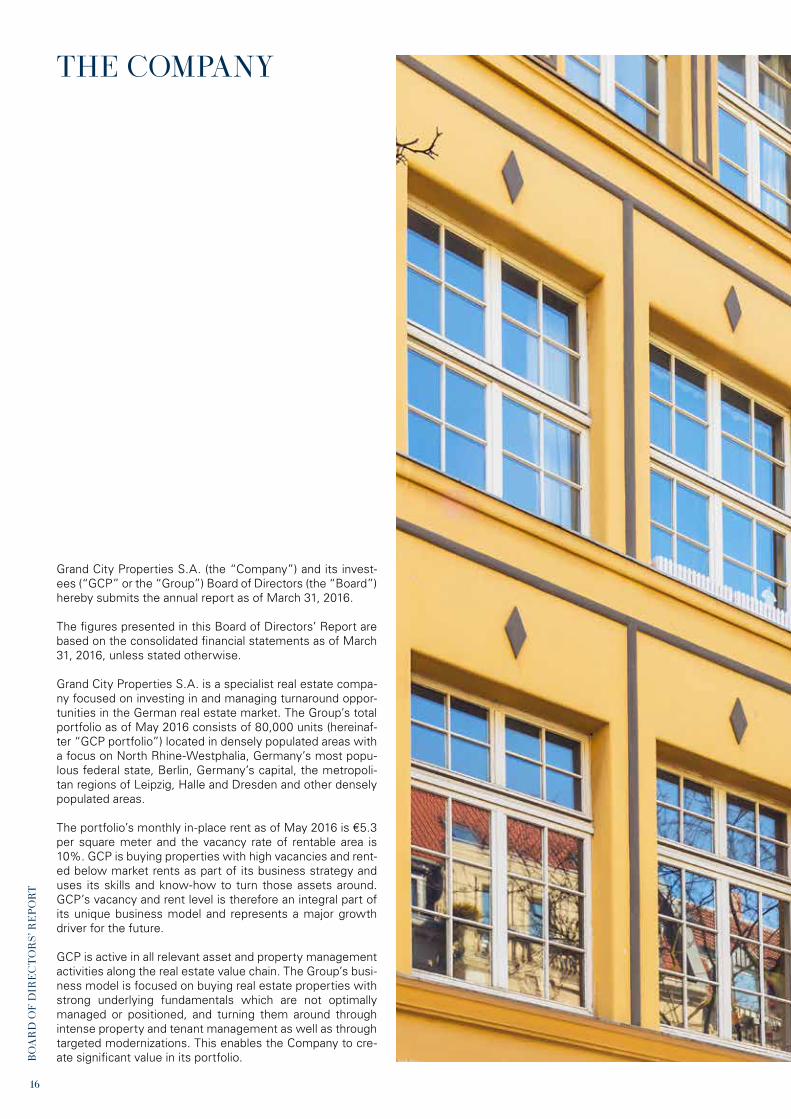
THE COMPANY
Grand City Properties S.A. (the “Company”) and its invest-ees (“GCP” or the “Group”) Board of Directors (the “Board”) hereby submits the annual report as of March 31, 2016.
The figures presented in this Board of Directors’ Report are based on the consolidated financial statements as of March 31, 2016, unless stated otherwise.
Grand City Properties S.A. is a specialist real estate compa-ny focused on investing in and managing turnaround oppor-tunities in the German real estate market. The Group’s total portfolio as of May 2016 consists of 80,000 units (hereinaf-ter “GCP portfolio”) located in densely populated areas with a focus on North Rhine-Westphalia, Germany’s most popu-lous federal state, Berlin, Germany’s capital, the metropoli-tan regions of Leipzig, Halle and Dresden and other densely populated areas.
The portfolio’s monthly in-place rent as of May 2016 is €5.3 per square meter and the vacancy rate of rentable area is 10%. GCP is buying properties with high vacancies and rent-ed below market rents as part of its business strategy and uses its skills and know-how to turn those assets around. GCP’s vacancy and rent level is therefore an integral part of its unique business model and represents a major growth driver for the future.
GCP is active in all relevant asset and property management activities along the real estate value chain. The Group’s busi-ness model is focused on buying real estate properties with strong underlying fundamentals which are not optimally managed or positioned, and turning them around through intense property and tenant management as well as through targeted modernizations. This enables the Company to cre-ate significant value in its portfolio.

17

18
BO
AR
D O
F D
IRE
CT
OR
S’ R
EP
OR
T
KEY STRENGTHS
ATTRACTIVE PORTFOLIO WITH SIGNIFICANT REPOSITIONING POTENTIAL AND DEFENSIVE CHARACTERISTICS
Properties that are attractively located and have been specif-ically selected because of their significant potential for value creation make up GCP’s well-balanced portfolio.
30% NRW
19% Berlin
20% Dresden/
Leipzig/Halle
6% Mannheim/
KL/Frankfurt/Mainz
4% Nuremburg-
Fürth/ Munich
5% Bremen/ Hamburg
16% Others
REGIONAL DISTRIBUTION BY VALUE
POPULATION DENSITY IN GERMANY(inhabitants per sqkm 2013)
The Group’s portfolio growth was accompanied by further diversification, allowing it to increase benefits from econ-omies of scale while reducing geographical clustering and thereby supporting the risk-averse and well allocated port-folio targets set by the Board. GCP’s focus on densely pop-ulated areas is mirrored by 30% of its portfolio being held in NRW, 19% in Berlin, 20% in the metropolitan regions of Leipzig, Halle and Dresden and significant holdings in oth-er major urban markets with strong fundamentals such as Nuremberg, Munich, Mannheim, Frankfurt, Bremen and Hamburg.
< 100
100 - 200 500 - 1000
200 - 500 > 1000
Hamburg
Berlin
Dresden Leipzig
Halle
Mannheim Kaiserslautern
Frankfurt Mainz
Nuremberg Fürth
Munich
Bremen
NRW

19
20
BO
AR
D O
F D
IRE
CT
OR
S’ R
EP
OR
T
FULLY INTEGRATED AND SCALABLE PLATFORM THAT IS TAILORED FOR ACQUISITIONS, TURNAROUND AND FAST GROWTH
Through its purpose-built platform GCP provides efficient in-house management to its existing real estate portfolio as well as support for the execution of its expansion plans. Giv-en its rapid expansion the Group has grown to approximately 600 staff members.
Specialized teams cover the entire range of the real estate value chain from acquisition to construction and refurbish-ment, sales and marketing, and key support functions such as finance, accounting, legal and IT. GCP puts strong empha-sis on growing relevant skills in-house to improve respon-siveness and generate innovation across processes and departments. In particular, its advanced proprietary IT/soft-ware enables the Company to closely monitor its portfolio and tenants to continuously optimize yields and implement strictest cost discipline. A rigorous focus on cost extends across the entire operations of GCP, including those that are chargeable to its tenants.
GCP strategically positioned itself for a quick and rapid take-over of the current pipeline and further property acquisitions. Given the efficiency measures taken the portfolio today has the capacity to further grow at a marginal cost to the plat-form, and further create economies of scale. The integrated nature of its platform also means that GCP is well positioned to make important decisions swiftly and efficiently when re-quired, for instance with acquisitions.
The Group is directed by an experienced and well-balanced management team, led by the Board of Directors. The Com-pany operates through over a dozen different departments which all form an important component in the value creation cycle from acquisition through turnaround to fully stabilized portfolio.
PROVEN SOURCING CAPABILITIES AND SUCCESSFUL PORTFOLIO GROWTH
The Company’s track record and established reputation pro-vides access to numerous investment opportunities often before they are widely promoted or publicized, reflecting GCP’s preferential counterparty status, both on a local and on a national level. This advantage is also reflected in im-proved access to financing and helped establishing strong relationships with debt providers. GCP operates in an attrac-tive market niche where the average deal size discourages most market players, as the typical properties it acquires are either too large for private individuals or too small and dif-ficult for institutional investors. GCP’s focus on and know-how in taking over mismanaged properties and turning them around to well managed properties is unique in the German real estate market and a sustainable competitive advantage.
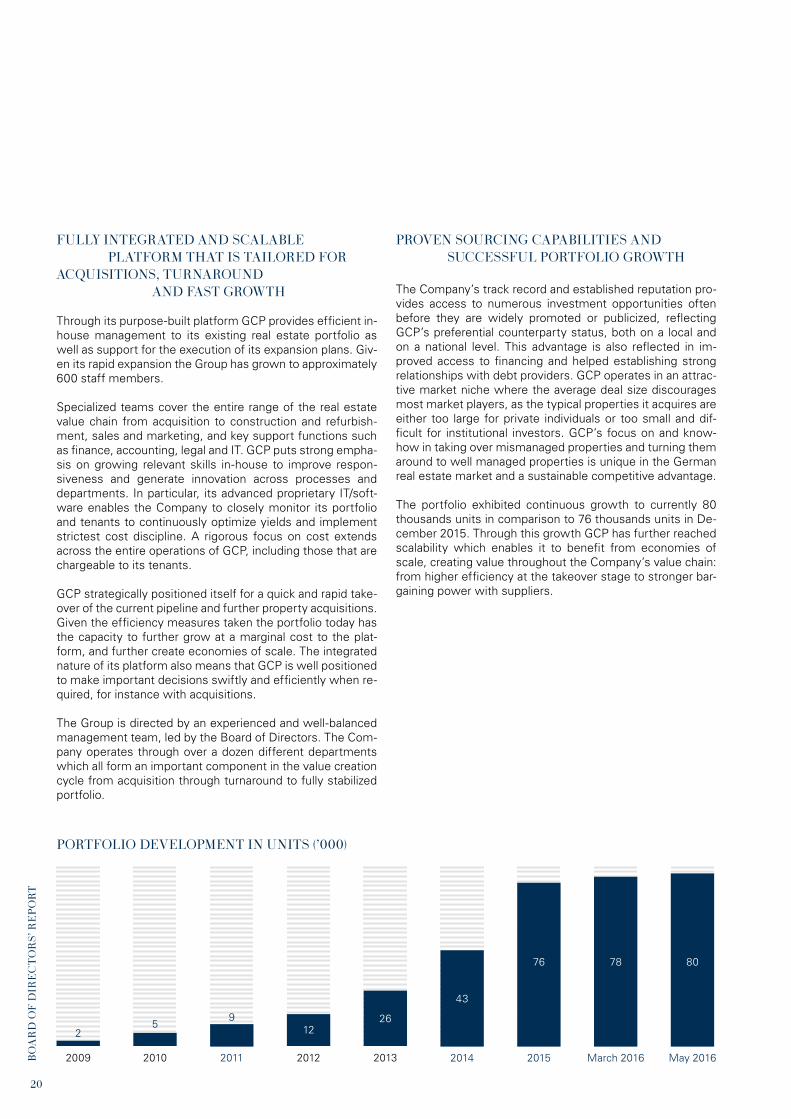
The portfolio exhibited continuous growth to currently 80 thousands units in comparison to 76 thousands units in De-cember 2015. Through this growth GCP has further reached scalability which enables it to benefit from economies of scale, creating value throughout the Company’s value chain: from higher efficiency at the takeover stage to stronger bar-gaining power with suppliers.
PORTFOLIO DEVELOPMENT IN UNITS (’000)
9
20112009
2
2012
12
2010
5
2013
26
2014
43
2015
76
March 2016
78
May 2016
80
21
Apart from GCP’s unique skills in identifying properties with significant upside potential, the Company has the ability to create and execute tailor made strategies for each asset to optimally improve its operating performance, which is re-flected in the significant value appreciation in its portfolio. GCP’s continuous asset management efforts result not only in improved cash flow results, but also in tangible value cre-ation that is captured instantly as well as over the long run in the Group’s financial performance. The Group’s experience and in-house operational skills allow it to continuously maxi-mize returns after the successful repositioning of the assets.
STRONG TRACK RECORD OF VALUE CREATION FROM RENOVATION AND REPOSITIONING OF ASSETS
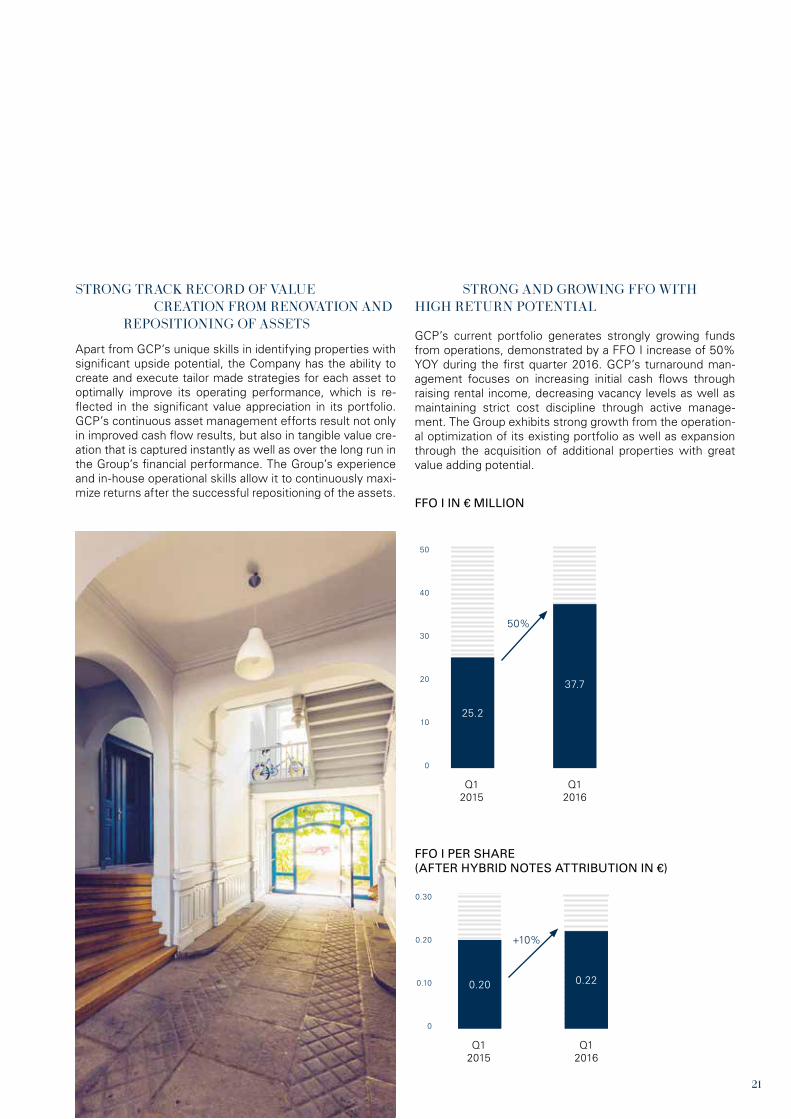
STRONG AND GROWING FFO WITH HIGH RETURN POTENTIAL
GCP’s current portfolio generates strongly growing funds from operations, demonstrated by a FFO I increase of 50% YOY during the first quarter 2016. GCP’s turnaround man-agement focuses on increasing initial cash flows through raising rental income, decreasing vacancy levels as well as maintaining strict cost discipline through active manage-ment. The Group exhibits strong growth from the operation-al optimization of its existing portfolio as well as expansion through the acquisition of additional properties with great value adding potential.
FFO I IN € MILLION
50
40
30
20
10
0
Q1 2015
25.2
Q1 2016
37.7
50%
FFO I PER SHARE (AFTER HYBRID NOTES ATTRIBUTION IN €)
Q1 2015
0.30
0.20
0.10
0
0.20
Q1 2016
0.22
+10%

22
BO
AR
D O
F D
IRE
CT
OR
S’ R
EP
OR
T
CONSERVATIVE CAPITAL STRUCTURE AND PROVEN ABILITY TO RAISE CAPITAL
GCP follows a financial policy in order to maintain and im-prove its strong capital structure:
○ Strive to achieve A- global rating in the long term ○ Maintaining an LTV below 50% ○ Maintaining very conservative financial ratios ○ Unencumbered assets above 50% of total assets ○ Long debt maturity profile ○ Good mix of long term unsecured bonds and non-re-course bank loans
○ Maintaining credit lines from several banks which are not subject to Material Adverse Effect
○ Dividend of 30% of FFO I
With €650 million in liquid assets as of March 31, 2016 GCP has a high amount of financial flexibility which is also reflect-ed in the €2.3 billion of unencumbered assets as of May 2016. The high amount of liquidity enables GCP on one hand to pursue attractive deals, and on the other provides signifi-cant head room and comfort to its debt holders. GCP’s con-servative capital structure is characterized by long term ma-turities, low debt amortization rates, hedged interest rates, excellent financial coverage ratios and a low LTV, reflecting its disciplined approach. The LTV as of March 31, 2016 is conservative at 40%. The Company set itself a management policy at 50%. GCP strategically maintains its strong finan-cial profile. The Board of Directors has decided to implement policies, management and financial strategies to achieve a further improvement of the credit rating.
GCP’s bank loans are spread across more than 30 separate loans from 17 different financial institutions that are non-re-course and have no cross collateral or cross default provi-sions.
Fitting to the Company’s conservative capital structure 97% of its interest is hedged.
81% Fixed & Swapped
16% capped
3% Variable
INTEREST COVERAGE RATIO (ADJ. EBITDA/INTEREST)LOAN-TO-VALUE
55%
50%
45%
40%
35%
30%
25%
20%
March 2016
40%
Dec2013
36%
Dec2014
45%
Dec2015
42%
Company BODpolicy
7.0
6.0
5.0
4.0
3.0
2.0
1.0
0.0
Q1 2015
5.7
Q1 2016
5.8

23
GCP’s financial flexibility is becoming stronger over time, both due to improved fundamentals affecting coverage ra-tios and improving profitability. Adjusted EBITDA increased significantly while proportional debt service payments de-creased. This led to a shift in the DSCR from 4.3 in Q1 2015 to 4.6 in Q1 2016. An increasing portion of assets are free of lien. As of May 2016, €2.3 billion of the held assets are unencumbered investment properties, in comparison to €2 billion in December 2015.
GCP’s long maturity schedule enables the Company to fully complete the turnaround cycle of its assets. This enables the Company to focus on its core business without the pressure to refinance and ensures a large extent of financial flexibility in the future.
DEBT SERVICE COVERAGE RATIO (DSCR) UNENCUMBERED ASSETS
60%
50%
40%
30%
20%
10%
0%
Por
tion
of t
otal
ass
ets
Mar 2016
€2.2 BN
56%
May 2016
€2.3 BN
57%
Dec2015
€2 BN
53%
Dec2014
€1.1 BN
52%
Dec2013
€ 440 M
32 %
5.0
4.0
3.0
2.0
1.0
0.0
Q1 2015
4.3
Q1 2016
4.6

24
BO
AR
D O
F D
IRE
CT
OR
S’ R
EP
OR
T
BALANCED FUNDING MIX BETWEEN DEBT & EQUITY AND A PROVEN ABILITY TO ACCESS CAPITAL MARKETS
JUL 12
OCT 12
FEB 13
JUL 13
OCT 13
DEC 13
FEB 14
APR 14
JUN 14
OCT 14
FEB 15
MAR 15
APR 15
JUL 15
SEP 15
SEP 15
JAN 16
FEB 16
Equity capital increase of € 15m
Issuance of Series A, 5 year convertible bonds of € 100m and a coupon of 8% p.a.
Equity capital increase of € 36m
Issuance of Series B, 7 year straight bonds of € 200m with a coupon of 6.25% p.a.
Full conversion of € 100m Series A convertible bonds into equity
Equity capital increase of € 175m
Issuance of Series C, 5 year convertible bonds of € 150m and a coupon of 1.50% p.a
Tap issuance of existing straight bonds with gross proceeds of € 160m
Tap issuance of convertible bonds with gross proceeds of € 140m
Redemption of straight bonds with nominal amount of € 350m. Issuance of 7 year straight bond of € 500m with a coupon of 2% p.a.
Issuance of €150m perpetual hybrid notes, coupon 3.75%
Tap issuance of perpetual hybrid notes of additional € 250m
Issuance of Series E, 10 year straight bond of € 400m with a coupon of 1.5% p.a.
Tap issuance of perpetual hybrid notes, (coupon 3.75%), of additional € 100m
Equity capital increase of € 151m
Tap issuance of € 150m of 10 year straight bond to an aggregate nominal amount of € 550m
Completion of the conversion of Series C convertible bonds (€275m)
Issuance of Series F, 2022 convertible bonds of € 450m, coupon of 0.25% p.a JUL 15
BBB S&P rating
FEB 15
Baa2 Moody‘s rating
NOV 14
BBB- S&P rating
FEB 14
BB+ S&P rating
NOV 13
BB S&P rating
FEB 13
BB- S&P initial rating

25
EQUITY AND BOND BOOKRUNNERS

26
BO
AR
D O
F D
IRE
CT
OR
S’ R
EP
OR
T
THE FOLLOWING ILLUSTRATION SHOWS THE VALUE CREATION TO THE SHAREHOLDER IN EACH ISSUANCE
30
25
20
15
10
5
0
4.46
Feb2013
July 2012
2.75
Dec2013
6.5
Sep2015
15.9
Feb2016
26.97
* refers to the conversion price of the convertible bond issuance
**effective conversion price 10.8 (9.72 conversion at 111.25% of par)
Sha
re p
rice
at is
suan
ce /
conv
ersi
on p
rice
*Feb2014
9.72
*June 2014
10.8
**Oct2012
4
*
27
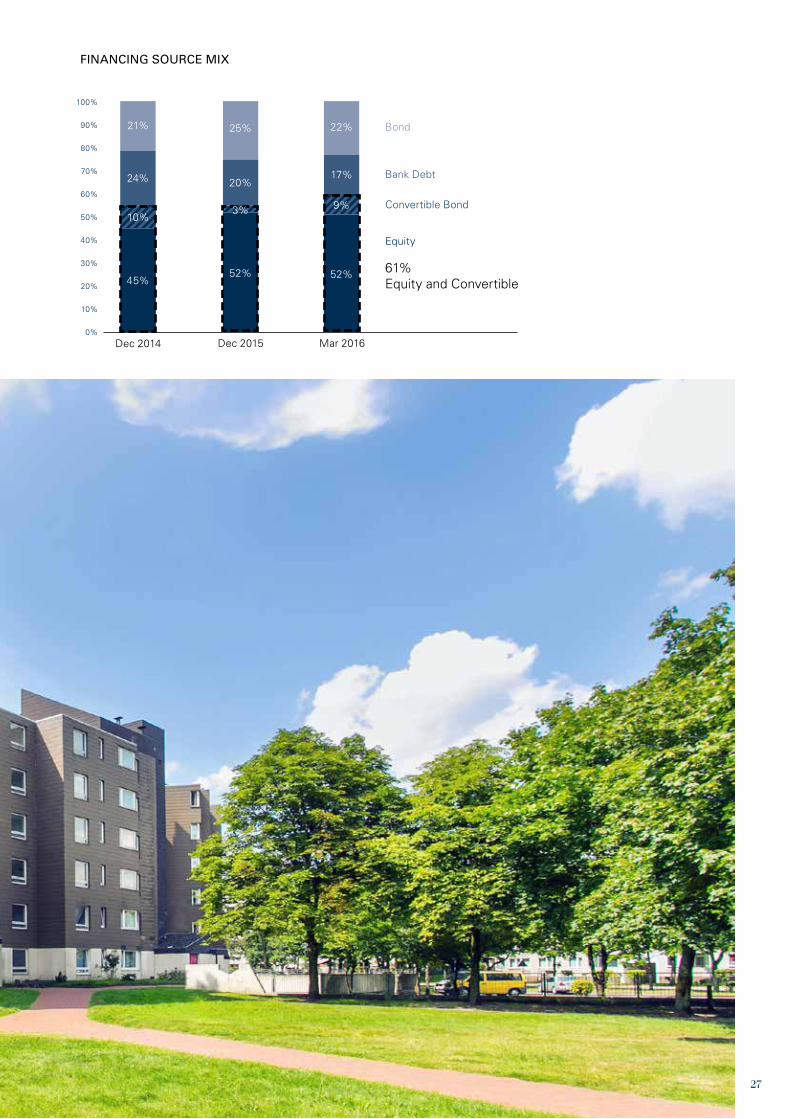
FINANCING SOURCE MIX
Bank Debt
Convertible Bond
Bond
Equity
61% Equity and Convertible
Dec 2014 Dec 2015 Mar 2016
24%
21%
10%
45%
25% 22%
52% 52%
100%
90%
80%
70%
60%
50%
40%
30%
20%
10%
0%
20%17%
3% 9%

28
BO
AR
D O
F D
IRE
CT
OR
S’ R
EP
OR
T
COMPANY STRATEGY
FOCUS ON TURNAROUND OPPORTUNITIES IN ATTRACTIVE, DENSELY POPULATED AREAS OF THE GERMAN REAL ESTATE MARKET, WHILE KEEPING A CONSERVATIVE FINANCIAL POLICY AND AN INVESTMENT GRADE RATING
GCP’s investment focus is on the German real estate mar-kets that it perceives to benefit from favorable fundamentals that will support stable profit and growth opportunities in the foreseeable future. The Group’s current portfolio is pre-dominantly focused on North Rhine-Westphalia, Berlin, the metropolitan regions of Leipzig, Halle and Dresden and other major cities in Germany. The Company believes its platform has the right abilities and systems to continue to perform strongly and to further expand successfully in the German market. The Group also believes that there are acquisition opportunities in these attractive markets to support its exter-nal growth strategy in the medium to long term.
For its acquisitions the Company is applying the following specific criteria:
○ Acquisition in densely populated areas and major cities ○ High cash flow generating assets ○ Vacancy reduction potential ○ Rent level per sqm is below market level (under-rented), upside potential and low downside risk
○ Purchase price below replacement costs and below mar-ket values
○ Potential to reduce the operating cost per sqm
TARGETED CASH FLOW IMPROVEMENTS THROUGH FOCUS ON RENTAL INCOME, INVESTMENT AND STRICT COST DISCIPLINE
GCP seeks to maximize its cash flows from its portfolio through the relentless management of its assets by increas-ing rent and occupancy. This process is initiated during the due diligence phase of each acquisition, through the devel-opment of a specific plan for each asset. Once acquired and the initial development plan realized, GCP then regularly as-sesses the merits of on-going improvements to its proper-ties to further enhance the yield on its portfolio by increasing the quality and appearance of the properties, raising rents and further increasing occupancy. GCP also applies signifi-cant scrutiny to its costs, systematically reviewing ways to increase efficiency and thus improving cash flows.
29
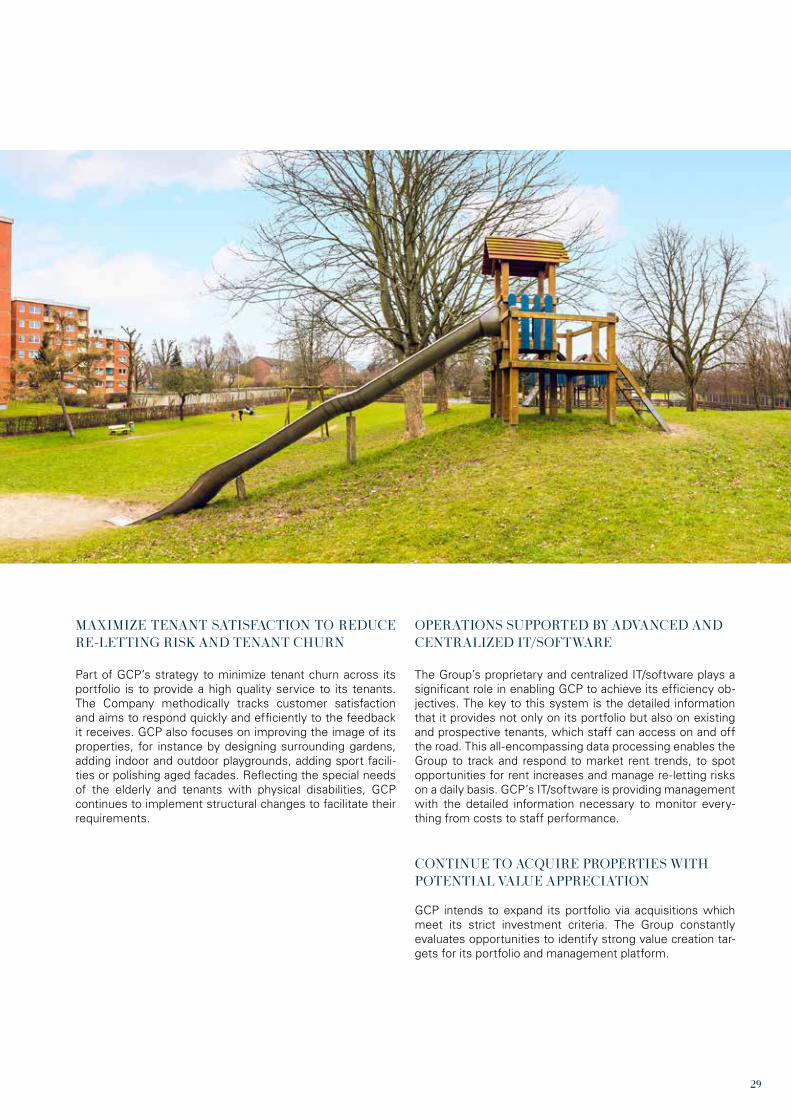
MAXIMIZE TENANT SATISFACTION TO REDUCE RE-LETTING RISK AND TENANT CHURN
Part of GCP’s strategy to minimize tenant churn across its portfolio is to provide a high quality service to its tenants. The Company methodically tracks customer satisfaction and aims to respond quickly and efficiently to the feedback it receives. GCP also focuses on improving the image of its properties, for instance by designing surrounding gardens, adding indoor and outdoor playgrounds, adding sport facili-ties or polishing aged facades. Reflecting the special needs of the elderly and tenants with physical disabilities, GCP continues to implement structural changes to facilitate their requirements.
OPERATIONS SUPPORTED BY ADVANCED AND CENTRALIZED IT/SOFTWARE
The Group’s proprietary and centralized IT/software plays a significant role in enabling GCP to achieve its efficiency ob-jectives. The key to this system is the detailed information that it provides not only on its portfolio but also on existing and prospective tenants, which staff can access on and off the road. This all-encompassing data processing enables the Group to track and respond to market rent trends, to spot opportunities for rent increases and manage re-letting risks on a daily basis. GCP’s IT/software is providing management with the detailed information necessary to monitor every-thing from costs to staff performance.
CONTINUE TO ACQUIRE PROPERTIES WITH POTENTIAL VALUE APPRECIATION
GCP intends to expand its portfolio via acquisitions which meet its strict investment criteria. The Group constantly evaluates opportunities to identify strong value creation tar-gets for its portfolio and management platform.

30
BO
AR
D O
F D
IRE
CT
OR
S’ R
EP
OR
T
COMPANY STRATEGY
MAINTAIN A CONSERVATIVE CAPITAL STRUCTURE
GCP seeks to preserve its conservative capital structure with an LTV policy to remain below 50%, sustain excellent fi-nancial coverage ratios and the majority of assets unencum-bered, low cost of debt that is mostly hedged, diversified financing sources and long maturities. A key feature of the Group’s financing objectives is to maintain ample investment flexibility, in order to take advantage of investment opportu-nities when they arise.
INVESTOR RELATIONS ACTIVITIES
GCP is proactively presenting its business strategy and thus enhancing perception as well as awareness of the Company among the different players of the capital markets through targeted and manifold investor relations activities over the year.
GCP seizes these opportunities to create transparency and present a platform for open dialogue. The improved percep-tion leads to a better understanding of GCP’s business mod-el, its competitive advantage and hence to a higher demand among the capital market players for participation in its suc-cess. Currently, GCP is being covered on an ongoing basis by 16 different equity analysts, who publish their reports regularly. GCP is part of major FTSE EPRA/NAREIT indices, including FTSE EPRA/NAREIT Global, Developed and Devel-oped Europe, and the GPR 250 index.
Placement Frankfurt Stock Exchange
First listing Q2 2012
Number of shares (as of 31 March 2016)
153,788,883ordinary shares with a par value of EUR 0.10 per share
Nominal Share Capital (as of 31 March 2016)
15,378,888 EUR
Number of shares on a fully diluted basis(as of 31 March 2016)
171,594,141
ISIN LU0775917882
WKN A1JXCV
Symbol GYC
Market Cap (as of 31 March 2016)
3.1 bn EUR
31
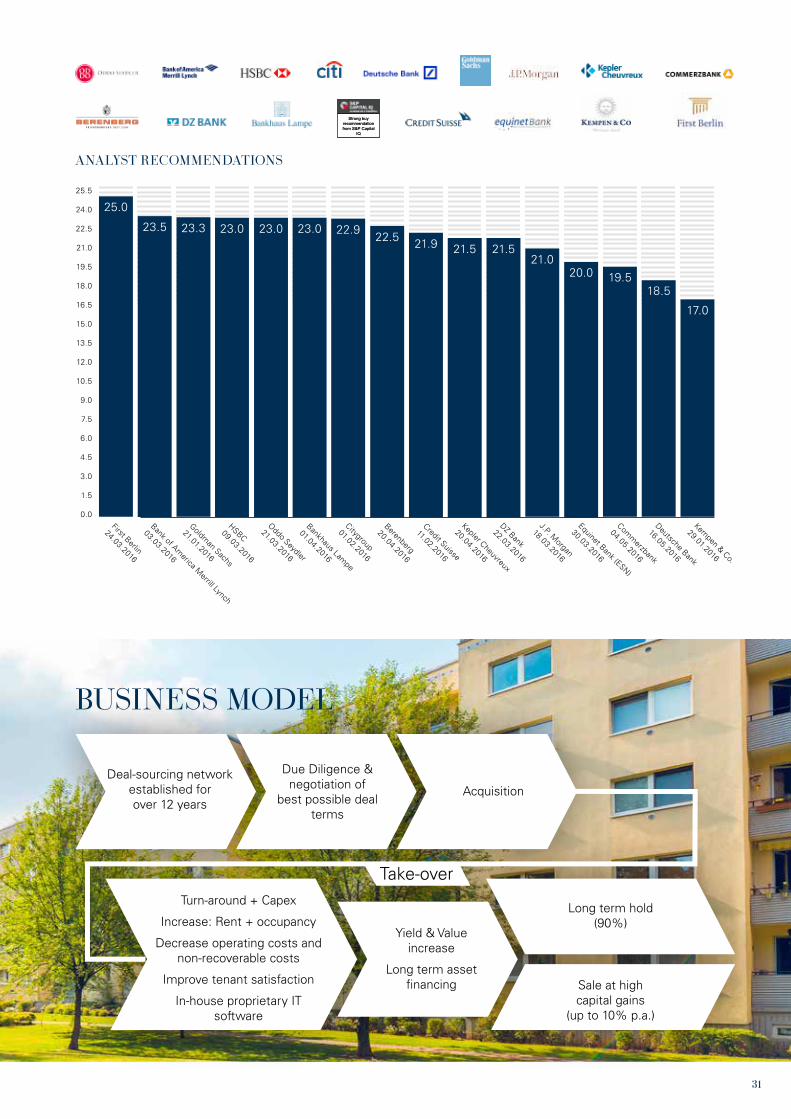
Deal-sourcing network established for over 12 years
Turn-around + Capex
Increase: Rent + occupancy
Decrease operating costs and non-recoverable costs
Improve tenant satisfaction
In-house proprietary IT software
Due Diligence & negotiation of
best possible dealterms
Yield & Valueincrease
Long term asset �nancing
Acquisition
Take-over
Long term hold(90%)
Sale at highcapital gains
(up to 10% p.a.)
BUSINESS MODEL
ANALYST RECOMMENDATIONS
First Berlin
24.03.2016
Bank of America M
errill Lynch
03.03.2016
Credit Suisse
11.02.2016
Citygroup
01.02.2016
HSBC09.03.2016
Goldman Sachs
21.01.2016
Comm
erzbank
04.05.2016
DZ Bank
22.03.2016
J.P. Morgan
18.03.2016
Deutsche Bank
16.05.2016
Kepler Cheuvreux
20.04.2016
Equinet Bank (ESN)
30.03.2016
Oddo Seydler
21.03.2016
Bankhaus Lampe
01.04.2016
20.0 19.5
25.5
24.0
22.5
21.0
19.5
18.0
16.5
15.0
13.5
12.0
10.5
9.0
7.5
6.0
4.5
3.0
1.5
0.0Kem
pen & Co.
29.01.2016
18.5
17.0
21.521.521.0
25.0
23.5 23.3 22.921.9
Berenberg
20.04.2016
22.523.023.023.0
Strong buy recommendation from S&P Capital
IQ
Strong buy recommendation from S&P Capital
IQ

32
BO
AR
D O
F D
IRE
CT
OR
S’ R
EP
OR
T
COMPANY STRATEGY
SHARE PRICE PERFORMANCE COMPARISON SINCE FIRST EQUITY PLACEMENT (19.07.2012)
FTSE EPRA/Nareit Germany Index (EPGR) (rebased)
222018161412108642
22
20
18
16
14
12
10
Oct 12
Jul 12
Jan 13
Jan 14
Apr 13
Apr 14
Jul 13
Jul 14
Oct 13
Oct 14
Jan 15
Apr 15
Jul 15
Oct 15
Jan 16
May 16
May 16
Nov 15
Jan 16
Mar 16
Jan 15
Mar 15
May 15
Jul 15
Sep 15
Grand City Properties S.A. (GYC) +618%Rebase Jan 2015
70%
24%
+77%
STRAIGHT BOND SERIES D – SPREAD OVER MID-€-SWAP, REMAINING 5.5 YEARS
Oct 14
Dec 15
Feb 16
Feb 15
Apr 15
Dec 14
Apr 16
May 16
Jun 15
Aug 15
Oct 15
2.5
2.0
1.5
1.0
0.5
Current Spread: 1.09%
24-07-15: S&P rating upgrade to ‘BBB’
20-11-14: S&P rating upgrade to 'BBB-'
Issue price at 95.56 and issuance spread at 2.01%
09-02-15: Moody’s assignment of Baa2 rating
issue price €2.75
33
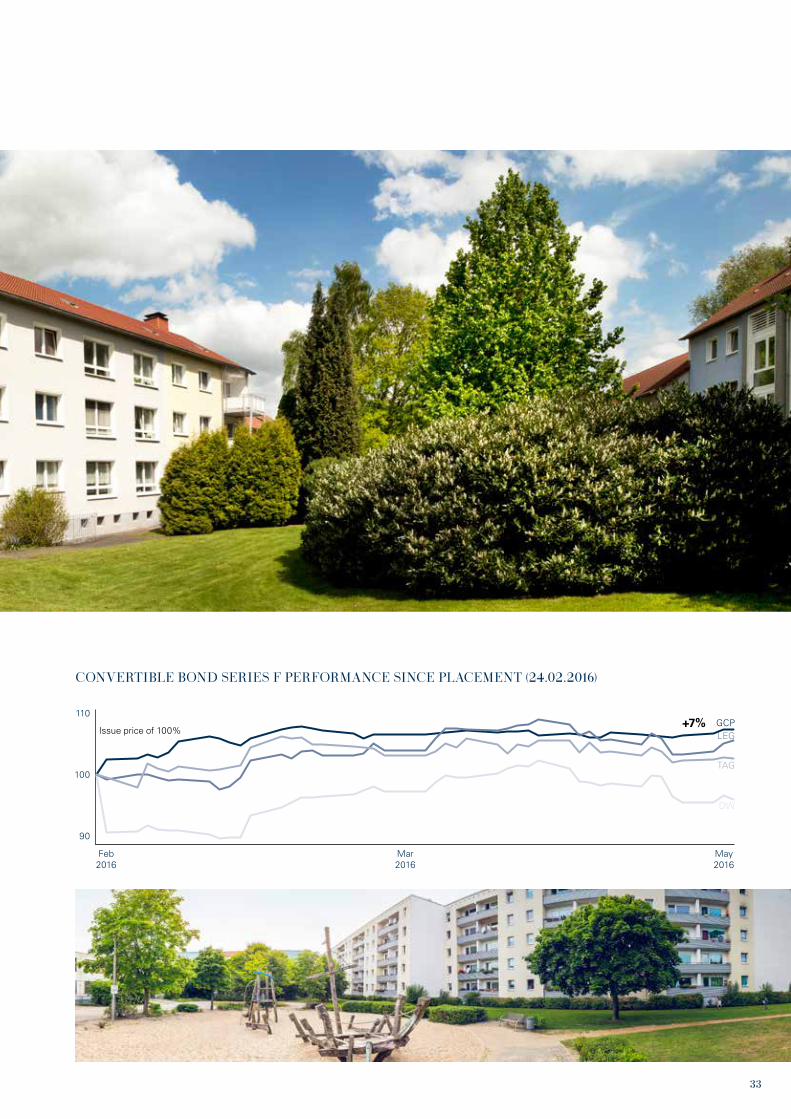
CONVERTIBLE BOND SERIES F PERFORMANCE SINCE PLACEMENT (24.02.2016)
110
100
90
GCPIssue price of 100%
+7%LEG
TAG
DW
Feb 2016
May 2016
Mar 2016
34
BO
AR
D O
F D
IRE
CT
OR
S’ R
EP
OR
T
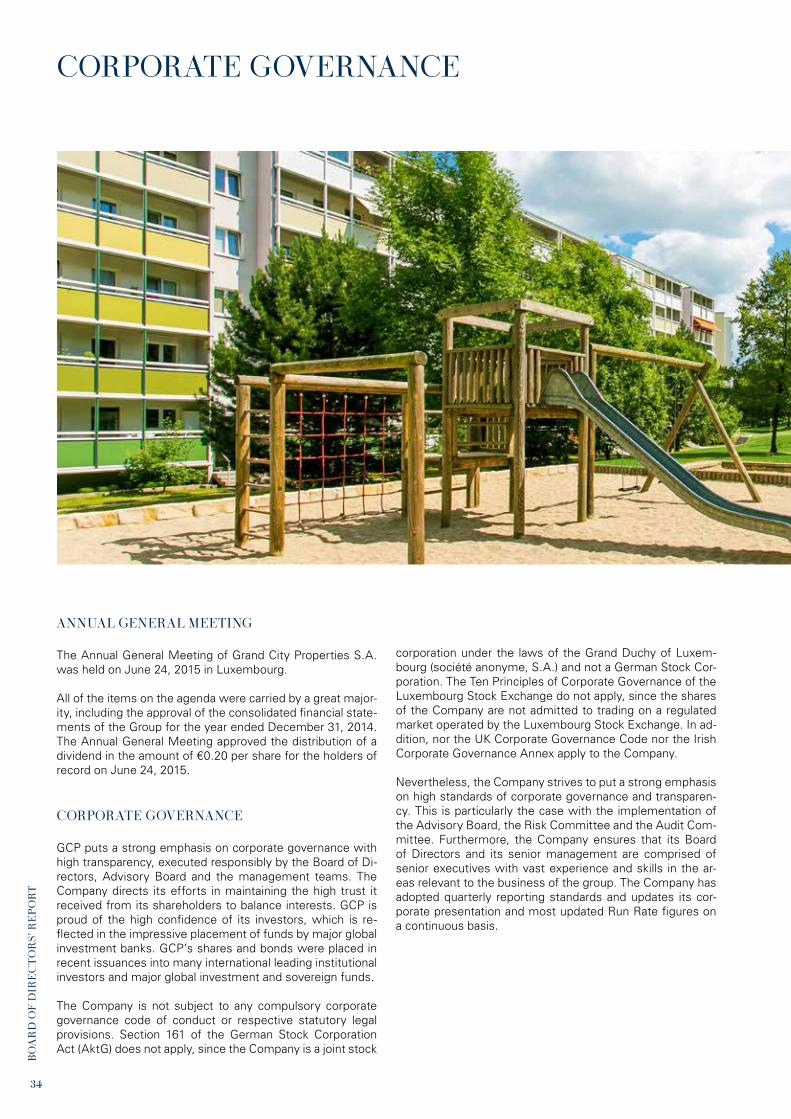
CORPORATE GOVERNANCE
ANNUAL GENERAL MEETING
The Annual General Meeting of Grand City Properties S.A. was held on June 24, 2015 in Luxembourg.
All of the items on the agenda were carried by a great major-ity, including the approval of the consolidated financial state-ments of the Group for the year ended December 31, 2014.The Annual General Meeting approved the distribution of a dividend in the amount of €0.20 per share for the holders of record on June 24, 2015.
CORPORATE GOVERNANCE
GCP puts a strong emphasis on corporate governance with high transparency, executed responsibly by the Board of Di-rectors, Advisory Board and the management teams. The Company directs its efforts in maintaining the high trust it received from its shareholders to balance interests. GCP is proud of the high confidence of its investors, which is re-flected in the impressive placement of funds by major global investment banks. GCP’s shares and bonds were placed in recent issuances into many international leading institutional investors and major global investment and sovereign funds.
The Company is not subject to any compulsory corporate governance code of conduct or respective statutory legal provisions. Section 161 of the German Stock Corporation Act (AktG) does not apply, since the Company is a joint stock
corporation under the laws of the Grand Duchy of Luxem-bourg (société anonyme, S.A.) and not a German Stock Cor-poration. The Ten Principles of Corporate Governance of the Luxembourg Stock Exchange do not apply, since the shares of the Company are not admitted to trading on a regulated market operated by the Luxembourg Stock Exchange. In ad-dition, nor the UK Corporate Governance Code nor the Irish Corporate Governance Annex apply to the Company.
Nevertheless, the Company strives to put a strong emphasis on high standards of corporate governance and transparen-cy. This is particularly the case with the implementation of the Advisory Board, the Risk Committee and the Audit Com-mittee. Furthermore, the Company ensures that its Board of Directors and its senior management are comprised of senior executives with vast experience and skills in the ar-eas relevant to the business of the group. The Company has adopted quarterly reporting standards and updates its cor-porate presentation and most updated Run Rate figures on a continuous basis.
35
BOARD OF DIRECTORS
The Company is administered and managed by a Board of Directors that is vested with the broadest powers to perform all acts of administration and management in the Company’s interest.All powers not expressly reserved by the Luxembourg law or by the articles of incorporation to the general meeting of the shareholders fall within the competence of the Board of Directors.
The Board of Directors represents the shareholders as a whole and makes decisions solely on the Company’s inter-est and independently of any conflict of interest. Regularly, the Board of Directors and its senior management evaluate the effective fulfillment of their remit and compliance with strong corporate governance rules. This evaluation is also performed on and by the Audit Committee and the Risk Committee.
The members of the Board of Directors are elected by the general meeting of the shareholders for a term not exceed-ing six years and are eligible for re-election. The directors may be dismissed with or without any cause at any time and at the sole discretion of the general meeting of the shareholders. At Grand City Properties S.A., the Board of Directors currently consists of a total of three members and resolves on matters on the basis of a simple majority, in accordance with the articles of incorporation. The Board of Directors chooses amongst the directors a chairperson who shall have a casting vote.
MEMBERS OF THE BOARD OF DIRECTORS
NAME POSITION
Ms Simone Runge-Brandner Chairperson
Mr Daniel Malkin Member
Mr Refael Zamir Member, CFO
SENIOR MANAGEMENT
The Board of Directors resolved to delegate the daily man-agement of the Company to Mr Christian Windfuhr, as Daily Manager (administrateur-délégué) of the Company, under the endorsed denomination (Zusatzbezeichnung) Chief Ex-ecutive Officer (CEO) for an undetermined period.

36
BO
AR
D O
F D
IRE
CT
OR
S’ R
EP
OR
T
CORPORATE GOVERNANCE
ADVISORY BOARD
The Board of Directors established an Advisory Board to pro-vide expert advice and assistance to the Board of Directors. The Board of Directors decides on the composition, tasks and term of the Advisory Board as well as the appointment and dismissal of its members. The Advisory Board has no statutory powers under Luxembourg law or the articles of incorporation of the Company, but applies rules adopted by the Board of Directors. The Advisory Board is an important source of guidance for the Board of Directors when making strategic decisions, capital markets activities, corporate rat-ing and in fostering contact with the business community, governmental authorities, financial institutions, analysts, and investors.
The current members of the Advisory Board are as follows:
MEMBERS OF THE ADVISORY BOARD
NAME POSITION
Mr Yakir Gabay Chairman of the Advisory Board
Mr Andrew Wallis Vice chairman of the Advisory board
Mr Claudio Jarczyk Member
Mr Markus J. Leininger Member
AUDIT COMMITTEE
The Board of Directors established an Audit Committee. The members of the Audit Committee are Mr Markus J. Leininger, Mr Reshef Ish-Gur as well as Mr Christian G. Windfuhr. The Board of Directors decides on the composi-tion, tasks and term of the Audit Committee as well as the appointment and dismissal of its members. The responsi-bilities of the Audit Committee relate to the integrity of the financial statements, including reporting to the Board of Di-rectors on its activities and the adequacy of internal systems controlling the financial reporting processes and monitoring the accounting processes.
The Audit Committee provides guidance to the Board of Di-rectors on the auditing of the annual financial statements of the Company and, in particular, shall monitor the indepen-dence of the approved independent auditor, the additional services rendered by such auditor, the issuing of the audit mandate to the auditor, the determination of auditing focal points and the fee agreement with the auditor.
37
RISK COMMITTEE
The Board of Directors established a Risk Committee for as-sisting and providing expert advice to the Board of Directors in fulfilling its oversight responsibilities, relating to the differ-ent types of risks, recommend a risk management structure including its organization and its process as well as assess and monitor effectiveness of the risk management. The Risk Committee provides advice on actions of compliance, in par-ticular by reviewing the Company’s procedures for detecting risk, the effectiveness of the Company’s risk management and internal control system and by assessing the scope and effectiveness of the systems established by the manage-ment to identify, assess and monitor risks.
The members of the Risk Committee are Ms Simone Run-ge-Brandner, Mr Daniel Malkin, Mr Markus J. Leininger, Mr Refael Zamir and Mr Timothy Wright. The Board of Direc-tors decides on the composition, tasks and term of the Risk Committee as well as the appointment and dismissal of its members.
INTERNAL CONTROLS AND RISK MANAGEMENT SYSTEMS
The Company closely monitors and manages any potential risk and sets appropriate measures in order to mitigate the occurrence of any possible failure to a minimum. The risk management is led by the Risk Committee, which constructs the risk management structure, organization and processes. The Risk Committee monitors the effectiveness of risk man-agement functions throughout the organization, ensures that infrastructure, resources and systems are in place for risk management and are adequate to maintain a satisfactory lev-el of risk management discipline. The Company categorizes the risk management systems into two main categories; in-ternal risk mitigation and external risk mitigation.
38
BO
AR
D O
F D
IRE
CT
OR
S’ R
EP
OR
T
CORPORATE GOVERNANCE
INTERNAL RISK MITIGATION
Internal controls are constructed from four main elements:
○ Risk assessment – set by the Risk Committee and guided by an ongoing analysis of the organizational structure and by identifying potential weaknesses. Further, the commit-tee assesses control deficiencies in the organization and executes issues raised by internal audit impacting the risk management framework.
○ Control discipline – based on the organizational structure and supported by employee and management commit-ments. The discipline is erected on the foundations of integrity and ethical values.
○ Control features – the Company sets physical controls, compliance checks and verifications such as cross departmental checks. Grand City Properties S.A. puts strong emphasis on separation of duties, as approval and payments are done by at least two separate parties. Payment verification is cross checked and confirmed with budget and contract. Any payment exceeding a certain set threshold amount requires additional approval by the head of the department as a condition for payment.
○ Monitoring procedures – the Company monitors and tests unusual entries, mainly through a detailed monthly actual vs.-budget analysis and checks. Strong and sustainable control and organizational systems reduce the probability of errors and mistakes significantly. The management sees high importance in constantly improving all measures, adjusting to market changes and organizational dynamics.
EXTERNAL RISK MITIGATION
As ordinary course of business, the Company is exposed to various external risks. The Risk Committee is constantly determining whether the infrastructure, resources and sys-tems are in place and adequate to maintain a satisfactory level of risk. The potential risks and exposures are related, inter alia, to volatility of interest risks, liquidity risks, credit risk, regulatory and legal risks, collection and tenant defi-ciencies, the need for unexpected capital investments and market downturn risk.
Grand City Properties S.A. sets direct and specific guidelines and boundaries to mitigate and address each risk, hedging and reducing to a minimum the occurrence of failure or po-tential default.
SHAREHOLDERS’ RIGHTS
The Company respects the rights of all shareholders and ensures that they receive equal treatment. All shareholders have equal voting rights and all corporate publications are transmitted through general publication channels as well as on a specific section on its website. The Company disclos-es its share ownership and additionally discloses any share-holder structure above 5% if it is informed by the respective shareholder.
The shareholders of Grand City Properties S.A. exercise their voting rights at the Annual General Meeting of the shareholders, whereby each share is granted one vote. The Annual General Meeting of the shareholders takes place on the last Wednesday of the month of June at 11:00 a.m. at the registered office of the Company, or at such other place as may be specified in the notice of the meeting. If such day is a legal holiday, the Annual General Meeting of the share-holders shall be held on the next following business day. At the Annual General Meeting of the shareholders the Board of Directors presents, among others, the management re-port as well as the statutory and consolidated financial state-ments to the shareholders.
The Annual General Meeting resolves, among others, on the statutory and consolidated financial statements of Grand City Properties S.A., the allocation of the statutory financial results, the appointment of the approved independent audi-tor and the discharge to and (re-)election of the members of the Board of Directors. The convening notice for the Annual General Meeting of the shareholders contains the agenda and is publicly announced twice, with a minimum interval of eight days, and eight days before the meeting in the Mé-morial, in a Luxembourg newspaper and on the Company‘s website.

39

40
BO
AR
D O
F D
IRE
CT
OR
S’ R
EP
OR
T
NOTES ON BUSINESS PERFORMANCE
SELECTED CONSOLIDATED INCOME STATEMENT DATA
REVENUE
For the 3 months ended March 31, 2016 2015
€’000
Rental and operating income 100,751 65,608
Capital gains, property revaluations and other income 69,217 59,628
Property operating expenses (46,164) (30,212)
Administrative & other expenses (1,862) (1,412)
Operating profit 121,942 93,612
Adjusted EBITDA 53,261 34,244
Finance expenses (9,119) (6,036)
Other financial results (2,766) 1,124
Current tax expenses (6,432) (3,000)
Deferred tax expenses (13,168) (5,402)
Profit for the period 90,457 80,298
For the 3 months ended March 31, 2016 2015
€’000
Rental and operating income 100,751 65,608
Total revenue 100,751 65,608
Rental and operating income increased in the first three months of 2016 to €101 million, reflecting an increase of 54% compared to the first three months of 2015. The strong increase is the result of GCP’s accretive portfolio growth and successful turnaround achievements of increasing rents and occupancy. The portfolio increased from March 2015 to March 2016 by 26 thousand units to 78 thousand units, an increase of 50%.

41
Due to acquisitions during the quarter not all properties con-tributed fully to the period’s result. In order to reflect the current portfolios rental income generation, we present the run rate which is the monthly annualized rental income. As of May 2016 the monthly annualized rental income run rate of 80 thousand units is €423 million, up from €403 million quarterly annualized rental income for the first three months of 2016.
RENTAL AND OPERATING INCOME QUARTERLY DEVELOPMENT (IN € MILLION)
RENTAL AND OPERATING INCOME ANNUAL DEVELOPMENT (IN € MILLION)
120
100
80
60
40
20
0
450
400
350
300
250
200
150
100
50
0
Q12016
100.8
Q12015
65.6
FY2014
217
FY2015
333
Q1 2016annualized
403
May 2016 annualized run rate (May*12)
423

42
BO
AR
D O
F D
IRE
CT
OR
S’ R
EP
OR
T
NOTES ON BUSINESS PERFORMANCE
CAPITAL GAINS, PROPERTY REVALUATIONS AND OTHER INCOME
PROPERTY OPERATING EXPENSES
For the 3 months ended March 31, 2016 2015
€’000
Change in fair value in investment property 68,550 31,178
Profit arising from business combinations 667 28,450
Total 69,217 59,628
For the 3 months ended March 31, 2016 2015
€’000
Total (46,164) (30,212)
The fair values of GCP’s investment properties are deter-mined by external, market leading and independent qualified valuators.
In the first three months of 2016 GCP recorded capital gains, property revaluations and other income at the amount of €69 million, 16% higher than in the first quarter of 2015. The strong increase in fair value proves the sustainable capability of the Company to lift its assets potential period over period.
Profit arising from business combinations are the results from acquisitions through share deals when the fair value of the total identifiable net assets of the company acquired exceeds the purchase price. The profit arising from business combination amounted in the first 3 months of 2016 to €0.7 million. The profit from business combination is determined and dependent on the total amount of acquisitions car-ried-out through share deals and on the ability of the Group to source deals at attractive acquisition prices. The lower amount compared to the first quarter of 2015 is the effect of significantly less acquisitions through share deals in the first quarter of 2016. Further details can be found in note 4 to the consolidated financial statements.
Property operating expenses are mainly related to ancillary costs recoverable from the tenants, such as heating and wa-ter costs, and also include maintenance costs and personnel expenses related to operations.
Property operating expenses amounted in the first three months of 2015 to €46 million. The increase from the first quarter of 2015 relates mainly to the increase of ancillary costs which are recovered by the tenants and is in line with the Company’s external growth of operating a larger port-folio and the increase in occupancy. Due to the nature of recoverable expenses, this item increases in parallel to the increase in operating income.
Although GCP’s portfolio increased significantly between the two periods, the Company was able to maintain the growth in property operating expenses proportionately to the increase in rental income over the same period. The op-erational expenses were kept proportionally stable due to a successful and swift takeover process of the new properties and by implementation of efficiency measures which are part of the turnaround strategy in which GCP is specialized. As GCP is capitalizing on the different benefits from econo-mies of scale, operational efficiencies are achieved through cost savings from the centralized monitoring of expenses, implementation of consumption based metering, large scale service tenders, and valuable capex investments.
43
MAINTENANCE AND CAPITALIZED EXPENDITURES
ADMINISTRATIVE AND OTHER EXPENSES
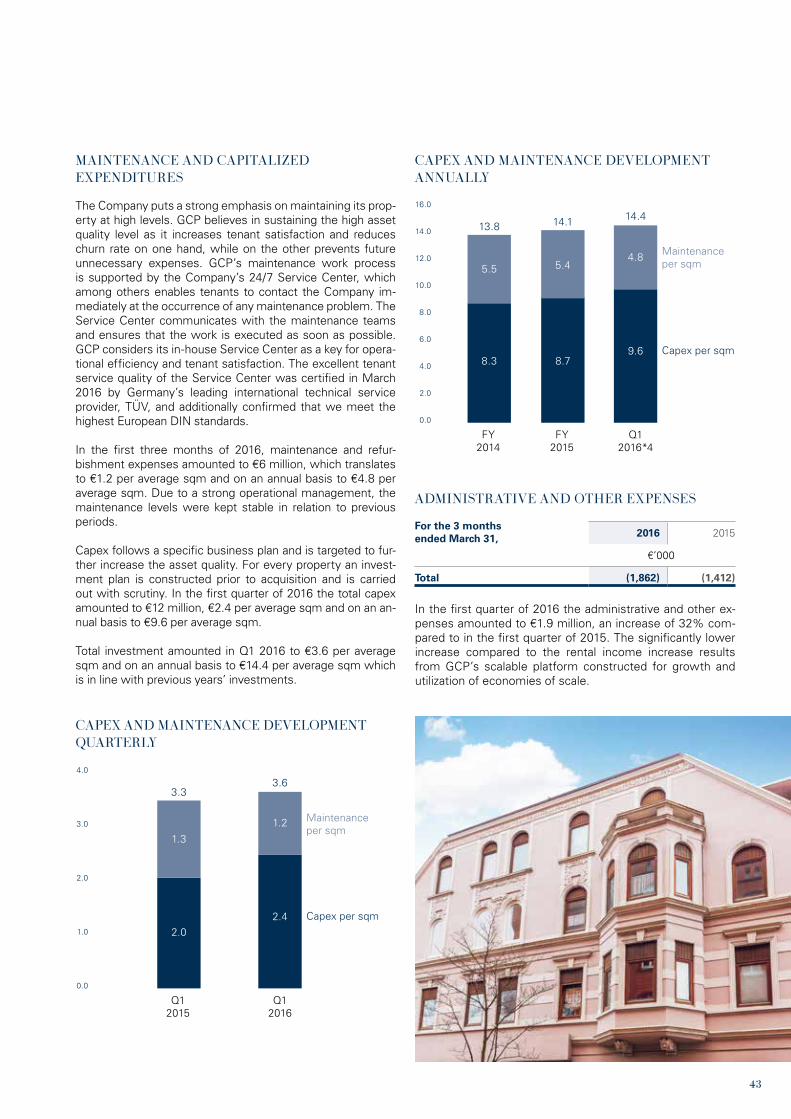
CAPEX AND MAINTENANCE DEVELOPMENT ANNUALLY
For the 3 months ended March 31, 2016 2015
€’000
Total (1,862) (1,412)
The Company puts a strong emphasis on maintaining its prop-erty at high levels. GCP believes in sustaining the high asset quality level as it increases tenant satisfaction and reduces churn rate on one hand, while on the other prevents future unnecessary expenses. GCP’s maintenance work process is supported by the Company’s 24/7 Service Center, which among others enables tenants to contact the Company im-mediately at the occurrence of any maintenance problem. The Service Center communicates with the maintenance teams and ensures that the work is executed as soon as possible. GCP considers its in-house Service Center as a key for opera-tional efficiency and tenant satisfaction. The excellent tenant service quality of the Service Center was certified in March 2016 by Germany’s leading international technical service provider, TÜV, and additionally confirmed that we meet the highest European DIN standards.
In the first three months of 2016, maintenance and refur-bishment expenses amounted to €6 million, which translates to €1.2 per average sqm and on an annual basis to €4.8 per average sqm. Due to a strong operational management, the maintenance levels were kept stable in relation to previous periods.
Capex follows a specific business plan and is targeted to fur-ther increase the asset quality. For every property an invest-ment plan is constructed prior to acquisition and is carried out with scrutiny. In the first quarter of 2016 the total capex amounted to €12 million, €2.4 per average sqm and on an an-nual basis to €9.6 per average sqm.
Total investment amounted in Q1 2016 to €3.6 per average sqm and on an annual basis to €14.4 per average sqm which is in line with previous years’ investments.
CAPEX AND MAINTENANCE DEVELOPMENT QUARTERLY
In the first quarter of 2016 the administrative and other ex-penses amounted to €1.9 million, an increase of 32% com-pared to in the first quarter of 2015. The significantly lower increase compared to the rental income increase results from GCP’s scalable platform constructed for growth and utilization of economies of scale.
4.0
3.0
2.0
1.0
0.0
16.0
14.0
12.0
10.0
8.0
6.0
4.0
2.0
0.0
Q12015
FY2014
FY2015
2.0
8.3 8.7
Q12016
Q12016*4
2.4
9.6
3.6
14.4
Capex per sqm
Capex per sqm
Maintenance per sqm
Maintenance per sqm
3.3
13.8 14.1
1.2
4.8
1.3
5.5 5.4
44
BO
AR
D O
F D
IRE
CT
OR
S’ R
EP
OR
T
NOTES ON BUSINESS PERFORMANCE
NET FINANCE EXPENSES
TAXATION
PROFIT FOR THE PERIOD
EARNINGS PER SHARE
For the 3 months ended March 31, 2016 2015
€’000
Finance expenses (9,119) (6,036)
Other financial results (2,766) 1,124
Total (11,885) (4,912)
For the 3 months ended March 31, 2016 2015
Basic earnings per share in € 0.47 0.63
Diluted earnings per share in € 0.43 0.53
For the 3 months ended March 31, 2016 2015
€’000
Current tax expenses (6,432) (3,000)
Deferred tax expenses (13,168) (5,402)
Total (19,600) (8,402)
For the 3 months ended March 31, 2016 2015
€’000
Profit for the period 90,457 80,298
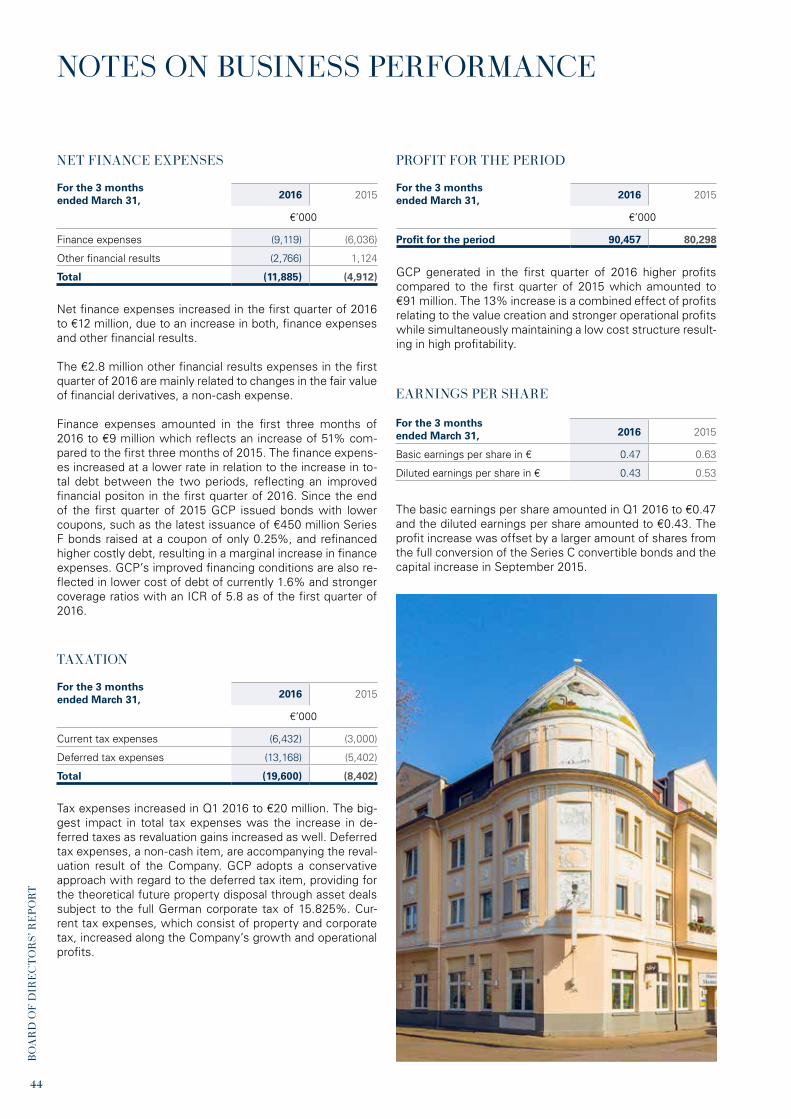
Net finance expenses increased in the first quarter of 2016 to €12 million, due to an increase in both, finance expenses and other financial results.
The €2.8 million other financial results expenses in the first quarter of 2016 are mainly related to changes in the fair value of financial derivatives, a non-cash expense.
Finance expenses amounted in the first three months of 2016 to €9 million which reflects an increase of 51% com-pared to the first three months of 2015. The finance expens-es increased at a lower rate in relation to the increase in to-tal debt between the two periods, reflecting an improved financial positon in the first quarter of 2016. Since the end of the first quarter of 2015 GCP issued bonds with lower coupons, such as the latest issuance of €450 million Series F bonds raised at a coupon of only 0.25%, and refinanced higher costly debt, resulting in a marginal increase in finance expenses. GCP’s improved financing conditions are also re-flected in lower cost of debt of currently 1.6% and stronger coverage ratios with an ICR of 5.8 as of the first quarter of 2016.
Tax expenses increased in Q1 2016 to €20 million. The big-gest impact in total tax expenses was the increase in de-ferred taxes as revaluation gains increased as well. Deferred tax expenses, a non-cash item, are accompanying the reval-uation result of the Company. GCP adopts a conservative approach with regard to the deferred tax item, providing for the theoretical future property disposal through asset deals subject to the full German corporate tax of 15.825%. Cur-rent tax expenses, which consist of property and corporate tax, increased along the Company’s growth and operational profits.
GCP generated in the first quarter of 2016 higher profits compared to the first quarter of 2015 which amounted to €91 million. The 13% increase is a combined effect of profits relating to the value creation and stronger operational profits while simultaneously maintaining a low cost structure result-ing in high profitability.
The basic earnings per share amounted in Q1 2016 to €0.47 and the diluted earnings per share amounted to €0.43. The profit increase was offset by a larger amount of shares from the full conversion of the Series C convertible bonds and the capital increase in September 2015.
45
ADJUSTED EBITDA, FFO I AND AFFO
For the 3 months ended March 31, 2016 2015
€’000
Operating Profit 121,942 93,612
Total depreciation and amortiation 536 260
EBITDA 122,478 93,872
Capital gains, property revaluations and other income (69,217) (59,628)
Adjusted EBITDA 53,261 34,244
Finance Expense (9,119) (6,036)
Current tax expenses (6,432) (3,000)
FFO I
37,710
25,208
Capex (11,823) (6,207)
AFFO
25,887
19,001
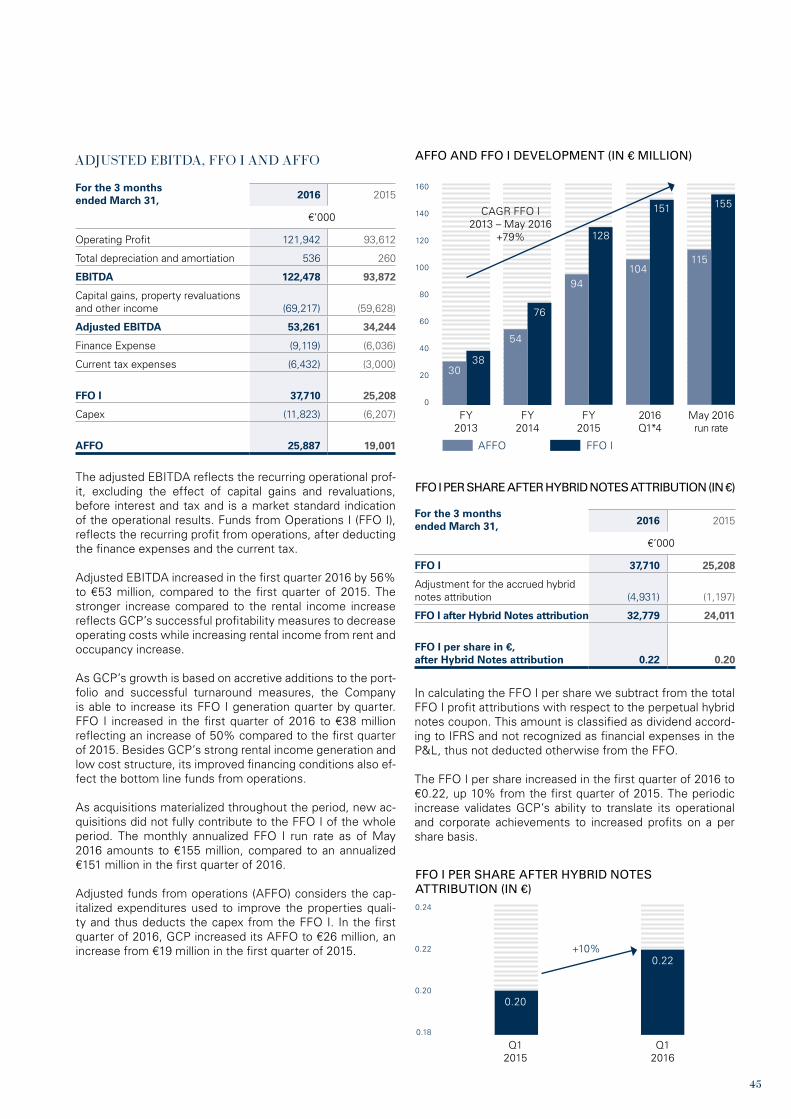
The adjusted EBITDA reflects the recurring operational prof-it, excluding the effect of capital gains and revaluations, before interest and tax and is a market standard indication of the operational results. Funds from Operations I (FFO I), reflects the recurring profit from operations, after deducting the finance expenses and the current tax.
Adjusted EBITDA increased in the first quarter 2016 by 56% to €53 million, compared to the first quarter of 2015. The stronger increase compared to the rental income increase reflects GCP’s successful profitability measures to decrease operating costs while increasing rental income from rent and occupancy increase.
As GCP’s growth is based on accretive additions to the port-folio and successful turnaround measures, the Company is able to increase its FFO I generation quarter by quarter. FFO I increased in the first quarter of 2016 to €38 million reflecting an increase of 50% compared to the first quarter of 2015. Besides GCP’s strong rental income generation and low cost structure, its improved financing conditions also ef-fect the bottom line funds from operations.
As acquisitions materialized throughout the period, new ac-quisitions did not fully contribute to the FFO I of the whole period. The monthly annualized FFO I run rate as of May 2016 amounts to €155 million, compared to an annualized €151 million in the first quarter of 2016.
Adjusted funds from operations (AFFO) considers the cap-italized expenditures used to improve the properties quali-ty and thus deducts the capex from the FFO I. In the first quarter of 2016, GCP increased its AFFO to €26 million, an increase from €19 million in the first quarter of 2015.
AFFO AND FFO I DEVELOPMENT (IN € MILLION)
FFO I PER SHARE AFTER HYBRID NOTES ATTRIBUTION (IN €)
160
140
120
100
80
60
40
20
0
2016Q1*4
May 2016run rate
151 155
104115
FY2013
3830
FY2014
76
54
FY2015
128
94
In calculating the FFO I per share we subtract from the total FFO I profit attributions with respect to the perpetual hybrid notes coupon. This amount is classified as dividend accord-ing to IFRS and not recognized as financial expenses in the P&L, thus not deducted otherwise from the FFO.
The FFO I per share increased in the first quarter of 2016 to €0.22, up 10% from the first quarter of 2015. The periodic increase validates GCP’s ability to translate its operational and corporate achievements to increased profits on a per share basis.
Q12015
0.20
Q12016
0.22+10%
FFO I PER SHARE AFTER HYBRID NOTES ATTRIBUTION (IN €)0.24
0.22
0.20
0.18
For the 3 months ended March 31, 2016 2015
€’000
FFO I 37,710 25,208
Adjustment for the accrued hybrid notes attribution (4,931) (1,197)
FFO I after Hybrid Notes attribution 32,779 24,011
FFO I per share in €, after Hybrid Notes attribution 0.22 0.20
CAGR FFO I 2013 – May 2016
+79%
AFFO FFO I

46
BO
AR
D O
F D
IRE
CT
OR
S’ R
EP
OR
T
NOTES ON BUSINESS PERFORMANCE
CASH FLOW ASSETS
For the 3 months ended March 31, 2016 2015
€’000
Net cash provided by operating activities 47,083 30,663
Net cash used in investing activities (155,942) (386,091)
Net cash provided by financing activities 376,556 285,984
Net increase in cash and cash equivalents 267,697 (69,444)
Mar 2016 Dec 2015
€’000
Non-current assets 4,285,022 4,061,699
Investment property* 4,025,288 3,859,511
Current assets 921,000 627,204
Total assets 5,206,022 4,688,903
*Including advanced payments for investment properties and balance of inventories
The strong operational improvement is mirrored in the net cash provided by operating activities, increasing by 54% to €47 million in the first quarter of 2016. The increase is de-rived from the substantial increase in rental and operating income, which reflects the growth of the portfolio as well as the increase in rents and occupancy rates.
Net cash used in investing activities amounted in the first three months of 2016 to €156 million compared with €386 million in the first three months of 2015. The 60% decrease between the two periods is due to a higher portfolio growth in the first quarter of 2015 in comparison to the first quarter of 2016, although the growth momentum continued with €156 million investments in the period. The net cash provid-ed by financing activities of €377 million derives to a large extent from the issuance of convertible bond series F, off-set by prepayments of bank loans and payment of dividend to the hybrid note holders. Therefore, in the first quarter of 2016 the net increase in cash and cash equivalents amount-ed to €268 million, supplying additional firepower to further pursue attractive opportunities.
Total assets increased since December 2015 by €0.5 billion to over €5.2 billion. The growth results mainly from the in-crease in the investment properties and in the cash balanc-es. The increase in the cash balances, amounting to €268 million, is mainly due to the €450 million Series F convertible bond issuance from February 2016, offset by cash used to fund the Company’s growth.

47
LIABILITIES
Mar 2016 Dec 2015
€’000
Total loans and borrowings* 802,440 846,900
Straight bonds 1,046,603 1,045,413
Convertible bond 426,191 122,576
Deferred tax liabilities 251,540 239,374
Other long term liabilities and derivative financial instruments 56,748 39,704
Other current liabilities 220,463 222,641
Total 2,803,985 2,516,608
* includes an amount of €9 million short term loans and borrowings
Total liabilities increased from December 2015 to March 2016 to €2.8 billion. The increase of €287 million is significantly below the increase in total assets of €517 million, reflecting a stronger capital structure. Total loans and borrowings de-creased by €44 million mainly relating to early repayment of expensive loans. The convertible bond balance increased by €304 million as a result of the issuance of Series F, bearing a coupon of 0.25%, offset by the full conversion of Series C at the amount of €123 million, bearing a coupon of 1.5%. The changes in the loans and borrowings and in the convertible bond balances decreased the average cost of debt of the Company to a low of 1.6%.GCP’s conservative stance is also embodied in its deferred taxes approach, for which it assumes the sale of properties through asset deals with a full German real estate tax effect (15.825%). Therefore, the deferred tax balances amounted to €252 million as of the end of March 2016, up €12 million from the end of 2015 due to property revaluations carried out in the period.
48
BO
AR
D O
F D
IRE
CT
OR
S’ R
EP
OR
T
NOTES ON BUSINESS PERFORMANCE
EPRA NAVLOAN-TO-VALUE Mar 2016 Dec 2015
€’000
Investment property* 4,025,288 3,859,511
Total Debt 2,275,234 2,014,889
Cash and liquid assets 649,577 388,925
Net debt 1,625,657 1,625,964
LTV 40% 42%
* Including advanced payments for investment properties and balance of inventories
Mar 2016 Dec 2015
€’000
Total Equity 2,402,037 2,172,295
Fair Value measurements of deriva-tive financial instruments 9,565 6,995
Deferred tax liabilities 251,540 239,374
In-the-money Convertible bond* - 125,683
EPRA NAV including hybrid notes 2,663,142 2,544,347
Equity attributable to Hybrid capital investors 480,527 478,146
EPRA NAV 2,182,615 2,066,201
*The amount includes accrued interest
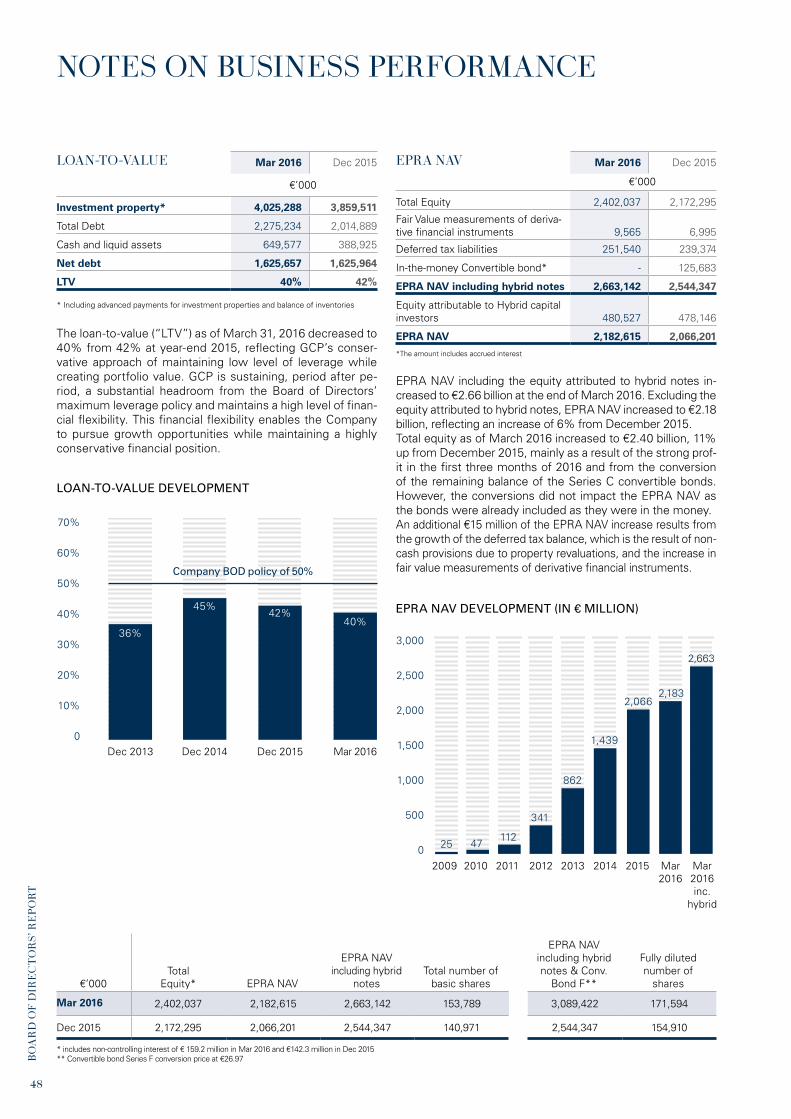
The loan-to-value (“LTV”) as of March 31, 2016 decreased to 40% from 42% at year-end 2015, reflecting GCP’s conser-vative approach of maintaining low level of leverage while creating portfolio value. GCP is sustaining, period after pe-riod, a substantial headroom from the Board of Directors’ maximum leverage policy and maintains a high level of finan-cial flexibility. This financial flexibility enables the Company to pursue growth opportunities while maintaining a highly conservative financial position.
EPRA NAV including the equity attributed to hybrid notes in-creased to €2.66 billion at the end of March 2016. Excluding the equity attributed to hybrid notes, EPRA NAV increased to €2.18 billion, reflecting an increase of 6% from December 2015. Total equity as of March 2016 increased to €2.40 billion, 11% up from December 2015, mainly as a result of the strong prof-it in the first three months of 2016 and from the conversion of the remaining balance of the Series C convertible bonds. However, the conversions did not impact the EPRA NAV as the bonds were already included as they were in the money.An additional €15 million of the EPRA NAV increase results from the growth of the deferred tax balance, which is the result of non-cash provisions due to property revaluations, and the increase in fair value measurements of derivative financial instruments.
EPRA NAV DEVELOPMENT (IN € MILLION)
2009
25
2010
47
2011
112
2012
341
2013
862
2014
1,439
2015
2,066
€’000Total
Equity* EPRA NAV
EPRA NAV including hybrid
notesTotal number of
basic shares
EPRA NAV including hybrid notes & Conv.
Bond F**
Fully diluted number of
shares
Mar 2016 2,402,037 2,182,615 2,663,142 153,789 3,089,422 171,594
Dec 2015 2,172,295 2,066,201 2,544,347 140,971 2,544,347 154,910
* includes non-controlling interest of € 159.2 million in Mar 2016 and €142.3 million in Dec 2015** Convertible bond Series F conversion price at €26.97
3,000
2,500
2,000
1,500
1,000
500
0
LOAN-TO-VALUE DEVELOPMENT
Dec 2014
45%
Dec 2013
36%
Dec 2015
42%
Company BOD policy of 50%
Mar 2016
40%
70%
60%
50%
40%
30%
20%
10%
0
Mar2016
2,183
Mar2016 inc.
hybrid
2,663
49
DISCLAIMER
By order of the Board of Directors,Luxembourg, May 17, 2016
The financial data and results of the Group are affected by financial and operating results of its subsidiaries. Significance of the information presented in this report is examined from the perspective of the Company including its portfolio with the joint ventures. In several cases, additional information and details are provided in order to present a comprehensive representation of the subject described, which in the Group’s view is essential to this report. These condensed interim consolidated financial statements have not been reviewed by the auditor.
Simone Runge-BrandnerDirector
Refael ZamirDirector, CFO
Daniel MalkinDirector
50 The notes on pages 64 to 80 form an integral part of these consolidated financial statements.
INTERIM CONSOLIDATED STATEMENT OF COMPREHENSIVE INCOME
INT
ER
IM C
ON
SOL
IDA
TE
D S
TA
TE
ME
NT
OF
CO
MPR
EH
EN
SIV
E I
NC
OM
E

51The notes on pages 64 to 80 form an integral part of these consolidated financial statements.
For the three monthsended March 31,
2016 2015
Note €’000
Revenue 100,751 65,608
Capital gains, property revaluations and other income 4, 5 69,217 59,628
Property operating expenses (46,164) (30,212)
Administrative and other expenses (1,862) (1,412)
Operating profit 121,942 93,612
Finance expenses (9,119) (6,036)
Other financial results (2,766) 1,124
Net finance expenses (11,885) (4,912)
Profit before tax 110,057 88,700
Current tax expenses 6 (6,432) (3,000)
Deferred tax expenses 6 (13,168) (5,402)
Tax and deferred tax expenses (19,600) (8,402)
Profit for the period 90,457 80,298
Other comprehensive income for the period, net of tax - -
Total comprehensive income for the period 90,457 80,298
INTERIM CONSOLIDATED STATEMENT OF COMPREHENSIVE INCOME
52 The notes on pages 64 to 80 form an integral part of these consolidated financial statements.
For the three monthsended March 31,
2016 2015
Note €’000
Profit attributable to:
Owners of the Company 69,873 75,048
Hybrid capital investors 4,931 1,197
Non controlling interests 15,653 4,053
90,457 80,298
Net earnings per share attributable to the owners of the Company (in euro):
Basic earnings per share 0.47 0.63
Diluted earnings per share 0.43 0.53INT
ER
IM C
ON
SOL
IDA
TE
D S
TA
TE
ME
NT
OF
CO
MPR
EH
EN
SIV
E I
NC
OM
E
INTERIM CONSOLIDATED STATEMENT OF COMPREHENSIVE INCOME (CONTINUED)

53
54 The notes on pages 64 to 80 form an integral part of these consolidated financial statements.
INTERIM CONSOLIDATED STATEMENT OF FINANCIAL POSITION
INT
ER
IM C
ON
SOL
IDA
TE
D S
TA
TE
ME
NT
OF
FIN
AN
CIA
L P
OSI
TIO
N

55The notes on pages 64 to 80 form an integral part of these consolidated financial statements.
March 31 December 31
2016 2015
Unaudited Audited
Note €’000
Assets
Equipment and intangible assets 9,521 9,493
Investment property 5 3,984,537 3,845,979
Other non-current assets 280,838 195,390
Deferred tax assets 10,126 10,837
Non-current assets 4,285,022 4,061,699
Cash and cash equivalents 503,698 236,001
Traded securities at fair value through profit and loss 145,879 152,924
Inventories – Trading property 12,053 11,877
Trade and other receivables 259,370 226,402
Current assets 921,000 627,204
Total assets 5,206,022 4,688,903

56 The notes on pages 64 to 80 form an integral part of these consolidated financial statements.
March 31 December 31
2016 2015
Unaudited Audited
Note €’000
Equity
Share capital 8 15,379 14,097
Share premium 708,809 582,910
Other reserves 42,687 29,283
Retained earnings 995,472 925,599
Total equity attributable to the owners of the Company 1,762,347 1,551,889
Equity attributable to Hybrid capital investors 8 480,527 478,146
Total equity attributable to the owners of the Company and Hybrid capital investors 2,242,874 2,030,035
Non controlling interests 159,163 142,260
Total equity 2,402,037 2,172,295
Liabilities
Loans and borrowings 7A 793,141 792,224
Convertible bond 7B, 7F 426,191 122,576
Straight Bonds 7C- 7E 1,046,603 1,045,413
Derivative financial instruments 9,565 6,995
Other non-current liabilities 47,183 32,709
Deferred tax liabilities 251,540 239,374
Non-current liabilities 2,574,223 2,239,291
Current portion of long term loans 7A 9,299 19,998
Loan redemption 7A - 34,678
Trade and other payables 181,931 190,358
Tax payable 14,496 13,389
Provisions for other liabilities and charges 24,036 18,894
Current liabilities 229,762 277,317
Total liabilities 2,803,985 2,516,608
Total equity and liabilities 5,206,022 4,688,903
INTERIM CONSOLIDATED STATEMENT OF FINANCIAL POSITION (CONTINUED)
The Board of Directors of Grand City Properties S.A. authorized these condensed interim consolidated financial statements for issuance on May 17, 2016
Simone Runge-BrandnerDirector
Refael ZamirDirector, CFO
Daniel MalkinDirectorIN
TE
RIM
CO
NSO
LID
AT
ED
ST
AT
EM
EN
T O
F F
INA
NC
IAL
PO
SIT
ION
57

58 The notes on pages 64 to 80 form an integral part of these consolidated financial statements.
INTERIM CONSOLIDATED STATEMENT OF CHANGES IN EQUITYFOR THE THREE MONTHS ENDED MARCH 31, 2016
INT
ER
IM C
ON
SOL
IDA
TE
D C
HA
NG
ES
IN E
QU
ITY
Attributable to the owners of the Company
€’000Share capital
SharePremium
Equity portion of
convertible bond
Other reserves
Retained earnings Total
Equity attributable to Hybrid
capital investors
Total Equity attributable to the own-ers of the Company
and Hybrid capital
investors
Non-controlling interests
Total equity
Balance as at December 31, 2015 (Audited) 14,097 582,910 7,131 22,152 925,599 1,551,889 478,146 2,030,035 142,260 2,172,295
Profit for the period - - - - 69,873 69,873 4,931 74,804 15,653 90,457
Other comprehen-sive income for the period - - - - - - - - - -
Total comprehen-sive income for the period - - - - 69,873 69,873 4,931 74,804 15,653 90,457
Issuance of shares related to conversion of convertible bond 1,282 125,899 (7,131) - - 120,050 - 120,050 - 120,050
Equity component of convertible bond F - - 20,351 - - 20,351 - 20,351 - 20,351
Amount paid to hybrid capital notes holders - - - - - - (2,550) (2,550) - (2,550)
Non-controlling interests arising from initially consolidated companies - - - - - - - - 1,250 1,250
Equity settled share-based payment - - - 184 - 184 - 184 - 184
Balance as at March 31, 2016 (Unaudited) 15,379 708,809 20,351 22,336 995,472 1,762,347 480,527 2,242,874 159,163 2,402,037
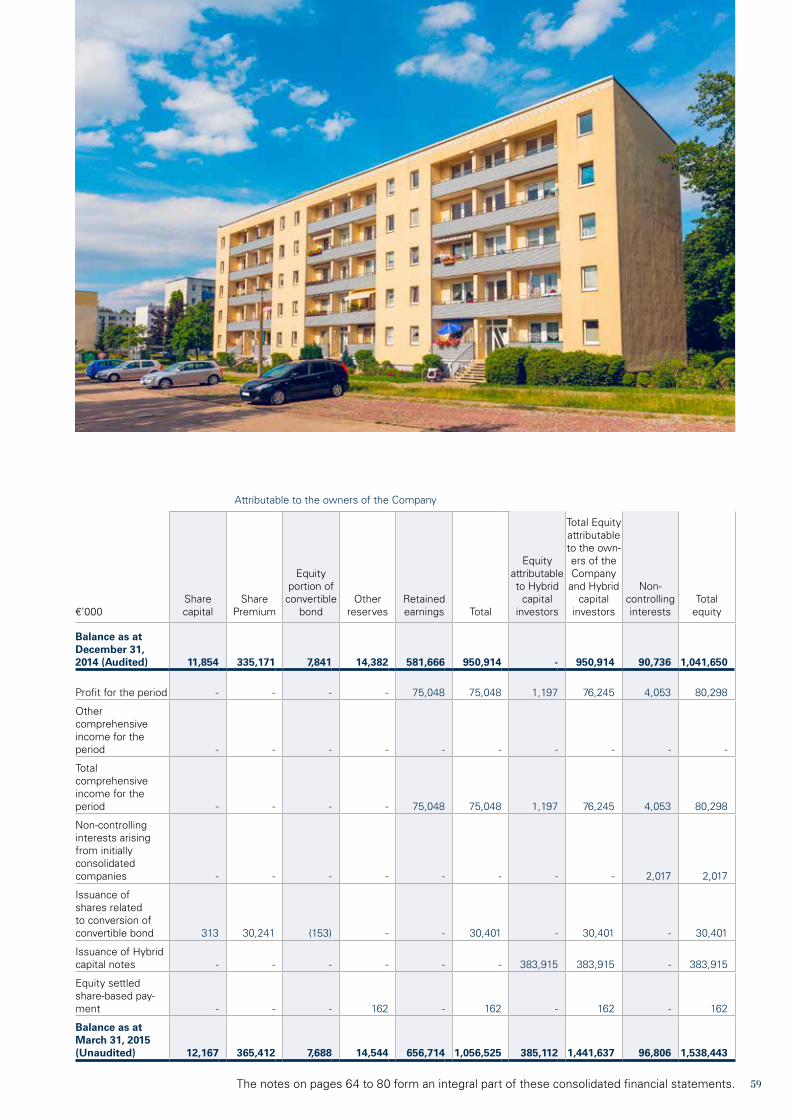
59The notes on pages 64 to 80 form an integral part of these consolidated financial statements.
Attributable to the owners of the Company
€’000Share capital
SharePremium
Equity portion of
convertible bond
Other reserves
Retained earnings Total
Equity attributable to Hybrid
capital investors
Total Equity attributable to the own-ers of the Company
and Hybrid capital
investors
Non-controlling interests
Total equity
Balance as at December 31, 2014 (Audited) 11,854 335,171 7,841 14,382 581,666 950,914 - 950,914 90,736
1,041,650
Profit for the period - - - - 75,048 75,048 1,197 76,245 4,053 80,298
Other comprehensive income for the period - - - - - - - - - -
Total comprehensive income for the period - - - - 75,048 75,048 1,197 76,245 4,053 80,298
Non-controlling interests arising from initially consolidated companies - - - - - - - - 2,017 2,017
Issuance of shares related to conversion of convertible bond 313 30,241 (153) - - 30,401 - 30,401 - 30,401
Issuance of Hybrid capital notes - - - - - - 383,915 383,915 - 383,915
Equity settled share-based pay-ment - - - 162 - 162 - 162 - 162
Balance as at March 31, 2015 (Unaudited) 12,167 365,412 7,688 14,544 656,714 1,056,525 385,112 1,441,637 96,806 1,538,443

60 The notes on pages 64 to 80 form an integral part of these consolidated financial statements.
INTERIM CONSOLIDATED STATEMENT OF CASH FLOWS
INT
ER
IM C
ON
SOL
IDA
TE
D S
TA
TE
ME
NT
OF
CA
SH F
LO
WS
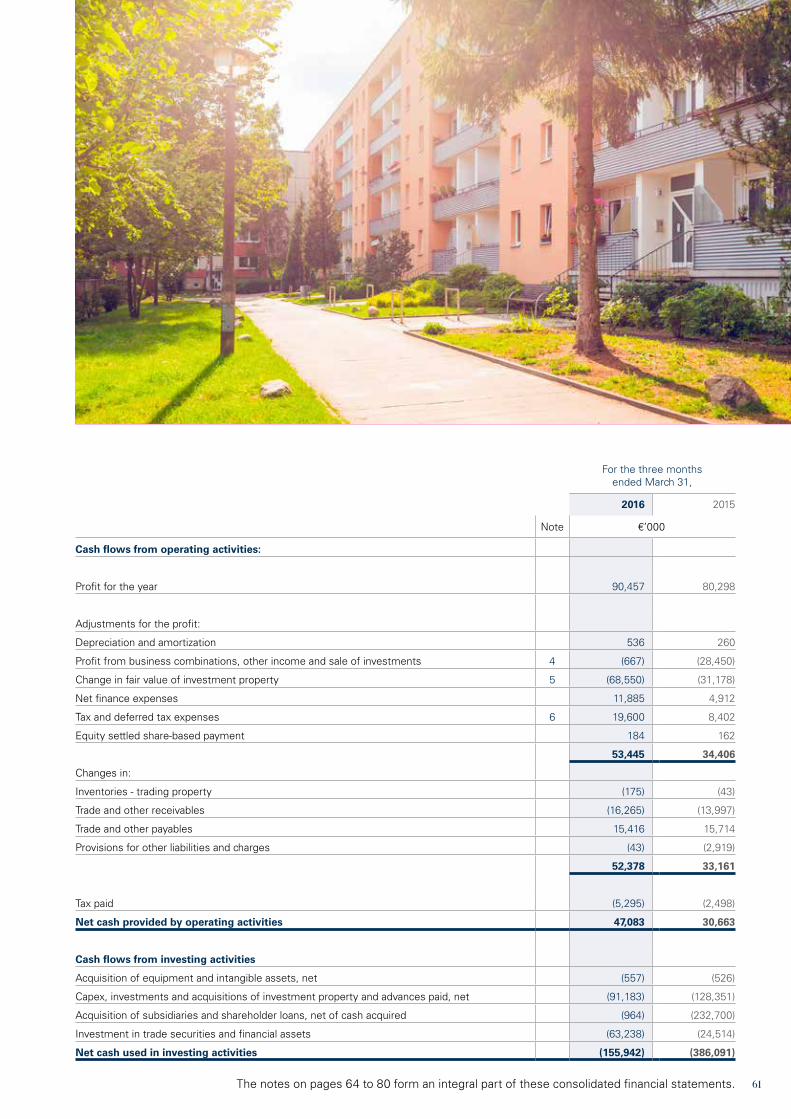
61The notes on pages 64 to 80 form an integral part of these consolidated financial statements.
For the three monthsended March 31,
2016 2015
Note €’000
Cash flows from operating activities:
Profit for the year 90,457 80,298
Adjustments for the profit:
Depreciation and amortization 536 260
Profit from business combinations, other income and sale of investments 4 (667) (28,450)
Change in fair value of investment property 5 (68,550) (31,178)
Net finance expenses 11,885 4,912
Tax and deferred tax expenses 6 19,600 8,402
Equity settled share-based payment 184 162
53,445 34,406
Changes in:
Inventories - trading property (175) (43)
Trade and other receivables (16,265) (13,997)
Trade and other payables 15,416 15,714
Provisions for other liabilities and charges (43) (2,919)
52,378 33,161
Tax paid (5,295) (2,498)
Net cash provided by operating activities 47,083 30,663
Cash flows from investing activities
Acquisition of equipment and intangible assets, net (557) (526)
Capex, investments and acquisitions of investment property and advances paid, net (91,183) (128,351)
Acquisition of subsidiaries and shareholder loans, net of cash acquired (964) (232,700)
Investment in trade securities and financial assets (63,238) (24,514)
Net cash used in investing activities (155,942) (386,091)
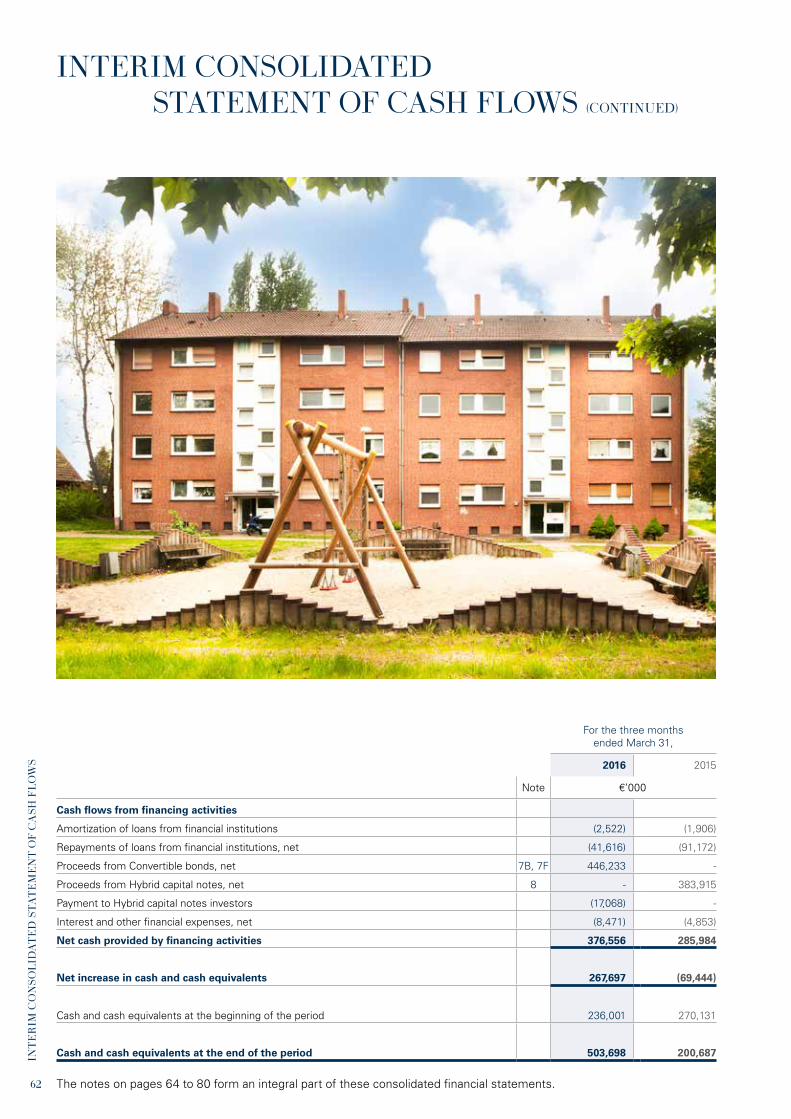
62 The notes on pages 64 to 80 form an integral part of these consolidated financial statements.
For the three monthsended March 31,
2016 2015
Note €’000
Cash flows from financing activities
Amortization of loans from financial institutions (2,522) (1,906)
Repayments of loans from financial institutions, net (41,616) (91,172)
Proceeds from Convertible bonds, net 7B, 7F 446,233 -
Proceeds from Hybrid capital notes, net 8 - 383,915
Payment to Hybrid capital notes investors (17,068) -
Interest and other financial expenses, net (8,471) (4,853)
Net cash provided by financing activities 376,556 285,984
Net increase in cash and cash equivalents 267,697 (69,444)
Cash and cash equivalents at the beginning of the period 236,001 270,131
Cash and cash equivalents at the end of the period 503,698 200,687
INTERIM CONSOLIDATED STATEMENT OF CASH FLOWS (CONTINUED)
INT
ER
IM C
ON
SOL
IDA
TE
D S
TA
TE
ME
NT
OF
CA
SH F
LO
WS

63
64
CO
ND
EN
SED
NO
TE
S T
O T
HE
IN
TE
RIM
CO
NSO
LID
AT
ED
FIN
AN
CIA
L ST
AT
EM
EN
TS
CONDENSED NOTES TO THE INTERIM CONSOLIDATED FINANCIAL STATEMENTS FOR THE THREE MONTHS PERIOD ENDED MARCH 31, 2016
65
1. GENERAL
(A) INCORPORATION AND PRINCIPAL ACTIVITIES
Grand City Properties S.A. (“the Company”) was incorporat-ed in Luxembourg on December 16, 2011 as a société ano-nyme (private company with limited liability). Its registered office is at 24 Avenue Victor Hugo, L – 1750, Luxembourg.The condensed interim consolidated financial statements (“interim financial statements”) for the three months ended March 31, 2016 consist of the financial statements of the Company and its subsidiaries (“the Group”).The Group’s vision is buying, redeveloping, turning around and optimizing real estate properties in Germany.
(B) CAPITAL AND BOND INCREASES DURING THE REPORTING PERIOD
For information about bonds and capital increase, please see note 7 and 8, respectively.
(C) LISTING ON THE FRANKFURT STOCK EXCHANGE
On May 28, 2012 the Company was listed on the Frankfurt Stock Exchange in the Entry Standard market segment. The Company has registered 50,000,000 ordinary shares with a par value of euro 0.10 per share. As at the reporting date, the issued and fully paid share capital consists 153,788,883 shares with a par value of euro 0.1 per share.
(E) DEFINITIONS
Throughout these notes to the interim financial statements:
The Company Grand City Properties S.A.
The Group The Company and its investees
Subsidiaries Companies that are controlled by the Company (as defined in IFRS 10) and whose financial statements are consoli-dated with those of the Group
Investees Subsidiaries, jointly controlled entities and associates
Related parties As defined in IAS 24
The reporting period
The three months ended on March 31, 2016
(D) GROUP RATING
On February 9, 2015, Moody’s Investors Services (“Moody’s”) has assigned a first-time long-term issuer rating of “Baa2” to the Group, with a stable outlook. Moody’s state that the Group’s rating is based on moderate leverage, finan-cial strength metrics stronger than those of similarly rated peers and good liquidity profile. The rating is supported by the Group’s prudent financial policies and the healthy debt maturity profile. In addition, Moody’s has rated the Hybrid capital notes as Ba1.
On July 24 2015, S&P raised the Company’s rating on its long-term corporate credit rating to ‘BBB’ from ‘BBB-‘. The rating of the Company’s senior unsecured and subordinated hybrid debt instruments improved by one notch as well to ‘BBB’ for its senior secured debt and ‘BB+’ for its subordi-nated hybrid notes.
66
CO
ND
EN
SED
NO
TE
S T
O T
HE
IN
TE
RIM
CO
NSO
LID
AT
ED
FIN
AN
CIA
L ST
AT
EM
EN
TS
2. BASIS OF PREPARATION
(A) STATEMENT OF COMPLIANCE
These condensed interim consolidated financial statements have been prepared in accordance with IAS 34 interim fi-nancial reporting. They do not include all the information required for a complete set of IFRS financial statements. However, selected explanatory notes are included to ex-plain events and transactions that are significant to an un-derstanding of the changes in the Group’s financial position and performance since the last annual consolidated financial statements as at and for the year ended December 31, 2014. These condensed interim consolidated financial statements have not been reviewed by the auditor.
For further information on the accounting and measurement policies used, please refer to the consolidated financial statements as at December 31, 2015, which are the basis for these interim consolidated financial statements.These condensed interim consolidated financial statements were authorized for issuance by the Company’s Board of Di-rectors on May 17, 2016.
(B) JUDGMENTS AND ESTIMATES
In preparing these condensed interim consolidated financial statements, management applies judgments, estimates and assumptions that affect the application of accounting poli-cies and the reported amounts of assets and liabilities, in-come and expenses. Actual results may differ from these estimates.
The significant judgments made by management in applying the Group’s accounting policies and the key sources of esti-mation uncertainty are consistent with those that applied to the consolidated financial statements as at and for the year ended December 31, 2015.
(C) OPERATING SEGMENTS
The Group meets the definition of operating in two operat-ing segments. An operating segment is a component of the Group that meets the following three criteria:
○ Is engaged in business activities from which it may earn revenues and incur expenses, including revenues and expenses relating to intragroup transactions;
○ Whose operating results are regularly reviewed by the Group’s chief operating decision maker to make decisions about resources to be allocated to the segment and as-sess its performance; and
○ For which separate financial information is available.
The main operating segment is rental income relates to owned investment properties. The second operating seg-ment relates to services charges to third parties (e.g. prop-erty management). The results from this segment is minor and does not meet the threshold to show as a separate re-porting segment, therefore only one reporting segment is presented.
(D) SEASONALITY OF OPERATIONS
Rental income, other revenues and costs are received and incurred smoothly over the accounting period. Therefore no additional disclosures are made in the interim condensed consolidated financial statements.
(E) GOING CONCERN
The condensed interim consolidated financial statements are prepared on a going concern basis.
67
The accounting policies adopted in the preparation of the condensed interim consolidated financial statements are consistent with those followed in the preparation of the Group’s annual financial statements for the year ended on December 31, 2015. The following standards have been is-sued but are not yet effective for annual periods beginning on January 1, 2016. Those which may be relevant to the Group are set out below. The Group does not plan to early adopt these standards.
(I) IFRS 9 - FINANCIAL INSTRUMENTS (2009, 2010)
IFRS 9 (2009) introduces new requirements for the classifi-cation and measurement of financial assets. Under IFRS 9 (2009), financial assets are classified and measured based on the business model in which they are held and the char-acteristics of their contractual cash flows. IFRS 9 (2010) in-troduces additional changes relating to financial liabilities. The IASB currently has an active project to make limited amendments to the classification and measurement require-ments of IFRS 9 and to add new requirements to address the impairment of financial assets and hedge accounting. IFRS 9 is effective for annual reporting periods beginning on or after January 1, 2018, with early adoption permitted.
(II) IFRS 15 - REVENUE FROM CONTRACTS WITH CUSTOMERS
IFRS 15 establishes a comprehensive framework for deter-mining whether, how much and when revenue is recognized. It replaces existing revenue recognition guidance, including IAS 18 Revenue, IAS 11 Construction Contracts and IFRIC 13 Customers Loyalty Programs. IFRS 15 is effective for an-nual reporting periods beginning on or after January 1, 2018, with early adoption permitted.
The Group has considered the above new standards, and will continue to evaluate the impact on the Group’s consolidated financial statements. At this time, the impact of the above publications is not expected to be material to the Group’s consolidated financial statements.
3. SIGNIFICANT ACCOUNTING POLICIES

68
CO
ND
EN
SED
NO
TE
S T
O T
HE
IN
TE
RIM
CO
NSO
LID
AT
ED
FIN
AN
CIA
L ST
AT
EM
EN
TS
(A) ACQUISITIONS
During the reporting period the Group obtained control of a company through acquisition in a total consideration of euro 1 million, net of cash acquired. As an outcome of the busi-ness combination, the Group recorded profit arising from bargain purchases at the amount of euro 0.7 million and non-controlling interests at the amount of euro 1.3 million. The aggregated identifiable assets and liabilities acquired as at the date of the transaction were as follows:
€’000
Investment property 4,980
Working capital, net 26
Cash and Cash equivalents 36
5,042
Bank loans (1,953)
Other liabilities, net (172)
(2,125)
Total identifiable net assets 2,917
Non-controlling interests arising from initial consolidation (1,250)
Consideration paid (1,000)
Profit arising from business combination (bargain purchase) 667
4. ACQUISITION OF SUBSIDIARIES AND NON–CONTROLLING INTERESTS
If the above purchase was carried out at the beginning of the reporting period, the Group’s revenue would have been increased by euro 113 thousand, and the Group’s net profit would have been increased by euro 8 thousand.
69
5. INVESTMENT PROPERTY
Three months ended
March 31
Year ended
December 31
2016 2015
Unaudited Audited
€’000
Balance as at January 1 3,845,979 2,179,982
Acquisitions of investment property during the period / year 65,028 409,912
Investment property arising from initial consolidation 4,980 1,138,494
Disposal of investment property - (101,720)
Transfer to Inventories – trading property - (5,120)
Fair value adjustment 68,550 224,431
Balance as at March 31 / December 31 3,984,537 3,845,979
70
CO
ND
EN
SED
NO
TE
S T
O T
HE
IN
TE
RIM
CO
NSO
LID
AT
ED
FIN
AN
CIA
L ST
AT
EM
EN
TS
6. TAX AND DEFERRED TAX EXPENSES
Tax and deferred tax expenses are recognized based on management’s best estimate of the weighted average an-nual income tax rate expected for the full financial year mul-tiplied by the pre-tax income of the interim reporting period.
The Group tax and deferred tax expenses for the three months ended March 31, 2016, is euro 19,600 thousand (2015: euro 8,402 thousand). The Company recorded euro 3,135 thousand for corporation tax (2015: euro 1,004 thou-sand), euro 13,168 thousand for deferred tax and euro 3,297 thousand for property tax (2015: euro 5,402 thousand and euro 1,996 thousand, respectively).
7. LOANS AND BORROWINGS, CONVERTIBLE AND STRAIGHT BONDS
March 31 December 31
2016 2015
Unaudited Audited
Note €’000
Long - term liabilities
Bank loans 793,141 792,224
Total long term loans 793,141 792,224
Straight and Convertible bonds
Convertible bond series C B - 122,576
Straight bond series D C 479,861 479,032
Straight bond E D 517,232 516,517
Straight bond CHF E 49,510 49,864
Convertible bond series F F 426,191 -
Total Straight and Convertible bonds 1,472,794 1,167,989
Short - term loans
Bank loans 9,299 19,998
Loan redemption - 34,678
Total short - term loans 9,299 54,676
A. COMPOSITION
71
7. LOANS AND BORROWINGS, CONVERTIBLE AND STRAIGHT BONDS (CONTINUED)
Three months ended
March 31
Year ended
December 31
2016 2015
Unaudited Audited
€’000
Balance at the beginning of the period / year 125,683 247,451
Expenses (income) for the period / year (3,063) 583
Expenses paid (2,570) (3,433)
Conversion to ordinary shares and redemption (122,620) (118,918)
Carrying amount of liability at the end of the period / year - 125,683
Non-current portion of Convertible bond series C - 122,576
Accrued interest - -
Total convertible bond series C - 122,576
Deferred income - 3,107
B. CONVERTIBLE BOND SERIES C
On February 24, 2014, the Company issued euro 150 million (nominal value) bonds, convertible into ordinary shares of the Company and bear a coupon of 1.50% p.a., payable semi-an-nually in arrears (hereafter – “Convertible bond series C”). The initial conversion price was fixed at euro 9.72. The bonds were issued at 100% of their principle amount and will be redeemed at maturity at 106.65% of their principle amount.
On June 19, 2014, the Company successfully completed with the tap up placement of additional euro 125 million (nominal value) of Convertible bond series C, for a consid-eration that reflected 111.25% of their principal amount. The total aggregated principal amount of the Convertible bond series C increased to euro 275 million (nominal value).
On June 25, 2015, as a result of the resolved dividend dis-tribution (see note 8) and in accordance with the terms and conditions of the bond, the Company adjusted the con-version price for the Convertible bond series C to be euro 9.5957 per share.
On January 11, 2016 the Company has resolved to exercise its right to redeem the outstanding euro 275 million 1.5 per cent Convertible bond C (hereafter – “Convertible bond”) in accordance with the terms and conditions of the Convert-ible bond. As of the resolution day, the principle amount of the Convertible bond which has been converted and/or re-deemed is euro 151,800,000. As of February 1, 2016 the principal amount of the Convertible bond which has been converted into share capital of the Company was euro 274,800,000 which represents 99.93 per cent of the aggre-gate principal amount of the Convertible bond and results a decrease of debt in the same amount. As a result, the equity of the company increase by euro 123 million. The outstand-ing Convertible bond in the amount of Euro 200,000 has been redeemed at its principal amount and accrued interest.

72
CO
ND
EN
SED
NO
TE
S T
O T
HE
IN
TE
RIM
CO
NSO
LID
AT
ED
FIN
AN
CIA
L ST
AT
EM
EN
TS
Three months ended
March 31
Year ended
December 31
2016 2015
Unaudited Audited
€’000
Balance at the beginning of the period / year 480,758 478,107
Issuance costs - (610)
Expenses for the period / year 3,322 13,261
Expenses paid - (10,000)
Carrying amount of liability at the end of the period / year 484,080 480,758
Non-current portion of bond series D 479,861 479,032
Accrued interest 4,219 1,726
Total bond series D 484,080 480,758
Three months
ended March 31, 2016
Year ended
December 31, 2015
Unaudited Audited
€’000
Balance at the beginning of the period / year 518,213 -
Proceeds from issuance of bond series E (550,000 notes at euro 100,000 par value) - 520,860
Issuance costs (88) (5,854)
Net proceeds during the period - 515,006
Expenses for the period 2,859 6,342
Expenses paid - (3,135)
Carrying amount of liability at the end of the period / year 520,984 518,213
Non-current portion of bond series E 517,232 516,517
Accrued interest 3,752 1,696
Total bond series E 520,984 518,213
C. STRAIGHT BOND SERIES D
On October 29, 2014, the Company successfully completed the placement of euro 500 million (nominal value), in aggre-gate principal amount of new fixed-rate secured bonds, due 2021 with a coupon of 2% p.a., payable semi-annually in ar-rears in a price of 95.564% of their principal amount. The of-fer was over-subscribed. Starting that day, series D bond is traded on the Irish stock exchange, on its regulated market.
D. STRAIGHT BOND SERIES E
On April 17, 2015, the Company successfully placed euro 400 million in aggregate principal amount of series E straight bonds. The new bond series was placed in an issue price of 96.76% of the principal amount and mature after 10 years. It bears a coupon of 1.5% p.a., payable semi-annually in ar-rears starting from October 2015.
On September 18, 2015, the Company successfully com-pleted with the tap up placement of additional euro 150 mil-lion (nominal value) of straight bond series E, for a consid-eration that reflected 89.21% of their principal amount. The total aggregated principal amount of the straight bond series E increased to euro 550 million (nominal value).
7. LOANS AND BORROWINGS, CONVERTIBLE AND STRAIGHT BONDS (CONTINUED)

73
Three months
ended March 31, 2016
From July 2, 2015 until
December 31, 2015
Unaudited Audited
€’000
Balance at the beginning of the period / business combination (July 2, 2015) 51,029 54,582
Financial expenses (income) for the period, net 178 (1,058)
Expenses paid - (2,495)
Carrying amount of liability at the end of the period 51,207 51,029
Non-current portion of straight bond 49,510 49,864
Accrued interest 1,697 1,165
Total bond 51,207 51,029
Three months
ended March 31, 2016
Year ended
December 31, 2015
Unaudited Audited
€’000
Balance at the beginning of the period / year - -
Proceeds from issuance of Convertible bond series F (4,500 notes at euro 100,000 par value) 450,000 -
Issuance costs (3,767) -
Net proceeds during the period 446,233 -
Amount classified as equity component (20,351)
Expenses for the period 398 -
Expenses paid - -
Carrying amount of liability at the end of the period / year 426,280 -
Non-current portion of Convertible bond series F 426,191 -
Accrued interest 89 -
Total convertible bond series F 426,280 -
E. STRAIGHT BOND CHF
In July 2015 the Group acquired a subsidiary (through busi-ness combination) which placed on July 8, 2013 a Swiss Franc (CHF) 55 million straight bond maturing in July 2018. The bond bears a coupon of 4.75% p.a., payable annually in arrears starting from July 2014. The bond is listed on the SIX Swiss Exchange.
F. CONVERTIBLE BOND SERIES F
On February 24, 2016 the Company successfully completed the placement of euro 450 million bonds series F, convert-ible into ordinary shares of the Company and bear a coupon of 0.25% p.a. payable semi-annually in arrears. The bonds were issued at 100% of their principal amount and will be redeemed at maturity of 6 years at par value. The initial con-version price was set at euro 26.9713.
74
CO
ND
EN
SED
NO
TE
S T
O T
HE
IN
TE
RIM
CO
NSO
LID
AT
ED
FIN
AN
CIA
L ST
AT
EM
EN
TS

75
G. OTHER INFORMATION
(1) SECURITY, NEGATIVE PLEDGE
a. For Gutburg Immobilien S.A. (hereafter – “Gutburg”), a wholly-owned subsidiary of the Company, and its subsid-iaries (hereafter – “Gutburg Group”), a negative pledge, default including cross default and change of control.
(2) COVENANTS (AS DEFINED IN THE TERMS AND CONDITIONS OF THE BONDS ISSUED)
The Company undertakes that it will not, and will procure that none of its subsidiaries will, up to (and including) the Final Discharge Date, incur any Indebtedness if, immediately after giving effect to the incurrence of such additional In-debtedness and the application of the net proceeds of such incurrence:
a. The sum of: (i) the Consolidated Indebtedness (less Cash and Cash Equivalents) as at the Last Reporting Date; and (ii) the Net Indebtedness (less Cash and Cash Equiv-alents) incurred since the Last Reporting Date would exceed 60% of the sum of (without duplication): (i) the Total Assets (less Cash and Cash Equivalents) as at the Last Reporting Date; (ii) the purchase price of any Real Estate Property acquired or contracted for acquisition by the Group since the Last Reporting Date; and (iii) the pro-ceeds of any Indebtedness incurred since the Last Re-porting Date (but only to the extent that such proceeds were not used to acquire Real Estate Property or to re-duce Indebtedness); and
b. The sum of: (i) the Consolidated Secured Indebtedness (excluding the Series B Bonds, the Series C Bonds and the Series D Bonds and less Cash and Cash Equivalents) as at the Last Reporting Date; and (ii) the Net Secured Indebtedness (excluding the Series B Bonds, the Series C Bonds and the Series D Bonds and less Cash and Cash Equivalents) incurred since the Last Reporting Date shall not exceed 45% of the sum of (without duplication): (i) the Total Assets (less Cash and Cash Equivalents) as at the Last Reporting Date; (ii) the purchase price of any Real Estate Property acquired or contracted for acquisi-tion by the Group since the Last Reporting Date; and (iii) the proceeds of any Indebtedness incurred since the Last Reporting Date (but only to the extent that such proceeds were not used to acquire Real Estate Property or to re-duce Indebtedness);
c. The Company undertakes that, on each Reporting Date, the Consolidated Coverage Ratio will be at least 2.0;
d. The Company undertakes that the sum of: (i) the Unen-cumbered Assets (less Cash and Cash Equivalents) as at the Last Reporting Date; and (ii) the Net Unencumbered Assets (less Cash and Cash Equivalents) newly recorded since the Last Reporting Date will at no time be less than 125% of the sum of: (i) the Unsecured Indebtedness (less Cash and Cash Equivalents) at the Last Reporting Date; and (ii) the Net Unsecured Indebtedness (less Cash and Cash Equivalents) incurred since the Last Reporting Date;
e. GCP ltd. will not open, maintain or hold any interest, in each case directly or indirectly, in any account whatsoever with any bank or financial institution except for the charged ac-counts, unless the Issuer or GCP ltd., respectively, grant a first-ranking security interest, satisfactory to the Trustee, over the respective account in favor of the Trustee, for the benefit of the Trustee and the Bondholders;
f. Will not permit any restriction on the ability of any subsid-iary of the Company to (i) make or pay dividends or any other distributions on its share capital to the Company or any of the Company’s investees or (ii) (a) pay any indebt-edness owed to the Company or any of the Company’s subsidiaries (b) make loans or advances to the Company or any of the Company’s subsidiaries or (c) transfer any of its properties or assets to the Company or any of the Company’s subsidiaries; and
g. The total indebtedness incurred by the group in respect of project financing debt shall not exceed the higher of euro 65 million or 25% of the portfolio value.
For Gutburg’s CHF bond:
h. All current and future financial liabilities of the Gutburg Group in total (excluding the bond) is not more than 75% of the total market value of the investment properties;
i. The total equity of the Gutburg Group which is adjusted for deferred taxes, subordinated instruments as well as interest rate swaps related to senior loans is more than 17.5% of all the assets;
j. The payment of dividends, repayment of capital or a simi-lar benefit to shareholders and/or participants (hereafter - “Distribution”) which in total is not more than 50% of the profit of the year which is adjusted for market val-ue changes of the investment properties, market value changes of interest rate swaps related to secured loans, deferred taxes expenses as well as expenses for refur-bishments and investments;
k. The adjusted equity ratio of the Gutburg Group must not fall below 22.5% because of a Distribution.
7. LOANS AND BORROWINGS, CONVERTIBLE AND STRAIGHT BONDS (CONTINUED)

76
CO
ND
EN
SED
NO
TE
S T
O T
HE
IN
TE
RIM
CO
NSO
LID
AT
ED
FIN
AN
CIA
L ST
AT
EM
EN
TS
8. CAPITAL AND RESERVES
ISSUANCE OF ORDINARY SHARES
a. On September 10, 2015 the Company received gross pro-ceeds of euro 151 million from a capital increase against a cash contribution. A total of 9.5 million new shares were placed at an issue price of euro 15.9 as part of a private placement to institutional investors.
b. On September 29, 2015 the Company received gross proceeds of euro 5 million from capital increase against a cash contribution. A total of 308.6 thousand new shares were placed at an issue price of euro 16.35.
c. On September 29, 2015 the Company received gross pro-ceeds of euro 7 million from a placement of a financial instrument – a 1.1 million call options convertible to the Company’s shares (in ratio of 1:1) for an additional price of euro 17.17 per option and exercisable in the period be-tween March 2016 to August 2021.
d. Since the initial placement of Convertible bond series C and until March 31, 2016, a total amount of 274.8 million bonds were converted into shares. According to the con-vertible bond’s terms, a total of 28.5 million shares were issued. (12.8 million shares were issued in 2016. See also Note 7B).
ISSUANCE OF HYBRID CAPITAL NOTES
a. On February 13, 2015, the Company successfully placed euro 150 million in aggregate principal amounts of Hy-brid capital notes. These notes were issued at a price of 96.3% of the principal amount. These Hybrid capital notes are of unlimited duration and can only be called back by the Company only on certain contractually fixed dates or occasions. Up until the first call date in February 2022, the Hybrid capital notes shall bear a coupon rate of 3.75% p.a. In case the Company does not exercise its call right at that point, the coupon rate applied until the next call date (February 2027) shall correspond to the five-year swap rate plus a margin of 388.8 basis points p.a. The mark-up will increase by 25 basis points (to 413.8 basis points p.a.) as of February 2027 and by another 75 basis points (to 488.8 basis points p.a.) as of February 2042.
b. On March 3, 2015, Company placed a tap issue of euro 250 million in aggregate principal amounts of the Hy-brid capital notes. These notes were issued at a price of 97.04% of the principal amount. The total aggregated principal amount of the notes at the end of the reporting period was euro 400 million.
c. On July 29 2015, the Company completed a successful tap up of its 3.75% Hybrid capital notes by euro 100 mil-lion. The new notes have the same terms and conditions as the existing ones and increased the nominal amount of the outstanding 3.75% Hybrid capital notes to euro mil-lion 500.
d. These Hybrid capital notes are presented in the consol-idated statement of financial position as equity reserve attributable to its holders, which is part of the total equi-ty of the Group. The coupon is deferrable until payment resolution of a dividend to the shareholders. The deferred amounts shall not bear interest.
77
RESOLUTION OF DIVIDEND DISTRIBUTION
On June 24 2015, the shareholders’ annual meeting resolved upon the distribution of cash dividend in the amount of euro 0.2 per share (ex – date and payment date were on June 25, 2015 and on July 3, 2015, respectively).
Share capital composition:
Three months ended March 31, 2016
Year endedDecember 31, 2015
Unaudited Audited
Number of shares
In thousands of euro
Number of shares
In thousands of euro
Authorized
Ordinary shares of euro 0.10 each 200,000,000 20,000 200,000,000 20,000
Issued and fully paid
Balance at the beginning of the period/year 140,970,655 14,097 118,541,449 11,854
Exercise of Convertible bond series C into shares 12,818,228 1,282 12,620,565 1,262
Issuance of new ordinary shares - - 9,808,641 981
Balance at the end of the period/year 153,788,883 15,379 140,970,655 14,097
78
CO
ND
EN
SED
NO
TE
S T
O T
HE
IN
TE
RIM
CO
NSO
LID
AT
ED
FIN
AN
CIA
L ST
AT
EM
EN
TS
9. RELATED PARTY TRANSACTIONS
10. FINANCIAL INSTRUMENTS
(i) Loans from associated undertakings
March 31 December 31
2016 2015
Unaudited Audited
€’000
Other associate undertakings - 81
(ii) Interest on loans from related parties
For the Three months endedMarch 31,
2016 2015
€’000
Interest expenses - 24
The transactions and balances with related parties are as follows:
FAIR VALUE HIERARCHY
The table below analyses financial instruments carried at fair value, by the levels in the fair value hierarchy. The different levels have been defined as follows:
Level 1: quoted prices (unadjusted) in active markets for identical assets or liabilities.
Level 2: inputs other than quoted prices included within Level 1 that are observable for the asset or liability, either directly (i.e. as prices) or indirectly (i.e. derived from prices).
Level 3: inputs for the asset or liability that are not based on observable market data (unobservable inputs).
Related party transactions were made on terms equivalent to those that prevail in arm’s length transactions, are made only if such terms can be substantiated.
Level 1 Level 2 Level 3 Total
€’000
March 31, 2016 (Unaudited)
Traded securities at fair value through profit or loss 145,879 - - 145,879
Total assets 145,879 - - 145,879
Derivative financial instruments (a) - 9,565 - 9,565
Total liabilities - 9,565 - 9,565
December 31, 2015 (Audited)
Traded securities at fair value through profit or loss 152,924 - - 152,924
Total assets 152,924 - - 152,924
Derivative financial instruments (a) - 6,995 - 6,995
Total liabilities - 6,995 - 6,995
(a) The fair value of financial instruments that are not traded in an active market is determined by using valuation tech-niques. The Group uses its judgment to select a variety of methods and make assumptions that are mainly based on market conditions existing at each reporting date. All of the Group’s derivatives financial instruments are linked to the bank loans maturity.
The calculation of the fair value of hedging instruments is based on discounted cash flows of future anticipated inter-est payments in place compared with the discounted cash flows of anticipated interest payments at market interest rates based on the hedging instrument agreement at the re-porting date.

79
80
CO
ND
EN
SED
NO
TE
S T
O T
HE
IN
TE
RIM
CO
NSO
LID
AT
ED
FIN
AN
CIA
L ST
AT
EM
EN
TS
11. COMMITMENTS 12. CONTINGENT ASSETS AND LIABILITIES
13. EVENTS AFTER THE REPORTING PERIOD
The Group had no significant commitments as at March 31, 2016.
The Group had no significant contingent assets and liabilities as at March 31, 2016.
There were no material events occurred after the reporting period.

81

GRAND CITY PROPERTIES S.A.
24, Avenue Victor HugoL-1750 Luxembourg
www.grandcityproperties.com