Endeavour Energy 2013/14 Annual Report
106
SAFE, SUSTAINABLE AND CUSTOMER FOCUSED 2013–14 ANNUAL REPORT
Transcript of Endeavour Energy 2013/14 Annual Report

SAFE, SUSTAINABLE AND CUSTOMER FOCUSED
2013–14 ANNUAL REPORT

About this report
This report provides a candid account of Endeavour Energy’s performance during the financial year 2013–14. It notes successes, areas for improvement and our future direction and challenges.
Endeavour Energy has a proud tradition of dedicated service to our communities. The theme for this year’s report – safe, sustainable and customer focused – reflects our commitment to serve our communities by efficiently distributing electricity to our customers in a way that is safe, reliable and sustainable.
The contents of this report are guided by the requirements of the Annual Report Statutory Bodies Act 1984 and the State Owned Corporations Act 1989.
Statutory accounts and financial information are verified by the NSW Auditor General.
This annual report can be found on our website at www.endeavourenergy.com.au. It was produced at a cost of $12,034 (GST inclusive).
© Endeavour Energy 2014
This work is copyright. Material contained in this document may be reproduced for personal, in-house or non-commercial use without formal permission or charge provided there is due acknowledgement of Endeavour Energy as the source.
Requests and enquiries concerning reproduction and rights for a purpose other than personal, in-house or non-commercial use should be addressed to the Manager Corporate Affairs, Endeavour Energy, PO Box 811, Seven Hills, NSW, 1730.
ISSN 1834-0733
ABN 59 253 130 878
Project management Corporate Affairs, Endeavour Energy
Design Impress Design
Editing BWD

1Endeavour Energy Annual Performance Report 2013–14
Letter to Shareholding Ministers
31 October 2014
The Hon. Andrew Constance, MP Treasurer Level 36, Governor Macquarie Tower 1 Farrer Place SYDNEY NSW 2000
The Hon. Dominic Perrottet, MP Minister for Finance and Services Level 36, Governor Macquarie Tower 1 Farrer Place SYDNEY NSW 2000
Dear Ministers
REPORT ON PERFORMANCE FOR THE YEAR ENDED 30 JUNE 2014
We are pleased to submit Endeavour Energy’s annual report detailing performance, operations and financial results for the year ended 30 June 2014.
The report has been prepared in accordance with section 24A of the State Owned Corporations Act 1989 and the Annual Reports (Statutory Bodies) Act 1984 and is submitted for tabling in Parliament.
Copies are being sent to the Premier of New South Wales (NSW), the Auditor-General, the Minister for Resources and Energy, and other key stakeholders.
The report is available on our website: www.endeavourenergy.com.au.
Sincerely
Roger Massy-Greene Vince Graham Chairman Chief Executive Officer
Our organisation 2
Year at a glance 3
Year in review 4
Our performance 8
Improve our safety performance 8
Improve customer value 9
Deliver the network plan 11
Achieve the financial plan 12
Manage business risk 13
Deliver performance through people 14
Leverage technology 15
Network 16
People 26
Community 28
Environment 30
Governance 32
Management discussion and analysis 36
Financial statements 38
Appendices 84
Index 99
CONTENTS

2
Endeavour Energy is a NSW Government owned electricity distributor. We are a ‘poles and wires’ business, responsible for the safe and reliable supply of electricity to 2.2 million people in households and businesses across Sydney’s Greater West, the Blue Mountains, Southern Highlands, the Illawarra and the South Coast.With assets valued at $5.61 billion, our network spans 24,500 square kilometres and is made up of more than 413,000 power poles, 178 major substations and 30,000 distribution substations connected by 35,000 kilometres (about the distance from Sydney to London and back) of underground and overhead cables.
We power some of the fastest growing regional economies in NSW, including Sydney’s North West and South West growth centres – areas earmarked by the NSW Government for future housing development.
Between them, these centres cover 27,000 hectares and will become home to more than 500,000 people in more than 180,000 dwellings an area of similar size to either Wollongong and Canberra.
We are preparing to meet this extra growth and maintain existing services by investing responsibly and efficiently in our network over the next five years.
Endeavour Energy is incorporated under the Energy Services Act 1995 and operates within the terms of the Electricity Supply Act 1995 on behalf of our shareholder, the NSW Government.
As a result of the NSW Government reforms to state-owned electricity networks since 1 July 2012, the three NSW Government owned electricity distribution networks Ausgrid, Endeavour Energy and Essential Energy continue to operate as separate legal entities but are managed by a joint Board of Directors and common Chief Executive Officer (CEO).
1OUR ORGANISATION
Our purposeTo be of service to our communities by efficiently distributing electricity to our customers in a way that is safe, reliable and sustainable.
Our valuesOur values and their supporting behaviours define the standard of ethical behaviour we expect of each other and our communities expect from us. They form the basis for everything we do.
Safety excellence
• put safety as your number one priority
• do not participate in unsafe acts, and challenge unsafe behaviours
• think before you act • lead by example • take responsibility for the health
and safety of yourself and others.
Respect for people
• treat all people with respect, dignity, fairness and equity
• demonstrate co-operation, trust and support in the workplace
• practise open, two-way communication.
Customer and community focus
• deliver value and reliable service to our customers and communities
• use resources responsibly and efficiently
• be environmentally and socially responsible.
Continuous improvement
• look for safer and better ways to do your job
• improve our financial performance • support innovation to add value
to our business.
Act with integrity
• act honestly and ethically in everything you do
• be accountable and own your actions
• follow the rules and speak up.
1 Refers to Endeavour Energy’s Regulatory Asset Base

3
OUR ORGANISATION 1
Endeavour Energy Annual Performance Report 2013–14
Year at a glance
ITEMS 2012–13 2013–14 % CHANGE
OUR SHAREHOLDER
EBITDA $m 802.6 770.1 (4.0)
Operating profit after tax $m 298.9 301.0 0.7
Returns to NSW Government $m 337.7 255.1 (24.4)
Dividend $m 209.5 178.1 (15.0)
Income tax equivalents $m 128.2 77.0 (39.9)
Net assets $m 1,586.2 1,720.3 8.5
Return on assets % 10.1 8.7 (14.0)
Return on equity % 19.7 18.2 (7.5)
OUR OPERATIONS
Reliability (unplanned interruptions to supply) Min/lost/cust 88.0 83.0a 5.7
Capital expenditureb $m 577.7 531.5 (8.0)
Output (GWh) GWh 16,001 15,637 (2.3)
Sales revenuec $m 1,299.2 1,274.4 (1.9)
OUR CUSTOMERS
Total network customer connections 907,996 922,205 1.6
Customer satisfaction indicator % 75 78 4.0
ENVIRONMENT
Transformer oil recycledd litres 342,092 460,585 34.6
Greenhouse gas emissions – direct emissionse t CO2e 633,106 595,183 (6.0)
Reportable environmental incidents No. 2 0 100.0
OUR PEOPLE
Total employeesf 2,635 2,533 (3.9)
Lost time injury frequency rate (LTIFR)g 2.6 4.8 (84.6)
To ensure consistency on an annual basis, prior year statistics may have changed in line with amendments to comparative financial statement disclosures and amended definitions.
a. In 2013–14, the calculation of SAIDI changed to the Australian Energy Regulator’s methodology. Prior to this, SAIDI was calculated in 2012–13 on the methodology provided in the licence conditions for NSW electricity distributors.
b. Capital expenditure referenced throughout this report is exclusive of capitalised interest.
c. Sales revenue includes total network use of system income only.
d. The increase in recycled oil is the result of an increase in transformer refurbishments, replacements and transformers being decommissioned in 2013–14.
e. We have reported our emissions using the National Greenhouse and Energy Reporting Scheme Determination where available, or if unavailable, using methods consistent with the emission estimates published by the Department of Climate Change and Energy Efficiency in the National Greenhouse Accounts, or relevant environmental key performance indicators developed by the Energy Network Association of Australia. Includes all scope 1 and 2 emissions minus offsets purchased.
f. Full time equivalent employees as at 30 June 2014.
g. The LTIFR indicates how frequently lost time injuries have occurred per million hours worked. It is calculated by taking the number of LTIs reported in the previous 12 months (multiplied by 1,000,000) and then dividing by the average number of employees for the previous 12 months (multiplied by 2,000 hours worked per FTE).

4
YEAR IN REVIEW
Safety mattersEmployee, contractor and public safety remains our top priority. We focused our efforts on instilling a safety culture where everyone understands their safety responsibilities, and where no employee knowingly participates in an unsafe act.
During 2013–14 Endeavour Energy met two of its three key safety improvement targets. The number of recordable injuries and serious electrical incidents were better than target however the number of lost time injuries exceeded our target.
We were saddened by the serious injuries suffered by an employee in a vehicle accident in July 2013 and renewed our efforts to eliminate risks that may lead to life-changing injuries or death.
In the year ahead, a key element of our safety program will be to develop, through employee consultation, a clear set of ‘rules we live by’ to help eliminate the risk of fatalities and serious injuries. In developing and implementing these rules, we aim to systematically reduce all injuries.
Two years of reformIn July 2012, the NSW Government initiated a Network Reform Program in response to community concerns about electricity pricing and the efficiency of its network distribution businesses. The combined savings of these reforms are expected to deliver $5.4 billion across the three NSW network businesses over five years through to 2016.
In its second year of this reform, Endeavour Energy has continued to focus on increasing efficiencies, reducing duplication and decreasing expenditure to deliver a more affordable service to our customers.
Electricity affordabilityCustomers sit at the centre of Endeavour Energy’s business. We focused on improving electricity affordability, implementing new consumer protections and improving
our engagement with customers, stakeholders and the community.
Electricity prices in NSW have risen in recent years due to the need to meet the former NSW Government’s reliability standards, replace ageing assets and build electricity infrastructure to meet growth, including the State’s two growth centres.
Since 2009 we have worked to improve our productivity and efficiency to end rising network charges and build customer value. This efficiency program has generated $164 million in savings over the past five years and progressively lowered network price increases for our customers since 2011.
On 1 July 2013, we were pleased to deliver on our pricing promise to contain increases in network charges to no more than CPI, marking the first time in a decade that households enjoyed two successive annual reductions in network charges in real terms.
We submitted a prudent proposal to the Australian Energy Regulator (AER) in May 2014, detailing our capital and operating plans and the funding needed to deliver them for the next five years.
Our proposal includes a real reduction of 43% in our capital program and a 3% real decrease in operating costs. Combined with NSW Government network reforms and our efficiency programs, we are confident this will on average see an end to double digit network price increases for all customers including families and small businesses.
Engaging with customers and stakeholdersWe undertook our most comprehensive engagement program to date to encourage customers to better understand our business and have a significant say in how we operate. In response, customers told us that they wanted price increases to end, the current level of network reliability to be maintained and for safety to be our continuing priority.
We used this feedback to better align our operations with the long-term interests of our customers. We have committed to keeping our network safe, reliable and affordable by containing annual electricity price increases at or below CPI for the next five years.
New consumer protectionsThe year also marked the start of the National Energy Customer Framework (NECF) in NSW. This is designed to bolster consumer protections for residential and small business customers.
The AER monitors and enforces the protections and obligations for energy customers under NECF. Failure to comply results in a NECF compliance breach, the most serious classified as a ‘type 1’ breach which can be subject to penalties ranging from public reporting, to enforced process change, court proceedings and fines.
Disappointingly, Endeavour Energy recorded 40 type 1 breaches in 2013–14. Of these, 17 incidents involved customers known to require electricity for medical equipment who were not given four days’ notice of a planned power outage and so unexpectedly lost electricity supply. Fortunately, no customer suffered ill-effects during the time they were without power. Endeavour Energy is taking steps to strengthen its systems and processes to protect these customers.
Investing for a safe, reliable, sustainable networkTo meet the needs of the 2.2 million people who rely on our network every day, we invested $902 million in our network during the year, delivering a capital program of around $531 million and a $371 million operating program. This included working on 64 major building construction projects and replacing over 43 kilometres of steel mains and over 17,000 service mains.
We delivered this investment using a peak resourcing strategy which blends the resources of our employees with contractors to deliver projects and
Endeavour Energy achieved another year of strong results in 2013–14. We delivered our pricing promise to customers to contain electricity price increases to CPI or below, we improved our safety culture and maintained the reliability of our network for the customers we serve.

5
OUR ORGANISATION 1
Endeavour Energy Annual Performance Report 2013–14
programs. We plan to maintain the productivity benefits this blended delivery model created while efficiently delivering a smaller capital investment program over the next five years.
Financial performanceOur work to improve fiscal discipline helped Endeavour Energy meet its financial targets for the year, contributing to our continued sustainability and supporting plans to contain future electricity price rises for customers.
Profit after tax was $301.0 million and earnings before interest, tax, depreciation and amortisation were $770.1 million. Revenue was down compared to budget due to systemic factors which have impacted the business over past years including declining demand, reduced consumption due to milder weather conditions and the uptake of solar by a broad number of customers.
In the year ahead, we’re committed to addressing these long-term changes by safely and sustainably improving the productivity of our business and applying greater strategic, operational and financial discipline.
Delivering a more resilient networkEndeavour Energy’s network reliability performance improved during the year to an average 83 minutes of unplanned interruptions per customer compared to our target of 93 minutes.
This pleasing result was assisted by mild weather conditions from January to June 2014.
However, our emergency response capabilities were tested in October 2013 when high temperatures and winds led to a number of serious bushfires in the Blue Mountains and Southern Highlands. Our crews responded swiftly and safely, restoring supplies to affected customers quicker than they expected.
Every employee at Endeavour Energy understands the devastating impact these fires had on the community, particularly the Springwood/Winmalee bushfire on 17 October 2013. Our thoughts continue to be with the residents who lost their homes and our focus remains on maintaining the safety and reliability of our network.
Following the fires, on 27 May 2014 Endeavour Energy was served with a statement of claim lodged in the NSW Supreme Court alleging breach of statutory and general duties owed to those persons who had suffered loss or damage arising from the Springwood/Winmalee bushfire on 17 October 2013.
Separate to this class action proceeding, NSW Police have been investigating the cause of this bushfire on behalf of the NSW Coroner.
While it is too early for Endeavour Energy to speculate on the outcome of any claims, we continue to provide full support and assistance in relation to these matters.
Challenges aheadEndeavour Energy thanks all employees who have worked hard to achieve the outcomes delivered in 2013–14.
Our operating environment is constantly changing and we expect three issues will drive further changes for our business in the coming year:
• the AER has reduced our revenue by $58 million for the 2014–15 financial year. Our capital program will reduce by 43% (in real terms) over the next five years compared to $3 billion approved by the AER for the 2009–14 period
• electricity consumption is expected to continue to decline by around 2% per annum because of high electricity prices, the high Australian dollar and the increasing use of solar panels by our customers
• the NSW Government has announced its intention to seek a mandate at the March 2015 state election for a 99 year lease of 49% of the ‘poles and wires’ network in NSW.
These challenges mean we need to become more efficient and more productive than we are today. Our people have the capability to safely improve the productivity and efficiency of our business to meet the needs of our customers and the community, and to help sustain secure jobs.
KEY RESULT AREAS MEASURES TARGET ACTUALSAFETYSafe, capable, motivated employees
Lost time injury frequency rate (LTIFR) – pathway to zero 2.2 4.8Total recordable injury frequency rate (TRIFR) 25 22.9Reportable incidents – controllable SENI 25 18
CUSTOMER / COMMUNITYValued by our community Customer satisfaction 75% 78%
Reportable incidents – NECF type 1 breaches – 40Protect public safety & environment
Reportable incidents – controllable environmental 1 0
Reliable & sustainable network Network reliability – unplanned SAIDI 93 mins 83 minsFINANCIALFinancial sustainability NPAT – Net Profit After Tax inc. Capital Contributions $267.1m $301.0mEfficient operations OPEX $383.9m $370.9m
Overtime expenditure $23.6m $20.0mBUSINESS PROCESSESNetwork Plan delivery Asset management plan % complete 95% 95%Governance, risk & compliance management
Audit recommendations outstanding ≥ 90 days 0 0Risk treatment plans outstanding ≥ 90 days 0 0
CULTURESafe, capable, motivated employees
Absenteeism (excluding family/carer’s leave) 2.6% 3.2%No. of employees with gross to base pay ratio at or above 1.5 18 6

6
1
Objective • Implement our Safety Strategic Plan to improve safety behaviours, culture and performance with a focus on fatal risk management, an effective Safety Management System and safety training and development
• Deliver our Customer Value Improvement Plan to improve our efficiency and contain average distribution network prices to CPI or below
• Apply best practice asset management principles to create value for our customers
• Operate as efficiently as any comparable business with prudent asset investment and efficient operations
• Identify and control risks that could affect our people, the communities we serve or the environment
• Develop the leadership performance, workplace culture and organisational capability required to execute the Network Reform Program
• Leverage technology and enable the transition to more efficient business models
Target • LTIFR of ≤ 2.2 on a pathway to zero
• TRIFR ≤ 25
• Controllable SENI ≤ 25
• Customer satisfaction 75%
• Monitor reportable incidents – National Energy Customer Framework (NECF) type 1 breaches*
• Network reliability – average unplanned SAIDI ≤ 93 mins
• Asset Management Plan 95% complete
• Net profit after tax $267.1m
• OPEX budget $383.9m
• Overtime expenditure $23.6m
• Audit recommendations outstanding ≥ 90 days 0
• Risk treatment plans outstanding ≥ 90 days 0
• Absenteeism (excluding family/carer’s leave) 2.5%
• Number of employees with gross-to-base ratio at or above 1.5 = 18
• Enable transition to a more efficient business model, and facilitate delivery of the new business model’s objectives
Result • While the TRIFR and controllable SENI were better than target, LTIFR exceeded our target at 4.8
• Contained network price increases below CPI
• Customer satisfaction was better than target at 78%
• There were 40 NECF type 1 breaches
• Network reliability – unplanned SAIDI 83 mins
• Delivered a capital program of around $531m including 64 major construction projects
• Asset Management Plan 95% complete
• Net profit after tax above target at $301.0m
• OPEX was better than target at $370.9m
• Overtime expenditure was better than target at $20.0m
• Audit recommendations outstanding ≥ 90 days 0
• Risk treatment plans outstanding ≥ 90 days 0
• Absenteeism (excluding family/carer’s leave) above target at 3.2%
• Number of employees with gross-to-base ratio at or above 1.5 was better than target at 6
• Implemented mobile technology to enhance the efficiency of our network maintenance
• Pilots conducted on network automation, capacity control and monitoring to provide a more reliable, efficient and sustainable network
Focus for 2014–15 • Implement our safety strategic plan with a focus on fatal risk management, safety leadership competency training and development of the “Network Fatal Risks: Rules we live by”
• Improve our customers’ experience by building a customer centred culture by focusing on improving customer service at five key customer touch points – Life Support customers, ASPs, retailers, Contact Centres and planned outage notification
• Align our plan to the AER’s network determination
• Develop our Sustainability Program by identifying benefits to customers through: efficient capital investment; improved productivity; increased blended delivery; efficient network support costs; and a competitive Enterprise Agreement
• Priority actions have been completed for this objective
• Deliver leadership training to improve leadership effectiveness, improve employee engagement and embed a Fair and Just culture
• Priority actions have been completed for this objective
IMPROVE CUSTOMER
VALUE
2DELIVER
THE NETWORK PLAN
3
2013–14 Corporate PlanThe strategic objectives and related key actions outlined in our 2013–14 Corporate Plan are designed to promote the long-term interests of our customers, employees and shareholders.
Over the past year, we kept a strong focus on improving our safety performance, maintaining the reliability and sustainability of our network and containing electricity cost increases for our customers.
On 1 July 2013 and 1 July 2014 our share of customers’ electricity bills did not increase by more than CPI, and will not for the next five years. Overall, our safety and network reliability programs are also delivering results, although this year saw lost time injuries increase.
IMPROVE OUR SAFETY
PERFORMANCE
1
* Target not set as this was the first year of operation under the framework.

7
OUR ORGANISATION 1
Endeavour Energy Annual Performance Report 2013–14
Objective • Implement our Safety Strategic Plan to improve safety behaviours, culture and performance with a focus on fatal risk management, an effective Safety Management System and safety training and development
• Deliver our Customer Value Improvement Plan to improve our efficiency and contain average distribution network prices to CPI or below
• Apply best practice asset management principles to create value for our customers
• Operate as efficiently as any comparable business with prudent asset investment and efficient operations
• Identify and control risks that could affect our people, the communities we serve or the environment
• Develop the leadership performance, workplace culture and organisational capability required to execute the Network Reform Program
• Leverage technology and enable the transition to more efficient business models
Target • LTIFR of ≤ 2.2 on a pathway to zero
• TRIFR ≤ 25
• Controllable SENI ≤ 25
• Customer satisfaction 75%
• Monitor reportable incidents – National Energy Customer Framework (NECF) type 1 breaches*
• Network reliability – average unplanned SAIDI ≤ 93 mins
• Asset Management Plan 95% complete
• Net profit after tax $267.1m
• OPEX budget $383.9m
• Overtime expenditure $23.6m
• Audit recommendations outstanding ≥ 90 days 0
• Risk treatment plans outstanding ≥ 90 days 0
• Absenteeism (excluding family/carer’s leave) 2.5%
• Number of employees with gross-to-base ratio at or above 1.5 = 18
• Enable transition to a more efficient business model, and facilitate delivery of the new business model’s objectives
Result • While the TRIFR and controllable SENI were better than target, LTIFR exceeded our target at 4.8
• Contained network price increases below CPI
• Customer satisfaction was better than target at 78%
• There were 40 NECF type 1 breaches
• Network reliability – unplanned SAIDI 83 mins
• Delivered a capital program of around $531m including 64 major construction projects
• Asset Management Plan 95% complete
• Net profit after tax above target at $301.0m
• OPEX was better than target at $370.9m
• Overtime expenditure was better than target at $20.0m
• Audit recommendations outstanding ≥ 90 days 0
• Risk treatment plans outstanding ≥ 90 days 0
• Absenteeism (excluding family/carer’s leave) above target at 3.2%
• Number of employees with gross-to-base ratio at or above 1.5 was better than target at 6
• Implemented mobile technology to enhance the efficiency of our network maintenance
• Pilots conducted on network automation, capacity control and monitoring to provide a more reliable, efficient and sustainable network
Focus for 2014–15 • Implement our safety strategic plan with a focus on fatal risk management, safety leadership competency training and development of the “Network Fatal Risks: Rules we live by”
• Improve our customers’ experience by building a customer centred culture by focusing on improving customer service at five key customer touch points – Life Support customers, ASPs, retailers, Contact Centres and planned outage notification
• Align our plan to the AER’s network determination
• Develop our Sustainability Program by identifying benefits to customers through: efficient capital investment; improved productivity; increased blended delivery; efficient network support costs; and a competitive Enterprise Agreement
• Priority actions have been completed for this objective
• Deliver leadership training to improve leadership effectiveness, improve employee engagement and embed a Fair and Just culture
• Priority actions have been completed for this objective
MANAGE BUSINESS
RISK
5DELIVER
PERFORMANCE THROUGH
PEOPLE
6LEVERAGE
TECHNOLOGY
7ACHIEVE
THE FINANCIAL PLAN
4

8
2OUR PERFORMANCE
1. Improve our safety performanceEmployee, contractor and public safety continues to be our number one priority. We seek to implement a culture in which everybody bears responsibility for safety and no employee knowingly participates in an unsafe act.
One of the ways we measured our success is by reducing our Lost Time Injury Frequency Rate (LTIFR) to below 2.2 by June 2014, on a pathway to zero.
Regrettably, we did not achieve our target in 2013–14 with a LTIFR result of 4.8, (see graph on page 9). This represents an increase in lost time injuries from 15 in 2012–13 to 25 in 2013–14. Of these, four of the lost time injuries were categorised as being fatal risk events.
An analysis of data has given us a better understanding of the steps we need to take in continuing to improve our overall injury management processes. A key recommendation from this analysis was to focus on earlier intervention strategies in 2014–15.
For 2014–15, our focus is on implementing our Health, Safety and Environment Plan to develop a shared safety culture, reach our goal of zero harm and reduce our LTIFR to 2.0 by June 2015, on a pathway to zero.
Mitigating network fatal risksIdentification, assessment and mitigation of network fatal risks have been a focus of our safety efforts throughout the year. Our objective is to limit high-consequence events that may result in either loss of life or life-changing injuries, while systematically reducing high frequency, low consequence injuries.
This has resulted in the development of a comprehensive framework of fatal risk controls across all NSW distribution networks, including Endeavour Energy’s, that provide
barriers and defences to prevent and mitigate potentially fatal events.
Working closely with staff, we have also started development of the ‘Rules We Live By’ to help prevent fatalities and serious injuries. Staff commit to these safe working behaviours and processes as they carry out their day-to-day work. We will continue to develop and implement them in 2014–15.
Lifeguard programOur workforce must be fit for work and free from the effects of drugs and alcohol as they perform their duties. It is every worker’s right to feel safe and not be at risk from the potential effects of drugs or alcohol in the workplace. We take this responsibility seriously and remain committed to doing our utmost to provide as safe a workplace as possible.
Our Lifeguard program is therefore designed to minimise the risk of a worker affected by alcohol, drugs or fatigue causing injury or death. An important component of this is random drug and alcohol testing. This commenced in 2013–14 with an independent third-party vendor conducting onsite testing of breath alcohol concentration levels and oral swab testing for other drugs.
Lifeguard is supported by a comprehensive education and training program, a Medical Review Officer and counselling and support services for staff if they need it. In 2013–14, over 1,000 tests were completed across all sites, and included management, office and field-based staff.
WorkCover AuditA requirement of Endeavour Energy’s self-insurance licence for workers compensation is to participate in an audit by WorkCover every three years.
Work Cover undertook the most recent audit in February 2014. It included a desktop audit of documentation and
processes as well as a detailed review of the Kings Park and Windsor Field Service Centres and two work sites.
WorkCover rated our performance as 100% for our Safety Management System and 89.5% for our systems of safety measurement, evaluation and review. Based on this result, it renewed our self-insurers licence for workers compensation and confirmed an ongoing triennial audit cycle.
Audit Plan and Incident InvestigationWe continuously improved and refreshed our health, safety and environment management systems, and our risk-based approach to audit and assurance helped us improve the way we administered the overall program.
We also continued to use the Incident Cause and Analysis Methodology (ICAM) to investigate incidents and near misses. In 2013–14 we undertook 60 ICAM investigations that have helped us to enhance our safety management system in order to drive continuous improvement in our safety performance.
Public SafetyEndeavour Energy is committed to keeping the public safe near our network and has an ongoing public safety awareness program that continues to inform the community about electrical risks and hazards and how to work safely around the network.
Safe driving campaign We launched our ‘Stay Switched ON. Drive Safely’ campaign in 2014 to educate and support staff in safe driving behaviour. We rolled out a ‘safe driving challenge’ in which employees committed to change the way they drive. It was supported by awareness initiatives disseminated through internal communications channels and targeted safety observations.

9
OUR PERFORMANCE 2
Endeavour Energy Annual Performance Report 2013–14
2. Improve customer valueOur customers were the centrepiece of our plans for 2013–14 with the aim of delivering network prices that represent the best “value for money” for our customers.
Two years ago, Endeavour Energy promised our customers we would do all that we could to keep our network prices at or below the rate of inflation without compromising safety or the reliability and sustainability of our network.
Due to our collective efforts to contain costs and improve productivity, the average distribution network price increase from 1 July 2013 fell below CPI for the first time in a decade. Central to delivering this outcome were our two efficiency programs, Projects Challenge and Compete, discussed in greater detail on page 14.
Customer engagement A key aspect of improving customer value is to reassess our relationship and engagement with our customers, electricity retailers and other important stakeholders. Effective engagement is a key driver for Endeavour Energy if we are to provide an electricity network that meets the long term interest of those who use our network and if we are to understand their preferences in terms of price, reliability, technology and energy services.
To this end, we developed and delivered our most comprehensive engagement program to date to encourage customers, welfare groups, electricity retailers, local councils and other stakeholders to better understand our business, have a significant say in the way we operate and factor their requirements and expectations into our investment choices and the way we recover costs. It also provided our customers and stakeholders with a genuine opportunity to provide meaningful input into our decisions by explaining the trade-offs involved and cost considerations.
In delivering our engagement plan in 2013–14 we:
• completed quantitative and qualitative research involving more than 900 residential and 300 small to medium business customers to gauge satisfaction levels, perceptions and preferences about electricity prices and the services we provide
• held interactive workshops in Penrith and Wollongong attended by residential and small business consumers to get to know our customers and help them understand our pricing plans and proposals
• participated in a joint industry workshop with peak consumer representatives to identify priority issues and begin a discussion on the need to reform electricity tariffs
• maintained an ongoing open conversation with customers through the joint industry Your Power, Your Say Facebook campaign on how they would like us to manage their power supply
• met with all local councils in our franchise (where we are the main streetlight provider) to obtain their feedback on our service and for their input into our public lighting plans
• conducted a joint industry forum for electricity retailers to give them the opportunity to understand, discuss and provide feedback on our plans outlined in our AER regulatory proposals
• presented our plans as part of the AER’s NSW Public Forum. In addition to being open to members of the public, the Forum was attended by the AER’s Consumer Challenge Panel who put forward its perspectives on the plans of the three NSW network operators including Endeavour Energy.
We know from these discussions that:
• price increases of the past need to end
• most customers are happy with reliability and do not want to pay for extra improvements
• that customers expect safety to be our continuing priority.
We were also able to identify a range of issues where we cannot make changes as they would add substantial costs which would ultimately be borne by customers, such as:
• underground existing areas of overhead network without sufficient justification and a source of payment from those who derive the benefit
• adopting smart meter technology as our default meter unless it is mandated by law.
Our aim is to integrate customers and stakeholders engagement into our business operations so we continuously reflect their preferences and deliver greater value for money.
TRIFR
2009
–10
2010
–11
2011
–12
2012
–13
2013
–14
Go
od
LTIFR
3.13.6
4.5
28.323.723.4
2.6
26.2
4.8
22.9
PERFORMANCE INDICATORLost time injury frequency rate and total recordable injuries
10
2
Reliability improvementWe monitor the reliability of our network with the System Average Interruption Duration Index (SAIDI). This measures the number of unplanned minutes customers, on average, are without electricity each year, excluding the impact of significant storms.
Our SAIDI improved from 126 minutes in 2003–04 to 83 minutes by the end of June 2014, which was favourable against the year’s reliability target of 93 minutes. This means that Endeavour Energy customers benefit from being supplied by one of the most reliable electricity networks in Australia.
Events that significantly impacted our reliability result included 46 interruptions to the sub-transmission network, 2,092 interruptions to the distribution network and 1,894 interruptions to the low-voltage network, mainly due to adverse weather, defective equipment, vegetation contact and interference on powerlines. Three major events, including two windstorms and bushfires, caused significant disruption to supply to customers in addition to the incidents above.
2009–10 2013–142012–132011–122010–110
20
40
60
80
100
79
72
82
8883
16.5
9 10
6
21.9
13
27.8
16
11.3
5
Annual SAIDICumulative high SAIDINumber of days high SAIDI
PERFORMANCE INDICATORSupply reliability – normalised unplanned SAIDI (minutes)
In 2013–14, the calculation of SAIDI changed to the Australian Energy Regulator's methodology. Prior to this, SAIDI was calculated in 2012–13 on the methodology provided in the licence conditions for NSW electricity distributors.
2. Improve customer value (continued)

11
OUR PERFORMANCE 2
Endeavour Energy Annual Performance Report 2013–14
3. Deliver the network planFocused asset management is key to running a safe, reliable and sustainable network while containing our average annual network price increases to CPI.
Endeavour Energy is committed to managing network assets in a manner that meets customers’ expectations, fulfils our business needs and satisfies our obligations to stakeholders, the regulator and the community.
To ensure customers get a fair deal and a safe and reliable network, capital investment and maintenance programs are independently regulated by the Australian Energy Regulator (AER) every five years. This year we have completed the final year of the AER-approved five-year program having invested $2.7 billion in our network and $1.5 billion in our operations by 30 June 2014.
The investment has been used to service the growth in customer demand, and renew ageing network assets so we can deliver a reliable and secure supply of electricity to both new and existing customers. It has also helped us meet the licence conditions set by the NSW Government.
Implicit in our network strategy is the need to ensure expenditure programs provide value for money for our customers.
How we performedIn 2013–14, we delivered $531.5 million of the total forecast capital budget of $569.5 million. Of this, $484.6 million was network system capital investment, compared with a budget of $509.3 million. For this investment we delivered 93% of required milestones in the network capital program.
During 2013–14 we worked on 64 major construction projects, replaced over 43 kilometres of steel mains and replaced over 17,000 service mains. We delivered this network investment over the last three years through a peak resourcing strategy designed to drive efficiencies by using a blend of internal and external resources.
With the peak of capital investment now behind us, our focus will be on maintaining the substantial efficiencies this blended model created while delivering a smaller capital investment program over coming years.
Australian Energy Regulator submissionEvery five years, we submit a proposal to the AER, which includes our proposed capital and operating plans and the funding needed to deliver those plans. The AER reviews our proposal, considers feedback, and decides the revenue we can recover from customers to fund our operations.
Our regulatory proposal reflects Endeavour Energy’s vision and objectives to keep our network safe, reliable and affordable for our customers. It also reflects a more concerted effort by Endeavour Energy to engage with our customers to better match the network plans with the long-term interests of consumers.
Our customer engagement identified that customers wanted the price increases of the past to end. We understand that most customers are happy with reliability and do not want to pay for extra improvements. Feedback also confirmed that customers expect safety to be our continuing priority.
The regulatory proposal submitted to the AER reflects these comments from customers. It sets out our plans to keep our network electricity charges at or below CPI for the next five years, and includes plans to improve safety for staff, contractors and the public and maintain a reliable network.
We will continue to engage with customers and stakeholders on this proposal and plan to submit a final revised proposal in January 2015 after considering more feedback.
The AER will release their preliminary views on Endeavour Energy’s regulatory proposal in November 2014, and complete their determination at the end of April 2015. Once made, the AER’s determination will set the total allowable revenues for Endeavour Energy’s distribution services until 30 June 2019.
PERFORMANCE INDICATORCapital expenditure (2004–2015)
0
100
200
300
400
500
600
700
2004–05
2005–06
2006–07
2007–08
2008–09
2009–10
2010–11
2011–12
2012–13
2013–14
2015–16
2014–15
System actualNon system actual
$m
(no
min
al)
System forecastNon system forecast
203
249
317296
381 369
420
485
402
358
54
87
65 77
6248
77
576
59
545
33
47
58
36

12
2
In line with the broader NSW electricity reform, Endeavour Energy continues to pursue a strategy to contain any increase in its share of electricity bills to at or below CPI, while maintaining a safe and reliable network.
For the three years to June 2014, Endeavour Energy had in place two programs, Projects Challenge and Compete, aimed at safely delivering ongoing operating efficiencies of $48 million per year by reducing corporate and administration costs and the cost of our regional operations, while delivering a reliable and sustainable network.
Project Challenge focused on reducing the cost of corporate support and network services by streamlining corporate governance, finance, health and safety, human resources, information technology, property and logistics, and other business services.
Renegotiating with existing suppliers and market testing specific services were among the ways we achieved the required savings. Completing the transition of our retail business also enabled us to simplify some corporate support functions, specifically IT, permitting a closer focus on ‘network only’ operations. Other savings included streamlining the delivery of technical training, relinquishing unnecessary property leases and cancelling underutilised corporate memberships.
Project Compete looked at regional and network operations. Its work included a review of our workforce delivery model, improving scheduling processes, standardising work practices, better control of our overtime expenditure, optimising generator hire and traffic management and implementing best-practice maintenance and defect repair job standards.
After three years of intensive focus, we have successfully completed both Project Challenge and Project Compete, achieving $50.1 million of annualised savings.
Further savings are being pursued by delivering the Network Reform Program. This includes streamlining corporate and support services, implementing policy changes and redefining capital programs to deliver better practices across the industry, and streamlining sourcing processes for products and services.
Endeavour Energy’s Network Reform Program target over four years from July 2012 is $149 million. Through this program we have achieved savings of $38.2 million to date and another $14.9 million delivered through Local Management Initiatives.
Thanks to our collective efforts to contain costs and boost productivity, the average distribution network price increase of 1.2% from 1 July 2014 was below CPI.
We aim to keep downward pressure on prices by controlling costs, so that our share of customers’ electricity bills remain at or below CPI over the next five years. This will be delivered through our Sustainability Program, which will focus on:
• ongoing delivery of Network Reform initiatives
• increasing productivity by driving best practice approaches across the three NSW network operators in relation to corporate and direct overheads
• developing and implementing the Regional Excellence program to safely improve the productivity and efficiency of our regional operations in conjunction with Ausgrid and Essential Energy.
4. Achieve the financial plan
PERFORMANCE INDICATOROur pricing promise to customers (2009–10 to 2018–19)
-10
-5
0
5
10
15
20
Target: Our share of customers’ electricity bills will increase by no more than CPI.
Currently under consideration by the AER.
1.21 1.22 1.22 1.22 1.22
Ave
rag
e A
nnua
l Dis
trib
utio
n P
rice
In
crea
se (N
om
inal
%)
2009
–10
2010
–11
2011
–12
2012
–13
2013
–14
2014
–15
2015
–16
2016
–17
2017
–18
2018
–19
0.01
17.48
15.0616.22
3.55

13
OUR PERFORMANCE 2
Endeavour Energy Annual Performance Report 2013–14
5. Manage business risk
Risk managementIn 2013–14, Endeavour Energy implemented an improved framework in conjunction with Ausgrid and Essential Energy for identifying and managing risks that could affect our customers, the community, the environment, our people, assets or financial resources. This common approach across all three NSW networks enabled comparable assessment and reporting of risks to the Audit and Risk Committee of the Board.
This year we reviewed major risks to achieving our strategic objectives and developed and implemented action plans to help manage them.
Our management of business risk is based on three key behaviours:
• we are aware of our activities, operations and objectives
• we consider what can go wrong and the consequences
• we take action to prevent what can go wrong.
We also strengthened risk management practices across the company.
The Audit and Risk Committee renewed our risk management strategy and risk management plan throughout the year. Risk owners provided regular reports to management and to the Audit and Risk Committee on the results of ongoing monitoring and review of risks, and on action plans to manage them.
Risks to achievement of our Corporate Plan are continually identified and assessed across nine categories, as shown in this table:
Bushfire risk managementIn addition to implementing our own Bushfire Management Plan, Endeavour Energy works with the NSW Rural Fire Service, local councils and community groups to protect our networks and the community from bushfires. The actions we undertake to reduce the risk and impact of bushfires in and around our network is detailed further on page 21.
Incident management and business continuity Endeavour Energy is committed to maintaining continuity of supply and business systems during network and other events. An important function of our incident management plan therefore is to enable us to mobilise resources, communicate with stakeholders and quickly recover key business processes.
Our incident management plan provides a framework to guide the organisation through major disruptive events. This is supported by our business continuity and disaster recovery plans for critical processes and systems. Plans are regularly reviewed and tested. The incident management plan was activated several times during the year and exercises to test our business continuity and disaster recovery plans were also completed.
BUSINESS RISK CATEGORY RISK DESCRIPTION
Safety Fatality/serious injury of employee or member of public
Network Significant customer impact related to the network
Finance Significant unbudgeted financial loss
Compliance Liability associated with a dispute or material breach of legislation or licence
Reputation Sustained public criticism of Endeavour Energy
Environment Significant environmental incident
People Failure to deliver performance through people
Strategy Strategic objectives are not delivered and business opportunities are lost
ICT Significant information and communications technology &/or operational technology service failure

14
2
Capable, skilled people are critical to the success of our business strategy. In 2013–14, we focused on leadership performance, workforce culture and the organisational capability required to execute the Network Reform Program. We also consulted with employees about our new organisational structure, designed to make our business more efficient and reduce duplication while still delivering a safe and reliable supply of electricity for our customers.
Developing our leadership capabilities and cultureWe continued to build our leadership capability through a variety of initiatives that included aligning leadership development programs to our purpose and desired culture.
This included refreshing our Leadership Competency framework to clearly outline the expected behaviours and attributes required by each level of management. The framework is underpinned by research into leadership effectiveness and the characteristics of outstanding leaders while reflecting our specific environment and desired culture to ensure our future success.
Ninety eight participants completed the third year of our Strategic Leadership and Active Leadership programs during 2013–14 which focused on change management, self-awareness of leadership behaviours, business acumen and safety leadership, to improve overall organisational performance and productivity. Diagnostics from the program show there has been a positive change in these strategic and active leaders to better align their leadership competencies with our framework. Each leader has been given an individual report of strengths and areas of opportunity and encouraged to drive their own development in these areas.
During the year, we began a conversation with our employees on reinforcing our values for a fair and just workplace and what that means for each of us. Our goal is to build what we refer to as a ‘fair and just’ culture where all employees know what’s expected of them, and where the right behaviours are recognised and reinforced and the wrong behaviours are addressed. Work during the year has focused on preparing the policy and producing associated education and communication materials.
Fostering an ethical cultureEndeavour Energy’s Make the Right Choice ethics program supports our employees and contractors to develop and maintain the highest standards of conduct. We completed the fifth year of this ongoing program which features interactive training modules to increase awareness of how to deal with ethical issues at work. In 2013–14, 99% of employees and temporary workers completed both modules of our ethics program.
A more effective and efficient organisational structureAs part of the NSW Government’s network reform plan, this year saw the ongoing restructure of our organisation as part of the integration of the three NSW network businesses under the Networks NSW operating model to continuously improve safety, maintain the reliability of our network and contain network tariff increases at or below CPI for our customers. The focus of the review was to:
• where possible, implement a common structure across Endeavour Energy, Ausgrid and Essential Energy to streamline governance
• clearly identify the functions and objectives to be delivered in each area in line with corporate plans
• improve efficiency, and reduce duplication and operating costs.
The restructure was delivered in three stages:
1. Preparation – where structures were reviewed with a focus on maximising efficiency.
2. Consultation – staff directly affected by proposed changes to structures were asked for their feedback to achieve the best outcomes. Consistent with our consultation process, we also discussed these proposals with all relevant unions.
3. Implementation – including the recruitment and selection of almost 300 positions, focusing on filling positions with existing employees where possible. Where changes affect award staff, these were managed through redeployment and voluntary redundancy.
By the end of June 2014, most areas of Endeavour Energy were operating under the new structures. In the coming year, we will continue to review our organisational structures to streamline processes and implement efficiency improvements with an initial focus on our technical training, metering and customer service functions.
Employee relationsOur enterprise agreement, which covers the employment conditions of over 80% of Endeavour Energy employees, was negotiated in 2013 and nominally expires in December 2014. We are currently negotiating a new enterprise agreement to safely improve our productivity and competitiveness and to sustain job security and keep downward pressure on electricity prices.
6. Deliver performance through people

15
OUR PERFORMANCE 2
Endeavour Energy Annual Performance Report 2013–14
7. Leverage technologyTechnology underpins Endeavour Energy’s infrastructure and the way we deliver electricity to our customers. The use of technology is key to achieving our business goals in the most effective and efficient way.
During the year we made progress on a number of important initiatives, providing significant benefits to the organisation in savings, productivity improvements and the delivery of business objectives.
Network technology strategyEndeavour Energy’s technology strategy for the next five years was included in our submission to the Australian Energy Regulator. The strategy was based on the use of technology which had been proven, in pilots and trials, to provide benefits to our customers.
We made significant progress on key pilots during the year which helped us develop our strategy.
Examples include:
• low-cost substation monitors, which can defer the need for augmentation by providing better information
• feeder automation that can help us maintain reliability at low cost
• capacitor control to influence voltage and increase feeder capacity
• the use of optical fibres to improve the operation of our network through better protection, communication and cyber security.
Project and Portfolio Management System (PPMS)A new PPMS was implemented during the year which provides a single view of all network projects and associated resource utilisation. PPMS has a direct integration with our asset and works management system enabling visibility of every work packet associated with our projects. This information system now provides a comprehensive record of all activities undertaken on projects, their costs and resource utilisation and now provides a comprehensive solution for forecasting our future resource needs and improving project delivery methodologies and estimates.
iSafeThe rollout of iSafe on all vehicles was completed during the year and the system is now fully operational. iSafe allows staff in the field to quickly alert our Network Control Room of an emergency and to be located through GPS technology.
Feeder automationOur feeder automation initiative was extended to help maintain reliability to 4,286 customers in the Hawkesbury region, which centred on the township of Glossodia. Feeder automation helps detect and isolate faults, which automatically restores supply from adjacent feeders and minimises supply interruptions. Since being implemented in late 2013, 75% of customers affected by faults in that area have had their supply restored from adjacent feeders within one minute.
SCADAWork commenced on the upgrade of our Supervisory Control and Data Acquisition (SCADA) system, which is the core operational technology for supervision, management and control of our electricity network. This platform will maintain the technical currency of the system, and help ensure we maintain a safe and reliable network.
Assured business platformsWe continued to upgrade our data centre infrastructure to enable significant consolidation of systems, increase workflow automation and operate reliable Information and Communications Technology (IC&T) platforms. In addition, we are currently planning to make better use of cloud solutions so as to drive down the cost of providing generic IT services, and enable mobile access to information from anywhere, at anytime and on any device.
Workflow automationWe continued to implement technology to enhance the efficiency of our network maintenance. By automating field operations, where possible, crews can access safety documents, work packets and our GIS/CAD system, and enter work data more readily.
New mobile devices have been rolled out to help us schedule crews working on streetlight maintenance more efficiently. This initiative is expected to result in a 9% increase in the number of streetlights that can be replaced per day, which will deliver a 5% saving in the cost of replacing lights.
During the year, pilot programs were run using mobile tablets in order to capture data for service line, columns and pillar inspections, and to issue network switching instructions for crews in the field.
We undertook significant work to improve business processes in our metering, billing and network connections systems, and to refurbish existing ICT assets.
Successful trialsOur Glenmore Park Demand Response Trial was completed this year, during which our PeakSaver and In Home Display (IHD) programs successfully influenced the attitudes of participating customers to peak energy consumption and energy saving. Participants in the PeakSaver program delivered peak time energy savings of between 12% and 43% during selected peak day events.
We also launched our PoolSaver community initiative to help customers with pools in certain areas address the challenge of peak demand, use electricity more efficiently and save money. We believe that customers can cut their pool energy costs by over 40% through PoolSaver, which switches their pool pump electricity supply from Domestic to Controlled Load 2 (off-peak) supply.

16
Our network strategyEndeavour Energy is committed to managing network assets in a manner that meets customers’ expectations, fulfils our business needs and satisfies our obligations to stakeholders, the regulator and the community.
During the current regulatory period (2009–14), the AER approved total capital expenditure on the network of $2.7 billion. This saw us embark on the largest investment program in our history, driven largely by the need to increase the security and reliability of our network infrastructure as required by licence conditions.
In order to deliver the program, we developed a number of strategies that targeted efficiency and sustainability. These strategies have enabled us to deliver our capital program without using our full expenditure allowance, with savings passed back to customers in the forthcoming regulatory period in the form of a lower-than-expected regulated asset base, and therefore a lower contribution to network prices.
Over the next five years (2014–19), our forecast capital expenditure of $1.7 billion is 43% lower (after considering the impacts of inflation) than the allowed capital expenditure for 2009–14. This demonstrates that we have achieved the ‘step change’ in the supply security required under our licence conditions. The lower capital expenditure also reflects strategic realignment of our objectives under industry reform, with a greater focus on minimising prices for customers and reductions in the rate of growth in peak demand.
Network investment in the coming five years is focused on servicing high-growth urban areas, particularly in the growth centres in North West and South West Sydney. These cover 27,000 hectares in total and will become home to more than 500,000 people in more than 180,000 dwellings, in areas similar in size to Wollongong and Canberra respectively.
We will also continue to focus on replacing deteriorated assets to ensure we maintain reliable and sustainable network services to customers. The main system capital expenditure categories are listed below:
GrowthEndeavour Energy needs to augment its network to connect new customers, and ensure there is sufficient capacity to meet the forecast peak demand for electricity.
Forecasts of maximum demand are a key input in forecasting capital expenditure, particularly investment to provide additional capacity to meet the needs of customers. Peak demand on our network mainly occurs in summer, due to hot days and lower equipment ratings.
Endeavour Energy’s maximum system demand is forecast to grow from 3,785 MW in 2014–15 to 4,060 MW in 2018–19, representing an annual growth rate of 1.8% over this period. This forecast is largely based on the need to provide new infrastructure to service future customers who will connect in the growth centres previously mentioned and will be wholly supplied by our network.
Asset renewal/replacementWe invest in the renewal and replacement of assets when their continued safe and reliable operation is no longer economically viable. The key drivers of this investment are:
• degradation in the condition of assets
• safety, environmental or other asset-related risks.
ReliabilityWe invest to ensure compliance with reliability performance targets set out in jurisdictional licence conditions. In particular, we work to ensure customers connected to the worst-performing parts of the network receive at least the minimum specified levels of reliability. The main driver of investment in this capital expenditure category is our performance against DRP Licence Condition reliability targets.
ComplianceRegulatory obligations in relation to public safety, workplace safety and environmental protection also require us to invest in our network. Over the coming five years, we have forecast an investment of $116 million to meet these obligations.
Major projects approved 2013–14To replace ageing assets, cater for future growth and ensure the security and reliability of electricity supply to customers, the Board approved two major projects, valued at $33.4 million, this year. Construction will commence in coming years. They are:
PROJECTS
ESTIMATED BUDGET
($M)
South Marsden Park Zone Substation (ZS) establishment
$24.7
Renewal of Mittagong-Avon and Nepean Dam 33kV feeder
$8.7
Total $33.4
3NETWORK

17
OUR NETWORK OPERATIONS 3
Endeavour Energy Annual Performance Report 2013–14
PROJECT DESCRIPTION
INVESTMENT ($)M*
PRACTICAL COMPLETION
DATE DETAILSBEFORE 2013–14 2013–14
TOTAL INVESTMENT
TO 30 JUNE 2014
Abbotsbury ZS establishment
10.5 9.6 20.1 September 2014 Construct a new 132/11kV substation
Baulkham Hills ZS establishment
9.2 1.4 10.7 Complete Construct a new 132/11kV substation within an existing transmission substation
Bella Vista ZS establishment with two 132kV cable links
31.1 0.2 31.3 Complete Construct a new 132/11kV substation
Blackheath ZS redevelopment
6.7 0.3 6.9 Complete Rebuild existing 66/11kV substation
Bulli ZS redevelopment
7.8 4.2 12.0 Complete Rebuild existing 33/11kV substation
Canley Vale ZS redevelopment
12.5 1.2 13.7 Complete Rebuild existing 33/11kV substation
Castle Hill ZS redevelopment
5.3 2.1 7.4 July 2018 Rebuild existing 66/11kV substation
Casula ZS establishment
17.0 1.8 18.7 Complete Construct a new 33kV/11kV substation
Cattai ZS feeders 443 and 458
8.9 13.4 22.2 July 2014 Replace 33kV outdoor switchgear with indoor and augment 33kV feeders
Cawdor ZS establishment
18.9 0.9 19.9 Complete Construct a new 33/11kV substation
Chipping Norton ZS establishment
10.7 3.9 14.6 Complete Construct a new 33/11 kV substation
Claremont Meadows ZS establishment
30.2 0.9 31.1 Complete Construct a new 33/11kV substation
Connection works for the establishment of Macarthur BSP
18.4 1.4 19.8 June 2015 Connection works associated with the new TransGrid Macarthur BSP
Corrimal ZS redevelopment
10.6 1.8 12.3 Complete Rebuild existing 33/11kV substation
Culburra ZS augmentation
5.2 3.1 8.3 March 2015 Install indoor 33kV switchgear, construct new 33kV feeder
Major worksNote: ZS = Zone Substation, TS = Transmission Substation, SS = Switching Station, BSP = Bulk Supply Point

18
3Major works
PROJECT DESCRIPTION
INVESTMENT ($)M*
PRACTICAL COMPLETION
DATE DETAILSBEFORE 2013–14 2013–14
TOTAL INVESTMENT
TO 30 JUNE 2014
Doonside ZS establishment
42.2 8.4 50.6 Complete Construct a new 132/11kV substation to replace the existing Doonside ZS
East Liverpool TS works
25.8 0.2 26.0 Complete Construct a new 132/33kV substation
East Parramatta SS & West Parramatta ZS establishment
75.2 12.5 87.7 Complete Construct a new 132/11kV substation and a new 132kV switching station
East Richmond ZS establishment
21.2 5.2 26.4 August 2014 Construct a new 33/11kV substation to replace the existing Richmond ZS
Edmondson Park ZS
0.2 2.5 2.7 October 2015 Construct a new 33/11kV substation
Feeder 512 to Kemps Creek rebuild
0.5 1.5 2.0 February 2015 Augment existing 33kV feeder
Fibre works at Carlingford TS for Ausgrid
0.3 0.1 0.4 December 2014 Install new fibre kiosk at Carlingford TS
Figtree ZS establishment
15.5 0.6 16.1 Complete Construct a new 33/11kV zone substation
Gerringong ZS augmentation
8.3 0.1 8.5 Complete Replace 11KV switchgear, augment 33KV feeder
Glenorie ZS establishment
9.7 6.3 15.9 July 2014 Construct a new 33/11kV modular substation
Granville ZS establishment
42.9 1.5 44.4 Complete Construct a new 132/11kV substation to replace the existing Granville ZS
Guildford TS redevelopment
42.0 8.0 50.0 Complete Rebuild existing 132/33kV substation
Holroyd BSP 0.5 0.4 0.9 Complete Connection works associated with the TransGrid Holroyd BSP
Holroyd ZS redevelopment
13.1 0.8 13.9 Complete Replace 33 kV and 11kV switchgear with new indoor switchgear
Homepride ZS augmentation
0.4 5.1 5.6 November 2014 Installation of 2 X 33kV circuit breakers at Homepride ZS and augmentation of the 33kV network
Huntingwood ZS establishment
16.8 4. 5 21.3 Complete Construct a new 132/11kV substation
Jordan Springs ZS establishment
10.5 9.5 19.9 July 2015 Construct a new 33/11kV substation (initially deploy mobile substation)

19
OUR NETWORK OPERATIONS 3
Endeavour Energy Annual Performance Report 2013–14
PROJECT DESCRIPTION
INVESTMENT ($)M*
PRACTICAL COMPLETION
DATE DETAILSBEFORE 2013–14 2013–14
TOTAL INVESTMENT
TO 30 JUNE 2014
Kandos ZS redevelopment
1.9 0.2 2.1 Complete Replace 11kV circuit-breakers and associated equipment
Kemps Creek ZS redevelopment
6.9 0.2 7.1 Complete Extend control room to accommodate new 11kV switchboard
Lawson TS RailCorp connections works
0.0 0.9 0.9 Complete Permanent connection of RailCorp 66kV busbars to indoor 66kV switchboard
Leabons Lane ZS redevelopment
1.0 6.3 7.3 December 2016 Rebuild existing 33/11kV substation
Leppington South ZS establishment
1.9 6.4 8.3 December 2014 Construct a new 132/11kV outdoor modular substation
Liverpool TS 132 kV and 33 kV feeders
15.0 8.6 23.6 Complete Construct a new 132kV transmission substation, two 132kV feeders and 16 33kV feeders
Mamre ZS augmentation
3.0 2.0 5.0 Complete Increase the substation capacity with an additional power transformer
South Marsden Park ZS
0.0 0.3 0.3 September 2016 Establish temporary 132/11kV substation
Marsden Park ZS 0.1 1.4 1.5 April 2017 Construct an new 132/11kV substation
Nepean ZS establishment
13.5 1.4 15.0 Complete Construct a new 66/11kV substation to replace the existing Camden ZS
Northmead ZS redevelopment
7.9 5.1 13.1 February 2015 Redevelopment of existing 33/11kV substation
Oakdale ZS switchgear rearrangement
0.0 0.4 0.4 Complete Rearrange switchgear and renew transformer circuit breaker
OPGW on feeders 98W and 98F
0.3 1.6 1.9 December 2014 Installation of fibre optic cables for feeders 98W & 98F
Oran Park establishment – line works
10.2 1.3 11.5 July 2015 Construct two new 132kV feeders to supply to Oran Park ZS and deploy mobile substation
Oran Park ZS establishment
0.8 7.0 7.8 April 2016 Construct a new 132/11kV substation
Penrith TS redevelopment
38.7 1.1 39.8 December 2014 Construct a new 132/33kV transmission substation to replace the existing Penrith TS
Port Kembla ZS redevelopment
9.4 4.1 13.4 July 2014 Construct a new 33/11kV substation to replace the existing Port Kembla ZS
Ringwood ZS redevelopment
2.9 0.4 3.3 Complete Install new 11kV switchgear and associated equipment
Major works

20
3
PROJECT DESCRIPTION
INVESTMENT ($)M*
PRACTICAL COMPLETION
DATE DETAILSBEFORE 2013–14 2013–14
TOTAL INVESTMENT
TO 30 JUNE 2014
Rosehill ZS redevelopment
13.6 0.9 14.5 Complete Construct a new 11kV switchgear room, new transformer, replace existing 33kV feeders
Russell Vale ZS augmentation
7.8 0.5 8.2 Complete Replace two transformers with higher capacity units
Rydalmere ZS redevelopment
16.5 3.7 20.1 May 2016 Rebuild existing 66/11kV substation
Sherwood ZS 3rd transformer
6.6 0.1 6.8 Complete Rebuild existing 33/11kV substation
Shoalhaven feeder 7510/7511 augment
1.1 2.4 3.5 Complete Augment 33kV feeders 7501 & 7511
South Granville ZS redevelopment
12.3 2.7 15.0 July 2015 Construct a new 33/11kV indoor substation
South Windsor ZS redevelopment
2.7 0.1 2.8 Complete Rebuild a fire damaged 11kV switchroom
St Marys ZS redevelopment
1.6 6.7 8.3 November 2016 Rebuild existing 33/11kV substation
Tomerong ZS establishment
14.4 2.8 17.2 Complete Construct a new 33/11kV substation
West Liverpool ZS establishment
17.3 0.1 17.4 Complete Construct a new 33/11kV substation to replace Hoxton Park ZS
West Tomerong TS establishment
24.2 6.3 30.5 Complete Construct a new 132/33kV substation
Westmead ZS redevelopment
0.9 4.2 5.1 June 2015 Rebuild existing 33/11kV substation
Wilton Park ZS establishment
24.3 0.1 24.4 Complete Construct a new 66/11kV substation
Windsor ZS augmentation
13.4 3.6 17.0 Complete Rebuild existing 33/11kV substation
Total 798.2 196.4 994.6
* Figures rounded to the nearest $100,000
Major works

21
OUR NETWORK OPERATIONS 3
Endeavour Energy Annual Performance Report 2013–14
Network maintenance Our Network Maintenance Implementation Plan, part of our broader Strategic Asset Management Plan, analyses maintenance needs against business objectives and details the strategies we need to embrace to maintain our network.
This work includes vegetation management, asset inspections and pre-summer bushfire inspections of our overhead electricity lines in bushfire-prone areas. The plan is reviewed and updated annually to identify what network maintenance activities will be needed over the next 12 months.
In 2013–14, Endeavour Energy delivered its maintenance program at a cost of $247.7 million and in compliance with our maintenance targets. Activities and expenditure this year included:
• $40.2 million on vegetation management so as to maintain safety clearances, reduce outages, improve reliability and manage bushfire risk
• $30.6 million on preventative maintenance and inspections of the transmission and distribution network
• $17.4 million for expenses related to the contestable customer connection works and contributions, including transformers and switchgear paid by the customer
• $15.9 million for fault and emergency work following weather-related events and third-party incidents
• $12.5 million on metering including the meter reading and provision of information for billing purposes
• $10.9 million for our overhead line and pole inspection program, which involved the inspection of 93,527 poles
• $6.0 million on street lighting, including the replacement of 62,210 lamps
• $114.3 million on the management of network operations and other maintenance activities.
Vegetation managementEndeavour Energy is committed to best practice in asset inspection and vegetation management. A key component of this strategy is to minimise the risk of trees coming in contact with our network, which could in-turn cause bushfires, damage assets and interrupt supply.
This year, we increased the deployment of new Light Detection and Ranging Technology (LiDAR) for our pre-summer bushfire inspections. This allowed us to review data in great detail after aerial surveys. It also removed risks associated with low-level flying near powerlines, enhanced the safety of survey crews and increased efficiency.
In 2013–14, we strengthened the controls around our vegetation maintenance contracts by ensuring the same contractor does not scope then perform the work.
We also ran an auditable management system which detailed the types, and location of vegetation in proximity to overhead mains. This information will be used in the coming year to help reduce vegetation management costs.
Pre-summer bushfire preparationsEndeavour Energy continued to undertake extensive work in line with our Bushfire Management Plan to reduce the risk and impact of bushfires in and around our networks.
This work included:
• thorough inspection of its powerlines in high-risk areas before the start of bushfire season (1 October) to assess potential fire hazards and correct hazard defects identified.
• fitting spreaders, where appropriate, to manage potential bare, low-voltage powerline clashing
• installing vibration dampers on long spans to reduce the risk of powerlines breaking due to vibration
• implementing changes in our operating procedures during times of high fire danger
• acknowledging ISSC 33 considerations, which provide a guideline for network configuration during days when there is a high risk of bushfire
• liaising with other organisations on bushfire-related issues
• providing information to the public about key safety issues relating to bushfires and electricity networks
We also minimised bushfire risks by:
• annual aerial and ground inspections of overhead powerlines in bushfire-prone areas in order to identify potential faults and prioritise associated repair works.
• increasing the deployment of LiDAR during our pre-summer inspections. This provided highly accurate infra-red images of potential faults and excellent measurements of safety clearances from vegetation
• inspecting approximately 152,000 poles during the reporting period in areas designated as bushfire-prone by the NSW Rural Fire Service
• keeping vegetation clear of powerlines in line with industry standards. Alternatives such as line relocation or conversion to covered conductors or underground lines were considered at locations where standards could not be readily achieved
• undertaking routine maintenance patrols to identify faults in need of repair
• disabling auto reclosers on the network on days of total fire bans, if there is a known defect on the line, and if the line is in a bushfire prone area. This means that if a fault occurs, the power supply will be disconnected until the powerline has been patrolled, the cause has been located and addressed and it has been deemed safe to manually restore supply.

22
3StreetlightingEndeavour Energy owns and maintains over 196,000 streetlights on behalf of its 29 public lighting customers, including 23 local councils.
Since 2007 we have met with councils on a bi-annual basis to discuss a range of issues in relation to the provision of street lighting services. In addition to this ongoing engagement, between February and April 2014 we met with 18 local councils and three regional organisations of councils to help them understand, and have input into our AER submission for the 2014–19 regulatory period.
This engagement represented the overwhelming majority of councils whose public lighting services are provided by Endeavour Energy. We focused on:
• providing information on streetlight tariffs
• informing councils about changes to street lighting charges
• ensuring our operations and services were aligned with the long term interests of local government
• discussing the availability and transition to new public lighting technologies.
Throughout the meetings, representatives from local and regional organisations of councils were given the opportunity to have input into our plans and also provide feedback on our performance to date.
The NSW Public Lighting Code requires us to repair faulty streetlights within eight working days of receiving the fault report. In 2013–14, our average response time to repair faults was 3.6 days.
During the year we replaced more than 62,000 lamps as part of a bulk change maintenance program. Defective mercury streetlights were replaced with more efficient LED lights, compact fluorescent lamps, T5 fluorescent lamps or high-pressure sodium lamps (that consume almost half the energy) thus helping our public lighting customers save energy.
We also undertook extensive field trials of LED streetlights, which are potentially more efficient and reliable than other technologies available. In coming years, Endeavour Energy’s customers can expect to save more energy and have greater reliability through the use of LED technology.
Demand managementOne way of reducing the cost of network management is to investigate demand management alternatives (also known as non-network options) to network augmentation, for specific capital projects.
Where feasible, Endeavour Energy investigates and implements projects that modify demand as an alternative to spending money to upgrade the network. Projects may include negotiating with high-use customers to move electricity consumption away from the network peak times or implementing projects to reduce overall usage in those times. Other initiatives include assisting customers financially to reduce their electricity consumption during peak periods.
Endeavour Energy recognises there is an imperative to ensure electricity is delivered reliably, and in an energy efficient and environmentally responsible manner, which is why we evaluate demand-side as well as construction options in the network planning process.

23
OUR NETWORK OPERATIONS 3
Endeavour Energy Annual Performance Report 2013–14
AREA DESCRIPTION
TARGET DEMAND REDUCTION (kVA)
CAPITAL EXPENDITURE DEFERRED RESULTS OF INVESTIGATION
Feeders 851 & 852 – southern Nepean area
Industrial, mining, residential and rural areas
14,000 $8.2 million Investigations into the development of load curtailment opportunities and customer power factor correction continuing. Demand management investigation still progressing.
Feeder 98P – Shoalhaven to West Tomerong TS
Coastal townships, residential and rural areas
51,600 $8.3 million Insufficient demand reduction opportunities. Demand management not warranted at this stage.
Feeder 808 – Springwood ZS
Predominantly residential
3,000 To be determined
Demand has reduced and constraint deferred.Demand management investigation put on hold.
The National Electricity Rules (NER) requires distribution network service providers to investigate demand management options by undertaking a thorough consultation process to facilitate input into network plans. This provides all interested parties with an opportunity to submit options and ideas which allow cost effective demand management and other system network support options to be developed.
The NER calls for a ‘screening test’ to be performed for all capital projects above $5 million, to determine if a non-network option is credible and should be further investigated. Endeavour Energy performs this test and summarises the results in its annual Demand Management Plan (DMP) and the Distribution Annual Planning Report (DAPR).
If a non-network option is deemed to be feasible, a Non-network Options Report is produced or an in-house demand management investigation is conducted. A Non-network Options Report is a public consultative process in which Endeavour Energy invites interested stakeholders to make submissions which evaluate system support options against network options.
The table below outlines our Network Demand Management Plan projects for investigation in 2013–14.
Residential demand management programsThe CoolSaver and PeakSaver residential demand management programs were implemented in the Glenmore Park area in the reporting period. This followed their successful implementation in the Rooty Hill ZS supply area the previous year, when they became the first residential demand management programs Endeavour implemented. Trials into air conditioning cycling and dynamic peak pricing were used to help create the residential DM programs.
The CoolSaver program involved the use of air conditioners built to a new Australian standard to reduce energy consumption. The PeakSaver program allows customers to manage their own energy consumption and be financially rewarded, depending on how much energy is saved.
Customers are generally happy to participate in these programs, which concluded at the end of February 2014 and recorded a satisfaction rate of 88%. Demand reduction against baseline was as high as 35% for PeakSaver (1.7 kVA per customer) and 30% for CoolSaver (1.5 kVA per customer). We now seek to expand the programs.
Nightwatch Our Nightwatch Service, which offers automatic dusk-to-dawn lighting, gives customers valuable security and/or promotional lighting. The service monthly rental includes energy, network charges and maintenance. As of 30 June 2014, Nightwatch had more than 1,742 customers, servicing 2,846 lights.
Dial-Before-You-Dig (DBYD)Since the exposure in 2009 of some high-profile ‘dig-ins’ and the associated legislative response to prevent damage to electricity assets, we have seen a 120% increase in the number of enquiries per day through our DBYD service. We currently receive around 350 enquiries daily on average, with peaks of around 450.
This year we made further improvements to our DBYD application to boost its efficiency and further improve the service we provide. Over half of our 9,000 monthly requests are now automated. Even with the increased demand, 99.8% of DBYD enquiries were responded to within 48 hours throughout the year.

24
3Metering servicesEndeavour Energy undertook 6,197,319 routine meter reads in 2013–14. In addition we supplied about 211,467 out-of-cycle meter reads to facilitate requests for reconnections, disconnections and special reads.
Customer service During 2013–14, our Customer Interaction Centres (CICs) in Huntingwood and Coniston received 222,427 fault and emergency calls via the 131 003 contact number, which equates to a 10% increase in the volume of calls received in 2012–13. Calls were answered at an average speed of 39 seconds, with 73% of calls answered by a human operator within 30 seconds. Our outage management interactive voice response satisfied a further 104,528 customers compared to 172,356 last year. A further 17,839 calls were also answered via our 133 718 general enquiries number.
We received 2,941 complaints in 2013–14 compared with 3,689 the previous year. The main complaints related to non-notification of routine interruptions to power supply, as well as dissatisfaction with tree trimming.
National Energy Customer Framework The National Energy Customer Framework (NECF) started in NSW on 1 July 2013. Its principle objective is to streamline the regulation of energy distribution and retail functions under a harmonised national framework overseen by the Australian Energy Regulator. It also gives residential and small business customers a much greater level of protection with respect to connection, supply and sale of energy.
Prior to the start of the NECF in NSW, we developed and implemented new procedures in our business processes to meet the standards of service delivery required and trained directly affected staff to implement the new requirements.
Despite this preparation, there were, regrettably, a total of 40 Type 1 breaches throughout the year. This included the failure to provide life-support customers with sufficient notice of planned interruptions on 17 occasions, failure to de-energise a customer’s premises within two business days of the date requested by their retailer on 20 occasions, and failure to re-energise a customer’s premises within set timeframes when requested by a retailer. In addition, there were 90 Type 3 breaches for the failure to notify customers (who were not flagged as life support) of planned interruptions.
These results are disappointing and we are addressing the relevant issues to improve performance via a number of initiatives. These include projects to assure the consistency of data between our business systems, improve our management of planned interruptions and ongoing staff communication and training to reinforce our updated business procedures.
Reliability projectsAt the end of June 2014, 322 reliability projects had been completed against a target of 346. The remaining projects will be carried over for completion in the 2014–15 works program. We are developing monthly reporting by location of Customer Average Interruption Duration Index (CAIDI) results, to help increase regional staff awareness of reliability issues.
In addition, specific areas of poor reliability are being reviewed by formalising regional work practices with regard to poorly performing feeders to specify actions required for remedial action including thermovision patrol, analysis of fault patterns, line patrols and resolution of priority defects.
Network connectionsEndeavour Energy processed a number of applications in 2013–14 which resulted in 1,100 contestable designs being certified for changes to the network. There were 726 contestable construction projects, representing approximately $90 million of non-cash capital contributions. Overall 15,779 new connections were made to the network, including residential and commercial/industrial subdivisions. Endeavour Energy works closely with developers through the Urban Development Institute of Australia (UDIA) in support of the NSW Government’s land release targets.
The introduction of the National Energy Customer Framework (NECF) outlined in Chapter 5A of the National Electricity Rules required a substantial change to the way we manage the connection of customers to the network. The NECF required that applications be accepted and offers made to customers who required a connection service. As a result we developed an expanded application management system to allow processing of applications as well as the capacity to issue a Permission to Connect letter for all complete applications.

25
OUR NETWORK OPERATIONS 3
Endeavour Energy Annual Performance Report 2013–14
This additional activity resulted in connection paperwork being processed for 14,890 basic applications, along with the application paperwork for small-scale embedded generation and standard connection services which required network extension or augmentation prior to customers connecting to the network.
We provided four temporary 11kV connections to support the energy requirements for tunnel-boring machines for the North West Rail Link. The major supply injection point in our area for this development will be at Rouse Hill. Negotiations on the primary supply voltage are progressing.
Development of the Denham Court Transmission Substation associated with the South West Rail project has progressed, with commissioning expected in October 2014. The supply point will provide energy for the rail connection between Leppington and Glenfield. Operation of the line is expected to commence in January 2015.
Ongoing refurbishment and augmentation of traction substations on the western line has led to the requirement for an additional 33kV traction feeder from Blacktown Transmission Station to connect to the Toongabbie Traction Substation.
KEPCO coal mine in the upper Bylong Valley requires a supply of 35 MVA to allow excavation and processing of coal reserves. This will require a major augment of the existing transmission feeder to the Bylong Zone Substation.
There have been several expansions at the Holsworthy and Albatross defence sites. These have required a major supply upgrade to cater for planned expanded operational activity. A number of data centres are also currently negotiating supply arrangements.
Solar connectionsAs at 30 June 2014, Endeavour Energy had 83,850 small solar generators connected to our network, an 11% increase on the number connected at the end of 2012–13. These generators exported 176 gigawatt hours of energy to our network throughout the year.
During the year, we processed solar connection applications for 8,821 sites from customers wishing to connect micro-embedded generation systems complying with AS4777 to our network. In addition applications for another 1,467 more complex, embedded generator connections were processed. Standard connection offers under the NECF were made in response to a total of 3,491 applications.
The high potential risk of equipment failure as a result of incorrect solar connections has led to the implementation of a minimum inspection standard for all solar installations. The implementation of this standard will result in all solar sites being revisited and assessed. To this end, we undertook 32,695 site inspections during 2013–14. The defect rate on these installations is 18% for minor defects, and 5% for major defects. This compares to 10% and 0.2% respectively for other installation inspections.
Major network eventsIn August 2013, winds gusting around 100 kilometres per hour damaged our network, leaving 16,000 homes and businesses in Sydney’s southern and western suburbs without power. Damage to the network centred on the Picton, Penrith and Lower Blue Mountains areas. Our crews restored power safely and efficiently to most customers within 24 hours.
A bushfire in September 2013 destroyed 17 network poles, six private poles, power lines and two substations. Seventy Endeavour Energy staff again restored power to affected customers within two days.
By mid-October, warm, dry and windy weather provided dangerous conditions which fuelled over 100 bushfires across NSW. It was reported at the time that the bushfires were the worst in NSW since the 1960s, and the NSW Government declared a state of emergency on 20 October 2013 after 248 houses and other structures had been destroyed by bushfires across the state.
Endeavour Energy understands the devastating impact these fires had on the community in our network area, particularly those parts of the Blue Mountains and Lithgow regions and at Balmoral in the Southern Highlands where bushfires destroyed or damaged homes and property.
In response to the destruction caused by this natural disaster, over 100 poles had to be replaced with more than 300 Endeavour Energy staff working on emergency repairs to restore essential electricity supplies. Once crews were granted safe access to the fire grounds by the NSW Rural Fire Service, all affected customers whose premises could be restored were reconnected to the network within two days.
Our thoughts continue to be with the residents who lost their homes. Following these bushfires, Endeavour Energy offered assistance to customers whose properties had been damaged or lost. This included the proactive payment of costs associated with re-establishing a connection to our network. Of the 201 eligible customers identified, 136 residents have received the payment. A program remains in place to ensure the remaining eligible customers can claim the payment.

26
Endeavour Energy employeesEndeavour Energy understands that to achieve our business goals and deliver better value to our customers, we need an engaged and capable workforce aligned with our values and culture.
During 2013–14 we continued to implement initiatives to improve productivity and provide the most efficient service possible for our customers. These efficiency improvements saw our workforce reduce to 2,533 full-time equivalent staff in 2013–14, a decrease of 3.9% on the previous year.
RecruitmentImplementing our new organisational structure has required significant restructuring in the last 12 months with approximately 90% of the positions filled by internal candidates.
We set up a new agency supplier panel for temporary resources and centralised the management of temporary employees to our recruitment team. These changes have increased the transparency and efficiency of the temporary labour recruitment process throughout the year, and led to cost savings.
Apprentices and other development programsIn early 2014 we employed 19 new apprentices, who will complete a Distribution Electricity Supply Industry trade qualification.
Meanwhile 58 apprentices completed their qualification during the year, with most accepting an employment arrangement within the organisation. We now employ 149 apprentices, six electrical engineering graduates, one electrical engineering cadet and two trainee electrical officers.
It was another successful year for Endeavour Energy apprentices at the 2014 NSW Training Awards, with 13 being nominated for awards. In the South Western Sydney Region, Jean-Pierre Manalo was awarded Apprentice of the Year. In Western Sydney, Zoe Osborne and Matthew Kinsela were finalists for Apprentice of the Year, while Ray Robinson won the Excellence in Electrotechnology Award.
Diversity We are committed to fostering an environment in which diversity in the workplace is respected and valued as a source of new ideas and perspectives. This commitment includes encouraging diversity across all areas of employment such as recruitment, remuneration, training, development and career progression and accommodating the needs of employees in their observance of religious duties and cultural obligations while at work.
Our Equal Employment Opportunity (EEO) group targets are detailed on page 99. During 2013–14, however, there has not been substantial progression towards these targets due to our organisational restructure and limited external recruitment.
Throughout the year we did work on strengthening our Indigenous employment connections through pre-apprenticeship programs, developing our ability awareness and improving our flexible working arrangements.
We expect to see change in the year to further programs to promote a more diverse workforce.
Multicultural policies and services programEndeavour Energy’s corporate values commit the organisation to acknowledging and valuing cultural diversity across our stakeholder base. This commitment is evident in our delivery of customer services, management of employees and interactions with suppliers, communities and other stakeholder groups.
Customers We strive to ensure that appropriate services are offered to our multicultural customers and that customers are not disadvantaged because of their cultural backgrounds.
To ensure we offer the same level of service to everyone, we provide an interpreter service that allows customers to speak their own language when dealing with us. To improve access to information for customers from non-English-speaking backgrounds, we include interpreter information on our significant customer communication materials and have it prominently displayed on our ‘Contact us’ page on our website.
Providing customers from a non-English speaking background with information in their own language also forms part of our commitment to public safety. As part of this, we have released important electrical safety information about how to live safely with electricity on our website in four community languages. The languages chosen for translation were based on census data on the make-up of our customer base and the most frequently used interpreter services in our interactions with customers.
4PEOPLE

27
OUR PEOPLE 4
Endeavour Energy Annual Performance Report 2013–14
Employees Our Code of Conduct sets the expectation for employees to treat customers and other employees with respect and be sensitive to their rights. We are committed to fostering an environment in which diversity in the workplace is respected and valued as a source of new ideas and perspectives. This commitment includes encouraging diversity across all areas of employment such as recruitment, remuneration, training, development and career progression and accommodating the needs of employees in their observance of religious duties and cultural obligations while at work.
Focus for 2014–15 Planned initiatives for the coming year include updating our Equity and Diversity Strategy and Framework in conjunction with Ausgrid and Essential Energy to embed the diversity principles and help work towards achieving EEO targets, and updating a multicultural plan to maintain a culture of inclusiveness across our organisation.
2,888
0.6%
2,925
1.3%
2,824
-3.5%
2,635
-6.7%
2,533
-3.9%
2009
–10
2010
–11
2011
–12
2012
–13
2013
–14
PERFORMANCE INDICATOREmployee numbers 2009–2014

28
Public safetyOur Public Electrical Safety Awareness Plan (PESAP) targets groups in the community most at risk from electrical hazards. Over the past three years, we have worked with the other NSW electricity network companies to deliver several state-wide campaigns to boost safety education.
Work associated with PESAP in 2013–14 involved engaging with workers managing vegetation to educate them about safe clearances and working safely around powerlines, promoting the safe management of asbestos among private contractors, and raising the awareness of drivers of heavy vehicles and large machinery regarding safe distances from powerlines.
Once again we helped educate primary school students about electricity safety through the Electricity Safety Week program, which includes teaching children about the dangers of electricity.
Copper theftStealing copper from the electricity network is a dangerous crime that risks serious injury to both the perpetrator and the general public. Following significant efforts over the past five years to upgrade the security and raise public awareness about its dangers, we saw a further decline with just 20 incidents of copper theft being reported in 2013–14 compared to 30 cases in 2012–13 and 121 cases 2011–12.
Throughout the year, local paper and radio advertising was again used to encourage customers to contact Crime Stoppers if they observed suspicious activity around Endeavour Energy assets.
GraffitiGraffiti vandalism is a major issue for the community. To help manage the problem, we have a target to remove graffiti from our assets within five to seven days of it being reported by customers, or within 48 hours if the graffiti is especially offensive. There were 2,000 graffiti vandalism reports this financial year, representing a cost to Endeavour Energy of $168,000.
We are examining new ways to manage graffiti more cost effectively in the longer term. The most significant of these is a recently released graffiti management tender for removal services, effective from October 2014. The new tender specification increases the coverage of the contract across our franchise area and at the same time aims to contain costs of graffiti removal while ensuring the safety of these contracted workers and the public.
In 2014–15 Endeavour Energy will again support The Electric Art Project that was originally trialled in 2004 and continued until 2009. The project with Blacktown City Council uses local artists to paint murals on selected graffiti-affected assets. Yearly audits indicate that these assets are now relatively free of graffiti.
Public consultation on major network projectsEndeavour Energy recognises that engaging the community and other key stakeholders in open, honest and respectful two-way dialogue is critical to our success. Community engagement provides us with the opportunity to understand and consider stakeholders’ needs, issues, concerns and expectations in the planning and development of our network, and its subsequent operation. This engagement may include informing, consulting and involving stakeholders at various points in project design and implementation.
In 2013–14, there were 28 major capital projects on which we engaged with local communities including:
• development of the new Marsden Park Zone Substation to supply a proposed new residential development in the area
• adjustments to the design of the transmission line connecting the new Oran Park Zone Substation to the existing Nepean Transmission Substation
• development of a new transmission line connecting Edmondson Park Zone Substation to Denham Court Transmission Substation
• installation of a third 132kV transformer at Liverpool Transmission Substation
• development of a new transmission cable connecting Camellia Transmission Substation to East Parramatta Switching Station.
5COMMUNITY

29
OUR COMMUNITY 5
Endeavour Energy Annual Performance Report 2013–14
Customer Consultative CommitteeOur Customer Consultative Committee has run successfully for over 20 years, and continues to provide valuable insights into the issues of importance to the community and the impact of our operations on our customers.
The Committee met twice in 2013–14 to discuss: Endeavour Energy’s strategic objectives for 2013–14; the input of customers and stakeholders into our regulatory proposals to the AER; network prices for the 2014–19 period; development of our Customer Strategic Plan; the restoration of supply to customers after bushfires impacted our network in October 2013; and the trial of new LED streetlight technology.
Feedback from the committee helps Endeavour Energy develop our network strategies, plans and regulatory submissions, and is provided to our Executive Leadership Team for review and consideration.
Community partnershipsEndeavour Energy’s community partnership programs align with our values and strategic objectives, provide mutual benefits to our communities, the organisation and employees, and contribute to the achievements of our objectives.
During 2013–14, we supported Australia Day and the NSW Centenary of ANZAC commemoration publication detailing the history of NSW’s involvement in the First World War.
Investment in the communitySince its launch in July 2004, our workplace giving program I care! has donated over $1.8 million to charities. Employees can make pre-tax donations to the program and their donations are matched dollar-for-dollar by Endeavour Energy up to $150,000 per year. In 2013–14, we provided $122,870 to match payments made by our staff to 11 employee-selected charities.
University of Wollongong Power Quality and Reliability CentreEndeavour Energy has been a partner of the Power Quality and Reliability Centre since it was established at the University of Wollongong in 1996. The focus of the Centre is to work in conjunction with industry to improve the quality and reliability of electricity supply for the benefit of all consumers.
Key areas of research include power quality issues that can affect the performance of the network and equipment, reliability of the distribution network, and integration of renewable energy into existing networks.
2013–14 was the second year of our current three-year funding commitment to the Power Quality & Reliability Centre. The funding is used to employ two full-time academics.
30
StrategyOur environment strategy was this year integrated into Networks NSW’s Health, Safety and Environment (HSE) Strategic Plan. The plan’s overarching objective is to continually improve our performance so as to protect the safety of our employees, contractors, the community and everyone influenced by our business. We will develop a framework to support this goal and our transition towards zero harm.
Environmental stewardship, improvement of our environmental performance, management of environmental risks and the implementation of sustainable initiatives will encourage our people to work responsibly and assist Networks NSW to create an ‘environmentally considerate’ culture.
Environmental complianceEndeavour Energy’s focus on strategic risk management again resulted in no fines or prosecutions in 2013–14 and a decrease in the number and severity of environmental incidents. No incidents were reported to the regulator under the Protection of the Environment Operations Act 1997.
Further, there was a 17% decrease in the number of minor incidents reported internally. Incident analysis indicates that the reporting culture remains strong, with employees continuing to report incidents, irrespective of their severity. Environmental incidents in 2013–14 were predominantly minor oil leaks or spills arising from equipment failure, third-party damage or extreme weather events.
As part of our efforts to align with the NSW Government’s 10-year strategic business plan, NSW 2021: A plan to make NSW number one, we continued to liaise with Regional Illegal Dumping Squads established by the Environmental Protection Authority (EPA) and local councils. Although the number of reported incidents of illegal dumping has marginally increased in the past year, this is likely the result of improved reporting processes.
Strategic risk managementAs part of the Networks NSW Health, Safety and Environment Strategic Plan, Endeavour Energy adopted a consistent approach in the identification and assessment of significant environmental hazardous events. Our aim is to reduce hazardous events to ‘As Low As Reasonably Practicable’ and we have developed action plans to support these efforts.
Networks NSW has developed Environmental Performance Protocols to establish a minimum and consistent standard for network activities which have the potential to cause environmental harm. While Endeavour Energy largely adheres to these protocols, a small number of gaps have been identified, which will be addressed over the next year.
Audit programOur strategic risk management approach has significantly influenced our environmental audit and assurance program. Approved by the Executive Health, Safety and Environment Committee, the audit program considered the adequacy and effectiveness of key environmental controls including: policies and procedures; monitoring; reporting processes; training; communication; and supervision.
Recommendations arising from the audits have led to:
• strengthening of controls governing network construction and maintenance works in national parks and Sydney Catchment Authority ‘Special Areas’
• streamlining environmental assessment processes
• delivery of training sessions in response to identified risks
• improving the effectiveness of spoil management processes, including the classification and disposal of contaminated materials.
Greenhouse gas reductionWe met our commitments to state based and national environmental schemes again in 2013–14. The schemes aim to reduce greenhouse gas emissions or promote energy efficiency among businesses and consumers.
6ENVIRONMENT

31
ENVIRONMENT 6
Endeavour Energy Annual Performance Report 2013–14
PERFORMANCE INDICATORNumber of environmental incidents
Go
od
2008
–09
2007
–08
2006
–07
2005
–06
2004
–05
2009
–10
2010
–11
2011
–12
2012
–13
2013
–14
11
13
5
2224
00
Carbon policyIn 2011, we committed to a Carbon Management Policy to eliminate 20,000 tonnes of carbon from our operations by 2016. In 2013–14, we continued to identify and assess opportunities to reduce emissions by:
• reducing the number of fleet vehicles required, the kilometres travelled (by restricting take home use of company vehicles) and replacing six-cylinder vehicles with four-cylinder vehicles where feasible
• increasing the percentage of Greenpower purchased so as to meet the electricity needs of our operations
• planning a number of energy efficiency projects at our Huntingwood head office including upgrading our heating, ventilation and air conditioning system and external security lighting
• commencing the decommissioning old computer equipment and replacing it with newer, more energy efficient technology.
By implementing these initiatives, we achieved 67% of our target in eliminating 13,406 tonnes of carbon from our operations by the end of the 2013–14 financial year.
Waste management and minimisation We met our commitments under the relevant NSW Government Waste Reduction and Purchasing Policy, continued the implementation of initiatives to reduce waste, and promoted the use of recycled materials.
In 2013–14, we diverted 1,629 tonnes of materials from landfill, representing 19% of our waste stream. Our timber power pole recycling program continues to be refined, and has resulted in the diversion of 299 tonnes of timber poles in 2013–14.
In response to network maintenance and refurbishment programs, a further 460,585* litres of transformer oil were recycled.
* The 34% increase in recycled oil was due to an increase in transformer refurbishments, replacements and decommissioning in 2013–14.

32
7GOVERNANCE
Integrated suite of ethical principles
EXECUTIVE LEADERSHIP GROUP
Chief Engineer
Jim Battersby• Primary systems• Secondary systems• Asset & network planning• Network data and performance• Electrical safety & authorisations
General ManagerNetwork Development
Ty Christopher• Portfolio management• Project development• Major projects• Capital programs• Maintenance & vegetation
General ManagerNetwork Operations
Scott Ryan• Regional operations• System control• Operational performance management• Network connections
General ManagerHealth, Safety & Environment
David Neville• Operational safety• Public safety program• Safety management• Health & wellbeing• Environment
General ManagerFinance & Compliance
Michael Ghattas• Finance• Governance & business risk• Network regulation• Legal• Strategy & compliance
Code of Conduct Statement of Business EthicsOutlines Endeavour Energy’s expectations of private sector service providers in conducting business with Endeavour Energy
Sets out the principles and values by which the Board and employees of Endeavour Energy are expected to act
General ManagerInformation, Communications and TechnologyIan Robinson• Strategy, architecture & governance • Infrasture & operations• Business systems• Vendor management
General ManagerPeople & Services
Bruce Rowley• Human resources• Corporate affairs• Customer service• Procurement & logistics• Property & fleet• Internal audit
Group Chief Financial Officer
Group Executive Network Strategy
Group Executive People & Services
ESSENTIAL ENERGY
AUSGRID
Chief Operating OfficerRod Howard
Board Secretary
Board of Directors
Chief Executive OfficerVince Graham
Governance and organisational structure
Endeavour Energy is a state-owned corporation established under the Energy Services Corporations Act 1995 (NSW) and the State Owned Corporations Act 1989 (NSW). It is governed, principally, by these two statutes and its Constitution.
Good governance is a critical prerequisite for a high-performance organisation. It provides a platform for a sustainable future and demonstrates our commitment to high standards of business integrity, ethics and professionalism across all activities. Our Code of Conduct sets out the expectations for staff behaviour that we believe are fundamental to our business success.
The Code encourages a culture of responsibility and accountability that promotes ethical and responsible decision making.
Good governance helps to ensure the delivery of outcomes sought by our shareholders; supports our people and business operations; and helps ensure we adopt sound ethical, financial and risk management practices to benefit our customers, and effective compliance and auditing programs.
Joint Board of DirectorsEndeavour Energy, Ausgrid and Essential Energy continue to operate as separate legal entities but are managed by a joint Board of Directors and common Chief Executive Officer (CEO).
All directors on the joint board, with the exception of the CEO, are appointed by the voting shareholders for terms of up to five years. Appointments may be renewed at the discretion of the voting shareholders.
Each non-executive director’s remuneration is determined by the voting shareholders and is paid out of Endeavour Energy’s funds. The CEO is not entitled to additional remuneration for being an executive director.

33
7GOVERNANCE
Endeavour Energy Annual Performance Report 2013–14
Board of Directors – 2013–14 (as at 30 June 2014)Roger Massy-GreeneBSc BE (Hons) MBA, FAICD, FIE (Aust)
Chairman
Term: 1 July 2012 to 30 June 2015
Chairman of the Board from 1 July 2012
Chairman, Nominations Committee
Member, Audit and Risk Committee
Member, Safety, Human Resources and Environment Committee
Other Directorships:
• Ausgrid, Chairman
• Essential Energy, Chairman
• Eureka Capital Partners Pty Ltd, Chairman
• Salvation Army’s Red Shield Appeal Committee Sydney, Chairman
• Eureka Benevolent Foundation, Chairman
• OneVentures Pty Ltd, Director
• The Hunger Project Australia, Director
• Illawarra Coke Company Pty Limited, Director
• ICC Holdings Pty Limited, Director
• Dovose Pty Limited, Director and Secretary
Peter DoddPhD, MSc MCom, BCom, Dip Ed
Non-Executive Director
Term: 1 July 2012 to 31 December 2016
Chairman, Audit and Risk Committee
Member, Nominations Committee
Other Directorships:
• Ausgrid, Director
• Essential Energy, Director
• The Centre for Independent Studies Ltd, Director
• Peter Dodd Pty Ltd, Director
• Collgar Wind Farm Pty Ltd, Director
• CWF Holding Pty Ltd, Director
• Energy Industries Superannuation Scheme (EISS), Chairman
• Investa Listed Funds Management Limited (ILFML), Director
• Macquarie University Group of companies, Director
Diana EilertBSc, MComm, GAICD
Non-Executive Director
Term: 23 June 2014 to 22 June 2017
Other Directorships:
• Ausgrid, Director
• Essential Energy, Director
• AMP Life Ltd, Director
• The National Mutual Life Association of Australia Ltd, Director
• Veda Group Ltd, Director
• Queensland Urban Utilities, Director
• Blue Sky Consulting Pty Ltd, Director
Philip GarlingB.Build, FAIB, FAICD, FIE (Aust)
Non-Executive Director
Term: 1 January 2013 to 31 December 2015
Chairman, Safety, Human Resources and Environment Committee
Other Directorships:
• Ausgrid, Director
• Essential Energy, Director
• Australian Renewable Fuels Limited, Chairman (resigned 28 August 2014)
• Downer EDI Limited, Director
• Water Polo Australia Limited, President
• Biofuel Producers Limited Scheme, Director (resigned 28 August 2014)
• Charter Hall Limited, Director
• Charter Hall Funds Management Limited, Director
• Tellus Holdings Limited, Chairman
Laura ReedBBus, MBA, FCPA
Non-Executive Director
Term: 1 January 2013 to 31 December 2015
Member, Audit and Risk Committee
Member, Nominations Committee
Other Directorships:
• Ausgrid, Director
• Essential Energy, Director
• ATCO Australia Pty Limited, Director
• ATCO Gas Australia GP Pty Limited, Director
• Canadian Utilities Limited (an ATCO company), Director
• MAPS Group, Director
Patrick Strange PhD BE (Hons)
Non-Executive Director
Term: 25 November 2013 to 24 November 2016
Member, Safety, Human Resources and Environment Committee
Other Directorships:
• Ausgrid, Director
• Essential Energy, Director
• WorkSafe NZ, Director
• Transpower NZ Ltd, CEO until 31 January 2014
• Mighty River Power, Director
Vince Graham BE (Civil), Grad Dip Mgmt, FAICD
Chief Executive Officer and Executive Director
Ex-officio member Audit and Risk Committee and Safety, Human Resources and Environment Committee
Other Directorships:
• Ausgrid, CEO & Executive Director
• Essential Energy, CEO & Executive Director
• Networks NSW Pty Limited, Chairman
• Energy Supply Association of Australia, Director
• Mamre Plains Limited, Chairman
• Graham Management Services Pty Limited, Director

34
7
Board and Board Committee meetings held in 2013–141 July 2013 to 30 June 2014 Directors’ Attendance Schedule
MEETINGSHELD
BOARD OF DIRECTORS
AUDIT & RISK COMMITTEE
SAFETY, HUMAN RESOURCES &
ENVIRONMENT NOMINATIONSA B A B A B A B
R Massy-Greene 13 13 9 8 4 4 5 5
P Dodd 13 13 9 9 – – 5 5
P Garling 13 13 – – 4 4 – 3#
L Reed 13 13 9 8 – – 5 5
P Strange 7 7 – – 2 2 – 2#
D Eilert 1 1 – – – – – –
V Graham* 13 12 8 7 4 4 – 4#
A Indicates number of meetings held during the period the Director was entitled to attend
B Indicates the number of meetings attended by the Director during the period
* The CEO is an ex-officio member of the Audit & Risk and Safety, Human Resources and Environment Committees. The ARC held one meeting for non-executive directors only. The CEO was on leave for one Board meeting and one Audit and Risk Committee where the acting CEO attended on his behalf.
# Attended meetings while not a member of the Committee
The role and responsibilities of the joint boardThe joint board is responsible for governance and, ultimately, the performance of the company. It gives direction and exercises judgment in setting the company’s strategy and objectives, and is responsible for overseeing its implementation. The joint board’s role is to govern the company rather than to manage it. The CEO is responsible to the joint board for the day-to-day management of the company and leads the Executive Leadership Group in delivering the approved strategy and achieving the performance targets set by the joint board.
In governing the company the directors must act in its best interests, subject to the requirement for the joint board to act in the best interests of the three companies as a combined entity (as if the individual businesses were being operated as parts of a single enterprise) even if acting in that way is not in the best interests of one company.
The joint board operates at all times in accordance with its Charter which is designed to provide an overarching statement of authority and accountability for governance and management of Endeavour Energy, consistent with the Constitution of Endeavour Energy, applicable
legislation and Government policy. The joint board has adopted board policies that implement the Board Charter and has declared that it will be bound by the company’s Code of Conduct.
Joint board committeesThe role of the joint board is to provide strategic guidance and effective oversight of management. In undertaking this role, the joint board has established the following committees:
Audit and RiskThe Audit and Risk Committee meets at least five times per year. The committee’s responsibilities cover matters relating to financial affairs and business risks, internal and external audits, risk management, compliance and fraud prevention. In addition, the committee examines any other matters referred to it by the joint board.
Safety, Human Resources and EnvironmentThe Safety, Human Resources and Environment Committee meets at least four times per year. The committee assists the board in fulfilling its responsibilities with regard to work health and safety and environmental practices, and to discharge the joint board’s responsibilities of oversight and corporate governance in relation to human resources matters.
In addition, the Committee examines any other matters referred to it by the joint board.
NominationsThe Nominations Committee meets as required and assists the joint board in fulfilling its responsibilities with regard to director appointments and reappointments. The Nominations Committee consists of the Chairman of the joint board and two non-executive directors. Membership is subject to rotation so that non-executive directors do not participate in the review of their own reappointment.
Director indemnity and insuranceUnder the State Owned Corporations Act 1989 and the Company’s Constitution, Endeavour Energy may, with the approval of its Shareholder Ministers, indemnify its Directors against certain liabilities incurred in the course of their duties. This indemnity does not cover the Director if the liability arises out of conduct involving lack of good faith. Endeavour Energy’s non-executive Directors have been granted indemnity in accordance with Shareholder approval and the NSW Treasury State Owned Corporation Indemnity Policy. Endeavour Energy also has in place a Directors’ and Officers’ liability and professional indemnity insurance policy.

35
7GOVERNANCE
Endeavour Energy Annual Performance Report 2013–14
Ethics and conductEndeavour Energy’s Code of Conduct states the corporate values and behaviours expected of employees. Supporting the Code is the Statement of Business Ethics which sets out the business principles for our dealings with suppliers. Both documents are available on our website.
A key initiative supporting our ethical culture is the Ethics Communication and Engagement Strategy developed to make our corporate values meaningful to employees in their everyday work, encourage a culture of personal accountability for behaviour and provide tools to apply in ethical dilemmas.
The strategy included the training of 166 leaders to deliver ethics awareness sessions to employees. The ethics training focused on these corporate values: safety excellence, act with integrity, customer and community focus, and respect for people.
Endeavour Energy’s Code of Conduct is available at www.endeavourenergy.com.au.
Fraud risk registerEndeavour Energy’s Fraud Risk Register is reviewed and updated by process owners throughout the year as the business environment changes. An independent review of controls identified in the Fraud Risk Register was conducted in December 2013. Key initiatives in our Fraud and Corruption Control Plan (FCCP) 2013–2015 drive the continuous update of the register. The FCCP 2013–2015 builds on past progress in developing a fraud and corruption-resistant culture and addresses new and emerging fraud and corruption risks at a time of increased economic uncertainty and industry restructure.
Conflicts of interestTo ensure their independent status, all directors of Endeavour Energy are subject to the statutory duties and prohibitions regarding conflicts of interest. We rely on the integrity of the Board of Directors to identify and disclose issues which may give rise to any conflict of interest. The Board Secretary maintains the Register of Disclosures which is reviewed, as a minimum, every six months to ensure the information held by the organisation is up to date.
Insurance Endeavour Energy reviews the adequacy of insurance policy coverage and limits during each annual insurance renewal process. All participating insurers must meet acceptable security requirements.
ComplianceOur Compliance Management Plan 2013–15 is structured around the four key focus areas of commitment, implementation, monitoring and measurement and continual improvement from Australian Standard AS 3806–2006: Compliance Programs. The plan’s status was regularly reported to the Audit and Risk Committee throughout the year.
Internal audit The Board and Executive Leadership Team are committed to the operation of an objective and independent internal audit function. Internal Audit assists management to achieve our statutory and business objectives by adopting a disciplined approach to evaluating and improving risk management, controls and governance processes. During the year we completed 34 internal audits across the organisation, with suitable actions put in place to address the issues identified.
External auditThe Auditor-General of New South Wales provides independent external audit services through the Audit Office of New South Wales. It does not provide other services to Endeavour Energy. The Audit and Risk Committee reviews the NSW Audit Office Client Service Plan, issues raised in the Annual Management Letter and the results of the annual audit of financial statements.
Endeavour Energy’s Executive Leadership Team Rod Howard PSMBE (Hons), MEngSc, BBus, MBA, GAICD
Chief Operating Officer
Jim Battersby BE (Elec), GradDipMgmt
Chief Engineer
Ty ChristopherBE (Hons) MBA (Dist) FIEAust CPEng Ad Dip Proj Mgt
General Manager Network Development
Michael GhattasBBus, CPA
General Manager Finance and Compliance
David NevilleBA (Communication Studies), MA (Organisational Communication), MBA
General Manager Health, Safety & Environment
Ian RobinsonBE (Elec)
General Manager Information Communications and Technology
Bruce RowleyBBus, AssDipLG
General Manager People & Services
Scott RyanBE (Elec) MBA
General Manager Network Operations

36
PerformanceEndeavour Energy is required to submit a Statement of Corporate Intent (SCI) to NSW Treasury. The SCI is an agreement with the NSW Government which documents the objectives, strategies and obligations by which the organisation is expected to operate. The SCI sets financial targets and clear limits on the scope of activities the organisation may undertake.
In 2013–14 Endeavour Energy maintained strong performance, achieved through continued focus on business fundamentals, financial discipline and corporate governance.
Profit resultsOur profit after tax result was $301.0 million, $33.9 million above the 2013–14 SCI target of $267.1 million. The higher than expected profit result was primarily due to:
• lower operating expenditure with the benefits of savings from targeted programs and decreases to employee entitlements resulting from actuarial assessment outcomes
• higher other income including capital contributions
• lower borrowing costs resulting from reduced borrowings (in line with reduced capital expenditure purchases) and lower funding costs
• lower income tax expense driven by a change in the tax treatment of income derived from unread meters
• partly offset by a lower Network Gross Margin driven by lower energy consumption
• higher depreciation and amortisation driven by a higher asset base.
Balance sheetEndeavour Energy’s total assets increased by $512.1 million compared to the prior year. The major contributing factor was an increase in property, plant and equipment in the amount of $470.7 million resulting from increased capital expenditure.
Return on assets, calculated as EBIT divided by the average asset base, decreased from 10.1% in 2012–13 to 8.7% at 30 June 2014 with a 7.2% decrease in EBIT combined with a 8.0% increase in average assets.
Total liabilities increased by $378.0 million compared to previous year driven by an increase in borrowings (inclusive of discounts/premiums) of $409.3 million, primarily due to the need to fund the capital expenditure program, partly offset by decreases in provisions totalling $46.8 million driven by EISS defined benefit superannuation and employee entitlement actuarial assessment outcomes, and reduced dividends.
Return on equity, calculated as profit after tax divided by average equity, was 18.2% at 30 June 2014. This result decreased from the 2012–13 outcomes of 1.5 percentage points, with a 0.7% increase in profit after tax compared to an increase of 8.9% in average equity.
FINANCIAL RESULTS2012/13 RESULT
2013/14 SCI
2013/14 RESULT
VARIATION TO SCI
Earnings before interest, tax, depreciation & amortisation (EBITDA) ($m) 802.6 779.4 770.1 (9.3)
Earnings before interest and tax (EBIT) ($m) 625.8 589.6 580.8 (8.8)
Operating profit before tax ($m) 427.1 381.6 378.0 (3.6)
Operating profit after tax ($m) 298.9 267.1 301.0 33.9
Dividend ($m) 209.5 187.0 178.1 (8.9)
Total Distribution (Dividend + Income Tax Expense) ($m) 337.7 301.4 255.1 (46.3)
Return on assets (%) 10.1 8.8 8.7 (0.1)
Return on equity (%) 19.7 16.8 18.2 1.4
Capital Expenditure ($m) 577.7 569.5 531.5 (38.0)
8MANAGEMENT DISCUSSION & ANALYSIS
Note that prior year results may have changed in line with amendments to comparative financial statement disclosures.

37
8MANAGEMENT DISCUSSION AND ANALYSIS
Endeavour Energy Annual Performance Report 2013–14
Cash flowsCash and cash equivalents at the end of the financial year decreased by $1.6 million compared to the prior year. Net cash flows provided by operating activities for the year were $327.3 million, a decrease of $80.5 million compared to 2012–13.
Net cash flows used in investing activities for the year were $521.0 million compared to $569.1 million in the prior year, driven by lower capital expenditure payments.
Net cash flows from financing activities for the year were $192.1 million compared to $162.8 million in the prior year. Proceeds from borrowings were higher than the previous year due to lower cash from operating activities and a higher dividend payment, partly offset by lower capital expenditure payments.
DebtBalance sheet debt increased by $409.3 million compared to the prior year, primarily due to the requirement to fund the capital expenditure program. The gearing ratio, calculated as debt divided by debt plus equity, increased marginally from 67.9% at 30 June 2013 to 68.7% at 30 June 2014. This result was driven by a slightly lower percentage increase in debt plus equity compared to the percentage increase in debt.
Shareholder returnThe directors declared a final dividend of $178.1 million, which was based on the NSW Government’s dividend cap policy for the distribution and transmission sector of the State Owned Corporations and negotiations between NSW Treasury on behalf of the shareholders and Endeavour Energy prior to 30 June 2014. The dividend was approved by the shareholding Ministers before 30 June 2014, and was calculated based on forecast profit adjusted for certain non-cash items, in accordance with NSW Treasury Policy TPP14–04 Financial Distribution Policy for Government Businesses. The dividend represents an $8.9 million or 4.8% decrease compared to the 2013–14 SCI target.
Capital expenditureCapital expenditure for the 2013–14 financial year was $531.5 million, $38.0 million below the 2013–14 SCI target and $46.2 million less than the prior year. The capital program continues to target asset renewals as well as growth-related projects, with 93% of target program milestones being delivered for 2013–14.
The capital program is underpinned by Endeavour Energy’s Strategic Asset Management Plan (SAMP). The SAMP is updated annually and reflects plans and strategies which are aligned to customer and technical drivers, improve long-term network asset values and produce optimal returns to shareholders. The plan sets priorities and summarises the investment in the network required to maintain ongoing network capability, consistent with a ‘best in class’ network asset manager.

38
FINANCIAL STATEMENTS
9INDEPENDENT AUDITOR’S REPORT 39
STATEMENT OF COMPREHENSIVE INCOME 40
STATEMENT OF FINANCIAL POSITION 41
STATEMENT OF CHANGES IN EQUITY 42
STATEMENT OF CASH FLOWS 43
NOTES TO THE FINANCIAL STATEMENTS 44
1 Significant Accounting Policies 44
(a) Reporting entity 44
(b) Statement of compliance 44
(c) Basis of preparation 44
(d) Fair value measurement 44
(e) Use of estimates and judgements 44
(f) Income tax 45
(g) Revenue recognition 45
(h) Cash and cash equivalents 45
(i) Trade and other receivables 46
(j) Inventories 46
(k) Assets classified as held for sale 46
(l) Property, plant and equipment 46
(m) Intangible assets 47
(n) Impairment 47
(o) Trade and other payables 48
(p) Loans and borrowings 48
(q) Financial instruments 48
(r) Employee benefits 49
(s) Superannuation 50
(t) Termination benefits 50
(u) Changes in accounting policy 50
(v) Provisions 51
(w) Other liabilities 51
(x) Share capital 51
(y) Reserves 51
(z) Finance costs 52
(aa) Leases 52
(bb) Greenhouse legislation 52
(cc) Goods and services tax 52
(dd) Foreign currency 52
(ee) New and revised accounting standards and Australian Accounting Interpretations 53
2 Revenue 53
3 Expenses 54
4 Income tax expense 55
5 Deferred tax assets/liabilities 56
6 Cash and cash equivalents 57
7 Trade and other receivables 57
8 Derivative financial instruments 58
9 Property, plant and equipment 59
10 Intangible assets 61
11 Trade and other payables 62
12 Borrowings 62
13 Provisions 62
14 Other liabilities 63
15 Financial instruments 64
16 Fair value measurements 68
17 Key management personnel 72
18 Related parties transactions 72
19 Remuneration of auditor 73
20 Contingent liabilities and contingent assets 74
21 Commitments 74
22 Operating leases 75
23 Reconciliation of cash flows from operating activities 76
24 Superannuation – Defined benefits plan 76
25 Events subsequent to balance date 82
STATEMENT BY DIRECTORS 83
FOR THE YEAR ENDED 30 JUNE 2014

39Endeavour Energy Annual Performance Report 2013–14
FINANCIAL STATEMENTS 9INDEPENDENT AUDITOR’S REPORT TO THE MEMBERS OF ENDEAVOUR ENERGYFOR THE YEAR ENDED 30 JUNE 2014

40
9STATEMENT OF COMPREHENSIVE INCOMEFOR THE YEAR ENDED 30 JUNE 2014
Note 2014
$m2013
$m
Profit and loss
Revenue 2 1,497.6 1,492.8
Expenses excluding finance costs 3(a) (916.8) (867.0)
Finance costs 3(b) (202.8) (198.7)
Profit before income tax 378.0 427.1
Income tax expense 4 (77.0) (128.2)
Profit for the year 301.0 298.9
Other comprehensive income
Items that will not be reclassified subsequently to profit or loss
Superannuation defined benefits remeasurements 24(f) 16.8 48.6
Revaluation of land and buildings 9 – 16.1
Income tax relating to items that will not be reclassified 4 (5.0) (19.3)
11.8 45.4
Items that will be reclassified subsequently to profit or loss
Effective portion of changes in the fair value of cash flow hedges (1.0) 1.0
Income tax relating to items that will be reclassified 4 0.3 (0.3)
(0.7) 0.7
Total other comprehensive income for the year, net of tax 11.1 46.1
Total comprehensive income for the year 312.1 345.0
The above Statement of Comprehensive Income should be read in conjunction with the accompanying notes

41Endeavour Energy Annual Performance Report 2013–14
FINANCIAL STATEMENTS 9
Note 2014
$m2013
$m
ASSETS
Current assets
Cash and cash equivalents 6 – 0.4
Trade and other receivables 7 270.8 240.1
Inventories 30.2 26.6
Derivative financial instruments 8,15 0.3 0.6
Current tax receivable 12.1 –
313.4 267.7
Assets classified as held for sale 4.8 4.8
Total current assets 318.2 272.5
Non-current assets
Derivative financial instruments 8,15 – 0.3
Property, plant and equipment 9 6,526.5 6,055.8
Intangible assets 10 68.2 72.2
Total non-current assets 6,594.7 6,128.3
Total assets 6,912.9 6,400.8
LIABILITIES
Current liabilities
Bank overdraft 6 1.2 –
Trade and other payables 11 246.7 201.2
Borrowings 12 376.3 513.5
Derivative financial instruments 8,15 1.7 0.4
Current tax liabilities – 47.1
Provisions 13 364.7 386.5
Other current liabilities 14 13.6 11.9
Total current liabilities 1,004.2 1,160.6
Non-current liabilities
Borrowings 12 3,391.4 2,844.9
Deferred tax liabilities 5 605.8 592.3
Provisions 13 186.7 211.7
Derivative financial instruments 8,15 4.5 5.1
Total non-current liabilities 4,188.4 3,654.0
Total liabilities 5,192.6 4,814.6
Net assets 1,720.3 1,586.2
EQUITY
Contributed equity 335.0 335.0
Reserves 927.4 928.3
Retained earnings 457.9 322.9
Total equity 1,720.3 1,586.2
The above Statement of Financial Position should be read in conjunction with the accompanying notes
STATEMENT OF FINANCIAL POSITIONAS AT 30 JUNE 2014

42
9STATEMENT OF CHANGES IN EQUITYFOR THE YEAR ENDED 30 JUNE 2014
Note
Contributed Equity
$m
Asset Revaluation
Reserve $m
Hedge Revaluation
Reserve $m
Retained Earnings
$mTotal
$m
Balance at 1 July 2012 335.0 920.9 (4.3) 199.1 1,450.7
Profit for the year – – – 298.9 298.9
Other comprehensive income
Superannuation defined benefits remeasurements 24(f) – – – 34.1 34.1
Revaluation of land and buildings 9 – 11.3 – – 11.3
Effective portion of changes in fair value of cash flow hedges – – 0.7 – 0.7
Total other comprehensive income – 11.3 0.7 34.1 46.1
Transactions with owners recorded directly in equity
Dividends provided for or paid – – – (209.5) (209.5)
Transfers to retained earnings, net of tax – (0.3) – 0.3 –
Total transactions with owners – (0.3) – (209.2) (209.5)
Balance at 30 June 2013 335.0 931.9 (3.6) 322.9 1,586.2
Profit for the year – – – 301.0 301.0
Other comprehensive income
Superannuation defined benefits remeasurements 24(f) – – – 11.8 11.8
Effective portion of changes in fair value of cash flow hedges – – (0.6) – (0.6)
Total other comprehensive income – – (0.6) 11.8 11.2
Transactions with owners recorded directly in equity
Dividends provided for or paid – – – (178.1) (178.1)
Transfers to retained earnings, net of tax – (0.3) – 0.3 –
Total transactions with owners – (0.3) – (177.8) (178.1)
Balance at 30 June 2014 335.0 931.6 (4.2) 457.9 1,720.3
The above Statement of Changes in Equity should be read in conjunction with the accompanying notes

43Endeavour Energy Annual Performance Report 2013–14
FINANCIAL STATEMENTS 9STATEMENT OF CASH FLOWSFOR THE YEAR ENDED 30 JUNE 2014
Note 2014
$m2013
$m
Cash flows from operating activities:
Receipts from customers 1,622.5 1,601.9
Payments to suppliers and employees (931.6) (880.5)
Interest received 0.1 0.2
Interest paid (236.4) (212.4)
Income taxes paid (127.3) (101.4)
Net cash inflow from operating activities 23 327.3 407.8
Cash flows from investing activities:
Proceeds from sale of property, plant and equipment 3.5 10.7
Payments for property, plant and equipment and intangible assets (524.5) (579.8)
Net cash outflow from investing activities (521.0) (569.1)
Cash flows from financing activities:
Proceeds from borrowings 401.6 349.4
Dividends paid (209.5) (186.6)
Net cash inflow from financing activities 192.1 162.8
Net increase (decrease) in cash and cash equivalents (1.6) 1.5
Cash and cash equivalents at the beginning of the year 0.4 (1.1)
Cash and cash equivalents at the end of the year 6 (1.2) 0.4
The above Statement of Cash Flows should be read in conjunction with the accompanying notes

44
NOTES TO THE FINANCIAL STATEMENTSFOR THE YEAR ENDED 30 JUNE 2014
9
1 Significant Accounting Policies
(a) Reporting entityEndeavour Energy is a New South Wales statutory State Owned Corporation (for-profit) established under the Energy Services Corporations Act 1995. The financial statements of the Corporation for the year ended 30 June 2014 comprises the Corporation only.
The financial statements were authorised for issue by the Directors on 10 September 2014.
(b) Statement of complianceThe financial statements comprise a general purpose financial report which has been prepared in accordance with Australian Accounting Standards (AASBs) (including the Australian Accounting Interpretations) adopted by the Australian Accounting Standards Board, the requirements of the Public Finance and Audit Act 1983, the Public Finance and Audit Regulation 2010, and the State Owned Corporations Act 1989. The financial statements of the Corporation also comply with International Financial Reporting Standards (IFRSs) and interpretations adopted by the International Accounting Standards Board.
(c) Basis of preparation
(i) Basis of measurementThe financial statements are prepared on the historical cost basis except that the following assets and liabilities are stated at their fair value: derivative financial instruments, provisions, assets classified as held for sale, and property, plant and equipment.
(ii) Comparative figuresWhen the presentation or classification of items in the financial statements is amended in respect of changes in the current year, comparative amounts are reclassified to enhance comparability unless the reclassification is impracticable. Refer note 1(u) for restated comparative amounts.
(iii) Presentation currencyThe financial statements are presented in Australian dollars. The amounts shown in the accounts have been rounded to the nearest tenth of a million dollars, unless otherwise stated. The Corporation is exempt from Part 2 paragraph 5 of the Public Finance and Audit Regulation 2010.
(d) Fair value measurementThe Corporation measures financial instruments such as derivative financial instruments, provisions and items of property, plant and equipment, at fair value each balance sheet date. Fair values of financial instruments measured at amortised cost are disclosed in Note 16.
Fair value is the price that would be received to sell an asset or paid to transfer a liability in an orderly transaction between market participants at the measurement date. The fair value measurement is based on the presumption that the transaction to sell the asset or transfer the liability takes place either in the principal market for the asset or liability, or, in the absence of a principal market, in the most advantageous market for the asset or liability. The principal or most advantageous market must be accessible by the Corporation.
The fair value of an asset or liability is measured using assumptions that market participants would use when pricing an asset or liability, assuming that market participants act in their economic best interest. Fair value measurement of a non-financial asset takes into account a market participant’s ability to generate economic benefits by using the asset in its highest and best use, or by selling it to another market participant that would use the asset in its highest and best use.
The Corporation uses valuation techniques that are appropriate in the circumstances and for which sufficient data is available to measure fair value, maximising the use of relevant observable inputs and minimising the use of unobservable inputs.
All asset and liabilities for which fair value is measured or disclosed in the financial statements are categorised within the fair value hierarchy, described as follows, based on the lowest level input that is significant to the fair value measurement as a whole:
• Level 1 – Quoted (unadjusted) market prices in active markets for identical assets or liabilities
• Level 2 – Valuation techniques for which the lowest level input that is significant to the fair value measurement is directly or indirectly observable
• Level 3 – Valuation techniques for which the lowest level input that is significant to the fair value measurement is unobservable.
For assets and liabilities that are recognised in the financial statements on a recurring basis, the Corporation determines whether transfers have occurred between levels in the hierarchy by re-assessing categorisation (based on the lowest level input that is significant to the fair value measurement as a whole) at the end of each reporting period.
(e) Use of estimates and judgements
The preparation of financial statements require management to make judgements, estimates and assumptions that affect the application of policies and reported amounts of assets and liabilities, income and expenses. The estimates and associated assumptions are based on historical experience and various other factors that are believed to be reasonable under the circumstances, the results of which form the basis of making the judgements about carrying values of assets and liabilities that are not readily apparent from other sources. Actual results may differ from these estimates. These accounting policies have been applied consistently by the Corporation.
Estimates and underlying assumptions are reviewed on an ongoing basis. Revisions to accounting estimates are recognised in the period in which the estimate is revised if the revision affects only that period, or in the period of the revision and future periods if the revision affects both current and future periods.

45Endeavour Energy Annual Performance Report 2013–14
FINANCIAL STATEMENTS 9
1 Significant Accounting Policies continued
Judgements made by management in the application of AASBs that have significant effect on the financial statements and estimates with a significant risk of material adjustment in the next year are included in the following notes:
Note 1(g)(iv) – Unread meters
Note 5 – Deferred tax assets/liabilities
Note 1(l)(i), 9 – Property, plant and equipment
Note 13 – Provisions
Note 15 – Financial instruments
Note 16 – Fair value measurements
Note 20 – Contingent liabilities and contingent assets
Note 24(i) – Superannuation Defined benefits plan – Significant actuarial assumptions at reporting date
In relation to employee benefit provisions, an expected 3.5% salary increase rate has been assumed for the purposes of defined benefit superannuation actuarial valuations. The NSW Government Wages Policy requires that any salary increase above 2.5% be offset by appropriate productivity savings made by the Corporation.
(f) Income taxEndeavour Energy is exempt from federal income tax under the Income Tax Assessment Acts. However, Endeavour Energy is subject to the National Tax Equivalent Regime which is based on the Income Tax Assessment Acts. Tax equivalents are payable to the Office of State Revenue.
Income tax on the profit or loss for the year comprises current and deferred tax. Income tax is recognised in the profit or loss except to the extent that it relates to items recognised directly in equity.
Current tax is the expected tax payable on the taxable income for the year, using tax rates enacted or substantively enacted at the statement of financial position date, and any adjustment to tax payable in respect of previous years.
Deferred tax is provided using the statement of financial position liability method, providing for temporary differences between the carrying amounts of assets and liabilities for financial reporting purposes and the amounts used for taxation purposes. The following temporary differences are not provided for: initial recognition of goodwill and initial recognition of assets or liabilities that affect neither accounting nor taxable profit. The amount of deferred tax provided is based on the expected manner of realisation or settlement of the carrying amount of assets and liabilities, using tax rates enacted or substantively enacted at the statement of financial position date.
A deferred tax asset is recognised only to the extent that it is probable that future taxable profits will be available against which the asset can be utilised. Deferred tax assets are reduced to the extent that it is no longer probable that the related tax benefit will be realised.
Additional income taxes that arise from the distribution of dividends and other payments are recognised at the same time as the liability to pay the related dividend or payment.
(g) Revenue recognitionRevenue is recognised when the significant risks and rewards of ownership have been transferred to the buyer, the amount of revenue can be reliably measured, and it is probable that the future economic benefits will flow to the entity.
(i) Network use of system revenueEndeavour Energy recognises revenue involving the rendering of electricity supply services in profit and loss when the goods are provided or when the fee in respect of services provided is receivable. Network use of system income is recognised on an accrual basis as revenue is accrued for consumption which is not invoiced at month end. No revenue is recognised if there are significant uncertainties regarding recovery of the consideration due, or if the costs incurred or to be incurred can not be measured reliably.
(ii) Rental incomeRental income from properties leased under property leases is recognised in profit or loss on a straight line basis over the term of the lease. Lease incentives granted are recognised as an integral part of the total rental income.
(iii) Contributions for capital worksThis represents cash and non-cash capital contributed by customers and developers, mainly towards the capital cost of electricity connections. Cash and non-cash capital contributions have been reported in order to comply with Australian Accounting Interpretation 18 Transfers of Assets from Customers.
Contributions of non-current assets are recognised as revenue and an asset when Endeavour Energy gains control of the asset. The fair value of contributed assets is recognised at the date at which control is gained.
(iv) Unread metersAt reporting date, Endeavour Energy accrues an estimate of the network use of system charges associated with electricity consumed where the meter has not been read. The accounting estimating methodology for calculating the unread revenue accrual calculates unread revenue volume where energy imports relating to basic meters are phased over the current month and future months in order to estimate the likely billing pattern relating to consumption. This calculation is accounted for as revenue from unread meters in profit or loss.
(v) Solar Bonus Rebate Scheme Recovery and other revenue
Endeavour Energy recognises solar and other revenue when the amount of revenue can be reliably measured, it is probable that future economic benefits will flow to the entity and specific criteria have been met for each of the Endeavour Energy’s activities.
(h) Cash and cash equivalentsCash and cash equivalents in the Statement of Financial Position comprise cash balances and call deposits. For the purposes of the Statement of Cash Flows, cash includes cash assets net of bank overdraft.

46
NOTES TO THE FINANCIAL STATEMENTSFOR THE YEAR ENDED 30 JUNE 2014
9
1 Significant Accounting Policies continued
(i) Trade and other receivables
Trade and other receivables are financial assets recognised initially at fair value plus any directly attributable transaction costs and subsequently measured at amortised cost using the effective interest rate method, less any impairment losses.
Collectability of trade receivables is reviewed on an ongoing basis in accordance with AASB 139 Financial Instruments. Individual debts that are known to be uncollectible are written off when identified. An impairment provision is recognised when there is objective evidence that the entity will not be able to collect the receivables, such as evidence of financial difficulties of the debtor, and default payments.
(j) InventoriesInventories are stated at the lower of cost and net realisable value. Cost is determined using the average purchase price of each item. In the case of manufactured stock for internal use, costs include direct labour, materials and a portion of variable overhead which comprises the cost of bringing the inventories to their appropriate location and condition. Net realisable value is the estimated selling price in the ordinary course of business, less the estimated costs of completion and selling expenses.
(k) Assets classified as held for sale
Non current assets and disposal groups are classified as held for sale and measured at the lower of their carrying amount and fair value less costs to sell, if their carrying amount will be recovered principally through a sale transaction as opposed to use. Once classified as held for sale, depreciation and amortisation ceases. For an asset or disposal group to be classified as held for sale, it must be available for immediate sale in its present condition and its sale must be highly probable.
Non-current assets held for sale for Endeavour Energy relate to non-infrastructure land & buildings surplus to requirements.
(l) Property, plant and equipment
(i) Recognition and measurementItems of property, plant and equipment are initially recognised at cost. Cost includes expenditure that is directly attributable to the acquisition and or construction of the asset including costs of materials, services, direct labour and an appropriate proportion of overheads.
Management judgement is required in the assessment of the types of costs that are directly attributable to the construction of property, plant and equipment. Satisfying the directly attributable criteria requires an assessment of those unavoidable costs that, if not incurred, would result in the property, plant and equipment not being constructed. Directly attributable overheads are allocated to the cost of construction of an asset using direct labour dollars.
Property, plant and equipment transferred from customers is initially measured at fair value at the date on which control is obtained in accordance with Interpretation 18 Transfer of Assets from Customers, AASB 13 Fair Value Measurement and AASB 116 Property, Plant and Equipment.
After initial recognition as an asset, items of property, plant and equipment are measured at fair value. Fair value is determined in accordance with NSW Treasury Accounting Policy TPP 14-01 Valuation of Physical Non-Current Assets at Fair Value, AASB 13 Fair Value Measurement and AASB 116 Property, Plant and Equipment, and reviewed annually for impairment in accordance with AASB 136 Impairment of Assets.
System assets
System assets are stated at fair value less accumulated depreciation and impairment losses. The fair value of system assets is determined using the income approach in accordance with AASB 13 Fair Value Measurement. The valuation methodology reflects a discounted cash flow methodology to value assets, and a calculation to subtract the value of other business assets and liabilities to arrive at a value for system assets.
The income approach is based on a discounted cash flow model using the following methods and assumptions:
• Use of an estimate of future cash flows to be derived based on financial forecasts;
• Expectations about possible variations in the amount/timing of future cash flows to reflect the most likely outcome;
• The time value of money, represented by the current market risk-free rate and the price for bearing the uncertainty inherent in the asset, as encapsulated in the discount rate;
• Other factors such as liquidity that should be reflected in pricing future cash flows; and
• The regulated asset base (RAB) used as a proxy for the terminal value.
System assets are revalued at least every five years in accordance with TPP 14-01 Valuation of Physical Non-Current Assets at Fair Value and AASB 13 Fair Value Measurement. However, an assessment is made at each reporting date to ensure the net carrying value of system assets does not differ materially from its fair value, which is calculated on a ‘cash generating unit’ (CGU) basis using the discounted cash flow. As at 30 June 2014 the net carrying amount of system assets did not differ materially to the discounted cash flows.
The Corporation’s view is that the distribution network as a whole should be considered to be a “single asset” for the purposes of revaluation. This is because all components within the network must work together in order to reliably supply electricity. Further, due to the specialised nature of Endeavour Energy’s network, system assets cannot be readily sold to third parties for different uses.
Non-system land and buildings
Non-system land and buildings are stated at fair value.

47Endeavour Energy Annual Performance Report 2013–14
FINANCIAL STATEMENTS 9
1 Significant Accounting Policies continued
Following initial recognition at cost, non-system land and building assets are carried at fair value less accumulated depreciation and impairment losses. Non-system land and buildings are revalued at least every three years in accordance with TPP 14-01 Valuation of Physical Non-Current Assets at Fair Value. However, an assessment is made at each reporting date to ensure the net carrying value of non-system land and building assets does not differ materially from fair value. Valuations are based on market-based evidence in accordance with AASB 13 Fair Value Measurement.
Other property, plant and equipment
Other property, plant and equipment assets comprise non-specialised assets with short useful lives. These assets are stated at fair value which is equivalent to their depreciated historical costs (deemed to be fair value in accordance with NSW Treasury Accounting Policy TPP 14-01 Valuation of Physical Non-Current Assets at Fair Value as any difference is unlikely to be material).
(ii) RevaluationsRevaluation increments are credited directly to the asset revaluation reserve, except that, to the extent that an increment reverses a revaluation decrement in respect of that asset previously recognised as an expense in net profit or loss, the increment is recognised immediately as revenue in net profit or loss. Revaluation decrements are recognised immediately as expenses in net profit or loss, except that, to the extent that a credit balance exists in the asset revaluation reserve in respect of the same asset, they are debited directly to the asset revaluation reserve. Accumulated depreciation as at the revaluation date is eliminated against the gross carrying amount of the asset and the net amount is restated to the revalued amount of the asset.
Gains and losses on disposal of revalued assets are included in profit and loss for the year. Any related revaluation increments in the asset revaluation reserve upon disposal are transferred to Retained Earnings.
(iii) Capitalisation policyNon-system assets purchased below $1,000 are expensed as acquired. All costs of assets constructed by Endeavour Energy are capitalised. This includes the cost of materials, direct labour, the initial estimate, where relevant, of the costs of dismantling and removing the items and restoring the site on which they are located, a proportion of overhead allocated on the basis of labour hours, other costs directly attributable to bringing the asset to a working condition for intended use and capitalised borrowing costs in accordance with AASB 116 Property, Plant and Equipment and AASB 123 Borrowing Costs.
(iv) Subsequent costsThe Corporation recognises in the carrying amount of an item of property, plant and equipment the cost of replacing part of such an item when that cost is incurred if it is probable that the future economic benefits embodied with the item will flow to the entity and the cost of the item can be measured reliably. All other costs are recognised in profit and loss as an expense as incurred.
(v) DepreciationWhere parts of an item of property, plant and equipment have different useful lives, they are accounted for as separate components of property, plant and equipment.
Depreciation is charged to profit and loss on a straight-line basis over the estimated useful lives of each part of an item of property, plant and equipment. Land is not depreciated. The estimated useful lives in the current and comparative periods are as follows:
Years
Buildings 40
System assets 7 – 60
Plant and equipment 4 – 15
Depreciation methods, useful lives and residual values are reviewed at each reporting date and adjusted if appropriate.
(m) Intangible assetsIntangible assets that are acquired externally or internally generated by the entity are stated at cost less accumulated amortisation and impairment losses (see Note 1(n)(ii)).
Subsequent expenditure on capitalised intangible assets is capitalised only when it increases the future economic benefits embodied in the specific asset to which it relates. All other expenditure is expensed as incurred.
Easements, which are interests in land allowing access to network assets, are not amortised as they are granted for an unlimited time.
Amortisation is charged to profit and loss on a straight-line basis over the estimated useful lives of intangible assets unless such lives are indefinite. Intangible assets with an indefinite useful life are systematically tested for impairment at each statement of financial position date. Other intangible assets are amortised from the date they are available for use.
The estimated useful lives in the current and comparative periods are as follows:
Years
Computer software 4 – 9
(n) Impairment
(i) Financial assets (including receivables)
A financial asset not carried at fair value through profit or loss is assessed at each reporting date to determine whether there is objective evidence that it is impaired. A financial asset is impaired if objective evidence indicates that a loss event has occurred after the initial recognition of the asset, and that the loss event had a negative effect on the estimated future cash flows of that asset that can be estimated reliably.

48
NOTES TO THE FINANCIAL STATEMENTSFOR THE YEAR ENDED 30 JUNE 2014
9
1 Significant Accounting Policies continued
An impairment loss in respect of a financial asset measured at amortised cost is calculated as the difference between its carrying amount and the present value of the estimated future cash flows discounted at the asset’s original effective interest rate. Losses are recognised in profit or loss and reflected in an allowance account against receivables. Interest on the impaired asset continues to be recognised through the unwinding of discount. When a subsequent event causes the amount of impairment loss to decrease, the decrease in impairment loss is reversed through profit or loss to the extent that the carrying amount reversed does not exceed what the amortised cost would have been had the impairment not been recognised.
Significant receivables are individually assessed for impairment. Non-significant receivables are collectively assessed by placing them in portfolios of similar risk profiles, based on objective evidence from historical experience adjusted for any effects of economic and credit conditions existing at each balance date.
(ii) Non-financial assetsThe carrying amounts of non-financial assets, other than inventories, derivatives and deferred tax assets are reviewed at each reporting date to determine whether there is any indication of impairment. If any such indication exists, the asset’s recoverable amount is estimated.
For assets that have an indefinite useful life and intangible assets that are not yet available for use, the recoverable amount is estimated annually irrespective of any indication of impairment. The recoverable amount of an asset or cash generating unit (CGU) is the greater of their fair value less costs to sell and value in use. In assessing value in use, the estimated future cash flows are discounted to their present value using a pre-tax discount rate that reflects current market assessments of the time value of money and the risks specific to the asset. For an asset that does not generate largely independent cash inflows, the recoverable amount is determined for the CGU to which the asset belongs.
An impairment loss is recognised whenever the carrying amount of an asset or its CGU exceeds its recoverable amount. Impairment losses are recognised in profit and loss, unless an asset has previously been revalued, in which case the impairment loss is recognised as a reversal to the extent of that previous revaluation with any excess recognised through profit or loss.
Impairment losses recognised in respect of CGU are allocated first to reduce the carrying amount of goodwill (if any) allocated to CGU and then, to reduce the carrying amount of the other assets in the CGU on a pro rata basis.
An impairment loss is reversed if there has been a change in the estimates used to determine the recoverable amount. An impairment loss is reversed only to the extent that the asset’s carrying amount does not exceed the carrying amount that would have been determined, net of depreciation and amortisation, if no impairment loss has been recognised for the asset in prior years.
(o) Trade and other payablesTrade and other payables represent liabilities for goods and services provided to Endeavour Energy prior to the end of the financial year where there is an obligation to make future payment. The amounts are unsecured and usually paid within 30 days of recognition.
Subsequent to initial recognition of these liabilities at fair value, they are measured at amortised cost using the effective interest rate method. This measurement is equivalent to the original invoice amount.
(p) Loans and borrowings Loans and borrowings are initially recognised at fair value, net of transaction costs incurred. After initial recognition, borrowings are subsequently measured at amortised cost using the effective interest method. This includes capital indexed bonds whose carrying amount is restated at each reporting date by way of an indexation adjustment based on the Consumer Price Index (CPI) in Australia.
Amortised cost is calculated by taking into account any issue costs, and any discount or premium on settlement. The difference between the face value and the capital value of these debt securities is amortised over the life of the specific instrument. Interest associated with these instruments is brought to account on an accrual basis. Indexation adjustments on CPI indexed bonds are also recognised as part of finance costs in profit and loss.
Gains and losses are recognised in profit and loss when the liabilities are derecognised as well as through the amortisation process.
Loan debt shown as a current liability is nominally due for repayment within twelve months. However due to the availability of roll-over facilities and the liquidity of the underlying debt instruments, Endeavour Energy may not necessarily need to repay these loans within twelve months.
(q) Financial instruments
Derivative financial instruments and hedge accounting
(i) Initial recognition and subsequent measurement
The Corporation uses derivative financial instruments, such as forward currency contracts and interest rate futures, to hedge foreign currency risks and interest rate risks respectively. Such derivative financial instruments are initially recognised at fair value on the date at which a derivative contract is entered into, and subsequently re-measured at fair value. Derivatives are carried as financial assets when the fair value is positive, and as financial liabilities when the fair value is negative.
For the purpose of hedge accounting, hedges are classified as:
• fair value hedges when hedging the exposure to changes in the fair value of a recognised asset or liability, or an unrecognised firm commitment.
• cash flow hedges when hedging the exposure to variability in cash flows that is either attributable to a particular risk associated with a recognised asset or liability, a highly probable forecast transaction, or a foreign currency risk in an unrecognised firm commitment.

49Endeavour Energy Annual Performance Report 2013–14
FINANCIAL STATEMENTS 9
1 Significant Accounting Policies continued
At the inception of a hedge relationship, the Corporation formally designates and documents the hedge relationship to which the Corporation wishes to apply hedge accounting, and the risk management objective and strategy for undertaking the hedge. The documentation includes identification of the hedging instrument, the hedged item or transaction, the nature of the risk being hedged and how the Corporation will assess the effectiveness of changes in the hedging instrument’s fair value in offsetting the exposure to changes in the hedged item’s fair value or cash flows attributable to the hedged risk. Such hedges are expected to be highly effective in offsetting the exposure to changes in the hedged items’ fair value or cash flows attributable to the hedged risk. Such hedges are assessed on an ongoing basis to determine that they actually have been highly effective throughout the financial reporting periods for which they were designated.
Hedges that meet the criteria for hedge accounting are accounted for as described below.
(ii) Fair value hedges
Changes in the fair value of derivatives that are designated and qualify as fair value hedges are recognised in profit or loss immediately, together with any changes in the fair value of the hedged asset or liability that is attributable to the hedged risk. The change in the fair value of the hedging instrument and the change in the hedged item attributable to the hedged risk are recognised in profit or loss in the line item relating to the hedged item.
Hedge accounting is discontinued when the Corporation revokes the hedging relationship, when the hedging instrument expires or is sold, terminated or exercised, or when it no longer qualifies for hedge accounting. The fair value adjustment to the carrying amount of the hedged item arising from the hedged risk is amortised to profit or loss from that date.
(iii) Cash flow hedges
The effective portion of changes in the fair value of derivatives that are designated and qualify as cash flow hedges is recognised in Other Comprehensive Income and accumulated under the heading Hedge Revaluation Reserve in equity. The gain or loss relating to the ineffective portion is recognised immediately in profit or loss, and is included in the “other gains or loss” line item.
Amounts previously recognised in profit or loss and accumulated in equity are reclassified to profit or loss in the period when the hedged item affects profit or loss, in the same line as the recognised hedged item. However, when the hedged forecast transaction results in the recognition of a non-financial asset or non-financial liability, the gains or losses previously recognised in Other Comprehensive Income and accumulated equity are transferred from equity and included in the initial measurement of the cost of the non-financial assets or non-financial liability.
Hedge accounting is discontinued when the Corporation revokes the hedging relationship, when the hedging instrument expires or is sold, terminated or exercised, or when it no longer qualifies for hedge accounting. Any gain or loss recognised in Other Comprehensive Income and accumulated in equity at that time remains in equity and is recognised when the forecast transaction is ultimately recognised in profit or loss. When a forecast transaction is no longer expected to occur, the gain or loss accumulated in equity is recognised immediately in profit or loss.
Derecognition of financial instrumentsEndeavour Energy derecognises a financial asset only when the contractual rights to the cash flows from the asset expire, or when it transfers the financial asset and substantially all the risks and rewards of ownership of the asset to another entity. If the Corporation retains substantially all the risks and rewards of ownership of a transferred financial asset, the Corporation continues to recognise the financial asset and the associated liability. Endeavour Energy
derecognises a financial liability when, and only when, Endeavour Energy’s obligation specified in the contract is discharged, cancelled or expired.
(r) Employee benefitsAll liabilities for employee benefits that are expected to be paid for services provided by employees to balance date represent present obligations that are fully provided for in the financial statements.
Liabilities for wages and salaries, annual leave, long service leave, maturing allowance and pre 93 sick leave that are expected to be settled wholly within 12 months of the reporting date represent present obligations resulting from employees’ services provided to reporting date, and are calculated at undiscounted amounts based on wage and salary rates that the entity expects to pay as at reporting date, including related on-costs such as workers compensation and payroll tax.
Liabilities for annual leave, long service leave, maturing allowance and pre 1993 sick leave not expected to be settled wholly within 12 months after the end of the period in which the employees render the related service, have been based on an actuarial assessment undertaken as at March 2014. An associated formulae has been provided for intervening periods between assessments, noting that actuarial assessments are performed, as a minimum, every three years.
The actuary has based their assessment on the following assumptions:
(a) 10 year Commonwealth Government bond rate used as the gross discount rate; and
(b) Rate of general salary increase in line with the NSW Government Wages Policy.
Liabilities for employee benefits (annual leave, long service leave, maturing allowance and pre 93 sick leave) which are not expected to be settled within twelve months are discounted at 3.5% per annum, based on 10 year Government bond rates as at 30 June 2014. All other provisions have been calculated at nominal amounts based on expected settlement rates.

50
NOTES TO THE FINANCIAL STATEMENTSFOR THE YEAR ENDED 30 JUNE 2014
9
1 Significant Accounting Policies continued
(s) Superannuation
Defined contribution planA defined contribution plan is a post employment benefit under which an entity pays fixed contributions into a separate entity and will have no legal or constructive obligation to pay further amounts. Obligations for contributions to defined contribution plans are recognised as an employee benefit expense in profit or loss in the periods during which services are rendered by employees.
Defined benefit planA defined benefit plan is a post-employment benefit plan other than a defined contribution plan. The net obligation in respect of defined benefit plans is calculated separately for each plan by estimating the amount of future benefit that employees have earned in return for their service in the current and prior periods; that benefit is discounted to determine its present value, and the fair value of any plan assets is deducted.
The discount rate is the yield at the statement of financial position date on government bonds that have maturity dates approximating to the terms of the Corporation’s obligations. The calculation is performed by a qualified actuary using the projected unit credit method.
All actuarial gains and losses arising from defined benefit plans are recognised in other comprehensive income in the year in which they occur.
Where the calculation results in a benefit to the Corporation, the recognised asset is limited to the net total of any unrecognised actuarial losses and past service costs and the present value of any future refunds from the plan or reductions in future contributions to the plan.
Past service cost is the increase in the present value of the defined benefit obligation for employee services in prior periods, resulting in the current period from the introduction of, or changes to, post-employment benefits or other long-term employee benefits. Past service costs may either be positive (where benefits are introduced or improved) or negative (where existing benefits are reduced).
Endeavour Energy has classified the defined benefits schemes wholly as a non-current liability to reflect the appropriate timing of the obligation.
(t) Termination benefitsTermination benefits are payable when employment is terminated before the normal retirement date, or when an employee accepts voluntary redundancy in exchange for these benefits. The Corporation recognises termination benefits at the earlier of the following dates: a) when the Corporation can no longer withdraw the offer of those benefits, or b) when the Corporation recognises costs for a restructuring that is within the scope of AASB 137 Provisions, Contingent Liabilities and Contingent Assets and involves the payment of termination benefits. In the case of an offer made to encourage voluntary redundancy, termination benefits are measured based on the number of employees expected to accept the offer. Benefits falling due more than 12 months after the end of the reporting period are discounted to present value.
(u) Changes in accounting policy
The adoption of revised AASB 119 Employee Benefits resulted in a change to the Corporation’s accounting policy, which significantly affected items recognised in the financial statements:
• The amount of net defined benefit expense recognised in profit or loss under the revised standard is higher than the amount that would have been recognised under pre 1 July 2013 rules, with an equal and opposite change to the amount recognised as remeasurement in Other Comprehensive Income. This is a result of the replacement of expected return on plan assets and separate interest expense with a net interest amount. The net impact on total comprehensive income is nil, with no adjustment to amounts recognised in the Statement of Financial Position resulting from this change.
• As the revised standard must be adopted retrospectively, adjustments to retirement benefit obligations have been recognised at the beginning of the earliest period presented (1 July 2012). Profit for the period and other comprehensive income in the Statement of Comprehensive Income have been restated for the comparative period. The impact of these adjustments on individual line items in the financial statements is shown below.

51Endeavour Energy Annual Performance Report 2013–14
FINANCIAL STATEMENTS 9
The revised standard also changed accounting for annual leave obligations. As the Corporation does not expect all annual leave to be taken within 12 months of the respective service being provided, annual leave obligations are now classified as long-term employee benefits. This changed the measurement of these obligations, as they are now measured on a discounted basis, however the impact of this change was immaterial since the majority of leave is still expected to be taken within a short period after the end of the year.
(v) ProvisionsA provision is recognised in the Statement of Financial Position when the Corporation has a present legal or constructive obligation as a result of a past event, and it is probable that an outflow of economic benefits will be required to settle the obligation. If the effect is material, provisions are determined by discounting the expected future cash flows at a pre-tax rate that reflects current market assessments of the time value of money and, where appropriate, the risks specific to the liability.
(w) Other liabilities
Deferred revenueDeferred revenue is recognised for customer prepayments for external, recoverable and contestable works carried out by Endeavour Energy at reporting date. The revenue is deferred pending completion of the works and services.
DepositsDeposits represent liabilities for contractors’ deposits which can be refunded at any time after the end of the financial year and unclaimed monies which are held up to 6 years before being transferred to the Office of State Revenue. The amount which can be refunded in the succeeding financial year and at any time is shown as current and the remainder of the liability as non-current.
(x) Share capital
Endeavour Energy is incorporated under the State Owned Corporations Act 1989 with issued capital of two fully paid $1 ordinary shares.
Current shareholders are the Treasurer and the Minister for Finance and Services on behalf of the NSW Government. The holders of ordinary shares are entitled to receive dividends as declared from time to time, and are entitled to one vote per share at meetings of the Corporation. The $2 share capital is included in Contributed Equity in the Statement of Financial Position.
(y) Reserves
Asset revaluation reserveThe revaluation reserve relates to fair value movements in property, plant and equipment.
Hedging reserve The hedging reserve is used to record unrealised gains or losses of effective cash flow hedges. The unrealised gains or losses of all other derivatives are recognised in profit and loss.
1 Significant Accounting Policies continuedStatement of Comprehensive Income (extract)
Current year impact Prior year restatement
2014 $m
Profit increase/
(decrease) $m
2014 as presented
$m
2013 previously
stated $m
Profit increase/
(decrease) $m
2013 restated
$m
Expenses excluding finance costs (906.4) (10.4) (916.8) (856.2) (10.8) (867.0)
Profit before income tax 388.4 (10.4) 378.0 437.9 (10.8) 427.1
Income tax expense (80.1) 3.1 (77.0) (131.4) 3.2 (128.2)
Profit for the year 308.3 (7.3) 301.0 306.5 (7.6) 298.9
Other comprehensive income
Superannuation defined benefits remeasurements 6.4 10.4 16.8 37.8 10.8 48.6
Income tax relating to items not reclassified (1.9) (3.1) (5.0) (16.1) (3.2) (19.3)
Total other comprehensive income for the year, net of tax 3.8 7.3 11.1 38.5 7.6 46.1
52
NOTES TO THE FINANCIAL STATEMENTSFOR THE YEAR ENDED 30 JUNE 2014
9
1 Significant Accounting Policies continued
(z) Finance costsFinance costs are recognised as expenses in profit and loss in the period in which they are incurred and include:
• interest expenses calculated using the effective interest method as described in AASB 139 Financial Instruments: Recognition and Measurement e.g. interest on overdrafts and short-term and long-term borrowings, including amounts paid or received on interest rate swaps, amortisation of discounts or premiums relating to borrowings, and indexation adjustments on CPI indexed bonds;
• a discount expense applied to provisions and amortised assets;
• amortisation of ancillary costs incurred in connection with the arrangement of borrowings; and
• a government loan guarantee fee assessed by NSW Treasury.
The amount excludes finance costs relating to qualifying assets, in which case they are capitalised as part of the cost of those assets in accordance with AASB 123 Borrowing Costs. Qualifying assets are assets that take a substantial period of time to get ready for their intended use. The Corporation considers this to be 12 months or more.
Capitalisation of borrowing costs is undertaken where a direct relationship can be established between the borrowings and the relevant projects giving rise to qualifying assets. Typically, these are projects whose expected total project expenditure is approximately $10 million or greater.
The amount of borrowing costs capitalised during the year was $44.4 million (2013: $31.4 million), and the capitalisation rate used to determine this amount was at a weighted average interest rate of 6.8% (2013: 7.1%).
(aa) Leases
As lesseePayments made under operating leases are recognised in profit and loss on a straight-line basis over the term of the lease. Lease incentives received are recognised in profit and loss as an integral part of the total lease expense and spread over the lease term.
Endeavour Energy has not entered into any finance leases as at reporting date. Leases in terms of which the Corporation assumes substantially all the risks and rewards of ownership are classified as finance leases.
As lessorEndeavour Energy leases out its properties, including premises, land and communications towers, under operating lease agreements at market rentals, predominantly on a fixed term basis.
Rentals received from the tenants during the year are recognised as income in profit and loss, and the costs of repairs and maintenance incurred on these properties for the year are recognised as an expense in profit and loss.
(bb) Greenhouse legislationUnder various legislation described below, the Corporation was required to surrender certificates in 2013/14 to acquit obligations as at 31 December 2013 placed on it by the various Commonwealth and New South Wales government greenhouse schemes. The obligations arise from two power purchase agreements that were not transferred as part of the electricity sales transaction on 1 March 2011. These certificates are, in turn, provided by Origin Energy under an On-Sale Agreement entered into as part of the same electricity sales transaction. For the period commencing 1 July 2013, the following schemes apply:
CommonwealthThe RET scheme, from 1 January 2011, is split into Small-scale Renewable Energy Scheme (SRES) and Large-scale Renewable Energy Target (LRET) requiring the surrender respectively of Small-scale Technology Certificates (STCs) and Large-scale Generation Certificates (LGCs). The Act also imposes an annual liability statement to the Office of the Renewable Energy
Regulator (ORER) in discharge of Endeavour Energy’s renewable energy obligations under the RET Scheme.
New South WalesThe Electricity Supply Act 1995 imposed an obligation on electricity retailers in NSW to comply with the Energy Savings Scheme. These obligations require Endeavour Energy to acquire and surrender sufficient Energy Savings certificates (ESCs), and to lodge an annual statement with the Independent Pricing and Regulatory Tribunal (IPART) in discharge of Endeavour Energy’s greenhouse gas emission reduction obligations.
(cc) Goods and services taxRevenues, expenses and assets are recognised net of the amount of Goods and Services Tax (GST), except where the amount of GST incurred is not recoverable from the taxation authority. In these circumstances, the GST is recognised as part of the cost of acquisition of the asset or as part of the expense.
Receivables and payables are stated with the amount of GST included. The net amount of GST recoverable from, or payable to, the taxation authority is included as a current asset or liability in the Statement of Financial Position.
Cash flows are included in the Statement of Cash Flows on a gross basis. The GST components of cash flows arising from investing and financing activities which are recoverable from, or payable to, the taxation authority are classified as operating cash flows.
(dd) Foreign currency Foreign currency transactions are converted to Australian currency at the exchange rates at the date of the transaction, with resulting exchange differences recognised as income or expense in profit and loss.
At each year end, monetary items denominated in foreign currencies are translated at the rates prevailing at year end, with resulting exchange differences classified as equity and transferred to the foreign currency translation reserve.

53Endeavour Energy Annual Performance Report 2013–14
FINANCIAL STATEMENTS 9
1 Significant Accounting Policies continued
(ee) New and revised accounting standards and Australian Accounting Interpretations
Accounting standards and Interpretations issued but not yet effectiveVarious new and revised accounting standards and Australian Accounting Interpretations have been published that are not mandatory for the 30 June 2014 reporting period.
The Corporation’s assessment of new standards and interpretations which may have an impact but have not been early adopted, is set out below. The main impact of these standards and interpretations will be on presentation and disclosure, with the exception of AASB 9 Financial Instruments which reflects the first phase of the IASB’s work on the replacement of AASB 139 Financial Instruments: Recognition and
Measurement and applies to both the classification and measurement of financial assets and financial liabilities. The standard was initially to be effective for annual periods beginning on or after 1 July 2013, however Amendments to AASB 9 Mandatory Effective Date of AASB 9 and Transition Disclosures moved the mandatory effective date to 1 January 2018. In subsequent phases, the IASB will be addressing hedge accounting and impairment of financial assets. Adoption of the first phase of AASB 9 will have an impact on the classification and measurement of the Corporation’s financial assets, but will not have an impact on classification and measurement of the Corporation’s financial liabilities. The Corporation will quantify impacts in conjunction with other phases, when the final standard including all phases is issued.
• AASB 9 Financial Instruments, AASB 2010-7 Amendments to Australian Accounting Standards arising from AASB 9 (December 2010) [AASBs 1, 3, 4, 5, 7, 101, 102, 108, 112, 118, 120, 121, 127, 128, 131, 132, 136, 137, 139, 1023 & 1038 and
Interpretations 2, 5, 10, 12, 19 & 127] and AASB 2012-6 Amendments to Australian Accounting Standards – Mandatory Effective Date of AASB 9 and Transition Disclosures [AASB 9, AASB 2010-7].
• AASB 9 (Revised), AASB 2010-7 and AASB 2012-6 are applicable to annual reporting periods beginning on or after 1 January 2018. Endeavour Energy has not elected to adopt this standard early. The Corporation will apply these standards in the 2018/19 financial statements.
• AASB 2012-3 is applicable to annual reporting periods beginning on or after 1 July 2014. Endeavour Energy has not elected to adopt this standard early. The Corporation will apply this standard in the period determined by the Australian Accounting Standards Board.
All other new standards and interpretations have no impact on Endeavour Energy and will not affect the Corporation’s financial statements.
2 Revenue
2014 $m
2013 $m
Revenue
Network use of system income 1,274.4 1,299.2
Capital contributions 91.9 74.7
Solar Bonus Rebate Scheme Recovery* 54.4 25.6
Gain on disposal of assets – 0.8
Other income** 76.9 92.5
Total operating revenue 1,497.6 1,492.8
* Solar bonus scheme provides a feed-in tariff payment to households for small-scale solar system generation for a period to December 2016. Endeavour Energy is reimbursed the amount paid to households under the NSW Government’s Solar Bonus Scheme Reimbursement Program (SBSRP) when conditions of the scheme are met.
** Other income consists of streetlighting income, transformer workshop sales, Accredited Service Provider (ASP) related fees, contestable metering income, pole rental income, other regulated fees, sale of scrap and Nightwatch income.

54
NOTES TO THE FINANCIAL STATEMENTSFOR THE YEAR ENDED 30 JUNE 2014
9
3 Expenses
(a) Expenses excluding finance costs
Note 2014
$m2013
$m
Expenses relating to operating activities
Distribution of energy and other services 466.5 434.1
Employee benefits expense 209.5 205.7
Bad debts and impairment of trade receivables 0.3 (1.1)
Operating lease rentals 5.6 4.7
External consultants 0.4 0.5
Superannuation expense (defined benefit plan) recognised in profit for the year 24(f) 14.3 16.6
Superannuation expense (defined contribution plan) 29.6 29.7
Loss on disposal of assets 1.3 –
Total expenses relating to operating activities 727.5 690.2
Depreciation of property, plant and equipment 9 181.6 167.7
Plant and equipment depreciation capitalised* (7.5) (7.6)
Depreciation expense 174.1 160.1
Amortisation of intangible assets 10 15.2 16.7
Total expenses excluding finance costs 916.8 867.0
* Depreciation of heavy vehicles and related plant and equipment used in the construction and maintenance of network assets is allocated to the cost of projects. Costs allocated to capital projects are recognised in profit and loss as depreciation of constructed network assets.
(b) Finance costs
2014 $m
2013 $m
Interest and finance charges paid/payable 202.8 198.7
Finance costs recognised in profit and loss 202.8 198.7
(c) Maintenance expenses
2014 $m
2013 $m
Employee benefits expense 64.4 65.0
Contracted labour and other (non-employee related) expenses 69.3 56.0
Total maintenance expenses 133.7 121.0

55Endeavour Energy Annual Performance Report 2013–14
FINANCIAL STATEMENTS 9
4 Income tax expense
(a) Income tax expense recognised in profit and loss
2014 $m
2013 $m
Current tax expense
Current year 68.3 94.0
Adjustments for prior years – (0.3)
68.3 93.7
Deferred tax expense
Origination and reversal of temporary differences 8.7 34.2
Under/(over) provided in prior years – 0.3
8.7 34.5
Total income tax expense in profit and loss 77.0 128.2
(b) Numerical reconciliation between tax expense and pre-tax net profit
2014 $m
2013 $m
Profit before tax 378.0 427.1
Income tax using the domestic corporation tax rate of 30% (2013: 30%) 113.5 128.2
Increase (decrease) in income tax expense due to:
Non-deductible expenses – 0.1
Change in tax treatment of accrued unread meters (note 5) (36.5) –
Under/(over) provided in prior years – (0.1)
Income tax expense on pre-tax net profit 77.0 128.2
(c) Income tax recognised in Other Comprehensive Income
2014 $m
2013 $m
Items not to be reclassified subsequently to profit or loss
Superannuation defined benefits remeasurements 5.0 14.5
Revaluation of property, plant and equipment – 4.8
Income tax charged directly to Other Comprehensive Income 5.0 19.3
Items to be reclassified subsequently to profit or loss
Revaluation of hedge derivatives (0.3) 0.3
(0.3) 0.3
Income tax charged directly to Other Comprehensive Income 4.7 19.6

56
NOTES TO THE FINANCIAL STATEMENTSFOR THE YEAR ENDED 30 JUNE 2014
9
5 Deferred tax assets/liabilities
Recognised deferred tax assets and liabilities
2014 $m
2013 $m
Assets subject to depreciation/amortisation/capital allowances 719.0 677.1
Assets held for sale 1.1 1.1
Deferred income and interest 0.1 0.6
Unread meters income – 31.5
Employee benefits (106.4) (114.2)
Provisions and accruals (5.9) (2.5)
Emission rights and deductible prepayments 0.2 0.2
Derivatives (2.3) (1.5)
Deferred tax (assets)/liabilities 605.8 592.3
The deductible temporary differences and tax losses do not expire under current tax legislation.
1 July 2013$m
Recognised in profit or
loss $m
Recognised in Other
Comprehensive Income
$m30 June 2014
$m
Movement in temporary differences during 2014
Assets subject to depreciation/amortisation/capital allowances 677.1 41.9 – 719.0
Assets held for sale 1.1 – – 1.1
Deferred income and interest 0.6 (0.5) – 0.1
Unread meters income 31.5 (31.5) – –
Employee benefits (114.2) 2.8 5.0 (106.4)
Provisions and accruals (2.5) (3.4) – (5.9)
Emission rights and deductible prepayments 0.2 – – 0.2
Derivatives (1.5) (0.5) (0.3) (2.3)
Total deferred tax (assets)/liabilities 592.3 8.8 4.7 605.8
Movement in temporary differences during 2013
Assets subject to depreciation/amortisation/capital allowances 643.8 28.5 4.8 677.1
Assets held for sale 1.1 – – 1.1
Deferred income and interest 0.3 0.3 – 0.6
Unread meters income 33.1 (1.6) – 31.5
Employee benefits (135.7) 7.0 14.5 (114.2)
Provisions and accruals (2.0) (0.5) – (2.5)
Emission rights and deductible prepayments 0.2 – – 0.2
Derivatives (2.6) 0.8 0.3 (1.5)
Total deferred tax (assets)/liabilities 538.2 34.5 19.6 592.3
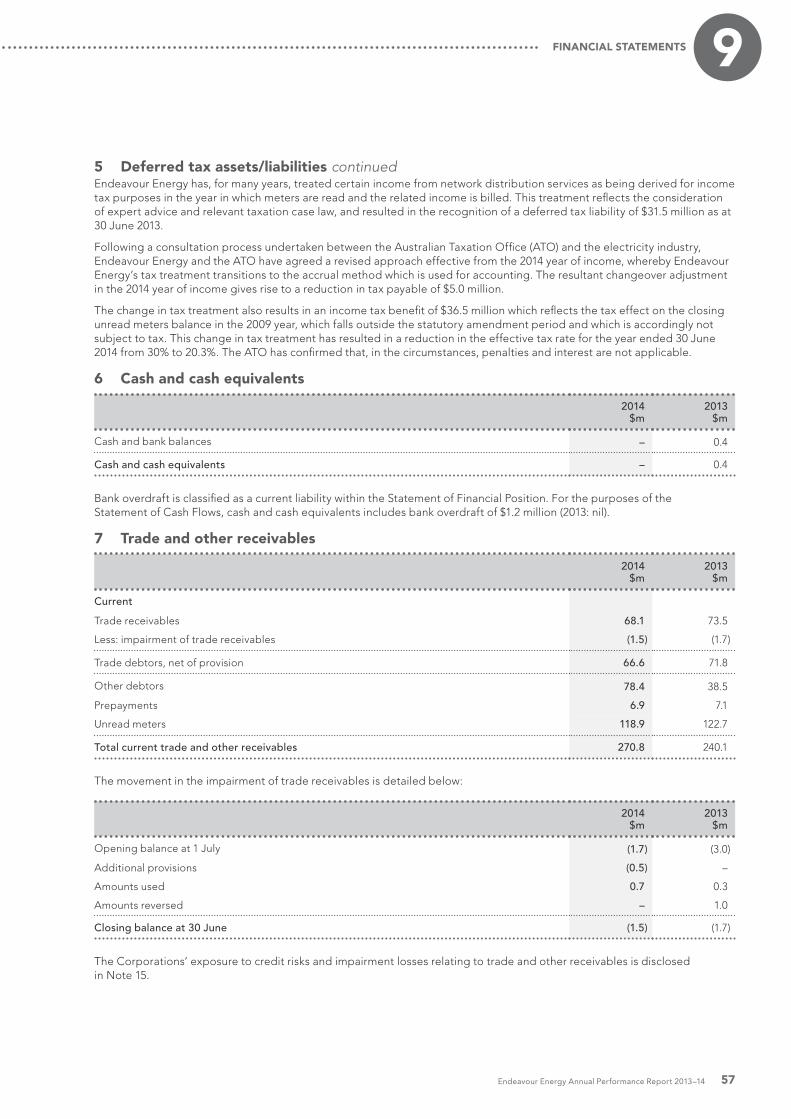
57Endeavour Energy Annual Performance Report 2013–14
FINANCIAL STATEMENTS 9
5 Deferred tax assets/liabilities continuedEndeavour Energy has, for many years, treated certain income from network distribution services as being derived for income tax purposes in the year in which meters are read and the related income is billed. This treatment reflects the consideration of expert advice and relevant taxation case law, and resulted in the recognition of a deferred tax liability of $31.5 million as at 30 June 2013.
Following a consultation process undertaken between the Australian Taxation Office (ATO) and the electricity industry, Endeavour Energy and the ATO have agreed a revised approach effective from the 2014 year of income, whereby Endeavour Energy’s tax treatment transitions to the accrual method which is used for accounting. The resultant changeover adjustment in the 2014 year of income gives rise to a reduction in tax payable of $5.0 million.
The change in tax treatment also results in an income tax benefit of $36.5 million which reflects the tax effect on the closing unread meters balance in the 2009 year, which falls outside the statutory amendment period and which is accordingly not subject to tax. This change in tax treatment has resulted in a reduction in the effective tax rate for the year ended 30 June 2014 from 30% to 20.3%. The ATO has confirmed that, in the circumstances, penalties and interest are not applicable.
6 Cash and cash equivalents
2014 $m
2013 $m
Cash and bank balances – 0.4
Cash and cash equivalents – 0.4
Bank overdraft is classified as a current liability within the Statement of Financial Position. For the purposes of the Statement of Cash Flows, cash and cash equivalents includes bank overdraft of $1.2 million (2013: nil).
7 Trade and other receivables
2014 $m
2013 $m
Current
Trade receivables 68.1 73.5
Less: impairment of trade receivables (1.5) (1.7)
Trade debtors, net of provision 66.6 71.8
Other debtors 78.4 38.5
Prepayments 6.9 7.1
Unread meters 118.9 122.7
Total current trade and other receivables 270.8 240.1
The movement in the impairment of trade receivables is detailed below:
2014 $m
2013 $m
Opening balance at 1 July (1.7) (3.0)
Additional provisions (0.5) –
Amounts used 0.7 0.3
Amounts reversed – 1.0
Closing balance at 30 June (1.5) (1.7)
The Corporations’ exposure to credit risks and impairment losses relating to trade and other receivables is disclosed in Note 15.

58
NOTES TO THE FINANCIAL STATEMENTSFOR THE YEAR ENDED 30 JUNE 2014
9
8 Derivative financial instruments
2014 $m
2013 $m
Derivative financial assets – current
Energy derivatives – 0.4
Treasury derivatives 0.3 0.2
Total derivative financial assets – current 0.3 0.6
Derivative financial assets – non-current
Treasury derivatives – 0.3
Derivative financial liabilities – current
Energy derivatives – 0.4
Treasury derivatives 1.7 –
Derivative financial liabilities – non-current
Treasury derivatives 4.5 5.1
Endeavour Energy’s exposure to credit, currency and interest rate risk related to derivatives is disclosed in note 15.

59Endeavour Energy Annual Performance Report 2013–14
FINANCIAL STATEMENTS 9
9 Property, plant and equipment
Note System assets
$m
Land and buildings
$m
Plant and equipment
$mTotal
$m
At 1 July 2013 – fair value
Gross carrying amount 14,934.0 460.3 303.1 15,697.4
Accumulated depreciation and impairment (9,469.4) (3.0) (169.2) (9,641.6)
Net carrying amount 5,464.6 457.3 133.9 6,055.8
At 30 June 2014 – fair value
Gross carrying amount 15,769.6 247.2 277.7 16,294.5
Accumulated depreciation and impairment (9,610.0) (7.6) (150.4) (9,768.0)
Net carrying amount 6,159.6 239.6 127.3 6,526.5
Year ended 30 June 2014
Net carrying amount at start of year 5,464.6 457.3 133.9 6,055.8
Additions 617.9 20.9 17.3 656.1
Disposals (2.2) – (2.2) (4.4)
Depreciation expense 3(a) (154.7) (4.6) (22.3) (181.6)
Other movements 16(c) 234.0 (234.0) 0.6 0.6
Net carrying amount at end of year 6,159.6 239.6 127.3 6,526.5
At 1 July 2012 – fair value
Gross carrying amount 14,313.3 447.2 294.6 15,055.1
Accumulated depreciation and impairment (9,336.1) (0.5) (162.5) (9,499.1)
Net carrying amount 4,977.2 446.7 132.1 5,556.0
At 30 June 2013 – fair value
Gross carrying amount 14,934.0 460.3 303.1 15,697.4
Accumulated depreciation and impairment (9,469.4) (3.0) (169.2) (9,641.6)
Net carrying amount 5,464.6 457.3 133.9 6,055.8
Year ended 30 June 2013
Net carrying amount at start of year 4,977.2 446.7 132.1 5,556.0
Additions 635.1 6.4 26.6 668.1
Disposals (5.4) (0.5) (3.6) (9.5)
Revaluation – 8.9 – 8.9
Depreciation expense 3(a) (142.3) (4.2) (21.2) (167.7)
Net carrying amount at end of year 5,464.6 457.3 133.9 6,055.8

60
NOTES TO THE FINANCIAL STATEMENTSFOR THE YEAR ENDED 30 JUNE 2014
9
9 Property, plant and equipment continued
Assets under construction
During the year ended 30 June 2014, the Corporation continued with its Network capital program. At the Statement of Financial Position date, construction in progress totalled:
Land and buildings $19.3 million (2013: $2.3 million)
System assets $707.4 million (2013: $869.0 million)
Plant and equipment $13.5 million (2013: $10.7 million)
Historical cost of revalued assets
The carrying amount of assets had they been carried under the cost model is:
Land and buildings $73.4 million (2013: $291.1 million)
System assets $5,028.9 million (2013: $4,333.9 million)
Plant and equipment $127.2 million (2013: $133.8 million)

61Endeavour Energy Annual Performance Report 2013–14
FINANCIAL STATEMENTS 9
10 Intangible assets
Note
Computer software
$mEasements
$mTotal
$m
At 1 July 2013
At cost 213.1 15.6 228.7
Accumulated amortisation and impairment (156.5) – (156.5)
Net carrying amount 56.6 15.6 72.2
At 30 June 2014
At cost 90.9 15.7 106.6
Accumulated amortisation and impairment (38.4) – (38.4)
Net carrying amount 52.5 15.7 68.2
Year ended 30 June 2014
Net carrying amount at start of year 56.6 15.7 72.3
Acquisitions 12.0 – 12.0
Disposals (0.3) – (0.3)
Amortisation 3(a) (15.2) – (15.2)
Other movement (0.6) – (0.6)
Net carrying amount at end of year 52.5 15.7 68.2
At 1 July 2012
At cost 207.1 12.4 219.5
Accumulated amortisation and impairment (146.6) – (146.6)
Net carrying amount 60.5 12.4 72.9
At 30 June 2013
At cost 213.1 15.6 228.7
Accumulated amortisation and impairment (156.5) – (156.5)
Net carrying amount 56.6 15.6 72.2
Year ended 30 June 2013
Net carrying amount at start of year 60.5 12.4 72.9
Acquisitions 13.1 3.2 16.3
Disposals (0.3) – (0.3)
Amortisation 3(a) (16.7) – (16.7)
Net carrying amount at end of year 56.6 15.6 72.2
Assets under constructionDuring the year ended 30 June 2014, the Corporation continued with its capital program. At the Statement of Financial Position date, construction in progress totalled:
Computer software $20.1 million (2013: $22.0 million)

62
NOTES TO THE FINANCIAL STATEMENTSFOR THE YEAR ENDED 30 JUNE 2014
9
11 Trade and other payables
2014 $m
2013 $m
Current
Trade payables 58.2 30.6
Accruals 179.4 161.9
Other payables 9.1 8.7
Total current trade and other payables 246.7 201.2
Details regarding credit risk, liquidity risk and market risk, including a maturity analysis, in relation to the above payables are disclosed in note 15.
12 Borrowings
2014 $m
2013 $m
Current liabilities
Current portion of loans 376.3 513.5
Non-current liabilities
Non-current portion of loans 3,391.4 2,844.9
Loans are unsecured and repayable in full on various maturity dates. For information about the Corporations exposure to interest rate and foreign currency risks, see note 15.
13 Provisions
Insurance $m
Dividends $m
Employee benefits
$mOther
$mTotal
$m
Opening balance at 1 July 2013 6.9 209.5 371.0 10.8 598.2
Additional provisions 0.1 178.1 223.3 18.6 420.1
Amounts used (0.5) (209.5) (217.9) (6.0) (433.9)
Amounts reversed (0.2) – (32.8) – (33.0)
Closing balance at 30 June 2014 6.3 178.1 343.6 23.4 551.4
Current 1.0 178.1 162.2 23.4 364.7
Non-current 5.3 – 181.4 – 186.7
Closing balance at 30 June 2014 6.3 178.1 343.6 23.4 551.4
Current 1.3 209.5 164.9 10.8 386.5
Non-current 5.6 – 206.1 – 211.7
Closing balance at 30 June 2013 6.9 209.5 371.0 10.8 598.2
The current provision for employee benefits includes accrued annual leave, vesting sick leave and long service leave. For long service leave it covers all unconditional entitlements where employees have completed the required period of service and also those where employees are entitled to pro-rata payments in certain circumstances. The entire amount of the provision of $162.2 million (2013: $164.9 million) is presented as current, since the Corporation does not have an unconditional right to defer settlement for any of these obligations. However, based on past experience, the Corporation does not expect all employees to take the full amount of accrued leave or require payment within the next 12 months. The following amounts reflect leave that is not to be expected to be taken or paid within the next 12 months.
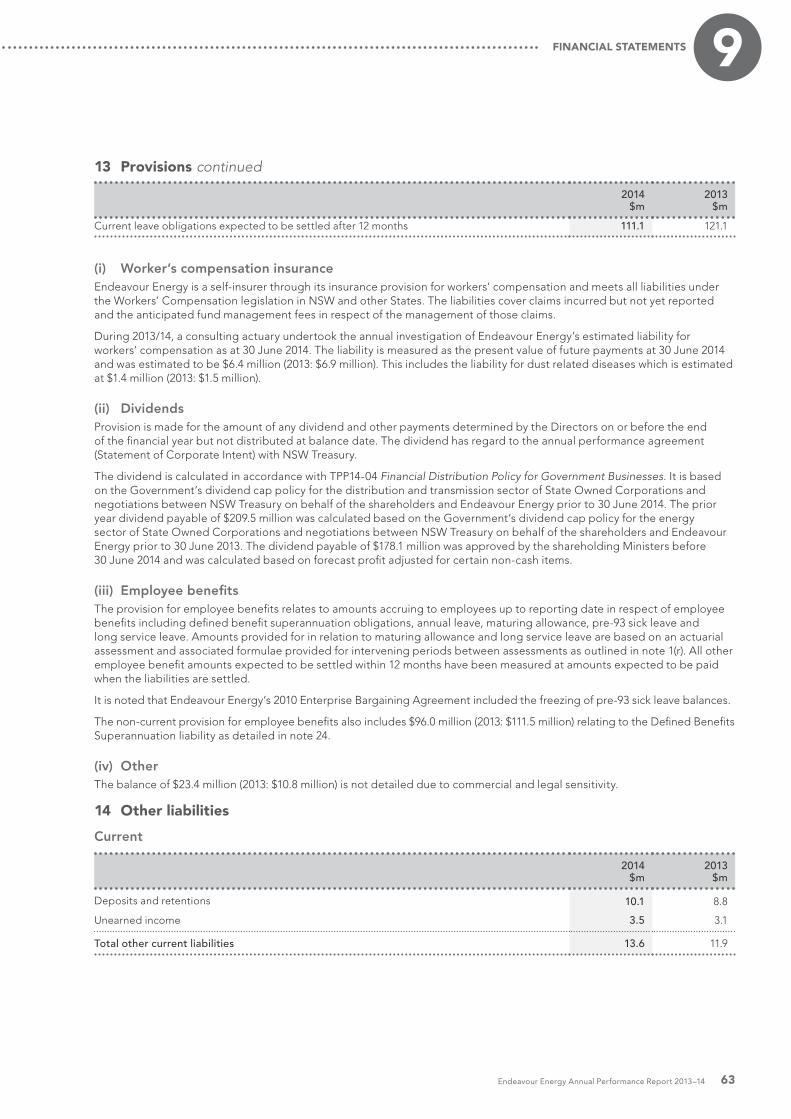
63Endeavour Energy Annual Performance Report 2013–14
FINANCIAL STATEMENTS 9
13 Provisions continued
2014 $m
2013 $m
Current leave obligations expected to be settled after 12 months 111.1 121.1
(i) Worker’s compensation insuranceEndeavour Energy is a self-insurer through its insurance provision for workers’ compensation and meets all liabilities under the Workers’ Compensation legislation in NSW and other States. The liabilities cover claims incurred but not yet reported and the anticipated fund management fees in respect of the management of those claims.
During 2013/14, a consulting actuary undertook the annual investigation of Endeavour Energy’s estimated liability for workers’ compensation as at 30 June 2014. The liability is measured as the present value of future payments at 30 June 2014 and was estimated to be $6.4 million (2013: $6.9 million). This includes the liability for dust related diseases which is estimated at $1.4 million (2013: $1.5 million).
(ii) DividendsProvision is made for the amount of any dividend and other payments determined by the Directors on or before the end of the financial year but not distributed at balance date. The dividend has regard to the annual performance agreement (Statement of Corporate Intent) with NSW Treasury.
The dividend is calculated in accordance with TPP14-04 Financial Distribution Policy for Government Businesses. It is based on the Government’s dividend cap policy for the distribution and transmission sector of State Owned Corporations and negotiations between NSW Treasury on behalf of the shareholders and Endeavour Energy prior to 30 June 2014. The prior year dividend payable of $209.5 million was calculated based on the Government’s dividend cap policy for the energy sector of State Owned Corporations and negotiations between NSW Treasury on behalf of the shareholders and Endeavour Energy prior to 30 June 2013. The dividend payable of $178.1 million was approved by the shareholding Ministers before 30 June 2014 and was calculated based on forecast profit adjusted for certain non-cash items.
(iii) Employee benefitsThe provision for employee benefits relates to amounts accruing to employees up to reporting date in respect of employee benefits including defined benefit superannuation obligations, annual leave, maturing allowance, pre-93 sick leave and long service leave. Amounts provided for in relation to maturing allowance and long service leave are based on an actuarial assessment and associated formulae provided for intervening periods between assessments as outlined in note 1(r). All other employee benefit amounts expected to be settled within 12 months have been measured at amounts expected to be paid when the liabilities are settled.
It is noted that Endeavour Energy’s 2010 Enterprise Bargaining Agreement included the freezing of pre-93 sick leave balances.
The non-current provision for employee benefits also includes $96.0 million (2013: $111.5 million) relating to the Defined Benefits Superannuation liability as detailed in note 24.
(iv) OtherThe balance of $23.4 million (2013: $10.8 million) is not detailed due to commercial and legal sensitivity.
14 Other liabilities
Current
2014 $m
2013 $m
Deposits and retentions 10.1 8.8
Unearned income 3.5 3.1
Total other current liabilities 13.6 11.9

64
NOTES TO THE FINANCIAL STATEMENTSFOR THE YEAR ENDED 30 JUNE 2014
9
15 Financial instruments
(a) Financial risk management objectives and policiesFinancial instruments comprise cash, trade debtors, trade creditors, short term deposits, loans and derivatives. The main purpose of these financial instruments is to raise finance or invest surplus cash for the entity’s operations, and to manage exposure to price movements.
Endeavour Energy’s treasury function, leadership team and Board manage the Corporation’s exposure to key financial risks including credit risk, currency risk, interest rate risk, liquidity risk and commodity price risk, in accordance with the Board’s financial risk management policies. The Board reviews and agrees policies for managing each of the key financial risks.
Details of the significant accounting policies and methods adopted, including the criteria for recognition, the basis of measurement and the basis on which income and expenses are recognised, in respect of each class of financial asset, financial liability and equity instrument are disclosed in Note 1 to the financial statements.
Derivative financial instruments can be used to trade or hedge exposure to fluctuations in foreign exchange rates, commodity prices and interest rates. Derivative financial instruments are not held for speculative or trading purposes, however there are some derivatives that do not quality for hedge accounting and are accounted for as trading instruments.
(b) Credit riskCredit risk is the risk of financial loss arising if counterparties fail to meet their financial obligations.
The credit risk on trade and other receivables and accrued income from unread meters that have been recognised in the Statement of Financial Position, is generally the carrying amount net of any impairment provisions. Endeavour Energy’s policy requires customers to pay in accordance with agreed payment terms. Payment terms are generally 15–30 days. All credit and recovery risks associated with trade receivables have been provided for in the Statement of Financial Position.
The ageing of trade receivables past due but not impaired at 30 June 2014 is detailed below:
2014 $m
2013 $m
Less than 3 months overdue 1.9 4.3
3 months to 6 months overdue – 0.6
Later than 6 months overdue – 0.1
1.9 5.0
Endeavour Energy’s credit risk on other assets is minimised as it transacts predominantly with other corporations in the energy industry. Where the counterparty is a non-Government owned corporation, credit worthiness is established in accordance with Endeavour Energy’s risk management policies which include the use of external credit ratings to derive risk limits as approved by the Board of Directors, and appropriate monitoring procedures.
(c) Currency riskCurrency risk is the risk that the fair value or future cash flows of a financial instrument will fluctuate because of changes in foreign exchange rates. The Corporation’s exposure to foreign currency risk is immaterial. The Corporation limits currency risk by entering into foreign currency options and forward foreign exchange contracts. The Corporation uses forward exchange contracts to hedge its foreign currency risk for all foreign exchange exposures that exceed $A 500,000 in value. As the foreign currency risk is immaterial in terms of a possible impact on profit and loss or total equity, a sensitivity analysis has not been completed.
(d) Interest rate riskInterest rate risk is the risk that the fair value of future cash flows of a financial instrument will fluctuate because of changes in market interest rate.
The Corporation adopts a policy of ensuring that its debt portfolio is managed within a risk framework including approved duration ranges and debt maturity profiles. Interest rate risk is managed through a combination of fixed rate long duration debts, inflation linked securities, floating rate debts and interest rate derivative instruments.
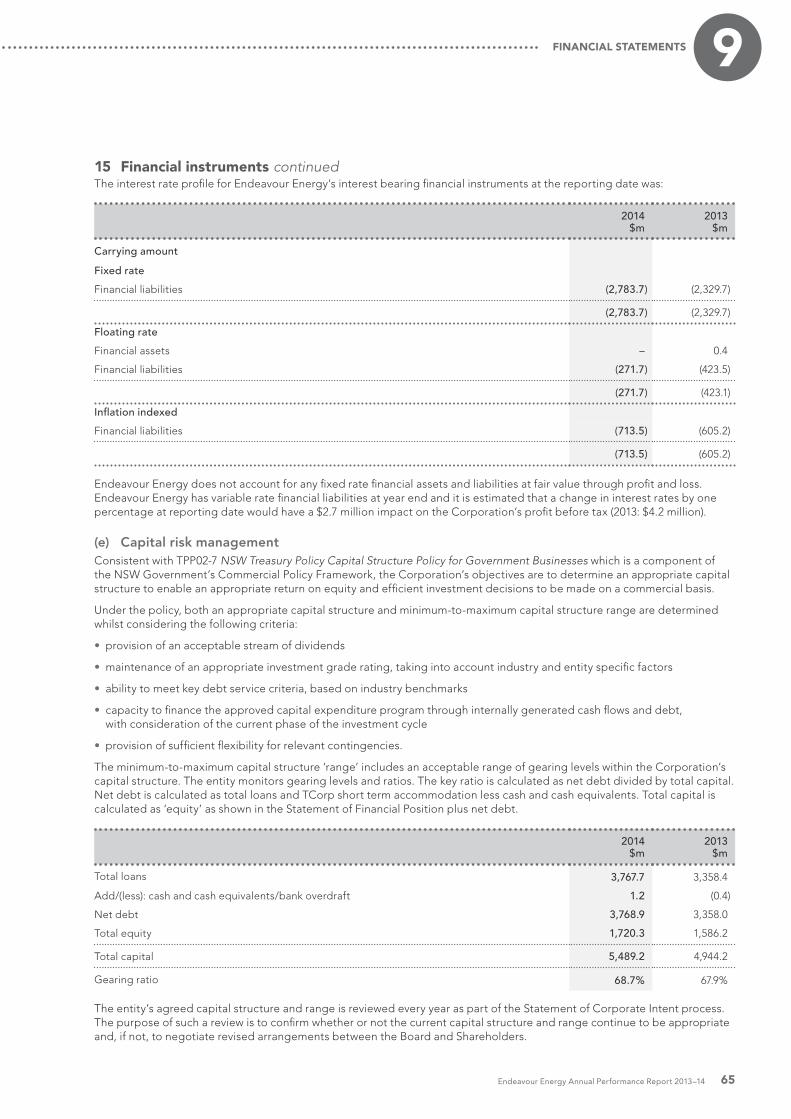
65Endeavour Energy Annual Performance Report 2013–14
FINANCIAL STATEMENTS 9
15 Financial instruments continuedThe interest rate profile for Endeavour Energy’s interest bearing financial instruments at the reporting date was:
2014 $m
2013 $m
Carrying amount
Fixed rate
Financial liabilities (2,783.7) (2,329.7)
(2,783.7) (2,329.7)
Floating rate
Financial assets – 0.4
Financial liabilities (271.7) (423.5)
(271.7) (423.1)
Inflation indexed
Financial liabilities (713.5) (605.2)
(713.5) (605.2)
Endeavour Energy does not account for any fixed rate financial assets and liabilities at fair value through profit and loss. Endeavour Energy has variable rate financial liabilities at year end and it is estimated that a change in interest rates by one percentage at reporting date would have a $2.7 million impact on the Corporation’s profit before tax (2013: $4.2 million).
(e) Capital risk managementConsistent with TPP02-7 NSW Treasury Policy Capital Structure Policy for Government Businesses which is a component of the NSW Government’s Commercial Policy Framework, the Corporation’s objectives are to determine an appropriate capital structure to enable an appropriate return on equity and efficient investment decisions to be made on a commercial basis.
Under the policy, both an appropriate capital structure and minimum-to-maximum capital structure range are determined whilst considering the following criteria:
• provision of an acceptable stream of dividends
• maintenance of an appropriate investment grade rating, taking into account industry and entity specific factors
• ability to meet key debt service criteria, based on industry benchmarks
• capacity to finance the approved capital expenditure program through internally generated cash flows and debt, with consideration of the current phase of the investment cycle
• provision of sufficient flexibility for relevant contingencies.
The minimum-to-maximum capital structure ‘range’ includes an acceptable range of gearing levels within the Corporation’s capital structure. The entity monitors gearing levels and ratios. The key ratio is calculated as net debt divided by total capital. Net debt is calculated as total loans and TCorp short term accommodation less cash and cash equivalents. Total capital is calculated as ‘equity’ as shown in the Statement of Financial Position plus net debt.
2014 $m
2013 $m
Total loans 3,767.7 3,358.4
Add/(less): cash and cash equivalents/bank overdraft 1.2 (0.4)
Net debt 3,768.9 3,358.0
Total equity 1,720.3 1,586.2
Total capital 5,489.2 4,944.2
Gearing ratio 68.7% 67.9%
The entity’s agreed capital structure and range is reviewed every year as part of the Statement of Corporate Intent process. The purpose of such a review is to confirm whether or not the current capital structure and range continue to be appropriate and, if not, to negotiate revised arrangements between the Board and Shareholders.
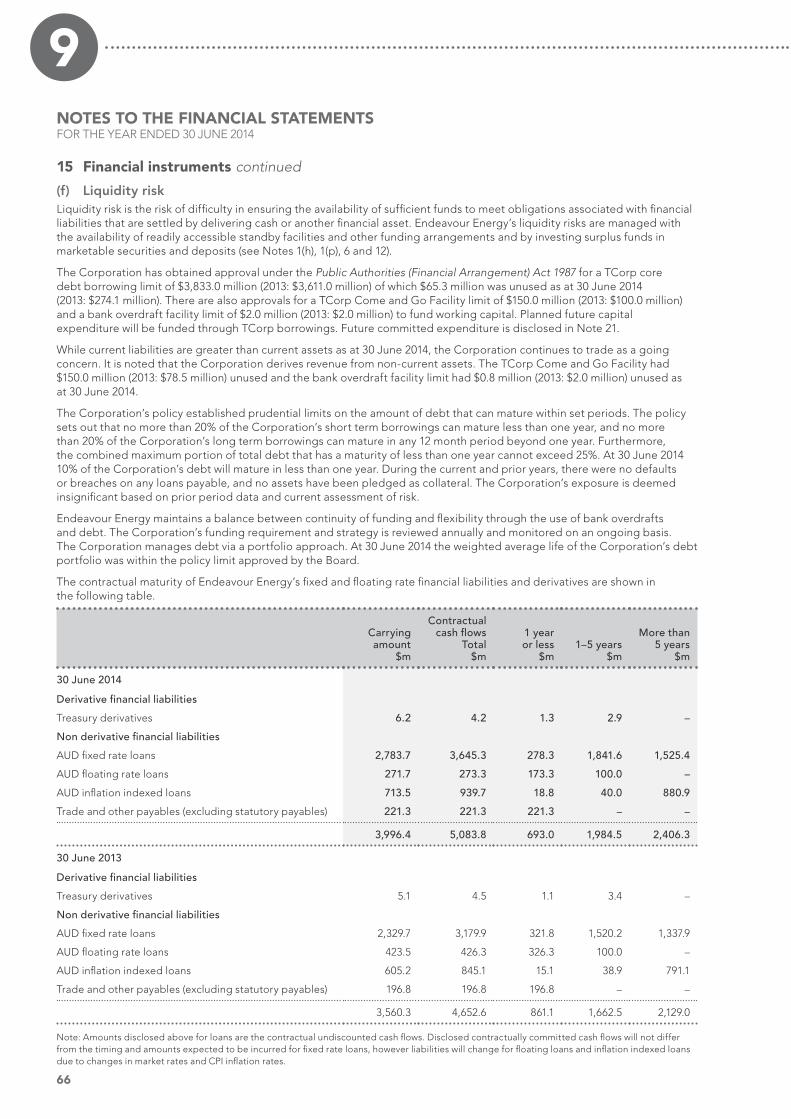
66
NOTES TO THE FINANCIAL STATEMENTSFOR THE YEAR ENDED 30 JUNE 2014
9
15 Financial instruments continued
(f) Liquidity riskLiquidity risk is the risk of difficulty in ensuring the availability of sufficient funds to meet obligations associated with financial liabilities that are settled by delivering cash or another financial asset. Endeavour Energy’s liquidity risks are managed with the availability of readily accessible standby facilities and other funding arrangements and by investing surplus funds in marketable securities and deposits (see Notes 1(h), 1(p), 6 and 12).
The Corporation has obtained approval under the Public Authorities (Financial Arrangement) Act 1987 for a TCorp core debt borrowing limit of $3,833.0 million (2013: $3,611.0 million) of which $65.3 million was unused as at 30 June 2014 (2013: $274.1 million). There are also approvals for a TCorp Come and Go Facility limit of $150.0 million (2013: $100.0 million) and a bank overdraft facility limit of $2.0 million (2013: $2.0 million) to fund working capital. Planned future capital expenditure will be funded through TCorp borrowings. Future committed expenditure is disclosed in Note 21.
While current liabilities are greater than current assets as at 30 June 2014, the Corporation continues to trade as a going concern. It is noted that the Corporation derives revenue from non-current assets. The TCorp Come and Go Facility had $150.0 million (2013: $78.5 million) unused and the bank overdraft facility limit had $0.8 million (2013: $2.0 million) unused as at 30 June 2014.
The Corporation’s policy established prudential limits on the amount of debt that can mature within set periods. The policy sets out that no more than 20% of the Corporation’s short term borrowings can mature less than one year, and no more than 20% of the Corporation’s long term borrowings can mature in any 12 month period beyond one year. Furthermore, the combined maximum portion of total debt that has a maturity of less than one year cannot exceed 25%. At 30 June 2014 10% of the Corporation’s debt will mature in less than one year. During the current and prior years, there were no defaults or breaches on any loans payable, and no assets have been pledged as collateral. The Corporation’s exposure is deemed insignificant based on prior period data and current assessment of risk.
Endeavour Energy maintains a balance between continuity of funding and flexibility through the use of bank overdrafts and debt. The Corporation’s funding requirement and strategy is reviewed annually and monitored on an ongoing basis. The Corporation manages debt via a portfolio approach. At 30 June 2014 the weighted average life of the Corporation’s debt portfolio was within the policy limit approved by the Board.
The contractual maturity of Endeavour Energy’s fixed and floating rate financial liabilities and derivatives are shown in the following table.
Carrying amount
$m
Contractual cash flows
Total $m
1 year or less
$m1–5 years
$m
More than 5 years
$m
30 June 2014
Derivative financial liabilities
Treasury derivatives 6.2 4.2 1.3 2.9 –
Non derivative financial liabilities
AUD fixed rate loans 2,783.7 3,645.3 278.3 1,841.6 1,525.4
AUD floating rate loans 271.7 273.3 173.3 100.0 –
AUD inflation indexed loans 713.5 939.7 18.8 40.0 880.9
Trade and other payables (excluding statutory payables) 221.3 221.3 221.3 – –
3,996.4 5,083.8 693.0 1,984.5 2,406.3
30 June 2013
Derivative financial liabilities
Treasury derivatives 5.1 4.5 1.1 3.4 –
Non derivative financial liabilities
AUD fixed rate loans 2,329.7 3,179.9 321.8 1,520.2 1,337.9
AUD floating rate loans 423.5 426.3 326.3 100.0 –
AUD inflation indexed loans 605.2 845.1 15.1 38.9 791.1
Trade and other payables (excluding statutory payables) 196.8 196.8 196.8 – –
3,560.3 4,652.6 861.1 1,662.5 2,129.0
Note: Amounts disclosed above for loans are the contractual undiscounted cash flows. Disclosed contractually committed cash flows will not differ from the timing and amounts expected to be incurred for fixed rate loans, however liabilities will change for floating loans and inflation indexed loans due to changes in market rates and CPI inflation rates.

67Endeavour Energy Annual Performance Report 2013–14
FINANCIAL STATEMENTS 9
15 Financial instruments continuedThe following table separately discloses the undiscounted contractual net cash inflows and outflows on derivative liabilities that settle on a net basis and that require gross disclosure. When the amount payable or receivable is not fixed, the amount disclosed has been determined by reference to projected prices as illustrated by forward curves at the end of each reporting period.
Carrying amount
$m
Total contractual cash flows
$m1 year or less
$m1–5 years
$m
More than 5 years
$m
30 June 2014
Derivative financial liabilities
Net settled:
– Treasury derivatives 6.2 4.2 1.3 2.9 –
6.2 4.2 1.3 2.9 –
30 June 2013
Derivative financial liabilities
Net settled:
– Treasury derivatives 5.1 4.5 1.1 3.4 –
5.1 4.5 1.1 3.4 –

68
NOTES TO THE FINANCIAL STATEMENTSFOR THE YEAR ENDED 30 JUNE 2014
9
16 Fair Value MeasurementsThis note provides information about how the Corporation determines the fair value of all assets and liabilities for which fair value is measured or disclosed in the financial statements.
(a) Fair value hierarchy
(i) Recognised fair value measurementsThe following table presents the Corporation’s assets and liabilities measured and recognised at fair value at 30 June 2014.
NoteLevel 1
$mLevel 2
$mLevel 3
$mTotal
$m
At 30 June 2014
Recurring fair value measurements
Financial assets
Treasury derivatives 8,15 – 0.3 – 0.3
Total financial assets – 0.3 – 0.3
Non-financial assets
System assets 9 – – 6,159.6 6,159.6
Land and buildings 9 – 239.6 – 239.6
Total non-financial assets – 239.6 6,159.6 6,399.2
Financial liabilities
Treasury derivatives 8,15 – 6.2 – 6.2
Total financial liabilities – 6.2 – 6.2
Non-recurring fair value measurements
Assets classified as held for sale – 4.8 – 4.8
At 30 June 2013
Recurring fair value measurements
Financial assets
Treasury derivatives 8,15 – 0.5 – 0.5
Energy derivatives 8,15 – 0.4 – 0.4
Total financial assets – 0.9 – 0.9
Non-financial assets
System assets 9 – – 5,464.6 5,464.6
Land and buildings 9 – 457.3 – 457.3
Total financial liabilities – 457.3 5,464.6 5,921.9
Financial liabilities
Treasury derivatives 8,15 5.1 – – 5.1
Total financial liabilities 5.1 – – 5.1
Non-recurring fair value measurements
Assets classified as held for sale – 4.8 – 4.8
Treasury derivative liabilities were transferred from Level 1 to Level 2 during the year following adoption of AASB 13 Fair Value Measurements. There were no other transfers between levels 1 and 2 for recurring fair value measurements during the year. For transfers in and out of level 3 measurements refer to (c) below.
The Corporation’s policy is to recognise transfers into and transfers out of fair value hierarchy levels as at the end of the reporting period.

69Endeavour Energy Annual Performance Report 2013–14
FINANCIAL STATEMENTS 9
16 Fair Value Measurements continued(ii) Disclosed fair valuesEndeavour Energy also has a number of assets and liabilities which are not measured at fair value, but for which fair values are disclosed in the notes.
Receivables and payables
The carrying amounts of trade receivables and payables are assumed to approximate their fair values due to their short-term nature.
Interest-bearing loans and borrowings
Fair value is calculated based on discounted expected future principal and interest cash flows at current market interest rates that are available to the Corporation for similar financial instruments. The fair value of current borrowings approximates carrying amount, as the impact of discounting is not significant (level 2).
Interest rates used for determining fair value: The Corporation uses the government yield curve as at 30 June 2014 plus an adequate constant credit spread to discount financial instruments. Interest rates used were as follows:
2014 2013
Loans and borrowings 2.5% – 4.5% 2.5% – 5.2%
Deposits and retentions
Deposits and retentions represent liabilities for contractors’ deposits which can be refunded at any time after the end of the financial year. The net fair value is the carrying value.
(b) Valuation techniques used to derive level 2 and level 3 fair valuesThe Corporation measures and recognises the following assets and liabilities at fair value on a recurring basis:
• Derivatives
• System assets
• Land and buildings
The Corporation has also measured assets and liabilities at fair value on a non-recurring basis as a result of the reclassification of assets as held for sale.
(i) Recurring fair value measurementsThe fair value of financial instruments that are not traded in an active market (for example, over the counter derivatives) is determined using valuation techniques. These valuation techniques maximise the use of observable market data where it is available and rely as little as possible on entity specific estimates. If all significant inputs required to fair value an instrument are observable, the instrument is included in level 2.
If one or more of the significant inputs is not based on observable market data, the instrument is included in level 3.
The fair value of financial assets and financial liabilities is determined as follows:
The fair value of financial assets and financial liabilities with standard terms and conditions and traded on active liquid markets is determined with reference to quoted market prices. In the absence of quoted market prices, the price of the most recent transaction provides evidence of the current fair value.
The fair values of other financial assets and financial liabilities is determined in accordance with generally accepted pricing models based on discounted cash flow analysis using maximum observable market input data which includes prices from observable current market transactions and dealer quotes for similar instruments.
Foreign exchange contracts
The net fair value of foreign exchange contracts is calculated by reference to the current spot and forward market currency exchanges rates.
System assets
System assets are valued using techniques described in note 1(l). All resulting fair value estimates for system assets are included in level 3.

70
NOTES TO THE FINANCIAL STATEMENTSFOR THE YEAR ENDED 30 JUNE 2014
9
16 Fair Value Measurements continuedLand and buildings
Land and buildings are valued using techniques described in note 1(l). All resulting fair value estimates for land and buildings are included in Level 2.
(ii) Non-recurring fair value measurementsNon-current land and buildings classified as held for sale during the reporting period is measured at the lower of its carrying amount and fair value less cost to sell.
(c) Fair value measurements using significant unobservable inputs (level 3)The following table presents the changes in level 3 items for the periods ended 30 June 2014 and 2013 for recurring fair value measurements.
Assets System assets
$mTotal
$m
Opening balance 1 July 2012 4,977.2 4,977.2
Acquisitions 635.1 635.1
Disposals (5.4) (5.4)
Depreciation and impairment (142.3) (142.3)
Closing balance 30 June 2013 5,464.6 5,464.6
Acquisitions 617.9 617.9
Disposals (2.2) (2.2)
Depreciation and impairment (154.7) (154.7)
Other movements* 234.0 234.0
Closing balance 30 June 2014 6,159.6 6,159.6
* Fair value measurements of non-financial assets take into account a market participant’s ability to generate economic benefits by using the asset in its highest and best use or by selling it to another market participant that would use the asset in its highest and best use. Land under infrastructure has been reclassified from land and buildings to system assets, reflecting that the assets generate economic benefits in combination with other network system assets.
(i) Transfers between levels 2 and 3 and changes in valuation techniquesThere were no transfers between Level 2 and 3 and no changes in valuation techniques during the year.
(ii) Valuation inputs and relationships to fair valueThe following table summarises quantitative information about significant unobservable inputs used in level 3 fair value measurements.
Fair value at 30 June 2014
$mUnobservable inputs
Range of inputs (probability
weighted average) Relationship of unobservable inputs to fair value
System assets 6,159.7 Discount rate 7.5% – 8.5% (8.0%)
The higher the discount rate, the lower the fair value. A 50 basis point increase/decrease in discount rate results in a $120.4m decrease/$123.7m increase in the fair value.
5 year forecast capital expenditure
+/- 10% ($1,552.1m)
The higher the capital expenditure, the higher the fair value. A 10% increase/decrease in capital expenditure results in a $15.3m increase/decrease in the fair value.

71Endeavour Energy Annual Performance Report 2013–14
FINANCIAL STATEMENTS 9
16 Fair Value Measurements continued(iii) Valuation processesThe finance division of the Corporation includes a team that performs valuations of system assets required for financial reporting purposes, including level 3 fair values. This team reports directly to the General Manager Finance and Compliance. Discussions of valuation processes and results are held between the General Manager Finance and the valuation team at least once every year, in line with reporting dates. The main level 3 inputs used by the group are derived and evaluated as follows:
• System assets – a discounted cash flow model is used to perform a value in use calculation using inputs such as future cash flows and discount rates to determine fair value (refer note 1(l)(i)). The cash flow model is used to formulate a discount rate to discount cash flows based upon several inputs, primarily the risk free rate and debt risk premium, and adjustments which are made within the model. The risk free rate is observable data based on government bond rates, and the debt risk premium data is obtained from observable data of corporate bond yields and spreads, and is adjusted as required for use in the model.
• Forecast capital expenditure represents non-growth capital expenditure expected to be spent between 1 July 2014 and 30 June 2019, based on latest management estimates.
(iv) Fair values versus carrying amountThe carrying amounts and fair values of financial assets and liabilities at reporting date were:
Note
2014 2013
Carrying amount
$mFair value
$m
Carrying amount
$mFair value
$m
Financial instruments
Financial assets carried at amortised cost
Cash and cash equivalents 6 – – 0.4 0.4
Trade and other receivables (excluding prepayments) 7 244.1 244.1 233.0 233.0
244.1 244.1 233.4 233.4
Financial assets carried at fair value
Energy derivatives 8 – – 0.4 0.4
Treasury derivatives 8 0.3 0.3 0.5 0.5
0.3 0.3 0.9 0.9
Financial liabilities carried at amortised cost
Bank overdraft 1.2 1.2 – –
Borrowings 12 3,767.7 4,104.1 3,358.4 3,592.8
Trade and other payables (excluding statutory payables) 11 221.3 221.3 196.8 196.8
3,990.2 4,326.6 3,555.2 3,789.6
Financial liabilities carried at fair value
Energy derivatives 8 – – 0.4 0.4
Treasury derivatives 8 6.2 6.2 5.1 5.1
6.2 6.2 5.5 5.5

72
NOTES TO THE FINANCIAL STATEMENTSFOR THE YEAR ENDED 30 JUNE 2014
9
17 Key management personnelKey management personnel comprise members of the Board of Directors, Networks NSW (NNSW) executive management team and the Corporation’s leadership management team.
The following were key management personnel of the entity at any time during the reporting period, and unless otherwise indicated were key management personnel for the entire period.
DirectorsMr Roger Massy-Greene (Chairman)
Dr Peter Dodd (reappointed 1 January 2014)
Ms Laura Reed
Mr Philip Garling
Dr Patrick Strange (appointed 25 November 2013)
Ms Diana Eilert (appointed 23 June 2014)
Mr Vince Graham (Chief Executive Officer)
Key management personnel remunerationIn addition to their salaries, the entity also provides post employment benefits to Directors and Executive Officers (see Notes 1(r) and 1(s)). For Directors, post employment benefit relates to compulsory superannuation contributions.
The allocation of NNSW executive management team remuneration to Endeavour Energy is based on the proportion of customer numbers to the total customer numbers of Ausgrid, Endeavour Energy and Essential Energy combined.
Key management personnel compensation included in “employee benefits expense” (see Note 3(a)) is as follows:
2014 $m
2013 $m
Short-term employee benefits 3.6 3.4
Long-term benefits 0.2 0.6
Post-employment benefits 0.2 0.2
Total 4.0 4.2
18 Related parties transactions
(i) Networks NSW structureOn 1 July 2012, the Networks NSW (NNSW) operating model commenced with Ausgrid, Endeavour Energy and Essential Energy (DNSPs) having separate Boards with common Directors, a common Chairman and common Chief Executive Officer (CEO). NNSW is not a legal entity.
The Umbrella Cooperation Agreement facilitates cooperation between the energy distributors to enable the identification and delivery of reform and other efficiency measures by acting collectively and co-operatively.
On 27 August 2013 amendments to the Energy Services Corporations Act (the governing legislation) were enacted to provide for the appointment of a single Board of Directors as the Board of Ausgrid, Endeavour Energy and Essential Energy, to act in their best interests as if they formed part of a combined operation.
(ii) Joint ventureFurther to the Umbrella Cooperation Agreement, the DNSPs have entered into a joint venture agreement for the purpose of realising cost savings through joint procurement and service provision activities. A legal entity Networks NSW Pty Limited has been used as the vehicle for this joint venture. Networks NSW Pty Limited will not incur any costs in its own right or enter into any sourcing agreements. Endeavour Energy has a one-third ownership interest in Networks NSW Pty Limited.

73Endeavour Energy Annual Performance Report 2013–14
FINANCIAL STATEMENTS 9
18 Related parties transactions continued
(iii) DirectorsSome Directors of Endeavour Energy are also Directors of other companies or have an interest in other companies or entities that may have had transactions with Endeavour Energy during the financial year. A Register of Directors’ interests is maintained by the Board Secretary and updated as required during the year. In particular, in accordance with the Board Charter and the Corporation’s Code of Conduct, Directors’ have declared any potential conflicts of interest in matters discussed at meetings.
(iv) Transactions with other related partiesProclamation of the Energy Services Corporations Amendment (Distributor Efficiency) legislation discussed above has placed Ausgrid, Endeavour Energy and Essential Energy under the control of a single Board of Directors. This new requirement means that transactions between these Corporations, starting from 27 August 2013, should be disclosed as related party transactions. Transactions prior to 27 August 2013 are not considered to be between related parties, therefore no comparatives have been disclosed at 30 June 2014. The following transactions occurred with Ausgrid and Essential Energy:
2014 $m
Network use of system income 12.6
Management fee recharge income 4.4
Management fee recharge expense 4.4
Provision of other services 0.8
Purchases of other services 3.4
(v) Outstanding balances arising from sales/purchases of goods and servicesThe following balances are outstanding at the end of the reporting period in relation to transactions with related parties:
2014 $m
Current receivables
Related parties 3.3
Current payables
Related parties 3.5
No impairment provision (2013: $nil) in respect of receivables has been raised in relation to any outstanding balances, and no expense has been recognised in respect of impaired receivables from related parties.
(vi) Terms and conditionsManagement fee recharge income and recharge expenses are calculated at a rate which reflects the cost of providing the service, based on normal commercial terms and conditions.
Network use of system income recoveries are based on normal commercial terms and conditions. Network use of system income recoveries represent inter distributor charges where Endeavour Energy supplies electricity to other distribution network service providers (DNSPs), Ausgrid and Essential Energy, where the respective DNSPs are not in a position to obtain supply from a Bulk Supply Point.
Amounts receivable are unsecured and made on normal commercial terms and conditions. Amounts payable are unsecured and made on normal commercial terms and conditions.
19 Remuneration of auditor
2014 $m
2013 $m
Amounts paid and payable to the Audit Office of New South Wales 0.3 0.3

74
NOTES TO THE FINANCIAL STATEMENTSFOR THE YEAR ENDED 30 JUNE 2014
9
20 Contingent liabilities and contingent assets
Contingent liabilities
2014 $m
2013 $m
Self insurance 0.5 0.4
Sundry general claims 6.2 9.5
6.7 9.9
The contingent liabilities relate to injury claims (self insurance) and sundry general claims. The Directors do not expect the outcomes of any actions associated with the above contingent liabilities to have a material effect on the Corporation’s financial position.
The Directors are of the opinion that provisions are not required in respect of these matters, as it is not probable that a future sacrifice of economic benefits will be required or the amount is not capable of reliable measurement.
Springwood/Winmalee bushfire on 17 October 2013On 27 May 2014 Endeavour Energy was served with a NSW Supreme Court statement of claim alleging breach of statutory and general duties owed to those persons who had suffered loss or damage arising from the Springwood/Winmalee bushfire on 17 October 2013. Separate to the class action proceedings, NSW Police has been investigating fire and property damage on behalf of the State Coroner. Endeavour Energy has and continues to provide full support and assistance in relation to these matters.
It is too early for Endeavour Energy to speculate on the outcome of any claims which may be instituted by third parties. If these claims are pursued, Endeavour Energy has liability insurance which provides cover for bushfire liability. Endeavour Energy reviews its insurance cover annually and ensures it is commensurate with the scale and size of its operations, the risks assessed to be associated with its operations and with industry standards and practice.
Contingent assets
2014 $m
2013 $m
Sundry general claims 3.4 7.3
3.4 7.3
The contingent asset relates to insurance claims.
21 Commitments
2014 $m
2013 $m
Capital commitments
Commitments for the acquisition of assets, plant and equipment contracted for at the reporting date but not recognised as liabilities payable (including GST) 96.3 196.0
GST credits 8.8 17.8
In addition, Endeavour Energy has two Power Purchase Agreements where Endeavour Energy remains the counterparty. However, through an on-sale agreement as part of the Retail sale, energy transferred to Endeavour Energy is automatically transferred to Origin Energy. Energy purchase commitments to be transferred through the on-sale agreement as at 30 June 2014 total $1,207.4 million (2013: $1,315.6 million).

75Endeavour Energy Annual Performance Report 2013–14
FINANCIAL STATEMENTS 9
22 Operating leases
Leases as lessee
2014 $m
2013 $m
Non-cancellable operating leases are payable as follows:
Within twelve months 7.0 6.5
Twelve months or longer and not longer than five years 10.4 12.1
Longer than five year 1.5 2.0
Total (including GST) 18.9 20.6
GST credits 1.7 1.9
The Corporation leases property under operating leases expiring from one to sixteen years. Leases generally provide the entity with a right of renewal, at which time all terms are renegotiated. Lease payments comprise a base amount plus an incremental contingent rental. Contingent rentals are based on either movements in the Consumer Price Index or operating criteria.
Leases as lessorThe Corporation leases out its properties, including premises, land and communications towers, under operating lease agreements at market rentals, predominantly on a fixed term basis. The future minimum lease payments under non-cancellable leases are:
2014 $m
2013 $m
Within twelve months 0.8 0.5
Twelve months or longer and not longer than five years 0.8 0.7
Total (including GST) 1.6 1.2
GST payable 0.1 0.1
During the year ended 30 June 2014, $0.7 million (2013: $0.7 million) was recognised as rental income in profit and loss in relation to these properties.

76
NOTES TO THE FINANCIAL STATEMENTSFOR THE YEAR ENDED 30 JUNE 2014
9
23 Reconciliation of cash flows from operating activities
2014 $m
2013 $m
Profit for the year 301.0 298.9
Add/(less) non-cash items
Depreciation non-current assets 174.1 160.1
Amortisation non-current assets 15.2 16.7
Amortisation of discounts/premiums 7.7 6.3
Non cash additions including capital contributions (91.8) (74.6)
Net (profit)/loss on disposal of property, plant and equipment 1.2 (0.8)
Reserve movements 11.1 45.9
Changes in assets and liabilities
(Increase)/decrease in trade and other receivables (34.6) 25.6
(Increase)/decrease in unread meters 3.8 (1.1)
(Increase)/decrease in derivative financial assets 0.6 12.8
(Increase)/decrease in inventories (3.7) (2.0)
Increase/(decrease) in trade and other payables 1.5 (39.6)
Increase/(decrease) in provisions (15.5) (68.7)
Increase/(decrease) in current tax balances (59.1) (7.7)
Increase/(decrease) in deferred tax liabilities 13.5 54.2
Increase/(decrease) in derivative financial liabilities 0.7 (17.4)
Increase/(decrease) in other liabilities 1.6 (0.8)
Net cash from operating activities 327.3 407.8
24 Superannuation – Defined benefits planThe Corporation has a defined benefit superannuation plan covering a significant number of employees, which requires contributions to be made to a separately administered fund.
(a) Nature of the benefits provided by the fundThe Energy Industries Superannuation Scheme (the Scheme) is divided into seven divisions, of which Divisions B, C and D provide defined benefits, that is at least a component of the final benefit is derived from a multiple of member salary and years of membership. Members receive lump sum or pension benefits on retirement, death, disablement and withdrawal. Divisions B, C and D are closed to new members except for members of eligible schemes who can transfer their entitlements into the Scheme.
Disclosures below are prepared in relation to Divisions B, C and D only, these Divisions are referred to collectively as “the Fund” hereafter.
(b) Description of the Regulatory FrameworkThe Scheme was established on 30 June 1997 by a Trust Deed made under an Act of the NSW Parliament, for the purpose of providing retirement benefits for employees of certain Energy Industries bodies in NSW.
The Scheme is regulated primarily by the Superannuation Industry (Supervision) Act 1993 (Cth) (“the SIS legislation”), but is also subject to regulation under the Superannuation Administration Act 1996 (NSW).
The SIS legislation governs the superannuation industry and provides the framework within which superannuation plans operate. The SIS Regulations require an actuarial valuation to be performed for each defined benefit superannuation plan every three years, or every year if the plan pays defined benefit pensions, unless an exemption has been obtained.
The prudential regulator, the Australian Prudential Regulation Authority (APRA), licenses and supervises regulated superannuation plans.
The Scheme has received an exemption from annual actuarial valuation and therefore actuarial valuations are only required triennially. The last actuarial valuation of the Scheme was performed as at 30 June 2012.

77Endeavour Energy Annual Performance Report 2013–14
FINANCIAL STATEMENTS 9
24 Superannuation – Defined benefits plan continued
(c) Risk exposureThere are a number of risks to which the Fund exposes the employer. The more significant risks relating to the defined benefits are:
• Investment risk – the risk that investment returns will be lower than assumed and the employer will need to increase contributions to offset the shortfall.
• Longevity risk – the risk that pensioners live longer than assumed, increasing future pensions.
• Pension indexation risk – the risk that pensions will increase at a rate great than assumed, increasing future pensions.
• Salary growth risk – the risk that wages or salaries (on which future benefit amounts for active members will be based) will rise more rapidly than assumed, increasing defined benefit amounts and thereby requiring additional employer contributions.
• Legislative risk – the risk that legislative changes could be made, increasing the cost of providing defined benefits.
Defined benefit fund assets are invested with independent fund managers and have a diversified asset mix. The Fund has no significant concentration of investment risk or liquidity risk.
(d) Description of other entities’ responsibilities for governance of the fundThe Scheme’s Trustee is responsible for governance of the Scheme. The Trustee has a legal obligation to act solely in the best interests of Scheme beneficiaries. The Trustee has the following roles:
• Administration of the Scheme and payment to beneficiaries from Scheme assets when required, in accordance with Scheme rules;
• Management and investment of Scheme assets;
• Compliance with other applicable regulations; and
• Compliance with the Trust Deed.
(e) Description of significant eventsThere were no fund amendments, curtailments or settlements during the year.

78
NOTES TO THE FINANCIAL STATEMENTSFOR THE YEAR ENDED 30 JUNE 2014
9
24 Superannuation – Defined benefits plan continued
(f) Reconciliation of the Net Defined Benefit (Liability)/AssetThe following tables summarise the components of net benefit expense recognised in the profit or loss, actuarial gains and losses recognised in other comprehensive income, and funded status and amounts recognised in the Statement of Financial Position.
Present value of obligation
$m
Fair value of plan assets
$mTotal
$m
At 1 July 2012 (434.2) 276.7 (157.5)
Current service cost (12.7) – (12.7)
Interest (expense)/income (3.9) – (3.9)
(Expense)/income recognised in profit or loss (16.6) – (16.6)
Contributions by fund participants
Employers – 14.0 14.0
Plan participants (3.8) 3.8 –
(3.8) 17.8 14.0
Remeasurements
Return on plan assets, excluding amounts included in interest expense/(income) – 40.7 40.7
Gain/(loss) from change in demographic assumptions – – –
Gain/(loss) from change in financial assumptions 7.9 – 7.9
(Expense)/income recognised in Other Comprehensive Income 7.9 40.7 48.6
Benefits paid 26.7 (26.7) –
At 30 June 2013 (420.0) 308.5 (111.5)
At 1 July 2013 (420.0) 308.5 (111.5)
Current service cost (10.9) – (10.9)
Interest (expense)/income (15.0) 11.6 (3.4)
(Expense)/income recognised in profit or loss (25.9) 11.6 (14.3)
Contributions by fund participants
Employers – 13.0 13.0
Plan participants (3.2) 3.2 –
(3.2) 16.2 13.0
Remeasurements
Return on plan assets, excluding amounts included in interest expense/(income) – 23.1 23.1
Gain/(loss) from liability experience 2.8 – 2.8
Gain/(loss) from change in financial assumptions (9.1) – (9.1)
(Expense)/income recognised in Other Comprehensive Income (6.3) 23.1 16.8
Benefits paid 29.0 (29.0) –
Taxes, premiums and expenses paid 2.3 (2.3) –
At 30 June 2014 (424.1) 328.1 (96.0)

79Endeavour Energy Annual Performance Report 2013–14
FINANCIAL STATEMENTS 9
24 Superannuation – Defined benefits plan continued
(g) Fair value of fund assetsAll Division B, C and D assets are held in Pool B of the Scheme. Pool B, in turn, holds units invested in the Energy Investment Fund, a pooled superannuation trust. As such, assets are not separately invested for each employer and it is not possible or appropriate to disaggregate and attribute fund assets to individual entities. Disclosures below relate to total assets of Pool B of the Scheme.
Total $m
Quoted prices in active markets for
identical assetsLevel 1
$m
Significant observable
inputsLevel 2
$m
Unobservable inputs
Level 3 $m
30 June 2014
Asset category
Energy Investment Fund 2,377.1 – 2,377.1 –
Total 2,377.1 – 2,377.1 –
Some Pool B assets are invested in accordance with member investment choices. For Pool B assets invested in the Energy Investment Fund but not subject to member investment choice, the percentage invested in each asset class at the reporting date is:
2014 %
2013 %
Australian equities 17 14
International equities 23 22
Emerging market equities 4 –
Property 7 7
Private equity 1 1
Infrastructure 10 9
Alternatives 25 18
Fixed income 12 20
Cash 1 9
Total 100 100
Derivatives can be used by investment managers, however strict investment guidelines detail all limits approved on the use of derivatives. The use of derivatives is governed by investment policies, which permit the use of derivatives to change the Fund’s exposure to particular assets. The Trustee requires that derivative financial instruments are not entered into for speculative purposes or to gear the Fund, and that all derivative positions are (a) fully cash covered; (b) are offset to existing assets; or (c) are used to alter exposures in underlying asset classes. Compliance with policies and exposure limits are reviewed by the Trustee on a continual basis. As such, investment managers make limited use of derivatives.
(h) Fair value of the Corporation’s own financial instrumentsThe fair value of Plan assets includes no amounts relating to any of the Corporation’s own financial instruments, or any property occupied by, or other assets used by, the Corporation.
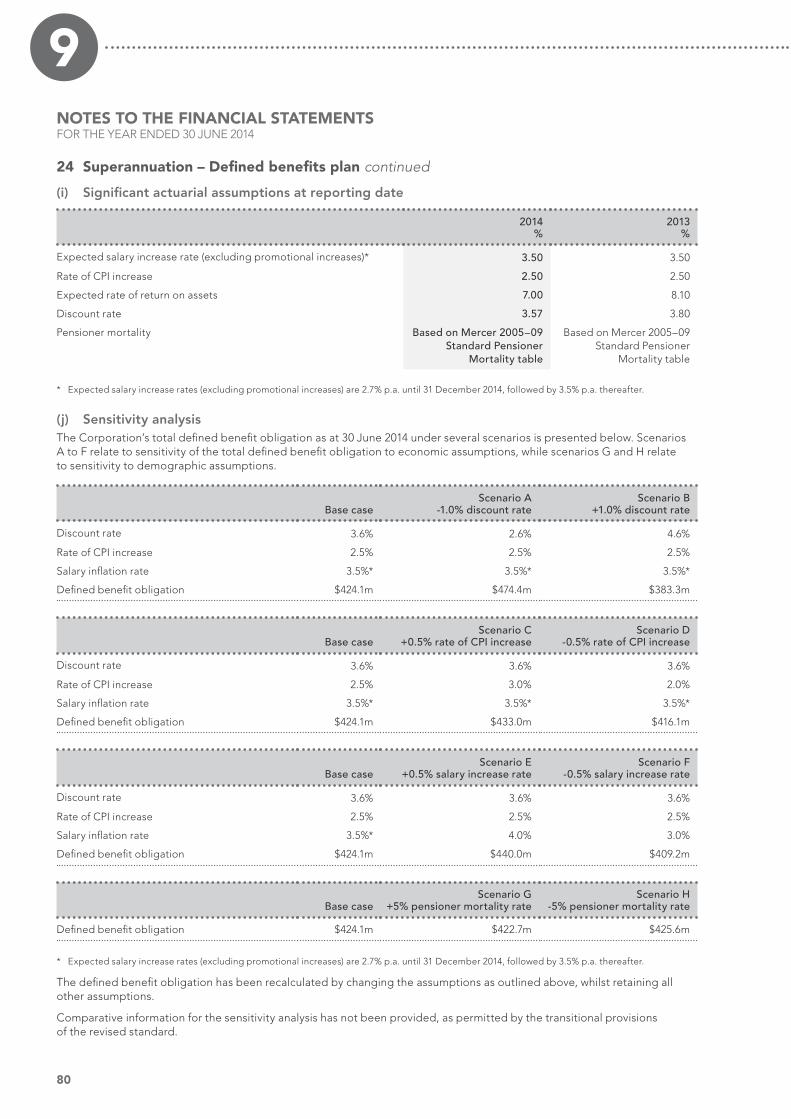
80
NOTES TO THE FINANCIAL STATEMENTSFOR THE YEAR ENDED 30 JUNE 2014
9
24 Superannuation – Defined benefits plan continued
(i) Significant actuarial assumptions at reporting date
2014 %
2013 %
Expected salary increase rate (excluding promotional increases)* 3.50 3.50
Rate of CPI increase 2.50 2.50
Expected rate of return on assets 7.00 8.10
Discount rate 3.57 3.80
Pensioner mortality Based on Mercer 2005–09 Standard Pensioner
Mortality table
Based on Mercer 2005–09 Standard Pensioner
Mortality table
* Expected salary increase rates (excluding promotional increases) are 2.7% p.a. until 31 December 2014, followed by 3.5% p.a. thereafter.
(j) Sensitivity analysisThe Corporation’s total defined benefit obligation as at 30 June 2014 under several scenarios is presented below. Scenarios A to F relate to sensitivity of the total defined benefit obligation to economic assumptions, while scenarios G and H relate to sensitivity to demographic assumptions.
Base caseScenario A
-1.0% discount rateScenario B
+1.0% discount rate
Discount rate 3.6% 2.6% 4.6%
Rate of CPI increase 2.5% 2.5% 2.5%
Salary inflation rate 3.5%* 3.5%* 3.5%*
Defined benefit obligation $424.1m $474.4m $383.3m
Base caseScenario C
+0.5% rate of CPI increaseScenario D
-0.5% rate of CPI increase
Discount rate 3.6% 3.6% 3.6%
Rate of CPI increase 2.5% 3.0% 2.0%
Salary inflation rate 3.5%* 3.5%* 3.5%*
Defined benefit obligation $424.1m $433.0m $416.1m
Base caseScenario E
+0.5% salary increase rateScenario F
-0.5% salary increase rate
Discount rate 3.6% 3.6% 3.6%
Rate of CPI increase 2.5% 2.5% 2.5%
Salary inflation rate 3.5%* 4.0% 3.0%
Defined benefit obligation $424.1m $440.0m $409.2m
Base caseScenario G
+5% pensioner mortality rateScenario H
-5% pensioner mortality rate
Defined benefit obligation $424.1m $422.7m $425.6m
* Expected salary increase rates (excluding promotional increases) are 2.7% p.a. until 31 December 2014, followed by 3.5% p.a. thereafter.
The defined benefit obligation has been recalculated by changing the assumptions as outlined above, whilst retaining all other assumptions.
Comparative information for the sensitivity analysis has not been provided, as permitted by the transitional provisions of the revised standard.

81Endeavour Energy Annual Performance Report 2013–14
FINANCIAL STATEMENTS 9
24 Superannuation – Defined benefits plan continued
(k) Asset-Liability matching strategiesWe are not aware of any asset and liability matching strategies currently adopted by the Fund.
(l) Funding arrangements Funding arrangements are reviewed at least every three years following release of the triennial actuarial review, and was last reviewed following completion of the triennial review as at 30 June 2012. Contribution rates are set following discussions between the employer and the Trustee. Funding positions are reviewed annually and funding arrangements may be adjusted as required after each annual review.
Surplus/deficitThe following is a summary of the 30 June 2014 financial position of the Fund calculated in accordance with AAS 25 Financial Reporting by Superannuation Plans.
2014 $m
2013 $m
Accrued benefits 312.9 311.0
Net market value of fund assets (328.2) (308.5)
Net (surplus)/deficit (15.3) 2.5
Contribution recommendationsRecommended contribution rates for the Corporation are:
• Division B – multiple of member contributions 1.9x
• Division C – % member salary 2.5%
• Division D – multiple of member contributions 1.64x
• Additional lump sum $p.a. $5.2m
Significant actuarial assumptions at reporting dateEconomic assumptions adopted for the 30 June 2012 actuarial investigation of the Fund were:
Weighted-average assumptions
Expected rate of return on fund assets backing current pension liabilities 7% pa
Expected rate of return on fund assets backing other liabilities 7% pa
Expected salary increase rate 2.7% pa until 31/12/2014 and 3.5% thereafter
Expected rate of CPI increase 2.5% pa
Expected contributionsExpected employer contributions for the financial year to 30 June 2014
2014 $m
2013 $m
Expected employer contributions 11.1 11.8
Maturity profile of defined benefit obligationThe weighted average duration of the defined benefit obligation is 13.1 years.

82
NOTES TO THE FINANCIAL STATEMENTSFOR THE YEAR ENDED 30 JUNE 2014
9
24 Superannuation – Defined benefits plan continued
(m) Nature of asset/liabilityIf a surplus exists in the employer’s interest in the Fund, the employer may be able to take advantage of it in the form of a reduction in the required contribution rate, depending on the advice of the Fund’s actuary. Where a deficiency exists, the employer is responsible for any difference between the employer’s share of Fund assets and the defined benefit obligation.
25 Events Subsequent to Balance DateThe financial statements of Endeavour Energy for the year ended 30 June 2014 were authorised for issue in accordance with a resolution of the Directors on 10 September 2014.
There are no known events that would impact the state of affairs of the entity or have a material impact on the financial statements up to that date.
End of audited Financial Statements

83Endeavour Energy Annual Performance Report 2013–14
FINANCIAL STATEMENTS 9
Pursuant to Section 41C of the Public Finance and Audit Act 1983, we state that in the opinion of the Directors of Endeavour Energy:
(a) The accompanying financial statements and notes are a general purpose financial report which has been prepared in accordance with Australian Accounting Standards, the State Owned Corporations Act 1989, the Public Finance and Audit Act 1983, the Public Finance and Audit Regulation 2010 and Accounting Interpretations, and give a true and fair view of the financial position of Endeavour Energy as at 30 June 2014 and its financial performance for the year ended on that date;
(b) At the date of this statement, there are reasonable grounds to believe that Endeavour Energy will be able to pay its debts as and when they become due and payable; and
(c) We are not aware of any circumstances at the date of this statement that would render any particulars included in the financial report to be misleading or inaccurate.
This declaration is made in accordance with a resolution of the Board of Directors.
Vince Graham Roger Massy-Greene Chief Executive Officer Chairman
Sydney 10 September 2014 10 September 2014
STATEMENT BY DIRECTORSFOR THE YEAR ENDED 30 JUNE 2014

84
APPENDICES
10Five-year statistical table 85
Consultants 86
Credit card certification 86
Digital information security 86
Disclosure of approved exemptions 86
Executive changes and remuneration 87
Funds granted to non-government organisations 89
Government Information (Public Access) Regulation 2009 89
Greenhouse gas emissions 92
Guaranteed Customer Service Standards 92
Investment performance 93
Land disposal 93
Liability management performance 93
Network prices 2013–14 93
Overseas travel 94
Public Interest Disclosures Act 94
Summary of legislative changes and judicial decisions 94
Senior executives 97
Workforce diversity statistics 97
Glossary 98
Index 99
Location and contacts inside back cover
FOR THE YEAR ENDED 30 JUNE 2014

85Endeavour Energy Annual Performance Report 2013–14
APPENDICES 10Five-year statistical table
(1) 2009–10 2010–11 2011–12 2012–13 2013–14
EFFICIENCY
Employment (2) 2,888 2,925 2,824 2,635 2,533
Output/employee (GWh) (3) 6.0 6.0 5.7 5.9 6.1
Sales revenue ($m) (4) 2,133.9 1,936.2 1,225.0 1,299.2 1,274.4
Customer/employee ratio (5) 299.8 300.0 306.3 328.2 354.1
System loss index (%) (6) 4.6 3.9 4.0 4.2 4.0
Days sick leave/employee 7.1 7.0 7.2 7.2 6.5
Lost time incidents frequency rate (LTIFR) (7) 3.1 4.5 3.6 2.6 4.8
EFFECTIVENESS
Output (GWh) (8) 17,411 17,501 16,506 16,001 15,637
Supply reliability (minutes) (9) 79.4 72.0 81.8 88.0 83.0
Customer service indicator (10)
Target 82%–84% 82% 75% 75% 75%
Result 80% 79% 76% 75% 78%
FINANCIAL INDICATORS
EBIT ($m) 439.3 546.9* 585.9 625.8 580.8
Operating profit after tax ($m) 179.0 244.7* 265.5 298.9 301.0
Revenue ($m) (11) 2,272.1 2,156.8 1,476.9 1,492.8 1,497.6
Return on assets (%) (12) 9.5 10.8* 10.6 10.1 8.7
Return on equity (%) (13) 17.3 20.5* 19.8 19.7 18.2
Asset base ($m) 4,940.6 5,159.1 5,936.4 6,400.8 6,912.9
Asset sales ($m) (14) 4.8 3.6 3.8 10.7 3.5
Financial distribution ($m) 215.3 266.4 302.3 337.7 255.1
Tax equivalent ($m) (15) 72.7 109.6 115.7 128.2 77.0
Dividend 142.6 156.8 186.6 209.5 178.1
Special Dividend 0.0 863.7 0.0 0.0 0.0
Gross external debt ($m) 2,414.3 2,617.5 3,003.8 3,358.4 3,768.9
Gearing ratio (%) (16) 67.7 68.0 67.4 67.9 68.7
Times interest earned (17) 2.3 2.9* 2.9 3.2 2.9
Prior year statistics may have changed in line with amendments to comparative financial statement disclosures and amended definitions, to ensure consistency on an annual basis.
* Excludes the impact resulting from the gain on the sale of retail net assets amounting to $759.3m.
(1) All dollar amounts are reported in real dollars.
(2) Full time equivalent staff as at 30 June.
(3) Network GWh sold per average number of FTE employees.
(4) Sales revenue includes total electricity sales and network use of system income only. Following the sale of the Retail net assets on 28 February 2011, there have been no further sales of electricity.
(5) Average network customers per average number of FTE employees.
(6) Energy imported less energy consumption, divided by energy imported.
(7) The LTIFR indicates how frequently lost time injuries have occurred per million hours worked. It is calculated by taking the number of LTI’s reported in the previous 12 months (multiplied by 1,000,000) and then dividing by the average number of employees for the previous 12 months (multiplied by 2,000 hours worked per FTE).
(8) Network sales (GWh) including accruals and off peak bulk transfers.
(9) Average minutes per customer per year without supply for unplanned outages.
(10) The Customer Service Indicator was based on an index covering both Retail and Network factors up to and including March 2011. From 1 July 2011 the Customer Satisfaction Indicator was determined on Network factors only, which means this data is not comparable.
(11) Revenue includes sales revenue and other income, including capital contributions.
(12) EBIT divided by the average asset base.
(13) Operating profit after tax divided by average equity.
(14) Total proceeds from asset sales.
(15) Defined as income tax expense per NSW Treasury.
(16) Debt divided by debt plus equity.
(17) Times interest earned calculated by adding the net interest expense to the profit before income tax and dividing by the net interest expense.

86
10ConsultantsIn 2013–14 Endeavour Energy engaged two consultants for projects (equal to or greater than $50,000) totalling $0.27 million, as detailed below:
Consultant Purpose Cost $m
Ernst & Young To provide technical advice in relation to National Energy Customer Framework (NECF) and AER Regulatory Submissions.
0.21
National Institute of Economic & Industry Research Pty Ltd
To provide technical consulting in relation to modelling of energy demand forecasts.
0.06
Total 0.27
Endeavour Energy also engaged two consultants for less than $50,000 during 2013–14 at a combined cost of $0.08m for provision of managerial and operational advice.
Credit card certificationEndeavour Energy’s corporate and purchasing card program is governed by approved policies and procedures that were developed having regard to the Treasury Circular 05/06 Credit Card Use – Best Practice Guide published in August 2005 (originally published in 1999), Treasurer directions and Premier’s memoranda.
Digital information securityEndeavour Energy has adopted the NSW Government recommended standard for the implementation of the information security management system (ISMS), ISO27001 and has developed internal policies and procedures related to digital information security in alignment to that standard. Endeavour Energy undertakes a managed process of penetration testing and internal audits to test its controls to mitigate identified risks to its digital information. The current ISMS and associated digital information systems security controls are currently deemed adequate for the foreseeable future.
Disclosure of approved exemptions
Reference Comment
s. 41B(c) PF&AA¹ Financial statements
Exemption from preparing manufacturing, trading, and profit and loss statements. Endeavour Energy is required to prepare a summarised Operating Statement, summarising major categories of revenues and expenses.
Schedule 1 ARSBR² Payment of accounts
Statutory SOCs are not subject to the payment of accounts provision in c13 of the Public Finance and Audit Regulation 2010.
Schedule 1 ARSBR Time for Payment of Accounts
As above.
s. 7(1)(a)(ia) ARSBA³ Financial Statement of Controlled Entities
Exemption from preparing manufacturing and trading statements. Endeavour Energy is required to prepare a summarised Operating Statement (i.e. summarising major categories of revenues and expenses).
1 Public Finance and Audit Act 1983
2 Annual Reports (Statutory Bodies) Regulation 2005
3 Annual Reports (Statutory Bodies) Act 1984

87Endeavour Energy Annual Performance Report 2013–14
APPENDICES 10Executive remuneration
General principles for remuneration of Executive OfficersEndeavour Energy’s remuneration strategies are designed to attract and retain Executive Officers who drive business performance and who consistently demonstrate high standards of behaviour consistent with Endeavour Energy’s values and Code of Conduct. Remuneration recommendations for Group Executive Officers that report to the Chief Executive Officer are considered and approved by the Board. The Chief Executive Officer considers and approves those recommendations for Executives that report to the Chief Operating Officer.
Components of remunerationEndeavour Energy Executive Officers are employed under performance-based employment contracts. Total remuneration for Executive Officers consists of fixed remuneration, ie the annual salary paid inclusive of superannuation contributions and all salary sacrificed benefits; and an annual “at risk” payment that represents the proportion of total remuneration that is “at risk” for each Executive Officer.
Fixed remunerationAs a condition of employment, remuneration of Executive Officers is reviewed in April each year in-line with market trends and is based on rigorous performance assessments of each Executive Officer. In approving increases to the remuneration of Executive Officers, the Board or the Chief Executive Officer considers the outcomes of these performance assessments, advice from external remuneration specialists on Executive salary trends and contemporary remuneration practices, movement in the consumer price index and NSW State Wages Policy.
On 30 April 2014, the Board approved an average 2.5% increase in the remuneration of Group Executive Officers consistent with the NSW Government Wages Policy. Endeavour Energy’s Chief Executive Officer subsequently approved the same average increase for Executive Leadership Team members.
Annual “at risk” paymentAnnual “at risk” payments are made to contract managers on the basis of individual performance assessed against pre-agreed measures and targets aligned to Endeavour Energy’s Corporate Plan and Statement of Corporate Intent (SCI).
Eligibility is contingent on a rigorous assessment of leadership performance and achievement of business targets for each manager during the course of the year. The Board or the Chief Executive Officer as appropriate reviews these performance assessments and approves all annual performance payments to Executive Officers.
Group Executive employed by Endeavour EnergyAn eight member Executive Leadership Group (ELG) was established in October 2012 to drive industry reform. Each Group Executive is paid by a nominated business. Endeavour Energy is responsible for contractual payments to the following executives and these costs are then shared by the three network businesses.
NamePosition at 30 June 2014 Remuneration a
“At risk” payment b 2013–14 Performance criteria
V. Graham CEO Ausgrid, Endeavour Energy and Essential Energy
$768,750 $175,275 Led strategic safety initiatives including analysis of network fatal risks and fair and just culture program. Championed efficiency and savings strategies across three network businesses in order to contain increases in network charges to CPI or less from 1 July 2013 and 1 July 2014. Delivered AER regulatory submissions on time with an emphasis on consumer engagement, prudent capital plans and real improvements in operating expenditure. Maintained continued focus on network reliability through network reliability plans. Supported the development of leadership capability programs.
D. Lucas Group Executive People and Services
$443,546 $57,353 Delivered strategic procurement savings and developed a common procurement framework across Networks NSW. Developed and delivered Networks NSW Customer Strategy. Implemented a consistent risk management framework. Developed and commenced implementation of common leadership development and ethics programs. Oversaw the development of a fair and just culture program.
a excludes “at risk’ payment.
b “at risk” payments are based on 2013–14 performance against key criteria, approved by the Board in September 2014.

88
10Network business Executive employed by Endeavour Energy
NamePosition at 30 June 2014 Remunerationa
“At risk” paymentb 2013–14 Performance criteria
R. Howard Chief Operating Officer
$474,447 $77,780 Led the delivery of strategic safety and structural cost saving initiatives. Year on year improvement in a number of performance measures including reliability. Led the implementation of new functional models.
J. Battersby Chief Engineer $298,438 $48,680 Implemented a new framework for reviewing network standards and the risk-based assessment of network capital proposals. Performed a key role in the development of the regulatory submissions to the AER.
T. Christopher General Manager Network Development
$298,375 $45,600 Led the efficient delivery of the network program, and the establishment of a workforce planning framework and benchmarking analysis framework.
M. Ghattas General Manager Finance and Compliance
$274,725 $43,385 Facilitated the Company’s overall efficiency program and undertook a key role in the development and delivery of the regulatory submissions to the AER.
D. Neville General Manager Health, Safety & Environment
$268,938 $36,542 Successfully implemented a number of new initiatives including the risk-based safety audit plan, the automated external defibrillator rollout and the random alcohol and drug testing program.
I. Robinson General Manager IC&T
$268,513 $31,128 Led a number of reforms at Networks NSW level and progress the efficient delivery of new sourcing contracts to provide future operating benefits.
B. Rowley General Manager People & Services
$360,800 $47,606 Implemented new sourcing initiatives, leveraged further savings from procurement activities and facilitated various employee change programs.
S. Ryan General Manager Network Operations
$325,250 $50,630 Delivered strong performance outcomes with significant work being done in driving productivity improvement and developing new resource management initiatives.
a excludes “at risk” payment
b “at risk” payments are based on 2013-14 performance against key criteria, and approved by the Board or Chief Executive Officer in September 2014.

89Endeavour Energy Annual Performance Report 2013–14
APPENDICES 10Funds granted to non-government organisationsEndeavour Energy lends support to selected community organisations that reflect its obligations as a state-owned corporation and align to its Corporate Plan.
Government Information (Public Access) Act 2009The Government Information (Public Access) Act 2009 (NSW) (GIPA Act) replaced the Freedom of Information Act 1989 (NSW) on 1 July 2010. The GIPA Act has established a comprehensive system for public access to government information. Endeavour Energy is subject to the GIPA Act and is committed to complying with the Act in a fair and objective manner when dealing with external requests for access to company information. We support the proactive release of information where it is in the public interest to do so.
Review of program for release of informationDuring 2013–14 Endeavour Energy’s review of its program for release of information, which was undertaken as required by section 7(3) of the GIPA Act, included the review of its policies, procedures, forms and templates regarding processing requests for access to government Information; the training of staff in GIPA Act compliance; publication of contractual information into a centralised database; a review of its website and publication of relevant information regarding corporate governance and the network business.
Total number of access applications received during the yearIn 2013–14 Endeavour Energy received 19 new formal access applications for information pursuant to the GIPA Act. As at 30 June 2014, two formal access applications were ongoing. The applications were from members of the public, media, private sector businesses, lawyers and investigators.
In response to the formal access applications that were finalised in 2013–14 (including two applications carried over from 2012–13), full access was provided on 10 occasions. With respect to the remaining access applications, six were granted in part, one was not dealt with due to the information being previously provided in response to a subpoena, and two applicants received refunds of their $30 application fee because the requested information was not held by Endeavour Energy. A variety of public interest considerations were taken into account in dealing with these applications. These are set out in Table E, below. In the course of determining access applications during the financial year, Endeavour Energy did not rely on any of the conclusive presumptions of overriding public interest against disclosure (as set out in schedule 1 of the GIPA Act).
Statistical information about access applicationsAs required by section 7 and schedule 2 of the Government Information (Public Access) Regulation 2009 (NSW), the following tables provide a summary of the responses to requests made pursuant to the GIPA Act in 2013–14.
Table A: Number of applications by type of applicant and outcome
Access granted
in full
Access granted
in part
Access refused
in fullInformation
not held
Information already
available
Refuse to deal with
application
Refuse to confirm/deny
whether information
is heldApplication withdrawn
Media 1 – – – – – – –
Members of Parliament – – – – – – – –
Private sector business 4 1 – – – – – –
Not for profit organisations or community groups – – – – – – – –
Members of the public (application by legal representative) 4 4 – 1 – 1* – –
Members of the public (other) 1 1 – 1 – – – –
* Information previously provided in response to a subpoena on behalf of the applicant.
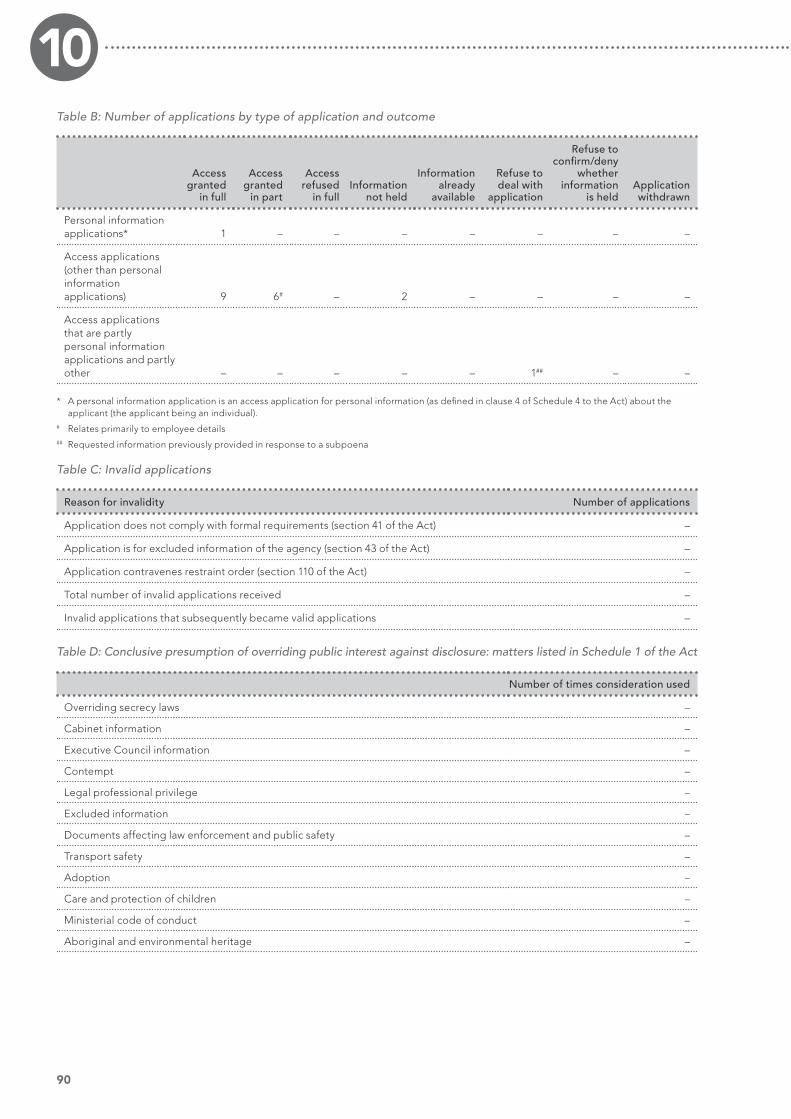
90
10Table B: Number of applications by type of application and outcome
Access granted
in full
Access granted
in part
Access refused
in fullInformation
not held
Information already
available
Refuse to deal with
application
Refuse to confirm/deny
whether information
is heldApplication withdrawn
Personal information applications* 1 – – – – – – –
Access applications (other than personal information applications) 9 6# – 2 – – – –
Access applications that are partly personal information applications and partly other – – – – – 1## – –
* A personal information application is an access application for personal information (as defined in clause 4 of Schedule 4 to the Act) about the applicant (the applicant being an individual).
# Relates primarily to employee details## Requested information previously provided in response to a subpoena
Table C: Invalid applications
Reason for invalidity Number of applications
Application does not comply with formal requirements (section 41 of the Act) –
Application is for excluded information of the agency (section 43 of the Act) –
Application contravenes restraint order (section 110 of the Act) –
Total number of invalid applications received –
Invalid applications that subsequently became valid applications –
Table D: Conclusive presumption of overriding public interest against disclosure: matters listed in Schedule 1 of the Act
Number of times consideration used
Overriding secrecy laws –
Cabinet information –
Executive Council information –
Contempt –
Legal professional privilege –
Excluded information –
Documents affecting law enforcement and public safety –
Transport safety –
Adoption –
Care and protection of children –
Ministerial code of conduct –
Aboriginal and environmental heritage –

91Endeavour Energy Annual Performance Report 2013–14
APPENDICES 10Table E: Other public interest considerations against disclosure: matters listed in table to section 14 of the Act
Number of occasions when application not successful
Responsible and effective government –
Law enforcement and security –
Individual rights, judicial processes and natural justice 4*
Business interests of agencies and other persons 1*
Environment, culture, economy and general matters –
Secrecy provisions –
Exempt documents under interstate Freedom of Information legislation –
* Part of requested information only – balance provided in full
Table F: Timeliness
Number of applications
Decided within the statutory timeframe (20 days plus any extensions) 16
Decided after 35 days (by agreement with applicant) 3
Not decided within time (deemed refusal) –
Total 19
Table G: Number of applications reviewed under Part 5 of the Act (by type of review and outcome)
Decision varied
Decision upheld Total
Internal review – – –
Review by Information Commissioner* – – –
Internal review following recommendation under section 93 of Act* – – –
Review by ADT – – –
Total – – –
* The Information Commissioner does not have the authority to vary decisions, but can make recommendation to the original decision-maker. The data in this table indicates whether a recommendation to vary or uphold the original decision has been made.
Table H: Applications for review under Part 5 of the Act (by type of applicant)
Number of applications for review
Applications by access applicants –
Applications by persons to whom information the subject of access application relates (see s.54 GIPA Act) –

92
10Greenhouse gas emissions
Emissions Source ConsumptionConsumption
Units Tonnes CO2 % Total
SCOPE 1 EMISSIONS
Petroleum products combusted in transport vehicles 3,402 kilolitres 8,758 1.47
Petroleum products combusted in stationary units (generators) * 206 kilolitres 553 0.09
HFC losses* NA –
SF6* 24,388 kilograms 5,188 0.87
Combusted petroleum based oils and greases* 28.5 kilolitres 31
Acetylene* 35 metres cubed <1 0.00
Bottled LPG* 23 kilolitres 35 0.01
Total Scope 1 Emissions 14,565 2.44
SCOPE 2 EMISSIONS
Electricity consumed by Endeavour Energy 15,629,792 kilowatt hours 13,911 2.34
Distribution Network Losses 644 gigawatt hours 573,160 96.30
Total Scope 2 Emissions 587,071 98.64
EMISSION REDUCTIONS
Energy production 5,215 kilowatt hours 5
GreenPower 3,907 megawatt hours 3,439
Fleet Efficiency Program 873 kilolitres 2,260
Huntingwood Lighting Upgrade 34 megawatt hours 30
Waste Reduction (Scope 3) 599 tonnes 719
Total emission reduction (including Scope 3) 6,453
NET GHG EMISSIONS
Scope 1 + Scope 2 – Reductions 595,183 100
* Data is not yet available for 2013–14 period; as such values are estimated based on previous years’ NGERS report.
Guaranteed customer service standardsThe NSW Government introduced Customer Service Standards for reliability in 2006 to provide financial compensation to eligible customers who have experienced poor reliability of supply from our distribution network and who make a valid claim.
The standards require us to compensate eligible customers who experience too many supply interruptions in one year or if supply is interrupted for too long. Eligibility criteria apply. Power outages that are part of normal network operations or are beyond our reasonable control are not eligible for compensation.
Interruption Frequency StandardThe Interruption Frequency Standard is the maximum number of supply interruptions a customer should experience in a financial year. Depending upon where the customer’s premises are located, a different standard will apply as set out in the table below.
Location Number of interruptions
Metropolitan area 4 interruptions (each interruption must be ≥ 4 hours duration)
Non metropolitan area 4 interruptions (each interruption must be ≥ 5 hours duration)

93Endeavour Energy Annual Performance Report 2013–14
APPENDICES 10Interruption Duration StandardThe Interruption Duration Standard is the maximum duration of any supply interruptions you should experience. Depending upon where your premises are located, a different standard will apply as set out in the table below.
Location Duration of interruption
(in hours)
Metropolitan area 12
Non metropolitan area 18
Further information on eligibility criteria, exclusions and how to make a claim are available on our website www.endeavourenergy.com.au.
As at 30 June 2014, Endeavour Energy compensated six customers for a total cost of $480 for not meeting these service levels.
Investment performanceIn accordance with NSW Treasury guidelines, investment return is benchmarked against the NSW Treasury Corporation’s hourglass cash facility.
Endeavour Energy is a net borrower in the marketplace. The interest income disclosed in the audited accounts represents income which is derived from the receipt of interest on our bank account being in credit and investment returns of average surplus funds over the reporting period.
In 2013–14, our investment performance was 2.6% compared to the benchmark of 2.9%, with an average investment balance of $1.8m. This reflected the short-term nature of our investments, with the return closely in line with the Reserve Bank of Australia cash rate.
Land disposalEndeavour Energy did not dispose of any land worth more than $5 million during the reporting year.
Access to documents concerning the details of properties disposed of during the reporting year may be made in accordance with the Government Information (Public Access) Act 2009.
Liability management performanceAt 30 June 2014, our total debt was $3.8 billion (current capital value), sourced entirely through NSW Treasury Corporation. The business actively manages the debt portfolio to limit the cost of funds by using the portfolio approach. Weighted average cost of debt for the year was 6.8%.
We continued to use NSW Treasury Corporation’s short-term borrowing facility to help meet cash requirements and reduce fixed borrowings.
At 30 June 2014, 74% of our total debt was fixed-rate debt maturing out to 2041, 19% was inflation-indexed debt maturing out to 2035, and the remaining 7% was floating rate debt.
Network prices 2013–14Each June the AER is required to approve Endeavour Energy’s proposed network prices for the upcoming financial year. On 26 June 2014, the AER advised that Endeavour Energy’s pricing proposal was compliant with Part I of the National Electricity Rules and the AER’s transitional decision for 2014–15, and that all forecasts associated with the proposal were reasonable.
Endeavour Energy’s network tariff strategy aims to move towards prices that better reflect the underlying costs of supplying network capacity while constraining average distribution price increases to at or below the rate of inflation.
Consistent with the network tariff objectives outlined above, our network tariff strategy aims to:
• contain our share of a customer’s bill to no more than the rate of inflation for (at least) the next five years
• align the largely fixed costs of the network and revenues
• provide outcomes that recognise the impacts that pricing decisions have on our customers
• pass through the full cost of TransGrid’s transmission services and preserve transmission price signals where possible
• explore tariff-based demand management opportunities, including voluntary time of use tariffs, and tariffs that target network constraints on a locational basis.

94
10
Public Interest Disclosures ActIn compliance with the Public Interest Disclosures Act 1994 (PID Act), Endeavour Energy has a policy for receiving, assessing and investigating public interest disclosures. Employees have been informed of the contents of the policy and the protection available under the Act through the publication and distribution of the Code of Conduct booklet and ‘Make the Right Choice’ discussion sessions.
During the period 1 July 2013 to 30 June 2014, Endeavour Energy dealt with ten public interest disclosures alleging corrupt conduct. Nine of the disclosures were received from eleven public officials performing their day to day function and one was received from a statutory authority. There was no public interest disclosures received in relation to maladministration, serious and substantial waste or government information contravention. Six public interest disclosures were finalised during the financial year.
Summary of Legislative changes and Judicial Decisions for 1 July 2013 to 30 June 2014
Material changes to Commonwealth legislation
Australian Jobs Act 2013 (Cth)The Act was assented to on 27 June 2013 and commenced on 27 December 2013. Pursuant to the Act, if Endeavour Energy is responsible for any projects that establish, expand or upgrade electricity facilities with an estimated capital expenditure of at least $500 million, it must submit an Australian Industry Participation Plan for approval. An Australian Industry Participation plan outlines how a project proponent or proponents of a major project will provide full, fair and reasonable opportunity to Australian industry to supply goods and services to the project during its construction and initial operation stage.
Fair Work Act 2009 (Cth)This Act was amended by the Fair Work Amendment Act 2013, assented to on 28 June 2013. The changes, commencing on 1 July 2013 and 1 January 2014, affect employers and employees and include:
• the expansion of circumstances in which an employee may request flexible working arrangements and obtain concurrent unpaid parental leave
• requirements that modern awards and enterprise agreements ensure consultation with employees about changes to regular rosters or ordinary hours of work
• empowering workers (including employees and contractors) who have been bullied at work to apply to the Fair Work Commission for any appropriate orders, other than pecuniary orders.
Overseas travel 2013–14
Name Title Travel to Dates Reason
Peter Norrie Senior Engineer Transmission Substation Equipment
China 23–25 October 2013 Transformer inspection (supplier: Toshiba)
Peter Norrie Senior Engineer Transmission Substation Equipment
China 29 November – 1 December 2013
Transformer inspection (supplier: Toshiba)
Alex Pinaca Equipment Specialist Engineer China 12–20 December 2013 Transformer witness testing (supplier: Toshiba)
Alex Pinaca Equipment Specialist Engineer China 7–9 January 2014 Transformer inspection (supplier: Toshiba)
Judy Ryan Manager HSE Management Systems & Reporting
Singapore 17–29 November 2013 Attend integrated safety management systems course
Patrick Strange Director New Zealand to Sydney and return
28–29 January 2014 25–26 February 2014 26–27 March 2014 29–30 April 2014 22–23 May 2014 27–28 May 2014 25–26 June 2014
Attend Board and Board Committee meetings Cost of travel shared by Ausgrid, Endeavour Energy and Essential Energy
Ty Christopher General Manager Network Development
New Zealand 17 – 20 June 2014 Presentation to Electric Energy Association New Zealand Conference All costs met by the Electric Energy Society of Australia

95Endeavour Energy Annual Performance Report 2013–14
APPENDICES 10Privacy Act 1988 (Cth)The Privacy Amendment (Enhancing Privacy Protection) Act 2012 (Cth) and the Privacy Regulation 2013 both commenced on 12 March 2014. Some important matters arising from the amendments are:
• organisations need to have a clearly written privacy policy and develop practices, procedures and systems to ensure proactive compliance with the legislation
• the introduction of a new accountability regime for personal information that is held offshore
• restrictions on the collection and use of personal information for direct marketing
• the expansion of the powers of the Office of the Australian Information Privacy Commissioner, including the ability to impose civil penalties of up to $1.7 million
• the introduction of a new Credit Reporting Code binding all credit reporting bodies, credit providers and affected information recipients and requiring greater comprehensive credit reporting.
Material changes to New South Wales legislation
National Energy Customer FrameworkThe National Energy Customer Framework (NECF) came into effect in NSW on 1 July 2013.
NECF introduces a consistent national framework for providing electricity and gas services to retail customers. It includes protections for small energy customers, such as:
• rights to an offer to connect
• mandatory minimum contract terms
• disconnection process
• notification of planned interruptions
• rules to ensure customers are fully informed of the terms of their contract.
NECF was implemented in NSW by the adoption of the National Energy Retail Law, the National Energy Retail Rules, and the National Energy Retail Regulations as NSW law. The National Energy Retail Law (Adoption) Act 2012 (NSW) was passed in 2012, but commenced on 1 July 2013 together with the National Energy Retail Law (Adoption) Regulation 2013 (NSW).
The Regulation deals with the transition to NECF, including savings and transitional provisions for distributors in relation to the transition of their customer contracts. This Regulation was amended by the National Energy Retail Law (Adoption) Amendment (Early Termination and site Specific Conditions) Regulation 2013 to, among other matters, provide for site specific conditions contained in contracts for initial or upgraded electricity connections to continue to apply to future occupants of the premises.
In 2012, the South Australian Energy Minister made amendments to the National Electricity Rules through the National Electricity (National Energy Retail Law) Amendment Rules to primarily implement a new Chapter 5A relating to connection of retail customers, and a new Chapter 6B relating to billing and credit support rules between distributors and retailers. These amendments applied in NSW from 1 July 2013.
Amendments to NSW legislation to implement the NECF were made by the Energy Legislation Amendment (National Energy Retail Law) Act 2012 and the Electricity Supply (General) Amendment (National Energy Retail Law) Regulation 2013 which took effect on 1 July 2013.
As part of the NECF implementation, all the NSW Energy Market Operations Rules (MOR) were repealed on 1 July 2013. MOR 6 was replaced by MOR 1 (NSW Electricity Business to Business Procedures) which took effect on 25 June 2013.
As a consequence, the laws and rules for the protection of electricity retail customers have been removed from the Electricity Supply Act 1995 (NSW) and Electricity Supply (General) Regulation 2001 (NSW). However some transitional jurisdictional arrangements and certain distributor service standards remain in these instruments.
National Electricity LawA major reform of the limited merits review regime in the National Electricity Law (which applies in NSW under the National Electricity (New South Wales) Act 1997 (NSW)) took effect on 19 December 2013. The amendments seek to make the reviewable regulatory decision making process and any subsequent reviews more robust, transparent, and focused on delivering the national electricity objective. Key amendments provide that:
• the AER must make the ‘preferable reviewable regulatory decision,’ give reasons for its decision and explain interrelationships between constituent components of a decision
• the Australian Competition Tribunal can only set aside, vary or remit a decision if it is satisfied that to do so is likely to result in a materially preferable decision
• parties who made a submission or comment to the AER during the regulatory process subject to the review can now apply for review of a decision
• applicants must meet a higher threshold to obtain leave to appeal to the Tribunal
• network businesses cannot pass through costs of a review to consumers, either prospectively or following a review.

96
10National Electricity RulesThe National Electricity Rules apply in NSW under the National Electricity (New South Wales) Act 1997 (NSW). In addition to the NECF-related amendments made by the South Australian Energy Minister, the AEMC has made the following rule changes:
(a) Publication of zone substation data – effective 13 March 2014, distribution network service providers (DNSP) are required to make historical zone substation information on electricity loads available on request to interested parties. Obligations under the rule will apply to each DNSP’s next Distribution Annual Planning Report.
(b) Connecting embedded generators – effective 1 October 2014, the key components of the rule change are:
(i) distributors are required to publish specified information to assist embedded generators
(ii) a new two-stage connection enquiry process and an application process with information requirements for both parties
(iii) distributors may charge an enquiry fee for preparing detailed enquiry responses.
(c) Network Service Provider expenditure objectives – effective 26 September 2013, the rule clarifies the existing expenditure objectives by giving primacy to jurisdictional standards relating to reliability, security, and quality of supply. This aims to avoid inconsistency between jurisdictional requirements and the level of expenditure that the AER is required to approve through the regulatory determination process.
Electricity Supply Act 1995 (NSW)In addition to the NECF-related amendments set out above, effective 1 January 2014, amendments were made to the Act and the Electricity Supply (General) Regulation 2001 to replace the Administrative Decisions Tribunal with the NSW Civil and Administrative Tribunal as the relevant tribunal for administrative reviews.
Electricity Supply (General) Regulation 2001 (NSW)In addition to the NECF-related amendments set out above, effective 1 July 2013, this Regulation was amended to:
• re-make provisions about customer consultative committees for distribution network service providers and to establish distributor service standards
• provide for the adoption of a Social Programs for Energy Code.
Electricity Supply (Safety and Network Management) Regulation 2008 (NSW)The repeal of this Regulation was postponed from 1 September 2013 to 1 September 2014.
Building and Construction Industry Security of Payment Act 1999 (NSW)The Act was amended by the Building and Construction Industry Security of Payment Amendment Act 2013, assented to on 20 November 2013 and commenced on 21 April 2014. The amendments introduce maximum time limits for making progress payments for all construction contracts entered into from 21 April 2014, and require payment claims by head contractors to include a supporting statement indicating that all subcontractors have been paid what is due and payable. Further, payment claims no longer have to state that they are being made under the Act.
Home Building Act 1989 (NSW)Amendments to this Act will commence on a date to be proclaimed by NSW Parliament. These changes will apply in respect of residential building work or specialist work (including electrical wiring work):
• increasing the penalties for unlicensed individuals or a licensee who hires the unlicensed individual and making imprisonment an option
• extending the matters which contracts must address
• requiring notification of certain events by holders of contractor licences
• implying further statutory warranties into contracts and associated amendments
• amending building dispute procedures.
Summary of significant judicial decisions, new codes of practice and compliance exemptionsDuring the financial year, there were no judicial decisions significantly affecting the operations of Endeavour Energy or the users of its services.

97Endeavour Energy Annual Performance Report 2013–14
APPENDICES 10Senior executives
Band1 Range Average Female Male
Above Band 42 > $488,100 $621,095 0 3
Band 4 $422,501 – 488,100 – 0 0
Band 3 $299,751 – 422,500 $343,019 2 12
Band 2 $238,301 – 299,750 $259,151 4 22
Band 1 $167,100 – 238,300 $194,674 30 116
Below Band 13 < $167,100 $140,532 70 181
106 334
Totals 440
1 Bands are as defined in the Initial Determination of Remuneration Packages for Public Service senior executives under the Government Sector Employment Act 2013 (dated 3 February 2014). Reporting is limited to contract managers employed on individual performance-based employment contracts.
2 Includes contract managers employed on individual performance based contracts receiving remuneration at levels above Band 4. The common CEO of all three network businesses is included in Endeavour Energy’s statistics.
3 Includes contract managers employed on individual performance based contracts receiving remuneration at levels below Band 1.
Workforce diversity statistics
Trends in the representation of workforce diversity groups (% of total employees excluding casual employees)
Workforce Diversity Group Benchmark/Target¹ 2012 2013 2014
Women 50% 19.7% 17.3% 17.6%
Aboriginal people and Torres Strait Islanders 2.6% 1.1% 1.2% 1.2%
People whose first language spoken as a child was not English 19.0% 9.6% 9.9% 10.1%
People with a disability N/A 3.9% 4.2% 4.1%
People with a disability requiring work-related adjustment 1.5% 0.3% 0.3% 0.3%
1 as set by the NSW Government
Trends in the distribution of workforce diversity groups
Workforce Diversity Group Benchmark/Target¹ 2012 2013 2014
Women 100 105 104 103
Aboriginal people and Torres Strait Islanders 100 91 92 95
People whose first language spoken as a child was not English 100 115 114 114
People with a disability 100 104 103 104
People with a disability requiring work-related adjustment² 100 N/A N/A N/A
1 A Distribution Index of 100 indicates that the centre of the distribution of the Workforce Diversity group across salary levels is equivalent to that of other staff. Values less than 100 mean that the Workforce Diversity group tends to be more concentrated at lower salary levels than is the case for other staff. The more pronounced this tendency is, the lower the index will be. In some cases the index may be more than 100, indicating that the Workforce Diversity group is less concentrated at lower salary levels.
2 The Distribution Index is not calculated where Workforce Diversity group or non-Workforce Diversity group numbers are less than 20.

98
10GlossaryAER Australian Energy Regulator
AS Australian Standard
BSP Bulk supply point
CIC Customer interaction centres
CPI Consumer Price Index
CEO Chief Executive Officer
CSS Customer service standard
DBYD Dial before you dig
DM Demand management
DNSP Distribution network service providers
EBIT Earnings before interest and tax
EBITDA Earnings before interest, tax, depreciation and amortisation
EEO Equal employment opportunity
EPA Environment Protection Authority
FBT Fringe benefit tax
FCCP Fraud and Corruption Control Plan
GWh Gigawatt hour
GST Goods and Services Tax
ICAC Independent Commission Against Corruption
ICAM Incident cause analysis method
I care! Endeavour Energy’s workplace giving program
ICT Information and communications technology
IHD In-home display
IT Information technology
kV Kilovolt
kVA Kilovolt ampere
kWh Kilowatt hour
LED Light-emitting diode
LiDAR Light detection and ranging
LTI Lost-time injury
LTIFR Lost-time injury frequency rate
MW Megawatt
NECF National Energy Customer Framework
NER National Electricity Rules
NPAT Net profit after tax including capital contributions
NSW New South Wales
ODRC Optimised depreciated replacement cost
OHS Occupational health and safety
OPEX Operating expenditure
OT Operational technology
PESAP Public Electrical Awareness Safety Plan
RFP Request for proposals
SAIDI System Average Interruption Duration Index
SAMP Strategic Asset Management Plan
SCADA Supervisory Control and Data Acquisition
SENI Significant electrical network incident
TRI Total recordable injuries
TRIFR Total recordable injuries frequency rate
TS Transmission substation
ZS Zone substation

99Endeavour Energy Annual Performance Report 2013–14
APPENDICES 10IndexAAdministrative Decisions Tribunal, 96air conditioning, 23, 31Annual Reports (Statutory Bodies) Act 1984 (NSW), inside front coverApprentice of the Year awards, 26 winners and nominations, 26approved exemptions, 86Art Project, The Electric, 28asbestos management, 28 assets ageing, 4, 11, 16 ICT, 15 graffiti removal from, 28 inspections, 21 management, 5, 6, 11, 16, 21, 37 net, 3 network, 16 renewal/replacement, 11, 16 security of, 28 value, 2, 36 see also financial statementsAudit and Risk Committee, 13, 34, 35audit report, independent, 39Auditor-General, NSW, inside front cover, 35Ausgrid, 2, 12, 13, 27, 32Australia Day, 29Australian Competition Tribunal, 95Australian Energy Regulator (AER) capital and operating plan
proposal for next 5 years, 4, 11 Consumer Challenge Panel, 9 final year of 5-year program, 11 merits review regime amendment, 95 National Energy Customer
Framework, 24, 95 network expenditure approval, 16 network price approval, 93 NSW Public Forum, 9 revenue reduction by, 5 reviews of decisions, 95 transitional decision for 2014–15, 93Australian Industry Participation Plan, 94Australian Jobs Act 2013 (Cth), 94automation, workflow, 15
BBalmoral, 25Blacktown City Council, 28Blacktown Transmission Station, 25Blue Mountains, 2 bushfires, 5, 25Board Committees, 34Board of Directors, 2, 32, 33, 87 appointments and
reappointments process, 34 conflicts of interest, 35 ethical principles, 32 indemnity insurance, 34 meetings, 34 profiles and term of office, 33 role and responsibilities, 34 statement, 83budget, 7, 11, 16 see also financial statements
Building and Construction Industry Security of Payment Act 1999 (NSW), 96Bushfire Management Plan, 13, 21bushfires, 5, 10, 25 costs of network reconnection, 25 emergency repairs, 25 pre–summer preparations, 21 risk management, 13 state of emergency, 25 total fire ban days, 21business continuity, 13Bylong Valley, 25
CCamellia Transmission Substation, 28capital expenditure, 3, 11, 16, 36 forecast, 16capital program, 4–5, 11 major projects, 28 reduction, 5carbon policy, 31Chief Executive Officer (CEO), 2, 32, 87climate change see environment; greenhouse gas
emissions; weather conditionscoal mining sector, 25Code of Conduct, 27, 32, 35, 94community, 28–9 consultation/engagement, 4, 9, 21, 29 partnerships, 29 see also public safetycomplaints, 24Compliance Management Plan, 35compliance with regulations, forecast expenditure, 16connections, 24–5 application management system, 24 number of, 3 Permission to Connect letter, 24construction projects, 6, 11, 24 building, 4, 11 peak resourcing strategy, 4, 11 major works approved, 16 major works in progress, 17–20consultants, 86Consumer Challenge Panel, 9Consumer Price Index (CPI), 4, 6, 9, 11, 12, 14consumer protection, 4, 95consumption see electricity demandcontact details, inside back covercontractors, 4, 11, 14, 28, 30, 94, 96 payments to, 96CoolSaver, 23copper theft, 28corporate plan 2013–14, 6–7, 13, 14, 87 strategic objectives, 6–7corruption, preventing, 35cost savings, 4, 12, 26, 36councils, engagement with, 9, 13, 30credit card certification, 86Credit Reporting Code, 95Crime Stoppers, 28Customer Average Interruption Duration Index (CAIDI), 24customer connection works, 21Customer Consultative
Committee, 29, 96Customer Interaction Centres (CICs), 24customer satisfaction, 3, 5, 6 Customer Satisfaction Indicator, 3, 85 research into, 9customer service, 24 Guaranteed Customer
Service Standards, 92–3 National Energy Customer
Framework (NECF), 24Customer Strategic Plan, 29Customer Value Improvement Plan, 6customers compensation paid to, 92 connections, 3, 24–5 engagement strategy, 9 feedback, 11 interpreter services, 26 life-support, 24 multicultural policies
and services, 26, 27 retail, 95 see also electricity demand
Ddemand management, 22–3 Demand Management Plan, 23 successful Glenmore Park
demand reduction trial, 15, 23Denham Court Transmission Substation, 25Department of Climate Change and Energy Efficiency, 3Dial Before You Dig, 23 number of enquiries per day, 23digital information security, 86Directors see Board of Directorsdisability reporting, 97disaster recovery plans, 13Distribution Electricity Supply Industry qualification, 26distribution substations, number of, 2dividend, 36, 37, 85driver safety campaign, 8drug and alcohol testing, 8
EEast Parramatta Switching Station, 28education, community, 28efficiency programs, 4, 12, 26, 85Electric Energy Society of Australia, 94electricity demand declining, 5, 36 forecast, 16, 86 growth areas, 2 management, 22–3 peak, 15, 16, 22, 23electricity distribution networks, 2 output, 3, 85 reliability, 3, 5, 9, 10, 15, 24Electricity Supply (Safety and Network Management) Regulation 2008 (NSW), 96Electricity Supply Act 1995 (NSW), 2 amendments, 95, 96emergency response work, 5, 21, 25employee relations, 14energy efficient lamps, streetlighting, 22

100
10Energy Legislation Amendment (National Energy Retail Law) Act 2012, 95Energy Services Act 1995 (NSW), 2Energy Services Corporations Act 1995 (NSW), 32Enterprise Agreement, 14environment, 3, 30–1 audit program, 30 carbon policy, 31 compliance, 30 energy efficiency, 31 greenhouse gas emissions, 3, 30, 92 illegal dumping, 30 landfill diversion, 31 minor incidents, 31 performance indicator, 31 recycling, 31 renewable energy, 29 reportable incidents, 3, 5 risk management, 30 strategy, 30 timber pole recycling, 31 training, 30 transformer oil recycling, 3, 31 vehicle reduction and
replacement, 31 waste management, 31Environmental Protection Authority, 30equipment, defective, 10Equity and Diversity Strategy, 27Essential Energy, 2, 12, 13, 27, 32ethical standards, 14, 32, 35 Make the Right Choice
Program, 14, 94Ethics Communication and Engagement Strategy, 35Executive Leadership Group, 87–8Executive Leadership Team, 29, 35, 87external audit, 35, 39
FFacebook, 9Fair Work Act 2009 (Cth), 94 amendment, 94Fair Work Commission, 94feeder automation, 15field force automation, 15finance assets and liabilities, 36 capital expenditure, 37 cash flows, 37 debt, 37, 93 dividend, 36, 37 EBITDA, 5, 36 financial indicators, five-year table, 85 investment performance, 93 liabilities, 36, 93 liability management
performance, 93 maintenance expenditure, 21 major projects approved, 16 major works in progress, 17–20 network prices, 93 OPEX, 5, 7 overtime expenditure, 5, 7 performance, 5, 36
plan, 7, 12 profit, 5, 7, 36, 85 return on equity, 36 sales revenue, 3, 5, 85 summary, 3, 5 sustainability, 5, 7, 12financial statements, 38–83Fraud and Corruption Control Plan (FCCP), 35fraud risk register, 35freedom of information, 89future planning, 5, 6–7, 16
GGIS/CAD system, 15Glenfield, 25Glenmore Park Demand Response Trial
completion, 15 successful demand reduction, 15, 23glossary, 98Glossodia, 15governance, 5, 32–5 audits, 35 compliance, 35 ethics, 35 fraud control, 35 insurance, 35 see also Board of Directors Government Information (Public Access) Act 2009 (NSW), 89, 93 access applications,
type and outcome, 89–90 applications reviewed
under Part 5, 91 invalid applications, 90 public interest considerations
against disclosure, 90–1 timeliness, 91GPS technology, 15graffiti, 28grants, 89greenhouse gas emissions, 3, 30, 92GreenPower, 31
HHawkesbury region, 15health and safety, 4, 30 audit plan, 8 fatigue management, 8 Incident Cause and Analysis
Methodology (ICAM), 8 injuries to staff, 4, 5 Lifeguard program, 8 Lost time injury frequency
rate (LTIFR), 3, 4, 5, 6, 8, 9 mitigation of fatal risks, 8 random alcohol and drug testing, 8 reportable incidents, 4, 5 ‘rules we live by’, 4, 8 safe driving campaign, 8 total recordable injury
frequency rate (TRIFR), 5, 6, 9 see also public safetyHealth, Safety and Environmental Plan, 8Home Building Act 1989 (NSW), 96Huntingwood head office, 31
II care!, 29In Home Display (IHD) programs, 15Incident Cause and Analysis Methodology, 8 number of investigations, 8incident management plan, 13independent auditor’s report, 39Information and Communications technology (IC&T), 12, 15 pilot programs using
mobile tables, 15information security management system (ISMS), 86injury management, 8insurance, 35 director indemnity, 34internal audit, 35interpreter service, 26interruptions to power supply, 4, 10 Customer Average Interruption
Duration Index (CAIDI), 24 customers using medical
equipment, 4, 24 Interruption Duration Standard, 93 Interruption Frequency Standard, 92 Guaranteed Customer
Service Standards, 92–3 planned, 24 System Average Interruption
Duration Index (SAIDI), 10 see also outage managementinvestment, 4–5 see also capital expenditure;
capital program; networkiSafe, 15
Jjoint industry forums/workshops, 9judicial decisions, 96
KKEPCO coal mine, 25key result areas, 5Kings Park Service Centre, 8
Lland disposal, 93Leadership Competency framework, 14LED lighting, 22 streetlight field trials, 22, 29legislative changes, 94–5Leppington, 25letter of transmittal, 1LiDAR technology, 21Lifeguard program, 8Lithgow, 25Liverpool Transmission Substation, 28
Mmaintenance, 15, 21 emergency repairs, 25Make the Right Choice Ethics program, 14, 94management structure, 14Marsden Park Zone Substation, 19, 28medical equipment, electricity for, 4, 24merits review, 95meter reading, 24 multicultural policies, 26 updating multicultural plan, 27murals, 28

101Endeavour Energy Annual Performance Report 2013–14
APPENDICES 10NNational Electricity (New South Wales) Act 1977 (NSW), 96National Electricity Rules, 23, 24, 93 amendments, 95, 96National Energy Customer Framework (NECF), 4, 24 breaches, 4, 5, 24National Energy Retail Law (Adoption) Act 2012 (NSW), 95National Greenhouse and Energy Reporting Scheme Determination, 3national parks, 30network, 16–25 ageing, 16 connections, 24–5 expenditure, 16 growth, 16 investment, 4, 11, 16 maintenance, 21 major events, 25 major projects approved, 16 major works, 17–20 new connections, 24 plan delivery, 11 prices, 8, 12, 16, 93 reliability, 5, 9, 16 service mains, 4, 11 steel mains, 4, 11 strategy, 16 tariff strategy, 93network businesses amalgamation, 14 Network Control Room, 15Network Reform Program, 4, 7, 12, 14 organisational restructure, 14, 26Networks NSW, 14 Environmental Performance
Protocols, 30 Health, Safety and Environment
(HSE) Strategic Plan, 30 shared management structure, 14Nightwatch Service, 23Nominations Committee, 34non-government organisations, 89North West Rail Link, 25North West Sydney, 2, 16NSW Centenary of ANZAC commemoration publication, 29NSW Civil and Administrative Tribunal, 96NSW Electricity Business to Business Procedures, 95NSW Government, 2, 4, 5, 11, 24 dividend cap policy, 37 land release, 24 state of emergency declaration, 25 Statement of Corporate Intent, 36 Strategic Business Plan, 30 wages policy, 87 Waste Reduction and
Purchasing Policy, 31 see also Network Reform Program;
shareholdersNSW Police, 5NSW Public Lighting Code, 22NSW Rural Fire Service, 13, 25NSW Training Awards, 26
NSW Treasury Corporation, 93 Financial Distribution Policy, 37 State Owned Corporation
Indemnity Policy, 34 Statement of Corporate Intent
submission to, 36 see also financial statementsNSW 2021: A plan to make NSW number one, 30
OOffice of the Australian Information Privacy Commissioner, 95operating program, 4 see also financial statementsoptical fibres, 15Oran Park Zone Substation, 28organisational structure, 14, 26outage management, 24 customers using medical
equipment, 4overhead power lines interference, 10 inspections, 21overseas travel, 94
PPeakSaver, 15, 23performance, 8–15 customer value, 9–10 finance, 12 indicators, 9, 10, 11, 12, 27, 31 investment, 93 network, 11 overview, 4–5 risk management, 13 safety, 8–9 staff, 14 summary, 3 use of technology, 15performance payments, 87pilot projects/programs, 7, 15pole(s) inspections, 21 number of, 2 timber recycling, 31poles and wires network, proposed 99-year lease, 5PoolSaver initiative, 15Power Quality and Reliability Centre, 29power supply Guaranteed Customer
Service Standards, 92–3pricing and affordability, 4 average distribution network
price increase, 12 promise to customers, 4, 9, 12primary school students, 28Privacy Act 1988 (Cth), 95 amendment, 95productivity, 4, 5, 7, 12profit, 3, 5, 7, 36 see also financial statementsProject and Portfolio Management System (PPMS), 15Project Challenge, 12Project Compete, 12
Protection of the Environment Operations Act 1997 (NSW), 30Public Electrical Safety Awareness Plan (PESAP), 28Public Finance and Audit Act 1983, 83Public Interest Disclosures Act 1994 (PID Act), 94public consultation see communitypublic safety, 4, 8, 28 education, 28public access to information, 89–91purpose statement, 2
Rrail projects, 19, 25recycling, 3, 31reform program, state-owned networks, 2 see also Network Reform ProgramRegional Excellence program, 12Regional Illegal Dumping Squads, 30regional work practices, 24regulation of energy distribution, 24reliability, 3, 5, 9, 10 projects, 24 technology assistance, 15remuneration, 87, 97renewable energy, 29, 52residential building work, new law, 96residential demand management programs, 23residential growth, 2, 16, 28residential land, 24revenue, 3, 5, 85see also financial statementsrisk management, 7 business, 13 environmental, 30 incident management plan, 13 mitigating fatal risks, 8 plan, 13 risk categories, 13 strategy, 13role and responsibilities, Board of Directors, 34Rooty Hill, 23Rouse Hill, 25
Ssafe driving campaign, 8safety see health and safety; public safetySafety, Human Resources and Environment Committee, 34Safety Strategic Plan, 6security assets, 28 cyber, 15 digital information, 86 lighting, 31 see also reliabilityshareholders, 2, 3, 6, 32 return, 37 Shareholder Ministers, 1, 34, 37smart meter technology, 9Social Programs for Energy Code, 96
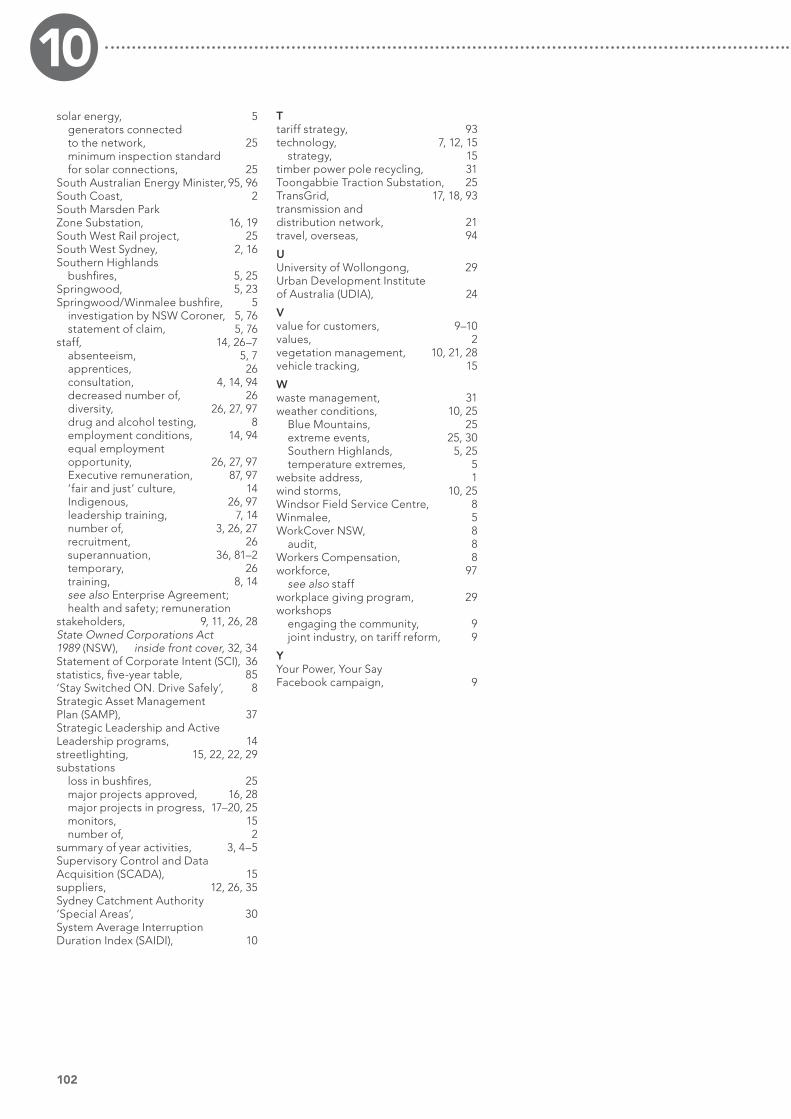
102
10solar energy, 5 generators connected
to the network, 25 minimum inspection standard
for solar connections, 25South Australian Energy Minister, 95, 96South Coast, 2South Marsden Park Zone Substation, 16, 19South West Rail project, 25South West Sydney, 2, 16Southern Highlands bushfires, 5, 25Springwood, 5, 23Springwood/Winmalee bushfire, 5 investigation by NSW Coroner, 5, 76 statement of claim, 5, 76staff, 14, 26–7 absenteeism, 5, 7 apprentices, 26 consultation, 4, 14, 94 decreased number of, 26 diversity, 26, 27, 97 drug and alcohol testing, 8 employment conditions, 14, 94 equal employment
opportunity, 26, 27, 97 Executive remuneration, 87, 97 ‘fair and just’ culture, 14 Indigenous, 26, 97 leadership training, 7, 14 number of, 3, 26, 27 recruitment, 26 superannuation, 36, 81–2 temporary, 26 training, 8, 14 see also Enterprise Agreement;
health and safety; remunerationstakeholders, 9, 11, 26, 28State Owned Corporations Act 1989 (NSW), inside front cover, 32, 34Statement of Corporate Intent (SCI), 36statistics, five-year table, 85‘Stay Switched ON. Drive Safely’, 8Strategic Asset Management Plan (SAMP), 37Strategic Leadership and Active Leadership programs, 14streetlighting, 15, 22, 22, 29substations loss in bushfires, 25 major projects approved, 16, 28 major projects in progress, 17–20, 25 monitors, 15 number of, 2summary of year activities, 3, 4–5Supervisory Control and Data Acquisition (SCADA), 15suppliers, 12, 26, 35Sydney Catchment Authority ‘Special Areas’, 30System Average Interruption Duration Index (SAIDI), 10
Ttariff strategy, 93technology, 7, 12, 15 strategy, 15timber power pole recycling, 31Toongabbie Traction Substation, 25TransGrid, 17, 18, 93transmission and distribution network, 21travel, overseas, 94
UUniversity of Wollongong, 29Urban Development Institute of Australia (UDIA), 24
Vvalue for customers, 9–10values, 2vegetation management, 10, 21, 28vehicle tracking, 15
Wwaste management, 31weather conditions, 10, 25 Blue Mountains, 25 extreme events, 25, 30 Southern Highlands, 5, 25 temperature extremes, 5website address, 1wind storms, 10, 25Windsor Field Service Centre, 8Winmalee, 5 WorkCover NSW, 8 audit, 8Workers Compensation, 8workforce, 97 see also staffworkplace giving program, 29workshops engaging the community, 9 joint industry, on tariff reform, 9
YYour Power, Your Say Facebook campaign, 9

Kings ParkParramatta
Kings ParkParramatta
Hoxton ParkNarellan
Picton
Moss Vale
Ulladulla
Nowra
Shellharbour
SpringhillConiston
Katoomba
Bowenfels
Kandos
Glendenning
Windsor
PenrithHuntingwood
Ausgrid
EssentialEnergy
PacificOcean
Location, addresses, phone numbers and hours of operation
Emergencies, streetlights out, hot water hotlinePhone: 131 003 (24 hours)
Customer enquiriesGeneral enquires phone: 133 718
Head Office Phone: 131 081 or (02) 9853 6666 (8.00am - 5.30pm Monday to Friday)
Interpreter servicesPhone: 131 450
Fax(02) 9853 6000
Websitewww.endeavourenergy.com.au
Ethics hotline1800 ETHICS (384 427)
Main office51 Huntingwood Drive Huntingwood NSW 2148 PO Box 811, Seven Hills NSW 1730
Bowenfels Field Service Centre 9-13 Cooerwull Road Bowenfels NSW 2790
Coniston Office Corner of Bridge Street and Old Springhill Road Coniston NSW 2500
Glendenning Central Logistics Facility 49 Glendenning Road Glendenning NSW 2761
Glendenning Civil Works Centre 15 Belfast Place Glendenning NSW 2761
Glendenning Field Service Centre 43 Glendenning Road Glendenning NSW 2761
Hoxton Park Field Service Centre 490 Hoxton Park Road Hoxton Park NSW 2171
Hoxton Park Technical Training Centre109 Jedda Road Prestons NSW 2170
Kandos Field Service Centre 16 White Crescent Kandos NSW 2848
Katoomba Field Service Centre 27-29 Whitton Street Katoomba NSW 2780
Kings Park Field Service Centre 10 Tasha Place Kings Park NSW 2148
Moss Vale Field Service Centre 8-10 Old Dairy Close Moss Vale NSW 2577
Narellan Field Service Centre 17 McPherson Road Smeaton Grange NSW 2567
Network Project Management OfficeLevel 5 Westpoint Tower 17 Patrick Street Blacktown NSW 2148
Nowra Field Service Centre 20 Depot Road West Nowra NSW 2541
Parramatta Field Service Centre 84-86 Macarthur Street Parramatta NSW 2150
Penrith Field Service Centre96-120 Blaikie Road Jamisontown NSW 2750
Picton Field Service Centre94 Bridge Street Picton NSW 2571
Shellharbour Field Service Centre Buckleys Road Shell Cove NSW 2529
South Windsor Field Service Centre Corner Ham Street and Fairey Street South Windsor NSW 2756
Springhill Field Service Centre 191-195 Five Island Road Unanderra NSW 2526
Ulladulla Field Service Centre18 Deering Street Ulladulla NSW 2539
LOCATIONS AND CONTACTS