End of year 2014 Housing Report
15
-
Upload
fort-collins-board-of-realtors -
Category
Documents
-
view
212 -
download
0
description
New Listings were down 13.3 percent for single family homes but increased 103.1 percent for townhouse-condo properties. Pending sales clocked in at 165 for single family homes and 50 for townhouse-condo properties. The Median Sales Price was up 23.8 percent to $318,000 for single family homes and 19.8 percent to $223,144 for townhouse-condo properties. Months Supply of Inventory stood at 1.5 for single family units and 1.3 months for townhouse-condo units.
Transcript of End of year 2014 Housing Report

December 2014 Activity Snapshot
One-Year Change in One-Year Change inSingle FamilySold Listings
Single FamilyDays On Market
23456789
101112131415
Click on desired metric to jump to that page.Current as of January 6, 2015. All data from IRES, LLC. Powered by 10K Research and Marketing.
Townhouse-Condo Activity Overview
Days on Market Until SaleHousing Affordability IndexAll Properties Activity OverviewSold Listings and Inventory by Price RangeGlossary of Terms
New ListingsPending SalesSold ListingsMedian Sales PriceAverage Sales PricePercent of List Price Received
Monthly Indicators
- 13.1% - 14.1% + 23.8%One-Year Change in
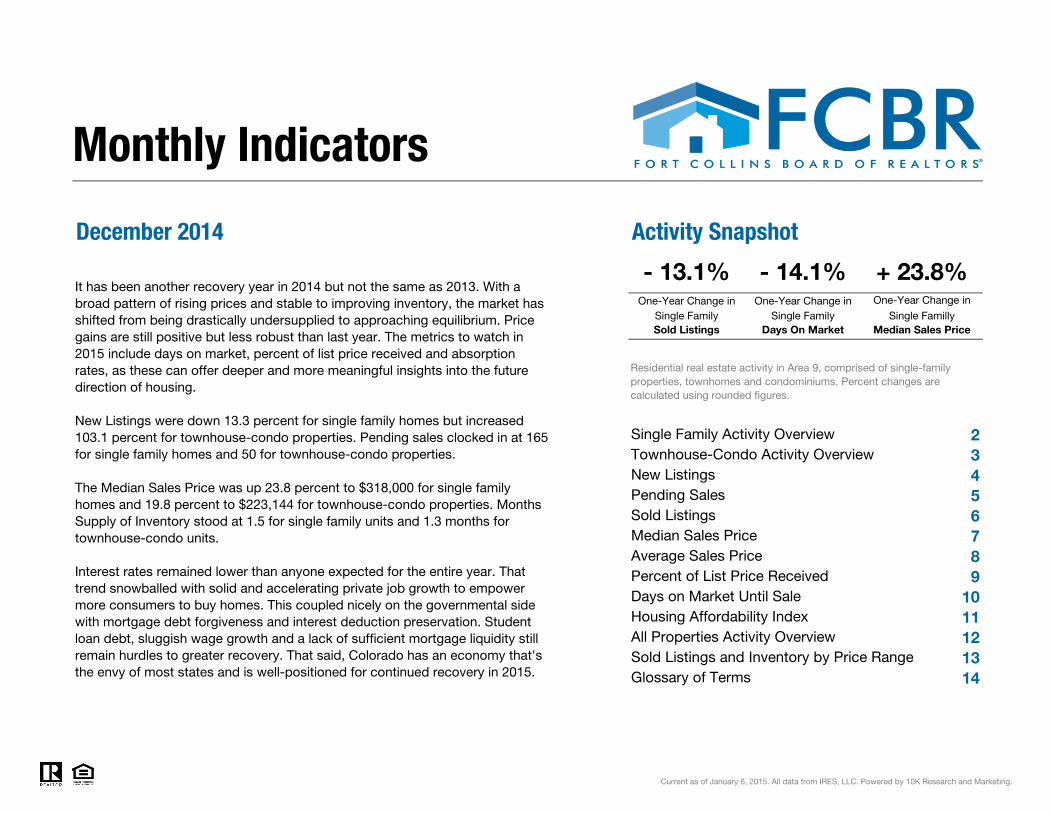
It has been another recovery year in 2014 but not the same as 2013. With a broad pattern of rising prices and stable to improving inventory, the market has shifted from being drastically undersupplied to approaching equilibrium. Price gains are still positive but less robust than last year. The metrics to watch in 2015 include days on market, percent of list price received and absorption rates, as these can offer deeper and more meaningful insights into the future direction of housing.
New Listings were down 13.3 percent for single family homes but increased 103.1 percent for townhouse-condo properties. Pending sales clocked in at 165 for single family homes and 50 for townhouse-condo properties.
The Median Sales Price was up 23.8 percent to $318,000 for single family homes and 19.8 percent to $223,144 for townhouse-condo properties. Months Supply of Inventory stood at 1.5 for single family units and 1.3 months for townhouse-condo units.
Interest rates remained lower than anyone expected for the entire year. That trend snowballed with solid and accelerating private job growth to empower more consumers to buy homes. This coupled nicely on the governmental side with mortgage debt forgiveness and interest deduction preservation. Student loan debt, sluggish wage growth and a lack of sufficient mortgage liquidity still remain hurdles to greater recovery. That said, Colorado has an economy that's the envy of most states and is well-positioned for continued recovery in 2015.
Single FamillyMedian Sales Price
Residential real estate activity in Area 9, comprised of single-family properties, townhomes and condominiums. Percent changes are calculated using rounded figures.
Single Family Activity Overview
All Properties Activity Overview

Single Family Activity OverviewKey metrics for Single Family by report month and for year-to-date (YTD) starting from the first of the year.
Key Metrics Historical Sparkbars 12-2013 12-2014 Percent Change YTD-2013 YTD-2014 Percent Change
- 6.2%
Pending Sales 150 165 + 10.0% 3,177 3,264 + 2.7%
New Listings 143 124 - 13.3% 3,983 3,738
Under Contract Not enough historical data for chart -- -- -- -- -- --
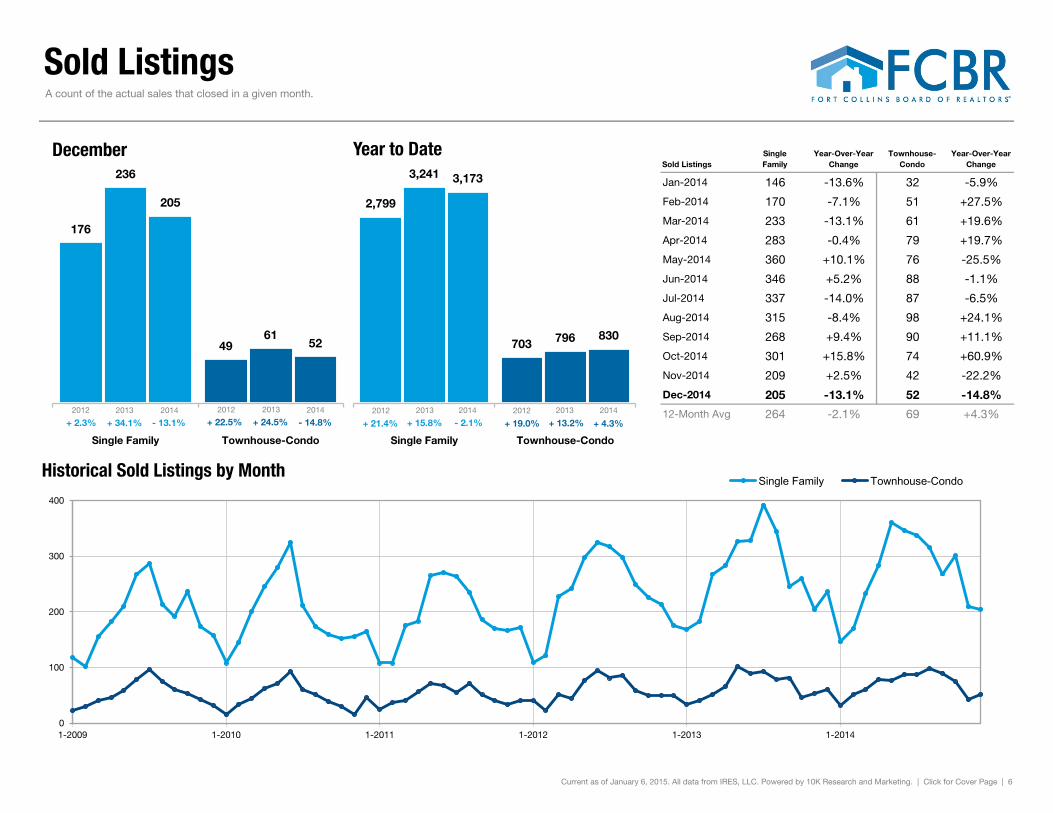
Sold Listings 236 205 - 13.1% 3,241 3,173 - 2.1%
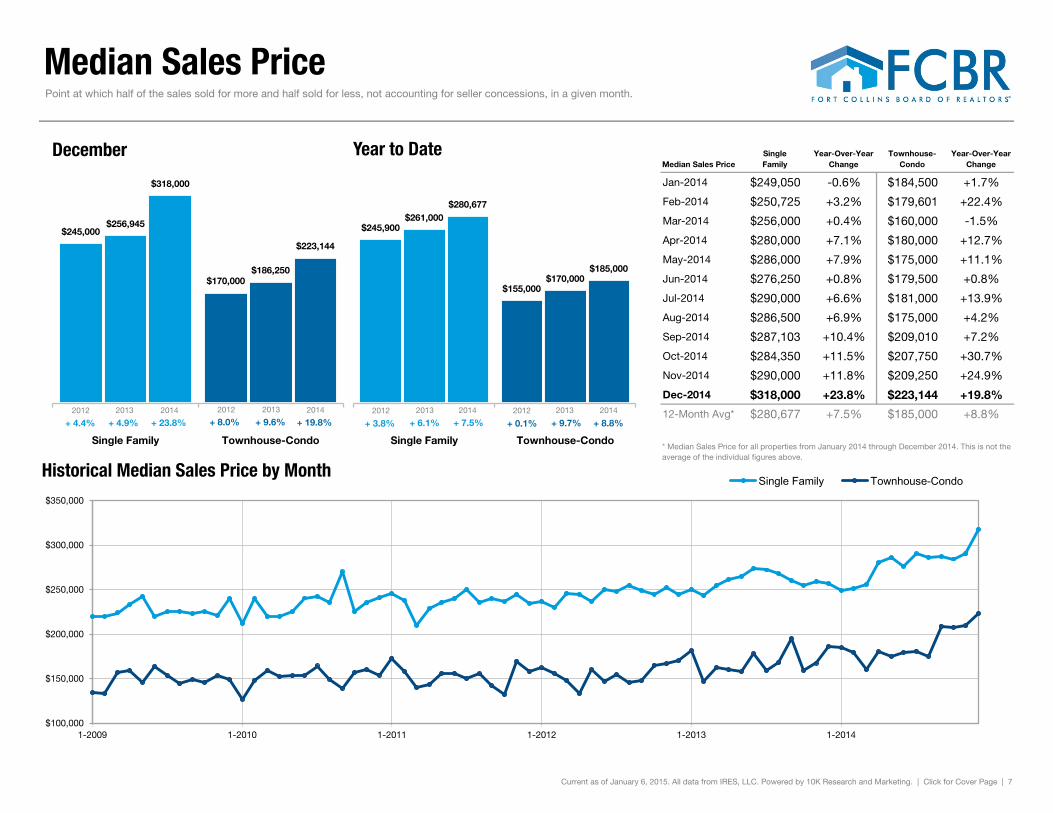
Median Sales Price $256,945 $318,000 + 23.8% $261,000 $280,677 + 7.5%
+ 7.1%
Pct. of List Price Received 98.5% 98.0% - 0.5% 98.8% 99.1% + 0.3%
Avg. Sales Price $305,645 $344,883 + 12.8% $299,935 $321,377
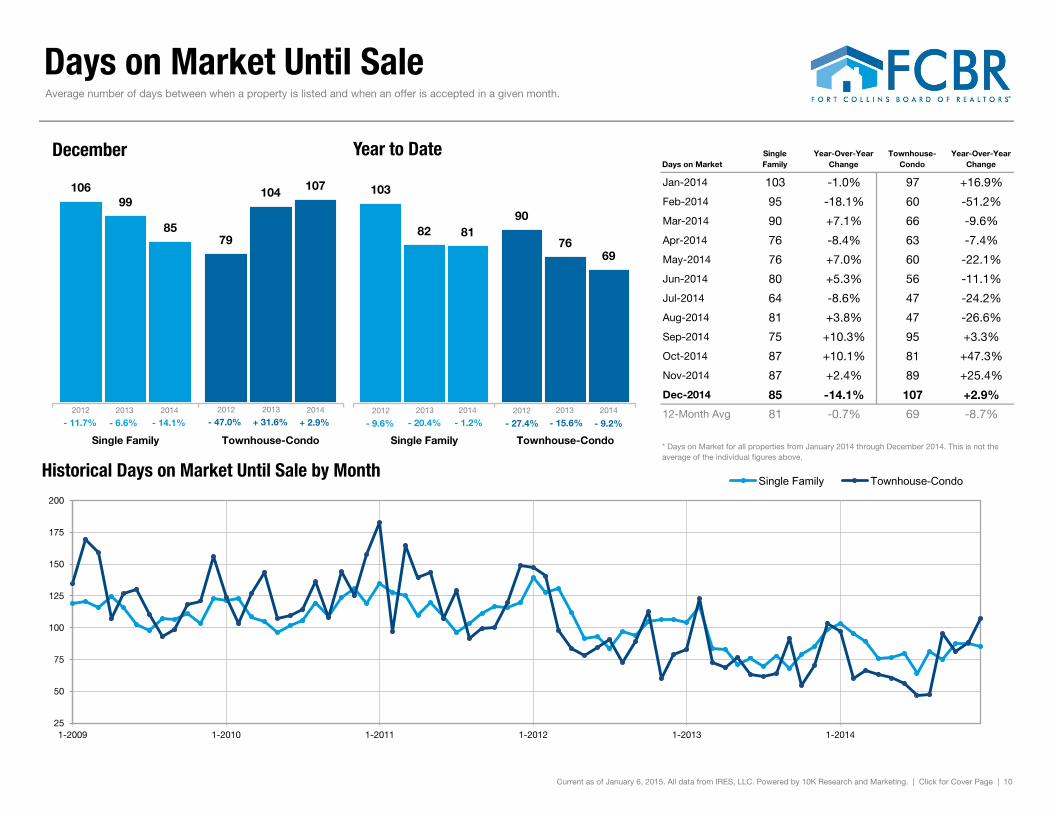
Days on Market 99 85 - 14.1% 82 81 - 1.2%
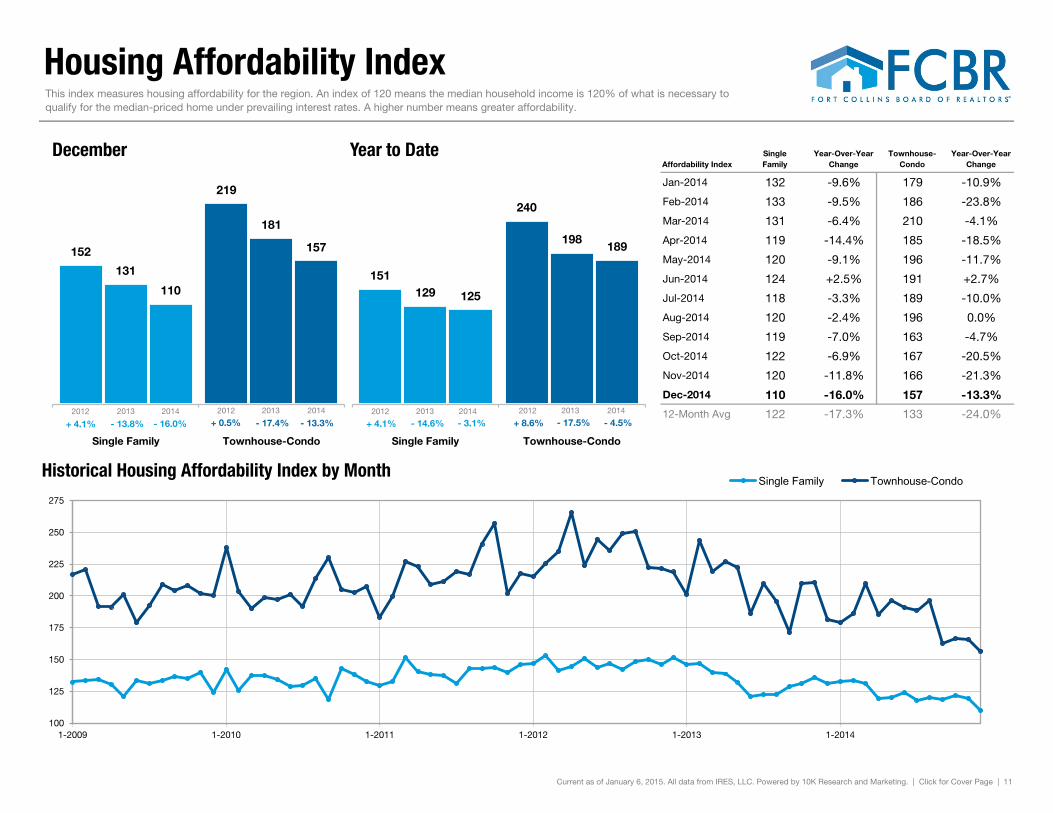
Affordability Index 131 110 - 16.0% 129 125 - 3.1%
-- --
Current as of January 6, 2015. All data from IRES, LLC. Powered by 10K Research and Marketing. | Click for Cover Page | 2
-- --
Months Supply Not enough historical data for chart -- 1.5 -- --
Active Listings Not enough historical data for chart -- 387 -- --
12-2011 12-2012 12-2013 12-2014
12-2011 12-2012 12-2013 12-2014
12-2011 12-2012 12-2013 12-2014
12-2011 12-2012 12-2013 12-2014
12-2011 12-2012 12-2013 12-2014
12-2011 12-2012 12-2013 12-2014
12-2011 12-2012 12-2013 12-2014
12-2011 12-2012 12-2013 12-2014
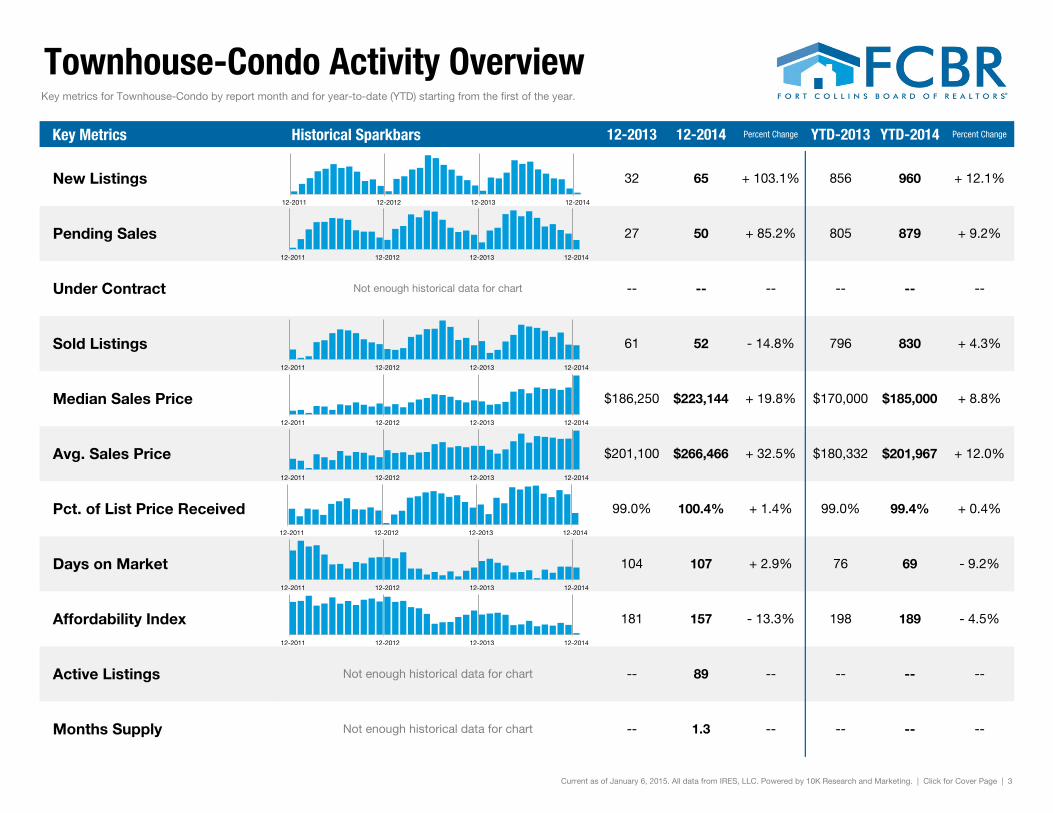
Townhouse-Condo Activity OverviewKey metrics for Townhouse-Condo by report month and for year-to-date (YTD) starting from the first of the year.
Key Metrics Historical Sparkbars 12-2013 12-2014 Percent Change YTD-2013 YTD-2014 Percent Change
+ 12.1%
Pending Sales 27 50 + 85.2% 805 879 + 9.2%
New Listings 32 65 + 103.1% 856 960
Under Contract Not enough historical data for chart -- -- -- -- -- --
Sold Listings 61 52 - 14.8% 796 830 + 4.3%
Median Sales Price $186,250 $223,144 + 19.8% $170,000 $185,000 + 8.8%
+ 12.0%
Pct. of List Price Received 99.0% 100.4% + 1.4% 99.0% 99.4% + 0.4%
Avg. Sales Price $201,100 $266,466 + 32.5% $180,332 $201,967
Days on Market 104 107 + 2.9% 76 69 - 9.2%
Affordability Index 181 157 - 13.3% 198 189 - 4.5%
-- --
Current as of January 6, 2015. All data from IRES, LLC. Powered by 10K Research and Marketing. | Click for Cover Page | 3
-- --
Months Supply Not enough historical data for chart -- 1.3 -- --
Active Listings Not enough historical data for chart -- 89 -- --
12-2011 12-2012 12-2013 12-2014
12-2011 12-2012 12-2013 12-2014
12-2011 12-2012 12-2013 12-2014
12-2011 12-2012 12-2013 12-2014
12-2011 12-2012 12-2013 12-2014
12-2011 12-2012 12-2013 12-2014
12-2011 12-2012 12-2013 12-2014
12-2011 12-2012 12-2013 12-2014
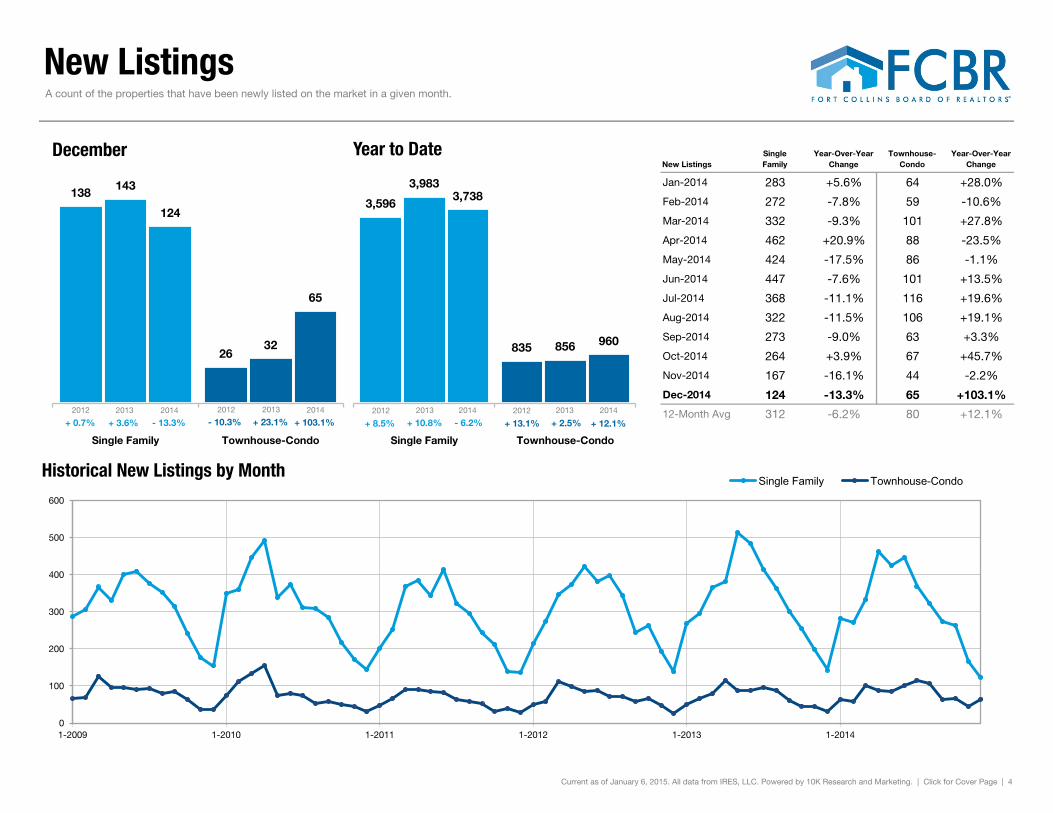
New Listings
New ListingsSingleFamily
Year-Over-YearChange
Townhouse-Condo
Year-Over-YearChange
Jan-2014 283 +5.6% 64 +28.0%
Feb-2014 272 -7.8% 59 -10.6%
Mar-2014 332 -9.3% 101 +27.8%
Apr-2014 462 +20.9% 88 -23.5%
May-2014 424 -17.5% 86 -1.1%
Jun-2014 447 -7.6% 101 +13.5%
Jul-2014 368 -11.1% 116 +19.6%
Aug-2014 322 -11.5% 106 +19.1%
Sep-2014 273 -9.0% 63 +3.3%
Oct-2014 264 +3.9% 67 +45.7%
Nov-2014 167 -16.1% 44 -2.2%
Dec-2014 124 -13.3% 65 +103.1%
12-Month Avg 312 -6.2% 80 +12.1%
Historical New Listings by Month
Current as of January 6, 2015. All data from IRES, LLC. Powered by 10K Research and Marketing. | Click for Cover Page | 4
A count of the properties that have been newly listed on the market in a given month.
138
26
143
32
124
65
Single Family Townhouse-Condo
December
0
100
200
300
400
500
600
1-2009 1-2010 1-2011 1-2012 1-2013 1-2014
Single Family Townhouse-Condo
3,596
835
3,983
856
3,738
960
Single Family Townhouse-Condo
Year to Date
2012 2013 2014
+ 103.1% + 23.1% - 13.3% + 3.6% + 2.5% - 6.2% + 10.8% + 12.1%
2012 2013 2014 2012 2013 2014 2012 2013 2014
+ 0.7% + 8.5% + 13.1% - 10.3%
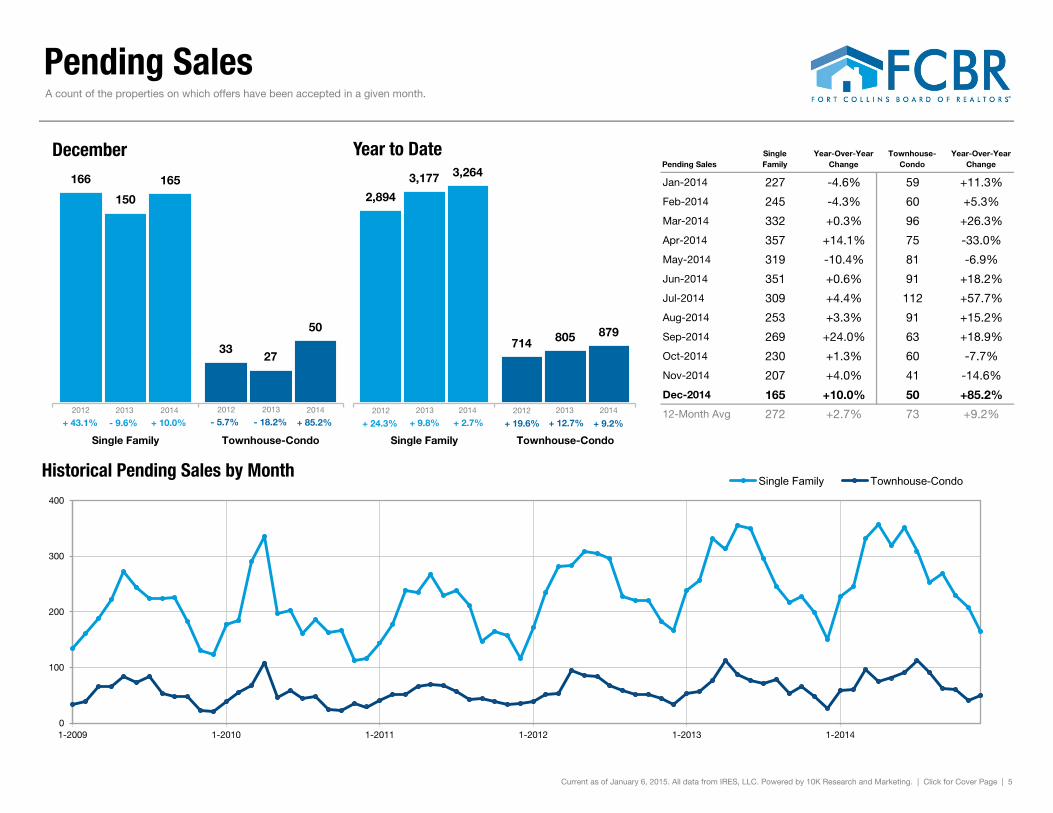
Pending Sales
Pending SalesSingleFamily
Year-Over-YearChange
Townhouse-Condo
Year-Over-YearChange
Jan-2014 227 -4.6% 59 +11.3%
Feb-2014 245 -4.3% 60 +5.3%
Mar-2014 332 +0.3% 96 +26.3%
Apr-2014 357 +14.1% 75 -33.0%
May-2014 319 -10.4% 81 -6.9%
Jun-2014 351 +0.6% 91 +18.2%
Jul-2014 309 +4.4% 112 +57.7%
Aug-2014 253 +3.3% 91 +15.2%
Sep-2014 269 +24.0% 63 +18.9%
Oct-2014 230 +1.3% 60 -7.7%
Nov-2014 207 +4.0% 41 -14.6%
Dec-2014 165 +10.0% 50 +85.2%
12-Month Avg 272 +2.7% 73 +9.2%
Historical Pending Sales by Month
Current as of January 6, 2015. All data from IRES, LLC. Powered by 10K Research and Marketing. | Click for Cover Page | 5
A count of the properties on which offers have been accepted in a given month.
166
33
150
27
165
50
Single Family Townhouse-Condo
December
0
100
200
300
400
1-2009 1-2010 1-2011 1-2012 1-2013 1-2014
Single Family Townhouse-Condo
2,894
714
3,177
805
3,264
879
Single Family Townhouse-Condo
Year to Date
2012 2013 2014
+ 85.2% - 18.2% + 10.0% - 9.6% + 12.7% + 2.7% + 9.8% + 9.2%
2012 2013 2014 2012 2013 2014 2012 2013 2014
+ 43.1% + 24.3% + 19.6% - 5.7%
Sold Listings
Sold ListingsSingleFamily
Year-Over-YearChange
Townhouse-Condo
Year-Over-YearChange
Jan-2014 146 -13.6% 32 -5.9%
Feb-2014 170 -7.1% 51 +27.5%
Mar-2014 233 -13.1% 61 +19.6%
Apr-2014 283 -0.4% 79 +19.7%
May-2014 360 +10.1% 76 -25.5%
Jun-2014 346 +5.2% 88 -1.1%
Jul-2014 337 -14.0% 87 -6.5%
Aug-2014 315 -8.4% 98 +24.1%
Sep-2014 268 +9.4% 90 +11.1%
Oct-2014 301 +15.8% 74 +60.9%
Nov-2014 209 +2.5% 42 -22.2%
Dec-2014 205 -13.1% 52 -14.8%
12-Month Avg 264 -2.1% 69 +4.3%
Historical Sold Listings by Month
Current as of January 6, 2015. All data from IRES, LLC. Powered by 10K Research and Marketing. | Click for Cover Page | 6
A count of the actual sales that closed in a given month.
176
49
236
61
205
52
Single Family Townhouse-Condo
December
0
100
200
300
400
1-2009 1-2010 1-2011 1-2012 1-2013 1-2014
Single Family Townhouse-Condo
2,799
703
3,241
796
3,173
830
Single Family Townhouse-Condo
Year to Date
2012 2013 2014
- 14.8% + 24.5% - 13.1% + 34.1% + 13.2% - 2.1% + 15.8% + 4.3%
2012 2013 2014 2012 2013 2014 2012 2013 2014
+ 2.3% + 21.4% + 19.0% + 22.5%
Median Sales Price
Median Sales PriceSingleFamily
Year-Over-YearChange
Townhouse-Condo
Year-Over-YearChange
Jan-2014 $249,050 -0.6% $184,500 +1.7%
Feb-2014 $250,725 +3.2% $179,601 +22.4%
Mar-2014 $256,000 +0.4% $160,000 -1.5%
Apr-2014 $280,000 +7.1% $180,000 +12.7%
May-2014 $286,000 +7.9% $175,000 +11.1%
Jun-2014 $276,250 +0.8% $179,500 +0.8%
Jul-2014 $290,000 +6.6% $181,000 +13.9%
Aug-2014 $286,500 +6.9% $175,000 +4.2%
Sep-2014 $287,103 +10.4% $209,010 +7.2%
Oct-2014 $284,350 +11.5% $207,750 +30.7%
Nov-2014 $290,000 +11.8% $209,250 +24.9%
Dec-2014 $318,000 +23.8% $223,144 +19.8%
12-Month Avg* $280,677 +7.5% $185,000 +8.8%
Historical Median Sales Price by Month* Median Sales Price for all properties from January 2014 through December 2014. This is not the average of the individual figures above.
Current as of January 6, 2015. All data from IRES, LLC. Powered by 10K Research and Marketing. | Click for Cover Page | 7
Point at which half of the sales sold for more and half sold for less, not accounting for seller concessions, in a given month.
$245,000
$170,000
$256,945
$186,250
$318,000
$223,144
Single Family Townhouse-Condo
December
$100,000
$150,000
$200,000
$250,000
$300,000
$350,000
1-2009 1-2010 1-2011 1-2012 1-2013 1-2014
Single Family Townhouse-Condo
$245,900
$155,000
$261,000
$170,000
$280,677
$185,000
Single Family Townhouse-Condo
Year to Date
2012 2013 2014
+ 19.8% + 9.6% + 23.8% + 4.9% + 9.7% + 7.5% + 6.1% + 8.8%
2012 2013 2014 2012 2013 2014 2012 2013 2014
+ 4.4% + 3.8% + 0.1% + 8.0%

Average Sales Price
Avg. Sales PriceSingleFamily
Year-Over-YearChange
Townhouse-Condo
Year-Over-YearChange
Jan-2014 $295,825 +2.7% $205,325 +9.8%
Feb-2014 $286,294 -1.1% $187,404 +16.0%
Mar-2014 $296,832 +5.0% $176,185 +1.5%
Apr-2014 $317,729 +9.9% $192,505 +17.6%
May-2014 $337,091 +16.2% $191,299 +9.5%
Jun-2014 $314,397 +1.3% $188,195 -4.3%
Jul-2014 $330,556 +4.7% $192,105 +13.6%
Aug-2014 $328,959 +8.9% $188,734 +9.5%
Sep-2014 $327,116 +7.1% $214,168 +5.1%
Oct-2014 $323,744 +7.0% $235,057 +42.3%
Nov-2014 $324,513 +6.0% $207,503 +11.7%
Dec-2014 $344,883 +12.8% $266,466 +32.5%
12-Month Avg* $321,377 +7.1% $201,967 +12.0%
Historical Average Sales Price by Month* Avg. Sales Price for all properties from January 2014 through December 2014. This is not theaverage of the individual figures above.
Current as of January 6, 2015. All data from IRES, LLC. Powered by 10K Research and Marketing. | Click for Cover Page | 8
Average sales price for all closed sales, not accounting for seller concessions, in a given month.
$294,534
$188,573
$305,645
$201,100
$344,883
$266,466
Single Family Townhouse-Condo
December
$100,000
$150,000
$200,000
$250,000
$300,000
$350,000
1-2009 1-2010 1-2011 1-2012 1-2013 1-2014
Single Family Townhouse-Condo
2012 2013 2014
+ 32.5% + 6.6% + 12.8% + 3.8% 2012 2013 2014
+ 7.9% + 20.4%
$281,375
$164,885
$299,935
$180,332
$321,377
$201,967
Single Family Townhouse-Condo
Year to Date
+ 12.0% + 9.4% 2012 2013 2014 2012 2013 2014
+ 7.1% + 6.6% + 2.9% + 5.9%

Percent of List Price Received
Pct. of List Price Received
SingleFamily
Year-Over-YearChange
Townhouse-Condo
Year-Over-YearChange
Jan-2014 98.0% +0.1% 98.0% -0.4%
Feb-2014 98.9% +0.8% 98.6% +0.2%
Mar-2014 98.6% -0.3% 98.9% 0.0%
Apr-2014 99.5% +0.5% 100.0% +1.1%
May-2014 99.4% +0.2% 99.9% +0.7%
Jun-2014 99.5% +0.2% 99.4% +0.3%
Jul-2014 99.6% +0.5% 99.5% +0.1%
Aug-2014 99.1% +0.2% 99.2% +0.1%
Sep-2014 98.9% -0.1% 99.7% +0.1%
Oct-2014 99.3% +0.6% 99.5% +1.1%
Nov-2014 99.1% +0.8% 98.8% +1.2%
Dec-2014 98.0% -0.5% 100.4% +1.4%
12-Month Avg* 98.8% +0.3% 99.0% +0.5%
Historical Percent of List Price Received by Month* Pct. of List Price Received for all properties from January 2014 through December 2014. This is not the average of the individual figures above.
Current as of January 6, 2015. All data from IRES, LLC. Powered by 10K Research and Marketing. | Click for Cover Page | 9
Percentage found when dividing a property’s sales price by its most recent list price, then taking the average for all properties sold in a given month, not accounting for seller concessions.
97.4% 97.9% 98.5% 99.0% 98.0% 100.4%
Single Family Townhouse-Condo
December
94%
95%
96%
97%
98%
99%
100%
101%
1-2009 1-2010 1-2011 1-2012 1-2013 1-2014
Single Family Townhouse-Condo
98.3% 97.8% 98.8% 99.0% 99.1% 99.4%
Single Family Townhouse-Condo
Year to Date
2012 2013 2014
+ 1.4% + 1.1% - 0.5% + 1.1% + 1.2% + 0.3% + 0.5% + 0.4% 2012 2013 2014 2012 2013 2014 2012 2013 2014
- 0.9% + 0.7% + 0.5% + 0.7%
Days on Market Until Sale
Days on MarketSingleFamily
Year-Over-YearChange
Townhouse-Condo
Year-Over-YearChange
Jan-2014 103 -1.0% 97 +16.9%
Feb-2014 95 -18.1% 60 -51.2%
Mar-2014 90 +7.1% 66 -9.6%
Apr-2014 76 -8.4% 63 -7.4%
May-2014 76 +7.0% 60 -22.1%
Jun-2014 80 +5.3% 56 -11.1%
Jul-2014 64 -8.6% 47 -24.2%
Aug-2014 81 +3.8% 47 -26.6%
Sep-2014 75 +10.3% 95 +3.3%
Oct-2014 87 +10.1% 81 +47.3%
Nov-2014 87 +2.4% 89 +25.4%
Dec-2014 85 -14.1% 107 +2.9%
12-Month Avg 81 -0.7% 69 -8.7%
Historical Days on Market Until Sale by Month
Average number of days between when a property is listed and when an offer is accepted in a given month.
* Days on Market for all properties from January 2014 through December 2014. This is not the average of the individual figures above.
Current as of January 6, 2015. All data from IRES, LLC. Powered by 10K Research and Marketing. | Click for Cover Page | 10
106
79
99 104
85
107
Single Family Townhouse-Condo
December
25
50
75
100
125
150
175
200
1-2009 1-2010 1-2011 1-2012 1-2013 1-2014
Single Family Townhouse-Condo
103
90 82
76 81
69
Single Family Townhouse-Condo
Year to Date
2012 2013 2014
+ 2.9% + 31.6% - 14.1% - 6.6% - 15.6% - 1.2% - 20.4% - 9.2%
2012 2013 2014 2012 2013 2014 2012 2013 2014
- 11.7% - 9.6% - 27.4% - 47.0%
Housing Affordability Index
Affordability IndexSingleFamily
Year-Over-YearChange
Townhouse-Condo
Year-Over-YearChange
Jan-2014 132 -9.6% 179 -10.9%
Feb-2014 133 -9.5% 186 -23.8%
Mar-2014 131 -6.4% 210 -4.1%
Apr-2014 119 -14.4% 185 -18.5%
May-2014 120 -9.1% 196 -11.7%
Jun-2014 124 +2.5% 191 +2.7%
Jul-2014 118 -3.3% 189 -10.0%
Aug-2014 120 -2.4% 196 0.0%
Sep-2014 119 -7.0% 163 -4.7%
Oct-2014 122 -6.9% 167 -20.5%
Nov-2014 120 -11.8% 166 -21.3%
Dec-2014 110 -16.0% 157 -13.3%
12-Month Avg 122 -17.3% 133 -24.0%
Historical Housing Affordability Index by Month
Current as of January 6, 2015. All data from IRES, LLC. Powered by 10K Research and Marketing. | Click for Cover Page | 11
This index measures housing affordability for the region. An index of 120 means the median household income is 120% of what is necessary to qualify for the median-priced home under prevailing interest rates. A higher number means greater affordability.
152
219
131
181
110
157
Single Family Townhouse-Condo
December
100
125
150
175
200
225
250
275
1-2009 1-2010 1-2011 1-2012 1-2013 1-2014
Single Family Townhouse-Condo
2012 2013 2014
- 13.3% - 17.4% - 16.0% - 13.8% 2012 2013 2014
+ 4.1% + 0.5%
151
240
129
198
125
189
Single Family Townhouse-Condo
Year to Date
- 4.5% - 17.5% - 3.1% - 14.6% + 4.1% + 8.6% 2012 2013 2014 2012 2013 2014

All Properties Activity OverviewKey metrics by report month and for year-to-date (YTD) starting from the first of the year.
Key Metrics Historical Sparkbars 12-2013 12-2014 Percent Change YTD-2013 YTD-2014 Percent Change
- 2.9%
Pending Sales 177 215 + 21.5% 805 879 + 9.2%
New Listings 175 189 + 8.0% 4,839 4,698
Under Contract Not enough historical data for chart -- -- -- -- -- --
Sold Listings 297 257 - 13.5% 4,037 4,003 - 0.8%
Median Sales Price $240,000 $294,000 + 22.5% $242,750 $260,000 + 7.1%
+ 7.3%
Pct. of List Price Received 98.6% 98.5% + 0.3% 98.9% 99.2% + 0.3%
Avg. Sales Price $284,173 $329,016 + 7.3% $276,346 $296,612
Days on Market 100 90 - 2.5% 81 79 - 2.5%
Affordability Index 141 119 - 3.3% 139 134 - 3.3%
-- --
Current as of January 6, 2015. All data from IRES, LLC. Powered by 10K Research and Marketing. | Click for Cover Page | 12
-- --
Months Supply Not enough historical data for chart -- 1.4 -- --
Active Listings Not enough historical data for chart -- 476 -- --
12-2011 12-2012 12-2013 12-2014
12-2011 12-2012 12-2013 12-2014
12-2011 12-2012 12-2013 12-2014
12-2011 12-2012 12-2013 12-2014
12-2011 12-2012 12-2013 12-2014
12-2011 12-2012 12-2013 12-2014
12-2011 12-2012 12-2013 12-2014
12-2011 12-2012 12-2013 12-2014
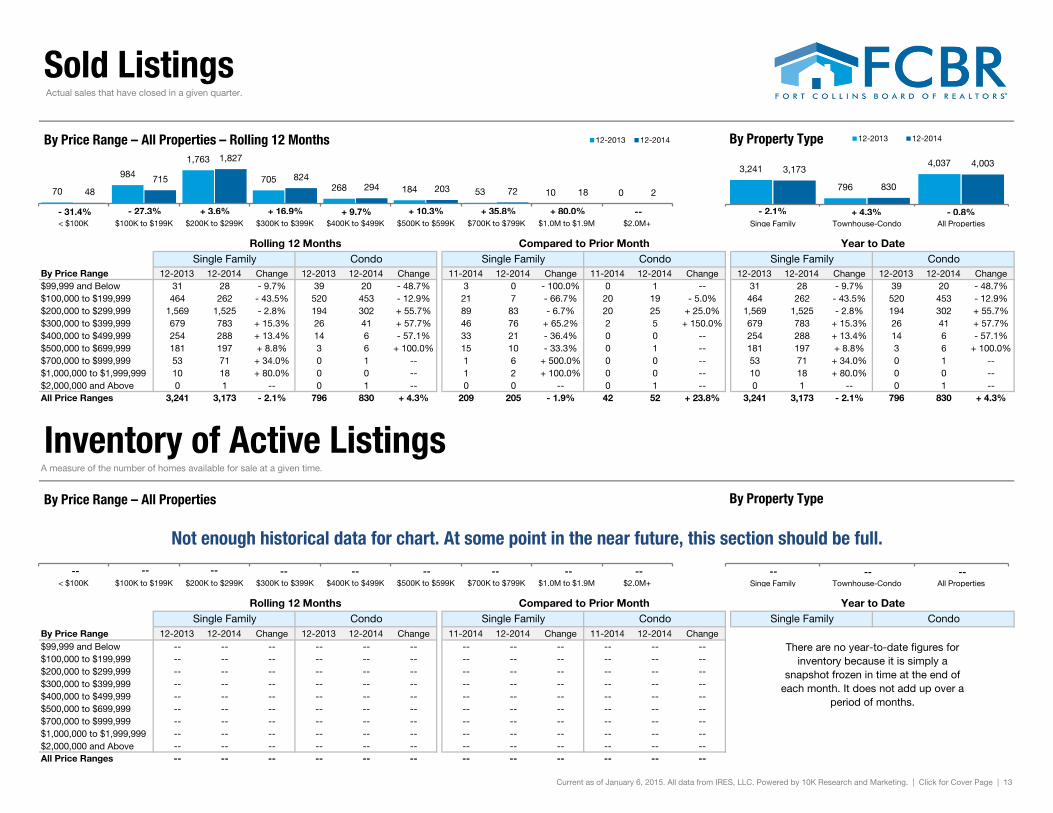
Sold Listings
By Price Range 12-2013 12-2014 Change 12-2013 12-2014 Change 11-2014 12-2014 Change 11-2014 12-2014 Change 12-2013 12-2014 Change 12-2013 12-2014 Change$99,999 and Below 31 28 - 9.7% 39 20 - 48.7% 3 0 - 100.0% 0 1 -- 31 28 - 9.7% 39 20 - 48.7%$100,000 to $199,999 464 262 - 43.5% 520 453 - 12.9% 21 7 - 66.7% 20 19 - 5.0% 464 262 - 43.5% 520 453 - 12.9%$200,000 to $299,999 1,569 1,525 - 2.8% 194 302 + 55.7% 89 83 - 6.7% 20 25 + 25.0% 1,569 1,525 - 2.8% 194 302 + 55.7%$300,000 to $399,999 679 783 + 15.3% 26 41 + 57.7% 46 76 + 65.2% 2 5 + 150.0% 679 783 + 15.3% 26 41 + 57.7%$400,000 to $499,999 254 288 + 13.4% 14 6 - 57.1% 33 21 - 36.4% 0 0 -- 254 288 + 13.4% 14 6 - 57.1%$500,000 to $699,999 181 197 + 8.8% 3 6 + 100.0% 15 10 - 33.3% 0 1 -- 181 197 + 8.8% 3 6 + 100.0%$700,000 to $999,999 53 71 + 34.0% 0 1 -- 1 6 + 500.0% 0 0 -- 53 71 + 34.0% 0 1 --$1,000,000 to $1,999,999 10 18 + 80.0% 0 0 -- 1 2 + 100.0% 0 0 -- 10 18 + 80.0% 0 0 --$2,000,000 and Above 0 1 -- 0 1 -- 0 0 -- 0 1 -- 0 1 -- 0 1 --All Price Ranges 3,241 3,173 - 2.1% 796 830 + 4.3% 209 205 - 1.9% 42 52 + 23.8% 3,241 3,173 - 2.1% 796 830 + 4.3%
Inventory of Active Listings
By Price Range 12-2013 12-2014 Change 12-2013 12-2014 Change 11-2014 12-2014 Change 11-2014 12-2014 Change$99,999 and Below -- -- -- -- -- -- -- -- -- -- -- --$100,000 to $199,999 -- -- -- -- -- -- -- -- -- -- -- --$200,000 to $299,999 -- -- -- -- -- -- -- -- -- -- -- --$300,000 to $399,999 -- -- -- -- -- -- -- -- -- -- -- --$400,000 to $499,999 -- -- -- -- -- -- -- -- -- -- -- --$500,000 to $699,999 -- -- -- -- -- -- -- -- -- -- -- --$700,000 to $999,999 -- -- -- -- -- -- -- -- -- -- -- --$1,000,000 to $1,999,999 -- -- -- -- -- -- -- -- -- -- -- --$2,000,000 and Above -- -- -- -- -- -- -- -- -- -- -- --All Price Ranges -- -- -- -- -- -- -- -- -- -- -- --
Actual sales that have closed in a given quarter.
Rolling 12 Months Compared to Prior Month Year to DateSingle Family Condo Single Family Condo Single Family Condo
There are no year-to-date figures for inventory because it is simply a
snapshot frozen in time at the end of each month. It does not add up over a
period of months.
Current as of January 6, 2015. All data from IRES, LLC. Powered by 10K Research and Marketing. | Click for Cover Page | 13
A measure of the number of homes available for sale at a given time.
Rolling 12 Months Compared to Prior Month Year to DateSingle Family Condo Single Family Condo Single Family Condo
Not enough historical data for chart. At some point in the near future, this section should be full.
3,241
796
4,037 3,173
830
4,003
Singe Family Townhouse-Condo All Properties
By Property Type 12-2013 12-2014
Singe Family Townhouse-Condo All Properties
By Property Type
70
984
1,763
705 268 184 53 10 0 48
715
1,827
824 294 203 72 18 2
< $100K $100K to $199K $200K to $299K $300K to $399K $400K to $499K $500K to $599K $700K to $799K $1.0M to $1.9M $2.0M+
By Price Range – All Properties – Rolling 12 Months 12-2013 12-2014
--
< $100K $100K to $199K $200K to $299K $300K to $399K $400K to $499K $500K to $599K $700K to $799K $1.0M to $1.9M $2.0M+
By Price Range – All Properties
- 31.4% - 27.3% + 3.6% + 16.9% + 80.0% + 9.7% + 10.3% + 35.8% - 2.1% + 4.3% - 0.8%
-- -- -- -- -- ---- -- -- -- -- --
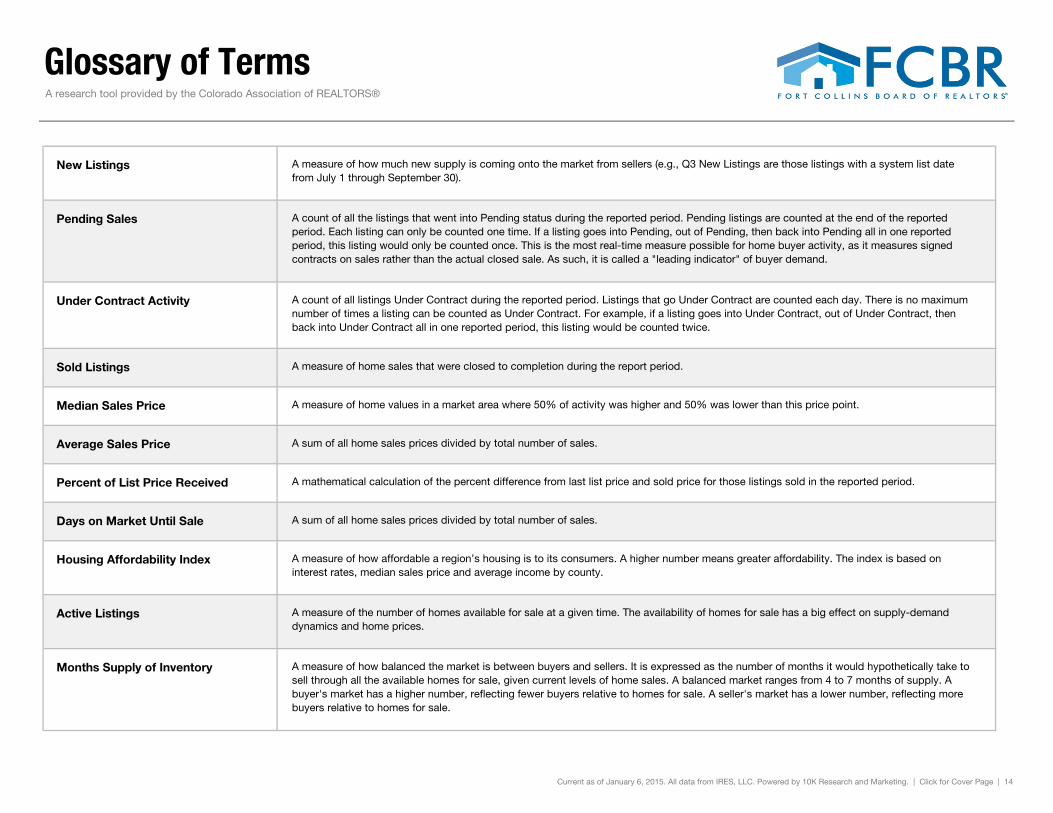
Glossary of Terms
New Listings
Pending Sales
Under Contract Activity
Sold Listings
Median Sales Price
Average Sales Price
Percent of List Price Received
Days on Market Until Sale
Housing Affordability Index
Active Listings
Months Supply of Inventory
A measure of home values in a market area where 50% of activity was higher and 50% was lower than this price point.
A research tool provided by the Colorado Association of REALTORS®
A measure of how much new supply is coming onto the market from sellers (e.g., Q3 New Listings are those listings with a system list date from July 1 through September 30).
A count of all the listings that went into Pending status during the reported period. Pending listings are counted at the end of the reported period. Each listing can only be counted one time. If a listing goes into Pending, out of Pending, then back into Pending all in one reported period, this listing would only be counted once. This is the most real-time measure possible for home buyer activity, as it measures signed contracts on sales rather than the actual closed sale. As such, it is called a "leading indicator" of buyer demand.
A count of all listings Under Contract during the reported period. Listings that go Under Contract are counted each day. There is no maximum number of times a listing can be counted as Under Contract. For example, if a listing goes into Under Contract, out of Under Contract, then back into Under Contract all in one reported period, this listing would be counted twice.
A measure of home sales that were closed to completion during the report period.
Current as of January 6, 2015. All data from IRES, LLC. Powered by 10K Research and Marketing. | Click for Cover Page | 14
A sum of all home sales prices divided by total number of sales.
A mathematical calculation of the percent difference from last list price and sold price for those listings sold in the reported period.
A sum of all home sales prices divided by total number of sales.
A measure of how affordable a region’s housing is to its consumers. A higher number means greater affordability. The index is based on interest rates, median sales price and average income by county.
A measure of the number of homes available for sale at a given time. The availability of homes for sale has a big effect on supply-demand dynamics and home prices.
A measure of how balanced the market is between buyers and sellers. It is expressed as the number of months it would hypothetically take to sell through all the available homes for sale, given current levels of home sales. A balanced market ranges from 4 to 7 months of supply. A buyer's market has a higher number, reflecting fewer buyers relative to homes for sale. A seller's market has a lower number, reflecting more buyers relative to homes for sale.