end-game - Tullett Prebon the denouement of exponentials Dr Tim Morgan Global Head of Research...
80
end-game the denouement of exponentials Dr Tim Morgan Global Head of Research strategy insights | issue six
-
Upload
phamkhuong -
Category
Documents
-
view
216 -
download
0
Transcript of end-game - Tullett Prebon the denouement of exponentials Dr Tim Morgan Global Head of Research...

end-gamethe denouement
of exponentials Dr Tim Morgan Global Head of Research
strategy insights | issue six

1strategy insights | issue six
contents
about this report 2
summaries i. overview – a system in crisis 5 ii. fundamental drivers – the exponential economy 6 iii. smoke and mirrors – a denouement disguised 7 iv. end-game – the denouement of exponentials 8
sources and recommended reading 10
part one: overview – a system in crisis 15 afundamentalchange? 17 smokeandmirrors 18 wherearewenow? 20 whathappensnext? 24
part two: fundamental dynamics – exponential drivers 27 exponentialenergyuse,finiteresources 28 exponentialmoney,escalatingdebt 34
part three: smoke and mirrors – a denouement disguised 43 misplacedfaith 44 officialdata,underlyingreality 44 ‘Pollyannacreep’ 47 inflation–thecostofliving,orthepriceofsurvival? 48 economicoutput–aGrosslyDistortedPicture 52 debtandthedeficit 56
part four: end-game – the denouement of exponentials 65 thefirstlinkage–aweakeningenergyequation 70 thesecondlinkage–recklessfinance 74 avoidingdisaster–canwebreakthelinkages? 75
end-gamethe denouement of exponentials

strategy insights | issue six2
end-game | the denouement of exponentials
about this report
WiththeWesterneconomiesmiredineconomicstagnationandburdenedbyunprecedentedlevelsofdebt,itisnotatallsurprisingthattheeconomicdebatehasbecomepolarisedbetweendebt-cuttersandfiscalstimulators.Ferventthoughthisdebateis,it completely misses the point.ThisreportidentifiesfundamentalissuesthatareneglectedbyKeynesiansandfreemarketeersalike,andcallsforawhollynewmethodofeconomicinterpretation.
Intellectually,thehighgroundisupforgrabsforonlythesecondtimesincetheSecondWorldWar.Inthethreedecadesafter1945,Keynesianorthodoxyruled.Fromthemid-1970s,afree-marketphilosophyvariouslylabelled‘monetarism’,‘laissez-faire’and‘theWashingtonconsensus’
becametheneworthodoxy.Thoughitsadherentshavebeenfightingavaliantrearguardaction,therealityisthattheultra-free-marketsystemisdeadinthewater,discreditedbytheeventsof2008-09.Keynesiansarehopingthattheirparadigmwillregainitsformerpre-eminence,buttheyaremistaken.
Both approaches are outmoded.Freemarketorthodoxycreatedprofoundweaknessesintheglobaleconomy,andtookthefinancialsystemtothebrinkofcollapse.TheKeynesiansolutionsofthepastarenoanswertothechallengesofthepresentandthefuture,notleastbecauseitisimpossibletoborrowone’swayoutofadebtproblem.Somethingwhollynewwillemergefromthecauldronofthefinancialcrisis.
That new paradigm is very likely to be “exponential economics”,ourtermforanewphilosophywhichtakesaccountofthelong-runtrendsthatgoverneconomicevolution.Thefirstaimofthisreportistoexplainwhat“exponentialeconomics”is.
Exponentialeconomicsisamethodofinterpretationwhichuseslong-runanalysistobuilduponanidentificationofthetwokeydriversofsocietyandtheeconomy.
Thefirstofthesekeydriversisthatthe economy is an energy equation.Societyasweknowittodayisaproductoftheuseofextraneousenergytoleveragethelimitedcapabilitiesofhumanlabour.Theleveragingeffectofabundant
strategy insights | issue six 3
extraneousenergyalonepermitstheearthtosupportapopulationofalmostsevenbillionpeople.
Ultimately,money and debt are quantifications of the energy leveraging effect.Ifonesingleequationmattersmostinunderstandinganenergy-basedeconomicsystem,itisEnergyReturnsOnEnergyInvested(EROEI),whichcomparesenergyoutputswithenergyconsumedintheextractionprocess.
Thesecondkeydriverhasbeentheerectionofan ever more extended anticipatory financial superstructure on top of the fundamental surplus energy equation.Sincetheadventofthefree-marketorthodoxy,thissuperstructurehasbecomesuccessivelymoreexponentialand
dangerous,toanextentthatwasnotfullyappreciateduntiltheentiresystemteeteredonthebrinkofcollapsein2008-09.
Theproblemnowisthat,evenifsuppliesofextraneousenergyremaincomparativelyabundant,energyreturns–thecriticalsurpluspartoftheenergyequation–areweakening,particularlyintheWesterneconomies.Thistendencysuggeststhatthefoundationsoftheelaboratefinancialsuperstructurearecrumbling,andthatthisprocessrendersunprecedentedeconomicandsocialchangeinevitable.
Policymakersaresingularlyill-equippedtounderstand,letalonetoanticipateandtomanage,thecomingperiodoffundamentalchange.Theirdatabasesarefartooshort-term
foranappreciationofexponentialchange,andthereexistsnoagreedcalibrationofthecriticalenergyreturnsequation.
Wehopethatthisreportwillprovokedebateovertheseissues,andwewelcomeallcontributionstothebetterunderstandingofexponentialeconomics.
Dr Tim MorganGlobalHeadofResearchTullettPrebonplc
November2010

“[W]ho profits from a low-growth U.S. economy hidden under statistical camouflage [?] Might it be
Washington politicos and affluent elites, anxious to mislead voters, coddle the financial markets, and
tamp down expensive cost-of-living increases for wages and pensions?”
Kevin Phillips1
end-game | the denouement of exponentials
4 strategy insights | issue six1 Kevin Phillips, “Numbers racket – why the economy is worse
than we know”, Harper’s Magazine, 1st May 2006

5strategy insights | issue six
• Thoughtheglobaleconomypulledbackfromthebrinkofcatastrophein2008-09,OECDcountriesremainburdenedbyhugedebts.
• Thoughsomeeconomicdatasuggestsrelativeresilience,adeeperlookattheglobaleconomysuggeststhatproblemshavebeenmanagedratherthanresolved.
• Officialdataisatoddsbothwiththerealityofmassivedebtsandwithsubjectiveinterpretationsonissuessuchasoutput,inflationandgrowth.
• Themonetaryratchet–aprocesswherebylowinterestratescreatebubbles,whosedamagingburststhenprovokeproblemswhicharecounteredbyyetlowerrates–hasreacheditslogicalconclusion,neutralisingratepolicyandencouragingaresorttoquantitativeeasing(QE),thecontemporaryeuphemismfortheprintingofmoney.
• Canawhollynewapproachtoeconomicinterpretation–exponential economics–providebetterinsightsintothetrueconditionof,andoutlookfor,theWesterneconomicsystem?
summariesi. overview – a system in crisis

strategy insights | issue six6
end-game | the denouement of exponentials
ii. fundamental drivers – the exponential economy
• Along-termassessmentoftheglobaleconomyrevealsthatitisgovernedbytwocategoriesof‘exponentials’.
• Thefirstoftheseistheexponentialexpansionofphysicalmetricssuchaspopulationandresourceuse.
• Thesecondisanexponentialfinancialsystemcharacterisedbyacceleratingexpansionindatasetssuchasdebtandinflation.
• Ultimately,theeconomyisanenergysurplusequation,andsocialsophisticationisaproductofthewayinwhichexogenousenergyhasleveragedhumanefforts.
• Theexponentials-basedfinancialsystemfacestwolinkedthreats.Thefirstoftheseisthepotentialforacollisionbetween,ontheonehand,aneconomicsystemwhichrequiresperpetualgrowthand,ontheother,afiniteresourceset.
• Thesecond,moreimminentthreatcomesfromtheinternalmathematicalcontradictionsofaneconomicsystemwhichisincreasinglyturningtodebttosustainconsumptioninthefaceofstaticrealoutput.
Fig. 1: The exponential economy – a conceptualised representation*
Exponentials – a conceptualised representation
1750 2010 2050
Exponential – tip-over?
Anticipated – debt and financialisation
Leveraged – energy & industry
Basic – population
*Sources:TullettPrebonanalysis

strategy insights | issue six 7
iii. smoke and mirrors – a denouement disguised
• Inmostwalksoflife,deferential,unquestioningacceptanceofgovernmentpronouncementsisathingofthepast,andinvestors,inparticular,usuallyexercisehealthyscepticism.Itisstrikinglyanomalous,therefore,thatmarketstendtoacceptgovernmentmacroeconomicdataatfacevalue.
• Therealityisthatmuchgovernmentdataisextremelyunreliable.Ahistoryofincremental‘adjustment’hasdistortedmanymeasures–suchasunemployment,inflation,growth,deficitsanddebt–tothepoint
wherethestatisticalpictureisdrasticallydifferentfromtheunderlyingeconomicreality.
• FocusingontheUS,weexplainandstripawaythreedecadesof‘Pollyannacreep’torevealaneconomywhichisdrasticallyweakerthanisgenerallysupposed.
• Unemployment,reportedat9.7%,actuallyexceeds21%.Inflation,saidtobeatnear-zerolevels,isabove7%.
• RealGDPgrowthoverthelastdecade,reportedtohaveaveraged1.7%,hasactuallybeennegative.
• Publicdebtisoutofcontrol,exceeding$69trillion(or540%ofGDP)onceoff-balance-sheetobligationsareincluded.
• ThedeficitforFY2009wasreportedat$1.47trillion,butthisexcludesincrementstooff-balance-sheetwelfareobligations.Theannualdeficitinclusiveoftheseincrementalcommitmentstotalled$4.5trillionlastyear.
Fig. 2: Smoke and mirrors – the US economy*
Smoke and mirrors – the US economy
Off balance sheetFormal
official underlying official underlying official underlying official underlying official underlying
Growth, 2000-09** Inflation, 2000-09** Deficit, 2009*** Public debt, 2009 Unemployment, 2010
+1.7% 9.4%
2.6%
-2.0%
$7.6 trn $1.47 trn
$69.4 trn $4.44 trn
9.7%
21.7%
Sources: *OfficialdataandTullettPreboncalculationsbasedondatafromShadowstats.com,seetext
**GrowthandCPIdatashowcompoundratesbetween2000and2009
***Atendoffiscalyear

strategy insights | issue six8
end-game | the denouement of exponentials
iv. end-game – the denouement of exponentials
• TheprocessoflookingbehindPollyannadatarevealsaUSeconomywhichisex-growth,hasstronginflationarytendencies,andismassivelyindebt.ThesecharacteristicsseemtobesharedbymanyotherWesterneconomies.
• Ineffect, theWestern economic system is being crippled by the unwinding of exponential debt-and-obligation finance as the core energy dynamic erodes.Itmaybesimplyamatteroftimebeforethesystemtopplesover,withultra-highinflationseemingalmostinevitable.
• Verylittlehasbeendonetoaddress(orevenrecognise)theseintrinsicunsustainabilities.Intheprivatesector,banksremainatlibertytoinflatefuturesequentialdebt-drivenassetbubbles,whilstgovernments’futurewelfarecommitmentscannotconceivablybedelivered.
• Inthissituation,neitherKeynesianstimulusnorlaissez-fairemarketliberalismoffersanyanswers.Betweenthem,theseideologiesarethecausesofthedeparturefromsoundfinance.
• Thekeyissueforpolicymakersisdamage-limitingmanagementoftheunwindingprocess,withconditionssettogettougherdueto(a)demographicchange,and(b)theweakeningofthesurplusenergyequation.
• Formaldebtwillbedestroyedviathe‘softdefault’routeofinflation,sincenoothersolutionexists.Atthesametime,governmentsneedtoacceptthatmostwesternwelfaresystemsarebecomingcompletelyunaffordable.

strategy insights | issue six 9
Fig. 3: Deep in the hole: total US debt and quasi-debt*
US debt & quasi-debt, 1990-2009 ($ trillion)
$100
$80
$40
$60
$20
$0
Individual & corporateState & localFederal owed to publicFederal off-balance sheet**
1990
1991
1992
1993
1994
1995
1996
1997
1998
1999
2000
2001
2002
2003
2004
2005
2006
2007
2008
2009
$bn 2000 2003 2006 2009
Individual & corporate $14,480 $18,063 $23,910 $26,262
State & local $1,198 $1,568 $2,008 $2,355
Federal debt to the public $3,385 $4,033 $4,885 $7,805
Federal off-balance-sheet $21,780 $29,608 $47,808 $56,536
Total $40,843 $53,273 $78,611 $92,958
Sources: *FederalReserve,www.federalreserve.gov/releases/z1/current/z1.pdf.Latestdata:1Q2010,andFinancial Report of the United States Government,2000through2009
**NPVoffutureoff-balance-sheetwelfareobligations,sourcedfromFinancial Report of the United States Government,2000through2009

strategy insights | issue six10
end-game | the denouement of exponentials
Thisresearchprojecthasdrawnupondataandinterpretationsfromaverywiderangeofsources.Someofthesearelistedbelow,togetherwithselectedrecommendationsforfurtherreading.
three sources have been of huge importance to this project:
ThefirstoftheseisJohn Williams,whoseShadow Government Statisticsservicelooksbehindthe“PollyannaCreep”inUSofficialdata,andpublishesconsistentlong-rundata,briefingsandanalyses.WebelievethattheSGSsubscriptionserviceisanimperativesourceforanyinvestororpolicymakerwhowishestounderstandtheeconomyandgovernmentoftheUnitedStates.Manyofthecharts
andtablesusedinthisreportarebasedondatafromthissource,andareacknowledgedas‘Shadowstats’throughout.Shadow Government Statisticscanbecontactedatwww.shadowstats.com
Chris Martensonhassetoutabrilliantandpersuasiveanalysisofthesocialandeconomicexponentialsprocess.HisCrash CourseisavailableasaDVD,andcanbeaccessedonlineatwww.chrismartenson.com
OurthirdkeysourcehasbeentheworksofKevin Phillips,oneofAmerica’sleadingpoliticalstrategists.WhenworkingfortheNixonteam,MrPhillipspublishedThe Emerging
Republican Consensus,inwhichhecorrectlyidentifiedthelikelyswinginthecentreofgravityofAmericanpoliticsfromtheindustrialNorthEasttothe“SunBelt”oftheSouthandWest.Latterly,MrPhillipshasbecomeincreasinglyconcernedaboutpoliticalandeconomicdevelopmentsintheUnitedStates,andhaspublishedseveralsuperbanalysesincludingAmerican Theocracy and Bad Money.
Thesethreesourceshavebeenindispensable(thoughweareofcourseresponsibleforallinterpretationspresentedinthisreport).
sources andrecommended reading

strategy insights | issue six 11
sources of information
1. AdamSmithInstitute(UK)
2. AlbertBartlett,ProfessorEmeritusofPhysics
3. BankforInternationalSettlements
4. BankofEngland(UK)
5. BBConline(UK)
6. BP Statistical Review of World Energy
7. BureauofEconomicAnalysis(US)
8. CentralIntelligenceAgency(US)
9. CongressionalBudgetOffice(US)
10. USCensusBureau
11. The Daily Telegraph
12. DebtManagementOffice(UK)
13. DepartmentforBusinessInnovationandSkills(UK)
14. USDepartmentofAgriculture
15. USDepartmentoftheTreasury
16. The Economist
17. EnergyInformationAdministration(US)
18. EuropeanCommission
19. Eurostat(EU)
20. FederalReserveBoard(US)
21. FederalReserveBankofSt.Louis(US)
22. The Financial Times
23. GovernmentPrintingOffice(US)
24. InternationalEnergyAgency
25. InternationalLabourOrganisation
26. InternationalMonetaryFund
27. JohnMauldin’sThoughts from the Front Line
28. NationalBureauofStatisticsofChina
29. TheNationalBureauofEconomicResearch(US)
30. The New York Times
31. OfficeofManagementandBudget(US)
32. OfficeforNationalStatistics(UK)
33. OrganisationforEconomicCooperationandDevelopment(OECD)
34. OrganisationofthePetroleumExportingCountries(OPEC)
35. WilliamH.Gross,Investment Outlook,PIMCO
36. MohamedEl-Erian,Economic Outlook,PIMCO
37. StatistischesBundesamtDeutschland(Germany)
38. H.M.Treasury(UK)
39. UnitedNations
40. TheWhiteHouse,CouncilofEconomicAdvisers(US)
41. TheWorldBank

strategy insights | issue six12
end-game | the denouement of exponentials
recommended reading: a selected bibliography
1. EamonnButler,The Rotten State of Britain: How Gordon Brown Lost a Decade and Cost a Fortune(2009)
2. JohnCassidy,How Markets Fail: The Logic of Economic Calamities(2010)
3. NiallFerguson,The Ascent of Money: A Financial History of the World(2009)
4. JohnGray,False Dawn: The Delusions of Global Capitalism(2009edition)
5. BillHoustonandRobinGriffiths,Future Storm: The Dynamics Unlocking the Future(2006)
6. PaulKrugman,The Return of Depression Economics(2008)
7. PaulMason,Meltdown: The End of the Age of Greed(2009)
8. RobertPeston,Who Runs Britain? And Who’s to Blame for the Economic Mess We’re in(2008)
9. KevinPhillips,American Theocracy: The Peril and Politics of Radical Religion, Oil, and Borrowed Money in the 21st Century (2007)
10. KevinPhillips,Bad Money(2009edition)
11. RaghuramG.Rajan,Fault Lines: How Hidden Fractures Still Threaten the World Economy(2010)
12. CarmenM.Reinhart,KennethRogoff,This Time is Different: Eight Centuries of Financial Folly(2009)
13. NourielRoubini,StephenMihm,Crisis Economics: A Crash Course in the Future of Finance (2010)
14. GeorgeSoros, The Crash of 2008 And What It Means: The New Paradigm For Financial Markets (2009)
15. JosephE.Stiglitz,The Stiglitz Report: Reforming the International Monetary and Financial Systems in the Wake of the Global Crisis(2010)
16. JosephE.Stiglitz,et al, Mismeasuring Our Lives: Why GDP Doesn’t Add Up (2010)
17. JosephStiglitz,Freefall: Free Markets and the Sinking of the Global Economy(2010)
18. GillianTett,Fool’s Gold: How Unrestrained Greed Corrupted a Dream, Shattered Global Markets and Unleashed a Catastrophe(2009)

strategy insights | issue six 13
“ [M]ost economic theories have little practical use in the real world. Concepts such as free trade being a boon to the world’s economy, a weak currency helping turn a nation’s trade deficit, or personal income including what the average homeowner would receive from himself in rental income if he charged himself to live in his own house, fall in to the “not in the real world” category”.
John Williams2
2 John Williams, Gross Domestic Product, briefing paper, Shadowstats.com

end-game | the denouement of exponentials
strategy insights | issue six14
“What we are describing is an economy that is essentially “running on empty” – moving
money around, borrowing, expanding the money supply, incurring huge debt
obligations and mortgaging the future in an ever more frenetic attempt to maintain at
least the illusion of the status quo in the face of underlying economic deterioration”.

15strategy insights | issue six
Haveinvestorsbecomeschizophrenic,oraretheyjustintwomindsaboutit?Ifasingletermcandescribethetenorofinvestmentmarketinrecentmonths,‘uncertain’issurelythatword.Thisuncertaintyinturnreflectssomeremarkabledivergenceswithintheavailableinformation,combinedwithsomeseriousdisconnectsbetweenstatisticaldataontheonehandandlogicalperceptionsontheother.
Onthefaceofit,thereseemtobesubstantialreasonsforoptimism.LookingattheUS–which,despiteglobalisationandpartialdecoupling,remainsthecentreofgravityoftheworldeconomy–thegoodnews
outweighsthebad,doesn’tit?Tobesure,growthisweakening,andadouble-diprecessioncannotberuledout.But,giventhescaleofthe2008-09bankingcrisisandthesubsequenteconomicdown-turn,Americanoutputhasheldupprettywell.Accordingbothtoofficialdataandtoconsensusassessments,realGDP(grossdomesticproduct)mighthavefallenbyabout6%frompeaktotrough,butthispalesintoinsignificanceincomparisonwiththeone-thirdfallinoutputexperiencedduringtheGreatDepression.
Likewise,USunemployment,at9.7%,isfarbelowthescary25%recordedin1933.Inflationislow,andexpectations
seemwellanchored–indeed,deflationremainsapossibility.Globally,interestratesareultra-lowand,withtheobviousexceptionsofcertainfiscalmiscreants,governmentbondmarketsarerobust.Corporateearningstrendsseemgenerallypositive.Ahandfulofmaverickcommentatorsaside,no-oneseemstoexpecteitherinflationorinterestratestotakeoffanytimesoon.Aboveall,theglobalfinancialsystemseemstohaveescapedfromthemelt-downwhichappearedaveryrealpossibilityinSeptemberandOctober2008.
part one:overview – a system in crisis
Fig. 4: Out of whack – US debt and GDP*
US total debt and GDP, 1947-2010 (trillions of 2010 dollars)
$60
$50
$40
$20
$30
$10
$0
Credit market debtGDP
1947
1949
1951
1953
1955
1957
1959
1961
1963
1965
1967
1969
1971
1973
1975
1977
1979
1981
1983
1985
1987
1989
1991
1993
1995
1997
1999
2001
2003
2005
2007
2009
Debt take-off beganin the early 1980s
*Sources:USBureauofEconomicAnalysis,USFederalReserve,andTullettPreboncalculations

strategy insights | issue six16
end-game | the denouement of exponentials
Andyet,andyet.Forastart,someoftheharddatamustgiveinvestorsnaggingdoubts.Taketotal(public,corporateandprivate)debtintheUnitedStates,forinstance(seefig.1).Sincetheearly1980s,aggregateAmericanindebtednesshasincreasedbyroughly4.7x,inrealterms,whichcompareswithadrasticallysmaller(2.25x)reportedexpansioninrealGDPoverthesameperiod.At350%,thedebt-to-GDPratiohasreachedlevelsforwhichthereisnoprecedent,eveninthecrisis-hit1930s(about290%).
Federaldebt,measuredasapercentageofGDP,maynotbeallthatlarge,butdeficitsarehuge,andno-oneexpectsthemtodeclineanytimesoon.TheBankforInternationalSettlements(BIS)haswarnedthatpublicdebtinmostOECDeconomiesthreatenstotakeoffexponentially3.
Moresubjectively–thoughsurelyjustasimportantly–does published data agree with logical perceptions, with intuitive assessments, or with investors’ everyday experience?Ifwestandbackandconsiderthepromptingsofwhatmightbecalledcommonsense,certainthingsbegintojar.
Startingwithdebt,investorsandpolicymakersmustbeuncomfortablyawarethatbothgovernmentandthebroadereconomyarepilingcolossalobligationsontofuturegenerations
(aprocessthatwehavedescribedas“generationaltheft”4).Deficitsseemintractable,andmaywellgetworseasdemographicchanges–suchasbaby-boomerretirement,andtheageingofthepopulation–kickin.Iftheneedtofinancedeficitsremainsatanywherenearcurrentlevels,caninterestratesreallyremainatrock-bottomlevels?Intheprivatesector,propertypricescontinuetolookveryexposedintermsofhistoricearningsmultiples.Evenmodestfurtherfallsinhousepricescouldputmillionsofborrowersunderwater5.Whatwillhappentohomeownerbudgetsifinterestratesrisewhich,givenpersistenthighstructuraldeficits,theyverywellmight?
Andwhataboutgovernments’informalliabilities?Wehavebeenwarningforalongtimeaboutcertaincountries’off-balance-sheetobligations,whichincludefuturecommitmentssuchaspublicsectorpensionsandaccumulatedwelfareentitlements.
Thenlet’sconsiderinflation,bothhistoricallyandinthefuture.Accordingtoofficialdata,theaverageAmericanconsumer’scostoflivinghasincreasedby29%–anannualaverageof2.6%–overthepastdecade6,butmostpeoplesurelyfeelthatinflation,asitappliestothemselves,hasbeenfar,farhigherthanthis.
Lookingahead,isthestill-vauntedfearofdeflationremotelyrealisticwhengovernmentscanprintmoney?Tobesure,theUSsufferedcripplingdeflationinthe1930s,butthecrucialdifferencewasthatthedollarwasstillgold-linkedatthattime.Now,governmentcansimplycreatemoney(and,indeed,alreadyhas,onahugescale).Iftheworstcomestotheworst,Washingtoncanmailchequestoindividuals,orsimplyaskthechairmanoftheFedtodropmoneyfromhishelicopter.Doesn’ttherecenthugescaleofquantitativeeasing(QE)–today’seuphemistictermfortheprintingofmoney–suggestthatthosepeskyCassandrasmighthaveapointwhentheywarnaboutfutureinflationarysurges?
Andthenthere’sthebankingsystem.Despiteallofthepoliticalposturing,andtheBaselrecommendationsnotwithstanding,notmuchhasreallychangedontheregulatoryfront.ArestorationofGlass-Steagallseparationseemsasfarawayasever,andthespiritofinternationalco-operationforgedintheheatofthebankingcrisishasmeltedaway.Asaresult,thebankingsystemisstillatlibertytoinflatemoreoftheworryinglysequential bubbleswhichhaveplaguedtheglobaleconomyoverthelastdecadeorso7.
3 See The Bank for International Settlements, The future of public debt: prospects and implications, BIS Working Papers No. 300, March 2010, and Tullett Prebon Strategy Notes, issue six, Out of Control, May 2010
4 See Tullett Prebon Strategy Notes, issue one, The Dick Turpin Generation, March 20105 In UK terms, ‘in negative equity’
6 CPI-U, 2009 compared with 1999

strategy insights | issue six 17
a fundamental change?
Someofthismayseemprettysubjective,butthere’ssolid,tangiblelogichere,too.Inahighlyperceptiverecentarticle,The Economistwarnedthata“monetaryratchet”hasnowreached“itslogicalconclusion”8.Thisprocessisprettysimple,atleastintheory.Regulatorypolicyisrelaxed,ratesarelow,borrowingexpands,andanassetbubbleispumpedup.Afteritbursts,fearsofeconomicslowdownprompttheauthoritiestocutrates,creditbecomescheapandplentiful,anotherbubbleemerges,thenbursts…andsoitgoeson.Now,though,weseemtobereachingtheendofthis
spiral.Ratesareaboutaslowastheycanget,whichessentiallyneutralisesrate-settingasapolicytool.Instead,governmentsareprintingmoney,whichsurelyrepresentsthe pre-inflationary end-game of the “monetary ratchet”.
Tous,andtothosewhoshareourcorephilosophy,there’sanotherissuetobeconsideredhere,whichistheprocessof‘dangerousexponentials’.“Thefartherbackwelook”,asWinstonChurchillsaid,“thefartherforwardwecansee”.Ourresearchphilosophyisthat,tounderstandreallyimportantdynamictrends,investorsneedto
escapefromthestraitjacketofshort-termanalysisandlookinsteadatultra-long-termeconomicevolution.
Seenfromthisperspective,itbecomesapparentthattheeconomyisdominatedbyaseriesofexponentialprogressionswhichconcernbothfinancialindicators(suchasinflationanddebt)andastringofcriticalnon-financials(includingpopulationgrowth,energyconsumptionandresourcedepletion).Theexponentialnatureofjustfourofthesedataseriesisveryevidentinfig.5.
7 We addressed the issue of sequential bubbles in Tullett Prebon Strategy Insights, issue three, Forever Blowing Bubbles, February 2010
8 The Economist www.economist.com/blogs/buttonwood/2010/06/economic_growth_money_supply_and_energy
Fig.5: Ever upwards? – ‘dangerous exponentials’*
Examples of exponentials, 1750-2010
12000
14000
10000
8000
4000
6000
2000
0
Population (world, millions)Fossil fuels (world, mmtoe/y)US Federal debt ($bn)US inflation (1666=100)
1750
1760
1770
1780
1790
1800
1810
1820
1830
1840
1850
1860
1870
1880
1890
1900
1910
1920
1930
1940
1950
1960
1970
1980
1990
2000
*Source:TullettPreboncalculationsfromvarioussources

strategy insights | issue six18
end-game | the denouement of exponentials
Our‘dangerousexponentials’thesisidentifiestwocriticalmacroeconomicissues,bothofwhichappeartobehiddenfrominvestorsandpolicymakersbytheirownshort-termtimereferencing.First,thefinancialsystemseemstobefirmlyinthegripofaseriesofexponentialprocesseswhicharesurelyreachingtheirlimits(aninterpretationwhichexactlydovetailswiththe“monetaryratchet…logicalconclusion”pointmadebyThe Economist).
Second, the economy is essentially an energy construct,withaccesstoexogenousenergycreatingtheeconomicsurplus(asurplus,thatis,overandabovetherequirementforbaresurvival)whichiswhatthemodern,specialisedeconomyisreallyallabout.Whilstwedonotbelieveina‘PeakOil’doomthesis,wedobelievethatthecriticalequation,whichisthe relationship between energy extracted and energy consumed in the extraction process,isdeterioratingmarkedly.
Ifadeteriorationintheenergyreturnsequationisclearlyoneofthetwogreatthreatsfacingtheeconomygoingforward,theotheristheintrinsiccontradictionimplicitinexponentially-growingfinancialaggregateswhich,logically,cannotgoongrowingindefinitely.Aneconomicsystemwhich,byits
nature,mustgrow,seemstobeapproachingacollision,notjustwithsimplemathematics,butalsowithafiniteresourcesetwhichcannotgrow.
This,wemustemphasise,doesnotmakeusinanysenseMalthusians.Farfrombelievingthatsolutionscannotbefound,weareconfidentthattheycanbe.Butwhatwedocontendisthatwe are entering a period of unprecedented change,inwhichallpriorassumptions,allstructuresandallpoliticalandsocialrelationshipswillneedtobereconfigured,rethoughtand,inmanycases,completelyreplaced.
smoke and mirrors
Theexponentialsprocessshouldbeseeninthecontextofapointmadeearlier,whichisthat,evenintheshortterm,thereseemstobeahugedisconnectbetween,ontheonehand,generallypositiveofficialmacroeconomicdata(onoutput,growth,inflationandunemployment)and,ontheother,botheverydayexperienceandeconomiclogic.Howcanwereconcilethisapparentmismatch,whatconclusionscanwearriveat,andhowmightthisrelatetoapossible‘denouementofexponentials’?
AsSherlockHolmesfamouslysaid,“whenyouhaveeliminatedtheimpossible,whateverremains,
however improbable,mustbethetruth”9.Theseeminglyimprobabletruthintheconundrumidentifiedhereisthatofficial data is by no means as reliable as investors generally assume.Indeed,thewidespreadassumptionthat‘thisinformationmustbeaccurate,becauseitcomesfromthegovernment’showsanalmostchildlikefaith(indeed,surelyanaiveté)thatisalientoinvestorsineveryotherfacetoftheiractivities.
YetadetailedperusaloftheevolutionofUSofficialdata,summarisedinpartthreeofthisreport,showsthatthisdataisnotremotelyasreliableasseemstobealmostuniversallyassumed.Throughanaccretionofincrementaldistortions,governmentstatisticsverymateriallyflattertheunderlyingreality.Innovationssuchashedonics,substitutionandgeometricweighting–eachofwhichisexplainedlater–havedistortedreportedinflationsuchthatpublishednumbersunderstatetherealpositionbyatleastsixpercentagepoints(soyes,wecanindeeddismissanynotionofdeflation).
Ifinflationdataisthisheavilydistorted,calculationsofrealGDPgrowthwouldbewayoffbeameveniftheGDPnumeratoritselfdidnotinclude,asitdoes,itsownheftydistortions.These,collectively,aretermed‘imputations’,andinclude
9 Sir Arthur Conan Doyle, The Sign of Four, 1890

strategy insights | issue six 19
“ownerequivalentrent”.Ifyouownyourpropertyoutright,andhencemakenomortgageorrentpayments,youmightassumethatnothingrelatingtoyourpropertyappearsinGDP.Thisisn’tthecase,becausetheBureauofEconomicAnalysis(BEA)calculatesandincludestherentthatyouwouldhavebeenpaying(presumablytoyourself)ifyoudidn’towntheproperty.(Smallwonderthatthetaxbase,asrecordedbytheIRS10,bearseverlessresemblancetooutputsupposedlymeasuredbyGDP).
Debtishugelyunderstatedinthatitexcludesenormousoff-balance-sheetobligations,andtherateatwhichtheseobligationsarebeing
accumulateddwarfsthepublishedfiscaldeficit.Unemploymenthasbeenroutinelyunderstatedsincethe1960s,notleastbecause“discouragedworkers”areexcludedfromthetotals.
Strippedofthesevariousdistortions,thepicturewhichemergesisextremelydisconcerting.Indeed,the underlying reality is barely recognisable to anyone who customarily bases his assessment of the American economy on official data.
USunemployment,forexample,thoughreportedat9.7%,actuallyexceeds21%whenweaddbackartificially-excludedcategoriessuchas“discouragedworkers”.Inflation,despitetrendinglower,continuesto
exceed7%,makinganinflationarytake-offlookverylikelyindeed.RealgrowthintheAmericaneconomywasminimalinthe1990s,andhas been negative over the last decade.Accordingtosomeestimates,Federalobligationsexceed$69trillion(5.4xGDP),andarerisingbymorethan$4trillionannually.
Justoneexampleoftheextrememismatchbetweenofficialandunderlyingdataissetoutinfig.6,whichindexesrealGDPfrom1980.Instarkcontrasttopublisheddata,underlyingcalculationssuggestthatAmericaneconomicgrowthwasprettyminimalinthe1990sandhas,sincethen,gone into reverse.
10 US Internal Revenue Service
Fig. 6: Statistical distortion? US real GDP since 1980*
US real GDP, 1980-2010, Indexed: 1980=100
250
200
100
150
50
0
OfficialUnderlying
1980
1981
1982
1983
1984
1985
1986
1987
1988
1989
1990
1991
1992
1993
1994
1995
1996
1997
1998
1999
2000
2001
2002
2003
2004
2005
2006
2007
2008
2009
2010
*Source:TullettPreboncalculationsbasedondatafromShadowstats.com
strategy insights | issue six20
end-game | the denouement of exponentials
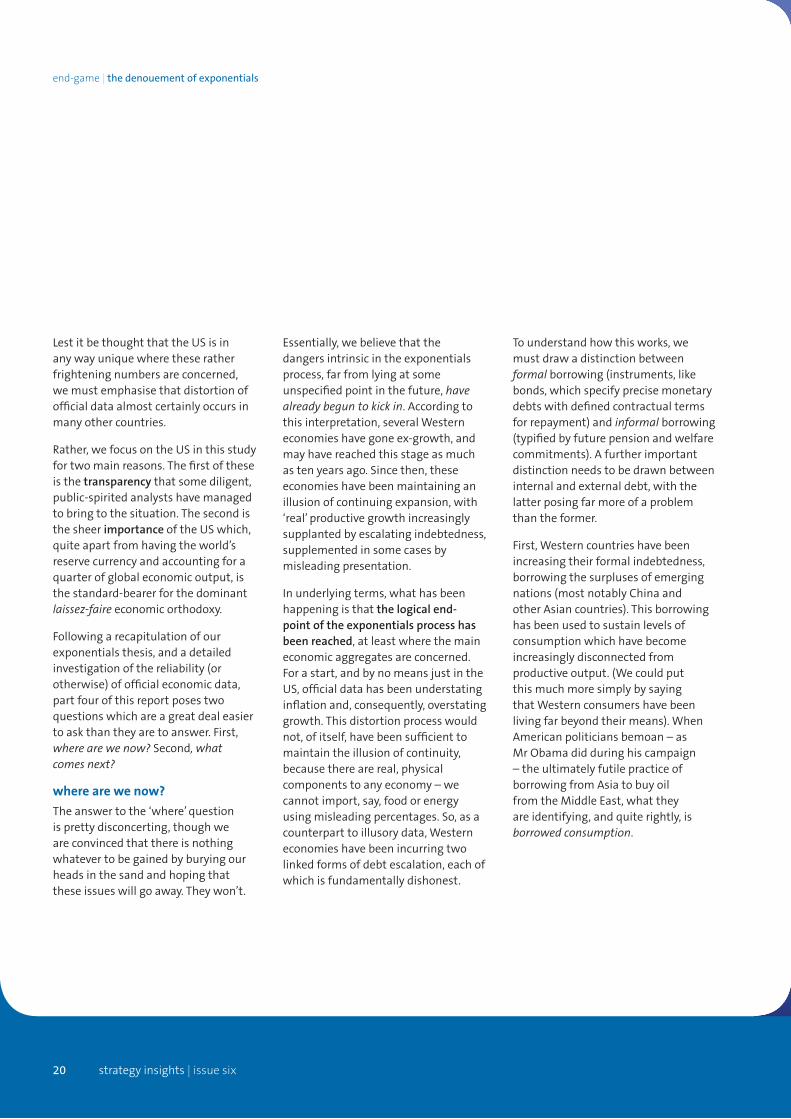
LestitbethoughtthattheUSisinanywayuniquewheretheseratherfrighteningnumbersareconcerned,wemustemphasisethatdistortionofofficialdataalmostcertainlyoccursinmanyothercountries.
Rather,wefocusontheUSinthisstudyfortwomainreasons.Thefirstoftheseisthetransparencythatsomediligent,public-spiritedanalystshavemanagedtobringtothesituation.ThesecondisthesheerimportanceoftheUSwhich,quiteapartfromhavingtheworld’sreservecurrencyandaccountingforaquarterofglobaleconomicoutput,isthestandard-bearerforthedominantlaissez-faireeconomicorthodoxy.
Followingarecapitulationofourexponentialsthesis,andadetailedinvestigationofthereliability(orotherwise)ofofficialeconomicdata,partfourofthisreportposestwoquestionswhichareagreatdealeasiertoaskthantheyaretoanswer.First,where are we now? Second, what comes next?
where are we now?
Theanswertothe‘where’questionisprettydisconcerting,thoughweareconvincedthatthereisnothingwhatevertobegainedbyburyingourheadsinthesandandhopingthattheseissueswillgoaway.Theywon’t.
Essentially,webelievethatthedangersintrinsicintheexponentialsprocess,farfromlyingatsomeunspecifiedpointinthefuture,have already begun to kick in.Accordingtothisinterpretation,severalWesterneconomieshavegoneex-growth,andmayhavereachedthisstageasmuchastenyearsago.Sincethen,theseeconomieshavebeenmaintaininganillusionofcontinuingexpansion,with‘real’productivegrowthincreasinglysupplantedbyescalatingindebtedness,supplementedinsomecasesbymisleadingpresentation.
Inunderlyingterms,whathasbeenhappeningisthatthe logical end-point of the exponentials process has been reached,atleastwherethemaineconomicaggregatesareconcerned.Forastart,andbynomeansjustintheUS,officialdatahasbeenunderstatinginflationand,consequently,overstatinggrowth.Thisdistortionprocesswouldnot,ofitself,havebeensufficienttomaintaintheillusionofcontinuity,becausetherearereal,physicalcomponentstoanyeconomy–wecannotimport,say,foodorenergyusingmisleadingpercentages.So,asacounterparttoillusorydata,Westerneconomieshavebeenincurringtwolinkedformsofdebtescalation,eachofwhichisfundamentallydishonest.
Tounderstandhowthisworks,wemustdrawadistinctionbetweenformalborrowing(instruments,likebonds,whichspecifyprecisemonetarydebtswithdefinedcontractualtermsforrepayment)andinformalborrowing(typifiedbyfuturepensionandwelfarecommitments).Afurtherimportantdistinctionneedstobedrawnbetweeninternalandexternaldebt,withthelatterposingfarmoreofaproblemthantheformer.
First,Westerncountrieshavebeenincreasingtheirformalindebtedness,borrowingthesurplusesofemergingnations(mostnotablyChinaandotherAsiancountries).Thisborrowinghasbeenusedtosustainlevelsofconsumptionwhichhavebecomeincreasinglydisconnectedfromproductiveoutput.(WecouldputthismuchmoresimplybysayingthatWesternconsumershavebeenlivingfarbeyondtheirmeans).WhenAmericanpoliticiansbemoan–asMrObamadidduringhiscampaign–theultimatelyfutilepracticeofborrowingfromAsiatobuyoilfromtheMiddleEast,whattheyareidentifying,andquiterightly,isborrowed consumption.

strategy insights | issue six 21

strategy insights | issue six22
end-game | the denouement of exponentials
Thisformofborrowingispalpablydishonest,becauseitisbasedonanimpliedwillingnessandabilitytorepaythesedebtsatsomefuturestage,eventhoughitissurelyprettyobviousthatfullrepaymentisalmostcertainlyimpossible,meaningthatsoft default (throughinflation) is the overwhelmingly likely outcome.
Second,andjustasinsidiously,Westerneconomiesarepilinginformalborrowingsontofuturegenerations,promisingfuturewelfareandpensionbenefitsthatcannotconceivablybedeliveredwithoutmassivetax
increases.Thisisadouble-con of future generations,whowillbeexpectedtoshouldertheirpredecessors’debtburdenswhilstatthesametimediscoveringthattheycannotconceivablyexpectthesamestandardsoflivingthatthosepredecessorsenjoyed.
Accordingtoeconomicsconventions,grossdomesticproductconsistsofthesumofprivateconsumption,governmentconsumption,investmentandnetexports(GDP=C+G+I+E),butthisequationleavesoutborrowings,whichhavemassively
supplementedconsumptionoverthelastdecade.Evenifallotherthingsweretoremainequal–which,ofcourse,theyhavenot–thenasimplereductionintherateatwhichdebtsarebeingaccumulatedwillreduceconsumptionandhenceeconomicoutput,withanymovementtowardsnetdebtreductionobviouslyhavinganevenmoremarkedimpact.A fundamental difference between the latest recession and all of its post-War predecessors is the deleveraging nature of the most recent downturn.
Fig. 7: Borrowed growth – British GDP and external debt, 1997-2009*
UK GDP and external debt, 1997-2009
£3,000 500%
441%
400%
300%
200%
100%
0
£2,500
£2,000
£1,000
£1,500
£500
0
-£500
-£1,000
Change in external debt (£bn)GDP (£bn)External debt as % GDP (RH scale)
1997
1998
1999
2000
2001
2002
2003
2004
2005
2006
2007
2008
2009
*Sources:OfficeforNationalStatisticsandHMTreasury

strategy insights | issue six 23
Allpreviousrecessionssince1945havebeende-stockingevents,inwhichbusinessescutbacktheirinventoriesandtheircapacityinresponseto(orinanticipationof)lowerdemand.Inthissituation,Keynesiandemandstimuluscanindeedsmooththeperformanceoftheeconomy.Butwhentheissueisdeleveraging–consumptionweakeningasindividualsandbusinessesretreatfromover-borrowedpositions–thetraditionalKeynesianstimulusapproachwillnotwork,andcouldexacerbatethesituation,sinceoneobviouslycannotborrowone’swayoutofexcessivedebt.
ThoughthisreportlooksmostcloselyattheUS,theBritishexperiencehasbeenastrikingexampleofthe‘borrowedgrowth’process(seefig.7).Between1997and2008,theUKborrowedalmost£4trillionfromoverseas,equivalentto29%ofnominalGDPoverthesameperiod.Atitspeakin2007,theincreaseinexternalborrowingsequatedto70%ofGDPduringthesameyear.Reflectingthisprocess,grossexternaldebtincreasedfrom181%ofGDPto441%inthespaceoftenyears.
Whatwashappeningherewasthat,fromtheturnofthecentury,theUKoperatedanexcessivelyrelaxedfinancialregulatoryregimewhilstatthesametimemaintainingirresponsiblylowinterestrates.
Givenminimalincentivestosave–notjustbecauseoflowrates,butalsobecauseofpunitiveimbecilitiesinthefiscalregime11–Britainnaturallysuckedinhugequantitiesofoverseasborrowings.
Muchofthiswasinturnchannelledintoirresponsiblemortgagelending,whichfedthroughintoapparentGDPintwomainways.First,itgaveahuge(though,ofcourse,anunsustainable)boosttoagamutofproperty-relatedtrades,includingbuilding,furnishing,realestateagencyandlegalservices.Second,itfedthroughintoconsumptionviaequityrelease,withhomeownersincreasinglyusingtheirpropertiesascash-cardmachines(ATMs).In2007,forinstance,only35%ofnewmortgageissuancewasactuallybeingusedforthepurchaseofhomes12.
Forthosepreparedtolookattheappropriatedata,allofthiswasclearenoughallalong,becauseeach year’s nominal increase in sterling GDP was exceeded by the same year’s increase in overseas indebtedness.Atthesametime,thethengovernmentseemstohavebelievedthatthisborrowedgrowthwasgenuineandsustainable–that“boomandbust”hadbeenabolished–sincethisrationaleseemstohaveunderpinnedtherecklessincreaseinpublicexpenditureoverthesameperiod.
Whenthisunsustainableprocessunravelled–whichitwouldinduecoursehavedone,bytheway,evenwithoutthecatalystoftheglobalbankingcrisis–theBritishgovernmentfounditselfinacleftstick.Reductionsinratesseemedimperative,inordertotrytokeepacredit-and-consumptioneconomygoing.Publicspending,meanwhile,couldnotbecut,becausetheautomaticstabiliserswouldhavedrivenitupwardsevenifKeynesiancalculationhadnot.
Thisprocesshasnecessarilyreacheditsdenouement,withthenewcoalitiongovernmentconfrontinganunsustainabledeficitviaspendingcutsintheknowledgethatthealternativeswouldundoubtedlybeevenworse.Therehavebeenvictimsallalong,ofcourse,includingsavers,butthe main effect has been to burden future generations with huge levels of formal and informal debt.Theultra-short-term,ideologicalandincompetentmanagementoftheBritisheconomybetween2000and2008wasadeeplyunedifyingspectacle,butoneforwhichconsumerswerenearlyasmuchtoblameasthethengovernment.
11 Such as the long-established practice of taxing interest as “income”, exacerbated by the notorious 1997 tax “raid” on pension funds
12 Of the remainder, 39% went into equity release and 26% was invested in buy-to-let. Source: Financial Services Authority (FSA), Address by Adair Turner – The Mortgage Market: Issues for Debate, 12th May 2009

strategy insights | issue six24
end-game | the denouement of exponentials
Ofcourse,theUKwasbynomeansaloneinthisprocess,andthequantitativelylargestfoul-upshavebeenmadeintheUS.LikeLondon,Washingtonseemstohaveexhibitedtotaleconomicmyopiainthe2000-08period,believing,againonthebasisofillusoryeconomicstrength,thatitcouldcombinetaxcuttingwiththehugelyexpensiveconductoftwoessentiallyunwinnablewars.MistakesofthemagnitudeofthosewhichhaveoccurredintheUS,theUK,Ireland,Icelandandelsewheredon’t‘justhappen’,bytheway–bringingthissortofsituationintobeingrequiresalmostsurreallevelsofincompetenceandmyopia.
AnotherprocesshasbeendisturbinglyevidentintheUS,theUKandseveralotherWesterneconomies,aprocesswhichhasbeentermed“financialization”.Lookingbackatpast‘end-of-Empire’examples–suchasSpaininthesixteenthcentury,HollandinthelateseventeenthandBritainintheearlytwentieth–highlyregardedpoliticalanalystKevinPhillipshasidentified,ineachinstance,aconsistentpatterninwhichproductiveactivitiesaredisplaced,withintheeconomicmix,byvariousformsofmovingmoneyaround.InthecaseofSpain,thevastinfluxofbullionfrom
theNewWorldwaslargelyresponsible,butmuchthesamethinghappenedbothintheNetherlandsandinBritainatsimilardevelopmentalstages.
Asimilarprocess,MrPhillipsexplains,hasnowhappenedintheUS,wheretheproportionateimportanceofindustryhasdeclinedjustastheroleoffinancehasexpanded.In1950,manufacturingaccountedforalmost30%ofAmericanGDP,andfinanceforlessthan11%.Thishascompletelyreversed,suchthatfinancenowprovidesafifth,andmanufacturinglessthan12%,ofUSeconomicoutput13.
ThistrendpresentsanotherdimensionoftheuneasyrelationshipbetweenWallStreetandMainStreet.Moreimportantly,ittellsusagreatdealaboutthenatureoftheAmericaneconomyjustastheexponentialsprocessstartstounwind.
what happens next?
Thisreportsetsoutthefindingsofwhathasbeen,byaverywidemargin,themostchallengingstrategyresearchprojectthatwehavethusfarundertaken.InDangerous Exponentials,wesetouttoexplorethecoredynamicsdrivingtheglobaleconomy,explainingthatthe economy comprises an exponential progression founded upon what is essentially an energy
dynamic.Inthatreport,weconcludedthattheseexponentialswereindeeddangerous,firstbecausethe energy foundation is weakening(asenergyreturnsdeteriorate),and,second,becauseofthe intrinsic mathematical impossibilityofextendingfinancialexponentialsindefinitely.Weconcluded,somewhattentatively,that,atsomeindeterminatepointinthenot-too-distantfuture,theexponentialsprocesscouldgointoreverse,fracturingthefragileeconomicandsocialconstruct.
Here,wegoagreatdealfurther,explainingourbeliefthatthedenouement of exponentials has already begun,atleastinmanyleadingWesterneconomies.Thefactthatmostinvestorsandpolicymakersareblissfullyunawareofthissituationcanbeexplainedintermsoftheultra-short-termbasisonwhichtheyassesssituationsandplanfuturestrategies,combinedwiththeweaknessesofthedatauponwhichtheirassessmentsarefounded.Providedonlythatthemuch-vauntedspectreof‘PeakOil’isn’tanimminentthreat–which,expressed simply as a reserves equation,itisn’t–thenpolicymakerslooknofurtherwherefundamentaldynamicsareconcerned.Tobesure,theyareawareofescalatingdebt,butbelievethatthis
13 Financialization’ – percentage contributions to US GDP, 1950-2008*
1950 1960 1970 1980 1990 2000 2005 2008
Manufacturing 29.3% 26.9% 23.8% 20.0% 16.3% 14.5% 11.9% 11.5%
Finance 10.9% 13.6% 14.0% 15.9% 18.0% 19.7% 20.4% 20.0%
*Sources: Economic Report of the President, 2010, table B-12, and Kevin Phillips, Bad Money, 2009 edition, page 31

strategy insights | issue six 25
canbemanagedor,attheveryleast,canbeputontheback-burnerwhilsttherearemoreimmediately-pressingissuestobetackled.
Asaresult,stop-gapexpedients–suchasunsustainable(andfundamentallydishonest)borrowingbothfromforeignersandfromposterity,haveenabledtheillusionofnormalitytobesustainedeventhoughthe exponentials process has already begun toppling over.Strippedbothofdistortionandofborrowing,realeconomicoutputinmanyWesterneconomieshasbeeneitherflatorindeclineforatleastadecade.Continuingincreasesinconsumptionhavebeensimplythe greatest-ever example of entire societies living beyond their means.
The‘normalitydelusion’doesnotpreventsome,atleast,oftheunpleasantrealitiesfilteringthroughintotheWesternconsciousness.Mostofusareuneasilyawareofseveralsirenfactors.OneoftheseisthatthereallivingstandardsofthemajorityofWesternconsumersaredeclining,whateverthepublishedstatisticsmaysay.
AnotheristhatWesterneconomicinfluenceisinsteepdecline,somethingwhichitisalltooeasytoattribute
simplytogrowthinemergingcountries.The West’s commercial, political and even militarily superiority seems to be ebbing away.WhenBarackObamanotestheabsurdityoftheUSborrowingfromChinatobuyMiddleEasternoil,orwhenDavidCamerongoestoIndiaasasupplicantfora‘specialrelationship’,weareseeingevidencenotjustofunder-performancebutofabsolutedecline.
Yetdelusionsstillabound.MostWesterncitizens,liketheWhiteQueeninThrough The Looking Glass,continueto“believeinsiximpossiblethingsbeforebreakfast”14.Amongstthese‘believedimpossibilities’arethemistakenbeliefsthat:
1. Western economies are getting richer,wheninrealitytheyarenot.
2. Western welfare systems can continue indefinitely in their present form,whichisnotremotelyfeasible.
3. The escalation of public and private debt can continue indefinitely,whichobviouslyitcannot.
4. Each successive generation will enjoy higher living standardsthantheirforebears,whichhasalreadyceasedtobethecase.
5. Western countries’ elected leaders have a long-term planfoundedonrealisticdataandexpectations,whereaswe see no evidence of any such fundamental preparedness.
6. Technology will ride to the rescue,whichcannothappenwithoutmajorstructuralchange.(Itisevenbelieved,bymany,thattechnologywillsomehowovercomeglobalpressuresonfoodsupplies,onenergyavailabilityandontheenvironment).
Thereisasurfeitofeconomictheoriesandprescriptions,butmostseemtoassumeessentiallystaticfundamentals–inotherwords,thatwhatisrequiredisbettermanagementofthesamestructure,notfundamentalchangestobasicassumptions.
If,aswearguehere,each of the above assumptions is profoundly mistaken,weneedtolooktowardsafutureeconomicstructurewhichisstaticratherthangrowing,whereneitherKeynesiandemandmanagementnor laissez-faireeconomicliberalismworksastheorysaysthatitshould,andwheredeleveraging becomes debt destruction.
14 Lewis Carroll, Through The Looking Glass (1871), chapter five

strategy insights | issue six26
end-game | the denouement of exponentials
“Nos numeros sumus et fruges consumere nati”.(We are just statistics, born to consume resources)
Horace15
15 Epistles, I ii 27

strategy insights | issue six 27
fundamental dynamics – exponential drivers
• Afundamentalassessmentoftheglobaleconomyrevealsthatitisgovernedbytwocategoriesof‘exponentials’–theexponentialexpansionofphysicalmetrics(suchaspopulationandresourceuse),andanexponentialfinancialsystemcharacterisedbyacceleratingexpansionindatasetssuchasdebtandinflation.
• Ultimately,the economy is an energy surplus equation,andsocialsophisticationisaproductofthewayinwhichexogenousenergyhasleveragedhumanefforts.
• Theexponentials-basedeconomicsystemfacestwolinkedthreats.Thefirstoftheseisthepotentialforacollisionbetween,ontheonehand,aneconomicsystemwhichrequiresperpetualgrowthand,ontheother,afiniteresourceset.
• Thesecond(andmoreimminent)threatcomesfromtheinternalmathematicalcontradictionsofasystemwhichisincreasinglyturningtodebttosustainconsumptioninthefaceofstaticrealoutput.
Atitsverysimplest,theexponentialfunctionstatesthatanychartofalinearpercentageprogressioneventuallyturnsintoanexponential,‘hockey-stick’or‘J’curve.
Oneofthebestexamplesofanexponentialprogressionistheglobalpopulation(fig.8).Historiansestimatethattheworldpopulationwasabout170millionin2000BC,andthatthisnumberincreasedonlyverygraduallythereafter,reaching254millionby1000AD.Bythelateeighteenthcentury,theglobalpopulationwasapproaching700million,butdidnotreachthefirstbillionuntilthe1830s16.
part two:
16 Source: US Census Bureau
Fig. 8: Going exponential – world population
Population, 2000 BC to 2050 AD (Millions)
Mill
ion
s
10000
9000
8000
7000
6000
5000
4000
3000
2000
1000
0
2000
BC
1500
BC
1000
BC
500
BC
0
500
1000
1500
2000
2010: 6,853 million
Industrial revolution
Maximum capacity range?
*Sourceofpopulationdata:USCensusBureau

strategy insights | issue six28
end-game | the denouement of exponentials
Thereafter,populationgrowthreallytookoff.Whilstithadtakenthousandsofyearstoreachthefirstbillion,thesecondbillionwasachievedinthe1920s–thatis,addingthesecondbilliontookaboutninetyyears.Thethirdbillionwasaddedinthirtyyears,thefourthinlessthantwentyyears,andsoon.Fromthemid-nineteenthcentury,thepopulationgrowthchartturnsintoacharacteristicexponential‘hockey-stick’shape.Thecurrentpopulationtotalisabout6.85bn,andthisisexpectedtoincreaseto7.6bnby2020,and9.3bnby2050,thelatterrepresentinganincreaseofmorethanonethirdfromacurrentnumberwhichhasitselfdoubledsincethelate1960s.
Sincetheearth’sresources–suchasland,foodproductioncapacity,energyand,perhapsmostimportantofall,freshwater–arenotinfinite,itislogicaltowonderwhetherthepopulationtrajectorymightatsome
pointcollidewithaphysicalconstraint,andsomespecialistsbelievethattheearth’s‘carryingcapacity’maybelimited,withestimatesvaryingbetweenperhaps8.5bnand11bn.Thisrangeissuperimposedonfig.8.
Ofcourse,suchconcernsarebynomeansnew,andexperienceoverthelasttwocenturieshasbeenthatfoodproductioncapacityhasexpandedevenmorerapidlythantheglobalpopulation.Optimistswouldthereforemaintainthattherapidexpansionofthepopulationneednotposeaproblem,eveniftheabsoluterateofgrowth(about70millionannually)seemsdaunting.Moreover,optimistscontend,fertilityratesaredroppingaslivingstandardsandlevelsofeducationimprove,suchthattheglobalpopulationmaytopoutatsomewherebetweennineandtenbillionsomewhereinthemiddleofthiscentury.
exponential energy use, finite resources
Unfortunately,thisinterpretationmaybeatoddswithanother,potentiallyunsustainableexponential,whichistherapidexpansionintheglobalconsumptionoffossilfuels,assummarisedinfig.9.Thoughshownonamuchshortertime-scalethanthechartofpopulation,energy usage nevertheless displays a distinctive ‘J-curve’ exponential trajectory.Fig.10makestherelationshipbetweenthetwocurvesexplicit,showinghowbothglobalpopulationandtheconsumptionoffossilfuelshaverisen,intandemandexponentially.Infact,energyconsumptionhasincreasedmore rapidlythanthepopulation,reflectingarisingenergyintensitywhichparallels–again,quiteun-coincidentally–increasinglivingstandards,albeitveryunevenlydistributed.

strategy insights | issue six 29
Fig. 9: The energy exponential*
Global consumption of fossil fuels
12,000
10,000
8,000
4,000
6,000
2,000
0
millions of tonnes of oil-equivalent per year
1500
1550
1600
1650
1700
1750
1800
1850
1900
1950
2000
*Source:TullettPreboncalculationfromavarietyofsources
Fig. 10: No coincidence – the population and energy exponentials*
Global population and energy consumption
10000
8000
4000
6000
2000
0
Population (millions)Energy (million tonnes of oil-equivalent per year)
0
500
1000
1500
2000
*Sources:Seeprecedingcharts

strategy insights | issue six30
end-game | the denouement of exponentials
Therearetwowhollyvalidexplanations–asimpleone,andamorefundamentalversion–whichexplaintherelationshipbetweenpopulationnumbersandtheconsumptionoffossilfuels.Thesimpleexplanationisthatthe ‘green revolution’–thedramaticexpansioninfoodproductionoverthelasttwocenturies–has been almost wholly energy-driven.Acrossthegamutofitsactivities,modernagricultureismassively(andincreasingly)energy-intensive,relyinghugelyonmechanisedplanting,cultivation,processinganddistribution,andonextraneousinputssuchasfertilisersandpesticides.Alloftheseinputsareenergy-dependent(throughextractionanddelivery)evenwhentheyarenotsourceddirectlyfromhydrocarbons.Theabilityoftheearthtofeed6,900millionpeople,wheretwohundredyearsagoitfedlessthan900million,isadirectfunctionoftheavailabilityofenergy-derivedinputs.
Buttheenergy-populationnexusgoesmuchdeeperthanthesimpleenergydependencyofmodernagriculture.Essentially,the entire economy is an energy equation.
Tounderstandthisconcept,weneedtogobacktothemostprimitiveformofhumanexistence,whichwas
thehunter-gatherersystempriortotheinventionofagriculture.Alloftheenergyderivedfromfoodwasconsumedincatchingandfindingthatfood.Therewasnoenergysurplusatanindividualleveland,sinceeverysingleindividual(orfamilyunit)wasfullyengagedintheobtainingoffood,therewasnospecialisation,andnosociety.
Thedevelopmentofagriculture,whichprobablybeganinthe‘fertilecrescent’inabout9,500BC,wasoneofthetwogreateststepsforwardinhumanexistence.Inadditiontoallowingpopulationdensitiestoincreasefromthemaximumofaboutonepersonperkm²underthehunter-gatherersystem,agricultureliberatedsurplusenergy.Thoughnearlyasenergy-intensiveasthehunter-gathererformofexistence,agriculturedeliveredproportionatelymajorimprovementsinenergyefficiencyby(a)utilisingtheenergyofanimals,and(b)harnessingeconomiesofscale.
Essentially,becausethelabouroffourindividualsorfamiliescouldnowsupportfiveindividualsorfamilies,agriculturecreatedthefirst‘energysurplus’.Thisinturnmadepossiblesomeverymodestformsofspecialisation,whichincludedrudimentarystructuresofgovernment
andlawtogetherwithalimitednumberofspecialisttradessuchasmiller,smithandshoemaker.
Progressoverthesubsequentmillenniawasevolutionaryratherthanrevolutionary,withagradualenhancementofagriculturalefficiencydrivingslowincreasesinsocialspecialisationandcomplexity.Societywasstilloverwhelminglyagrarian,andboastedverylittlespecialisation,inthelateeighteenthcentury,whenthesecondgreatstepforwardoccurred–thediscoveryoftheheatengine,initiallyintheformofsteam-powerderivedfromcoal.Thecrucialpointtonoteabouttheharnessingofcoal–andlatterlyofotherfossilfuelssuchasoilandnaturalgas–wasthatthe energy equation altered drastically from the agricultural model.
Agricultureitselfwasmadevastlymoreefficient,initiallythroughtheuseofmotivepowerandlatterlythroughtheintroductionofhydrocarbon-basedfertilisersandpesticides.Withinahundredyearsofthefirstcommercialuseofsteam-power,theproportionofthepopulationsofmostdevelopedcountriesengagedinfarminghadfallentolessthantenpercent.Specialisationhadarrived,courtesyoftheharnessingoftheenergycontainedinfossilfuels.

strategy insights | issue six 31
Theoverwhelminglyimportantpointtograspfromthislightningtourofsocialandeconomicevolutionisthatthere is an essential connection between all forms of energy,whichincludefoodandhumanlabouraswellasexogenousformsofenergysuchasfossilfuels.Thereis,asweshallsee,afurtherdirectlinkagebetweenenergyandthemonetaryeconomy.Beforethat,however,weneedtolookalittlefurtherintotheenergydynamic,bearinginmindthatsocial specialisation and complexity are direct functions of surplus energy.
Whatwouldhappen,then,iftheexponentialprogressionofenergyconsumptionceasedtofunction?Mightspecialisationandsocialcomplexity–andthereforetheeconomyasawhole–unravelandstartgoingbackwardsiftheexponentialenergyequationweretogointoreverse?Afterall,andasweshallseelater,wehavenowbuiltatoweringfinancialsuperstructureontopofanessentiallyenergy-basedsocialandeconomicdynamic.
Someanalystsbelievethatthisunravellingisexactlywhatisinstorefortheeconomyif–orrather,intheiranalysis,when–wehit‘PeakOil’.Thisconcept,pioneeredbyAmericangeologistM.KingHubbert,contendsthat,atsometimeintherelativelynearfuture,wewillhaveconsumedhalf
ofalloriginally-availablereservesofoil.Atthatpoint,Hubbertiansargue,thesupplyofoilwilldecline,inprettymuchamirror-imageoftheincreaseinconsumptionwhichhastakenplacesincethe1850s.Muchthesame,theyargue,willeventuallyhappentosuppliesofnaturalgasandofcoal,withdepletionoftheseresourcesacceleratingasaresultofsubstitutionfromoil.
AdvocatesofthePeakOilthesisarguethatthereisadirecttime-linkagebetweenratesofdiscoveryandsubsequenttrendsinproduction.Forexample,petroleumdiscoveryratesinAmerica’slowerforty-eightstatespeakedin1930,andpeakproductionoccurredfortyyearslater,in1970,sincewhenoutputhasdeclinedrelentlessly.Sincetheglobalpeakdiscoveryrateoccurredinthemid-1960s,itisargued,asimilartime-lagimpliesthatglobalPeakOilisnowimminent.
WhetherornotoneagreeswiththeHubbertianthesis,weareinnodoubtthatthefutureoutlookforfossilfuelavailabilityiscritical,becausetheeconomyis,ultimately,anenergy-drivenconstruct.Arethe‘Peakniks’righttoarguethatwhen,intheverynearfuture,wereachthepointatwhichhalfofoiloriginally-recoverableoilhasbeenproduced,productionmustgointoinevitabledecline?
Thefirstflawinthe‘half-way’argumentisthatitissimplynottrue.TheapplicationoftheHubbertthesisatthistimeimpliesthattheoriginalreservesbasewasoftheorderof2.2tnbbls(trillionbarrels),whereasampleevidenceexiststosuggestthattheoriginally-recoverablereservesbasewasoftheorderof3.0to3.5tnbbls,andpossiblymuchlarger.WhilsttheHubbertiancasehasmeritifitisappliedtoconventionaloil–light,sweetcrudeswhichcanbeextractedrelativelyeasily–itsadherentstendtooverlooktheseeminglyincontrovertibleevidencethathugequantitiesofunconventionaloilsremaintobeextracted.
TheseincludetarsandsinCanada,whichareestimatedatnotlessthan170bnbbls(billionbarrels),shalesintheUS(perhaps800bnbbls),andperhaps350bnbblsofultra-heavycrudesinVenezuela.Theremayindeedbesignificantoverstatementsofreservesinothercountries(andmostnotablyamongstOPECnations,thelegacyofaperiodinwhichproductionquotaswereallocatedpro-ratatoclaimedreserves),buttheoverallpicture,when non-conventionals are included,isoneofacomparativeabundanceofrecoverablereserves.
strategy insights | issue six32
end-game | the denouement of exponentials
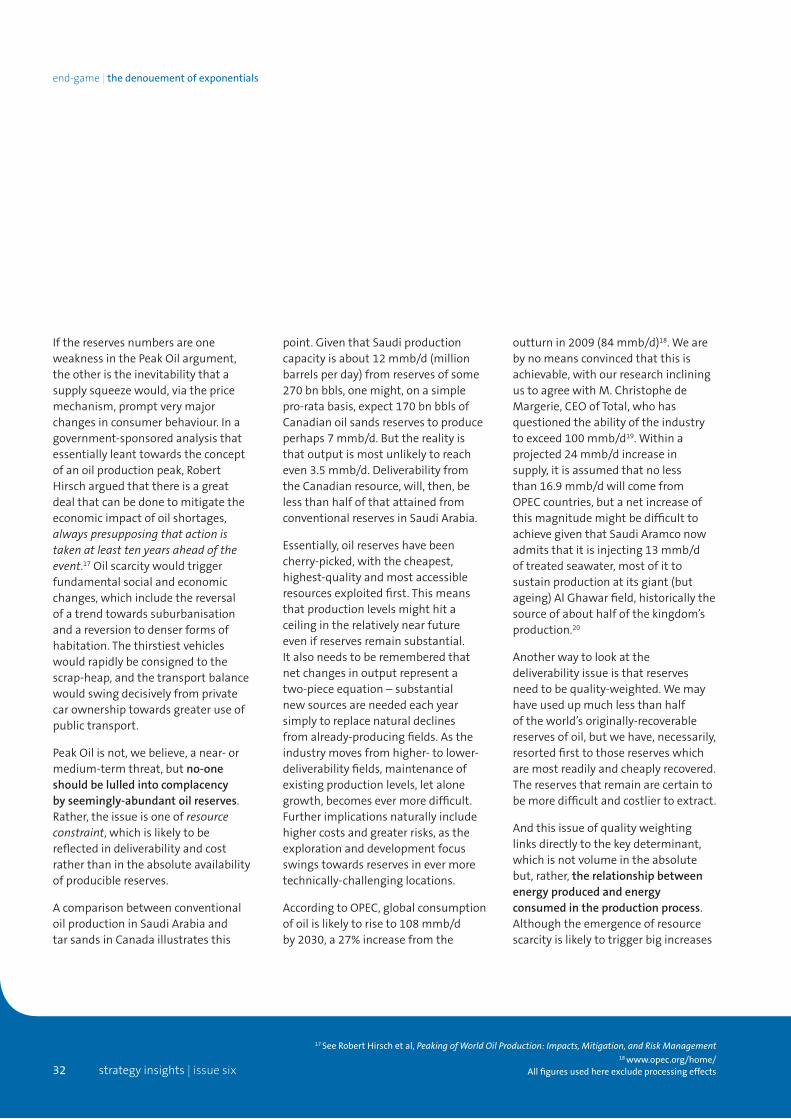
IfthereservesnumbersareoneweaknessinthePeakOilargument,theotheristheinevitabilitythatasupplysqueezewould,viathepricemechanism,promptverymajorchangesinconsumerbehaviour.Inagovernment-sponsoredanalysisthatessentiallyleanttowardstheconceptofanoilproductionpeak,RobertHirscharguedthatthereisagreatdealthatcanbedonetomitigatetheeconomicimpactofoilshortages,always presupposing that action is taken at least ten years ahead of the event.17Oilscarcitywouldtriggerfundamentalsocialandeconomicchanges,whichincludethereversalofatrendtowardssuburbanisationandareversiontodenserformsofhabitation.Thethirstiestvehicleswouldrapidlybeconsignedtothescrap-heap,andthetransportbalancewouldswingdecisivelyfromprivatecarownershiptowardsgreateruseofpublictransport.
PeakOilisnot,webelieve,anear-ormedium-termthreat,butno-one should be lulled into complacency by seemingly-abundant oil reserves.Rather,theissueisoneofresource constraint,whichislikelytobereflectedindeliverabilityandcostratherthanintheabsoluteavailabilityofproduciblereserves.
AcomparisonbetweenconventionaloilproductioninSaudiArabiaandtarsandsinCanadaillustratesthis
point.GiventhatSaudiproductioncapacityisabout12mmb/d(millionbarrelsperday)fromreservesofsome270bnbbls,onemight,onasimplepro-ratabasis,expect170bnbblsofCanadianoilsandsreservestoproduceperhaps7mmb/d.Buttherealityisthatoutputismostunlikelytoreacheven3.5mmb/d.DeliverabilityfromtheCanadianresource,will,then,belessthanhalfofthatattainedfromconventionalreservesinSaudiArabia.
Essentially,oilreserveshavebeencherry-picked,withthecheapest,highest-qualityandmostaccessibleresourcesexploitedfirst.Thismeansthatproductionlevelsmighthitaceilingintherelativelynearfutureevenifreservesremainsubstantial.Italsoneedstoberememberedthatnetchangesinoutputrepresentatwo-pieceequation–substantialnewsourcesareneededeachyearsimplytoreplacenaturaldeclinesfromalready-producingfields.Astheindustrymovesfromhigher-tolower-deliverabilityfields,maintenanceofexistingproductionlevels,letalonegrowth,becomesevermoredifficult.Furtherimplicationsnaturallyincludehighercostsandgreaterrisks,astheexplorationanddevelopmentfocusswingstowardsreservesinevermoretechnically-challenginglocations.
AccordingtoOPEC,globalconsumptionofoilislikelytoriseto108mmb/dby2030,a27%increasefromthe
outturnin2009(84mmb/d)18.Wearebynomeansconvincedthatthisisachievable,withourresearchincliningustoagreewithM.ChristophedeMargerie,CEOofTotal,whohasquestionedtheabilityoftheindustrytoexceed100mmb/d19.Withinaprojected24mmb/dincreaseinsupply,itisassumedthatnolessthan16.9mmb/dwillcomefromOPECcountries,butanetincreaseofthismagnitudemightbedifficulttoachievegiventhatSaudiAramconowadmitsthatitisinjecting13mmb/doftreatedseawater,mostofittosustainproductionatitsgiant(butageing)AlGhawarfield,historicallythesourceofabouthalfofthekingdom’sproduction.20
Anotherwaytolookatthedeliverabilityissueisthatreservesneedtobequality-weighted.Wemayhaveusedupmuchlessthanhalfoftheworld’soriginally-recoverablereservesofoil,butwehave,necessarily,resortedfirsttothosereserveswhicharemostreadilyandcheaplyrecovered.Thereservesthatremainarecertaintobemoredifficultandcostliertoextract.
Andthisissueofqualityweightinglinksdirectlytothekeydeterminant,whichisnotvolumeintheabsolutebut,rather,the relationship between energy produced and energy consumed in the production process.Althoughtheemergenceofresourcescarcityislikelytotriggerbigincreases
17 See Robert Hirsch et al, Peaking of World Oil Production: Impacts, Mitigation, and Risk Management18 www.opec.org/home/
All figures used here exclude processing effects

strategy insights | issue six 33
indollaroilprices,price-basedanalysisisinadequateinthiscontext–wecanalwaysprintdollars,buttherealissuesherearehardphysicalconstraints.Thesameistrueofsupposedsubstitutesforoil,suchasbiofuels.Aneffectiveassessmentofthefutureoutlookforenergyinputsneedstobecalibratedintermsofanenergyratherthanamonetaryequation.
Itisevidentthatweneedanewparadigmifwearetointerpretenergyconstraintinaneconomyofexponentials.Theappropriateenergy-basedequationalreadyexists,andisknownasEROEI(energyreturnonenergyinvested).Thetheoryof
EROEIisextremelysimple,butitsapplicationiscomplicated.Thebasicrequirementisthattheamountofenergyextractedshouldbedividedbytheamountofenergyinvolvedinextractingit.Theproblemhereishowfarthecalculationshouldbecarriedbackupthesupplychain.
Ourbeliefisthatthe lack of a consistent basis of EROEI calculation is a huge flaw in our understanding of economics.Indeed,wethinkthatthelackofadefinitiveandstandardisedEROEImethodologyisthe greatest single shortcominginthewayinwhicheconomictrendsareinterpreted.
Notwithstandingthelackofaccuratecalibration,wecandevelopanapproximationoftheEROEIlandscape,andthiscanbestbedepictedintheformofa‘cliffchart’(fig.11).Thehorizontalandverticalaxesarelinked–thehorizontalaxisiscalibratedtoEROEIasamultiple,whilsttheverticalaxisexpressesthesamecalculationbydividingenergyoutputintopercentagesof‘cost’(energyin)and‘profit’(thesurplusofenergyoutminusenergyin).
19 As reported in the Financial Times, www.ft.com/cms/s/0/1d725e64-c8d2-11de-8f9d-00144feabdc0.html20 See www.saudiaramco.com/irj/portal/anonymous?favlnk=%2FSaudiAramcoPublic%2Fdocs%2FOur+
Business%2FOil+Operations%2FProduction+Facilities%2FWater+Injection&ln=en Until quite recently, the figure cited was only 7 mmb/d
Fig. 11: Going off a cliff? Energy return on energy invested

strategy insights | issue six34
end-game | the denouement of exponentials
Thegeneralpatternwhichemergesfromthisapproachishighlyinstructive.Withintheoilindustryitself,EROEIsaredeterioratingaseasy-accesssourcesdepleteandarereplacedbyevermorechallengingalternatives.Althoughthecliffchartisnottime-linear,thebroaderenergypictureshowssteadymovementfromlefttorightalongtheEROEIcurve,with newer sources of energy delivering ever lower returns.AtEROEIsoflessthanabout15,theenergyreturnsequationdropsoffacliff,andtheoverallaverageisclearlyworseningastraditionalhigh-returnssourcesaredisplacedbyresourceswhichoffersuccessivelylowerEROEIs.Tarsands,oilshalesandbiofuelsareonthelow-returnsendoftheequation.Aneconomycharacterisedbyever-worseningEROEIsiscertaintobeavastlyweakergeneratorofvalue,anditsabilitytosustaincurrentsocialcomplexitywouldbe,atbest,debateable.
SlippagealongtheEROEIcurve–andnotthesimpleissueof‘runningoutofoil’,assomefear–istheclearandpresentthreattoaneconomybasedondangerouslyenergy-dependentexponentials.Tounderstandhowthisprocessmightmanifestitself,weneedtoexaminethesecondcategoryofexponentialprogressions,whichisthetoweringsuperstructureoffinancialsystemswhichhasbeenconstructedontopofanessentiallyenergy-driveneconomicequation.
exponential money, escalating debt
InDangerous Exponentials,weexplainedtheexponentialnatureofthefinancialsysteminconsiderabledepth.Inthecontextofthisreport,therearetwokeypointswhichneedtoappreciated.Thefirstoftheseisthatthefinancialsystemisasuperstructurebuiltuponanenergyequation,andthatthedevelopmentoffinancialexponentialshasdevelopedintandemwithexponentialexploitationofexogenousenergy.Thesecondisthat the financial system itself has developed exponential characteristics which look increasingly unsustainable.
Thehistoryofmoney–asamediumofexchangeandastoreofvalue–beginsmillenniabeforetheIndustrialRevolution,andmoneyinpre-industrialtimeswasinessenceaclaimonhumanlabour.Moneywas,ofcourse,usedinpaymentforwork,andthosethingswhichcouldbepurchasedwithitwerealltheproductsofhumanlaboureitherinthepast,thepresentorthefuture.Thefundamentalnatureofmoneyasaclaimonlabourremainedtrueaftertheharnessingofexogenousenergy,thebigdifferencebeingthatenergy drastically leveraged the quantum of labour.
Toappreciatethispoint,thereaderneedonlyputonegallonoffuelinhisorhercar,driveituntilthefuelrunsout,andthenpaysomeonetopushthecarbacktothestart-point.ChrisMartensonhascalculatedthat,at

strategy insights | issue six 35
thefar-from-generousrateof$15perhour,thiswouldcost$7,50021.Sinceagallonofgasolinecanbepurchasedforabout$3,itisclearthattheabundanceofexogenousenergyhasmassivelyleveragedtheeconomyinrelationtohumanlabour.Asafurtherexample,onecanenvisagetryingtopowerdomesticappliancesusingdynamoslinkedtoexercisebicyclespropelledbyemployees.The energy used in a typical modern home equates to the full-time labour of perhaps a hundred people.Sooureconomicsystemismassivelyleveragedbyexogenousenergy,thekeypartofthewholeequationbeingtherelationshipbetweenenergyextractedandtheenergyconsumedintheextractionprocess.
Inotherwords,the economy is a function of surplus energy, and money is the medium with which this energy surplus is quantified.Fromitsoriginsasaclaimonhumanenergy(intheformoflabour),money has become a claim on energy,past,presentorfuture.Atthesametime,debtisbydefinitiona claim on future money.Sothe ultimate nature of debt is that it is a claim on future energy.Adebt-drivensystemisthusviableif–andonlyif–theenergyofthefutureissufficienttomeettheclaimsthatexistonit.Andthepaymentofinterestinturnrequiresthatthemoney(thatis,theenergy-claim)ofthefuturehastobegreaterthanitistoday.Thebignuancetothisequationisinflation,a
processbywhichtherealvalueofmoney–andhencethevalueofdebtasaclaimonfutureenergy–isdiminished.
Asfig.12shows,inflationhastakenonitsownexponentialtrajectory.ThroughmuchofAmericanhistory,inflationwasminimal,withinflationaryspikes(causedbyconflictssuchastheWarofIndependence,theWarof1812andtheCivilWar)reversedduringyearsofpeace.Inperiodsofwar,thegovernmenttendedtoprintmoneytomeetcostswhichfarexceededavailablebudgets,butthegoldlinkagealwayscausedapost-warreversiontosomethingclosetopre-warvalues.
21 See Chris Martenson, Crash Course
Fig. 12: The destruction of value – the history of US inflation
US RPI index, 1666 = 100
14000
12000
10000
6000
8000
4000
2000
0
1666
1686
1706
1726
1746
1766
1786
1806
1826
1846
1866
1886
1906
1926
1946
1966
1986
2006
Ending of gold link, 1971

strategy insights | issue six36
end-game | the denouement of exponentials
Thefirstbigbreakfromreliablegoldlinkageoccurredin1933,whenPresidentRooseveltconfiscatedallprivately-ownedgoldintheUnitedStates.Americanscouldbuytheirgoldback,butatapriceof$35/oz,significantlyhigherthanthe$21/ozpaidtothemincompensation.Thisamountedtoaone-offinflationaryburstand,althoughitsimmediateinflationaryeffectwascancelledoutbythegeneraldeflationaryconditionsoftheperiod,itisneverthelessa striking example of the use of inflation to devalue outstanding debts.Atthesametime,MrRooseveltalsounilaterallycancelledallgovernment
obligationspayableingold.Thougharguablynecessary,thesemovesshowedapreparednesstoplaceexpediencyfirmlyaheadofprinciple.
Thiswasfollowed,inthepost-waryears,bytheremovalofthegoldstandardbyRichardNixonin1971.Asfig.12shows,thisopenedthefloodgatesforamassivedepreciationinthepurchasingpowerofthedollar,whichhaslostmorethan80%ofitsvalueovertheinterveningfourdecades.Forourpurposes,however,thekeypointtonoteisthatinflation has taken on unmistakeably exponential characteristics.
Inflationisbynomeanstheonlyfinancialexampleofexponentialprogressions.Indeed,theentirefinancialsystemhasexponentialcharacteristics,ascanbeseenfromthechartsofAmericanM3moneysupply(fig.13)andFederaldebt(fig.14).TheauthoritiesceasedpublishingM3datain2006–justwhenitmighthavealertedinvestorstothesheerscaleofthefinancialbubblewhichwasthendeveloping–butJohnWilliamsofShadowstatshascontinuedtocalculateandpublishit.Thoughnowinretreat(becauseAmericaisgrippedbyanessentiallydeleveragingrecession),thechartof
Fig. 13: Exponential money – US M3 since 1959*
16000
14000
12000
10000
8000
6000
4000
2000
0
Jan
59
Jan
61
Jan
63
Jan
65
Jan
67
Jan
69
Jan
71
Jan
75
Jan
73
Jan
77
Jan
79
Jan
81
Jan
83
Jan
85
Jan
87
Jan
89
Jan
91
Jan
93
Jan
95
Jan
97
Jan
99
Jan
01
Jan
03
Jan
05
Jan
07
Jan
09
1971: $733bn
2006: $10,276bn
2009 est: $13,909bn
US M3 money supply
OfficialUnderlying
*Sources:1959-2006–FederalReserveBankofStLouis.Since2006–TullettPrebonestimatesbasedonShadowstats.comdata

strategy insights | issue six 37
M3neverthelessrevealsadistinctivelyexponentialprogression,albeitonethatnowseemstohavehitthebuffers.
Expansionsinthemoneysupplyare,clearly,partoftheexponentialsequation,andmonetaristtheory,aschampionedbyMiltonFriedman,arguesthat,iftherateofexpansioninthemoneysupplybecomesexcessive,theinevitableresultisinflation.Ofthe3,800orsopapercurrencieswhichhavegoneintothedustbinoffinancialhistory,almostallhavebeendestroyedbyhyperinflationwhichwasitselftriggeredbyexcessivegrowthinthesupplyofmoney.
“ The economy is a function of surplus energy, and money is the medium with which this energy surplus is quantified”.

end-game | the denouement of exponentials
strategy insights | issue six38
Fig. 14: Exponential government – US Federal debt since 1791*
Federal debt, 1791-2009 (trillions of dollars)
1798
1806
1814
1822
1830
1838
1846
1854
1862
1870
1878
1886
1894
1902
1910
1918
1926
1934
1942
1950
1958
1966
1974
1982
1990
1998
2006
2009: $11.9 trn$12
$14
$10
$8
$4
$6
$2
$0
-$2
*Sources:www.treasurydirect.gov/govt/reports/pd/histdebt/histdebt.htm
strategy insights | issue six 39
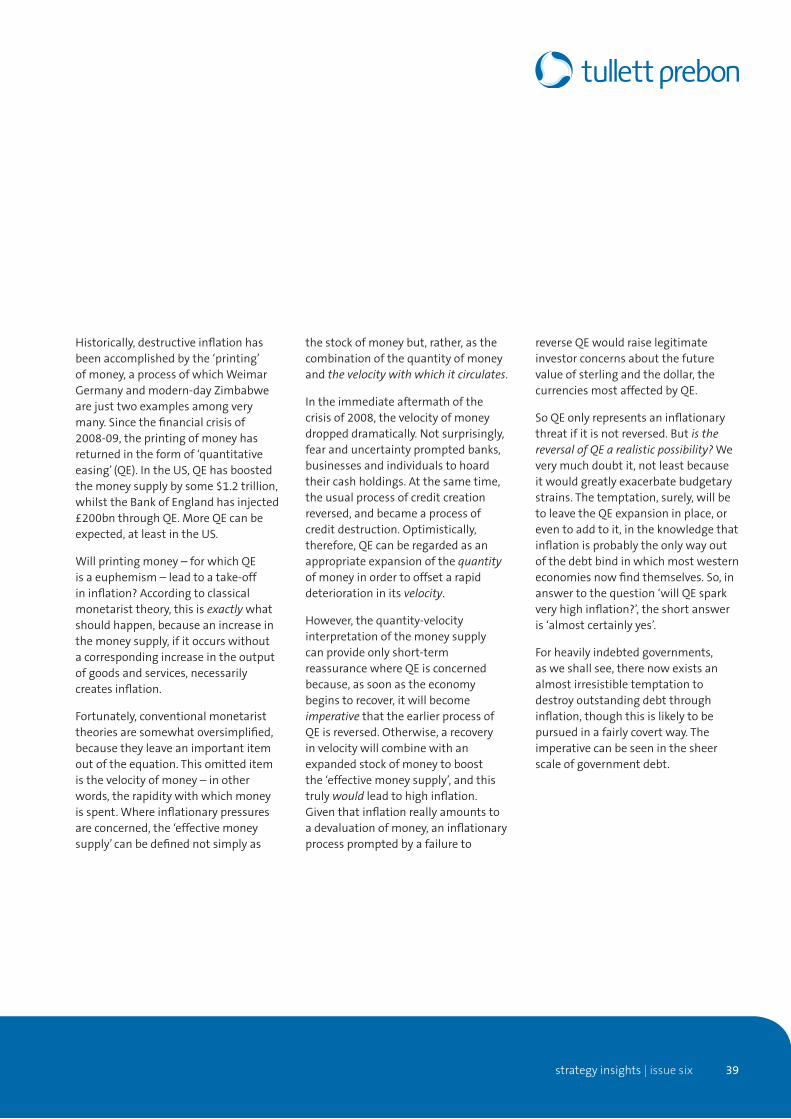
Historically,destructiveinflationhasbeenaccomplishedbythe‘printing’ofmoney,aprocessofwhichWeimarGermanyandmodern-dayZimbabwearejusttwoexamplesamongverymany.Sincethefinancialcrisisof2008-09,theprintingofmoneyhasreturnedintheformof‘quantitativeeasing’(QE).IntheUS,QEhasboostedthemoneysupplybysome$1.2trillion,whilsttheBankofEnglandhasinjected£200bnthroughQE.MoreQEcanbeexpected,atleastintheUS.
Willprintingmoney–forwhichQEisaeuphemism–leadtoatake-offininflation?Accordingtoclassicalmonetaristtheory,thisisexactlywhatshouldhappen,becauseanincreaseinthemoneysupply,ifitoccurswithoutacorrespondingincreaseintheoutputofgoodsandservices,necessarilycreatesinflation.
Fortunately,conventionalmonetaristtheoriesaresomewhatoversimplified,becausetheyleaveanimportantitemoutoftheequation.Thisomitteditemisthevelocityofmoney–inotherwords,therapiditywithwhichmoneyisspent.Whereinflationarypressuresareconcerned,the‘effectivemoneysupply’canbedefinednotsimplyas
thestockofmoneybut,rather,asthecombinationofthequantityofmoneyandthe velocity with which it circulates.
Intheimmediateaftermathofthecrisisof2008,thevelocityofmoneydroppeddramatically.Notsurprisingly,fearanduncertaintypromptedbanks,businessesandindividualstohoardtheircashholdings.Atthesametime,theusualprocessofcreditcreationreversed,andbecameaprocessofcreditdestruction.Optimistically,therefore,QEcanberegardedasanappropriateexpansionofthequantityofmoneyinordertooffsetarapiddeteriorationinitsvelocity.
However,thequantity-velocityinterpretationofthemoneysupplycanprovideonlyshort-termreassurancewhereQEisconcernedbecause,assoonastheeconomybeginstorecover,itwillbecomeimperativethattheearlierprocessofQEisreversed.Otherwise,arecoveryinvelocitywillcombinewithanexpandedstockofmoneytoboostthe‘effectivemoneysupply’,andthistrulywouldleadtohighinflation.Giventhatinflationreallyamountstoadevaluationofmoney,aninflationaryprocesspromptedbyafailureto
reverseQEwouldraiselegitimateinvestorconcernsaboutthefuturevalueofsterlingandthedollar,thecurrenciesmostaffectedbyQE.
SoQEonlyrepresentsaninflationarythreatifitisnotreversed.Butis the reversal of QE a realistic possibility?Weverymuchdoubtit,notleastbecauseitwouldgreatlyexacerbatebudgetarystrains.Thetemptation,surely,willbetoleavetheQEexpansioninplace,oreventoaddtoit,intheknowledgethatinflationisprobablytheonlywayoutofthedebtbindinwhichmostwesterneconomiesnowfindthemselves.So,inanswertothequestion‘willQEsparkveryhighinflation?’,theshortansweris‘almostcertainlyyes’.
Forheavilyindebtedgovernments,asweshallsee,therenowexistsanalmostirresistibletemptationtodestroyoutstandingdebtthroughinflation,thoughthisislikelytobepursuedinafairlycovertway.Theimperativecanbeseeninthesheerscaleofgovernmentdebt.

strategy insights | issue six40
end-game | the denouement of exponentials
Whilsttherehavebeensignificantcontractionsinprivateindebtedness,therehasbeennosimilarreversalsinpublicdebt.Asfig.14shows,USFederaldebtisanotherextremelydistinctiveexponential.Whenconsideringtheexponentialtrajectoriesofinflation,themoneysupplyanddebt,weneedtobearinmindthattheseareallaspectsofasingleexponential,andshowan out-of-control propensity for living on printed money and accumulated debt.
Wheregovernmentindebtednessisconcerned,theUSisbynomeansalone,eitherintheexponentialtrendofborrowingsorintheexistenceofdisguisedaswellasdisclosedindebtedness.AstheBankforInternationalSettlements(BIS)explainedinarecentreport,thesovereigndebtsofmostOECDcountriesareindangerofturningintoexponentialtrajectories,becauseofacombinationofstructuraldeficitsanddemographicchange22.
Wheretheexponentialexpansionofpublicdebtisconcerned,twoprocesseshaveaccelerateddebtaccumulationsince2008.Thefirstoftheseis‘toxicassettransference’,aprocesswherebythestate,inanefforttostaveoffasystemiccollapseofthebanking
system,takesovertheburdenofdebtsirresponsiblycreatedduringthebubble-buildingphase.Thisisbynomeansanewphenomenon–ithappened,forexample,duringtheSavingsandLoan(S&L)crisisofthe1980sand1990s–butthetransferencewhichhasoccurredinrecentyearsdwarfsallprevioussuchepisodes.
Laterinthisreport,weshalllookathowadebt-expanding,sequentialbubbleprocesshascomeintoexistence,howverylittlehasbeendoneaboutit,andhowdiretheconsequencescouldbeifthisstructuralweaknessisnotaddressed.Forourpurposeinthischapter–whichistoreviewtheessentiallyexponentialnatureoftheeconomy–itissufficienttonotethatallformsofdebtareexpandingexponentially.ThisisastrueofaggregateAmericanindebtedness(fig.17)asitisofFederaldebt,withsimilarexponentialphenomenaevidentacrosstheOECDeconomies.
Withtheconceptofexponentialeconomicsnowunderstood,wecanmoveontolookatwhentheunsustainablenatureofthismightimpactthesystem,andhowwemightrecogniseitwhenithappens.
22 See The Bank for International Settlements, The future of public debt: prospects and implications, BIS Working Papers No. 300, March 2010, and Tullett Prebon
Strategy Notes, issue six, Out of Control, May 2010

strategy insights | issue six 41
Fig. 15: Exponential debt risk – the US*
United States
500
400
300
200
100
019801970 1990 2000 2010 2020 2030 2040
Nation
al debt as % of G
DP
Years
Baseline scenarioSmall gradual adjustmentSmall gradual adjustment, withage-related spending held constant
*Sourceforfigs.15and16:The future of public debt: prospects and implications,BISWorkingPapersNo.300,March2010
Fig. 16: Exponential debt risk – the UK*
United Kingdom
600
500
400
300
200
100
0
Baseline scenarioSmall gradual adjustmentSmall gradual adjustment, withage-related spending held constant
19801970 1990 2000 2010 2020 2030 2040
Years
Nation
al debt as % of G
DP
Fig. 17: Deep in the hole – US debt, 1945-2010*
$40
$35
$30
$25
$20
$15
$10
$5
$0
1945
1947
1949
1951
1953
1955
1957
1963
1959
1961
1965
1967
1969
1971
1973
1975
1977
1979
1981
1983
1985
1987
1989
1991
1993
1995
1997
1999
2001
2003
2005
2007
2009
2Q 2010: $37.5 trillion
Total US debt, 1945-2010 (trillions of dollars)
IndividualsFinancialCorporateState & localFederal (owed to the public)
*Source:FederalReserve,www.federalreserve.gov/releases/z1/current/z1.pdf.Latestdata:2Q2010

end-game | the denouement of exponentials
“There are three kinds of lies: lies, damned lies and statistics”.
Benjamin Disraeli
strategy insights | issue six42

strategy insights | issue six 43
smoke and mirrorsa denouement disguised
• Inmostwalksoflife,deferential,unquestioningacceptanceofgovernmentpronouncementsisathingofthepast,andinvestors,inparticular,customarilyexercisehealthyscepticism.Itisstrikinglyanomalous,therefore,thatinvestorstendtoacceptgovernmentmacroeconomicdataatfacevalue.
• Therealityisthatmuchgovernmentdataisextremelyunreliable.Ahistoryofincremental‘adjustment’hasdistortedmanymeasures–suchasunemployment,inflation,growth,deficitsanddebt–tothepointwherethestatisticalpictureisdrasticallydifferentfromtheunderlyingeconomicreality.
• FocusingontheUS,weexplainandstripawaythreedecadesof‘Pollyannacreep’torevealaneconomywhichisverymuchweakerthanisgenerallysupposed.Unemployment,reportedat9.7%,mayactuallyexceed21%.Inflation,saidtobeatnear-zerolevels,isabove7%.Growthoverthelastdecadehasbeennegative.Debtisoutofcontrol.
Asoutlinedearlier,webelievethattheglobaleconomyisfirmlyinthetalonsofanexponentialsprocesswhichwill,induecourse,putthecurrenteconomicsysteminjeopardy.Essentially,exponentials-based
analysisshowsthattheeconomyfacestwodistinctthreats–athreatfrominternalcontradictions(becauseexponentialfinancialprogressionsmaybecomeunsustainable),andathreatfromaworseningintheenergyequation(asaneconomicmodelwhichreliesupongrowthcollideswiththerealitiesofafiniteresourceset).
Aquestionwhichnaturallyarisesatthispointisthis–‘howwillwerecognisethedenouementprocesswhenitbeginstohappen?’Thenaiveanswertothisquestionwouldbethattheunravellingofthesystemwillbecomeapparentinheadlinemacroeconomicnumbers.Butthisanswerwouldbecorrectif–andonlyif–twoessentialpre-conditionsbothapplied.Thefirstofthesevitalpre-conditionsisthatinvestorsarewatchingtherightheadlinenumbers.Thesecond(andevenmoreimperative)pre-conditionisthatthedatathatinvestorsarewatchingisaccurate.
Infact,neither pre-condition applies.Thoughhabituallyscepticalinmostotherareasoftheiractivities,investorsdisplayanalmostchildliketrustandnaivetéwhereofficialdataisconcerned.Theyplaceimplicitfaithinthevalidityofofficialstatistics.Thealmostuniversalassumption–whichisthat‘thesefiguresmustbeaccurate,becausetheycomefrom
thegovernment’–revealsahugelymisplacedfaithinthequalityofofficialdata.
Giventhat–asweshallsee–public faith in the accuracy of official data is very seriously misplaced,twocoursesofactionareessential.First,weshouldlookatthe‘structuralcontext’–ingeneralterms,whatistheeconomicenvironmenttellingus,anddoesitaccordwithofficialdata?Second,andmoreobviously,canweaccessandinterpretamoreaccuratestatisticalpictureofwhatisreallyhappeningtotheeconomy?
The‘structuralcontext’issurelyextremelycautionary.Forastart,themacroenvironmentischaracterisedbyaveryobvious“monetaryratchet”.Asremarkedearlier,thishasbeendescribedbyThe Economistasaprocessinwhich“lowerinterestratesleadstomoredebt,whichleadstoassetbubbles,whichthenpop;whentheypop,authoritiescutratesagainandthewholecyclestartsagain.Thisprocesshasreacheditslogicalconclusionwithratesatzero.TheauthoritieshaverespondedbyresortingtoQE,moneyprinting.Thishasnotresultedinhighinflation(yet)becausethevelocityofmoneyhascollapsed(ifyoulike,themoneyhasbeenhoarded)”23.
part three:
23 ‘Energy In, Energy Out’, The Economist, 9th June 2010 www.economist.com/blogs/buttonwood/2010/06/economic_growth_money_supply_and_energy

strategy insights | issue six44
end-game | the denouement of exponentials
Whenaprocessasfundamentalasa“monetaryratchet”reaches“itslogicalconclusion”,investorsneedtoposetwoquestions–‘why has this happened?’and‘what comes next?’.Ouranswertothe‘why’questionaboutthemonetaryratchetisthatthe‘implicitgrowth’systemhascollidedwithitsintrinsiccontradictions.Asto‘whatcomesnext?’,ourbeliefisthat,atleastwheretheWesterneconomiesareconcerned,an exponentials-based economic system is unravelling.Moreover,webelievethatthesystemhasbeenunravellingforatleastadecade.
misplaced faith
Despitethefinancialcrisisof2008-09,thewidespreadperceptionseemstobeoneof‘businessasusual’–thatcatastrophehaseitherbeenavertedoratleastdelayed,andthattheresilienceofthesystemhasbeenprovenunderextremestress.Thebankingsystemdidnot,afterall,collapseintheautumnof2008.Althougheconomicoutputhasfallen,thedeclinehasbeenbynomeansassevereasitwasduringtheGreatDepression.Neitheremploymentnorlivingstandardshavecrateredastheydidinthe1930s.Whilstmanyinvestorsacceptthepossibilityeitherofa‘double-dip’recessionorofanextendedperiodofflat-lining,theoverwhelmingperceptionisthatthe
fall-outfromthebankingcrisishasbeencomparativelymodest,andthateconomicgrowthhasresumed,albeitatasubduedrate.
Evenbeforewegointothereliability(orotherwise)ofthedatauponwhichsuchcomfortingconclusionsarebased,therearesurelyatleasttwohighlycautionaryindicators.First,debt–bothformalandinformal–hasescalated,andcontinuestodoso,inmannerwhichlooksverylikeavortexprocess,andfromwhichthereisnoobviousexitrouteinsight.Theimplication,therefore,isthattheeconomyisproceedingontheassumptionthatwecancontinuetopileadditionalobligationsontofuturegenerationsad infinitum.Anysuchassumptionisillogical,asalimitmustbereached(indeed,webelievethatithasbeenreachedalready).Second,itissurelyobviousthatcontinuousprogressionissurelyimpossibleifthemonetaryratchethasindeedalreadyreached“itslogicalconclusion”.At that point, something new has to happen.
Theconclusionssuggestedhereareasfollows:
• Ifwelookbehindtheofficialdata,wecanperceiveareality-setwhichaccordsmuchmorecloselywiththesubjectiveindicatorsprovidedbythe
out-of-controlaccumulationofforwardobligationsandbythecompletionofthemonetaryratchetprocess.
• Thoughtheexacttimingoftheprocessisneitherpossiblenoressential,theprobabilityisthattheWesterneconomicsystemcollidedwithitsinternalcontradictionsnolaterthantheendofthe1990s.
• Whathasbeenhappeningsincethenistheincreasinglyunsustainablecontinuationofthesystemthroughintrinsicallytime-limitedexpedients,ofwhichbyfarthemostimportant,unsustainableanddangerousistheaccumulationofevergreaterformalandinformalindebtedness.
official data, underlying reality
Torelatethisinterpretationtoseemingly-comfortingofficialdata,weneedtolookathowreliablethatdatais.Weconcludethat,sincethisdataisnotreliable,anycomfortwhichinvestorsorpolicymakersderivefromitisdangerouslymisplaced.Oncewehaveexposedthestructuralinaccuraciesofofficialmacroeconomicnumbers,wethenneed,asamatterofurgency,toaccessanalternativedatasetwhichshowsusthetruepicture.
24 Total credit market debt25 Kevin Phillips is one of America’s most respected political analysts. As a young strategist working for
Richard Nixon, he published The Emerging Republican Consensus, which correctly predicted the benefits which the party could reap from the swing in America’s centre of economic gravity away from the industrial
north-east towards the “Sun Belt” States of the south and west. Recent seminal works by Mr Phillips include American Theocracy and Bad Money

strategy insights | issue six 45
Thisexercise,summarisedhere,revealssomeextraordinarilystarkandworryingconclusions.Forastart,theUSeconomy,farfromhavinggrownbytwo-thirdsinrealtermssince1990,hasactuallybeenflat,atbest,overthatperiod,withthetrendinrealoutputworseningsince2000(seefig.6inpartoneofthisreport).Second,Americaninflationhas,formorethanadecade,beenunderstatedintheheadlinenumbersbyatleastsixpercentagepoints,whichsupportsourconclusionthat,incontrasttothelargelydelusionalthreatofdeflation,therealforwardriskliesinverymuchhigherinflation.
Third,andinstarkcontrasttotheofficially-reported$7.8trillion,thetruescaleofFederalobligationsstandsataneye-watering$69trillion.Likewise,thefiscaldeficit,at$1,417billion,dramaticallyunderstatestherealrateatwhichformalandinformalobligationsareaccumulating.Fourth,USunemployment,currentlyquotedat9.7%(ontheU-3definition),mayactuallyexceed21%oftheworkforce.
Allofthis,ofcourse,isin additiontoknownaggregateformalAmericanindebtedness24which,at350%ofGDP,iscompletelywithoutprecedent.
Inthissectionofourreport,theemphasisisplacedoverwhelminglyonthestatisticaldistortionofadireeconomicstatusandoutlookintheUnitedStates.Thisbeingthecase,wecannotemphasisetoostronglythattheUSisnottheworst(andismostcertainlynottheonly)exampleofunderlyingweaknessesbeingmaskedbyunreliableofficialdata.
ThefocusisplacedontheUSherefortworeasons.First,AmericanfigurescanbeunmaskedbecauseofthesheerqualityoftheeconomicdebateintheUS,inwhichtheunreliabilityofofficialdatahasbeenunmaskedbytheeffortsofanalystssuchasKevinPhillips25,ChrisMartenson26and,aboveall,JohnWilliams27.
26 Chris Martenson is the author of the eye-opening Crash Course, which was mentioned extensively in Tullett Prebon Strategy Insights, issue five, Dangerous Exponentials, May 2010
27 John Williams’ Shadow Government Statistics (Shadowstats.com) is the source for data which looks beyond the distorted data supplied by American government agencies. We regard Mr Williams’ subscription service as the imperative source for anyone wishing to understand the real state of the American economy

end-game | the denouement of exponentials
strategy insights | issue six46
28 As measured by 2009 GDP. Source: CIA World Factbook29 The term ‘Pollyanna’, meaning resolute optimism in the face of the facts, derives
from Pollyanna: The First Glad Book, by Eleanor H. Porter (1868-1920) 30 Kevin Phillips, Harper’s Magazine, 1st May 2008

strategy insights | issue six 47
Second,andwhilstAmericaisbynomeanstheonlyWesterncountryinwhicha‘denouementcrisis’ismaskedbyunreliabledata,itisbyfarthemostimportant,intermsbothofsheerscale(theUSaccountsfor25%oftheglobaleconomy28)andasthestandard-bearerforthedominant‘Anglo-Americaneconomicmodel’,alaissez-fairesystemwhichisalsoknownas‘TheWashingtonConsensus’.Clearly,any emergence of an ‘exponentials denouement’ in the United States would have hugely far-reaching implications for the global economy.
‘Pollyanna creep’29
Asweexplainhere,theinvestorcannolongerrelyontheaccuracyofabroadswatheofAmericanofficialeconomicdata.Here,weexaminethisprocess,lookinginturnatinflation,growth,grossdomesticproduct(GDP),debtandthedeficit.Butitisimportanttoemphasisefromtheoutsetthattherevelationofthedistortionprocessdoesnotunmaskanykindofgrandconspiracy.Rather,thedistortionofUSofficialdatahasbeenapiecemeal,
incrementalandbipartisanprocess.AsKevinPhillipshasputit,“thedeceptionarosegradually,atnostagestemmingfromanyconcertedorcynicalscheme.Therewasnograndconspiracy,justaccumulatingopportunisms”30.
Thefirstsetoffigurestofallvictimtothedistortionprocesswasunemployment,which,earlyinthepresidencyofJohnF.Kennedy,wasinconvenientlyhigh,andmarredthe“Camelot-on-the-Potomac”31imagethattheKennedyteamwishedtoportray.Henceforward,unemployedAmericanswhohadgivenuplookingforworkwouldbeclassifiedas“discouragedworkers”andexcludedfromtheunemploymentstatistics.Kennedy’ssuccessor,LyndonJohnson,mayhavesupervisedand‘fine-tuned’GNP32numbersbeforetheirpublication,andhecertainlyintroducedthe“unifiedbudget”,whichcombinedSocialSecurity33datawithbroaderFederalnumbers.Thelattermovewassignificant,becausetheinclusionoftheSocialSecuritysurplushas,since1969,improvedtheapparentstandingoftheoverallbudget.
Asmightbeexpected,Richard‘TrickyDickey’Nixonwasnotabovetinkeringwitheconomicdata.Heproposedthatgovernmentshouldchoosebetweenseasonally-adjustedandnon-adjustedunemploymentnumbersonamonth-by-monthbasis,publishingwhicheverhappenedtobetheloweratthetime.Althoughthisblatantpieceoffinaglingwasopposedsuccessfully,MrNixondidsucceedincreatingtheconceptof“coreinflation”,fromwhichthefastest-risingpricecategoriesoftheperiod–energyandfood–wereexcludedtocreateanumberwhichhasbeendescribedas“inflationex-inflation”.Byusingthiscorenumber,governmentshaveatvarioustimesbeenabletoclaimthatinflationislowevenwhenconsumersareexperiencingveryrapidincreasesinthecostofliving.
31 Kevin Phillips, Harper’s Magazine, op cit32 Gross National Product, a measure of output which was used until 1991, when government
opted for the more flattering GDP measure instead33 In the United States, Social Security refers to the Federal Old-Age, Survivors,
and Disability Insurance (OASDI) program

strategy insights | issue six48
end-game | the denouement of exponentials
UnderRonaldReagan,theprocessof“Pollyannacreep”continuedwhenthegovernmentdecidedthat,likeenergyandfood,therisingcostofhousing,too,wasbiasinginflationupwards.Consequently,from1983,“owner-equivalentrent”wasintroducedinsteadoftheactualcostofhousing.Essentially,theBureauofLaborStatistics(BLS)wouldhenceforthcalculate,insteadofactualhousingcosts,therentthatahomeownermightpayifheorsherentedapropertywhichtheyactuallyowned.Asweshallsee,thisdubiousmethodologyisstillusedtoday,andimpactsGDP(asan“imputation”)aswellasdistortingthemeasurementofCPI.Becauselowreportedinflationhelpsinfluenceinterestratepolicies,itcanbearguedthattheunder-reportingofCPIcontributedtoalowinterestrateenvironmentwhichinturnfosteredanartificialpropertypriceboomwhichcontributedverysignificantlytothesavings-and-loan(S&L)34andjunkbondscandalsoftheera.
UnderGeorgeH.W.Bush,itwasdecidedthateconomicdatashouldberedesignedtoshiftreportingawayfromoldindustrial-eramethodologiestowardsamoremodern,service-basedeconomicpattern.Whatevertherealmotivation,theresult,whenimplementedbytheClinton
administration,wasafurtherreductioninreportedCPIinflation,oneeffectofwhichwasareductionintheannualincreasesreceivedbyrecipientsofSocialSecurity.Clinton’sgovernmentalsofurtherunderminedthereliabilityofunemploymentdata,as“discouragedworkers”–ofwhomtherewereaboutfourmillion–wouldhenceforthberemovedentirelyfromthelargerworkforce.Samplingsizeswerereducedfrom60,000householdsto50,000.Sinceadisproportionatenumberofthedroppedhouseholdswerelocatedininnercities,thischangemayhaveresultedintheunder-reportingofunemploymentamongstblackAmericans.
FewfurtherchangeswereintroducedbyunderGeorgeW.Bush(whowasperhapstoobusyfightingunwinnablewars).Intheeconomicsphere,policybunglinginthisperiodwaslargelylefttotheFederalReserve,whoseinterestratepoliciescontributedtothespectacularboom-bustrollercoasterinrealestatemarkets.Anew“experimental”CPIcalculation(C-CPI-U)wasintroduced,whichfurtherreducedreportedinflation.From2006,thegovernmentceasedpublicationofM3moneysupplydata,whichwasbeginningtorevealthedangerousnatureofthebanklendingbubble.
Asaresultofthisconvolutedandincrementalprocess,inflation,unemployment,deficitsanddebtareroutinelyunder-reported,whilstbothgrowthandabsoluteGDPareover-stated.BeforeconsideringtherealnatureofanAmericaneconomymaskedbymisleadingdata,weneedtolookmorecloselyatreportingdistortion,startingwithinflation.
inflation – the cost of living, or the price of survival?
Withthepossibleexceptionofdebt,noothermacroeconomicindicatorisasimportantasinflation.Ineverydaylife,inflationdetermineshowwellaperson’sincomekeepsupwiththecostofliving.Thecalculationofrealeconomicgrowthisafunctionofthereverseinflator35appliedtomeasuresofnationaloutputsuchasGDP.Inflationdeterminesgrowthnotjustinnationaloutputbutintherealprofitabilityofcompanies,andisthusofgreatimportancetoinvestors.Therelationshipbetweeninterestratesandinflationdeterminestherealreturnonsavings.Inflationmeasuresareingeneraluseinthecalculationofwagesettlementsingovernmentandindustry.Inflationcalculationsinformrateofreturnsassessmentsonmajorcapitalprojects.Andthepaymentsmadeunderwelfareprogrammes(such
34 S&Ls are the American name for institutions also known as ‘thrifts’ and, in the UK, ‘Building Societies’
35 The GDP deflator

strategy insights | issue six 49
asSocialSecurityintheUS)aresetinrelationtoofficialstatementsofinflation.
TheinflationmeasuremostcommonlyusedinAmericaistheConsumerPriceIndex(CPI),whichiscalculatedandpublishedbytheBLS.TheBLSactuallypublishesthreeprincipalCPImeasures,butthemostcommonlyusedisCPI-U(theconsumerpriceindexforurbanconsumers).CPIhasalonghistory–butwhetheritsmorerecenthistoryisalsoanhonourableoneisopentoverysignificantdoubt.
TheoriginsofCPIcanbetracedbacktothe1880s,whentheBureauofLabour–thepredecessoroftheBLS–usedittocalculatetheeffectsoftariffs.DuringtheFirstWorldWar,itwasusedtodeterminewageratesinshipyards.Thoughpublishedregularlyfrom1921,CPIdidnotbecomeawidespreadtoolofmeasurementuntilaftertheSecondWorldWar,whenitbecameanintegralpartofwagesettlementsbetweenemployersandunions.ItsusehaslongsincespreadintoagamutofcommercialcontractsaswellasintosuchmainstreameconomicindicatorsasgrowthinrealGDP.
Atvarioustimes,inflationhasdestroyedpapercurrenciessuchastheWeimarmarkandtheZimbabwean
dollar.Infact,morethan3,800differentpapercurrencieshavebeendestroyedbyhyperinflation,affectedcountrieshavingincludedArgentina,Austria,Brazil,China,Greece,Hungary,Japan,Poland,RussiaandYugoslaviaaswellasinter-warGermanyandmodern-dayZimbabwe.Ifwegobackfarenoughintohistory,eventheUnitedStateshasnotbeenimmune,asrapidinflation(exacerbatedbyBritishcounterfeiting)destroyedAmerica’sfirstpapercurrency,the“continental”,duringtheWarofIndependence,whilstmuchthesamethinghappenedtothecurrencyoftheConfederacyduringtheCivilWar.EconomistsmaydisputeMiltonFriedman’sfamousobservationthat“inflationisalwaysandeverywhereamonetaryphenomenon”36,buttherecanbenodoubtthatacurrencycanbedestroyedifhyperinflationisletloosebytheexcessivecreationofmoney.
ThelasttimethatmajorWesterneconomieswerethreatenedbyrapidinflationwasinthe1970s,whentwosuccessiveoilcrisesdroveannualinflationwellintodoubledigits.Thehighinflationofthe1970swasdrivenoutofthesystem,successfullybutathugecost,byresoluteactionbycentralbankers,andmostnotablybythenFedchairmanPaulVolcker.Ironically,
thedebauchingoftheAmericanCPImeasureseemstohavebegunjustasMrVolcker’seffortswerebearingfruit.
AmongstthefirstofthemeasureswhichunderminedCPIwastheadoptionof“ownerequivalentrent”(OER)insteadoftheactualcostofhousing.OERiscalculatedbysubstitutingthenotionalrentthatahomeownerwouldhavetopayhim-orherselfiftheydidnotownthepropertyfortheactualmortgagecoststhatheorshepays.Inadditiontoitsdirectdistortioneffects,OERissignificantintwootherrespects.First, it introduced a notional element into an equation that had previously been based on strictly cash-based computations.Second,andaswellshallsee,OERisalsousedasan“imputation”incalculatingnominalGDP.
Intheearly1990s,somefinancialluminaries(includingGeorgeH.W.Bush’schiefeconomistMichaelBoskin,andFedchairmanAlanGreenspan)begantoarguethatCPIactuallyoverstatedinflationand,asaresult,artificiallyincreasedthecosttogovernmentofprogrammessuchasSocialSecurity.AlthoughplannedchangestothesystemfailedtogetthroughCongress,theywereimplementedanywayunderBillClinton.
36 Milton Friedman, The Counter Revolution in Monetary Theory, 1970
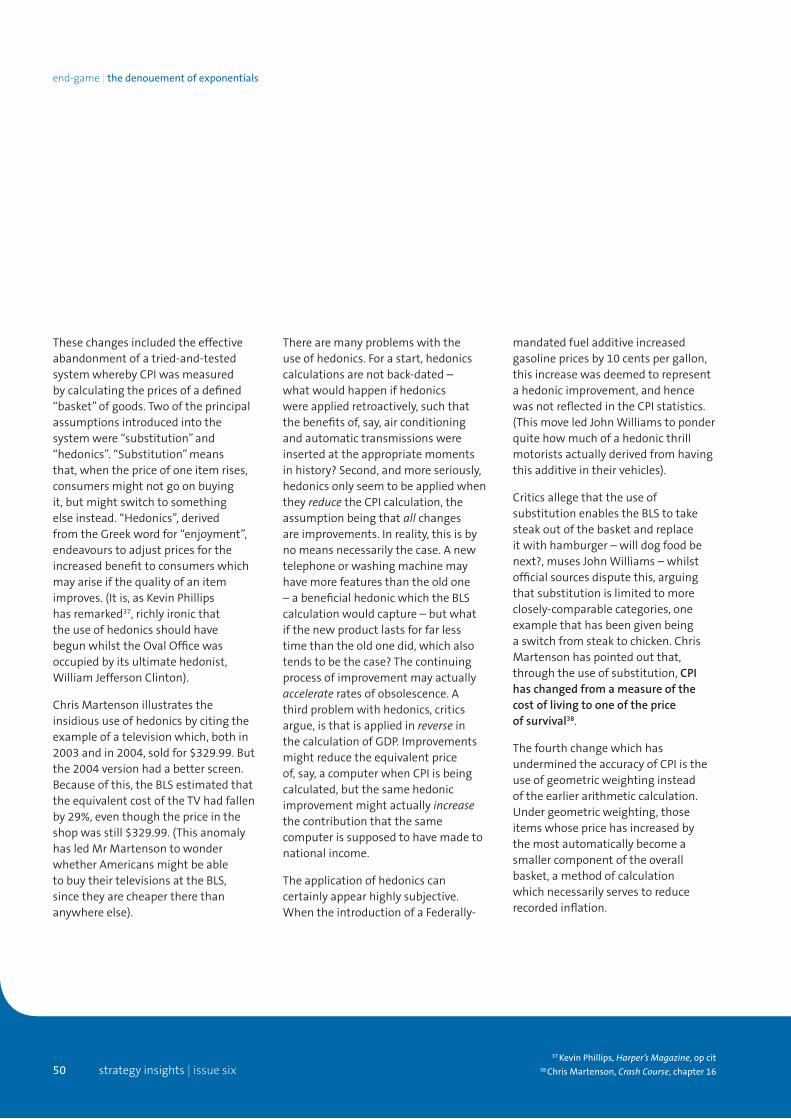
strategy insights | issue six50
end-game | the denouement of exponentials
Thesechangesincludedtheeffectiveabandonmentofatried-and-testedsystemwherebyCPIwasmeasuredbycalculatingthepricesofadefined“basket”ofgoods.Twooftheprincipalassumptionsintroducedintothesystemwere“substitution”and“hedonics”.“Substitution”meansthat,whenthepriceofoneitemrises,consumersmightnotgoonbuyingit,butmightswitchtosomethingelseinstead.“Hedonics”,derivedfromtheGreekwordfor“enjoyment”,endeavourstoadjustpricesfortheincreasedbenefittoconsumerswhichmayariseifthequalityofanitemimproves.(Itis,asKevinPhillipshasremarked37,richlyironicthattheuseofhedonicsshouldhavebegunwhilsttheOvalOfficewasoccupiedbyitsultimatehedonist,WilliamJeffersonClinton).
ChrisMartensonillustratestheinsidioususeofhedonicsbycitingtheexampleofatelevisionwhich,bothin2003andin2004,soldfor$329.99.Butthe2004versionhadabetterscreen.Becauseofthis,theBLSestimatedthattheequivalentcostoftheTVhadfallenby29%,eventhoughthepriceintheshopwasstill$329.99.(ThisanomalyhasledMrMartensontowonderwhetherAmericansmightbeabletobuytheirtelevisionsattheBLS,sincetheyarecheapertherethananywhereelse).
Therearemanyproblemswiththeuseofhedonics.Forastart,hedonicscalculationsarenotback-dated–whatwouldhappenifhedonicswereappliedretroactively,suchthatthebenefitsof,say,airconditioningandautomatictransmissionswereinsertedattheappropriatemomentsinhistory?Second,andmoreseriously,hedonicsonlyseemtobeappliedwhentheyreducetheCPIcalculation,theassumptionbeingthatallchangesareimprovements.Inreality,thisisbynomeansnecessarilythecase.Anewtelephoneorwashingmachinemayhavemorefeaturesthantheoldone–abeneficialhedonicwhichtheBLScalculationwouldcapture–butwhatifthenewproductlastsforfarlesstimethantheoldonedid,whichalsotendstobethecase?Thecontinuingprocessofimprovementmayactuallyaccelerateratesofobsolescence.Athirdproblemwithhedonics,criticsargue,isthatisappliedinreverseinthecalculationofGDP.Improvementsmightreducetheequivalentpriceof,say,acomputerwhenCPIisbeingcalculated,butthesamehedonicimprovementmightactuallyincreasethecontributionthatthesamecomputerissupposedtohavemadetonationalincome.
Theapplicationofhedonicscancertainlyappearhighlysubjective.WhentheintroductionofaFederally-
mandatedfueladditiveincreasedgasolinepricesby10centspergallon,thisincreasewasdeemedtorepresentahedonicimprovement,andhencewasnotreflectedintheCPIstatistics.(ThismoveledJohnWilliamstoponderquitehowmuchofahedonicthrillmotoristsactuallyderivedfromhavingthisadditiveintheirvehicles).
CriticsallegethattheuseofsubstitutionenablestheBLStotakesteakoutofthebasketandreplaceitwithhamburger–willdogfoodbenext?,musesJohnWilliams–whilstofficialsourcesdisputethis,arguingthatsubstitutionislimitedtomoreclosely-comparablecategories,oneexamplethathasbeengivenbeingaswitchfromsteaktochicken.ChrisMartensonhaspointedoutthat,throughtheuseofsubstitution,CPI has changed from a measure of the cost of living to one of the price of survival38.
ThefourthchangewhichhasunderminedtheaccuracyofCPIistheuseofgeometricweightinginsteadoftheearlierarithmeticcalculation.Undergeometricweighting,thoseitemswhosepricehasincreasedbythemostautomaticallybecomeasmallercomponentoftheoverallbasket,amethodofcalculationwhichnecessarilyservestoreducerecordedinflation.
37 Kevin Phillips, Harper’s Magazine, op cit38 Chris Martenson, Crash Course, chapter 16

strategy insights | issue six 51
Theoverallresultofthesevariousadjustments,criticsrightlyclaim,hasbeentounderstateCPItothepointatwhichithasbecomegrosslyinaccurate,quiteapartfrombeingtransformedfromarealisticmeasureofthecostoflivingintoadescendingbarometerofthepriceofsurvival.Fig.18comparestheofficialandunderlyingratesforUSinflationsince1980,showingthatthespreadbetweentheofficialandtheunderlyingnumberhaswidenedwitheachsuccessivemethodologicalchange,andnowexceedssevenpercentagepoints.
Overthelastdecade,underlyingCPIinflationhasaveraged9.4%,comparedwithanofficialfigureofjust2.6%.Thisisprettytoughonmanypeople,particularlythoseSocialSecurityrecipientswho,ifthemethodsofcalculatingCPIhadremainedunchangedsincethe1980s,wouldnowbereceivingabouttwiceasmuchtodayastheyactuallydo.
Mostimportantly,ofcourse,theunderminingofthecalculationofinflationmeansthatthoseanalysts,investorsandpolicymakerswhobasetheirdecisionsonofficialinflationdata
arelivinginathrough-the-looking-glasscountrywhichbearslittleornoresemblancetotheUnitedStatesasitreallyis.Fearsofdeflation–whichare,ofcourse,ratherimplausibleanywayinanycountrywhichcansimplyprintmoney–lookparticularlyimprobablewhen,asfig.18shows,underlyinginflationremainsatsevenpercent.Ofevengreatersignificance,wherethisanalysisisconcerned,isafurtherimplicationwhichflowsfrommassivelyunderstatedinflation,whichisthatreportedGDP“growth”isclearlyawhollyunreliablenumber.Howstrongistoday’sAmericaneconomy?
Fig. 18: Smoke & mirrors #1 – unmasking American inflation*
16%
14%
12%
10%
8%
6%
4%
2%
0%
-2%
1980
1981
1982
1983
1984
1985
1988
1986
1987
1989
1990
1991
1992
1993
1994
1995
1996
1997
1998
1999
2000
2001
2002
2003
2004
2005
2006
2007
2008
2009
2010
11.6%
9.2%
1.9%
3.8%
OfficialUnderlying
US CPI inflation, 1980-2010
*Source:TullettPreboncalculations,basedondatasourcedfromShadowstats.com

strategy insights | issue six52
end-game | the denouement of exponentials
economic output – a Grossly Distorted Picture
Grossdomesticproduct(GDP)–orrather,thequarterlyorannualrateofchangeinthisnumber–isoneofthemostimportantindicatorsstudiedbyanalysts,investorsandpolicymakers.Afterall,GDPissupposedtoquantifyacountry’stotaleconomicoutput,andthechangeinthisnumber–adjusted,ofcourse,forinflationaryeffects–shouldtelluswhethertheeconomyisgrowingand,ifso,howrapidly.Indeed,arecessioniscustomarilydefinedas‘twoconsecutivequartersofnegativegrowth’.
Theoretically,atleast,thisrateofgrowthalsodeterminesthescopeforexpansioninbusinessprofitability.ThewelfareofmillionsofindividualsandfamiliesisdeterminedbyGDPgrowth.Agrowingeconomyboostsgovernmenttaxrevenues,reduceswelfarecosts(theso-called‘automatic
stabilisers’),anddeterminestheaffordabilityofdebt.LevelsofGDP,whetherinabsoluteorinper-capitaterms,areroutinelyusedtocomparethewealthofnations.Androbustgrowthiscertainlygoodforgovernmentsseekingre-election.
Thoughtherateofgrowthinamatureeconomyclearlycannotrivalthatofanemergingcountrywhichstartsfromalowbase,theAmericaneconomycontinuestogrowatarespectablerate–ifgovernmentnumbersaretobebelieved.Accordingtoofficialdata,USoutputexpandedby38%(acompoundaverageof3.25%peryear)duringthe1980s,by40%(3.4%annually)duringthe1990s,andbyabout18%(0.3%peryear)inthedecadesince2000.
Butthese seemingly-comfortable numbers might be wildly inaccurate.Alternativecalculations,summarisedinfig.19,suggestthatAmericanreal
GDPgrowthmighthaveaveraged2.1%duringthe1980sand0.3%duringthe1990s,andthatUSoutputmightactuallyhavefallen(byabout2%annually)sincetheturnofthecentury.Iftrue,thiskindofcalculationwouldputawhollynewcomplexionontheperformanceoftheAmericaneconomy.Doessuchaninterpretationaccordwiththefacts?
Therearetworeasonsforsupposingthatthisgloomypicturemightindeedbeaccurate.Forastart,GDPdoesnot–asmostAmericansprobablyassumethatitdoes–representamonetaryquantificationofnationaloutputmeasuredin‘actual’dollars.Rather,itincludessubstantial“imputations”.Second,thewayinwhichinflationisdeductedtoarriveat“real”growth–thatis,theGDPdeflator–mightbecontaminatedbythesamedistortionswhichafflictthemeasurementofconsumer(CPI)inflation.
Fig. 19: Divergent numbers – US economic growth, 1980-2010e*
1980-90 1990-2000 2000-2010e Since 1980
Aggregate Annual Aggregate Annual Aggregate Annual Aggregate
Official 38% 3.3% 40% 3.4% 18% 1.7% 127%
Alternate 23% 2.1% 3% 0.3% -18% -2.0% 4.1%
*Source:TullettPrebonestimatesbasedonofficialandShadowstats.comdata,seetext

strategy insights | issue six 53
“ Exponential economics can provide investors and corporate managers with a competitive edge because it offers a basis for interpretation and prediction which is far superior to anything else available. As the process of change accelerates, policymakers have an imperative need to access the insights that exponential economics can provide”.

strategy insights | issue six54
end-game | the denouement of exponentials
Oneofthedistorting“imputations”,describedearlierwhenwelookedatinflation,is“owner-equivalentrent”.Ifyouownyourhouseoutright,younaturallymakenomortgageorrentpayments,soyouwouldassumethatnofigurecouldpossiblyshowupinthenationaloutputaccountsinrespectofyourproperty.ButthisisnotthecaseasfarastheBureauofEconomicAnalysis(BEA)isconcernedwhenGDPisbeingcalculated.Rather,theBEAcalculatestherentthatyouwouldotherwisebepaying(toyourself,presumably)ifyoudidnotowntheproperty.
Likewise,yourbankmightprovideafreebankingservice.Beingfree,obviouslynomoneychangeshandsinrespectofthisservice,buttheBEAcalculateswhatyouwouldhavetopayifyourbankdidchargeyouforit.Theseandotherimputationsstackuptoatleast15%of‘nominal’GDP,meaningthatthisfigureisnot–asmostpeopleprobablyassumethatitis–anactualcountednumberof‘real’dollars.
Imputations(andthedubiousnatureofinflationreporting)shouldofthemselvespromptanalyststolookcloselyatthevalidityofGDPdata,
whichJohnWilliamsdescribesasbeingboth“themostwidelyfollowedbusinessindicatorreportedbytheUSgovernment”and“nearlyworthlessasanindicatorofeconomicactivity”39.
GDPisalargecomponentoftheNationalIncomeandProductAccounts(NIPA),developedbytheNationalBureauofEconomicResearch(NBER),aprivateorganisationestablishedin1920.Today,GDPreportingisundertakenbytheBEA.
Forastart,investorsshouldnotethatGDPisnotasbroadameasureofnationaleconomicoutputasGNP(grossnationalproduct),thehistoricbenchmarkusedfordecadesincalculatingAmericaneconomicdata.However,thebroaderGNPmeasureincludesinternationalflowsofinterestanddividends,whichareanegativeiteminAmericasincetheUSisamajordebtornation.Consequently,reportingswitchedfromGNPtothemoreflatteringGDPin1991.Sincethen,andreflectingarelentlessincreaseinAmericanoverseasindebtedness,therehasbeenevergreaterdivergencebetweenoutputandgrowthasmeasuredonaGDPoraGNPbasis.
39 Gross Domestic Product, briefing paper by John Williams, Shadowstats.com

strategy insights | issue six 55
Mostusersofnationaloutputdata,beitGNPorGDP,probablyassumethatitisapredominantlycash-basednumber,whichcountstransactionsinmuchthesamewayas,say,thetradedeficitiscomputed.Butthisisnotthecase.Forastart,andasmentionedearlier,itincludesverylargeimputations(suchasowner-equivalentrentandfreebanking,ofwhichthelatteristreatedas“imputedinterestincome”).Criticsallegethatfreebankingaccountsformorethanhalfofaggregatepersonalinterestincome,andthatowner-equivalentrentrepresentswelloverhalfofallrentalflows.
DefendersofGDPcalculationsdrawcomfortfromtheobservationthattheGDPdeflatorisappliedinreversethroughachain-weightedvolumetricmeasure,andisthereforedistinctfrompotentially-understatedconsumerinflationmeasuressuchastheCPI.
Butamoment’sreflectionwillindicatethatthe change in GDP between one period and the next cannot, in fact, conceivably be measured volumetrically–thatis,inanon-financialway–inordertobackouttheeffectsofpricechanges.Evenifthenumbersofpaper-clipsandcarsproducedintheUSintwocomparative
periodscouldbecounted,thenature,qualityandlongevityofthecars,ifnotofthepaperclips,arecertaintohaveevolved.Andthen,ofcourse,thereisthehugevolumeofpurelyfinancialtransactions–involvedinfinancialservicesactivitiessuchasinsurance,bankingrealestateandsoon–thatcannotpossiblybemeasuredinanon-financialandpurelyvolumetricway.Soitisself-evidentthatthedistortedmeasurementofconsumerinflationnecessarilyimpactsthecalculationof‘real’economicgrowth.
Quiteapartfromthesetheoreticalweaknesses,GDPdataisoftenstarklyatoddsbothwithlogicandwithalternativedatareferencepoints.Wherealternatedataisconcerned,thereisapersistentandwideningmismatchbetweensoliddata(suchasthatpublishedbythetaxauthorities)andreportedeconomicactivity.Therentpaidtoanon-existentlandlordforthe“rent”ofawholly-ownedpropertydoesnotactuallyexistindollarform,ofcourse,whichmeansthattheInternalRevenueService(IRS)obviouslycannottaxit.
Asaresult,incometrendsreportedbytheIRSareoftenstarklyatoddswithapparentchangesinGDP.Butfew
analystsseemtoaskthemselveswhytheefficiencyoftheIRS–measured,thatis,againstchangesinreportedGDP–seemstodeteriorateovertime.Theanswertothisconundrumliestoasignificantextentwithinimputationswhich,sincetheydonotactuallyexistinrealterms,obviouslycannotbetaxed.
Ofcourse,anycomputationofnationaloutputrequiresajudgementaboutthe“productionboundary”,becausesomeservicesnaturallylieoutsidetheformaleconomy.Agoodexampleofthisischildcarecarriedoutbyparents–thisserviceisofundoubtedvalue,butnodollarsumisattachedtoit.Theproductionboundarynecessarilycomplicatestheassessmentprocess.Evenso,thesteadilyincreasingscaleofimputationsdoesseemtohaveboostednominalGDPprettyappreciably,andinamannerstarklyandincreasinglyatoddswithnationalincomeasmeasuredfortaxpurposes.Thesevariationsaremoststarkinareassuchasrentalandinterestincome,the same categories in which imputations are most extensive.

strategy insights | issue six56
end-game | the denouement of exponentials
EvenifwecouldsomehowsquareGDPandIRSreporting(whichwecannot),subjectiveassessmentwouldsurelyconformthatofficialdataoverstatesoutputandgrowth.Onseveraloccasions,officialGDPdatahasproducedaso-called“joblessrecovery”,whichmanycriticsregardasacontradictioninterms.Evenassumingthemostbenigncomputationprocedures,GDPis,amongstallofthefront-linemacroeconomicmeasures,theonemostdependentuponeconomictheoryratherthanthesimplecountingofmonetarysums.Onbalance,weleanheavilytowards
theviewthatGDPsignificantly(andincreasingly)overstatesoutputbothintheUnitedStatesandelsewhere.
Fig.20showsareconstructionofhowextensivelyofficialGDPdatamayhaveoverstatedAmericaneconomicgrowthsincethe1980s.
debt and the deficit
AccordingtoofficialdatafromtheFinancial Report of the United States Governmentforthe2009fiscalyear(FRUSG09),theFederalgovernmentincurredadeficitof$1,417billioninthatyear,andoweddebtof$7.58
trillionat30thSeptember.Criticsallegethatthesefiguresaredrasticunderstatementsofthegovernment’sfinancialobligationsandoftherateatwhichtheseobligationsareaccruing.Significantly,intheaccompanyinglettertothePresidentandtheleadersofbothhousesofCongress,theOfficeoftheComptrollerGeneralreportedthatthereportcontainedsome“majorimpediments”which“continuedtopreventusfromrenderinganopinionontheFederalgovernment’saccrual-basedconsolidatedfinancialstatements”40.Inthetermsinwhichsuchmattersareexpressedinthecorporatesector,
Fig. 20: Smoke & mirrors #2 – unmasking American economic growth*
1980
1981
1982
1983
1984
1985
1988
1986
1987
1989
1990
1991
1992
1993
1994
1995
1996
1997
1998
1999
2000
2001
2002
2003
2004
2005
2006
2007
2008
2009
2010
10%
8%
6%
4%
2%
0%
-2%
-4%
-6%
-8%
OfficialUnderlying
US real GDP growth, 1980-2010
*Source:TullettPreboncalculations,basedondatasourcedfromShadowstats.com
40 Financial Report of the United States Government for the 2009 fiscal year (FRUSG 09)

strategy insights | issue six 57
the government’s own auditor again refused to sign off the accounts.Criticsofgovernmentreportingcertainlyseemtohaveapoint.
TounderstandtheaccuracyorotherwiseofthereportedFederaldebtanddeficitnumbers,investorsneedtoappreciatethattheAmericangovernment–likemanyothers,amongstthemthatoftheUK–doesnotaccountforforwardcommitments(sometimesknownas‘off-balance-sheet’obligations)inthewaythatcorporationsareroutinelyrequiredtodo.Theseobligationsaretypicallyhuge,andcanincludeundertakingstopaypensionstoitsemployeesandtoprovidemoregeneralpensionsandotherbenefitstomembersofthepublic.TheUSgovernmentisbynomeansalonewheretheseoff-balance-sheetobligationsareconcerned.Indeed,weexplainedinanApril2010report41thatBritishpublicsectorpensioncommitmentsaloneconstituteda£1,000billionundisclosedobligation.
ThenumbersintheUnitedStatesaremuchlargerthanthoseoftheUK,byordersofmagnitudegreaterthanthesimplecomparisonsofpopulationoreconomicscale.Takingoff-balance-sheetUSobligationsintotheequation,criticshavearguedthatthetruefederaldeficitinthe2009fiscalyearwas$4.4trillion,or35%ofnationalincome,
andthatoutstandingliabilitiesattheyear-endexceededaterrifying$69trillion,whichisabout5.4xAmericanGDP. If these figures are even remotely accurate, the US government is in very, very deep trouble.
Thoughwebelieve–forreasonstobeexplainedshortly–thatoutsidecritics’terrifyingnumbersmaybesomewhatexaggerated,weconcurintheirbeliefthatthe revenue and capital accounts of the American government are drastically worse than official numbers imply.Moreover,seniorofficialsnotonlyknowthisbutperiodicallydotheirverybesttowarntheirelectedmasters(andtheAmericanpublic)abouttheimplicationsofundisclosedandescalatingindebtedness.What,then,istherealsituationregardingdebtandthedeficit?
Thedebtanddeficitstoryreallybeginsinthe1960s,whentheJohnsonadministrationbegantheobfuscationprocessbycombiningnetSocialSecuritypaymentswithothergovernmentaccountsinthe“unifiedbudget”.BecauseinMrJohnson’sday(andsince),SocialSecurityreceiptshaveexceededpayments,thisprocesshasflatteredthereporteddeficit,butisnowpoisedtoreverseas‘babyboomer’retirementbeginstoexertsignificantupwardspressureonnetpaymentsbygovernment.
Intheearly1970s–ataboutthesametimethatRichardNixondetachedthedollarfromgold,therebyenablingtheUS,atleastintheory,toprintasmanygreenbacksasitcouldgetawaywith–thetenthen-largestAmericanaccountancyfirmsproposedthatthegovernmentshouldreportitsfinancialperformanceunderUSgenerallyacceptedaccountingprinciples(USGAAP),thesamebenchmarkusedbycorporations.Suchaccounts,whichbegantobepublishedfrom1974,showedthegovernment’soff-balance-sheetobligationsaswellasitsformalindebtedness.ButtheReaganadministrationdisliked(andthereforeceased)thepracticeofdisclosingtheseaccruedamounts.Tohiscredit,GeorgeW.BushreinsertedthesesumsintheFRUSGfrom2002,inthatoff-balance-sheetobligationsaredisclosedinanotetotheaccounts(thoughtheydonotappearinthegovernment’sbalancesheetorcashflowstatement).
Criticsarguethat,ifthesesumswerefullyincorporatedintoGAAPaccounts,reporteddeficitswouldbeverymuchlarger,whilsttheAmericanpublicwouldbecomeconsciousofthehugescaleofunderlyingFederaldebtandquasi-debt.
41 Tullett Prebon Strategy Insights, issue four, Britain at the Crossroads, April 2010

strategy insights | issue six58
end-game | the denouement of exponentials
Publishednumberscertainlyappeartobearthisout.Attheendofthe2009fiscalyear,thenetpresentvalueoffutureSocialSecurityandMedicarecommitmentsexceededschemeassetsby$52.1trillion.Moreover,reportedFederaldebt(of$7.6trillion)excludes$4.4trillionofintra-governmentaldebtswhich,sincetheyareowedtothewelfarefunds,havealreadybeenexcludedfromthenetpresentvaluecalculationwhichresultsinthe$52trillionoutstandingwelfarecomputation.Finally,obligationsto
paypensionstofederalemployeesshouldbeincluded,too.Together,thesesumstotal$69,403billion,equivalentto540%ofGDP(seefig.21).BoththeaggregatesumandtheGDPmeasurehaveexpandeddramaticallyinrecentyears,withtotal obligations rising from 248% to 540% of GDP between fiscal years 2000 and 2009.
Similarcalculations,criticscontend,haveimplicationsforthedeficitwhichareeverybitasgruesomeastheyareforthedebtcalculation.During2009,thedeficitwasreportedat
$1.47trillion,inclusiveofanunusual(buthighlysignificant)reversaloftheSocialSecuritybalancefromcredittodebit(seefig.22).Butoff-balance-sheetliabilitiesincreasedbyalmost$3trillionduringtheyear,andcriticscontendthattheunderlyingFederaldeficitwasactuallycloseto$4.5trillion,withinawhiskerof35%ofGDP(eveniftheanalystacceptsaGDPdenominatorswelledbyimputations).Inshort,someargue,both Federal debt and the deficit are completely unaffordable and out of control,a
Fig. 21: Smoke & mirrors #3 – hidden Federal debt*
2000 2001 2002 2003 2004 2005 2006 2007 2008 2009
80
70
60
50
40
30
20
10
0
US Federal debt and obligations ($ trillion)
Off balance sheet**IntragovernmentDebt held by public
$28.0$32.2 $33.9
$37.4
$48.7$52.5
$57.4 $59.4$64.5
$69.4
Sources: *Financial Report of the United States Government (FRUSG),2000through2009.Dataisatend-September
**Futurenetpresentvalueofwelfareandpensionprogrammes

strategy insights | issue six 59
grimrealitythatisbeinghiddenfromtheAmericanpeoplebydistortedaccounting.
Andthereisonefurther,evenmorefrighteningcalculationwhichcanbemadehere.Theaggregateindebtednessfigure(whichtotalled$69.4trillionattheendofthe2009fiscalyear)isgrowingatacompoundannualrateofalmost11%.Sincetheseobligationsalsoequateto5.4xGDP,therateofnominalnationalincomegrowthrequiredeven to maintain
the multiple at this frightening levelisaludicrous58%.Therefore,the underlying indebtedness ratio must continue to grow under any realistic economic scenario.
Finally,inflationcan(anddoubtlesswill)destroyconventionaldebtovertime,butitcannotworkthesamemagicwhereoff-balance-sheetobligationsareconcerned,becausethesecommitmentstendtoexpandatleastasrapidlyasthecostofliving.ConcludingthattheFederal
governmentisbankruptinallbutname,criticscallinaidformerFedbossAlanGreenspan,whowarnedalmosttenyearsagothatWashingtonoughttocomecleanaboutitsinabilitytodeliveroncurrentSocialSecurityandMedicarecommitments,addingthatthereisnopossibilitywhatsoeverofthesecommitmentsbeingrenderedaffordablebyeconomicorproductivitygrowth.Perhapsunsurprisingly,analystJohnWilliamswarnsofan“unfolding fiscal disaster”42.
42 Federal Deficit Reality briefing paper, and Commentary Number 282, by John Williams, Shadowstats.com
Fig. 22: Smoke and mirrors #4 – the hidden Federal deficit*
Fiscal year 2002 2003 2004 2005 2006 2007 2008 2009
$ billions:
Basic deficit $365 $668 $616 $760 $450 $276 $1,009 $1,254
Social Security -$207 -$293 -$203 -$442 -$202 -$113 -$554 $217
Reported deficit $158 $375 $412 $319 $248 $163 $455 $1,471
Welfare & Pension obligations $1,316 $2,929 $10,711 $3,191 $4,293 $1,547 $4,083 $2,975
Total deficit $1,473 $3,303 $11,123 $3,509 $4,541 $1,710 $4,538 $4,446
As % GDP:
Reported deficit 1.4% 3.1% 3.4% 2.5% 1.9% 1.2% 3.4% 11.4%
Welfare & Pension obligations 11.3% 24.5% 87.1% 25.2% 33.1% 11.7% 30.9% 23.1%
Total deficit 12.7% 27.7% 90.4% 27.7% 35.0% 12.9% 34.3% 34.6%
*Sources:TullettPrebonestimatesbasedonofficialdata

strategy insights | issue six60
end-game | the denouement of exponentials
Atthispoint,weneedtostandbackandrememberfourverysignificantamelioratingfactors.First,theoff-balance-sheetdebtsreportedintheFRUSGrepresentthedifferencebetweentheassetsofthevariousschemesandthenetpresentvalue(NPV)oftheirobligationsovera75-yearperiod.This,wethink,pullstoomuchofthefuturecommitmentintothepresent-daybalancesheet.UsingparameterspublishedintheFRUSG,wehavecalculatedtheoutstandingnetliabilitybasedonamorereasonable25-yearhorizon(seefig.23).
Thissuggeststhattheoutstandingobligationisoftheorderof$46trillion–comprisingdebtof$12trillion,employeebenefitsof$5.3trillionandfuturewelfarecommitmentsof$28.9trillion–whilsttheunderlyingdeficitinfiscalyear2009wasoftheorderof$3.5trillion.Sincetheunderlyingobligationsanddeficitequateto359%and27.4%ofGDPrespectively,thesenumbersareonlymarginallylessappallingthanthefull-inclusioncalculations.Thesenumbersaresummarisedinfig.24.

strategy insights | issue six 61
Fig. 23: Still daunting – the time-scaling of unfunded US welfare commitments*
Estimated timescaling of future Federal welfare costs
$3,000
$2,000
$1,000
$0
2010
2012
2014
2016
2018
2020
2022
2024
2026
2028
2030
2032
2034
2036
2038
2040
2042
2044
2046
2048
2050
2052
2054
2056
2058
2060
2062
2064
2066
2068
2010-35 – NPV – $28.9 trillion After 2035-84 – NPV – $23.3 trillion
NPVAnnual cost
Total outstanding liability– $52.1 trillion
*Source:TullettPreboncalculationsbasedontheFinancial Report of the United States Government(FRUSG),2000through2009
Sources: *Financial Report of the United States Government(FRUSG),2000through2009.Dataisatend-September
**BasedonestimatedNPVof25–ratherthan75yearforwardcommitments
Fig. 24: Smoke and mirrors #5 – the hidden federal obligations*
Fiscal year in $ trillion 2002 2003 2004 2005 2006 2007 2008 2009
Federal debt (gross) $6.2 $6.8 $7.4 $8.0 $8.5 $9.0 $10.1 $12.0
Federal employee benefits $3.6 $3.9 $4.1 $4.5 $4.7 $4.8 $5.3 $5.3
Welfare commitments** $13.4 $14.8 $20.6 $22.2 $24.4 $25.2 $27.2 $28.9
Aggregate indebtedness $23.2 $25.5 $32.1 $34.6 $37.7 $39.1 $42.6 $46.1
As % GDP 200% 214% 261% 273% 290% 294% 322% 359%
Effective deficit $1.3 $2.3 $6.6 $2.5 $3.0 $1.4 $3.6 $3.5
As % GDP 10.8% 19.3% 53.7% 19.9% 23.3% 10.6% 26.9% 27.4%

end-game | the denouement of exponentials
strategy insights | issue six62

strategy insights | issue six 63
Second,Americahassignificantleewaywheretaxationisconcerned.AccordingtodatasourcedfromtheCIA World FactBook,governmentrevenuesequatedtojust15%ofAmericanGDPlastyear,farlowerthancompetitorssuchasJapan(35%),Britain(40%),Germany(45%)orFrance(48%)(fig.25).Onepossibility,therefore,isthattheUScouldraisetaxesverymaterially.Thissolutionwouldbehugelyunpopular–as,indeed,wouldanycutbacksinforwardwelfareobligations–butitdoesgiveAmericamoreroomformanoeuvrethanmanyotherheavily-indebtedcountries.
Third,thevastbulkofthesedebtsareinternal–thatistosay,theyareobligationswhichsomeAmericansowetootherAmericans.Aswehaveexplainedinseveralpreviousresearchreports,internaldebtsmatterfarlessthanexternalobligations.Bythiscriterion,America,withgrossexternaldebtsof$44,000percapita,isinfarbettershapethanGermany($63,000),France($78,000)ortheUK($149,000).
Finally,andperhapsmostpivotally,theAmericandollaristheworld’sreservecurrency.ThishasenabledtheUStoenjoyinternational(thoughoftengrudging)acceptanceforexpansions
ofdebtandthemoneysupply.WhethertheAmericandollarcanretainitsreservestatusinthefuture,however,hastobeopentoquestion–asubjecttowhichweshallreturninpartfourofthisstudy,whenwelookattheimplicationsofanAmerican(andWestern)economicsysteminthegripofunwindingexponentials.
Fig. 25: Room for manoeuvre? – the US as a low-tax economy*
China UnitedStates
UnitedKingdom
Spain Japan Germany Italy France
60%
40%
20%
0%
Comparative taxation and expenditure, 2009
RevenueExpenditure
11% 12%
35%
42% 40%
52%
45% 48%
46%
51% 48%
56%
15%
25% 29%
37%
*Source:CIA World FactBook

end-game | the denouement of exponentials
strategy insights | issue six64
“America has indulged in a debt binge which, whilst adding hugely to the burdens of
median earners whose real earnings have been declining anyway, has benefited
only a tiny minority of the very rich”.

part four:
strategy insights | issue six 65
end-game – the denouement of exponentials
• AllavailableevidencesuggeststhattheWesterneconomiesarealreadyinthetalonsofanexponentialsdenouementprocess.Thecriticalenergyequationisweakening,andanexponentialfinancialsystemhascreatedunsustainabledebtburdens.
• Ifwearetounderstandandmanagethisprocess,weneedtorealisethatneitherKeynesiannorfree-marketeconomicscanprovidethenecessarypolicytools.Investorsandpolicymakersalikeneedtoembracethenewparadigmofexponential economics.
• Thereisanimperativeneedforastandardisedcalibrationoftheenergysurplusequation(EROEI),andforaconsistent,accurateandlong-termeconomicdatabase,whichcanfacilitateabreakawayfromfaultyandshort-terminterpretationandplanning.
• Specifically,investorsandpolicymakersalikeneedtopreparethemselvesforhigherinflation,andforagrowingrecognitionthatthecurrentbasisofglobalisedfree-tradeisextremelydetrimentaltotheWesterneconomies.
Beforelookingattheimplicationsoftheexponentialsend-game,let’sreviewwherethisresearchprojecthasledusthusfar.First,we’vereviewedthetwo-partexponentialsequation,comprisingasurplus-energyeconomydrivenbyfossilfuels,ontopofwhichhasbeenconstructedanincreasinglyexponentialfinancialsuperstructure.Andwehaveexplainedthatreportedmacroeconomicdatapresentsahugelydistortedpicture,certainlyintheUnitedStatesandveryprobablyelsewhereinOECD.
ConcentratingontheUS,wehaveseenthattheeconomyappearstobeessentiallyex-growth,asituationdisguisedbyunderstatedinflationandoverstatedGDP.Meanwhile,andinadditiontohugedisclosedformaldebts,theFederalgovernmenthasaccumulatedtrulyenormousforwardobligations,principallyintheformofwelfarecommitments.Inclusionoftheannualincrementtothese‘informal’debtspresentsafarworseongoingpicturethancanbeappreciatedbythereportedfiscaldeficit,withtheAmericangovernmentincurringwelfareobligationswhichcannotconceivablybemetwithouttrulymassiveincreasesintaxation.Totalcreditmarketdebt,whichincludesindividualsandthecorporatesectoraswellasStateandFederalgovernment,standsatanunprecedented350%ofGDP(seefig.26).

strategy insights | issue six66
end-game | the denouement of exponentials
Fig. 26: Uncharted waters – US debt as a percentage of GDP*
450%
350%
250%
150%
50%
1945
1947
1949
1951
1953
1955
1957
1963
1959
1961
1965
1967
1969
1971
1973
1975
1977
1979
1981
1983
1985
1987
1989
1991
1993
1995
1997
1999
2001
2003
2005
2007
2009
157%
353%
171%
US credit market debt as % of GDP, 1945-2010
*Source:Officialdata
Fig. 27: Smoke and mirrors #6 – America’s hidden jobless*
25%
15%
20%
10%
5%
0%
21.7%
16.5%
9.5%
US unemployment rates – reported and underlying, 1994-2010
Official U-3Official U6Underlying
*Source:OfficialdataandShadowstats.com

strategy insights | issue six 67
Moreover,unemploymentisextremelyhigh,andhasrisensharplyinrecentyears,withthereported(U3)figure(9.7%)disguisingafarworseunderlyingsituation(seefig.27).ThereseemseverylikelihoodthattheunderlyingeconomicweaknessandtheexcessiveindebtednessoftheUSisreplicatedthroughouttheOECDeconomies.
Doesthisdisturbingstateofaffairstiebacktoanunravellingofexponentials?Inordertorelatethesituationtothesetwofactors–anunsustainableexponentialdynamic,andaweaker-than-reported,massivelyindebtedeconomy–weneedtoconsiderwhat we would expect to seeiftheeithertheresourceorthefinancialdimensionoftheexponentialsprocessweretoreachend-game.
Essentially,wewouldexpecttoseeaneconomythatisincreasinglymonetaryratherthanproductive.Thismeans,first,thatthecurrencylosesitsvalueasthemoneysupplyexpandsmuchmorerapidlythanrealproductivecapacity(bywhichwemeantheaggregateofmanufacturing,agriculture,theextractiveindustriesandgenuinelyvalue-addingservicessuchasretailinganddistribution).Second,itmeansthatthecentreofgravityoftheeconomyswingssuccessivelyawayfromproductiveactivities,withanever-largerproportionofGDPbeingaccountedforbytheultimatelyunproductiveactivityofsimplymovingmoneyaround.
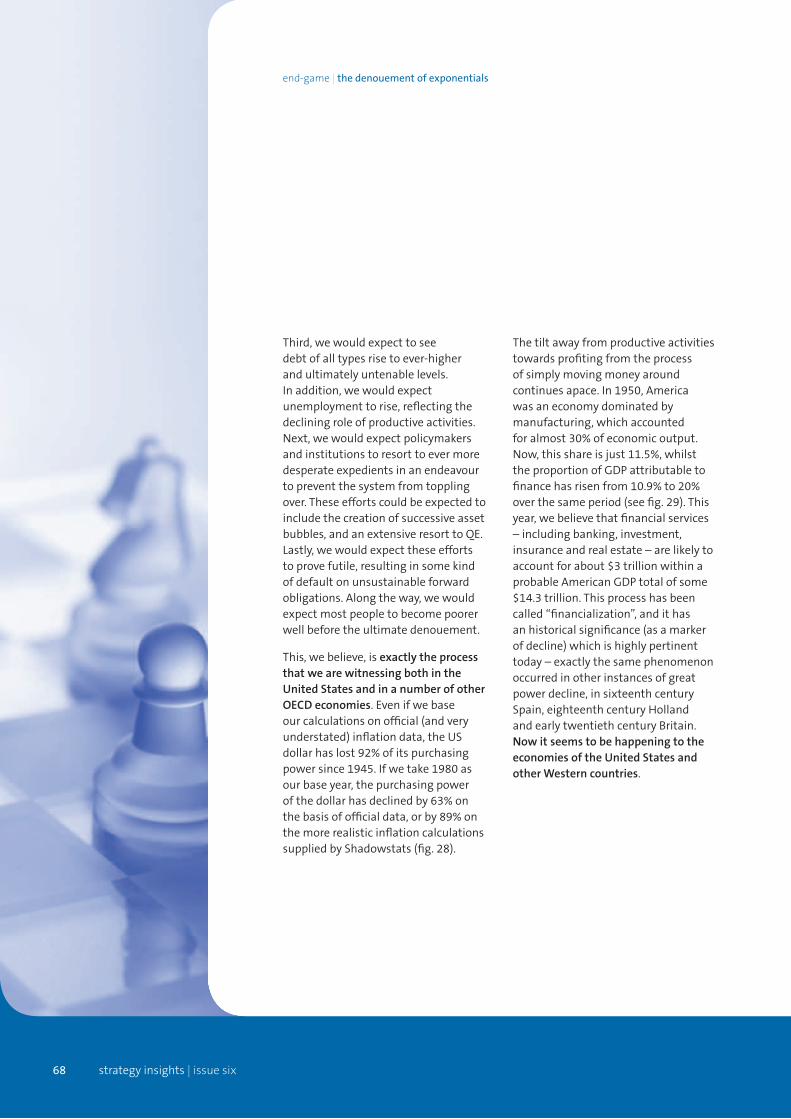
strategy insights | issue six68
end-game | the denouement of exponentials
Third,wewouldexpecttoseedebtofalltypesrisetoever-higherandultimatelyuntenablelevels.Inaddition,wewouldexpectunemploymenttorise,reflectingthedecliningroleofproductiveactivities.Next,wewouldexpectpolicymakersandinstitutionstoresorttoevermoredesperateexpedientsinanendeavourtopreventthesystemfromtopplingover.Theseeffortscouldbeexpectedtoincludethecreationofsuccessiveassetbubbles,andanextensiveresorttoQE.Lastly,wewouldexpecttheseeffortstoprovefutile,resultinginsomekindofdefaultonunsustainableforwardobligations.Alongtheway,wewouldexpectmostpeopletobecomepoorerwellbeforetheultimatedenouement.
This,webelieve,isexactly the process that we are witnessing both in the United States and in a number of other OECD economies.Evenifwebaseourcalculationsonofficial(andveryunderstated)inflationdata,theUSdollarhaslost92%ofitspurchasingpowersince1945.Ifwetake1980asourbaseyear,thepurchasingpowerofthedollarhasdeclinedby63%onthebasisofofficialdata,orby89%onthemorerealisticinflationcalculationssuppliedbyShadowstats(fig.28).
Thetiltawayfromproductiveactivitiestowardsprofitingfromtheprocessofsimplymovingmoneyaroundcontinuesapace.In1950,Americawasaneconomydominatedbymanufacturing,whichaccountedforalmost30%ofeconomicoutput.Now,thisshareisjust11.5%,whilsttheproportionofGDPattributabletofinancehasrisenfrom10.9%to20%overthesameperiod(seefig.29).Thisyear,webelievethatfinancialservices–includingbanking,investment,insuranceandrealestate–arelikelytoaccountforabout$3trillionwithinaprobableAmericanGDPtotalofsome$14.3trillion.Thisprocesshasbeencalled“financialization”,andithasanhistoricalsignificance(asamarkerofdecline)whichishighlypertinenttoday–exactlythesamephenomenonoccurredinotherinstancesofgreatpowerdecline,insixteenthcenturySpain,eighteenthcenturyHollandandearlytwentiethcenturyBritain.Now it seems to be happening to the economies of the United States and other Western countries.

strategy insights | issue six 69
Fig. 28: Crumbling? – the purchasing power of the dollar*
Purchasing power of the US dollar, 1980-2010
$1.00
$0.90
$0.80
$0.70
$0.60
$0.50
$0.40
$0.30
$0.20
$0.10
$0.00
1983
1985
1987
1989
1991
1993
1995
1997
1999
2001
2003
2005
2007
2009
$1.00
$0.38
$0.13
OfficialUnderlying
*Source:TullettPreboncalculationsbasedonofficialCPI-UandShadowstatsalternateCPIdata
Fig. 29: ‘Financialization’ – America swings from making to moving*
1950 1960 19901970 1980 2000 2008
30%
40%
10%
20%
0%
Manufacturing and finance shares of US GDP, 1950-2008
ManufacturingFinance
29.3%26.9%
23.8%
14.0%
20.0%
15.9%18.0%
16.3%14.5%
19.7%
11.5%
20.0%
10.9%13.6%
*Source:Economic Report of the President, 2010,tableB-12,andKevinPhillips,Bad Money,2009edition,page31

strategy insights | issue six70
end-game | the denouement of exponentials
Another‘denouementmarker’–anescalationinallformsofdebt–isextremelyvisible,againintheUSandinotherOECDcountries.Sowhatwearedescribingisan economy that is essentially “running on empty” – moving money around, borrowing, expanding the money supply, incurring huge debt obligations and mortgaging the future in an ever more frenetic attempt to maintain at least the illusion of the status quo in the face of underlying economic deterioration.
the first linkage – a weakening energy equation
Intheautumnof1941,whentheRooseveltadministrationfinallylostpatiencewithJapaneseincursionsintoIndo-China,theUSimposedanoilexportembargoonJapan.ThispresentedtheTokyogovernmentwithtwounpalatablealternatives–losefacebybackingdowninthefaceofpressurefromWesternerswidelyregardedinJapanasracists43,orstartawarthatmanyintheImperialhighcommandknewtobeunwinnable.Intheend,Japangambled,creatingtheultimateeuphemism–the“GreaterEastAsianCo-ProsperitySphere”–aspartofadashtosecureaccesstooilsuppliesfromtheDutchEastIndies.Togivetheprojecteventhefaintestchanceofsuccess,theUSbattlefleetat
PearlHarbor(andespeciallyitsaircraftcarriers44,thoughtheJapanesefailedtoappreciatethis)neededtobetakenout.Thecarriersweremissed(theywereatsea),amightyindustrialpowerhadbeenprovokedtoanger,andtheendresultwasneverinmuchdoubt.
Thoughthesailors,soldiersandairmenoftheUSandheralliesdefeatedtheJapanese,thewarwasreallywonbyindustrialmight.OilwasthebasisofAmerica’sindustrialmuscle–anarmymighthavemarchedonitsstomachinNapoleon’sday,butthemechanisedforcesofthemid-twentiethcenturywerepoweredbyoil,notjustatseaandintheairbutinthefactoriesandtheshipyardsthatmadevictorypossible.
Changesintheenergybalancecreateshiftsinglobalpower.Asenergypre-eminenceshiftedfromcoaltooil,theUnitedStates,withherthen-hugepetroleumsupplies,overtookBritainasthemajorindustrialpower,adisplacementthatBritaintriedunsuccessfullytoforestallbytryingtoparcelouttheMiddleEastbetweenherselfandFranceintheimmediateaftermathoftheFirstWorldWar.OilpoweredAmericanindustrial,economic,politicalandmilitarysuperiorityformuchofthetwentiethcentury.
ButdomesticoilproductionintheUnitedStateshasbeenindeclinesincetheearly1970s,andnowmeetsbarely40%ofAmericanrequirements(seefig.30).Since1970,USconsumptionofoilhasincreasedby62%,whilstproductionhasfallensteadilydespitemajorexplorationanddevelopmentinvestmentinAlaskaandtheoffshoreGulfofMexico.
Lastyear,Americaconsumed18.7mmb/dofoilandproducedonly7.2mmb/d,withthebiggestsharesofimportsbeingsourcedfromCanada,fromMexico(whereproductionisinrapiddecline),fromVenezuela(whosegovernmentistrenchantlyanti-American),fromWestAfrica(whereWesternoilcompaniesareinfiercecompetitionwithoil-hungryChineseplayers)and,ofcourse,fromtheperenniallyunstableMiddleEast.
Thefundamentalproblem,fortheUSasfortheotherOECDeconomies,isamassiveimbalancebetweenconsumptionandreservesofoil.Lastyear,theUSconsumed22%ofworldoilsuppliesonthebasisofjust2%ofreserves,whilstEuropeaccountedforafurther17%ofconsumptionyethasbarely0.5%ofglobalprovedreserves(fig.31).
43 Propaganda designed to reassure expatriate residents in British Singapore seems to bear out the accusation. British residents were informed that an invasion was improbable because the Japanese were baffled by complex
machinery, made their aeroplanes out of bamboo, and were prevented from flying at night by bad eyesight 44 USS Enterprise, Lexington and Saratoga

strategy insights | issue six 71
Fig. 30: Running out of gas? – the US petroleum balance, 1965-2009*
1965
1967
1969
1971
1973
1975
1977
1979
1981
1983
1985
1987
1989
1991
1993
1995
1997
1999
2001
2003
2005
2007
2009
20
25
10
5
15
0
75%
100%
25%
50%
0
US oil production, consumption and imports, 1965-2009
Imports (%, RH scale)ProductionConsumption
mm
b/d
*Source:BP Statistical Review of World Energy 2010
Fig. 31: Over a barrel #1 – shares of oil reserves and consumption, 2009*
United States European Union OECD China Russia Africa Other countries Middle East
40%
60%
20%
0%
Oil consumption and reserves, 2009
ConsumptionReserves
22%
2.1%
17%
0.5%
54%
7%11%
1.1% 3%6% 4%
10%
20% 20%
8%
57%
*Source:BP Statistical Review of World Energy 2010

strategy insights | issue six72
end-game | the denouement of exponentials
Onewaytolookattheoil-economyequationistostateAmericanincomenotindollarsbutinbarrelsofoil,assetoutinfig.32.Inthiscalculation,USpercapitaGDPforeachyearisdividedbytheoilpriceprevailingatthattime.Forexample,percapitaGDPin1970was$5,090andthepriceofoilwas$1.80perbarrel,sopercapitaincomeequatedto2,828barrels.
Duringtheoilcrisesofthe1970s,thesoaringpriceofcrudeoilreducedthisnumbertojust361barrels.Bytheendofthe1990s,theequationhad
improved,thoughnottothe1970leveleveninthespikeyearof1999(whensharpfallsinoilpricespushedthenumberupto2,507barrels).Despiteasmallrespitein2009–whenslackdemandreducedoilprices–thetrajectorysince1999hasbeenrelentlesslyadverse.
Thistypeofcalculationdoesnottellthewholestory,forwhichtwoothercriticalfactorsneedtobetakenintoaccount.First,andincontrasttothenot-too-distantpast,Americanowcontrolsonlyasmallproportionof
globaloilsupplies,andthiscanbeexpectedtodeclinefurtherinthefuture.Second,andasestablishedearlier,absolutevolumesofoil(orofanyotherformofenergy)arenotthecriticalissue,whichisthe relationship between energy extracted and energy consumed in the extraction process(EROEI).IntheUS,thisequationhasweakenedsuccessivelyas‘easy’sourcesofoilhavebeendepletedandhavebeensupplantedbyfieldswhicharecostlier(inenergyaswellasinmonetaryterms)toproduce.
Fig. 32: Over a barrel #2 – US income measured in barrels of oil*
0
1945
1947
1949
1951
1953
1955
1957
1963
1959
1961
1965
1967
1969
1971
1973
1975
1977
1979
1981
1983
1985
1987
1989
1991
1993
1995
1997
1999
2001
2003
2005
2007
2009
2,828
361
2,507
753
3,000
2,500
2,000
1,500
1,000
500
US GDP per capita expressed in barrels of oil, 1945-2010
Per capita GDP in bbls
*Source:USCensusBureau,BureauofEconomicAnalysis&BP Statistical Review of World Energy 2010,andTullettPrebonestimates
strategy insights | issue six 73
Ofcourse,American(andbroaderWestern)EROEIhasbeendeterioratingformanydecades,buttwogeopoliticalchangeshavetightenedthescrew.ThefirstofthesehasbeenlossofWesterncontroloversourcesofoil.Priorto1960,productionofoilincountriessuchasSaudiArabia,IraqandIranwascontrolledbyWesterncompanies,principallytheso-called“SevenSisters”.ThesecompaniesextractedcheapoilintheMiddleEastandelsewhereandshippedittoberefinedathomefortheirdomesticmarkets.Asaresult,any weakening in the domestic EROEI was cancelled out by access to high EROEI sources overseas.Thisadvantagedpositionwasundercutbytheprocessesfirstofindependenceandlatterlyofnationalisation.
Second,thereare,increasingly,competingpurchasersforhighEROEIenergysupplies,principally(butbynomeansonly)inAsia.TheproblemposedbyAmerican(andEuropean)energydependencyisamuch-discussedtopic,butthe role of exponential energy in leveraging the economyhasnotbeenproperlyunderstoodbecausecertainkeylinkageshavebeenneglected.
Inshort,then,the US economy was for many decades an economic powerhouse partly because of American access to high EROEI energy supplies from both domestic and foreign sources.Asthisadvantagedpositionhaseroded,theleveragingeffecthasbeenundermined.
AwarenessofAmerica’spetroleumvulnerabilityhasledmanyobserverstobelievethattheinvasionofIraqwasmotivatedbyadesiretotakeoverthatcountry’shugepetroleumreserves.Ourinterpretationisthatoilwasindeedcritical,butthattheexplanationissomewhatmorenuancedthanasimple‘resourcegrab’,andhasadirectbearingoneconomicpolicy.
Intheyearspriorto2003,SaddamHusseinhadbeenundertakingastrategywhich,ifithadbeenimplementedsuccessfully,couldhavehadseverelyadverseimplicationsfortheAmericaneconomy.Essentially,SaddamwasofferingaccesstoIraqioiltocompaniesfromChina,RussiaandFrance,withtwoprincipalobjectivesinview.First,hewantedthesecountriestohaveavestedinterestinlifting
UNsanctionsonIraqioilexports.Second,andevenmoresignificantly,heplannedtopriceIraqioilin a currency other than American dollars(probablyineuros).
ThestatusofthedollarastheglobalreservecurrencyisvitaltotheUS,andhaslookedvulnerableforanumberofyears.ReservestatuseffectivelyallowsWashingtontoissuedebtsandtogrowthemoneysupplywithoutprovokingasharpdeclineintheinternationalvalueofthedollar.Ifthedollarwereevertoloseitsreservestatus,itsvaluecouldbeexpectedtofallsharply,triggeringveryhighinflationwhilstmassivelyunderminingAmerica’sinfluenceintheglobaleconomy.AsgrowingUSindebtednesshasputthedollar’sreservestatusunderevergreaterpressure,the‘petroleumprop’–theroleofthedollarasthecurrencyinwhichoilistraded–hasbecomesuccessivelymoreimportant.This,webelieve,mayhavepromptedtheBushadministrationtoseektopreventIraq’sgovernmentfrominvitingcompetitorparticipationandsimultaneouslyweakeningtheoilmarketroleofthedollar.

strategy insights | issue six74
end-game | the denouement of exponentials
the second linkage – reckless finance
Ononeofthetwodimensionsoftheexponentialsequation–energyleverage–itseemsclearthattheUnitedStatesandotherWesterncountriesarebeingadverselyaffectedbyalossofaccesstopremium(thatis,highEROEI)sourcesofenergy.ThattheUSisalsobecomingavictimoftheotherexponentialprocess–thatofanexcessaccumulationofunsustainableforwardobligations–seemsequallyclear,mostobviouslyinthetrulymassivescaleofformalandinformaldebtsaccumulatedbyindividuals,businessesandgovernment.
Totalcreditmarketdebt–includingthatportionofFederaldebtowedtothepublic–totals350%ofGDP.Inaddition,wehaveidentified–usingofficialsourcesofdata–afurther$61.8trillionofobligations,whichtakesthecombinedtotalto$112trillion,or770%ofGDP.Thisnumbercompareswith$50.9trillionnineyearsago($24.6trillionofcreditmarketdebtplus$26.3trillionofFederaloff-balance-sheetliabilities).Overthatperiod,therefore,aggregateindebtednesshasincreasedby9.1%annually,whereasthegrowthratefornominalGDPhasbeen4.3%.
Thisdescribesasituationwhichlookstobetoallintentsandpurposesoutofcontrol.Whyhasithappened?
Essentially,twofactorshavebeenatworkhere.First,profitingfromthesimpleprocessofmovingmoneyaroundhasgrowninpartbecauseofthedecliningrealproductivityofaneconomysqueezedbyasharpdeteriorationinavailableEROEIs.
Second,the US–likeanumberofotherWesterncountries,mostnotablytheUK–has bought into recklessly excessive deregulation.Itisbynomeanscoincidentalthatthe‘financialization’oftheUSeconomyhasacceleratedinapost-Glass-Steagallerainwhichmassiveintegratedfinancehouseshavecreatedinstruments(suchasMBSs45)whichhaveoutpacedthecapabilitiesofaregulatorysystemwhichhasitselfbeengivenlowpriorityinapoliticalsystemexcessivelyattachedto–toborrowaBritishphrase–“light-touch”regulation.
Thesystemhaspusheda relentlessly consumerist ethos–toparaphraseDescartes,“IbuythereforeIam”–andhassimultaneouslyusedlowinterestratestomakeavailableconsumerfinanceonseeminglyattractiveterms.Legislationhasbeenpassedwhichtightenscreditcardcompanies’holdoverdebtorstoanextentthatatleastoneAmericanobserverhaslikenedtoindenturedlabour.
Inshort,Americahasindulgedinadebtbingewhich,whilstaddinghugelytotheburdensofmedianearnerswhoserealearningshavebeendeclininganyway,hasbenefitedonlyatinyminorityoftheveryrich.Thisisthe‘WallStreetversusMainStreet’divergencewhichMrObamapromisedtoaddress,buthasbeenabletodopreciouslittleabout.
Inhisfarewelladdress46,PresidentEisenhowertoldAmericansthatthey“mustguardagainsttheacquisitionofunwarrantedinfluence,whethersoughtorunsought,bythemilitary-industrialcomplex”.Perhapsheshouldhavewarnedinsteadabouta“credit-industrialcomplex”,becausethatiswhattheUnitedStatesnowhas.
Theintellectualunderpinningforthisprocesshasbeenthelaissez-faire,monetaristphilosophysometimesalsocalled‘theWashingtonconsensus’.Webelievethatanysystemicextreme(suchasexcessivestatecontrol,excessivesocialismorexcessivetheocracy)canproveextremelydamaging.Unbridledfreemarketeconomics,bydrivingacultureofgreedandshort-termism,hasexposedtheUS(andmanyotherWesterncountries)tothedenouementofexponentials.
45 Mortgage-Backed Securities46 17th January 1961

strategy insights | issue six 75
Onequestionremains–whathappensnext?Isanexponentials-drivencollapseinevitable,orcanpolicymakerscraftasuitableresponse?
avoiding disaster – can we break the linkages?
Thusfarinthisreport,wehaveexplainedourviewthattheWesterneconomiesareinthegripofexponentialsprocessesthatareweakeningtheenergyleverageequationwhilstbuildingunsustainabletendenciesintothefinancialsystem.Thissituationisnotirremediable,solongasitisrecognisedthatfundamentalchangeisinevitable,that‘businessasusual’isnotanoption,andthateconomicandsociallifeastheWesthasknownthemformorethanacenturyarenolongersustainable.
Changethatisnotunderstoodcannotbemanaged,andchangethatcannotbemanagedcanbeextraordinarilyunpleasantanddisruptive.Whatfollowscanatbestbeasetofoutlinepolicysuggestions.
Firstandforemost,weneedtounderstandthatneither Keynesian demand management nor free-market laissez-faire economics is an effective management tool for the future.Bothareoutdated.Thefreemarketassumptionsof‘theWashington
consensus’werediscreditedduringthe2008-09crisis,evenifpolicymakersandvestedinterestsareunableorunwillingtorecognisethisfundamentalchange.Atthesametime,areversiontopre-1980sKeynesianmanagementisnotanoption,sincewhatisrequirednowisfundamentalchange,notsimplythemorecompetentmanagementoftheexistingsystem.Instead,whatisneededisthedevelopmentofawhollynewapproachtoeconomicissues.Inshort,weneedanewdiscipline–exponential economics.
Forthistohappen,weneedsomethingmorethananunderstandingofexponentialissues,imperativethoughthatis.Twoessentialtoolsarerequiredifthenewdisciplineofexponentialeconomicsistoinformamoreaccuratereadingoftheoutlook.
Thefirstofthesetoolsisaneffectivecalibrationofthe critical economic equation,whichisEnergyReturnOnEnergyInvested(EROEI).Agreatdealofinterestingworkhasbeendoneonthisissueinacademiccircles,butthisnowneedstogomainstream,withagreedmethodologiesandconsistentcalibration.RichardFeynmanoncereferredto“theidiocyofallthedifferentunitswhich[physicists]useformeasuringenergy”47Suchvaguenessisnolongeraffordable.
Atthesametime,thereisahugeneedfordatawhichisbothreliable(inthatitisaccurate)andsuitable(inthatitusestheultra-longtimescaleswhichareimperativeforanunderstandingofexponentials).Thereisanurgentneedforthecreationofaneconomicdatabasewhichprovidesexponentialeconomistswithdatawhichisbothlong-termandfreefromPollyannadistortions.
Inbothareas,webelievethatacombinationofprivatesectorandgovernmentwillprovethebestroutetotheprovisionofthisessentialintellectualandinterpretativeresource.
Bothprivateenterpriseandgovernmentinstitutionshaveastrongvestedinterestindevelopingtheessentialtoolsforanunderstandingofthisrevolutionaryapproachtoeconomicinterpretation.Ifwearerightabouttheinterpretativemeritsofexponentialeconomics,itcanprovideinvestorsandcorporatemanagerswithacompetitiveedgebecauseitoffersabasisforinterpretationandpredictionwhichisfarsuperiortoanythingelseavailable.Astheprocessofchangeaccelerates,policymakershaveanimperativeneedtoaccesstheinsightsthatexponentialeconomicscanprovide.
47 Richard Feynman, The Character of Physical Law, 1964
end-game | the denouement of exponentials
strategy insights | issue six76
Specifically,itisevidentthatinflationrepresentsahugethreatgoingforwards.Inflation is implicit in printing money, and is likely to impact the economic system as soon as the velocity of money recovers.Inanycase,inflationislikelytobecomeunstatedpolicy,asdevaluationistheonlyway(shortofoutrightdefault)inwhichexcessiveformaldebtscanbeeliminated.
Together,acceleratinginflationandresourceconstraintimplysteady rises in the values of physical commodities,mostnotablyintheenergyfield.Somecountries(suchasChina)alreadyrecognisethistrend,andcanbeexpectedtouseeveryefforttoconverttheirdevaluingcurrency(andespeciallydollar)holdingsintophysicalresources.
Whilstinflationcanerodetherealvalueofformaldebts,itcannotworkthesamealchemyforinformalobligationssuchasfuturewelfarepayments.Thesefutureobligations,whicharealreadyimpossiblylarge,aresettoworsenastheboomergenerationretires.Governments need to come clean on the fact that the delivery of benefits promised for the future has become impossible,andwouldbelikelytoremainsoeveniftaxesweretorisedramatically.Meanwhile,acombinationofdemographicchangeandweakeningproductivity–thelatterdrivenbyadeterioratingenergyleverageequation
–meanthatsomecurrentwelfaresystemsarenolongeraffordable,mostnotablyinEurope.
Aftertheeventsof2008-09,itshouldhardlyneedtobeexplainedthatafinancialsystemwhichhasbeenfreetogeneratesequentialassetbubblesneedstobecurbed,bytighterregulationoverproductssuchasmortgagesandthroughspecificmeasuressuchasthereintroductionofabsoluteseparationbetweenretailandinvestmentbankingactivities,thekindofseparationthatwasimposedbytheUSGlass-SteagallActbetweenitsintroductionin1933anditsdisastrousrepealin1999.
One of the delusions that the West needs to rethink is globalisation.ThefirstorganisationstoquestionthisprocesswereUSlabourunions–whichfeared,quiterightly,thatitwasamechanismforexportingAmericanjobs–butthereisalotmoretoitthanthat.CertainemergingeconomiesareexploitingtheglobalisationprocessbymanipulatingtheircurrencieswhilstatthesametimeoperatingtariffsystemsexpresslydesignedtoinhibitexportsfromOECDcountries.This process not only enriches the emerging countries at the expense of the OECD economies, but also hollows out Western nations’ economic structures by destroying their indigenous manufacturing industries.
Studentsofeconomicsareroutinelyinstructedthatfreetradeis“good”becauseitmakeseveryonericherthroughoptimisationoftheircapabilities,butthisisthetypeofpurelytheoreticalinterpretationthatgetseconomistsabadname.“Freetradetheory”,JohnWilliamsexplains,“assumesallinvolvednationsareatfullemployment.Whenthatisnotthecasethewealthiestandhighestsalariedcountriesendupwithadecliningstandardoflivingandredistributingtheirwealthtotheotherfree-tradeparticipants,asisthecurrentcircumstancefortheUnitedStates”48.
Inthelongerterm,exponentialsanalysisindicatesthattheentireWesternconsumeristethos,withitsresourceprofligacyanditsshort-termism,isnolongersustainable.Beforethatpointarrives,however,thereisanimperativeneedtorethinkourfinancialinstitutionsandourtraderelationswhilstdevelopingtheintellectualanddataresourcesneedediftheWestistounderstandandtomanagethedenouementofexponentials.
48 John Williams, Gross Domestic Product, briefing paper, Shadowstats.com

Disclaimer
The information in this communication is provided for informational and demonstrational purposes only and neither is it intended as an offer or solicitation with
respect to the purchase or sale of any security nor should it serve as the basis for any investment decisions. In the UK, this material is intended for use only by persons
who have professional experience in matters relating to investments falling within Articles 19(5) and 49(2)(a) to (d) of the Financial Services and Markets Act 2000
(Financial Promotion) Order 2005 (as amended), or to persons to whom it can be otherwise lawfully distributed.
Any reference to ‘Tullett Prebon’ refers to Tullett Prebon plc and/or its subsidiaries and affiliated companies as applicable.
Neither Tullett Prebon plc, nor any of its subsidiaries (collectively, “Contributors”) guarantees the accuracy or completeness of the information or any analysis based
thereon. Neither Tullett Prebon plc nor Contributors make any warranties, express or implied, with respect to the information (including without limitation any
warranties of merchantability or fitness for particular purposes) and neither Tullett Prebon plc, nor Contributors shall in any circumstances be liable for economic
loss or any indirect, or consequential loss or damages including without limitation, loss of business or profits arising from the use of, any inability to use, or any in
accuracy in the information.
Tullett Prebon provides a wholesale broking service only. It does not provide services to private clients. Tullett Prebon (Securities) Limited and Tullett Prebon (Europe)
Limited are authorised and regulated by the Financial Services Authority (“FSA”).
This publication is produced and distributed in accordance with ‘COB 12.2 – Investment Research’ of the FSA Handbook. Recipients should note that all such
publications are objective and impartial in their content unless clearly notified otherwise. The author(s) act in accordance with Tullett Prebon’s ‘Conflict Management
Policy’, full details of which can be viewed on our website at www.tullettprebon.com.
TPSI 006 | November 2010

Tullett Prebon Group Ltd
155 BishopsgateLondon EC2M 3TQ
Tel: +44 (0)20 7200 7000Fax: +44 (0)20 7200 7176www.tullettprebon.com