Chapter 2. The contribution of conversion to organic food ...

South Dakota State University South Dakota State University
Open PRAIRIE: Open Public Research Access Institutional Open PRAIRIE: Open Public Research Access Institutional
Repository and Information Exchange Repository and Information Exchange
Electronic Theses and Dissertations
2017
Encouraging Organic Agriculture: The Effects of Conversion Encouraging Organic Agriculture: The Effects of Conversion
Subsidies Subsidies
Sarah Adams Inkoom South Dakota State University
Follow this and additional works at: https://openprairie.sdstate.edu/etd
Part of the Agricultural Economics Commons, and the Economics Commons
Recommended Citation Recommended Citation Adams Inkoom, Sarah, "Encouraging Organic Agriculture: The Effects of Conversion Subsidies" (2017). Electronic Theses and Dissertations. 1214. https://openprairie.sdstate.edu/etd/1214
This Thesis - Open Access is brought to you for free and open access by Open PRAIRIE: Open Public Research Access Institutional Repository and Information Exchange. It has been accepted for inclusion in Electronic Theses and Dissertations by an authorized administrator of Open PRAIRIE: Open Public Research Access Institutional Repository and Information Exchange. For more information, please contact [email protected].

ENCOURAGING ORGANIC AGRICULTURE: THE EFFECTS OF CONVERSION
SUBSIDIES
BY
SARAH ADAMS INKOOM
A thesis submitted in partial fulfillment of requirement for the
Master of Science
Major in Economics
South Dakota State University
2017


iii
ACKNOWLEDGEMENTS
I wish to express my sincere and absolute gratitude to God Almighty, who has been
my constant hope and light in fulfilling this dream. I also want to extend my appreciation
and special thanks to Dr. Evert Van der Sluis, my thesis advisor. Dr. Evert’s, guidance was
the highlight in the successful completion of this thesis. I also wish to thank Dr. Larry
Janssen who from the onset guided me in identifying a thesis topic. Thanks also goes to
Dr. Wang Zhiguang and Dr. Nicole Klein, for accepting to be on my thesis committee. I
am also grateful to Dr. Cempellin Leda the graduate faculty representative on my thesis
committee, for accepting to take on that responsibility. Not forgetting all my colleagues,
friends and family who provided their support and encouragement throughout my study
here at South Dakota State University (SDSU).
Finally, my sincere appreciation goes to all faculty of the Economics Department
of SDSU for the knowledge and training I received from them.
This thesis is dedicated to my mother who believes in my dreams and aspirations in life.

iv
TABLE OF CONTENTS LIST OF FIGURES........................................................................................................................vi
LIST OF TABLES........................................................................................................................vii
LIST OF APPENDICES..............................................................................................................viii
ABSTRACT...................................................................................................................................ix
CHAPTER 1: BACKGROUND OF STUDY.................................................................................1
1.1 Problem Statement..........................................................................................................4
1.2 Objectives........................................................................................................................4
1.3 Justification.....................................................................................................................5
1.4 Organization....................................................................................................................5
CHAPTER 2: LITERATURE REVIEW.........................................................................................7
2.1 An Overview of the Organic Agriculture Sector.............................................................7
2.2 Forces Stimulating Organic Agriculture..........................................................................9
2.3 Subsidies.......................................................................................................................11
2.4 Collaborations with Private Entities..............................................................................12
2.5 Market Incentives..........................................................................................................13
2.6 Push Factors Associated with Moving to Organic Agriculture.....................................14
2.7 Inhibiting Factors for Organic Agriculture....................................................................15
2.7.2 Low Profitability.......................................................................................................17
2.7.3 Lack of Marketing Infrastructure..............................................................................18
2.11 Lack of Organic Knowledge.........................................................................................19
2.12 Lack of Institutional Support.........................................................................................19
2.8 Conclusion.....................................................................................................................20
CHAPTER THREE: METHODOLOGY......................................................................................21
3.1 The Adoption Decision.................................................................................................21
3.2 Empirical Model and Estimation...................................................................................22
3.3 Modelling the Impact of Subsidies on the Adoption of Organic Agriculture................23
3.4 The Utility Difference Model........................................................................................24
3.5 Indirect Utility Function................................................................................................25
3.6 Variables.......................................................................................................................26
3.7 Hypotheses....................................................................................................................30
CHAPTER 4: DATA AND DESCRIPTIVE ANALYSIS............................................................33
4.1 Global Importance of Organic and Sustainable Agriculture..........................................33

v
4.2 Global Organic Demand and Supply.............................................................................33
4.3 Trends in Organic Agriculture.......................................................................................35
4.4 Data...............................................................................................................................37
4.5 Main Sources of Data....................................................................................................38
4.6 Geographical Area Considered......................................................................................38
4.7 Acreage Size..................................................................................................................39
4.8 Farm Size......................................................................................................................40
4.9 U.S. Organic Market Forces..........................................................................................42
4.10 Subsidies/ Cost of Production.......................................................................................44
4.11 Certified Organic Programs...........................................................................................49
CHAPTER 5: ANALYSIS AND RESULTS................................................................................52
5.1 Introduction...................................................................................................................52
5.2 Results for Diagnostic Test...........................................................................................52
5.3 Results from Stationarity Test...................................................................................52
5.4 Results from Residual Correlation Matrix.................................................................52
5.5 Results for Multicollinearity......................................................................................53
5.6 Results for Heteroscedasticity...................................................................................53
5.2 Empirical Findings........................................................................................................54
CHAPTER 6: SUMMARY OF FINDINGS AND CONCLUSION.............................................63
6.1 Summary of Key Findings and Conclusions.................................................................63
6.2 Conclusions...................................................................................................................65
6.3 Limitations of the Study................................................................................................67
6.4 Recommendations.........................................................................................................67
REFERENCES..............................................................................................................................68

vi
LIST OF FIGURES Figure 1: Organic Agriculture As A Subset Of Sustainable Agriculture ............................ 9
Figure 2: Flow Diagram Showing Possible Sequence To Achieving Organic Status. .... 17
Figure 3: U.S. organic food retail sales ............................................................................ 34
Figure 4: Organic Corn, Wheat And Soybean Acreage Trends From 2002 To 2014 ...... 37
Figure 5: States In The Study Area –North Central States ............................................... 39
Figure 6: Study Area Acreage Size Analysis .................................................................... 40
Figure 7: Organic Farm Size ............................................................................................. 41
Figure 8: Proportion Of Sales By States, 2002-2014 ........................................................ 43
Figure 9: Organic Food Sales In The United States From 2000 To 2014 ........................ 44
Figure 10: Mandatory Spending On Organic Agriculture, 2002-2014 ............................. 46
Figure 11: Trends In Environmental Quality Subsidies ................................................... 47
Figure 12: Federal Subsidies ............................................................................................. 48
Figure 13: Organic Conservation Technical Assistance Program .................................... 49
Figure 14: Certified Organic Program 2002-2014 ............................................................ 51

vii
LIST OF TABLES Table 1: Description of the Variables............................................................................................27
Table 2: Descriptive Variable Statistics........................................................................................30
Table 3: Trends in U.S. Top Leading Organic Crops....................................................................36
Table 4: Study Area Summary Statistics, 2014.............................................................................42
Table 5: Summary Statistics of Independent Variables.................................................................56
Table 6. Model 1: Regressing the Adoption Of Organic Agriculture On Fedsub As Main Subsidy
.......................................................................................................................................................58
Table 7. Model II: Regressing the Adoption of Organic Agriculture On Equipfund as Main
Subsidy..........................................................................................................................................60
Table 8. Model III Regressing Adoption of Organic Agriculture On Otcap as Main Subsidy……62
Table 10. Trade-Offs Between Adoption Level and Other Variables to Hold Probability
of Subsidy Requirement Constant ……………………………………………………....65
Table 11. Results of Hypothesis Testing ………………………......................................66

viii
LIST OF APPENDICES
Appendix I: Model 1 test for multicollinearity ………………………………………….74
Appendix II: Model 2 test for multicollinearity …………………………………………74
Appendix III: Model 3 test for multicollinearity ………………………………………..75
Appendix IV: Correlation Matrix ……………………………………………………….75
Appendix V: Regressing the Adoption of Organic Agriculture on All Subsidies…….....76

ix
ABSTRACT
ENCOURAGING ORGANIC AGRICULTURE: THE EFFECTS OF CONVERSION
SUBSIDIES
SARAH ADAMS INKOOM
2017
This thesis examines the importance of conversional subsidies in accounting for an increase
in organic acreage in the 12 North-Central States in the United States. Monthly time series
data that spans from January 2002 to December 2014 was used in the analysis. Empirical
evidence suggests that increase in organic acreage is due in part to the availability of
conversion subsidies. Without government assistance, most small-scale farmers are not
sufficiently motivated to switch to organic production due to the high initial costs involved
in transitioning. Further, increased institutional support could facilitate organic adoption
and its absence is detrimental to increasing the rate of adopting organic production
methods.
Key words, NOSB, NOP, USDA, ARMS, organic, acreage, subsidies, certified farmers,
transitioning cost.

1
CHAPTER 1: BACKGROUND OF STUDY
U.S. agricultural sustainability may be improved by way of various innovative approaches,
one of which includes organic agriculture. In accordance with the National Organic
Standards Board (NOSB), “organic agriculture is an ecological production management
system that promotes and enhances biodiversity, biological cycles and soil biological
activity. It is also based on minimal use of off-farm inputs and on management practices
that restore, maintain and enhance ecological harmony.” Under organic cropping systems,
the fundamental components and natural processes of ecosystems such as soil organism
activities, nutrient cycling, and species distribution and competition are used as farm
management tools (Greene and Kremen, 2003). Others authors such as Watson et al. (2007)
are of the opinion that organic agriculture is distinct from conventional agriculture because
of its alternative agricultural practices, worldview, and values.
Despite long and complicated processes and practices involved with moving toward
production systems based on organic agriculture, the adoption of an organic approach to
producing agricultural products has been on the rise over the past decades. In particular,
organic agriculture has grown substantially since emerging in the 1940s, as measured by
the area of certified lands, organic programs, and the organic farmland acreage. For
instance, cropland acres devoted to organic production methods increased from 1.3 acres
to 3.7 acres between 2002 and 2014 (McBride et al. 2015). In addition, consumption of
organic food has risen by double digits annually, as the public demands increasing amounts
of organic fruits and vegetables from Whole Foods, Wal-Mart, and other retailers and
farmers’ markets (Haedicke, 2016).

2
Some researchers have analyzed the motivations for the adoption of organic
systems. For example, Fairweather (1999) found that most Midwestern organic farmers
use organic methods out of concern for their own health, their families and their livestock.
An additional reason for the popularity of organic agriculture is its limited use of resources
and the absence of the use of synthetic nitrogen. The latter can have negative environmental
consequences when overused, such as pollution of groundwater and waterways. Organic
farming methods often require additional manual work on the farm, but reduce farm
workers’ exposure to pesticides and other chemicals. While economic concerns are
important, they are not always the main reasons farmers choose an organic approach.
Researchers such as Rigby and Cáceres (2001) identified other reasons, including concerns
about soil degradation, marketing and market incentives, and lifestyle choice (ideological,
philosophical or religious) as motivating factors for farmers in their conversion decision-
making process.
Dobbs and Pretty (2000) showed that key factors contributing to the increase in the
number of organic crop acres include the existence and availability of government policies
and subsidies. They documented that government policies and private conversion
incentives such as cost-sharing transition expenses, supporting research and extension,
assisting in market development and ensuring the quality of organic certification have been
effective factors in encouraging farmers to switch to organic production methods. In
addition, targeted subsidies may help enable farmers gain the financial ability to transition
to organic production and thereby reduce their reliance on agricultural chemicals.
Distinguishing between farmers who do and those who do not require conversion subsidies
may help evaluate which policies encourage such conversions and which ones offset one

3
another. This will provide a foundation for decision makers for comparing transition costs
related to management and yield, and will help farmers make sound decisions regarding
risk management practices. The positive effects of conversion subsidies and other policies
on the transition from conventional toward organic agriculture suggest that, vice versa, the
absence of favorable policy instruments could hinder the adoption of organic systems.
Hence, quantifying the effects of the (lack of) incentives may aid policy makers in
designing appropriate policies to encourage conversion and in identifying market-based
policies that could have similar effects as subsidies, but with less interference.
The demand for organic products is linked in part to the perception among some
consumers that organic food is more healthful than food produced based on conventional
agricultural production methods. In addition to the personal health benefits that some
consumers associate with consuming organic products, social considerations are a driving
force of the purchasing behaviors among consumers. MacRae et al. (2007) conducted a
study in Ontario, and found that organic farmers are less dependent on off-farm income
and they appear to be more involved in direct marketing than their conventional
counterparts. The authors further stressed that direct marketing is closely connected to
community involvement. The authors also found that organic agriculture practitioners had
a greater capacity to mobilize community resources for local development than did farmers
using conventional production techniques, including relatively larger degrees of active
participation in local government, and comparatively higher levels of new community
economic development structures and new businesses creation.
Another set of reasons for the increase in the adoption of organic agriculture
includes the consistent support organic farmers receive as compensation for possible losses

4
they may face in the first three years of transitioning, the availability of organic price
premiums, the adequacy of technical advice and knowledge, as well as a general
environmental awareness of organic systems which are gaining recognition worldwide. For
instance, farmers committed to soil conservationist may be more willing to adopt organic
agriculture than other farmers because they share positive attitude and motivation regarding
improving soil quality and limiting soil erosion.
1.1 Problem Statement
While there appears to be agreement in the literature that favorable subsidies and high
market demand affect the adoption of organic systems, few studies have examined the
barriers to acquiring these subsidies and their role in hindering the transition from
traditional to organic agriculture. Thus, a critical research question is whether conversion
subsidies provide farmers with sufficient incentives to switch to organic production while
maintaining levels of profitability comparable to those achieved using conventional
production methods. In addition, the literature provides little information on the
relationship between the availability of market information, training and management
systems and farmers’ decisions to convert their operations to organic production. Against
this background, this study seeks to examine the role of conversion subsidies in
encouraging farmers to switch their operations to using organic agricultural practices.
1.2 Objectives
The broad objective of this study is to examine the importance of conversional subsidies
in accounting for an increase in organic acreage in the United States over the past decades.
The specific objectives of this thesis are to analyze:
Ø whether favorable conversion subsidies are positively related to farmers’ decisions

5
on whether to switch to organic production,
Ø various persistent barriers that may keep farmers from switching to organic
agricultural production,
Ø market demand forces that incentivize farmers to transition to organic production,
and
Ø environmental sustainability challenges of organic production practices.
1.3 Justification
The use of subsidies can help farmers gain the financial ability to transition toward
organic production and shift toward reduced and no-chemical production systems.
Therefore, the results of the study will be of importance to farmers interested in practicing
organic farming, but also to consumers, and other actors in the organic production sector,
as well as researchers concerned with organic production practices. By distinguishing
between farmers requiring such subsidies to convert to organic production and those who
do not, it may be possible to evaluate which policy variables offset or reduce transition
effects and which ones encourage the conversion to organic methods. This will provide a
foundation for decision makers in considering transition costs related to production and
risk management practices associated with sustainable and organic farming in the United
States.
1.4 Organization
This thesis is organized in six main chapters. Chapter 2 includes a review of empirical and
theoretical literature on the adoption of organic agriculture practices, and is divided into
three sections. The first section contains an overview of the organic agriculture sector. The
second deals with market incentives and policy instruments affecting the organic

6
agriculture sector in the United States, including subsidies designed to smoothen the
transition to organic agriculture, and pull and push factors affecting the adoption of organic
agriculture. The final section provides a discussion of outcomes from previous studies
related to the adoption of organic agriculture.
Chapter 3 discusses the research design, methodology, and variables used in the
research. This chapter discusses the theoretical model, empirical model estimation,
variables used in the analysis, descriptive statistics, and analytical methods used.
Chapter 4 introduces the data analysis procedures and summarizes important trends
of the organic agriculture sector. The final section of this chapter discusses projected
increases in the adoption of organic agriculture production methods and the linkage
between farmers’ past and future decisions regarding the adoption of organic agriculture
practices. Chapter 5 contains a discussion of findings associated with the study’s
objectives. The chapter also includes a description of the regional distribution of the
subsidies, and examines the reasons for the increase in organic agriculture adoption.
Chapter 6 contains an investigation of determinants of organic agriculture adoption.
The chapter also provides a discussion of modeling procedures, and reports the results of
the regression models. The final section of this chapter provides the main findings of the
discussed models, and contains a summary, limitations, conclusions, and recommendation
of the study.

7
CHAPTER 2: LITERATURE REVIEW
This chapter contains a review of the relevant literature on subsidies and policies affecting
the adoption of organic production methods. The chapter is divided into three sections. The
first gives an overview of the organic agriculture sector that includes information on the
following: conversion policies that seek to motivate farmers to transition to organic
farming, barriers to transitioning to organic farming, market forces shaping organic
agriculture, and environmental sustainability benefits of practicing organic farming
practices. The second section provides a discussion of utility maximization and product
characteristics incorporating the decision to switch to organic production methods, while
the third looks at the empirical literature concerning organic agriculture.
2.1 An Overview of the Organic Agriculture Sector
“Certified Organic” is a labelling term that indicates that the agricultural products were
produced by way of approved methods that integrate cultural, biological, and mechanical
practices that foster cycling of resources, promote ecological balances, and conserve
biodiversity (ERS-USDA, 2001). In the Unites States, the National Organic Program
(NOP) provides the federal regulatory framework governing organic food. In addition, the
Organic Food Production Act of 1990 required that the USDA develop national standards
for organic products (Ellsworth, 2001).
According to Kassam et al. (2009), sustainable agriculture is a way of growing or
raising food in an ecologically and ethically responsible manner. This includes adhering to
agricultural and food production practices that do not harm the environment. Such systems
must be resource-conserving, socially supportive, commercially competitive and
environmentally sound. Due to this, organic agriculture holds a special place under the

8
sustainable agriculture umbrella, since it embodies most of the qualities of sustainable
agriculture. For instance, USDA organic standards seek to ensure that the production of
organically-produced food preserves natural resources and biodiversity, supports animal
health and welfare, does not use genetically modified ingredients, and does not use
livestock feed additives.
Reganold and Wachter (2016) found that organic agriculture has an important role
in producing an adequate and sustainable global food supply. The authors reviewed
hundreds of published studies on organic agriculture which provided evidence that organic
farming can produce sufficient yields, be profitable for farmers, protect and improve the
environment, and is safe for farm workers, as illustrated in Figure 1. The authors suggest
that organic agriculture is associated with greater biodiversity of plants, animals, insects
and microbes, as well as with more genetic diversity than conventional farming. They
further found evidence that organic farms tend to store more soil carbon, have better soil
quality, cause less soil erosion, and have a greater ability to adapt to changing conditions
than do their conventional counterparts. The authors also suggest that organic agriculture
has the ability to be profitable in the long run, and to minimize energy and pesticide
residuals.

9
Figure 1: Organic Agriculture as a Subset of Sustainable Agriculture
Source: Reganold, & Wachter (2016).
2.2 Forces Stimulating Organic Agriculture
Policies pertaining to organic agriculture are evolving in the United States, and so is the
infrastructure to support the adoption of organic agriculture practices. Many changes in
organic agriculture are market-driven as organic food production faces a rapidly-growing
demand in the United States and other industrialized countries. U.S. national organic policy
aims to develop standards governing the production, processing and labeling of organically
produced food. Since 1990, the Organic Food Production Act (OFPA) has supported the
USDA’s effort to provide research, technical assistance, risk management and other
support for farmers who are transitioning toward organic production. As a result, funding
for organic research, financial assistance for conservation practices, certification cost-share
assistance programs, and data collection increased in the 2014 Farm Bill relative to
previous farm bills (Stubbs 2014).
A key reason for the growing interest in organic agriculture is the increased number

10
of government initiatives enacted to support organic agriculture. For instance, the 2002,
2008 and 2014 farms bill each supported organic agriculture in data collection, national
organic cost-share programs, and organic agriculture research and extension initiatives.
These government funds provide a platform for transitional organic farmers to be educated
and provide an advocacy role for the organic industry at the federal level. Lohr and
Salomonsson (2000) found that government research and policy initiatives often play key
roles in the adoption of new farming technologies and systems.
The organic community generally agrees on the need to promote organic agriculture
policies and fund research relevant to production practices that seek to improve efficiency
and sustainability for farmers who become organically certified. For example, DeLonge et
al. (2016) documented the need for conducting research on organic farming, for helping
organic agriculture achieve its full potential, and for offering relevant education to the
public. According to the authors, organic agriculture has the potential to maintain low input
costs and achieve price premiums, which can lead to improved profit margins and
contribute to maintaining a sustainable environment.
Watson et al. (2007) provide further evidence that the ability of farmers to obtain
favorable subsidies provides an important incentive for conversion. In addition, a number
of researchers have found that government and private conversion policies are the main
forces behind the increase in organic acreage. Similar findings were documented by Padel
(2001), and Van der Ploeg et al. (2000), who found that government and private conversion
policies such as cost-sharing transition expenses, supporting research and extension,
assisting in market development and insuring the quality of organic certification are
effective factors in encouraging farmers to switch to organic production methods.

11
2.3 Subsidies
The nature of organic agriculture subsidies is evolving in the United States, and so is the
infrastructure to support the adoption of organic agriculture practices. Lohr and
Salomonsson (2000) found that farmers requiring subsidies tend to manage large and
diversified farms and are more concerned about organic inspection, quality and adequacy
of technical advice than are conventional farmers. The 2014 farm bill modified the system
of subsidies for organic farming by dividing them into three groups: subsidies for farms
during the period of conversion to organic farming systems; subsidies for organic
extensification; and continuous subsidy schemes for organic farming1. These subsidies
consist of various types of support, e.g. subsidies for the maintenance of permanent
grassland, and those encouraging a reduction in nitrogen fertilizer applications.
Governmental support for organic agriculture is implemented by means of subsidies paid
directly to those farmers who adopt and/or maintain environmentally-friendly practices for
a period of at least five years. To obtain this support, participating farmers must develop
production methods that do not involve the application of chemicals such as pesticides.
A particular focus of the government has been on reducing greenhouse gases
(GHGs), which may help mitigate climate change. Organic farming may contribute to
reducing GHGs by promoting the use of reduced amounts of energy, which could lessen
the negative impact on the environment relative to conventional agricultural practices.
Thus, most organic subsidies aim to promote environmentally friendly farming methods,
such as organic agriculture practices.
1 Organic extensification can be defined as the process (or trends of developing an extensive production system, i.e. one which utilizes large areas of land, but with minimal inputs and expenditures on capital and labor.

12
2.4 Collaborations with Private Entities
The U.S. federal government has provided financial support to farmers who transition from
conventional to organic production methods. Best (2008) documents that these direct
organic transition payments to farmers increased significantly since the 1990s and acted as
incentives to move toward increasingly sustainable practices. Though federal financial
supports provide benefits to organic farmers, the funds may not be enough to encourage
farmers to switch to organic production. This has led private agencies to provide financial
support for encouraging farmers to modify their production systems. In a study conducted
in Canada, MacRae et al. (2007) showed that the increase in organic production over two
decades was not only due to the existence of policy support and government-provided
financial incentives for organic farming, but also because of the availability of private
funding. The study’s findings are relevant to general settings because organic production
systems have the potential to provide social benefits that exceed the purely private benefits
that farmers consider when making investment decisions.
Mosier and Thilmany (2016) examined the policies and prospects of organic
agriculture, and focused especially on the government’s role in ensuring support for
organic agriculture. The authors found that as the organic farm sector expands, university-
based research and technical assistance, federal cost-share funds, and other private, state,
and federal supports for organic farmers begin to emerge. Policies such as the Agricultural
Risk Protection Act implemented in 2000 continue to support the growing organic industry
and are based on the widely-held view that organic agriculture involves good farming
practices and is worthy of support. This recognition has led private entities to cooperate on
supporting organic agriculture in the United States.

13
2.5 Market Incentives
The amount of farmland under organic management has grown steadily during the last
decades in the United States, as farmers strive to meet increasing consumer demand for
organic food products in both local and national markets. Certified organic crop acreage
nearly tripled between 2002 and 2014, from 1.3 million to 3.7 million acres. However,
while organic farming continues to grow at an impressive rate worldwide, demand for
organic food and beverages is far outpacing supply (Nesheim et al. 2015). While the gap
between the domestic demand and supply has been filled by imports, the costs associated
with importing organic foods are high – the United States spends more than $1 billion each
year on organic food imports (Greene 2012). The high price of imported organic food
products provides incentives for domestic producers to increase their production of organic
food products, or for farmers using conventional production techniques to adopt organic
agricultural practices.
Dimitri and Greene (2002) document the development of organic agriculture, and
show that it has grown substantially since the emergence of organic agriculture in the 1940s
and particularly so over the past two decades. A contributing factor to the growing interest
in organic products is rising demand for organic food products. For example, results of a
2013 survey conducted by the Organic Consumer Association in the United States showed
that 63 percent of respondents purchased organic foods and beverages on a regular basis,
and 40 percent of respondents indicated expecting that organic food products would be an
increasing part of their diet within one year. The respondents cited health and nutrition
matters as reasons for buying organic food, followed by taste, food safety and
environmental concerns. Reganold et al. (2011) found that consumer demand is also

14
growing for products that take into account environmental and social accountability among
farmers, including considerations of animal welfare, ecosystem services, worker safety and
welfare and resource conservation. The authors argue that organic agriculture practices
provide answers to these demands, by way of using “value-added traits” and using the
notion of “sustainability” in branding of organic products. These market forces could help
explain the rise in the demand for organic food – not only in the United States but also for
the world as a whole.
According to the Organic Trade Association (OTA) 2015 organic industry survey,
the industry saw its largest annual dollar gain ever in 2015, with an increase of $4.2 billion
in sales, up from the $3.9 billion in new sales recorded in 2014. Of the $43.3 billion in total
organic sales, $39.7 billion were organic food sales, up 11 percent from the previous year,
and non-food organic products accounted for $3.6 billion, up 13 percent. Nearly 5 percent
of all the food sold in the U.S. in 2015 was organic. The market encompasses $5.7 billion
worth of organic produce sold in supermarkets, big-box stores and warehouse clubs; $4.7
billion sold by specialty and natural retailers; and $2.7 billion in direct sales, including at
farmers' markets, by community-supported agriculture (CSA) projects and online. The
survey indicated that the more organic producers know about the market and what
consumers want; the better the organic producers, distributors, and retailers can respond to
meet the needs of organic consumers.
2.6 Push Factors Associated with Moving to Organic Agriculture
The need for agricultural sustainability has played an important role in shaping not only
the path of organic agriculture in the United States but also the country’s general
agricultural policies, as recognized by Youngberg and DeMuth (2013). This is because

15
organic agriculture is often viewed as being able to provide solutions to some of the
problems – real or perceived – associated with conventional agricultural practices, such as
environmental degradation, depletion of non-renewable resources, and food safety issues
(Lampkin and Padel 1994). DeLonge et al. (2016) found that consumer demand is
increasing for products that are perceived to incorporate environmental and social
accountability aspects in their production, including considerations of animal welfare,
ecosystem services, worker safety and welfare, and resource conservation.
With the idea of organic production in place, the impact of its activities on the
ecosystem is important to sustainable agriculture. Pechrová (2014) suggested that by
avoiding the use of agrochemicals, organic agriculture will help make food relatively ‘free’
of synthetic chemicals and thus healthier in comparison to food produced based on
conventional agricultural practices. In addition, organic farming has a favorable effect on
the environment, which may partially compensate for its relatively high production costs,
so making subsidies available to motivate farmers to transition toward organic agriculture
could be justified from a social efficiency point of view.
2.7 Inhibiting Factors for Organic Agriculture
Any one motivation may be sufficient to lead a farmer to consider growing organic
products. Vice versa, any one constraint can potentially prevent a farmer from actually
adopting organic agriculture practices. In the absence of financial support, agricultural
producers may face a number of obstacles in their consideration to transition from
conventional to organic production systems. These obstacles include 1) high transitioning
cost; 2) low profitability; 3) lack of marketing infrastructure; 4) misperceptions and lack

16
of organic knowledge; and 5) lack of institutional support, each of which will be tackled in
the following sections.
2.7.1 High Transitional Cost
The steps involved with the conversion to organic agricultural are both time-consuming
and costly. Figure 2.2 shows the possible sequence prior to achieving organic status.
During the process, which usually takes a transition period of about 36 months, farmers
and facilitators are restricted to sell, label or represent their products as “organic” and
farmers are not allowed to use the USDA organic certifying agent’s seal without fully
fulfilling the entire sequence involved in the certification. Because of this costly process,
the USDA Organic Certification Cost Share Program takes it upon itself to provide organic
producers and handlers with assistance. Constance et al. (2015) discussed the role of
government assistance in the organic adoption process. The authors found that without
government involvement, most small-scale farmers are not motivated to transition due to
the associated high initial costs. To most farmers, the organic certification process requires
time and expense and involves rigorous on-site production verification.

17
Figure 2: Flow Diagram Showing Possible Sequence to Achieving Organic Status.
Source: USDA-AMS-OID-2014.
2.7.2 Low Profitability
The perceived lack of profitability of organic systems is a key obstacle to considering a
transition to organic production systems. These and other obstacles were documented by
Farmer et al. (2013), who identified possible barriers such as the cost of organic production,
farm labor, fertility management, yields, insect pest management, and access to organic
inputs. The authors noted that organic production tends to be more labor intensive and more
reliant on manual work than conventional agriculture, while yields may be relatively low.
Offermann (2003) found that an important aspect of the profitability of organic farms is
the opportunity to receive farm-gate price premiums for organically-produced goods over
Apply for certification
Complete the SCS Application for
organic Certification
Determine Eligibilty
SCS reviews application
Authorize a Proposal
SCS prepares proposal for approval with
suggested scope of work
On-site Audit and Testing
*physical inspection*review of records
*interview with personnel
Certifcation Decision If certification is
granted, a certification of compliance is issued
Maintaining Certification
Annual Audits are required to maintain
certification

18
and above conventionally produced product prices. Crowder and Reganold (2015) found
that when no organic premiums were available in a given year, gross returns, benefit/cost
ratios, and investment in organic production were significantly lower for that particular
period than when premiums were available. Therefore, motivating farmers to transition to
or expand organic farming requires price premiums, and in the absence of price premiums
and other financial incentives, agricultural producers will likely refrain from adopting
organic production practices.
2.7.3 Lack of Marketing Infrastructure
The 2014 USDA organic survey indicates that farmers’ ability to market their product is
among the most important concerns when they consider switching to organic production
systems. Although marketing channels for organic food have expanded in recent years,
insufficient infrastructure, such as lack of established purchasing, storage, and distribution
channels can still hinder growers interested in adopting or expanding their production to
accommodate organic food demand.
In 2015, the organic agriculture industry experienced significant growth despite its
continued struggle to meet the seemingly unquenchable consumer demand for organic
products. Supply issues persisted to dominate the industry, as organic production in the
U.S. lagged behind consumption. In response, the organic industry joined in collaborative
ways to invest in infrastructure and education, by advocating for policies to advance the
sector, and individual companies invested in their own supply chains to ensure a
dependable stream of organic products for the consumer.
19
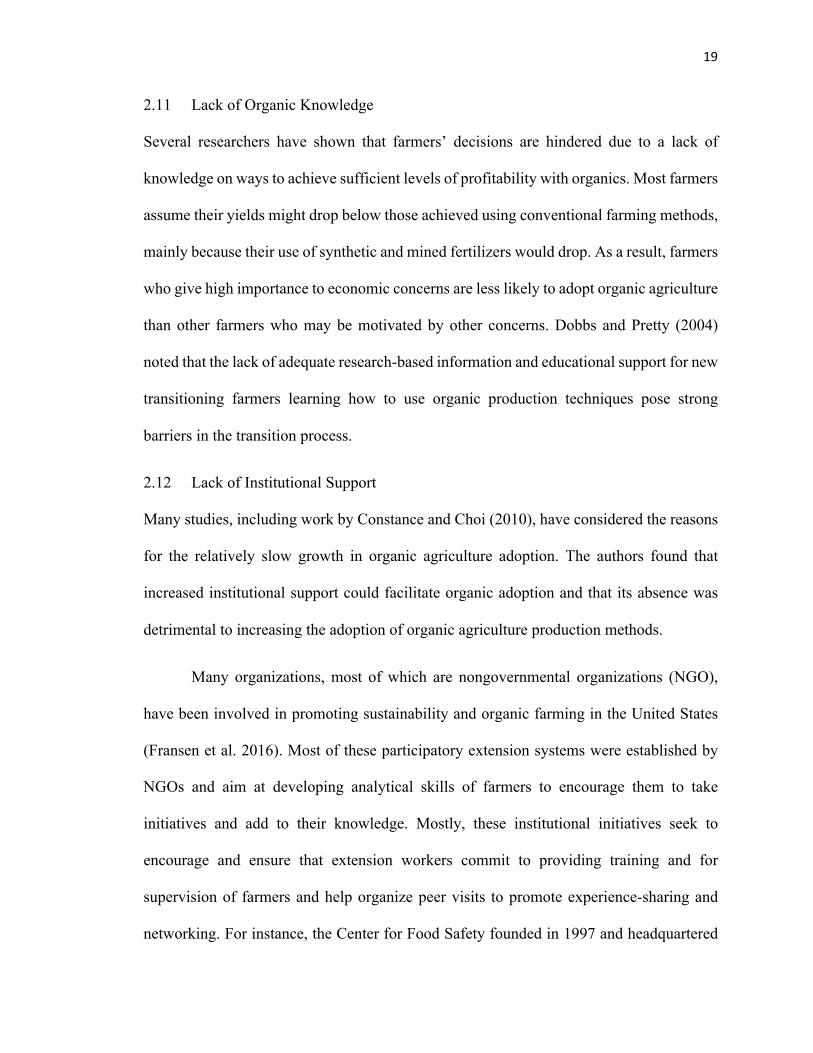
2.11 Lack of Organic Knowledge
Several researchers have shown that farmers’ decisions are hindered due to a lack of
knowledge on ways to achieve sufficient levels of profitability with organics. Most farmers
assume their yields might drop below those achieved using conventional farming methods,
mainly because their use of synthetic and mined fertilizers would drop. As a result, farmers
who give high importance to economic concerns are less likely to adopt organic agriculture
than other farmers who may be motivated by other concerns. Dobbs and Pretty (2004)
noted that the lack of adequate research-based information and educational support for new
transitioning farmers learning how to use organic production techniques pose strong
barriers in the transition process.
2.12 Lack of Institutional Support
Many studies, including work by Constance and Choi (2010), have considered the reasons
for the relatively slow growth in organic agriculture adoption. The authors found that
increased institutional support could facilitate organic adoption and that its absence was
detrimental to increasing the adoption of organic agriculture production methods.
Many organizations, most of which are nongovernmental organizations (NGO),
have been involved in promoting sustainability and organic farming in the United States
(Fransen et al. 2016). Most of these participatory extension systems were established by
NGOs and aim at developing analytical skills of farmers to encourage them to take
initiatives and add to their knowledge. Mostly, these institutional initiatives seek to
encourage and ensure that extension workers commit to providing training and for
supervision of farmers and help organize peer visits to promote experience-sharing and
networking. For instance, the Center for Food Safety founded in 1997 and headquartered

20
in Washington D.C., is a nonprofit advocacy organization that promotes food systems that
are safe, sustainable and environmentally friendly. The center set up a type of social control
system in 2003 to ensure that farmers comply with organic agriculture requirement in terms
of managing their landscape, enhancing biodiversity, and producing food in environmental
sustainable ways. This social system is also expected to ease and reinforce solidarity in
organic farmers’ associations and communities (Moumouni et al. 2013). To sum up, the
institutional support for organic farmers can promote and ensure learning (by encouraging
training, preparation and use of inputs, and sustainable farming), networking (joining
farmer associations), attending meetings, facilitating outside peer visits, and ensuring
mutual encouragement, (Constance and Choi, 2010).
2.8 Conclusion
This review shows that farmers’ transition from conventional to organic agriculture is
driven by several factors, such as the availability of subsidies and market demands forces.
In addition, farmers face several barriers when transitioning. While organic agriculture has
the potential to play an important role in helping to sustain the environment, little attention
has been given to the role of favorable subsidies in motivating farmers to transition to
organic farming. This study seeks to examine the importance of subsidies in stimulating
the development of the organic agriculture sector in the United States.

21
CHAPTER THREE: METHODOLOGY
This chapter presents the methodological framework for conducting the study, and explains
the variables used in this thesis. It also describes the statistical methods and models used
to test whether subsidies influence organic adoption. Using secondary data, I test the
hypothesis that policies such as organic transition subsidies are positively related to
increasing the adoption of organic agricultural practices. The analysis utilizes the statistical
software Stata, JMP and Simetar to provide summary statistics, conduct correlation
analyses and perform regressions.
3.1 The Adoption Decision
The adoption decision of a new technology is essentially a choice between two alternatives,
the traditional technology and the new one. As such, choice models developed in consumer
theory have been used to motivate adoption decision models. In this context farmers are
assumed to make decisions by choosing the alternative that maximizes their perceived
utility (Fernandez, 1998). Thus, a farmer is likely to adopt if the utility of adopting, I1*, is
higher than the utility of not adopting, I0.*. However, only the binary random variable I
(taking the value of one if organic agriculture practices are adopted and zero otherwise),
observed as utility I*, is a latent variable and as such is treated as a random variable.
In the context of the adoption of organic agriculture, Ij * = Vj + ej, where Vj is the
systematic component of I*, related to the utility of adopting (j = 1) and not adopting (j =
0). Assuming a linear utility function, the utility of adopting is I1* = γ1Z + e1, and the utility
of not adopting is I0* = γ0Z + e0 where γ is the parameter vector and the stochastic
component ej accounts for unobserved variations in preferences and errors in perception
and optimization by the farmer.

22
3.2 Empirical Model and Estimation
The empirical model and estimation are based on Lohr and Salomonsson’s (2000) work,
but with a few modifications. Their model suggests that the utility of a farmer adopting
organic agriculture should be greater than that associated with the /conventional production
methods, so the adoption equation is:
I1* = γ1Z + e1 > I0* = γ0Z + e0.
The major reason for the modification is that the previous authors used primary data, which
enabled them to accurately capture individual farmers’ decisions to convert to organic
production methods with the help of subsidies. To derive a testable model, we assume: (a)
the adoption of organic agriculture is dependent on organic policies or subsidies offered,
(b) income from organic agriculture is due to increasing consumer demand, which induces
the adoption of organic agriculture, (c) the probability that farmers will adopt organic
agricultural practices is higher if they receive these incentives or subsidies than without
them, and (d) due to cost minimization created by these organic subsidies, farmers’ indirect
utility derived from adopting organic practices is greater than without the assistance of
subsidies.
Based on these assumptions, the probability P that a given farmer adopts organic
agriculture practices or not is given by: P (IJ* = 1) = f (Si + Inci ; Ai) + εj1 > P (IJ* = 0) =
f(S0 + Inci ; Ai) + εj0, where f denotes the cumulative normal distribution. If the disturbances
(e) are independently and normally distributed, then their differences (e0 – e1 = µ) will also
be normally distributed and the probit transformation can be used to model the farmer’s
adoption decision. In the preceding equation (IJ* = 1) represent the probability that organic
agriculture is adopted in a given period and P (IJ* = 0) indicates the situation when organic

23
agriculture isn’t adopted in a given period. The variable Inci represents all other income
generated from organic agriculture in a given period and Ai represent all other behavioral
variables that may affect the decision to adopt organic agriculture.
3.3 Modelling the Impact of Subsidies on the Adoption of Organic Agriculture
To examine the impact of subsides on the adoption of organic agriculture, we specify that:
(i) the outcome of a utility maximizing choice reflects the farmers’ decision to transition
toward adopting organic practices; (ii) an individual farmer’s indirect utility function
associated with adopting organic agriculture depends on the subsidies offered; (iii) farm
income depends on sales, and (iv) other behavioral characteristics and institutional factors
that affect adoption decision. Given the utility maximizing equation:
ΔOrgacrge = f (1, Si + Inci; Ai) + εj0 (1)
where a farmer’s utility derived from adopting organic agriculture is represented by
positive changes in organic acreage, Si represents organic subsidies available, Inci denotes
the income obtained from producing organic products, and Ai indicates other behavioral
characteristics and institutional factors that affect the adoption of organic agricultural
practices.
ΔOrgacrge = f (0, Inci; Ai) + εj0 < 1 (2)
Equation 2 shows that the marginal utility of farmers adopting organic agriculture or
increasing their organic acreage is less than 1 when the adoption of organic practices is not
related to the subsidy which is designated by 0.
ΔOrgacrge = f (1, Si + Inci; Ai) + εj1 > ΔOrgacrge = f (0, Inci; Ai) + εj1 (3)
Consequently, Equation 3 shows that the indirect utility derived from the adoption of
organic practices with the subsidy is greater than without it. In the equations above, εj1 and

24
εj0 represent the random factors that influence the indirect utility function. These random
variables are independent and identically distributed random variables with zero means.
3.4 The Utility Difference Model
The following equation (4) shows that if the expected differences between the two utility
functions in equations 1 and 2 is greater than zero, then an organic subsidy is needed to
stimulate farmers’ decision to adopt organic agriculture production methods.
ΔOrgacrge = βf (Inci, Si, Ai) + mi (4)
Note, the decision of interest here is solely to identify if the subsidy has a significant
influence on adopting organic agriculture practices. The functional form that depends on
observed explanatory variables is denoted by f (.) and β denotes the vector of estimated
parameters. Similar to the error term in the earlier equation, mi represents all other
unobserved factors that influence if a subsidy is needed for the adoption of organic
agriculture. Since the random variables εj1 and εj0 are independent and distributed with zero
means, the difference in the error terms of the indirect utility function is defined as εj1 - εj0.
One of the most important determinants of the transition to organic agriculture is
ensuring an easy conversion process. Most economic research shows that a high percentage
of farmers with a low marginal cost of conversion or a high marginal benefit would convert
without the need for subsidies. However, according to Lohr and Salomonsson, there is no
one indicator of ease of conversion. This means that the availability of subsidies must be
considered important and highly necessary if farmers respond to it positively as an
incentive for conversion.

25
3.5 Indirect Utility Function
The specification of the indirect utility function to assess the objectives of this thesis is as
shown in equation 5:
ΔOrgacrge = β0 + β1Inci + β2Si + β2Ai + mi, (5)
Where ΔOrgacrge denotes the change in the adoption of organic agriculture, Inci denotes
the income from organic agriculture, Si represents organic subsidies, and Ai indicates other
behavioral characteristics and institutional factors that affect the adoption of organic
agricultural practices. By specifying the components of Si and Ai, we will be able to test
which factors influence the adoption of organic agriculture using the OLS regression
equations below:
Ø Δ Orgacrge = β0 + β1 * fedsub + β2 * Orgsales + β3 * Orgprogm+ β4 * Orgcertcost
+ β5 * Orgcertfms+ β6 * Nocsp + m1 (6)
Ø ΔOrgacrge= β0 + β1 * Equipfund + β2 * Orgsales + β3 * Orgprogm
+ β4 * Orgcertcost + β5 * Orgcertfms + β6 * Nocps + m2 (7)
Ø ΔOrgacrge= β0 + β1 * Otcap + β2 * Orgsales + β3 * Orgprogm+ β4 * Orgcertcost
+ β5 * Orgcertfms + β6 *Nocps+ m3 , (8)
Where variables fedsub, Equipfund, and Otcap represent Si from equation (1), and are
explained in Table I. All other variables are elements of the vector Ai. Mosier and Thilmany
(2016) found that the adoption of organic agricultural practices depends on a variety of
factors, such as structural and economic characteristics. The authors also found that
structural characteristics such as economies of scale, ownership structure and family owned
farm businesses organization were vital considerations for adopting organic agriculture

26
practices. However, a growing number of studies, especially on the profitability of organic
agriculture, stresses the importance of motivating farmers in their decision-making process
when adopting organic practices. Based on the availability of data, we consider both
economic and non-economic factors in this study.
3.6 Variables
To assess the extent to which the adoption of organic farming is influenced by targeted
subsidies, we use data on eight independent variables to test the internal determinants of
organic adoption growth. Due to the unavailability of data on selected variables, some
factors are not included, though they might have influenced results. For instance, the
USDA does not have data on marketing/sales outlets. Table 1 provides a description of the
variables, and Table 2 provides summary statistics of the variables included in the analysis.

27
Table 1: Description of the Variables Model Variable
Variable Description Units
Dependent Variable
Orgacrge Acres of organic cropland operated on in the selected geographical area of the study.
1,000 USD
Independent variables
Nocsp Number of farms enrolled in organic cost-share programs.
count
Fedsub Federal subsidies paid to organic farmers in each state. Each farmer qualifies for such funding as long as it is certified and has already been through the 3 years of transitioning phase.
1,000 USD
Equipfund Environmental Quality Incentive Program funds provided to eligible applicants and land for supporting the environmental sustainability of organic operations.
1,000 USD
Otcap Organic Conservation Technical Assistance program fund provided through Natural Resource Conservation Service (NRCS) to farmers to facilitate wider adoption of organic farming and to improve consumer access to organic products.
1,000 USD
orgsales Derived from the sale of organic products by state.
1,000 USD
orgcertcost Organic certification costs incurred each year, including organic application fees, annual inspection fees, training and educational fees, and annual certification fees.
1,000 USD
Orgcertfms Number of farmers fully converted or in conversion to organic methods from 2002 to 2012.
count
orgprogm Number of certified organic farms or business operations that sell, label or represent products as organic.
1,000 USD
Organic acreage serves as the dependent variable in assessing the impact of
subsidies on organic adoption. Organic acreage represented by the variable “Orgacrge” is
calculated by summing up the yearly acres of organic acreage in each state data in 2002,
2007, 2008, 2010, 2011, 2012, and 2014. The U.S. Department of Agriculture‘s organic

28
database could not account for missing years because organic surveys are not conducted
yearly.
In order to capture the effect of the adequacy of technical and economic advice on
the organic agriculture adoption rate, the number of organic farms in each state enrolled in
cost-share programs is included. The “Nocsp” variable represent the likelihood of farmers
converting to organic agriculture due to acquiring knowledge and education on organic
agriculture. Knowledge of the application of organic technology and marketing is
considered particularly important to farmers who are new to organic agriculture. The
significance of including Nocsp is to suggest that the availability of organic education and
research has the potential of helping farmers maximize their resources when converting to
organic agriculture.
The potential to sell organic products can influence the adoption of organic
agriculture. Rigby and Young (2001) cited marketing opportunities and market incentives
as being leading motives for adopting organic techniques. The availability of marketing
opportunities can substantially reduce the need for organic subsidies received by farmers in
converting to organic agriculture. According to Klonsky and Greene (2005), increased
demand for organic products affects organic adoption because it will lead to additional
marketing outlets, and will increase the number of organic products in these outlets and
finally increase the entry rate of mainstream food manufacturers into organics. This ripple
effect will eventually cause farmers to respond to such demands by adopting organic
agriculture practices.
The number of farmers converted or in the process of conversion to organic
production is also considered an important factor. The USDA began tracking the number of

29
certified organic producers in 2002. In 2014, there were 19,474 organic farmers in the
United States which represented a 250% increase since their initial count in 2002,
suggesting that practices are on the rise, as discussed earlier.
Organic certification costs are represented by the variable “Orgcertcost” and are
included as one of the independent variables. Such costs represent an important impediment
to converting to organic agriculture. These costs normally include the organic application
costs, soil management and rotational costs and inspection costs. Most farmers believe
organic certification is cumbersome, expensive and most importantly time consuming, so
they may hesitate to convert to organic agricultural practices.
Organic subsidies are grouped into three major variables; “Equipfund, Fedsub and
Otcap”. While there is widespread interest in organic agriculture, it still represents only a
small portion of total utilized agricultural area in the United States. To most farmers,
adopting organic practices is considered rather risky because this mode of farming presents
uncertainties in the areas of input costs and output (yields). Thus the switch to organic
production is often perceived as a risky adventure to these farmers as they are uncertain
about almost every aspect of organic farming. To overcome impediments to adoption, the
U.S. promotes the practice mainly through subsidy-driven policies.

30
Table 2: Descriptive Variable Statistics Variables
Mean Standard
Deviation
Min
Maximum
Orgacrge
(1000)
136,657 154,725 211 951
Nocsp (count) 140 191 10 1,052
Fedsub (1000) 117,805 65,327 4,384 309,606
Equipfund
(1000)
23,012 20,388 2,776 100,187
Otcap (1000) 13,891 5,928 7,336 36,460
Orgsales
(1000)
135,247 301,560 103 2,231,000
Orgcertcost
(1000)
491 664 36 5,527
Orgcertfms
(count)
443 550 35 2,805
Orgprogm
(counts)
531 666 45 4,462
Units of all the variables are in thousands except organic farms and organic programs
which are in numbers.
3.7 Hypotheses
Using state-level data collected for the North Central U.S. states, we test specific
hypotheses related to factors affecting the necessity of subsidies in the conversion and
adoption of organic agriculture in general. Four specific null hypotheses were formed.

31
(a) Hypothesis I – the null hypothesis is that there is no significant difference in the
adoption of organic agriculture with the availability and acquisition of organic
subsidies by farmers, while controlling for other determinants. The alternative
hypothesis is that organic subsidies received by or available to farmers must be
viewed as being important since farmers respond to this incentive to convert.
Therefore, this financial incentive is expected to be positively related to the
adoption of organic agriculture.
(b) Hypothesis II – the null hypothesis is that there is no significant growth effect in
the adoption of organic agriculture associated with an increasing demand for
organic products while controlling for other relevant determinants. On the other
hand, increasing the sales of organic products is considered the biggest incentive to
farmers in their decision making process, and therefore is expected to positively
correlate with the adoption of organic adoption.
(c) Hypothesis III – the null hypothesis is that there is no significant effect on the
adoption of organic agriculture from the acquisition of adequate information and
knowledge of organic practices, while controlling for the other relevant determinant
of adoption of organic agriculture. It is expected that passive awareness or organic
agriculture should positively affect adoption, even without subsidies.
(d) Hypothesis IV – the null hypothesis is that the existence of transitioning costs does
not have any significant effect on the adoption of organic agriculture while
controlling for other relevant factors. On the other hand, certification costs continue
to pose a dilemma to farmers when transitioning to organic agriculture, therefore

32
this variable is expected to be negatively related to conversion to organic
agriculture.
Given the available data, running multiple OLS regressions may cause statistical
problems such as perfect collinearity, heterogeneity and possibly endogeneity. Therefore,
tests for heterogeneity and collinearity are carried out in order to check for deviations from
the underlying assumptions about statistical properties required for consistency and robust
inference. We test for heterogeneity by running a “Breusch-Pagan test.” The above
processes help in making unbiased analysis and enhancing asymptotic efficiency in the
results.

33
CHAPTER 4: DATA AND DESCRIPTIVE ANALYSIS
4.1 Global Importance of Organic and Sustainable Agriculture
Organic farming is practiced worldwide and plays an increasingly important role in modern
agriculture, as measured by the number of farmers turning to certified organic farming
systems. Despite long and complicated processes and practices involved with moving
toward organic agriculture production systems, its use has grown substantially since
emerging in the 1940s (Dimitri and Greene 2000). Nevertheless, it is an open question
whether organic agriculture will continue to expand in the future, and if so, what will drive
its growth. Some researchers (e.g. Pinstrup-Anderson et al. 1999) contend organic
agriculture does not provide a viable solution for improving food security because it
occupies only one percent of global cropland, but others (e.g. Crowder and Reganold 2015)
view organic agriculture as an important tool for achieving global food security. If the latter
view is valid and organic agriculture can help enhance food security and food system
sustainability, it is critical to identify which policies are effective, and which ones are
impediments for encouraging agricultural producers to move toward organic production.
4.2 Global Organic Demand and Supply
Organic agriculture may have the potential to contribute to increasing the global food
supply and reduce some of the negative environmental impacts of conventional agriculture.
People throughout the world produce and consume organic food and beverages. According
to the International Federation of Organic Agriculture Movement, in 2014 the United States
ranked fourth in the world in terms of the production of organic products, with sales valued
at 32.2 billion U.S. dollars, and corresponding to about four percent of total U.S. food sales.
The United States is ranked as the country with the third largest organic crop area, and with

34
Australia as the first and Argentina the second largest combined, these three countries have
73% of the world’s organic agricultural land (Niggli et al. 2016). The production of
certified organic products continues to increase in response to surging consumer demand,
even though organic food products as a share of all food products remains relatively small.
Figure 4.1 shows that although the annual growth rate of organic food sales fell from the
double-digit range in 2009-10 when the U.S. economy slowed, annual growth rates since
2011 have rebounded to 10-12 percent, and are more than double the annual growth rate
forecast for all food sales (Jaenicke et al. 2015).
Figure 3: U.S. Organic Food Retail Sales
Source: Economic Issues in the Coexistence of Organic, Genetically Engineered
(GE), and non-GE Crops
The growth in the organic food market did not come without challenges to the
supply chain. U.S. producers struggle to keep pace with the growing consumer demand for
organic products, both domestically and internationally, and face increased competition

35
from foreign producers. In addition, increased global population growth and food supply
pressures have led to concerns about putting too much of the arable land under sustainable
production practices. Nevertheless, Halweil (2006) believes that a large-scale shift to
organic farming would not only increase the world's food supply, but might be the only
way to eradicate hunger. The author also expressed the belief that organic agriculture has
the ability to restore the ecosystem because it does not deplete the soil of its nutrients, so
the focus on organic agriculture as a sustainable approach to agricultural production is
justified, as are research efforts to motivate farmers to adopt organic agriculture production
methods. Whether or not this view is widely shared, there is broad agreement on the need
to build a secure supply chain that can support demand, which goes hand-in-hand with
securing additional organic acreage, by encouraging farmers to farm organically.
4.3 Trends in Organic Agriculture
U.S. crop acres under USDA-certified organic systems have grown rapidly since the
implementation of the NOP in 2002. The number of organic acres was nearly 2.8 times
greater in 2014 than in 2002, and increased from about 1.3 million to almost 3.7 million
acres (Coleman-Jensen et al. 2014). Among the major field crops using organic production
methods whose acreage increased substantially during the same period were corn, soybean
and wheat. For instance, Table 3 shows that organic corn production increased the most in
the United States, from about 96,000 acres in 2002 to 234,000 acres in 2011. Between 2011
and 2014 alone, acreage committed to the production of organic corn increased by 24%.
Certified organic wheat made up the largest number of organic acres between 2002 and
2011; it increased from 225,000 acres in 2002 to a peak of about 345,000 acres in 2011.
Certified organic soybean acres increased from 120,000 acres in 2002 to about 240,000

36
acres in 2011. In addition, between 2005 and 2013, the amount of certified organic pasture
fluctuated from year to year but overall expanded by nearly 80% to 3.1 million acres in
2011. Much of the increase in organic crop production is associated with a rapidly growing
demand for organic products, which increased at an average rate of 20% each year since
1990, with retail sales reaching $51.8 billion in 2014 (Spark, 2014).
Table 3: Trends in U.S. Top Leading Organic Crops
Year Corn (acres) Wheat (acres) Soybean (acres)
2002 96,270 217,611 126,540
2003 105,574 234,221 112,403
2004 99,111 214,244 114,239
2005 130,672 277,487 122,217
2006 137,522 224,762 114,581
2007 172,112 329,688 100,390
2008 194,637 415,902 125,621
2010 213,035 345,041 132,468
2011 234,470 335,829 132,411
2012 344,883 224,329 200,876
2014 167,702 343,793 125,000
Source: Census of organic survey by USDA/ERS.

37
Figure 4 depicts corn, wheat and soybean acreage trends from 2002 to 2014. The
figure shows that soybean acreage committed to organic agriculture practices grew more
than acreage dedicated to organic wheat and corn acres.
Figure 4: Organic Corn, Wheat and Soybean Acreage Trends from 2002 To 2014
Source: Census of organic survey by USDA/ERS.
4.4 Data
The quantitative methods used in this research include conducting an analysis of annual
state-level data from 2002 to 2014. Based on the availability of data and the model
described in Chapter 3, nine variables are utilized in testing the research hypothesis. Data
on both independent and dependent data were collected from archived materials, and
government and academic sources. To assess the extent to which organic production
methods were adopted as a result of subsidies provided, only data pertaining to certified
organic agriculture were used to allow for drawing proper inferences and conclusions.
0
100,000
200,000
300,000
400,000
500,000
600,000
700,000
800,000
900,000
2002 2003 2004 2005 2006 2007 2008 2010 2011 2012 2014
acres
years
corn wheat soybean

38
4.5 Main Sources of Data
Our analysis uses secondary data from two key sources. First, the USDA Organic
Agriculture database from the Agricultural Resource Management Survey (ARMS) over
the 2000-2014 period provided data on organic acreage, cost of production and subsidies.
It is part of a larger ARMS database, which provides information on financial conditions,
production practices, resource use, and economic well-being of America's farm
households. These data provide an opportunity to study farmers’ responses to policies. The
second data source is the USDA’s National Agricultural Statistics Service (NASS), which
conducts its Organic Production Survey in conjunction with USDA’s Risk Management
Agency (RMA)-Collaborative Organic Censuses. Data from this source include marketing
practices, organic sales and production expenses.
4.6 Geographical Area Considered
Consistent with the objectives of the study and in accordance with the literature, our
analysis is based on data collected in North-Central U.S. States (IA, IL, IN, KS, MI, MN,
MO, NE, ND, OH, SD, and WI); see Figure 4.3. Though farmers in other states are also
involved in practicing organic production, these states have relatively high concentrations
of certified organic farmers and experienced a relatively large increase in organic acreage
over the past decade. For example, on average there are fewer than 500 certified operations
per state in Southeastern states, compared to over 700 certified operations per states in the
12 North-Central states.

39
Figure 5: States in the Study Area –North Central States
Sources: The geography of the Midwest.
4.7 Acreage Size
Acreage data from 2002 to 2014 were obtained from the Organic Production Survey
conducted by NASS and RMA. This is the third organic production and practices survey
NASS conducted at the national level; the previous data pertain to the 1997-2011 Certified
Organic Production Survey.
U.S. organic acreage has increased rapidly since the establishment of the Organic
Foods Production Act in 1990, which mandated the creation of the National Organic
Program (NOP) and the passage of uniform organic standards. Figure 4.4 shows the
increase in certified organic acreage. This increase is due in part to the growing federal
spending on organic agriculture programs associated with the farm bill.

40
Figure 6: Study Area Acreage Size Analysis
Source: Census of organic survey by USDA/ERS.
4.8 Farm Size
As stated earlier, the number of acres devoted to organic production has increased in recent
decades. The organic conversion rate among producers who turned idle arable land into
cropland between 2002 and 2014 was 22% for NC states, versus and 16.9% for the U.S. as
a whole. When farmers convert land into organic production, they may also turn
conventional cropland into organic production.
Granatstien (2003) suggest that the issue of scale has always been part of the
organic discussion. According to the author, the most diligent organic farmers in America
are unbothered by the size of farmland they convert initially, because innovations at one
organic system often influence sustainability in the other. Figure 7 shows the increase in
farm size operated by organic farmers for most of the 12 states.
20…0
100,000
200,000
300,000
2002 2010 2014
acres

41
Figure 7: Organic Farm Size
Source: Census of organic survey by USDA/ERS.
Table 4 lists the average farm size by state for the study area, taken from the 2002-2014
Census of Agriculture. In 2014, the North Central region had 22,877 farms that operated
7,815,730 organic acres, resulting in an average size of 342 acres of organic land per farm,
which compares to an average size of about 5,300 acres for all farms in the region. The
relatively small size of the organic operations is in part due to general characteristics
associated with organic farming discussed earlier, particularly concerning labor intensity.
0
500
1,000
1,500
2,000
2,500
3,000ac
res
states
2002 2008 2014

42
Table 4: Study Area Summary Statistics, 2014
NC States Organic
cropland
Operated in
(1000 acres)
Farms
(numbers)
Average Farm Size (acres)
Illinois 240,296 1,029 234
Indiana 157,671 1,170 135
Iowa 690,377 2,913 240
Kansas 293,219 488 601
Michigan 416,515 1,851 225
Minnesota 985,608 2,955 352
Missouri 294,938 837 1,008
Nebraska 856,911 850 1,658
North Dakota 1,117,353 674 145
Ohio 399,420 2,756 1,909
South Dakota 971,623 509 203
Wisconsin 1,391,799 6,845 342
Totals 7,815,730 22,877 342
Source: Census of organic survey by USDA/ERS.
4.9 U.S. Organic Market Forces
Figure 8 shows the market demand for organic products for the selected years. Market
demand increased in the North-Central states between 2002 and 2014. Kroger and Walmart,
two of the top food retailers in the United States in 2014, announced organic initiatives
including to expand the number of organic products they sell. This could further incentivize

43
conventional farmers to transition to organic agriculture. While profit-driven factors
continue to induce the organic industry to grow, recent years have seen an increase in the
number of health-conscious, informed, and demanding consumers, which has led to an
increase in the demand for healthy, safe and environmentally-friendly food products. The
food industry has responded to this increased demand by offering a wider range of quality-
differentiated products, including organic food. The projected increase in sales of organic
products in Figure 9 reflects an increasingly positive attitude among consumers toward the
consumption of organic products in the United States.
Figure 8: Proportions of Sales by States, 2002-2014
Source: Census of organic survey by USDA/ERS.
0
50000000
100000000
150000000
200000000
250000000
dollars
states
2002 2008 2011 2014

44
Figure 9: Organic Food Sales in the United States from 2000 To 2014
Source: fibl.org: Media release of FiBL and IFOAM - Organics International of February
2016.
4.10 Subsidies/ Cost of Production
Conventional farmers who wish to transition to organic methods often require funding to
convert their production systems, because the transition process is quite expensive, in part
due to high input costs. Both the government and private organizations provide support to
transitioning farmers in the form of funding for organic research, financial assistance for
conservation practices, certification cost-share assistance, and data collection. Funding for
these and other policy instruments was increased in the 2014 farm bill, which continued
the support for the organic sector that began in 2002 when the USDA implemented national
organic standards. Funding was also expanded for USDA’s National Organic Program,
which regulates organic standards, labeling and certification.
In the late 1990s, as demand for organic products grew, a need arose for national

45
organic standards. As a part of the 1990 farm bill, the Organic Foods Production Act that
included the National Organic Program (NOP) was passed. The goal of the NOP was to
set national standards for organic production. In 2002, the NOP rule was issued
establishing uniform national standards for organic goods including production and
handling standards, labeling standards, and a system of USDA accreditation for
independent certifiers (Fetter et al. 2002). The 2014 Farm Bill reflects shifting priorities
over the past decade in which issues such as local and organic food and healthy food access
have become elevated, in accordance with growing consumer demand for agricultural
products produced locally and strong growth in the development of local and regional food
systems (Morath 2015). Figure 10 shows a notable increase in funding for the National
Organic Certification Cost Share Program, which provides subsidies to farmers for the
certification fee. In 2008, this subsidy increased to $750 per farm, up from $500 per farm
in 2002 (Mercier 2016). A variety of stakeholders play a role in organic agriculture,
including both national and state government agencies, as well as organic certification
companies, interest groups, and a large variety of producers, suppliers, and consumers of
organic goods. Organic subsidies provided by the federal government are intended to help
organic agriculture producers manage risks associated with organic production and
profitability from year to year. Usually these support funds help curb the effect of variations
that weather, market prices and other factors have on farmers when adopting organic
farming practices.

46
Figure 10: Mandatory Spending On Organic Agriculture, 2002-2014
Sources: McFadden et al 201.
The Environmental Quality Incentives Program (EQIP) is a voluntary program that
provides financial and technical assistance to agricultural producers to plan and implement
conservation practices that improve soil, water, plant, animal, air and related natural
resources for agricultural production. U.S. agri-environmental programs such as EQIP seek
to offset the cost of environmental regulation, so maximizing the extent to which these
objectives can be achieved entails designing programs to be cost-effective. Environmental
cost effectiveness has been an important criterion in the development of U.S. agri-
environmental policy since the early 1990s (Santos et al. 2015). According to the authors,
these financial assistance payments are provided to eligible producers to implement
approved conservation practices on eligible land or to help them develop Conservation
Activity Plans (CAPS) to address specific land uses. Figure 11 shows that between 2002
and 2014, all 12 North Central Region states received a considerable increase in the amount

47
of assistance. In particular, Kansas, Missouri and Indiana saw increases of about 80 percent
in 2014 relative to 2002.
Figure 11: Trends in Environmental Quality Subsidies
Source: Census of organic survey by USDA/ARMS
Consumers want assurance that products labelled “organic” are indeed produced
per organic production methods, and producers want to know that other producers also
claiming to produce organic products are competing fairly. The “organicness” of a product
cannot be established by looking at the harvested product or by testing it. Rather, it is
ascertained through documentation and inspection of the whole production process.
Federal subsidies provide the core source of funding to assist organic producers and
handlers with covering the cost of organic certification. These subsidies exempt certified
organic producers from having to pay for conventional commodity promotion programs,
0
5,000
10,000
15,000
20,000
25,000
30,000
35,000
40,000
dollars
States
2002 2012 2014

48
and instead allow them the option of reducing the cost involved in obtaining certification.
In addition, subsidies require improvements in crop insurance for organic producers and
strengthen enforcement of organic regulations. Figure 12 shows that certified organic
farmers in Iowa appear to receive the largest amount of subsidies and have seen greater
increases between 2002 and 2014 than other states.
Figure 12: Federal Subsidies
Source Census of organic survey by USDA/ARMS
As with sustainable agriculture, there is a variety of definitions of organic farming (Kennedy
and Smith 1995). Kongolo (2014) refers to it as “a holistic view of agriculture that aims to
reflect the profound interrelation that exist between farm biota, its production and the overall
environment”. The author stresses that much of the debate over agricultural sustainability
includes issues of soil health and structure, the exhaustible nature of artificial fertilizers and
human health, which organic agriculture addresses in its aims of production and processing.
0
5,000
10,000
15,000
20,000
25,000
30,000
35,000
40,000
dollars
States
2002 2012 2014

49
In the United States, organic farming is considered a form of sustainable agricultural
practice, so the USDA has thus far ensured that certified organic farmers continue to receive
organic conservation assistance to help facilitate changes in land use as needed for natural
resource protection and sustainability. These funds aid organic farmers to solve soil, water
quality, water conservation, air quality, and agricultural waste management problems and
reduce soil loss due to erosion. Figure 13 shows a consistent though slow increase in the
distribution of these funds among the 12 states. The Organic Conservation Technical
Assistance Program helps in providing soil information and interpretation to individual
organic farmers and aids them in making sound decisions regarding the wise use and
management of soil resources.
Figure 13: Organic Conservation Technical Assistance Program
Source: Census of organic survey by USDA/ARMS.
4.11 Certified Organic Programs
To label products as being organic, farmers must obtain organic certification. Nationwide,
0
5000000
10000000
15000000
20000000
25000000
DOLLAR
S
STATES
2002 2012 2014

50
a variety of USDA accredited independent certifying companies exist to grant such
certification, which is based on a set of strict criteria about land use and agricultural
practices. Certified organic operations must meet defined standards, so farms that are not
USDA-certified are excluded from being recognized as organic and are not allowed to
market their products as such. While it is crucial that these certified organic operations
meet organic standards, a negative effect is that uncertified organic farms do not get
included in research and statistical analyses of organic farms.
Organic agriculture has evolved in the United States from a small number of
farmers who market locally and directly to consumers to a multi-billion-dollar agricultural
sector that trades domestically and internationally. For the purpose of clarity and further
development of organics in the market place, organic standards which keep evolving over
the years are enforced in the United States. These standards represent an agricultural
production system founded upon ecological principles that promote a whole-system
approach to farming and impact on the environment. Figure 14 shows the increase in the
number of organic programs between the 2002-2014 time periods. According to U.S.
National Organic Program Standards (NOPS) these programs encourage practices that
improve soil health, promote good sanitation measures, employ cultural practices that
enhance crop diversity, and advance the control of pathogens through mechanical, physical
and cultural methods. NOPS further confirms that these growing programs are expected
to facilitate the development of research projects that can be applicable to a broader base
of organic producers.

51
Figure 14: Certified Organic Program 2002-2014
Source: Census of organic survey by USDA/ARMS.
4.12 Conclusion
This chapter reviewed the variables potentially responsible for the adoption of
organic agriculture practices in the United States, particularly in the North Central region.
The chapter also discussed trends in the variables for the 2012-2014 period, such as the
growth in the governmental and private support for the adoption of organic agriculture.
There is agreement in the literature that organic subsidies and demand for organic products
have been on the rise over the past several decades.
0500100015002000250030003500
coun
ts
states
2002 2012 2014

52
CHAPTER 5: ANALYSIS AND RESULTS
5.1 Introduction
This chapter seeks to answer the research questions stated in Chapter 1, which are, to what
extent organic policies and subsidies affect the adoption of organic agriculture and which
barriers farmers face in adopting organic agriculture production methods in the North-
Central states. We report summary statistics, correlation coefficients between the
dependent and independent variables, and regression results using STATA 14.1.
5.2 Results for Diagnostic Test
All three models show strong goodness-of-fit, as indicated by the relatively high R2 and
the χ2 statistics, which are significant at the 5% level. The high R2 indicates a strong
relationship between our model and the response variable. In addition, the estimated
coefficients are similar across different models and estimators, and they are in the expected
directions. These findings indicate that the models explain a substantial proportion of the
variation in the dependent variable and are well specified.
5.3 Results from Stationarity Test
The second issue concerns the results of key regression diagnostics and the performance
of appropriate specification tests. To check for the data’s stationarity, we conducted a unit-
root test using the Philip-Peppron procedure, which provides an improvement over the
Dickey-Fuller test. Once the data are identified as being stationary, OLS results are likely
to be consistent.
5.4 Results from Residual Correlation Matrix
The third observation concerns the coefficients of the independent variable. The Breusch
– Pagan test for independence was used to obtain the correlation matrix for the residuals in

53
all three IUFS (Indirect Utility Function Regressions). The null hypothesis for the Breusch
– Pagan test was that the equations under consideration are independent of each other and
the alternative hypothesis was that the equations are not independent of each. A failure to
reject the null hypothesis will mean that OLS can be used to obtain estimates for parameters
without danger. A failure to reject the alternative hypothesis will permit the use of IUFS to
obtain estimates for parameters.
5.5 Results for Multicollinearity
Reviewing concerns regarding multicollinearity reveals the extent to which the inclusion
of one observed variable could inflate coefficients of the remaining independent variables.
We test for multicollinearity correlation between predictors using the Variance Inflation
Factor (VIF). The test shows that the number of organic programs (Oprogram) causes
constant variance in the model. As a rule of thumb, variables with VIF values greater than
10 are excluded, as is case with the program variable. In addition, removing the variable
from the model increased the goodness of fit of all models. This suggest that
multicollinearity is problematic, because it can increase the variance of the regression
coefficients, making them unstable and difficult to interpret. See Appendix I, II and III for
test results.
5.6 Results for Heteroscedasticity
Due to the fact that a single model including all three subsidies resulted in perfect
multicollinearity, we ran three separate models to analyze the effect of each subsidy on the
adoption of organic agriculture. With respect to an FIML (asymptotically efficient
estimator for simultaneous models with normally distributed errors) model,
heteroscedasticity tests were significant at the 5% level.

54
The Breusch – Pagan test Statistics revealed that models were fairly homoscedastic.
This indicates that the assumptions underpinning the FIML approach are not substantially
violated, so these test estimates are preferred. Robust standard errors are used to address
any remaining heteroscedasticity.
Finally, the most striking results are the consistently positive and significant effects
of the subsidies observed in all three models, suggesting all three subsidy variables –
Equipfund, Otcap and Fedsub correlate positively with the adoption of organic agriculture
practices. The consistently negative coefficient of organic certification costs indicates that
we can reject the null hypothesis that there is no significant difference in organic adoption
between certified and non-certified farmers. This suggests there is a negative relationship
between organic certification costs incurred and farmers’ willingness to adopt organic
agriculture. The results from getting adequate technical advice from enrolling in cost-share
programs are also significant. This implies that there is a measureable gain from the
adoption of organic farming when farmers enroll in cost-share programs, holding all other
variables constant.
5.2 Empirical Findings
To conduct our statistical analyses, we applied inferences of three statistical model
specifications, differing only by type of subsidy considered. Tables 6, 7 and 8 report the
results of the three models, with each model containing the same set of explanatory
variables except the subsidy variables. Before going through each model result, provided
below is an overall statistical comparison of the three organic adoption models.
The relative performance of the three models is compared by examining their R2
values. First, adoption of organic agriculture induced by the Environmental Quality

55
Incentive Fund (Equipfund) has the highest R2 (78.15 percent), and indicates that the
independent variables in Model 2 explain 78 percent of variation in the adoption of organic
agriculture. All the explanatory variables are statistically significant at the 5 percent level
in Model 2, except organic sales which is only significant at the 10 percent. Model 3 has
the same set of statistical significant explanatory variables, with a maximum rescaled R2
value of 76.59 percent, somewhat lower than in Model 2. Finally, Model 1 has a
considerably lower R2 value than the other two models. These results suggest that model 2
is the strongest and Model 1 is the weakest of the three models discussed in this section.
Summary statistics of subsidies (the main independent variables) are listed in Table
5. The table shows that the amount of funds associated with the federal subsidy, the
Environmental Quality Incentive program, and the Organic Conservation Technical
Assistance program received by the organic farmers in the North Central states were
$11,780,580,000, $23,012,000 and $23,012,000, respectively. Over the thirteen-year
period, the states with the largest percentage increase in federal subsidies received were
Indiana, Iowa, Kansas and Michigan (Figure 12). These states experienced an increase of
35 percent while the states that received the largest amounts of funds of the Equipfund
program were Iowa, Missouri and Nebraska (Figure 13), which experienced an increase of
29 percent. Kansas, Minnesota, Nebraska, Wisconsin and Illinois received an increase in
Otcap over 32 percent in the thirteen-year period (Figure 13).
In addition to setting the standard for the U.S. organic industry, the USDA supports
organic agriculture in the adoption process, so the subsidies are a means of supporting
organic agriculture. Both government and private institutions provide a wide variety of
funding opportunities, including conservation grants, organic crop insurance and

56
simplified microloans. Comparing the various kinds of subsidies from government and
private organizations provides (indirect) evidence that coupled subsidies indeed induce
farmers’ behavior, and may lead them to switch from conventional to organic agriculture.
Table 5: Summary Statistics of Independent Variables Independent
Variables
Obs. Mean
Std. Dev.
Min
Max
Fedsub 126 117,806 65,327 4,384 309,606
Equipfund 126 23,012 20,389 2,776 100,187
Otcap 126 13,891 5,929 7,336 36,460
*Units of all the variables are in thousands of U.S. dollars.
Table 6 shows the regression results of organic agriculture adoption and the six
behavioral characteristics and institutional factors over the 2012-2014 period for the North
Central states with federal subsidies as the determining subsidy. In appendix IV all the
three subsidies were run together in one model, there was the issue of multicollinearity
where one subsidy was correlated with one other variable and that was the reason we chose
to run the models separately with each subsidy. The Table shows a positive coefficient for
each of the independent variables, except for the certification cost variable. All coefficients
are statistically significant at the 0.05-probability level, except the NOSCP coefficient
which is not statistically significant. The parameter estimates of the organic certification
cost variable is negative and statistically significant at the 0.05 confidence level.
Organic food products are typically more expensive than conventional food
products, possibly making the cost of organic products prohibitive for some consumers.

57
Federal subsidies help reduce organic farm input costs. The regression results indicate that
the subsidies are positively associated with the increase in the number of organic acreage.
The number of farms enrolled in organic cost-share programs shows a strongly
positive association with the number of organic acres suggesting that the practical
knowledge of organic agriculture passed on to farmers in their decision-making process is
important in their transition phase. It is often difficult to quantify the benefits of organic
knowledge to farmers because the benefits are often intangible, however, it is important to
ensure environmental costs are considered, such as proper production of healthy food
without insecticides and pesticides for the organic market. Farmers enrolled in cost-share
programs receive knowledge on opportunities in maximizing the use of their resources.
Organic agriculture is complex and the conversion to organic management affects
the entire farming system. The 36-month transitioning period affects the farming
infrastructure and approach, such as maintaining soil fertility, as well as controlling weeds
and pests. The process of adopting organic agriculture systems causes unusual changes to
the land, input costs and yields, leading to excessive costs that many farmers are unable to
bear. This explains the negative parameter estimate of the organic certification cost
variable. The results in Table 6 also show that average farm size, as measured by organic
product sales, is positively associated with organic agriculture adoption. Based on Model
1, the increasing number of organically certified farmers over the last 13 years indicate that
farmers are increasingly converting conventional/arable lands into organic agriculture

58
Table 6. Model 1: Regressing the Adoption of Organic Agriculture on Fedsub as Main Subsidy Explanatory Variable coefficient Standard
errors
P-value
Subsidy to farmers (Fedsub) .3456 .1344 (0.011)**
Organic certification cost (Orgcertcost) -64.5349 18.6072 (0.001)**
Sales of organic products (orgsales) .2391 .0620 (0.000)**
Number of organic certified farmers
(Orgcertfm)
160.6888 29.1954 (0.000)**
Number of farms enrolled in organic
cost-share program (Nocsp)
91.8957 91.9529 (0.320)
Intercept 17850.25 20540.81 (0.387)
Observation 126
R2 .7084
Adj-R2 0.6960
Notes: the dependent variable is Orgacrge. Asymptotic t-values for the OLS model are in
parenthesis, Standard errors are robust and asterisks indicate significance at a specific
confidence level. *Significant at 1% level, **significant at 5% level, and ***significant at
10% level.
Table 7 shows the results of regressing the adoption of organic agriculture on
Equipfund as the desired subsidy and the remaining independent variables. The results
show that subsidies as part of EQIP given to organic farmers motivate them to adopt
organic agriculture and are statistically significant. The positive and statistically significant

59
Nocsp coefficient indicates that farmers find the availability of organic information and
education important in the conversion to organic agriculture decision making process.
The statistically significant and negative coefficient of -34.03 for organic
certification cost indicates that a $1,000 increase in organic certification costs per farm is
associated with a decrease in the number of organic cropland by 34,000 acres. Dimitri and
Greene (2000) found that market development and increased sales (consumer demand for
organic products) substitute for conversion subsidy payments. They explained that aid in
the form of the establishment of market infrastructure for organic products has a more
permanent impact on conversion than subsidizing production costs. We confirm these
findings, so that a $1,000 increase in organic sales is associated with a 0.2% increase in
organic agriculture acres. This may explain why the USDA in 1999 awarded the Organic
Trade Association a cost-share under the Market Access Program (MAP) to explore foreign
markets for organic food products.
The statistically significant and positive coefficient of organic farms gives an idea
of scale effects. In particular, if organic certified farmers increase in size by one unit, the
probability of farmers adopting organic agricultural practices increases by a greater
percentage. The more motivated organic farmers are, the more likely they are to convert
additional land to organic production and adopt its practices thereafter. Thus when farmers
expect improved financial returns, it is easier to increase organic farmlands.

60
Table 7. Model II: Regressing the Adoption of Organic Agriculture on Equipfund as Main Subsidy Explanatory Variable coefficient Standard
errors
P-value
Subsidy to farmers (Equipfund) 3.2129 .4583 (0.000)**
Organic certification cost (Orgcertcost) -34.0272 16.6633 (0.043)**
Sales for organic product (orgsales) .0020 .0632 (0.097)***
Number of organic certified farmers
(Orgcertfm)
124.096 25.9073 (0.000)**
Number of farms enrolled in organic cost-
share program (Nocsp)
213.2414 73.5352 (0.004)**
Intercept -5878.662 13822.91 (0.671)
Observation 126
R2 0.7815
Adj-R2 0.7724
Notes: the dependent variable is Orgacrge. Asymptotic t-values for the OLS model are in
parenthesis. Standard errors are robust and asterisks indicate significance at a specific
confidence level. *Significant at 1% level, **significant at 5% level, and ***significant at
10% level.
Table 8 lists the results of regressing the adoption of organic agriculture on Otcap
as the main subsidy payment. Compared to the first two regression model specifications,
all independent variables are statistically significant and have the same direction of
association with the adoption of organic agriculture. The relationship between the cost of
organic certification and the adoption of organic agriculture is not surprising and is
consistent with the work of Constance and Choi (2010), who found that the relationship
between organic agriculture growth and the cost of transitioning was negative and
statistically significant. This makes intuitive sense, because a reduction in cost of
transitioning might motivate farmers to adopt organic agricultural practices.

61
As far as the financial situation of organic agriculture is concerned, the period of
converting to organic farming is costly and does not always lead to improved profits
afterwards. In this case, organic agriculture differs from conventional agriculture, which
might be more commercially beneficial. However, with all that mentioned, the available
evidence from the results of Models 1, 2 and 3 indicates that well-established markets,
conversion aid payments and ongoing support for organic farming that may be available
each contribute to the adoption of organic agriculture, hence the positive coefficients of
Orgsales, Nocsp, and Otcap. However, for some farmers, conversion to organic farming
may be associated with an economic penalty due to cost of conversion and a potential loss
of revenue thereafter. It is likely that the perception of relatively low profits and high risks
may be important barriers to the conversion.
The results presented in Tables 6, 7 and 8 suggest the independent variables in all
three models explain the adoption of organic agriculture in similar ways. Organic subsidies,
organic sales, and organic farms enrolled in cost-share program are all positively related to
the adoption of organic agriculture and are statistically significant. The analysis shows that
while federal policies strongly support organic agriculture, private conversion incentives
also strongly motivate farmers to convert to organic agriculture.

62
Table 8. Model III: Regressing Adoption of Organic Agriculture on Otcap as Main Subsidy Explanatory Variable coefficient Standard
errors P-value
Subsidy to farmers (Otcap) 7.4462 1.2102 (0.000)**
Organic certification cost (Orgcertcost) -50.1021 16.8203 (0.043)**
Sales for organic product (orgsales) .1353 .0578 (0.097)***
Number of organic certified farmers (Orgcertfms)
136.5331 27.0822 (0.000)**
Number of farms enrolled in organic cost-share program (Nocsp)
239.4452 76.5373 (0.004)**
Intercept -54718.46 21522.73 (0.012)**
Observation 126
R2 0.7659
Adj-R2 0.7562
Notes: the dependent variable is Orgacrge. Asymptotic t-values for the OLS model are in
parenthesis, Standard errors are robust and asterisks indicate significance at a specific
confidence level. *Significant at 1% level, **significant at 5% level, and ***significant at
10% level.
In the final chapter, we present a summary of key findings of this study,
conclusions, limitations, and recommendations for future research related to this thesis.
63
CHAPTER 6: SUMMARY OF FINDINGS AND CONCLUSION
This final chapter summarizes and concludes the study. It also contains a description of the
limitations of the study and recommendations for future study.
6.1 Summary of Key Findings and Conclusions
This research attempts to accomplish four main objectives. One is to examine to what
degree conversion subsidies are positively related to farmers’ decisions to switch to organic
production. Second, to investigate various persistent barriers that may keep farmers from
switching to organic agricultural production. Third, to study market demand forces that
incentivize farmers to transition to organic production; and fourth, to analyze
environmental sustainability challenges of organic production practices.
To achieve these objectives, data on organic agriculture were collected for twelve
North-Central states namely: Illinois, Indiana, Iowa, Kansas, Michigan, Minnesota,
Nebraska, North Dakota, Ohio, South Dakota, and Wisconsin. Specifically, the data
pertaining to organic cropland acreage, the number of organic farms, the organic
operations, number of farms enrolled in cost share programs, federal organic subsidies,
environmental quality incentive subsidies, organic certification cost, and organic
conservation technical assistance. The data were analyzed using descriptive statistics and
multiple linear regression. STATA was the statistical package employed in the analysis.
Major findings of this study are as follows.
Table 9 shows the descriptive statistics of trade-offs between organic acres and
other variables while holding the probability of subsidy requirements constant in that the
increased market for organic products explains about 60 percent of the variation in farmers’

64
willingness to adopt organic agriculture practices, thereby enhancing farmers in their
decision making process when transitioning. This finding confirms the work of Thilmany
et al. (2008) who found that farmers’ markets and specialty markets carrying organic
produce are increasingly becoming prevalent, particularly in larger cities. We also estimate
that each additional certified organic farmer operated and cost-share program enrolled in,
explained 58% variation in farmer’s willingness to adopt organic agriculture. This provides
evidence that the positive adoption effect arises not only from subsidy payment to farmers.
The degree of importance of these variables may change in the future as additional
variables are included and effective farming techniques are adopted.
Table 10. Trade-Offs Between Adoption Level and Other Variables to Hold Probability of Subsidy Requirement Constant Change in variables Willingness to
adopt organic
agriculture (%)
One thousand dollar (increase) in organic sales 60.78 (acres)
One acre (increase) in arable farms 58.35 (acres)
One thousand (decrease) in organic certification cost 25.90 (acres)
One unit (increase) adequacy of technical advice from enrolling in
cost-share program
58.44 (acres)
The study confirms that absence of organic subsidies, the presence of sales, and
increased number of farms enrolled in cost-share program are relevant for the adoption of
organic agriculture in the North Central states of the U.S. In addition, the presence of high
transitioning cost is detrimental in farmers’ decision-making process when converting to

65
organic agriculture. Finally, to confirm the robustness of the results, Table 10 lists the
results of testing the three hypotheses. Hypothesis II, the expectation of no effect in sales
on the adoption of organic agriculture is strongly rejected. We also reject Hypothesis I, but
more cautiously – farmers acquiring knowledge because of enrolling in cost-share
programs generates a relatively small positive effect, but this is only observable when it is
the only independent variable explaining the adoption of organic agriculture. Finally, we
reject the null hypothesis that organic certification cost has no effect on the adoption of
organic agriculture. The results in Table 10 confirm the importance of including all these
variables in the study though studies reviewed show that there is a wide variety of motives
for the conversion to organic agriculture.
Table 11. Results of Hypothesis Testing Null and Alternative
Hypothesis
Findings
Ha mean <0 Ha: mean !=0
Ha mean >0
HO: Sales =0
HA: Sales ≠ 0
Pr(T < t) = 1.0000 Pr(|T| > |t|) = 0.0000
Pr(T > t) = 0.0000
t = 5.0343
HO: Nocsp =0
HA: Nocsp ≠ 0
Pr(T < t) = 1.0000 Pr(|T| > |t|) = 0.0000
Pr(T > t) = 0.0000
t = 8.2392
HO: Ocertcost =0
HA: Ocertcost ≠ 0
Pr(T < t) = 1.0000 Pr(|T| > |t|) = 0.0000
Pr(T > t) = 0.0000
6.2 Conclusions
This study was motivated by the evolution of organic agriculture. We have analyzed

66
the effects of subsidies on the adoption of organic agriculture in 12 North-Central U.S.
states, and the implications of the existence of barriers to moving to organic farming.
Controlling for a range of factors including organic sales and cost-share programs, we find
a positive individual effect on organic agriculture adoption with the organic sales variables.
Our results suggest that the increase in organic acreage is due in part to the availability of
conversion subsidies. Without government assistance, most small-scale farmers are not
sufficiently motivated to switch to organic production due to the high initial costs involved
in transitioning. Further, increased institutional support could facilitate organic adoption
and its absence is detrimental to increasing the rate of adopting organic production
methods.
Based on the three models, we find clear evidence that the link between subsidies
and the level of organic adoption during the transitioning phase is positive, though the
magnitude of the regression coefficients varies substantially across subsidy type. While the
coefficients are relatively small, they are highly statistically significant. In terms of organic
adoption, the relationship is negative for the cost of certification, but not statistically
significant. These results are consistent with findings in the literature.
Finally, we found potential barriers to the adoption of organic farming and
identified problems with access to information, access to markets, farm structure and
availability of necessary organic inputs. Most importantly, the non-adoption of organic
practices may be due to its complexity and the need for an entire system change, higher
risks and possibly lower yields. In addition, organic agriculture might not be immediately
financially rewarding but could results in positive effects regarding soil fertility, animal
health or human health or general benefit to the environment.

67
6.3 Limitations of the Study
This study has some notable limitations. First, the results differ slightly from
previous studies, which are largely based on primary survey data. In contrast, our analysis
uses secondary data, and does not account for important factors such as knowledge and
access to appropriate technology, as well as favorable organic trade policies that could
motivate farmers to transition toward organic farming. The difference in results may also
be attributable to the use of proxies and adjustments to shortcomings in the collection of
primary data. Another limitation of this work includes the limited unavailability of
published data on organic agriculture.
6.4 Recommendations
While this study is focused on policies and subsidies associated with the adoption
of organic agriculture, possible future work could investigate relationships that may exist
between infrastructure for transport, handling, packaging and marketing, and the growth of
organic agriculture. This could help identify policies in the area of organic agriculture that
need attention and support. Future research could also consider testing whether there are
barriers that might prevent organic-transitioning farmers in acquiring organic subsidies.

68
REFERENCES
Best, H. (2008). “Organic agriculture and the conventionalization hypothesis: A case study
from West Germany”. Agriculture and Human Values 25(1): 95-106.
Claassen, R., Cattaneo, A., & Johansson, R. (2008). “Cost-effective design of agri-
environmental payment programs: US experience in theory and practice”.
Ecological economics, 65(4), 737-752
Coleman-Jensen, A., Gregory, C., & Singh, A. (2014). “Household food security in the
United States in 2013”. USDA-ERS Economic Research Report, (173).
Constance, D. H., & Choi, J. Y. (2010). “Overcoming the barriers to organic adoption in
the United States: A look at pragmatic conventional producers in
Texas”. Sustainability, 2(1), 163-188.
Constance, D. H., Choi, J. Y., & Lara, D. (2015). “Engaging the organic
conventionalization debate”. In Re-Thinking Organic Food and Farming in a
Changing World (pp. 161-185). Springer Netherlands.
Crowder, D. W., & Reganold, J. P. (2015). “Financial competitiveness of organic
agriculture on a global scale”. Proceedings of the National Academy of
Sciences, 112(24), 7611-7616.
DeLonge, M.S., Miles, A. and Carlisle, L., 2016. “Investing in the transition to sustainable
agriculture”. Environmental Science & Policy, 55: 266-273.
Dimitri, C., and Greene, C. (2000). “Recent growth patterns in the US organic foods
market”. Agriculture Information Bulletin, 777.
Dimitri, C., & Dettmann, R. L. (2012). “Organic food consumers: what do we really know
about them”. British Food Journal, 114(8), 1157-1183.
Dobbs, T. L., & Pretty, J. N. (2004). “Agri-environmental stewardship schemes and
“Multifunctional”. Applied Economic Perspectives and Policy 26(2), 220-237.
Dobbs, T. L., Shane, R. C., and Feuz, D. M. (2000). “Lessons learned from the Upper
Midwest organic marketing project”. American Journal of Alternative
Agriculture 15(03): 119-128.
Economic Research Service, USDA. Organic Agriculture. http://www.ers.usda.gov/Briefing/Organic/

69
Economic Research Service, USDA. Customized Data Summaries from ARMS. http://www.ers.usda.gov/Data/ARMS/.
Ellsworth, J. (2001). The History of Organic Food Regulation.
Fairweather, J. R. (1999). “Understanding how farmers choose between organic and
conventional production: Results from New Zealand and policy
implications”. Agriculture and Human Values, 16(1), 51-63.
Farmer, J., Peters, C., Hansen, E., Boettner, F., and Betcher, M. (2013). “Overcoming the
Market Barriers to Organic Production in West Virginia”. Bloomington: USDA
National Institute of Food and Agriculture.
Fernandez-Cornejo, J. (1998). “Environmental and economic consequences of technology
adoption: IPM in viticulture”. Agricultural economics, 18(2), 145-155.
Fetter, T. Robert, and Julie A. Caswell. (2002) “Variation in Organic Standards Prior to
the National Organic Program.” American Journal of Alternative Agriculture 17,
no. 2
Fibl.org: Media release of FiBL and IFOAM - Organics International of February 2016
Fransen, L., Schalk, J., & Auld, G. (2016). “Work ties beget community. Assessing
interactions among transnational private governance organizations in sustainable
agriculture”. Global Networks, 16(1), 45-67.
Greene, C. (2012, Oct 24). “USDA Economic Service- Growth Pattern in the US Organic
Industry”. Retrieved from http://www.ers.usda.gov/amber-waves/2013-
october/growth-patterns-in-the-us-organic-industry.
Greene, C. R., & Kremen, A. (2003). US organic farming in 2000-2001: Adoption of
certified systems (No. 33769). United States Department of Agriculture, Economic
Research Service.
Greene, C., Wechsler, S. J., Adalja, A., & Hanson, J. (2016). “Economic Issues in the
Coexistence of Organic, Genetically Engineered (GE), and Non-GE
Crops”. Economic Information Bulletin, 149.
Haedicke, M. (2016). “Organizing Organic: Conflict and Compromise in an Emerging
Market”. Stanford University Press
Halweil, B. (2006). “Can Organic Farming Feed Us All? Probably-but that may not be the
right question”. World Watch, 19(3), 18.

70
International Federation of Organic Agriculture Movements (IFOAM)-Organics
International.(n.d.).Retrieved from January 22, 2017, from
https://en.wikipedia.org/wiki/International_Federation_of_Organic_Agriculture_
Movements_(IFOAM)_-_Organics International
Jaenicke, E. C., & Carlson, A. C. (2015). “Estimating and Investigating Organic Premiums
for Retail- Level Food Products”. Agribusiness, 31(4), 453-471.
Kassam, A., Friedrich, T., Shaxson, F., & Pretty, J. (2009). “The spread of conservation
agriculture: justification, sustainability and uptake”. International Journal of
Agricultural Sustainability, 7(4), 292-320.
Kennedy, A. C., & Smith, K. L. (1995). “Soil microbial diversity and the sustainability of
agricultural soils”. Plant and soil, 170(1), 75-86.
Klonsky, K., & Greene, C. (2005, July). “Widespread adoption of organic agriculture in
the US: are market-driven policies enough”. In American Agricultural Economics
Association Annual Meeting, Providence, Rhode Island (pp. 2014-06).
Kongolo, M. (2014). “Resource Use Efficiency in Organic Vegetable Production: A Case
Study of Manzini Region, Swaziland”. Journal of Agricultural Studies, 2(2), 52-
61.
Lampkin, N. H., and S. Padel. (1994). "Organic farming and agricultural policy in Western
Europe: An overview." The Economics of Organic Farming. pp 437-454.
Lohr, L., and Salomonsson, L. (2000). “Conversion subsidies for organic production:
results from Sweden and lessons for the United States”. Agricultural
Economics 22(2): 133-146.
MacRae, R. J., Frick, B., and Martin, R. C. (2007). “Economic and social impacts of
organic production systems”. Canadian Journal of Plant Science 87(5): 1037-1044.
McBride, W. D., Greene, C., Foreman, L., & Ali, M. (2015). “The profit potential of
certified organic field crop production”. US Department of Agriculture, Economic
Research Service, ERR-188, July.
McFadden, B. R., & Stefanou, S. (2016). “Another Perspective on Understanding Food
Democracy”. Choices, 31(1).
McNeil M. (2015, May 19) U.S. “Organic sales post new record of $43.3 billion in 2015”.
Retrieved from https://www.ota.com/news/press-releases/19031

71
Mercier, S. (2016). Federal Benefits for Livestock and Specialty Crop Producers.
Choices,31, no (4).
Mercier, S. (2011). Review of US farm programs. AGree, Washington, DC. Nov.
Morath, S. J. (2015). The Farm Bill: A Wicked Problem Seeking a Systematic Solution.
Mosier, S. L., and Thilmany, D. (2016). Diffusion of food policy in the US: The case of
organic certification. Food Policy 61: 80-91.
Moumouni, I., Baco, M. N., Tovignan, S., Gbèdo, F., Nouatin, G. S., Vodouhê, S. D., &
Liebe, U. (2013). What happens between technico-institutional support and
adoption of organic farming? A case study from Benin. Organic Agriculture, 3(1),
1-8.
Nesheim, M. C., Oria, M., Yih, P. T., Resources, N., & Council, N. R. (2015).
Environmental Effects of the US Food System.
Niggli, Urs, Helga Willer, and Brian Baker. "A Global Vision and Strategy for Organic
Farming Research." (2016): 1-107
Novak, J. L., Pease, J. W., & Sanders, L. D. (2015). Agricultural Policy in the United
States: Evolution and Economics (Vol. 13). Routledge.
Offermann, F. (2003). “The influence of the EU common agricultural policy on the
competitiveness of organic farming.” Organic Agriculture: Sustainability, Markets
and Policies, 329.
Padel, S. (2001). Conversion to organic farming: a typical example of the diffusion of an
innovation? Sociologia Ruralis 41(1): 40-61.
Padel, S., and Lampkin, N. H. (1994). “Conversion to organic farming: an overview.” The
Economics of Organic Farming: An International Perspective: 295-313.
Pechrová, M. (2014). “Determinants of the Farmers' Conversion to Organic and
Biodynamic Agriculture”. AGRIS on-line Papers in Economics and
Informatics, 6(4), 113.
Pinstrup-Andersen, P., Pandya-Lorch, R., & Rosegrant, M. W. (1999). World food
prospects: Critical issues for the early twenty-first century.
Reganold, J. P., Jackson-Smith, D., Batie, S. S., Harwood, R. R., Kornegay, J. L., Bucks,
D., & Schumacher, A. (2011). Transforming US agriculture. Science, 332(6030),
670-671.

72
Reganold, J. P., & Wachter, J. M. (2016). “Organic agriculture in the twenty-first
century”. Nature plants, 2, 15221.
Rigby, D., & Cáceres, D. (2001). “Organic farming and the sustainability of agricultural
systems”. Agricultural Systems, 68(1), 21-40.
Rigby, D., Young, T., & Burton, M. (2001). “The development of and prospects for organic
farming in the UK”. Food Policy, 26(6), 599-613.
Santos, R. F., Antunes, P., Ring, I., & Clemente, P. (2015). “Engaging Local Private and
Public Actors in Biodiversity Conservation: The role of Agri-Environmental
schemes and Ecological fiscal transfers”. Environmental Policy and Governance,
25(2), 83-96.
Spark, A. (2014). “US Agricultural Policies and the US Food Industry”. Local Food
Environments: Food Access in America, 29.
Stubbs, M. (2014). “Conservation Reserve Program (CRP): status and issues”.
Congressional Research Service Report, 42783, 24p.
The geography of the Midwest
http://www.aprilsmith.org/lesson-11-the-midwest-states.html. incomplete
Thilmany, D., Bond, C. A., & Bond, J. K. (2008). “Going local: Exploring consumer
behavior and motivations for direct food purchases”. American Journal of
Agricultural Economics, 90(5), 1303-1309.
USDA-ERS (2001). “U.S. Organic Farming Emerges in the 1990’s: Adoption of Certified
Systems”. USDA, Economic Research Service, Resource Economics Division.
Agriculture Information Bulletin No. 770.
USDA Census of Agriculture. (n.d.). Retrieved from
https://www.ers.usda.gov/topics/natural-resources-environment/organic-
agriculture.
Van der Ploeg, J. D., Renting, H., Brunori, G., Knickel, K., Mannion, J., Marsden, T., &
Ventura, F. (2000). “Rural development: from practices and policies towards
theory”. Sociologia Ruralis, 40(4), 391-408.
Verhoog, H., Matze, M., Van Bueren, E. L., & Baars, T. (2003). “The role of the concept
of the natural (naturalness) in organic farming”. Journal of agricultural and
environmental ethics, 16(1), 29-49.

73
Warson, Jones, D (2007), Organic Agriculture: Sustainability, Markets and Policies. CABI
Publishing, Wallingford, UK, for Org. for Econ. Coop. and Dev., Paris.
Washington State University (2016, Feb 3). “Organic agriculture key to feeding the world
sustainably”. Retrieved from
https://www.sciencedaily.com/releases/2016/02/160203085855.htm.
Watson, C., Alrøe, H., Kristensen, E. S., Kristiansen, P., Taji, A., & Reganold, J. (2006).
“Research to support the development of organic food and farming”. Organic
agriculture: A global perspective, 361-383.
Youngberg, G., & DeMuth, S. P. (2013). “Organic agriculture in the United States: A 30-
year retrospective”. Renewable Agriculture and Food Systems 28(04), 294-328.

74
APPENDIX
Appendix I: Model 1 test for multicollinearity
Dependent Variable Model 1
VIF
Adjusted Model
VIF
Fedsub 1.36 1.32
Orgsales 7.79 6.00
Orgcertfms 19.40 5.63
Ocertcost 3.61 2.61
Oprgram 21.07 removed
R-squared 0.70 0.71
Adj-R-squared 0.69 0.69
Obs 126 126
Mean VIF 11.43 4.18
Appendix II: Model 2 test for multicollinearity
Dependent Variable Model 2
VIF
Adjusted model
VIF
Equipfund 2.00 2.00
Orgsales 10.02 8.22
Orgcertfms 16.85 4.66
Ocertcost 2.77 2.81
Oprgram 20.19 removed
R-squared 0.72 0.78
Adj-R-squared 0.77 0.77
Obs 126 126
Mean VIF 11.25 4.47

75
Appendix III: Model 3 test for multicollinearity
Dependent Variable Model 3
VIF
Adjusted Model
VIF
Otcap 1.10 1.10
Orgsales 8.24 6.52
Orgcertfms 16.92 4.76
Ocertcost 3.63 2.67
Oprgram 30.19 removed
R-squared 0.77 0.77
Adj-R-squared 0.75 0.76
Obs 126 126
Mean VIF 10.73 3.93
Appendix IV: Correlation Matrix
OAcreage
Octap Equifund
Febsub
Ocertcost
Osales
Ofarm
Nocsp
OAcreage
1.000
Octap 0.2461 1.000 Equifun
d 0.7378 0.586
9 1.000
fedsub 0.0163 0.6698
0.3372 1.000
Ocertcost
0.5147 -0.0967
0.3661 -0.1614
1.000
Osales 0.7816 0.0333
0.6683 -0.1016
0.7589 1.000
Ofarm 0.7660 -0.1039
0.5004 -0.2519
0.7477 0.8540
1.000
Nocsp 0.7686 -0.0615
0.5463 0.0306
0.6533 0.8649
0.8270
1.000

76
Appendix V: Table 9. Model IV: Regressing Adoption of Organic Agriculture On all subsidies
Explanatory Variable coefficient Standard errors
P-value
Subsidy to farmers (Otcap) 7.4462 1.2102 (0.000)**
Organic certification cost (Orgcertcost) -50.1021 16.8203 (0.043)**
Sales for organic product (orgsales) .1353 .0578 (0.097)***
Number of organic certified farmers (Orgcertfms)
136.5331 27.0822 (0.000)**
Number of farms enrolled in organic cost-share program (Nocsp)
239.4452 76.5373 (0.004)**
Intercept -54718.46 21522.73 (0.012)**
Observation 126
R2 0.7659
Adj-R2 0.7562