
ENCORE Fayette - Fayette County Economic Overview
55
An Economic Overview Fayette County, Georgia Thursday, February 14, 2013
-
Upload
matt-forshee -
Category
Education
-
view
513 -
download
5
Transcript of ENCORE Fayette - Fayette County Economic Overview

AnEconomic Overview
Fayette County, GeorgiaThursday, February 14, 2013

POPULATION
8

Population: 111,150
Average Household Income: $90,608
Cost of Living: 4.6% below national average
Labor Force: 835,562
Demographics

POPU
LATION
Fayette County Census Breakdown
2000 2010Growth
RateFayette CountyUnincorporated Area 43891 48697 9.87%Peachtree City 31580 34364 8.10%Fayetteville 11148 15945 30.08%Tyrone 3916 6879 43.07%Brooks 553 524 -5.53%Woolsey 175 158 -10.76%Fayette County (ALL) 91263 106567 14.36%
Population Breakdown
10
2000 20100
20000
40000
60000
80000
100000
120000
Woolsey
Brooks
Tyrone
Fayetteville
Peachtree City
Unincorporated Fayette
Daytime Population
36.60%
37.97%
19.58%
5.54% 0.31%

POPU
LATION
- AGEPopulation by Age
Population by Age, Summary
11
Age 0-9 Age 10-29 Age 30-44 Age 45-64 Age 65+
2000 2010Growth
Rate
2000 2010Growth
Rate
2000 2010Growth
Rate
2000 2010 Growth
Rate
2000 2010Growth
Rate2000 Total Pop
2010 Total Pop % of Pop % of Pop % of Pop % of Pop % of Pop
Fayette County (unincorporated) 5620 5172 -8.0% 11102 12306 10.8% 9987 7677 -
23.1% 13376 17078 27.7% 3706 6434 73.6%
43891 48697 12.8%
10.6% -17.2% 25.3
%25.3% 0.0% 22.8
%15.8%
-30.7%
30.5%
35.1% 15.1% 8.4% 13.2
% 57.1%
Peachtree City 4698 4208 -10.4% 8195 8614 5.1% 7915 6182 -21.9% 8260 11237 36.0% 2512 4123 64.1%
31580 34364 5.1% 12.2%
139.2%
26.0%
25.1% -3.5% 25.1
%18.0%
-28.3%
26.2%
32.7% 25.0% 8.0% 12.0
% 50.0%
Fayetteville 1604 1977 23.3% 2891 4177 44.5% 2821 3199 13.4% 2355 4353 84.8% 1477 2239 51.6%
11148 15945 14.4%
12.4% -13.9% 26.0
%26.2% 1% 25.3
%20.1%
-20.6%
21.1%
27.3% 29.4% 13.3
%14.0% 5.3%
Tyrone 526 940 78.7% 976 1641 68.1% 918 1395 52.0% 1178 2237 89.9% 318 666 109.4%
3916 6879 13.4%
13.7% 2.2% 25.0
%24.0% -4.0% 23.4
%20.3%
-13.2%
30.1%
32.5% 8.0% 8.1% 9.8% 21.0%
Brooks 65 55 -15.3% 135 131 -3.0% 122 86 -29.5% 163 201 23.3% 68 51 -25%
553 524 11.8% 10.5% -11.0% 24.4
% 25% 2.5% 22.1%
16.4%
-26.0%
29.5%
38.4% 30.2% 12.3
% 9.7% -21.1%
Woolsey 13 16 23.1% 53 30 -43.4% 35 21 -
40.0% 51 59 15.7% 23 32 39%
175 158 7.4% 10.1% 36.5% 30.3
%19.0%
-37.3% 20% 13.3
%-
33.5% 29% 37.3% 28.6% 13.1
%20.3% 55.0%
Fayette County (ALL) 12526 12368 -1.3% 23352 26899 15.2% 21798 18590 -14.7% 25383 35165 38.5% 8104 13545 67.1%
91263 106567 8.0% 7.0% -12.5% 25.6%
25.2% -2.0% 23.9
%17.4%
-27.2%
27.8%
33.0% 18.7% 8.9% 12.7
% 43.0%
Source: US CensusOverall, Fayette County is ageing as a community. The population age 0-44 declined from 2000 to 2010 by 5,821 people, while the population age 45+ added 15,223 people. This has impacts on our schools and services as well as our business community. How will our medical services, education, transportation, shopping, housing need to change to meet the needs of this changing demographic?

POPU
LATION
– AGE BREAKDOW
N
17%
32%30%
11%11%
2000 Census, Fayette, by age
0-910-2930-4445-6465+
0-9 10-29
30-44
45-64
65+
-40.0%
-30.0%
-20.0%
-10.0%
0.0%
10.0%
20.0%
30.0%
40.0%
50.0%
-12.5%-2.0%
-27.2%
18.7%
43.0%
Change in Growth Rate as a Share of Population, 2000 - 2010
12%
25%
17%
33%
13%
2010 Census, Fayette, by Age
0-910-2930-4445-6465+
2010
2000
0 50000 100000 150000
57,857
57,676
48,710
16,208
0-4445+
12

POPU
LATION
– RACE & ETHN
ICITYPopulation by Race & Ethnicity
Population by Age, Summary
13
White Black Asian Hispanic Other
2000 2010Growth
Rate
2000 2010Growth
Rate
2000 2010Growth
Rate
2000 2010Growth
Rate
2000 2010Growth
Rate2000 Total Pop
2010 Total Pop % of Pop % of Pop % of Pop % of Pop % of Pop
Fayette County (unincorporated) 34995 31934 -
8.74% 6868 11655 69.7% 659 1008 53.0% 1027 3284 219.8% 342 915 167.5
%
43891 48697 79.7%
65.6%
-17.7%
15.6%
23.9% 53.2% 1.5
%2.1% 40.0% 2.3
%6.7%
191.3%
0.8%
1.9%
137.5%
Peachtree City 26873 26790 -0.3% 1894 2509 32.5% 1152 1811 57.2% 1184 2442 106.3% 477 812 70.2%
31580 34364 85.1%
78.0% -8.3% 5.9% 7.3% 23.7% 3.6
%5.3% 47.2% 3.7
%7.1% 91.9% 1.5
%2.4% 60.0%
Fayetteville 8772 8345 -4.9% 1544 5223 238.3% 369 1053 185.4% 310 766 147.1% 153 458 199.3
%
11148 15945 78.7%
52.3%
-33.5%
13.9%
32.8% 136.0% 3.3
%6.6% 100.0% 2.8
%4.8% 71.4% 1.4
%2.9%
107.1%
Tyrone 3646 4490 23.1% 132 1722 1204.5% 39 231 492.3% 57 246 431.6
% 42 190 352.4%
3916 6879 93.1%
65.3%
-29.9% 3.4% 25.0
% 635.3% 1.0%
3.4% 240.0% 1.5
%3.6% 1.4% 1.1
%2.8%
154.5%
Brooks 539 493 -8.5% 2 3 50.0% 7 3 -57.1% 3 20 566.7% 2 5 150.0
%
553 524 97.5%
94.1% -3.5% 0.4% 0.6% 50% 1.2
%0.6% -50.0% 0.5
%3.8%
660.0%
0.4%
1.0%
150.0%
Woolsey 166 149 -10.2% 6 5 -16.7% 2 0 -
100.0% 1 2 100% 0 2 200%
175 158 94.9%
94.3% -0.6% 3.4% 3.2% -5.9% 1.1
%0.0%
-100.0%
0.6%
1.3% 116.7% 0.0
%1.3% 130%
Fayette County (ALL) 74991 72202 -3.7% 10446 21117 102.2% 2228 4106 84.3% 2582 6760 161.8% 1016 2382 134.4
%
91263 106567 84.2%
67.8%
-19.5% 11.4% 19.8
% 73.7% 2.4%
3.9% 62.5% 2.8
%6.3%
125.0%
1.1%
2.2% 100%
Source: US Census
Fayette is becoming increasingly diversified. Tyrone was the only area to see real growth White populations. All other areas of the county saw declines in white population. Black populations grew in all areas of the county, seeing double or triple digit percentage growth in all but two areas. There is the strong potential that sometime this decade, Fayetteville will become a majority-minority area. It currently has a white population of 52.3%.

POPU
LATION
– RACE & ETHN
ICITY, REGION
ALPopulation by Race & Ethnicity – Metro Atlanta
Distribution of the 0-9 Population by Race/Ethnicity, Metro Atlanta 2010
14

POPU
LATION
– RACE & ETHN
ICITY, REGION
ALDistribution of the 10-29 Population (Millennials) by Race/Ethnicity, Metro Atlanta 2010
Distribution of the 30-44 Population (Generation X) by Race/Ethnicity, Metro Atlanta 2010
15

POPU
LATION
– RACE & ETHN
ICITY, REGION
ALDistribution of the 45-64 Population (Baby Boomers) by Race/Ethnicity, Metro Atlanta 2010
Distribution of the 65+ Population by Race/Ethnicity, Metro Atlanta 2010
16

HOUSING
17

BUILDIN
G PERMITS
Housing Permits for Single Family Construction
18
Atlanta MSA
Fayette Clayton Coweta
# of permits % of ATL MSA # of permits % of ATL MSA # of permits % of ATL MSA
2012 (Jan – Jun) 4447 59 1.33% 23 0.52% 211 4.74%
2011 6291 71 1.12% 85 1.35% 336 5.34%
2010 6384 82 1.28% 143 2.24% 416 6.51%
2009 5421 75 1.38% 85 1.57% 314 5.79%
2008 11989 142 1.18% 403 3.36% 503 4.20%
2007 31089 355 1.14% 1238 3.98% 1120 3.60%
2006 53927 651 1.20% 2217 4.11% 1835 3.40%
2005 61558 906 1.47% 2106 3.42% 2049 3.33%
2004 57316 948 1.65% 2046 3.57% 1792 3.13%
2003 55033 907 1.64% 2519 4.58% 1730 3.14%
2002 50151 915 1.82% 2283 4.55% 1659 3.31%
2001 48423 916 1.89% 2534 5.23% 1657 3.42%

BUILDIN
G PERMITS
Monthly Building Permit
Jan-11
Mar-11
May-11
Jul-11
Sep-11
Nov-11
Jan-12
Mar-12
May-12
Jul-12
Sep-12
0
10
20
30
40
50
60
FayetteClaytonCoweta
19
BUILDIN
G PERMITS
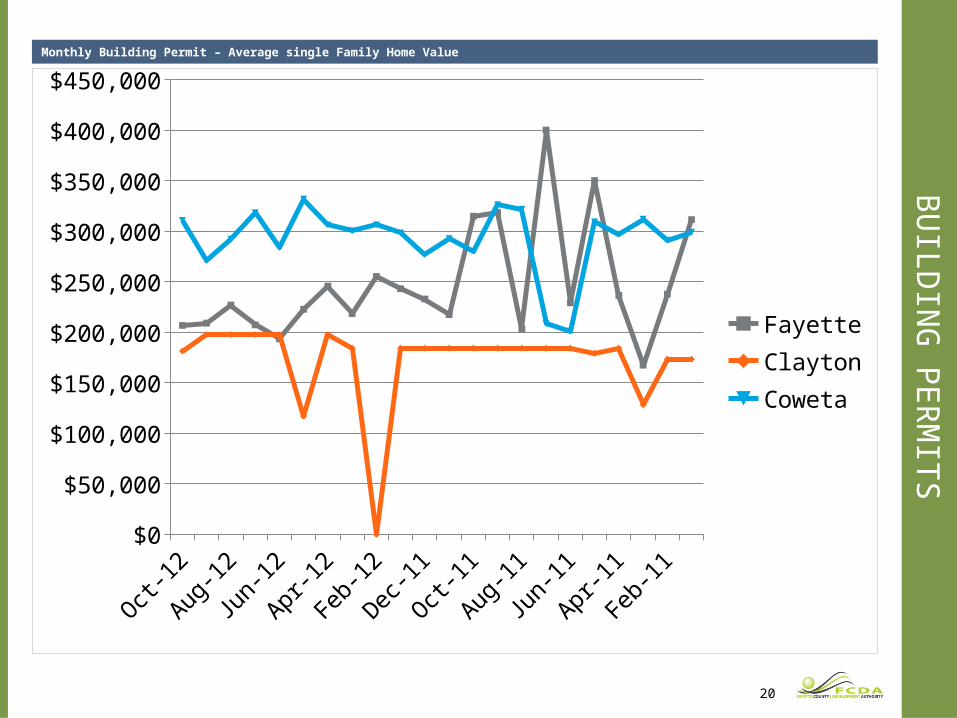
Monthly Building Permit – Average single Family Home Value
Jan-11
Mar-11
May-11
Jul-11
Sep-11
Nov-11
Jan-12
Mar-12
May-12
Jul-12
Sep-12
$0
$50,000
$100,000
$150,000
$200,000
$250,000
$300,000
$350,000
$400,000
$450,000
FayetteClaytonCoweta
20

TAXES
21

TAXESFayette County Revenue Sources, 2011
County Revenue Sources
Fayette County Governmental Expenses, by Function, 2011
Fayette County Taxable Property Estimated True Value
20022003
20042005
20062007
20082009
20102011
$0
$2,000,000,000
$4,000,000,000
$6,000,000,000
$8,000,000,000
$10,000,000,000
$12,000,000,000
$14,000,000,000
$16,000,000,000
Privately Owned Public UtilitiesPersonal PropertyReal Property
22
2007 2008 2009 2010 2011$0
$20,000,000
$40,000,000
$60,000,000
$80,000,000
$100,000,000
$120,000,000
OtherOther TaxesFeesSPLOSTSales TaxesProperty Taxes

TAXESSales Tax Revenues, 2012
$8,432,967.88
$7,451,163.39
$3,016,486.12
$670,915.39
Peachtree CityFayettevilleFayette CountyTyrone
23
MISC ECO
NO
MIC IN
DICATORS
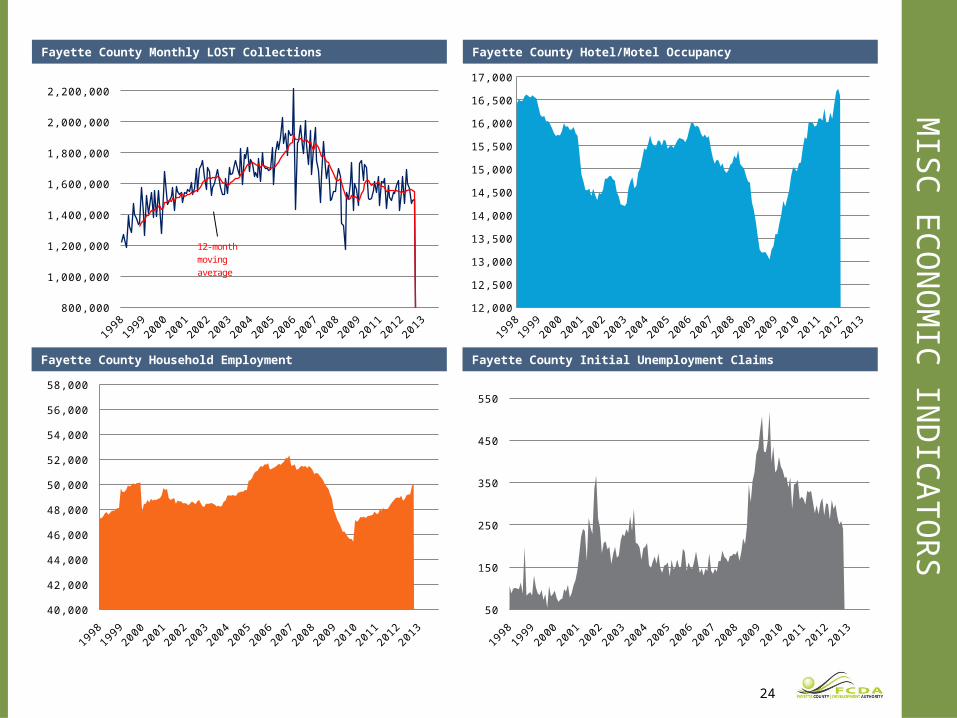
Fayette County Monthly LOST Collections
Fayette County Household Employment
Fayette County Hotel/Motel Occupancy
Fayette County Initial Unemployment Claims
24
1998
1998
1999
2000
2001
2002
2003
2003
2004
2005
2006
2007
2008
2008
2009
2010
2011
2012
2013
2013
800,000
1,000,000
1,200,000
1,400,000
1,600,000
1,800,000
2,000,000
2,200,000
12-month moving average
1998
1999
2000
2001
2001
2002
2003
2004
2004
2005
2006
2007
2007
2008
2009
2010
2010
2011
2012
2013
2013
12,000
12,500
13,000
13,500
14,000
14,500
15,000
15,500
16,000
16,500
17,000
1998
1998
1999
2000
2001
2002
2003
2003
2004
2005
2006
2007
2008
2008
2009
2010
2011
2012
2013
2013
40,000
42,000
44,000
46,000
48,000
50,000
52,000
54,000
56,000
58,000
1998
1999
2000
2000
2001
2002
2003
2003
2004
2005
2006
2006
2007
2008
2009
2009
2010
2011
2012
2012
2013
50
150
250
350
450
550

EMPLOYMENT
25

2000
2001
2002
2003
2004
2005
2006
2007
2008
2009
2010
2011
0
2000
4000
6000
8000
10000
12000 Total Population (in thousands)
Construction
Manufacturing
Wholesale Trade
Retail Trade
Transportation & Warehousing
Information
Finance & Insurance
Real Estate and Rental and Leasing
Professional, Scientific and Technical Services
Management of Com-panies and Enterprises
Administrative and Support and Waste Management
Arts, Entertainment & Recreation
Accomodation & Food Services
Other Services (except Public Admin)
Public Administration
Jobs by Employment Sector, 2000 - 2011

2000
2001
2002
2003
2004
2005
2006
2007
2008
2009
2010
2011
0
2000
4000
6000
8000
10000
12000
Total Population (in thousands)
Construction
Manufacturing
Administrative and Support and Waste Management
Arts, Entertainment & Recreation
Declining Jobs by Employment Sectors, 2000 - 2011

2000
2001
2002
2003
2004
2005
2006
2007
2008
2009
2010
2011
0
2000
4000
6000
8000
10000
12000Total Population (in thousands)
Wholesale Trade
Retail Trade
Transportation & Warehousing
Information
Finance & Insurance
Real Estate and Rental and Leasing
Professional, Scientific and Technical Services
Management of Com-panies and Enterprises
Accomodation & Food Services
Other Services (except Public Admin)
Public Administration
Growing Jobs by Employment Sector, 2000 - 2011

2009 2010 20110
2000
4000
6000
8000
10000
12000Total Population (in thousands)
Wholesale Trade
Retail Trade
Transportation & Warehousing
Finance & Insurance
Real Estate and Rental and Leasing
Management of Com-panies and Enterprises
Administrative and Support and Waste Management
Accomodation & Food Services
Growing Jobs by Employment Sector, 2009 - 2011

Houston; 13.4%Washington; 9.2%
Nashville; 6.6%Riverside; 6.6%Phoenix; 6.5%
Dallas-Fort Worth; 5.2%Seattle; 2.5%
San Diego; 1.6%Baltimore; 1.5%
Miami; 0.2%Denver; -1.4%Fayette; -1.5%
New York; -1.5%Tampa; -1.7%
Philadelphia; -2.3%Minneapolis; -2.5%
St Louis; -2.6%Atlanta; -2.8%
Chicago; -6.2%Los Angeles; -6.4%
San Francisco; -10.2%Detroit; -17.6%
Employment Change, 2001 - 2011

SO WAIT, WHERE ARE WE AGAIN?
31
FAYETTE COU
NTY CU
RRENT ECO
NO
MIC IN
DEX
32
Jan-9
8
Jan-9
9
Jan-0
0
Jan-0
1
Jan-0
2
Jan-0
3
Jan-0
4
Jan-0
5
Jan-0
6
Jan-0
7
Jan-0
8
Jan-0
9
Jan-1
0
Jan-1
1
Jan-1
2
Jan-1
370
75
80
85
90
95
100
105
110
115
120
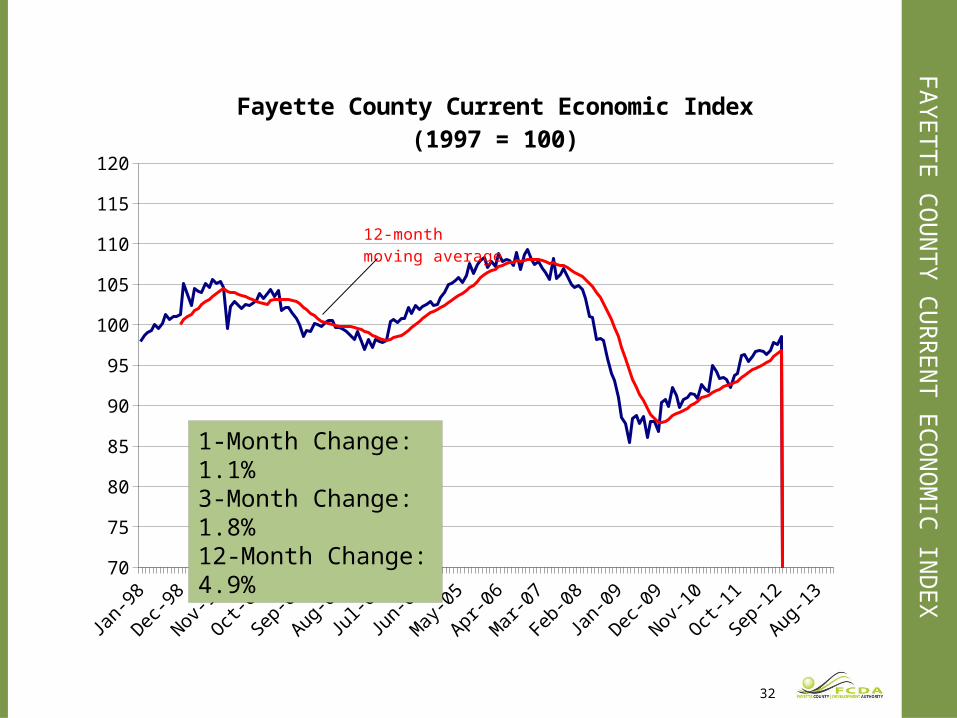
Fayette County Current Economic Index(1997 = 100)
12-monthmoving average
1-Month Change: 1.1%3-Month Change: 1.8%12-Month Change: 4.9%

FAYETTE COU
NTY LEADIN
G ECON
OM
IC INDEX
33
Jan-9
8
Jan-9
9
Jan-0
0
Jan-0
1
Jan-0
2
Jan-0
3
Jan-0
4
Jan-0
5
Jan-0
6
Jan-0
7
Jan-0
8
Jan-0
9
Jan-1
0
Jan-1
1
Jan-1
2
Jan-1
385
87
89
91
93
95
97
99
101
103
Fayette County Leading Economic Index(1997 = 100)
12-monthmoving average
1-Month Change: 1.5%3-Month Change: 0.9%12-Month Change: 3.5%

WHERE DO WE GO FROM HERE?
34

FCDA ORGAN
IZATION
BREAKDOW
N
Board of Directors
Administration
Recruitment
Marketing
Retention/Expansion

RECRUITING NEW
INDUSTRY & OFFICE

HELPING EXISTING BUSINESS
AND INDUSTRY EXPAND

Fayettega.org Newsletter
Marketing
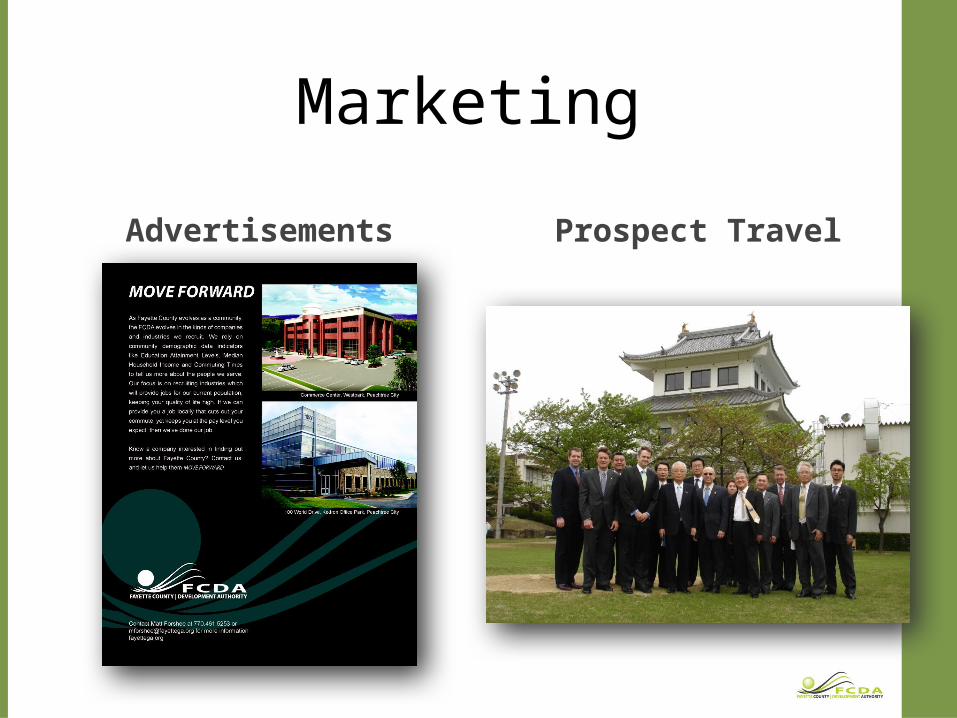
Advertisements Prospect Travel
Marketing

Site Selection Building Selection
Project Management

Demographics Existing Industry Data
Research

WHY
DO W
E RECRU
IT BU
SINE
SS?

WHY DO
WE RECRU
IT BUSIN
ESS?• increases the quality of life for
the citizens• allows people to live and work
in the same community• corporations give back to the
community

HOW
DO W
E RECRUIT
Allies & Partners

HOW
DO W
E RECRUIT
Allies & PartnersConsultants & Brokers

HOW
DO W
E RECRUIT
•Allies & Partners•Consultants & Brokers•Direct to Companies•Newsletters•Advertising & Events

WHO
DO W
E RECRUIT
Headquarters

WHO
DO W
E RECRUIT
HeadquartersClean Manufacturing & Assembly

WHO
DO W
E RECRUIT
HeadquartersClean Manufacturing & AssemblyAviation Related Industry

WHO
DO W
E RECRUIT
• Headquarters• Clean Manufacturing & Assembly• Aviation Related Industry• Small Business & Entrepreneurs• Light Warehousing• Medical (growth segment)

ACTIVITY OVER THE LAST 3 YEARS

ACTIVITY OVER THE LAST 3 YEARS

Approximately 20-30 minutes south of Atlanta.
Accessed via Interstates 85 and 75
Approximately 15-20 minutes to Hartsfield-Jackson Atlanta Intl Airport
Fayetteville is county seat, Peachtree City is largest city
Location

2 Amphitheaters with nationally touring acts
Over 100 holes of championship caliber golf
Recreation fields for soccer, football, baseball, lacrosse. 18 court Peachtree City Tennis Center.
Full BMX course
Legacy Theater – professional stage company
Three lakes for recreation activities
“Top 25 Arts Destination”-AmericanStyle Magazine
Numerous open parks & playgrounds
Culture & Rec
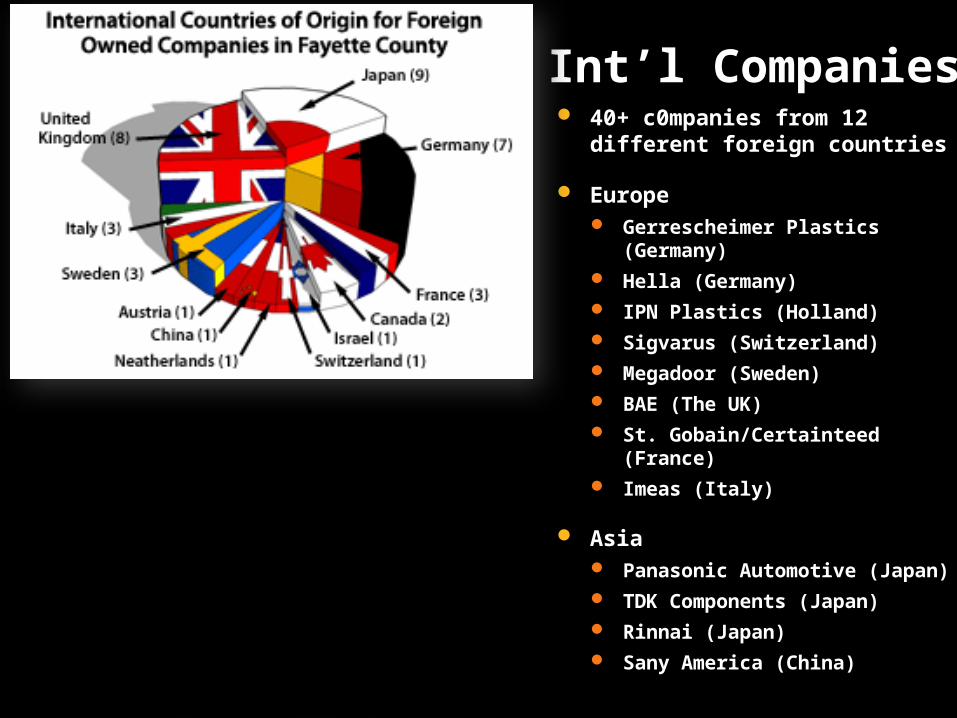
40+ c0mpanies from 12 different foreign countries
Europe Gerrescheimer Plastics
(Germany) Hella (Germany) IPN Plastics (Holland) Sigvarus (Switzerland) Megadoor (Sweden) BAE (The UK) St. Gobain/Certainteed
(France) Imeas (Italy)
Asia Panasonic Automotive
(Japan) TDK Components (Japan) Rinnai (Japan) Sany America (China)
Int’l Companies

Atlanta Regional Airport – Peachtree City Falcon Field
Over 20 Aviation related Companies in Fayette County AIM Aircraft Spares (OEM
Mfg) Aircraft Spruce & Specialty
(Parts) Aventure Aviation (Parts
Supplier) Clayton International
(Helicopter Refurbishing) Priority Jet (Aviation Services) Dixie Aerospace (OEM Mfg Gardner Aviation (Aviation
Maintenance) MegaDoor (Air Hanger Doors) NAECO (Aviation Parts Mfg) Plastikos (Fiberglass Mfg) RAS (Metal Forming for Parts) World Airways (Airline HQ)
Aviation

Major location in metro Atlanta for headquarter operations
Highly educated workforce with college degrees
15-20 minute drive to Hartsfield-Jackson Atlanta International Airport (ATL)
High quality of life elements (schools, recreation, shopping, entertainment)
Sample of Existing HQ operations: World Airways (HQ, Operations,
Flight center) Sany America (HQ, R&D, Mfg) Panasonic Automotive (HQ, R&D) Cooper Lighting (HQ, R&D, Logistics) Cooper Wiring Devices (HQ, R&D) NCR (Division HQ) Hoshizaki (HQ, Mfg) MegaDoor (HQ, Mfg) UES (HQ, Mfg) Rinnai (HQ, R&D) IPN USA (HQ, R&D, Mfg) SMC3 (HQ, command center)
Headquarters

60 acre greenfield site, south side of airport. Utilities installed. Ready for development.
Site 1 - Airport

100,000 sf speculatively built industrial building on 12 acres.
Expansion space for an additional 100,000 sf (200,000 sf total)
Site 2 – Peachtree City Spec Building
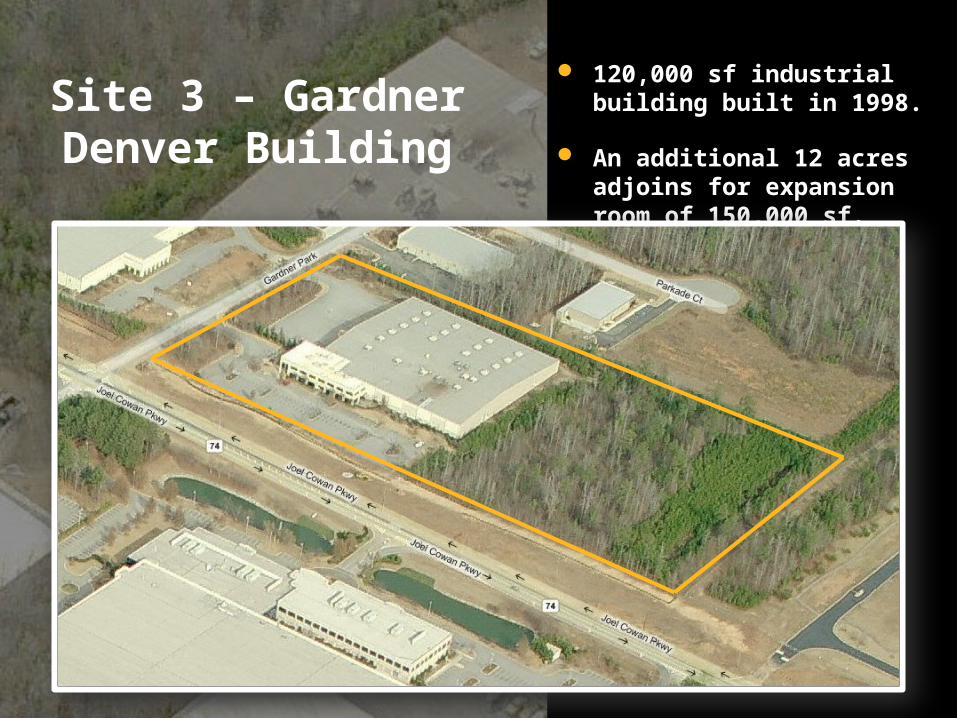
120,000 sf industrial building built in 1998.
An additional 12 acres adjoins for expansion room of 150,000 sf.
Site 3 – Gardner Denver Building

To learn more about the business opportunities in Fayette County, contact the Fayette County Development Authority. We can help you with:
• Available site and building information• Comprehensive demographic information• Labor statistics• Community tours• Customized state incentive proposals• Groundbreaking ceremony coordination
Matt Forshee, President/[email protected]
PH: 770-461-5253 • FX: 770-460-0259www.fayettega.org
200 Courthouse SquareFayetteville, GA 30214