Enabling Supply Chain Excellence™ Printed in Canada … · — to be the dominant Supply Chain...
69
Enabling Supply Chain Excellence™ © 2005, TECSYS Inc. All names, trademarks, products and services mentioned are registered or unregistered trademarks of their respective owners. Printed in Canada 075122 TECSYS Inc. 87 Prince Street 5th Floor Montreal, Quebec Canada H3C 2M7 Tel.: (800) 922-8649 or (514) 866-0001 Fax: (514) 866-1805 www.tecsys.com Annual Report 2005
Transcript of Enabling Supply Chain Excellence™ Printed in Canada … · — to be the dominant Supply Chain...

Enabling Supply Chain Excellence™© 2005, TECSYS Inc.All names, trademarks, products and services mentioned are registered or unregistered trademarks of their respective owners.
Printed in Canada 075122
TECSYS Inc.
87 Prince Street
5th Floor
Montreal, Quebec
Canada H3C 2M7
Tel.: (800) 922-8649 or (514) 866-0001
Fax: (514) 866-1805
www.tecsys.com
Annual Report 2005

Our Vision
TECSYS is in relentless pursuit of one goal — to be the dominant Supply Chain Management (SCM) software technology and solutions provider for distribution-centric operations. Our specifi c focus is in healthcare, import-to-retail, third-party logistics (3PL) providers, and high-volume wholesale-to-retail distribution. Today, hundreds of world-class companies and thousands of facilities with complex, high-volume order fulfi llment and warehousing environments rely on EliteSeries in the Unix/Linux and iSeries environments, PointForce Enterprise in the Unix/Linux and Microsoft environments, and TECSYS Transportation Management Systems in all environments where multi-carrier shipping needs to be managed. In each and every case, the goal is to achieve the highest level of customer service at the lowest possible operating costs.
Our Mission
We aim to deliver the highest value to our clients, with unparalleled industry solutions based on our advanced, proven technologies and feature-rich suites of enterprise SCM and logistics applications. Backed up by the breadth and depth of our employees’ expertise, and focused by our “Customers for Life” philosophy, we continue to be the software vendor of choice because of our value as a strategic business partner. By leveraging the full power of our solutions to improve the effi ciency and profi tability of their businesses, our clients continue to soar as leaders in their respective fi elds.

Table of Contents
Message to Shareholders ................................................................................... 3
Chairman’s Perspective ..................................................................................... 4
Management’s Discussion and Analysis .......................................................... 5
Management’s Report ......................................................................................22
Auditors’ Report to the Shareholders of TECSYS Inc. ...............................23
Financial Section ...............................................................................................24
General Information .........................................................................................64
Directors and Executive Management ..........................................................65
Corporate Information ....................................................................................66
Distributors ........................................................................................................67

We began fi scal 2005 as a North American business delivering great enterprise supply chain solutions to the distribution market. Our technology platforms were Linux/Unix and Windows, and our annualized run rate was in the low US$20 million range.
We ended fi scal 2005 with a European subsidiary serving the major Western European countries, solutions for all three viable technology platforms on the market today, a much more multilingual product offering, a strategic agreement with SAP to resell its product and deliver complementary products and services, and an annualized revenue run rate in the low US$30 million range. Our overall revenue growth was 38%.
Our focus hasn’t changed — we enable supply chain excellence — but we have expanded our platforms and territories to the extent that if you have a supply chain problem, we have a state-of-the-art solution for you.
Our accomplishments during fi scal 2005 included our fi rst complete implementations in Europe, providing us a strong foothold in the European supply chain solutions market. We also made further inroads into healthcare, adding another hospital group as well as several pharmaceutical and medical/surgical distributors. We are now positioned as a key supply chain solution provider to this growing, dynamic industry with its own particular set of challenges.
We furthered our Supply Chain Excellence strategy with the acquisition of Markham-based Application Solutions Inc., a leading Canadian provider of warehouse management solutions for IBM iSeries. We also acquired Symplistech Inc., a consulting fi rm specializing in SAP implementations, with customers in the U.S. and Canada and more than 15 successful implementations under its belt.
Unwavering Focus, Widening Scope
Message to Shareholders
We noted several continuing trends during the fi scal year in the enterprise software industry as a whole:
• Consolidation continued unabated in the form of mergers and acquisitions, with mergers occurring at all levels of the market.
• Customer project activity began to pick up as business capital spending began to return to more normal levels in this space. We signed 34 new accounts during the year.
• The growth of offshore manufacturing continued, and with it came increased demand for global trade management. High volume, multinational distribution organizations continue to need effi cient enterprise systems to manage transactions and physical logistics on a global basis.
In summary, we are delighted to report of a year of great progress. Our balance sheet remains strong, and we are a substantially larger business than we were a year ago. We look forward to fi scal 2006 from a position of strength.
I would like to take this opportunity to thank our customers, employees, partners, and shareholders for their continued support, and our Board members for their astute guidance.
Peter BreretonPresident and Co-CEO
Unwavering Focus, Wideni

Chairman’s Perspective
Positioned at the Forefront
Logistics Management Group. This acquisition, along with our new partnership with SAP to resell its products in the mid-market, positions us as a solid option for companies that have made or are making the decision to standardize on SAP.
Our expansion into various niches of our market, coupled with our acquisition strategy, necessitated some changes in our corporate marketing. We have consolidated the identity of our divisions so that they now all operate under the TECSYS banner, each with a specifi c division name related to its mission: Enterprise Supply Chain Group (formerly the EliteSeries Group), Logistics Management Group (formerly ASI), SMB Group (formerly PointForce) and Transportation Management Group.
In the coming year, we will continue our strategy of acquiring and developing business applications for the supply chain management space where we believe it delivers excellent value for our shareholders, and we will pursue our aggressive growth strategy through internal growth and acquisitions. We plan to be a leader in the mid-market supply chain execution space, delivering high value and solid returns to our shareholders.
On a community note, I am pleased to report that the TECSYS Foundation for Youth continues to make a difference in the lives of young people. The foundation’s Montreal school, Education Plus, achieved a major milestone this year by celebrating its tenth anniversary. Since it opened, the school has seen around 200 students receive their high school diplomas.
On behalf of the Board of Directors I would like to thank our employees, shareholders, the investment community, our customers and partners for their support. In closing, I would personally like to extend my sincere thanks and appreciation to the distinguished individuals who make up our Board of Directors. Their guidance and commitment is invaluable.
David BreretonChairman of the Board and Co-CEO
Fiscal 2005 saw continued and accelerated market consolidation in the supply chain execution space, and TECSYS solidifi ed its position at the forefront of this trend. With only a handful of mid-tier suppliers left to focus on small and medium-sized businesses, we continued to move ahead of the pack and remain one of the few companies able to deliver fully integrated solutions with the latest technology effectively. Our advanced technology is ahead of that of many of our competitors, and we continue to be guided by our “customers for life” philosophy, placing the customer at the center of everything we do.
We are pursuing our strategy to capture market share and increase shareholder value and market capitalization. In terms of fi nancial performance, we have increased revenue, and cash flow from operations, while reducing days sales outstanding.
Our two acquisitions during the year were both right in the sweet spot of our target, and provide us with additional points of entry into this increasingly concentrated space, as well as a substantial customer base.
Application Solutions Inc. (ASI), now TECSYS’ Logistics Management Group, provides us with approximately 50 marquis customers, including Honda Canada Inc., ICI Canada Inc., adidas-Salomon Canada Ltd., Schenker of Canada Ltd. and Bayer Inc., and an excellent product suite for the iSeries (formerly the AS/400) world. The acquisition furthers our expansion in the supply chain execution market by opening up the proprietary IBM market to us. It also positions us as an early leader in business opportunities for radio frequency identifi cation devices and mobile warehouse management solutions.
Recognizing that approximately 40% of companies buying ERP systems are buying SAP’s supply chain execution solutions, at least in the mid-range to high-end segment of that market, we acquired Symplistech Inc., a leading Canadian consulting firm specializing in SAP implementations. Symplistech Inc. is profitable, and we expect this transaction to be accretive to earnings. Its track record in a number of industries, including consumer packaged goods and electronics manufacturing, make it a key addition to our

Management’s Discussion
and Analysis
TECSYS Inc. Annual Report 2005

6 TECSYS Inc. Annual Report 2005
Management’s Discussion and Analysis of Financial Condition and Results of Operations
The following discussion and analysis should be read in conjunction with the Consolidated Financial Statements and Notes thereto, which are included in this document. The Company’s fi scal year ends on April 30. Fiscal 2005 refers to the twelve-month period ended April 30, 2005.
The Company’s consolidated fi nancial statements have been prepared in accordance with Canadian generally accepted accounting principles, and all fi nancial data derived therefrom in this annual report are expressed in U.S. dollars. The Company’s reporting currency is the U.S. dollar; however, the functional currency is the Canadian dollar. Accordingly, the fi nancial statements for the years ended April 30, 2005, 2004 and 2003 are translated into U.S. dollars using the current rate method. All gains and losses resulting from the translation of the consolidated fi nancial statements into U.S. dollars are refl ected in the cumulative translation adjustment in shareholders’ equity.
In addition, the consolidated fi nancial statements include a reconciliation of the signifi cant measurement differences between Canadian and United States generally accepted accounting principles as they relate to the Company.
OverviewThe Company is a leading Supply Chain Management (SCM) software provider that delivers powerful enterprise distribution, warehouse and transportation logistics solutions.
In response to the continuing challenging business climate for capital spending in information technology in recent years, the Company maintained its vigilance to insure that its business-operating model is in line with realistic revenue expectations. The Company also continued its investment in research and development and launched its latest suite of enterprise distribution applications — EliteSeries 7.3. This new release capitalizes on the Services-Oriented-Architecture (SOA) application development environment and delivers leading edge capabilities such as “anywhere, anytime” distribution management. This release also strengthens the international appeal with improved multilingual and multi-currency support. The Company has also adopted a strategy of acquisition for growth to leverage its strength and expertise in the SCM software industry.
On February 28, 2005, the Company acquired 100% of the issued and outstanding shares of Application Solutions Inc. (“ASI”), a leading Canadian provider of best-of-breed warehouse management systems, Radio Frequency Identifi cation Device (RFID) solutions, and system integration services on the IBM iSeries platform. ASI’s solutions have integrated with key ERP solutions in the market including SAP, SSA, Oracle/Peoplesoft/JDE, and MS Business Solutions. ASI was wound-up into TECSYS Inc. on March 1, 2005, and the results of its operations are included in the accompanying fi nancial statements commencing on that date.
On March 31, 2005, the Company acquired 100% of the issued and outstanding shares of Symplistech Inc. (“Symplistech”), a Canadian consulting practice specializing in the implementation of SAP solutions for manufacturing, warehousing, and distribution businesses. Symplistech was wound-up into TECSYS Inc. on April 1, 2005 as an integral part of the operations of the Logistics Management Group (LMG, formerly ASI), and the results of its operations are included in the accompanying fi nancial statements commencing on that date.
For the two-month period ended April 30, 2005, LMG (formerly ASI and Symplistech) contributed $2.7 million to revenues and $685,000 to income from operations.
During the previous fi scal year, on December 31, 2003, the Company acquired 100% of the issued and outstanding shares of PointForce Inc. (“PointForce”), a company which develops, markets, and sells distribution software primarily to the gift and home decor market. PointForce was wound-up into TECSYS Inc. on January 1, 2004 and the results of its operations are included in the accompanying fi nancial statements commencing January 1, 2004. PointForce currently operates as a division of TECSYS known as the Small Medium Business (SMB) group.

TECSYS Inc. Annual Report 2005 7
During fi scal year 2005, the Company renewed its banking agreement with the National Bank of Canada as described in note 8 of the consolidated fi nancial statements. This agreement obliges the Company to respect certain covenants in the form of fi nancial ratios, which have been respected.
The Company generates revenue through the licensing of proprietary and third-party products, including third-party software licenses and hardware, and the provision of related information technology services.
Services revenue includes both the fees associated with implementation assistance and billings for ongoing services. These ongoing services include consulting, training, product adaptations, implementation assistance, maintenance and customer support. Such revenue is typically derived from contracts based on a fi xed-price or time-and-material basis and is recognized as the services are performed.
Products revenue has two components: third-party products and the Company’s proprietary products. In fi scal 2005, third-party products represented 19% of total revenue (22% in fi scal 2004 and 21% in fi scal 2003) and include products developed by Oracle Corporation, IBM Corporation, SAP Canada Inc., Psion Teklogix Inc., Cognos Incorporated, Intermec Systems Corporation, Optio Software Inc., Best Software Canada Ltd., and Radio Beacon Inc. Proprietary products’ revenue was 17% of revenue for fi scal year 2005, 16% and 15% for fi scal years 2004 and 2003 respectively.
Cost of revenue comprises the cost of products purchased for re-sale and the cost of services, made up mainly of salaries, incentives, benefi ts and travel expenses of all personnel providing services. Also included in the cost of service is a portion of overhead and multimedia tax credits available under a Quebec government incentive program designed to support the development of the multimedia industry (as described in note 1). This program became effective in fi scal year 1999. Cost of products purchased for re-sale includes all products not developed by the Company that are required for a sale. These are typically other software products but may include hardware such as radio frequency equipment and servers.
Sales and marketing, as well as general and administration expenses, include all human resources costs involved in these functions. They also include all other costs related to sales and marketing, such as travel, rent, professional fees, offi ce expenses, training, telecommunications, bad debts, and equipment rentals and maintenance. The Company is also committed to donate approximately one-half of one percent of revenue to charitable organizations. Such amounts are included in general and administration expenses.
Research and development (R&D) includes salaries, benefi ts, incentives and expenses of all staff assigned to R&D. Fees paid to external consultants and sub-contractors are also included, along with a portion of overhead.
The Company’s employees number 241 at the end of fi scal 2005 in comparison to 224 at the end of fi scal 2004. The average number of employees for the Company increased to 221 in fi scal 2005 compared to 186 in fi scal 2004.
Quarterly Selected Financial DataIn thousands of U.S. dollars, except per share data
Fiscal Year 2005 Fiscal Year 2004
Q1 Q2 Q3 Q4 Total Q1 Q2 Q3 Q4 Total
Total Revenue 5,345 5,495 5,303 8,129 24,272 3,766 4,147 4,175 5,462 17,550Net Earnings (Loss) 136 (316) 180 334 334 10 24 20 361 415
Basic and DilutedNet Earnings (Loss)per Common Share(in U.S. dollars) 0.01 (0.02) 0.01 0.02 0.02 – – – 0.03 0.03

8 TECSYS Inc. Annual Report 2005
Results of OperationsYear ended April 30, 2005 compared to year ended April 30, 2004
RevenueTotal revenue increased 38% or $6.7 million to $24.3 million in fi scal 2005 compared to $17.6 million in fi scal 2004. The Company’s latest acquisitions, ASI and Symplistech (LMG) contributed $2.7 million in revenues for the two-month period ended April 30, 2005. The Company’s acquisition from the prior fi scal year, PointForce, contributed to revenues for $5.5 million in fi scal 2005 compared to $1.9 million for four-month period ended April 30, 2004 in the previous fi scal year. Excluding the revenue contributions of the above-mentioned acquisitions in both fi scal periods, revenue increased by $428,000 or 3% in fi scal 2005 in comparison to fi scal 2004.
Products revenue increased by 29% or $1.9 million to $8.6 million compared to $6.7 million for the previous fi scal year. LMG contributed $1.9 million of that increase, while PointForce’s products revenue for the twelve-month period in fi scal 2005 increased by $746,000 to $1.3 million in comparison to $528,000 for the four-month period in fi scal 2004. Excluding the revenue contributions of the above-mentioned acquisitions in both fi scal periods, products revenue decreased by $747,000 or 12% to $5.4 million in fi scal 2005 in comparison to $6.1 million for fi scal 2004. This decrease is due exclusively to decreases of third-party products revenue amounting to $928,000 while proprietary license revenues increased by $181,000. In fi scal 2004, several large orders of third-party products were shipped to signifi cant customers.
Services revenue increased 47% to $15.0 million from $10.2 million in the previous year, an increase of $4.8 million. LMG contributed $790,000 of that increase, while PointForce’s services revenue for the twelve-month period in fi scal 2005 increased $2.8 million to $4.1 million in comparison to $1.3 million for the four-month period in fi scal 2004. Excluding the revenue contributions of the above mentioned acquisitions in both fi scal periods, services revenue increased $1.2 million or 14% to $10.0 million in fi scal 2005 compared to $8.8 million in the previous fi scal year. The increased revenues are due to a higher number of accounts under implementation in fi scal 2005 as compared to fi scal 2004 in all service areas including consulting, product adaptations, and support.
As a percentage of total revenue, products revenue and services revenue were 35% and 62% respectively in fi scal 2005 in comparison to 38% and 58% respectively for fi scal 2004. The reduction of the products revenue percentage is mainly attributable to the decrease of products revenue of $747,000 described above.
The Canadian dollar has strengthened approximately 6% against the U.S. dollar in fi scal 2005 in comparison to fi scal 2004. The U.S. dollar to Canadian dollar exchange rates for fi scal 2005 averaged 1.2697 in comparison to 1.3434 for fi scal 2004. Consequently, excluding LMG, the strengthening Canadian dollar affected the reported revenues favorably by an estimated $537,000 or 2% in fi scal 2005. On the other hand, the strengthening Canadian dollar affected services expenses and operating expenses adversely by an estimated $966,000 in fi scal 2005.
Source of Revenue FY2005 Graphic Breakdown of Revenue FY2005
U.S.
50%
Other
1%
Canada
49%
Services
62%
Reimbursable Expenses
3%
Products
35%

TECSYS Inc. Annual Report 2005 9
Cost of RevenueTotal cost of revenue in fi scal 2005 increased by $3.7 million or 45% to $11.9 million in comparison to $8.2 million for the previous fi scal year. LMG accounted for $1.5 million of this increase for the two-month period ended April 30, 2005. The Company’s acquisition from the prior fi scal year, PointForce, incurred cost of revenues for $2.9 million in fi scal 2005 compared to $1.1 million for four-month period ended April 30, 2004 in the previous fi scal year.
Services costs increased by $2.6 million or 48% to $8.0 million in fi scal 2005 compared to $5.4 million in fi scal 2004. LMG accounted for $524,000 of this increase for the two-month period ended April 30, 2005. PointForce incurred services expenses of $2.4 million in fi scal 2005 in comparison to $766,000 for the four-month period ended April 30, 2004 refl ecting an increase of $1.6 million. Excluding the above-mentioned acquisitions in both fi scal periods, services costs increased by $470,000 or 10% in fi scal 2005 in comparison to fi scal 2004 while revenues increased 14%. The increase in services costs, excluding LMG and PointForce, is primarily attributable to unfavorable impact of the strengthening Canadian dollar estimated at $263,000 and the reduction of $94,000 to $518,000 of multimedia tax credits in fi scal 2005 compared to $612,000 in fi scal 2004. The reduction in multimedia tax credits is due to the slightly reduced services headcount in fi scal 2005 in comparison to fi scal 2004.
Costs related to third-party products increased $1.1 million or 52% to $3.2 million in fi scal 2005 compared to $2.1 million for the previous year. LMG accounted for $949,000 of this increase for the two-month period ended April 30, 2005 while PointForce incurred increased costs of $160,000 in fi scal 2005 compared to the four-month operating period in fi scal 2004.
As a result of the strengthening Canadian dollar against the U.S. dollar for fi scal 2005 as compared to fi scal 2004, the cost of revenues for fi scal 2005, excluding LMG, was unfavorably impacted by approximately $398,000.
Gross MarginTotal gross margin increased $3.0 million or 32% to $12.4 million in fi scal 2005 compared to $9.4 million in the previous fi scal year. The gross margin percentage decreased to 51% in fi scal 2005 in comparison to 53% for fi scal 2004. The decline in the gross margin percentage is primarily attributable to a higher ratio of revenue derived from services (62% in fi scal 2005 compared to 58% in fi scal 2004) which carry a lower margin compared to products and the addition of LMG which has an overall gross margin of 45%.
LMG contributed $1.2 million to the gross margin for the two-month period ended April 30, 2005 with an overall gross margin percentage of 45%. LMG’s lower gross margin percentage is due to the fact that its product revenue mix is weighted more heavily on hardware and supplies, which carry a lower gross margin, than proprietary and third-party software licenses. Additionally, LMG’s gross margin for services is lower compared to the gross margin of the existing business mainly due to the fact that a portion of their service revenues comprises the repair of third-party hardware products which carries a signifi cantly lower gross margin.
PointForce’s gross margin was 48% with a contribution of $2.6 million in fi scal 2005 compared to 44% and a contribution of $850,000 for the four-month period ended April 30, 2004. PointForce’s gross margin realization is 68% for products and 43% for services in fi scal 2005 compared to 53% for products and 43% for services for the four-month period in fi scal 2004. The increase of the products gross margin in fi scal 2005 compared to fi scal 2004 is due to the higher ratio of proprietary software licenses within the product revenue mix which carry a higher margin than third-party products.
Excluding the gross margin contributions of the above-mentioned acquisitions in both fi scal periods, gross margin increased by $23,000 in fi scal 2005 in comparison to fi scal 2004 while the gross margin percentage was 53% in fi scal 2005 compared to 55% for fi scal 2004. This decrease in gross margin percentage is primarily attributable to a change in the revenue mix. In fi scal 2005, services accounted for 63% of revenues compared to 56% in fi scal 2004. Services carry a signifi cantly lower gross margin compared to products.

10 TECSYS Inc. Annual Report 2005
Operating ExpensesTotal operating expenses increased 34% or $3.0 million to $11.9 million in fi scal 2005 compared to $8.9 million in fi scal 2004. The LMG operating activity for the two-month period ended April 30, 2005 accounted for $549,000 of the increase, while PointForce’s operating expenses for fi scal 2005 exceeded the four-month operating expenses of fi scal 2004 by $1.8 million (2005 - $2.7 million, 2004 - $822,000). The Company’s adoption of the new stock-based compensation standards without restatement (see note 1) effective May 1, 2004 accounted for $174,000 of additional operating expenses.
Total operating expenses excluding the above-mentioned acquisitions in both fi scal years and the adoption of the stock-based compensation standards, increased by $475,000 or 6% over the comparable activity for fi scal 2004. This increase is due primarily to the unfavorable impact of the strengthening Canadian dollar, higher bad debt expense, and the reduction of investment tax credits offset by favorable variances regarding reversed accumulated accruals for the disputed allocation of common space at one of the Company’s facilities. Please refer to the “general and administration” discussion below for more specifi c details.
As a result of the strengthening of the Canadian dollar against the U.S. dollars for fi scal 2005, as compared to fi scal 2004, excluding LMG, operating expenses for fi scal 2005 were unfavorably impacted by approximately $568,000 or 6% of the 2004 operating expenses.
Sales and MarketingExpenses increased 33% or $1.3 million to $5.1 million in fi scal 2005 from $3.8 million in fi scal 2004. LMG accounted for $352,000 of the increase while PointForce’s fi scal 2005 costs amounted to $1.1 million compared to $387,000 for the four-month period in fi scal 2004 accounting for an additional $723,000. Excluding the impacts of these acquisitions in both fi scal years, the expenses increased $193,000 or 6% primarily as a result of the strengthening Canadian dollar estimated at $156,000.
General and AdministrationExpenses increased 49% or $747,000 to $2.3 million in fi scal 2005 compared to $1.5 million in the previous year. LMG accounted for $103,000 of the increase while expenses for PointForce amounted to $766,000 in fi scal 2005 compared to $167,000 for the four-month period in fi scal in 2004 accounting for an additional $599,000. After taking into account the additional expenses for a twelve-month operating period in fi scal 2005 compared to a four-month period in fi scal 2004, the general and administration expenses in PointForce were adversely affected by the severance of a key employee as well as the absorption of corporate expenses. Excluding the impacts of the acquisitions in both years, general and administration expenses increased $45,000 in fi scal 2005. The discussion hereunder describes the major changes contributing to the $45,000 increase.During the third quarter of fi scal 2005, the Company received a unanimous favorable judgment from a panel of three judges at the Quebec Court of Appeal in connection with a lawsuit brought forth by one of the Company’s landlords regarding the disputed allocation of common area space. The landlord has since taken steps to request an appeal to the Supreme Court of Canada. In consideration of the opinions of the Company’s legal counsel, management’s best estimate at this time considers that it is highly unlikely that the Supreme Court of Canada would grant the landlord’s request for an appeal. If the request to appeal is granted, management believes that it is very unlikely that the landlord’s position will prevail and that no amount will ever become payable regarding this claim. Since inception of the dispute with the landlord, the Company has been establishing accruals for the amounts claimed by the landlord. In consideration of the above, the Company reversed the accumulated accruals from April 30, 2004 of CA$300,000 (US$245,000) in fi scal 2005 related to the dispute and reduced general and administration expenses. In fi scal 2005, the company incurred $158,000 of bad debt expense whereas in fi scal 2004 the Company had realized a recovery of $191,000 accounting for an unfavorable impact of $349,000 in fi scal 2005. Excluding the acquisitions in both fi scal years, the strengthening Canadian dollars adversely affected general and administration expenses by approximately $74,000 in fi scal 2005 as compared to fi scal 2004.

TECSYS Inc. Annual Report 2005 11
Research and Development (R&D)Gross R&D expenses increased by 17% or $569,000 to $3.9 million in fi scal 2005 compared to $3.4 million in fi scal 2004 ($3.5 million and $2.8 million, respectively, net of tax credits). LMG incurred $59,000 of gross R&D expenses for the two-month period ended April 30, 2005. PointForce’s gross R&D expenses increased by $394,000 to $576,000 in fi scal 2005 in comparison to $182,000 for the four-month period of the previous fi scal year. Excluding the impacts of these acquisitions in both fi scal periods, gross R&D expenses increased by $116,000 or 4% over the comparable base from the previous fi scal year. Approximately $182,000 unfavorable impact can be attributed to the strengthening Canadian dollar offset by favorable impacts of a diminished personnel headcount averaging 42 in fi scal 2005 compared to 45 for fi scal 2004.
In fi scal 2005, gross R&D expenses were 16% of revenue compared to 19% in fi scal 2004.
R&D tax credits decreased by $135,000 or 22% in fi scal 2005 in comparison to fi scal 2004. LMG and PointForce tax credits amounted to $73,000 in fi scal 2005 whereas there were no credits in fi scal 2004. Excluding LMG and PointForce, the tax credit decrease of $208,000 is due primarily to a $60,000 adjustment relating to a prior year as a result of a government audit. Additionally, the fi scal 2005 reduced tax credits refl ect the changes reducing research and development tax credit rates from 40% to 35% of the fi rst $2 million of eligible expenditures and the amendments to tax legislation which specifi ed that an expenditure related to an activity for a given period may not give rise to more than one refundable credit. In the 2004 MD&A, the Company indicated that the changes to the Quebec tax credit would have an adverse impact of approximately $150,000 in fi scal 2005 in comparison to fi scal 2004.
Amortization of Intangible AssetsThe amortization of intangible assets increased $151,000 or 76% to $349,000 in fi scal 2005 compared to fi scal 2004. An increase of $146,000 is due to the amortization of PointForce intangible assets throughout 2005 whereas only four months of activity were amortized in fi scal 2004. Additionally, the acquisition of LMG in fi scal 2005 included intangible assets that were amortized for two months contributing $39,000 in amortization expense. These increases in the amortization of intangible assets related to these acquisitions were offset by a reduced amortization expense related to software acquired for internal use of $34,000.
Other Income and ExpensesInterest income decreased 29% or $79,000 to $189,000 in fi scal 2005 in comparison to $268,000 for fi scal 2004. This can be attributed to less funds being available for investment in fi scal 2005 as a result of the acquisitions in fi scal 2004 and 2005, and the repayment a term loan and capital leases in 2004.
Interest expense decreased 50% to $36,000 in fi scal 2005 compared to $72,000 for fi scal 2004. The reduction in interest expense is attributable to the repayment of long-term debt in fi scal 2004 and capital lease obligations.
As a result of the continuing strengthening of the Canadian dollar against the U.S. dollar, the Company incurred an exchange loss of $284,000 in fi scal 2005 as compared to $244,000 in fi scal 2004. The exchange loss is primarily a result of carrying a net asset position, primarily cash and accounts receivable denominated in U.S. dollars. U.S. monetary assets have been devalued by 8.3% in fi scal 2005 in comparison to a 4.4% devaluation in fi scal 2004 in consideration of the exchange rates at April 30, 2003, 2004, and 2005 (2005 - 1.2569, 2004 - 1.3707, 2003 – 1.4335). During the year, the Company protected a portion of its net monetary U.S. assets by means of four forward exchange contracts selling U.S. dollars forward for maturity before the end of each quarter. The hedging strategy yielded cumulative reduced exchange losses of $61,000 for the year.
There were no foreign exchange contracts outstanding at the end of either the 2004 or 2005 fi scal year. Subsequent to the current year end, the Company undertook another foreign exchange contract to sell $2.0 million U.S. dollars forward at 1.2522 on July 29, 2005.

12 TECSYS Inc. Annual Report 2005
Net IncomeThe Company recorded net earnings of $334,000 ($0.02 per share) in fi scal 2005 compared $415,000 ($0.03 per share) in fi scal 2004.
Results of OperationsYear ended April 30, 2004 compared to year ended April 30, 2003
RevenueTotal revenue increased 17% to $17.6 million in fi scal 2004 compared to $15 million in fi scal 2003. PointForce’s contribution to revenues during the 2004 fi scal year was $1.9 million. Products revenue increased by 25% to $6.7 million compared to $5.3 million for the previous fi scal year, an increase of $1.4 million. PointForce accounted for $528,000 of that increase. Excluding PointForce, products revenue increased by 15% or $818,000 due to higher products revenue from base accounts. Services revenue increased 12% to $10.2 million from $9.1 million in the previous year, an increase of $1.1 million. PointForce contributed $1.3 million in services revenue during fi scal year 2004. Excluding PointForce, services revenue decreased slightly by 3% or $254,000 representing primarily lower consulting and product adaptations. As a percentage of total revenue, products revenue and services revenue were 38% and 58% respectively. In fi scal 2003, products revenue and services revenue were 35% and 61% respectively.
As a result of the strengthening Canadian dollar against the U.S. dollar during fi scal 2004 as compared to fi scal 2003, the revenues for fi scal 2004 were favorably impacted by approximately $500,000 or 3%. On the other hand, the strengthening Canadian dollar affected services expenses and operating expenses adversely for approximately $1.4 million. The U.S. dollar to Canadian dollar exchange rates for fi scal 2004 averaged 1.3434 in comparison to 1.5381 for fi scal 2003.
Cost of RevenueTotal cost of revenue in fi scal 2004 was fl at at $8.2 million in comparison to the previous year. PointForce’s cost of revenues for the four months ended April 30, 2004 accounted for $1.1 million of fi scal 2004 costs. Services costs decreased slightly to $5.4 million in fi scal 2004, from $5.5 million in fi scal 2003, a reduction of $145,000 or 3%. PointForce incurred $766,000 in services expenses. Excluding PointForce, services costs decreased $911,000 or 17% refl ecting mainly the lower average services personnel count of 79 in fi scal 2004 compared to 101 in fi scal 2003. The cost of services also includes multimedia tax credits of $612,000 in fi scal 2004 compared to $730,000 in fi scal 2003. The reduction in multimedia tax credits is due primarily to the reduced services headcount in fi scal 2004 in comparison to fi scal 2003. Costs related to third-party products rose slightly by $52,000 or 3% to $2.1 million in fi scal 2004 compared to the previous year.
As a result of the strengthening Canadian dollar against the U.S. dollar for fi scal 2004 as compared to fi scal 2003, the services expenses for fi scal 2004 were unfavorably impacted by approximately $467,000 or 8%.
Gross MarginTotal gross margin increased to 53% in fi scal 2004 in comparison to 46% for fi scal 2003. The increase is due to a higher proportion of product revenues, which also generated higher margins of 69% compared to 62% for fi scal 2003. This is due to better product mix and better-negotiated costs from suppliers. Services gross margin also increased to 47% in fi scal 2004 compared to 39% for the previous fi scal year. The improvement in services margin is due primarily to lower personnel and related overhead costs.
Operating ExpensesTotal operating expenses decreased 30% to $8.9 million in fi scal 2004 compared to $12.8 million in fi scal 2003. During fi scal 2003, the Company recorded a number of non-recurring charges. Specifi cally, the Company wrote off intangible assets regarding acquired technology resulting from a business combination effected in July 2000 and

TECSYS Inc. Annual Report 2005 13
sub-licensing rights acquired in May 2000 amounting to $1.1 million, incurred restructuring charges related to the sublease of one fl oor at one of its facility amounting to $1.2 million, and wrote off non-refundable tax assets for $610,000. Additionally, during the fourth quarter of fi scal 2003, the Company provided a bad debt allowance of $1.1 million for a long-term receivable that was no longer reasonably assured. Excluding the non-recurring charges and the bad debt allowance in fi scal 2003, operating expenses increased 1% or $104,000 in fi scal 2004 as compared to fi scal 2003. The increase includes PointForce’s operating expenses for the four-month period ended April 30, 2004 amounting to $822,000. Total operating expenses excluding PointForce decreased 8% in fi scal 2004 compared to 2003 operating expenses excluding the non-recurring charges and the bad debt allowance. The reduction in operating expenses is due primarily to the lower average headcount, excluding PointForce, of 89 for sales and marketing, general and administrative, and R&D personnel in comparison to an average headcount of 109 for fi scal 2003, a decrease of 18%.
As a result of the strengthening of the Canadian dollar against the U.S. dollar for fi scal 2004, as compared to fi scal 2003, operating expenses for fi scal 2004 were unfavorably impacted by approximately $900,000 or 10% of the 2003 operating expenses excluding the non-recurring charges and the bad debt allowance.
Sales and MarketingExpenses increased 3% to $3.8 million in fi scal 2004 from $3.7 million in fi scal 2003. Excluding PointForce’s costs of $387,000, expenses decreased 7% in fi scal 2004 as compared to the previous year due mainly to lower personnel costs. Excluding PointForce’s expenses, the strengthening Canadian dollars in fi scal 2004 as compared to fi scal 2003 adversely affected expenses by approximately $300,000.
General and AdministrationExpenses decreased 38% to $1.5 million in fi scal 2004 compared to $2.5 million in the previous year. Excluding PointForce’s costs in fi scal 2004, and the bad debt allowance referred to above in fi scal 2003, general and administration expenses have remained fl at at $1.4 million. Excluding PointForce’s expenses, the strengthening Canadian dollars in fi scal 2004 as compared to fi scal 2003 adversely affected expenses by approximately $200,000.
Research and Development (R&D)Gross R&D expenses decreased slightly by 3% to $3.4 million in fi scal 2004 compared to $3.5 million in fi scal 2003 ($2.8 million and $2.7 million, respectively, net of tax credits). Excluding PointForce’s expenses of $182,000 and the unfavorable impact of the strengthening Canadian dollar in fi scal 2004 as compared to fi scal 2003, estimated at approximately $400,000, gross R&D expenses decreased 20% to $2.8 million in fi scal 2004 as compared to $3.5 million in fi scal 2003. The decrease is due primarily to the reduced average number of personnel engaged in the R&D function from 56 to 45. In fi scal 2004, the Company continued to focus on moving its EliteSeries fl agship to a fully browser-based application with improved functionality with the release of EliteSeries 7.2. In fi scal 2004, gross R&D expenses were 19% of revenue compared to 23% in fi scal 2003. The Company expects that the recent changes to the Quebec tax credit will have an adverse impact of approximately $150,000 in the amount to be claimed in fi scal year 2005 in comparison to fi scal year 2004.
Amortization of Intangible AssetsThe acquisition of PointForce in the third quarter of fi scal 2004 included intangible assets for technology and customer relationships amounting to $1.0 million (note 2).
During the third quarter of fi scal 2003, the Company adopted retroactive to May 1, 2002, the new recommendations of the CICA regarding impairment of long-lived assets and reassessed the carrying value under these new rules, resulting in a write-off of $1.1 million of acquired technology from a business combination effected in July 2000 and sub-licensing rights acquired in May 2000.
The amortization of intangible assets decreased 41% to $198,000 for fi scal 2004 as compared to $337,000 for fi scal 2003. The amortization of the PointForce intangible assets in fi scal 2004, included in the amount above for the four-month period ended April 30, 2004, amounted to $68,000. The reduced expense in fi scal 2004 is due primarily to the reduced asset base resulting from the fi scal 2003 write-off described above.

14 TECSYS Inc. Annual Report 2005
Other Income and ExpensesInterest income of $268,000 in fi scal 2004 was 12% higher compared to $240,000 for fi scal 2003. This can be attributed to more funds being available for investment in fi scal 2004, despite the fact that rates of return were generally lower in fi scal 2004 as compared to fi scal year 2003.
Interest expense decreased 46% to $72,000 compared to $133,000 for fi scal 2003. The reduction in interest expense is attributable to the repayment of long-term debt and capital lease obligations.
As a result of the continuing strengthening of the Canadian dollar against the U.S. dollar, the Company incurred an exchange loss of $244,000 in fi scal 2004 as compared to $794,000 in fi scal 2003, a decrease of 69%. The exchange loss is primarily a result of carrying a net asset position in U.S. dollars.
The consolidated fi nancial statements are translated into U.S. dollars using the current rate method. All gains and losses resulting from the translation of Canadian dollar consolidated fi nancial statements into U.S. dollars are refl ected in the cumulative translation adjustment (CTA) in shareholders’ equity.
The Company has recorded increases in the CTA within shareholders’ equity of $536,000 in fi scal 2004 compared to an increase of $1.3 million in fi scal 2003. The increases to the CTA account represent exchange gains arising on the translation of the Canadian dollar consolidated fi nancial statements into U.S. dollars where such gains are posted directly into the shareholders’ equity section rather than fl owing through the statement of operations.
Net IncomeThe Company recorded a net earnings of $415,000 ($0.03 per share) in fi scal 2004, compared to a net loss of $6.6 million ($0.45 per share) in fi scal 2003.
Liquidity and Capital ResourcesAs of April 30, 2005, current assets totaled $15.8 million compared to $14.9 million at the end of fi scal 2004. Cash, cash equivalents and short-term and other investments, amounted to $6.5 million, compared to $8.1 million as of April 30, 2004. The decrease is primarily a result of the recent ASI and Symplistech (LMG) acquisition, the repayment of bank advances and capital lease obligations, and the repurchase of shares for cancellation.
Accounts receivable totaled $7.0 million at the end of fi scal 2005, compared to $4.7 million at the end of fi scal 2004. The increase in accounts receivable is largely due to the ASI and Symplistech acquisition accounting for $2.4 million of the outstanding receivables. The Company’s DSO (Days Sales Outstanding) is 70 days at the end of fi scal 2005 in comparison to 78 days at the end of fi scal 2004. The decrease in DSO is largely attributable to the collection of a major sale realized in the fourth quarter at LMG.
Current liabilities totaled $6.9 million, compared to $5.7 million at the end of fi scal 2004. The increase in current liabilities is due to the acquisition of ASI and Symplistech accounting for $1.9 million of the current liabilities. Long-term debt and other long-term liabilities decreased $56,000 to $958,000 at the end of fi scal 2005.
In fi scal 2005, operating activities generated funds of $768,000 compared to $36,000 in fi scal 2004. In both fi scal years, cash generated by positive operating activities was offset largely by increases in net non-cash working capital of $760,000 for fi scal 2005 and $1.3 million for fi scal 2004. In fi scal 2003 operating activities generated funds of $3.3 million characterized primarily by the reduction of net non-cash working capital items of $6.3 million offset by losses and non-cash charges reducing cash for $2.9 million.
Working capital at the end of fi scal 2005 was $9.0 million compared to $9.2 million at the end of the previous year. The reduction in working capital is due primarily to the differential of the cash consideration paid for the ASI and Symplistech acquisition versus the net working capital acquired (note 2), the repayment of capital lease obligations, and the repurchase of shares for cancellation. The Company believes that funds on hand at the end of fi scal 2005, together with cash fl ow from operations, will be suffi cient to meet its needs for working capital, R&D, capital expenditures and debt repayment for at least the next twelve months.

TECSYS Inc. Annual Report 2005 15
Financing activities required funds of $672,000 in fi scal 2005 compared to $1.1 million in fi scal 2004 and $884,000 for fi scal 2003. In fi scal 2005, $275,000 was used for the repayment of a bank loan acquired as part of the ASI acquisition. Additionally, in fi scal 2005, $104,000 was used for the repayment of capital lease obligations compared to $707,000 and $577,000 used in fi scal year 2004 and fi scal year 2003 respectively for the repayment of long-term debt and capital lease obligations. In fi scal 2005, the Company purchased 235,500 of its outstanding shares for cancellation for $293,000 in fi scal 2005 compared to 327,700 shares repurchased for $360,000 in fi scal 2004 and 487,800 shares repurchased for $307,000 in fi scal 2003. The excess of the net book value over the purchase price of these shares and related costs has been credited to contributed surplus (2005 - $365,000, 2004 - $610,000, 2003 - $996,000). Please refer to note 11 b) to the consolidated fi nancial statements for further details.
In fi scal 2005, investing activities used funds of $1.5 million in comparison to generating $2.7 million in fi scal 2004. In fi scal 2005, $812,000 was generated by reductions in short-term investments compared to $6.2 million for the previous fi scal year. During fi scal 2005, business combinations, net of cash acquired, used funds of $2.0 million comprising $2.2 million for the acquisition of ASI, $255,000 for the acquisition of Symplistech, and was partially offset by the recovery of $368,000 representing the purchase price adjustment of PointForce acquired in fi scal 2004. In fi scal 2004, $3.2 million was disbursed for the acquisition of PointForce. In fi scal 2005, $236,000 was used for the acquisition of property, plant and equipment and computer software for internal use in comparison to $283,000 for the previous fi scal year. In fi scal 2003, investing activities used funds of $3.3 million as cash was converted to short-term investments for $3.1 million and net cash outfl ows of $267,000 were used to acquire property, plant and equipment and computer software for internal use.
As of April 30, 2005, the Company had no material commitments for capital expenditures. As at April 30, 2005, the principal commitments consist of capital and operating leases and long-term debt as described in Notes 10 and 18 to the consolidated fi nancial statements. The following table summarizes signifi cant contractual obligations as at April 30, 2005.
Contractual ObligationsIn thousands of U.S. dollars
Long-term Capital OperatingYears Ending Debt Leases Leases Total
April 30, 2006 85 24 1,379 1,488April 30, 2007 398 12 1,241 1,651April 30, 2008 - - 1,029 1,029April 30, 2009 - - 1,015 1,015April 30, 2010 - - 1,025 1,025
483 36 5,689 6,208
Under the terms of a licensing agreement with a third party, the Company is committed to pay royalties calculated at a rate of 1% of revenue, excluding reimbursable expenses, increasing to 1.5% from May 1, 2005. Revenues derived from the operations of acquired companies are exempt from royalties only for a period of 18 months from the date of the acquisition. Revenues derived from the operations of PointForce are exempt until June 30, 2005. Similarly, revenues derived from the operations of ASI and Symplistech are exempt from royalties until August 31, 2006 and September 30, 2006 respectively.
The agreement was effective February 1, 2004, has an initial term expiring April 30, 2007, and may be terminated by either party at any time by providing six months’ notice. The Company has incurred costs related to this agreement of $155,000 for the twelve-month period ended April 30, 2005 and $39,000 for the period from February 1, 2004 to April 30, 2004.

16 TECSYS Inc. Annual Report 2005
Critical Accounting PoliciesThe Company’s critical accounting policies are those that it believes are the most important in determining its fi nancial condition and results. A summary of the Company’s signifi cant accounting policies, including the critical accounting policies discussed below, is set out in the notes to the consolidated fi nancial statements.
Use of EstimatesThe preparation of fi nancial statements in accordance with generally accepted accounting principles requires management to make estimates and assumptions that affect the reported amounts of assets and liabilities and the reported amounts of revenue and expenses during the reporting periods.
As the Company’s software implementation period may typically span from six to twelve months, the most signifi cant area requiring judgement and estimation is revenue recognition relating to multiple element arrangements, where the resulting revenue recognition per element and the related timing must be assessed in relation to contract terms, Statement of Position (“SOP”) 97-2 criteria, future services, and other criteria as discussed later. The estimates and assumptions are based on past experience and other factors that the Company considers reasonable. As this involves varying degrees of judgement and uncertainty, actual results could differ from those estimates.
Based on a structured methodology, portions of the purchase price paid in business acquisitions (PointForce Inc. in fi scal 2004 and Application Solutions Inc. and Symplistech Inc. in fi scal 2005) have been assigned to intangible assets acquired, consisting of customer relationships, acquired technology, in-process research and development, reseller agreement and vendor non-solicitation engagements. Determination of the fair values assigned to each of these acquired intangible assets has required management estimates of revenue growth, gross margins, retention of customer base, technology obsolescence, operating expenses, capital requirements and expected future cash fl ows. Fair values attributed to the intangible assets acquired in each business acquisition were determined based on the specifi c circumstances of each acquisition together with management’s outlook based on past performance, the business plan, and as incorporated in initial operating and capital budgets. The acquired intangible assets are being amortized on a straight-line basis over fi ve years based on the current estimates of technological obsolescence of fi ve years and a projected 20% annual attrition of the existing customer base. The carrying values of the intangible assets acquired in business acquisitions are reviewed annually for impairment as described below.
Goodwill represents the excess of the purchase price of businesses acquired over the fair value of the underlying net identifi able assets acquired or liabilities assumed. Goodwill related to business combinations initiated or completed prior to July 1, 2001 was amortized on a straight-line basis over the estimated useful life of fi ve years. Following the adoption of the recommendations of the CICA Handbook Section 3062 on May 1, 2002, goodwill is not amortized, but rather is evaluated for impairment annually, or when events or changed circumstances indicate that an impairment may have occurred. In connection with the goodwill impairment test, if the carrying value of the Company’s reporting unit to which goodwill relates exceeds its estimated fair value, the goodwill related to that reporting unit is tested for impairment. If the carrying value of such goodwill is determined to be in excess of its fair value, an impairment loss is recognized in the amount of the excess of the carrying value over the fair value. The goodwill impairment test entails the use of a number of estimates including future cash fl ows and involving varying degrees of judgement and uncertainty. Actual results will differ from those estimates.
The Company assesses the carrying value of its long-lived assets, which include property, plant and equipment and defi nite-life intangible assets, for future recoverability when events or changed circumstances indicate that the carrying value may not be recoverable. An impairment loss is recognized if the carrying value of a long-lived asset exceeds the sum of the estimated undiscounted future cash fl ows expected from its use. The amount of impairment loss, if any, is determined as the excess of the carrying value of the assets over their fair value. The long-lived assets impairment test entails the use of a number of estimates including future cash fl ows and involving varying degrees of judgement and uncertainty. Actual results will differ from those estimates.
The Company maintains an allowance for doubtful accounts at an amount estimated to be suffi cient to provide adequate protection against losses resulting from collecting less than full payment on its receivables. Individual overdue accounts are reviewed and allowance adjustments are recorded when determined necessary to state receivables at the realizable value. If the fi nancial condition of customers deteriorates resulting in their diminished

TECSYS Inc. Annual Report 2005 17
ability or willingness to make payment, additional provisions for doubtful accounts are recorded. Considerable judgement is required to assess the realizable value of the receivables including the probability of collection and the current creditworthiness of each customer. As this involves varying degrees of judgement and uncertainty, actual results could differ from those estimates.
The Company accrues refundable investment tax credit benefi ts related to qualifying activities, including research and development projects. Considerable judgement is required to assess the various criteria of whether activities qualify. As these activities are audited periodically by the taxation authorities, the actual results attributable to a fi scal period may differ from the accounting estimates posted.
Revenue RecognitionThe Company licenses software under non-cancellable license agreements and provides services including training, installation, consulting and maintenance, consisting of product support services and periodic updates. The Company recognizes revenue in accordance with Statement of Position (“SOP”) 97-2, “Software Revenue Recognition”. Revenues generated by the Company include the following:
• License Fees Revenues from licenses sold separately are recognized when a non-cancellable license agreement has been
signed, the software product has been shipped, there are no uncertainties surrounding product acceptance, the fees are fi xed or determinable, and collection is considered probable. Fees from multiple element arrangements are allocated to the various elements based on vendor-specifi c objective evidence of fair value provided that services, if any, are not essential to the functionality of the software. Revenues from licenses sold under multiple element arrangements are recognized upon shipment of the software product, provided that all of the above criteria have been met.
Where services are considered to be essential to the functionality of the software, fees from licenses and services are aggregated and recognized as revenue as the related services are performed using the percentage-of-completion method. The percentage of completion is generally determined based on the number of hours incurred to date in relation to the total expected hours of services. The cumulative impact of any revision in estimates of the percent completed is refl ected in the period in which the changes become known. Losses on such contracts in progress are recognized when known. Work in process is established for revenue based on the percent completed in excess of progress billings as of the balance sheet date. Any excess of progress billings over revenue based on the percent completed is deferred and included in deferred revenue. Generally, the terms of long-term contracts provide for progress billing based on completion of certain phases of work. Where acceptance criteria are tied to specifi c milestones, the percentage of completion up to that milestone is recognized upon acceptance.
• Support Agreements Support agreements generally call for the Company to provide technical support and unspecifi ed software
updates to customers. Revenues from technical support and unspecifi ed software update rights are recognized ratably over the term of the support agreement.
• Consulting and Education Services The Company provides consulting and education services to its customers. Revenues from such services are
recognized as the services are performed.
Stock-based Compensation and Other Stock-based PaymentsEffective May 1, 2004, the Company adopted the fair value based method of accounting for stock options and warrants granted to employees and directors and elected to apply the new standard retroactively without restatement as prescribed by Canadian Institute of Chartered Accountants (“CICA”) Handbook Section 3870, “Stock-based Compensation and Other Stock-based Payments”. Under the fair value based method, compensation cost is measured at fair value at the date of grant and is expensed over the award’s vesting period with a corresponding credit to contributed surplus. The stock-based compensation expense of $174,000 is recorded in the fi nancial statements for the year ended April 30, 2005. Accordingly, for the years ended April 30, 2004 and 2003, the Company provides only pro forma disclosures of net earnings (loss) and net earnings (loss) per common share as if the fair value based method of accounting had been used to account for options and warrants granted to employees (note 11 (e)). No compensation cost is recognized for this plan when shares are issued to employees and directors

18 TECSYS Inc. Annual Report 2005
upon the exercise of the options. Any consideration received from plan participants is credited to capital stock. Any stock-based compensation costs related to awards to individuals other than employees and directors are accounted for at fair value.
The change in accounting for the stock-based compensation has resulted in an adjustment of the opening balance of defi cit as of April 30, 2004 for $4,785,000, with a corresponding credit to contributed surplus, refl ecting the prior periods’ cost of options and warrants granted since inception of the plan, which occurred in the 1998 fi scal year. Additionally, the capital stock account has been increased by $353,000 with a corresponding reduction in contributed surplus representing the value of compensation cost associated with the options exercised since inception.
ContingenciesThrough the course of operations, the Company is party to a number of lawsuits, claims and contingencies. Accruals are made in instances where it is probable that liabilities will be incurred and where such liabilities can be reasonably estimated. Although it is possible that liabilities may be incurred in instances for which no accrual has been made, the Company has no reason to believe that the ultimate resolution of such matters will have a material impact on its fi nancial position.
In the 2002 fi scal year, a former customer instituted a lawsuit against the Company claiming damages in the amount of $3,200,000 for breach of contract and implied warranties, misrepresentation, unfair and deceptive consumer sales practices and unjust enrichment. The Company believes the claim is unfounded and has vigorously contested the lawsuit. No provision is included in the fi nancial statements. Discovery is ongoing with a trial date set for January 2006. The outcome of this claim cannot be determined at this time and it is not possible to reasonably estimate the likely outcome of this claim.
Significant Differences between Canadian and United States GAAPThe Company’s fi nancial statements were prepared in accordance with Canadian GAAP, which differs in some respects from U.S. GAAP.
In fi scal 2005, the purchase price allocation regarding the acquisition of ASI identifi ed various intangible assets including in-process research and development with an unamortized balance of $60,000 as at April 30, 2005. In accordance with Canadian GAAP, the Company provides for the amortization of intangible assets on a straight-line basis over their estimated useful life of fi ve years. U.S. GAAP requires that in-process research and development identifi ed as an intangible asset pursuant to an acquisition is charged to the current period immediately following the acquisition. As such, the net earnings for fi scal 2005 in accordance with U.S. GAAP would be $274,000 as compared to $334,000 for Canadian GAAP. There are no signifi cant differences between Canadian and U.S. GAAP for fi scal 2004. The net earnings for fi scal 2004 is $415,000.
In fi scal 2003, effective May 1, 2002, the Company adopted the recommendations of CICA Handbook Section 3062, “Goodwill and Other Intangible Assets”. Upon completion of the transitional impairment tests, the Company determined that at May 1, 2002, the carrying value of the assets of the acquired businesses exceeded the fair value of those businesses as determined using expected discounted future cash fl ows and that the related goodwill was fully impaired. Consequently, the Company recorded a transitional impairment loss as at May 1, 2002 in the amount of $346,000, which was charged to defi cit in accordance with Canadian GAAP. U.S. GAAP requires that the transitional impairment loss is charged to the period, hence the net loss for fi scal 2003 would be $7.0 million in accordance with U.S. GAAP as compared to $6.6 million for Canadian GAAP.
The consolidated fi nancial statements prepared in accordance with Canadian GAAP are translated into U.S. dollars using the current rate method. All gains and losses resulting from the translation of Canadian dollar consolidated fi nancial statements into U.S. dollars are refl ected in the cumulative translation adjustment (CTA) in shareholder’s equity. The Company has recorded increases in the CTA within shareholder’s equity of $1.2 million in fi scal 2005 compared to $536,000 and $1.3 million for fi scal 2004 and fi scal 2003 respectively. The increases to the CTA account represent exchange gains arising on the translation of the Canadian dollar fi nancial statements into U.S. dollars where such gains are posted directly into the shareholder’s equity section rather than fl owing through the statement of operations.

TECSYS Inc. Annual Report 2005 19
In accordance with U.S. GAAP, foreign currency translation adjustments are to be considered in determining the comprehensive income (loss). As such, in fi scal 2005, the Company recorded comprehensive income of $1.5 million compared to $1.0 million for fi scal 2004 and a comprehensive loss of $5.6 million for fi scal 2003.
Please refer to note 22 to the consolidated fi nancial statements for further detail.
Dividend PolicyThe Company currently intends to retain future earnings, if any, to support business growth. The Company has never declared or paid dividends on its common shares and does not anticipate paying dividends in the foreseeable future. Dividend policy is determined by the Board of Directors, taking into account the Company’s fi nancial condition and other factors deemed relevant.
Risks and UncertaintiesThis management’s discussion and analysis contains “forward-looking” statements, as defi ned in the Private Securities Litigation Reform Act of 1995, that are based on current expectations and estimates. Forward-looking statements may be identifi ed by the use of forward-looking terminology such as “believe”, “intend”, “may”, “will”, “expect”, “estimate”, “anticipate”, “continue” or similar terms, variations of those terms or the negative of those terms. Statements that are not historical facts, including statements about the Company’s beliefs and expectations, are forward-looking statements. These statements contain potential risks and uncertainties, and actual results may therefore differ materially. The Company undertakes no obligation to update publicly any forward-looking statements whether as a result of new information, future events or otherwise. Important factors that may affect these expectations include, but are not limited to, the factors discussed below.
History of Losses; Uncertainty of Future Operating ResultsThe Company has incurred losses in fi scal 2003, 2002 and 2001 as well as in other prior fi scal years. The Company has continued to adjust its operating model and downsized its operation in view of achieving profi tability. However, there can be no assurance that the Company will achieve or sustain profi tability in the future. As at April 30, 2005, the Company had an accumulated defi cit of $32.2 million. The limited operating history of the Company as a public company and its dependence on a market characterized by rapid technological change make the prediction of future results of operations diffi cult or impossible. There can be no assurance that the Company can generate substantial revenue growth on a quarterly or annual basis, or that any revenue growth that is achieved can be sustained. Revenue growth that the Company has achieved or may achieve may not be indicative of future operating results. In addition, the Company may increase its operating expenses in order to fund higher levels of research and development, increase its sales and marketing efforts, develop new distribution channels, broaden its customer support capabilities and expand its administrative resources in anticipation of future growth. To the extent that increases in such expenses precede or are not subsequently followed by increased revenues, the Company’s business, results of operations and fi nancial condition would be materially adversely affected.
Fluctuations in Quarterly ResultsThe Company’s quarterly operating results have in the past and will in the future, fl uctuate signifi cantly, depending on factors such as the demand for the Company’s products, the size and timing of orders, the number, timing and signifi cance of new product announcements by the Company and its competitors, the ability of the Company to develop, introduce, and market new and enhanced versions of its products on a timely basis, the level of product and price competition, changes in operating expenses, changes in average selling prices and product mix, sales personnel changes, the mix of direct and indirect sales, product returns and general economic factors, among others.
In particular, the Company’s quarterly results are affected by the timing of new releases of its products and upgrades. The Company’s operating expenses are based on anticipated revenue levels in the short term and are relatively fi xed and incurred throughout the quarter. As a result, if the revenues are not realized in the expected quarter, the Company’s operating results could be materially adversely affected. Quarterly results in the future may be infl uenced by these or other factors, including possible delays in the shipment of new products and purchasing delays of current products as customers anticipate new product releases. Accordingly, there may be signifi cant variations in the Company’s quarterly operating results.

20 TECSYS Inc. Annual Report 2005
Lengthy Sales and Implementation CycleThe sale and implementation of the Company’s products generally involves a signifi cant commitment of resources by prospective customers. As a result, the Company’s sales process is often subject to delays associated with lengthy approval processes attendant to signifi cant capital expenditures. For these and other reasons, the sales cycle associated with the licensing of the Company’s products varies substantially from customer to customer and typically lasts between six and twelve months. During this time, the Company may devote signifi cant resources to a prospective customer, including costs associated with multiple site visits, product demonstrations and feasibility studies, and experience a number of signifi cant delays over which it has no control. In addition, following license sales, the implementation period may involve six to twelve months for consulting services, customer training and integration with the customer’s other existing systems.
Product Development and Technological ChangeThe software industry is characterized by rapid technological change and frequent new product introductions. Accordingly, the Company believes that its future success depends upon its ability to enhance current products or develop and introduce new products that enhance performance and functionality at competitive prices. The Company’s inability, for technological or other reasons, to develop and introduce products in a timely manner in response to changing market conditions or customer requirements could have a material adverse effect on its business, results of operations and fi nancial condition.
The ability of the Company to compete successfully will depend in large measure on its ability to maintain a technically competent research and development staff and adapt to technological changes and advances in the industry, including providing for the continued compatibility of its software products with evolving computer hardware and software platforms and operating environments. There can be no assurance that the Company will be successful in these efforts.
CompetitionThe Company competes in many cases against companies with more established and larger sales and marketing organizations, larger technical staff, and signifi cantly greater fi nancial resources. As the market for the Company’s products continues to develop, additional competitors may enter the market and competition may intensify. Additionally, there can be no assurance that competitors will not develop products superior to the Company’s products or achieve greater market acceptance due to pricing, sales channels or other factors.
Management of GrowthThe Company’s ability to support the growth of its business will be substantially dependent upon having in place highly trained internal and third-party resources to conduct pre-sales activity, product implementation, training and other customer support services.
Risks Related to AcquisitionsThe Company may continue to expand its operations or product line through the acquisition of additional businesses, products or technologies. Acquisitions may involve a number of special risks, including diversion of management’s attention, failure to retain key acquired personnel, unanticipated events or circumstances and legal liabilities, some or all of which could have a material adverse effect on the Company’s business, results of operations and fi nancial condition.
Risk of Software DefectsSoftware products as complex as those offered by the Company frequently contain errors or defects, especially when fi rst introduced or when new versions or enhancements are released. Despite product testing, the Company has in the past released products with defects, discovered software errors in certain of its new versions after introduction, and experienced delays or lost revenue during the period required to correct these errors. The Company regularly introduces new releases and periodically introduces new versions of its software. There can be no assurance that, despite testing by the Company and its customers, defects and errors will not be found in existing products or in new products, releases, versions or enhancements after commencement of commercial shipments.

TECSYS Inc. Annual Report 2005 21
Risk of Third-party Claims for InfringementThe Company is not aware that any of its products infringe the proprietary rights of third-parties. There can be no assurance, however, that third-parties will not claim such infringement by the Company or its licensees with respect to current or future products. The Company expects that software developers will increasingly be subject to such claims as the number of products and competitors in the Company’s industry segment grows and as functionality of products in different industry segments overlaps.
Reliance on Third-party SoftwareThe Company relies on certain software that it sub-licenses from third-parties. There can be no assurance that these third-party software companies will continue to permit the Company to sub-license on commercially reasonable terms.

22 TECSYS Inc. Annual Report 2005
The consolidated fi nancial statements of the Company included herewith as well as all the information presented in this Annual Report are the responsibility of management and have been approved by the Board of Directors.
The consolidated fi nancial statements have been prepared by management in accordance with Canadian generally accepted accounting principles. The consolidated fi nancial statements include amounts based on the use of best estimates and judgements. Management has established these amounts in a reasonable manner in order to ensure that the consolidated fi nancial statements are fairly presented in all material respects. Management has also prepared the fi nancial information presented elsewhere in the annual report and has ensured that it agrees with the consolidated fi nancial statements. The Company maintains control systems for internal accounting and administration. The objective of these systems is to provide a reasonable assurance that the fi nancial information is pertinent, reliable and accurate and that the Company’s assets are properly accounted for and safeguarded.
The Board of Directors is entrusted with ensuring that management assumes its responsibilities with regard to the presentation of fi nancial information and is ultimately responsible for the examination and approval of the fi nancial statements. However, it is mainly through its Audit Committee, whose members are external directors, that the Board discharges this responsibility. This committee meets periodically with management and the external auditors to discuss the internal controls exercised over the process of presentation of the fi nancial information, auditing issues and questions on the presentation of fi nancial information, in order to assure themselves that each party properly fulfi lls its function and also to examine the consolidated fi nancial statements and the external auditors’ report.
The consolidated fi nancial statements have been audited on behalf of the shareholders by the external auditors, PricewaterhouseCoopers LLP. The auditors have free and full access to internal records and to the Audit Committee.
Peter BreretonPresident and Co-CEO
Berty Ho-Wo-CheongVice President, Finance and Administration and Chief Financial Offi cer
Management’s Report

TECSYS Inc. Annual Report 2005 23
We have audited the consolidated balance sheets of TECSYS Inc. as at April 30, 2005 and 2004 and the consolidated statements of operations, defi cit and cash fl ows for each of the years in the three-year period ended April 30, 2005. These fi nancial statements are the responsibility of the Company’s management. Our responsibility is to express an opinion on these fi nancial statements based on our audits.
We conducted our audits in accordance with Canadian generally accepted auditing standards. Those standards require that we plan and perform an audit to obtain reasonable assurance whether the fi nancial statements are free of material misstatement. An audit includes examining, on a test basis, evidence supporting the amounts and disclosures in the fi nancial statements. An audit also includes assessing the accounting principles used and signifi cant estimates made by management, as well as evaluating the overall fi nancial statement presentation.
In our opinion, these consolidated fi nancial statements present fairly, in all material respects, the fi nancial position of the Company as at April 30, 2005 and 2004 and the results of its operations and its cash fl ows for each of the years in the three-year period ended April 30, 2005 in accordance with Canadian generally accepted accounting principles.
Chartered AccountantsMontreal, Quebec, CanadaJune 15, 2005 (except for note 24, which is as of July 14, 2005)
Auditors’ Report to the Shareholders of TECSYS Inc.

TECSYS Inc. Consolidated Balance SheetsPrepared in Accordance with Canadian Generally Accepted Accounting Principles
(in thousands of U.S. dollars)
24 TECSYS Inc. Annual Report 2005
Approved by the Board of Directors
___________________________________ Director ___________________________________ Director
The accompanying notes are an integral part of these financial statements.
April 30, 2005
April 30, 2004
Assets
Current assets Cash and cash equivalents 1,054 2,388 Short-term and other investments (note 3) 5,435 5,665 Accounts receivable (note 4) 7,000 4,705 Other accounts receivable 177 579 Tax credits receivable (note 5) 1,241 1,056 Inventory 162 134 Prepaid expenses 749 367
15,818 14,894
Restricted cash equivalents and other investments (note 3) 815 747
Property, plant and equipment (note 6) 2,044 2,059
Intangible assets (note 7) 2,239 1,215
Goodwill (notes 2 and 7) 1,827 1,242 22,743 20,157
Liabilities
Current liabilities Accounts payable and accrued liabilities (note 9) 4,890 3,691 Current portion of long-term debt (note 10) 106 175 Deferred revenue 1,868 1,809
6,864 5,675
Long-term debt (note 10) 410 401
Other long-term liabilities (note 15) 548 613 7,822 6,689
Contingencies and commitments (notes 17 and 18)
Shareholders’ Equity
Capital stock (note 11) 39,019 39,326
Contributed surplus (note 11) 6,624 1,606
Cumulative translation adjustment 1,493 300
Deficit (32,215) (27,764) 14,921 13,468 22,743 20,157

TECSYS Inc. Consolidated Statements of Deficit Prepared in Accordance with Canadian Generally Accepted Accounting Principles
(in thousands of U.S. dollars)
TECSYS Inc. Annual Report 2005 25
The accompanying notes are an integral part of these financial statements.
Years ended April 30, 2005 2004 2003
Balance – Beginning of year as originally stated (27,764) (28,179) (21,227)
Adjustment resulting from a change in accounting
policy regarding stock-based compensation (note 1) (4,785) - -
Beginning balance as restated (32,549) (28,179) (21,227) Transitional goodwill impairment loss (note 7(b)) - - (346)Net earnings (loss) for the year 334 415 (6,606) Balance – End of year (32,215) (27,764) (28,179)

TECSYS Inc. Consolidated Statements of OperationsPrepared in Accordance with Canadian Generally Accepted Accounting Principles
(in thousands of U.S. dollars, except share and per share data)
26 TECSYS Inc. Annual Report 2005
The accompanying notes are an integral part of these financial statements.
Years ended April 30, 2005 2004 2003
Revenue Products (note 13) 8,583 6,663 5,317 Services 14,963 10,164 9,080 Reimbursable expenses 726 723 634
24,272 17,550 15,031
Cost of revenue Products 3,179 2,085 2,033 Services (note 14) 7,953 5,371 5,516 Reimbursable expenses 726 723 634
11,858 8,179 8,183
Gross margin 12,414 9,371 6,848
Operating expenses Sales and marketing 5,102 3,834 3,725 General and administration 2,275 1,528 2,458 Gross research and development 3,944 3,375 3,490 Research and development tax credits (484) (619) (808) Stock-based compensation 174 - - Write-off of non-refundable tax credits - - 610 Amortization of property, plant and equipment 589 592 685 Impairment loss on intangible assets - - 1,059 Amortization of intangible assets 349 198 337 Restructuring charges (note 15) - - 1,201
11,949 8,908 12,757
Earnings (loss) from operations 465 463 (5,909)
Interest income 189 268 240 Interest expense (36) (72) (133) Foreign exchange losses (284) (244) (794)
Earnings (loss) before income taxes 334 415 (6,596)
Provision for current income taxes (note 12) - - 10
Net earnings (loss) for the year 334 415 (6,606)
Weighted average number of common shares outstanding – basic 14,089,359 14,211,996 14,835,297
Basic and diluted net earnings (loss) per common share
(in U.S. dollars) 0.02 0.03 (0.45)

TECSYS Inc. Consolidated Statements of Cash Flows Prepared in Accordance with Canadian Generally Accepted Accounting Principles
(in thousands of U.S. dollars)
TECSYS Inc. Annual Report 2005 27
The accompanying notes are an integral part of these financial statements.
Years ended April 30, 2005 2004 2003
Cash flows from
Operating activities Net earnings (loss) for the year 334 415 (6,606)Adjustments for
Write-off of non-refundable tax credits - - 610 Amortization of property, plant and equipment 589 592 685 Impairment loss on intangible assets - - 1,059 Amortization of intangible assets 349 198 337 Unrealized foreign exchange losses (gains) 82 127 (8)Stock-based compensation 174 - - Restructuring charges - - 1,015
Changes in non-cash working capital items related to operations Decrease (increase) in accounts receivable 130 (274) 4,068 Decrease (increase) in other accounts receivable 47 (138) 342 Decrease in tax credits receivable 160 461 1,292 Decrease in inventory 119 - - Decrease (increase) in prepaid expenses (224) 111 303 Decrease in accounts payable and accrued liabilities (433) (878) (366)Increase (decrease) in deferred revenue (559) (578) 616
768 36 3,347 Financing activities Decrease in bank advances (275) - - Repayment of long-term debt and capital lease obligations (104) (707) (577)Issuance of common shares - 5 - Purchase of common shares for cancellation (293) (360) (307) (672) (1,062) (884) Investing activities Decrease (increase) in short-term and other investments 812 6,161 (3,077)Acquisitions of property, plant and equipment (223) (243) (318)Proceeds on disposal of property, plant, and equipment - - 113 Acquisitions of intangible assets (13) (40) (62)Business combinations, net of cash and cash equivalents acquired (2,041) (3,199) - (1,465) 2,679 (3,344) Effect of foreign exchange rate fluctuations on cash
and cash equivalents 35 32 84 Change in cash and cash equivalents (1,334) 1,685 (797) Cash and cash equivalents – Beginning of year 2,388 703 1,500 Cash and cash equivalents – End of year 1,054 2,388 703 Supplementary information (note 16)

TECSYS Inc. Notes to Consolidated Financial Statements Prepared in Accordance with Canadian Generally Accepted Accounting Principles
(in U.S. dollars, tabular amounts in thousands, except as otherwise noted)
28 TECSYS Inc. Annual Report 2005
1 Accounting policies
These financial statements have been prepared in accordance with Canadian generally accepted accounting principles (“GAAP”). Note 22 discloses significant measurement differences between Canadian and United States GAAP as they relate to the Company.
Nature of activities
The Company develops, markets and sells enterprise-wide supply chain management software for distribution operations, enterprise solutions for e-commerce driven organizations and e-commerce solutions for on-line distributors and retailers. The Company also provides related consulting, education and support services. The Company derives substantially all of its revenue from customers located in the United States and Canada. The Company’s customers consist primarily of high-volume distributors of discrete goods operating in such industries as computers, office products, telecommunications, health care, hardware, third party logistics, electrical products, giftware and home decor, and consumer goods.
Consolidation
These consolidated financial statements include the accounts of the Company and its wholly owned subsidiaries. All intercorporate accounts and transactions have been eliminated. Acquisitions are accounted for by the purchase method and, accordingly, the results of operations of subsidiaries are included from the dates of acquisition.
Use of estimates
The preparation of financial statements in accordance with generally accepted accounting principles requires management to make estimates and assumptions that affect the reported amounts of assets and liabilities and disclosures of contingent assets and liabilities at the dates of the financial statements and the reported amounts of revenue and expenses during the reporting periods. Actual results could differ from those estimates.
Foreign currency translation
Reporting currency
The functional currency of the Company is the Canadian dollar. Accordingly, the consolidated financial statements have been translated into the reporting currency (the U.S. dollar) using the current rate method. Under this method, the financial statements are translated into the reporting currency as follows: assets and liabilities are translated at the exchange rate in effect at the balance sheet date, and revenues and expenses are translated at the average exchange rate for the reporting period. All gains and losses resulting from the translation of the financial statements into the reporting currency are included in the cumulative translation adjustment in shareholders’ equity. Changes in the cumulative translation adjustment during each year result solely from the application of this translation method.

TECSYS Inc. Notes to Consolidated Financial Statements Prepared in Accordance with Canadian Generally Accepted Accounting Principles
(in U.S. dollars, tabular amounts in thousands, except as otherwise noted)
TECSYS Inc. Annual Report 2005 29
Foreign operations
The Company’s foreign operations are classified as integrated and are translated into the functional currency using the temporal method. Under this method, monetary assets and liabilities are translated at the exchange rate in effect at the balance sheet date, whereas non-monetary assets and liabilities are translated at historical exchange rates. Revenues and expenses are translated at the average exchange rate for the reporting period, except for amortization which is translated at the same rate as the asset to which it applies. Gains and losses resulting from translation are reflected in the statement of operations for the year.
Foreign currency transactions
Transactions denominated in foreign currencies are translated into the functional currency using the temporal method.
Forward exchange contracts
From time to time the Company enters into forward exchange contracts to manage its exposure to fluctuations in foreign exchange rates on both contracted and expected cash flows related to accounts receivable denominated in currencies other than the functional currency. These derivative financial instruments are effective in meeting the risk reduction objectives of the Company by generating offsetting cash flows related to the underlying position in respect of amount and timing. The Company does not hold or issue derivative financial instruments for trading purposes. The foreign currency gains and losses on these contracts are recognized and offset against the exchange losses or gains on the accounts receivable being hedged. Cash flows from forward exchange contract settlements are classified as cash flows from operating activities along with the corresponding cash flows from the accounts receivable being hedged.
Revenue recognition
The Company licenses software under non-cancellable license agreements and provides services including training, installation, consulting and maintenance, which includes product support services and periodic updates. The Company recognizes revenue in accordance with the guidance set out in Statement of Position (“SOP”) 97-2, “Software Revenue Recognition”. Revenues generated by the Company include the following:
License fees
Revenues from licenses sold separately are recognized when a non-cancellable license agreement has been signed, the software product has been shipped, there are no uncertainties surrounding product acceptance, the fees are fixed or determinable, and collection is considered probable. Fees from multiple element arrangements are allocated to the various elements based on vendor-specific objective evidence of fair value provided that services, if any, are not essential to the functionality of the software. Revenues from licenses sold under multiple element arrangements are recognized upon shipment of the software product, provided that all of the above criteria have been met.

TECSYS Inc. Notes to Consolidated Financial Statements Prepared in Accordance with Canadian Generally Accepted Accounting Principles
(in U.S. dollars, tabular amounts in thousands, except as otherwise noted)
30 TECSYS Inc. Annual Report 2005
Where services are considered to be essential to the functionality of the software, fees from licenses and services are aggregated and recognized as revenue as the related services are performed using the percentage-of-completion method. The percentage of completion is generally determined based on the number of hours incurred to date in relation to the total expected hours of services. The cumulative impact of any revision in estimates of the percentage completed is reflected in the period in which the changes become known. Losses on such contracts in progress are recognized when known. Work in process is established for revenue based on the percentage completed in excess of progress billings as of the balance sheet date. Any excess of progress billings over revenue based on the percentage completed is deferred and included in deferred revenue. Generally, the terms of long-term contracts provide for progress billings based on completion of certain phases of work. Where acceptance criteria are tied to specific milestones, the percentage of completion up to that milestone is recognized upon acceptance.
Support agreements
Support agreements generally call for the Company to provide technical support and unspecified software updates to customers. Revenues from technical support and unspecified software update rights are recognized ratably over the term of the support agreement.
Consulting and education services
The Company provides consulting and education services to its customers. Revenues from such services are recognized as the services are performed.
Reimbursable expenses
The Company records revenue and the associated cost of revenue on a gross basis in its statement of operations for reimbursable expenses such as airfare, hotel lodging, meals, automobile rental and other charges related to providing services to its customers.

TECSYS Inc. Notes to Consolidated Financial Statements Prepared in Accordance with Canadian Generally Accepted Accounting Principles
(in U.S. dollars, tabular amounts in thousands, except as otherwise noted)
TECSYS Inc. Annual Report 2005 31
Stock-based compensation and other stock-based payments
The Company maintains a stock-based compensation plan, which is described in note 11(d). Effective May 1, 2004, the Company adopted the fair value based method of accounting for stock options and warrants granted to employees and directors and elected to apply the new standard retroactively without restatement as prescribed by Canadian Institute of Chartered Accountants (“CICA”) Handbook Section 3870, “Stock-based Compensation and Other Stock-based Payments”. Under the fair value based method, compensation cost is measured at fair value at the date of grant and is expensed over the award’s vesting period with a corresponding credit to contributed surplus. The stock-based compensation expense is recorded in the financial statements for the year ended April 30, 2005. Accordingly, for the years ended April 30, 2004 and 2003, the Company provides only pro forma disclosures of net earnings (loss) and net earnings (loss) per common share as if the fair value based method of accounting had been used to account for options and warrants granted to employees (note 11(e)). No compensation cost is recognized for this plan when shares are issued to employees and directors upon the exercise of the options. Any consideration received from plan participants is credited to capital stock. Any stock-based compensation costs related to awards to individuals other than employees and directors are accounted for at fair value.
The change in accounting for the stock-based compensation has resulted in an adjustment of the opening balance of deficit as of April 30, 2004 of $4,785,000, with a corresponding credit to contributed surplus, reflecting the prior periods’ cost of options and warrants granted since inception of the plan, which occurred in the 1998 fiscal year. Additionally, the capital stock account has been increased by $353,000 with a corresponding reduction in contributed surplus representing the value of compensation cost associated with the options exercised since inception.
Cash and cash equivalents
Cash and cash equivalents include all cash on hand and balances with banks, as well as all highly liquid short-term investments with original terms to maturity of three months or less.
Short-term and other investments
Short-term and other investments are valued at the lower of amortized cost and market value.
Allowance for doubtful accounts
The Company maintains an allowance for doubtful accounts at an amount estimated to be sufficient to provide adequate protection against losses resulting from collecting less than full payment on its receivables. Individual overdue accounts are reviewed and allowance adjustments are recorded when determined necessary to state receivables at the realizable value. If the financial conditions of customers deteriorate resulting in their diminished ability or willingness to make payment, additional provisions for doubtful accounts are recorded. Considerable judgement is required to assess the realizable value of the receivables, including the probability of collection and the current creditworthiness of each customer. As this involves varying degrees of judgement and uncertainty, actual results could differ from those estimates.

TECSYS Inc. Notes to Consolidated Financial Statements Prepared in Accordance with Canadian Generally Accepted Accounting Principles
(in U.S. dollars, tabular amounts in thousands, except as otherwise noted)
32 TECSYS Inc. Annual Report 2005
Inventory
Inventory is stated at the lower of cost and net realizable value. Cost is determined on a first-in, first-out basis.
Property, plant and equipment and amortization
Property, plant and equipment are carried at cost less accumulated amortization. The Company provides for amortization of property, plant and equipment commencing once the related assets have been put into service using the following methods and rates or period:
Method Rate/period
Computer equipment Declining balance 30% Furniture and fixtures Declining balance 20% Exhibition equipment Declining balance 20% Leasehold improvements Straight-line Over term of lease
Intangible assets
Intangible assets are carried at cost less accumulated amortization. The Company provides for amortization of software acquired for internal use over its estimated useful life using the declining balance method at a rate of 30% per year. Technology, customer relationships, other intangible assets, and the sub-licensing right are amortized on a straight-line basis over their estimated useful lives of five years.
Goodwill
Goodwill represents the excess of the purchase price of businesses acquired over the fair value of the underlying net identifiable assets acquired or liabilities assumed. Goodwill related to business combinations initiated or completed prior to July 1, 2001 was amortized on a straight-line basis over the estimated useful life of five years. Since May 1, 2002, goodwill is not amortized. Following adoption of the recommendations of CICA Handbook Section 3062 on May 1, 2002, the Company recorded a transitional impairment loss of $346,000 which was charged to deficit (note 7(b)).
Goodwill is evaluated for impairment annually or when events or changed circumstances indicate an impairment may have occurred. In connection with the goodwill impairment test, if the carrying value of the Company’s reporting unit to which goodwill relates exceeds its estimated fair value, the goodwill related to that reporting unit is tested for impairment. If the carrying value of such goodwill is determined to be in excess of its fair value, an impairment loss is recognized in the amount of the excess of the carrying value over the fair value. Management has selected April 30 as the date of its annual impairment test for goodwill.

TECSYS Inc. Notes to Consolidated Financial Statements Prepared in Accordance with Canadian Generally Accepted Accounting Principles
(in U.S. dollars, tabular amounts in thousands, except as otherwise noted)
TECSYS Inc. Annual Report 2005 33
Impairment of long-lived assets
The Company assesses the carrying value of its long-lived assets, which include property, plant and equipment and definite-life intangible assets, for future recoverability when events or changed circumstances indicate that the carrying value may not be recoverable. An impairment loss is recognized if the carrying value of a long-lived asset exceeds the sum of the estimated undiscounted future cash flows expected from its use. The amount of impairment loss, if any, is determined as the excess of the carrying value of the assets over their fair value.
Income taxes
The Company provides for income taxes using the liability method of tax allocation. Under this method, future income tax assets and liabilities are determined based on deductible or taxable temporary differences between financial statement values and tax values of assets and liabilities using substantively enacted income tax rates expected to be in effect for the year in which the differences are expected to reverse.
The Company establishes a valuation allowance against future income tax assets if, based on available information, it is more likely than not that some or all of the future income tax assets will not be realized.
Tax credits
The Company is entitled to scientific research and experimental development (“SRED”) tax credits granted by the Canadian federal government (“Federal”) and the governments of the provinces of Quebec and Ontario (“Provincial”). Federal SRED tax credits, which are non-refundable, are earned on qualified Canadian SRED expenditures and can only be used to offset Federal income taxes otherwise payable. Provincial SRED tax credits, which are refundable, are earned on qualified SRED salaries in the provinces of Quebec and Ontario.
Pursuant to a Quebec Government program aimed at assisting companies operating in the information technology and multimedia sectors, the Company is eligible to receive supplementary tax credits (“multimedia tax credits”) through 2008. Such tax credits are generally earned at an annual rate of 40% of salaries paid to employees engaged in eligible activities, to a maximum annual tax credit of CA$15,000 (US$11,934) per eligible employee.
SRED and other tax credits are accounted for as a reduction of the related expenditures. The refundable portion of tax credits is recorded in the year in which the related expenditures are incurred. The non-refundable portion of tax credits is recorded in the year in which the related expenditures are incurred provided the Company has reasonable assurance the credits will be realized.
The Company accrues refundable investment tax credit benefits related to qualifying activities, including research and development projects. Considerable judgement is required to assess the various criteria of whether activities qualify. As these activities are audited periodically by the taxation authorities, the actual results attributable to a fiscal period may differ from the accounting estimates posted.

TECSYS Inc. Notes to Consolidated Financial Statements Prepared in Accordance with Canadian Generally Accepted Accounting Principles
(in U.S. dollars, tabular amounts in thousands, except as otherwise noted)
34 TECSYS Inc. Annual Report 2005
Research and development costs
All costs related to development activities which do not meet generally accepted criteria for deferral and to research are expensed as incurred. Development costs which do meet generally accepted criteria for deferral are capitalized and amortized against earnings over the estimated period of benefit.
As at April 30, 2005 and 2004, the Company had not deferred any development costs.
Employee future benefits
The Company maintains employee benefit programs which provide retirement savings, medical, dental and group insurance benefits for current employees. The Company’s expense is limited to the employer’s match of employees’ contributions to a retirement savings plan, and to the employer’s share of monthly premiums for insurance covering other benefits. An employee’s entitlement to any benefits ceases upon termination of employment with the Company. The Company has no liability for any future benefits.
Years ended April 30, 2005 2004 2003
Contribution to retirement savings 17 18 32 Premiums for other benefits 309 225 206
326 243 238
Earnings (loss) per share
Basic earnings (loss) per share is calculated using the weighted average number of shares outstanding during the year.
Diluted earnings per share is calculated based on the weighted average number of common shares outstanding during the period plus the effects of dilutive potential common shares outstanding during the period. This method requires that the dilutive effect of outstanding options and warrants be calculated using the treasury stock method, as if all dilutive options had been exercised at the later of the beginning of the reporting period or date of issuance, and that the funds obtained thereby were used to purchase common shares of the Company at the average trading price of the common shares during the period.

TECSYS Inc. Notes to Consolidated Financial Statements Prepared in Accordance with Canadian Generally Accepted Accounting Principles
(in U.S. dollars, tabular amounts in thousands, except as otherwise noted)
TECSYS Inc. Annual Report 2005 35
The diluted weighted average number of shares has been calculated as follows:
2005 2004 2003
Weighted average number of shares – basic 14,089,359 14,211,996 14,835,297 Addition to reflect the impacts of:
Exercise of employee and director stock options and warrants 80,724 120,511 -
Weighted average number of shares – diluted 14,170,083 14,332,507 14,835,297
Options and warrants to purchase 475,095 common shares (2004 – 332,304; 2003 – 864,799) have been excluded from the above calculations since they would have an anti-dilutive effect. Since the Company was in a loss position in 2003, there is no difference between basic and diluted per share figures for that year.
2 Business combinations
Effective March 1, 2005, the Company acquired 100% of the issued and outstanding shares of Application Solutions Inc. (“ASI”). ASI develops and markets warehouse management solutions and system integration services for the IBM iSeries. The total purchase price of CA$2,623,000 (US$2,130,000) consisted of cash, warrants, and costs related to the acquisition.
ASI was wound up into TECSYS Inc. on March 1, 2005 and the results of its operations are included in the accompanying financial statements commencing from that date.

TECSYS Inc. Notes to Consolidated Financial Statements Prepared in Accordance with Canadian Generally Accepted Accounting Principles
(in U.S. dollars, tabular amounts in thousands, except as otherwise noted)
36 TECSYS Inc. Annual Report 2005
This business combination was accounted for using the purchase method and resulted in goodwill of CA$572,000, based on the following allocation of the purchase price to identifiable assets acquired and liabilities assumed:
CA$ US$
Current assets 2,780 2,258 Intangible assets
Technology 503 408 Customer relationships 707 574 Other 155 126
Other long-term assets 169 137 4,314 3,503
Current liabilities 2,263 1,838
Net identifiable assets acquired 2,051 1,665 Goodwill 572 465
Purchase price 2,623 2,130
Fair value of warrants issued (24) (20)Cash deficit acquired 54 44
Cash paid, net of cash and cash equivalents acquired 2,653 2,154
Effective April 1, 2005, the Company acquired 100% of the issued and outstanding shares of Symplistech Inc., a consulting practice specializing in the implementation of SAP solutions. The total purchase price of CA$344,000 (US$284,000) consisted of cash, warrants, and costs related to the acquisition.
Symplistech was wound up into TECSYS Inc. on April 1, 2005 and the results of its operations are included in the accompanying financial statements commencing from that date.

TECSYS Inc. Notes to Consolidated Financial Statements Prepared in Accordance with Canadian Generally Accepted Accounting Principles
(in U.S. dollars, tabular amounts in thousands, except as otherwise noted)
TECSYS Inc. Annual Report 2005 37
This business combination was accounted for using the purchase method and resulted in goodwill of CA$20,000, based on the following allocation of the purchase price to identifiable assets acquired and liabilities assumed:
CA$ US$
Current assets 188 155 Intangible assets
Customer relationships 197 163 Other 9 7
Other long-term assets 39 32 433 357
Current liabilities 109 90
Net identifiable assets acquired 324 267 Goodwill 20 17
Purchase price 344 284
Fair value of warrants issued (33) (27)Cash and cash equivalents acquired (2) (2)
Cash paid, net of cash and cash equivalents acquired 309 255
The agreement for the acquisition of Symplistech includes provisions for an additional balance of the purchase price payable to the vendors. The balance of the purchase price will be an amount equal to 20% of the services billed to existing customers up to a maximum of CA$350,000 (US$278,000) until the earlier of the fifth anniversary of the acquisition date or the resignation of a key employee or his termination for cause. The balance of the purchase price will be accounted for as a variable compensation expense as it is incurred.
Effective January 1, 2004, the Company acquired 100% of the issued and outstanding shares of PointForce Inc., a company which develops, markets and sells distribution software products primarily to the import-to-retail distribution market. The total purchase price of CA$3,779,000 (US$2,924,000) consisted of cash and costs related to the acquisition.
PointForce was wound up into TECSYS Inc. on January 1, 2004 and the results of its operations are included in the accompanying financial statements commencing from that date.

TECSYS Inc. Notes to Consolidated Financial Statements Prepared in Accordance with Canadian Generally Accepted Accounting Principles
(in U.S. dollars, tabular amounts in thousands, except as otherwise noted)
38 TECSYS Inc. Annual Report 2005
This business combination was accounted for using the purchase method and resulted in goodwill of CA$1,703,000, based on the following allocation of the purchase price to identifiable assets acquired and liabilities assumed:
CA$ US$
Current assets 1,802 1,395 Intangible assets
Technology 797 617 Customer relationships 557 431
Other long-term assets 224 173 3,380 2,616
Current liabilities 1,232 953 Obligations under capital leases 72 56
1,304 1,009
Net identifiable assets acquired 2,076 1,607 Goodwill 1,703 1,317
Purchase price 3,779 2,924
Cash and cash equivalents acquired (128) (99)Purchase price adjustment recoverable from former
PointForce shareholders 487 374
Cash paid, net of cash and cash equivalents acquired 4,138 3,199
The agreement for the acquisition of PointForce included provisions for purchase price adjustments based on a final determination of 2003 earnings and net equity at December 31, 2003. Pursuant to this agreement, the Company subsequently determined and negotiated a final purchase price of CA$3,779,000 (US$2,924,000)including acquisition costs. The purchase price adjustment of CA$487,000, representing the excess of the amount paid over the final price, was included in other receivables as at April 30, 2004 and was reimbursed to the Company in the first quarter of fiscal 2005. The CA$487,000 (US$368,000 at the time of receipt) is reflected as a recovery on the business combinations line within “Investing activities” on the consolidated statement of cash flows in fiscal year 2005.
None of the goodwill or intangible assets acquired in the above acquisitions is deductible against corporate income taxes.

TECSYS Inc. Notes to Consolidated Financial Statements Prepared in Accordance with Canadian Generally Accepted Accounting Principles
(in U.S. dollars, tabular amounts in thousands, except as otherwise noted)
TECSYS Inc. Annual Report 2005 39
3 Short-term and other investments
Short-term and other investments comprise the following:
April 30, 2005
April 30, 2004
Commercial paper denominated in Canadian dollars, bearing
interest at rates of between 2.25% and 2.45% (2004 – 1.90% and 2.05%), maturing through August 15, 2005 (2004 – December 19, 2004) 6,250 6,412
Presented as: Short-term investments 5,435 5,665 Restricted cash equivalents and other investments 815 747
As at April 30, 2005, the Company is obligated to provide short-term investments totalling CA$1,024,000 (US$815,000) (April 30, 2004 – CA$1,024,000 (US$747,000)) as security for outstanding letters of guarantee expiring beyond one year from April 30, 2005 (note 8(c)). As a result, this amount has been classified as restricted cash equivalents and other investments.
4 Accounts receivable
Accounts receivable comprise the following:
April 30, 2005
April 30, 2004
Trade, net of an allowance for doubtful accounts of $135
(April 30, 2004 – $1,221) 6,467 4,398 Work in process 533 307
7,000 4,705

TECSYS Inc. Notes to Consolidated Financial Statements Prepared in Accordance with Canadian Generally Accepted Accounting Principles
(in U.S. dollars, tabular amounts in thousands, except as otherwise noted)
40 TECSYS Inc. Annual Report 2005
5 Tax credits receivable
Tax credits receivable comprise the following:
April 30, 2005
April 30, 2004
Refundable research and development tax credits 444 304 Refundable multimedia tax credits 797 752
1,241 1,056
6 Property, plant and equipment
Property, plant and equipment comprise the following:
April 30, 2005
Cost Accumulated amortization Net
Computer equipment 5,479 4,492 987 Furniture and fixtures 2,076 1,476 600 Exhibition equipment 338 271 67 Leasehold improvements 1,294 904 390
9,187 7,143 2,044
April 30, 2004
Cost Accumulated amortization Net
Computer equipment 4,767 3,808 959 Furniture and fixtures 1,900 1,244 656 Exhibition equipment 266 238 28 Leasehold improvements 1,190 774 416
8,123 6,064 2,059

TECSYS Inc. Notes to Consolidated Financial Statements Prepared in Accordance with Canadian Generally Accepted Accounting Principles
(in U.S. dollars, tabular amounts in thousands, except as otherwise noted)
TECSYS Inc. Annual Report 2005 41
7 Goodwill and other intangible assets
a) Intangible assets comprise the following:
April 30, 2005
Cost Accumulated amortization Net
Technology (note 2)
PointForce 634 169 465 ASI 400 13 387
Customer relationships (note 2) PointForce 443 118 325 ASI 563 19 544 Symplistech 157 3 154
Other intangible assets ASI 123 4 119 Symplistech 7 - 7
Software acquired for internal use 1,861 1,623 238 4,188 1,949 2,239
April 30, 2004
Cost Accumulated amortization Net
Technology (note 2) 581 39 542 Customer relationships (note 2) 406 27 379 Software acquired for internal use 1,692 1,398 294
2,679 1,464 1,215
During fiscal 2005, the Company acquired intangible assets totalling $1,278,000 (FY2004 – $1,048,000) relating to the business combinations described in note 2 and $13,000 (FY2004 – $40,000) for the acquisition of software for internal use.
During fiscal 2003, the Company reassessed the carrying value of technology resulting from a business combination effected in July 2000 and of a sub-licensing right acquired in May 2000. These analyses determined that no future cash flows could be expected from the exploitation of either of these assets. Accordingly, the Company concluded that both of these assets were fully impaired and recognized an impairment loss during 2003 equal to their net aggregate carrying value of $1,059,000.

TECSYS Inc. Notes to Consolidated Financial Statements Prepared in Accordance with Canadian Generally Accepted Accounting Principles
(in U.S. dollars, tabular amounts in thousands, except as otherwise noted)
42 TECSYS Inc. Annual Report 2005
b) The changes in the carrying amount of goodwill for the years ended April 30, 2005 and 2004 are as follows:
Years ended April 30,
2005 2004 Balance – Beginning of year 1,242 - Business combinations (note 2) 482 1,317 Effect of foreign exchange 103 (75) Balance – End of year 1,827 1,242
Effective May 1, 2002, the Company adopted the recommendations of CICA Handbook Section 3062, “Goodwill and Other Intangible Assets”. Upon completion of the transitional impairment tests, the Company determined that at May 1, 2002, the carrying value of the assets of the acquired businesses exceeded the fair value of those businesses as determined using expected discounted future cash flows and that the related goodwill was fully impaired. Consequently, the Company recorded a transitional impairment loss as at May 1, 2002 in the amount of $346,000, which was charged to deficit.
8 Credit facilities
a) The Company renewed its banking agreement with National Bank of Canada in January 2005. This agreement obliges the Company to respect certain covenants in the form of financial ratios, which have been respected as of April 30, 2005.
b) Under the terms of the agreement, the Bank has also agreed to provide a currency risk protection facility for a principal amount not exceeding CA$750,000 (US$597,000) which may be used to issue forward exchange contracts regarding the sale or purchase of foreign currencies. As at April 30, 2005 and 2004, the Company had no forward exchange contracts outstanding to hedge against potential gains and losses.
c) This facility also permits the issuance of letters of guarantee of up to a maximum amount of CA$1,500,000 (US$1,193,000). As at April 30, 2005, CA$1,024,000 (US$815,000) of this facility was used to obtain letters of guarantee in favour of one of the Company’s landlords and must be renewed annually through fiscal 2010 as per the terms of the lease.
d) These facilities are secured by a first ranking general hypothec of CA$2,000,000 on all present and future moveable assets.

TECSYS Inc. Notes to Consolidated Financial Statements Prepared in Accordance with Canadian Generally Accepted Accounting Principles
(in U.S. dollars, tabular amounts in thousands, except as otherwise noted)
TECSYS Inc. Annual Report 2005 43
9 Accounts payable and accrued liabilities
Accounts payable and accrued liabilities comprise the following:
April 30, 2005
April 30, 2004
Trade 3,039 2,214 Accrued employee costs 1,311 1,060 Other 540 417
4,890 3,691
10 Long-term debt
a) Long-term debt, all of which is denominated in Canadian dollars, includes the following:
April 30, 2005
April 30, 2004
Expansion term loan, bearing interest based on the lender’s
banking rates (5.75% as of April 30, 2005), repayable in October 2006 (CA$500,000) 398 365
Subordinated loan from a person related to certain shareholders, bearing interest at 12.67%, with no specific terms of repayment (CA$107,000) 85 78
Capital lease obligations (CA$41,000; 2004 – CA$98,000) 33 72 Term loan from the Economic Development Agency of
Canada, non-interest bearing, (CA$84,000), repaid in 2004 - 61
516 576
Less: Current portion 106 175 410 401

TECSYS Inc. Notes to Consolidated Financial Statements Prepared in Accordance with Canadian Generally Accepted Accounting Principles
(in U.S. dollars, tabular amounts in thousands, except as otherwise noted)
44 TECSYS Inc. Annual Report 2005
b) As at April 30, 2005, future minimum payments required under capital lease obligations are as follows:
Years ending April 30, 2006 24 2007 12
36
Less: Amounts representing interest (weighted average interest rate of 11.4%) 3
33
Less: Current portion 21
12
c) The estimated aggregate amount of capital repayments on long-term debt as at April 30, 2005, excluding capital lease obligations, required in future years to fully reimburse these obligations is as follows:
Years ending April 30, 2006 85 2007 398
d) Interest expense on long-term debt and capital lease obligations amounted to US$36,000, US$72,000 and US$97,000 in 2005, 2004 and 2003 respectively.
e) Certain of these loans and obligations require the Company to respect certain financial covenants, which were respected as of April 30, 2005.
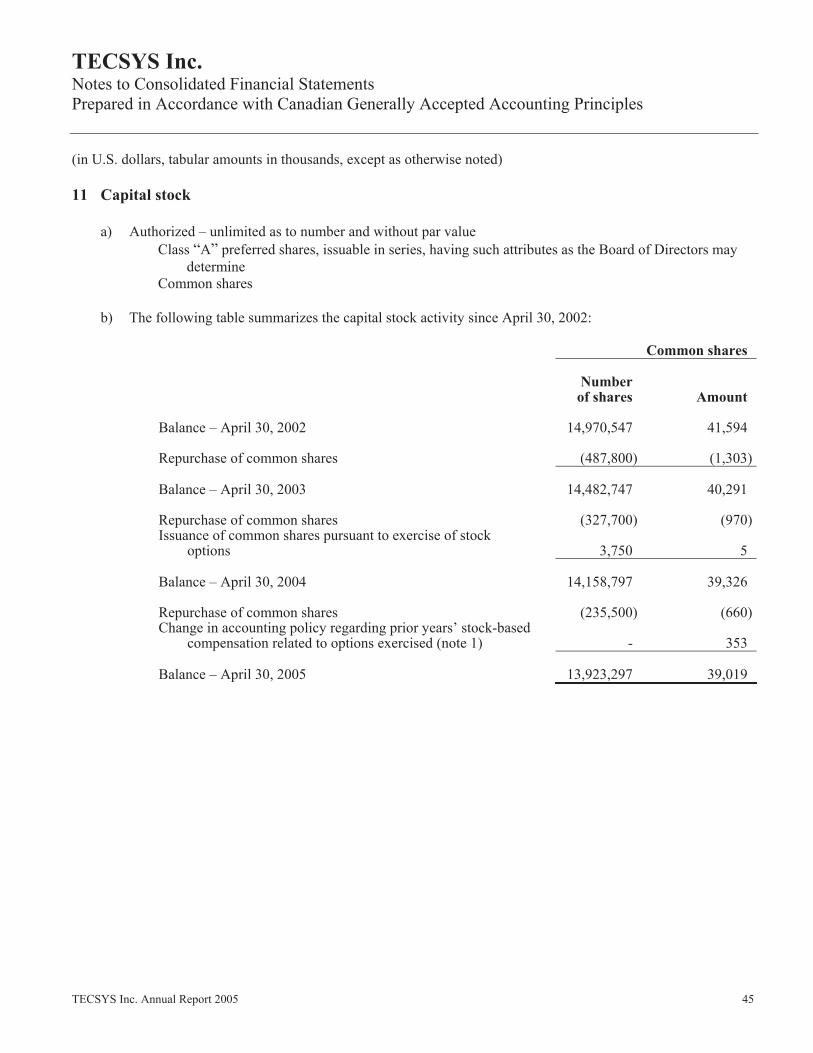
TECSYS Inc. Notes to Consolidated Financial Statements Prepared in Accordance with Canadian Generally Accepted Accounting Principles
(in U.S. dollars, tabular amounts in thousands, except as otherwise noted)
TECSYS Inc. Annual Report 2005 45
11 Capital stock
a) Authorized – unlimited as to number and without par value Class “A” preferred shares, issuable in series, having such attributes as the Board of Directors may
determine Common shares
b) The following table summarizes the capital stock activity since April 30, 2002:
Common shares
Number of shares Amount
Balance – April 30, 2002 14,970,547 41,594
Repurchase of common shares (487,800) (1,303) Balance – April 30, 2003 14,482,747 40,291 Repurchase of common shares (327,700) (970)Issuance of common shares pursuant to exercise of stock
options 3,750 5 Balance – April 30, 2004 14,158,797 39,326 Repurchase of common shares (235,500) (660)Change in accounting policy regarding prior years’ stock-based
compensation related to options exercised (note 1) - 353 Balance – April 30, 2005 13,923,297 39,019

TECSYS Inc. Notes to Consolidated Financial Statements Prepared in Accordance with Canadian Generally Accepted Accounting Principles
(in U.S. dollars, tabular amounts in thousands, except as otherwise noted)
46 TECSYS Inc. Annual Report 2005
The following table summarizes the contributed surplus activity since April 30, 2002:
Amount Balance – April 30, 2002 -
Repurchase of 487,800 common shares – excess of net book
value over purchase price 996 Balance – April 30, 2003 996 Repurchase of 327,700 common shares – excess of net book
value over purchase price 610 Balance – April 30, 2004 1,606 Repurchase of 235,500 common shares – excess of net book
value over purchase price and related costs 365 Change in accounting policy regarding prior years’ stock-based
compensation (note 1) 4,785 Change in accounting policy regarding prior years’ stock-based
compensation related to options exercised (note 1) (353)Current year’s stock-based compensation 174 Fair value of warrants issued regarding ASI acquisition (note 2) 20 Fair value of warrants issued regarding Symplistech acquisition
(note 2) 27 Balance – April 30, 2005 6,624
c) On July 15, 2004, the Company filed a renewal with the Toronto Stock Exchange of a Notice of Intention to Make a Normal Course Issuer Bid (the “Notice”). In the Notice, the Company stated its intention to purchase on the open market at prevailing market prices, through the facilities of the Toronto Stock Exchange, up to a maximum of 700,000 of its common shares, being approximately 5% of the 14,158,797 common shares outstanding as at June 30, 2004, but not more than 2% of such outstanding shares in any 30-day period. Under this renewal, the Company may purchase common shares if it considers it advisable, at any time and from time to time until July 16, 2005. The common shares will be purchased for cancellation.
During the year, the Company purchased 235,500 (2004 – 327,700) of its outstanding common shares for cancellation at an average price of CA$1.51 (US$1.23) per share (2004 – CA$1.44 (US$1.05)). The total cost related to purchasing these shares, including other related costs, was CA$360,000 (US$293,000) (2004 – CA$495,000 (US$360,000)). The excess of the net book value over the purchase price of these shares of CA$615,000 (US$370,000) (2004 – CA$844,000 (US$610,000)) has been credited to contributed surplus.

TECSYS Inc. Notes to Consolidated Financial Statements Prepared in Accordance with Canadian Generally Accepted Accounting Principles
(in U.S. dollars, tabular amounts in thousands, except as otherwise noted)
TECSYS Inc. Annual Report 2005 47
d) In 1998, the Company adopted a new stock option plan. All options then outstanding under the previous plan were continued under the new plan. As at the date of adoption of the new plan, there were 265,910 options outstanding under the old plan. Under the new plan, the total number of additional common shares which may be issued is 1,145,000, and the maximum number that may be issued in the aggregate to any single individual under the new plan or any other future plan shall not exceed 5% of the number of shares issued and outstanding at the time of granting. The exercise price shall be the “market price” of the common shares in Canadian dollars at the time of granting, the market price being the weighted average trading price per share traded on the Toronto Stock Exchange during the period of five trading days preceding the date of grant. The options are non-assignable and generally expire five years after the date of granting. Options granted under this plan generally vest over a period of four years, with 25% (31.25% for options issued before May 10, 2000) becoming exercisable on the first anniversary of the date of grant and an additional 6.25% becoming exercisable at the end of each three-month period thereafter.
The following table summarizes information about stock options outstanding as at April 30, 2005:
Options outstanding Options exercisable
Exercise priceUS$
Numberoutstanding
Weightedaverage
remainingcontractual
life(years)
Weightedaverageexercise
priceUS$
Numberexercisable
Weightedaverageexercise
priceUS$
0.79 110,750 1.48 0.79 96,906 0.79 0.94 – 1.40 497,075 2.84 1.26 239,450 1.25 1.41 – 2.11 271,395 3.79 1.66 76,222 1.71 2.52 125,750 0.71 2.52 125,750 2.52 4.71 4,950 0.56 4.71 4,950 4.71 1,009,920 2.67 1.49 543,278 1.56
As at April 30, 2004, there were 325,439 options exercisable at a weighted average exercise price of US$1.82.

TECSYS Inc. Notes to Consolidated Financial Statements Prepared in Accordance with Canadian Generally Accepted Accounting Principles
(in U.S. dollars, tabular amounts in thousands, except as otherwise noted)
48 TECSYS Inc. Annual Report 2005
The following table summarizes the stock option activity under this plan:
Number of options
Weightedaverageexercise
priceCA$
Weightedaverageexercise
priceUS$
Balance – April 30, 2002 910,592 5.64 3.60
Granted 175,450 1.50 0.98 Expired (143,456) (4.10) (2.67)Forfeited (77,787) (4.85) (3.15)
Balance – April 30, 2003 864,799 5.12 3.57
Granted 464,300 1.76 1.31 Exercised (3,750) (1.70) (1.27)Expired (134,681) (4.10) (3.05)Forfeited (230,814) (12.00) (8.93)
Balance – April 30, 2004 959,854 2.00 1.46 Granted 128,500 1.91 1.50 Expired (24,779) (6.90) (5.43) Forfeited (53,655) (1.97) (2.85)
Balance – April 30, 2005 1,009,920 1.87 1.49
As an integral part of the ASI acquisition cost, each of the five former owners was issued 5,000 warrants to purchase in aggregate 25,000 common shares of TECSYS Inc., the exercise price of which was the weighted average price of common shares of TECSYS Inc. on the Toronto Stock Exchange for the five trading days preceding February 28, 2005 (the “Grant Date”). The exercise price per warrant was CA$1.64 (US$1.30). The warrants will vest 33.33% on each anniversary of the Grant Date over a three-year period and will expire four years from the Grant Date.
As an integral part of the Symplistech acquisition cost, a former owner was issued warrants to purchase 30,000 common shares of TECSYS Inc., the exercise price of which was the weighted average price of common shares of TECSYS Inc. on the Toronto Stock Exchange for the five trading days preceding March 31, 2005 (the “Grant Date”). The exercise price per warrant was CA$1.73 (US$1.38). The warrants will vest 25% on the first anniversary of the Grant Date and 6.25% per quarter thereafter and will expire five years from the Grant Date.

TECSYS Inc. Notes to Consolidated Financial Statements Prepared in Accordance with Canadian Generally Accepted Accounting Principles
(in U.S. dollars, tabular amounts in thousands, except as otherwise noted)
TECSYS Inc. Annual Report 2005 49
In fiscal 2004, pursuant to the acquisition of PointForce, a key employee was issued warrants to purchase 30,000 common shares of TECSYS Inc., the exercise price of which was the weighted average price of common shares of TECSYS Inc. on the Toronto Stock Exchange for the twenty trading days preceding December 31, 2003 (the “Grant Date”). The exercise price per warrant was CA$2.03 (US$1.48). The warrants vest in tranches of 25% on each anniversary of the Grant Date over a four-year period and will expire five years from the Grant Date.
The following table summarizes information about the warrants outstanding as at April 30, 2005:
Warrants outstanding Warrants exercisable
Exercise price US$
Number outstanding
Weighted average
remaining contractual
life (years)
Weightedaverageexercise
price US$
Number exercisable
Weightedaverageexercise
price US$
1.30 – 1.62 85,000 3.37 1.44 7,500 1.62
The following table summarizes the stock warrant activity:
Number of warrants
Weightedaverageexercise
priceCA$
Weightedaverageexercise
priceUS$
Balance – April 30, 2003 - - -
Granted 30,000 2.03 1.48
Balance – April 30, 2004 30,000 2.03 1.48 Granted 55,000 1.69 1.34
Balance – April 30, 2005 85,000 1.81 1.44

TECSYS Inc. Notes to Consolidated Financial Statements Prepared in Accordance with Canadian Generally Accepted Accounting Principles
(in U.S. dollars, tabular amounts in thousands, except as otherwise noted)
50 TECSYS Inc. Annual Report 2005
e) Stock-based compensation costs
Commencing May 1, 2004, the Company adopted the fair value based method of accounting for stock options and warrants granted to employees and directors and elected to apply the new standard retroactively without restatement. The stock-based compensation cost recorded for the year ended April 30, 2005 was CA$221,000 (US$174,000). Stock-based compensation costs are not reflected in the statement of operations for the years ended April 30, 2004 and 2003. If the fair value based method had been used to account for stock-based compensation costs related to stock options and warrants issued to employees and directors, the net earnings (loss) and related net earnings (loss) per share figures would be as follows:
Years ended April 30, 2004 2003
Net earnings (loss) for the year 415 (6,606)Stock-based compensation costs (219) (551)
Pro forma net earnings (loss) for the year 196 (7,157)
Pro forma basic and diluted net earnings (loss) per common share 0.01 (0.48)
The fair value of options and warrants granted was estimated using the Black-Scholes option pricing model with the following weighted average assumptions:
Years ended April 30, 2005 2004 2003
Volatility 62.5% 75% 75% Risk-free interest rate 3.7% 3.0% 3.0% Dividend yield nil nil nil Expected lives (in years) 4 3 3

TECSYS Inc. Notes to Consolidated Financial Statements Prepared in Accordance with Canadian Generally Accepted Accounting Principles
(in U.S. dollars, tabular amounts in thousands, except as otherwise noted)
TECSYS Inc. Annual Report 2005 51
Following is a summary of the weighted average grant date fair value of options and warrants granted during the years ended April 30, 2005, 2004 and 2003:
Number of options
and warrants
Weightedaverageexercise
priceUS$
Weightedaverage
grant date fair value
US$
2005 Warrants 55,000 1.34 0.81 2005 Options 128,500 1.50 0.76 2004 Warrants 30,000 1.48 0.86 2004 Options 464,300 1.31 0.67 2003 Options 175,450 0.98 0.49

TECSYS Inc. Notes to Consolidated Financial Statements Prepared in Accordance with Canadian Generally Accepted Accounting Principles
(in U.S. dollars, tabular amounts in thousands, except as otherwise noted)
52 TECSYS Inc. Annual Report 2005
12 Income taxes
a) The provision for income taxes varies from the expected provision at the statutory rate for the following reasons:
Years ended April 30,
2005%
2004%
2003%
Combined basic federal and provincial
statutory income tax rate 33.19 32.07 34.59 Unrecognized benefit of non-capital
losses and undeducted research and development expenses 29.38 - (23.71)
Benefit of previously unrecognized non-capital losses and undeducted research and development expenses (119.32) (19.22) -
Unrecognized benefit of net operating losses of U.S. subsidiaries - - (0.04)
Benefit of previously unrecognized net operating losses of U.S. subsidiaries (1.17) (1.65) -
Unrecognized benefit of current year temporary differences 89.52 5.08 (10.89)
Large corporations tax - - 0.15 Permanent differences including
non-deductible expenses and non-taxable foreign exchange gains (31.60) (16.28) 0.10
Other - - (0.05) Provision for income taxes per the
financial statements - - 0.15

TECSYS Inc. Notes to Consolidated Financial Statements Prepared in Accordance with Canadian Generally Accepted Accounting Principles
(in U.S. dollars, tabular amounts in thousands, except as otherwise noted)
TECSYS Inc. Annual Report 2005 53
b) The future income tax balances are summarized as follows:
April 30, 2005
April 30, 2004
Future income tax assets
Non-refundable research and development tax credits (net of related income taxes) 4,053 3,966
Research and development expenses 4,370 3,675 Share issue costs 8 12 Non-capital losses 1,815 2,041 Net operating losses of U.S. subsidiaries 1,624 1,628 Property, plant and equipment 1,873 1,419 Other 254 256
13,997 12,997 Valuation allowance (13,288) (12,809)
Total future income tax assets 709 188 Future income tax liabilities
Multimedia tax credits (41) (188)Intangible assets on business acquisitions (668) -
Total future income tax liabilities - -
c) As at April 30, 2005, the Company had accumulated research and development expenses of approximately CA$16,510,000 (US$13,135,000) for Federal income tax purposes, CA$14,594,000 (US$11,611,000) for Quebec provincial income tax purposes, and CA$17,482,000 (US$13,909,000) for Ontario provincial income tax purposes which may be carried forward indefinitely and used to reduce taxable income in future years.

TECSYS Inc. Notes to Consolidated Financial Statements Prepared in Accordance with Canadian Generally Accepted Accounting Principles
(in U.S. dollars, tabular amounts in thousands, except as otherwise noted)
54 TECSYS Inc. Annual Report 2005
d) As at April 30, 2005, the Company had non-capital loss carryforwards totalling approximately CA$5,790,000 (US$4,607,000) for Canadian Federal income tax purposes, CA$11,368,000 (US$9,044,000) for Quebec provincial income tax purposes, and CA$6,792,000 (US$5,404,000) for Ontario provincial income tax purposes which may be used to reduce taxable income in future years. These losses may be claimed no later than fiscal years ending April 30:
FederalCA$
Quebec Provincial
CA$
Ontario Provincial
CA$ 2007 - 341 - 2008 - 1,134 - 2009 3,295 5,217 4,340 2010 1,180 4,250 1,198 2011 889 - 889 2012 426 426 365
e) As at April 30, 2005, the Company’s U.S. subsidiaries had net operating loss carryforwards for Federal income tax purposes totalling approximately US$5,049,000 which may be used to reduce Federal taxable income in future years. These losses may be claimed no later than fiscal years ending April 30:
2019 133 2020 820 2021 3,912 2023 174 2024 10
13 Product revenue
Product revenue is broken down as follows:
Years ended April 30, 2005 2004 2003
Software products 4,031 2,779 2,209 Third party hardware and software
products 4,552 3,884 3,108 8,583 6,663 5,317

TECSYS Inc. Notes to Consolidated Financial Statements Prepared in Accordance with Canadian Generally Accepted Accounting Principles
(in U.S. dollars, tabular amounts in thousands, except as otherwise noted)
TECSYS Inc. Annual Report 2005 55
14 Cost of services
Cost of services is detailed as follows:
Years ended April 30, 2005 2004 2003
Gross expenses 8,471 5,983 6,246 Multimedia tax credits (518) (612) (730) 7,953 5,371 5,516
15 Restructuring charges
During the third quarter of fiscal 2003, the Company entered into a sub-lease agreement with a third party regarding one floor at one of its facilities which the Company vacated at the beginning of that quarter. The Company’s remaining lease obligations extend through April 30, 2010, while the sub-lease term expires on December 31, 2007. At the expiration of the sub-lease, the sub-lessee has the option to renew the sub-lease for the remainder of the Company’s contractual lease term, subject to the consent of the Company. Accordingly, the Company has recorded a provision for restructuring costs, which represents the estimated excess of future contractual lease payments and operating expenses over the estimated future sub-lease revenue, as well as the write-down of the associated leasehold improvements and furniture and fixtures to their estimated fair value.
The restructuring charges originally consisted of the following:
Rental payments, net of recoveries 945 Write-down of property, plant and equipment 256
1,201

TECSYS Inc. Notes to Consolidated Financial Statements Prepared in Accordance with Canadian Generally Accepted Accounting Principles
(in U.S. dollars, tabular amounts in thousands, except as otherwise noted)
56 TECSYS Inc. Annual Report 2005
Following is a summary of the change in the provision for rent and operating costs since the date the provision was established:
Initial provision 945 Actual expenses – 2003 (186) Foreign exchange 75 Provision as at April 30, 2003 834 Actual expenses – 2004 (160) Foreign exchange 41
Provision as at April 30, 2004 715 Actual expenses – 2005 (102) Foreign exchange 55 Provision as at April 30, 2005 668
As at April 30, 2005, the provision has been presented as follows:
Accounts payable and accrued liabilities 120 Other long-term liabilities 548
668
16 Supplementary cash flow information
Years ended April 30, 2005 2004 2003
Cash paid for interest 36 72 118 Cash paid (received) for income taxes - (4) 14
17 Contingencies
a) In the 2002 fiscal year, a former customer instituted a lawsuit against the Company claiming damages in the amount of $3,200,000 for breach of contract and implied warranties, misrepresentation, unfair and deceptive consumer sales practices and unjust enrichment. The Company believes the claim is unfounded and has vigorously contested the lawsuit. No provision is included in the financial statements. Discovery is

TECSYS Inc. Notes to Consolidated Financial Statements Prepared in Accordance with Canadian Generally Accepted Accounting Principles
(in U.S. dollars, tabular amounts in thousands, except as otherwise noted)
TECSYS Inc. Annual Report 2005 57
ongoing with a trial date set for January 2006. The outcome of this claim cannot be determined at this time and it is not possible to reasonably estimate its likely outcome.
b) Through the course of operations, the Company is party to a number of other lawsuits, claims and contingencies. Accruals are made in instances where it is probable that liabilities will be incurred and where such liabilities can be reasonably estimated. Although it is possible that liabilities may be incurred in instances for which no accrual has been made, the Company has no reason to believe that the ultimate resolution of such matters will have a material impact on its financial position.
c) The Company has guaranteed a mortgage loan on behalf of the TECSYS Foundation for Youth (the “Foundation”) in the amount of CA$247,500 (US$197,000) for the purchase of land and a building to be used by the Foundation as a school. The mortgage loan was granted on December 23, 2002, bears interest at Canadian prime rate plus 0.5% and is payable monthly. The principal is payable in 180 equal and consecutive monthly instalments of CA$1,375 (US$1,094), which instalments are being paid by the Foundation. The outstanding principal balance of the mortgage amounted to CA$209,000 (US$166,000) as at April 30, 2005. The mortgage is secured by the land and building.
18 Commitments
a) As at April 30, 2005, the minimum future rental payments required under long-term operating leases are as follows:
2006 1,379 2007 1,241 2008 1,029 2009 1,015 2010 1,025
b) Under the terms of a licensing agreement with a third party, the Company is committed to pay royalties calculated at a rate of 1% of revenue, excluding reimbursable expenses, increasing to 1.5% from May 1, 2005. Revenues derived from the operations of acquired companies are exempt from royalties only for a period of 18 months from the date of the acquisition. Revenues derived from the operations of PointForce are exempt until June 30, 2005. Similarly, revenues derived from the operations of ASI and Symplistech are exempt from royalties until August 31, 2006 and September 30, 2006 respectively.
The agreement was effective February 1, 2004, has an initial term expiring April 30, 2007, and may be terminated by either party at any time by providing six months’ notice. The Company has incurred costs related to this agreement of $155,000 for the twelve-month period ended April 30, 2005 and $39,000 for the period from February 1, 2004 to April 30, 2004.

TECSYS Inc. Notes to Consolidated Financial Statements Prepared in Accordance with Canadian Generally Accepted Accounting Principles
(in U.S. dollars, tabular amounts in thousands, except as otherwise noted)
58 TECSYS Inc. Annual Report 2005
19 Related party transactions
The following transactions occurred between the Company and certain related parties:
Years ended April 30, 2005 2004 2003
Interest on advances from a person related to certain shareholders 11 10 9
All other balances and transactions with related parties are disclosed separately in these financial statements.These transactions occurred in the normal course of operations and were measured at the exchange amount, which is the amount of consideration established and agreed to by the related parties.
20 Financial instruments
a) Currency risks
Certain of the Company’s sales and expenses are incurred in U.S. dollars, resulting in U.S. dollar- denominated accounts receivable and accounts payable. In addition, certain of the Company’s cash and cash equivalents are denominated in U.S. dollars. These balances are therefore subject to gains or losses due to fluctuations in that currency.
During fiscal 2005, the Company protected a portion of its net monetary U.S. assets by means of various forward exchange contracts to sell U.S. currency forward.
As at April 30, 2005 and 2004, the Company held no forward exchange contracts outstanding to hedge against potential gains or losses due to currency fluctuations.
Subsequent to the current year ended April 30, 2005, the Company undertook another forward exchange contract to sell US$2,000,000 forward at a rate of 1.2522 on July 29, 2005.
b) Credit and concentration risks
Financial instruments which potentially subject the Company to credit risk consist principally of cash and cash equivalents, short-term and other investments, and accounts receivable. The Company’s cash and cash equivalents are maintained at major financial institutions and short-term and other investments consist of commercial paper and investment certificates issued by high-credit quality corporations and financial institutions; therefore, the Company considers the risk of non-performance of these instruments to be remote.

TECSYS Inc. Notes to Consolidated Financial Statements Prepared in Accordance with Canadian Generally Accepted Accounting Principles
(in U.S. dollars, tabular amounts in thousands, except as otherwise noted)
TECSYS Inc. Annual Report 2005 59
There is no customer comprising more than 10% of total trade accounts receivable. There is no particular concentration of credit risk due to the North American distribution of customers and procedures for the management of commercial risks. The Company performs ongoing credit reviews of all its customers and establishes an allowance for doubtful accounts receivable when accounts are determined to be uncollectible. In addition, the Company has entered into an arrangement with Export Development Corporation wherein the latter has assumed the risk of credit loss in the case of bankruptcy for up to 90% of accounts receivable from certain foreign and domestic customers, to a maximum of US$2,500,000 and CA$1,000,000 (US$796,000) respectively, in any given year. As at April 30, 2005, accounts receivable (prior to the allowance for doubtful accounts) include accounts totalling US$1,905,000 and CA$777,000 (US$618,000) that were pre-approved for coverage, subject to the above-noted maximums, under this arrangement (April 30, 2004 – US$3,763,000 and CA$841,000 (US$614,000)).
c) Fair value
Cash and cash equivalents, short-term and other investments, accounts receivable and accounts payable and accrued liabilities are short-term financial instruments whose fair values approximate their carrying values.
The fair value of the long-term debt, capital lease obligations and other long-term liabilities was determined by discounting future cash flows using interest rates which the Company could obtain for loans with similar terms, conditions and maturity dates. There was no significant difference between the fair value and the carrying value of long-term debt and capital lease obligations as at April 30, 2005 and 2004. The fair value of other long-term liabilities, including the current portion, as at April 30, 2005 was $578,000 (2004 – $607,000) versus a carrying value of $668,000 (2004 – $715,000).
d) Interest rate risks
As at April 30, 2005, the Company’s exposure to interest rate risk is summarized as follows:
Cash and cash equivalents Non-interest bearing Short-term investments As described in note 3 Restricted cash equivalents and other investments As described in note 3 Accounts receivable Non-interest bearing Accounts payable and accrued liabilities Non-interest bearing Long-term debt and capital lease obligations As described in note 10 Other long-term liabilities Non-interest bearing
21 Segment information
Management has organized the Company under one reportable segment: the development and marketing of enterprise-wide distribution software and related services. Substantially all of the Company’s long-lived assets are located in Canada.

TECSYS Inc. Notes to Consolidated Financial Statements Prepared in Accordance with Canadian Generally Accepted Accounting Principles
(in U.S. dollars, tabular amounts in thousands, except as otherwise noted)
60 TECSYS Inc. Annual Report 2005
Following is a summary of revenue by geographic location in which the Company’s customers are located:
Years ended April 30, 2005 2004 2003
United States 12,114 11,109 11,135 Canada 11,969 6,208 3,651 Other 189 233 245
24,272 17,550 15,031
Major customers
There were no major customers (customers from which 10% or more of total revenue is derived during the specified period) for fiscal year 2005 and 2004. In fiscal 2003, one customer accounted for 11.6% of total revenue.

TECSYS Inc. Notes to Consolidated Financial Statements Prepared in Accordance with Canadian Generally Accepted Accounting Principles
(in U.S. dollars, tabular amounts in thousands, except as otherwise noted)
TECSYS Inc. Annual Report 2005 61
22 Significant differences between Canadian and United States GAAP
The Company’s financial statements were prepared in accordance with Canadian GAAP, which differs in some respects from U.S. GAAP. Significant measurement differences between Canadian GAAP and U.S. GAAP as they relate to the Company are set forth below.
a) Statements of operations
The following summary sets out the material differences between the Company’s reported net earnings (loss) and basic and diluted net earnings (loss) per share under Canadian GAAP as compared to U.S. GAAP:
Years ended April 30, 2005 2004 2003
Net earnings (loss) for the year in
accordance with Canadian GAAP 334 415 (6,606)
Write-off of in-process research & development relating to ASI acquisition (60) - -
Transitional goodwill impairment loss - - (346) Net earnings (loss) for the year in
accordance with U.S. GAAP 274 415 (6,952)Other comprehensive income
Foreign currency translation adjustments 1,193 536 1,313
Comprehensive income (loss) 1,467 951 (5,639) Basic and diluted net earnings (loss)
per share 0.02 0.03 (0.47)

TECSYS Inc. Notes to Consolidated Financial Statements Prepared in Accordance with Canadian Generally Accepted Accounting Principles
(in U.S. dollars, tabular amounts in thousands, except as otherwise noted)
62 TECSYS Inc. Annual Report 2005
b) Summary statements of operations
The following are summary statements of operations prepared in accordance with U.S. GAAP:
Years ended April 30, 2005 2004 2003
Revenues 24,272 17,550 15,031 Gross margin 12,414 9,371 6,848 Operating expenses 12,009 8,908 12,757 Earnings (loss) from operations 405 463 (5,909)
Net earnings (loss) 274 415 (6,952)
c) Write-off of in-process research and development projects regarding the ASI acquisition
In fiscal 2005, the purchase price allocation regarding the acquisition of ASI identified various intangible assets including in-process research and development with an unamortized balance of $60,000 as at April 30, 2005. In accordance with Canadian GAAP, the Company provides for the amortization of intangible assets on a straight-line basis over their estimated useful life of five years. U.S. GAAP requires that in-process research and development identified as an intangible asset pursuant to an acquisition is charged to
d) Transitional goodwill impairment loss
Upon adoption in 2003 of SFAS No. 142, “Goodwill and Other Intangible Assets”, a transitional impairment loss was charged to the consolidated statement of operations in 2003 as a cumulative effect of a change in accounting policy. Under Canadian GAAP, this impairment loss was charged to deficit.
e) Disclosure of guarantees
The Company has not issued any guarantees subsequent to December 31, 2002 which require recognition in the financial statements under FASB Interpretation No. 45.
The Company does not maintain an accrual for future warranty claims since the costs of providing any warranty services are minimal. The Company is covered by back-to-back warranties from suppliers of third-party products and services.
the current period immediately following the acquisition.

TECSYS Inc. Notes to Consolidated Financial Statements Prepared in Accordance with Canadian Generally Accepted Accounting Principles
(in U.S. dollars, tabular amounts in thousands, except as otherwise noted)
TECSYS Inc. Annual Report 2005 63
23 Comparative figures
Certain comparative figures have been reclassified to conform with the basis of presentation used in the current year.
24 Subsequent event
On June 21, 2005, the Company adopted a resolution to amend the stock option plan (the “Plan”) adopted in 1998 (note 11(d)) to change the total number of common shares which may be issued upon the exercise of options that may be granted under the Plan. The amendment would increase the maximum number of stock options from 1,145,000 to 10% of the total number of common shares issued and outstanding. The amendment to the Plan requires the approval of the Toronto Stock Exchange and the Company’s shareholders at the next shareholders meeting.
Intention to Make a Normal Course Issuer Bid ( the "Notice"). The Notice stated the Company's intention to purchase on the open market at prevailing market prices, through the facilities of the Toronto Stock Exchange, up to a maximum of 690,000 of its common shares, being approximately 5% of the 13,857,797 common shares outstanding as of June 30, 2005, but not more than 2% of such outstanding common shares in any 30-day period. The Company may purchase common shares under the bid, if it considers it advisable, at any time and from time to time between July 19, 2005 and July 18, 2006.
On July 14, 2005, the Company filed a one-year renewal with the Toronto Stock Exchange, a Notice of


The statements in this report relating to matters that are not historical fact are forward looking statements that are based on management’s beliefs and assumptions. Such statements are not guarantees of future performance, and are subject to a number of uncertainties, including but not limited to future economic conditions, the markets that TECSYS Inc. serves, the actions of competitors, major new technological trends and other factors beyond the control of TECSYS Inc., which could cause actual results to differ materially from such statements.