Enabling Rural Innovation in Africa, CIAT-Africa, P O Box...
24
1 Participatory Monitoring and Evaluation for Stakeholder Engagement, Assessment of Project Impacts, and for Institutional and Community Learning and Change Jemimah Njuki , Susan Kaaria Colletah Chitsike and Pascal Sanginga Enabling Rural Innovation in Africa, CIAT-Africa, P O Box 6247 Kampala, Uganda Abstract Participatory monitoring and evaluation (PM&E) offers new ways for strengthening learning and change both at community, project and institutional level. PM&E can and has been used for various purposes, including project planning and management, organizational strengthening and learning, understanding and negotiating stakeholder interests, and the assessment of project outcomes and impacts. For example, at community level, PM&E systems can serve as a tool for strengthening the local capacity to track changes, assess the effectiveness, environmental sustainability and livelihood impacts of their projects. The process involves scientists and communities negotiating and agreeing on what changes they expect from projects; what they need to do to achieve these changes; what local and scientific indicators will track these changes; and which success and failure factors need to be monitored to ensure that the projects are on track. This research project seeks to investigate whether PM&E systems can contribute to improving project performance, ownership, and success; strengthen local decision- making processes; and enhance accountability of formal R&D organizations to communities, thereby improving the delivery of outputs and outcomes. The paper presents lessons and experiences from establishing and applying PM&E systems at both the community and project levels within the Kenya Agricultural Research Institute (KARI). It details the process of establishing the PM&E systems, including strategies for stakeholder involvement, identification of community indicators for empowerment, enhanced capacity, and differences in local indicators for men and women. Preliminary results from this study indicate that scientists are beginning to apply the PM&E process to engage their stakeholders in joint planning, developing common objectives and vision, and in collectively assessing progress. Scientists are paying more attention to issues and concerns of stakeholders and are adjusting project outcomes, outputs, and indicators based on stakeholder priorities. At the community level, PM&E data is being applied to adjust project activities, reflect and make decisions on various aspects of community initiatives, and to plan and monitor the implementation of activities. Additionally, communities are using these systems to hold R&D institutions accountable to their priorities, through effective communication and feedback mechanisms. These results demonstrate that integrating local indicators with project level indicators provides a more holistic view of the benefits and impacts strengthens information feedback process between communities and R&D systems. This process also provides indicators for measuring the often hard to measure process level outcomes such as empowerment from the perspectives of the communities. Developing indicators and negotiating them with different stakeholders allows for the impact to be measured from the perspectives of different project stakeholders including women, the marginalized and the resource poor.
Transcript of Enabling Rural Innovation in Africa, CIAT-Africa, P O Box...

1
Participatory Monitoring and Evaluation for Stakeholder Engagement, Assessmentof Project Impacts, and for Institutional and Community Learning and Change
Jemimah Njuki , Susan Kaaria Colletah Chitsike and Pascal SangingaEnabling Rural Innovation in Africa, CIAT-Africa, P O Box 6247 Kampala, Uganda
AbstractParticipatory monitoring and evaluation (PM&E) offers new ways for strengtheninglearning and change both at community, project and institutional level. PM&E can andhas been used for various purposes, including project planning and management,organizational strengthening and learning, understanding and negotiating stakeholderinterests, and the assessment of project outcomes and impacts. For example, atcommunity level, PM&E systems can serve as a tool for strengthening the local capacityto track changes, assess the effectiveness, environmental sustainability and livelihoodimpacts of their projects. The process involves scientists and communities negotiatingand agreeing on what changes they expect from projects; what they need to do to achievethese changes; what local and scientific indicators will track these changes; and whichsuccess and failure factors need to be monitored to ensure that the projects are on track.This research project seeks to investigate whether PM&E systems can contribute toimproving project performance, ownership, and success; strengthen local decision-making processes; and enhance accountability of formal R&D organizations tocommunities, thereby improving the delivery of outputs and outcomes. The paperpresents lessons and experiences from establishing and applying PM&E systems at boththe community and project levels within the Kenya Agricultural Research Institute(KARI). It details the process of establishing the PM&E systems, including strategies forstakeholder involvement, identification of community indicators for empowerment,enhanced capacity, and differences in local indicators for men and women.
Preliminary results from this study indicate that scientists are beginning to apply thePM&E process to engage their stakeholders in joint planning, developing commonobjectives and vision, and in collectively assessing progress. Scientists are paying moreattention to issues and concerns of stakeholders and are adjusting project outcomes,outputs, and indicators based on stakeholder priorities. At the community level, PM&Edata is being applied to adjust project activities, reflect and make decisions on variousaspects of community initiatives, and to plan and monitor the implementation ofactivities. Additionally, communities are using these systems to hold R&D institutionsaccountable to their priorities, through effective communication and feedbackmechanisms.
These results demonstrate that integrating local indicators with project level indicatorsprovides a more holistic view of the benefits and impacts strengthens informationfeedback process between communities and R&D systems. This process also providesindicators for measuring the often hard to measure process level outcomes such asempowerment from the perspectives of the communities. Developing indicators andnegotiating them with different stakeholders allows for the impact to be measured fromthe perspectives of different project stakeholders including women, the marginalized andthe resource poor.
2
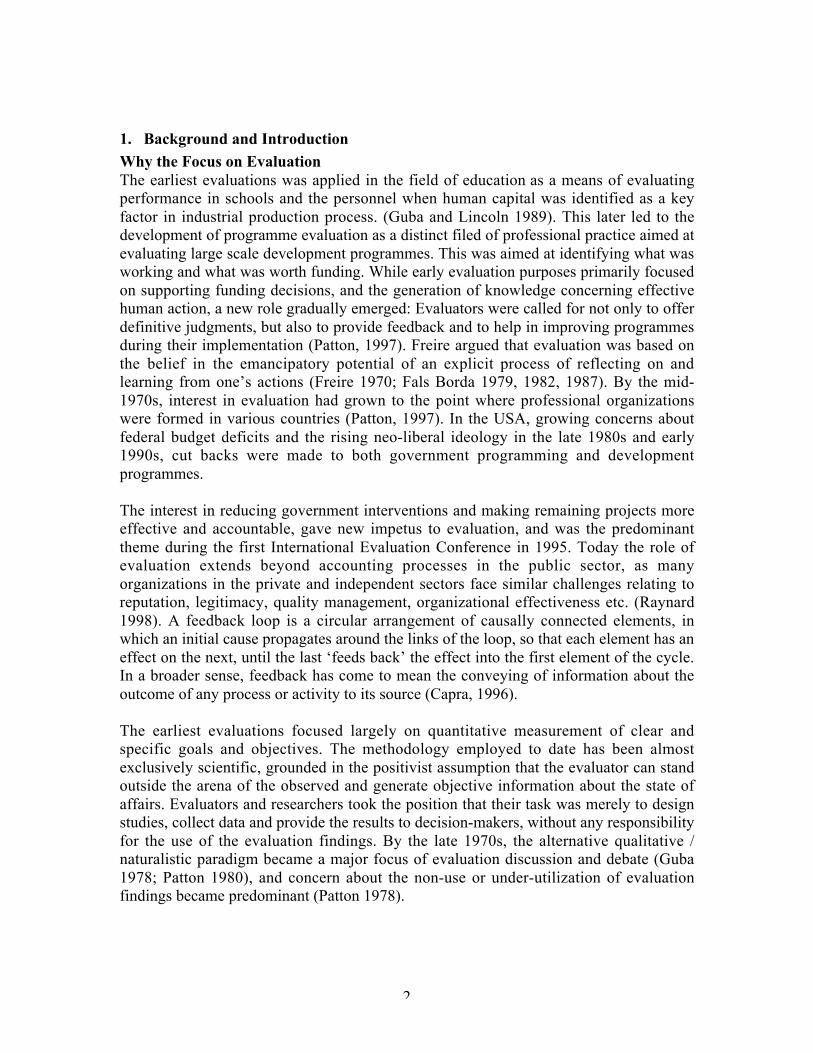
1. Background and IntroductionWhy the Focus on EvaluationThe earliest evaluations was applied in the field of education as a means of evaluatingperformance in schools and the personnel when human capital was identified as a keyfactor in industrial production process. (Guba and Lincoln 1989). This later led to thedevelopment of programme evaluation as a distinct filed of professional practice aimed atevaluating large scale development programmes. This was aimed at identifying what wasworking and what was worth funding. While early evaluation purposes primarily focusedon supporting funding decisions, and the generation of knowledge concerning effectivehuman action, a new role gradually emerged: Evaluators were called for not only to offerdefinitive judgments, but also to provide feedback and to help in improving programmesduring their implementation (Patton, 1997). Freire argued that evaluation was based onthe belief in the emancipatory potential of an explicit process of reflecting on andlearning from one’s actions (Freire 1970; Fals Borda 1979, 1982, 1987). By the mid-1970s, interest in evaluation had grown to the point where professional organizationswere formed in various countries (Patton, 1997). In the USA, growing concerns aboutfederal budget deficits and the rising neo-liberal ideology in the late 1980s and early1990s, cut backs were made to both government programming and developmentprogrammes.
The interest in reducing government interventions and making remaining projects moreeffective and accountable, gave new impetus to evaluation, and was the predominanttheme during the first International Evaluation Conference in 1995. Today the role ofevaluation extends beyond accounting processes in the public sector, as manyorganizations in the private and independent sectors face similar challenges relating toreputation, legitimacy, quality management, organizational effectiveness etc. (Raynard1998). A feedback loop is a circular arrangement of causally connected elements, inwhich an initial cause propagates around the links of the loop, so that each element has aneffect on the next, until the last ‘feeds back’ the effect into the first element of the cycle.In a broader sense, feedback has come to mean the conveying of information about theoutcome of any process or activity to its source (Capra, 1996).
The earliest evaluations focused largely on quantitative measurement of clear andspecific goals and objectives. The methodology employed to date has been almostexclusively scientific, grounded in the positivist assumption that the evaluator can standoutside the arena of the observed and generate objective information about the state ofaffairs. Evaluators and researchers took the position that their task was merely to designstudies, collect data and provide the results to decision-makers, without any responsibilityfor the use of the evaluation findings. By the late 1970s, the alternative qualitative /naturalistic paradigm became a major focus of evaluation discussion and debate (Guba1978; Patton 1980), and concern about the non-use or under-utilization of evaluationfindings became predominant (Patton 1978).

3
Among the multitude of existing approaches there are three innovative perspectives thathave emerged among evaluation professionals are reviewed:
(i.) Fourth Generation Evaluation which was proposed by Guba and Lincolon(1989) as a methodology that moves beyond previously existing conventionalmeasurement-, description-, and judgment-oriented evaluation techniques.The authors argue that evaluation has a social, political and value-orientedcharacter, and findings are not ‘true facts’ but constructions. As aconsequence, fourth generation evaluation is grounded in a constructivistinquiry paradigm, and requires an involvement of various stakeholders indetermining what questions are to be asked and what information is to becollected. The outcome of evaluations is an agenda for negotiation rather thana set of conclusions, recommendations or value judgments.
(ii.) Empowerment Evaluation, which was put forward by David Fetterman, AEApresident in 1993. Fetterman defined empowerment evaluation as the use ofevaluation concepts and techniques to foster self-determination. Through self-assessment and a group’s knowledge of itself, it achieves accountability ontoitself as well as to others (Fetterman 1994; Fetterman et al. 1996). The use ofevaluation to mobilize for social action and empower participants certainlydraws from the action research tradition of Freire and Fals-Borda. As the term‘empowerment’ carries an activist connotation, it frequently provokesnegative reactions among formal researchers and evaluators.
(iii.) Utilization-focused Evaluation takes a more pragmatic stance (Patton 1978,1986, 1997). Utilization-focused evaluation begins with the premise thatevaluations should be judged by their utility and actual use, i.e. the focus is onintended use by intended users. The evaluator facilitates judgment anddecision-making by the intended users rather than acting as a distant,independent judge. It is acknowledged that no evaluation is value-free, andtherefore it has to be clarified whose values will frame the evaluation.Utilization-focused evaluation does not advocate any particular evaluationcontent, model, method, theory, or even use. Rather it is a process for makingdecisions about these issues in collaboration with an identified group ofprimary users. Intended users are more likely to use evaluation findings if theyunderstand and feel ownership of the evaluation process and findings, and ifthey are actively involved. Using evaluation to empower participants is seenas one of its many possible purposes (Patton, 1997).
(iv.) Participatory monitoring and evaluation which incorporates beneficiaryinvolvement in monitoring and evaluation, participatory M&E, is viewed as alogical extension of the other dimensions of participation (e.g. Uphoff 1991;Germann et. al. 1996; UNDP 1997; Abbot and Guijt 1998; Estrella andGaventa 1998; Estrella et al. 2000)
Participatory Monitoring and EvaluationPM&E draws from 20 years of participatory research traditions including participatoryaction research (PAR), participatory learning and action (PLA), Participatory RuralAppraisal (PRA), and farming systems research (FSR) and farming participatory research(FPR). By the 1980s, concepts of participatory monitoring and evaluation had alreadyentered the policy making domain of larger donor agencies and development

4
organizations most notably the Food and Agriculture Organization (FAO), the UnitedStates Agency for International Development (USAID), the Danish InternationalDevelopment Agency (DANIDA), and the UK Department for InternationalDevelopment (DFID), the Swedish International Development Authority (SIDA), theNorwegian Agency for International Development (NORAD) and the World Bank.(Howes 1992). Outside the field of development, PM&E can also trace its beginnings inthe private sector where there has been growing appreciation for individual andorganizational learning (Raynard 1998).
PM&E involves stakeholders including local people in deciding how progress should bemeasured, in defining criteria for success and in determining how results should be actedupon (Guijt & Gaventa, 1998). PME strives to be an internal learning process thatenables people to reflect on past experience, examine present realities, revisit objectivesand define future strategies by recognizing differential stakeholders' priorities andnegotiating their diverse claims and interests (Estrella et al., 2000). In these processes thelocal people are involved in developing indicators to measure change, in collecting andanalyzing the data, and making a decision as to how to adjust the activities. PM&E is nota tool but a diverse constellation of approaches, methodologies and techniques. PM&E isnot just a matter of using participatory techniques within a conventional monitoring andevaluation setting. It is about radically rethinking who initiates and undertakes theprocess, and who learns or benefits from the findings (IDS, 1998).
PM&E systems provide a framework for collaborative learning and for involving projectclients, participants and partners in the M&E process. PM&E produces important benefitsincluding valid, timely and relevant information for management decision-making andproject improvement within R&D institutions. It leads to improved accountability;examines assumptions on what is progress; can lead to contradictions and conflict; butcan also be empowering by putting local people in charge, it helps in developing skills,and showing all stakeholders that their views count.
At the heart of PM&E are four broad principles: (1) 'Participation' - which means openingup the design of the process to include those most directly affected, and agreeing toanalyze data together;(2) the inclusiveness of PM&E requires 'negotiation' to reachagreement about what will be monitored or evaluated, how and when data will becollected and analyzed, what the data actually means, and how findings will be shared,and action taken;(3) which leads to 'learning' that becomes the basis for subsequentimprovement and corrective action; and (4) since the number, role, and skills ofstakeholders, the external environment, and other factors change over time, 'flexibility' isessential.
Participatory Monitoring and Evaluation can be summarized as a continuum ofobservations, information gathering, analysis, documentation, and assessment fortracking changes and critical learning at different stages of the research and developmentprocess, conducted by and for the various stakeholders of the project. The goals are toadapt M&E tools to make them more accessible and relevant to local stakeholders; todevelop an appropriate PM & E system at the community level that can improve the

5
decision-making capacity of local communities; to involve local communities inmonitoring and evaluating progress and impacts of project -- assessment ofachievements/ impacts over a longer period; to enhance the flow of information andprovide feedback to different levels (such as, group, community, project managers,between farmers and R&D systems).
PM&E has also been defined as a process of self-assessment, knowledge generation andcollective action in which stakeholders in a program or intervention collaborativelydefine the evaluation issues, collect and analyze data and take action as a result of whatthey learn through this process. Philosophically, participatory monitoring and evaluationseeks to honour the perspectives, voices, preferences and decisions of the least powerfuland most affected stakeholders and local beneficiaries. Guijt and Gaventa (1998) havedefined PM&E as an approach which involves local people, development agencies, andpolicy makers in deciding together how progress should be measured and results actedupon while McAllister and Vernooy (1999) say that it is the systematic collection ofinformation pertinent to the orientation and results analysis of the project that allows for aself-critical view and facilitates the reformulation of activities during their course. Indefining PM&E the World Bank (2002) indicates that it is a radical new way of assessingand learning.
Estrella and Gaventa (1998) and Guijt and Gaventa, (1998) write that the issues whichaffect the interest in PM&E include the trend in management circles towards performancebased accountability, the growing scarcity of funds, the shift towards decentralization anddevolution of central government responsibilities and authority to lower levels ofgovernment, necessitating new forms of oversight to ensure transparency and to improvesupport to constituency-responsive initiatives and stronger capacities and experiences ofNGOs and CBOs as decision makers and implementers in the development process.
CIAT’s Approaches to developing a PM&E SystemsCommunity-Driven PM&E Systems:The CD-PM&E approach builds on the concepts and ideas developed by the Institute ofDevelopment Studies at the University of Sussex (Estrella et al., 2000; Guijt & Gaventa,1998), the PIM concept developed by Germann et al. (1996), and more recently by Probst(2002). Probst’s work focused on using PM&E as an instrument to support systematicreflection, learning, the generation of knowledge and process-oriented management at thecommunity level. In community driven PM&E, community members themselves identifytheir own objectives and initiate activities to achieve these objectives. They develop theirindicators for measuring progress towards achievement of the objectives; indicators toassess change, are in charge of the data collection and analysis, and finally use the PM&Eresults to adjust their activities. Community indicators are based on local experiences,perceptions and knowledge. The purpose of the community driven PM&E is to empowerthe local community to initiate control and take corrective action and to basicallyempower them to improve their social well-being. This type of PM&E approach is uniquebecause of the emphasis on developing a system that is managed and supported by localcommunities, for their own purposes.

6
Community driven helps capture differences and different viewpoints from differentgroups within a community who may have different perspectives, aims and objectives.These differences may be due to their experiences, their social and cultural situationssuch as their wealth, gender among other things. By promoting participatory approaches,it gives the rural people a voice in their community. It is an important vehicle forincreasing participation and improving accountability. Appropriate forms of PM&E helpthe local people manage their own affairs better, take more control of the projects andtheir aspirations and increase the likelihood that project-supported activities will continueafter the project ends. It enables the community to look systematically at what they wantto achieve by deciding their own goals, what they have done in that they reflect on theirachievements, what they still need to do i.e. what action has to be taken and what changesthey have seen by capturing differences and different viewpoints on their indicators. Theamount of local control over the process can be assessed by considering who makesdecisions (researchers or local people, and which local people or groups), whoimplements the activities, who analyses the information, and who is the researchultimately for- who will use the results of the research and how (McAllister, 1999).
Institutional levelAt institutional level, different stakeholders involved in research and developmentprojects including communities are involved in defining project objectives and activities,in deciding what should be monitored and evaluated. They contribute to the developmentof indicators to measure the achievement of objectives and the successful completion ofactivities. Roles for data collection and analysis are shared between the differentstakeholders. Data and information collected is shared systematically by the stakeholdersleading to learning and adjustment of activities and approaches and to the documentationof best practices. Within this institutional PM&E, communities or local stakeholders canb e i n v o l v e d i n v a r i o u s w a y s i n c l u d i n g d u r i n g t h enning
stage, implementation stage, data analysis, use and sharing of information.
This paper analyses experience with establishing project / institutional level andcommunity-based PM&E in three countries; Uganda, Malawi, and Kenya and gives theresults and changes that have been achieved at institutional and community level as aresult of these systems. The objectives of this work were;

7
• To strengthen PM&E systems within R&D projects to critically analyze andunderstand the institutional learning and change process, to increase self-learning,cross learning, and to evaluate impacts;
• To establish an appropriate PM&E system at the community level that allowslocal people analyze and interpret change, to learn from their own experiences, toadjust strategies accordingly and to systematically evaluate progress and
• To develop strategies for the institutionalization of PM&E in R&D organizations

8
2. Methodology: The PM&E processFigure 1 shows the steps that are involved in establishing PM&E both at community leveland institutional level. The back and forward arrows between the two systems are stepswere the two interface or feed into each other. Although the process is drawn as though itwere linear, it is cyclical and the use of PM&E results lead into the planning process andinto another cycle of monitoring. The reflection process occurs at most of the differentstages of the PM&E process. As teams develop and agree on what to monitor, they arereflecting on past experiences and deciding what is achievable and what is not. Reflectionat the end of the PM&E cycle enables the team to look at the key achievements and toplan a way forward. These steps are briefly described below.
Figure 1: Steps in the PM&E
2.1 Engaging stakeholders and deciding the objective of the PM&EStakeholder or multi-stakeholder analysis is the approach and procedure for gaining anunderstanding of a system by means of identifying the key actors or stakeholders in thesystem and assessing their respective interests in that system (Grimble and Chan, 1995).Stakeholders include all those who affect, and/or are affected by the policies, decisions,and actions of a system. Involving all stakeholders is critical to developing successfulPM&E systems, integrating different perspectives from those within the community,R&D systems and project participants, and creating ownership in the process. Astakeholder analysis (for further details see Rietbergen-McCracken, J.and D. Narayan.1998.) is used to identify stakeholders’ interests, their roles and responsibilities and theparticipation strategy necessary to involve them in the process. A PM&E stakeholder
1. Identifying and engaging stakeholders
2. Building stakeholders’ capacity for PM&E
3. Defining and agreeing on what to monitor and evaluate: Objectives
4. DEVELOPING AND FORMULATING INDICATORS
5. Gathering information
6. Managing & analyzing data
8. Learning and change
7. Reflection,sharing andusing theresults ofPM&E
Pali et al, 2005

9
analysis ensures that key stakeholders are not left out in the PM&E process and is also animportant step in the sharing of roles and responsibilities for PM&E. An example of theresults of a PM&E stakeholder analysis is given below.
2.2 Building capacity for understanding of PM&E concepts and principlesThis process aims to develop a common understanding (and local vocabulary) of theconcepts and principles of participation, monitoring, evaluation and indicators, using avariety of tools and methods (including formal workshops). It employs methods thatencourage participation of all individuals in the group. Capacity development involvesvarious aspects: (i) Developing a common understanding PM&E concepts and goals. (ii)Identifying local vocabulary and local terms that are equivalent to technical terms(Monitoring, evaluation, participation and indicators). (iii) Using of methods and toolsthat encourage participation of all individuals in the group, such as graphics, role-plays,graphics using scenes from the farmers’ daily lives, or planting and cropping seasons andmanagement. (iv) Discussion on why PM&E is important to their lives and their projects.
Figure 2: PM&E Graphic
Figure 2 shows an example of one of the graphics thatwas developed by a community and used tocollectively develop a common understanding of whatmonitoring and evaluation is, and why it is importantto the community. In many instances communities willchose to draw another more appropriate graphic,depicting their farming systems or their specificcultural context.
2.3 Deciding what to monitorStakeholders begin implementation of the PM&E process by developing a commonvision and agreeing on measurable results and processes that need to be monitored andevaluated. A systematic process for developing results can apply an ‘impact chain’(which includes impacts, outcomes, outputs, processes and activities of the project). Inthe impact chain, several activities contribute to an output, several outputs contribute toan outcome, and several outcomes contribute to an impact. The impact chain alsoincludes processes, such as approaches, strategies, and methodologies that are applied toachieve results, and describes what is happening to (and between) stakeholders while theproject is being implemented.
Visualization tools (such as force-field analysis and the river code) are used to enablecommunities to develop shared goals and a common vision on what to monitor. The rivercode is a role-play (acted out by the community members) that enables them to analyzetheir current situation (one side of the river), their desired future situation (the other side
TwoFarmers
CultivatingMaizeGermann et al 1996

10
of the river), what they need to do to move from the current to the desired situation (stepsto cross the river) and the strategies they need to employ (how to cross the river). In forcefield analysis the community uses a diagram to think about and record their opportunities,and the constraining factors, in reaching their goals (for more on these tools see Hope andTimmel, 1996).
2.4 Developing indicatorsIndicators are pieces of information that help you understand where you are, which wayyou are going, and how far you are from where you want to be (Hart 1995; McSweeney1996). They are a means to track progress towards achievement of results over time asand compared to targets, to measure beneficiary or client satisfaction and communicateresults to stake holders, and to measure actual results against planned or expected resultsin terms of quality, quantity and time lines. Selecting the best indicators is not alwayseasy because it is a balancing act between choosing locally-relevant factors, and thosethat can be applied more widely and the more stakeholders that are involved.Additionally, indicators should capture intangible as well as tangible changes particularlyin participatory projects that value factors such as personal and social development.
The concept of indicators for community driven M&E is discussed using graphics andfamiliar stories from the farmers’ lives (such as signposts to the market, for example).Community indicators for measuring change are developed during a brainstormingsession of groups of farmers for each result or objective. Small group sessions ensure thatthere are contributions from the majority of the members of the community, representingits diversity. Different members have different perspectives on the indicators, influencedby their involvement in the project, their gender, wealth status or their expectations of aparticular activity.
2.5 Organizing for PM&EAt project level, the PM&E plan as shown in Table 1 synthesizes the results and theirindicators and include information requirements, baselines and targets for indicators, thefrequencies and responsibilities for data collection, analysis and reporting. Roles andresponsibilities are guided by PM&E interests, type of data, source of data, and ease ofdata collection. Special emphasis is placed on developing targeted baselines that providea starting point from which to measure change, to develop realistic targets, and to assesswhether change has occurred or not.
Table 1: A PM&E Plan / FrameworkResults/processes,activities
Indicators Informationrequirements
Baseline
Targets Datasource
Whocollects?Analyses?Reports?
How often?When?
Tools

11
IntegratedNRMoptionsevaluatedwith maleand femalefarmers
Proportion ofmen and womenparticipating inevaluation
Number ofmen
Number ofwomen
Baseline is 0/0
Men towomenration of70:30 byyear 1
Men towomenration of50:50 byyear 2
Farmers Participating farmerscollect theprimarydata
Fieldofficerfacilitatescompilationand analysisof the data
Participatingfarmers recordduring eachactivity
Every 3 monthsthe fieldfacilitatorcompiles andanalyses
Attendancelists
Facilitator’sfield journal
Datapresented intrend lines orgraphs
At community level, a committee is elected by the group and charged with theresponsibility of data collection, analysis and providing regular feedback to thecommunity. This process involves a) the development of criteria for the selection ofcommittee members; b) facilitating the development of simple tools for data collection,and c) training the committee on how to manage the PM&E processes (for example,when to collect data on the indicators, how to analyze, when to report).
2.6 Data collection and analysisA range of different tools is used to collect, analyze and document data, which includesboth qualitative and quantitative tools such as focus group discussion, participatoryimpact diagrams, resource maps, social maps, and institutional maps. Simple registers,records, questionnaire surveys, and process journals can also be used. Stakeholdersdecide which tools should be used to collect information on which indicators, howsampling will be done, who should collect and analyze information on which indicators,how frequently this will be done and how the information will be shared.
Communities manage the process of M&E using simple tools for collecting andanalyzing data. Some common data collection tools include resource maps to collectbaseline data and registers to record participation in community activities, visitors’ booksto record linkages with others, and input, output and account registers to record enterpriseprofitability. The community performs simple analyses on their data (for exampleattendance levels data to demonstrate trends) with the assistance of the facilitator.
2.7 Reflection and learning from PM&EThis is a process that helps the teams and the community to analyze what is working,what is not working and why. Reflection allows members to reflect on the progress of theproject towards achieving its goals and to adjust activities as required. It provides a forumfor exchanging and evaluating information; and it allows community members tosystematically review their activities. Reflections need to be carried out for each result (oractivity or process) and its indicators, one at a time. This can be done using simplegraphics or questions to examine the results of any data analysis. Some useful fourquestions to use in reflection are
• What have we achieved this season/ this year etc?• What worked well?

12
• What did not work well?• What do we need to change?
Decisions are made within the group about the implications of the analyzed informationfor stakeholders and on decision-making within the project. The results of the reflectionare used to make decisions and to adjust activities if and when need be so that monitoringand evaluation is a learning process. At community level, the committee charged with theresponsibility of data collection analyses the information with the facilitation of thecommunity facilitators and shares it with the rest of the community (those collectinginformation and keeping records).3 Results and Discussion: Using the data from PM&E for Enhanced Decision-
makingStakeholder participation: Inclusion of different stakeholder perspectivesin monitoring and evaluation
Through a direct participation in the monitoring and evaluation process, the PM&Eprocess has allowed the different stakeholders involved in the projects project to betterunderstand each other’s views and values, and to design ways to resolve competing orconflicting views and interests. Scientists especially have benefited from gettingcommunity perspectives and contributions in terms of what their objectives and desiredexpectations are as well as providing more qualitative indicators for measuring progressto supplement the usually very quantitative measures that they use for monitoring.
Through this process, differences in indicators have emerged between the differentstakeholders, between farmers and scientists and amongst farmers themselves especiallybetween men and women (see Table 2), youth and the elderly, between different wealthlevels and cultural backgrounds. For example, in Kitale, Kenya where communities arerelatively well off with larger land sizes and large numbers of livestock, the indicators ofimproved food security are diversity of foods available for consumption and quantityfood that households have in storage. On the other hand, in Mtwapa, Kenya wherehouseholds are relatively poorer, the indicators for improved food security are increase innumber of meals per day from one to three and availability of food throughout the year(no emphasis is made on quality). Although these indicators are related, their expressionsreflect differences in well being of the different communities.
Table 2: Differences in indicators between men and womenResult: Increased incomes from sale of beansIndicators from Men Indicators from Women
• Income generating activities initiated• Increased ceremonies in the village• Good clothing –Men wearing suits• Good housing with iron sheet roof
• More children being sent to secondary school• Good food (breakfast, good quality tea)• Women going to market weekly• Better clothing -- women wearing new khangas,
kodokodo,• Increase in women membership in merry go-rounds (
group savings and credit)
Some indicators are very specific to ethnic groups reflecting differences in culture andbeliefs. For example, increased ceremonies are a common indicator of increased foodavailability among the Kenya coastal communities where ceremonies are part and parcelof their culture while this does not come up as an indicator with other communities.There were however still a lot of similarities in community expectations and indicators

13
across different communities which provides an opportunity for a comparison ofindicators across different sites and communities. Some of the most commonexpectations and indicators are given in Table 3.
Table 3: Examples of common community indicators across communities and countriesResult/Process Indicators
Food security • Availability of food throughout the year• Increase in number of meals eaten per day from 1 to 3• Amount of food stored in granary• Good health: shiny faces; reduced skin diseases; cases of kwashiorkor reduced• Presence of food leftovers in homesteads• Healthy dogs and chicken• Presence of dish racks with clean utensils• Un-harvested fruits (papaw and bananas) ripening in farms
Increased incomes • Children going to secondary school• Good food (breakfast, good quality tea)• Women going to market weekly• Better clothing -- women wearing new khangas (fabric), kodokodo (high heels),• Increase in livestock numbers• Hire of labor
Empowerment • Farmers and group members seeking services independently from other service providers• Ability to apply skills learnt• Ability to make decisions• Women buying things without asking for permission• Women having own bank accounts
Participation • Level of sharing information• Contributing during discussions• Number of participants by gender• High and regular attendance to meetings• Men and women members involved in decision making
Some of the differences in indicators between scientists and communities are thatcommunities tend to focus more on the outcomes versus the specific outputs. Forexample, community indicators for improved soil fertility tend to differ significantly fromscientists’, whilst community indicators are more often related to increased yields ratherthan the nature of the soil itself. Community indicators combine both qualitative andquantitative measures while scientists’ indicators are more quantitative and generic as theexamples given in Table 4 show.
Table 4; Differences in indicators between scientists and farmersOutcome IndicatorsImproved soil fertility Quantitative
Nutrient levels (carbon, phosphorus, macronutrients)Increase in yieldsQualitativePerception of farmers on change in soil quality (-colour, -type & presence of weeds, -texture)
Increased food security QuantitativeAmount of food stored and number of months with food / Having Food throughout the yearIncreased production (acreage and yields)QualitativePerception of men and women farmers of food availability and composition( e.g. Number of mealsper day ,-Quantity of meals, Composition of meals, Maize purchases, Amount of relief, Farmerslooking for casual for casual labour)
Given all these differences in perspectives and expectations, one of the key roles offacilitation in the PM&E process has been to ensure that all these differences are notconflicting and do not lead to parallel monitoring systems by ensuring that they arenegotiated, understood and integrated in the monitoring and evaluation process.

14
Figure 4: A PM&E committee of Galana FFS presentingresults to group
Figure 3: A group register as a data collection tool-GalanaFFS, Kenya
3.2 Community organization and learningThe path from knowledge generation to knowledge utilization is direct in CD-PM&E
because the same actors are involved in allactivities. Once PM&E information iscollected and analyzed the next step isreflection process that enables thecommunity to discuss and communicatetheir PME results; provide a forum forexchanging and evaluating information;allow community members to systematicallyreview and look back to the start of theiractivities, comparing it with where they arecurrently and to understand what haschanged; and to allow all members to reflect
on the progress of the project and to adjust itas required. Different tools have been used inthe data analysis and presentation. Simplegraphs, tables, role plays help to enhance thecommunity understanding of the progressmade their achievements and what needs to beadjusted. Figure 3 shows a group register as adata collection tool while figure 4 shows amonitoring and evaluation committee at afarmer field school in Mtwapa, Kenyapresenting a graph showing the trends inattendance by the group members.
Through the data analysis and reflection process, communities are:• Using the PM&E information to calculate costs and profits from production
activities,• Improving participation in group activities because the information shows who is
and who is not participating in group meetings and activities• Keep group members active: In instances where indicators for results are
measured across farms/households, the PM&E process acts to exert peer pressureto push other group members to meet the same goals. For example, farmersvisiting each other will have the urge to improve what they are doing to comparewith others.
• Reorienting how a project is being implemented: During a reflection meeting inMalawi, Chisewu Village of Kasungu realized that not all community memberswould benefit from the project in one year. After the reflection meetingcommunity members who had benefited decided to contribute an additional seedto the community to ensure that other members of the community would alsobenefit.
• Recognizing/acknowledging achievements by group.• Finally, through failure and success factors identify the process aspects that can
strengthen or weaken the project. Indicators for success and failure factors bring

15
out some negative aspects such as lack of transparency, gossiping, and othernegative group aspects. So the group starts taking account of these aspects as thegroup is managed.
• Taking corrective measures at opportune moments, especially in relation to howthe groups’ funds are managed. For example, during a reflection exercise a farmerfield school in Mtwapa Kenya realized that some officials of the group weremismanaging funds from a group income generating activity. This led to thegroup putting in measures to ensure accountability. The results of a reflectionprocess, by the group and some of the recommendations made are shown inFigure 5.
Figure 5: Community reflection processI n d i c a t o r /Activity
What do we feel?Are we satisfied with progress in this activity/ indicator
What is goingwell
What is not goingwell/ Why?
What should wechange, how andwho will do it
Attendance duringgroup activities
1 8 m e m b e r scons is tent inattendance
R e d u c t i o n i nmembership 30 to22 to 18Drop outs hadother expectationsNo transparency inthe group
1 8 m e m b e r sconsistent-to bemaintainedRevisitconstitution andmake objectivesclearCommit tee topresenting recordsfor discussion
Sale of bananasand suckers
Group has madesome money
Records kept havenot been shown tofarmers
Periodic analysisand review ofrecord by farmersevery end of themonth
L a c k o ftransparency inmoney matters
As aboveUse of receipts forpurchases andsales6 monthly audit ofgroup finances
3.3 Institutional organization and learningPM&E at the project and institutional level has led to increased learning and betterorganization in the way the institution manages the research-development process and inthe monitoring and evaluation. Scientists identified several aspects in the way in whichthey are engaging with communities: (1) An important change noted was that before theinitiation of the PM&E system, scientists would develop a project and then take it to thefarmers for implementation, however, now scientists are discussing and prioritizingissues with communities. The scientists feel they are now more practical and realistic andare better addressing the needs of the farmers they work with. This is also reflected in thelevel of community understanding of what the scientists are doing with them. (2)Through the development of the ‘impact chain’ the projects have become more impact

16
oriented especially within the adaptive research projects. Scientists are beginning to usequestions such as ‘so what?’ as a strategy of orienting projects towards impacts. (3)Thesharing of roles and responsibilities in the process is creating openness and reducing thesuspicion that sometimes exists between scientists and communities. (4) A systematicprocess for generating, managing, collecting and analyzing data has led to a more robustPM&E system at the project level, which has improved project management. Forexample in KARI Mtwapa, a similar activity reporting format has been developed whichis currently being applied across 5 projects. This format ensures that a comparativeanalysis can be conducted across projects and information on progress of activities can becollated and aggregated in a systematic manner.
3.4 Targeting and improving the project implementation processAs a result of the reflection process and the use of PM&E information, project activitiesand outputs are reviewed periodically and adjusted where and when necessary. Ourresults indicate that the PM&E systems have led to changes in the project implementationprocess. These changes vary from aspects such as better targeting of the beneficiaries orstakeholders, to more complex changes such as the addition of activities, adjustment ofmethodologies, as well as revision of the project objectives. For example in a Soya beanproject in Kitale, Kenya, an activity on community multiplication and bulking wasincluded after the team including research, extension and the farmers realized that theactivity was crucial to the achievement of the results (increased incomes from sale ofsoya beans and improved nutrition) during a reflection meeting. They realized that theactivity was crucial to the achievement of results although it had not been planned forduring the project development. As farmers define future objectives they are able tobring in new activities that help them achieve these expected results. They are abledevelop a strategy and a sequence of activities that are required to realize these objective.
3.5 Identifying indicators to Measure EmpowermentWhile it has been very easy and straightforward to develop indicators and measurebenefits from technological options, the development of indicators for benefits ofparticipatory approaches has not been always easy. One of the key results of participatoryprocesses is empowerment. There have been some attempts to measure empowermentespecially in studies that want to demonstrate the impacts of an intervention onempowerment (Kabeer, 1999). Through the results from our work in Malawi andUganda, communities have identified different indicators to measure empowerment fromtheir own perspective: Empowerment entails a process of change from the inability tomake a choice to a situation where persons can make choices. Different types ofempowerment stand out: social and cultural empowerment, economic empowerment andpolitical empowerment. Another distinction is between choices that have to do withallocation of resources (both physical and the rules and norms that govern theallocations), and choices to do with the freedom of action, bargaining, or negotiation andcapacity to define their life choices. These choices may be strategic choices or nonstrategic choices.
Rural agro-enterprises geared towards increasing household and especially women’sincomes have led to women’s economic empowerment. Women have access and

17
sometimes have control over money that they can use at their discretion. The economicempowerment also sometimes creates empowerment in terms of negotiation andbargaining power by the women and a break from cultural traditions that are demeaningto women. For example, a woman in Malawi said:
“Before when I did not make any money of my own, I had to kneel down several metresaway from my husband and beg for money. Now he recognizes that I have some money ofmy own and we can now negotiate on equal terms. I use the money to buy things that Ineed for myself and the family. I can buy some lotion for my body, clothes for me and myfamily. I do not have to ask him for money every time I need a small item like amatchbox”
The choice to make decisions is not only reflected between men and women but alsobetween traditional and political authority and the people. As one young man in Malawiput it:
“The village headman makes all the decisions to do with the village, even sometimes todo with our households. I would like to see everyone participating in making decisions onissues to do with our village and people making decisions on their household issues”
The indicators vary across sites and countries and depend largely on several factors• levels of poverty
Disempowerment is very linked to poverty. When people are poor, the choices they haveare limited and their indicators of empowerment are linked to these limited choices. InWestern Kenya, where poverty levels are relatively high women gave indicators ofeconomic empowerment as having money to take care of basic necessities withouthaving to ask from their husbands such as toiletries, match boxes et. In Kitale, Kenyawhich is relatively better off, on of the indicators was that women would have their ownbank accounts in their names.
• cultural traditions, religion and status of women in the societyEmpowerment is linked to cultural values, religion and beliefs which in turn define thestatus of women in that particular society. In Malawi where cultural beliefs dictates thatwomen do not speak out in front of men and have to kneel down when they talk to themen, indicators of socio-political empowerment included the ability of women to speakand negotiate their ideas with men without having to kneel down, women speaking outduring meetings and sharing their ideas and women being involved in the decisionmaking processes in the community.
Table 6 gives some indications of indicators from men and women for different types ofempowerment.
Table 6: Types of empowerment and their indicators from communitiesType of empowerment Common indicators across communitiesEconomic empowerment Women have small business of their own from which they can use money to fulfil
their own needs (basic necessities such as matchbox without having to borrow) Acquire personal bank accounts for their money in their names Women can organise and establish revolving funds

18
Impact of K132 by a mixed group of farmers, Nabongo Parish,
Uganda (redrawn from original diagram)
Figure 6. A Participatory Impact diagram (David,2000)
Socio-Political empowerment Internal (household and community) Equal representation in committees – having women who are active and effective
in major committees in the community Women have the capacity to buy clothes or use their money without requesting for
permission from their husbands Women being able to contribute and say their ideas in community meetings Women and the youth are involved in decision making processes at the household
and in the community. Decisions are not only made by the elderly men and thevillage authority
Links with others Capacity to approach the extension worker Capacity to negotiate for higher prices Self reliance in looking for services that the community members require e.g
finding seed, market, and services from other organization Women and youth are to be found in key decision making bodies in the
communities and outsideAccess to physical resources and therules and norms that govern them
Women to have their own plots which they can deicide how to use. Ability to use their own money
Freedom of action, bargaining, ornegotiation and capacity to definelife choices
Girls will be going to school and not for early marriages Women to be self reliant Women can go out to distance markets buy goods and come to sell in the
community without any restrictions (freedom of movement)
3.6 Linking PM&E to impact assessmentImpact assessment is the systematic analysis of the lasting or significant changes-positiveor negative, intended or not-in people’s lives brought about by a given action or series ofactions. It is an evaluation of how, and to what extent, change had occurred. Monitoringand Evaluation are essential parts of impact assessment, especially if the focus is onlearning and change. The three processes overlap and are, in fact, interrelated activitiesas part of a continuous learning process. As you monitor you also evaluate by makingjudgment, reflecting and correcting. It is difficult to carry out impact assessmentactivities successfully if the more basic task of monitoring and evaluation and theirimmediate effects are not done properly. Our rationale and the results for linking PM&Eto impact assessment are;
• To establish causal linkagesbetween project interventionsand their outcomes
This is been achieved throughcontinuous follow up of the activities,the effect these activities and thechanges that occur as a result.Participatory impact diagrams have alsobeen used to establish causal linkagesbetween activities and their outcomes.An example of an impact diagram is
shown in Fig. 6.
• Incorporate participatory tools and user perspectives in impact assessmentThe desired results are developed using participatory tools such as the river code duringthe PM&E process. Indicators for these results are developed with all stakeholders and
19
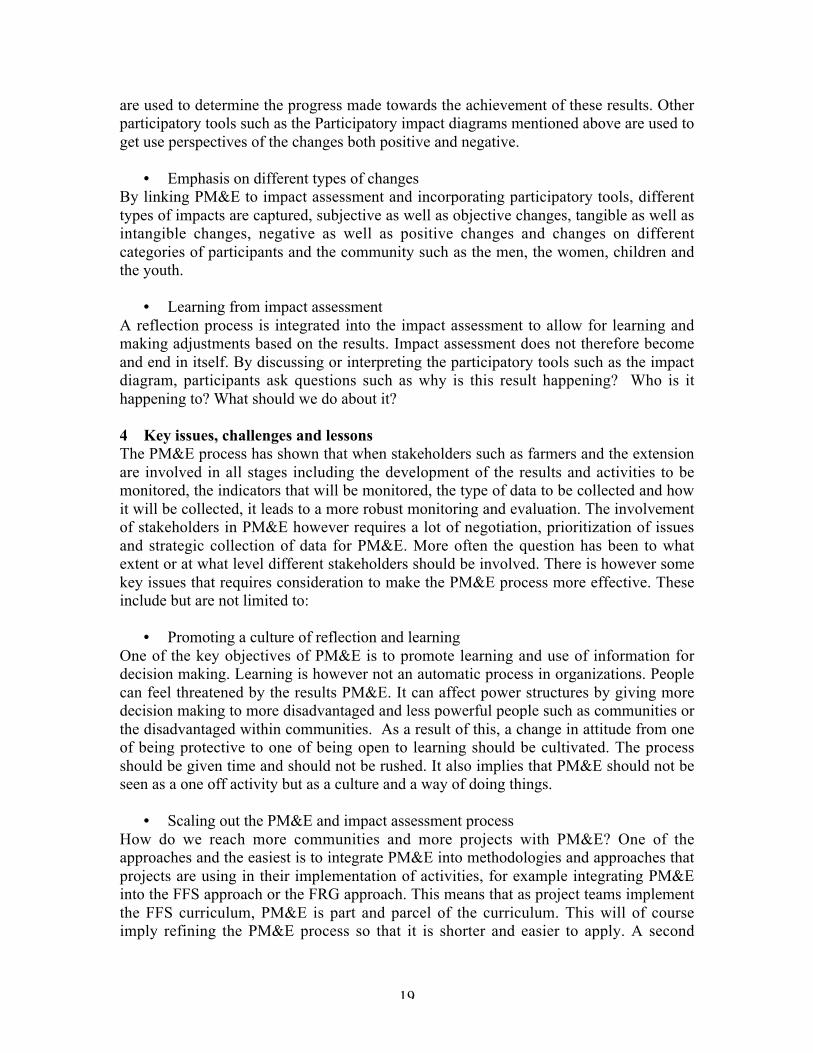
are used to determine the progress made towards the achievement of these results. Otherparticipatory tools such as the Participatory impact diagrams mentioned above are used toget use perspectives of the changes both positive and negative.
• Emphasis on different types of changesBy linking PM&E to impact assessment and incorporating participatory tools, differenttypes of impacts are captured, subjective as well as objective changes, tangible as well asintangible changes, negative as well as positive changes and changes on differentcategories of participants and the community such as the men, the women, children andthe youth.
• Learning from impact assessmentA reflection process is integrated into the impact assessment to allow for learning andmaking adjustments based on the results. Impact assessment does not therefore becomeand end in itself. By discussing or interpreting the participatory tools such as the impactdiagram, participants ask questions such as why is this result happening? Who is ithappening to? What should we do about it?
4 Key issues, challenges and lessonsThe PM&E process has shown that when stakeholders such as farmers and the extensionare involved in all stages including the development of the results and activities to bemonitored, the indicators that will be monitored, the type of data to be collected and howit will be collected, it leads to a more robust monitoring and evaluation. The involvementof stakeholders in PM&E however requires a lot of negotiation, prioritization of issuesand strategic collection of data for PM&E. More often the question has been to whatextent or at what level different stakeholders should be involved. There is however somekey issues that requires consideration to make the PM&E process more effective. Theseinclude but are not limited to:
• Promoting a culture of reflection and learningOne of the key objectives of PM&E is to promote learning and use of information fordecision making. Learning is however not an automatic process in organizations. Peoplecan feel threatened by the results PM&E. It can affect power structures by giving moredecision making to more disadvantaged and less powerful people such as communities orthe disadvantaged within communities. As a result of this, a change in attitude from oneof being protective to one of being open to learning should be cultivated. The processshould be given time and should not be rushed. It also implies that PM&E should not beseen as a one off activity but as a culture and a way of doing things.
• Scaling out the PM&E and impact assessment processHow do we reach more communities and more projects with PM&E? One of theapproaches and the easiest is to integrate PM&E into methodologies and approaches thatprojects are using in their implementation of activities, for example integrating PM&Einto the FFS approach or the FRG approach. This means that as project teams implementthe FFS curriculum, PM&E is part and parcel of the curriculum. This will of courseimply refining the PM&E process so that it is shorter and easier to apply. A second

20
approach is to apply the indicators from one community into communities with similarcharacteristic (cultural, socio-economic, ethnic, etc) or use results and indicators fromother schools with similar technologies and geographical area to introduce new schools toPM&E. This however has its shortcomings as the communities may not have as muchownership to the results “imported” from other schools or communities compared to ifthey developed their results themselves.
• Integrating gender and equity into PM&EWith participatory research, gender and equity concerns are central to the implementationprocess. More often than not, gender and equity has not been reflected in the PM&Eperformance frameworks. Gender and equity issues including participation,empowerment, changes in gender relations need to be negotiated by both the projectteams and the communities so that they become part of the PM&E process.
• Negotiation and sharing roles for PM&EData collection needs to be a shared responsibility between researchers, extensionofficers and farmers. Teams however need to be careful so that none of these becomeoverwhelmed with the data collection. For example farmers should not collect data that isnot of interest to them but only to scientists. Information should also be shared across allstakeholders; for example scientists should share their information with farmers and viceversa. A common assumption with regards to data collection by farmers has been thatonce farmers know the indicators they should collect data on, they will get on with it.More often than not, the capacity of farmers to collect and analyze data has to be built.This should however not be taken to the extent that researchers give farmers longcomplicated forms or data sheets in which to record data as this may deter them fromcollecting the data.
• Standardization and comparabilityIndicators and questions from PM&E will differ between projects if they are defined in aparticipatory way, which may make it difficult to compare outputs and outcomes ofdifferent participatory approaches between projects
There are many challenges in setting up and implementing PM&E systems. Ensuring thatPM&E does not just become a technical process-develop results, indicators, collect dataand analyze. The learning aspect of PM&E needs very strong emphasis so that there is abalance between focus on the implementation and on the learning and the use of PM&Edata to take corrective measures and make decisions. Establishing and supporting PM&Esystems is an expensive process, both in terms of time, human capital and materialresources for initiating and sustaining M&E, and also because of the intensive facilitationrequired in the initial stages. In most cases, organizations will not have the skills that arerequired to support the process and these skills may need to be built before the processcan take off. Due to the involvement of different stakeholders, strategies need to bedeveloped to involve these different stakeholders. For example for CD-PM&E the use ofgraphics, identification of local vocabulary for some of the technical terms should bedone.

21
5. Conclusions and recommendationsThis paper analyzes experience with establishing and supporting PM&E processes both atcommunity and project level in three countries in Uganda, Malawi, and Kenya. Our ininitial results indicate that there are several important aspects in establishing andsupporting these systems: (1) Developing a capacity building strategy for PM&E. Thisincludes applying diverse tools and methods that can encourage active participation of allmembers, such as graphics, role plays, stories from the farmers’ daily lives, andidentifying local vocabulary for the technical terms. (2) Ensuring that indicators arenegotiated information is only collected on those indicators that are relevant, from theperspective of the different stakeholders. (3) The initial stages of establishing PM&Esystems at require a strong mentoring and follow-up component from facilitators toensure appropriate establishment and skills enhancement. (4) The Community-drivenPM&E system provides relevant information that communities can use to improve thefunctioning of their projects, communication within the group, and for informed decision-making. (5) Integrating community indicators with project level indicators providing amore holistic view of the project benefits and can strengthen information feedbackprocess between communities and R&D systems. (6) The PM&E system must include acommunication system that allows information to be exchanged between the stakeholdersand to be interpreted so that it can form a basis for taking appropriate decisions (7)Linking PM&E to impact assessment improves the process and allows for more reflectionand learning making the results of the impact assessment useful for future improvements(8) Involving different stakeholders especially communities in PM&E improves themeasurement of the benefits of participatory processes such as empowerment, capacityand organizational skills.
References
Abbot, J and Gujit, I (1998) Changing views on change: Participatory approaches tomonitoring the environment: SARL Discussion Paper No.2.
CAPRA, F. (1996): The Web of Life. A new synthesis of mind and matter. HarperCollins Publishers (Flamingo), London. 320p.
CIAT 2004 Conference “Strengthening PM&E systems in Research and DevelopmentInstitutions: Report of a Training Workshop held at the Izak Walton Inn Embufrom 29th March to 3rd April 2003.
Estrella, M. (ED.), Blauert, J., Campilan, D., Gaventa, J., Gonsalves, J., Guijt, I.,Johnson, D., Ricafort, R. (2000): Learning from change: issues and experiences inparticipatory monitoring and evaluation. Intermediate Technologies Publications,London, UK. 274 p.
Fals Borda, O. (1979): Investigating reality in order to transform it: The Colombianexperience. In: Dialectical Anthropology, Vol. 4, No. 1, pp. 33-56.
Fals Borda, O. (1982): Participatory research and rural social change. In: Journal ofRuralCooperation, Vol. 10, No. 1, pp. 25-40.
Fals Borda, O. (1987): The application of participatory action research in Latin America.In: International Sociology, Vol. 2, No. 4, pp. 329-347.
Fetterman, D.M. (1994): Empowerment evaluation. American Evaluation AssociationPresidential Address. In: Evaluation Practice, Vol 15, No. 1, pp. 1-15.

22
Fetterman, D.M., Kaftarian, A.J., Wansersman, A. (eds.) (1996): EmpowermentEvaluation: Knowledge and Tools for Self-Assessment and Accountability. SagePublications, Newbury Park, CA. 204
Freire, P. (1970): Pedagogy of the oppressed. Seabury Press, New York.Germann, D.; Gohl, E.( 1996). Participatory impact monitoring (PIM). GTZ; German
Appropriate Technology Exchange (GATE)/Information and Advisory Service onAppropriate Technology (ISAT):
Grimble, R and Chan, M.K (1995) Stakeholder Analysis for Natural Resource.Guba, E.G. (1978): Toward a methodology of naturalistic inquiry in educational
evaluation. Monograph Series 8, UCLA Center for the Study of Evaluation.Guba, E.G., Lincolon, Y.S. (1989): Fourth Generation Evaluation. Sage Publications,
Newbury Park – London – New Delhi. 294p.Guba, E.G., Lincolon, Y.S. (1994): Competing paradigms in qualitative research. In:
Denzin, N.K., Lincoln, Y.S. (eds.): Handbook of Qualitative Research. SagePublications, Thousand Oaks – London – New Delhi. Chapter 6, pp. 105-117.
Guijt, I. and J. Gaventa. (1998). Participatory Monitoring and Evaluation: Learning fromChange. IDS Policy Briefing 12. Brighton: Institute of Development Studies.
Hope A and Timmel, S (1996) Training for transformation: A handbook for communityworkers. ITDG Publications, London UK.
Howes, M (1992): linking paradigms and practise: key issues in the appraisal, monitoringand evaluation of British NGO Projects. In: Journal of International Development,Vol. 4, No. 4, pp. 375-396.
Institute of Development Studies (IDS). 1998. Participatory Monitoring and Evaluation:Learning From Change. Policy Briefing Issue 12 November 1998
McAllister, K (1999) Understanding Participation: Monitoring and Evaluating process,outputs and outcomes. CBNRM, Programs, IDRC
Pali,P. N, G. Nalukgwago,G, Kaaria, S, Sanginga, P and , Kankwatsa, P (2005Empowering Communities through Community-Based Participatory Monitoringand Evaluation in Tororo district. Draft paper. CIAT-Africa.
Patton, M.Q. (1978): Utilisation-focused evaluation. Sage Publications, Beverly Hills,CA.
Patton, M.Q. (1980): Qualitative evaluation methods. Sage Publications, Beverly Hills,CA.
Patton, M.Q. (1997): Utilization-focused Evaluation. The New Century Text. 3rd Edition.Sage Publications, Thousand Oaks – London – New Delhi. 431p.
Probst, K. 2002. Participatory Monitoring and Evaluation: A Promising Concept inParticipatory Research? Lessons from two case studies in Honduras. Ph.D.Dissertation, University of Hohenheim, Stuttgart, Germany
Raynard, P. (1998): Coming together. A review of contemporary approaches tosocial,accounting, auditing and reporting in non-profit organizations. In: Journalof Business Ethics Vol. 17No.13, pp. 1471-79.
Rietbergen-McCracken, J., and D. Narayan. 1998. Participation and Social Assessment:Tools and Techniques. The International Bank for Reconstruction andDevelopment / THE WORLD BANK, 1818 H Street, N.W. Washington, D.C.20433, U.S.A
23
UNDP (1997): Who are the question-makers? A participatory evaluation handbook.OESP Handbook Series. Office of Evaluation and Strategic Planning, UnitedNations Development Programme. New York.http://www.undp.org/eo/documents/who.htm (18.10.2001)
Uphoff N. 1991. A field methodology for participatory self-evaluation.CommunityDevelopment Journal 26 (4): 271–285.
Vernooy R. 1999. Mapping, analysis and monitoring the natural resource base in micro-watersheds: experience from Nicaragua. Joint CGIAR-PRGA / NRI Workshop onParticipatory Research for Natural Resources Management: Continuing to LearnTogether, 1–3 September 1999, Natural Resources Institute, Greenwich, UK.
World Bank (2002b) Participatory Monitoring and Evaluation: Protecting. TheVulnerable:- The Design and Implementation of Effective Safety Nets December2-13 Washington,D.C.http://www.worldbank.org/wbi/socialsafetynets/courses/dc2000/proceedings/pdfppt/participatory.pdf

24