Enabling In-Theater Processes for Indigenous, … DEC 2015 US Army Research Laboratory Enabling...
50
ARL-TR-7560 ● DEC 2015 US Army Research Laboratory Enabling In-Theater Processes for Indigenous, Recycled, and Reclaimed Material Manufacturing by Marc Pepi, Rik Riman, Terence Whalen, Ray Brennan, and Matt Bratcher Approved for public release; distribution is unlimited.
Transcript of Enabling In-Theater Processes for Indigenous, … DEC 2015 US Army Research Laboratory Enabling...

ARL-TR-7560 ● DEC 2015
US Army Research Laboratory
Enabling In-Theater Processes for Indigenous, Recycled, and Reclaimed Material Manufacturing by Marc Pepi, Rik Riman, Terence Whalen, Ray Brennan, and Matt Bratcher Approved for public release; distribution is unlimited.

NOTICES
Disclaimers The findings in this report are not to be construed as an official Department of the Army position unless so designated by other authorized documents. Citation of manufacturer’s or trade names does not constitute an official endorsement or approval of the use thereof. Destroy this report when it is no longer needed. Do not return it to the originator.

ARL-TR-7560 ● DEC 2015
US Army Research Laboratory
Enabling In-Theater Processes for Indigenous, Recycled, and Reclaimed Material Manufacturing
by Marc Pepi, Ray Brennan, and Matt Bratcher Weapons and Materials Research Directorate, ARL Rick Riman and Terence Whalen Rutgers University, New Brunswick, NJ Approved for public release; distribution is unlimited.
FOR OFFICIAL USE ONLY (delete if not FOUO)

ii
REPORT DOCUMENTATION PAGE Form Approved OMB No. 0704-0188
Public reporting burden for this collection of information is estimated to average 1 hour per response, including the time for reviewing instructions, searching existing data sources, gathering and maintaining the data needed, and completing and reviewing the collection information. Send comments regarding this burden estimate or any other aspect of this collection of information, including suggestions for reducing the burden, to Department of Defense, Washington Headquarters Services, Directorate for Information Operations and Reports (0704-0188), 1215 Jefferson Davis Highway, Suite 1204, Arlington, VA 22202-4302. Respondents should be aware that notwithstanding any other provision of law, no person shall be subject to any penalty for failing to comply with a collection of information if it does not display a currently valid OMB control number. PLEASE DO NOT RETURN YOUR FORM TO THE ABOVE ADDRESS.
1. REPORT DATE (DD-MM-YYYY)
December 2015 2. REPORT TYPE
Final 3. DATES COVERED (From - To)
October 2011–August 2015 4. TITLE AND SUBTITLE
Enabling In-Theater Processes for Indigenous, Recycled, and Reclaimed Material Manufacturing
5a. CONTRACT NUMBER
5b. GRANT NUMBER
5c. PROGRAM ELEMENT NUMBER
6. AUTHOR(S)
Marc Pepi, Rik Riman, Terence Whalen, Ray Brennan and Matt Bratcher 5d. PROJECT NUMBER
5e. TASK NUMBER
5f. WORK UNIT NUMBER
7. PERFORMING ORGANIZATION NAME(S) AND ADDRESS(ES)
US Army Research Laboratory ATTN: RDRL-WMM-D Aberdeen Proving Ground, MD 21005-5069
8. PERFORMING ORGANIZATION REPORT NUMBER
ARL-TR-7560
9. SPONSORING/MONITORING AGENCY NAME(S) AND ADDRESS(ES)
10. SPONSOR/MONITOR'S ACRONYM(S)
11. SPONSOR/MONITOR'S REPORT NUMBER(S)
12. DISTRIBUTION/AVAILABILITY STATEMENT
Approved for public release; distribution is unlimited.
13. SUPPLEMENTARY NOTES
14. ABSTRACT
The US Army Research Laboratory has researched the feasibility of performing manufacturing processes on a forward-operating base (FOB) using battlefield scrap, and recycled and indigenous materials as feedstock. Attention was focused on a process known as low-temperature solidification (LTS) ceramic, and flexure and compression testing was accomplished on this material alone, as well as infused aluminum foam. The LTS-infused aluminum foam showed an interesting combination of both strength and strain resistance. In addition, actual char from a tactical garbage to energy refinery deployed to Iraq was added to LTS and tested in compression. It is contemplated that LTS could be infused into additively manufactured structures on a future FOB for Warfighter protection against blast threats.
15. SUBJECT TERMS
indigenous manufacturing, concrete alternatives, nondestructive evaluation, metallic foam testing, recycled materials
16. SECURITY CLASSIFICATION OF: 17. LIMITATION OF ABSTRACT
UU
18. NUMBER OF PAGES
50
19a. NAME OF RESPONSIBLE PERSON
Marc Pepi a. REPORT
Unclassified b. ABSTRACT
Unclassified c. THIS PAGE
Unclassified 19b. TELEPHONE NUMBER (Include area code)
410-306-0848 Standard Form 298 (Rev. 8/98) Prescribed by ANSI Std. Z39.18

Approved for public release; distribution is unlimited. iii
Contents
List of Figures v
List of Tables vii
Acknowledgments viii
1. Introduction and Background 1
2. Challenges 2
3. Army Impact 2
4. Research Strategy 3
5. Program Goal 3
6. Manufacturing with Indigenous Materials In-Theater 3
6.1 Use of Indigenous Materials on the Battlefield 3
6.2 Cement and Concrete in the War Zone 3
6.3 Manufacturing of Building Materials from Indigenous Raw Materials 4
6.4 LTS Ceramic 6
6.5 LTS Ceramic: Aggregate Block 7
6.6 LTS of Blocks on a FOB: CO2 Supply 11
6.7 Metallic Foam Infiltration with LTS Ceramic 12
6.8 LTS Ceramic Made with Gasified Char 21
6.9 Micro Auto Gasification System (MAGS) 21
6.10 Tactical Garbage to Energy Refinery (TGER) 24
7. Conclusion 35
8. Future Work 35

Approved for public release; distribution is unlimited. iv
9. References 36
List of Symbols, Abbreviations, and Acronyms 39
Distribution List 40
Approved for public release; distribution is unlimited. v
List of Figures
Fig. 1 Reactive hydrothermal liquid phase densification paradigm .................6
Fig. 2 Aggregate-filled LTS brick (approximate preslice dimensions: 12 × 6 × 6 inches) ...........................................................................................7
Fig. 3 Results of dielectric measurements taken through 3 regions of a section of the aggregate-filled LTS brick ..............................................8
Fig. 4 Image analysis and aggregate content (table above) of the aggregate-filled LTS brick ......................................................................................8
Fig. 5 Results of ultrasonic measurements taken through 3 regions of the aggregate-filled LTS brick .....................................................................9
Fig. 6 Scanning electron microscope (SEM) of the aggregate-filled LTS brick (magnification 30×) ....................................................................10
Fig. 7 SEM of the aggregate-filled LTS brick (magnification 250×) ............10
Fig. 8 A comparison of the green density of CaSiO3 in pure samples and those containing varying pore size aluminum for the compression specimens (left) and flexure specimens (right) ....................................12
Fig. 9 A comparison of mass gain due to carbonation of CaSiO3 in pure and aluminum foam samples for the compression specimens (left) and flexure specimens (right) .....................................................................13
Fig. 10 An infiltrated compression block next to a metal foam block .............13
Fig. 11 Three different grades of aluminum metal foam that were infiltrated (and an infiltrated bar) .........................................................................14
Fig. 12 Results of compression testing CaSiO3 cubes .....................................15
Fig. 13 Compression testing metal foam cube (left) and CaSiO3 cube (right) ...................................................................................................15
Fig. 14 Compression of 5-, 10-, and 20-PPI aluminum foam cubes. Typical foam behavior was observed, with 1) an elastic region, 2) a plastic region, and 3) a densifying region .......................................................15
Fig. 15 Compression curves of 5-, 10-, and 20-PPI CaSiO3-infiltrated aluminum foam cubes. Ultimate strengths achieved were higher than the individual phases. All of the 10-PPI samples exceeded the capacity of the testing load cell. .........................................................................16
Fig. 16 Results of 3-point flexure of CaSiO3 tiles (left) and varying PPI aluminum foam tiles (right). The ceramic tile failed immediately after low deflection.......................................................................................17
Fig. 17 A 3-point flexure testing of a metal foam sample (left) and CaSiO3 sample (right) .......................................................................................18
Fig. 18 Results of 3-point bending of CaSiO3-infiltrated foam tiles ................18

Approved for public release; distribution is unlimited. vi
Fig. 19 Graphical depiction of the average results of compression testing each material ................................................................................................19
Fig. 20 Materialography of a sample with the metal foam. There appears to be some shrinkage between the foam and the CaSiO3 as a result of drying. ..................................................................................................20
Fig. 21 Materialography of a CaSiO3 sample (not containing metal foam) showing mineral silicate particles in a carbonate matrix .....................20
Fig. 22 Optical photograph of representative MAGS char ..............................22
Fig. 23 Scanning electron micrograph of representative MAGS char .............22
Fig. 24 TGER gray char (left) and black char (right) .......................................25
Fig. 25 Representative scanning electron micrograph of TGER gray char .....25
Fig. 26 Sieve analysis of MAGS char ..............................................................26
Fig. 27 Sieve analysis of TGER gray char .......................................................26
Fig. 28 Sieve analysis of TGER black char .....................................................27
Fig. 29 Process flow and equipment used in adding char to LTS ....................30
Fig. 30 Samples pressed (top) and cast (bottom left and right) by the addition of TGER gray char to LTS...................................................................31
Fig. 31 Average compressive strengths of samples made from TGER and MAGS char ..........................................................................................33
Fig. 32 Plot of individual compressive strength measurements as a function of material density ....................................................................................33
Fig. 33 SEM of an LTS and TGER char sample ..............................................34
Fig. 34 Another SEM of an LTS and TGER char sample................................34

Approved for public release; distribution is unlimited. vii
List of Tables
Table 1 Blocks per day possible .......................................................................11
Table 2 Averaged elastic modulus of CaSiO3-infiltrated compression cubes ....................................................................................................16
Table 3 Flexural modulus from 3-point bending specimens.............................19
Table 4 Cursory analysis of as-received MAGS char .......................................23
Table 5 Elemental composition (via ICP-AES analysis) of as-received MAGS char ..........................................................................................24
Table 6 Cursory analysis of as-received black TGER char ..............................27
Table 7 Elemental composition (via ICP-AES analysis) of as-received black TGER char ...........................................................................................28
Table 8 Cursory analysis of as-received gray TGER char ................................28
Table 9 Elemental composition (via ICP-AES analysis) of as-received gray TGER char ...........................................................................................29
Table 10 Compression results of LTS plus TGER gray char (with steam) ........31
Table 11 Compression results of LTS plus TGER black char (without steam) ..32
Table 12 Compression results of LTS plus MAGS char ....................................32

Approved for public release; distribution is unlimited. viii
Acknowledgments
The authors wish to thank the following individuals for their contributions: Dennis Miller (materialography and optical microscopy), Dr Jay Valdes (Tactical Garbage to Energy Refinery information and char samples), Donn Murakami (Micro Auto Gasification System information and char samples), CPT Terence Wilkin (correspondence regarding forward operating base information), Frank Kellogg (scanning electron microscopy), and Lehigh Testing Laboratories for chemical composition of the char.

Approved for public release; distribution is unlimited. 1
1. Introduction and Background
The concept of utilizing indigenous materials in-theater at a forward-operating base (FOB) has gained traction within the Army. Indigenous materials include not only the organic and inorganic materials naturally occurring in the area of the FOB but could also include recycled materials from the FOB (metals, polymers, etc.) and battlefield scrap. This idea would revolutionize the way we wage war, in that it could potentially reduce the huge logistics tail needed to conduct wars on foreign soil, saving valuable resources and lives. This research aligns with one of the Army’s “Next Five” S&T (science and technology) Challenges: sustainability/logistics: transport, distribute and dispose”.1,2 The Army needs improved capability to tactically transport and reliably deliver consumables to FOBs and smaller satellite bases in remote, austere, dispersed locations with reduced supplier and equipment risk, including improved efficient safe methods for disposing waste.3 It would be favorable for our Warfighters to have access to technology that uses locally available indigenous earth materials. Several advantages of this would include the following: reduction of energy costs related to transportation, reduction of material costs due to reduced transportation costs, especially for well-established industries and, support of local businesses and resource bases.4
Shrinking the logistics tail is an important benefit of utilizing indigenous materials in-theater.5 The 2012 Army Sustainability Report, released 31 October 2012, outlines the Army’s desire to reduce the number of convoys required to resupply troops on the battlefield.6 Reducing vulnerable convoys not only saves materiel and lives, but troops assigned to guard these convoys can actually be utilized for their intended purpose—engaging the enemy. The charter to reduce the tail in the combat zone is deemed critical to the success of the overall Army transformation, with relevance to Army future missions.7 The Army research and development and the sustainment community should consider the reduction in the logistics footprint a principal goal. As stated in Ransom’s paper,8 “Technology will be one of the primary enablers to reduce the logistics footprint, and the reduction of the logistics footprint is clearly a key element of the future battlefield.” Also, the armed forces are increasingly playing humanitarian roles in the context of assisting citizens who have lost their assets in a natural disaster and/or live in parts the world where there is no infrastructure for creating buildings, roads, bridges, or for manufacturing materials that can clean water, create energy, or repair machines. The ability to build and make materials with indigenous materials dually serves the armed forces and society’s needs.

Approved for public release; distribution is unlimited. 2
2. Challenges
There are many challenges to utilizing indigenous materials in-theater. First, the materials must be readily available and in relatively large amounts to be useful. Next, manufacturing processes must be available at the FOB and easy and robust enough to provide a meaningful and reliable method of production, while retaining a small physical and environmental footprint. Scalability of these manufacturing processes must also be taken into account. In addition, power and energy requirements will dictate whether these manufacturing processes will be available on the FOB. A further concern is the effect that extreme environments (i.e., thermal and atmospheric conditions) has on the raw materials and the subsequent processing steps.
3. Army Impact
The transportation of Army materiel to and from theater is costly not only in terms of the logistic burden but the time delays associated with replacing, repairing, and upgrading mission critical equipment, systems, and vehicle platforms. The average Soldier alone generates up to 7.5 lb of waste per day and often has very limited means to remove the waste, so there is a need to address this from an environmental and health perspective. Water bottles in particular are a major problem, representing 200–300 lb/Soldier/yr. Multiple waste streams composed of organic and inorganic materials are produced (including meals-ready-to-eat [MRE] trash, cardboard boxes, cellophane and Styrofoam packing boxes, used oil and air filters, used motor oil, ammunition dunnage and empty brass cartridge casings, medical waste, used batteries, used steel-belted off-road tires, etc.),9 and together with indigenous materials this offers an opportunity for novel processing technologies to reuse these materials effectively in theater. Such an effort should be focused to offer a safe and environmentally responsible way to reduce disposal requirements by turning specific waste streams into value-added products. This could include versatile fiber-generation systems that will enable Soldiers to generate membranes to provide safe drinking water, bandages for the injured, and maybe even insulation for living spaces; it could also include fabrication of blast-protecting “crumple zones” from in-situ metal foam manufacturing, or spare part generation via advanced molding and casting capabilities.

Approved for public release; distribution is unlimited. 3
4. Research Strategy
The ultimate goal of developing technologies to enable mobile, in-theater manufacturing capabilities for sustainment requires demonstrable progress in select areas of known interest. Thus, plastics and metals, together with indigenous materials and available energy sources, provide a practical near-term application for identifying, integrating, and demonstrating early process methodologies. Research at the US Army Research Laboratory (ARL) in this area includes alternatives to Portland cement that can be used at a FOB and the re-use of plastic waste bottles by creating nanofibers utilizing electrospinning and rotary jet spinning techniques. This report will only discuss efforts in scaling up low-temperature solidification (LTS) processes as a means for enabling an in-situ manufacturing capability for FOBs as an alternative for traditional Portland cement. Conversely, this report will not address the efforts undertaken with our polymer research program, which have been addressed in other publications.10
5. Program Goal
The goal of this study is to develop technology for increasing the use of indigenous and recycling of captured/reclaimed resources for in-theater manufacturing into value-added products of use to the Warfighter.
6. Manufacturing with Indigenous Materials In-Theater
6.1 Use of Indigenous Materials on the Battlefield
Historically, the Warfighter has used indigenous materials (namely, sand and earth) on the battlefield in the form of sand bags, and expeditionary earth-filled protective- and Hesco-barriers. According to MIL-PRF-32277,11 this family of earth-filled barriers is intended to provide protection from visual detection, small-arms fire, indirect fire, and perimeter intrusion. All of these products are more utilitarian in nature, rather than technological applications.
6.2 Cement and Concrete in the War Zone
By far the most common cement used today is referred to as “Portland cement”. Its name was derived in the 19th century, from its similarity to Portland stone, a type of building stone that was quarried on the Isle of Portland in Dorset, England.12 This cement is characterized as containing calcareous (lime) and argillaceous materials or other silica-, alumina- and iron-oxide bearing materials.13 On a FOB,

Approved for public release; distribution is unlimited. 4
it may be necessary to use alternatives to Portland cement, based on its lack of availability. A green alternative to Portland cement would be beneficial on a FOB, since Portland cement plants emit not only carbon dioxide but also acid gases, mercury, particulate, total hydrocarbons and hazardous air pollutants. All of these substances originate from the plants unique source of limestone containing kerogen hydrocarbons, a variable mixture of organic compounds and fuels.14
Cement and concrete are used quite extensively in the theater of operations during wartime, not only on FOBs but on roadways and for protection of certain buildings in the war zone (not to mention during the inevitable rebuild of infrastructure). Generally, indigenous materials are used for the creation of large concrete structures in-theater, such as concrete barriers and the like. According to CPT Terence Wilkin,15 who has experience in Southwest Asia:
The most common type of cement barriers on FOBs, were Alaska or "T-Walls" which are roughly 15–20 feet tall or so. These were almost exclusively produced on much larger FOBs where contractors would establish small concrete plants, sourcing the materials from the locals. There’s one such plant that I know of on Bagram AFB in Afghanistan, while in Iraq they were located on Balad AFB, Taji, and in Kuwait. The cast barriers complete with rebar lifting points are then transported to FOBs on flatbed trucks for emplacement. This created a large amount of logistics requirements in terms of line-haul and crane assets required to emplace the barriers. This became a significant issue, as combat brigades do not have organic cranes rated high enough to emplace these barriers. As a result, we had to rely exclusively on paying local nationals to source whatever cranes were available to emplace defensive barriers for our own positions and for local security forces such as the Iraqi police.
6.3 Manufacturing of Building Materials from Indigenous Raw Materials
Space exploration agencies and the Army share a similar goal with respect to manufacturing with indigenous materials. Whereas the Army’s interest is on this capability within the confines of a FOB, space scientists have long studied ways of creating structures on extraterrestrial planets and moons, with access only to indigenous materials for potential future habitation. This concept has had a renewed interest recently, with the proliferation of additive manufacturing and 3-dimensional (3-D) printing capabilities. The European Space Agency has

Approved for public release; distribution is unlimited. 5
examined the logistics of constructing a manned base on the moon using 3-D printing technology and lunar dirt for building materials.16 Researchers used a mixture of minerals resembling the dust and dirt on the moon, called “regolith”, to create a simulated 4-person home with a robotic printer using an organic binder to bond the particles. Alternatively, US researchers have developed a microwave furnace that sinters the lunar dust together. This system uses the ATHLETE (all-terrain hex-limbed extra-terrestrial explorer mobility system as a positioning mechanism with a microwave print head (similar to that of a smaller-scale 3-D printer) to create simulated livable structures.17 The Chinese have even shown that 3-D printed glass fiber-reinforced cement houses can be built, in as little as 24 h, which, with a more optimized design, could be utilized on a FOB for Warfighter protection.
Academic research into indigenous manufacturing was also noted. Worcester Polytechnic Institute, Worcester, MA, has researched geopolymerization as a greener alternative to Portland cement. As defined by Zhang et al.,18 a geopolymer is an emerging class of cementitious materials, which can be synthesized from a wide range of abundant industrial waste materials, such as class F fly ash, red mud, slag, and biomass ash. It is unknown if these waste materials would be in abundance in-theater, and the embedded energy and cost from alkali hydroxide synthesis renders this technology expensive and energy intensive. Another promising and mature technology is the low-temperature solidification (LTS) ceramic manufacturing process developed at Rutgers University. This process is also a cheaper and greener alternative to Portland cement and is processed from minerals and waste. It consumes carbon dioxide (CO2), while only using a small amount of water (water is not a reactant), and has many advantages over traditional cement such as the following19:
• Low-cost raw materials
• Low-carbon footprint
• Conserves water
• Low-energy consumption
• No long “curing” period
• No shrinkage
• Strong and chemically durable
• Advantageous mechanical properties
• New composites; aesthetics and function

Approved for public release; distribution is unlimited. 6
Any mineral combination that can be used to make Portland cement can be used to make LTS ceramic. It was decided to research LTS further and to determine if it would be possible to expand the minerals that can be successfully utilized. The intent of exploring LTS would be to provide protection on FOBs from small arms and fragmentation weapons, and possible structural applications.
6.4 LTS Ceramic
As mentioned previously, research was focused on the area of LTS as a means of creating ceramic/concrete materials on a FOB utilizing available indigenous materials, CO2, and water. This process was chosen due to its maturity and ability to scale up and is used to manufacture ceramic items without high-temperature kilns, which have been required to create ceramics for more than 26,000 years. LTS has been shown to solidify a wide range of monolithic ceramic composite materials. The LTS process consists of the sequence shown in Fig. 1: 1) conventional powder processing methods are used to form a monolithic porous solid matrix from indigenous minerals or waste products; 2) the porous solid matrix is infiltrated with liquid- or vapor-containing reactants; 3) a hydrothermal reaction occurs between the infiltrated reactants and the solid, and the reaction product fills the pore space as the reaction proceeds, solidifying the material.20
Fig. 1 Reactive hydrothermal liquid phase densification paradigm19
LTS is more scientifically referred to as reactive hydrothermal (solvothermal) liquid phase densification (rHLPD). This solvothermal technology enables ceramic densification to proceed without high temperature kilns. Rutgers has invented and used rHLPD to densify a wide range of monolithic composite systems that include ceramics, metals and polymers. Their discovery of the calcium silicate (calcium carbonate-silicon dioxide) (CaSiO3 [CaCO3,-SiO2]) composite system as a suitable cementitious phase for concrete is beginning to displace Portland cement in the
A + B = C

Approved for public release; distribution is unlimited. 7
commercial market. Cement and concrete companies are licensing this technology because the materials have exceptional properties (e.g., strength and durability), meet industry 2050 CO2 emissions and energy goals, and match the cost of ordinary Portland cement.
For this program, 3 different LTS end-products were produced: 1) LTS with aggregate block, 2) metallic foam infused with LTS, and 3) LTS with gasified char additive.
6.5 LTS Ceramic: Aggregate Block
The LTS process was utilized to fabricate a “cinderblock”-sized brick which included rock chunks as aggregate (Fig. 2). This block represented the largest scale-up of the LTS process to date and was subjected to characterization at ARL. Characterization included dielectric measurements, image analysis, ultrasonic testing (UT) inspection, materialography, and scanning electron microscopy.
Fig. 2 Aggregate-filled LTS brick (approximate preslice dimensions: 12 × 6 × 6 inches)
ARL made efforts to quantify the compositional variability in the LTS block by employing dielectric measurements. The sample was scanned in a linear fashion in 3 regions, and measurement volumes were roughly 1.5-inch-diameter cylinders through the thickness of the sample. Figure 3 shows these measurements were highly variable and were deemed inconclusive due to the rough surface. The fact that the sample had nonparallel faces further complicated the measurements. Overall trends did indicate, however, that the sample has significant variability on the cubic inch scale. To illustrate this variability, the faces of the sample were photographed and images were modified to clearly delineate cement from aggregate as shown in Fig. 4. The table within Fig. 4 quantifies the percent area aggregate in the images and values range from 25% to 46% for this sample.

Approved for public release; distribution is unlimited. 8
Fig. 3 Results of dielectric measurements taken through 3 regions of a section of the aggregate-filled LTS brick
Fig. 4 Image analysis and aggregate content (table above) of the aggregate-filled LTS brick
-6.46E-27
1E-12
2E-12
3E-12
4E-12
5E-12
6E-12
7E-12
8E-12
9E-12
1E-11
0 50 100 150 200 250 300
Top
Middle
Bottom
% Area Stone

Approved for public release; distribution is unlimited. 9
UT was used to characterize the block by transmitting acoustic waves into the sample. The goal was to inspect the block for defects and inhomogeneities such as pores, inclusions, or cracks by observing the reflection of the ultrasound waves at material interfaces, which is caused by a mismatch in acoustic impedance. C-scan images were generated from top/near surface-reflected signals, bottom surface-reflected signals, and bulk sample regions (Fig. 5). Scans were run on the strike face and back face of the block. The strike-face images show evidence of extensive pitting damage to the surface (red regions in bottom surface signal scan), while the bulk image shows amplitude variations within the pits themselves. The back face images, which were not affected by pitting damage, were able to more clearly show variations in the bulk without the influence of surface damage. The C-scan image of the bottom surface reflected signal identified the presence of high-attenuation, low-density bands across the top and left side of the sample. The bulk sample image detected several large pores (red regions) in the bottom left and near the top of the block. While the strike face surface showed severe damage, presumably due to chunks of rock detaching from the brick, the bulk of the sample remained intact, with relatively minor damage from isolated pores and lower density regions evident in the scans. While the process requires significant improvement for producing a block with minimal surface damage, the bulk of the sample appears to require more minor adjustments for use as a suitable structural material.
Fig. 5 Results of ultrasonic measurements taken through 3 regions of the aggregate-filled LTS brick
Marc Pepi – Brick 454I; 3.5 MHz; AMP C-Scan ImagesStrikeface Backface
Surfa
ce/N
ear S
urfa
ceBo
ttom
Surfa
ce S
igna
lSa
mpl
e Bul
k
Within Pits

Approved for public release; distribution is unlimited. 10
Scanning electron microscopy of the brick revealed a closer look at the cement/aggregate relationship. Figures 6 and 7 show the morphology of the sectioned LTS brick. Figure 6 shows the product at low magnification, while Fig. 7 shows excellent adhesion of the LTS to the aggregate. The material had low porosity, as determined at the higher magnifications.
Fig. 6 Scanning electron microscope (SEM) of the aggregate-filled LTS brick (magnification 30×)
Fig. 7 SEM of the aggregate-filled LTS brick (magnification 250×)

Approved for public release; distribution is unlimited. 11
6.6 LTS of Blocks on a FOB: CO2 Supply
The CO2 needed for the production of low-temperature solidified “blocks” (similar in size to a standard cinder block) would be expected to come from the exhaust of 2 sources readily available on a FOB: generators and incinerators (such as the Tactical Garbage to Energy Refinery [TGER]). With respect to generators, standard MEP-12A generators were used for calculations. These generators are used on FOBs, with typically 6–8 per approximately 1,100 Warfighters.21 These generators produce 750 kW at 60 Hz, and one generator uses 55 gal of fuel per hour of use.22 Based on the fact that each gallon of diesel fuel produces, on average, 10,084 g of CO2 (about 22 lb),23 and FOB generators are using 55 gal of fuel per hour, we can see that there will be plenty of CO2 for LTS manufacture. Only if necessary (i.e., urgently needed fortification) would block manufacture need to rely on other means of producing CO2, such as vehicle exhaust or the burning of fuel. With respect to incinerators, there are many varieties that are available but not too many that have actually been in service on a FOB. The TGER, created by engineers at Edgewood Chemical Biological Center (ECBC), Edgewood, MD, had been in service in Iraq and was able to stand up to the rigors of the environment and the enormous amount of trash generated. The Marines have used the Micro Auto Gasification System (MAGS) at a camp in Hawaii with success. The LTS process can benefit not only from the CO2 production from these units but can also incorporate the ash into the mix (as we show in Section 6.8). Table 1 shows the blocks per day (b/d) that can be manufactured from the CO2 produced by trash incineration (using 1 and 4.5 lb/day/Soldier as guidelines), and the number of blocks that can be made based on the CO2 derived from the burning of fuel (at 6.6 and 11 gal/day/Soldier). It was found that the number of gallons needed per day per Soldier is on the order of 22 gal,24,25 with half of this fuel requirement needed to run generators.25,26
Table 1 Blocks per day possible
Soldiers CO2 from trash incineration
(b/d) CO2 from diesel burning
generator (b/d) 1 p/d/s 4.5 p/d/s 6.6 g/d/s 11 g/d/s
600 1,228.8 5,236 117,691 196,152 700 1,433.6 6,109 137,306 228,844 800 1,638.4 6,982 156,922 261,536 900 1,843.2 7,855 176,537 294,228
1,000 2,048 8,727 196,152 326,920
Notes: b/d = blocks/day, p/d/s = pounds of trash/day/Soldier, and g/d/s = gallons of fuel/day/Soldier.
Approved for public release; distribution is unlimited. 12
6.7 Metallic Foam Infiltration with LTS Ceramic
LTS presents an opportunity to utilize metallic waste as additives or scaffolding for metal-ceramic structural composites. Since the LTS of ceramics does not require the high temperature of conventional ceramic hardening techniques, metal structures can be incorporated without fear of deformation or melting. This is particularly important for aluminum. Its low density (2.7 g/cm3) is attractive for low-weight structures, but its melting point (660 °C) prevents it from maintaining any structure during ceramic sintering (usually > 1,000 °C). Typical LTS processes rarely exceed 200 °C, and in the following example only 90 °C was used in processing. Thus, aluminum structures can be infiltrated with a ceramic suspension, and the ceramic can subsequently be hardened in place without damaging the aluminum.
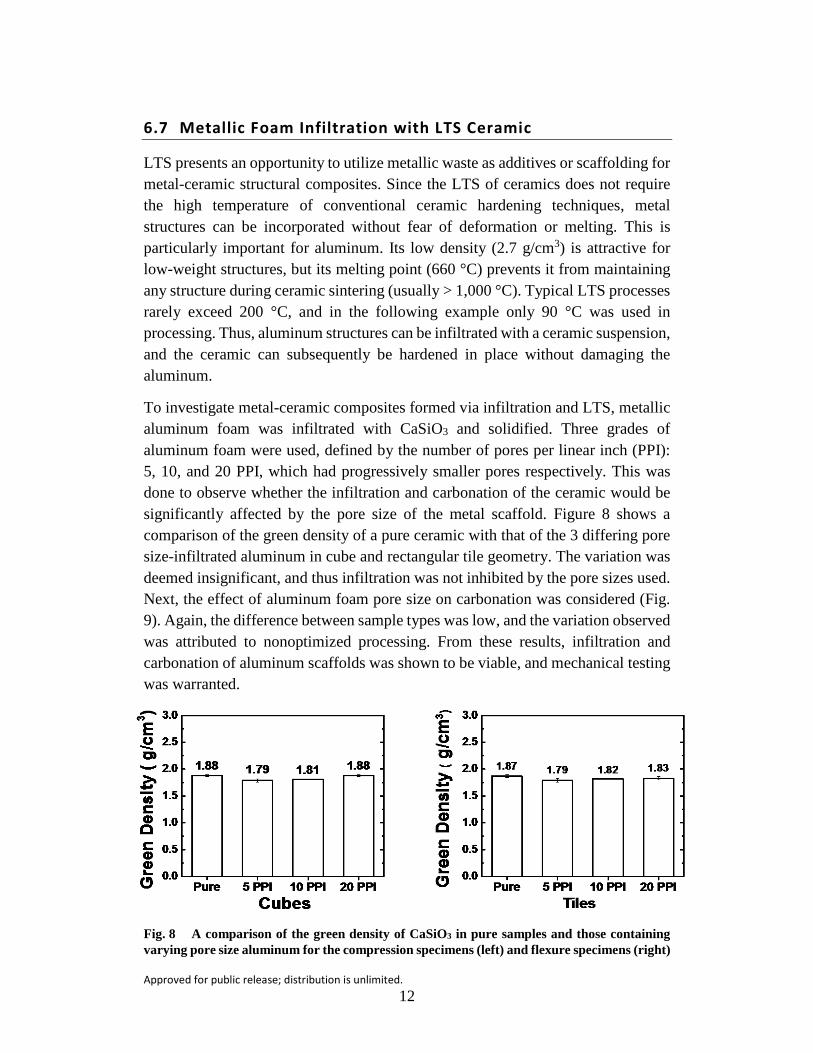
To investigate metal-ceramic composites formed via infiltration and LTS, metallic aluminum foam was infiltrated with CaSiO3 and solidified. Three grades of aluminum foam were used, defined by the number of pores per linear inch (PPI): 5, 10, and 20 PPI, which had progressively smaller pores respectively. This was done to observe whether the infiltration and carbonation of the ceramic would be significantly affected by the pore size of the metal scaffold. Figure 8 shows a comparison of the green density of a pure ceramic with that of the 3 differing pore size-infiltrated aluminum in cube and rectangular tile geometry. The variation was deemed insignificant, and thus infiltration was not inhibited by the pore sizes used. Next, the effect of aluminum foam pore size on carbonation was considered (Fig. 9). Again, the difference between sample types was low, and the variation observed was attributed to nonoptimized processing. From these results, infiltration and carbonation of aluminum scaffolds was shown to be viable, and mechanical testing was warranted.
Fig. 8 A comparison of the green density of CaSiO3 in pure samples and those containing varying pore size aluminum for the compression specimens (left) and flexure specimens (right)

Approved for public release; distribution is unlimited. 13
Fig. 9 A comparison of mass gain due to carbonation of CaSiO3 in pure and aluminum foam samples for the compression specimens (left) and flexure specimens (right)
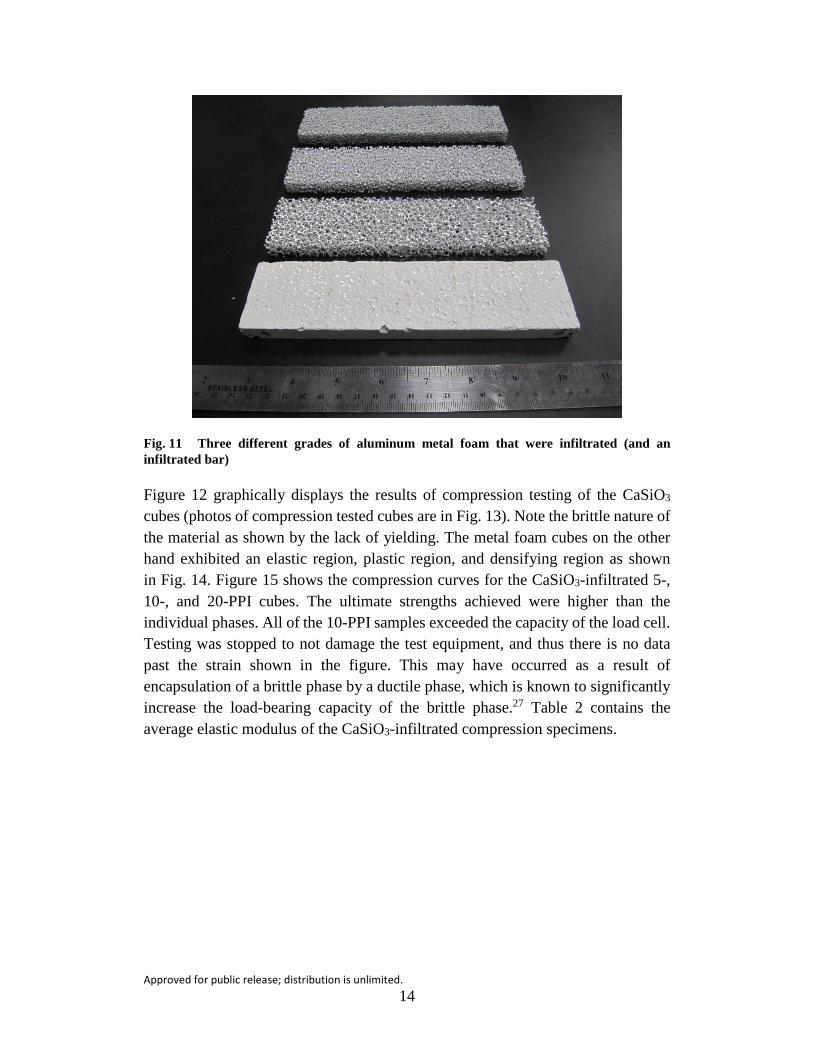
The intent of this research was to create a system that may provide improved mechanical properties over traditional concrete, or metal foam on their own. Cubes of 40 mm and 8- × 2- × 0.5-inch 3-point bars of the aluminum foam were infiltrated with LTS for compression and flexure testing, respectively. Figure 10 shows an infiltrated compression block next to a metal foam block, and Fig. 11 shows the 3 different grades of aluminum metal foam that were infiltrated (and an infiltrated specimen).
Fig. 10 An infiltrated compression block next to a metal foam block
Approved for public release; distribution is unlimited. 14
Fig. 11 Three different grades of aluminum metal foam that were infiltrated (and an infiltrated bar)
Figure 12 graphically displays the results of compression testing of the CaSiO3 cubes (photos of compression tested cubes are in Fig. 13). Note the brittle nature of the material as shown by the lack of yielding. The metal foam cubes on the other hand exhibited an elastic region, plastic region, and densifying region as shown in Fig. 14. Figure 15 shows the compression curves for the CaSiO3-infiltrated 5-, 10-, and 20-PPI cubes. The ultimate strengths achieved were higher than the individual phases. All of the 10-PPI samples exceeded the capacity of the load cell. Testing was stopped to not damage the test equipment, and thus there is no data past the strain shown in the figure. This may have occurred as a result of encapsulation of a brittle phase by a ductile phase, which is known to significantly increase the load-bearing capacity of the brittle phase.27 Table 2 contains the average elastic modulus of the CaSiO3-infiltrated compression specimens.

Approved for public release; distribution is unlimited. 15
Fig. 12 Results of compression testing CaSiO3 cubes
Fig. 13 Compression testing metal foam cube (left) and CaSiO3 cube (right)
Fig. 14 Compression of 5-, 10-, and 20-PPI aluminum foam cubes. Typical foam behavior was observed, with 1) an elastic region, 2) a plastic region, and 3) a densifying region

Approved for public release; distribution is unlimited. 16
0 10 20 30 40 500
25
50
75
100
125
Stre
ss (M
Pa)
Normalized Strain (%)
5PPI
0 2 40
25
50
75
100
125
Stre
ss (
MPa
)
Normalized Strain (%)
10PPI
0 10 20 30 40 500
25
50
75
100
125
Stre
ss (
MPa
)
Normalized Strain (%)
20PPI
Fig. 15 Compression curves of 5-, 10-, and 20-PPI CaSiO3-infiltrated aluminum foam cubes. Ultimate strengths achieved were higher than the individual phases. All of the 10-PPI samples exceeded the capacity of the testing load cell.
Table 2 Averaged elastic modulus of CaSiO3-infiltrated compression cubes

Approved for public release; distribution is unlimited. 17
Figure 16 graphically depicts the average results of 3-point flexure testing for CaSiO3 specimens, and the aluminum foam of varying PPI (see representative 3-point flexure test in Fig. 17). Figure 18 depicts the curves for the CaSiO3-infiltrated specimens, while Figure 19 shows a relative comparison of each material. The composites showed a combination of the individual phase properties, with the ceramic providing increased strength and the foam giving increased deflection. The CaSiO3 alone had medium strength but no ductility. The foam alone had very low strength but lots of ductility. The infiltrated blocks (blue curve) had high strength and high ductility. Table 3 contains the results of flexural modulus measurement. Materialography of a sample with and without the metal foam are shown in Figs. 20 and 21. Some shrinkage (a result of the drying process) in the form of cavities was noted on the LTS-infiltrated metal foam samples (at the LTS to metal foam interface), hinting that the process may be further optimized. Figure 21 shows the LTS structure, containing mineral silicate particles within a carbonate matrix. See regions of preferred orientation caused by flow of the slurry.
0.0 0.5 1.00
10
20
30
CaSiO3 Tiles
Flex
ural
Str
ess
(MPa
)
Deflection (mm)0 2 4 6
0
1
2
3
4
20PPI5PPI
Aluminum Foam Tiles
Flex
ural
Str
ess
(MPa
)
Deflection (mm)
10PPI
Fig. 16 Results of 3-point flexure of CaSiO3 tiles (left) and varying PPI aluminum foam tiles (right). The ceramic tile failed immediately after low deflection.

Approved for public release; distribution is unlimited. 18
Fig. 17 A 3-point flexure testing of a metal foam sample (left) and CaSiO3 sample (right)
Fig. 18 Results of 3-point bending of CaSiO3-infiltrated foam tiles

Approved for public release; distribution is unlimited. 19
Fig. 19 Graphical depiction of the average results of compression testing each material
Table 3 Flexural modulus from 3-point bending specimens

Approved for public release; distribution is unlimited. 20
Fig. 20 Materialography of a sample with the metal foam. There appears to be some shrinkage between the foam and the CaSiO3 as a result of drying.
Fig. 21 Materialography of a CaSiO3 sample (not containing metal foam) showing mineral silicate particles in a carbonate matrix

Approved for public release; distribution is unlimited. 21
6.8 LTS Ceramic Made with Gasified Char
The intent of this effort was to determine whether char could be utilized as an additive to the LTS process, and if so, to what percentage before a degradation of properties occur. Specifically, the char produced by refuse waste combustors used by the military on FOBs or camps was researched for this effort. Waste disposal in the field is a problem for the military, with respect to environmental, health, and security issues. Open-pit burning is becoming less of an option due to these concerns.
Contact was made with the Marines on Camp Smith, HI (Donn Murakami, PE, USMC), regarding the MAGS and with the inventor of the Army’s Tactical Garbage to Energy Refinery (TGER) – Dr James Valdes, ECBC, Edgewood Arsenal, MD. Both the Marines and Dr Valdes provided samples of char that was generated from their respective systems, which was then used in the LTS process.
6.9 Micro Auto Gasification System (MAGS)
As of this writing, the MAGS system is under evaluation at US Marine Corps Forces, Pacific headquarters, in an effort to bring a better waste solution to the Marine Corps.28 The MAGS uses a down-draft gasifier and was the result of an Office of Naval Research program to advance the Secretary of the Navy’s energy goals. This technology was originally shipboard-based but was retooled to be mobile and used on a FOB. The system provides a 20:1 reduction (volumetrically, this equates to 1 yd3 of waste char from 20 yd3 of trash). The waste is combusted, not incinerated, and typical waste streams can include paper, cardboard, plastic, chemicals, food, cloth, oil, grease, biological materials, animal and agricultural waste, and sludge. It is expected that one of these systems could handle the waste of 1,000 Marines on a FOB. An optical photograph of representative MAGS char is shown in Fig. 22, while Fig. 23 shows the char under scanning electron microscopy. As-received char was subjected to cursory analysis prior to elemental composition analysis. The results are listed in Table 4. Elemental composition analysis was conducted via inductively coupled plasma atomic emission spectroscopy (ICP-AES), with the results shown in Table 5. As shown, the sample contained a significant amount of carbonaceous material (56.49% b/w), while 42.79% of the sample after ignition was composed primarily of calcium oxide, lime with significantly lower levels of additional elements/oxides.29 The presence of calcium indicates that the char may be compatible with the LTS process, but unfortunately, the char composition will always change, depending on that day’s waste.

Approved for public release; distribution is unlimited. 22
Fig. 22 Optical photograph of representative MAGS char
Fig. 23 Scanning electron micrograph of representative MAGS char

Approved for public release; distribution is unlimited. 23
Table 4 Cursory analysis of as-received MAGS char29
Metric Char sample
Loss on drying (LODa) 110 °C 0.72% b/w (moisture and/or low temperature volatiles)
Loss on ignition (LOIb) (carbonaceous material) 650–850 °C
56.49% b/w (carbon)
Primary compound after ignitionc
Calcium oxide, CaO, Lime, International Center for Diffraction Data (ICDD) card 48–1467 (calcium oxide plus other components quantified in Table 4 accounted for 42.79% of the char b/w).
a The char was measured for loss on drying (LOD) by heating at 110 °C for 2 h in a forced air oven and measuring the weight loss. Additionally, the sample was further processed by heating in a muffle furnace at temperatures ranging from 650 to 850 °C to a constant weight to measure loss on ignition (LOI). This loss represented the carbonaceous material still present in the char, possibly from incomplete combustion when the char was produced. After ignition, a true, off-white char remained. b The resulting char after LOI was analyzed by X-ray Diffraction (XRD) using a Shimadzu XRD-6000, Lab-X diffractometer. The scan was from 5• 2-theta to 90• 2-theta at a scan rate of 0.5. I minute. Reflection angles were converted to 1-d space data by the Braggs equation and the results searched by ICDD reference tiles for matches. The search was aided by semi-quantitative elemental composition data from a scan of the as-received material using a JEOL 820 scanning electron microscope (SEM) and a 4-Pi energy dispersive X-ray microprobe. c Another portion of the char after ignition was digested by the borate fusion method and analyzed by ICP-AES using a Spectro Ciros ICP spectrometer. The digested sample was scanned from - A 160 to -A 800 nm and detected elements noted and subsequently quantified against calibrations using National Institute of Standards and Technology traceable standards. Results were reported as the common oxides.

Approved for public release; distribution is unlimited. 24
Table 5 Elemental composition (via ICP-AES analysis) of as-received MAGS char29
Element (as oxide) Char after ignition Calcium (CaO, Lime) balance Aluminum (Al2O3) 6.11% Barium (BaO) 0.03 Cobalt (CoO) 0.15 Chromium (Cr2O3) 0.08 Copper (CuO) 0.08 Iron (Fe2O3) 10.64 Potassium (K2O) 0.07 Lithium (Li2O) 0.01 Magnesium (MgO) 1.49 Manganese (Mn2O3) 0.07 Sodium (Na2O) 0.60 Nickel (NiO) 0.03 Phosphorus (P2O4) 0.24 Sulfur (SO4) 0.84 Silicon (SiO2) 5.10 Strontium (SrO) 0.04 Titanium (TiO2) 4.81 Yttrium (Y2O3) 0.05 Zinc (ZnO) 0.11 Zirconium (ZrO2) 0.05
6.10 Tactical Garbage to Energy Refinery (TGER)
The TGER is a waste-to-energy system initially developed by Purdue University and Defense Life Sciences, LLC, under the US Army Small Business Technology Transfer Research program and is a hybrid system combining advanced fermentation and thermal decomposition to convert waste products into energy.30 This reference also concludes that the residue from the TGER appears to be innocuous, with very small amounts of inorganics and can be recycled into other materials (such as we attempted with LTS).
The TGER system does not use down draft gasifier, and it can purportedly break plastics down much better than the MAGS system. This system provides a 30:1 reduction (1 yd3 of waste char from 30 yd3 of trash). This equipment was actually used on a FOB during the Iraq war and provides the advantage of being capable of accommodating liquid waste. The char from each of these systems is considered benign and could be deposited on-site. As shown in Fig. 24, the TGER can produce a “gray char” and a “black char”. The gray char is processed with a steam additive and is shown in the scanning electron micrograph (SEM) photomicrograph in Fig. 25.

Approved for public release; distribution is unlimited. 25
Fig. 24 TGER gray char (left) and black char (right)
Fig. 25 Representative scanning electron micrograph of TGER gray char
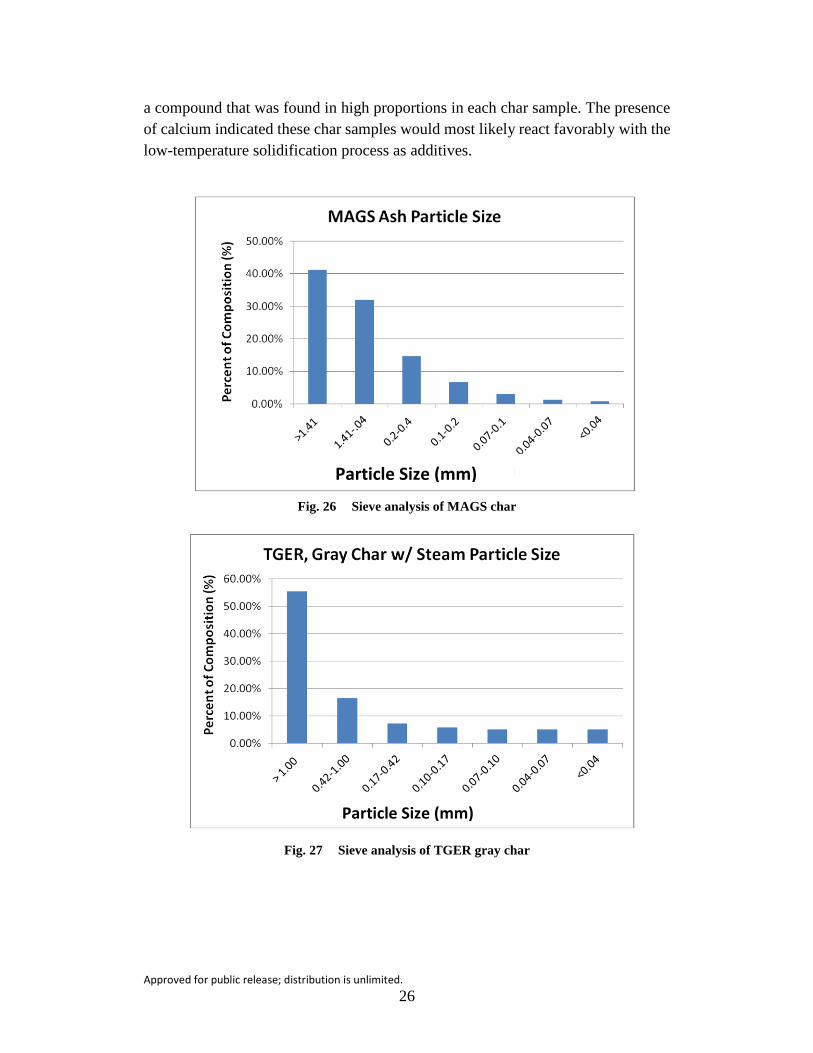
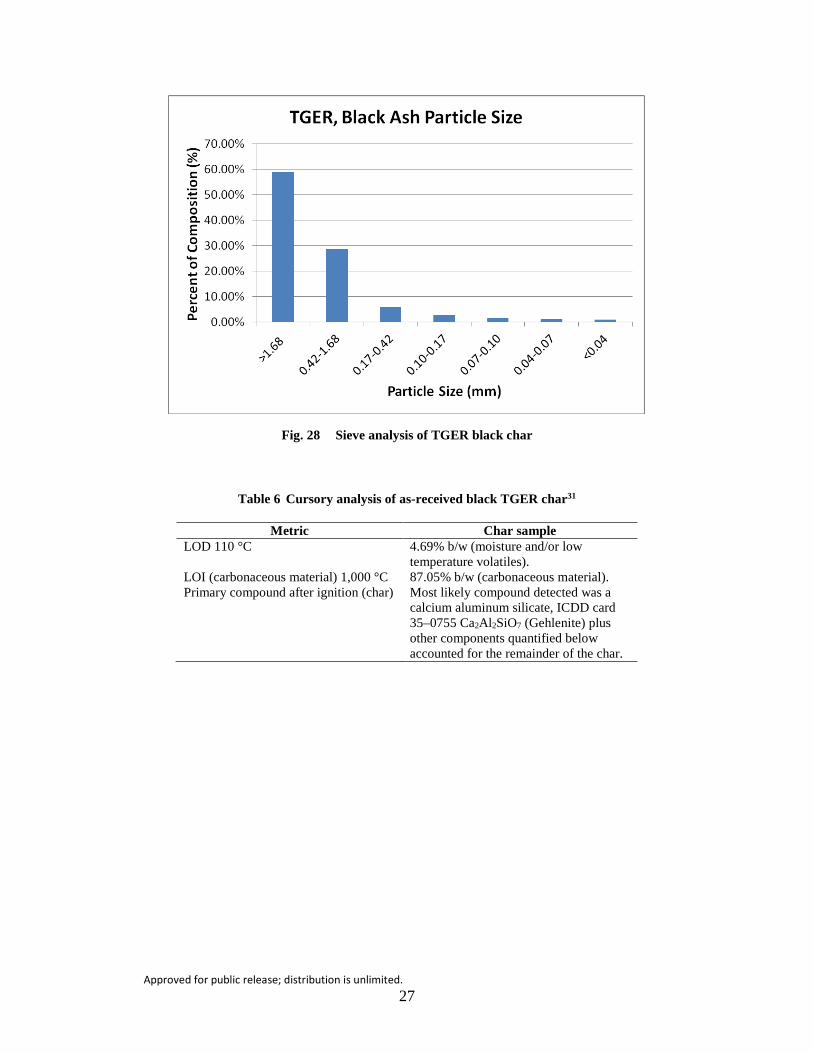
Figure 26 displays the results of subjecting MAGS char to sieve analysis, Fig. 27 for TGER black char, and Fig. 28 for the TGER gray char. The bulk of the each char sample measured greater than 1 mm. Optical and SEM analysis, and the determination of elemental composition was also performed for the black and gray TGER char samples. These results of the ICP-AES analyses are listed in Tables 6–9. There were differences in the composition of both the MAGS and TGER char, which is to be expected due to the variety of items that can be combusted during each batch. The MAGS char was predominantly calcium-based, as was the gray TGER char (processed with steam). The black TGER char contained a significant amount of calcium but was predominantly silicon-based. Aluminum oxide was also
500 µm
Approved for public release; distribution is unlimited. 26
a compound that was found in high proportions in each char sample. The presence of calcium indicated these char samples would most likely react favorably with the low-temperature solidification process as additives.
Fig. 26 Sieve analysis of MAGS char
Fig. 27 Sieve analysis of TGER gray char
Particle Size (mm)
Particle Size (mm)
Particle Size (mm) Particle Size (mm)
Approved for public release; distribution is unlimited. 27
Fig. 28 Sieve analysis of TGER black char
Table 6 Cursory analysis of as-received black TGER char31
Metric Char sample LOD 110 °C 4.69% b/w (moisture and/or low
temperature volatiles). LOI (carbonaceous material) 1,000 °C 87.05% b/w (carbonaceous material). Primary compound after ignition (char) Most likely compound detected was a
calcium aluminum silicate, ICDD card 35–0755 Ca2Al2SiO7 (Gehlenite) plus other components quantified below accounted for the remainder of the char.

Approved for public release; distribution is unlimited. 28
Table 7 Elemental composition (via ICP-AES analysis) of as-received black TGER char31
Element (as oxide) Char after ignition Calcium (CaO, Lime) 22.99% Aluminum (Al2O3) 16.78 Barium (BaO) 0.10 Cobalt (CoO) 0.04 Chromium (Cr2O3) 2.14 Copper (CuO) 0.08 Iron (Fe2O3) 14.95 Potassium (K2O) 1.08 Magnesium (MgO) 3.94 Manganese (Mn2O3) 0.48 Sodium (Na2O) 5.59 Nickel (NiO) 0.72 Phosphorus (P2O4) 0.68 Sulfur (SO4) 0.82 Silicon (SiO2) balance Strontium (SrO) 0.04 Titanium (TiO2) 1.39 Yttrium (Y2O3) 0.0009 Zinc (ZnO) 0.03 Zirconium (ZrO2) 0.10
Table 8 Cursory analysis of as-received gray TGER char31
Metric Char sample
LOD 110 °C 4.27% b/w (moisture and/or low temperature volatiles).
LOI (carbonaceous material) 1,000° C 90.77% b/w (carbonaceous material).
Primary compound after ignition (char)
Most likely compound detected was a calcium aluminum silicate, ICDD card 35–0755 Ca2Al2SiO7 (Gehlenite) plus other components quantified below accounted for the remainder of the char.

Approved for public release; distribution is unlimited. 29
Table 9 Elemental composition (via ICP-AES analysis) of as-received gray TGER char31
Element (as oxide) Char after ignition
Calcium (CaO, Lime) balance Aluminum (Al2O3) 19.90% Barium (BaO) 0.10 Cobalt (CoO) 0.03 Chromium (Cr2O3) 0.08 Copper (CuO) 0.04 Iron (Fe2O3) 1.87 Potassium (K2O) 1.36 Magnesium (MgO) 3.85 Manganese (Mn2O3) 0.34 Sodium (Na2O) 7.76 Nickel (NiO) 0.07 Phosphorus (P2O4) 1.20 Sulfur (SO4) 1.86 Silicon (SiO2) 28.03 Strontium (SrO) 0.06 Titanium (TiO2) 2.04 Yttrium (Y2O3) 0.0009 Zinc (ZnO) 0.006 Zirconium (ZrO2) 0.03
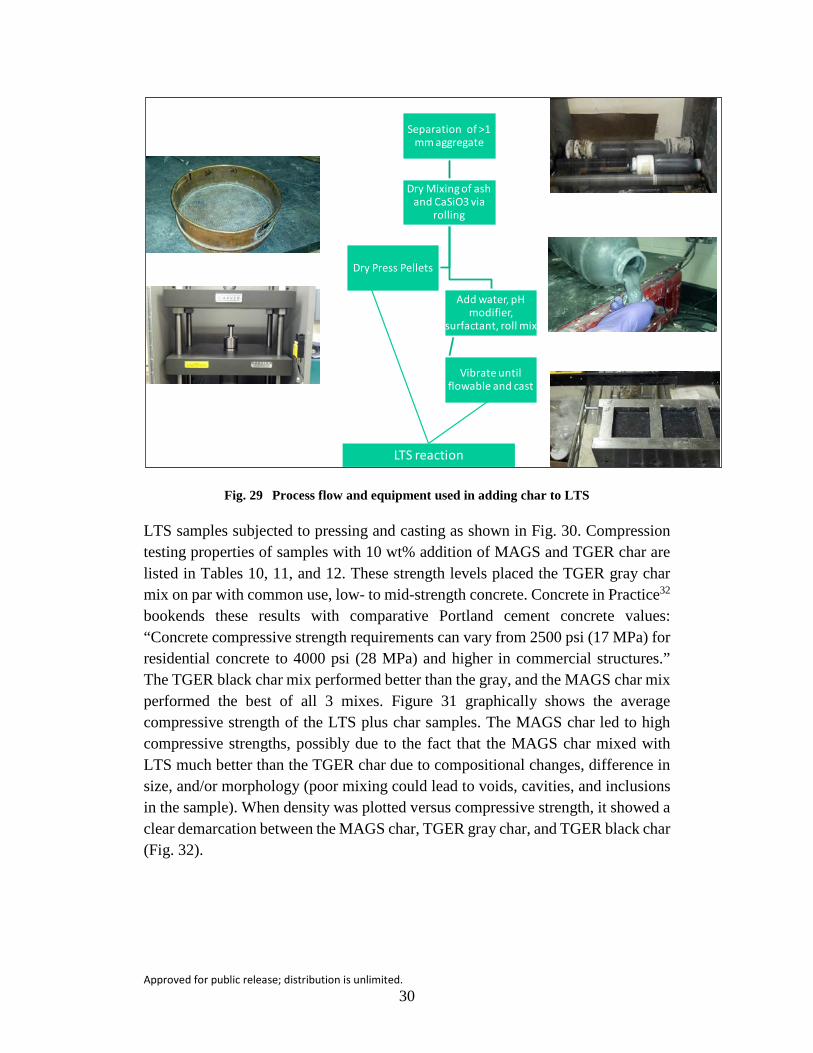
Rutgers University added varying amounts of the black and gray TGER char to their LTS process, and Fig. 29 diagrams the process flow and equipment used to infuse the LTS product with char. Aggregate greater than 1 mm is separated, followed by the dry mixing of the char plus CaSiO3. After dry mixing, water, surfactant, and a modifier is added as-needed to make the slurry flowable and castable. The batching and preparation included 75 wt% of solid suspension, with char less than 1 mm added as 10 wt% of the solids, and Wollastonite comprising the remaining 90 wt%. The 25 wt% of liquids included deionized water with potassium hydroxide, which was added to increase the pH to approximately 12. A common dispersant was also added at less than 1 wt% of the total solids. The batch was subsequently mixed via rolling on a jar mill in a 4-L bottle for approximately 48 h. Casting was accomplished by vibrating the slurry while pouring into a square mold. The mold with the slurry was also vibrated for a short time after pouring. The cast slurry was then dried in ambient conditions for approximately 16 h, and transferred to an oven at 50 °C for another 16 h. Finally, the samples were moved to a reactor for low-temperature solidification.
Approved for public release; distribution is unlimited. 30
Fig. 29 Process flow and equipment used in adding char to LTS
LTS samples subjected to pressing and casting as shown in Fig. 30. Compression testing properties of samples with 10 wt% addition of MAGS and TGER char are listed in Tables 10, 11, and 12. These strength levels placed the TGER gray char mix on par with common use, low- to mid-strength concrete. Concrete in Practice32 bookends these results with comparative Portland cement concrete values: “Concrete compressive strength requirements can vary from 2500 psi (17 MPa) for residential concrete to 4000 psi (28 MPa) and higher in commercial structures.” The TGER black char mix performed better than the gray, and the MAGS char mix performed the best of all 3 mixes. Figure 31 graphically shows the average compressive strength of the LTS plus char samples. The MAGS char led to high compressive strengths, possibly due to the fact that the MAGS char mixed with LTS much better than the TGER char due to compositional changes, difference in size, and/or morphology (poor mixing could lead to voids, cavities, and inclusions in the sample). When density was plotted versus compressive strength, it showed a clear demarcation between the MAGS char, TGER gray char, and TGER black char (Fig. 32).
Separation of >1 mm aggregate
Dry Mixing of ash and CaSiO3 via
rolling
Add water, pH modifier,
surfactant, roll mix
Vibrate until flowable and cast
Dry Press Pellets
LTS reaction

Approved for public release; distribution is unlimited. 31
Fig. 30 Samples pressed (top) and cast (bottom left and right) by the addition of TGER gray char to LTS
Table 10 Compression results of LTS plus TGER gray char (with steam)
Sample Length (mm)
Width (mm)
Area (mm2)
Max stress (MPa)
Density (g/cm3) Mean
(MPa) Std. Dev.
(MPa) 403 a1 19.63 19.58 384.36 21.66 1.48 27.97 4.41 403 a2 19.99 19.88 397.40 24.60 1.60 . . . . . . 403 a3 19.67 19.64 386.32 28.84 1.65 . . . . . . 403 b1 19.91 19.69 392.03 24.19 1.68 . . . . . . 403 b2 19.69 19.57 385.33 30.10 1.69 . . . . . . 403 b3 19.53 19.26 376.15 27.39 1.71 . . . . . . 403 b4 20.09 19.55 392.76 28.59 1.70 . . . . . . 403 c1 20.19 19.73 398.35 30.57 1.74 . . . . . . 403 c2 19.68 19.20 377.86 40.45 1.78 . . . . . . 403 c3 19.88 19.84 394.42 28.83 1.77 . . . . . . 403 c4 19.39 19.23 372.87 27.71 1.77 . . . . . . 403 e1 19.86 19.55 388.26 28.10 1.60 . . . . . . 403 e2 19.79 19.74 390.65 29.59 1.58 . . . . . . 403 e2 19.39 19.04 369.19 22.25 1.55 . . . . . . 403 e4 19.64 19.36 380.23 26.66 1.58 . . . . . .

Approved for public release; distribution is unlimited. 32
Table 11 Compression results of LTS plus TGER black char (without steam)
Sample Length (mm)
Width (mm)
Area (mm2)
Max stress (MPa)
Density (g/cm3) Mean
(MPa) Std. Dev.
(MPa) 435 a1 19.67 20.09 395.17 36.70 1.732 42.20 3.04 435 a2 19.19 19.58 375.74 45.53 1.732 . . . . . . 435 b1 19.67 20.00 393.40 39.29 1.683 . . . . . . 435 b2 19.66 20.12 395.56 38.64 1.683 . . . . . . 435 b3 19.06 19.58 373.19 38.78 1.683 . . . . . . 435 c1 19.61 19.49 382.20 41.18 1.690 . . . . . . 435 c2 19.61 19.75 387.30 40.99 1.690 . . . . . . 435 c3 18.90 19.74 373.09 42.98 1.690 . . . . . . 435 d1 19.22 19.44 373.64 46.19 1.783 . . . . . . 435 d2 20.06 19.50 391.17 44.67 1.783 . . . . . . 435 d3 20.10 19.82 398.38 44.91 1.783 . . . . . . 435 e1 19.73 20.00 394.60 44.97 1.763 . . . . . . 435 e2 19.50 19.84 386.88 41.52 1.763 . . . . . . 435 e3 19.39 19.29 374.03 44.46 1.763 . . . . . .
Table 12 Compression results of LTS plus MAGS char
Sample Length (mm)
Width (mm)
Area (mm2)
Max stress (MPa)
Density (g/cm3) Mean
(MPa) Std. Dev.
(MPa) 447 a1 19.14 19.00 363.66 363.66 1.845 74.02693 13.36072 447 a2 19.04 19.85 377.94 377.94 1.845 . . . . . . 447 a3 20.56 19.80 407.09 407.09 1.845 . . . . . . 447 b1 19.68 19.54 384.55 384.55 1.868 . . . . . . 447 b3 19.58 19.64 384.55 384.55 1.868 . . . . . . 447 b4 19.58 19.51 382.01 382.01 1.868 . . . . . . 447 c1 19.97 19.36 386.62 386.62 1.798 . . . . . . 447 c2 19.96 19.60 391.22 391.22 1.798 . . . . . . 447 c3 19.22 19.54 375.56 375.56 1.798 . . . . . . 447 d1 19.71 20.09 395.97 395.97 1.874 . . . . . . 447 d2 19.87 19.21 381.70 381.70 1.874 . . . . . . 447 d3 19.6 20.52 402.19 402.19 1.874 . . . . . . 447 e1 18.95 20.19 382.60 382.60 1.867 . . . . . . 447 e2 19.13 20.54 392.93 392.93 1.867 . . . . . . 447 e3 20.05 20.17 404.41 404.41 1.867 . . . . . .

Approved for public release; distribution is unlimited. 33
TGER, Bag
Ash(w
/ stea
m)
TGER, Barr
el Ash
MAGS Ash0
20
40
60
80
100
Strength of Cast Ash Cubes
Com
pres
sion
Str
engt
h (M
Pa)
Fig. 31 Average compressive strengths of samples made from TGER and MAGS char
1.5 1.6 1.7 1.8 1.920
30
40
50
60
70
80
90
Compression Testing of 10% Ash Addition Samples
TGER Bag Ash TGER Barrel Ash MAGS Ash
Com
pres
sive
Str
ess
( MPa
)
Density
Fig. 32 Plot of individual compressive strength measurements as a function of material density
Approved for public release; distribution is unlimited. 34
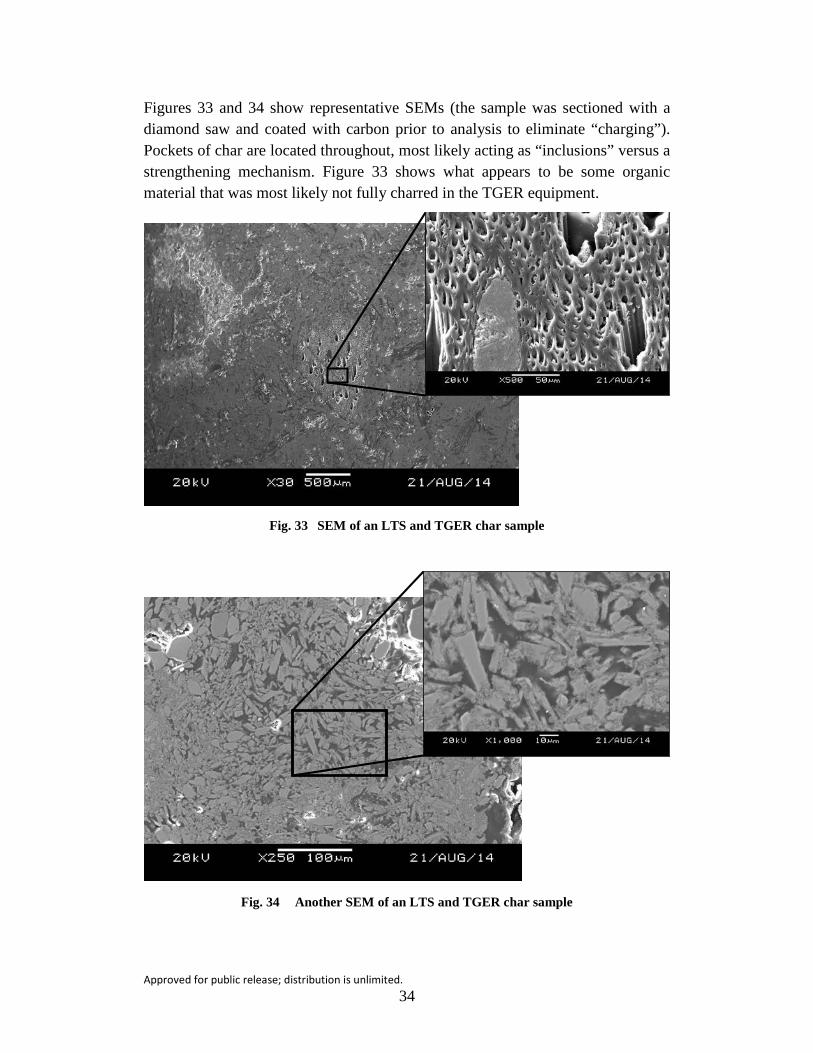
Figures 33 and 34 show representative SEMs (the sample was sectioned with a diamond saw and coated with carbon prior to analysis to eliminate “charging”). Pockets of char are located throughout, most likely acting as “inclusions” versus a strengthening mechanism. Figure 33 shows what appears to be some organic material that was most likely not fully charred in the TGER equipment.
Fig. 33 SEM of an LTS and TGER char sample
Fig. 34 Another SEM of an LTS and TGER char sample
Approved for public release; distribution is unlimited. 35
7. Conclusion
ARL has explored the LTS process with metal foam and waste char as a proof-of-concept. Although these studies looked promising after a few tests, more samples (and the resultant data) could certainly be helpful in determining the viability of utilizing these materials and processes in-theater.
8. Future Work
ARL is interested in any and all manufacturing processes that can be utilized in-theater with indigenous, recycled, and reclaimed materials. Future work will entail researching whether indigenous sand from Afghanistan (outside Bagram Air Force Base), and other locales can be used with the LTS process. This would enable product to be manufactured on a FOB with little to no need for convoys resulting in a further reduction of our logistics tail.

Approved for public release; distribution is unlimited. 36
9. References
1. Hoffman M. US Army sets S&T priorities. Defense News. 2011 Oct 10; 26(37).
2. The seven problems. Army AL&T Magazine. 2011 Oct 6; p.81.
3. Army unveils new science, technology approach. Washington (DC): Army (US); nd [accessed 2011 Oct 7]. http://www.army.mil/article/66973/ Army_unveils_new_science_technology_approach/.
4. Sustainable source: 20 years of online Green Building information. Np: Earth Materials; nd [accessed 2011 Dec 8]. http://earth.sustainablesources.com.
5. Tan M. US Army outlines push to save resources, lives. Defense News. 2012 November;27(44):14.
6. Dellarocco GJ. Force projection research and development: the key enabler for Army transformation [strategy research project]. [Carlisle Barracks (PA)]: Army War College (US); 2001 Apr 10.
7. Jameson LW. Shrinking the logistics tail in the combat zone [strategy research project]. [Carlisle Barracks (PA)]: Army War College (US); 2002 Apr 9.
8. Ransom DS. Logistics transformation – reducing the logistics footprint. [research paper]. [Carlisle Barracks (PA)]: Army War College (US); 2002 Apr 5.
9. Wilkin T. US Army Research Laboratory, Aberdeen Proving Ground, MD. Personal communication, 2014 Aug 12.
10. Zander NE, Orlicki JA, Rawlett AM. Electrospun polycaprolactone scaffolds with tailored porosity using two approaches for enhanced cellular infiltration. Journal of Materials Science: Medical Materials. 2013;24:79–187.
11. MIL-PRF-32277. Performance specification – expeditionary earth-filled protective barriers. Aberdeen Proving Ground (MD): Army Research Laboratory (US); 2010 July 30.
12. van Mier JGM. Fracture processes of concrete. Boca Raton (FL): CRC Press; 1997.
13 RTO solutions for environmental compliance in the cement industry. Pollution Equipment. 2011 Feb/Mar; 8–9.

Approved for public release; distribution is unlimited. 37
14. Riman R. Advanced military materials from indigenous minerals and waste. Proposal to National Security Science and Engineering Faculty Fellowship; 2011.
15. Wilken T. US Army Research Laboratory, Aberdeen Proving Ground, MD. Personal correspondence, 2014 Sep 2.
16. How 3-D printers could build a futuristic moon colony. Np: Space.com; nd [accessed 2013 Feb 2]. http://www.space.com/19602-moon-colony-3d-printing-lunar-dirt.html.
17. Howe AS, Wilcox BH, Barmatz MB, Mercury MB, Seibert MA, Rieber RR. Microwave sinterator freeform additive construction system (MS-FACS). NASA Tech Briefs. 2013 Jan:30–32.
18. Zhang M, Guo H, El-Korchi T, Zhang G, Tao M. Experimental feasibility study of geopolymer as the next-generation soil stabilizer. Journal of Construction and Building Materials. 2013 Oct;47:1468–1478.
19. Riman R. LTS: a new approach for manufacturing materials, presentation furnished [presentation to ARL]. [New Brunswick (NJ)]: Rutgers University; 2013 Jun 25.
20. Whalen T. Rutgers University, New Brunswick, NJ. Private communication, 2014 Aug 8.
21. McCaskey NC. Renewable energy systems for forward operating bases: a simulations-based optimization approach [master’s degree project]. [Fort Collins (CO)]: Colorado State University; 2010 Aug.
22. Air Force Civil Engineer Support Agency. Guide to contingency electrical power system installation. Washington (DC): Headquarters, US Air Force; 2008 July 1. Air Force Handbook 10–222, Volume 5;13–14.
23. Zvi A. How to calculate carbon dioxide emissions from a diesel generator. Santa Monica (CA): eHow; nd [accessed 2013 Sep 26]. http://www.ehow.com/how_6023500_calculate-dioxide-emissions-diesel -generator.html.
24. Wald CF, Captain T. Energy security – America’s best defense. New York (NY): Deloitte; 2009.
25. Schihl P. Power and energy strategy white paper. Deputy Chief of Staff, G-4, US Army, 2010 Apr 1.

Approved for public release; distribution is unlimited. 38
26. Prado V, Seager TP, Mechtenberg AR, Bennett E. A systematic thermodynamic analysis of fuel consumption at forward operating bases. Proceedings of the Sustainable Systems and Technology (ISSST) 2011 IEEE International Symposium; 2011 May 16–18; Chicago, IL. New York (NY): IEEE; c2011. p. 1.
27. Whalen T. Rutgers University, New Brunswick, NJ. Personal correspondence, 2014 Aug 26.
28. Hawaii-based Marines test green waste disposal technology at PTA on Mauna Kea. Np: Damon Tucker: Hawaii News & Information; 2013 Jan 29 [accessed 2015 Aug 12]. http://damontucker.com/tag/micro-auto-gasification-system/.
29. Engelgau P. Report of findings. New Castle (DE): Lehigh Testing Laboratories; 2012 Feb 16. Test Report N-32-5.
30. Valdes ER, Valdes JJ, Clark KC, Hoang KT. Evaluation of residual waste char and ash from the tactical garbage to energy refinery. Edgewood (MD): Edgewood Chemical Biological Center; In press.
31. Engelgau P. Report of findings. New Castle (DE): Lehigh Testing Laboratories; Test Report R-49-33, 2014 Dec 23.
32. Testing compressive strength of concrete. Concrete in Practice. NRMCA. 2003; CIP 35.

Approved for public release; distribution is unlimited. 39
List of Symbols, Abbreviations, and Acronyms
3-D 3 dimensional
ARL US Army Research Laboratory
ATHLETE all-terrain hex-limbed extra-terrestrial explorer
AFB air force base
b/d blocks/day
CO2 carbon dioxide
ECBC Edgewood Chemical Biological Center
FOB forward operating base
ICDD International Center for Diffraction Data
ICP-AES inductively coupled plasma atomic emission spectroscopy
LOD loss on drying
LOI loss on ignition
LTS the low-temperature solidification
MAGS Micro Auto Gasification System
MRE meal-ready-to-eat
PPI pores per linear inch
rHLPD reactive hydrothermal (solvothermal) liquid phase densification
SEM scanning electron microscope
TGER Tactical Garbage to Energy Refinery
UT ultrasonic testing
XRD X-ray Diffraction

Approved for public release; distribution is unlimited. 40
1 DEFENSE TECHNICAL (PDF) INFORMATION CTR DTIC OCA 2 DIRECTOR (PDF) US ARMY RESEARCH LAB RDRL CIO LL IMAL HRA MAIL & RECORDS MGMT
1 GOVT PRINTG OFC (PDF) A MALHOTRA
1 DIR USARL (PDF) RDRL WMM D M PEPI