en Report of Greenhouse Gas Technical Report … · Carbon Footprint Calculator ... N Fertilizer...
140
en A report submitted by ICF International and Colorado State University for the project: Technical Guidelines and Scientific Methods for Entity-Scale Greenhouse Gas Estimation. Report of Greenhouse Gas Accounting Tools for Agriculture and Forestry Sectors Interim Project Technical Report Contract No. GS-23F-8182H February 2012
Transcript of en Report of Greenhouse Gas Technical Report … · Carbon Footprint Calculator ... N Fertilizer...

en
A report submitted by ICF International and Colorado State University for the project: Technical Guidelines and Scientific Methods for Entity-Scale Greenhouse Gas Estimation.
Report of Greenhouse Gas Accounting Tools for Agriculture and Forestry Sectors
Interim Project Technical Report Contract No. GS-23F-8182H February 2012

Report of Greenhouse Gas Accounting Tools for Agriculture and Forestry Sectors Work done under USDA Contract No. GS23F8182H in support of the project: Technical Guidelines and Scientific Methods for EntityScale Greenhouse Gas Estimation.
This report should be cited as: Denef, K., K. Paustian, S. Archibeque, S. Biggar, D. Pape, 2012. Report of Greenhouse Gas Accounting Tools for Agriculture and Forestry Sectors. Interim report to USDA under Contract No. GS23F8182H.
This report was provided to USDA under contract by ICF International and is presented in the form in which it was received from the contractor. Any views presented are those of the authors and are not necessarily the views of or endorsed by USDA. For more information on the Technical Guidelines and Scientific Methods for EntityScale Greenhouse Gas Estimation project, visit http://www.usda.gov/oce/climate_change/techguide or contact the USDA Climate Change Program Office by email at [email protected], fax 202‐401‐1176, or phone 202‐401‐0979.

Contents Table 1: GHGs and Sources Addressed by Tools .............................................................................................. 3 Table 2: Comparison of Features of GHG Calculators ..................................................................................... 8 Calculators ........................................................................................................................................................... 11
Agri-LCI models ....................................................................................................................................... 12 C-PLAN .................................................................................................................................................... 13 CALM ....................................................................................................................................................... 14 CAR Livestock.......................................................................................................................................... 15 Carbon Footprint Calculator ..................................................................................................................... 16 CCT ........................................................................................................................................................... 17 CFF Carbon Calculator ............................................................................................................................. 18 COLE calculators (including GCOLE, COLE, COLE-lite, COLE-EZ) ................................................... 19 COMET-VR/COMET2.0.......................................................................................................................... 20 COMET-FARM ........................................................................................................................................ 21 Cool Farm Tool ......................................................................................................................................... 22 CTCC ........................................................................................................................................................ 23 DNDC calculator ...................................................................................................................................... 24 FarmGAS .................................................................................................................................................. 25 Farming Enterprise GHG Calculator ........................................................................................................ 26 Fieldprint Calculator ................................................................................................................................. 27 FSGGEC ................................................................................................................................................... 28 FVS-CarbCalc ........................................................................................................................................... 29 Greenhouse in Agriculture Tools: Grains Greenhouse Accounting Framework V4 ................................ 30 Greenhouse in Agriculture Tools: Dairy Greenhouse Accounting Framework V4 ................................. 31 Greenhouse in Agriculture Tools: Beef Greenhouse Accounting Framework V6 ................................... 32 Greenhouse in Agriculture Tools: Sheep Greenhouse Accounting Framework V2 ................................. 33 HGCA Biofuel GHG Calculator ............................................................................................................... 34 HOLOS ..................................................................................................................................................... 35 i-Tree Canopy ........................................................................................................................................... 36 International Wine Carbon Calculator ...................................................................................................... 37 IPCC .......................................................................................................................................................... 38 Lincoln Farm Carbon Calculator .............................................................................................................. 39 MANURE ................................................................................................................................................. 40 NDFU ........................................................................................................................................................ 41 OVERSEER .............................................................................................................................................. 42 RAPCOE ................................................................................................................................................... 43 USAID FCC: Agroforestry Tool .............................................................................................................. 44 USAID FCC: Afforestation/Reforestation Tool ....................................................................................... 45 USAID FCC: Forest Management Tool ................................................................................................... 46 USAID FCC: Forest Protection Tool ........................................................................................................ 47
Protocols and Guidelines .................................................................................................................................... 48 1605(b) - Section H & I ............................................................................................................................ 49 ACR - Fertilizer ........................................................................................................................................ 50 ACR - Forest ............................................................................................................................................. 51 ACR - Manure ........................................................................................................................................... 52 AOS - Beef Feeding (edible Oils) ............................................................................................................. 53 AOS - Beef Feeding (reducing days-on-feed) .......................................................................................... 54 AOS - Beef Lifecycle ................................................................................................................................ 55 AOS - Biogas ............................................................................................................................................ 56 AOS - Dairy .............................................................................................................................................. 57

AOS - Energy Efficiency .......................................................................................................................... 58 AOS - NERP ............................................................................................................................................. 59 AOS - Pork ................................................................................................................................................ 60 AOS - Tillage ............................................................................................................................................ 61 CAR - Forest ............................................................................................................................................. 62 CAR – Manure .......................................................................................................................................... 63 Carbon Accounting Protocol for the International Wine Industry ............................................................ 64 CCX - Agricultural Best Management Practices ...................................................................................... 65 CCX - Agricultural Methane .................................................................................................................... 66 CCX - Range ............................................................................................................................................. 67 CCX - Forest ............................................................................................................................................. 68 CDM - A/R ............................................................................................................................................... 69 CDM - Manure .......................................................................................................................................... 70 CDM (small scale)-III.A. Nitrogen Fertilizer offset ................................................................................. 71 Climate Leaders - A/R .............................................................................................................................. 72 Climate Leaders - Manure ........................................................................................................................ 73 FAO - Dairy LCA ..................................................................................................................................... 74 GHG protocol - LULUCF ......................................................................................................................... 75 IPCC – AFOLU ........................................................................................................................................ 76 Managing Energy and Carbon .................................................................................................................. 77 Millar et al., 2010 ...................................................................................................................................... 78 RGGI - Afforestation ................................................................................................................................ 79 RGGI - Manure ......................................................................................................................................... 80 Smith et al. 2006 ....................................................................................................................................... 81 UNDP - GEF ............................................................................................................................................. 82 USAID FCC: Agroforestry Tool .............................................................................................................. 83 USAID FCC: Afforestation/Reforestation Tool ....................................................................................... 84 USAID FCC: Forest Management Tool ................................................................................................... 85 USAID FCC: Forest Protection Tool ........................................................................................................ 86 VCS - AFOLU .......................................................................................................................................... 87 VCS - AFOLU ARR ................................................................................................................................. 88 VCS - AFOLU ALM ................................................................................................................................ 89 VCS - AFOLU IFM .................................................................................................................................. 90 VCS - AFOLU REDD .............................................................................................................................. 91 VCS - VM0003 ......................................................................................................................................... 92 VCS - Biochar (under development) ........................................................................................................ 93 VCS - SALM (under development) .......................................................................................................... 94 VCS - Afforestation/ Reforestation (under development) ........................................................................ 95 VCS - N Fertilizer Rate Reduction (under development) ......................................................................... 96 VCS - Sustainable Grassland Management (under development) ............................................................ 97
Models .................................................................................................................................................................. 98 APEX (EPIC) ............................................................................................................................................ 99 CENTURY .............................................................................................................................................. 100 CNCPS .................................................................................................................................................... 101 COWPOLL ............................................................................................................................................. 102 CQESTR ................................................................................................................................................. 103 DairyGEM............................................................................................................................................... 104 DairyGHG ............................................................................................................................................... 105 DairyWise ............................................................................................................................................... 106 DAYCENT ............................................................................................................................................. 107 DNDC ..................................................................................................................................................... 108 FarmGHG ............................................................................................................................................... 109

FORCARB/FORCARB2 ........................................................................................................................ 111 FVS-CarbCalc ......................................................................................................................................... 112 IFSM ....................................................................................................................................................... 113 Manure-DNDC ....................................................................................................................................... 114 MOLLY .................................................................................................................................................. 115 NASA-CASA (CQUEST) ...................................................................................................................... 116 RothC ...................................................................................................................................................... 117 SCUAF .................................................................................................................................................... 118 SIMS Dairy ............................................................................................................................................. 119 SOCRATES ............................................................................................................................................ 121 SOMMER ............................................................................................................................................... 122 WOODCARB II...................................................................................................................................... 123
References .......................................................................................................................................................... 124

Contract # GS‐23F‐8182H, Report of GHG Tools: Introduction 1 | P a g e
Introduction and Overview Authors and contact information Dr. Karolien Denef, Research Scientist, Natural Resource Ecology Laboratory, Colorado State University ([email protected]) Prof. Keith Paustian, Professor, Department of Soil and Crop Sciences and Senior Research Scientist, Natural Resource Ecology Laboratory, Colorado State University ([email protected]) Prof. Shawn Archibeque, Assistant Professor, Department of Animal Sciences, Colorado State University ([email protected]) Sarah Biggar, Research Assistant, Climate Change and Sustainability Division, ICF International ([email protected]) Diana Pape, Vice President, Climate Change and Sustainability Division, ICF International ([email protected]) Introduction This report provides an overview of publically accessible tools (calculators, protocols, guidelines and models) for quantifying GHG emissions/offsets from agricultural and forestry activities, with a focus on farm/entity/project-level GHG accounting tools. Information contained in this report draws upon publically available information obtained through an extensive literature and web-search, as well as from direct contact with experts. The following review reports were also used:
• Driver et al. (2010a): Driver K., K. Haugen-Kozyra, and R. Janzen. 2010. Agriculture Sector Greenhouse Gas Practices and Quantification Review: Phase 1 Report. 105 pp.
• Driver et al. (Driver et al., 2010b): Driver K., K. Haugen-Kozyra, and R. Janzen. 2010. Agriculture Sector Greenhouse Gas Protocol Benchmarking: Phase 2 Report. 64 pp.
• Lazarus et al. (2009): Lazarus M., et al. 2009. Road-testing of Selected Offset Protocols and Standards. A Comparison of Offset Protocols: Landfills, Manure, and Afforestation/Reforestation. Stockholm Environment Institute Working Paper WP-US-0904.
• Hall et al. (2010): Hall P., P. Holmes-Ling, K. Stewart, and R. Sheane. 2010. A Scottish Farm-Based Greenhouse Gas Accounting Tool. A review of existing tools and recommendations for improved emissions accounting and reporting within agriculture and horticulture. Prepared by Laurence Gould Partnership Ltd and Best Foot Forward for the Scottish Government.
This report contains tools (calculators, protocols and guidelines, and process-based models) related to GHG accounting and a brief description of characteristics for each tool. The report provides general information on each tool (e.g., name, description, origin, purpose) as well as more detailed information on the methodology, application, targeted users, inputs/outputs, and underlying database/ data sources. The tools are separated in three main categories: (1) calculators, (2) protocols and guidelines, and (3) process-based models. Within each category, the tools are alphabetically listed. The category “calculators” include automated web-, excel-, or other software-based calculation tools, developed for quantifying GHG emissions or emission reductions from whole farms, specific agricultural and forest activities, or offset projects. Calculators for U.S. and several other countries are included. We acknowledge that some of these calculators could be categorized as 'process-based models' as well, when the particular calculator is mainly driven by simulations performed by a model. However, many of these model-driven calculators are specifically designed to have a more user-friendly interface and to be used by a more general audience, which distinguishes them in this database from the process-based models listed in this report. The category “protocols and guidelines” contain an overview of predominantly international and U.S.-based guidelines, protocols and other reports that describe quantification methodologies for GHG accounting from agricultural and forestry practices. The database contains a large number of protocols and methodologies, approved (or pending) under the different international and U.S. GHG offset or emission reduction programs, e.g., CDM, RGGI, Climate Leaders, CAR, CCX.

Contract # GS‐23F‐8182H, Report of GHG Tools: Introduction 2 | P a g e
The category “process-based models” contains an overview of process-based, empirical and mechanistic research models that can directly or indirectly (e.g., carbon and nutrient process models) simulate GHG emissions from agricultural or forest activities. The list of process-based models is limited to those that have been most widely used in the U.S. for assessments related to agriculture and greenhouse gases. Many other models that have been used primarily outside of the U.S. are NOT included. Two comparison tables summarize key characteristics and contents of the tools. The first table compares the GHGs and sources addressed by each of the tools (including calculators, protocols and guidelines, and models). The second table compares different features that are specific to calculators. The purpose of developing this report is to identify and provide an overview of publically accessible tools (calculators, protocols and guidelines, and models) for quantifying GHG emissions/offsets from agricultural and forestry activities, with a focus on farm/entity/project-level accounting tools. All of the information in this report is current to the best of our knowledge. This report is not intended to provide a definite characterization or a scientific evaluation on all existing GHG accounting tools. The report was developed with the intention to serve as an aid and reference resource for the Working Groups involved in developing the USDA guidelines for entity-level GHG accounting, as well as the Tool Development Team in the design of a U.S. entity-level GHG calculator for the land use sector. All information contained in this report has been obtained from public sources or direct contact with experts, but no guarantee is given as to the accuracy or completeness of the documented information and no external verification has been undertaken.

Contract # GS‐23F‐8182H, Report of GHG Tools: Comparisons 3 | P a g e
Table 1: GHGs and Sources Addressed by Tools
Tool Name
GHGs Covered Sources
CO2
N2O
CH4
Other
Crop
land
Horticulture
Grazing
Lan
d
Grassland
Agroforestry
Vineyards/ Orcha
rds
Livestock
Forest
Urban
Trees
Afforestation
/ Deforestation
Rice Produ
ction
Wetland
s
Energy Use
Other
Calculators
Agri‐LCI models 1 C‐PLAN 2 CALM 3 4 CAR Livestock Carbon Footprint Calculator 5 CCT 6 CFF carbon calculator 1 COLE calculators 6
COMET‐VR/COMET2.0 7 COMET‐FARM 7 Cool Farm Tool CTCC DNDC calculator FarmGAS 8 9 10 11 Farming Enterprise GHG Calculator Fieldprint Calculator FSGGEC FVS‐CarbCalc 6 Greenhouse in Agriculture tools Grains Greenhouse Accounting Framework V4
6
11
Greenhouse in Agriculture tools Dairy Greenhouse Accounting Framework V4
6
12
Greenhouse in Agriculture tools Beef Greenhouse Accounting Framework V6
6
13
Greenhouse in Agriculture tools Sheep Greenhouse Accounting Framework V2
6
14
HGCA Biofuel GHG Calculator 15 HOLOS 16 17 i‐Tree Canopy
18
19

Contract # GS‐23F‐8182H, Report of GHG Tools: Comparisons 4 | P a g e
Table 1: GHGs and Sources Addressed by Tools (continued)
Tool Name
GHGs Covered Sources
CO2
N2O
CH4
Other
Crop
land
Horticulture
Grazing
Lan
d
Grassland
Agroforestry
Vineyards/ Orcha
rds
Livestock
Forest
Urban
Trees
Afforestation
/ Deforestation
Rice Produ
ction
Wetland
s
Energy Use
Other
Calculators
International Wine Carbon Calculator
IPCC 20 21 Lincoln Farm Carbon Calculator
MANURE NDFU
22,
23 24
OVERSEER 1 RAPCOE USAID FCC: Agroforestry Tool USAID FCC: Afforestation/ Reforestation tool USAID FCC: Forest Management tool USAID FCC: Forest Protection tool
Guide
lines and
Protocols
1605(b) ‐ section H & I
1,
16
25
ACR ‐ Fertilizer ACR ‐ Forest ACR ‐ Manure AOS ‐ Beef Feeding (edible Oils) AOS ‐ Beef Feeding (reducing days‐on‐feed) AOS ‐ Beef Lifecycle AOS ‐ Biogas AOS ‐ Dairy AOS ‐ Energy Efficiency AOS ‐ NERP AOS ‐ Pork AOS ‐ Tillage CAR ‐ Forest CAR ‐ Manure

Contract # GS‐23F‐8182H, Report of GHG Tools: Comparisons 5 | P a g e
Table 1: GHGs and Sources Addressed by Tools (continued)
Tool Name
GHGs Covered Sources
CO2
N2O
CH4
Other
Crop
land
Horticulture
Grazing
Lan
d
Grassland
Agroforestry
Vineyards/ Orcha
rds
Livestock
Forest
Urban
Trees
Afforestation
/ Deforestation
Rice Produ
ction
Wetland
s
Energy Use
Other
Guide
lines and
Protocols
Carbon Accounting Protocol for the International Wine Industry
CCX ‐ Agricultural Best Management Practices CCX ‐ Agricultural Methane CCX ‐ Range CCX ‐ Forest CDM ‐ A/R 26 CDM ‐ Manure CDM (small scale)‐III.A. Nitrogen Fertilizer offset Climate Leaders ‐ A/R 27 Climate Leaders‐ Manure FAO ‐ Dairy LCA 28 GHG protocol ‐ LULUCF 29 IPCC ‐ AFOLU 30 Managing Energy and Carbon Millar et al., 2010 RGGI ‐ Afforestation 27 RGGI ‐ Manure Smith et al. 2006 6 UNDP ‐ GEF 6 USAID FCC: Agroforestry tool USAID FCC: Afforestation/ Reforestation tool USAID FCC: Forest management tool USAID FCC: Forest protection tool VCS ‐ AFOLU VCS – AFOLU: ARR VCS – AFOLU: ALM VCS – AFOLU: IFM VCS – AFOLU: REDD

Contract # GS‐23F‐8182H, Report of GHG Tools: Comparisons 6 | P a g e
Table 1: GHGs and Sources Addressed by Tools (continued)
Tool Name
GHGs Covered Sources
CO2
N2O
CH4
Other
Crop
land
Horticulture
Grazing
Lan
d
Grassland
Agroforestry
Vineyards/ Orcha
rds
Livestock
Forest
Urban
Trees
Afforestation
/ Deforestation
Rice Produ
ction
Wetland
s
Energy Use
Other
Guide
lines and
Protocols
VCS ‐ VM0003 6 VCS ‐ Biochar VCS ‐ SALM
31 VCS ‐ Afforestation/ Reforestation 27 VCS ‐ N fertilizer rate reduction VCS ‐ Sustainable Grassland Management
Mod
els
APEX (EPIC) CENTURY 32 33 CNCPS COWPOLL CQESTR 34 DairyGEM
DairyGHG DairyWise DAYCENT 32 35 33 DNDC 32 FarmGHG FOFEM 36 FORCARB/FORCARB2 FVS‐CarbCalc 34 IFSM Manure‐DNDC MOLLY NASA‐CASA (CQUEST) RothC SCUAF 34 SIMS Dairy

Contract # GS‐23F‐8182H, Report of GHG Tools: Comparisons 7 | P a g e
Table 1: GHGs and Sources Addressed by Tools (continued)
Tool Name
GHGs Covered Sources
CO2
N2O
CH4
Other
Crop
land
Horticulture
Grazing
Lan
d
Grassland
Agroforestry
Vineyards/ Orcha
rds
Livestock
Forest
Urban
Trees
Afforestation
/ Deforestation
Rice Produ
ction
Wetland
s
Energy Use
Other
Mod
els
SOCRATES 34 1 37
SOMMER
WOODCARB II Notes:
1. Includes arable cropland. 2. Includes woodland. 3. Includes specialist pigs, specialist poultry, dairy, LFA grazing livestock, lowland grazing. 4. Includes mixed, nature reserve. 5. All 6 Kyoto GHGs are included (i.e., CO2, N2O, CH4, HFC, PFC, SF6). 6. Only includes changes in annual carbon stocks. 7. Conservation Research Program (CRP) lands are a targeted user. 8. Extensive cropping systems (up to 4 dryland crops and 2 irrigated crops can be
included). 9. Extensive grazing systems (beef and sheep production). 10. Intensive livestock (beef feedlot and piggery ‐ no dairy). 11. Farm trees (environmental plantings). 12. Dairy farms, with land under pasture, cropland and tree plantings. 13. Grazing farms, with land under pasture, cropland and tree plantings. 14. Sheep farms, with land under pasture, cropland and tree plantings. 15. Rapeseed and wheat farms for biodiesel and bioethanol production. 16. Includes organic soils. 17. Lineal tree plantings. 18. The model calculates land cover (tree cover). But this could be used in GHG accounting
models where this information is required to estimate C stocks in tree biomass.
19. Allows any cover class to be included in the tool (e.g., trees, grass, buildings). 20. Only soil C stocks are calculated. 21. Includes native Vegetation, set aside lands, and fallow rotations. 22. Cropland under continuous conservation tillage (see CCX protocol for definition). 23. Cropland converted to permanent grass or hay stands, including permanent pasture
and alfalfa used for hay or sillage. 24. Rangeland, managed for increase in soil carbon storage. 25. Includes residue burning and lime additions. 26. Only through change in carbon stock. 27. Indirect, through C sequestered in carbon pools. 28. Includes GHG associated with refrigerants. 29. Includes N2O, but only as a secondary effect. 30. Methodology includes settlements. 31. Residue and waste management. 32. Soil C sequestration. 33. Includes savannah systems. 34. Indirectly through changes in soil organic carbon (SOC). 35. Only uptake of CH4. 36. Source: Woody fuel consumption by fire. 37. Includes shrubland.

Contract # GS‐23F‐8182H, Report of GHG Tools: Comparisons 8 | P a g e
Table 2: Comparison of Features of GHG Calculators
Tool Name
Ease of Use Output Methodology
Cost Interface Tool Type
User Feed
back Available
Data Storage
Fina
ncial (cost/ben
efit) o
utpu
t
Mitigation / Co
nservation
/ Opp
ortunities advice provided
Uncertainty
Measuremen
t/ M
onitoring
Free
of C
harge
Web
‐based
Excel Spreadshe
et
Software Program or
Compu
ter App
lication
GHG emission
s calculator
C stocks calculator
Offsets calculator
Other
Stored
on Server
Store on
persona
l com
puter
Register and
save to
accoun
t
Empirically Calculated
Mon
te Carlo
Follo
w IP
CC
Other
Agri‐LCI models 1 2 3 4 C‐PLAN 5
6 7
CALM 8 CAR Livestock 9 Carbon Footprint Calculator 10 11 CCT
CFF carbon calculator 12 COLE calculators 13 COMET‐VR/COMET2.0
14 15
COMET‐FARM 16 14 15 Cool Farm Tool 17 CQUEST Lite CTCC 18 19 20 DNDC calculator 21 FarmGAS 22 23 Farming Enterprise GHG Calculator Fieldprint Calculator 24 3
FSGGEC
FVS‐CarbCalc 25
Greenhouse in Agriculture tools: Grains Greenhouse Accounting Framework V4
26
Greenhouse in Agriculture tools: Dairy Greenhouse Accounting Framework V4
26
Greenhouse in Agriculture tools: Beef Greenhouse Accounting Framework V6
26

Contract # GS‐23F‐8182H, Report of GHG Tools: Comparisons 9 | P a g e
Table 2: Comparison of Features of GHG Calculators (continued)
Tool Name
Ease of Use Output Methodology
Cost Interface Tool Type
User Feed
back Available
Data Storage
Any
fina
ncial (cost/ben
efit)
output
Mitigation / Co
nservation
/ Opp
ortunities advice provided
Uncertainty
Measuremen
t/ M
onitoring
Free
of C
harge
Web
‐based
Excel Spreadshe
et
Software Program or
Compu
ter App
lication
GHG emission
s calculator
C stocks calculator
Offsets calculator
Other
Stored
on Server
Store on
persona
l com
puter
Register and
save to
accoun
t
Empirically Calculated
Mon
te Carlo
Follo
w IP
CC
Other
Greenhouse in Agriculture tools: Sheep Greenhouse Accounting Framework V2
26
HGCA Biofuel GHG Calculator HOLOS 3 27
i‐Tree Canopy
28 29
International Wine Carbon Calculator IPCC Lincoln Farm Carbon Calculator MANURE NDFU 30 OVERSEER RAPCOE USAID FCC: Agroforestry Tool 31
USAID FCC: Afforestation/ Reforestation tool
31
USAID FCC: Forest Management tool 31 USAID FCC: Forest Protection tool 31 Notes:
1. This tool is a life cycle assessment (LCA) tool. 2. Energy use is also calculated, which can be a financial indicator. 3. Only available through what‐if analysis. 4. Uncertainty is not analyzed in the models, but some indication of uncertainty is given in the report (Williams et al., 2006, pg. 84): "A reasonable estimate of the uncertainty associated
with any calculated burden is 30%." 5. C‐PLANv0 is free of charge, but simplified version of tool; C‐PLANv2 has free registration, but small fee for calculation. 6. General info on website ("Reducing your footprint") with links to other sites which specialize in a particular mitigation option. Links are split up per source category to direct user to the
area where the contribution of GHG emissions is the biggest; mitigation is one of the topics in the discussion forum (publically accessible); Website also offers consulting advice (at a cost) on mitigation opportunities.
7. Uncertainties are quantified following IPCC guidelines and presented as upper and lower estimate around average. 8. In the notes where mitigation advice is given, some of these are aligned with economic savings too (i.e., those based on efficiencies of inputs). 9. Ex‐post measurements required (metered CH4 capture and combustion).

Contract # GS‐23F‐8182H, Report of GHG Tools: Comparisons 10 | P a g e
10. This tool is a carbon footprint calculator. 11. Not in the tool, but Carbon Trust offers advice for different sectors, but mainly on energy savings. 12. Annual soil organic matter content measurements are required for estimating C sequestration in soils. 13. Standard errors provided on the means. 14. Uncertainties are quantified for CO2 and N2O using an empirically‐based approach, where differences between modeled estimates and field data (from long‐term agricultural experiments
in the U.S.) were analyzed using linear‐mixed effect models. 15. Optional user input of tree measurements (DBH, number of trees in a specific area). 16. Includes spatial user‐interface. 17. User can see which source is contributing most to the total GHG footprint, hence where to put focus on mitigation practices. 18. Plan to be replaced by a Web‐based version with greater functionality. 19. Based on fixed errors per error source category (emission factors, interpolation, building energy simulation). 20. Measurement of tree diameter breast height (DBH) and azimuth (compass bearing) is needed for data entry. 21. User has the option to choose between Monte Carlo method or Most Sensitive Factor method (Li et al. 1996, 2004). For the latter, DNDC runs twice for each cropping system in each grid
with two extreme values of the most sensitive driving factors for the concerned C or N fluxes or pools. 22. A cost/benefit analysis is presented for mitigation measures. Also the cost of the farm emissions is calculated based on an entered C price. 23. Tool offers mitigation options for which N2O and CH4 emissions savings and financial impacts are calculated. 24. Only cost of fuel for the different practices (e.g., tillage, fertilizer application, irrigation) is presented ($/BTU). 25. “Suppose” is the graphical user‐interface for the Forest Vegetation Simulator. 26. General description of mitigation practices provided in the tool introduction page. 27. A rough estimate of uncertainty was developed, based on expert opinion, for each of the categories of emission given in the Holos output. These estimates are best viewed as crude
markers, rather than as definitive assessments, provided merely to alert users especially to the areas of potentially high uncertainty. A weighted measures approach was used to derive the overall uncertainty for the estimate of net GHG emissions from a specified set of farm conditions.
28. This tool is a land cover calculator. 29. The accuracy of the uncertainty analysis depends upon the ability of the user to correctly classify each point into its correct class. Thus the classes that are chosen for analysis must be able
to be interpreted from an aerial image. The tool calculates an uncertainty estimate (standard error) around the estimated percent cover. 30. Includes information regarding the amount of money that could be made from offsets through an offset trading program (i.e., CCX). 31. Free, but only accessible for USAID contracts.

Contract # GS‐23F‐8182H, Report of GHG Tools: Calculators 11 | P a g e
Report of GHG Tools
Calculators

Contract # GS‐23F‐8182H, Report of GHG Tools: Calculators 12 | P a g e
AgriLCI models Cranfield University Agricultural and Horticultural commodity Life Cycle Inventory (LCI) models
General Information• Origin: UK • Authors/Developers: Cranfield University (Williams et al.,
2006), with financial support from DEFRA (Project IS0205). • Year Published: 2006 • Tool Type: LCA tools • Interface: Excel documents, with a graphical interface in
Visual Basic (VB) to allow rapid and easy interrogation of the model.
• Assessment level: Commodity level (although plans for expanding to allow assessments at farm and regional level ‐ DEFRA project IS0222)
• Geographical coverage: England and Wales, although much will also be appropriate for other parts of the UK
• Practices covered: Arable; Livestock. Commodities currently include: bread wheat, potatoes, oilseed rape, tomatoes, beef, pig meat, sheep meat, poultry meat, milk and eggs. Both conventional and organic production systems are included.
• GHG covered: CO2, N2O, CH4 Description
A set of Excel‐based models that can calculate the environmental burdens and resource use of current and future combinations of agricultural production systems, using the principles of life cycle assessment (LCA), currently developed for ten agricultural and horticultural commodities in England and Wales, but possibly to be expanded for more commodities and for assessments at the farm or regional level.
Main Purpose of Tool• To allow modeling the environmental burdens and resource use involved in producing ten agricultural and horticultural commodities in the UK, using the principles of Life Cycle Assessment (LCA). The model can analyze variations in existing production systems.
Current Applications• The model has been used to inform Defra‐funded research projects.
Targeted UsersNone specified.
General MethodologyApproach used in national GHG inventory (IPCC, Tier 1 and 2 GHG emission factors) • Most GHG emission factors in the arable model are those in the IPCC (2006) Guidelines at the Tier 1 level. • Emission factors in the animal model are derived from a mixture of sources and were selected to be more representative of UK conditions than the IPCC Tier 1 default values. Values were taken from the 1997 UK agricultural methane and nitrous oxide inventories and more recent scientific sources. Some interpretations of IPPC emission factors for manure management were made to develop the Tier 1 factors to be closer to UK practices.
• Emissions for producing, packing and delivering fertilizers: various publications (see Williams et al., 2006, pg. 24). • Emissions from composting: national inventory and various publications (see Williams et al., 2006, pg. 26). • Methane oxidation: values obtained from literature. • Emissions from building materials came from proprietary software (SimaPro) and a number of data sources and literature (see Williams et al., 2006, pg. 45).
Underlying Databases/ Data Sources• Farm production databases • DEFRA and MAFF publications and surveys
• UK National Inventory Report (Tier 2 emission factors) • EcoInvent LCA database (SimaPro)
Data Input by User • The default set of values are the ones that were believed to best represent current practices and proportions of production systems and methods in the UK;
• Typical options for field crops also include the proportions of tillage types (plough, reduced, direct drilling), N fertilizer application rate and soil texture distribution;
• Tomatoes: include the mixture of products (classic, specialist, loose, vine), production system, the amount of CHP used; and
• Animal production: include housing types, intensity of nutrition (for dairying), location for sheep production.
Data Output • GWP (100 yrs) in kg CO2 eq per ton of commodity and the
distribution by individual GHG (CO2, CH4, N2O direct, N2O indirect);
• Uncertainty is not analyzed in the models, but some indication of uncertainty is given in the report (Williams et al., 2006, pg. 84): "A reasonable estimate of the uncertainty associated with any calculated burden is 30%;" and
• The user can change input data and create scenarios to analyze variations in existing production systems.
More Info:http://www.cranfield.ac.uk/sas/naturalresources/research/agrilcl.html?ref=88166 See Williams et al. (2006).

Contract # GS‐23F‐8182H, Report of GHG Tools: Calculators 13 | P a g e
CPLAN C‐PLAN Carbon Footprint Calculator
General Information• Origin: UK (Scotland) • Authors/Developers: Drew and Jan Coulter, farmers in
Central Scotland, who rent a mixed hill farm • Year Published: 2007 v0, 2009 v2 • Tool Type: GHG emissions calculator • Interface: Web‐based
• Assessment level: Farm level (UK only) • Geographical coverage: UK • Practices covered: Crops, Livestock, Forest, Woodland • GHG covered: CO2, N2O, CH4
DescriptionC‐PLAN is a web‐based calculator which aims to give farmers and land managers a rapid estimate of the greenhouse gas emissions of their business.
Main Purpose of Tool• To provide farmers, consultants, academics and students with both the average and the upper and lower estimates of their greenhouse gas budgets
Current Applications• None specified.
Targeted UsersC‐PLAN was especially designed for agricultural enterprises.
General MethodologyEmission factor approach, following 2006 IPCC Guidelines (2006) – uses simple Tier 1 IPCC emission factors, modified for UK farming conditions.
Underlying Databases/ Data Sources• UK National Inventory
Data Input by User C‐PLAN v0: • Simplified from v2 ‐ less detailed data needed for forestry, fertilizer and land‐use change.
C‐PLAN v2: • Energy use; • Livestock info (option to select standard settings for UK or customize ‐‐> where you can enter month‐by‐month details of your specific herds, e.g., number of males, number of females, weight of animals, diet, female info, pasture info);
• Fertilizer (amount, N content); • Manure (amount, N content); • Crop (yields); • Other soil related info (e.g., lime, peat removal, histosol area, improved grassland area);
• Forestry info (area, species, planting year, site quality, harvested volume); and
• Land‐use change (country, area, year).
Data Output • C‐PLANv0: Estimates (without uncertainties) of GHG
emissions expressed as tonnes Ceq emitted per year; • C‐PLANv2: Estimates (with uncertainties) of GHG emissions
expressed as tonnes CO2, N2O, CH4, CO2eq and Ceq emitted per year for entire farm. Tool also reports on C sequestration through land use change and forestry, and counts these as a negative on the carbon account; and
• Uncertainties are quantified following IPCC guidelines and presented as upper and lower estimate around average.
More Info: http://www2.cplan.org.uk

Contract # GS‐23F‐8182H, Report of GHG Tools: Calculators 14 | P a g e
CALM Carbon Accounting for Land Managers
General Information• Origin: UK • Authors/Developers: Country Land and Business
Association (CLA) working in partnership with Savills and EEDA
• Year Published: Not specified • Tool Type: GHG emissions calculator • Interface: Web‐based
• Assessment level: Farm level • Geographical coverage: UK • Practices covered:
o Cropland o Horticulture o Specialist pigs o Specialist poultry o Dairy o LFA grazing livestock o Lowland grazing livestock o Mixed o Other o Nature reserve
• GHG covered: CO2, N2O, CH4 Description
The CLA CALM calculator is activity‐based, showing the balance between annual emissions of the key GHG and carbon sequestration associated with the activities of land‐based businesses.
Main Purpose of Tool• To offer a tool to farmers/land managers to measure the annual emissions of CO2, CH4 and N2O from their farm/estate and balance this against any carbon which is sequestered (stored) in their soil and trees; and
• To help land managers understand the carbon balance of their business and highlight opportunities that may have some mitigating effect on climate change by reducing GHG emissions.
Current Applications• CALM calculator has been used in the Natural England Carbon Baseline Survey Project (Holmes‐Ling and Metcalfe, 2008) on 200 farms in the UK.
Targeted UsersDue to the complexity (level of detail) of the tool, mainly for use by professional agricultural consultants and scientists.
General MethodologyIPCC Tier 1 • CALM uses 2005 UK national greenhouse gas emissions methodology (Choudrie et al., 2008) which is largely based on IPCC 2001 guidance on Tier 1 methodology for greenhouse gas reporting at the national level. CALM follows the guidelines provided by DEFRA and the GHG Protocol Corporate Accounting and Reporting Standard; and
• Modifications of IPCC methodology (only on‐site use/incoming manure; livestock emissions based on where they graze; milk yield class instead of national average).
Underlying Databases/ Data Sources• UK National Inventory Report from 1990‐2006 (Choudrie et al., 2008)
Data Input by User • Location (county); • Farm area; • Energy use (farm, contracting); • N Fertilizer use (amount, N content); • Manure use; • Lime use; • Livestock information; • Crop/grass info (tonnes harvested, straw removal, area); • Land‐use change (in past 20 yrs); • Organic soil info; and • Forestry info (area, timber harvested, stem density, biomass expansion).
Data Output • The overall C balance for the business as a whole is
reported in tonnes of CO2, CH4, N2O and CO2eq per year. Tool also reports on C sequestration through land use change and forestry, and counts these as a negative on the carbon account.
More Info: http://www.calm.cla.org.uk/ http://www.naturalengland.org.uk/Images/calmreportfinal_tcm6‐10148.pdf

Contract # GS‐23F‐8182H, Report of GHG Tools: Calculators 15 | P a g e
CAR Livestock Climate Action Reserve Livestock Calculation Tool Beta Version 2.2.0
General Information• Origin: U.S. • Authors/Developers: Climate Action Reserve (CAR) • Year Published: 2009 • Tool Type: Offset calculator • Interface: Excel document
• Assessment level: Farm level • Geographical coverage: U.S. • Practices covered: Livestock farms • GHG covered: CH4, CO2
DescriptionThis calculator will calculate GHG emission reductions associated with installing a manure biogas control system for livestock operations, such as dairy cattle and swine farms, in accordance with CAR's Livestock Project Protocol.
Main Purpose of Tool• To support project developers of CAR Livestock projects and facilitate consistent and complete emissions reporting.
Current Applications• None specified.
Targeted UsersCAR Livestock Project project developers
General MethodologyCombination of modeling (algorithms requiring site‐specific data and using default parameters from IPCC, EPA) and ex‐post measurements (to check modeled estimates). Methodology follows IPCC (2006) guidelines. • CH4 emissions from anaerobic manure storage uses equations which incorporates temperature effect using Van’t Hoff Arrhenius factor and accounts for the retention of volatile solids;
• CH4 emissions from non‐anaerobic manure storage, the BCS effluent pond as well as other non‐BCS related CH4 sources, uses equations which take into account amount of volatile solids produced and default IPCC methane conversion factor (specific for manure storage system);
• CH4 from biogas system uses equations which take into account metered CH4 combusted and collection and combustion efficiency; and
• CO2 from fuel combustion uses equations taking into account amount of fuel and fuel‐specific EF (from EPA). Underlying Databases/ Data Sources
Default values for: • Volatile solids for livestock categories from EPA (2008a); EPA (2009), ASAE (2005) and IPCC (2006); • Methane conversion factors for manure management systems from IPCC 2006; and • Emission factors for fossil fuel combustion from EPA (2008c).
Data Input by User • Site information (e.g., state, county, size); • Monthly site temperature; • Livestock information (categories, mass, population); • Manure storage information; • Fossil fuel use; • Efficiency of CH4 collection and destruction; and • Metered quantity of CH4 captured and combusted.
Data Output • Results are expressed in tonnes CH4 and CO2eq per year for
baseline and project scenario. Modeled CH4 reductions are compared with measured CH4 destruction.
More Info: http://www.climateactionreserve.org/how/protocols/adopted/livestock/current‐livestock‐project‐protocol/See Climate Action Reserve (2010b)

Contract # GS‐23F‐8182H, Report of GHG Tools: Calculators 16 | P a g e
Carbon Footprint Calculator Carbon Trust Carbon Footprint Calculator
General Information• Origin: UK • Authors/Developers: Carbon Trust • Year Published: Not specified • Tool Type: Carbon footprint calculator • Interface: Web‐based
• Assessment level: Company level • Geographical coverage: Global • Practices covered: Agricultural enterprises (farming,
fishing, forestry, dairy); Energy management • GHG covered: All 6 Kyoto GHG (CO2, N2O, CH4, HFC, PFC,
SF6) Description
Carbon footprint calculator allows organizations to calculate GHG emissions from all the activities across the organization, including buildings’ energy use, industrial processes and company vehicles.
Main Purpose of Tool• To enable estimating the carbon footprint of a company, based on easy to gather input data.
Current Applications• None specified.
Targeted UsersAny company interested to obtain a quick assessment of its carbon footprint.
General MethodologyDefault emission factor approach using emission factors published by UK DEFRA in June 2008.
Underlying Databases/ Data Sources• Defra emission factors
Data Input by User • Energy use on site; • Electricity use on site; • Fuel use for employee transportation; and • CO2eq emissions from other indirect emissions (upstream, downstream) if known.
Data Output • CO2 equivalents (tonnes) for the different emission
categories and for the whole company.
More Info: http://www.carbontrust.co.uk/cut‐carbon‐reduce‐costs/calculate/carbon‐footprinting

Contract # GS‐23F‐8182H, Report of GHG Tools: Calculators 17 | P a g e
CCT U.S. Forest Carbon Calculation Tool
General Information• Origin: U.S. • Authors/Developers: USDA, Forest Service and U.S. EPA • Year Published: 2007 • Tool Type: C stocks calculator • Interface: Computer application (.exe)
• Assessment level: State level • Geographical coverage: U.S. • Practices covered: Forest • GHG covered: Only changes in annual carbon stocks (CO2
emissions can be calculated by user) Description
The Carbon Calculation Tool 2007, CCT2007.exe, is a computer application that reads publicly available forest inventory data collected by the USDA Forest Service's Forest Inventory and Analysis Program (FIA) and generates state‐level annualized estimates of carbon stocks and flux estimates for 1990 to the present on forest land, based on FORCARB2 estimators.
Main Purpose of Tool• To provide State‐level forest carbon stock and stock change (difference between successive stocks) estimates as indicated by successive forest inventories.
Current Applications• Basis for the forest ecosystem carbon change values reported to the U.S. EPA by the U.S. Forest Service for inclusion in the annual inventory of greenhouse gas emissions and sinks.
Targeted UsersUsers are likely to be individuals, State governments, or regional groups interested in trends in forest carbon since 1990.
General MethodologyPublished equations using coefficients of the FORCARB2 model and applied at the plot level. • Carbon conversion coefficients of the FORCARB2 model are used and applied at the FIA inventory plot scale (Birdsey and Heath, 2001, 1995; Heath et al., 2003; Smith et al., 2004). The results are estimates of C density for live trees, standing dead trees, understory vegetation, down dead wood, forest floor and soil organic matter.
• C density is converted to carbon mass based on expansion factors (Miles, 2008), and then summed to determine total carbon stock for a survey.
• Equations are used from Jenkins et al., (2003), Smith et al., (2003, to calculate tree biomass), Birdsey, 1996 (1996, understory carbon density), Smith and Heath, (2002, forest‐floor carbon), Amichev and Galbraith, (2004, soil organic C).
Underlying Databases/ Data Sources• USDA Forest Service’s Forest Inventory and Analysis Program (FIA) data (plot‐level inventory data)
Data Input by User • CCT reads publicly available forest inventory data from the FIA. No additional data input by user is needed.
Data Output • Results are expressed in terragrams C per year for the
selected state; • Annualized C stocks and flux are organized according to
year and state and are broken down by (cf. categories cf. U.S. EPA and IPCC reporting):
o Aboveground biomass C; o Belowground biomass C; o Dead wood C; o Litter C; o Soil organic C;
• In the 'Comprehensive' output option: AG biomass C is further broken down by live trees, understory vegetation, dead standing trees and dead down wood.
More Info: http://nrs.fs.fed.us/carbon/tools/#cvalhttp://www.nrs.fs.fed.us/pubs/gtr/gtr_nrs13R.pdf See Smith et al. (2007); Birdsey and Heath (1995, 2001); Birdsey (1996); Heath et al. (2003); Smith and Heath (2002); Smith et al. (2003; 2004); Jenkins et al. (2003); Miles (2008); Amichev and Galbraith (2004).

Contract # GS‐23F‐8182H, Report of GHG Tools: Calculators 18 | P a g e
CFF Carbon Calculator Climate Friendly Food Carbon Calculator
General Information• Origin: UK • Authors/Developers: Jonathan Smith and Mukti Mitchell • Year Published: 2009 • Tool Type: GHG emissions calculator • Interface: Web‐based
• Assessment level: Farm level • Geographical coverage: UK • Practices covered: Horticulture cropland, Arable cropland,
Livestock (dairy, beef, pigs, sheep, poultry….), Cultivation of histosols
• GHG covered: CO2, N2O, CH4 Description
This tool calculates greenhouse gas emissions and C sequestration from all activities relating to organic farming and growing businesses.
Main Purpose of Tool• To allow organic farmers and growers to estimate the carbon footprint of their business, identify cost savings and offer advice on how to minimize their carbon emissions.
Current Applications• Used by several farms in the UK to determine GHG emissions and C sequestration of their farm.
Targeted UsersOrganic farmers and growers
General MethodologyFollowing methodology of UK National inventory report (Choudrie et al., 2008, based on IPCC guidelines Tier 1 and 2), as well as methodologies and EF from published studies: • Energy use and transport: Defra GHG emission factors; • Embedded emissions in materials: Hammond and Jones (2008); • Machinery: Williams et al. (2006); • Soil‐related emissions: IPCC default emission factors; • Manure management: IPCC Tier 1 and 2 approaches; • Green manure: Cuttle et al. (2003); • Imported feed: ADAS (2009); • Orchards: Kerckhoffs and Reid (2007); • Trees: King et al. (2004); • Hedges, field margins: Falloon et al. (2004); and • Soil organic matter: by measurement and monitoring.
Underlying Databases/ Data Sources• None specified.
Data Input by User • Energy use (fuel, electricity, transport, contractors); • Use of construction materials, packaging materials, crop protection materials, office materials;
• On‐farm vehicles; • Machinery and implements; • Harvested amounts of horticulture crops, arable crops; • Amount of compost produced; • Amount of amendments (lime, manure, biomass); • Area of cultivated peat soil; • Area of green manures and period used; • Livestock information (dairy, beef, pigs, sheep, lamb, goats, horses, deer, different poultry) ‐ heads, grazing, manure management;
• Imported organic animal feed; • Produce end‐use information; and • Sink information (area of orchards, woodland, SOM content upon measurement).
Data Output • Output shows the total kg CO2eq emissions and
sequestered per year for the entire farm. No results are given for the individual GHG. Results are broken down by source/sink category.
More Info: http://www.cffcarboncalculator.org.uk/carboncalcSee list of references used to construct the calculator: http://www.cffcarboncalculator.org.uk/sites/default/files/download/list_of_cff_carbon_calculator_references_0.pdf

Contract # GS‐23F‐8182H, Report of GHG Tools: Calculators 19 | P a g e
COLE calculators (including GCOLE, COLE, COLElite, COLEEZ) Carbon OnLine Estimator: GCOLE: next generation COLE‐lite: html‐based
COLE‐EZ: for 1605(b) reporting
General Information• Origin: U.S. • Authors/Developers: National Council for Air and Stream
Improvement, Inc and the USDA Forest Service, Northern Research Station
• Year Published: 2005 (version 2) • Tool Type: C stocks calculator • Interface: Web‐based
• Assessment level: County level (or larger) • Geographical coverage: U.S. • Practices covered: Forestry • GHG covered:
o In COLE, GCOLE and COLE‐Lite only C stocks (no change)
o In COLE‐EZ: CO2 (indirectly) only change in C stocks calculated in different pools
DescriptionCOLE is an online tool used to generate forest carbon inventory estimates for any area of the continental United States. As tool development proceeds, COLE will take the place of U.S. Forest Carbon Calculation Tool (CCT).
Main Purpose of Tool• To aid landowners, companies, States and other sectors to monitor and manage their forest carbon resources; and • For calculating carbon “growth and yield” curves for 1605b reporting for the DOE 1605(b) program (voluntary GHG emission reduction reporting) (DOE, 2007).
Current Applications• Reports can be produced which calculate carbon “growth and yield” curves for 1605b reporting; • For the inventory of U.S. greenhouse gas emissions and sinks; and • Can be useful for the carbon criterion in the Montreal Process criteria and indicators for sustainability.
Targeted UsersLandowners, companies, states.
General MethodologyPublished equations • FIA (Forest Inventory and Analysis) database provides total gross biomass oven dry weight (DRYBIOT) values for each tree; • DRYBIOT data is multiplied by 0.5 to get C in total above ground biomass for a tree 1.0 inch and larger including all tops and limbs, but excluding foliage;
• Carbon in foliage and roots is then estimated for each tree using published equations (Jenkins et al., 2003); and • C in forest floor, down dead wood, and soil, is estimated at the plot level using methods (models) developed by Smith et al. (2006).
Underlying Databases/ Data Sources• FAO (ecological zone map) • IPCC default values for biomass accumulation rates and root‐to‐shoot ratios
Data Input by User • State ‐ County; and • Filter (e.g., by forest type, growing stock conditions, owner, productivity class).
Data Output • Results are expressed in metric tonnes carbon stock per
hectare in forests for the selected states and counties; and • Uncertainty: Standard errors are provided on the means.
More Info: http://www.fs.fed.us/ccrc/tools/cole.shtmlhttp://nrs.fs.fed.us/carbon/tools/#cval http://nrs.fs.fed.us/carbon/local‐resources/downloads/COLE_Handout.pdf See Proctor et al. (2002). Also see Van Deusen and Heath (2010; 2011); Potter et al. (2008); Smith et al., (2006).
Contract # GS‐23F‐8182H, Report of GHG Tools: Calculators 20 | P a g e
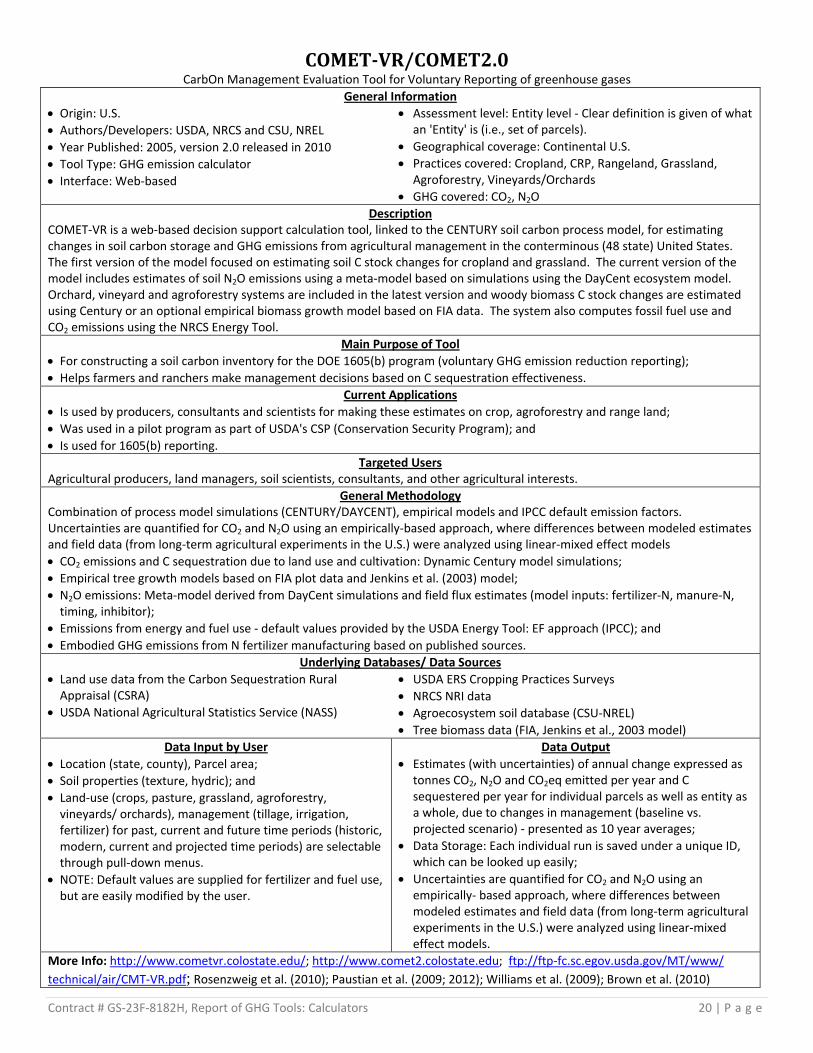
COMETVR/COMET2.0 CarbOn Management Evaluation Tool for Voluntary Reporting of greenhouse gases
General Information• Origin: U.S. • Authors/Developers: USDA, NRCS and CSU, NREL • Year Published: 2005, version 2.0 released in 2010 • Tool Type: GHG emission calculator • Interface: Web‐based
• Assessment level: Entity level ‐ Clear definition is given of what an 'Entity' is (i.e., set of parcels).
• Geographical coverage: Continental U.S. • Practices covered: Cropland, CRP, Rangeland, Grassland,
Agroforestry, Vineyards/Orchards • GHG covered: CO2, N2O
DescriptionCOMET‐VR is a web‐based decision support calculation tool, linked to the CENTURY soil carbon process model, for estimating changes in soil carbon storage and GHG emissions from agricultural management in the conterminous (48 state) United States. The first version of the model focused on estimating soil C stock changes for cropland and grassland. The current version of the model includes estimates of soil N2O emissions using a meta‐model based on simulations using the DayCent ecosystem model. Orchard, vineyard and agroforestry systems are included in the latest version and woody biomass C stock changes are estimated using Century or an optional empirical biomass growth model based on FIA data. The system also computes fossil fuel use and CO2 emissions using the NRCS Energy Tool.
Main Purpose of Tool• For constructing a soil carbon inventory for the DOE 1605(b) program (voluntary GHG emission reduction reporting); • Helps farmers and ranchers make management decisions based on C sequestration effectiveness.
Current Applications• Is used by producers, consultants and scientists for making these estimates on crop, agroforestry and range land; • Was used in a pilot program as part of USDA's CSP (Conservation Security Program); and • Is used for 1605(b) reporting.
Targeted UsersAgricultural producers, land managers, soil scientists, consultants, and other agricultural interests.
General MethodologyCombination of process model simulations (CENTURY/DAYCENT), empirical models and IPCC default emission factors. Uncertainties are quantified for CO2 and N2O using an empirically‐based approach, where differences between modeled estimates and field data (from long‐term agricultural experiments in the U.S.) were analyzed using linear‐mixed effect models • CO2 emissions and C sequestration due to land use and cultivation: Dynamic Century model simulations; • Empirical tree growth models based on FIA plot data and Jenkins et al. (2003) model; • N2O emissions: Meta‐model derived from DayCent simulations and field flux estimates (model inputs: fertilizer‐N, manure‐N, timing, inhibitor);
• Emissions from energy and fuel use ‐ default values provided by the USDA Energy Tool: EF approach (IPCC); and • Embodied GHG emissions from N fertilizer manufacturing based on published sources.
Underlying Databases/ Data Sources• Land use data from the Carbon Sequestration Rural Appraisal (CSRA)
• USDA National Agricultural Statistics Service (NASS)
• USDA ERS Cropping Practices Surveys • NRCS NRI data • Agroecosystem soil database (CSU‐NREL) • Tree biomass data (FIA, Jenkins et al., 2003 model)
Data Input by User • Location (state, county), Parcel area; • Soil properties (texture, hydric); and • Land‐use (crops, pasture, grassland, agroforestry, vineyards/ orchards), management (tillage, irrigation, fertilizer) for past, current and future time periods (historic, modern, current and projected time periods) are selectable through pull‐down menus.
• NOTE: Default values are supplied for fertilizer and fuel use, but are easily modified by the user.
Data Output • Estimates (with uncertainties) of annual change expressed as
tonnes CO2, N2O and CO2eq emitted per year and C sequestered per year for individual parcels as well as entity as a whole, due to changes in management (baseline vs. projected scenario) ‐ presented as 10 year averages;
• Data Storage: Each individual run is saved under a unique ID, which can be looked up easily;
• Uncertainties are quantified for CO2 and N2O using an empirically‐ based approach, where differences between modeled estimates and field data (from long‐term agricultural experiments in the U.S.) were analyzed using linear‐mixed effect models.
More Info: http://www.cometvr.colostate.edu/; http://www.comet2.colostate.edu; ftp://ftp‐fc.sc.egov.usda.gov/MT/www/ technical/air/CMT‐VR.pdf; Rosenzweig et al. (2010); Paustian et al. (2009; 2012); Williams et al. (2009); Brown et al. (2010)

Contract # GS‐23F‐8182H, Report of GHG Tools: Calculators 21 | P a g e
COMETFARM CarbOn Management Evaluation Tool for whole FARM GHG accounting
General Information• Origin: U.S. • Authors/Developers: USDA, NRCS and CSU, NREL • Year Published: Not available yet, public release scheduled
for March 2012. • Tool Type: GHG emission calculator • Interface: Web‐based (with spatial user‐interface) • Assessment level: Farm/enterprise level
• Geographical coverage: Continental U.S., Alaska, Hawaii, Puerto Rico, and other U.S. Territories with major agricultural or agroforestry practices for which NRCS data on those practices exist
• Practices covered: Cropland, CRP, Rangeland, Grassland, Agroforestry, Vineyards/Orchards, Livestock
• GHG covered: CO2, N2O, CH4 Description
COMET‐FARM is currently under development as a major upgrade of COMET2.0, but with inclusion of livestock and other emission sources to provide a full GHG accounting at the farm‐level, with a spatial user‐interface, and linkages to NRCS web‐served products.
Main Purpose of Tool• To enable full farm‐level greenhouse gas accounting.
Current Applications• Not yet released.
Targeted UsersAgricultural producers, land managers, federal agencies, soil scientists, consultants, and other agricultural interests.
General MethodologyCombination of process model simulations (DAYCENT), empirical models and IPCC emission factors. • Uses DAYCENT for estimating soil C sequestration and emissions of CO2 and N2O; • Indirect N2O estimated from DAYCENT N leaching and volatilization and IPCC indirect N2O emission factors • Livestock related emissions include CH4 from enteric fermentation and CH4 and N2O from manure management; • Livestock categories limited to those described in IPCC (1996‐ reference manual, Ch. 4 Agriculture); • Emissions from biomass burning based on IPCC methods and USDA (Tier 2) emission factors; • Empirical tree growth models based on FIA plot data and Jenkins et al. model; • Emissions from energy and fuel use ‐ default values provided by the USDA Energy Tool: EF approach (IPCC); • Emission reductions from on‐farm fuel and electricity production are included; and • Embodied GHG emissions from N fertilizer manufacturing based on published sources.
Underlying Databases/ Data Sources• SSURGO soil maps • NCDC gridded climate • USDA National Agricultural Statistics Service (NASS)
• USDA ERS Cropping Practices Surveys • NRCS NRI data • Agroecosystem soil database (CSU‐NREL) • Tree biomass data (FIA, Jenkins et al., 2003 model)
Data Input by User • Spatial interface allows the user to specify individual fields. For calculation purposes fields are subdivided by major soil types with automatic overlays with SSURGO soil maps, served from Web Soil Survey;
• Land use and management information is input by user using pull‐down and accordion menus, but the main difference compared to COMET‐VR is that management can be specified year‐by‐year for the baseline period (2000‐present) and for the projection period (+ 10 years). Multiple scenarios for each field can be specified; and
• For livestock related emissions (enteric methane and CH4 and N2O from manure management), user specifies livestock populations (mean monthly) for the baseline and projection years, sex, age, breed, mature weight and selects type of manure management system, based on IPCC Tier 1 methods. A Tier 2/3 approach allows users to specify feed rations and additives for estimating reductions in enteric methane.
Data Output • Full GHG budget for entire farm, with breakdown by
individual fields, livestock and energy use (and production) categories;
• System will also produce outputs as GHG intensity (i.e., emissions per unit product yield); and
• Uncertainty: Similar to COMET‐VR but with Monte‐Carlo simulations as part of uncertainty estimates for soil N2O.
More Info: http://cometfarm.nrel.colostate.edu/

Contract # GS‐23F‐8182H, Report of GHG Tools: Calculators 22 | P a g e
Cool Farm Tool
General Information• Origin: UK • Authors/Developers: John Hillier and Pete Smith from the
University of Aberdeen, and Christoph Walter et al. from Unilever
• Year Published: 2010 • Tool Type: GHG emissions calculator • Interface: Open‐source Excel document
• Assessment level: Farm level • Geographical coverage: Global • Practices covered: Cropland (grass, grass/clover, legume,
wetland rice, other crops); Livestock (cows, pigs, buffalo, sheep, goat)
• GHG covered: CO2, N2O, CH4
DescriptionCool Farm Tool assesses GHG emissions and soil carbon sequestration changes in response to management activities.
Main Purpose of Tool• The tool is designed for farmers, supply chain managers and companies interested in quantifying their agricultural carbon footprint and finding practical ways of reducing it.
Current Applications• Tool will be used by Unilever as part of its Metric Reporting requirements of its Sustainable Agriculture Code; • The tool will also be used in a multi‐company project on agricultural climate mitigation coordinated by the Sustainable Food Lab, including several multinational companies (e.g., Pepsico). For list of projects: http://sustainablefoodlab.org/index.php?option=com_content&view=article&id=117:gaca‐home&catid=18&Itemid=53
Targeted UsersFarmers, supply chain managers and companies
General MethodologyLife Cycle Inventory emission factors, empirical model, IPCC Tier 1 and 2, and published equations • Embodied GHG emissions in fertilizers: Ecoinvent LCI (www.ecoinvent.ch); • N2O emissions from fertilizer use: multivariate empirical model of Bouwman et al. (2002) ‐ which is based on a global dataset of over 800 sites;
• NO and NH3 to N2O conversion factors cf. IPCC Tier 1 EF; • N2O from N leaching: IPCC; • CO2 emissions from liming and Urea: IPCC Tier 1 EF; • Soil CO2 emissions from land management changes: IPCC Tier 1 and Ogle et al. (2005); • Soil C changes from organic amendments: equations cf. Smith et al., (1997, based on medium/long term data from EU15 countries);
• Pesticides: 1 coefficient based on Audsley (1997); • Livestock: IPCC Tier 1 or Tier 2; • Fuel use: model based on ASABE (2006) technical data; and • Electricity: EF per country.
Underlying Databases/ Data Sources• None specified.
Data Input by User • Crop management details (e.g., fertilizer type, amount; land use/tillage changes in the past 20 years; etc.);
• Livestock management details (e.g., animal type, numbers; manure management; dietary information); and
• Energy use on field and for primary processing.
Data Output • CO2 eq emissions for the entire farm, split up by source and
by GHG. Output is expressed as total emissions, emissions per unit of area, and emissions per unit finished product; and
• Activity data for energy use is also presented.
More Info: http://www.unilever.com/aboutus/supplier/sustainablesourcing/tools/ Further reading: http://www.greenbiz.com/blog/2010/11/02scaling‐up‐unilevers‐farm‐tool‐measure‐global‐ag‐emissions See also: Bowman et al., (2002); Ogle et al. (2005); Smith et al. (1997); ASABE (2006); Audsley, E., (1997); Lal, (2004).

Contract # GS‐23F‐8182H, Report of GHG Tools: Calculators 23 | P a g e
CTCC The Center for Urban Forest Research Tree Carbon Calculator
General Information• Origin: U.S. • Authors/Developers: USDA Forest Service, Pacific
Southwest Research Station, the Center for Urban Forest Research (CUFR). Developed in partnership with the California Department of Forestry and Fire Protection.
• Year Published: 2007 • Tool Type: C stocks and offset calculator
• Interface: Downloadable software that is programmed in an Excel spreadsheet.
• Assessment level: Individual tree • Geographical coverage: U.S. • Practices covered: Urban trees • GHG covered: CO2
DescriptionThe CTCC provides quantitative data on CO2 sequestration and building heating/cooling energy savings provided by individual trees. CTCC outputs can be used to estimate GHG benefits for existing trees or to forecast future benefits. It is the only tool approved by the California Climate Action Reserve's Urban Forest Project Reporting Protocol for quantifying carbon dioxide sequestration from GHG tree planting projects.
Main Purpose of Tool• To calculate carbon dioxide sequestration and building energy savings provided by individual trees; and • The tool is intended as "proof of concept" software that is in the testing phase. It is provided "as is" without warranty of any kind.
Current Applications• Currently in testing phase. Potential applications are for estimating benefits of urban trees, projecting benefits of planting projects.
Targeted UsersNone specified.
General MethodologyEquations, constructed based on measurements in 6 reference cities for 20‐22 most abundant species in each city (see help file from download). • Tree size and growth data are developed from samples of about 650‐1000 street trees representing approximately 20 predominant species in each of the sixteen regional reference cities;
• Biomass equations, many derived from volumetric measurements of open‐grown city trees, are used to derive total CO2 stored and sequestered; and
• To determine effects of tree shade on building energy performance, over 12,000 simulations were conducted for each reference city using different combinations of tree sizes, locations, and building vintages. Regional emission factors for electricity and fuel use are used (literature).
Underlying Databases/ Data Sources• None specified.
Data Input by User • U.S. climate region; • Tree's size (dbh) or age as well as tree condition (dead or alive); and
• Specific information for energy conservation (azimuth, distance to building, building info, heating and AC equipment).
Data Output • kg CO2 sequestered per tree per year, and energy savings
(air conditioning (kWh/tree) and heating (MBtu or GJ/tree)).
• Output categories: o C stored in the tree; o CO2 sequestered during the past year; o Dry weight of aboveground biomass that could be
utilized if the tree was removed; o Annual energy savings in kWh of electricity and MBtu
of heating per tree (when trees are strategically located to shade buildings and reduce energy consumed for heating and cooling); and
o CO2 equivalents of these energy savings. • Uncertainty: based on fixed errors per error source
category (emission factors, interpolation, building energy simulation).
More Info: http://www.fs.fed.us/ccrc/tools/ctcc.shtmlhttp://www.fs.fed.us/ccrc/topics/urban‐forests/ctcc/

Contract # GS‐23F‐8182H, Report of GHG Tools: Calculators 24 | P a g e
DNDC calculator U.S. Cropland Greenhouse Gas Calculator
General Information• Origin: U.S. • Authors/Developers: University of New Hampshire • Year Published: Not specified • Tool Type: GHG emission calculator • Interface: Software program, which user has to install first
• Assessment level: Site level • Geographical coverage: U.S. • Practices covered: Cropland only • GHG covered: CO2, N2O, CH4
DescriptionA decision support system for quantifying impacts of management alternatives on greenhouse gas emissions from agro‐ecosystem in the U.S., based on the DNDC model (DeNitrification‐DeComposition).
Main Purpose of Tool• To quantify all GHG emissions from cropland soils in the U.S.
Current Applications• The model has been widely applied to estimate N2O emissions from agricultural fields and dairy farms, CH4 emissions from rice fields, and soil organic carbon dynamics.
Targeted UsersNone specified.
General MethodologyDNDC model simulations to compute all GHG emissions (CO2, N2O and CH4). DNDC integrates ecological drivers in three sub‐models to generate their collective effects on soil temperature, moisture, pH, Eh, and substrate concentrations. The links between these soil environmental variables to production and consumption rates of trace gases in DNDC are set up based on either the basic physical, chemical, or biological laws, or equations obtained from experiments under controlled conditions so that the effect of each soil variable can be distinguished.
Underlying Databases/ Data Sources• None specified.
Data Input by User • Daily temperature and precipitation; • Soil bulk density, texture, organic carbon content, pH; and • Farming practices (e.g., crop type and rotation, tillage, fertilization, manure amendment, irrigation, flooding, grazing, and weeding).
Data Output • Daily dynamics in the simulation run tab; • Annual results per hectare in the results tab:
Crop production (kg C/ha/year); N balance (kg N/ha/yr); C balance (kg C/ha/yr); Water balance (mm/yr); and GHG emissions (kg CO2eq/ha/yr).
• Uncertainty: user has the option to choose between Monte Carlo method or Most Sensitive Factor method (Li et al., 2004; Li et al., 1996). For the latter, DNDC runs twice for each cropping system in each grid with two extreme values of the most sensitive driving factors for the concerned C or N fluxes or pools.
More Info: http://www.dndc.sr.unh.edu/Models.htmlSee also: Li et al., (1996); Li, (2000); Li et al., (2004).

Contract # GS‐23F‐8182H, Report of GHG Tools: Calculators 25 | P a g e
FarmGAS FarmGAS
General Information• Origin: Australia • Authors/Developers: Australian Farm Institute • Year Published: 2009 • Tool Type: GHG emissions calculator • Interface: Web‐based
• Assessment level: Farm (multi‐enterprise) level • Geographical coverage: Australia • Practices covered:
o Extensive cropping systems (up to 4 dryland crops and 2 irrigated crops can be included)
o Extensive grazing systems (Beef and sheep production)
o Intensive livestock (beef feedlot and piggery ‐ no dairy)
o Horticulture (one perennial crop) o Farm trees (environmental plantings)
• GHG covered: CO2, CH4, N2O Description
FarmGAS is an online GHG calculator tool allowing farmers to estimate their farm’s annual GHG emissions, both at the individual enterprise activity level and for the farm as a whole, and to examine the GHG and financial impacts that different greenhouse mitigation options may have on the farm business profitability.
Main Purpose of Tool• FarmGAS is primarily a decision support tool, allowing farmers to gain an understanding of both the financial and GHG emissions implications of farm management decisions.
Current Applications• None specified.
Targeted UsersFarm business managers.
General MethodologyIPCC Tier 1&2 • FarmGAS uses the calculations and emission factors described in the 'Australian Methodology for the Estimation of GHG Emissions and Sinks 2006: Agriculture'. This uses a combination of country‐specific and IPCC methodologies and emission factors, and is used by the Department of Climate Change in determining Australia's National GHG Inventory (2008) ‐ see www.climatechange.gov.au.
Underlying Databases/ Data Sources• Australian Bureau of Statistics • Australian Lot Feeders Association • Dairy Australia
• WA Department of Land Information • Published data
Data Input by User • Location of farm (State in Australia); • Type of enterprises included in farm; • Area (total and per system); • Crop yield; • Fertilizer applied, type, N content; • Area burned each year; • Livestock specific information (e.g., number of cows, bulls, mortality);
• Option to provide financial data for farming business (to calculate gross margins budget); and
• Option to provide carbon price.
Data Output • GHG emissions are expressed in CO2 equivalent tonnes; • The total farm emissions are given, as well as the emissions
GHG (CH4 and N2O), emission source, and enterprise and without and with mitigation measures taken;
• Net emissions are calculated by subtracting the C sequestration by trees; and
• The cost of the farm's emissions is also calculated by using a chosen carbon price by the user.
More Info: http://new.dpi.vic.gov.au/agriculture/climate/ctan/on‐farm‐greenhouse‐gas‐accounting‐tools http://farmgas.farminstitute.org.au/publicpages/AFIPublic.aspx?ReturnUrl=/default.aspx

Contract # GS‐23F‐8182H, Report of GHG Tools: Calculators 26 | P a g e
Farming Enterprise GHG Calculator
General Information• Origin: Queensland, Australia • Authors/Developers: Queensland University of Technology
Institute for Sustainable Resources (ISR) • Year Published: Not specified • Tool Type: GHG emissions calculator • Interface: Web‐based
• Assessment level: Farm level • Geographical coverage: Queensland, Australia • Practices covered: Cropland (irrigated and dryland);
Pasture; Livestock • GHG covered: CO2, N2O, CH4
DescriptionA web‐based GHG emissions calculator for estimating farm‐level GHG emissions in Queensland, NE Australia.
Main Purpose of Tool• To allow farmers and graziers determine how much greenhouse gas their enterprises create and how much they could be
reduced if they changed their farming practices. Current Applications
• The calculator is being used by farmers in Queensland to determine how much greenhouse gas their enterprises create and how much they could be reduced if they changed any of their farming practices. The calculator has also been adapted by the Smithsonian National Museum of Natural History, in Washington D.C., for an education tool teaching children about soils, farming and greenhouse gas emissions (http://forces.si.edu/soils/interactive/web/index.html). ISR is also working with Michigan State University to help it adapt the calculator for use by farmers in the American mid‐west.
Targeted UsersFarmers, Estate/Facility managers.
General MethodologyCombination of dynamic model simulations and IPCC emission factors. • Soil C emissions (0‐30 cm) are estimated using the SOCRATES soil C model; • Animal emissions are based on the simplified IPCC calculations; and • Fuel, nitrogen fertilizer and ancillary N2O emissions (dung, urine) are estimated using the Australian National Greenhouse Gas Inventory methodology.
Underlying Databases/ Data Sources• None specified.
Data Input by User • Location in Queensland; • Fuel use; • Dryland cropland area; • Irrigated cropland area; • Pasture area; • Fertilizer applied (N); and • Beef, dairy, sheep numbers.
Data Output • Results are expressed as tonnes CO2eq per year per source
category: o Fuel; o Soil; o Fertilizer; o Animals; and o Other N2O.
More Info: http://www.isr.qut.edu.au/greenhouse/index.jsp

Contract # GS‐23F‐8182H, Report of GHG Tools: Calculators 27 | P a g e
Fieldprint Calculator Fieldprint Calculator
General Information• Origin: U.S. • Authors/Developers: Field To Market, The Keystone
Alliance for Sustainable Agriculture (an initiative that joins producers, agribusinesses, food and retail companies, and conservation organizations seeking to develop a supply‐chain system for agricultural sustainability)
• Year Published: 2009 • Tool Type: GHG emission calculator • Interface: Web‐based
• Assessment level: Farm level • Geographical coverage: U.S. • Practices covered: Cropland • GHG covered: CO2, N2O
DescriptionThe Fieldprint Calculator is a simple tool designed to help farmers begin to look at how their crop production operations impact the sustainability of their farm. It provides a fieldprint for assessing the sustainability of a farm in the resource areas of land use, energy use, climate impact, soil loss, and water use (irrigation).
Main Purpose of Tool• To be an educational resource to get growers thinking about their operations and how their practices relate to natural resource management and sustainability. It is not designed to provide a precise evaluation, but allows benchmarking performance of a farm against state and national averages; and
• The Fieldprint Calculator is designed to explore differing scenarios and combinations of on‐farm management decisions, which may help improve natural resource management and, ultimately, an operation’s efficiency and financial return.
Current Applications• Different groups are planning to use the Fieldprint Calculator to analyze and assess how the management decisions of farmers in a region affect land use, energy use, water use, greenhouse gas emissions, and soil loss. (see: http://www.fieldtomarket.org/news/2011/spring‐farm‐tour‐kicks‐off/#more‐198).
Targeted UsersFarmers.
General MethodologyMethod based on West and Marland (2002)‐ using fixed emission factors and soil C sequestration rates for no‐tillage. • Fixed calculations, emission factors and sequestration rates, based on West and Marland (2002); • Method using an average sequestration factor for no‐tillage of 337 Kg C/hectare, and an EF of 1.33 percent of all fertilizer N applied and 1.79 percent of N from manure to estimate N2O emissions (Tier 1). Method uses assumed N content values for different fertilizers/manure sources; and
• Emission factors for fuel combustion are also based on West and Marland (2002). Underlying Databases/ Data Sources
• State and national data (which is used in the tool to benchmark the fieldprints against) obtained from West and Marland (2002) and USDA NASS
Data Input by User • Location (State); • Area; • Crop; • Parameters to determine soil loss (slope, soil texture, protection measures, observed intensity of erosion);
• Parameters to determine water use (water use for irrigation); and
• Parameters to determine energy use (irrigation system, fertilizer application, manure application, other applicants, tillage).
• NOTE: User can only select 4 crops: corn, soybean, wheat, and cotton
Data Output • A fieldprint is determined by dividing the resource
use/impact by the crop productivity or yield (e.g., Acres/bu for land‐use; BTU/bu for energy use; lb CO2e/bu for climate impact);
• The fieldprints are benchmarked vs. state and national averages by expressing them as indices on a scale from 0 to 100 with 0 representing more sustainable outcomes and 100 representing less sustainable outcomes for a particular resource area (e.g., climate);
• Cost of fuel for the different practices (e.g., tillage, fertilizer application, irrigation) is presented ($/bu);
• No uncertainty included. More Info: http://www.fieldtomarket.org/fieldprint‐calculator/http://keystone.org/files/file/SPP/environment/field‐to‐market/Field‐to‐Market_Environmental‐Indicator_First_Report_With_Appendices_01122009.pdf See also: Keystone Alliance (2009); West and Marland (2002).

Contract # GS‐23F‐8182H, Report of GHG Tools: Calculators 28 | P a g e
FSGGEC Farm Systems Greenhouse Gas Emissions Calculator
General Information• Origin: U.S. • Authors/Developers: Claire McSwiney, Sven Bohm, and
Phil Robertson of the W.K. Kellogg Biological Station, Michigan State University, and Peter Grace, Queensland University of Technology
• Year Published: 2010 • Tool Type: GHG emissions calculator • Interface: Web‐based
• Assessment level: Farm level • Geographical coverage: U.S., but input parameters can be
adjusted to make results appropriate for temperate region soils worldwide
• Practices covered: Cropland only • GHG covered: CO2, N2O
DescriptionThis web‐based tool linked to the SOCRATES soil carbon process model, provides a simple introduction to the concepts and magnitudes of GHG emissions associated with crop management. The calculator demonstrates how cropping systems and management choices affect GHG emissions in field crops.
Main Purpose of Tool• To provide users a general understanding of how different agricultural management practices might be adjusted to minimize the greenhouse gas impact of field crops and to maximize opportunities to participate in emerging greenhouse gas markets.
Current Applications• Used in research studies (e.g., McSwiney et al., 2010).
Targeted UsersStudents, producers, educators, offset aggregators and other stakeholders (that require easy to use).
General MethodologyCombination of process model simulations (SOCRATES), empirical models and IPCC emission factors • See McSwiney et al. (2010) for details; • Based on the SOCRATES model for soil carbon change (Grace et al., 2006b) and on IPCC GHG inventory methods for other GHG sources;
• For N2O, user can choose between IPCC Tier1 method (default emission factors) or Tier2 method (specific emission factors) • For fuel and embedded fertilizer emissions, EF approach (Robertson et al., 2000); and • No uncertainty included.
Underlying Databases/ Data Sources• Weather data (NOAA, 2009) • Soils data from USDA‐NRCS (Grace et al., 2006b) • Crop yields from county level averages
• N fertilizer rates from mean rates for the North Central Region (USDA ERS, 2008), except for switchgrass (Schmer et al., 2008)
Data Input by User • Location (State, county) ‐ on U.S. map; • Crop management info per year and per scenario (crops, yields, tillage practices, N fertilizer);
• Tool gives default yield and N fertilizer levels, but user can change these; and
• Tool gives default climate (temperature, precipitation) and soil properties (%clay, % SOC), but user can change these, specific to his site.
• User can only select 6 crops: corn, soybean, winter wheat, switchgrass, corn silage, oats.
Data Output • Outputs are generated for baseline and different scenarios
(choice of user); • Results are shown "as you go", meaning, with every change
you make to your input data, you see the immediate impact on the results; and
• Tool generates GHG emissions as Greenhouse Gas Costs, expressed as CO2 equivalents (MT/ha/year).
More Info: http://surf.kbs.msu.edu/ghgcalculator/See McSwiney et al. (2010); Grace et al. (2006b); Robertson et al. (2000).

Contract # GS‐23F‐8182H, Report of GHG Tools: Calculators 29 | P a g e
FVSCarbCalc
Stand Level Carbon Reporting Using the Forest Vegetation Simulator (FVS)
General Information• Origin: U.S. • Authors/Developers: USDA, Forest Service • Year Published: 2006 • Tool Type: C stocks calculator • Interface: "Suppose" ‐ this is the graphical user interface
for the Forest Vegetation Simulator
• Assessment level: Forest stand or inventory plot • Geographical coverage: U.S. • Practices covered: Forest • GHG covered: Only changes in annual carbon stocks (CO2
emissions can be calculated by user)
DescriptionThis tool is part of the Fire and Fuels Extension (FFE) of the FVS and creates reports on stand level carbon stocks and carbon in harvested products estimates for U.S. forest stands.
Main Purpose of Tool• To provide natural resource managers with amounts of carbon being sequestered by their forest and the impact of various management activities on the amount of carbon sequestered.
Current Applications• Already used in the U.S. for forest carbon inventories (e.g., Hoover and Rebain, 2008).
Targeted UsersForest managers familiar with FVS.
General MethodologyAll methodologies are consistent with U.S. DOE 1605(b) VR calculation and reporting guidelines and the Intergovernmental Panel on Climate Change (IPCC) Good Practice Guidance for Land Use, Land Use Change, and Forestry (IPCC, 2003). • Aboveground dead biomass is always computed using the existing FFE algorithms; • Aboveground live components can be calculated either with the existing FFE biomass algorithms, orAlternatively with a set of allometric equations described by Jenkins et al. (2003);
• Belowground components are also calculated using Jenkins equations. The root decay rate is 0.0425 by default (Ludovici et al., 2002) but can be adjusted by the model user;
• Carbon in the living and dead biomass is converted to units of carbon by multiplying by 0.5 (IPCC, 2003); • Litter and duff biomass are converted using a multiplier of 0.37 (Smith and Heath, 2002); and • Carbon in harvested merchantable biomass is allocated following the methods of Smith et al. (2006).
Underlying Databases/ Data Sources• Can use existing forest inventory data (e.g., FIA data or data stored in the Forest Service Field Sampled Vegetation (FSVeg) database) to describe initial stand conditions
Data Input by User • Forest stand or inventory plot specific data files (see http://www.fs.fed.us/fmsc/fvs/data/fileformat.shtml#fvs).
Data Output • Results are expressed in tons C/acre or metric tons C per
hectare or acre. • Stand C stocks are broken down by:
o Total aboveground live; o Merchantable aboveground live; o Belowground live; o Belowground dead; o Standing dead; o Forest down dead wood; o Forest floor: litter and duff; o Herbs and shrubs; o Total stand carbon; o Total removed carbon; and o Carbon released from fire: carbon in fuel consumed
by simulated wildfires, prescribed burns, and pile‐burns.
More Info: http://nrs.fs.fed.us/carbon/tools/#cval http://www.fs.fed.us/fmsc/fvs/ See Reinhardt et al. (2007); Hoover and Rebain (2008); Smith et al. (2006); Jenkins et al. (2003).

Contract # GS‐23F‐8182H, Report of GHG Tools: Calculators 30 | P a g e
Greenhouse in Agriculture Tools Grains Greenhouse Accounting Framework V4
General Information• Origin: Australia • Authors/Developers: University of Melbourne (Australia) • Year Published: 2010 • Tool Type: GHG emissions calculator • Interface: Excel document
• Assessment level: Farm level • Geographical coverage: Australia • Practices covered: Cropland (fertilisation, burning,
irrigation); Tree plantings • GHG covered: N2O, CH4; C sequestered by trees
DescriptionExcel‐based farm‐level GHG emissions calculator which estimates GHG emissions from grain‐producing systems based on Australia's NGGI methodology.
Main Purpose of Tool• To help farmers better understand the impact of their farming practices on the emission of greenhouse gases.
Current Applications• None specified
Targeted UsersFarmers
General MethodologyAustralian NGGI approach ‐ combination of Tier 1 and Tier 2 method and IPCC and country‐specific emission factors. See methodology described in the National Inventory Report (2008, Chapter 6.6): • N2O from synthetic fertilizer: country‐specific, based on literature; • N2O from manure addition: Bouwman et al. (2002); • N2O emissions from N‐fixing crops: IPCC Tier 1 EF; • N2O emissions from crop residue return: IPCC Tier 1 EF; and • N2O and CH4 from burning: Hurst et al. (1994a; 1994b).
Underlying Databases/ Data Sources• See National Inventory Report (2008, p. 192)
Data Input by User • State; • Rainfall; • Type of crop; type of trees planted; • Area of cropland; area of trees planted; • Average yield; • % burned land; • Irrigation (y/n); and • N fertilizer addition (type, amount).
Data Output • Emissions in tonnes CO2eq, split up per source category
and per crop type. Emissions are also presented as a percentage of the total farm emissions.
More Info: http://www.greenhouse.unimelb.edu.au/Tools.htmSee National Inventory Report‐ Australia (2008).

Contract # GS‐23F‐8182H, Report of GHG Tools: Calculators 31 | P a g e
Greenhouse in Agriculture tools Dairy Greenhouse Accounting Framework V4
General Information• Origin: Australia • Authors/Developers: University of Melbourne (Australia) • Year Published: 2002 • Tool Type: GHG emissions calculator • Interface: Excel document
• Assessment level: Farm level • Geographical coverage: Australia • Practices covered: Dairy farms, with land under pasture,
cropland and tree plantings • GHG covered: CO2, N2O, CH4; C sequestered by trees
DescriptionExcel‐based farm‐level GHG emissions calculator which estimates GHG emissions from dairy farms based on Australia's NGGI methodology.
Main Purpose of Tool• To create awareness of the various sources of GHG emissions on dairy farms, to stimulate thinking and action aimed at reducing these emissions while further improving farming efficiency.
Current Applications• None specified.
Targeted UsersFarmers.
General MethodologyAustralian NGGI approach ‐ combination of Tier 2 and country‐specific method and IPCC and country‐specific EF. See methodology described in the National Inventory Report (2008, Chapter 6.3 and 6.4): • CH4 from enteric fermentation: country specific methodologies (Minson and McDonald, 1987; Blaxter and Clapperton, 1965);
• CH4 production from the manure of dairy cattle: modified IPCC default EF for Australia; and • N2O from manure: country‐specific algorithms.
Underlying Databases/ Data Sources• See National Inventory Report (2008, p. 192)
Data Input by User • State; • Rainfall; • Herd, feed, and milk production information; • Area of cropland, improved pasture land, area of trees planted;
• N fertilizer addition (amount); • Energy consumption; and • Tree type planted.
Data Output • Emissions in tonnes CO2eq, split up per source category
and per GHG. Emissions are also presented as a percentage of the total farm emissions.
More Info: http://www.greenhouse.unimelb.edu.au/Tools.htmSee National Inventory Report‐ Australia (2008).

Contract # GS‐23F‐8182H, Report of GHG Tools: Calculators 32 | P a g e
Greenhouse in Agriculture tools Beef Greenhouse Accounting Framework V6
General Information• Origin: Australia • Authors/Developers: University of Melbourne (Australia) • Year Published: 2002 • Tool Type: GHG emissions calculator • Interface: Excel document
• Assessment level: Farm level • Geographical coverage: Australia • Practices covered: Grazing farms, with land under pasture,
cropland and tree plantings • GHG covered: CO2, N2O, CH4; C sequestered by trees
DescriptionExcel‐based farm‐level GHG emissions calculator which estimates GHG emissions from grazing farms based on Australia's NGGI methodology.
Main Purpose of Tool• To facilitate greenhouse gas emission accounting at a farm scale, identify the major sources of emission and explore the impact of changed management options.
Current Applications• None specified.
Targeted UsersFarmers.
General MethodologyAustralian NGGI approach ‐ combination of Tier 2 and country‐specific method and IPCC and country‐specific EF. See methodology described in the National Inventory Report (2008, Chapter 6.3 and 6.4): • CH4 from enteric fermentation: country specific methodologies (Minson and McDonald, 1987; Blaxter and Clapperton, 1965);
• CH4 from manure: Country‐specific algorithms (González‐Avalos and Ruiz‐Suárez, 2001); and • N2O from manure: country‐specific algorithms.
Underlying Databases/ Data Sources• See National Inventory Report (2008, p. 192)
Data Input by User • State; • Rainfall; • Beef herd and feed information; • Area of cropland, improved pasture land, area of trees planted;
• N fertilizer addition (amount); • Energy consumption; and • Tree type planted.
Data Output • Emissions in tonnes CO2eq, split up per source category
and per GHG. Emissions are also presented as a percentage of the total farm emissions.
More Info: http://www.greenhouse.unimelb.edu.au/Tools.htmSee National Inventory Report‐ Australia (2008).

Contract # GS‐23F‐8182H, Report of GHG Tools: Calculators 33 | P a g e
Greenhouse in Agriculture tools Sheep Greenhouse Accounting Framework V2
General Information• Origin: Australia • Authors/Developers: University of Melbourne (Australia) • Year Published: 2008 • Tool Type: GHG emissions calculator • Interface: Excel document
• Assessment level: Farm level • Geographical coverage: Australia • Practices covered: Sheep farms, with land under pasture,
cropland and tree plantings • GHG covered: CO2, N2O, CH4; C sequestered by tree; C
sequestered by wool Description
Excel‐based farm‐level GHG emissions calculator which estimates GHG emissions from sheep farms based on Australia's NGGI methodology.
Main Purpose of Tool• To facilitate greenhouse gas emission accounting at a farm scale, identify the major sources of emission and explore the impact of changed management options.
Current Applications• None specified.
Targeted UsersFarmers.
General MethodologyAustralian NGGI approach ‐ combination of Tier 2 and country‐specific method and IPCC and country‐specific EF. See methodology described in the National Inventory Report (2008, Chapter 6.3 and 6.4): • CH4 from enteric fermentation: country specific methodologies (Howden et al. (1994)); • CH4 from manure: Country‐specific algorithms (González‐Avalos and Ruiz‐Suárez, 2001); and • N2O from manure: country‐specific algorithms.
Underlying Databases/ Data Sources• See National Inventory Report (2008, p. 192)
Data Input by User • State; • Rainfall; • Sheep flock and feed information; • Area of cropland, improved pasture land, area of trees planted;
• N fertilizer addition (amount); • Energy consumption; • Tree type planted; and • Wool production and C content.
Data Output • Emissions in tonnes CO2eq, split up per source category
and per GHG. Emissions are also presented as a percentage of the total farm emissions.
More Info: http://www.greenhouse.unimelb.edu.au/Tools.htmSee National Inventory Report‐ Australia (2008).

Contract # GS‐23F‐8182H, Report of GHG Tools: Calculators 34 | P a g e
HGCA Biofuel GHG Calculator
General Information• Origin: UK • Authors/Developers: Developed by Imperial College, UK.
(Biomass Energy Group), commissioned by Home Grown Cereals Association (HGCA): the cereals and oilseeds division of the Agricultural and Horticulture Development Board (AHDB) in the UK.
• Year Published: 2005 • Tool Type: GHG emissions calculator • Interface: Web‐based
• Assessment level: Product level • Geographical coverage: UK • Practices covered: Rapeseed and wheat farms for
biodiesel and bioethanol production • GHG covered: CO2, N2O, CH4
DescriptionThis tool calculates the life‐cycle greenhouse gas emissions resulting from production and supply of biofuels in the United Kingdom. It also compares these greenhouse gas emissions with those generated from production of equivalent quantities of the fossil‐based transport fuels.
Main Purpose of Tool• To provide the basis for a credible calculation of the GHG emissions arising from UK‐derived bioethanol and biodiesel. The tool is also designed to allow farmers and bioethanol and biodiesel suppliers to see how changes made in management practices or inputs could affect the overall GHG emissions of the resulting biofuel production.
Current Applications• None specified.
Targeted UsersBioethanol and biodiesel farmers/producers/suppliers, investors, NGOs, academics, policy makers.
General Methodology• Well‐to‐tank LCA approach; • Default emission factors from published studies; • The emission factors used per source category are those adopted by the Low Carbon Vehicle Partnership study (LCVP, 2004). Similarly, the tool uses the LCVP emission factors and methodology for calculations of GHG credits;
• For embedded emissions in fertilizer, pesticide and seeds, the LCVP GHG emission factors are derived from Elsayed et al. (2003) and Mortimer et al. (2004);
• For N2O emissions from fertilizer‐N addition: default EF related to amount of N applied; and • Transport by rail, sea and air: EF from DEFRA (2005) company GHG reporting guidelines.
Underlying Databases/ Data Sources• None specified.
Data Input by User • Ethanol or biodiesel; • N fertilizer, manure and other farming inputs (seed, lime, pesticide, diesel);
• Grain and straw yields; • Grain drying information (equipment, energy use, etc.); • Transport modes and distances; and • Processing info (energy use, co‐product yields and utilization).
Data Output • kg CO2 eq per product unit (ton, liter, petrol‐equivalent
liter, GJ) ‐ so rather a product carbon footprint (LCA approach); and
• % reduction vs. petrol fuel emissions.
More Info: http://www.hgca.com/bioFuelCalc/ http://www.hgca.com/content.output/2135/2135/Resources/Tools/Bioethanol%20Greenhouse%20Gas%20Calculator.mspx See LCVP (2004); DEFRA (2005).

Contract # GS‐23F‐8182H, Report of GHG Tools: Calculators 35 | P a g e
HOLOS Holos Farm Greenhouse Gas Calculator
General Information• Origin: Canada • Authors/Developers: Agriculture and Agri‐Food Canada
(AAFC) • Year Published: 2008 • Tool Type: GHG emissions calculator • Interface: Software program
• Assessment level: Farm level • Geographical coverage: Canada • Practices covered: Cropland; Grassland; Livestock (cow‐
beef and dairy, calf, sheep, swine, poultry, other animals); Lineal tree plantings; (Note: includes organic soils)
• GHG covered: CO2, N2O, CH4 Description
Holos is a whole‐farm modelling software program that estimates greenhouse gas (GHG) emissions based on information entered for individual farms and using primarily IPCC (IPCC, 2006)(2006) methodology. It replaces the older version (GHGFarm). Holos also provides a set of possible mitigation options unique to each farm and lets users explore the impact of these options.
Main Purpose of Tool• The main purpose of Holos is to envision and test possible ways of reducing GHG emissions from farms. Holos, is designed primarily as an exploratory tool, rather than as an accounting or inventory tool. It is intended to look into the future and ask ‘what if?’, rather than looking at the past and asking ‘what were my emissions?’
Current Applications• Already used to estimate whole‐farm GHG emissions from beef production in western Canada (see Beauchemin et al., 2010).
Targeted UsersFarmers.
General MethodologyAlgorithms based on IPCC methods, but adjusted to reflect Canadian, and farm‐site specific conditions. Soil C factors were derived from process‐based model (CENTURY). All equations are documented in the HOLOS methodology document. • The methodology for calculating soil N2O emissions is based on that for the National Inventory Report‐ Canada (2007) specifically for Canada (Rochette et al., 2008a), and adapted to account for site conditions;
• Holos uses the methodology developed for the National Inventory Report (Canadian Agriculture Monitoring Accounting and Reporting System (CanAG‐MARS), (McConkey et al., 2007) to estimate CO2 emissions or removal from soil carbon change. The various carbon factors associated with each situation were derived using the CENTURY model;
• GHG emissions from the cultivation of organic soil are calculated based on the method of IPCC (2006); • Livestock and manure emissions are calculated following IPCC (2006) methods. However, for swine, Holos uses values provided in the Greenhouse Gas System Pork Protocol (PTWG, 2006) for feed intake, protein content of feed, and volatile solid excretion; and
• Tree C accumulation is calculated based on Kort and Turnock (1998). Underlying Databases/ Data Sources
• Holos ecodistrict map (Each ecodistrict is linked to default values for soil type and texture, precipitation, potential evapotranspiration and land topography data)
• Soil ecodistrict shape files, soil data and climate data were obtained from the Canadian Soil Information System (CanSIS), National Ecological Framework (Marshall et al., 1999)
Data Input by User • Area of cropland, irrigated land, grassland, grazed land, feedlot, tree planting;
• Management system (tillage, herbicide and fertilizer use, irrigation); and
• Livestock data (e.g., type of animals and numbers, grazing, diet, manure handling).
Data Output • CO2eq emissions for the entire farm, split up by source and
GHG. Results are given for each scenario. Output is expressed as total farm emissions.
• A rough estimate of uncertainty was developed, based on expert opinion, for each of the categories of emission given in the Holos output. These estimates are best viewed as crude markers, rather than as definitive assessments, provided merely to alert users especially to the areas of potentially high uncertainty. A weighted measures approach was used to derive the overall uncertainty for the estimate of net GHG emissions from a specified set of farm conditions.
More Info: http://www4.agr.gc.ca/AAFC‐AAC/display‐afficher.do?id=1226606460726&lang=eng See also Little et al. (2008); Rochette et al. (2008b); Janzen et al. (2006); Kort and Turnock (1998); McConkey et al. (2007); PTWG (2006); Beauchemin et al. (2010).

Contract # GS‐23F‐8182H, Report of GHG Tools: Calculators 36 | P a g e
iTree Canopy General Information
• Origin: U.S. • Authors/Developers: USDA Forest Service (David J.
Nowak, Jeffrey T. Walton and Eric J. Greenfield) • Year Published: 2006 • Tool Type: land cover calculator • Interface: Online tool
• Assessment level: Different levels: a single street tree, a neighborhood, local park, city, county or entire state can be analyzed.
• Geographical coverage: Global • Practices covered: Allows any cover class to be included
in the tool (e.g., trees, grass, building) • GHG covered: none ‐ the model calculates land cover
(tree cover). But this could be used in GHG accounting models where this information is required to estimate C stocks in tree biomass.
Descriptioni‐Tree Canopy offers a quick and easy way to produce a statistically valid estimate of land cover types (e.g., tree cover) using aerial images available in Google Maps. The data can be used by urban forest managers to estimate tree canopy cover, set canopy goals, and track success; and to estimate inputs for use in other models where land cover data are needed.
Main Purpose of Tool• To help users assess and manage the structure, function, and value of urban tree populations and to strengthen urban forest management and advocacy efforts.
Current Applications• i‐Tree canopy is currently used in municipal projects.
Targeted UsersConsultants, non‐profits and universities.
General MethodologyPhoto‐interpreted estimation of tree cover using Google imagery. • This tool randomly lays points (number determined by the user) onto Google Earth imagery and the user then classifies what cover class each point falls upon. From this classification of points, a statistical estimate of the amount or percent cover in each cover class can be calculated along with an estimate of uncertainty of the estimate (standard error (SE));
• The accuracy of the analysis depends upon the ability of the user to correctly classify each point into its correct class. Thus the classes that are chosen for analysis must be able to be interpreted from an aerial image; and
• The tool calculates an uncertainty estimate (standard error) around the estimated percent cover. Underlying Databases/ Data Sources
• NLCD imagery • Google Earth
Data Input by User • Requires local field inventory data (a sample or complete) ‐ location, year, plot info, etc.; and
• Data collection can be done by PDA or paper forms.
Data Output • i‐Tree Canopy generates results (% cover) for each cover
class.
More Info: http://www.itreetools.org/index.php

Contract # GS‐23F‐8182H, Report of GHG Tools: Calculators 37 | P a g e
International Wine Carbon Calculator
General Information• Origin: Australia, New Zealand, California, S. Africa • Authors/Developers: Provisor Pty Ltd, contracted by The
Wine Institute of California, New Zealand Winegrowers, Integrated Production of Wine South Africa and the Winemakers Federation of Australia
• Year Published: 2008 • Tool Type: GHG emissions calculator • Interface: Excel document
• Assessment level: Enterprise and/or facility level • Geographical coverage: International • Practices covered: Vineyards • GHG covered: CO2, N2O
DescriptionExcel‐based enterprise‐level GHG emissions calculator which estimates GHG emissions from wineries across the world, based on the 'Carbon Accounting Protocol for the International Wine Industry.'
Main Purpose of Tool• To provide general guidance on the significant emissions associated with wine production.
Current Applications• None specified.
Targeted UsersWine producers.
General MethodologyIPCC Tier 1 (default emission factors) and published algorithms. • N2O emissions: IPCC Tier 1 (default EF); • C sequestration by row cropping: Camilleri (2006); and • C sequestration by biomass: Williams (1995b).
Underlying Databases/ Data Sources• None specified.
Data Input by User • Crush size; • Average baume at harvest; • Amount of N fertilizer applied; • Vineyard area; and • % cropped of the vineyard.
Data Output • Emissions in tonnes CO2eq, split up per source category
and per GHG. Emissions are also presented as a percentage of the total farm emissions.
More Info: http://www.wineinstitute.org/ghgprotocolSee Wine Institute (2008); Camilleri (2006); Williams (1995b).

Contract # GS‐23F‐8182H, Report of GHG Tools: Calculators 38 | P a g e
IPCC IPCC Calculator LULUCF
General Information• Origin: U.S. • Authors/Developers: Developed at the Natural Resource
Ecology Lab at Colorado State University • Year Published: 2003 • Tool Type: C stocks calculator • Interface: Software program (exe. to install)
• Assessment level: Country level • Geographical coverage: Global • Practices covered: • Native vegetation
o Cultivated cropland o Grassland/grazing land o Set aside land o Paddy rice o Fallow rotations
• GHG covered: Only soil C stocks are calculated Description
This is a tool for estimation of changes in soil carbon stocks associated with management changes in croplands and grazing lands for any country, based on IPCC default data.
Main Purpose of Tool• Tool within the IPCC GPG‐LULUCF guidelines which aims to assist countries in producing national inventories for the land use, land‐use change and forestry sector.
Current Applications• Used by countries in developing GHG inventories for the LULUCF sector under the Kyoto Protocol.
Targeted UsersNational agencies in charge of developing national GHG inventories.
General Methodology• IPCC Tier 1 • Equation to calculate C stock:
o Reference C stock * input factor * land use factor * management factor (default IPCC values) ‐ see Chapter 3 of IPCC Good Practice Guidance for LULUCF (IPCC, 2003);
o Default reference carbon stocks and stock change factors are used for major cropland systems in a country, stratified by the default climate and soil types.
Underlying Databases/ Data Sources• Default IPCC management, input, and land use factors and the reference carbon stocks for 0‐30 cm from Chapter 3 of the
IPCC GPG‐LULUCF guidelines (IPCC, 2003). • Reference C stocks are based on soil profile data from Bernoux et al. (2002) and Jobbagy and Jackson (2000).
Data Input by User • Country; • Climate region; • Soil type; • Land use system; • Management system; and • Input (qualitative).
Data Output • Existing C stock (Mg C/ha); • Predicted C stock before and after period of 20 years (Mg
C/ha); and • Annual C stock change (Mg C/ha/yr).
More Info: http://www.ipcc‐nggip.iges.or.jp/public/gpglulucf/annex4a1.htmlSee IPCC (2003).

Contract # GS‐23F‐8182H, Report of GHG Tools: Calculators 39 | P a g e
Lincoln Farm Carbon Calculator
General Information• Origin: New Zealand • Authors/Developers: Lincoln University • Year Published: 2008 • Tool Type: GHG emissions calculator • Interface: Web‐based
• Assessment level: Farm level • Geographical coverage: New Zealand • Practices covered: Horticultural farms; Agricultural/mixed
farms (with stocks) • GHG covered: CO2, N2O, CH4
DescriptionThis calculator determines GHG emissions from livestock, farm energy use, and the use of fertilizer and feed.
Main Purpose of Tool• To allow New Zealand farmers, based on a range of properties, to easily calculate their farm’s CO2 footprint, to set a benchmark, and to set targets which they can monitor from year to year
Current Applications• None specified.
Targeted UsersFarmers.
General MethodologyIPCC • The calculator uses IPCC methodology (2006) and NZ GHG Inventory (New Zealand Government, 2007) default values (with some modifications to dairy). More accurate stock emissions (N2O and CH4) can be included by user (OVERSEER program).
Underlying Databases/ Data Sources• None specified.
Data Input by User • Farm size; • Farm type; • Energy usage; • Contractor's activities (hectares, hours); • Fertilizer applied; • Animal feed use; • Number of animals on farm; • Production (milk, meat, wool); and • Revenue % (milk, meat, wool, crop).
Data Output • The output shows the total annual kg of CO2 equivalent
produced (using Life Cycle Assessment) as well as a value per hectare and a pie chart of the totals. For agricultural farms, the user can also select whether to display the total per kg of Meat, Milk or Wool production (using revenue allocation).
More Info: http://www.lincoln.ac.nz/carboncalculator

Contract # GS‐23F‐8182H, Report of GHG Tools: Calculators 40 | P a g e
MANURE Manure and Nutrient Reduction Estimator
General Information• Origin: U.S. • Authors/Developers: Eastern Research Group, Inc. in
conjunction with ERT‐Winrock International • Year Published: 2009 • Tool Type: Offset calculator • Interface: Web‐based
• Assessment level: Farm level • Geographical coverage: U.S. • Practices covered: Livestock farms (dairy or swine) • GHG covered: CH4, N2O
DescriptionThe MANURE tool provides a system to quantify methane and other greenhouse gas emission reductions and the environmental benefits of renewable energy produced by digesters at dairy and swine operations.
Main Purpose of Tool• To enable estimating greenhouse gas emissions reductions associated with the installation of livestock manure anaerobic digestion methane recovery projects at farms
Current Applications• None specified.
Targeted UsersNone specified.
General MethodologyUses equations requiring site‐specific data (weather, animal population, manure management system, etc.) and uses default parameters from IPCC, EPA, USDA, etc. Methodology follows IPCC (2006) guidelines. • CH4 emissions from manure management are calculated using equations taking into account volatile solids excreted, maximum methane production from the manure and methane conversion factors (MCF). The MANURE tool uses default MCF for dry manure management systems, based on IPCC default values (IPCC, 2006);
• MCFs for liquid systems are highly temperature dependant and are calculated using the methodology described in the U.S. EPA GHG inventory for manure management (EPA, 2009), i.e., a climate‐based approach based on the van’t Hoff‐Arrhenius equation. This approach reflects seasonal changes in temperatures, accounts for long‐term retention time, and is consistent with the IPCC Guideline (IPCC, 2006); and
• N2O emissions are calculated following Tier 1 IPCC guidance (default emission factors) and EPA 2009 U.S.‐specific values for volatilization, leaching and run‐off fractions.
Underlying Databases/ Data Sources• Data sources (default factors) include:
o NOAA 2008 (weather data) o USDA 2008 (manure excreted and VS content data) o EPA 2009 (nitrogen excreted, nitrogen leached/volatilized, methane conversion factors) o IPCC 2006 (max methane producing capacity, animal mass, methane conversion factors, N2O emission factors)
Data Input by User • Location (state, county); • Type of dairy farm; • Choice of GWP (IPCC SAR, TAR, AR4, custom); • Monthly site temperature; • Animal population, hours spent in confinement, %TS and %VS in manure;
• Manure management system info pre‐project and post‐project; and
• Anaerobic digester system info (e.g., collection and destruction efficiency).
Data Output • Emission totals are expressed in metric tons of gas per year
and in units of metric tons of carbon dioxide equivalents (CO2eq).
More Info: http://app6.erg.com/manure/index.cfmSee also Eastern Research Group (2009).

Contract # GS‐23F‐8182H, Report of GHG Tools: Calculators 41 | P a g e
NDFU The North Dakota Farmers Union Carbon Credit Program Payment Calculator
General Information• Origin: U.S. • Authors/Developers: North Dakota Farmers Union Carbon
Credit Program (an official aggregator of carbon credits for the Chicago Climate Exchange)
• Year Published: Not specified • Tool Type: Offset calculator • Interface: Web‐based
• Assessment level: Site level (i.e., farmland where offsets are generated)
• Geographical coverage: U.S. (USDA Land Resource Regions, LRR).
• Practices covered: Cropland under continuous conservation tillage (see CCX protocol for definition); Cropland converted to permanent grass or hay stands, including permanent pasture and alfalfa used for hay or silage; Rangeland, managed for increased soil carbon storage
• GHG covered: CO2 (C sequestered) Description
This farm organization developed its own carbon credit program for farmers and ranchers across the U.S., selling carbon credits for agricultural offset practices through the CCX. Its online tool is based on CCX carbon offset protocols and EF.
Main Purpose of Tool• To provide an estimate of C sequestration rates and payments to farmers from offsets (CCX) due to no‐till cropping, seeding long‐term grasses, enhanced rangeland vegetation.
Current Applications• None specified.
Targeted UsersFarmers/landowners with particular interest in generating offsets for trading through CCX.
General MethodologyEmission factor approach. • Fixed Sequestration Rates factors (tonnes CO2eq/acre/year) for different mitigation/conservation systems; varies with Land Resource Regions, LRR (see CCX maps); and
• For rangeland, the range of soil carbon sequestration rates represents a best estimate based on a detailed assessment of peer‐reviewed scientific literature, actual soil sampling at NRCS plots, Flux tower data and runs of the Century model using COMET VR.
Underlying Databases/ Data Sources• EF developed for CCX protocols
Data Input by User • U.S. State; • County; and • Acres of no‐till cropping, seeding grasses, enhanced rangeland vegetation.
Data Output • Metric tons of CO2eq emissions avoided (offset) per year
and USD ($) received by farmer for offsets per year; • CO2eq avoided due to:
o conservation tillage; o seeding grasses; and o enhanced rangeland vegetation;
• $ for CCX offsets is included in the output.
More Info: http://carboncredit.ndfu.org/carboncalculator.htmlhttp://www.chicagoclimatex.com/content.jsf?id=1816 See CCX (2009b, a).

Contract # GS‐23F‐8182H, Report of GHG Tools: Calculators 42 | P a g e
OVERSEER
OVERSEER Nutrients Budget Model
General Information• Origin: New Zealand • Authors/Developers: MAF, FertResearch and AgResearch • Year Published: 2008 • Tool Type: GHG emissions calculator • Interface: Software program (exe. to install)
• Assessment level: Farm level (data entry per 'block') • Geographical coverage: New Zealand • Practices covered: Livestock (Dairy, Beef, Deer Sheep);
Horticulture; Arable crops • GHG covered: CH4, N2O, CO2
DescriptionOVERSEER® is an agricultural management tool that calculates and estimates the nutrient flows in a productive farming system and identifies potential for risk of environmental impacts through calculation of nutrient loss as run‐off and leaching and greenhouse gas emissions.
Main Purpose of Tool• To assist New Zealand farmers in examining nutrient use and movements within their farm (as products, fertilizer, effluent, supplements or transfer by animals) to optimize production and environmental outcomes.
Current Applications• Is widely used throughout New Zealand by farmers, farm consultants and fertilizer representatives.
Targeted UsersUsers range from farmers and their consultants through to policy makers and policy implementers.
General MethodologyIPCC and published EF. The GHG emission model is based on models and algorithms used for the NZ GHG national inventory, modified to include a wide range of on‐farm management practices and farm‐specific data. • Animal enteric CH4 emissions: methodology of Clark (2001), using emission factors for 5 pasture types; • CH4 emissions from dung patches and effluent ponds: emission factors from Saggar et al. (2003); • N2O emissions using IPCC emission factors or site‐specific emission factors; and • CO2: emission factors cf. NZ National Inventory and method described by Wells (2001) and Earle (1996).
Underlying Databases/ Data Sources• Livestock Improvement Corporation (2004) (Dairy statistics)
Data Input by User Whole farm: • Region, block set up; • Feedpads, animal shelters, farm dairy and associated; effluent management;
• Animal species, stocking rates and management; • Supplements imported onto farm; and • Use of nitrification inhibitors, areas of wetlands. Per block: • Topography, climate, soils, irrigation; • Effluent application management; • Pasture type and development phase; • Animal species present; and • Soil analysis and fertilizer inputs.
Data Output • CO2eq emissions (kg/ha/year) for the entire farm, split up
by source.
More Info: http://www.agresearch.co.nz/overseerwebFor other references: http://www.overseer.org.nz/OVERSEERModel/Information/References.aspx See Clark (2001); Saggar et al. (2003).

Contract # GS‐23F‐8182H, Report of GHG Tools: Calculators 43 | P a g e
RAPCOE Reforestation Afforestation Project Carbon On‐Line Estimator
General Information• Origin: U.S. • Authors/Developers: Duke University/Stratus Inc. under
contract to, and with technical guidance from, U.S. EPA's Climate Change Division
• Year Published: 2007 • Tool Type: Offset calculator • Interface: Web‐based
• Assessment level: Site level • Geographical coverage: U.S. • Practices covered: Land‐use management
(afforestation/reforestation on cropland or pasture) • GHG covered: CO2 (C sequestered)
DescriptionThe Reforestation/Afforestation Project Carbon On‐line Estimator estimates the net carbon offset produced by a reforestation or an afforestation project in the United States. With this tool, net offsets can be estimated for both (1) proposed reforestation/afforestation projects, for which gross offsets are not known and must be estimated from existing carbon stock accumulation tables (pre‐project planning)‐‐ and (2) projects already underway ‐‐ where the gross offsets have been measured or verified (post‐project monitoring).
Main Purpose of Tool• RAPCOE tool was developed in order to automate the U.S. Climate Leaders Offset Project Methodology for Reforestation/ Afforestation (EPA, 2008b). RAPCOE is used both for application of the performance threshold for determining additionality, as well as baseline setting and estimation of the gross and net offset potential of the project.
Current Applications• None specified.
Targeted UsersNone specified.
General MethodologyUses the method described in the U.S. Climate Leaders GHG offset protocol for Afforestation/Reforestation projects. Carbon offsets are estimated using FORCARB2 stand level and wood product forest carbon look‐up tables, which are part of the 1605(b) reporting guidance (DOE, 2007) for forestry project. • Leakage is calculated using default regional or national leakage rates; and • C sequestration in different pools is calculated using look‐up tables (FORCARB2).
Underlying Databases/ Data Sources• The default rates used to project land use changes occurring independently of project activity (in baseline scenario) are derived from National Resource Inventory (NRI) data ‐ plot level data collected over a 15 year span (1982‐97) for the area in which the project occurs.
Data Input by User • U.S. State; • County; and • Acres of pasture/cropland converted to forest in project.
Data Output • Results are expressed as metric tonnes CO2eq sequestered
per year per 5 year intervals (for up to 20 year predictions). Results show gross sequestration, baseline sequestration and CO2 loss due to leakage.
More Info: http://ecoserver.env.duke.edu/RAPCOEv1/See EPA (2008b).

Contract # GS‐23F‐8182H, Report of GHG Tools: Calculators 44 | P a g e
USAID FCC: Agroforestry Tool
USAID FOREST CARBON CALCULATORS: Agroforestry Tool
General Information• Origin: U.S. • Authors/Developers: Winrock International, in
corporation with USAID's Global Climate Change • Year Published: 2009 • Tool Type: Offset calculator • Interface: Web‐based
• Assessment level: Administrative unit (admin unit) = nationally recognized states, provinces, etc.
• Geographical coverage: Tropical/Subtropical regions • Practices covered: Land‐use management (agroforestry) • GHG covered: CO2
DescriptionThis carbon calculator produces estimates of sequestration or avoided emissions of CO2eq of USAID sponsored forestry‐related projects, in this particular case from agroforestry projects.
Main Purpose of Tool• This tool was designed with the purpose of allowing USAID to calculate the climate impacts of its forestry projects worldwide in terms of reducing emissions or increasing removals of carbon dioxide.
Current Applications• USAID forestry related projects.
Targeted UsersUSAID and partners
General Methodology• Equations, using parameters derived from models based on published literature.
Underlying Databases/ Data Sources• Data from extensive literature review about biomass accumulation in agroforestry systems within tropical and subtropical areas of the world.
Data Input by User • Administrative unit (location: coordinates, drop‐down, or interactive map);
• Area; • Appropriate calculator for the project; • Effectiveness of project maturity and success (%); • User has the choice to work with default parameters or site‐specific data for:
o Growth habitat (fast, medium, slow); o Stand density (dense, medium, low); o Site quality (good, fair, poor); o Annual aboveground biomass accumulation; and o Root to shoot ratio.
Data Output • Carbon benefit of the project (in tonnes of CO2eq) across
all administrative units and project activities, categorized by admin unit and activity.
More Info: http://winrock.stage.datarg.net/gcc/login.aspx?ReturnUrl=%2fgcc%2fdefault.aspx See Casarim et al. (2010).

Contract # GS‐23F‐8182H, Report of GHG Tools: Calculators 45 | P a g e
USAID FCC: Afforestation/Reforestation Tool USAID FOREST CARBON CALCULATORS: Afforestation/Reforestation Tool
General Information• Origin: U.S. • Authors/Developers: Winrock International, in
corporation with USAID's Global Climate Change • Year Published: 2009 • Tool Type: Offset calculator • Interface: Web‐based
• Assessment level: Administrative unit (admin unit) = nationally recognized states, provinces, etc.
• Geographical coverage: Tropical/Subtropical regions • Practices covered: Land‐use management
(afforestation/reforestation) • GHG covered: CO2
DescriptionThis carbon calculator produces estimates of sequestration or avoided emissions of CO2eq of USAID sponsored forestry‐related projects, in this particular case from afforestation or reforestation projects.
Main Purpose of Tool• This tool was designed with the purpose of allowing USAID to calculate the climate impacts of its forestry projects worldwide in terms of reducing emissions or increasing removals of carbon dioxide.
Current Applications• USAID forestry related projects.
Targeted UsersUSAID and partners.
General MethodologyAlgorithms based on IPCC guidelines for AFOLU. • Equations, using default parameters (aboveground biomass accumulation rate and root‐to‐shoot ratio) per ecological zone (FAO ecological zone map) based on IPCC guidelines for AFOLU (IPCC, 2006).
Underlying Databases/ Data Sources• FAO (ecological zone map) • IPCC default values for biomass accumulation rates and root‐to‐shoot ratios
Data Input by User • Administrative unit (location: coordinates, drop‐down, or interactive map);
• Area; • Appropriate calculator for the project; • Effectiveness of project maturity and success (%); • User has the choice to work with default parameters or site‐specific data for:
o Growth habitat (fast, medium, slow); o Stand density (dense, medium, low); o Site quality (good, fair, poor); o Annual aboveground biomass accumulation; and o Root to shoot ratio.
Data Output • Carbon benefit of the project (in tonnes of CO2eq) across
all administrative units and project activities, broken down by admin unit and activity.
More Info: http://winrock.stage.datarg.net/gcc/login.aspx?ReturnUrl=%2fgcc%2fdefault.aspx See Harris et al. (2009a).

Contract # GS‐23F‐8182H, Report of GHG Tools: Calculators 46 | P a g e
USAID FCC: Forest Management Tool USAID FOREST CARBON CALCULATORS: Forest management Tool
General Information• Origin: U.S. • Authors/Developers: Winrock International, in
corporation with USAID's Global Climate Change • Year Published: 2010 • Tool Type: Offset calculator • Interface: Web‐based
• Assessment level: Administrative unit (admin unit) = nationally recognized states, provinces, etc.
• Geographical coverage: Tropical/Subtropical regions • Practices covered: Forest management • GHG covered: CO2
DescriptionThis calculator will estimate the total benefit from stopping logging and reduced impact logging.
Main Purpose of Tool• This tool was designed with the purpose of allowing USAID to calculate the climate impacts of its forestry projects worldwide in terms of reducing emissions or increasing removals of carbon dioxide.
Current Applications• USAID forestry related projects.
Targeted UsersUSAID and partners.
General MethodologyEquations, using parameters based on literature: • Winjum et al. (1998) for carbon stored in wood products; • Pinard and Putz (1996) for reduced logging damage to surrounding trees; • Pereira et al. (2002); and • Holmes et al. (2002) Pinard et al. (1995) for reduced damage from roads, skid trails and logging decks.
Underlying Databases/ Data Sources• FAO databases (FAO, 2009) for production volumes of wood product classes (http://faostat.fao.org/site/626/default.aspx#ancor);
• FAO Global Forest Resources Assessment 2005 (FAO, 2006) (for calculating default annual timber extraction rates) • USAID databases
Data Input by User • Administrative unit (location: coordinates, drop‐down, or interactive map);
• Harvested Area; • Appropriate calculator for the project; • Effectiveness of project maturity and success (%); • User has the choice to work with default parameters or site‐specific data for:
o Annual harvest area; o Rotation length; o Project type (reduced impact logging, stop logging); o Volume removed before activity; o Volume removed after activity; o Wood density; o Average length of logs extracted; o Average number of logs per tree; and o Presence or absence of burning slash in the without‐
project case.
Data Output • Carbon benefit of the project (in tonnes of CO2eq) across
all administrative units and project activities, broken down by admin unit and activity. This C benefit is calculated as the difference in CO2 emissions between the two scenarios (without the project and with the project of reduced impact or stopped logging).
More Info: http://winrock.stage.datarg.net/gcc/login.aspx?ReturnUrl=%2fgcc%2fdefault.aspx http://winrock.stage.datarg.net/Content/Documents/Forest_Protection.pdf See Harris et al. (2009b).

Contract # GS‐23F‐8182H, Report of GHG Tools: Calculators 47 | P a g e
USAID FCC: Forest Protection Tool USAID FOREST CARBON CALCULATORS: Forest Protection Tool
General Information• Origin: U.S. • Authors/Developers: Winrock International, in
corporation with USAID's Global Climate Change • Year Published: 2009 • Tool Type: Offset calculator • Interface: Web‐based
• Assessment level: Administrative unit = nationally recognized states, provinces, etc.
• Geographical coverage: Tropical/Subtropical regions • Practices covered: Forest management (protection) • GHG covered: CO2
DescriptionThis calculator will estimate the total benefit from reducing deforestation, fire incidence and illegal logging.
Main Purpose of Tool• This tool was designed with the purpose of allowing USAID to calculate the climate impacts of its forestry projects worldwide in terms of reducing emissions or increasing removals of carbon dioxide.
Current Applications• USAID forestry related projects.
Targeted UsersUSAID and partners.
General MethodologyAlgorithms based on IPCC guidelines for AFOLU (IPCC, 2006). • Equations, using parameters from existing regional and global datasets (e.g., remote sensing imagery, maps) for forest cover, forest biomass stocks, wood density (IPCC); and
• For lost forest sequestration, calculation was based on 2006 IPCC AFOLU guidelines. Underlying Databases/ Data Sources
• To estimate gross deforestation rates for each administrative unit: o Landsat data (30‐m resolution) for 2 years for Paraguay, Liberia, Madagascar, Guatemala, Indonesia and Brazil; and o Global MODIS land cover 2001 and 2004 datasets.
• To estimate area‐weighted forest carbon stocks: o a number of different regional and global datasets were used (China, Asia, Africa, Amazon, Russia, Other).
Data Input by User • Administrative unit (location: coordinates, drop‐down, or interactive map);
• Area; • Appropriate calculator for the project; • Effectiveness of management; • User has the choice to work with default parameters or site‐specific data for:
o Forest type; o Protection against; o Known deforestation rate; o Known fire incidence; o Known illegal logging rate; and o Forest carbon or biomass stock.
Data Output • Carbon benefit of the project (in tonnes of CO2eq) across
all administrative units and project activities, broken down by admin unit and activity. This C benefit is calculated as the difference in CO2 emissions between the two scenarios (without the project and with the project).
More Info: http://winrock.stage.datarg.net/gcc/login.aspx?ReturnUrl=%2fgcc%2fdefault.aspx See Harris et al. (2009c).

Contract # GS‐23F‐8182H, Report of GHG Tools: Protocols and Guidelines 48 | P a g e
Report of GHG Tools
Protocols and Guidelines

Contract # GS‐23F‐8182H, Report of GHG Tools: Models 49 | P a g e
1605(b) Section H & I Technical Guidelines for the Voluntary Reporting of Greenhouse Gases (1605(b)) Program
General Information• Origin: U.S. • Authors/Developers: U.S. Department of Energy (DOE) • Agricultural and Forestry emissions: prepared by USDA • Year Published: 2007 • Tool Type: Guidelines • Assessment level: Farm‐level, site‐level, regional level • Geographical coverage: U.S.
• Practices covered: Agriculture
o Animal operations o Cropland (arable cropping, rice cultivation) o Residue burning o N fertilization o Cultivation of organic soils o Lime additions o Cropping practices and grazing land management
Forestry o Afforestation, reforestation o Forest management o Reduced deforestation o Agroforestry o Urban forestry
• GHG covered: CO2, N2O, CH4 Description
The Technical Guidelines describe numerous methods of how to estimate and report emissions and reductions of greenhouse gases, for voluntary reporting under the 1605(b) program. Section H provides guidance on estimating greenhouse gas emissions and soil carbon sequestration from agricultural sources and sinks. Section I provides guidance on estimating forest carbon sequestration and emissions from forests, woody biomass, and the wood product sector.
Main Purpose of Tool• To define permissible methods of calculating reportable GHG emissions and reductions for voluntary reporting under the 1605(b) program.
General MethodologyGuidelines provide a number of different quantification methods that are allowed under the program, and assigns 'ratings' (A‐D) to these different methods for each of the source categories. Suggested methods range from: • Agriculture
o Direct measurements; o Inference using site‐specific activity data and default emission and sequestration factors for the state, region or nation
(provided in the guidelines, from EPA, 2003; IPCC, 1997); o Inference Using Improved Emission Factors; o Process model estimates (referred to COMET‐VR tool for soil C flux estimation); and o Hybrid estimation approach.
• Forestry o Lookup tables with default C stock factors for average forest conditions for a region, ownership class, forest type, and
productivity class; o Models (referred to COLE model for estimating forest C stocks for the conterminous United States); o Direct measurements; and o Hybrid approach.
Depending on the method used, uncertainty is accounted for. Validation/Verification: • Reports submitted under the 1605(b) program (DOE, 2007) are not required independent verification, although strongly
encouraged. Measurements/Monitoring: • Guidelines for direct measurements are provided (e.g., soil C stocks, soil emissions, livestock emissions). More Info: http://www.eia.doe.gov/oiaf/1605/gdlins.htmlSee DOE (2007).

Contract # GS‐23F‐8182H, Report of GHG Tools: Models 50 | P a g e
ACR Fertilizer American Carbon Registry: Fertilizer Management
General Information• Origin: U.S. • Authors/Developers: American Carbon Registry (ACR), an
enterprise of Winrock International • Year Published: 2010 • Tool Type: Quantification protocol
• Assessment level: Project level • Geographical coverage: U.S., but potentially global
coverage depending on data availability to parameterize DNDC model.
• Practices covered: o Nitrogen management (including changes in fertilizer
rate, type, placement, timing, use of timed‐release fertilizers, use of nitrification inhibitors, and other factors)
o Farm energy management • GHG covered: N2O, CO2, CH4
DescriptionThe ACR Methodology for N2O Emissions Reductions from Changes in Fertilizer Management details requirements for quantification of GHG emissions reductions in the agriculture sector resulting from changes in how fertilizer is applied and used.
Main Purpose of Tool• To enable generating tradable offsets under the ACR system, branded as Emission Reduction Tons (“ERTs”) from Agricultural Land Management (ALM) ACR project activities that involve a change in fertilizer management.
General MethodologyIPCC Tier 3 approach: Incorporates site specific data into a peer‐reviewed, tested and highly parameterized model, the Denitrification‐Decomposition (DNDC) model, to quantify direct N2O emissions as well as indirect emissions from leaching and ammonia volatilization. Uncertainty must be accounted for and is estimated by DNDC modeling approach (Monte Carlo). Validation/ verification: • Independent verification by an ACR‐approved third party verifier; and • DNDC is highly reviewed, parameterized model. Measurements/ Monitoring: • Certain parameters (DNDC input data) may require measurement; and • Monitoring requirements apply (e.g., data from climate, cropping, tillage, fertilizer, amendment, irrigation). More Info: http://www.americancarbonregistry.org/carbon‐accounting/emissions‐reductions‐through‐changes‐in‐fertilizer‐management See American Carbon Registry (2010b); Pearson and Brown (2010); Pearson et al. (2010).

Contract # GS‐23F‐8182H, Report of GHG Tools: Models 51 | P a g e
ACR Forest American Carbon Registry: Forest Carbon
General Information• Origin: U.S. • Authors/Developers: American Carbon Registry (ACR), an
enterprise of Winrock International. • Year Published: 2010 • Tool Type: Quantification protocol
• Assessment level: Project level • Geographical coverage: U.S., with extension into other
jurisdictions depending on the use of approved methodologies (e.g., CDM)
• Practices covered: Crop management, Land use management
• GHG covered: CO2 Description
Forest carbon‐based GHG emission reduction and removal project standard focusing on Afforestation and Reforestation (AR), Improved Forest Management (IFM) and Reducing Emissions from Deforestation and Degradation (REDD).
Main Purpose of Tool• To enable generating tradable offsets under the ACR system, branded as Emission Reduction Tons (“ERTs”) from AR, IFM and REDD project activities.
General MethodologyAllows use of EPA CL, CDM, IPCC and VCS methodologies. More Info: http://www.americancarbonregistry.org/carbon‐accounting

Contract # GS‐23F‐8182H, Report of GHG Tools: Models 52 | P a g e
ACR Manure American Carbon Registry: Livestock Manure
General Information• Origin: U.S. • Authors/Developers: American Carbon Registry (ACR), an
enterprise of Winrock International. • Year Published: 2010 • Tool Type: Quantification protocol
• Assessment level: U.S., with extension into other jurisdictions depending on the use of approved methodologies (e.g., CDM)
• Geographical coverage: Project level • Practices covered:
o Dairy and swine operations o Livestock manure management o Farm energy management
• GHG covered: CO2, N2O, CH4 Description
The Livestock Manure Management Project Standard details ACR’s requirements and specifications for the quantification, monitoring, and reporting of GHG reductions from manure management systems using anaerobic digesters at dairy and swine operations.
Main Purpose of Tool• To enable generating tradable offsets under the ACR system, branded as Emission Reduction Tons (“ERTs”) from ACR project activities that involve a manure management system using anaerobic digesters.
General MethodologyThe quantification methodology derives primarily from the Inland Empire Utility Agency (IEUA) site‐specific MRV protocol (IEUA, 2006) developed by ERT and approved by the California Energy Commission, the U.S. EPA’s Climate Leaders Program Manure Offset Protocol (EPA, 2008a), U.S. EPA Greenhouse Gas Inventory for Manure Management (EPA, 2009), and CDM methodologies ACM0010, Version 05 and AM0073, Version 01. Use of IPCC default factors (MCF for dry manure management systems, EF for fossil fuel combustion). Validation/ verification: • Independent verification by an ACR‐approved third party verifier. Measurements/ Monitoring: • Ex‐post metered data requirements to check ex‐ante modeled estimates; and • Other measurement requirements apply (e.g., VS content). More Info: http://www.americancarbonregistry.org/carbon‐accounting/livestock‐manure‐management‐project‐standard‐v1.0See American Carbon Registry (2010a).

Contract # GS‐23F‐8182H, Report of GHG Tools: Models 53 | P a g e
AOS Beef Feeding (edible Oils) Alberta Offset System: Beef Feeding Quantification Protocol
General Information• Origin: Canada • Authors/Developers: Alberta government • Year Published: 2008 • Tool Type: Quantification protocol
• Assessment level: Project level • Geographical coverage: Alberta, Canada • Practices covered: Livestock management (Beef farms) • GHG covered: CH4
DescriptionFeedlot offset accounting protocol for Alberta operations to quantify enteric emission reductions based on diet modification to include edible oils.
Main Purpose of Tool• To enable generating carbon offsets under the Alberta Offset System from the reductions of GHG emissions resulting from modification of the finishing diet for cattle to include edible oils, by providing the requirements for measurement, monitoring and GHG quantification.
General MethodologyCalculations based on 2006 IPCC best practice guidance using default emission factors depending on diet type and appropriate to Alberta context. Uncertainty is not addressed in this protocol. Validation/ verification: • Projects must be verified by an independent third party. Measurements/ Monitoring: • Requires records on numbers, weights, diets (quantity and composition), and days on feed for the cattle produced in the project.
More Info: http://environment.alberta.ca/02275.htmlSee Alberta Environment (2008b).

Contract # GS‐23F‐8182H, Report of GHG Tools: Models 54 | P a g e
AOS Beef Feeding (reducing daysonfeed) Alberta Offset System: Beef Days on Feed Protocol
General Information• Origin: Canada • Authors/Developers: Alberta government • Year Published: 2008 • Tool Type: Quantification protocol
• Assessment level: Project level • Geographical coverage: Alberta, Canada • Practices covered: Livestock management (Beef farms) • GHG covered: CH4, N2O
DescriptionFeedlot offset accounting protocol for Alberta‐based operations, quantifying enteric CH4 and manure management CH4 and N2O emissions. It involves diet modification and feed additives to decrease days‐on‐feed required for equivalent cattle weight gain.
Main Purpose of Tool• To enable generating carbon offsets under the Alberta Offset System from the reductions of GHG emissions resulting from reducing the days on feed for cattle being finished on feed lots, by providing the requirements for measurement, monitoring and GHG quantification.
General MethodologyCalculations based on 2006 IPCC best practice guidance and default emission factors. Uncertainty is not addressed in this protocol. Validation/ verification: • Projects must be verified by an independent third party. Measurements/ Monitoring: • Records with respect to the number of cattle, incoming and outgoing weights, diets (quantity and composition), and days on feed, among others, are required.
More Info: http://environment.alberta.ca/02275.htmlSee Albert a Environment (2008c).

Contract # GS‐23F‐8182H, Report of GHG Tools: Models 55 | P a g e
AOS Beef Lifecycle Alberta Offset System: Beef Lifecycle Quantification Protocol
General Information• Origin: Canada • Authors/Developers: Alberta government • Year Published: 2009 • Tool Type: Quantification protocol
• Assessment level: Project level • Geographical coverage: Alberta, Canada • Practices covered: Livestock management (Beef farms) • GHG covered: CH4, N2O
DescriptionOffset accounting protocol for full lifecycle cattle management in Alberta operations, to maintain production while reducing cattle lifespan duration (i.e., from reducing the culling age of cattle throughout the beef production supply chain). This protocol quantifies enteric CH4 emissions from calves, cows and bulls; and emissions from manure handling, storage and application.
Main Purpose of Tool• To enable generating carbon offsets under the Alberta Offset System from the reductions of GHG emissions resulting from reducing the culling age of cattle throughout the beef production supply chain, by providing the requirements for measurement, monitoring and GHG quantification.
General MethodologyCalculations based on 2006 IPCC (IPCC, 2006) best practice guidance (Tier 2), whereby the calculation of emission factors is based on the feeding regimes. Uncertainty is not addressed in this protocol. Validation/ verification: • Projects must be verified by an independent third party. Measurements/ Monitoring: • Records with respect to the number and mass of cattle produced are required. More Info: http://environment.alberta.ca/02275.htmlSee Alberta Environment (2008a).

Contract # GS‐23F‐8182H, Report of GHG Tools: Models 56 | P a g e
AOS Biogas Alberta Offset System: Biogas Quantification Protocol
General Information• Origin: Canada • Authors/Developers: Alberta government • Year Published: 2007 • Tool Type: Quantification protocol
• Assessment level: Project level • Geographical coverage: Alberta, Canada • Practices covered: Livestock management • GHG covered: CH4, CO2, N2O
DescriptionAnaerobic digester offset accounting protocol for Alberta‐based projects using manure and other organic feedstocks. The protocol accounts for biogas production used for electricity, biofuel and CHP generation.
Main Purpose of Tool• To enable generating carbon offsets under the Alberta Offset System from the reductions of GHG emissions resulting from displacing fossil fuel based electricity, thermal energy or natural gas in gas transmission systems with the biogas from the anaerobic digestion of materials (primarily agricultural materials such as manure, silage, dead animal stocks, etc), by providing the requirements for measurement, monitoring and GHG quantification.
General MethodologyEmission quantifications are based on IPCC and Environment Canada guidance and approved emission factors from landfill avoidance. Emission factors are adjusted annually as part of Environment Canada reporting on Canada's emissions inventory. Uncertainty is not addressed in this protocol. Validation/ verification: • Projects must be verified by an independent third party. Measurements/ Monitoring: • Records with respect to mass to landfill, volume of manure in vessel, volume of biogas, methane content of biogas, fuel and electricity usage, etc. are required.
More Info: http://environment.alberta.ca/02275.html

Contract # GS‐23F‐8182H, Report of GHG Tools: Models 57 | P a g e
AOS Dairy Alberta Offset System: Dairy Cattle Quantification Protocol
General Information• Origin: Canada • Authors/Developers: Alberta government • Year Published: 2010 • Tool Type: Quantification protocol
• Assessment level: Project level • Geographical coverage: Alberta, Canada • Practices covered: Livestock management (Dairy farms) • GHG covered: CO2, N2O, CH4
DescriptionAlberta dairy farm offset accounting protocol which quantifies emissions and emission reductions per unit of milk produced of CO2, CH4, and N2O for dairy farms in Canada.
Main Purpose of Tool• To enable generating carbon offsets under the Alberta Offset System from the reductions of GHG emissions resulting from increasing annual milk productivity, modifying diet, retaining fewer heifers as replacements and modifying manure spreading timing, by providing the requirements for measurement, monitoring and GHG quantification.
General MethodologyGHG emissions are calculated using an 'activity level * multiplication factor' equation following IPCC guidance. Activity levels are measured or estimated; multiplication factors are derived from published documents (e.g., Marinier et al., 2004; Vergé et al., 2007 for methane conversion factors for manure systems). Protocol offers either a Basic or an Advanced quantification approach. The Basic approach will use accepted emission factors (e.g., IPCC, other publications) or default assessments of feed quality/greenhouse gas emissions, while the Advanced approach will require on‐site measurement and accounts for more site specific conditions (e.g., includes Van't Hoff Arrhenius factor in methane calculations from liquid manure storage; measurements of dry matter intake for enteric CH4 emissions calculations). Uncertainty is not addressed in this protocol. Validation/ verification: • Projects must be verified by an independent third party. Measurements/ Monitoring: • Monitoring requirements apply. Parameters such as amount of milk produced, milk fat content, dry matter intake, quality of forage, etc. need to be measured.
More Info: http://environment.alberta.ca/02275.htmlSee Alberta Environment (2010b).

Contract # GS‐23F‐8182H, Report of GHG Tools: Models 58 | P a g e
AOS Energy Efficiency Alberta Offset System: Energy Efficiency Quantification Protocol
General Information• Origin: Canada • Authors/Developers: Alberta government • Year Published: 2007 • Tool Type: Quantification protocol
• Assessment level: Project level • Geographical coverage: Alberta, Canada • Practices covered: Farm energy management • GHG covered: CO2, N2O, CH4
DescriptionFacilities management and energy efficiency offset accounting protocol for a broad range of retrofit projects on farms (and other facilities).
Main Purpose of Tool• To enable generating carbon offsets under the Alberta Offset System from the reductions of GHG emissions resulting from the implementation of industrial, commercial and agricultural process changes and facility retrofits that result in overall efficiencies in energy use per unit of productivity, by providing the requirements for measurement, monitoring and GHG quantification.
General MethodologyGHG emissions are calculated using an 'activity level * multiplication factor' equation following IPCC guidance. Activity levels are measured; multiplication factors are derived from Environment Canada reference documents (reference values adjusted annually as part of Environment Canada reporting on Canada's emissions inventory). Validation/ verification: • Projects must be verified by an independent third party. Measurements/ Monitoring: • All activity data must be measured, including volumes of fuels used and amount of electricity used. • Monitoring requirements apply. More Info: http://environment.alberta.ca/02275.htmlSee Alberta Environment (2007a).

Contract # GS‐23F‐8182H, Report of GHG Tools: Models 59 | P a g e
AOS NERP Alberta Offset System: Nitrous Oxide Emissions Reductions in Agriculture Quantification Protocol
General Information• Origin: Canada • Authors/Developers: Alberta government • Year Published: 2010 • Tool Type: Quantification protocol
• Assessment level: Project level • Geographical coverage: Alberta, Canada • Practices covered: Cropland (annual, perennial), Nitrogen
management • GHG covered: N2O, CO2, CH4
DescriptionN2O emission quantification protocol based on the implementation of comprehensive nitrogen management plans for optimum crop nitrogen uptake. This protocol quantifies direct and indirect N2O emissions per unit of crop produced.
Main Purpose of Tool• To enable generating carbon offsets under the Alberta Offset System from the reductions of N2O emissions from N fertilizer application by switching to an integrated set of Beneficial Nitrogen Management Practices (BMPs) for annual and perennial cropping, by providing the requirements for measurement, monitoring and GHG quantification.
General Methodology• Protocol follows methodology (emission factors, formula) used in Canada’s National Inventory Report (cf. Rochette et al., 2008a), based on N‐input from fertilizer, crop residue, manure, etc and the IPCC Tier 2 approach whereby emission factors for direct N2O emissions are specific to the ecodistrict where the farm is located and are corrected for soil type, topography and climate. For indirect N2O emissions, protocol uses default N2O emission factor (constant for Canada);
• Project N2O emissions are multiplied by a reduction modifier depending on the selected Performance Levels in the 4R Consistent Plan (0.85 for the basic and 0.75 for the intermediate and advanced levels);
• Fuel combustion emissions are calculated based on activity data*fuel emission factor (default for Canada); and • Uncertainty is not explicitly addressed in this protocol. Validation/ verification: • Projects must be verified by an independent third party. Measurements/ Monitoring: • Protocol requires some activity data to be measured, including crop productivity (dry matter), amount of N fertilizer, manure‐N applied; and
• Monitoring requirements apply. More Info: http://environment.alberta.ca/02275.htmlSee Alberta Environment (2010a).

Contract # GS‐23F‐8182H, Report of GHG Tools: Models 60 | P a g e
AOS Pork Alberta Offset System: Pork Quantification Protocol
General Information• Origin: Canada • Authors/Developers: Alberta government • Year Published: 2007 • Tool Type: Quantification protocol
• Assessment level: Project level • Geographical coverage: Alberta, Canada • Practices covered: Livestock management (swine
operations) • GHG covered: CH4, N2O
DescriptionOffset accounting protocol for Alberta swine operations to address manure‐based emission reductions from innovative practices (substitution‐ and efficiency‐type innovations), which result in a decrease of the total amount of VS and N excreted, and consequently in reduction of CH4 emission from stored manure and in reduction of N2O emission from land receiving manure.
Main Purpose of Tool• To enable generating carbon offsets under the Alberta Offset System from the reductions of GHG emissions resulting from the implementation of two kinds of innovative practices (feed and manure substituting practices) on swine farms, by providing the requirements for measurement, monitoring and GHG quantification.
General MethodologyProtocol uses IPCC best practice guidelines and expert‐validated emission factors. • CH4 emissions from manure storage are calculated based on available volatile solids (calculated based on farm‐specific data), maximum methane producing capacity of manure storage system (fixed factor for liquid swine manure), and climate;
• Direct N2O emissions from manure application to land are calculated based on N content in manure, location/climate‐specific emission factor, and default correction factors for snow periods and season of manure application. Indirect N2O emissions use default emission factors and climate‐specific leaching fraction values; and
• Uncertainty is not addressed in this protocol. Validation/ verification: • Projects must be verified by an independent third party Measurements/ Monitoring: • Protocol requires some activity data to be measured, [e.g., number and weight of pigs produced in the project, feed intake, feed composition (dry matter, energy digestibility), monthly temperature]; and
• Monitoring requirements apply. More Info: http://environment.alberta.ca/02275.htmlSee Alberta Environment (2007b).

Contract # GS‐23F‐8182H, Report of GHG Tools: Models 61 | P a g e
AOS Tillage Alberta Offset System: Tillage Quantification Protocol
General Information• Origin: Canada • Authors/Developers: Alberta government • Year Published: 2009 • Tool Type: Quantification protocol
• Assessment level: Project level • Geographical coverage: Alberta, Canada • Practices covered: Soil management (annual cropland),
Farm energy management • GHG covered: CO2, N2O, CH4
DescriptionOffset accounting protocol for improved tillage practices on Alberta cropland for farms implementing conservation tillage practices.
Main Purpose of Tool• To enable generating carbon offsets under the Alberta Offset System from the reductions of GHG emissions through implementing no‐till and reduced till systems on agricultural lands, by providing the requirements for measurement, monitoring and GHG quantification.
General Methodology• Protocol uses 'activity data * factor' calculations, with fuel emission reduction factors, N2O emission reduction factors and C sequestration factors, specific for tillage practice and project location. These emission factors were calculated using Century model for no‐till and reduced‐till sequestration factors;
• Applies an assurance factor method for managing the risk of reversal; and • Uncertainty is not addressed in this protocol. Validation/ verification: • Projects must be verified by an independent third party. Measurements/ Monitoring: • Protocol only requires monitoring and measurement of area under reduced tillage practice. More Info: http://environment.alberta.ca/02275.htmlSee Alberta Environment (2009).

Contract # GS‐23F‐8182H, Report of GHG Tools: Models 62 | P a g e
CAR Forest Climate Action Reserve: Forest Project Protocol
General Information• Origin: U.S. • Authors/Developers: Climate Action Reserve (formerly
California Climate Action Registry) • Year Published: 2010 • Tool Type: Field‐based sampling method
• Assessment level: Project level • Geographical coverage: U.S. • Practices covered: Afforestation/reforestation • GHG covered: CO2
DescriptionThe Forest Project Protocol provides guidance for project development and the quantification of carbon offset credits, known as Climate Reserve Tonnes (CRT), generated by GHG emission reductions associated with reforestation/afforestation projects (on lands with less than 10% tree canopy for at least 10 years prior), improved forest management, and avoided conversion projects.
Main Purpose of Tool• To enable generating CRTs from CAR projects that sequester carbon in U.S. forestlands.
General Methodology• Combination of modeling and measurements (e.g., for use in allometric equations); • For leakage emissions: using default land‐use conversion factors for non‐project land; and • Uncertainty is not addressed in this protocol. Validation/ verification: • Project must be verified by approved third‐party verifiers; and • Approval by CAR. Measurements/ Monitoring: • Quantification of offsets is based on direct measurements; • Project must be monitored for a period of 100 years following issuance of any Climate Reserve Tonne (CRT) for GHG reductions; and
• A monitoring report must be completed annually for this 100 year period. More Info: http://www.climateactionreserve.org/how/protocols/adopted/forest/current/See CAR (2010a).

Contract # GS‐23F‐8182H, Report of GHG Tools: Models 63 | P a g e
CAR – Manure Climate Action Reserve: Livestock Project Protocol
General Information• Origin: U.S. • Authors/Developers: Climate Action Reserve (formerly
California Climate Action Registry) • Year Published: 2010 • Tool Type: Quantification protocol
• Assessment level: Project level • Geographical coverage: U.S. • Practices covered: Livestock farms, Livestock waste
management • GHG covered: CH4, CO2
DescriptionThe Livestock Project Protocol provides guidance to calculate, report, and verify GHG emission reductions associated with installing a manure biogas control system for livestock operations, such as dairy cattle and swine farms.
Main Purpose of Tool• To enable generating CRTs from CAR projects that reduce CH4 emissions through installment of manure biogas control systems.
General Methodology• Combination of modeling (equations requiring site‐specific data input and using default parameters from publications, IPCC, EPA, ASAE) and ex‐post metered data (CH4 removal);
• Method is derived from CDM (ACM0010 V.5), the EPA’s Climate Leaders Program Manure Offset Protocol (EPA, 2008a), and the RGGI (2007) Model Rule; and
• Uncertainty is not addressed in this protocol. Validation/ verification: • Project must be verified by CAR approved ISO‐accredited third‐party verifiers; and • Approval by CAR. Measurements/ Monitoring: • Projects must monitor actual metered amounts of CH4 destroyed in the biogas control system (BCS) (i.e., flow of biogas and fraction of CH4 in biogas); and
• Other parameters must be monitored as well (e.g., livestock data, temperature). More Info: http://www.climateactionreserve.org/how/protocols/See Climate Action Reserve (2010b).

Contract # GS‐23F‐8182H, Report of GHG Tools: Models 64 | P a g e
Carbon Accounting Protocol for the International Wine Industry
General Information• Origin: Australia, New Zealand, California, S. Africa • Authors/Developers: Provisor Pty Ltd, contracted by The
Wine Institute of California, New Zealand Winegrowers, Integrated Production of Wine South Africa and the Winemakers Federation of Australia
• Year Published: 2008 • Tool Type: Quantification protocol
• Assessment level: Company level • Geographical coverage: Global • Practices covered: Wine production companies including;
grapegrowing, winemaking and/or bottling operations. • GHG covered: CO2, N2O
DescriptionProtocol which provides guidance in how to estimate GHG emissions from wineries across the world. The protocol forms the basis for the Excel‐based 'International Wine Carbon Calculator '.
Main Purpose of Tool• To provide an enterprise and/or facility level calculating tool for the International Wine Industry in compliance with current international standards and practices for Greenhouse Gas accounting. It is also expected that the tool will be used by companies in the following ways:
o Mandatory and/or voluntary reporting; o Calculating Carbon Footprint; o Providing information to customers about carbon impact; o As a decision tool in reaching carbon neutrality; o Developing an understanding of the wine industry emission for industry information and advocacy purposes;
and/or o Responding to market demands for information on product entrained carbon.
General Methodology• For emissions from vineyards, protocol follows IPCC Tier 1 approach (default emission factors, i.e., for N2O emissions) and published algorithms (for C sequestration estimates); and
• Uncertainty is not addressed in this protocol. Validation/ verification: • Not specified. Measurements/ Monitoring: • Not specified. More Info: http://www.wineinstitute.org/ghgprotocolSee Wine Institute (2008).

Contract # GS‐23F‐8182H, Report of GHG Tools: Models 65 | P a g e
CCX Agricultural Best Management Practices Chicago Climate Exchange Offset Project Protocol
Agricultural Best Management Practices – Continuous Conservation Tillage and Conversion to Grassland Soil Carbon Sequestration
General Information• Origin: U.S. • Authors/Developers: Chicago Climate Exchange • Year Published: 2009 • Tool Type: Quantification protocol
• Assessment level: Project level • Geographical coverage: U.S. • Practices covered: Soil management, Crop management • GHG covered: CO2
DescriptionThis protocol outlines the project criteria, boundaries, monitoring requirements, emissions reduction calculations and other guidelines for CCX Project Proponents to register greenhouse gas emission reductions resulting from voluntary conservation tillage practices and/or grassland planting.
Main Purpose of Tool• To enable generating CCX Exchange Offsets from conservation tillage, direct seeding and cropland‐to‐grassland conversion projects.
General Methodology• Emission reductions are calculated by multiplying qualifying acres by a standardized crediting rate for specified practices/projects in certain regions of the U.S. (provided in CCX protocol, based on input from scientific experts), less project emissions (if any); and
• Uncertainty is not addressed in this protocol. Validation/ verification: • Validated by CCX staff; verified by a CCX‐Approved Verifier. Measurements/ Monitoring: • Monitoring requirements apply. More Info: http://www.chicagoclimatex.com/content.jsf?id=1816See CCX (2009a).

Contract # GS‐23F‐8182H, Report of GHG Tools: Models 66 | P a g e
CCX Agricultural Methane Chicago Climate Exchange Offset Project Protocol
Agricultural Methane Collection and Combustion Offset Project Protocol General Information
• Origin: U.S. • Authors/Developers: Chicago Climate Exchange • Year Published: 2009 • Tool Type: Quantification protocol
• Assessment level: Project level • Geographical coverage: U.S. and non‐Annex 1 countries • Practices covered: Livestock farms, Livestock waste
management • GHG covered: CO2, CH4
DescriptionThis protocol outlines the project criteria, boundaries, monitoring requirements, emissions reduction calculations and other guidelines for CCX Project Proponents to register greenhouse gas emission reductions resulting from the voluntary destruction of methane originating from animal agricultural operations.
Main Purpose of Tool• To enable generating CCX Exchange Offsets from agricultural methane collection and combustion Projects.
General Methodology• Combination of ex‐ante IPCC Tier 2 modeling approach (equations requiring site‐specific activity data and using state‐specific emission factors for each livestock category and manure management system) and ex‐post equations using metered data (CH4 removal);
• Provides look up tables for emission factors. Emission factors are calculated in the protocol based on state‐specific methane conversion factors (MCF) for management types and maximum CH4 generation potential (B0) for livestock category (from EPA GHG Inventory); and
• Uncertainty is not addressed in this protocol. Validation/ verification: • Validated by CCX staff; verified by a CCX‐Approved Verifier. Measurements/ Monitoring: • Biogas flow (flow meter); CH4 content analysis; electricity production (if applicable); destruction device operating hours; project‐related emissions; and
• Measurement requirements also apply (for biogas analysis, flow meter device, electricity metering device). More Info: http://www.chicagoclimatex.com/content.jsf?id=1817See CCX (2009c).

Contract # GS‐23F‐8182H, Report of GHG Tools: Models 67 | P a g e
CCX Range Chicago Climate Exchange Offset Project Protocol
Agricultural Best Management Practices – Sustainably Managed Rangeland Soil Carbon Sequestration Offset Projects
General Information• Origin: U.S. • Authors/Developers: Chicago Climate Exchange • Year Published: 2009 • Tool Type: Quantification protocol
• Assessment level: Project level • Geographical coverage: U.S. • Practices covered: Rangeland, Grazing practices • GHG covered: CO2
DescriptionOffset accounting protocol for improved rangeland management through formal grazing plans on rangelands that are not fertilized or irrigated.
Main Purpose of Tool• To enable generating CCX Exchange Offsets from improved rangeland management Projects.
General Methodology• Emission reductions are calculated by multiplying qualifying acres by a standardized crediting rate for specified practices/projects in certain regions of the U.S. (provided in CCX protocol, based on input from scientific experts), less project emissions (if any);
• Soil carbon sequestration rates represent a best estimate based on a detailed assessment of peer‐reviewed scientific literature, actual soil sampling at NRCS plots, Flux tower data and runs of the Century model using COMET VR; and
• Uncertainty is not addressed in this protocol. Validation/ verification: • Validated by CCX staff; verified by a CCX‐Approved Verifier. Measurements/ Monitoring: • Monitoring requirements apply. More Info: http://www.chicagoclimatex.com/content.jsf?id=1816See CCX (2009b).

Contract # GS‐23F‐8182H, Report of GHG Tools: Models 68 | P a g e
CCX Forest Chicago Climate Exchange Offset Project Protocol: Forestry Carbon Sequestration Projects
General Information• Origin: U.S. • Authors/Developers: Chicago Climate Exchange • Year Published: 2009 • Tool Type: Quantification protocol
• Assessment level: Project level • Geographical coverage: U.S. and non‐Annex 1 countries • Practices covered: Afforestation, reforestation, Forest
management • GHG covered: CO2
DescriptionAfforestation offset accounting for projects within the U.S. or non‐Annex 1 countries, where previously non‐forested land (at least 10 years prior) is planted to have trees on more than 0.5 ha, with potential or current canopy height greater than 5 m and canopy cover greater than 10%.
Main Purpose of Tool• To enable generating CCX Exchange Offsets from forestry Projects.
General MethodologyAfforestation / Reforestation projects: • Either through the use of the CCX Carbon Accumulation Tables ((based on DOE, 2007)) or by combining direct measurement with growth‐and‐yield modeling approach.
Forest management: • Must involve a combination of direct measurement through either an in‐field timber inventory and/or remote sensing techniques, and may be combined with growth‐and‐yield models to project growth.
Uncertainty is not addressed in this protocol. Validation/ verification: • Validated by CCX staff; verified by a CCX‐Approved Verifier. Measurements/ Monitoring: • Monitoring requirements apply. More Info: http://www.chicagoclimatex.com/content.jsf?id=1816See CCX (2009d).

Contract # GS‐23F‐8182H, Report of GHG Tools: Models 69 | P a g e
CDM A/R Clean Development Mechanism methodologies
Methodologies for afforestation and reforestation projects Approved small scale A/R methodologies: AR‐AMS0001, 0002, 0003, 0004, 0005, 0006, 0007. Approved large scale A/R methodologies: AR‐AM0002, 0004, 0005, 0006, 0007, 0009, 0010, 0011, 0012, AR‐ACM0001, 0002.
General Information• Origin: International • Authors/Developers: various (SGS, TÜV SÜD) • Year Published: Varies with methodology • Tool Type: Quantification protocol ‐ offsets
• Assessment level: Project level • Geographical coverage: Global • Practices covered: Afforestation/reforestation • GHG covered: CO2 (through change in C stocks)
DescriptionThese protocols provide a step‐wise measurement, monitoring and calculation procedure to estimate the net removal of GHG emissions achievable within the boundary of an afforestation or reforestation activity under the CDM (A/R CDM project activity).
Main Purpose of Tool• To enable generating CERs from CDM projects that increase C stocks from afforestation and reforestation projects.
General Methodology• Baseline: priority to use in‐situ data and species and project specific measurements or local forestry inventory data (i.e., for BEFs, root‐to‐shoot ratios) before using global default values. As well, methodologies apply parameter values that will likely overestimate removals by sinks in the baseline (i.e., maximal values of the biomass expansion factors (BEF) in non forest trees);
• Project: field measurements or yield tables are recommended. Projects methodologies correspond to higher‐tier for estimation methods and factors (only seldom relay on IPCC default);
• Biomass: estimation using BEF or allometric equation approach; • Soil C stock changes following CDM protocol: "Tool for estimation of change in soil organic carbon stocks due to the implementation of A/R CDM project activities". Some protocols provide default C stock change factors; and
• Uncertainty is not addressed in these protocols. Validation/ verification: • CDM process: validation/verification of offset project by a DOE; and • Approval by CDM Executive Board. Measurements/ Monitoring: • Certain measurements and monitoring requirements exist (defined in the different protocols; e.g., DBH, height of trees). More Info: http://cdm.unfccc.int/methodologies/index.htmlList of approved A/R methodologies under: http://cdm.unfccc.int/methodologies/index.html See Blujdea et al. (2010).

Contract # GS‐23F‐8182H, Report of GHG Tools: Models 70 | P a g e
CDM Manure Clean Development Mechanism methodologies ‐ ACM0010
Manure management systems (based on AM0006 and AM0016)
General Information• Origin: International • Authors/Developers: various (DNV, TÜV SÜD) • Year Published: 2008 • Tool Type: Quantification protocol ‐ offsets
• Assessment level: Project level • Geographical coverage: Global • Practices covered: Livestock waste management • GHG covered: CO2, CH4, N2O
DescriptionOffset accounting methodology generally applicable to livestock farm manure management to capture and destroy methane from stored manure.
Main Purpose of Tool• To enable generating CERs from CDM projects that reduce CH4 emissions from livestock manure management.
General MethodologyEquations using manure management system‐ and climate specific methane conversion factor (MCF) for the baseline CH4 emission calculations, obtained from IPCC 2006 Guidelines. • For N2O emissions, site‐specific, regional or national emission factors are preferred; otherwise default emission factors from IPCC 2006 Guidelines (IPCC, 2006) can be used; and
• Uncertainty is not addressed in this protocol. Validation/ verification: • CDM process: validation/verification of offset project by a DOE; and • Approval by CDM Executive Board. More Info: http://cdm.unfccc.int/methodologies/index.htmlSee CDM (2008).

Contract # GS‐23F‐8182H, Report of GHG Tools: Models 71 | P a g e
CDM (small scale)III.A. Nitrogen Fertilizer offset Clean Development Mechanism methodologies
III.A. Offsetting of synthetic nitrogen fertilizers by inoculant application in legumes‐grass rotations on acidic soils on existing cropland
General Information• Origin: International • Authors/Developers: Perspectives GmbH • Year Published: 2010 • Tool Type: Quantification protocol ‐ offsets
• Assessment level: Project level • Geographical coverage: Global • Practices covered: Grass‐legume cropping; Nitrogen
management • GHG covered: N2O, CO2, CH4
DescriptionOffset accounting methodology for CDM projects where soybeans are inoculated with rhizobium on acidic soils in grass‐legume cropping rotation systems where no previous inocula were used as a means to reduce fertilizer N inputs.
Main Purpose of Tool• To enable generating CERs from CDM projects that reduce CO2 emissions from N‐fertilizer use.
General Methodology• Equations using local values or default IPCC Tier 1 values for emission factors (for CO2 emissions from production of fertilizer or inoculum); and
• Uncertainty is not addressed in this protocol. Validation/ verification: • CDM process: validation/verification of offset project by a DOE; and • Approval by CDM Executive Board. Measurements/ Monitoring: • A number of parameters are required to be monitored (amount of inoculant applied, amount of urea and other fertilizers, crop yield).
More Info: http://cdm.unfccc.int/methodologies/index.htmlSee CDM (2009).

Contract # GS‐23F‐8182H, Report of GHG Tools: Models 72 | P a g e
Climate Leaders A/R
General Information• Origin: U.S. • Authors/Developers: Climate Leaders (EPA industry‐
government partnership) • Year Published: 2008 • Tool Type: Quantification protocol
• Assessment level: Project level • Geographical coverage: U.S. • Practices covered: Afforestation, reforestation • GHG covered: CO2 (indirect, through C sequestered in
organic carbon pools) Description
A performance standard based accounting methodology for GHG offset projects that introduce forest planting on cropland or pasture. The accounting methodology presented in this paper addresses the eligibility of afforestation/reforestation projects as greenhouse gas offset projects and provides measurement and monitoring guidance.
Main Purpose of Tool• To ensure that the GHG emission reductions from afforestation/reforestation project offsets are credible.
General Methodology• The Reforestation Afforestation Project Carbon Online Estimator (RAPCOE) is referenced as a tool to simplify the quantification process;
• The recommended default approach is to use FORCARB2 (Heath et al., 2010) stand level and wood product forest carbon look‐up tables, which are part of the 1605(b) reporting guidance (DOE, 2007) for forestry projects. These tables provide estimates of in situ carbon storage levels on a per‐acre and per‐hectare basis, starting in year 5 after conversion, and reporting at 5 or 10 year time intervals for the different forest carbon pools;
• Leakage is calculated using default regional or national leakage rates; and • Uncertainty is not addressed in this protocol. Validation/ verification: • By EPA. Measurements/ Monitoring: • Monitoring requirements apply either through modeling or through measurements. More Info: http://www.epa.gov/climateleaders/resources/optional‐module.htmlSee EPA (2008b).

Contract # GS‐23F‐8182H, Report of GHG Tools: Models 73 | P a g e
Climate Leaders Manure Climate Leaders: Offset Project Methodology for Managing Manure with Biogas Recovery Systems
General Information• Origin: U.S. • Authors/Developers: Climate Leaders (EPA industry‐
government partnership) • Year Published: 2008 • Tool Type: Quantification protocol
• Assessment level: • Geographical coverage: U.S. • Practices covered: Livestock farms (dairy, swine), Dairy
and swine waste management • GHG covered: CH4, N2O, CO2
DescriptionA performance standard based accounting methodology for GHG offset projects that introduce methane collection and combustion (biogas recovery system) into a dairy or swine manure management system at an existing farm. The accounting methodology presented in this paper addresses the eligibility of manure management methane collection and combustion projects as greenhouse gas offset projects and provides measurement and monitoring guidance.
Main Purpose of Tool• To ensure that the GHG emission reductions from manure management methane collection and combustion project offsets are credible.
General Methodology• Protocol uses calculations following IPCC 2006 guidance, using site‐specific data (e.g., animal weights, fuel use), default parameters (e.g., VS, N excreted, CH4 generation potential, CH4 conversion factors from published literature) and default emission factors (EPA, 2009) provided in Annex to the protocol. However, protocol encourages the use of project‐specific factors; and
• Uncertainty is not addressed in this protocol. Validation/ verification: • By EPA. Measurements/ Monitoring: • Farm‐specific data input is needed in calculations, which requires measurement of farm animal weights and fuel use; and • Project monitoring requirements apply either through modeling (equations) or through measurements (biogas flow rate and CH4 content of biogas).
More Info: http://www.epa.gov/climateleaders/resources/optional‐module.htmlSee EPA (2008a).
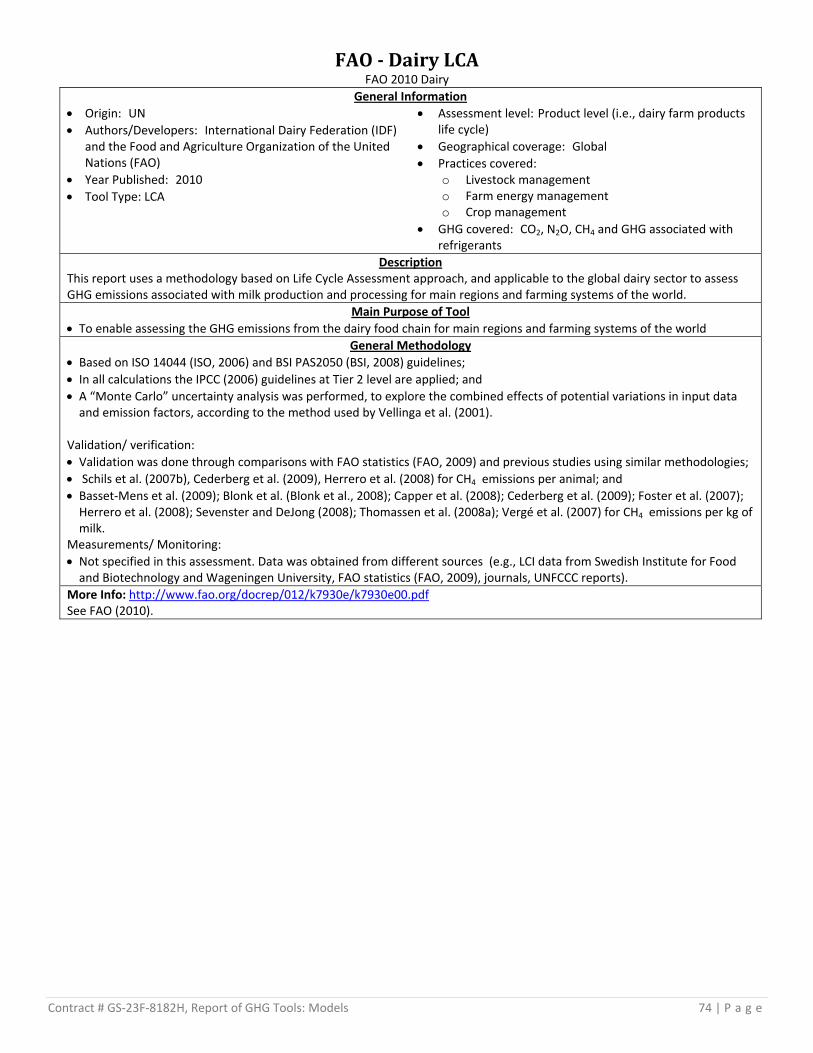
Contract # GS‐23F‐8182H, Report of GHG Tools: Models 74 | P a g e
FAO Dairy LCA FAO 2010 Dairy
General Information• Origin: UN • Authors/Developers: International Dairy Federation (IDF)
and the Food and Agriculture Organization of the United Nations (FAO)
• Year Published: 2010 • Tool Type: LCA
• Assessment level: Product level (i.e., dairy farm products life cycle)
• Geographical coverage: Global • Practices covered:
o Livestock management o Farm energy management o Crop management
• GHG covered: CO2, N2O, CH4 and GHG associated with refrigerants
DescriptionThis report uses a methodology based on Life Cycle Assessment approach, and applicable to the global dairy sector to assess GHG emissions associated with milk production and processing for main regions and farming systems of the world.
Main Purpose of Tool• To enable assessing the GHG emissions from the dairy food chain for main regions and farming systems of the world
General Methodology• Based on ISO 14044 (ISO, 2006) and BSI PAS2050 (BSI, 2008) guidelines; • In all calculations the IPCC (2006) guidelines at Tier 2 level are applied; and • A “Monte Carlo” uncertainty analysis was performed, to explore the combined effects of potential variations in input data and emission factors, according to the method used by Vellinga et al. (2001).
Validation/ verification: • Validation was done through comparisons with FAO statistics (FAO, 2009) and previous studies using similar methodologies; • Schils et al. (2007b), Cederberg et al. (2009), Herrero et al. (2008) for CH4 emissions per animal; and • Basset‐Mens et al. (2009); Blonk et al. (Blonk et al., 2008); Capper et al. (2008); Cederberg et al. (2009); Foster et al. (2007); Herrero et al. (2008); Sevenster and DeJong (2008); Thomassen et al. (2008a); Vergé et al. (2007) for CH4 emissions per kg of milk.
Measurements/ Monitoring: • Not specified in this assessment. Data was obtained from different sources (e.g., LCI data from Swedish Institute for Food and Biotechnology and Wageningen University, FAO statistics (FAO, 2009), journals, UNFCCC reports).
More Info: http://www.fao.org/docrep/012/k7930e/k7930e00.pdfSee FAO (2010).

Contract # GS‐23F‐8182H, Report of GHG Tools: Models 75 | P a g e
GHG protocol LULUCF The Greenhouse Gas Protocol ‐ The Land Use, Land‐Use Change, and Forestry Guidance for GHG Project Accounting
General Information• Origin: International • Authors/Developers: World Resource Institute (WRI) • Year Published: 2006 • Tool Type: Guidelines
• Assessment level: Project level • Geographical coverage: Global • Practices covered: Reforestation, Forest management • GHG covered: CO2 (and N2O, only as secondary effect)
DescriptionThe LULUCF Guidance was developed by the WRI to supplement the GHG Protocol for Project Accounting (Project Protocol). This document provides specific guidance to quantify and report GHG reductions from LULUCF project activities.
Main Purpose of Tool• To facilitate the use of the Project GHG Protocol for LULUCF project activities and to provide a credible and transparent approach to quantifying and reporting GHG reductions from GHG projects.
General Methodology• Allows quantification methods based on direct measurements, values taken from the scientific literature, carbon models, or some combination of these; and
• Uncertainty is briefly addressed. Some basic guidance is provided on how to address, minimize and report on uncertainty. Validation/ verification: • Not addressed. Measurements/ Monitoring: • Requires monitoring and measurement of GHG reductions. More Info: http://www.ghgprotocol.org/standards/project‐protocolSee Greenhalgh et al. (2006).

Contract # GS‐23F‐8182H, Report of GHG Tools: Models 76 | P a g e
IPCC – AFOLU IPCC 2006 Guidelines for National Greenhouse Gas Inventories, Volume 4: Agriculture, Forestry and Other Land Use
General Information• Origin: International • Authors/Developers: IPCC (lead author: Keith Paustian) • Year Published: 2006 • Tool Type: Guidelines
• Assessment level: Developed for country‐level accounting, but approach can be (has been) used for entity‐level GHG emissions accounting as well.
• Geographical coverage: Global • Practices covered:
o Cropland o Forest land o Grassland o Wetlands o Settlements o Other Land
• GHG covered: CO2, N2O, CH4 Description
International guidelines for preparing annual GHG inventories in the AFOLU sector. Main Purpose of Tool
• To improve consistency and completeness in the estimation and reporting of greenhouse gas emissions and removals in the AFOLU sector.
General MethodologyThree Tier‐approach: • Tier 1: IPCC equations and default parameters (e.g., emission factors); • Tier 2: Country‐ or region‐specific emission and stock change factors; • Tier 3: includes the use of models or measurement systems and high resolution activity data disaggregated at sub‐national
level; Guidance on how to account for uncertainty is provided for the different Tier approaches. Validation/Verification: • None. Measurements/Monitoring: • See Measurement‐based Tier 3 approach guidelines. More Info: http://www.ipcc‐nggip.iges.or.jp/public/2006gl/vol4.htmlSee IPCC (2006).

Contract # GS‐23F‐8182H, Report of GHG Tools: Models 77 | P a g e
Managing Energy and Carbon Managing Energy and Carbon ‐ Energy Audit Manual
General Information• Origin: UK • Authors/Developers: Centre for Alternative Land Use
(CALU, a partnership between Bangor University, Glyndwr University, ADAS Wales Ltd, Coed Cymru, and Coleg Llysfasi) and ADAS Wales environmental consultancy
• Year Published: Not specified • Tool Type: Quantification protocol
• Assessment level: Farm‐level • Geographical coverage: UK • Practices covered: Farm energy management • GHG covered: CO2
DescriptionThis is an energy audit manual which provides guidelines for calculating CO2 emissions from energy use on farm. The guide also provides an overview of energy management issues and provides a series of enterprise sheets where real data can be compared to industry averages. The final part of the guide is a checklist of actions which can be implemented to improve on‐farm energy efficiency.
Main Purpose of Tool• This practical guide aims at helping farmers and growers audit their energy usage.
General MethodologyEquations using default emission factors per energy type. Uncertainty is not addressed in this protocol. Validation/ verification: • Not specified. Measurements/ Monitoring: • None. More Info: http://www.calu.bangor.ac.uk/Technical%20leaflets/Energyauditmanual.pdf

Contract # GS‐23F‐8182H, Report of GHG Tools: Models 78 | P a g e
Millar et al., 2010 Nitrogen fertilizer management for nitrous oxide (N2O) mitigation in intensive corn (Maize) production: an emissions reduction
protocol for U.S. Midwest agriculture
General Information• Origin: U.S. • Authors/Developers: Neville Millar & G. Philip Robertson &
Peter R. Grace & Ron J. Gehl & John P. Hoben • Year Published: 2010 (proposed methodology in peer‐reviewed
article) • Tool Type: Quantification methodology (proposal)
• Assessment level: Site level • Geographical coverage: U.S. • Practices covered: Cropland, Nitrogen management • GHG covered: N2O
DescriptionThe paper proposes a quantitative N2O reduction protocol by reducing fertilizer over‐application via crop rotation and reduced N‐fertilizer application, with using emission reduction credits as incentive. The paper provides a quantification method for direct N2O emissions from agricultural soils as a result of N fertilizer application.
Main Purpose of Tool• To enable agricultural offset project developers to generate fungible GHG emission reduction credits for the emerging U.S. carbon cap and trade market, from reduced fertilizer N rate.
• Overall goal is to avoid over‐application of N fertilizer. General Methodology
• N2O emission reduction calculations backed up by field samples. Field data was used to generate relationship between N application rate and direct N2O emissions, to obtain a modified IPCC Tier 1 linear relationship. The protocol also proposes a non‐linear Tier 2 relationship as an alternative, regional specific approach, using regionally relevant emission factors; and
• No indirect N2O emissions are accounted for. Validation/ verification: • No validation thus‐far. Measurements/ Monitoring: • No measurements other than N fertilizer application rate are required. More Info: http://www.kbs.msu.edu/images/stories/docs/robertson/Millar_Robertson_et_al_2010_N2O_Mitigation_Adaptation_Strat_Global_Change.pdf See Millar et al., (2010).

Contract # GS‐23F‐8182H, Report of GHG Tools: Models 79 | P a g e
RGGI Afforestation Regional Greenhouse Gas Initiative: Afforestation
General Information• Origin: U.S. • Authors/Developers: RGGI member states (Northeast and
Mid‐Atlantic) • Year Published: 2008 • Tool Type: Quantification protocol
• Assessment level: Project level • Geographical coverage: RGGI member states in the U.S. • Practices covered: Land‐use management (afforestation) • GHG covered: CO2 (indirect, through C sequestered)
DescriptionOffset accounting methodology for afforestation projects using native tree species with the intent of promoting the restoration and sustainable management of native forests where lands have not been forested for at least 10 years prior.
Main Purpose of Tool• To enable generating RGGI CO2 offset allowances from afforestation projects, by providing the requirements for determination of offset project and the award of CO2 offset allowances, and to ensure that offset projects represent GHG emissions reductions or carbon sequestration that are real, additional, verifiable, enforceable, and permanent.
General Methodology• Quantification is based on direct measurement procedures, consistent with the guidance contained in the U.S. DOE 1605(b) (DOE, 2007) technical guidelines for forest projects.
• Uncertainty not addressed in protocol. Validation/ verification: • Independent verification by an accredited independent offset project verifier. Measurements/ Monitoring: • Monitoring requirements apply. All C pools must be quantified by direct measurement. More Info: http://www.rggi.org/market/offsets/offset_requirementshttp://www.rggi.org/docs/Model%20Rule%20Revised%2012.31.08.pdf See RGGI (2007).

Contract # GS‐23F‐8182H, Report of GHG Tools: Models 80 | P a g e
RGGI Manure Regional Greenhouse Gas Initiative: Manure Management
General Information• Origin: U.S. • Authors/Developers: RGGI member states (Northeast and
Mid‐Atlantic) • Year Published: 2008 • Tool Type: Quantification protocol
• Assessment level: Project level • Geographical coverage: RGGI member states in the U.S. • Practices covered: Livestock waste management • GHG covered: CH4, CO2
DescriptionAccounting methodology for methane emission avoidance through capture and destruction from stored livestock manure.
Main Purpose of Tool• To enable generating RGGI CO2 offset allowances from manure methane capture and destruction, by providing the requirements for determination of offset project and the award of CO2 offset allowances, and to ensure that offset projects represent GHG emissions reductions or carbon sequestration that are real, additional, verifiable, enforceable, and permanent.
General Methodology• Quantification using IPCC default factors to model emissions before covering, and metered captured methane in project to measure biogas combusted; and
• Modeling approach uses EPA methods for estimating input of total and volatile solids from manure and for modeling baseline emissions of CH4, which includes Van't Hoff Arrhenius factor to convert VS to CH4 (using monthly temperature data).
Validation/ verification: • Independent verification by an accredited independent offset project verifier. Measurements/ Monitoring: • Monitoring requirements apply. Ex‐post metering of biogas volumetric flow rate and determination of CH4 concentration are required; and
• Other measurement requirements for data input in calculations include: total solids, volatile solids, monthly temperature. More Info: http://www.rggi.org/market/offsets/offset_requirementshttp://www.rggi.org/docs/Model%20Rule%20Revised%2012.31.08.pdf See RGGI (2007).

Contract # GS‐23F‐8182H, Report of GHG Tools: Models 81 | P a g e
Smith et al. 2006 Methods for Calculating Forest Ecosystem and Harvested Carbon with Standard Estimates for Forest Types of the United States
General Information• Origin: U.S. • Authors/Developers: USDA Forest Service (James E.
Smith, Linda S. Heath, Kenneth E. Skog, Richard A. Birdsey) • Year Published: 2006 • Tool Type: Quantification methodology
• Assessment level: Site level • Geographical coverage: U.S. • Practices covered: Forests • GHG covered: CO2 (through change in C stocks)
DescriptionThis study presents techniques for calculating average net annual additions to carbon in forests and in forest products in the United States (including reforestation and afforestation). This methodology has been adopted by the U.S. Voluntary Greenhouse Gas Reporting Program, 1605(b) (DOE, 2007, Forest Appendix).
Main Purpose of Tool• To enable consistent and reliable estimation of carbon emissions, emission reductions, or sequestration from forestry activities.
General Methodology• Carbon estimates are derived from the individual carbon‐pool estimators in FORCARB2 model (Heath et al., 2010), a national empirical simulation and carbon‐accounting model that produces stand‐level, inventory‐based estimates of carbon stocks for forest ecosystems and regional estimates of carbon in harvested wood;
• This study provides look‐up tables for forest carbon stocks and carbon in harvested wood, categorized by region, forest type, previous land use, and, in some cases, productivity class and management intensity. Age‐volume relationships in the tables are based on information from the timber projection model ATLAS. Tables represent an update of previous tables published by Birdsey (1996), by using new inventory surveys, forest carbon and timber projection models, and a more precise definition of carbon pools;
• The estimates and methods are consistent with U.S. DOE 1605(b) VR (DOE, 2007) reporting guidelines and IPCC guidelines; • Uncertainty is addressed in this study, but no uncertainty estimates around look‐up table values are provided; only mentions that uncertainty analysis was performed by studies from which look‐up table values were derived.
Validation/ verification: • Not specified. Measurements/ Monitoring: • No measurements needed. User only has to work with look‐up tables. More Info: http://nrs.fs.fed.us/pubs/8192 http://www.nrs.fs.fed.us/carbon/local‐resources/downloads/Std_C_tables_NE343.pdf See Smith et al. (2006).

Contract # GS‐23F‐8182H, Report of GHG Tools: Models 82 | P a g e
UNDP GEF United Nations Development Programme: Guidelines for C assessments of GEF (Global Environmental Facility) Projects
General Information• Origin: UN • Authors/Developers: Winrock International, and Indian
Institute of Science, Bangalore, India • Year Published: 2005 • Tool Type: Guidelines
• Assessment level: Project level • Geographical coverage: Global • Practices covered:
o Forest conservation and forest management o Restoration of grazing lands or wetlands o Improved management of cropland or grazing lands
• GHG covered: CO2 (through change in C stocks), N2O, CH4 Description
These guidelines provide methods for measuring and estimating carbon stocks and the changes in carbon stocks that may result from relevant GEF project interventions. Methods are proposed for estimating all relevant carbon pools as well as emissions, or avoided emissions, of non‐CO2 greenhouse gases.
Main Purpose of Tool• These guidelines seek to present user‐friendly, yet rigorous, methods for assessment of carbon stock and stock changes that may result from relevant GEF project interventions. The guidelines provide a means to evaluate project achievements and the potential for generating carbon credits.
General MethodologyEquations for estimating C stocks and C stock changes are based on measured forest data, tree biomass equations and belowground biomass regression models (from published literature), default expansion factors and soil measurements (bulk density, C concentration). Guidelines provide overview of published tree biomass allometric equations in Appendix D (e.g., Brown, 1997; Brown and Schroeder, 1999; Jenkins et al., 2003), but also provide guidance on how to develop local biomass equations. The methods for estimating CH4 and N2O emissions are based on IPCC Good Practice Guidance for Land Use, Land‐Use Change and Forestry (IPCC, 2003). Uncertainty is assessed by either complex Monte Carlo analysis, or a simple approach using the 95% confidence intervals around each estimated C pool. Validation/ verification: • Not addressed. Measurements/ Monitoring: • Guidance provided on developing a robust measuring and monitoring plan; • Guidance provided on how to decide which C pools need to be measured for C assessments, i.e., which pools will show a significant change in carbon, or could show a significant change in carbon for different project types;
• Guidance is provided on how to determine the type, number and location of measurement plots and frequency of measurements; and
• Guidance is provided on how to perform measurements of biomass and soil C stocks. More Info: http://www.winrock.org/ecosystems/files/GEF_Guidebook.pdfSee Pearson et al. (2005).

Contract # GS‐23F‐8182H, Report of GHG Tools: Models 83 | P a g e
USAID FCC: Agroforestry Tool USAID Forest Carbon Calculators: Agroforestry Tool
General Information• Origin: U.S. • Authors/Developers: Winrock International under USAID
Cooperative Agreement • Year Published: 2010 • Tool Type: Quantification protocol
• Assessment level: Project level • Geographical coverage: Tropical/Subtropical regions • Practices covered: Land‐use management (agroforestry) • GHG covered: CO2
DescriptionThis protocol provides a background guidance document describing the calculations underlying the agroforestry carbon calculator. This calculator produces estimates of sequestration or avoided emissions of CO2eq of USAID sponsored forestry‐related projects, in this particular case from agroforestry projects.
Main Purpose of Tool• To provide support and background to the USAID Forest Carbon Calculators. The reports outline the data and equations used to develop the different FCC calculators.
General MethodologyEquations, using parameters derived from models based on published literature; and Uncertainty is not addressed in this protocol. More Info: http://winrock.stage.datarg.net/gcc/login.aspx?ReturnUrl=%2fgcc%2fdefault.aspxSee Casarim et al. (2010)

Contract # GS‐23F‐8182H, Report of GHG Tools: Models 84 | P a g e
USAID FCC: Afforestation/Reforestation Tool USAID Forest Carbon Calculators: Afforestation/Reforestation Tool
General Information• Origin: U.S. • Authors/Developers: Winrock International under USAID
Cooperative Agreement • Year Published: 2009 • Tool Type: Quantification protocol
• Assessment level: Project level • Geographical coverage: Tropical/Subtropical regions • Practices covered: Land‐use management (afforestation/
reforestation) • GHG covered: CO2
DescriptionThis protocol provides a background guidance document describing the calculations underlying the Afforestration/ Reforestation carbon calculator. This calculator produces estimates of sequestration or avoided emissions of CO2eq of USAID sponsored forestry‐related projects, in this particular case from afforestation or reforestation projects.
Main Purpose of Tool• To provide support and background to the USAID Forest Carbon Calculators. The reports outline the data and equations used to develop the different FCC calculators.
General MethodologyEquations, using default parameters (aboveground biomass accumulation rate and root‐to‐shoot ratio) per ecological zone (FAO ecological zone map) based on IPCC guidelines for AFOLU (IPCC, 2006); and Uncertainty is not addressed in this protocol.
More Info: http://winrock.stage.datarg.net/gcc/login.aspx?ReturnUrl=%2fgcc%2fdefault.aspx See Harris et al. (2009a).

Contract # GS‐23F‐8182H, Report of GHG Tools: Models 85 | P a g e
USAID FCC: Forest Management Tool USAID Forest Carbon Calculators: Forest Management Tool
General Information• Origin: U.S. • Authors/Developers: Winrock International under USAID
Cooperative Agreement • Year Published: 2010 • Tool Type: Quantification protocol
• Assessment level: Project level • Geographical coverage: Tropical/Subtropical regions • Practices covered: Forest management • GHG covered: CO2
DescriptionThis protocol provides a background guidance document describing the calculations underlying the Forest Management carbon calculator. This calculator will estimate the total benefit from stopping logging and reduced impact logging.
Main Purpose of Tool• To provide support and background to the USAID Forest Carbon Calculators. The reports outline the data and equations used to develop the different FCC calculators.
General MethodologyEquations, using parameters based on literature : • Winjum et al. (1998), for carbon stored in wood products; • Pinard and Putz (1996), for reduced logging damage to surrounding trees; and • Pereira et al. (2002), Holmes et al. (2002) and Pinard et al. (1995), for reduced damage from roads, skid trails and logging decks.
Uncertainty is not addressed in this protocol. More Info: http://winrock.stage.datarg.net/gcc/login.aspx?ReturnUrl=%2fgcc%2fdefault.aspx See Harris et al. (2009b).

Contract # GS‐23F‐8182H, Report of GHG Tools: Models 86 | P a g e
USAID FCC: Forest Protection Tool USAID Forest Carbon Calculators: Forest Protection Tool
General Information• Origin: U.S. • Authors/Developers: Winrock International under USAID
Cooperative Agreement • Year Published: 2010 • Tool Type: Quantification protocol
• Assessment level: Project level • Geographical coverage: Tropical/Subtropical regions • Practices covered: Forest management (protection) • GHG covered: CO2
DescriptionThis protocol provides a background guidance document describing the calculations underlying the Forest Protection carbon calculator. This calculator will estimate the total benefit from reducing deforestation, fire incidence and illegal logging.
Main Purpose of Tool• To provide support and background to the USAID Forest Carbon Calculators. The reports outline the data and equations used to develop the different FCC calculators.
General MethodologyEquations, using parameters from existing regional and global datasets (e.g., remote sensing imagery, maps) for forest cover, forest biomass stocks, wood density (IPCC); For lost forest sequestration, calculation was based on 2006 IPCC AFOLU guidelines (IPCC, 2006); and Uncertainty is not addressed in this protocol. More Info: http://winrock.stage.datarg.net/gcc/login.aspx?ReturnUrl=%2fgcc%2fdefault.aspx See Harris et al. (2009c).

Contract # GS‐23F‐8182H, Report of GHG Tools: Models 87 | P a g e
VCS AFOLU Voluntary Carbon Standard: Guidance for Agriculture, Forestry and Land Use Projects
General Information• Origin: International • Authors/Developers: VCS Association • Year Published: 2008 • Tool Type: Guidelines
• Assessment level: Project level • Geographical coverage: Global • Practices covered:
o Afforestation, Reforestation and Revegetation (ARR) o Agricultural Land Management (ALM) o Improved Forest Management (IFM) o Reduced Emissions from Deforestation and
Degradation (REDD) • GHG covered: N2O, CH4, CO2
DescriptionGuidance and additional context for users of the Voluntary Carbon Standard (VCS) Agriculture, Forestry and Other land Use (AFOLU) project tools for generating VCS‐approved C credits for voluntary C offset projects.
Main Purpose of Tool• These guidelines have been developed to enable high‐quality AFOLU projects from around the world to generate Voluntary Carbon Units (VCUs) that are credible, robust, permanent and fungible.
General MethodologyQuantification of baseline and project scenario, including leakage assessment, that follow IPCC 2006 guidelines for AFOLU (IPCC, 2006) or approved methodologies under VCS program (i.e., CDM, VCS and CAR methodologies); and Uncertainty follows IPCC 2006 guidelines. For a list of approved VCS methodologies: see http://www.v‐c‐s.org/vcsmethodologies.html For a list of new VCS methodologies under development, see http://www.v‐c‐s.org/methodologies.html Validation/Verification: • Protocols are validated by independent firms approved by CDM or CAR; and • Protocols must be verified (double validation process). Measurements/Monitoring: • All significant GHG sources and leakage needs to be measured, estimated and monitored in both baseline and project case; • All AFOLU projects MUST have robust and credible monitoring protocols for monitoring net emission reductions and GHG
removals; and • Monitoring and ex‐ante quantification must follow A/R CDM methodologies or IPCC guidelines. More Info: http://www.v‐c‐s.org/policydocs.htmlSee VCS (2008a, b).

Contract # GS‐23F‐8182H, Report of GHG Tools: Models 88 | P a g e
VCS AFOLU ARR Voluntary Carbon Standard: Guidance for Agriculture, Forestry and Land Use Projects: Afforestation, Reforestation and Revegetation
General Information• Origin: International • Authors/Developers: VCS Association • Year Published: 2008 • Tool Type: Guidelines
• Assessment level: Project level • Geographical coverage: Global • Practices covered: Afforestation, Reforestation and
Revegetation • GHG covered: N2O, CH4, CO2
DescriptionGuidance and additional context for users of the Voluntary Carbon Standard (VCS) Agriculture, Forestry and Other land Use (AFOLU) project tools for generating VCS‐approved C credits for voluntary C offset Afforestation, Reforestation and Revegetation (ARR) projects.
Main Purpose of Tool• These guidelines have been developed to enable high‐quality Afforestation, Reforestation, Revegetation (ARR) projects from around the world to generate Voluntary Carbon Units (VCUs) that are credible, robust, permanent and fungible.
General MethodologyFollowing IPCC 2006 guidelines for AFOLU (IPCC, 2006) or approved methodologies under VCS (e.g., A/R CDM methodologies). Uncertainty follows IPCC 2006 guidelines. Validation/Verification: • Protocols are validated by independent firms approved by CDM or CAR; and • Protocols must be verified (double validation process). Measurements/Monitoring: • All significant GHG sources and leakage needs to be measured, estimated and monitored in both baseline and project case. More Info: http://www.v‐c‐s.org/policydocs.htmlSee VCS (2008a, b)

Contract # GS‐23F‐8182H, Report of GHG Tools: Models 89 | P a g e
VCS AFOLU ALM Voluntary Carbon Standard: Guidance for Agriculture, Forestry and Land Use Projects: Agricultural Land Management
General Information• Origin: International • Authors/Developers: VCS Association • Year Published: 2008 • Tool Type: Guidelines
• Assessment level: Project level • Geographical coverage: Global • Practices covered: Cropland and grassland conversions
and management: o Improved cropland management activities; o Improved grassland management activities; and o Cropland and grassland land‐use conversions (e.g.,
crop to perennial grass; degraded pasture to orchard crop or agroforestry).
• GHG covered: N2O, CH4, CO2 Description
Guidance and additional context for users of the Voluntary Carbon Standard (VCS) Agriculture, Forestry and Other land Use (AFOLU) project tools for generating VCS‐approved C credits for voluntary C offset Agricultural Land Management (ALM) projects.
Main Purpose of Tool• These guidelines have been developed to enable high‐quality Afforestation, Reforestation, Revegetation (ARR) projects from around the world to generate Voluntary Carbon Units (VCUs) that are credible, robust, permanent and fungible.
General MethodologyFollowing IPCC 2006 guidelines for AFOLU (IPCC, 2006)or approved methodologies under VCS. Uncertainty follows IPCC 2006 guidelines. Validation/Verification: • Protocols are validated by independent firms approved by CDM or CAR; and • Protocols must be verified (double validation process). Measurements/Monitoring: • All significant (5% de minimis) GHG sources and leakage needs to be measured, estimated and monitored in both baseline
and project case; and • Specific guidance is provided for measuring soil C (as well as N2O and CH4 project emissions. More Info: http://www.v‐c‐s.org/policydocs.htmlSee VCS (2008a, b).

Contract # GS‐23F‐8182H, Report of GHG Tools: Models 90 | P a g e
VCS AFOLU IFM Voluntary Carbon Standard: Guidance for Agriculture, Forestry and Land Use Projects: Improved Forest Management
General Information• Origin: International • Authors/Developers: VCS Association • Year Published: 2008 • Tool Type: Guidelines
• Assessment level: Project level • Geographical coverage: Global • Practices covered: Improved Forest Management:
o Conversion from conventional to reduced impact logging;
o Conversion of logged to protected forests; o Extending the rotation age of evenly aged managed
forests; and o Conversion of low‐productive to high‐productive
forests. • GHG covered: N2O, CH4, CO2
DescriptionGuidance and additional context for users of the Voluntary Carbon Standard (VCS) Agriculture, Forestry and Other land Use (AFOLU) project tools for generating VCS‐approved C credits for voluntary C offset Improved Forest Management (IFM) projects.
Main Purpose of Tool• These guidelines have been developed to enable high‐quality ARR projects from around the world to generate Voluntary Carbon Units (VCUs) that are credible, robust, permanent and fungible.
General MethodologyFollowing IPCC 2006 guidelines for AFOLU (IPCC, 2006) or approved methodologies under VCS (e.g., CAR forest project protocol‐ Climate Action Reserve, 2010a). Uncertainty follows IPCC 2006 guidelines. Validation/Verification: • Protocols are validated by independent firms approved by CDM or CAR; and • Protocols must be verified (double validation process). Measurements/Monitoring: • All significant (5% de minimis) GHG sources and leakage needs to be measured, estimated and monitored in both baseline
and project case. More Info: http://www.v‐c‐s.org/policydocs.htmlSee VCS (2008a, b).

Contract # GS‐23F‐8182H, Report of GHG Tools: Models 91 | P a g e
VCS AFOLU REDD Voluntary Carbon Standard: Guidance for Agriculture, Forestry and Land Use Projects: Reduced Emissions from Deforestation and
Degradation General Information
• Origin: International • Authors/Developers: VCS Association • Year Published: 2008 • Tool Type: Guidelines
• Assessment level: Project level • Geographical coverage: Global • Practices covered: Forest protection:
o Reduction in the conversion of native or natural forests to non‐forest land, that would be deforested in the absence of the REDD project activity
• GHG covered: N2O, CH4, CO2 Description
Guidance and additional context for users of the Voluntary Carbon Standard (VCS) Agriculture, Forestry and Other land Use (AFOLU) project tools for generating VCS‐approved C credits for voluntary C offset Reduced Emissions from Deforestation and Degradation (REDD) projects.
Main Purpose of Tool• These guidelines have been developed to enable high‐quality ARR projects from around the world to generate Voluntary Carbon Units (VCUs) that are credible, robust, permanent and fungible.
General MethodologyFollowing IPCC 2006 guidelines for AFOLU (IPCC, 2006) or approved methodologies under VCS (e.g., CAR forest project protocol‐ Climate Action Reserve, 2010a). Uncertainty follows IPCC 2006 guidelines. Validation/Verification: • Protocols are validated by independent firms approved by CDM or CAR; and • Protocols must be verified (double validation process). Measurements/Monitoring: • All significant (5% de minimis) GHG sources and leakage needs to be measured, estimated and monitored in both baseline
and project case. More Info: http://www.v‐c‐s.org/policydocs.html See VCS (2008a, b).

Contract # GS‐23F‐8182H, Report of GHG Tools: Models 92 | P a g e
VCS VM0003 Approved VCS Methodology VM0003 “Methodology for Improved Forest Management through Extension of Rotation Age”
General Information• Origin: International • Authors/Developers: Ecotrust • Year Published: 2010 • Tool Type: Quantification protocol
• Assessment level: Project level • Geographical coverage: Global • Practices covered: Improved Forest Management,
Extension in rotation age • GHG covered: CH4, CO2 (only as change in C stock)
DescriptionOffset accounting protocol for generating VCS approved C credits for voluntary C offset from VCS Improved Forest Management (IFM) project activities involving extension of rotation age.
Main Purpose of Tool• The methodology has been developed to enable generating Voluntary Carbon Units (VCUs) from VCS improved forest management project activities through extension of rotation age.
General Methodology• Largely following CDM approach for Afforestation and Reforestation projects (AR‐ACM0001); • Protocol provides a number of equations to calculate GHG emissions and removals in baseline and project scenario, including IPCC default factors;
• Changes in C stocks in the baseline scenario must be estimated using peer‐reviewed forestry models (e.g., FVS); • Verifiable changes in C stocks in project scenario are estimated following IPCC GPG LULUCF (2003) equations; and • Uncertainty must be accounted for and obtained from IPCC guidelines (2006) for default values, from statistical sampling, measurements or literature.
Validation/Verification: • Protocol has been validated and approved by VCS. More Info: http://www.v‐c‐s.org/VM0003.html See VCS (2010a).

Contract # GS‐23F‐8182H, Report of GHG Tools: Models 93 | P a g e
VCS Biochar (under development) General Methodology for Quantifying the Greenhouse Gas Emission Reductions from the Production and Incorporation of Soil of
Biochar in Agricultural and Forest Management Systems
General Information• Origin: International • Authors/Developers: Carbon Gold • Year Published: Under development • Tool Type: Quantification protocol
• Assessment level: Project level • Geographical coverage: Global • Practices covered: Cropland, Grassland, Managed forest
land • GHG covered: CO2, N2O, CH4
DescriptionOffset accounting protocol for generating VCS approved C credits for voluntary C offset from VCS ALM or IFM project activities involving incorporation of biochar in agricultural and forest systems. This methodology applies to projects that increase the carbon stocks in soils by treating crop residues or other biomass produced as part of agricultural activities or forest management through controlled pyrolysis. The resulting carbon rich residue is applied to soils. Due to the project activity, net GHG emissions from cropland, grassland or managed forest land will be reduced by increasing carbon stocks in soils.
Main Purpose of Tool• The methodology has been developed to enable generating Voluntary Carbon Units (VCUs) from VCS Improved Forest Management (IFM) project or Agricultural Land Management (ALM) project activities through pyrolysis of residues and application of biochar to soil.
General Methodology• Largely following CDM small‐scale methodology AMS‐III.L and AMS‐III.E and CDM A/R methodologies; • Calculations follow basic equations with emission factors (not clear which EF should be used); and • For baseline C storage in residue and soil, model‐based IPCC Tier 3 approach needs to be followed. For soil C stock estimates, Century or SCUAF soil organic matter model 8 must be used.
Validation/ verification: • Under development (will have to be validated and approved by VCS). Measurements/ Monitoring: • Measurement and monitoring requirements apply (residue amounts, biochar composition, fuel use); and • Potential leakage effects need to be monitored. More Info: http://www.v‐c‐s.org/methodology_gmfqtgger.htmlSee VCS (2009c).

Contract # GS‐23F‐8182H, Report of GHG Tools: Models 94 | P a g e
VCS SALM (under development) VCS: Adoption of Sustainable Agricultural Land Management
General Information• Origin: International • Authors/Developers: BioCarbon Fund, World Bank • Year Published: Under development • Tool Type: Quantification protocol
• Assessment level: Project level • Geographical coverage: Global • Practices covered: Crop management, Land use
management, Residue/Waste management • GHG covered: CO2, N2O, CH4
DescriptionAgricultural offset accounting methodology for increased rotations, displacing fossil‐fuel‐based inputs, planting trees and establishing grassland.
Main Purpose of Tool• The methodology has been developed to enable generating Voluntary Carbon Units (VCUs) from project activities that reduce emissions in agriculture by applying sustainable land management practices (SALM).
General Methodology• The methodology uses input parameters to existing analytical models accepted in scientific publications (e.g., RothC or Century) for estimation of soil organic C in each of the identified management practices;
• N2O emissions from fertilizer use and C stocks in woody perennials follow CDM A/R methodologies; • Protocol provides tools (equation‐based) for calculating N2O emissions from N‐fixers and residue, and for N2O and CH4 emissions from burning residue; and
• Protocol does not address uncertainty. Validation/ verification: • Under development (will have to be validated and approved by VCS). Measurements/ Monitoring: • Several parameters need to be measured (e.g., biomass production, biomass left on the fields, amount of manure and N fertilizer input).
More Info: http://www.v‐c‐s.org/methodology_salm.htmlSee VCS (2009b).

Contract # GS‐23F‐8182H, Report of GHG Tools: Models 95 | P a g e
VCS Afforestation/ Reforestation (under development) VCS Methodology UNDER DEVELOPMENT: Afforestation/Reforestation of Agricultural Lands
General Information• Origin: International • Authors/Developers: Forest Systems Services, LLC and
Winrock international • Year Published: Under development • Tool Type: Quantification protocol
• Assessment level: Project level • Geographical coverage: Global • Practices covered: Afforestation/ reforestation • GHG covered: CO2 (indirect, through C sequestered in
organic carbon pools) Description
Afforestation offset accounting methodology intended to provide guidance for future afforestation methodologies for projects with tree planting on land with no trees in previous 10 years, displacing crops, grazing and/or fuel wood production.
Main Purpose of Tool• The methodology has been developed to enable generating Voluntary Carbon Units (VCUs) from projects that convert agricultural and grazing lands to forest plantations.
General MethodologyThe methodology borrows heavily from already approved CDM methodologies and tools. Uncertainty needs to be accounted for (equations provided in protocol). Validation/ verification: • Under development (will have to be validated and approved by VCS). Measurements/ Monitoring: • Measurement and monitoring requirements are provided for C stock changes, GHG emissions and leakage. More Info: http://www.v‐c‐s.org/methodology_aroal.htmlSee VCS (2009a).

Contract # GS‐23F‐8182H, Report of GHG Tools: Models 96 | P a g e
VCS N Fertilizer Rate Reduction (under development) VCS Methodology UNDER DEVELOPMENT: Quantifying N2O Emissions Reductions in U.S. Agricultural Crops through N Fertilizer Rate
Reduction
General Information• Origin: International • Authors/Developers: Electric Power Research Institute
(EPRI) ‐ Michigan State University • Year Published: Under development • Tool Type: Quantification protocol
• Assessment level: Project level • Geographical coverage: Global • Practices covered: Cropland, Nitrogen management • GHG covered: N2O
DescriptionThis offset accounting methodology describes how to quantify emissions reductions of nitrous oxide from U.S. agriculture, brought about by reductions in the rate of nitrogen fertilization to annual cropping systems.
Main Purpose of Tool• The methodology has been developed to enable generating Voluntary Carbon Units (VCUs) from projects that reduce net N2O emissions from agricultural cropping systems by reducing nitrogen (N) fertilizer rate.
General Methodology• The protocol is largely based on the 2006 IPCC Guidelines for National Greenhouse Gas Inventories; • Dependent on U.S. state, the methodology utilizes either IPCC Tier 1 default emission factor approach (for states outside the North Central Region, NCR, or corn‐soy rotations within NCR), or an empirically derived, region‐specific emission factor approach (IPCC Tier 2), for states within NCR with corn‐soy rotations, to calculate N2O emission reductions; and
• Guidance provided on how to assess uncertainty. Uncertainty is considered minimal when using Tier 2 approach. Validation/ verification: • Under development (will have to be validated and approved by VCS). Measurements/ Monitoring: • Measurement and monitoring requirements are provided for N fertilizer amounts, N content, crop yields. More Info: http://www.v‐c‐s.org/methodology_qn2o.htmlSee VCS (2010b).

Contract # GS‐23F‐8182H, Report of GHG Tools: Models 97 | P a g e
VCS Sustainable Grassland Management (under development) VCS Methodology UNDER DEVELOPMENT: ALM Adoption of Sustainable Grassland Management through Adjustment of Fire and
Grazing
General Information• Origin: International • Authors/Developers: Soils for the Future and Jadora
International • Year Published: Under development • Tool Type: Quantification protocol
• Assessment level: Project level • Geographical coverage: Global • Practices covered: Grassland • GHG covered: CO2, N2O, CH4
DescriptionThis offset accounting methodology shows how to determine additional carbon offsets through grassland soil sequestration and/or reduction in methane emissions as a result of reducing fire frequency and altering the density and/or activities of grazing animals.
Main Purpose of Tool• The methodology has been developed to enable generating Voluntary Carbon Units (VCUs) from projects that increase soil C stocks and/or reduce CH4 emissions from grasslands due to reduced fire frequency and altered grazing density and activities.
General MethodologyThe baseline changes in SOC based on published soil carbon dynamics models (e.g., RothC, Century). A system similar to IPCC (2006) Tier 2 Soil methodology but using locally derived or measured parameters can also be used; and Uncertainty needs to be accounted for (details provided in protocol). Validation/ verification: • Under development (will have to be validated and approved by VCS). Measurements/ Monitoring: • Measurement and monitoring requirements are provided for (e.g., biomass production used by grazers, number of livestock, C stocks in crop, litter, dead wood, soil C every 3‐10 years).
More Info: http://www.v‐c‐s.org/methodology_alma.htmlSee VCS (2010b).

Contract # GS‐23F‐8182H, Report of GHG Tools: Models 98 | P a g e
Report of GHG Tools
Models

Contract # GS‐23F‐8182H, Report of GHG Tools: Models 99 | P a g e
APEX (EPIC) Agricultural Policy Environmental eXtender
(EPIC: 'Erosion Productivity Impact Calculator' ‐ later name changed into 'Environmental Policy Impact Climate') General Information
• Origin: U.S. • Authors/Developers: Blacklands Research and Extension
Center in Temple, Texas • Year Published: 1995 • Model Type: Process‐based model
• Spatial Scale: Field level, Farm level, Watershet level • Ecosystem/Management Practices covered: Broad range:
from whole farms to small watersheds. Soil management, crop management, N management, land‐use management.
• GHG covered: CO2, N2O Description
APEX is a process‐based model that is capable of simulating management and land use impacts for whole farms and small watersheds on C and N cycles, C and N storage, nutrient loading and losses through volatilization. It also assesses CO2 sequestration via plant growth. APEX is essentially a multi‐field version of the predecessor Erosion Productivity Impact Calculator (EPIC) model and can be executed for single fields similar to EPIC as well as for a whole farm or watershed that is subdivided based on fields, soil types, landscape positions, or sub‐watersheds. A key feature that differentiates APEX/EPIC from other SOM and terrestrial ecosystem models is its capability to estimate SOC losses caused by wind and water erosion.
Main Purpose of Model• APEX was developed to address environmental problems (e.g., water supply and quality, erosion, soil quality, plant productivity and pests) associated with livestock and other agricultural production systems on a whole‐farm or small watershed basis.
General Methodology• Based off of carbon and nitrogen cycling algorithms, initially developed by Izaurralde et al. (2006) for EPIC, which are based on concepts used in the Century model (i.e., kinetic pool approach). However, in contrast to Century, in APEX/EPIC, leaching equations are used to move organic materials from surface litter to subsurface layers. Temperature and water controls affecting transformation rates are calculated with equations. Surface litter fraction has a slow compartment in addition to the metabolic and structural litter components in Century. Last, lignin concentration is modeled as a sigmoidal function of plant age, whereas it is a function of annual precipitation in Century;
• N2O emissions are simulated by adjusting a maximum, empirically determined emission rate using factors that control the total denitrification rate (electron flow, oxygen availability, competitive inhibition among oxides of N);
• EPIC calculates annual changes in bulk density due to changes in soil organic C content caused by soil respiration and erosion using a modified version of the Adams equation (1973); and
• APEX functions on a daily time step. Calibration/validation • Initial testing and calibration of the APEX model was performed using monitoring data collected over periods ranging from 12 to 20 months for eight research plots located in or near the Upper North Bosque River Watershed (UNBRW) that included a range of crop, soil, landscape, and manure management conditions representative of the watershed (Flowers et al., 1996); and
• Further evaluation and calibration of APEX was performed by Gassman (1997) for UNBRW baseline conditions by performing separate 30‐year simulations for individual manure waste application fields associated with all 94 dairies that were present in the watershed at the time of the study.
Underlying Databases/ Data Sources• Uses highly detailed spatial information.
Input Variables • Daily precipitation, maximum and minimum temperature, and solar radiation; and
• Soil properties including soil layer depth, texture, bulk density, and C concentration.
Data Output • Soil organic C and N stocks (Mg/ha) in the different pools; • The complete N cycle is simulated in APEX, including
atmospheric N inputs; fertilizer and manure N applications; crop N uptake; denitrification; mineralization; immobilization; nitrification; ammonia volatilization; organic N transport on sediment; and
• Nitrate‐nitrogen (NO3‐N) losses in leaching, surface runoff, lateral subsurface flow, and tile flow.
More Info: http://epicapex.brc.tamus.edu/ See Gassman et al. (2005; 2010); Williams (1995a); Williams and Izaurralde (2006); Izaurralde et al. (2006).

Contract # GS‐23F‐8182H, Report of GHG Tools: Models 100 | P a g e
CENTURY CENTURY model General Information
• Origin: U.S. • Authors/Developers: NREL, Colorado State University
(Parton et al.) • Year Published: 1987 • Model Type: Process‐based model • Spatial Scale: Field level
• Ecosystem/Management Practices covered: Grassland systems, agricultural crop systems, forest systems, and savanna systems. Agricultural management (e.g., tillage, irrigation, fertilization, manure application, grazing, fire).
• GHG covered: CO2 (soil C sequestration)
DescriptionCENTURY is a process‐model that simulates C, N, P, and S dynamics for different plant‐soil systems for time scales from years to centuries. Most of the model runs on a monthly time step, with weekly time steps for soil water dynamics. The model simulates cropland, grassland, forest and savanna ecosystems. CENTURY was especially developed to deal with land use change and land management. For crop systems, a wide range of cropping system rotations, tillage, fertilization, manure application, irrigation, harvest and other management practices are included in the model.
Main Purpose of Model• The primary purposes of the model are to provide a tool for ecosystem analysis, to test the consistency of data and to evaluate the effect of changes in management and climate on ecosystems;
• The model was specifically developed for long term ‐ years to centuries ‐ simulation of SOC dynamics, plant productivity and nutrient cycling; and
• The model is used for estimation of soil C emissions and removals in the U.S. national greenhouse gas inventory and is used in the COMET‐VR farm level accounting tool.
General MethodologyThe model has different plant production submodels which are linked to a common soil organic matter submodel. The SOM sub‐model includes three soil organic matter pools (active, slow and passive) with different potential decomposition rates and turnover times, above and belowground litter pools and a surface microbial pool which is associated with decomposing surface litter. First‐order equations are used to model all SOM pools. Rate constants are influenced by soil water content, soil temperature and soil texture and other soil conditions. The model has been parameterized to simulate soil organic matter dynamics in the top 20 cm of the soil. The CENTURY model uses a monthly time step for an annual cycle over time scales of centuries to millennia. CENTURY allows simulation of complex agricultural management practices including crop rotation, tillage, fertilization, grazing and harvest methods. Calibration/validation • Several internal parameters in CENTURY were calibrated by fitting the model to long‐term soil decomposition experiments (1‐5 yr) where different types of plant material were added to soils with a number of soil textures (Parton et al., 1987);
• The Century model was originally validated by simulating steady‐state soil C and N levels and aboveground plant production for several sites across the U.S. and comparing the simulated values with mapped plant production and soil C and N levels for different textured soils at these sites; and
• The model has been subsequently tested for a large number of long‐term field experiments in the U.S. and Canada and elsewhere in the world. Model uncertainty has been estimated based on comparisons to measurements at more than 50 long‐term experiments in U.S.
Underlying Databases/ Data Sources• Data sources obtained by user
Input Variables • Monthly average maximum and minimum air temperature; • Monthly precipitation; • Lignin content of plant material; • Plant N, P, and S content; • Soil texture; • Atmospheric and soil N inputs; and • Initial soil C, N, P, and S amounts.
Data Output Century simulates changes in ecosystem C and N (P and S are optional) stocks, including several plant (e.g., shoot, root, standing dead for herbaceous vegetation, leave, fine branch, coarse wood, fine roots, coarse root, dead wood) and soil organic N and N stocks. Soil organic carbon stocks are only simulated for a surface layer and the top layer of mineral soil (where a 20 cm depth is the default). Many other process rates for N, P, and S, as well as water balance variables are available as output.
More Info: http://www.nrel.colostate.edu/projects/century5/See Parton et al. (1996; 1998); Parton (1996).

Contract # GS‐23F‐8182H, Report of GHG Tools: Models 101 | P a g e
CNCPS The Cornell Net Carbohydrate and Protein System
General Information• Origin: U.S. • Authors/Developers: Cornell University • Year Published: 1992 (first publication by Russell et al.;
Sniffen et al.; Fox et al.) • Model Type:
• Spatial Scale: • Ecosystem/Management Practices covered: Dairy, beef,
sheep farms • GHG covered: CH4
DescriptionThe Cornell Net Carbohydrate and Protein System (CNCPS) uses farm level information about cattle, intake, feed composition and environment to evaluate animal performance. The model is capable of predicting: (1) energy, metabolizable protein, amino acid, and mineral requirements for maintenance, tissue deposition, and milk synthesis; (2) intake and ruminal degradation of feed carbohydrate and protein fractions, and microbial growth; (3) intestinal digestion and excretion; (4) metabolism of absorbed energy, protein, and amino acids; and (5) nutrient excretion and feed requirements for individual and herd.
Main Purpose of Model• The Cornell Net Carbohydrate and Protein System (CNCPS) was developed to predict requirements, feed utilization, animal performance and nutrient excretion for dairy and beef cattle and sheep, using accumulated knowledge about feed composition, digestion, and metabolism in supplying nutrients to meet requirements.
• The long‐term objective of the CNCPS modeling effort has been to provide a field usable model that accounts for a large proportion of the variation in ration formulation and animal performance and is based on a functional mathematical description of the biology of both growing and lactating cattle and their diet and management.
General Methodology• The model uses published equations for predicting methane from Ellis et al. (2007) for beef cattle, and Mills et al. (Mills et al., 2003) (i.e., non‐linear equation “Mitschelich 3”) for dairy cattle.
Calibration/validation • The model has been validated in several studies (see http://www.cncps.cornell.edu/publications.html#Papermenu2).
Underlying Databases/ Data Sources• The database for the model is largely based on published research on the various components of the tissue, ruminal and whole animal components.
Input Variables • Diet composition; and • Animal Parameters.
Data Output • Predicted methane production in grams; and • Performance parameters, including growth and milk
production.
More Info: http://www.cncps.cornell.edu/ See Van Amburtgh et al. (2010); Tylutki et al. (2008); Russell et al. (1992); Sniffen et al. (1992); Fox et al. (1992); Pitt et al (1996).

Contract # GS‐23F‐8182H, Report of GHG Tools: Models 102 | P a g e
COWPOLL COWPOLL model
General Information• Origin: Europe • Authors/Developers: History: Rumen model of Dijkstra et
al. (1992); Modified by Mills et al. (2001, CH4 from rumen) and Kebreab et al. (2004, whole animal model). Bannink et al. (2006) developed a new stoichiometry for fermentation within the rumen based entirely on experimental observations with lactating dairy cows.
• Year Published: 1992 • Model Type: Dynamic mechanistic model of rumen
metabolism
• Spatial Scale: Cow level • Ecosystem/Management Practices covered: Dairy farms • GHG covered: CH4
DescriptionCOWPOLL is a dynamic mechanistic model that simulates CH4 emissions based on ruminal fermentation biochemistry.
Main Purpose of Model• The COWPOLL model was developed to provide further insight into energetic relationships and partition of nutrients, primarily for assessment of dietary manipulations on animal productivity and most recently pathways of nitrogen excretion from cattle. While originally designed for modeling of the dairy cow, there have been recent efforts to include a feedlot cattle sub‐model.
General Methodology• Dynamic, mechanistic model that simulate CH4 emissions based on a mathematical description of rumen fermentation biochemistry;
• COWPOLL simulates digestion, absorption and outflow of nutrients from or in the rumen using a series of dynamic, deterministic, nonlinear differential equations; and
• COWPOLL assumes 3 microbial populations. Note: The major difference between MOLLY and COWPOLL in predicting CH4 emissions is the representation of microbes in the rumen and coefficients of fermentation for transformation of substrate to VFA as MOLLY uses a single group of microbes, whereas COWPOLL separates the microbial community into amylolytic and cellulolytic bacteria, and protozoa.
Underlying Databases/ Data Sources• The database for the model is largely based on published research on the various components of the tissue, ruminal and whole animal components.
Input Variables • Diet composition; and • Animal Parameters.
Data Output • Milk production (including components); • Methane yield on a per animal basis.
More Info: See Kebreab et al. (2004); Dijkstra et al. (1992); Mills et al. (2001); Bannik et al. (2006); Kebreab et al. (2008); Legesse et al. (2011).

Contract # GS‐23F‐8182H, Report of GHG Tools: Models 103 | P a g e
CQESTR C sequestration model
General Information• Origin: U.S. • Authors/Developers: USDA ARS • Year Published: 2001 • Model Type: Process‐based model
• Spatial Scale: Field level • Ecosystem/Management Practices covered: Cropland • GHG covered: CO2 (indirectly through changes in SOC)
DescriptionCQESTR is a process‐based carbon balance model that relates crop residue additions and crop and soil management to soil organic matter (SOM) accretion or loss. CQESTR is based on the balance of organic C added to a soil and lost to microbial oxidation. It uses information stored in crop management files associated with the c‐factor of the Revised Universal Soil Loss Equation (RUSLE, version 1, Renard et al., 1996).
Main Purpose of Model• With the goal of using readily available input data at the field scale, the CQESTR model was developed to simulate the effect of agricultural management practices on short and long‐term trends of SOM; and
• It can potentially serve as a basis for a field‐level SOM planning and prediction tool. CQESTR could be potentially used to estimate the amount of C that can be sequestered for C credit, and offers the potential to guide crop residue removal (e.g., for biofuel production) while maintaining the SOM content.
General Methodology• Model uses a number of decomposition algorithms which were taken from the existing residue decomposition model named ‘D3R’ (Douglas and Rickman, 1992). The decomposition equation used for CQESTR contains only one more term (fB, a biomass or residue type factor) than D3R;
• Algorithms take into account the effect of soil texture, water availability, N content, residue/ biomass type, soil drainage, cumulative degree days; and
• The model operates on a daily time‐step and performs long‐term (100‐yr) simulations. Calibration/validation • Calibrated using information from six long‐term experiments across North America; and • Validated using data from several additional long‐term experiments across North America having a range of SOM content. Regression analysis of 306 pairs of predicted and measured SOM data under diverse climate, soil texture and drainage classes, and agronomic practices at 13 agricultural sites resulted in a linear relationship with an r2 of 0.95 (P < 0.0001) and a 95% confidence interval of 2.5 g SOC/kg.
Underlying Databases/ Data Sources• Most of the model input data is automatically extracted from the c‐factor, crop, and operation files that are created for
the Revised Universal Soil Loss Equation (RUSLE) (Renard et al. 1996). These consist of crop grain yields, shoot‐to‐grain ratios, dates of all operations (e.g., tillage, seeding, harvest, biomass addition, biomass removal, etc.), depth of tillage and the fraction of the soil surface covered, and effects of tillage on residue (e.g., fraction of pre‐tillage residue weight remaining on the soil surface after each tillage).
Input Variables Input data for SOM calculation include: • Crop biomass (aboveground and belowground), applied to or remaining in a field after harvest;
• Residue remaining on surface post‐tillage; • Tillage (dates, depth); • Timing of amendments/residue addition; • Number and thickness of soil layers; • Average daily air temperature; • N content of crop residues and any organic amendments; • Starting OM content; and • Bulk density.
Data Output • Short‐term trends of surface and remaining buried residue
and long‐term trends in soil organic matter (carbon) content are computed for individual fields and cropping practices.
More Info: http://www.ars.usda.gov/Main/docs.htm?docid=13499See Rickman et al. (2001); Liang et al. (2008; 2009).

Contract # GS‐23F‐8182H, Report of GHG Tools: Models 104 | P a g e
DairyGEM Dairy Gas Emissions Model
General Information• Origin: U.S. • Authors/Developers: USDA ARS (C.A. Rotz et al) • Year Published: 2011 • Model Type: Semi process based & emission factor based
& semi‐LCA
• Spatial Scale: Farm level • Ecosystem/Management Practices covered: Livestock
management (dairy, beef); Cropland (for feed production); Grassland (for grazing)
• GHG covered: N2O, CH4, CO2 Description
DairyGEM is a new model and software tool that expands and essentially replace DairyGHG. It includes the greenhouse gas emission model of DairyGHG and adds process based models for predicting ammonia and hydrogen sulfide emissions from all manure sources on farms. There have also been some refinements to GHG prediction including the addition of a new component for using an anaerobic digestion system on the farm. ARS recommends using DairyGEM instead of DairyGHG.
Main Purpose of Model• DairyGEM was developed to provide a simple tool for predicting GHG emissions of dairy production systems and GHG emission reductions from using an anaerobic digestion system on the farm.
General Methodologycf. DairyGHG Process‐based relationships and emission factors are used to predict the primary GHG emissions from the production system. All emissions are predicted through a daily simulation of feed use and manure handling. Daily emission values of each gas are summed to obtain annual values. Note: Development of a more robust model for use in DairyGEM to predict N2O emission from cropland is planned, as model currently uses Tier 1 IPCC approach. Calibration/validation • cf. DairyGHG.
Underlying Databases/ Data Sources• cf. DairyGHG
Input Variables • Input information is supplied to the program through two data files: farm and weather parameter files;
• The farm parameter file requires data input that describe the farm facilities. This includes feeds and pasture available (including concentrate feeds available for feed supplementation such as protein and energy supplements), nutritive contents of feeds, number of animals at various ages, milk production, housing facilities, and manure handling strategies; and
• The weather data (location) file contains daily weather for many years at a particular location. Files for each state in the U.S. are provided with the model, but can be edited/ created by the model user.
Data Output • Output is the daily and annual CO2, N2O and CH4 as well as
total CO2 equivalents emitted by the farm, split up over the different source categories (barn, manure storage, feed producing fields, and grazing animals), as well as the carbon footprint of milk production (total CO2eq per unit of milk produced); and
• cf. DairyGHG (but also included are the daily and annual emissions of NH3 and H2S).
More Info: http://www.ars.usda.gov/Main/docs.htm?docid=21345See Rotz et al. (2011).

Contract # GS‐23F‐8182H, Report of GHG Tools: Models 105 | P a g e
DairyGHG Dairy Greenhouse Gas Model General Information
• Origin: U.S. • Authors/Developers: USDA ARS (C.A. Rotz et al) • Year Published: 2009 • Model Type: Semi process based & emission factor based
& semi‐LCA
• Spatial Scale: Farm level • Ecosystem/Management Practices covered: Livestock
management (dairy, beef); Cropland (for feed production); Grassland (for grazing)
• GHG covered: N2O, CH4, CO2 Description
The Dairy Greenhouse Gas Model (DairyGHG) is a software tool for estimating the greenhouse gas emissions and carbon footprint of dairy production systems. This tool calculates the carbon footprint of a dairy production system as the net exchange of all GHG in CO2 equivalent units per unit of energy‐corrected milk produced.
Main Purpose of Model• DairyGHG was developed to provide a relatively simple tool for predicting ammonia and hydrogen sulfide emissions and the integrated net global warming potential of all GHG emissions from dairy production systems.
General MethodologyUses process‐based relationships and emission factors to predict the primary GHG emissions from the production system. Emissions are predicted through a daily simulation step. Daily emission values of each gas are summed to obtain annual values. • CO2 emissions from barn floor using empirical equation based on Wheeler et al. (2008) data. CO2 from animal respiration cf. Kirchgessner et al. (1991). CO2 from manure storage using constant emission factor, adjusted for covered vs. uncovered. Model does not allow for net soil C changes with time and refers to the COMET‐VR tool for obtaining such values;
• CH4 from enteric fermentation is simulated using Mitscherlich 3 (Mits3) equation developed by Mills et al. (2003). Mits3 is process‐based, relating CH4 emissions to dietary intake as well as animal type and size. CH4 from barn floor, using empirical equation based on data from Wheeler et al. (2008), and Tier 2 IPCC approach. CH4 from manure storage using empirical model of Sommer et al. (2004) based upon the degradation of volatile solids (VS), temp and storage time, and Tier 2 IPCC approach. CH4 from field‐applied manure using equation of Sherlock et al. (2002). CH4 from feces deposited by grazing animals is estimated using a constant emission factor;
• N2O from soil processes (nitrification/denitrification) cf. IPCC Tier 1 (fixed emission factor). N2O from barns using Tier 2 IPCC. N2O from uncovered manure storage using fixed emission rate (Olesen et al., 2006) and fixed emission factor for stacked manure (IPCC). An emission factor is also used to predict enteric N2O emissions (0.8 g N2O / kg N intake).
• The carbon footprint of milk production is determined through a partial life cycle assessment of the production system. Embedded emissions are calculated using emission factors from the GREET model (Wang, 2007) and published emission factors. Allocation to milk production is based on the economic allocation procedure.
Calibration/validation • Validation of this type of model is not possible because any method of determining a C footprint is just estimation. Instead, three forms of model evaluation were conducted (see Rotz et al., 2010): a verification of individual model components through comparisons with measured data and other model predictions (Chianese et al., 2009a, b; 2009c), a comparison with previous studies of the C footprint of dairy production systems (Capper et al., 2008; Cederberg and Mattsson, 2000; Cederberg and Stadig, 2003; Phetteplace et al., 2001; Thomassen et al., 2008b; Vergé et al., 2007), and a sensitivity analysis.
Underlying Databases/ Data Sources• Weather files for each state are provided with the model, but can be created/edited by user • Other data sources are obtained by user
Input Variables • Input information is supplied to the program through two data files: farm and weather parameter files;
• The farm parameter file requires data input that describe the farm facilities. This includes feeds and pasture available (including concentrate feeds available for feed supplementation such as protein and energy supplements), nutritive contents of feeds, number of animals at various ages, milk production, housing facilities, and manure handling strategies; and
• Weather data (location) file contains daily weather for many years at a particular location; files for each state are provided with the model; can be edited/created by the model user.
Data Output • Output is the daily and annual CO2, N2O and CH4 as well as total CO2 equivalents emitted by the farm, split up over the different source categories (barn, manure storage, feed producing fields, and grazing animals), as well as the carbon footprint of milk production (total CO2eq per unit of milk produced) with a breakdown of emissions from animal production, manure handling, engine operation and the secondary (embodied) emissions from the production of farm inputs.
More Info: http://www.ars.usda.gov/Main/docs.htm?docid=17355. See Rotz et al. (2011); Rotz and Chianese (2009).

Contract # GS‐23F‐8182H, Report of GHG Tools: Models 106 | P a g e
DairyWise
General Information• Origin: The Netherlands • Authors/Developers: Wageningen University, The
Netherlands (Schils et al.) • Year Published: 2007 • Model Type: Empirical simulation model
• Spatial Scale: farm level • Ecosystem/Management Practices covered: Livestock
management (dairy), grass and silage production • GHG covered: CO2, N2O, CH4
DescriptionDairyWise is an empirical simulation model integrating all major subsystems of a dairy farm into one whole‐farm model. It models CH4, N2O, and CO2 emissions in the submodel GHG emissions.
Main Purpose of Model• The DairyWise model was developed to integrate livestock management, environmental and financial aspects for dairy production in the Netherlands by combining existing sub‐models.
General MethodologyThis model is a compilation of existing models developed by the same group. These models include the FeedSupply and GrassGrowth models. GHG emissions are calculated using default emission factors. Calibration/validation • Not specified.
Underlying Databases/ Data Sources• The database for the model is largely based on published research on the various components of 3 input categories.
Equations are available at http://edepot.wur.nl/35296. Input Variables
Flexible input options. Three categories of data: • Livestock and feed management; • Land and crop management (e.g., fertilizer, manure application); and
• Energy use.
Data Output • Milk production; • CH4 (kg/ha of farm or per animal); and • N2O emission (kg/ha of farm or per animal).
More Info: http://edepot.wur.nl/35296 See Schils et al. (2007a; 2007b).

Contract # GS‐23F‐8182H, Report of GHG Tools: Models 107 | P a g e
DAYCENT Daily CENTURY model
General Information• Origin: U.S. • Authors/Developers: NREL, Colorado State University
(Parton et al.) • Year Published: 1994 • Model Type: Process‐based model
• Spatial Scale: Field level • Ecosystem/Management Practices covered: Grassland
systems, agricultural crop systems, forest systems, and savanna systems. Agricultural management (e.g., tillage, irrigation, fertilization, manure application, grazing, fire).
• GHG covered: CO2 (soil C sequestration), N2O, (CH4 ‐ uptake only)
DescriptionDAYCENT is the daily time‐step version of the CENTURY biogeochemical model. DAYCENT simulates exchanges of C, N, P and S, and trace gases between the atmosphere, soil, and plants that result from plant growth and events such as fire, grazing, cultivation, harvest, and organic matter or fertilizer additions. DAYCENT is process‐based by accounting for how management scenarios affect the moisture content, pH, nitrate and ammonium concentration, etc. in the soil.
Main Purpose of Model• To simulate the impacts of land use options and management practices on N gas emissions, NO3 leaching, crop yields, and soil C levels.
• The model is used to estimate N2O emissions from soils in the U.S. national greenhouse gas inventory and is used in the COMET‐Farm, farm‐level accounting tool.
General Methodology• DAYCENT includes all the functionality and the same basic structure as the Century model but also includes more detailed models for plant productivity and water balance as well as additional submodels for trace gas emission processes (nitrification and denitrification, and CH4 oxidation);
• For N2O emissions, it uses the 'leaky pipe' approach – calculated on basis of % of N mineralization subject to soil environment conditions; and
• The DAYCENT model uses a daily time step for an annual cycle over time scales of years to centuries. Calibration/validation • The ability of DAYCENT to simulate net primary production (NPP), soil organic carbon, N2O emissions, and NO3 leaching has been tested with data from various native and managed systems (Del Grosso et al., 2001b; 2002; 2005).
Underlying Databases/ Data Sources• Data sources obtained by user
Input Variables • Daily maximum/minimum air temperature and precipitation
• Surface soil texture class • Land cover/use data (e.g., vegetation type, cultivation/planting schedules, amount and timing of nutrient amendments)
Data Output • Daily N‐gas flux (N2O, NOx, N2) • CO2 flux from heterotrophic soil respiration • Soil organic C and N • NPP, H2O and NO3 leaching • Other ecosystem parameters
More Info: http://www.nrel.colostate.edu/projects/daycent/index.htmlSee Del Grosso et al. (2001a; 2001b; 2002; 2005); Parton et al. (1998).

Contract # GS‐23F‐8182H, Report of GHG Tools: Models 108 | P a g e
DNDC DeNitrification‐DeComposition model
General Information• Origin: U.S. • Authors/Developers: Institute for the Study of Earth,
Oceans and Space University of New Hampshire (Li et al.) • Year Published: 1992 • Model Type: Process‐based model
• Spatial Scale: Field level • Ecosystem/Management Practices covered: Cropland
(including rice paddies), grassland/pasture, forests, wetlands.
• GHG covered: CO2 (soil C sequestration), N2O, CH4 Description
The DNDC model is a general model of C and N biogeochemistry in agricultural ecosystems for predicting C sequestration, trace gas emissions, crop yield, and N leaching in the agroecosystems. It integrates Nernst and Michaelis– Menten equations to simulate microbial‐driven process. For anaerobic processes (e.g., denitification, methanogenesis), the model employs the concept of an "anaerobic balloon" which is defined as the volumetric fraction of anaerobic microsites in a soil.
Main Purpose of Model• Originally developed as a tool to predict nitrous oxide (N2O) emissions from cropping systems, DNDC has since been expanded to include other ecosystems such as rice paddies, grazed pastures, forests, and wetlands, and the model accounts for land‐use and land‐management effects on N2O emissions; and
• The model is currently used for national GHG emission inventories in countries worldwide (e.g., current NITRO Europe program for cropland, pasture and forest for entire EU).
General Methodology• Soil organic carbon is split into 4 compartments: litter, microbial biomass, active humus and passive humus. The first three compartments are further divided into sub‐compartments according to their resistance to decomposition. DNDC applies principles of first‐order kinetics to describe decomposition and adjusts rate constants according to soil water content, soil temperature, N availability and soil texture;
• For N2O emissions, drivers are soil Eh and microbial population dynamics; and • DNDC uses a daily time step for computing decomposition processes, but uses hourly steps to quantify denitrification. Calibration/validation • Well tested and has been independently validated across a wide range of agro‐and forested ecosystems. See Table 1 in Giltrap et al. (2010).
Underlying Databases/ Data Sources• Data sources obtained by user
Input Variables • Daily temperature and precipitation; • Land use; • Soil bulk density, texture, organic carbon content, pH; • Farming practices (e.g., crop type and rotation, tillage, fertilization, manure amendment, irrigation, flooding, grazing, and weeding).
Data Output • DNDC produces graphs to demonstrate the daily dynamics
of simulated meteorological conditions, soil; • Climate and chemistry, crop growth, and gas emissions;
and • DNDC also produces the annual crop biomass results, C and
N pools (e.g., kg C/ha/year) and fluxes (kg CO2eq/ha), and water budget (mm).
More Info: http://www.dndc.sr.unh.edu/ See Li et al.(1992; 1994; 1996; 2004); Li (2000); Giltrap et al. (2010).

Contract # GS‐23F‐8182H, Report of GHG Tools: Models 109 | P a g e
FarmGHG General Information
• Origin: Denmark • Authors/Developers: Danish Institute of Agricultural
Sciences (J.E. Olesen et al.), developed under the MIDAIR EU project (EU Commission’s Fifth Framework Programme for RTD).
• Year Published: 2004 • Model Type: Empirical simulation model and LCA
• Spatial Scale: Farm level • Geographical coverage: • Ecosystem/Management Practices covered: Livestock
management (dairy farms) • GHG covered: CO2, N2O, CH4
DescriptionFarmGHG is a model for estimating GHG emissions from a whole‐farm, including emissions from imported goods to the farm. The model draws on experience from internationally agreed upon models, from life cycle assessments (LCA) and reported model studies from dairy farms, and, importantly, it also accounts for energy use and emissions occurring in the whole supply chain. The model includes both matter balances of C and N, and allows calculation of environmental effect balances for greenhouse gas emissions (CO2, CH4 and N2O) and eutrophication (NO3 and NH3).
Main Purpose of Model• To allow the quantification of all direct and indirect gaseous emissions from dairy farms, so that the model can be used for assessment of mitigation measures and strategies; and
• During MIDAIR, FarmGHG was applied to 15 European dairy model farms to identify regional variation as well as variation between conventional and organic dairy farming. It was also used to determine the effectiveness of various proposals to reduce GHG emissions. The model was also extended to analyze other environmental problems associated with large‐scale farming, such as eutrophication.
General Methodology• The model is divided in compartments, handling imports, exports and farm operations. The model draws on experience from both nutrient balance models (Olesen and Vester, 1995), from life cycle assessments (LCA) (Halberg et al., 1999) and reported model studies from dairy farms (Brown et al., 2001; Phetteplace et al., 2001). Calculations follow IPCC (1997) or IPCC Good Practice (2000) approach (either Tier 1 or Tier 2 approach) or published equations (e.g., Kirchgessner et al., 1995 for enteric methane emissions; Høgh‐Jensen et al., 2003 for N fixation). Model allows for use of different methods (IPCC, IPCC GP or model default method);
• A simple emission factor approach is used for quantifying the emissions associated with imports of energy, fertilizer, pesticides, feedstuffs etc.; and
• The model is run at monthly and daily time steps (depending on the flows). Calibration/validation • Within the scope of the MIDAIR project (research project funded by the European Commission’s Fifth Framework Programme for RTD), 15 European dairy model farms were used as input for the FarmGHG model. The FarmGHG model was validated based on emission plume measurements with a tunable diode laser downwind from 20 farms in the Netherlands.
Underlying Databases/ Data Sources• Data sources obtained by user
Input Variables • Farm details (name, type ‐ organic or conventional, soil and climate identifiers);
• Animal details (type, number, feed demand, weight info, meat and milk type codes, number sold, etc.);
• Animal housing information; • Manure storage information; • Crop and field amendment information (area of land, crop type and use, yield, fertilizer type, manure application method, N demand, irrigation amount, etc.);
• Feed plan information; and • User also defines method (IPCC vs. default) as well as parameters to model.
Data Output • Model generates emissions output expressed in kg C or kg
N, kg GHG (N2O, CO2, CH4) and NH3, and kg CO2eq, spit up by emission source category.
More Info: http://agrsci.au.dk/fileadmin/DJF/JPM/Klima/JEO/FarmGHGManual5.pdf http://cordis.europa.eu/fetch?ACTION=D&SESSION=&DOC=1&TBL=EN_OFFR&RCN=4184&CALLER=OFFR_TM_EN http://ec.europa.eu/research/environment/newsanddoc/article_2087_en.htm See Schils et al. (2007b); Olesen et al. (2004).

Contract # GS‐23F‐8182H, Report of GHG Tools: Models 110 | P a g e
FOFEM First Order Fire Effects Model
General Information• Origin: U.S. • Authors/Developers: Elizabeth Reinhardt and Robert E.
Keane (Missoula Fire Sciences Lab of the Rocky Mountain Research Station, USDA Forest Service).
• Year Published: 1997 • Model Type: Emission factor‐based
• Spatial Scale: Site level • Ecosystem/Management Practices covered: Most U.S.
forest types; Some rangeland vegetation types • GHG covered: CH4, CO2
DescriptionFOFEM is a computer program for predicting tree mortality, fuel consumption, smoke production (including GHG), and soil heating caused by prescribed fire or wildfire.
Main Purpose of Model• FOFEM was developed to meet the needs of resource managers, planners, and analysts in predicting and planning for fire effects. Quantitative predictions of fire effects are needed for planning prescribed fires that best accomplish resource needs, for impact assessment, and for long‐range planning and policy development.
General Methodology• FOFEM 5 combines well‐tested physical and empirical models with expert knowledge to predict the effects of fire on tree mortality, fuel consumption, smoke emissions and soil heating;
• FOFEM 5 uses Burnup, a theoretical model for predicting woody fuel consumption; • Smoke production (including GHG) is estimated by multiplying fuel consumption by emissions factors; • FOFEM uses separate emissions factors for flaming and smoldering combustion; and • Emission production is estimated in time intervals from ignition until combustion ceases.
Underlying Databases/ Data Sources• FOFEM uses an extensive set of default inputs, based on an exhaustive fuels literature search (e.g., database for fuel loads: Mincemoyer, 2002); and
• Default values can be overridden by the user, allowing the use of FOFEM at different levels of resolution and knowledge. Input Variables
• Cover type classification; • U.S. region; • Season; • Fuel category; • Fuel moisture; and • Burn type (crown % vs. surface).
Data Output • GHG are predicted as part of the 'smoke production'
module, which predicts fuel consumption rate, emission production rate and fire intensity over time for both surface and crown fires. It also simulates the proportion of flaming and smoldering combustion.
• Outputs generated include: o Graph and tabular reports for smoke production over
time for each emission species (PM10, PM2.5, CO, CO2, CH4, NOx, SOx) in lbs/acre; and
o Combustion efficiency and emission factors. More Info: http://www.firelab.org/science‐applications/fire‐fuel/111‐fofem See Reinhardt (2003); Reinhardt et al. (1997).

Contract # GS‐23F‐8182H, Report of GHG Tools: Models 111 | P a g e
FORCARB/FORCARB2 FORest CARBon Budget Model
General Information• Origin: U.S. • Authors/Developers: USDA Forest Service (Heath et al.) • Year Published: 1993 (FORCARB); 2010 (FORCARB2) • Model Type: Empirical simulation model
• Spatial Scale: Forest level, Regional level, National level • Ecosystem/Management Practices covered: Forest land • GHG covered: CO2
DescriptionFORCARB and FORCARB2 (an updated version of FORCARB), is an empirical simulation model that produces estimates of C stocks and changes for U.S. forest ecosystems and forest products at 5‐year intervals. FORCARB2 includes a new methodology for C in harvested wood products, updated initial inventory data, a revised algorithm for dead wood, and includes public forest land, reserved forest land, and forest land of low productivity.
Main Purpose of Model• To provide estimates and projections of U.S. forest C stocks for policy‐related needs, such as the Resources Planning Act timber resource assessment and forest‐related greenhouse gas inventories of the United States.
General MethodologyEmpirical model using sets of equations for estimating stocks for each carbon pool, including live tree, standing dead tree, understory, down dead wood, forest floor, and organic portion of soil, based on forest inventory information (e.g., age, volume, area) modeled by ATLAS combined with data from ecological studies. The equations are used to estimate mass density of carbon within each pool. These values are multiplied by the forest area to obtain values for total carbon. The mass densities of live and standing dead trees are calculated cf. Smith et al. (2003), as a function of plot‐level merchantable growing‐stock volume. The estimate of mass density of the forest floor is based on Smith and Heath (2002). Mass density of soil organic carbon to a depth of 1 meter is estimated for each region and forest type cf. Amichev and Galbraith (2004). The calculation of mass density of understory carbon is based on models with coefficients specific to region, forest type, and owner/land‐status category described in Plantinga and Birdsey (1993). FORCARB2 follows the methodology of Smith et al. (2006) for estimating C stocks in harvested wood products. Calibration/validation • Not specified.
Underlying Databases/ Data Sources• FORCARB has used data from the U.S. Forest Service, Forest Inventory and Analysis (FIA) Program particularly for initial inventories, in construction of growth‐yield curves, and for harvest information such as utilization rates.
• The FORCARB2 model uses 2 output files generated by the Aggregate Timber Assessment (ATLAS) model. ATLAS projects timber inventories by allowing for growth, harvest, land‐use change, and changes in management intensity through time. These output files provide estimates and projections of areas and tree volume by age class for the specified categories of forest land.
Input Variables • FORCARB2 runs on 20 input files, of which 2 are generated from running ATLAS. These input files contain forest information as well as lookup tables with coefficients for FORCARB2 calculations.
Data Output • The model can produce national carbon inventories based
on aggregations of regional timber inventories; • The carbon inventory is partitioned into that in forest soils,
trees, understory vegetation and on the forest floor. Carbon in harvested products is also simulated;
• National carbon inventory outputs are in units of thousands of hectares of area and petagrams of carbon; and
• The user has a choice of different output files.
More Info: http://nrs.fs.fed.us/pubs/35613 See also Heath et al. (2010); Plantinga and Birdsey (1993).

Contract # GS‐23F‐8182H, Report of GHG Tools: Models 112 | P a g e
FVSCarbCalc Stand Level Carbon Reporting Using the Forest Vegetation Simulator (FVS)
General Information• Origin: U.S. • Authors/Developers: USDA, Forest Service • Year Published: 2006 • Model Type: Empirical simulation model
• Spatial Scale: Forest level • Ecosystem/Management Practices covered: Forest land • GHG covered: CO2 (indirectly through changes in SOC)
DescriptionFVS is an individual‐tree, distance‐independent growth and yield model used for predicting forest stand dynamics that is used extensively in the United States. The FVS‐CarbCalc tool is part of the Fire and Fuels Extension (FFE) of the FVS and simulates stand level carbon stocks and carbon in harvested products estimates for U.S. forest stands.
Main Purpose of Model• To provide natural resource managers with amounts of carbon being sequestered by their forest and the impact of various management activities on the amount of carbon sequestered.
General MethodologyAll methodologies are consistent with U.S. DOE 1605(b) VR (DOE, 2007) calculating and reporting guidelines and the Intergovernmental Panel on Climate Change (IPCC) Good Practice Guidance for Land Use, Land Use Change, and Forestry (IPCC, 2003). • Aboveground dead biomass is computed using Fire and Fuels Extension (FFE) algorithms; • Aboveground live components can be calculated either with FFE biomass algorithms, or alternatively using allometric equations of Jenkins et al. (2003);
• Belowground components are calculated using Jenkins equations. The root decay rate is 0.0425 by default (Ludovici et al., 2002) but can be adjusted by the model user;
• Carbon in the living and dead biomass is converted to units of carbon by multiplying by 0.5 (IPCC, 2003); Litter and duff biomass are converted using a multiplier of 0.37 (Smith and Heath, 2002); and
• Carbon in harvested merchantable biomass is allocated following the methods of Smith et al. (2006). Underlying Databases/ Data Sources
• Can use existing forest inventory data (e.g., FIA data or data stored in the Forest Service Field Sampled Vegetation (FSVeg) database) to describe initial stand conditions
Input Variables • FVS runs on forest stand or inventory plot specific data files (http://www.fs.fed.us/fmsc/fvs/data/fileformat.shtml#fvs), which can be obtained from FIA or FSVeg databases.
Data Output • Results are expressed in tons C/acre or metric tons C per
hectare or acre, broken down per source/sink category.
More Info: http://www.fs.fed.us/fmsc/fvs/index.shtmlSee Dixon (2002); Reinhardt et al. (2007); Hoover and Rebain (2008); Smith et al. (2006); Jenkins et al. (2003).

Contract # GS‐23F‐8182H, Report of GHG Tools: Models 113 | P a g e
IFSM The Integrated Farm System Model
General Information• Origin: U.S. • Authors/Developers: USDA ARS (C.A. Rotz et al) • Year Published: 2009 • Model Type: Semi process based, empirical model‐based,
emission factor based and semi‐LCA
• Spatial Scale: Farm level • Ecosystem/Management Practices covered: Livestock
management (dairy, beef); Cropland (for feed production); Grassland (for grazing)
• GHG covered: N2O, CH4, CO2 Description
The IFSM model is a whole‐farm simulation model of crop, dairy, or beef production. Farm systems are simulated over many years of weather to determine long‐term performance, environmental impact, and economics. IFSM is a more complex tool than DairyGHG as, in addition to simulating GHG emissions and the carbon footprint, it also simulates nitrogen and phosphorus losses and farm economics.
Main Purpose of Model• IFSM was developed to serve as a research tool for comprehensive evaluation and comparison of the performance, environmental impacts and economics of dairy‐production systems.
• In addition, the model provides an effective teaching aid for students to learn more about the complexity of the many interactions that occur within a crop and livestock‐production system.
General Methodology• The model uses a daily time step for simulations; • Model uses DAYCENT to simulate C dynamics in the crop and soil components of the farm, as well as other published equations [e.g., for CO2 emissions from barn floor, Chianese et al. (2009a); animal respiration, Kirchgessner et al. (1991)];
• CH4 from enteric fermentation is simulated using Mitscherlich 3 (Mits3) equation developed by Mills et al. (2003), based on dietary composition. CH4 from barn floor, using empirical equations and Tier 2 IPCC approach. CH4 from manure storage using empirical model of Sommer et al. (2004) based upon the degradation of volatile solids (VS), temp and storage time, and Tier 2 IPCC approach. CH4 from field‐applied manure using equation of Sherlock et al. (2002). CH4 from feces deposited by grazing animals is estimated using a constant emission factor;
• N2O from nitrification/denitrification is simulated using DAYCENT. N2O from barns using Tier 2 IPCC. N2O from uncovered manure storage using fixed emission rate (Olesen et al., 2006) and fixed emission factor for stacked manure (IPCC); and
• The carbon footprint of milk production is determined through a partial life cycle assessment of the production system. Embedded emissions are calculated using the GREET model (Wang, 2007) and published emission factors. Allocation to milk production is based on the economic allocation procedure.
Calibration/validation • Most of the validation and application of the model has been done for the Midwest, Northeast, and Pacific Northwest regions of the United States, along with some application in Ontario and Quebec, Canada. Recent applications have also included farms in northern Europe with similar climate as Northern U.S.
Underlying Databases/ Data Sources• Weather files for each state are provided with the model, but can be created/ edited by user. • Other data sources are obtained by user.
Input Variables • Input information is supplied to the program through three data files: farm, machinery, and weather parameter files;
• Farm parameter file requires data input including crop areas; soil characteristics; equipment and structures used; number of animals at various ages; harvest, tillage, manure handling strategies; and prices for various farm inputs and outputs;
• Machinery file requires parameters for each machine available for use on a simulated farm. These parameters include machine size, initial cost, operating parameters, and repair factors; and
• Weather data file contains daily weather for many years at a particular location. Weather files for about twenty locations are available with the model, but users can create new files for other locations.
Data Output • Output is the daily and annual GHG emissions emitted by
the farm or the carbon footprint of milk production (total CO2eq per unit of milk produced).
More Info: http://www.ars.usda.gov/Main/docs.htm?docid=8519; See Rotz et al. (2009).

Contract # GS‐23F‐8182H, Report of GHG Tools: Models 114 | P a g e
ManureDNDC Manure‐DNDC model
General Information• Origin: U.S. • Authors/Developers: Institute for the Study of Earth,
Oceans and Space University of New Hampshire (Li et al.) • Year Published: Not specified • Model Type: Process‐based model (will have a web‐
interface in the future)
• Spatial Scale: Farm level • Ecosystem/Management Practices covered: Livestock
farms • GHG covered: CO2, N2O, CH4
DescriptionThe Manure‐DNDC model is a new version of DNDC to quantify greenhouse gas and ammonia emissions from livestock operation systems, i.e., from manure production (animals), storage, processing and application. The model is capable of estimating the greenhouse gas inventory, and predicting impacts of alternative management practices (e.g., feed types, housing, manure storage/treatment) on greenhouse gas mitigation for a wide range of farm types. The model is designed for both regional and single farm simulations.
Main Purpose of Model• To estimate the greenhouse gas inventory, and predicting impacts of alternative management practices (e.g., feed types, housing, manure storage/treatment) on greenhouse gas mitigation for a wide range of farm types.
• Currently developed for quantifying air emissions from California dairies. Tool can be adopted for other regions based on local soils, climate and manure management conditions and practices.
General MethodologyIn Manure‐DNDC, the biogeochemical reactions (e.g., decomposition, hydrolysis, ammonium–ammonia equilibrium, ammonia volatilization, nitrification, denitrification and fermentation) parameterized in DNDC have been linked to dynamics of the environmental factors (e.g., temperature, moisture, pH, Eh and substrate concentration gradients) for each of the farm management facilities (e.g., feeding lot, compost, lagoon, anaerobic digester, manure land application). Calibration/validation • Manure‐DNDC has been calibrated and validated with datasets observed in house, storage and field. Measurements are conducted at feed‐lot, housing, storage, lagoon and field in 6 dairy farms in California (2006‐2008).
Underlying Databases/ Data Sources• Data sources obtained by user
Input Variables • Daily climate data; • Animal type and population; intake protein and feed quality;
• House ventilation, floor surface and bedding, cleaning method;
• Compost size, density, storage time, litter addition; • Lagoon capacity, surface area, coverage, drainage frequency;
• Slurry tank capacity, coverage, storage time; • Anaerobic digester capacity, hydraulic retention time, CH4 production; and
• Manure field application: rate, C/N, timing, depth, crop, soil.
Data Output Manure‐DNDC quantifies gas emissions and sequestration from each component (enteric, house, field, lagoon, etc.) of the livestock farm along with other parameters: • Enteric CO2, N2O, CH4 emissions; • Emissions of CO2, N2O, CH4, NH3, NO, N2 from feeding lot,
compost, lagoon, slurry tank and field; • Soil C sequestration; • N leaching and uptake in field; • Crop growth and yield; • Milk and meat production; and • Production of urine and dung.
More Info: Zhang et al. (2009) and Giltrap et al. (2010).

Contract # GS‐23F‐8182H, Report of GHG Tools: Models 115 | P a g e
MOLLY MOLLY model
General Information• Origin: U.S. • Authors/Developers: University of California, Davis
(Baldwin, 1995) • Year Published: 1995 • Model Type: Dynamic mechanistic model of rumen
metabolism
• Spatial Scale: Cow level • Ecosystem/Management Practices covered: Dairy farms • GHG covered: CH4
DescriptionMOLLY is a dynamic mechanistic model of nutrient utilization in cattle. It estimates CH4 emissions based on ruminal fermentation biochemistry.
Main Purpose of Model• The Molly model was developed to provide quantitative and dynamic analysis of concepts and data regarding factors which influence the partition of nutrients in lactating dairy cows
General Methodology• Dynamic, mechanistic model that simulate CH4 emissions based on a mathematical description of rumen fermentation
biochemistry: • Methane production is predicted as described by Baldwin (1995), i.e., ruminal CH4 production is predicted based on
hydrogen balance; • The VFA stoichiometry in MOLLY is based on equations developed by Murphy et al. (1982); and • MOLLY assumes 1 microbial population. Calibration/validation • In Kebreab et al. (2008), the accuracy of predictions of CH4 emissions by the MOLLY model was evaluated by comparison with CH4 emission data from dairy cattle from Westberg et al. (2001) and Johnson et al. (2002) and from feedlot cattle from Archibeque et al. (2006; 2007). These data were individual daily animal CH4 emissions from animals fed several types of diets. Methane measurements were based on sulfur hexafluoride tracer gas technique (SF6).
Underlying Databases/ Data Sources• The database for the model is largely based on published research on the various components of the tissue, ruminal and whole animal components.
Input Variables • Diet composition; and • Animal Parameters.
Data Output • Milk production (including components); and • Methane yield on a per animal basis.
More Info: http://animalscience.ucdavis.edu/research/mollySee Baldwin (1995); Kebreab et al. (2008); Legesse et al. (2011).

Contract # GS‐23F‐8182H, Report of GHG Tools: Models 116 | P a g e
NASACASA (CQUEST) CASA: Carnegie‐Ames‐Stanford Approach
CQUEST: Carbon Query and Evaluation Support Tool
General Information• Origin: U.S. • Authors/Developers: Carnegie Mellon University,
NASA/Ames Research Center, and Stanford University • Year Published: 1997 • Model Type: Process‐based model
• Spatial Scale: Regional level • Ecosystem/Management Practices covered: Cropland,
Grassland, Forest • GHG covered: CO2, N2O, CH4
DescriptionThe NASA‐CASA model simulates net primary production (NPP), biomass accumulation, litterfall inputs to soil C pools, soil heterotrophic respiration (Rh) and trace gas fluxes at regional to global scales, at a geographic resolution of 1 degree latitude and longitude. CASA output data are visualized using C‐QUEST Viewer, a multi‐purpose visualization system/decision support tool that enables advanced navigation and geo‐data query functions in an online geographic information system (GIS).
Main Purpose of Model• To facilitate a better understanding of the controls on biogenic trace gas fluxes and the ecosystem processes regulating these gases.
General Methodology• Calculation of monthly terrestrial net primary production (NPP) is based on the concept of light‐use efficiency, modified by temperature and moisture stress scalars;
• Soil carbon cycling and Rh flux components of the model are based on a compartmental pool structure, with first‐order equations to simulate loss of CO2 from decomposing plant residue and surface soil organic matter (SOM) pools; and
• MODIS canopy radiative transfer algorithms (Knyazikhin et al., 1999) are used by the model, to generate improved FPAR products as inputs to carbon flux calculations.
Calibration/validation • Aboveground biomass carbon estimates from the NASA‐CASA model have been validated to extrapolated field data reported by Olson et al. (1983).
Underlying Databases/ Data Sources• MODIS for LCLU data, FPAR and LAI data and relative greenness index
Input Variables • Monthly climate data from historical climate data sets or from predicted climate model outputs;
• Land cover/land use (LCLU) data; • Soil and vegetation data; • Digital Elevation Data; • Atmospheric N deposition data (ammonium and nitrate); • Validation information on present and past C fluxes estimated by CASA in order to determine the reliability of the results in future predictions; and
• Information on potential land‐use and land‐cover changes due to anthropogenic and climate changes effects in the future if the effect of climate change on carbon sequestration is required.
Data Output • The fluxes of all major biogenic gases (CO2, N2O, NO, CO,
CH4, plus isoprene, monoterpenes, acetone, and methanol). Most of the output data from CASA goes to C‐QUEST viewer. This Viewer application allows users to display CASA‐CQUEST data interactively as a map, customize the view, print image files, and obtain data values in tabular format.
More Info: http://geo.arc.nasa.gov/sge/casa/ http://appl‐policy.saic.com/CASA.html See Potter et al. (2003; 2008); Potter (1999).

Contract # GS‐23F‐8182H, Report of GHG Tools: Models 117 | P a g e
RothC The Rothamsted Soil Carbon Turnover Model
General Information• Origin: UK • Authors/Developers: IACR ‐ Rothamsted (Coleman and
Jenkinson) • Year Published: 1990 • Model Type: Process‐based model
• Spatial Scale: Field level • Ecosystem/Management Practices covered: Cropland,
Grassland, Forest • GHG covered: CO2
DescriptionThe RothC Model allows calculating the effect of organic matter management on the development of soil organic carbon in non‐waterlogged topsoils over a period ranging from a few years to a few centuries. It takes into account the quality and quantity of the organic matter added, soil type, temperature, moisture content and plant cover on the turn over process.
Main Purpose of Model• For calculating the rate of carbon loss or sequestration for specific agricultural practices. It can also be used to predict long‐term changes in carbon due to changing climate.
General Methodology• Soil organic carbon is split into 4 active compartments and a small amount of inert organic matter (IOM). The four active compartments are Decomposable Plant Material (DPM), Resistant Plant Material (RPM), Microbial Biomass (BIO) and Humified Organic Matter (HUM). Decomposition of the active compartments is modeled by an exponential decay function that uses the initial amount of C in the pool, a series of rate‐modifying factors for temperature, moisture, plant retainment and the decomposition rate constant for the pool. The model also adjusts for clay content;
• The IOM compartment is resistant to decomposition; and • The model uses a monthly time step to calculate total organic carbon (ton / ha), microbial biomass carbon (ton / ha) and Δ14C (from which the equivalent radiocarbon age of the soil can be calculated) on a years to centuries time scale.
Calibration/validation • The model was originally calibrated using the long‐term field experiments at Rothamsted. The model has subsequently been widely used for cropland and grassland systems at many locations, particularly in Europe and Australia.
Underlying Databases/ Data Sources• Data sources obtained by user
Input Variables The model requires the following data: • Monthly rainfall and evapotranspiration (mm); • Average monthly mean temperature (oC); • Percentage clay; • An estimate of the decomposability of the incoming plant material;
• Soil cover: is the soil bare of vegetated; • Monthly input of plant residues (ton C / ha), including C released from roots during crop growth;
• Monthly input of farm yard manure (ton C/ha); and • Depth of soil layer sampled (cm).
Data Output • Total soil organic C (t/ha).
More Info: http://www.rothamsted.bbsrc.ac.uk/aen/carbon/rothc.htmSee Coleman and Jenkinson (1999) and Jenkinson (1990).

Contract # GS‐23F‐8182H, Report of GHG Tools: Models 118 | P a g e
SCUAF Soil Changes Under Agriculture, Agroforestry and Forestry model
General Information• Origin: Australia • Authors/Developers: Australian Centre for International
Agricultural Research, with support of the International Centre for Research in Agroforestry (ICRAF), Nairobi, Kenya.
• Year Published: 1990 • Model Type: Process‐based model
• Spatial Scale: Field level • Ecosystem/Management Practices covered: Agroforestry
systems • GHG covered: CO2 (indirectly through changes in SOC)
DescriptionSCUAF is a computer model which predicts the effects on soils of specific land use systems under given environmental conditions. It is designed to include the distinctive features of agroforestry.
Main Purpose of Model• To predict changes in soil properties under specified agroforestry systems within given environments, and for comparison with agriculture and forestry; and
• It can be used in the design of experiments, to extrapolate experimental data (in time or to other treatments), to indicate what data are needed for prediction, to make management recommendations for specified environmental conditions, and in training.
General Methodology• Modeling of three components: plant system (trees, crop), soil system (erosion, soil C, nutrients), effect of soil conditions on plant growth (nutrients, soil C, soil depth);
• The soil carbon cycle is modeled based on principles set out in the classic study of Nye and Greenland (1960), modified to take account of the different fractions of soil organic matter (active, labile, stable). Changes in soil C are modeled through gains (humification), losses (erosion, oxidation) and stabilization (conversion of labile to stable pool);
• All variables in SCUAF are given default values. These are set by the environmental conditions: climate, soil and slope, but can be changed by user; and
• SCUAF is primarily intended for simulation over periods of the order of 10‐20 years, longer term simulation is possible but with pitfalls.
Calibration/validation • SCUAF has never been checked against a large body of uniform data extending across a controlled range of environmental conditions. For research applications, SCUAF requires self‐calibration, that is, calibration done by the user (based on experimental data and adjustment of model‐default values).
Underlying Databases/ Data Sources• SCUAF uses a set of default values, varying according to the physical environment: climate, soil, slope, etc. (based on
published studies). Input Variables
The user specifies: • The physical environment; • The land use system (% trees and crops, organic additions, fertilizers, harvest, losses, standing biomass, prunings and transfers of tree prunings to soil under crops);
• The initial soil conditions; • The initial rates of plant growth; • Plant composition (C, N, P); and • The rates of operation of soil‐plant processes.
Data Output The model provides an annual simulation of: • Changes in soil conditions (soil erosion, soil organic C, plant
nutrients N, P); and • The effects of soil changes upon subsequent plant growth
and harvest.
More Info: Young and Muraya (1990); Young et al. (1998).

Contract # GS‐23F‐8182H, Report of GHG Tools: Models 119 | P a g e
SIMS Dairy Sustainable and Integrated Management Systems for Dairy Production
General Information• Origin: UK • Authors/Developers: Institute of Grassland and
Environmental Research (A. del Prado et al.) • Year Published: 2006 • Model Type: Semi mechanistic model
• Spatial Scale: Farm level • Ecosystem/Management Practices covered: Livestock
management (dairy) • GHG covered: N2O, CH4
DescriptionSIMSDAIRY is framework far‐scale model which integrates existing models for N flows, transformations and losses (NGAUGE, NARSES), P losses (PSYCHIC) and farm economics equations to simulate NH3 losses from manure application, predict CH4 losses and cows' nutrient requirements. The effects on farm profitability and attributes of biodiversity, milk quality, soil quality and animal welfare are also included. SIMSDAIRY can also be used to optimize fertilizer N.
Main Purpose of Model• The model was developed to allow for the assessment of sustainability of a dairy farm including environmental and socio‐economic aspects.
• The model has been used for a number of desktop studies in order to investigate abatement options at farm scale for GHG emissions from ruminant livestock systems, investigate possible trajectories towards UK dairy sustainable farming systems, assess the impact of NO3 leaching abatement measures on N2O and CH4 emissions from a UK dairy system, and evaluate CH4 mitigation measures for long‐term national CH4 emissions from ruminants (for references, see del Prado and Scholefield, 2008).
General Methodology• SIMSDAIRY integrates all of the major components of a dairy farm into a modeling framework using a system‐based approach (see del Prado et al., 2011 for details). The model has a modular construction, with each module carrying out calculations at different farm levels. These modules are either modifications of existing models (e.g., for grassland fields; NGAUGE) or new developments. SIMSDAIRY simulates processes for most of the soil–plant and animal mechanisms that control environmental N losses and animal productivity. For example, emissions of N2O and NOx and NO3 leaching are simulated through the competition of soil NO3 and NH4 between the biological processes of plant uptake, denitrification, nitrification and mineralization and the physical process of solute leaching. Flows of N losses (N2O, NOx, N2) and products (milk N and N, and DM plant yields) are simulated on a per hectare basis based on Brown et al. (2005);
• Methane losses from manure management are calculated using the IPCC methodology for the storage stage (IPCC, 1997); • EFs (per animal) derived from Chadwick and Pain (1997) and Yamulki et al. (1999) for applied manure and dung excreted during grazing, respectively;
• On‐farm C modeling is restricted to an empirical prediction of CH4 emissions (Giger‐Reverdin et al., 2003) and a simple estimation of soil C changes (based on Dendoncker et al., 2004) and also accounts for some CH4 oxidation by soil (based on Byrne et al., 2007); and
• Emissions from electricity and fuel use are calculated using factor from DEFRA (2010). Pre‐farm emissions associated with purchased concentrates, straw and manufactured inorganic fertilizers (N and P) are estimated based on the approach by Casey and Holden (2005). Indirect energy use to produce pesticides, seeds, or to build buildings and farm machinery is not considered in this model. Indirect energy use for services or investment is also not considered.
Calibration/validation • Some of the individual sub‐models of the SIMSDAIRY modeling framework have been validated and tested in previous studies (e.g., Webb et al., 2005; Brown et al., 2005; Strömqvist et al., 2008; Dijkstra et al., 2008). As with all farm‐scale system models, the overall framework is difficult to validate, as appropriate detailed data of all the components of livestock systems, and their development over time, are lacking.
Underlying Databases/ Data Sources• This model combines several existing models that are largely focused on emissions from manure [NARSES: Webb &
Misselbrook (2004); NGUAGE: Brown et al. (2005); and PSYCHIC: Strömqvist et al. (2008)]. • Data sources are obtained by user.

Contract # GS‐23F‐8182H, Report of GHG Tools: Models 120 | P a g e
Input Variables • Climate; • Soil type; • Genetic characteristics of plants and animals; • Diet composition; • Manure application techniques; • silage making quality; • Fertilizer distribution; • Target milk production; • Location (UK specific); and • Plant and animal traits.
Data Output • SIMSDAIRY includes results in text files and graphs for
different outputs; and • Amongst those, SIMSDAIRY displays graphically
environmental losses (N2O, CH4, CO2, NH3, NOx, NO3 leaching, P losses, sediment losses), economic results, sustainability indices results, management used and N and P farm surpluses.
More Info: del Prado et al. (2011; 2006); del Prado and Scholefield (2008).

Contract # GS‐23F‐8182H, Report of GHG Tools: Models 121 | P a g e
SOCRATES Soil Organic Carbon Resources And Transformations in EcoSystems
General Information• Origin: Australia • Authors/Developers: Queensland University of
Technology, Australia (Grace et al.) • Year Published: 1995 • Model Type: Process‐based model
• Spatial Scale: Field level • Ecosystem/Management Practices covered: Forest,
Grassland, Arable, Shrubland • GHG covered: CO2 (indirectly through changes in SOC)
DescriptionThe SOCRATES model is a simple process‐based representation of soil SOC dynamics in terrestrial ecosystems, which requires minimal data inputs (soil, climate and biological inputs) and specifically designed to examine the impact of land use and land use change on soil carbon storage in the topsoil (0‐10 cm).
Main Purpose of Model• To estimate changes in topsoil SOC, based on generic concepts of carbon cycling and biogeochemistry; this includes a minimum dataset set of soil, climate and biological inputs.
General Methodology• The carbon model consists of five compartments which undergo first‐order decomposition in response to temperature and moisture. Plant material is divided into decomposable (DPM) and resistant (RPM) components. The soil components consist of microbial biomass (unprotected and protected) and humus. The generic description of decomposition in the model produces microbial material, humus, and CO2 in proportions that depend on the CEC of the soil.
• The model operates on a weekly time‐step and performs long‐term (100‐yr) simulations. • The model has been parameterized to simulate soil organic matter dynamics in the top 10 cm of the soil. Calibration/validation • The proportions of microbial material, humus, and CO2 and the specific decay rates for each component of the model were calibrated using the 14C data of Grace and Ladd (1995).
Underlying Databases/ Data Sources• Data sources obtained by user
Input Variables • Annual precipitation (monthly if available); • Mean annual temperature (monthly if available); • Soil clay content or CEC; • Initial soil organic C; and • Bulk density.
Data Output • Soil organic C stocks (0‐10 cm) (Mt C).
More Info: Grace et al. (2006a; 2006b); Grace and Ladd (1995).

Contract # GS‐23F‐8182H, Report of GHG Tools: Models 122 | P a g e
SOMMER Sommer et al. 2004: Algorithms for calculating methane and nitrous oxide emissions from manure management
General Information• Origin: Denmark • Authors/Developers: S.G. Sommer and colleagues (Danish
Institute of Agricultural Sciences, Department of Agricultural Engineering, Research Centre Bygholm)
• Year Published: 2004 • Model Type: Dynamic mechanistic model
• Spatial Scale: Farm level • Geographical coverage: Cattle and pigs farms • Ecosystem/Management Practices covered: • GHG covered: CH4, N2O
DescriptionA model consisting of a set of algorithms to quantify CH4 emissions from animal manure during storage, and N2O emissions from the slurry after field application. The model is specifically designed to evaluate the impact of temperature, anaerobic digestion and soil water potential on CH4 and N2O emissions from animal manure.
Main Purpose of Model• To better account for local climatic conditions and slurry properties (slurry VS) in estimating CH4 and N2O emissions from livestock housing, manure storage and manure application for national inventories and other GHG accounting.
General MethodologyThe model uses a set of algorithms to calculate CH4 and N2O emissions from manure storage and field application. CH4 emissions are calculated as a function of amounts of slurry organic matter (volatile solids, VS), temperature and storage time. N2O emissions from field‐applied slurry are related to VS, slurry N content, and soil water potential.
Underlying Databases/ Data SourcesThe model assumes the following systems: • Excretion of 1 kg VS d–1; and • Storage time is defined by a standard scheme for filling and emptying of in‐house slurry channels and the outdoor store The model also uses a set of fixed parameters in the algorithms (e.g., Arrhenius parameters for in‐house vs. outside stores for cattle and pig; rate correction factors for VS; different N2O emission factors).
Input Variables • Storage temperatures; and • Volatile Solids (VS) in excreta.
Data Output • The model predicts emission rates for CH4 (g kg‐1 VS) and
for N2O (kg N ha‐1).
More Info: http://www.springerlink.com/content/g5452j5jt7t31881/fulltext.pdfSee Sommer et al. (2004; 2009).

Contract # GS‐23F‐8182H, Report of GHG Tools: Models 123 | P a g e
WOODCARB II WOODCARB II model
General Information• Origin: Finland • Authors/Developers: Created by VTT Technical Research
Centre of Finland and modified by USDA Forest Service Lab• Year Published: Not specified • Model Type: Factor‐based model
• Spatial Scale: U.S. • Geographical coverage: • Ecosystem/Management Practices covered: Wood
production • GHG covered: CO2, CH4
DescriptionThis Excel‐based model estimates carbon in harvested wood products held in products (in‐use), discards from use, and transfers into and CH4 emissions out of unmanaged disposal sites and landfills. WOODCARBII does not estimate wood used for energy.
Main Purpose of Model• The model has been used to provide estimates of the U.S. harvested wood products contribution to annual greenhouse gas removals in the agriculture, forestry, land use, and land use change sector (see Skog, 2008).
General MethodologyMethodology is based on IPCC (2006) guidance for estimating HWP C, using product specific factors to convert product units to weight of carbon. Other parameters used are: fractions of primary products used in various end uses or disposed after use; and estimates of half‐lives for products in various end uses and in landfills or dumps. Calibration/validation • The model was calibrated by matching estimates to estimates from independent sources. Model has also been validated (Skog, 2008).
Underlying Databases/ Data Sources• Data sources are obtained by user.
Input Variables • Production, import and export data (see data source references for U.S. carbon sequestration estimates in Skog, 2008); and
• Domestic roundwood harvest, imports and exports, and paper‐related fiber imports and exports.
Data Output • The model estimates carbon stored in HWP in “products in
use” and “products in SWDS (solid‐waste disposal sites).”
More Info: See Skog (2008).
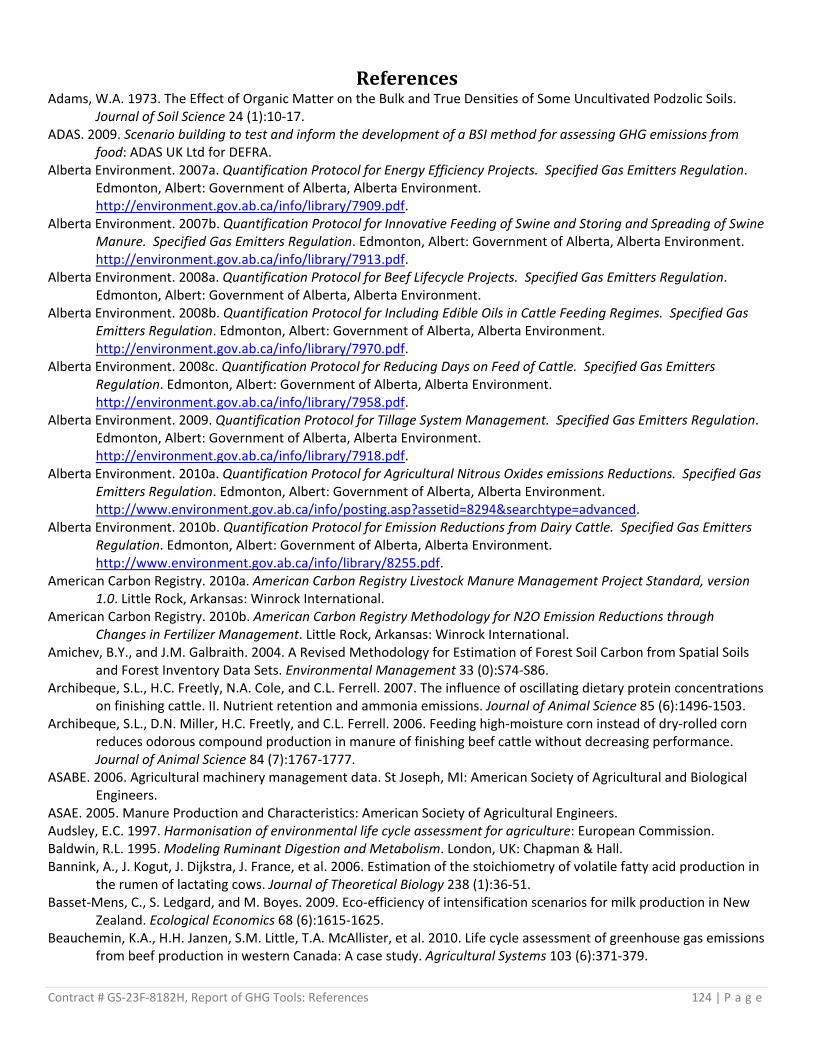
Contract # GS‐23F‐8182H, Report of GHG Tools: References 124 | P a g e
References Adams, W.A. 1973. The Effect of Organic Matter on the Bulk and True Densities of Some Uncultivated Podzolic Soils.
Journal of Soil Science 24 (1):10‐17. ADAS. 2009. Scenario building to test and inform the development of a BSI method for assessing GHG emissions from
food: ADAS UK Ltd for DEFRA. Alberta Environment. 2007a. Quantification Protocol for Energy Efficiency Projects. Specified Gas Emitters Regulation.
Edmonton, Albert: Government of Alberta, Alberta Environment. http://environment.gov.ab.ca/info/library/7909.pdf.
Alberta Environment. 2007b. Quantification Protocol for Innovative Feeding of Swine and Storing and Spreading of Swine Manure. Specified Gas Emitters Regulation. Edmonton, Albert: Government of Alberta, Alberta Environment. http://environment.gov.ab.ca/info/library/7913.pdf.
Alberta Environment. 2008a. Quantification Protocol for Beef Lifecycle Projects. Specified Gas Emitters Regulation. Edmonton, Albert: Government of Alberta, Alberta Environment.
Alberta Environment. 2008b. Quantification Protocol for Including Edible Oils in Cattle Feeding Regimes. Specified Gas Emitters Regulation. Edmonton, Albert: Government of Alberta, Alberta Environment. http://environment.gov.ab.ca/info/library/7970.pdf.
Alberta Environment. 2008c. Quantification Protocol for Reducing Days on Feed of Cattle. Specified Gas Emitters Regulation. Edmonton, Albert: Government of Alberta, Alberta Environment. http://environment.gov.ab.ca/info/library/7958.pdf.
Alberta Environment. 2009. Quantification Protocol for Tillage System Management. Specified Gas Emitters Regulation. Edmonton, Albert: Government of Alberta, Alberta Environment. http://environment.gov.ab.ca/info/library/7918.pdf.
Alberta Environment. 2010a. Quantification Protocol for Agricultural Nitrous Oxides emissions Reductions. Specified Gas Emitters Regulation. Edmonton, Albert: Government of Alberta, Alberta Environment. http://www.environment.gov.ab.ca/info/posting.asp?assetid=8294&searchtype=advanced.
Alberta Environment. 2010b. Quantification Protocol for Emission Reductions from Dairy Cattle. Specified Gas Emitters Regulation. Edmonton, Albert: Government of Alberta, Alberta Environment. http://www.environment.gov.ab.ca/info/library/8255.pdf.
American Carbon Registry. 2010a. American Carbon Registry Livestock Manure Management Project Standard, version 1.0. Little Rock, Arkansas: Winrock International.
American Carbon Registry. 2010b. American Carbon Registry Methodology for N2O Emission Reductions through Changes in Fertilizer Management. Little Rock, Arkansas: Winrock International.
Amichev, B.Y., and J.M. Galbraith. 2004. A Revised Methodology for Estimation of Forest Soil Carbon from Spatial Soils and Forest Inventory Data Sets. Environmental Management 33 (0):S74‐S86.
Archibeque, S.L., H.C. Freetly, N.A. Cole, and C.L. Ferrell. 2007. The influence of oscillating dietary protein concentrations on finishing cattle. II. Nutrient retention and ammonia emissions. Journal of Animal Science 85 (6):1496‐1503.
Archibeque, S.L., D.N. Miller, H.C. Freetly, and C.L. Ferrell. 2006. Feeding high‐moisture corn instead of dry‐rolled corn reduces odorous compound production in manure of finishing beef cattle without decreasing performance. Journal of Animal Science 84 (7):1767‐1777.
ASABE. 2006. Agricultural machinery management data. St Joseph, MI: American Society of Agricultural and Biological Engineers.
ASAE. 2005. Manure Production and Characteristics: American Society of Agricultural Engineers. Audsley, E.C. 1997. Harmonisation of environmental life cycle assessment for agriculture: European Commission. Baldwin, R.L. 1995. Modeling Ruminant Digestion and Metabolism. London, UK: Chapman & Hall. Bannink, A., J. Kogut, J. Dijkstra, J. France, et al. 2006. Estimation of the stoichiometry of volatile fatty acid production in
the rumen of lactating cows. Journal of Theoretical Biology 238 (1):36‐51. Basset‐Mens, C., S. Ledgard, and M. Boyes. 2009. Eco‐efficiency of intensification scenarios for milk production in New
Zealand. Ecological Economics 68 (6):1615‐1625. Beauchemin, K.A., H.H. Janzen, S.M. Little, T.A. McAllister, et al. 2010. Life cycle assessment of greenhouse gas emissions
from beef production in western Canada: A case study. Agricultural Systems 103 (6):371‐379.

Contract # GS‐23F‐8182H, Report of GHG Tools: References 125 | P a g e
Bernoux, M., M. da Conceição Santana Carvalho, B. Volkoff, and C.C. Cerri. 2002. Brazil's Soil Carbon Stocks. Soil Sci. Soc. Am. J. 66 (3):888‐896.
Birdsey, R.A. 1996. Carbon storage for major forest types and regions in the coterminous United States. In Forests and global change. Volume 2: forest management opportunities for mitigating carbon emissions, edited by N. Sampson and D. Hair. Washington, DC: American Forests.
Birdsey, R.A., and L.S. Heath. 1995. Carbon changes in U.S. forests. In Productivity of America’s forests and climate change, edited by L. S. Joyce. Fort Collins, CO: U.S. Department of Agriculture, Forest Service, Rocky Mountain Research Station.
Birdsey, R.A., and L.S. Heath. 2001. Forest inventory data, models, and assumptions for monitoring carbon flux. In Soil carbon sequestration and the greenhouse effect, edited by R. Lal. Madison, WI: Soil Science Society of America.
Blaxter, K.L., and J.L. Clapperton. 1965. Prediction of the amount of methane produced by ruminants. The British journal of nutrition 19 (4):511‐522.
Blonk, H., A. Kool, and B. Luske. 2008. Milieueffecten van Nederlandse consumptie van eiwitrijke producten. Gevolgen van vervanging van dierlijke eiwitten anno 2008. Gouda: Blonk Milieu Advies.
Blujdea, V., D.N. Bird, and C. Robledo. 2010. Consistency and comparability of estimation and accounting of removal by sinks in afforestation/reforestation activities. Mitigation and Adaptation Strategies for Global Change 15 (1):1‐18.
Bouwman, A.F., L.J.M. Boumans, and N.H. Batjes. 2002. Modeling global annual N2O and NO emissions from fertilized fields. Global Biogeochemical Cycles 16 (4).
Brown, J., J. Angerer, S.W. Salley, R. Blaisdell, et al. 2010. Improving Estimates of Rangeland Carbon Sequestration Potential in the US Southwest. Rangeland Ecology & Management 63 (1):147‐154.
Brown, L., S.C. Jarvis, and D. Headon. 2001. A farm‐scale basis for predicting nitrous oxide emissions from dairy farms. Nutrient Cycling in Agroecosystems 60 (1):149‐158.
Brown, L., D. Scholefield, E.C. Jewkes, D.R. Lockyer, et al. 2005. NGAUGE: A decision support system to optimise N fertilisation of British grassland for economic and environmental goals. Agriculture, Ecosystems & Environment 109 (1–2):20‐39.
Brown, S. 1997. Estimating biomass and biomass change of tropical forests: a primer: Food and Agriculture Organization of the United Nations. http://www.fao.org/docrep/W4095E/W4095E00.htm.
Brown, S.L., and P.E. Schroeder. 1999. Spatial patterns of aboveground production and mortality of woody biomass for eastern U.S. forests. Ecological Applications 9 (3):968‐980.
BSI. 2008. PAS 2050:2008. Specification for the assessment of the life cycle greenhouse gas emissions of goods and services. UK: British Standards Institution (BSI).
Byrne, K.A., G. Kiely, and P. Leahy. 2007. Carbon sequestration determined using farm scale carbon balance and eddy covariance. Agriculture, Ecosystems & Environment 121 (4):357‐364.
Camilleri, C. 2006. Life Cycle Assesment of Wine and Grape Growing. Angaston, South Australia: Yalumba Wine Company.
Capper, J.L., E. Castañeda‐Gutiérrez, R.A. Cady, and D.E. Bauman. 2008. The environmental impact of recombinant bovine somatotropin (rbST) use in dairy production. Proceedings of the National Academy of Sciences 105 (28):9668‐9673.
Casarim, F.M., N.L. Harris, and S. Brown. 2010. USAID Forest Carbon Calculator: Data and Equations for the Agroforestry Tool: Winrock International
Casey, J.W., and N.M. Holden. 2005. Analysis of greenhouse gas emissions from the average Irish milk production system. Agricultural Systems 86 (1):97‐114.
CCX. 2009a. CCX Offset Project Protocol: Agricultural Best Management Practices – Continuous Conservation Tillage and Conversion to Grassland Soil Carbon Sequestration: Chicago Climate Exchange.
CCX. 2009b. CCX Offset Project Protocol: Agricultural Best Management Practices – Sustainably Managed Rangeland Soil Carbon Sequestration: Chicago Climate Exchange.
CCX. 2009c. CCX Offset Project Protocol: Agricultural Methane Collection and Combustion: Chicago Climate Exchange. CCX. 2009d. CCX Offset Project Protocol: Forestry Carbon Sequestration: Chicago Climate Exchange. CDM. 2008. Consolidated baseline methodology for GHG emission reductions from manure management systems: Clean
Development Mechanism.

Contract # GS‐23F‐8182H, Report of GHG Tools: References 126 | P a g e
CDM. 2009. Offsetting of synthetic nitrogen fertilizers by inoculant application in legumes‐grass rotations on acidic soils on existing cropland: Clean Development Mechanism.
Cederberg, C., and B. Mattsson. 2000. Life cycle assessment of milk production — a comparison of conventional and organic farming. Journal of Cleaner Production 8 (1):49‐60.
Cederberg, C., U. Sonesson, M. Henriksson, V. Sund, et al. 2009. Greenhouse gas emissions from Swedish production of meat, milk and eggs 1990 and 2005. Göteborg, Sweeden: The Swedish Institute for Food and Biotechnology.
Cederberg, C., and M. Stadig. 2003. System expansion and allocation in life cycle assessment of milk and beef production. The International Journal of Life Cycle Assessment 8 (6):350‐356.
Chadwick, D.R., and B.F. Pain. 1997. Methane fluxes following slurry applications to grassland soils: laboratory experiments. Agriculture, Ecosystems & Environment 63 (1):51‐60.
Chianese, D.S., C.A. Rotz, and T.L. Richard. 2009a. Simulation of carbon dioxide emissions from dairy farms to assess greenhouse gas reduction strategies. Trans. ASABE 52:1301‐1312.
Chianese, D.S., C.A. Rotz, and T.L. Richard. 2009b. Simulation of methane emissions from dairy farms to assess greenhouse gas reduction strategies. Trans. ASABE 52:1313‐1323.
Chianese, D.S., C.A. Rotz, and T.L. Richard. 2009c. Simulation of nitrous oxide emissions from dairy farms to assess greenhouse gas reduction strategies. . Transactions of the Asabe 52 (4):1325‐1335.
Choudrie, S.L., J. Jackson, J.D. Watterson, T. Murrells, et al. 2008. UK Greenhouse Gas Inventory, 1990 to 2006: Annual Report for submission under the Framework Convention on Climate Change. Oxfordshire, UK: Department for Environment, Food and Rural Affairs.
Clark, H. 2001. Ruminant methane emissions: a review of the methodology used for national inventory estimations. Wellington, New Zealand.
Climate Action Reserve. 2010a. Forest Project Protocol. Los Angeles, CA: Climate Action Reserve. Climate Action Reserve. 2010b. U.S. Livestock Project Protocol. Los Angeles, CA: Climate Action Reserve. Coleman, K., and D.S. Jenkinson. 1999. RothC‐26.3—A Model for the Turnover of Carbon in Soil: Model Description and
Users’ Guide. Harpenden, UK: Lawes Agricultural Trust. Cuttle, S., M. Shepherd, and G. Goodlass. 2003. A review of leguminous fertility‐building crops, with particular refence to
nitrogen fixation and utilization: Defra Project OF0316. http://www.organicadvice.org.uk/soil_papers/leguminous_fert.pdf.
DEFRA. 2005. Annexes to Guidelines for Company Reporting on Greenhouse Gas Emissions: Department for Environment Food and Rural Affairs. http://archive.defra.gov.uk/environment/business/reporting/pdf/envrpgas‐annexes.pdf.
DEFRA. 2010. Guidelines to Defra / DECC’s GHG Conversion Factors for Company Reporting: Methodology Paper for Emission Factors: Department for Environment Food and Rurual Affairs. http://archive.defra.gov.uk/environment/business/reporting/pdf/101006‐guidelines‐ghg‐conversion‐factors‐method‐paper.pdf.
Del Grosso, S., D. Ojima, W. Parton, A. Mosier, et al. 2002. Simulated effects of dryland cropping intensification on soil organic matter and greenhouse gas exchanges using the DAYCENT ecosystem model. Environmental Pollution 116:S75‐S83.
Del Grosso, S.J., A.R. Mosier, W.J. Parton, and D.S. Ojima. 2005. DAYCENT model analysis of past and contemporary soil N2O and net greenhouse gas flux for major crops in the USA. Soil & Tillage Research 83 (1):9‐24.
Del Grosso, S.J., W.J. Parton, A.R. Mosier, M.D. Hartman, et al. 2001a. Simulated interaction of carbon dynamics and nitrogen trace gas fluxes using the DAYCENT model. In Modeling Carbon and Nitrogen Dynamics for Soil Management, edited by M. J. Schaffer, L. Ma and S. Hansen. Boca Raton, Florida: CRC Press.
Del Grosso, S.J., W.J. Parton, A.R. Mosier, M.D. Hartman, et al. 2001b. Simulated effects of land use, soil texture, and precipitation on N gas emissions using DAYCENT. In Nitrogen in the Environment: Sources, Problems, and Management, edited by R. F. Follett and J. L. Hatfield. The Netherlands: Elsevier Science Publishers.
del Prado, A., T. Misselbrook, D. Chadwick, A. Hopkins, et al. 2011. SIMSDAIRY: A modelling framework to identify sustainable dairy farms in the UK. Framework description and test for organic systems and N fertiliser optimisation. Science of The Total Environment 409 (19):3993‐4009.
del Prado, A., and D. Scholefield. 2008. Use of SIMS(DAIRY) modelling framework system to compare the scope on the sustainability of a dairy farm of animal and plant genetic‐based improvements with management‐based changes. Journal of Agricultural Science 146:195‐211.

Contract # GS‐23F‐8182H, Report of GHG Tools: References 127 | P a g e
del Prado, A., D. Scholefield, D.R. Chadwick, T.H. Misselbrook, et al. 2006. A modelling framework to identify new integrated dairy production systems. Grassland Science in Europe 11:766‐768.
Dendoncker, N., B. Van Wesemael, M.D.A. Rounsevell, C. Roelandt, et al. 2004. Belgium’s CO2 mitigation potential under improved cropland management. Agriculture, Ecosystems & Environment 103 (1):101‐116.
Dijkstra, J., E. Kebreab, A. Bannink, L.A. Crompton, et al. 2008. Comparison of energy evaluation systems and a mechanistic model for milk production by dairy cattle offered fresh grass‐based diets. Animal Feed Science and Technology 143 (1–4):203‐219.
Dijkstra, J., H. Neal, D.E. Beever, and J. France. 1992. SIMULATION OF NUTRIENT DIGESTION, ABSORPTION AND OUTFLOW IN THE RUMEN ‐ MODEL DESCRIPTION. Journal of Nutrition 122 (11):2239‐2256.
Dixon, G.E. 2002. Essential FVS: A user’s guide to the Forest Vegetation Simulator. Fort Collins, CO: U. S. Department of Agriculture, Forest Service, Forest Management Service Center.
DOE. 2007. Technical Guidelines Voluntary Reporting of Greenhouse Gases (1605(b)) Program. Washington DC: Office of Policy and International Affairs United States Department of Energy.
Douglas, C.L., and R.W. Rickman. 1992. Estimating Crop Residue Decomposition from Air Temperature, Initial Nitrogen Content, and Residue Placement. Soil Sci. Soc. Am. J. 56 (1):272‐278.
Driver, K., K. Haugen‐Kozyra, and R. Janzen. 2010a. Agriculture Sector Greenhouse Gas Practices and Quantification Review: Phase 1 Report.
Driver, K., K. Haugen‐Kozyra, and R. Janzen. 2010b. Agriculture Sector Greenhouse Gas Practices and Quantification Review: Phase 2 Report.
Earle, R.L. 1996. Food processing In Energy Efficiency: a guide to current and emerging technologies. Volume 2, Industry and Primary Production: Centre for Advanced Engineering, University of Canterbury.
Eastern Research Group. 2009. Documentation of the Emissions Calculations for Version 1.2 of the Manure and Nutrient Reduction Estimator (MANURE) tool. Arlington, VA: ERT ‐ Winrock International.
Ellis, J.L., E. Kebreab, N.E. Odongo, B.W. McBride, et al. 2007. Prediction of Methane Production from Dairy and Beef Cattle. Journal of dairy science 90 (7):3456‐3466.
Elsayed, M.A., R. Matthews, and N.D. Mortimer. 2003. Carbon and Energy Balances for a Range of Biofuels Options. Sheffield, UK: Resources Research Institute, Sheffield Hallam University.
EPA. 2003. Inventory of U.S. Greenhouse Gas Emissions and Sinks: 1990‐2001. Washington, D.C.: U.S. Environmental Protection Agency.
EPA. 2008a. Climate Leaders Greenhouse Gas Inventory Protocol ‐ Offset Project Methodology for Managing Manure with Biogas Recovery Systems: Climate Protection Partnerships Division/Climate Change Division Office of Atmospheric Programs, U.S. Environmental Protection Agency.
EPA. 2008b. Climate Leaders Greenhouse Gas Inventory Protocol ‐ Offset Project Methodology for Reforestation/ Afforestation: Climate Protection Partnerships Division/Climate Change Division Office of Atmospheric Programs, U.S. Environmental Protection Agency.
EPA. 2008c. Climate Leaders Greenhouse Gas Inventory Protocol ‐ Stationary Combustion Guidance: Climate Protection Partnerships Division/Climate Change Division Office of Atmospheric Programs, U.S. Environmental Protection Agency.
EPA. 2009. Inventory of U.S. Greenhouse Gas Emissions and Sinks: 1990‐2007. Washington, D.C.: U.S. Environmental Protection Agency.
Falloon, P., D. Powlson, and P. Smith. 2004. Managing field margins for biodiversity and carbon sequestration: a Great Britain case study. Soil Use and Management 20 (2):240‐247.
FAO. 2006. Global Forest Resource Assessment 2005, Main Report. Progress Towards Sustainable Forest Management. Rome, Italy: Food and Agriculture Organization of the United Nations.
FAO. 2009. FAO STAT: FAO Statistical Database: Food and Agriculture Organization of the United Nations. FAO. 2010. Greenhouse Gas Emissions from the Dairy Sector: A Life Cycle Assessment: Food and Agriculture Organization
of the United Nations: Animal Production and Health Division. Flowers, J.D., J.R. Williams, and L.M. Hauck. 1996. Livestock and the Environment: A National Pilot Project NPP Integrated
Modeling system: Calibration of the APEX Model for Dairy Waste Application Fields in Erath County, Texas.

Contract # GS‐23F‐8182H, Report of GHG Tools: References 128 | P a g e
Foster, C., E. Audsley, A. Williams, S. Webster, et al. 2007. The Environmental, Social and Economic Impacts Associated with Liquid Milk Consumption in the UK and its Production: A Review of Literature and Evidence. London, United Kingdom: DEFRA.
Fox, D.G., C.J. Sniffen, J.D. Oconnor, J.B. Russell, et al. 1992. A net carbohydrate and protein system for evaluating catle diets. 3. Cattle requirements and diet adequacy. Journal of Animal Science 70 (11):3578‐3596.
Gassman, P.W. 1997. The National Pilot Program Integrated Modeling System: Environmental Baseline Assumptions and Results for the APEX Model (Livestock Series Report 9). Ames, Iowa: Center for Agricultural and Rural Development, Iowa State University.
Gassman, P.W., J.R. Williams, V.W. Benson, R.C. Izaurralde, et al. 2005. Historical development and applications of the EPIC and APEX models. Ames, IA: Center for Agricultural and Rural Development, Iowa State University. http://www.card.iastate.edu/publications/synopsis.aspx?id=763.
Gassman, P.W., J.R. Williams, X. Wang, A. Saleh, et al. 2010. The Agricultural Policy/Environmental eXtender (APEX) model: An emerging tool for landscape and watershed environmental analyses. Transactions of the Asabe 53 (3):711‐740.
Giger‐Reverdin, S., P. Morand‐Fehr, and G. Tran. 2003. Literature survey of the influence of dietary fat composition on methane production in dairy cattle. Livestock Production Science 82 (1):73‐79.
Giltrap, D.L., C.S. Li, and S. Saggar. 2010. DNDC: A process‐based model of greenhouse gas fluxes from agricultural soils. Agriculture Ecosystems & Environment 136 (3‐4):292‐300.
González‐Avalos, E., and L.G. Ruiz‐Suárez. 2001. Methane emission factors from cattle manure in Mexico. Bioresource Technology 80 (1):63‐71.
Grace, P.R., M. Colunga‐Garcia, S.H. Gage, G.P. Robertson, et al. 2006a. The potential impact of agricultural management and climate change on soil organic carbon of the North Central Region of the United States. Ecosystems 9 (5):816‐827.
Grace, P.R., and J.N. Ladd. 1995. SOCRATES v2.00 User Manual. Glen Osmond. South Australia: Cooperative Research Centre for Soil and Land Management.
Grace, P.R., J.N. Ladd, G.P. Robertson, and S.H. Gage. 2006b. SOCRATES ‐ A simple model for predicting long‐term changes in soil organic carbon in terrestrial ecosystems. Soil Biology & Biochemistry 38 (5):1172‐1176.
Greenhalgh, S., F. Daviet, and E. Weninger. 2006. The Greenhouse Gas Protocol. The Land Use, Land‐Use Change, and Forestry Guidance for GHG Project Accounting: World Resource Institute.
Halberg, N., I.S. Kristensen, and T. Dalgaard. 1999. Linking data sources and models at the levels of processes, farm types, and regions. In Agricultural data for Life Cycle Assessments, edited by B. P. Weidema and M. J. G. Meeusen: Agricultural Economics Research Institute.
Hall, P., P. Holmes‐Ling, K. Stewart, and R. Sheane. 2010. A Scottish Farm‐Based Greenhouse Gas Accounting Tool. A review of existing tools and recommendations for improved emissions accounting and reporting within agriculture and horticulture: Prepared by Laurence Gould Partnership Ltd and Best Foot Forward for the Scottish Government.
Hammond, G.P., and C.I. Jones. 2008. Embodied energy and carbon in construction materials: Thomas Telford. Harris, N.L., T.R.H. Pearson, S. Petrova, S. Grimland, et al. 2009a. USAID Forest Carbon Calculator: Data and Equations for
the Afforestation/Reforestation Tool: Winrock International under USAID Cooperative Agreement No. EEM‐A‐00‐06‐00024‐00.
Harris, N.L., T.R.H. Pearson, S. Petrova, S. Grimland, et al. 2009b. USAID Forest Carbon Calculator: Data and Equations for the Forest Management Tool: Winrock International under USAID Cooperative Agreement No. EEM‐A‐00‐06‐00024‐00.
Harris, N.L., T.R.H. Pearson, S. Petrova, S. Grimland, et al. 2009c. USAID Forest Carbon Calculator: Data and Equations for the Forest Protection Tool: Winrock International under USAID Cooperative Agreement No. EEM‐A‐00‐06‐00024‐00.
Heath, L.S., M.C. Nichols, J.E. Smith, and J.R. Mills. 2010. FORCARB2: An updated version of the U.S. Forest Carbon Budget Model. Newtown Square, PA: U.S. Department of Agriculture, Forest Service, Northern Research Station.
Heath, L.S., J.E. Smith, and R.A. Birdsey. 2003. Carbon trends in U. S. forest lands: a context for the role of soils in forest carbon sequestration. In The potential of US forest soils to sequester carbon and mitigate the greenhouse effect, edited by J. M. Kimble, L. S. Heath, R. A. Birdsey and R. Lal. Boca Raton, FL: CRC Press.

Contract # GS‐23F‐8182H, Report of GHG Tools: References 129 | P a g e
Herrero, M., P.K. Thornton, R. Kruska, and R.S. Reid. 2008. Systems dynamics and the spatial distribution of methane emissions from African domestic ruminants to 2030. Agriculture, Ecosystems & Environment 126 (1–2):122‐137.
Høgh‐Jensen, H., R. Loges, E.S. Jensen, F.V. Jørgensen, et al. 2003. Empirical model for quantification of symbiotic nitrogen fixation in leguminous crops.
Holmes‐Ling, P., and P. Metcalfe. 2008. Natural England Carbon Baseline Survey Project UK: Natural England http://s3.amazonaws.com/zanran_storage/www.naturalengland.org.uk/ContentPages/18412107.pdf.
Holmes, T.P., G.M. Blate, J.C. Zweede, R. Pereira Jr, et al. 2002. Financial and ecological indicators of reduced impact logging performance in the eastern Amazon. Forest Ecology and Management 163 (1–3):93‐110.
Hoover, C., and S. Rebain. 2008. The Kane Experimental Forest carbon inventory: Carbon reporting with FVS. Proceedings of the Third Forest Vegetation Simulator Conference, February 13‐15, 2007, at Fort Collins, CO.
Howden, S.M., D.H. White, G.M. McKeon, J.C. Scanlan, et al. 1994. Methods for exploring management options to reduce greenhouse gas emissions from tropical grazing systems. Climatic Change 27 (1):49‐70.
Hurst, D.F., D.W.T. Griffith, J.N. Carras, D.J. Williams, et al. 1994a. Measurements of trace gases emitted by Australian savanna fires during the 1990 dry season. Journal of Atmospheric Chemistry 18 (1):33‐56.
Hurst, D.F., D.W.T. Griffith, and G.D. Cook. 1994b. Trace gas emissions from biomass burning in tropical Australian savannas. J. Geophys. Res. 99 (D8):16441‐16456.
IEUA. 2006. Monitoring, Reporting and Verification Protocol for the IEUA Anaerobic Digester Project: Inland Empire Utility Agency.
IPCC. 1996. IPCC Guidelines for National Greenhouse Gas Inventories: Intergovernmental Panel on Climate Change. www.ipcc‐nggip.iges.or.jp/public/gl/invs1.htm.
IPCC. 1997. Greenhouse Gas Inventory Reference Manual (Revised 1996 IPCC Guidelines for National Greenhouse Gas Inventories): Intergovernmental Panel on Climate Change. www.ipcc‐nggip.iges.or.jp/public/gl/invs1.htm.
IPCC. 2000. Good Practice Guidance and Uncertainty Management in National Greenhouse Gas Inventories. In Intergovernmental Panel on Climate Change. IPCC National Greenhouse Gas Inventories Programme.
IPCC. 2003. Good Practice Guidance for Land Use, Land‐Use Change and Forestry. In Intergovernmental Panel on Climate Change. IPCC National Greenhouse Gas Inventories Programme.
IPCC. 2006. 2006 IPCC Guidelines for National Greenhouse Gas Inventories, Vol 4. Agriculture, Forestry and Other Land Use, Prepared by the National Greenhouse Gas Inventories Programme. Edited by H. S. Eggleston, L. Buendia, K. Miwa, T. Ngara and K. Tanabe. Japan: IGES. http://www.ipcc‐nggip.iges.or.jp/public/2006gl/vol4.html.
ISO. 2006. Environmental management ‐ Life Cycle Assessment: Requirements and guidelines: International Organization for Standardization.
Izaurralde, R.C., J.R. Williams, W.B. McGill, N.J. Rosenberg, et al. 2006. Simulating soil C dynamics with EPIC: Model description and testing against long‐term data. Ecological Modelling 192 (3‐4):362‐384.
Janzen, H.H., D.A. Angers, M. Boehm, M. Bolinder, et al. 2006. A proposed approach to estimate and reduce net greenhouse gas emissions from whole farms. Canadian Journal of Soil Science 86 (3):401‐418.
Jenkins, J.C., D.C. Chojnacky, L.S. Heath, and R.A. Birdsey. 2003. National‐scale biomass estimators for United States tree species. Forest Science 49 (1):12‐35.
Jenkinson, D.S. 1990. The turnover of organic‐carbon and nitrogen in soil. Philosophical Transactions of the Royal Society of London Series B‐Biological Sciences 329 (1255):361‐368.
Jobbágy, E.G., and R.B. Jackson. 2000. The vertical distribution of soil organic carbon and its relation to climate and vegetation. Ecological Applications 10 (2):423‐436.
Johnson, K.A., R.L. Kincaid, H.H. Westberg, C.T. Gaskins, et al. 2002. The Effect of Oilseeds in Diets of Lactating Cows on Milk Production and Methane Emissions. Journal of dairy science 85 (6):1509‐1515.
Kebreab, E., K.A. Johnson, S.L. Archibeque, D. Pape, et al. 2008. Model for estimating enteric methane emissions from United States dairy and feedlot cattle. Journal of Animal Science 86 (10):2738‐2748.
Kebreab, E., J.A.N. Mills, L.A. Crompton, A. Bannink, et al. 2004. An integrated mathematical model to evaluate nutrient partition in dairy cattle between the animal and its environment. Animal Feed Science and Technology 112 (1‐4):131‐154.
Kerckhoffs, L.H.J., and J.B. Reid. 2007. Carbon sequestration in the standing biomass of orchard crops in New Zealand. Hastings, New Zealand: New Zealand Institute for Crop & Food Research Ltd.

Contract # GS‐23F‐8182H, Report of GHG Tools: References 130 | P a g e
King, J.A., R.I. Bradley, R. Harrison, and A.D. Carter. 2004. Carbon sequestration and saving potential associated with changes to the management of agricultural soils in England. Soil Use and Management 20 (4):394‐402.
Kirchgessner, M., W. Windisch, and H.L. Müller. 1995. Nutritional factors for the quantification of methane production. In Ruminant Physiology: Digestion, Metabolism, Growth and Reproduction, edited by W. V. Engelhardt, S. Leonhard‐Marek, G. Breves and D. Giesecke: Proceedings VIII International Symposium on Ruminant Physiology.
Kirchgessner, M., W. Windisch, H.L. Müller, and M. Kreuzer. 1991. Release of methane and of carbon dioxide by dairy cattle. Agribiological Research 44 (2‐3):91‐102.
Knyazikhin, Y., J. Glassy, J.L. Privette, Y. Tian, et al. 1999. MODIS Leaf Area Index (LAI) and Fraction of Photosynthetically Active Radiation Absorbed by Vegetation (FPAR) Product (MOD15) Algorithm, Theoretical Basis Document. Greenbelt, MD: NASA Goddard Space Flight Center.
Kort, J., and R. Turnock. 1998. Annual carbon accumulations in agroforestry plantations. Indian Head, Canada: Agriculture and Agri‐Food Canada, PFRA Shelterbelt Centre.
Lal, R. 2004. Carbon emission from farm operations. Environment International 30 (7):981‐990. Lazarus, M., C. Lee, G. Smith, K. Todd, et al. 2009. Road‐testing of Selected Offset Protocols and Standards. A Comparison
of Offset Protocols: Landfills, Manure, and Afforestation/Reforestation. Somerville, MA: Stockholm Environment Institute.
LCVP. 2004. Well‐to‐Wheel Evaluation for Production of Ethanol from Wheat. London, UK: Low Carbon Vehicle Partnership (LowCVP) Fuels Working Group. http://www.lowcvp.org.uk
Legesse, G., J.A. Small, S.L. Scott, G.H. Crow, et al. 2011. Predictions of enteric methane emissions for various summer pasture and winter feeding strategies for cow calf production. Animal Feed Science and Technology 166–167 (0):678‐687.
Li, C. 2000. Modeling Trace Gas Emissions from Agricultural Ecosystems. Nutrient Cycling in Agroecosystems 58 (1):259‐276.
Li, C., S. Frolking, and T.A. Frolking. 1992. A Model of Nitrous Oxide Evolution From Soil Driven by Rainfall Events: 1: Model structure and sensitivity. Journal of Geophysical Research 97 (D9):9777‐9783.
Li, C., S. Frolking, and R. Harriss. 1994. Modeling carbon biogeochemistry in agricultural soils. Global Biogeochem. Cycles 8 (3):237‐254.
Li, C., A. Mosier, R. Wassmann, Z. Cai, et al. 2004. Modeling greenhouse gas emissions from rice‐based production systems: Sensitivity and upscaling. Global Biogeochemistry Cycles 18 (GB1043).
Li, C., V. Narayanan, and R.C. Harriss. 1996. Model estimates of nitrous oxide emissions from agricultural lands in the United States. Global Biogeochem. Cycles 10 (2):297‐306.
Liang, Y., H.T. Gollany, R.W. Rickman, S.L. Albrecht, et al. 2008. CQESTR Simulation of Management Practice Effects on Long‐Term Soil Organic Carbon. Soil Sci. Soc. Am. J. 72 (5):1486‐1492.
Liang, Y., H.T. Gollany, R.W. Rickman, S.L. Albrecht, et al. 2009. Simulating soil organic matter with CQESTR (v. 2.0): Model description and validation against long‐term experiments across North America. Ecological Modelling 220 (4):568‐581.
Little, S., J. Lindeman, K. Maclean, and H. Janzen. 2008. Holos: A tool to estimate and reduce greenhouse gases from farms. Methodology & algorithms for version 1.1.x: Agriculture and Agri‐Food Canada.
Livestock Improvement Corporation. 2004. New Zealand Dairy Statistics 2003‐2004. Hamilton, New Zealand: Livestock Improvement Corporation.
Ludovici, K.H., S.J. Zarnoch, and D.D. Richter. 2002. Modeling in‐situ pine root decomposition using data from a 60‐year chronosequence. Canadian Journal of Forest Research 32 (9):1675‐1684.
Marinier, M., K. Clark, and C. Wagner‐Riddel. 2004. Improving Estimates of Methane Emissions Associated with Animal Waste Management Systems in Canada by Adopting an IPCC Tier 2 Methodology.
Marshall, I.B., P. Schut, and M. Ballard. 1999. A National Ecological Framework for Canada: Attribute Data. Ottawa/Hull, Canada: Environmental Quality Branch, Ecosystems Science Directorate, Environment Canada and Research Branch, Agriculture and Agri‐ Food Canada.
McConkey, B., D. Angers, M. Bentham, M. Boehm, et al. 2007. Canadian Agricultural Greenhouse Gas Monitoring Accounting and Reporting System: Methodology and greenhouse gas estimates for agricultural land in the LULUCF sector for NIR 2006. Ottawa, Canada: Agriculture and Agri‐Food Canada.

Contract # GS‐23F‐8182H, Report of GHG Tools: References 131 | P a g e
McSwiney, C.P., S. Bohm, P.R. Grace, and G.P. Robertson. 2010. Greenhouse Gas Emissions Calculator for Grain and Biofuel Farming Systems. jnrlse 39 (1):125‐131.
Miles, P. 2008. A simplified Forest Inventory and Analysis Database: FIADB‐Lite. Newtown Square, PA: U.S. Department of Agriculture, Forest Service, Northern Research Station.
Millar, N., G.P. Robertson, P.R. Grace, R.J. Gehl, et al. 2010. Nitrogen fertilizer management for nitrous oxide (N2O) mitigation in intensive corn (Maize) production: an emissions reduction protocol for U.S. Midwest agriculture. Mitigation and Adaption Strategies for Global Change 15 (2):185‐204.
Mills, J.A., J. Dijkstra, A. Bannink, S.B. Cammell, et al. 2001. A mechanistic model of whole‐tract digestion and methanogenesis in the lactating dairy cow: model development, evaluation, and application. Journal of Animal Science 79 (6):1584‐1597.
Mills, J.A.N., E. Kebreab, C.M. Yates, L.A. Crompton, et al. 2003. Alternative approaches to predicting methane emissions from dairy cows. Journal of Animal Science 81 (12):3141‐3150.
Mincemoyer, S.A. 2002. FOFEM fuel loading database. Missoula, MT USDA Forest Service, Rocky Mountain Research Station, Missoula Fire Sciences Laboratory,.
Minson, D.J., and C.K. McDonald. 1987. Estimating Forage Intake from the Growth of Beef Cattle. Tropical Grasslands 21 (3):116‐122.
Mortimer, N.D., M.A. Elsayed, and R.E. Horne. 2004. Energy and Greenhouse Gas Emissions for Bioethanol Production from Wheat Grain and Sugar Beet: Final Report for British Sugar plc.
Murphy, M.R., R.L. Baldwin, and L.J. Koong. 1982. Estimation of Stoichiometric Parameters for Rumen Fermentation of Roughage and Concentrate Diets. Journal of Animal Science 55 (2):411‐421.
National Inventory Report‐ Australia. 2008. National Inventory Report‐ Australia, 2008. Volume 1: The Australian Government Submission to the UN Framework Convention on Climate Change
National Inventory Report‐ Canada. 2007. National Inventory Report: Greenhouse Gas Sources and Sinks in Canada 1990‐2005. Gatineau, Canada: Greenhouse Gas Division, Environment Canada. Environment Canada. http://www.ec.gc.ca/pdb/ghg/inventory_report/2005_report/tdm‐toc_eng.cfm.
New Zealand Government. 2007. New Zealand’s Greenhouse Gas Inventory 1990–2005. New Zealand: Ministry for the Environment.
NOAA. 2009. National Weather Service: National Oceanic and Atmospheric Administration Nye, P.H., and D.J. Greenland. 1960. The soil under shifting cultivation. Harpenden, U.K.: Commonwealth Bureau of Soils. Ogle, S.M., F.J. Breidt, and K. Paustian. 2005. Agricultural management impacts on soil organic carbon storage under
moist and dry climatic conditions of temperate and tropical regions. Biogeochemistry 72 (1):87–121. Olesen, J.E., K. Schelde, A. Weiske, M.R. Weisbjerg, et al. 2006. Modelling greenhouse gas emissions from European
conventional and organic dairy farms. Agriculture, Ecosystems & Environment 112 (2–3):207‐220. Olesen, J.E., and J. Vester. 1995. Nutrient balances and energy use in organic farming ‐ emphasis on dairy and cash crop
farms (in Danish). Tjele, Denmark: Danish Institute of Agricultural Sciences. Olesen, J.E., A. Weiske, M.R. Weisbjerg, W.A.H. Asman, et al. 2004. FarmGHG. A model for estimating greenhouse gas
emissions from livestock farms. Tjele, Denmark: Danish Institute of Agricultural Sciences. Olson, J.S., J.A. Watts, and L.J. Allison. 1983. Carbon in live vegetation of major world ecosystems: Oak Ridge National
Laboratory. DOE/NBB‐0037; Other: ON: DE83015328 United StatesOther: ON: DE83015328Thu Feb 07 05:59:13 EST 2008NTIS, PC A09/MF A01; 1.ERA‐08‐044710; EDB‐83‐142959English.
Parton, W. 1996. The CENTURY model. In Evaluation of soil organic matter models using existing long‐term datasets, edited by D. S. Powlson, P. Smith and J. U. Smith. Berlin, Germany: Springer‐Verlag.
Parton, W.J., M. Hartman, D. Ojima, and D. Schimel. 1998. DAYCENT and its land surface submodel: description and testing. Global and Planetary Change 19 (1‐4):35‐48.
Parton, W.J., D.S. Schimel, C.V. Cole, and D.S. Ojima. 1987. Analysis of factors controlling soil organic matter levels in Great Plains grasslands. Soil Sci. Soc. Am. J. 51:1173‐1179.
Paustian, K., J. Brenner, M. Easter, K. Killian, et al. 2009. Counting carbon on the farm: Reaping the benefits of carbon offset programs. Journal of Soil and Water Conservation 64 (1):36A‐40A.
Paustian, K., J. Schuler, K. Killian, A. Chambers, et al. 2012. COMET2.0 – Decision support system for agricultural greenhouse gas accounting. In Managing agricultural greenhouse gases: Coordinated agricultural research

Contract # GS‐23F‐8182H, Report of GHG Tools: References 132 | P a g e
through GRACEnet to address our changing climate, edited by M. A. Liebig, A. J. Franzluebbers and R. F. Follett. San Diego, CA: Academic Press.
Pearson, T., and S. Brown. 2010. Assessment of potential for development of a simplified methodology for accounting for reduction in N2O emissions from change in fertilizer usage: Winrock International. Report to Packard Foundation under #2008‐32689.
Pearson, T., S. Grimland, and S. Brown. 2010. A spatial analysis of greenhouse gas emissions from agricultural fertilizer usage in the US: Winrock International. Report to Packard Foundation under #2008‐32689.
Pearson, T.R.H., S. Brown, and N.H. Ravindranath. 2005. Integrating Carbon Benefit Estimates into GEF Projects. New York, NY: United Nations Development Programme, Global Environment Facility.
Pereira, R., J. Zweede, G.P. Asner, and M. Keller. 2002. Forest canopy damage and recovery in reduced‐impact and conventional selective logging in eastern Para, Brazil. Forest Ecology and Management 168 (1):77‐89.
Phetteplace, H., D. Johnson, and A. Seidl. 2001. Greenhouse gas emissions from simulated beef and dairy livestock systems in the United States. Nutrient Cycling in Agroecosystems 60 (1):99‐102.
Pinard, M.A., and F.E. Putz. 1996. Retaining forest biomass by reducing logging damage. Biotropica 28 (3). Pinard, M.A., F.E. Putz, J. Tay, and T.E. Sullivan. 1995. Creating timber harvest guidelines for a reduced‐impact logging
project in Malaysia. Pitt, R.E., J.S. VanKessel, D.G. Fox, A.N. Pell, et al. 1996. Prediction of ruminal volatile fatty acids and pH within the net
carbohydrate and protein system. Journal of Animal Science 74 (1):226‐244. Plantinga, A.J., and R.A. Birdsey. 1993. Carbon fluxes resulting from United States private timberland management.
Climatic Change 23 (1):37‐53. Potter, C., P. Gross, S. Klooster, M. Fladeland, et al. 2008. Storage of carbon in U.S. forests predicted from satellite data,
ecosystem modeling, and inventory summaries. Climatic Change 90 (3):269‐282. Potter, C., S. Klooster, R. Myneni, V. Genovese, et al. 2003. Continental‐scale comparisons of terrestrial carbon sinks
estimated from satellite data and ecosystem modeling 1982–1998. Global and Planetary Change 39 (3–4):201‐213.
Potter, C.S. 1999. Terrestrial biomass and the effects of deforestation on the global carbon cycle ‐ Results from a model of primary production using satellite observations. Bioscience 49 (10):769‐778.
Proctor, P., L.S. Heath, P.C. Van Deusen, J.H. Gove, et al. 2002. COLE: a web‐based tool for interfacing with forest inventory. Proceedings of the Fourth Annual Forest Inventory and Analysis Symposium.
PTWG. 2006. Greenhouse Gas System Pork Protocol: The Innovative Feeding of Swine and Storing and Spreading of Swine Manure: Pork Technical Working Group (PTWG), a sub‐committee of the National Offsets Quantification Team (NOQT).
Reinhardt, E. 2003. Using FOFEM 5.0 to estimate tree mortality, fuel consumption, smoke production and soil heating from wildland fire. Missoula, MT: Missoula Fire Sciences Lab.
Reinhardt, E., N.L. Crookston, S.A. Rebain, and (tech. eds.). 2007. Addendum to the fire and fuels extension to the Forest Vegetation Simulator. http://www.fs.fed.us/fmsc/fvs/documents/gtrs_ffeaddendum.php.
Reinhardt, E.D., R.E. Keane, and J.K. Brown. 1997. First Order Fire Effects Model: FOFEM 4.0, users guide: General Technical Report INT‐GTR‐344.
Renard, K.G., G.R. Foster, G.A. Weesies, D.K. McCool, et al. 1996. Predicting Soil Erosion by Water: A guide to conservation planning with the Revised Universal Soil Loss Equation (RUSLE). In Agriculture Handbook No. 703. Washington D.C.: U.S. Department of Agriculture.
RGGI. 2007. Regional Greenhouse Gas Initiative. Model Rule Rickman, R.W., C.L. Douglas, S.L. Albrecht, L.G. Bundy, et al. 2001. CQESTR: a model to estimate carbon sequestration in
agricultural soils. Journal of Soil and Water Conservation 56 (3):237‐242. Robertson, G.P., E.A. Paul, and R.R. Harwood. 2000. Greenhouse gases in intensive agriculture: Contributions of
individual gases to the radiative forcing of the atmosphere. Science 289 (5486):1922‐1925. Rochette, P., D.E. Worth, E.C. Huffman, J.A. Brierley, et al. 2008a. Estimation of N(2)O emissions from agricultural soils in
Canada. II. 1990‐2005 inventory. Canadian Journal of Soil Science 88 (5):655‐669. Rochette, P., D.E. Worth, R.L. Lemke, B.G. McConkey, et al. 2008b. Estimation of N(2)O emissions from agricultural soils
in Canada. I. Development of a country‐specific methodology. Canadian Journal of Soil Science 88 (5):641‐654.

Contract # GS‐23F‐8182H, Report of GHG Tools: References 133 | P a g e
Rosenzweig, C., S. Bartges, A. Powell, J. Garcia, et al. 2010. Soil carbon sequestration potential in the Hudson Valley, New York‐A pilot study utilizing COMET‐VR. Journal of Soil and Water Conservation 65 (3):68A‐71A.
Rotz, C.A., and D.S. Chianese. 2009. The Dairy Greenhouse Gas Model. Reference Manual Version 1.2: U.S. Department of Agriculture, Agricultural Research Service, Pasture Systems and Watershed Management Research Unit.
Rotz, C.A., D.S. Chianese, F. Montes, S. Hafner, et al. 2011. Dairy Gas Emissions Model. Reference Manual Version 2.4: U.S. Department of Agriculture, Agricultural Research Service, Pasture Systems and Watershed Management Research Unit.
Rotz, C.A., M.S. Corson, D.S. Chianese, and C.U. Coiner. 2009. Integrated Farm System Model. Reference Manual Version 3.2: U.S. Department of Agriculture, Agricultural Research Service, Pasture Systems and Watershed Management Research Unit.
Rotz, C.A., F. Montes, and D.S. Chianese. 2010. The carbon footprint of dairy production systems through partial life cycle assessment. Journal of Dairy Science 93 (3):1266‐1282.
Russell, J.B., J.D. Oconnor, D.G. Fox, P.J. Vansoest, et al. 1992. A net carbohydrate and protein system for evaluating cattle diets. 1. Ruminal Fermentation. Journal of Animal Science 70 (11):3551‐3561.
Saggar, S., H. Clark, C. Hedley, K. Tate, et al. 2003. Methane emissions from animal dung and waste management systems, and its contribution to the national methane budget. Wellington, New Zealand: New Zealand Ministry of Agriculture and Forestry. LandCare Research Contract Report LC0301/020.
Schils, R.L.M., M.H.A. de Haan, J.G.A. Hemmer, A. van den Pol‐van Dasselaar, et al. 2007a. DairyWise, a whole‐farm dairy model. Journal of Dairy Science 90 (11):5334‐5346.
Schils, R.L.M., J.E. Olesen, A. del Prado, and J.F. Soussana. 2007b. A review of farm level modelling approaches for mitigating greenhouse gas emissions from ruminant livestock systems. Livestock Science 112 (3):240‐251.
Schmer, M.R., K.P. Vogel, R.B. Mitchell, and R.K. Perrin. 2008. Net energy of cellulosic ethanol from switchgrass. Proceedings of the National Academy of Sciences 105:464‐469.
Sevenster, M., and F. DeJong. 2008. A sustainable dairy sector. Global, regional and life cycle facts and figures on greenhouse‐gas emissions: CE Delft.
Sherlock, R.R., S.G. Sommer, R.Z. Khan, C.W. Wood, et al. 2002. Ammonia, Methane, and Nitrous Oxide Emission from Pig Slurry Applied to a Pasture in New Zealand. J. Environ. Qual. 31 (5):1491‐1501.
Skog, K.E. 2008. Sequestration of carbon in harvested wood products for the United States. Forest Products Journal 58 (6):56‐72.
Smith, J.E., and L.S. Heath. 2002. A model of forest fl oor carbon mass for United States forest types. Newtown Square, PA: U.S. Department of Agriculture, Forest Service, Northeastern Research Station.
Smith, J.E., L.S. Heath, and J.C. Jenkins. 2003. Forest volume‐to‐biomass models and estimates of mass for live and standing dead trees of U.S. forests. Newtown Square, PA: U.S. Department of Agriculture, Forest Service, Northeastern Research Station.
Smith, J.E., L.S. Heath, and M.C. Nichols. 2007. US forest carbon calculation tool: forest‐land carbon stocks and net annual stock change (Revised). Newtown Square, PA: U.S. Department of Agriculture, Forest Service, Northern Research Station.
Smith, J.E., L.S. Heath, K.E. Skog, and R.A. Birdsey. 2006. Methods for calculating forest ecosystem and harvested carbon with standard estimates for forest types of the United States. Newtown Square, PA: U.S. Department of Agriculture, Forest Service, Northeastern Research Station.
Smith, J.E., L.S. Heath, and P.B. Woodbury. 2004. How to estimate forest carbon for large areas from inventory data. Journal of Forestry 102 (5):25‐31.
Smith, P., D.S. Powlson, M.J. Glendining, and J.U. Smith. 1997. Potential for carbon sequestration in European soils: Preliminary estimates for five scenarios using results from long‐term experiments. Global Change Biology 3 (1):67‐79.
Sniffen, C.J., J.D. Oconnor, P.J. Vansoest, D.G. Fox, et al. 1992. A net carbohydrate and protein system for evaluating cattle diets. 2. Carbohydrate and Protein Availability. Journal of Animal Science 70 (11):3562‐3577.
Sommer, S.G., J.E. Olesen, S.O. Petersen, M.R. Weisbjergz, et al. 2009. Region‐specific assessment of greenhouse gas mitigation with different manure management strategies in four agroecological zones. Global Change Biology 15 (12):2825‐2837.

Contract # GS‐23F‐8182H, Report of GHG Tools: References 134 | P a g e
Sommer, S.G., S.O. Petersen, and H.B. Moller. 2004. Algorithms for calculating methane and nitrous oxide emissions from manure management. Nutrient Cycling in Agroecosystems 69 (2):143‐154.
Strömqvist, J., A.L. Collins, P.S. Davison, and E.I. Lord. 2008. PSYCHIC – A process‐based model of phosphorus and sediment transfers within agricultural catchments. Part 2. A preliminary evaluation. Journal of Hydrology 350 (3–4):303‐316.
The Keystone Alliance. 2009. Environmental Resource Indicators for Measuring Outcomes of On‐Farm Agricultural Production in the United States: Field to Market: The Keystone Alliance for Sustainable Agriculture.
Thomassen, M., R. Dalgaard, R. Heijungs, and I. de Boer. 2008a. Attributional and consequential LCA of milk production. The International Journal of Life Cycle Assessment 13 (4):339‐349.
Thomassen, M.A., K.J. van Calker, M.C.J. Smits, G.L. Iepema, et al. 2008b. Life cycle assessment of conventional and organic milk production in the Netherlands. Agricultural Systems 96 (1–3):95‐107.
Tylutki, T.P., D.G. Fox, V.M. Durbal, L.O. Tedeschi, et al. 2008. Cornell Net Carbohydrate and Protein System: A model for precision feeding of dairy cattle. Animal Feed Science and Technology 143 (1–4):174‐202.
USDA ERS. 2008. Fertilizer Use and Price, Published Estimates Database: U.S. Department of Agriculture. Van Amburgh, M.E., L.E. Chase, T.R. Overton, D.A. Ross, et al. 2010. Updates to the Cornell Net Carbohydrate and
Protein System v6.1 and implications for ration formulation. Proceedings of the Cornell Nutrition Conference, at Syracuse, NY.
Van Deusen, P., and L.S. Heath. 2011. COLE web applications suite: NCASI and USDA Forest Service, Northern Research Station.
Van Deusen, P.C., and L.S. Heath. 2010. Weighted analysis methods for mapped plot forest inventory data: Tables, regressions, maps and graphs. Forest Ecology and Management 260 (9):1607‐1612.
VCS. 2008a. Guidance for Agriculture, Forest and Other Land Use Projects: Voluntary Carbon Standard. VCS. 2008b. Tool for AFOLU Methodological Issues: Voluntary Carbon Standard. VCS. 2009a. Proposed Methodology: Afforestation/Reforestation of Agricultural Lands. Version 2: Winrock International.
Voluntary Carbon Standard. VCS. 2009b. Proposed Methodology: Adoption of sustainable agricultural land management (SALM): BioCarbon Fund.
Voluntary Carbon Standard. VCS. 2009c. Proposed Methodology: General Methodology for Quantifying the Greenhouse Gas Emission Reductions
from the Production and Incorporation into Soil of Biochar in Agricultural and Forest Management Systems: Voluntary Carbon Standard. Carbon Gold.
VCS. 2010a. Methodology for Improved Forest Management through Extension of Rotation Age: Voluntary Carbon Standard. Ecotrust.
VCS. 2010b. Proposed Methodology: Quantifying N2O Emissions Reductions in US Agricultural Crops through N Fertilizer Rate Reduction: Michigan State University‐EPRI. Voluntary Carbon Standard.
Vellinga, T.V., A.H.J. Van Der Putten, and M. Mooij. 2001. Grassland management and nitrate leaching, a model approach. NJAS ‐ Wageningen Journal of Life Sciences 49 (2–3):229‐253.
Vergé, X.P.C., J.A. Dyer, R.L. Desjardins, and D. Worth. 2007. Greenhouse gas emissions from the Canadian dairy industry in 2001. Agricultural Systems 94 (3):683‐693.
Wang, M. GREET version 1.8a. Argonne National Laboratory. Retrieved February 15, 2012 from http://greet.es.anl.gov/.
Webb, J., S.G. Anthony, L. Brown, H. Lyons‐Visser, et al. 2005. The impact of increasing the length of the cattle grazing season on emissions of ammonia and nitrous oxide and on nitrate leaching in England and Wales. Agriculture, Ecosystems & Environment 105 (1–2):307‐321.
Webb, J., and T. Misselbrook. 2004. A mass‐flow model of ammonia emissions from UK livestock production. Atmospheric Environment 38:2163‐2176.
Wells, C. 2001. Total energy indicators of agricultural sustainability: Dairy farming case study. New Zealand: Ministry of Agriculture and Fisheries.
West, T.O., and G. Marland. 2002. A synthesis of carbon sequestration, carbon emissions, and net carbon flux in agriculture: comparing tillage practices in the United States. Agriculture Ecosystems & Environment 91 (1‐3):217‐232.

Contract # GS‐23F‐8182H, Report of GHG Tools: References 135 | P a g e
Westberg, H., B. Lamb, K.A. Johnson, and M. Huyler. 2001. Inventory of methane emissions from U. S. cattle. J. Geophys. Res. 106 (D12):12633‐12642.
Wheeler, D.M., S.F. Ledgard, and C.A.M. DeKlein. 2008. Using the OVERSEER nutrient budget model to estimate on‐farm greenhouse gas emissions. Australian Journal of Experimental Agriculture 48 (1‐2):99‐103.
Williams, A.G., E. Audsley, and D.L. Sandars. 2006. Final report on project IS0205: Determining the environmental burdens and resource use in the production of agricultural and horticultural commodities. London, UK: DEFRA Publications.
Williams, J.R. 1995a. The EPIC Model. In Computer Models of Watershed Hydrology, edited by V. P. Singh. Highlands Ranch, CO: Water Resources Publications.
Williams, J.R., and R.C. Izaurralde. 2006. The APEX model. In Watershed Models, edited by V. P. Singh and D. K. Frevert. Boca Raton, FL: CRC Press, Taylor & Francis.
Williams, J.R., S. Mooney, and J.M. Peterson. 2009. What is the carbon market: Is there a final answer? Journal of Soil and Water Conservation 64 (1):27A‐35A.
Williams, L. 1995b. Are Vineyards Environmentally Friendly?: American Vineyard Viticulture and Enology Lab. Wine Institute. 2008. International Wine Carbon Calculator Protocol, Version 1.2. Winjum, J.K., S. Brown, and B. Schlamadinger. 1998. Forest Harvests and Wood Products: Sources and Sinks of
Atmospheric Carbon Dioxide. Forest Science 44 (2):272‐284. Yamulki, S., S.C. Jarvis, and P. Owen. 1999. Methane Emission and Uptake from Soils as Influenced by Excreta Deposition
from Grazing Animals. J. Environ. Qual. 28 (2):676‐682. Young, A., K.M. Menz, P. Muraya, and C. Smith. 1998. SCUAF ‐ Version 4: A Model to Estimate Soil Changes Under
Agriculture, Agroforestry and Forestry: Australian Centre for International Agricultural Research. Young, A., and P. Muraya. 1990. SCUAF: Soil Changes Under Agroforestry. Nairobi, Kenya: The World Agroforestry Centre
(ICRAF). Zhang, R., F. Mitloehner, H. El‐Mashad, L. C., et al. 2009. Process Based Emission Models for Predicting Gaseous
Emissions from Animal Feeding Operations: White Paper to USDA Agricultural Air Quality Task Force.