
Empowering Kentucky...Synapse Energy Economics, Inc. Empowering Kentucky ii From 2018 to 2032,...
72
485 Massachusetts Avenue, Suite 2 Cambridge, Massachusetts 02139 617.661.3248 | www.synapse-energy.com Empowering Kentucky A no-regrets plan to create jobs, improve health, lower bills, and invest in a just transition while cutting harmful emissions Prepared for Kentuckians for the Commonwealth April 10, 2017 AUTHORS Pat Knight Spencer Fields Frank Ackerman, PhD Tyler Comings Avi Allison
Transcript of Empowering Kentucky...Synapse Energy Economics, Inc. Empowering Kentucky ii From 2018 to 2032,...

485 Massachusetts Avenue, Suite 2
Cambridge, Massachusetts 02139
617.661.3248 | www.synapse-energy.com
Empowering Kentucky
A no-regrets plan to create jobs, improve
health, lower bills, and invest in a just transition
while cutting harmful emissions
Prepared for Kentuckians for the Commonwealth
April 10, 2017
AUTHORS
Pat Knight
Spencer Fields
Frank Ackerman, PhD
Tyler Comings
Avi Allison

Synapse Energy Economics, Inc. Empowering Kentucky
ACKNOWLEDGEMENTS
Funding for this report was provided by Kentuckians for the Commonwealth. The authors would also like
to thank members of Kentuckians for the Commonwealth for providing valuable feedback and input
throughout this analysis.
The authors at Synapse worked closely over nine months with KFTC’s New Energy and Transition
Committee to analyze Kentucky’s energy landscape and current trends, assess the impacts of various
choices, and identify key policy recommendations. Many of those recommendations were ultimately
incorporated into KFTC’s Empower Kentucky Plan.
The full Empower Kentucky Plan was developed with input from more than 1,200 Kentuckians, a diverse
range of stakeholders, and state and national energy experts, including Synapse. Many of the individuals
and organizations who provided valuable input, guidance, and support are acknowledged by KFTC at
www.empowerkentucky.org.
The Empower Kentucky Plan is published at www.empowerkentucky.org, along with an environmental
justice analysis of Kentucky produced by KFTC and this analysis by Synapse.

Synapse Energy Economics, Inc. Empowering Kentucky i
EXECUTIVE SUMMARY
This report examines Kentuckians for the Commonwealth’s “Empower Kentucky” future: a plan in which
the future energy sector prioritizes both environmental outcomes and the local economy. We find that
relative to a business-as-usual future in which no new policies are implemented, the Empower Kentucky
Plan increases jobs, decreases residential electric bills, and leads to significant environmental benefits
for public health and the global climate.
In the Empower Kentucky Plan, we assume that Kentucky and the rest of the states achieve compliance
with the Clean Power Plan. However, the Empower Kentucky Plan goes beyond the Clean Power Plan. It
describes ways Kentucky can achieve a higher-job, lower-bill, lower-carbon future through energy
efficiency, renewables, and investments in a just transition for affected workers and communities,
whether or not the Clean Power Plan is implemented in its proposed form.
Our analysis and findings follow.
------------------------------------------------------------------------------------------------------------------------------------------
For years, Kentucky’s electric system has been founded on a reliance on coal to produce inexpensive
electricity for local industry, for residents, and for regional exports. This dependence on coal has come
with the cost of creating pollutants that cause harm to Kentucky’s citizens and the global climate.
However, this status quo is beginning to change. From 2013 to 2016, 2,900 megawatts (MW) of coal
electric-generating capacity retired in Kentucky, equal to about 16 percent of the pre-2013 coal fleet.
Over the next 15 years, as coal’s role diminishes, Kentucky will increasingly rely on instate natural gas
generation and imports of electricity from Kentucky’s neighbors.
Energy markets across the United States have entered a period of rapid change, driven by many factors.
Kentucky policymakers must make a decision: should they double-down on increasingly expensive, risky,
and dirty fossil-fueled power? Or should they chart a path to a clean energy future in which Kentuckians
reap the benefits of good jobs, clean air, and lower electricity bills?
In this analysis, we analyze a Reference case—a business-as-usual future in which no changes are made
to state policy—and an Empower Kentucky Plan, in which investments in renewables and energy
efficiency increase and a modest carbon price adder is implemented. Importantly, we find that only
incremental, positive changes are needed to change the business-as-usual case into a future which
results in Kentucky meeting its emission reduction goals. At the same time, they catalyze an
economically just transition for Kentuckians by reducing monthly electric bills, creating thousands of
new jobs, and directly investing in measures that benefit affected workers and communities.
An Empower Kentucky Plan creates 46,300 more job-years for Kentuckians than a business-
as-usual future over 15 years.
Synapse Energy Economics, Inc. Empowering Kentucky ii
From 2018 to 2032, 46,300 more total job-years are created under the Empower Kentucky Plan,
equivalent to an average of 3,100 new jobs in each year, relative to the Reference case. Many of these
jobs are created through expanding energy efficiency programs in Kentucky.
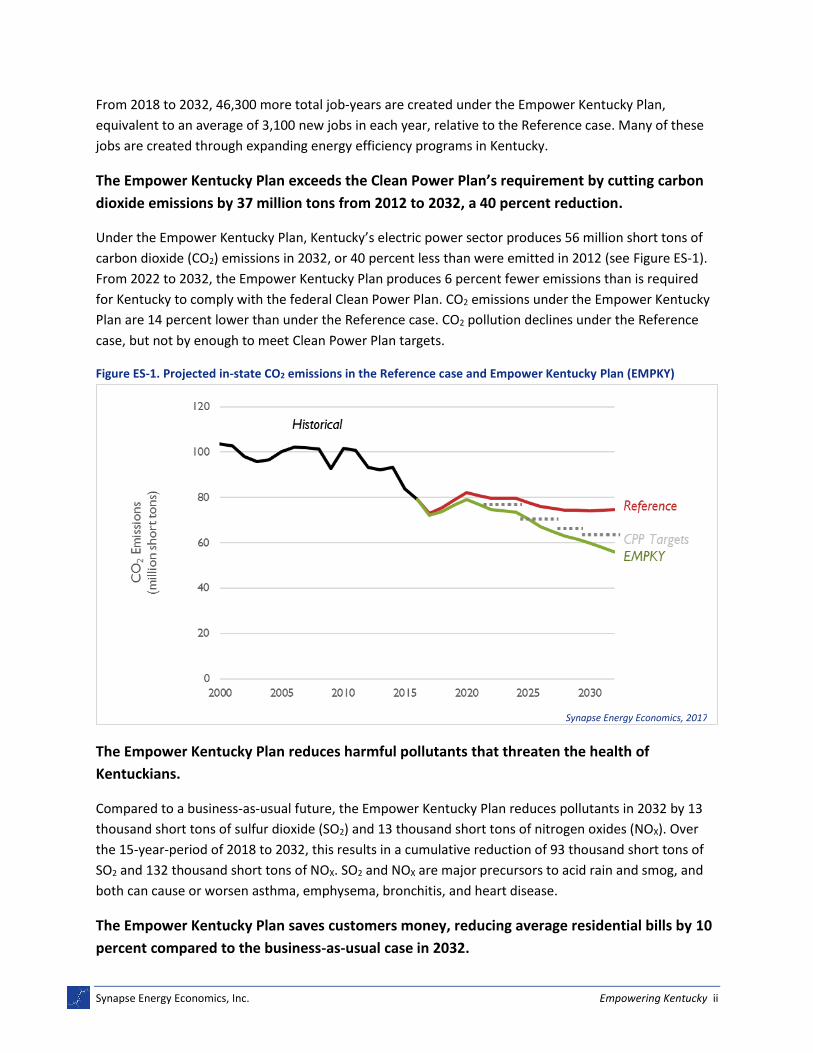
The Empower Kentucky Plan exceeds the Clean Power Plan’s requirement by cutting carbon
dioxide emissions by 37 million tons from 2012 to 2032, a 40 percent reduction.
Under the Empower Kentucky Plan, Kentucky’s electric power sector produces 56 million short tons of
carbon dioxide (CO2) emissions in 2032, or 40 percent less than were emitted in 2012 (see Figure ES-1).
From 2022 to 2032, the Empower Kentucky Plan produces 6 percent fewer emissions than is required
for Kentucky to comply with the federal Clean Power Plan. CO2 emissions under the Empower Kentucky
Plan are 14 percent lower than under the Reference case. CO2 pollution declines under the Reference
case, but not by enough to meet Clean Power Plan targets.
Figure ES-1. Projected in-state CO2 emissions in the Reference case and Empower Kentucky Plan (EMPKY)
The Empower Kentucky Plan reduces harmful pollutants that threaten the health of
Kentuckians.
Compared to a business-as-usual future, the Empower Kentucky Plan reduces pollutants in 2032 by 13
thousand short tons of sulfur dioxide (SO2) and 13 thousand short tons of nitrogen oxides (NOX). Over
the 15-year-period of 2018 to 2032, this results in a cumulative reduction of 93 thousand short tons of
SO2 and 132 thousand short tons of NOX. SO2 and NOX are major precursors to acid rain and smog, and
both can cause or worsen asthma, emphysema, bronchitis, and heart disease.
The Empower Kentucky Plan saves customers money, reducing average residential bills by 10
percent compared to the business-as-usual case in 2032.
Synapse Energy Economics, 2017
Synapse Energy Economics, Inc. Empowering Kentucky iii
Implementing energy efficiency, renewables, and carbon pricing reduces residential electric bills by $13
per month in 2032 relative to the business-as-usual future. These net cost savings are due to reduced
purchases of fossil fuels, implementing energy efficiency measures, and avoided costly environmental
retrofits. The Empower Kentucky Plan leads to average residential electric bills 10 percent lower than
the reference case in 2032.
The Empower Kentucky Plan invests $387 million in a just transition for Kentucky’s coal
workers and communities.
A key objective of the Empower Kentucky Plan is to ensure a just transition for workers and
communities most affected by the shift to a clean energy economy. Under this plan, 20 percent of all
carbon pricing revenue—$387 million—is re-invested in job training and education; financial support for
affected workers and communities; local infrastructure and job creation initiatives; and support for local
innovation and entrepreneurship.1
Over the 15-year period, the low price on CO2 emissions from instate and imported electricity
generation imposed under this plan will generate almost $1.9 billion in total revenue. Of that, 20
percent is dedicated to support just transition efforts. The remaining $1.5 billion will be re-invested in
efforts to accelerate energy efficiency across the economy and state. It can be expected that a share of
those energy sector investments will also benefit affected workers and communities, in addition to the
$387 million directed towards just transition strategies.
The Empower Kentucky Plan invests $11 billion in energy efficiency across the economy and
prioritizes savings for low-income customers.
In the Empower Kentucky Plan, utilities will invest $11 billion in energy efficiency programs between
2018 and 2032 and achieve cumulative energy savings 17 percent lower than the business-as-usual case.
Fifty-five percent of all energy savings come from Kentucky’s commercial and industrial sector, and 45
percent from residential customers. Within those overall efficiency goals, the Empower Kentucky Plan
calls for 18 percent of all energy savings to come from projects and programs benefitting low-income
customers and communities. That low-income standard is higher than some leading states are achieving
today, a reflection of Kentucky’s higher average household electricity consumption and lower median
household incomes.
The Empower Plan also builds 1,000 MW of new combined heat and power capacity by 2032 as a cost
effective approach to achieve energy savings in commercial and industrial sectors. Combined heat and
1 To learn more about KFTC’s plan for a just transition for the state’s coal workers, and economy as a whole, see:
https://www.kftc.org/sites/default/files/docs/resources/kftcs_just_transition_framework.pdf and www.empowerkentucky.org.
Synapse Energy Economics, Inc. Empowering Kentucky iv
power systems allow facilities to generate heat or hot water and electricity from the same energy
source, often located on-site, and produce significant, low-cost energy savings.
The Empower Kentucky Plan results in a cleaner and more diverse energy system in Kentucky
by 2032, while system costs are just 7 percent higher and average residential bills are lower.
Under the Empower Kentucky Plan, the share of Kentucky’s electricity generated from coal falls to 61
percent in 2032, compared to 87 percent in 2015 and 68 percent in the Reference case. The same
number of coal plant retirements are expected over the next 15 years under both scenarios. In the
Empower Kentucky Plan, Kentucky will build 0.8 GW less natural gas than in the Reference case, while
installing 1 GW more solar (including more than 600 MW of distributed solar), building 600 MW more
wind, and increasing imports by just 3 percentage points. Overall system costs for the Empower
Kentucky Plan are just 7 percent higher than the reference case, while average bills are lower due to
greater energy efficiency.
Conclusion
If Kentucky embarks on a clean energy future as envisioned in the Empower Kentucky Plan, its citizens
will benefit from lower electric bills, cleaner air and water, more jobs, and more support for workers and
communities affected by our energy transition, all while exceeding the state’s obligation to reduce
harmful climate emissions.

Synapse Energy Economics, Inc. Empowering Kentucky
CONTENTS
ACKNOWLEDGEMENTS .............................................................................................. 1
EXECUTIVE SUMMARY ................................................................................................ I
1. KENTUCKY’S ELECTRICITY FUTURE ......................................................................... 1
1.1. Kentucky’s electricity present ...........................................................................................2
Capacity, generation, and sales ................................................................................................. 2
Imports and exports .................................................................................................................. 5
Rates and bills ............................................................................................................................ 6
1.2. Looking to the future .......................................................................................................8
Low natural gas prices ............................................................................................................... 8
Lowered expectations for electricity sales ................................................................................ 9
Changes in expected resource costs ....................................................................................... 10
Environmental regulations and pricing carbon ....................................................................... 12
2. EMPOWERING KENTUCKY ................................................................................. 15
2.1. The Empower Kentucky Plan .......................................................................................... 15
Renewable portfolio standard................................................................................................. 16
Energy efficiency ..................................................................................................................... 16
The Clean Power Plan .............................................................................................................. 16
CO2 price adder ....................................................................................................................... 16
2.2. The Empower Kentucky Plan reduces CO2 emissions by 40 percent ................................. 17
Changes to electric generating capacity ................................................................................. 17
Generation implications .......................................................................................................... 18
Impacts on emissions .............................................................................................................. 19
2.3. Kentucky’s new electrical system does not increase costs ............................................... 22
System costs ............................................................................................................................ 22
Monthly electric bills ............................................................................................................... 22
2.4. The Empower Kentucky Plan produces more jobs for Kentuckians than a Reference case 23

Synapse Energy Economics, Inc. Empowering Kentucky
3. SUMMARY OF FINDINGS ................................................................................... 25
APPENDIX A: ELECTRIC SYSTEM AND JOBS IMPACT MODELS ............................................ A1
Electric-Sector ReEDS Model .................................................................................................. A1
IMPLAN Job Impacts Model .................................................................................................... A1
Temporal Scope ..................................................................................................................... A2
Geographic Scope .................................................................................................................. A2
APPENDIX B: MODELED SCENARIOS ........................................................................... B1
Electric sector natural gas prices ............................................................................................. B1
Sales forecasts and energy efficiency ...................................................................................... B2
General energy efficiency potential and costs ........................................................................ B4
Residential programs ............................................................................................................... B5
Commercial programs ............................................................................................................. B5
Industrial programs ................................................................................................................. B5
Combined heat and power ...................................................................................................... B6
Low-income programs ............................................................................................................. B7
Electric generating units in Kentucky ...................................................................................... B8
Environmental control retrofits ............................................................................................. B27
Renewable portfolio standard ............................................................................................... B31
Clean Power Plan .................................................................................................................. B32
Allowance allocation ............................................................................................................. B33
Clean Energy Incentive Program ........................................................................................... B33
CO2 price adder ..................................................................................................................... B34
Synapse Energy Economics, Inc. Empowering Kentucky 1
1. KENTUCKY’S ELECTRICITY FUTURE
For years, Kentucky’s electric system has been founded on a reliance on coal to produce inexpensive
electricity for local industry and regional exports. This reliance on coal has come with the cost of
creating pollutants that cause harm to Kentucky’s citizens and the global climate. Since electrification
began, well over 90 percent of electricity produced in Kentucky every year has come from coal plants.
This status quo is beginning to change. From 2013 to 2016, 2,900 megawatts (MW) of coal electric-
generating capacity retired, equal to about 16 percent of the pre-2013 coal fleet. Coal’s share of
Kentucky’s electric generation fell below 90 percent for the first time in 2015, to 87 percent, and
dropped even further to 83 percent in 2016. Over the next 15 years, as coal’s role diminishes, Kentucky
will increasingly rely on instate natural gas generation and imports of electricity from Kentucky’s
neighbors.
These shifts in the energy landscape have been caused in part by sustained low natural gas prices, aging
coal plants with inferior heat rates that need costly environmental retrofits, and Kentucky’s excellent
electrical connections to other states. Other changes taking place in electricity systems around the
country have impacted the Commonwealth. Renewables continue to plummet in price. Energy efficiency
and combined heat and power (CHP) measures, resources that are already cost-effective, have risen to
prominence. State and regional policies that put a price on carbon dioxide (CO2) and limit the output of
this harmful greenhouse gas have also come into effect.
In 2015, the United States Environmental Protection Agency (EPA) promulgated the Clean Power Plan, a
federal regulation aimed at reducing CO2 emissions through a switch to renewables, energy efficiency,
and natural gas. On February 9, 2016, the United States Supreme Court issued an unprecedented stay
on the Clean Power Plan while its fate was being decided in lower courts. At this time, the Clean Power
Plan’s fate is uncertain, but having been promulgated, it cannot simply be wiped away.2
At this moment, Kentucky policymakers must make a decision: should they double-down on increasingly
expensive, risky, and dirty fossil-fueled power? Or should they embrace a clean energy future in which
Kentuckians reap the benefits of clean jobs, clean air, and lower electricity bills while investing in a just
transition and meeting obligations to protect the climate?
2 The Supreme Court has already found in the 2007 decision Massachusetts vs. Environmental Protection Agency that the EPA is
required to regulate carbon dioxide emissions. Even if the EPA were to proceed with all the notices, hearings, etc. associated with pulling back on the Clean Power Plan, the agency would still be required to issue regulations addressing carbon dioxide emissions.

Synapse Energy Economics, Inc. Empowering Kentucky 2
1.1. Kentucky’s electricity present
In most states, the electric system is managed by one or two main operators. In some cases, these
operators are large, vertically-integrated electric utilities that own power plants and transmission lines
and deliver electricity to customers. In other cases, operational responsibility has been delegated to
independent authorities. These authorities are in charge of maintaining reliability and overseeing
electricity markets in which multiple electricity utilities participate.
Kentucky has a unique system, divided into four different balancing regions (see Figure 1). While one
region (Louisville Gas and Electric / Kentucky Utilities) is entirely contained within the Commonwealth,
the three other areas are constituent regions of larger balancing regions:
1. Tennessee Valley Authority in southwestern Kentucky operates as part of the larger TVA region
encompassing Tennessee and other southern states.
2. The eastern part of Kentucky, which includes utilities such as East Kentucky Power Cooperative,
Kentucky Power, and Duke Energy Kentucky, is part of the PJM Interconnection, which
coordinates electricity dispatch from New Jersey to Illinois.
3. In the northwestern part of the state, utilities such as Big Rivers Electric Cooperative are
dispatched as part of the Midcontinent ISO (MISO), which encompasses states from Montana to
Michigan and as far south as Louisiana.
Figure 1. Kentucky balancing authority areas as of 2015
Source: Kentucky Energy Profile 2015, page 23. Available at http://energy.ky.gov/Kentucky_Energy_Profile/Kentucky%20Energy%20Profile%202015.pdf
Capacity, generation, and sales
Kentucky’s utility landscape is currently dominated by coal and few utilities. As of December 2016, 65
percent of the total electric generating capacity in Kentucky came from coal (see Table 1). More than

Synapse Energy Economics, Inc. Empowering Kentucky 3
three-quarters of all capacity was concentrated in just three utilities—the newly-merged Louisville Gas &
Electric / Kentucky Utilities (LG&E/KU), Tennessee Valley Authority (TVA), and East Kentucky Power
Cooperative (EKPC).
Table 1. Electric generating capacity (GW) existing as of December 2016.
Utility Utility Type Coal Natural
Gas Hydro
Oil & Other
Total
LG&E/KU Utility 6.1 3.3 0.1 0.0 9.5
TVA Utility 4.1 0.3 0.2 4.6
EKPC Utility 2.0 1.7 0.0 0.0 3.6
Big Rivers Utility 1.5 0.1 1.6
Duke Utility 0.8 0.0 0.0 0.0 0.8
US Army Corps of Engineers Utility 0.5 0.5
City of Owensboro Utility 0.4 0.0 0.0 0.0 0.4
Kentucky Power Co Utility 0.3 0.3
Other Merchant 1.2 0.0 0.0 1.2
Other Industrial 0.0 0.1 0.1
Other Utility 0.0 0.1 0.2 0.0 0.3
Total 14.9 6.8 1.0 0.2 22.9
Source: EIA 860 2016M
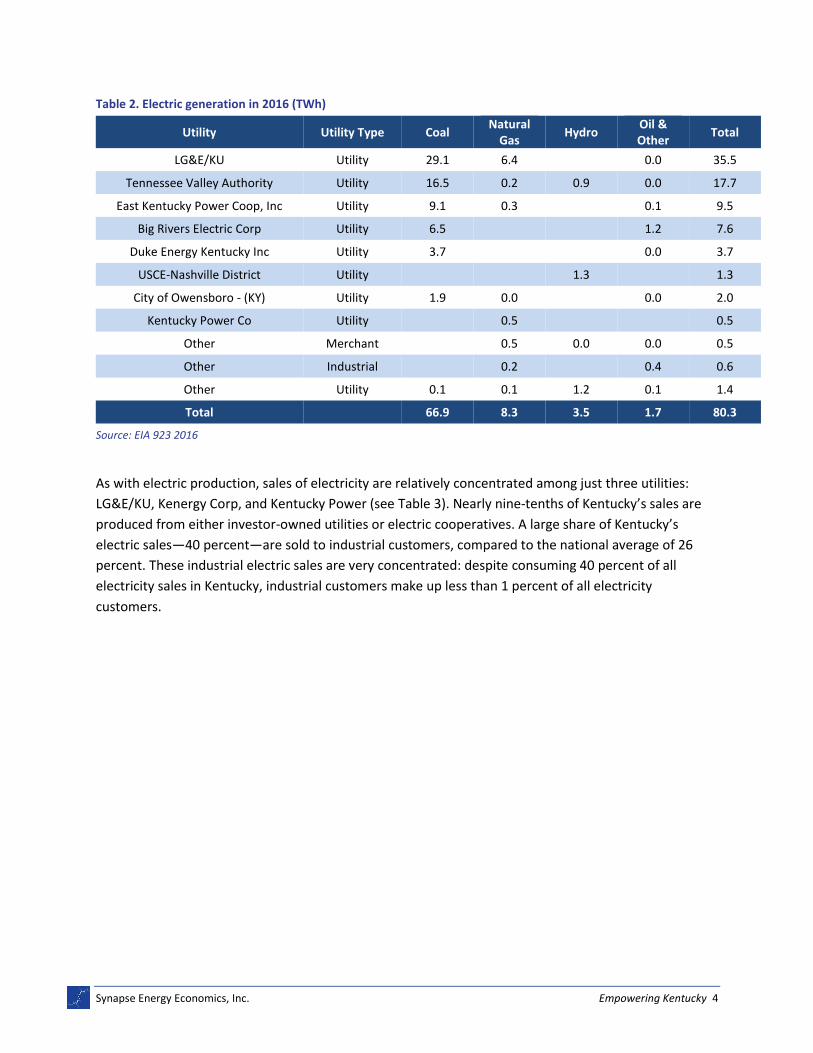
In 2016, 83 percent of electricity was generated from coal plants (see Table 2). At the same time, 78
percent of generation also came from the same three utilities: LG&E/KU, TVA, and EKPC.
Synapse Energy Economics, Inc. Empowering Kentucky 4
Table 2. Electric generation in 2016 (TWh)
Utility Utility Type Coal Natural
Gas Hydro
Oil & Other
Total
LG&E/KU Utility 29.1 6.4 0.0 35.5
Tennessee Valley Authority Utility 16.5 0.2 0.9 0.0 17.7
East Kentucky Power Coop, Inc Utility 9.1 0.3 0.1 9.5
Big Rivers Electric Corp Utility 6.5 1.2 7.6
Duke Energy Kentucky Inc Utility 3.7 0.0 3.7
USCE-Nashville District Utility 1.3 1.3
City of Owensboro - (KY) Utility 1.9 0.0 0.0 2.0
Kentucky Power Co Utility 0.5 0.5
Other Merchant 0.5 0.0 0.0 0.5
Other Industrial 0.2 0.4 0.6
Other Utility 0.1 0.1 1.2 0.1 1.4
Total 66.9 8.3 3.5 1.7 80.3
Source: EIA 923 2016
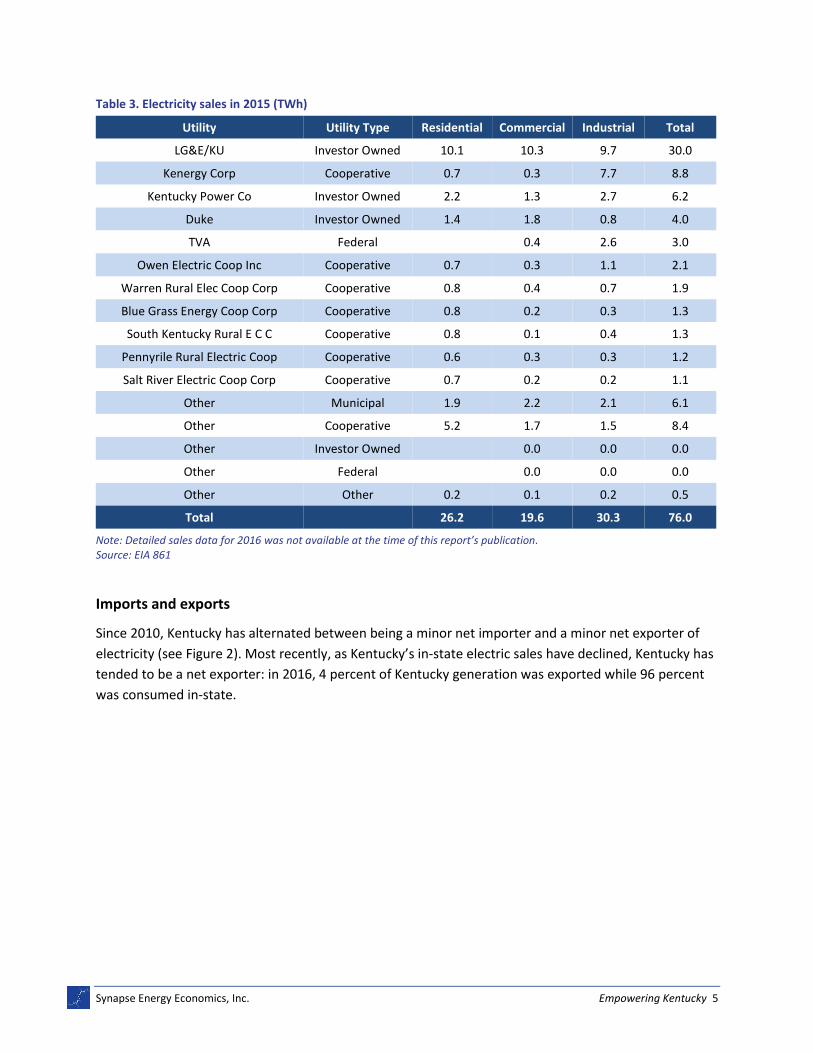
As with electric production, sales of electricity are relatively concentrated among just three utilities:
LG&E/KU, Kenergy Corp, and Kentucky Power (see Table 3). Nearly nine-tenths of Kentucky’s sales are
produced from either investor-owned utilities or electric cooperatives. A large share of Kentucky’s
electric sales—40 percent—are sold to industrial customers, compared to the national average of 26
percent. These industrial electric sales are very concentrated: despite consuming 40 percent of all
electricity sales in Kentucky, industrial customers make up less than 1 percent of all electricity
customers.
Synapse Energy Economics, Inc. Empowering Kentucky 5
Table 3. Electricity sales in 2015 (TWh)
Utility Utility Type Residential Commercial Industrial Total
LG&E/KU Investor Owned 10.1 10.3 9.7 30.0
Kenergy Corp Cooperative 0.7 0.3 7.7 8.8
Kentucky Power Co Investor Owned 2.2 1.3 2.7 6.2
Duke Investor Owned 1.4 1.8 0.8 4.0
TVA Federal 0.4 2.6 3.0
Owen Electric Coop Inc Cooperative 0.7 0.3 1.1 2.1
Warren Rural Elec Coop Corp Cooperative 0.8 0.4 0.7 1.9
Blue Grass Energy Coop Corp Cooperative 0.8 0.2 0.3 1.3
South Kentucky Rural E C C Cooperative 0.8 0.1 0.4 1.3
Pennyrile Rural Electric Coop Cooperative 0.6 0.3 0.3 1.2
Salt River Electric Coop Corp Cooperative 0.7 0.2 0.2 1.1
Other Municipal 1.9 2.2 2.1 6.1
Other Cooperative 5.2 1.7 1.5 8.4
Other Investor Owned 0.0 0.0 0.0
Other Federal 0.0 0.0 0.0
Other Other 0.2 0.1 0.2 0.5
Total 26.2 19.6 30.3 76.0
Note: Detailed sales data for 2016 was not available at the time of this report’s publication. Source: EIA 861
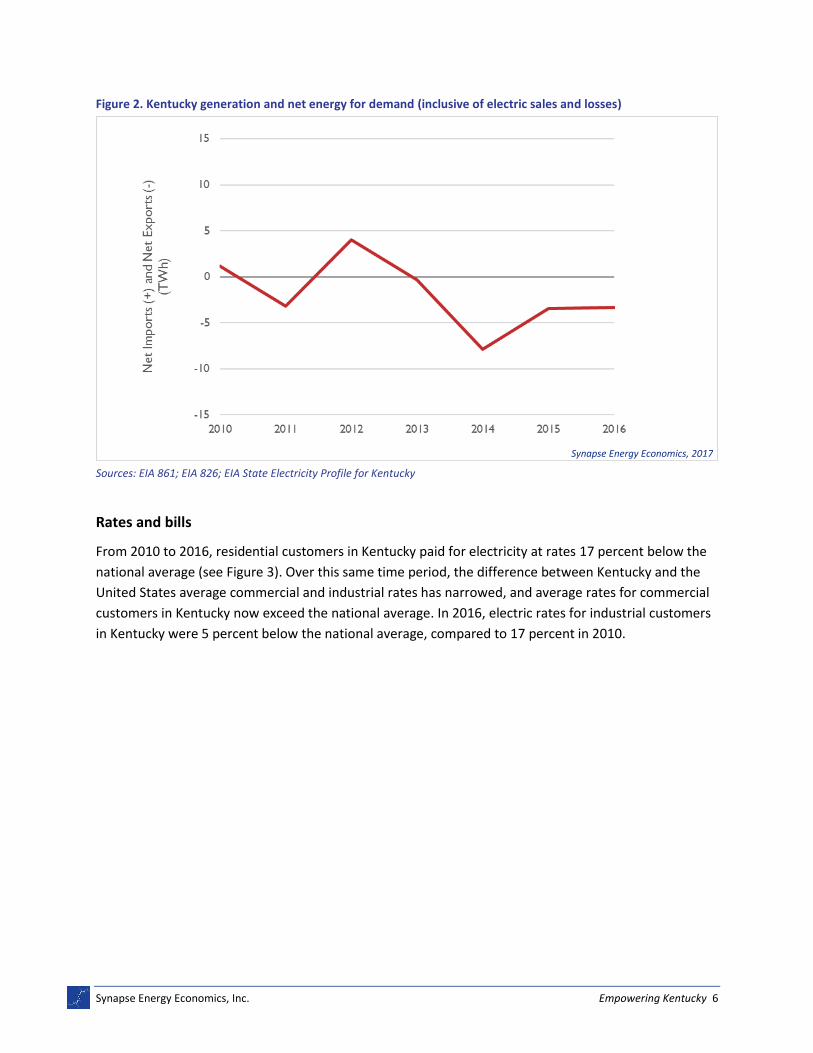
Imports and exports
Since 2010, Kentucky has alternated between being a minor net importer and a minor net exporter of
electricity (see Figure 2). Most recently, as Kentucky’s in-state electric sales have declined, Kentucky has
tended to be a net exporter: in 2016, 4 percent of Kentucky generation was exported while 96 percent
was consumed in-state.
Synapse Energy Economics, Inc. Empowering Kentucky 6
Figure 2. Kentucky generation and net energy for demand (inclusive of electric sales and losses)
Sources: EIA 861; EIA 826; EIA State Electricity Profile for Kentucky
Rates and bills
From 2010 to 2016, residential customers in Kentucky paid for electricity at rates 17 percent below the
national average (see Figure 3). Over this same time period, the difference between Kentucky and the
United States average commercial and industrial rates has narrowed, and average rates for commercial
customers in Kentucky now exceed the national average. In 2016, electric rates for industrial customers
in Kentucky were 5 percent below the national average, compared to 17 percent in 2010.
Synapse Energy Economics, 2017

Synapse Energy Economics, Inc. Empowering Kentucky 7
Figure 3. Average electric rates in Kentucky and United States for the residential sector (Res), the commercial sector (Com), and the industrial sector (Ind)
Source: EIA 861; EIA 826 Note: The y-axis on this figure begins at 4 cents per kWh, not 0 cents per kWh.
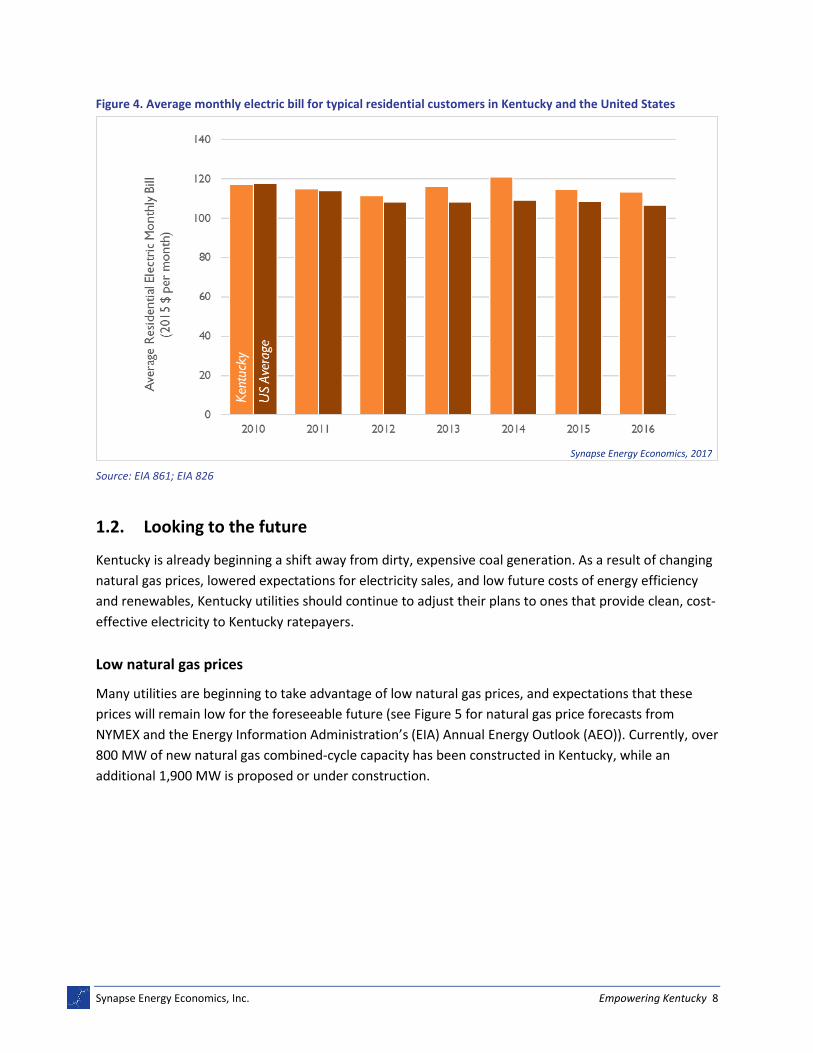
Residential customers in Kentucky typically consume significant energy for both cooling and heating,
with this energy generally sourced from electricity rather than natural gas or oil. Because of this unique
pattern of end-use consumption, residential customers in Kentucky typically use more electricity than
other customers around the country. Because of this increased usage, and in spite of lower-than-
average electricity rates, from 2010 to 2016, residential customers paid monthly bills 5 percent higher
than the United States average (see Figure 4). Over these seven years, Kentucky residential customers’
rates and bills have increased by 9 percent and 3 percent, respectively. At the same time, residential
rates and bills in many other states have remained flat or have even fallen.
Synapse Energy Economics, 2017
Synapse Energy Economics, Inc. Empowering Kentucky 8
Figure 4. Average monthly electric bill for typical residential customers in Kentucky and the United States
Source: EIA 861; EIA 826
1.2. Looking to the future
Kentucky is already beginning a shift away from dirty, expensive coal generation. As a result of changing
natural gas prices, lowered expectations for electricity sales, and low future costs of energy efficiency
and renewables, Kentucky utilities should continue to adjust their plans to ones that provide clean, cost-
effective electricity to Kentucky ratepayers.
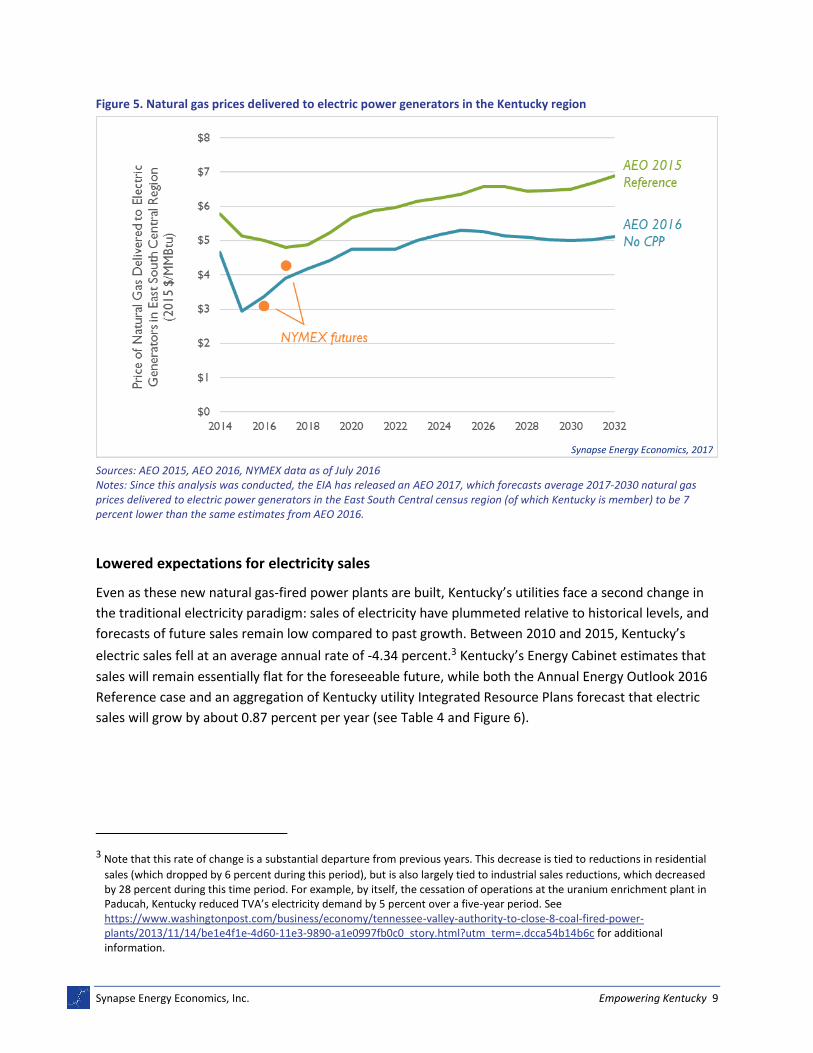
Low natural gas prices
Many utilities are beginning to take advantage of low natural gas prices, and expectations that these
prices will remain low for the foreseeable future (see Figure 5 for natural gas price forecasts from
NYMEX and the Energy Information Administration’s (EIA) Annual Energy Outlook (AEO)). Currently, over
800 MW of new natural gas combined-cycle capacity has been constructed in Kentucky, while an
additional 1,900 MW is proposed or under construction.
Synapse Energy Economics, 2017
Synapse Energy Economics, Inc. Empowering Kentucky 9
Figure 5. Natural gas prices delivered to electric power generators in the Kentucky region
Sources: AEO 2015, AEO 2016, NYMEX data as of July 2016 Notes: Since this analysis was conducted, the EIA has released an AEO 2017, which forecasts average 2017-2030 natural gas prices delivered to electric power generators in the East South Central census region (of which Kentucky is member) to be 7 percent lower than the same estimates from AEO 2016.
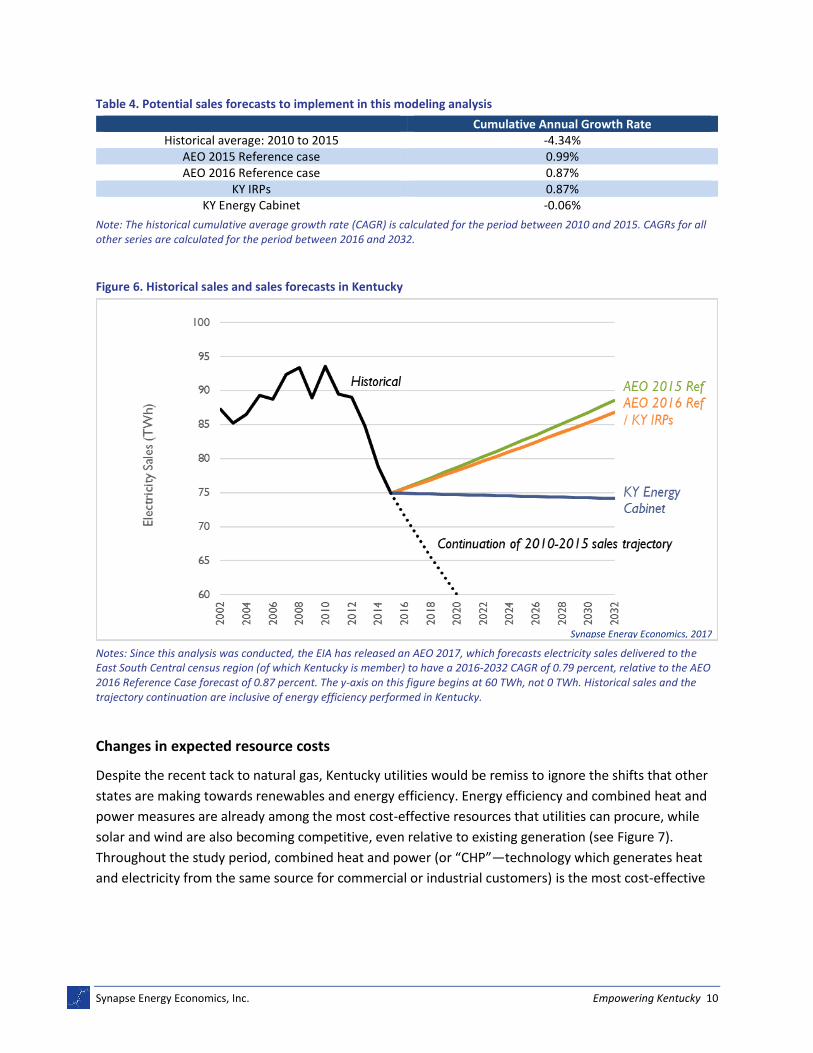
Lowered expectations for electricity sales
Even as these new natural gas-fired power plants are built, Kentucky’s utilities face a second change in
the traditional electricity paradigm: sales of electricity have plummeted relative to historical levels, and
forecasts of future sales remain low compared to past growth. Between 2010 and 2015, Kentucky’s
electric sales fell at an average annual rate of -4.34 percent.3 Kentucky’s Energy Cabinet estimates that
sales will remain essentially flat for the foreseeable future, while both the Annual Energy Outlook 2016
Reference case and an aggregation of Kentucky utility Integrated Resource Plans forecast that electric
sales will grow by about 0.87 percent per year (see Table 4 and Figure 6).
3 Note that this rate of change is a substantial departure from previous years. This decrease is tied to reductions in residential
sales (which dropped by 6 percent during this period), but is also largely tied to industrial sales reductions, which decreased by 28 percent during this time period. For example, by itself, the cessation of operations at the uranium enrichment plant in Paducah, Kentucky reduced TVA’s electricity demand by 5 percent over a five-year period. See https://www.washingtonpost.com/business/economy/tennessee-valley-authority-to-close-8-coal-fired-power-plants/2013/11/14/be1e4f1e-4d60-11e3-9890-a1e0997fb0c0_story.html?utm_term=.dcca54b14b6c for additional information.
Synapse Energy Economics, 2017
Synapse Energy Economics, Inc. Empowering Kentucky 10
Table 4. Potential sales forecasts to implement in this modeling analysis
Cumulative Annual Growth Rate Historical average: 2010 to 2015 -4.34%
AEO 2015 Reference case 0.99% AEO 2016 Reference case 0.87%
KY IRPs 0.87% KY Energy Cabinet -0.06%
Note: The historical cumulative average growth rate (CAGR) is calculated for the period between 2010 and 2015. CAGRs for all other series are calculated for the period between 2016 and 2032.
Figure 6. Historical sales and sales forecasts in Kentucky
Notes: Since this analysis was conducted, the EIA has released an AEO 2017, which forecasts electricity sales delivered to the East South Central census region (of which Kentucky is member) to have a 2016-2032 CAGR of 0.79 percent, relative to the AEO 2016 Reference Case forecast of 0.87 percent. The y-axis on this figure begins at 60 TWh, not 0 TWh. Historical sales and the trajectory continuation are inclusive of energy efficiency performed in Kentucky.
Changes in expected resource costs
Despite the recent tack to natural gas, Kentucky utilities would be remiss to ignore the shifts that other
states are making towards renewables and energy efficiency. Energy efficiency and combined heat and
power measures are already among the most cost-effective resources that utilities can procure, while
solar and wind are also becoming competitive, even relative to existing generation (see Figure 7).
Throughout the study period, combined heat and power (or “CHP”—technology which generates heat
and electricity from the same source for commercial or industrial customers) is the most cost-effective
Synapse Energy Economics, 2017

Synapse Energy Economics, Inc. Empowering Kentucky 11
resource on a levelized basis, although its potential may be smaller than other resources.4 In the mid-
2020s, energy efficiency is likely to supplant existing coal as the most cost-effective resource on average
in Kentucky. Over this same time period, the costs of producing power from existing natural gas
combined-cycle units (NGCCs) and the costs of installing new generation turbines at existing unpowered
dams are expected to be marginally higher than the average price of producing power from existing coal
units.
Other than combined heat and power, energy efficiency, and new hydro generation at existing dams,
the most cost-effective new resources in the near term are new natural gas combined-cycle units and
new on-shore wind facilities. In the near- to mid-term, certain tax benefits, such as the production tax
credit (PTC) for wind and the investment tax credit (ITC) for solar expire, increasing the costs of
renewables relative to new natural gas-fired plants. At the same time, however, these technologies’
costs are expected to fall quickly as a result of technological enhancements. For these reasons, by 2028,
new utility-scale solar photovoltaics (PV) are estimated to be as cost-effective as building a new NGCC
unit in Kentucky.
4 A levelized cost of energy is an “average” cost of energy that assumes any up-front capital costs are amortized or spread over
the lifetime of the resource and are added to any fuel, operating, or maintenance costs.

Synapse Energy Economics, Inc. Empowering Kentucky 12
Figure 7. Levelized costs of energy
Notes: Costs of coal are weighted using both newer and older existing units. These costs do not include the costs of installing new environmental retrofits. Costs do not include the price of building new transmission to new plants (such as wind, hydro, or utility PV plants, which may be located in more remote parts of the grid). Tax credits such as the PTC and ITC are included for both wind and utility PV. Costs of “existing” resources do not include sunk costs. Distributed PV is not shown. While costs of distributed PV are expected to see declines similar to utility-scale PV, a significant share of the costs for distributed PV are paid for privately by the developers or owners of those systems. Sources: All costs except for energy efficiency are shown using the current ReEDS default price trajectories for units in Kentucky. Energy efficiency costs are calculated using Synapse research.
Environmental regulations and pricing carbon
Over the past five years, many Kentucky power plants have undergone significant retrofits to comply
with environmental regulations. These regulations aim to reduce emissions of harmful sulfur dioxide
(SO2), nitrogen oxides (NOX), particulate matter, and heavy metals (such as mercury).5 In many other
cases, rather than invest in costly upgrades at struggling power plants, utilities have chosen to close
these generating units and obtain electricity from less-expensive sources. In the near future, the
remaining coal plants will need to contend with the enforcement of these same environmental policies
(which may require further, more stringent retrofits), as well as recent regulations to protect Kentucky’s
drinking and recreation water from damaging coal ash spills and voluminous cooling water withdrawal.
At the same time, many utilities have begun to plan for the regulation of CO2. In 2014, EPA issued a draft
Clean Power Plan, followed by a final version in August 2015. The Clean Power Plan is meant to reduce
5 SO2, NOX, and particulate matter are major precursors to acid rain and smog and can cause or worsen asthma, emphysema,
bronchitis, and heart disease. Mercury and other heavy metals have been associated with birth defects and impacts on the nervous, digestive, immune respiratory, and renal systems.
Synapse Energy Economics, 2017

Synapse Energy Economics, Inc. Empowering Kentucky 13
emissions of CO2 from electric generators to 32 percent below 2005 levels by the year 2030 by
increasing the use of renewables, energy efficiency, and natural gas. Despite many analysts showing that
the Clean Power Plan was unlikely to cause significant costs to consumers, a number of states and
utilities sued the federal government in an effort to stop the regulation.6
In February 2016, the United States Supreme Court made an unprecedented decision to stay the
implementation of the plan during its litigation in lower courts. While current federal politics make the
near-term future of the Clean Power Plan uncertain, the EPA is mandated under the 2007 Supreme
Court decision Massachusetts vs. Environmental Protection Agency to regulate CO2 emissions.7 Whether
it takes the form of the Clean Power Plan or some other approach, federal regulation of greenhouse gas
emissions is unavoidable.
Rather than waiting for the federal government, some states are forging ahead with their own approach
to reducing greenhouse gas emissions. Since 2010, nine states in the northeast have participated in the
Regional Greenhouse Gas Initiative (RGGI), a regional market that imposes a cost on CO2 from electric
generators.8 California created its own law, AB32, which mandates California to reduce emissions to
1990 levels by 2020 and established targets and regulations aimed at reducing CO2 emissions in later
years. In November 2016, Washington state voters narrowly rejected a measure to implement a carbon
tax. Despite this, Washington and other states are exploring ways to create their own greenhouse gas
legislation or to join existing programs like RGGI and AB32.
Further, many individual utilities now recognize the need to incorporate carbon prices into their
integrated resource plan (IRP) exercises and account for the cost of carbon when making resource
procurement decisions. As noted in Synapse’s Spring 2016 National Carbon Dioxide Price Forecast:
History has shown a steady increase in the number of utility planning processes that
include a CO2 price:
None of the 15 IRPs published from 2003-2007 reviewed by Synapse included a CO2
price forecast.
Of the 56 IRPs from 2008-2011 reviewed, 23 included a CO2 price forecast.
Of the 115 IRPs released in 2012-2015 and reviewed by Synapse, 66 include a CO2
price in at least one scenario, including 61 with a CO2 price in their reference case
scenario.
6 For a review of modeled Clean Power Plan costs, see
http://www.wri.org/sites/default/files/The_Economic_Impacts_of_the_Clean_Power_Plan.pdf
7 Massachusetts v. Environmental Protection Agency, 549 U.S. 497 (2007)
8 More information available at www.rggi.org.

Synapse Energy Economics, Inc. Empowering Kentucky 14
Moreover, of the 24 IRPs in the Synapse review that were released in 2014-2015, 20
included a CO2 price in at least one scenario. Of these, 19 includes a CO2 price in
their reference case scenario.9
The trend towards including the cost of carbon in resource planning has not passed over Kentucky: in
their 2014 joint IRP, Louisville Gas & Electric and Kentucky Utilities considered a carbon price that grew
from $17 per short ton in 2020 to $48 in 2029;10 Big Rivers Electric Corporation modeled both a $10 and
$30 tax per metric ton in 2014;11 Duke Energy Kentucky modeled a Reference Case scenario in 2014 with
carbon prices starting at $17 per ton in 2020 and increasing to $53 per ton in 2034.12 Kentucky Power’s
2013 IRP included a cost of carbon in its preferred portfolio at a base price of $15 per ton13 and its 2016
draft IRP considers CO2 prices ranging from $3 per ton in 2024 to $20 per ton in 2030.14
Given rapidly changing energy markets and stricter pollution standards, Kentucky policymakers have
been presented with a choice. They can continue to adhere to traditional approaches to generating
electricity from fossil fuels, despite strong signals that that doing so exposes Kentuckians to many risks,
including increased consumer costs and environmental degradation. Or Kentucky can forge its own path
to a low-risk, clean energy future in which residents see a just transition to lower electric bills, improved
public health, and local job creation.
9 Luckow, Patrick, et al. Spring 2016 National Carbon Dioxide Price Forecast. Synapse Energy Economics. March 16, 2016.
Available at: http://www.synapse-energy.com/sites/default/files/2016-Synapse-CO2-Price-Forecast-66-008.pdf
10 Kentucky Public Service Commission. 2016. Staff Report on the 2014 Integrated Resource Plan of Louisville Gas and Electric
Company and Kentucky Utilities Company. Case No. 2014-00131. Page 14. Available at: http://psc.ky.gov/agencies/psc/industry/electric/irp/201400131_032016.pdf
11 Kentucky Public Service Commission. 2015. Staff Report on the 2014 Integrated Resource Plan of Big Rivers Electric
Corporation. Case No. 2014-00166. Page 11. Available at: http://psc.ky.gov/agencies/psc/industry/electric/irp/201400166_122015.pdf
12 Kentucky Public Service Commission. 2015. Staff Report on the 2014 Integrated Resource Plan of Duke Energy Kentucky, Inc.
Case No. 2014-00273. Page 36. Available at: http://psc.ky.gov/agencies/psc/industry/electric/irp/201400273_082015_sr.pdf
13 Kentucky Public Service Commission. 2014. Staff Report on the 2013 Integrated Resource Plan of Kentucky Power Company.
Case No. 2013-00475. Page 48. Available at: http://psc.ky.gov/agencies/psc/industry/electric/irp/201300475_20141113.pdf
14 Kentucky Public Service Commission. 2016. 2016 Integrated Resource Plan of Kentucky Power Company Volume A - Public
Version. Case No. 2016-00413. Page 33. Available at: http://psc.ky.gov/pscecf/2016-00413/jkrosquist%40aep.com/12202016110531/KPCO_2016_IRP__Volume_A___Public__Version.pdf

Synapse Energy Economics, Inc. Empowering Kentucky 15
2. EMPOWERING KENTUCKY
To investigate the costs and benefits of pursuing a clean energy future for Kentuckians, Synapse
conducted analysis using the National Renewable Energy Laboratory’s (NREL) Regional Energy
Deployment System (ReEDS) model.15 ReEDS is a long‐term capacity expansion and dispatch model of
the electric power system in the lower 48 states. Synapse has adapted its in-house version of the ReEDS
model to allow for more detailed outputs by state and sector and to permit differentiation of energy
efficiency expectations by state. We modeled two scenarios through 2032:
Reference case: This is a future in which Kentucky continues on a business-as-usual trajectory. Energy efficiency and renewables are added at minimal levels. Natural gas plays a much larger role than it has historically in Kentucky, and coal continues to be a dominant part of the state’s energy. In this scenario, we assume the Clean Power Plan is not implemented for Kentucky or any other state.
Empower Kentucky Plan: In this case, Kentucky pursues a three-fold strategy: it invests in cost-effective energy efficiency and combined heat and power, establishes an aggressive renewable portfolio standard (RPS) of 25 percent by 2030, and creates a carbon dioxide price that rises from $1 in 2018 to $3 in 2030. In this case, we assume that Kentucky and all other states meet the carbon reductions mandated under the Clean Power Plan. While coal and natural gas continue to play significant roles in this scenario, generation from those sources declines, relative to the Reference case.
The following sections give an overview of the key policies in the Empower Kentucky Plan, detail how
Kentucky’s electric sector is expected to change under both scenarios, and discuss the impact of those
changes on emissions, costs, and jobs.
2.1. The Empower Kentucky Plan
The Empower Kentucky Plan differs from the Reference case in several key ways: the implementation of
a renewable portfolio standard, increased energy efficiency measures, and a Kentucky-specific CO2 price
adder. The Empower Scenario also includes provisions to prioritize energy programs that benefit low-
income residents and commercial and industrial customers, expand distributed solar installations, and
limit electric generation from biomass. More information on each of these policies is available in
Appendix B.
In the Empower Kentucky Plan, we also assume that Kentucky and the rest of the states achieve
compliance with the Clean Power Plan. However, the Empower Kentucky Plan goes beyond the Clean
Power Plan—it achieves a lower-carbon, lower-bill, and higher-job future through energy efficiency and
renewables, whether or not the Clean Power Plan is implemented in its proposed form.
15 More information on ReEDS is available at http://www.nrel.gov/analysis/reeds and in Appendix A.

Synapse Energy Economics, Inc. Empowering Kentucky 16
Renewable portfolio standard
Under the renewable portfolio standard put in place in the Empower Kentucky Plan, 25 percent of all
Kentucky sales must be covered through the purchase of renewable energy certificates (RECs) by 2030
and all later years. These RECs can be purchased from new wind, solar, or hydroelectric generators in
Kentucky, or in any state electrically connected to Kentucky. This policy also requires that 1 percent of
electric sales are met through distributed solar by 2030 and all later years.
Energy efficiency
Under the Empower Kentucky Plan, Kentucky utilities increase their implementation of cost-effective
energy efficiency from current levels of about 0.38 percent savings per year to a level of 2.5 percent
savings per year by 2030—a level comparable to many successful programs in the country today. This
level of savings is sustained through 2032, and by that year, this will result in cumulative energy
efficiency savings of 17 percent in the Empower Kentucky Plan, compared to cumulative savings of 3
percent in the Reference case. Utilities will prioritize energy efficiency programs for low-income
customers and communities. Savings from low-income energy efficiency programs will account for 18
percent of all energy efficiency savings. Achieving the plan’s overall energy efficiency goals will require
an $11 billion investment over 15 years, creating new jobs and energy savings in communities statewide.
In addition, the Empower Kentucky Plan will result in the installation of 1,000 MW of combined heat and
power capacity to reduce energy consumption and costs in the commercial and industrial sector.
The Clean Power Plan
In the Empower Kentucky Plan, Kentucky and all other states are required to meet the stipulations of
the Clean Power Plan. For Kentucky generators, this means emitting no more than 64 million short tons
starting in 2030 or purchasing enough emissions allowances from other states to meet any emissions
overage. We assume that all states achieve the EPA’s requirement for tons of CO2 pollution reduced
from their power sector, including from new sources (within the Clean Power Plan, this is referred to as
meeting each state’s “mass-based standard with new-source complement”). We assume that emission
allowances are traded both within and across state borders among two separate groups of states: the
nine states which currently trade CO2 emissions under the Regional Greenhouse Gas Initiative and all
other states modeled. In this analysis, we assume that emission allowance costs are incurred by power
plants that purchase allowances—and their utility ratepayers—and that the revenue from sold
allowances offset other ratepayer electric costs.
CO2 price adder
In addition to the Clean Power Plan, the Empower Kentucky Plan also features a Kentucky-specific CO2
price adder. This price adder is put into place at $1 per short ton in 2018 and gradually increases to $3
per short ton in 2030, continuing through 2032. (Note that this is far below the levels assumed in recent
integrated resource plans from the state’s utilities, as discussed above.) This price adder is applied both
to in-state emitting generators, as well as to the CO2 content of electricity imported to Kentucky. As with
the revenue generated through the Clean Power Plan, we assume that most revenue from the Kentucky-

Synapse Energy Economics, Inc. Empowering Kentucky 17
specific CO2 price adder is reinvested in the electric system in support of energy efficiency measures;
however, we assume that 20 percent of all revenue raised through the CO2 price adder is used to fund a
just transition for Kentucky’s coal workers and communities.
2.2. The Empower Kentucky Plan reduces CO2 emissions by 40 percent
Kentucky’s electric sector is expected to undergo significant changes in both the Reference case and the
Empower Kentucky Plan. In both cases, Kentucky increasingly moves away from coal and achieves large
reductions in SO2, NOX, and CO2 emissions.
Changes to electric generating capacity
In both the Reference case and the Empower Kentucky Plan, 5.7 gigawatts (GW) of coal capacity is
expected to retire by 2032, above and beyond what has already retired as of 2015. This includes 3.7 GW
of coal capacity where owners have already announced retirement dates, as well as 2.0 GW that retires
on an economic basis—as more cost-effective resources come online, these power plants are used less
and less until it is more economical to retire them than to keep them running. Figure 8 shows historical
electric generating capacity for Kentucky in 2015, as well as forecasted capacity in 2020, 2025, and 2032
for both the Reference case (left bars) and the Empower Kentucky Plan (right bars).
Figure 8. Projected electric generating capacity in the Reference case (Ref) and Empower Kentucky Plan (EMPKY)
At the same time this coal capacity is retired, new resources are built. In addition to the 1.9 GW of NGCC
capacity that is proposed or under construction, both cases add new NGCC units on an economic basis.
Beyond the known additions, an additional 1.7 GW of new combined-cycle units are built in the
Synapse Energy Economics, 2017

Synapse Energy Economics, Inc. Empowering Kentucky 18
Reference case, while in the Empower Kentucky Plan 0.8 GW are built. Another major difference in the
Empower Kentucky Plan is the new renewable capacity: by 2032, 1 GW of solar and 600 MW of wind are
built, including distributed generation, compared to none built in the Reference case.16
Generation implications
As a result of the changes to Kentucky’s fleet of power plants, the projected in-state generation will also
change (see Figure 9). One of the most notable effects is that as new renewables and natural gas
generators come online, coal generation begins to decrease. By 2032, only 68 percent of Kentucky’s in-
state generation comes from coal in the Reference case, compared to 87 percent in 2015. In the
Empower Kentucky Plan, this number drops to 61 percent in 2032. As less coal generation is produced in
Kentucky in the Reference case, utilities begin to import more electricity from neighboring states,
leading to 8 percent of demand being met through imports in 2032, compared to 4 percent of all
generation being exported in 2015. In the Empower Kentucky Plan, 11 percent of demand is met
through imports in 2032.
Figure 9. Projected electric generation in the Reference case (Ref) and Empower Kentucky Plan (EMPKY)
16 In the Empower Kentucky Plan, we model an RPS policy that requires Kentucky utilities to purchase renewable energy credits
equivalent to 25 percent of utility sales by 2030, continuing through 2032. Roughly half of all states currently have an RPS policy. Like the policies that exist in all other states, Kentucky’s policy allows utilities to purchase RECs from any state, as long as those RECs are generated in a state that is electrically connected to a Kentucky utility. Because Kentucky is one of the more interconnected states in the country, it can purchase RECs from Iowa to New Jersey and from Minnesota to Louisiana. Sixty percent of Kentucky’s RECs in the Empower Kentucky Plan are bought from wind farms in Iowa, where wind generation is inexpensive, allowing for Kentucky to decrease nationwide emissions at a low cost to consumers.
Synapse Energy Economics, 2017
Synapse Energy Economics, Inc. Empowering Kentucky 19
While electric sales are projected to increase by 0.87 percent per year in both cases, in the Reference
case Kentucky utilities only implement energy efficiency measures at the same rate as in past years
(with energy savings equal to 0.38 percent of the previous years’ sales); in the Empower Kentucky Plan,
utilities gradually increase the level of energy efficiency measures they install in each year until they
reach the level that leading states like California, Massachusetts, and Rhode Island currently attain (a
gradual 0.15 percentage point increase each year until reaching 2.5 percent annual savings by 2030).
Cumulative, this results in sales decreasing by 17 percent in 2032. This decrease in total electricity sales
means that in 2032 Kentucky utilities avoid 13 terrawatt-hours (TWh) of electricity generation and
import purchases relative to the Reference case, a decrease of 14 percent (not including REC purchases
from out-of-state).
In 2018, Kentucky begins to implement a price adder for CO2 emitted by Kentucky generators. This price
adder also applies to the CO2 pollution associated with electricity imports, which is determined by the
average CO2 emissions rate of the power sector in the originating state. This price adder increases
gradually from $1 per short ton of CO2 in 2018 to $3 in 2030, where it remains for all future years. Eighty
percent of the revenue collected from this adder is assumed to be reinvested in the electric sector,
causing the program to nearly be cost neutral to Kentucky ratepayers.17 This price adder further
incentivizes a switch away from CO2-intensive generation towards cleaner, more efficient electricity.
Impacts on emissions
As a result of these changes to in-state generation, Kentucky’s electric generating fleet produces far
fewer emissions that harm public health. Even in the Reference case, 2032 SO2 emissions are down 66
percent relative to 2015 while 2032 NOX emissions are down 33 percent relative to 2015 (see Figure 10
and Figure 11). Because of the additional shift away from coal generation in the Empower Kentucky
Plan, even more emission reductions are achieved: a 76 percent decrease in SO2 by 2032 and a 53
percent decrease in NOX by 2032 (both relative to 2015 levels).
17 See Appendix B for more discussion on this price adder.

Synapse Energy Economics, Inc. Empowering Kentucky 20
Figure 10. Projected in-state SO2 emissions in the Reference case and Empower Kentucky Plan (EMPKY)
Figure 11. Projected in-state NOX emissions in the Reference case and Empower Kentucky Plan (EMPKY)
Changes in the electric sector in both scenarios also lead to decreased CO2 emissions. In the Reference
case, Kentucky’s CO2 emissions are 20 percent lower in 2032 than in 2012 (see Figure 12). This
represents a sizeable decrease for a scenario with no Clean Power Plan, but it falls far short of the rule’s
Synapse Energy Economics, 2017
Synapse Energy Economics, 2017

Synapse Energy Economics, Inc. Empowering Kentucky 21
32 percent CO2 reduction target for Kentucky. On the other hand, because of renewables, energy
efficiency, and the CO2 price adder, CO2 emissions in the Empower Kentucky Plan are 40 percent lower
in 2032 than in 2012, exceeding the Clean Power Plan target. Under the Clean Power Plan, Kentucky
utilities are required to either achieve in-state emissions of 64 million short tons in 2030 (and later
years) or purchase emissions allowances from other states. In the Empower Kentucky Plan, Kentucky
utilities over-comply with the Clean Power Plan and thus can sell allowances to generators in other
states.18 Between 2022 (when the Clean Power Plan goes into effect) and 2032, cumulative CO2
emissions in the Empower Kentucky Plan are 14 percent lower than in the Reference case.
Figure 12. Projected in-state CO2 emissions in the Reference case and Empower Kentucky Plan (EMPKY)
The above numbers are framed in terms of a generation-based emissions inventory—i.e., the framework
of the Clean Power Plan, where states are eligible to count emissions reductions as long as they happen
within their state borders. However, under Kentucky’s RPS policies in the Empower Kentucky Plan, a
majority of the required renewables are built in other states, producing 15 TWh of electricity that is then
delivered to the Kentucky electric system. If Kentucky utilities were to count emission reductions caused
by these out-of-state renewable generators, 2032 CO2 emissions in the Empower Kentucky Plan would
drop from 25 percent lower than the Reference case to 33 percent lower than the Reference case.19
18 Note that nationwide compliance with the Clean Power Plan is achieved relatively easily—allowances are not priced until
2026, when they reach a price of $2 per short ton. Prices then grow to just under $6 per short ton by 2030, before dropping to under $5 per short ton in 2032.
19 This calculation assumes that these renewables displace emissions from existing natural gas-fired combined cycle
generators.
Synapse Energy Economics, 2017

Synapse Energy Economics, Inc. Empowering Kentucky 22
2.3. Kentucky’s new electrical system does not increase costs
These changes to system capacity, electric generation, and emissions all have implications for what
Kentucky ratepayers pay for electricity. We find that the Empower Kentucky Plan is not any more
expensive than the Reference case. On the contrary, it actually leads to monthly electric bill savings for
Kentucky consumers.
System costs
On a system cost-basis (i.e., the dollar amount required to reliably provide electric service to Kentucky
customers, including costs relating to capital expenditures, operating and maintenance, energy
efficiency, environmental retrofits, transmission construction, and purchased imported electricity,
among others), we estimate that 2032 costs in the Reference case increase to $5.1 billion (see Figure
13). In the Empower Kentucky Plan, system costs are just 7 percent higher, in part because of
investment in cost-effective energy efficiency.
Figure 13. Kentucky electric system costs in the Reference case (Ref) and Empower Kentucky Plan (EMPKY)
Monthly electric bills
Despite 2032 system costs being slightly increased in the Empower Kentucky Plan, monthly bills are
lower because of energy efficiency savings. While residential ratepayers might be paying more for
electricity on a dollar-per-kWh basis, they more than make up for this rate increase by avoiding
unnecessary use of electricity. In 2032, monthly residential electric bills are estimated to be $117 per
month, just $3 per month higher than average bills were in 2015 and $13 per month lower than bills
would be in a case where the Empower Kentucky Plan is not implemented.
Synapse Energy Economics, 2017

Synapse Energy Economics, Inc. Empowering Kentucky 23
Figure 14. Typical monthly residential bills in the Reference case (Ref) and Empower Kentucky Plan (EMPKY)
2.4. The Empower Kentucky Plan produces more jobs for Kentuckians than a Reference case
The Empower Kentucky Plan leads to a diversified generating fleet, reduces emissions that harm public
health and the global climate, and delivers net savings to Kentucky ratepayers’ wallets. Importantly, we
also find that the Empower Kentucky Plan is a pathway towards more jobs for Kentuckians.
From 2018 to 2032, the Empower Kentucky Plan creates a total of 46,300 net additional job-years, an
average of 3,100 net additional jobs in each year, relative to the Reference case.20 Many of these jobs
are created through increased energy efficiency investment, which relies on local workers who live in
Kentucky and continue to contribute to the local economy. We find that in 2032 the Empower Kentucky
Plan creates an annual average of 600 more jobs, relative to the Reference case (see Figure 15).
In addition, we assume that 20 percent of all revenue generated by the Empower Kentucky’s CO2 price
adder is used to fund a just transition for Kentucky workers. This revenue funds job training and
education; financial support for affected workers and communities; local infrastructure and job creation
initiatives; and support for local innovation and entrepreneurship.21 From 2018 to 2032, the Empower
20 These numbers are in “job-years,” equivalent to one full-time job lasting a single year.
21 To learn more about KFTC’s plan for a just transition for the state’s coal workers, and economy as a whole, see:
https://www.kftc.org/sites/default/files/docs/resources/kftcs_just_transition_framework.pdf
Synapse Energy Economics, 2017

Synapse Energy Economics, Inc. Empowering Kentucky 24
Kentucky Plan creates $387 million to use in a just transition for Kentucky’s coal workers and
communities.
Figure 15. Net annual job-years created in the Empower Kentucky Plan, relative to the Reference case
Synapse Energy Economics, 2017

Synapse Energy Economics, Inc. Empowering Kentucky 25
3. SUMMARY OF FINDINGS
In this analysis we find that an Empower Kentucky Plan not only results in reduced emissions—it also
achieves a just transition for Kentuckians by reducing monthly electric bills and creating thousands of
new jobs.
An Empower Kentucky Plan creates 46,300 more job-years for Kentuckians than a business-
as-usual future over 15 years.
From 2018 to 2032, 46,300 more total job-years are created under the Empower Kentucky Plan,
equivalent to an average of 3,100 new jobs in each year, relative to the Reference case. Many of these
jobs are created through expanding energy efficiency programs in Kentucky.
The Empower Kentucky Plan exceeds the Clean Power Plan’s requirement by cutting carbon
dioxide emissions by 37 million tons from 2012 to 2032, a 40 percent reduction.
Under the Empower Kentucky Plan, Kentucky’s electric power sector produces 56 million short tons of
carbon dioxide (CO2) emissions in 2032, or 40 percent less than were emitted in 2012. From 2022 to
2032, the Empower Kentucky Plan produces 6 percent fewer emissions than is required for Kentucky to
comply with the federal Clean Power Plan. CO2 emissions under the Empower Kentucky Plan are 14
percent lower than under the Reference case. CO2 pollution declines under the Reference case, but not
by enough to meet Clean Power Plan targets.
The Empower Kentucky Plan reduces harmful pollutants that threaten the health of
Kentuckians.
Compared to a business-as-usual future, the Empower Kentucky Plan reduces pollutants in 2032 by 13
thousand short tons of sulfur dioxide (SO2) and 13 thousand short tons of nitrogen oxides (NOX). Over
the 15-year-period of 2018 to 2032, this results in a cumulative reduction of 93 thousand short tons of
SO2 and 132 thousand short tons of NOX. SO2 and NOX are major precursors to acid rain and smog, and
both can cause or worsen asthma, emphysema, bronchitis, and heart disease.
The Empower Kentucky Plan saves customers money, reducing average residential bills by 10
percent compared to the business-as-usual case in 2032.
Implementing energy efficiency, renewables, and carbon pricing reduces residential electric bills by $13
per month in 2032 relative to the business-as-usual future. These net cost savings are due to reduced
purchases of fossil fuels, implementing energy efficiency measures, and avoided costly environmental
retrofits. The Empower Kentucky Plan leads to average residential electric bills 10 percent lower than
the reference case in 2032.
The Empower Kentucky Plan invests $387 million in a just transition for Kentucky’s coal
workers and communities.

Synapse Energy Economics, Inc. Empowering Kentucky 26
A key objective of the Empower Kentucky Plan is to ensure a just transition for workers and
communities most affected by the shift to a clean energy economy. Under this plan, 20 percent of all
carbon pricing revenue—$387 million—is re-invested in job training and education; financial support for
affected workers and communities; local infrastructure and job creation initiatives; and support for local
innovation and entrepreneurship.22
Over the 15-year period, the low price on CO2 emissions from instate and imported electricity
generation imposed under this plan will generate almost $1.9 billion in total revenue. Of that, 20
percent is dedicated to support just transition efforts. The remaining $1.5 billion will be re-invested in
efforts to accelerate energy efficiency across the economy and state. It can be expected that a share of
those energy sector investments will also benefit affected workers and communities, in addition to the
$387 million directed towards just transition strategies.
The Empower Kentucky Plan invests $11 billion in energy efficiency across the economy and
prioritizes savings for low-income customers.
In the Empower Kentucky Plan, utilities will invest $11 billion in energy efficiency programs between
2018 and 2032 and achieve cumulative energy savings 17 percent lower than the business-as-usual case.
Fifty-five percent of all energy savings come from Kentucky’s commercial and industrial sector, and 45
percent from residential customers. Within those overall efficiency goals, the Empower Kentucky Plan
calls for 18 percent of all energy savings to come from projects and programs benefitting low-income
customers and communities. That low-income standard is higher than some leading states are achieving
today, a reflection of Kentucky’s higher average household electricity consumption and lower median
household incomes.
The Empower Plan also builds 1,000 MW of new combined heat and power capacity by 2032 as a cost
effective approach to achieve energy savings in commercial and industrial sectors. Combined heat and
power systems allow facilities to generate heat or hot water and electricity from the same energy
source, often located on-site, and produce significant, low-cost energy savings.
The Empower Kentucky Plan results in a cleaner and more diverse energy system in Kentucky
by 2032, while system costs are just 7 percent higher and average residential bills are lower.
Under the Empower Kentucky Plan, the share of Kentucky’s electricity generated from coal falls to 61
percent in 2032, compared to 87 percent in 2015 and 68 percent in the Reference case. The same
number of coal plant retirements are expected over the next 15 years under both scenarios. In the
Empower Kentucky Plan, Kentucky will build 0.8 GW less natural gas than in the Reference case, while
installing 1 GW more solar (including more than 600 MW of distributed solar), building 600 MW more
22 To learn more about KFTC’s plan for a just transition for the state’s coal workers, and economy as a whole, see:
https://www.kftc.org/sites/default/files/docs/resources/kftcs_just_transition_framework.pdf and www.empowerkentucky.org.

Synapse Energy Economics, Inc. Empowering Kentucky 27
wind, and increasing imports by just 3 percentage points. Overall system costs for the Empower
Kentucky Plan are just 7 percent higher than the reference case, while average bills are lower due to
greater energy efficiency.
Conclusion
If Kentucky embarks on a clean energy future as envisioned in the Empower Kentucky Plan, its citizens
will benefit from lower electric bills, cleaner air and water, more jobs, and more support for workers and
communities affected by our energy transition, all while exceeding the state’s obligation to reduce
harmful climate emissions.

Synapse Energy Economics, Inc. Empowering Kentucky A1
APPENDIX A: ELECTRIC SYSTEM AND JOBS IMPACT MODELS
Synapse relied on two models to conduct its analysis of the Reference case and the Empower Kentucky
Plan: Synapse’s adapted version of the National Renewable Energy Laboratory’s (NREL) Regional Energy
Deployment System (ReEDS) model, and IMPLAN, a job impact model developed by IMPLAN Group PLC
and modified by Synapse.23
Electric-Sector ReEDS Model
ReEDS is a long‐term capacity expansion and dispatch model of the electric power system in the lower
48 states. Synapse has adapted its in-house version of the ReEDS model to allow for more detailed
outputs by state and sector and to permit differentiation of energy efficiency expectations by state.
Compliance with the Clean Power Plan is modeled as achieving the state-level mass-based targets that
include estimated emissions from new sources (the “new source complement”) on a biennial basis. We
assume that emission allowances are traded both within and across state borders among two separate
groups of states: the nine states which currently trade carbon dioxide (CO2) emissions under the
Regional Greenhouse Gas Initiative (RGGI) and all other states modeled. The price of CO2 allowances is
set endogenously within the model as a shadow price.
IMPLAN Job Impacts Model
We estimated the job impacts using IMPLAN, which captures the in-state job impacts from energy
spending in Kentucky only.24 The assumed spending comes from following activities:
Construction of generating resources, transmission, and energy efficiency installations
Operations of energy resources
Consumer and business re-spending of electricity
For the electric sector, we developed customized inputs for the IMPLAN model relying in part on NREL’s
JEDI model.25 For each resource, we estimated the portion of the investment spent on materials versus
23 ReEDS version used is ReEDS_v2015.2(r25). More information is available at: http://www.nrel.gov/analysis/reeds. IMPLAN is
a commercial model developed by IMPLAN Group PLC. Information on IMPLAN is available at: http://implan.com/
24 This modeling does not incorporate the job impacts in Kentucky of changes to the electric system that occur outside of
Kentucky’s borders.
25 NREL. Jobs and Economic Development Impact (JEDI) Models. Last accessed February 2017. Available at:
http://www.nrel.gov/analysis/jedi/about_jedi.html.

Synapse Energy Economics, Inc. Empowering Kentucky A2
labor. Impacts from household spending and gas stations were more straightforward since these
industries directly correspond to IMPLAN sectors. The analysis results in impacts of the following types:
Direct impacts include jobs for contractors, construction workers, plant operators, and
automobile manufacturers. We developed these estimates using the amount of investment, the
share of that investment spent on labor for each resource, and industry‐specific wages.
Indirect impacts include jobs that support the direct activities. For instance, an investment in a
new wind farm not only creates jobs at the wind farm, but also down the supply chain,
increasing jobs for turbine and other component manufacturers. We adjusted the IMPLAN
model’s base resource spending allocation assumptions for the entire electric industry based on
NREL data on requirements for each individual resource.
Induced impacts result from employees in newly created direct and indirect jobs spending their
paychecks locally on restaurants, car repairs, and countless other consumer goods and services.
Induced impacts also come from customer savings on energy spending, which are spent on the
same broad range of goods and services.
Temporal Scope
The time period of our modeling is 2016-2032. ReEDS modeling is performed at two-year intervals
starting in 2014. Historical data has been included in our post-processing to serve as a point of
comparison for future emissions.
Geographic Scope
In the ReEDS model, all states in the continental United States are represented. ReEDS divides the
United States into 134 power control areas that are consistent with state boundaries and can be
aggregated to model state impacts. Each power control area is modeled as having a single aggregated
“unit” of each resource type, the size of which is equal to the sum of the capacities of the actual units in
that territory. For this analysis, Synapse modeled the country as a whole to capture interactions
between states.

Synapse Energy Economics, Inc. Empowering Kentucky B1
APPENDIX B: MODELED SCENARIOS
To investigate the costs and benefits of pursuing a clean energy future for Kentuckians, Synapse
modeled two scenarios through 2032:
Reference case: This is a future in which Kentucky continues on a business-as-usual trajectory. Energy efficiency and renewables are added at minimal levels. Natural gas plays a much larger role than it has historically in Kentucky, and coal continues to be a dominant part of the state’s energy. In this scenario, we assume the Clean Power Plan is not implemented for Kentucky or any other state.
Empower Kentucky Plan: In this case, Kentucky pursues a three-fold strategy: it invests in cost-effective energy efficiency and combined heat and power, establishes an aggressive renewable portfolio standard of 25 percent by 2030, and creates a carbon dioxide price that rises from $1 in 2018 to $3 in 2030. In this case, we assume that Kentucky and all other states meet the carbon reductions mandated under the Clean Power Plan. While coal and natural gas continue to play significant roles in this scenario, generation from those sources declines, relative to the Reference case.
This section details the input assumptions used in both scenarios, as well as the input assumptions that
are unique to the Reference case and the Empower Kentucky Plan. Note that all assumptions in this
analysis were carefully developed in a process involving stakeholders from Kentuckians for the
Commonwealth.
Electric sector natural gas prices
Sustained low natural gas prices have already had an important effect on the share of electricity
produced by coal units. For 17 out of the 21 months from April 2015 to December 2016, more U.S.
electricity was produced from natural gas than from coal—a remarkable first. Utilities are beginning to
take advantage of low natural gas prices and expectations that these prices will remain low for the
foreseeable future (see Figure 16 for natural gas price forecasts from NYMEX and the Energy
Information Administration’s (EIA) Annual Energy Outlook (AEO)). Currently, over 800 megawatts (MW)
of new natural gas combined-cycle capacity has been constructed, while an additional 1,900 MW is
proposed or under construction in Kentucky. In both the Reference case and the Empower Kentucky
Plan, we use the same natural gas price forecast: we rely on the “AEO 2016 No CPP” natural gas price.
This series is most in line with current near-term prices for natural gas.

Synapse Energy Economics, Inc. Empowering Kentucky B2
Figure 16. Natural gas prices delivered to electric power generators in the Kentucky region
Sources: AEO 2015, AEO 2016, NYMEX data as of July 2016 Notes: Since this analysis was conducted, the EIA has released an AEO 2017, which forecasts average 2017-2030 natural gas prices delivered to electric power generators in the East South Central census region (of which Kentucky is member) to be 7 percent lower than the same estimates from AEO 2016.
Sales forecasts and energy efficiency
Recently, sales of electricity in Kentucky have plummeted relative to historical levels. At the same time,
forecasts of future sales remain low compared to past growth. Between 2010 and 2015, Kentucky’s
electric sales fell at an average annual rate of -4.34 percent.26 Kentucky’s Energy Cabinet estimates that
sales will remain essentially flat for the foreseeable future, while both the AEO 2016 Reference case and
an aggregation of Kentucky utility integrated resource plans forecast that electric sales will grow by
about 0.87 percent per year (see Table 5). In both the Reference case and the Empower Kentucky Plan,
we assume that electric sales (absent any energy efficiency, combined heat and power projects, or
distributed renewable generation) will grow by the “KY IRPs” value of 0.87 percent per year.
26 Note that this rate of change is a substantial departure from previous years. This decrease is tied to reductions in residential
sales (which dropped by 6 percent during this period) but is also largely tied to industrial sales reductions, which decreased by 28 percent during this time period, in part as a result of the closure of the Paducah uranium enrichment plant and other energy-intensive facilities.
Synapse Energy Economics, 2017

Synapse Energy Economics, Inc. Empowering Kentucky B3
Table 5. Potential sales forecasts to implement in this modeling analysis
Cumulative Annual Growth Rate Historical average: 2010 to 2015 -4.34%
AEO 2015 Reference case 0.99% AEO 2016 Reference case 0.87%
KY IRPs 0.87% KY Energy Cabinet -0.06%
Note: The Historical CAGR is calculated for the period between 2010 and 2015. CAGRs for all other series are calculated for the period between 2016 and 2032.
In 2014, Kentucky utilities achieved annual incremental energy efficiency savings of 0.38 percent of the
previous year sales, relatively low compared to many of its neighbors (see Figure 17).
Figure 17. Utility program energy efficiency savings in Kentucky and neighboring states, 2014
Note: Sector-specific percentages refer to savings as a percent of those sector’s sales (for example the residential sector in Kentucky achieved 0.68 percent savings as a percent of residential sales). 2015 data was not available at the time input assumptions were developed—2015 savings as a percent of previous year sales were 0.42 percent. Source: EIA 861 2014
Table 6 compares Kentucky’s energy savings achieved from utility programs to both the United States
average. Kentucky’s total energy efficiency savings are about half of the incremental savings achieved
nationwide. While Kentucky is on average under-investing in energy efficiency compared to the nation
as a whole, it is even more dramatically under-investing in industrial energy efficiency, with savings in
this sector just one-third that of the U.S. average. Table 6 also shows 2014 energy efficiency savings for
Massachusetts, the top-ranking state for energy efficiency according to American Council for an Energy-

Synapse Energy Economics, Inc. Empowering Kentucky B4
Efficient Economy (ACEEE).27 As a result of strong state policies partnered with on-the-ground utility
experience, Massachusetts has attained incremental energy savings more than six-and-half-times
greater than Kentucky. Massachusetts utilities have also filed plans to increase these savings to 2.94
percent each year for 2016 to 2018.28 Massachusetts’ plan puts special emphasis on low-income and
commercial and industrial savings, with annual savings goals of 1.83 percent and 2.59 percent,
respectively.
Table 6. Incremental energy efficiency savings as a percent of sales in utility programs, 2014
Kentucky U.S. Average Massachusetts Residential 0.68% 0.81% 2.92% Commercial 0.44% 0.88% 2.53%
Industrial 0.09% 0.31% 1.56% All Sectors 0.38% 0.70% 2.52%
Note: Sector-specific percentages refer to savings as a percent of those sector’s sales (for example the residential sector in Kentucky achieved 0.68 percent savings as a percent of residential sales). 2015 data was not available at the time input assumptions were developed—2015 savings as a percent of previous year sales were 0.42 percent. Source: EIA 861 2014
General energy efficiency potential and costs
In terms of energy efficiency potential, a 2015 report by Applied Energy Group performed on behalf of
Kentucky Power found that even at moderate levels of penetration, statewide energy efficiency
programs could reach levels of 0.65 percent by 2018 in Kentucky. A second scenario found that by
achieving Kentucky Power’s “economic potential” (in which all cost-effective measures are adopted by
consumers), all sectors could achieve levels of 1.34 percent by 2018.29 For comparison, in the agency’s
Clean Power Plan analysis the U.S. Environmental Protection Agency assumes that all utilities can
increase energy efficiency savings by 0.2 percentage points per year (over current-year savings) starting
in 2020 with Kentucky reaching annual incremental energy efficiency savings of 1 percent by 2024.30
EPA assumes that this level of savings can be sustained through 2040. Other potential studies, such as
ACEEE’s 2012 report Energy Efficiency Cost-Effective Resource Assessment for Kentucky written for the
U.S. Department of Energy, found that levels of 1 percent could be achieved.
In Synapse’s February 2016 preliminary analysis for KFTC, we found that energy efficiency levels of 3
percent per year by 2030 could cause Kentucky to achieve Clean Power Plan compliance, when
renewable levels were relatively low (13 percent of sales by 2030). Separately, we found that when
27 ACEEE Scorecards are available at http://aceee.org/state-policy/scorecard
28 Massachusetts three-year plans for 2016-2018 available at http://ma-eeac.org/plans-updates/
29 Note that Synapse’s December 2015 report for Mountain Associates for Community Economic Development, Employment
After Coal, uses an Applied Energy Group study based on this market potential study and uses an energy efficiency trajectory similar to the “economic potential” estimate.
30 Available at https://www.epa.gov/sites/production/files/2015-11/df-cpp-demand-side-ee-at3.xlsx
Synapse Energy Economics, Inc. Empowering Kentucky B5
combined with high levels of renewables (13 percent per year by 2030), renewable levels of 1 percent
per year by 2020 were sufficient to meet Clean Power Plan compliance.
This analysis of the Empower Kentucky Plan assumes an all-in levelized cost of saved energy associated
with energy efficiency programs of $0.070 per kilowatt hour (kWh), or a first-year cost of about $0.596
per kWh.31 We assume that utility and participant costs of energy efficiency are split 50/50.32 This
results in utility-side costs of $0.035 per kWh (levelized) and $0.298 per kWh (first-year).
The next sections discuss possible levels of energy efficiency to model both by sector and for electric
cooperatives, which encompass more than 40 percent of Kentucky’s electric system sales. Note that
savings percentages below are given in reference to sector-specific sales.
Residential programs
Kentucky’s residential efficiency programs are its most robust, achieving annual incremental savings of
0.68 percent in 2014 (compared to total residential sales). However, nearby states, including Illinois,
Ohio, Indiana, and Missouri, are achieving still higher savings at levels between 0.80 and 2.21 percent
per year. Applied Energy Group’s 2015 study on Kentucky found that levels of 0.72 percent could be
achieved in a mid case and that 1.63 percent could be achieved in an “economic potential” scenario.
ACEEE’s 2012 study on Kentucky found that the residential sector could achieve annual incremental
savings levels of 1.1 percent per year.
Commercial programs
Kentucky’s commercial efficiency programs also lag behind its neighbors, including Illinois, Ohio, Indiana,
and Missouri, all of which achieve savings of at least 0.68 percent per year in this sector (versus
Kentucky’s 0.44 percent). Applied Energy Group’s 2015 study found that levels of 0.46 percent could be
achieved in the commercial sector in a mid case and that 0.96 percent could be achieved in an
“economic potential” scenario. ACEEE’s 2012 study found that the commercial sector could achieve
annual incremental savings levels of 1.4 percent per year.
Industrial programs
Kentucky’s industrial efficiency programs have historically been its weakest, although they are in line
with many neighboring states. Only Ohio achieves significantly more energy efficiency savings—at levels
of 0.83 percent (compared to industrial sales), it is over nine times greater than Kentucky’s savings level.
Applied Energy Group’s 2015 study found that levels of 0.69 percent could be achieved in the industrial
sector in a mid case and that 1.29 percent could be achieved in an “economic potential” scenario.
31 This value is calculated based on Synapse analysis of EIA 861 data.
32 This is the same assumption used by EPA in its Clean Power Plan technical support documentation at
https://www.epa.gov/sites/production/files/2015-11/df-cpp-demand-side-ee-at3.xlsx

Synapse Energy Economics, Inc. Empowering Kentucky B6
ACEEE’s 2012 study found that the industrial sector could achieve annual incremental savings levels of at
least 0.7 percent per year.
Combined heat and power
Combined heat and power (CHP) projects are among the most cost-effective ways to achieve electricity
savings. Instead of separately procuring on-site heat or hot water and electricity, an industrial or
commercial facility can use a single CHP system to produce both. CHP systems can significantly reduce
the energy expenditures of large industrial facilities and commercial buildings, which may help offset
rising energy costs associated with other changes to Kentucky’s electric system.
A March 2016 study of Kentucky by the DOE found more than 2.7 gigawatts (GW) of CHP potential
distributed across over 4,000 sites, with over half of this potential concentrated in fewer than 100 large
sites.33 Sites for installing CHP projects include industrial facilities specializing in primary metals,
stone/clay/glass manufacturing, and petroleum refining, as well as commercial sites such as colleges and
universities, office buildings, and hospitals.
Because CHP projects can be installed at many different types and sizes of facilities, their costs vary
significantly. On average, total costs of installing CHP systems can range from about $900 per kW to
$1,600 per kW.34 Many states currently provide incentives for implementing CHP projects.
Massachusetts, for example, provides two incentives: one for capacity at $800 per kW and one for
energy produced at $75-115 per megawatt hour (MWh).35 Other utilities, such as Baltimore Gas &
Electric in Maryland and ComEd and Ameren in Illinois, provide slightly different incentives. These
include capacity incentives of $250-350 per kWh and production incentives of $60-80 per MWh, but only
for a short period of time, with a cap on total incentive dollars spent of $2.0-2.5 million per project.36
Collectively, these programs average first-year costs of about $250 per MWh, or about $15 per MWh
when levelized over 20 years (the price assumptions used in this analysis).
These same states have achieved different levels of realized CHP projects. While Kentucky has only had
four new CHP projects installed in the ten-year period from 2006 to 2015, Maryland and Illinois both
installed 16, while Massachusetts installed 102 (see Table 7). The average size of these projects varied
widely in size from 1 MW per project in Massachusetts to 5.5 MW per project in Illinois. While some
33 Available at http://www.energy.gov/sites/prod/files/2016/04/f30/CHP%20Technical%20Potential%20Study%203-31-
2016%20Final.pdf
34 More information available at http://www.c2es.org/technology/factsheet/CogenerationCHP
35 More information available at http://www.masssave.com/~/media/Files/Business/Applications-and-Rebate-Forms/A-Guide-
to-Submitting-CHP-Applications-for-Incentives-in-Massachusetts.pdf
36 More information available at http://www.bgesmartenergy.com/business/chp and
http://programs.dsireusa.org/system/program/detail/5506

Synapse Energy Economics, Inc. Empowering Kentucky B7
specific projects are smaller than even 50 kW, many are much larger projects totaling 24 to 78 MW at
hospitals, universities, and industrial facilities.
Table 7. CHP projects installed, 2006 to 2015
Total Projects Total Capacity (MW) Average Capacity per Project (MW) Kentucky 4 18.7 4.7
Massachusetts 102 105.4 1.0 Maryland 16 35.5 2.2
Illinois 16 87.9 5.5
Source: https://doe.icfwebservices.com/chpdb/
In the Reference case, we assumed no incremental combined heat and power projects. In the Empower
Kentucky Plan, Synapse assumed a trajectory for combined heat and power as depicted in Table 8. This
results in cumulative energy savings from CHP projects totaling 0.5 percent by 2030.
Table 8. Total CHP capacity to be added in Empower Kentucky Plan
2017 2018 2019 2020 2021 and each year thereafter
Total New CHP Capacity (MW)
5 25 50 75 100
Low-income programs
Providing assistance for low-income customers through energy efficiency programs is a key feature of
the Empower Kentucky Plan. While over 19 percent of Kentucky residents are living below the federal
poverty level according to the U.S. Census Bureau, just 0.14 percent of energy efficiency program
expenditures were spent on targeted low-income programs in recent years according to ACEEE data.
Some Kentucky utilities, such as Duke, LG&E/KU, and Kentucky Power, are currently implementing low-
income energy efficiency programs, although at relatively low levels of about 0.01 percent of
incremental annual savings as a percent of total utility sales.37 Meanwhile, utilities such as Duquesne
Light and PECO Energy in Pennsylvania achieved low-income energy efficiency at levels seven to nine
times higher than Kentucky utilities. Some states require low-income energy efficiency programs to be
maintained at some level relative to overall savings: Massachusetts, for example, requires that at least
10 percent of all annual energy efficiency budgets be spent on low-income programs. One utility—
Eversource Energy—recently achieved low-income savings levels 12 times higher than Kentucky utilities.
In the Empower Kentucky Plan, we assume that 18 percent of all energy efficiency savings are directed
at low-income customers and communities.
37 Low-income programs are sometimes reported as their own sector and sometimes rolled into residential programs. Because
of this discrepancy in reporting, we have provided low-income savings levels as a percent of total sales.
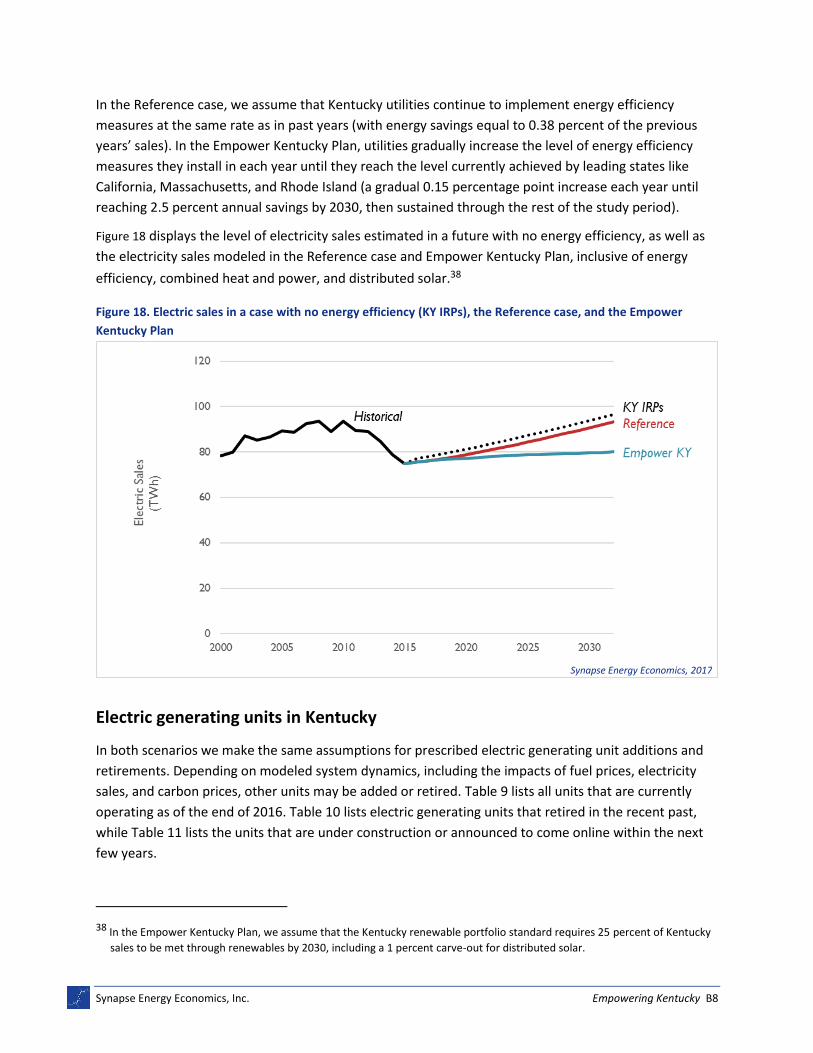
Synapse Energy Economics, Inc. Empowering Kentucky B8
In the Reference case, we assume that Kentucky utilities continue to implement energy efficiency
measures at the same rate as in past years (with energy savings equal to 0.38 percent of the previous
years’ sales). In the Empower Kentucky Plan, utilities gradually increase the level of energy efficiency
measures they install in each year until they reach the level currently achieved by leading states like
California, Massachusetts, and Rhode Island (a gradual 0.15 percentage point increase each year until
reaching 2.5 percent annual savings by 2030, then sustained through the rest of the study period).
Figure 18 displays the level of electricity sales estimated in a future with no energy efficiency, as well as
the electricity sales modeled in the Reference case and Empower Kentucky Plan, inclusive of energy
efficiency, combined heat and power, and distributed solar.38
Figure 18. Electric sales in a case with no energy efficiency (KY IRPs), the Reference case, and the Empower
Kentucky Plan
Electric generating units in Kentucky
In both scenarios we make the same assumptions for prescribed electric generating unit additions and
retirements. Depending on modeled system dynamics, including the impacts of fuel prices, electricity
sales, and carbon prices, other units may be added or retired. Table 9 lists all units that are currently
operating as of the end of 2016. Table 10 lists electric generating units that retired in the recent past,
while Table 11 lists the units that are under construction or announced to come online within the next
few years.
38 In the Empower Kentucky Plan, we assume that the Kentucky renewable portfolio standard requires 25 percent of Kentucky
sales to be met through renewables by 2030, including a 1 percent carve-out for distributed solar.
Synapse Energy Economics, 2017

Synapse Energy Economics, Inc. Empowering Kentucky B9
Table 9. Currently-existing electric generating units
Dec 2016 Operational
Status Owner Plant ORSPL Unit
Fuel Type
Unit Type
County Online Year
Retire-ment Year
Nameplate Capacity
(MW)
2016 Generation
(GWh)
2016 Capacity
Factor (%)
Operating American Mun
Power-Ohio, Inc
Cannelton Hydroelectric
Plant 57399 CG1 Hydro Hydro Hancock 2016 29 125 48%
Operating American Mun
Power-Ohio, Inc
Cannelton Hydroelectric
Plant 57399 CG2 Hydro Hydro Hancock 2016 29 125 48%
Operating American Mun
Power-Ohio, Inc
Cannelton Hydroelectric
Plant 57399 CG3 Hydro Hydro Hancock 2016 29 125 48%
Operating Big Rivers D B Wilson 6823 1 Coal Steam Ohio 1984 509 3,115 70%
Operating Big Rivers HMP&L Station Two Henderson
1382 1 Coal Steam Henderson 1973 200 781 44%
Operating Big Rivers HMP&L Station Two Henderson
1382 2 Coal Steam Henderson 1974 205 997 55%
Out of Service
Big Rivers Kenneth C Coleman
1381 1 Coal Steam Hancock 1969 205 - -
Out of Service
Big Rivers Kenneth C Coleman
1381 2 Coal Steam Hancock 1970 205 - -
Out of Service
Big Rivers Kenneth C Coleman
1381 3 Coal Steam Hancock 1971 192 - -
Operating Big Rivers R D Green 6639 1 Coal Steam Webster 1979 293 1,351 52%
Operating Big Rivers R D Green 6639 2 Coal Steam Webster 1981 293 1,386 54%

Synapse Energy Economics, Inc. Empowering Kentucky B10
Dec 2016 Operational
Status Owner Plant ORSPL Unit
Fuel Type
Unit Type
County Online Year
Retire-ment Year
Nameplate Capacity
(MW)
2016 Generation
(GWh)
2016 Capacity
Factor (%)
Operating Big Rivers Robert A Reid 1383 1 Other Steam Webster 1966 96 - -
Standby Big Rivers Robert A Reid 1383 GEN2 Natural
Gas Gas
Turbine Webster 1976 99 - -
Operating City of
Hamilton - (OH)
Meldahl Hydroelectric
Project 56872 1 Hydro Hydro Bracken 2016 35 126 41%
Operating City of
Hamilton - (OH)
Meldahl Hydroelectric
Project 56872 2 Hydro Hydro Bracken 2016 35 126 41%
Operating City of
Hamilton - (OH)
Meldahl Hydroelectric
Project 56872 3 Hydro Hydro Bracken 2016 35 126 41%
Operating City of
Owensboro Elmer Smith 1374 1 Coal Steam Daviess 1964 2019 163 698 49%
Operating City of
Owensboro Elmer Smith 1374 2 Coal Steam Daviess 1974 2023 282 1,257 51%
Operating City of Paris -
(KY) Paris (KY) 1376 1 Other
Int. Com-
bustion Bourbon 1952 1 - -
Operating City of Paris -
(KY) Paris (KY) 1376 2 Other
Int. Com-
bustion Bourbon 1954 1 - -
Operating City of Paris -
(KY) Paris (KY) 1376 3 Other
Int. Com-
bustion Bourbon 1934 1 - -
Operating City of Paris -
(KY) Paris (KY) 1376 4 Other
Int. Com-
bustion Bourbon 1947 1 - -

Synapse Energy Economics, Inc. Empowering Kentucky B11
Dec 2016 Operational
Status Owner Plant ORSPL Unit
Fuel Type
Unit Type
County Online Year
Retire-ment Year
Nameplate Capacity
(MW)
2016 Generation
(GWh)
2016 Capacity
Factor (%)
Operating City of Paris -
(KY) Paris (KY) 1376 5 Other
Int. Com-
bustion Bourbon 1949 1 - -
Operating City of Paris -
(KY) Paris (KY) 1376 6 Other
Int. Com-
bustion Bourbon 1974 3 - -
Operating City of Paris -
(KY) Paris (KY) 1376 7 Other
Int. Com-
bustion Bourbon 1974 3 - -
Operating Cox Interior
Inc Cox Waste to
Energy 54850 01 Other Steam Taylor 1995 4 - -
Operating Cox Interior
Inc Cox Waste to
Energy 54850 02 Other Steam Taylor 2002 1 - -
Operating Domtar Paper Company LLC
Kentucky Mills 55429 01 Other Steam Hancock 2001 88 377 49%
Operating DTE Calvert
City LLC Calvert City 55308 GEN1
Natural Gas
Gas Turbine
Marshall 2000 27 - -
Operating Duke East Bend 6018 2 Coal Steam Boone 1981 772 3,667 54%
Operating EKPC Bavarian LFGTE 56277 1 Other Int.
Com-bustion
Boone 2003 1 - -
Operating EKPC Bavarian LFGTE 56277 2 Other Int.
Com-bustion
Boone 2003 1 - -
Operating EKPC Bavarian LFGTE 56277 3 Other Int.
Com-bustion
Boone 2003 1 - -

Synapse Energy Economics, Inc. Empowering Kentucky B12
Dec 2016 Operational
Status Owner Plant ORSPL Unit
Fuel Type
Unit Type
County Online Year
Retire-ment Year
Nameplate Capacity
(MW)
2016 Generation
(GWh)
2016 Capacity
Factor (%)
Operating EKPC Bavarian LFGTE 56277 4 Other Int.
Com-bustion
Boone 2003 1 - -
Operating EKPC Bluegrass
Generating Station
55164 CT1 Natural
Gas Gas
Turbine Oldham 2002 208 17 1%
Operating EKPC Bluegrass
Generating Station
55164 CT2 Natural
Gas Gas
Turbine Oldham 2002 208 17 1%
Operating EKPC Bluegrass
Generating Station
55164 CT3 Natural
Gas Gas
Turbine Oldham 2002 208 17 1%
Operating EKPC Cooper 1384 1 Coal Steam Pulaski 1965 114 239 24%
Operating EKPC Cooper 1384 2 Coal Steam Pulaski 1969 230 406 20%
Operating EKPC Glasgow LFGTE 60137 1 Other Int.
Com-bustion
Barren 2015 1 - -
Operating EKPC Green Valley
LFGTE 56278 1 Other
Int. Com-
bustion Greenup 2003 1 - -
Operating EKPC Green Valley
LFGTE 56278 2 Other
Int. Com-
bustion Greenup 2003 1 - -
Operating EKPC Green Valley
LFGTE 56278 3 Other
Int. Com-
bustion Greenup 2003 1 - -
Operating EKPC H L Spurlock 6041 1 Coal Steam Mason 1977 358 1,870 60%

Synapse Energy Economics, Inc. Empowering Kentucky B13
Dec 2016 Operational
Status Owner Plant ORSPL Unit
Fuel Type
Unit Type
County Online Year
Retire-ment Year
Nameplate Capacity
(MW)
2016 Generation
(GWh)
2016 Capacity
Factor (%)
Operating EKPC H L Spurlock 6041 2 Coal Steam Mason 1981 592 3,085 59%
Operating EKPC H L Spurlock 6041 3 Coal Steam Mason 2005 329 1,744 60%
Operating EKPC H L Spurlock 6041 4 Coal Steam Mason 2009 329 1,863 64%
Operating EKPC Hardin County
LFGTE 56280 1 Other
Int. Com-
bustion Hardin 2006 1 - -
Operating EKPC Hardin County
LFGTE 56280 2 Other
Int. Com-
bustion Hardin 2006 1 - -
Operating EKPC Hardin County
LFGTE 56280 3 Other
Int. Com-
bustion Hardin 2006 1 - -
Operating EKPC J K Smith 54 GT1 Natural
Gas Gas
Turbine Clark 1999 149 32 2%
Operating EKPC J K Smith 54 GT10 Natural
Gas Gas
Turbine Clark 2010 98 21 2%
Operating EKPC J K Smith 54 GT2 Natural
Gas Gas
Turbine Clark 1999 149 32 2%
Operating EKPC J K Smith 54 GT3 Natural
Gas Gas
Turbine Clark 1999 149 32 2%
Operating EKPC J K Smith 54 GT4 Natural
Gas Gas
Turbine Clark 2001 108 23 2%

Synapse Energy Economics, Inc. Empowering Kentucky B14
Dec 2016 Operational
Status Owner Plant ORSPL Unit
Fuel Type
Unit Type
County Online Year
Retire-ment Year
Nameplate Capacity
(MW)
2016 Generation
(GWh)
2016 Capacity
Factor (%)
Operating EKPC J K Smith 54 GT5 Natural
Gas Gas
Turbine Clark 2001 108 23 2%
Operating EKPC J K Smith 54 GT6 Natural
Gas Gas
Turbine Clark 2005 98 21 2%
Operating EKPC J K Smith 54 GT7 Natural
Gas Gas
Turbine Clark 2005 98 21 2%
Operating EKPC J K Smith 54 GT9 Natural
Gas Gas
Turbine Clark 2010 98 21 2%
Operating EKPC Laurel Ridge
LFGTE 56279 1 Other
Int. Com-
bustion Laurel 2003 1 - -
Operating EKPC Laurel Ridge
LFGTE 56279 2 Other
Int. Com-
bustion Laurel 2003 1 - -
Operating EKPC Laurel Ridge
LFGTE 56279 3 Other
Int. Com-
bustion Laurel 2003 1 - -
Operating EKPC Laurel Ridge
LFGTE 56279 4 Other
Int. Com-
bustion Laurel 2003 1 - -
Operating EKPC Laurel Ridge
LFGTE 56279 5 Other
Int. Com-
bustion Laurel 2006 1 - -
Operating EKPC Pendleton
County LFGTE 56327 1 Other
Int. Com-
bustion Pendleton 2007 1 - -
Operating EKPC Pendleton
County LFGTE 56327 2 Other
Int. Com-
bustion Pendleton 2007 1 - -
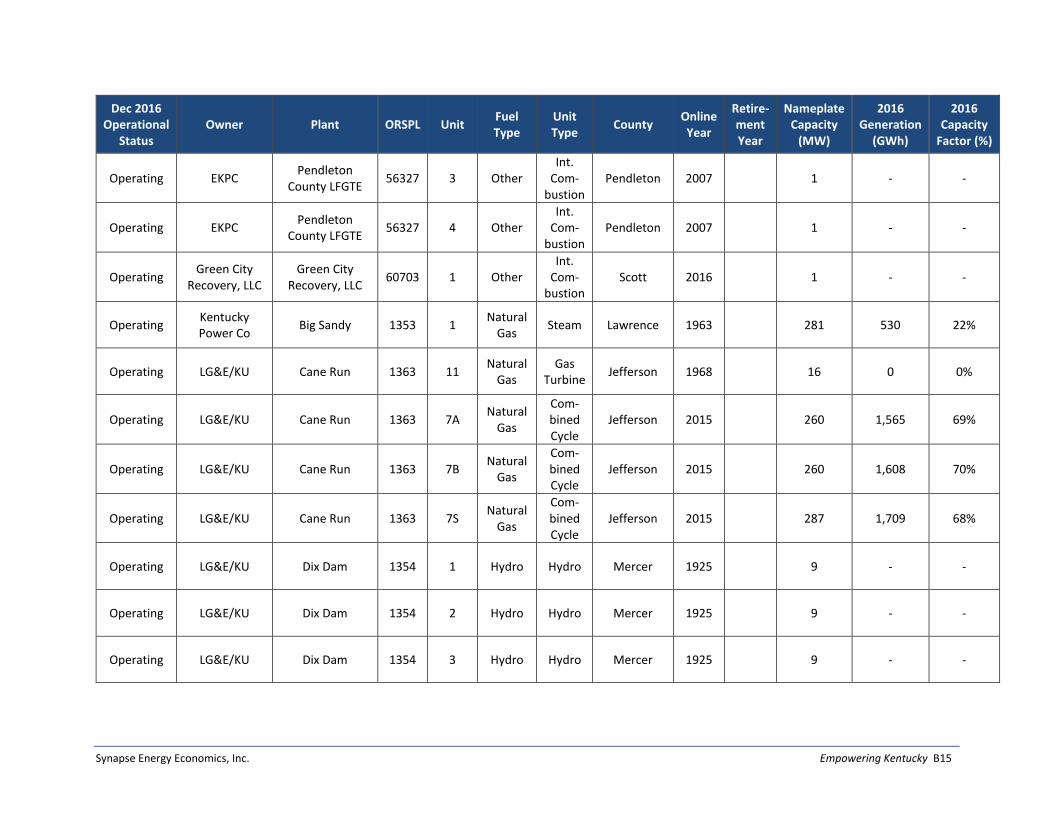
Synapse Energy Economics, Inc. Empowering Kentucky B15
Dec 2016 Operational
Status Owner Plant ORSPL Unit
Fuel Type
Unit Type
County Online Year
Retire-ment Year
Nameplate Capacity
(MW)
2016 Generation
(GWh)
2016 Capacity
Factor (%)
Operating EKPC Pendleton
County LFGTE 56327 3 Other
Int. Com-
bustion Pendleton 2007 1 - -
Operating EKPC Pendleton
County LFGTE 56327 4 Other
Int. Com-
bustion Pendleton 2007 1 - -
Operating Green City
Recovery, LLC Green City
Recovery, LLC 60703 1 Other
Int. Com-
bustion Scott 2016 1 - -
Operating Kentucky Power Co
Big Sandy 1353 1 Natural
Gas Steam Lawrence 1963 281 530 22%
Operating LG&E/KU Cane Run 1363 11 Natural
Gas Gas
Turbine Jefferson 1968 16 0 0%
Operating LG&E/KU Cane Run 1363 7A Natural
Gas
Com-bined Cycle
Jefferson 2015 260 1,565 69%
Operating LG&E/KU Cane Run 1363 7B Natural
Gas
Com-bined Cycle
Jefferson 2015 260 1,608 70%
Operating LG&E/KU Cane Run 1363 7S Natural
Gas
Com-bined Cycle
Jefferson 2015 287 1,709 68%
Operating LG&E/KU Dix Dam 1354 1 Hydro Hydro Mercer 1925 9 - -
Operating LG&E/KU Dix Dam 1354 2 Hydro Hydro Mercer 1925 9 - -
Operating LG&E/KU Dix Dam 1354 3 Hydro Hydro Mercer 1925 9 - -

Synapse Energy Economics, Inc. Empowering Kentucky B16
Dec 2016 Operational
Status Owner Plant ORSPL Unit
Fuel Type
Unit Type
County Online Year
Retire-ment Year
Nameplate Capacity
(MW)
2016 Generation
(GWh)
2016 Capacity
Factor (%)
Operating LG&E/KU E W Brown 1355 1 Coal Steam Mercer 1957 114 219 22%
Operating LG&E/KU E W Brown 1355 2 Coal Steam Mercer 1963 180 410 26%
Operating LG&E/KU E W Brown 1355 3 Coal Steam Mercer 1971 464 1,105 27%
Operating LG&E/KU E W Brown 1355 5 Natural
Gas Gas
Turbine Mercer 2001 123 65 6%
Operating LG&E/KU E W Brown 1355 6 Natural
Gas Gas
Turbine Mercer 1999 177 94 6%
Operating LG&E/KU E W Brown 1355 7 Natural
Gas Gas
Turbine Mercer 1999 177 94 6%
Operating LG&E/KU E W Brown 1355 8 Natural
Gas Gas
Turbine Mercer 1995 126 67 6%
Operating LG&E/KU E W Brown 1355 9 Natural
Gas Gas
Turbine Mercer 1994 126 67 6%
Operating LG&E/KU E W Brown 1355 10 Natural
Gas Gas
Turbine Mercer 1995 126 67 6%
Operating LG&E/KU E W Brown 1355 11 Natural
Gas Gas
Turbine Mercer 1996 126 67 6%
Operating LG&E/KU E W Brown 1355 SOLAR Solar Photo-voltaic
Mercer 2016 10 12 13%
Operating LG&E/KU Ghent 1356 1 Coal Steam Carroll 1974 557 3,050 62%

Synapse Energy Economics, Inc. Empowering Kentucky B17
Dec 2016 Operational
Status Owner Plant ORSPL Unit
Fuel Type
Unit Type
County Online Year
Retire-ment Year
Nameplate Capacity
(MW)
2016 Generation
(GWh)
2016 Capacity
Factor (%)
Operating LG&E/KU Ghent 1356 2 Coal Steam Carroll 1977 556 2,971 61%
Operating LG&E/KU Ghent 1356 3 Coal Steam Carroll 1981 557 2,683 55%
Operating LG&E/KU Ghent 1356 4 Coal Steam Carroll 1984 556 3,074 63%
Operating LG&E/KU Haefling 1358 1 Natural
Gas Gas
Turbine Fayette 1970 21 - -
Operating LG&E/KU Haefling 1358 2 Natural
Gas Gas
Turbine Fayette 1970 21 - -
Operating LG&E/KU Mill Creek (KY) 1364 1 Coal Steam Jefferson 1972 356 1,802 58%
Operating LG&E/KU Mill Creek (KY) 1364 2 Coal Steam Jefferson 1974 356 1,652 53%
Operating LG&E/KU Mill Creek (KY) 1364 3 Coal Steam Jefferson 1978 463 2,007 49%
Operating LG&E/KU Mill Creek (KY) 1364 4 Coal Steam Jefferson 1982 544 2,469 52%
Operating LG&E/KU Ohio Falls 1365 1 Hydro Hydro Jefferson 1928 10 - -
Operating LG&E/KU Ohio Falls 1365 2 Hydro Hydro Jefferson 1928 10 - -
Operating LG&E/KU Ohio Falls 1365 3 Hydro Hydro Jefferson 1928 10 - -

Synapse Energy Economics, Inc. Empowering Kentucky B18
Dec 2016 Operational
Status Owner Plant ORSPL Unit
Fuel Type
Unit Type
County Online Year
Retire-ment Year
Nameplate Capacity
(MW)
2016 Generation
(GWh)
2016 Capacity
Factor (%)
Operating LG&E/KU Ohio Falls 1365 4 Hydro Hydro Jefferson 1928 10 - -
Operating LG&E/KU Ohio Falls 1365 5 Hydro Hydro Jefferson 1928 10 - -
Operating LG&E/KU Ohio Falls 1365 6 Hydro Hydro Jefferson 1928 13 - -
Operating LG&E/KU Ohio Falls 1365 7 Hydro Hydro Jefferson 1928 13 - -
Operating LG&E/KU Ohio Falls 1365 8 Hydro Hydro Jefferson 1928 10 - -
Operating LG&E/KU Paddys Run 1366 11 Natural
Gas Gas
Turbine Jefferson 1968 16 7 5%
Operating LG&E/KU Paddys Run 1366 12 Natural
Gas Gas
Turbine Jefferson 1968 33 14 5%
Operating LG&E/KU Paddys Run 1366 13 Natural
Gas Gas
Turbine Jefferson 2001 178 78 5%
Operating LG&E/KU Trimble County 6071 1 Coal Steam Trimble 1990 566 3,565 72%
Operating LG&E/KU Trimble County 6071 2 Coal Steam Trimble 2011 834 4,135 56%
Operating LG&E/KU Trimble County 6071 5 Natural
Gas Gas
Turbine Trimble 2002 199 143 8%
Operating LG&E/KU Trimble County 6071 6 Natural
Gas Gas
Turbine Trimble 2002 199 143 8%

Synapse Energy Economics, Inc. Empowering Kentucky B19
Dec 2016 Operational
Status Owner Plant ORSPL Unit
Fuel Type
Unit Type
County Online Year
Retire-ment Year
Nameplate Capacity
(MW)
2016 Generation
(GWh)
2016 Capacity
Factor (%)
Operating LG&E/KU Trimble County 6071 7 Natural
Gas Gas
Turbine Trimble 2004 199 143 8%
Operating LG&E/KU Trimble County 6071 8 Natural
Gas Gas
Turbine Trimble 2004 199 143 8%
Operating LG&E/KU Trimble County 6071 9 Natural
Gas Gas
Turbine Trimble 2004 199 143 8%
Operating LG&E/KU Trimble County 6071 10 Natural
Gas Gas
Turbine Trimble 2004 199 143 8%
Operating LG&E/KU Zorn 1368 1 Natural
Gas Gas
Turbine Jefferson 1969 18 - -
Operating Lock 7 Hydro Partners LLC
Mother Ann Lee 1359 1 Hydro Hydro Mercer 2008 1 - -
Operating Lock 7 Hydro Partners LLC
Mother Ann Lee 1359 2 Hydro Hydro Mercer 2007 1 - -
Operating Lock 7 Hydro Partners LLC
Mother Ann Lee 1359 3 Hydro Hydro Mercer 2007 1 - -
Operating North
American Biofuels, LLC
Blue Ridge Generating
59392 GEN1 Other Int.
Com-bustion
Estill 2013 2 - -
Operating Paducah
Power System PPS Power Plant
No 1 56556 1
Natural Gas
Gas Turbine
McCracken 2010 60 - -
Operating Paducah
Power System PPS Power Plant
No 1 56556 2
Natural Gas
Gas Turbine
McCracken 2010 60 - -
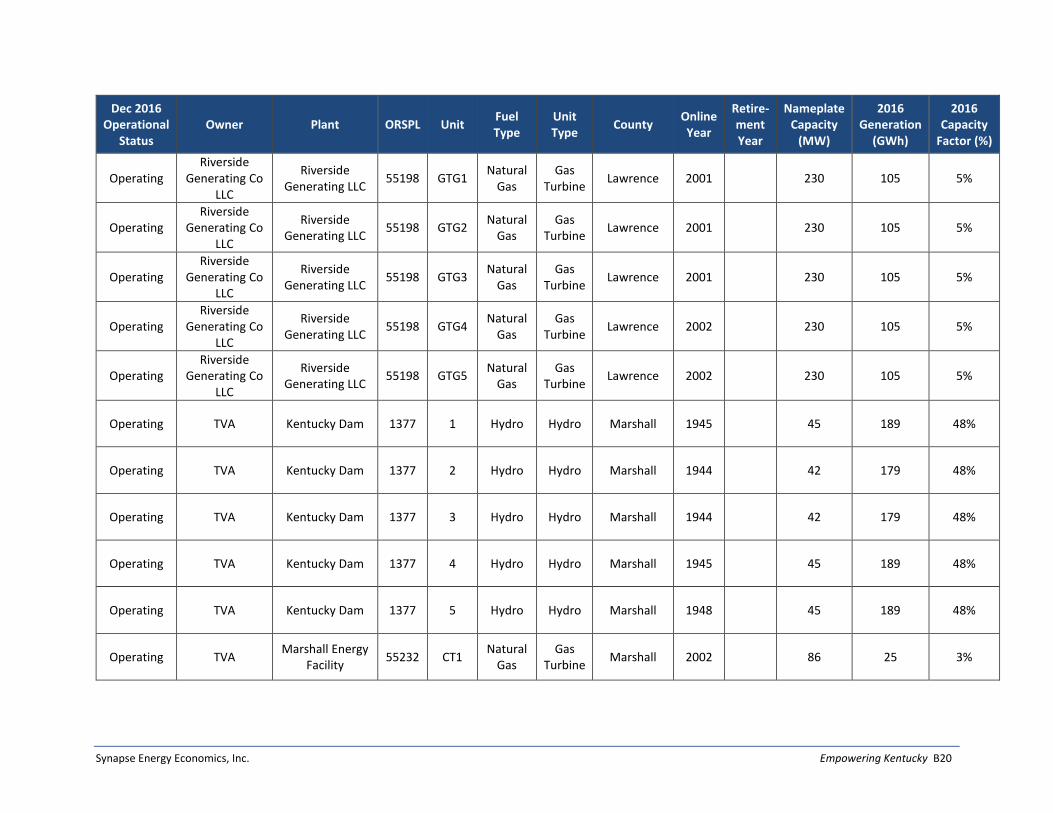
Synapse Energy Economics, Inc. Empowering Kentucky B20
Dec 2016 Operational
Status Owner Plant ORSPL Unit
Fuel Type
Unit Type
County Online Year
Retire-ment Year
Nameplate Capacity
(MW)
2016 Generation
(GWh)
2016 Capacity
Factor (%)
Operating Riverside
Generating Co LLC
Riverside Generating LLC
55198 GTG1 Natural
Gas Gas
Turbine Lawrence 2001 230 105 5%
Operating Riverside
Generating Co LLC
Riverside Generating LLC
55198 GTG2 Natural
Gas Gas
Turbine Lawrence 2001 230 105 5%
Operating Riverside
Generating Co LLC
Riverside Generating LLC
55198 GTG3 Natural
Gas Gas
Turbine Lawrence 2001 230 105 5%
Operating Riverside
Generating Co LLC
Riverside Generating LLC
55198 GTG4 Natural
Gas Gas
Turbine Lawrence 2002 230 105 5%
Operating Riverside
Generating Co LLC
Riverside Generating LLC
55198 GTG5 Natural
Gas Gas
Turbine Lawrence 2002 230 105 5%
Operating TVA Kentucky Dam 1377 1 Hydro Hydro Marshall 1945 45 189 48%
Operating TVA Kentucky Dam 1377 2 Hydro Hydro Marshall 1944 42 179 48%
Operating TVA Kentucky Dam 1377 3 Hydro Hydro Marshall 1944 42 179 48%
Operating TVA Kentucky Dam 1377 4 Hydro Hydro Marshall 1945 45 189 48%
Operating TVA Kentucky Dam 1377 5 Hydro Hydro Marshall 1948 45 189 48%
Operating TVA Marshall Energy
Facility 55232 CT1
Natural Gas
Gas Turbine
Marshall 2002 86 25 3%
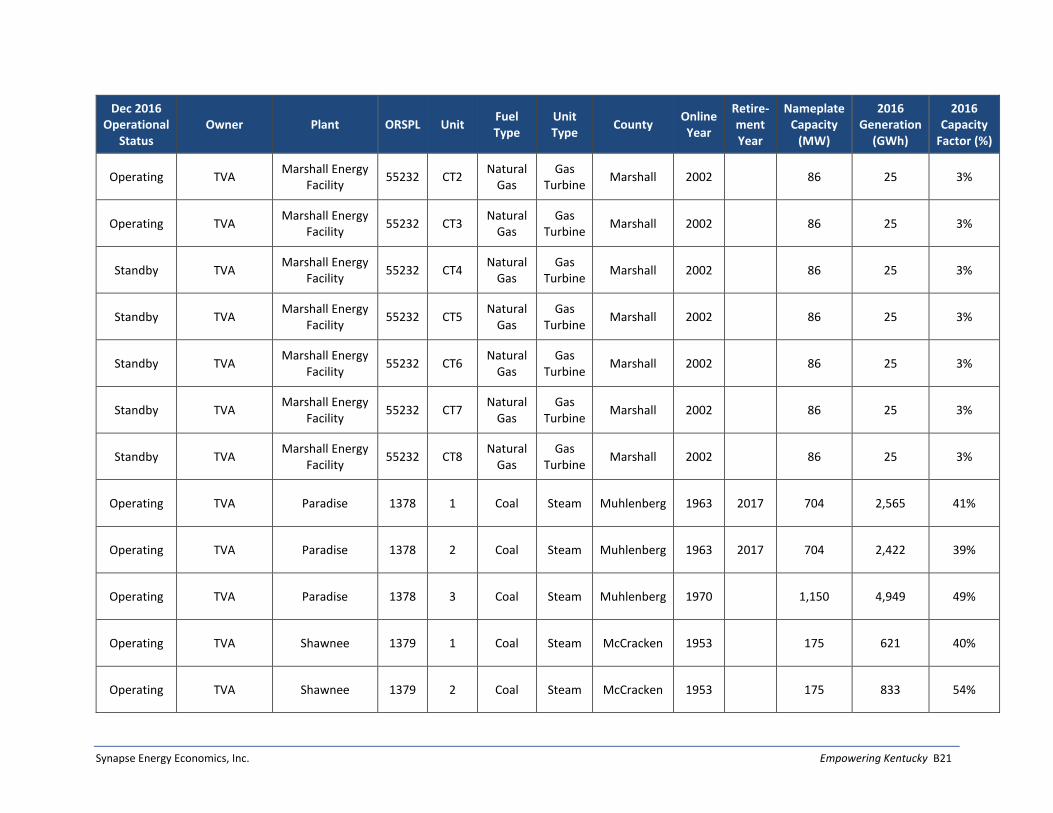
Synapse Energy Economics, Inc. Empowering Kentucky B21
Dec 2016 Operational
Status Owner Plant ORSPL Unit
Fuel Type
Unit Type
County Online Year
Retire-ment Year
Nameplate Capacity
(MW)
2016 Generation
(GWh)
2016 Capacity
Factor (%)
Operating TVA Marshall Energy
Facility 55232 CT2
Natural Gas
Gas Turbine
Marshall 2002 86 25 3%
Operating TVA Marshall Energy
Facility 55232 CT3
Natural Gas
Gas Turbine
Marshall 2002 86 25 3%
Standby TVA Marshall Energy
Facility 55232 CT4
Natural Gas
Gas Turbine
Marshall 2002 86 25 3%
Standby TVA Marshall Energy
Facility 55232 CT5
Natural Gas
Gas Turbine
Marshall 2002 86 25 3%
Standby TVA Marshall Energy
Facility 55232 CT6
Natural Gas
Gas Turbine
Marshall 2002 86 25 3%
Standby TVA Marshall Energy
Facility 55232 CT7
Natural Gas
Gas Turbine
Marshall 2002 86 25 3%
Standby TVA Marshall Energy
Facility 55232 CT8
Natural Gas
Gas Turbine
Marshall 2002 86 25 3%
Operating TVA Paradise 1378 1 Coal Steam Muhlenberg 1963 2017 704 2,565 41%
Operating TVA Paradise 1378 2 Coal Steam Muhlenberg 1963 2017 704 2,422 39%
Operating TVA Paradise 1378 3 Coal Steam Muhlenberg 1970 1,150 4,949 49%
Operating TVA Shawnee 1379 1 Coal Steam McCracken 1953 175 621 40%
Operating TVA Shawnee 1379 2 Coal Steam McCracken 1953 175 833 54%

Synapse Energy Economics, Inc. Empowering Kentucky B22
Dec 2016 Operational
Status Owner Plant ORSPL Unit
Fuel Type
Unit Type
County Online Year
Retire-ment Year
Nameplate Capacity
(MW)
2016 Generation
(GWh)
2016 Capacity
Factor (%)
Operating TVA Shawnee 1379 3 Coal Steam McCracken 1953 175 856 56%
Operating TVA Shawnee 1379 4 Coal Steam McCracken 1954 175 693 45%
Operating TVA Shawnee 1379 5 Coal Steam McCracken 1954 175 828 54%
Operating TVA Shawnee 1379 6 Coal Steam McCracken 1954 175 811 53%
Operating TVA Shawnee 1379 7 Coal Steam McCracken 1954 175 596 39%
Operating TVA Shawnee 1379 8 Coal Steam McCracken 1955 175 691 45%
Operating TVA Shawnee 1379 9 Coal Steam McCracken 1955 175 690 45%
Operating US Army Corps
of Engineers Barkley 1371 1 Hydro Hydro Lyon 1966 33 122 43%
Operating US Army Corps
of Engineers Barkley 1371 2 Hydro Hydro Lyon 1966 33 122 43%
Operating US Army Corps
of Engineers Barkley 1371 3 Hydro Hydro Lyon 1966 33 122 43%
Operating US Army Corps
of Engineers Barkley 1371 4 Hydro Hydro Lyon 1966 33 122 43%
Operating US Army Corps
of Engineers Laurel Dam 6171 1 Hydro Hydro Laurel 1977 70 - -

Synapse Energy Economics, Inc. Empowering Kentucky B23
Dec 2016 Operational
Status Owner Plant ORSPL Unit
Fuel Type
Unit Type
County Online Year
Retire-ment Year
Nameplate Capacity
(MW)
2016 Generation
(GWh)
2016 Capacity
Factor (%)
Operating US Army Corps
of Engineers Wolf Creek 1380 1 Hydro Hydro Russell 1952 45 141 36%
Operating US Army Corps
of Engineers Wolf Creek 1380 2 Hydro Hydro Russell 1952 45 141 36%
Operating US Army Corps
of Engineers Wolf Creek 1380 3 Hydro Hydro Russell 1952 45 141 36%
Operating US Army Corps
of Engineers Wolf Creek 1380 4 Hydro Hydro Russell 1951 45 141 36%
Operating US Army Corps
of Engineers Wolf Creek 1380 5 Hydro Hydro Russell 1951 45 141 36%
Operating US Army Corps
of Engineers Wolf Creek 1380 6 Hydro Hydro Russell 1951 45 141 36%
Table 10. Recently-retired units in Kentucky
Dec 2016 Operational
Status Owner Plant ORSPL Unit
Fuel Type
Unit Type
County Online Year
Retire-ment Year
Nameplate Capacity
(MW)
2016 Generation
(GWh)
2016 Capacity
Factor (%)
Retired DTE Silver Grove LLC
Silver Grove 57955 1 Natural
Gas Gas
Turbine Campbell 2001 2013 5 - -
Retired EKPC Dale 1385 1 Coal Steam Clark 1954 2015 27 - -
Retired EKPC Dale 1385 2 Coal Steam Clark 1954 2015 27 - -

Synapse Energy Economics, Inc. Empowering Kentucky B24
Dec 2016 Operational
Status Owner Plant ORSPL Unit
Fuel Type
Unit Type
County Online Year
Retire-ment Year
Nameplate Capacity
(MW)
2016 Generation
(GWh)
2016 Capacity
Factor (%)
Retired EKPC Dale 1385 3 Coal Steam Clark 1957 2016 81 - -
Retired EKPC Dale 1385 4 Coal Steam Clark 1960 2016 81 - -
Retired EKPC Mason County
LFGTE 56977 1
Landfill Gas
Int. Com-
bustion Mason 2009 2015 2 - -
Retired Kentucky Power Co
Big Sandy 1353 2 Coal Steam Lawrence 1969 2015 816 - -
Retired LG&E/KU Cane Run 1363 4 Coal Steam Jefferson 1962 2015 163 - -
Retired LG&E/KU Cane Run 1363 5 Coal Steam Jefferson 1966 2015 209 - -
Retired LG&E/KU Cane Run 1363 6 Coal Steam Jefferson 1969 2015 272 - -
Retired LG&E/KU Green River 1357 1 Coal Steam Muhlenberg 1950 2003 37.5 - -
Retired LG&E/KU Green River 1357 2 Coal Steam Muhlenberg 1950 2003 37.5 - -
Retired LG&E/KU Green River 1357 3 Coal Steam Muhlenberg 1954 2015 75 - -
Retired LG&E/KU Green River 1357 4 Coal Steam Muhlenberg 1959 2015 114 - -
Retired LG&E/KU Haefling 1358 3 Natural
Gas Gas
Turbine Fayette 1970 2013 21 - -

Synapse Energy Economics, Inc. Empowering Kentucky B25
Dec 2016 Operational
Status Owner Plant ORSPL Unit
Fuel Type
Unit Type
County Online Year
Retire-ment Year
Nameplate Capacity
(MW)
2016 Generation
(GWh)
2016 Capacity
Factor (%)
Retired LG&E/KU Pineville 1360 3 Coal Steam Bell 1951 2002 37.5 - -
Retired LG&E/KU Tyrone 1361 1 Other Steam Woodford 1948 2007 31.2 - -
Retired LG&E/KU Tyrone 1361 2 Other Steam Woodford 1964 2007 31.2 - -
Retired LG&E/KU Tyrone 1361 3 Coal Steam Woodford 1953 2013 75 - -
Retired LG&E/KU Waterside GT 1367 7 Natural
Gas Gas
Turbine Jefferson 1964 2006 20 - -
Retired LG&E/KU Waterside GT 1367 8 Natural
Gas Gas
Turbine Jefferson 1964 2006 25 - -
Retired TVA Shawnee 1379 3 Coal Steam McCracken 1956 2014 175 - -
Table 11. Under construction or proposed units in Kentucky
Dec 2016 Operational
Status Owner Plant ORSPL Unit
Fuel Type
Unit Type
County Online Year
Retire-ment Year
Nameplate Capacity
(MW)
2016 Generation
(GWh)
2016 Capacity
Factor (%)
Under Construction
American Mun Power-Ohio,
Inc
Smithland Hydroelectric
Plant 57400 SG1 Water Hydro Livingston 2017 25 - -
Under Construction
American Mun Power-Ohio,
Inc
Smithland Hydroelectric
Plant 57400 SG2 Water Hydro Livingston 2017 25 - -

Synapse Energy Economics, Inc. Empowering Kentucky B26
Dec 2016 Operational
Status Owner Plant ORSPL Unit
Fuel Type
Unit Type
County Online Year
Retire-ment Year
Nameplate Capacity
(MW)
2016 Generation
(GWh)
2016 Capacity
Factor (%)
Under Construction
American Mun Power-Ohio,
Inc
Smithland Hydroelectric
Plant 57400 SG3 Water Hydro Livingston 2017 25 - -
Proposed Cash Creek Generating
LLC Cash Creek 56107 -
Natural Gas
Com-bined Cycle
Henderson 2019 320 - -
Proposed Cash Creek Generating
LLC Cash Creek 56107 -
Natural Gas
Com-bined Cycle
Henderson 2019 320 - -
Proposed Cash Creek Generating
LLC Cash Creek 56107 -
Natural Gas
Com-bined Cycle
Henderson 2019 187 - -
Proposed EKPC Cooperative
Solar One 60863 PV1 Solar
Photo-voltaic
Unknown 2017 9 - -
Proposed SunCoke
Energy, Inc.
SunCoke Energy South Shore
Facility 60373 SSST6 Coal Steam Greenup 2018 90 - -
Under Construction
TVA Paradise 1378 CTG1 Natural
Gas
Com-bined Cycle
Muhlenberg 2017 231 - -
Under Construction
TVA Paradise 1378 CTG2 Natural
Gas
Com-bined Cycle
Muhlenberg 2017 231 - -
Under Construction
TVA Paradise 1378 CTG3 Natural
Gas
Com-bined Cycle
Muhlenberg 2017 231 - -
Under Construction
TVA Paradise 1378 STG1 Natural
Gas
Com-bined Cycle
Muhlenberg 2017 467 - -

Synapse Energy Economics, Inc. Empowering Kentucky B27
Environmental control retrofits
As a result of EPA regulations unrelated to the Clean Power Plan, it is expected that many coal plants will
be required to install environmental control equipment over the next few years. This equipment
controls air emissions of nitrogen oxides, sulfur dioxide, mercury, and particulates; controls water
withdrawals and overall consumption; and regulates the disposal of coal ash and polluted effluent.
These needed environmental controls are often costly in terms of both capital expenditures and ongoing
maintenance and operation, and as a result, retrofitted coal plants are often dispatched less frequently
or outright retired to avoid expensive upgrades. In futures like the Empower Kentucky Plan where more
renewables and energy efficiency replace coal generation, overall cost savings can be significant when
compared to a Reference case in which installation and operation of these expensive retrofits moves
forward. Table 12 displays the assumptions about what types of upcoming retrofits will be required at
coal units. Table 13 shows how these assumptions get applied to each of Kentucky’s existing coal units—
if plants already have adequate controls, they are not assumed to need new retrofits. Units retiring or
undergoing a fuel conversion are not expected to require new environmental controls.
Table 12. Default environmental retrofit assumptions
Retrofit Controlled Pollutant Year of Installation Control Stringency
Dry FGD Sulfur dioxide (SO2) 2020 -
SCR Nitrogen oxides (NOX) 2021 -
ACI Mercury 2016 -
Baghouse Particulate matter, mercury, SO2, NOX
2025 -
Recirculating cooling
Water withdrawals and consumption
2019 Units withdrawing >125 million gallons per day require control
Coal combustion residuals
Coal ash 2019 Subtitle D (non-hazardous)
Effluent controls Effluent 2019 FGD wastewater and dry fly ash
handling

Synapse Energy Economics. Inc. Empowering Kentucky B28
Table 13. Environmental retrofits assumed for each Kentucky coal unit. Units are given an “existing” designation if the specified control currently exists at the coal unit and is not projected to be added in the future. Units are given a “required” designation if the unit does not currently control for the specified pollutant or does not control for the pollutant to an adequate level.
Owner Plant ORSPL Unit Dry FGD SCR ACI Baghouse Cooling CCR Effluent
Big Rivers Electric Corp
D B Wilson 6823 1 Existing Existing Required Required Existing Required Required
Big Rivers Electric Corp
HMP&L Station Two Henderson
1382 1 Existing Existing Required Required Existing Required Required
Big Rivers Electric Corp
HMP&L Station Two Henderson
1382 2 Existing Existing Required Required Existing Required Required
Big Rivers Electric Corp
Kenneth C Coleman
1381 1 Existing Required Existing Required Required Required Required
Big Rivers Electric Corp
Kenneth C Coleman
1381 2 Existing Required Existing Required Required Required Required
Big Rivers Electric Corp
Kenneth C Coleman
1381 3 Existing Required Existing Required Required Required Required
Big Rivers Electric Corp
R D Green 6639 1 Existing Required Existing Required Existing Required Required
Big Rivers Electric Corp
R D Green 6639 2 Existing Required Existing Required Existing Required Required
City of Owensboro
Elmer Smith 1374 1 Existing Existing Retiring in
2019
Retiring in 2019
Retiring in 2019
Retiring in 2019
Retiring in 2019
City of Owensboro
Elmer Smith 1374 2 Existing Existing Existing Required Required Required Required
Duke East Bend 6018 2 Existing Existing Required Required Existing Required Required
EKPC Cooper 1384 1 Required Required Required Required Required Required Required
EKPC Cooper 1384 2 Existing Existing Required Existing Existing Required Required
EKPC H L Spurlock 6041 1 Existing Existing Required Required Existing Required Required
EKPC H L Spurlock 6041 2 Existing Existing Required Required Existing Required Required

Synapse Energy Economics, Inc. Empowering Kentucky B29
Owner Plant ORSPL Unit Dry FGD SCR ACI Baghouse Cooling CCR Effluent
EKPC H L Spurlock 6041 3 Existing Existing Required Existing Existing Required Required
EKPC H L Spurlock 6041 4 Existing Existing Required Existing Existing Required Required
LG&E/KU E W Brown 1355 1 Existing Required Required Required Existing Required Required
LG&E/KU E W Brown 1355 2 Existing Required Required Required Existing Required Required
LG&E/KU E W Brown 1355 3 Existing Existing Required Required Existing Required Required
LG&E/KU Ghent 1356 1 Existing Existing Required Required Existing Required Required
LG&E/KU Ghent 1356 2 Existing Required Required Required Existing Required Required
LG&E/KU Ghent 1356 3 Existing Existing Required Existing Existing Required Required
LG&E/KU Ghent 1356 4 Existing Existing Required Existing Existing Required Required
LG&E/KU Mill Creek (KY) 1364 1 Existing Required Required Required Required Required Required
LG&E/KU Mill Creek (KY) 1364 2 Existing Required Required Required Existing Required Required
LG&E/KU Mill Creek (KY) 1364 3 Existing Existing Required Required Existing Required Required
LG&E/KU Mill Creek (KY) 1364 4 Existing Existing Required Existing Existing Required Required
LG&E/KU Trimble County 6071 1 Existing Existing Required Existing Existing Required Required
LG&E/KU Trimble County 6071 2 Existing Existing Required Existing Existing Required Required
TVA Paradise 1378 3 Existing Existing Required Required Existing Required Required
TVA Shawnee 1379 1 Required Required Required Existing Required Required Required

Synapse Energy Economics, Inc. Empowering Kentucky B30
Owner Plant ORSPL Unit Dry FGD SCR ACI Baghouse Cooling CCR Effluent
TVA Shawnee 1379 2 Required Required Required Existing Required Required Required
TVA Shawnee 1379 3 Required Required Required Existing Required Required Required
TVA Shawnee 1379 4 Required Required Required Existing Required Required Required
TVA Shawnee 1379 5 Required Required Required Existing Required Required Required
TVA Shawnee 1379 6 Required Required Required Existing Required Required Required
TVA Shawnee 1379 7 Required Required Required Existing Required Required Required
TVA Shawnee 1379 8 Required Required Required Existing Required Required Required
TVA Shawnee 1379 9 Required Required Required Existing Required Required Required

Synapse Energy Economics. Inc. Empowering Kentucky B31
Renewable portfolio standard
In both scenarios, the ReEDS model will build renewables like wind and utility-scale solar in Kentucky or
in other states if it is economic to do so. In the Empower Kentucky, all utilities are required to comply
with a renewable portfolio standard. We model this standard as coming into effect in 2017 and
increasing by about 1.8 percent per year until a level of 25 percent is achieved by 2030, where it is
sustained into the future (see Figure 19). Qualifying resources include new wind, solar, or hydroelectric
generators.39 This standard includes an assumption that 1 percent of sales will come from distributed
solar resources by the year 2030.
Like the renewable portfolio standard policies in place in states around the country, utilities are eligible
to purchase renewable energy credits (RECs) from renewable generators that are either situated in
Kentucky or capable of delivering electricity to Kentucky utilities via a larger balancing authority, as long
as no other utility has already purchased that REC. Because Kentucky is one of the more interconnected
states in the country, it can purchase RECs from Iowa to New Jersey and from Minnesota to Louisiana.
According to this analysis, sixty percent of Kentucky’s RECs in the Empower Kentucky Plan are bought
from wind farms in Iowa, where wind generation is inexpensive, allowing for Kentucky to decrease
nationwide emissions at a low cost to consumers.
In our analysis, we find that by 2030, nearly 2 terawatt hours (TWh) of wind are added in Kentucky as a
result of the renewable portfolio standard policy (equivalent to about 600 MW). At the same time, 1.4
TWh of solar are added, compared to less than 0.1 TWh in the Reference case. This includes 0.8 TWh of
distributed solar (about 600 MW) and 0.6 TWh of utility-scale solar (about 400 MW).
39 In the Empower Kentucky Plan, biomass is not a qualifying resource for the purpose of complying with the RPS; in addition,
biomass is not permitted as a low-carbon or carbon neutral resource.

Synapse Energy Economics, Inc. Empowering Kentucky B32
Figure 19. In-state and out-of-state REC purchases under Kentucky’s RPS in the Empower Kentucky Plan
Clean Power Plan
In the Reference case, we assume that the Clean Power Plan is not in effect. In the Empower Kentucky
Plan, Kentucky and all other states are required to comply with the Clean Power Plan. Compliance with
the Clean Power Plan means that by 2030 states must not emit more CO2 emissions than a level of 32
percent below 2005 CO2 emissions.40 For Kentucky, this means not exceeding 64 million short tons.
Analogous to renewable portfolio standards, Kentucky utilities may either achieve these emission
reductions by reducing output at emitting Kentucky power plants (i.e., purchasing electricity from
cleaner generators) or by purchasing CO2 emissions allowances from other states (i.e., effectively paying
for the “right to pollute” a single ton of CO2). The Clean Power Plan comes into effect in 2022 and
continues throughout the study period. The Clean Power Plan is split up into four compliance periods in
which the total number of allowed CO2 emissions is ratcheted down.
Compliance with the Clean Power Plan is modeled as achievement of the state-level mass-based targets
including estimated emissions from new sources (the “new source complement”). We assume that
emission allowances are traded both within and across state borders among two separate groups of
states: (1) the nine states that currently trade CO2 emissions under the Regional Greenhouse Gas
Initiative (RGGI) and (2) all other states modeled. The price of CO2 allowances under the Clean Power
Plan is set endogenously within the model as a shadow price.
40 2005 is the year by which the goal is theoretically set, but progress is actually benchmarked against a “starting year” of 2012.
Synapse Energy Economics, 2017

Synapse Energy Economics, Inc. Empowering Kentucky B33
Allowance allocation
Under the Clean Power Plan, states are given a set number of allowances that they may distribute to in-
state generators. For Kentucky, allowances equal a level of 77 million short tons in 2022 and decrease to
64 million short tons starting in in 2030. States may choose to distribute these allowances through a
number of options, including “free” allocation (in which the allowances may be distributed, for free, to
all generators based on their output in previous years) or auctioned allocation (in which generators pay
into a pool to purchase allowances from the state). If generators wish to emit more than they are
allotted under their distributed allowances, they will need to purchase allowances from other
generators, either in-state or from other states.
In existing carbon trading systems, such as RGGI, proceeds from allowance auctions are recirculated to
the electric system. Each state deals with this recirculation differently: some states place an emphasis on
funding energy efficiency or renewables, while other states provide a rebate to customers, with a focus
on low-income ratepayers. Another option (not in place in RGGI) would be to refund auction proceeds
to the generators themselves. For any approach, if auction proceeds are wholly refunded to the electric
system the program will appear, from a ratepayer perspective, to have the same cost as participating in
free allocation.41 In this analysis, we do not make an explicit determination on which approach—free
allocation or auctions with 100 percent cost recirculation—is used; we do, however, assume that costs
are incurred by power plants that purchase allowances—and their utility ratepayers—and that the
revenue from sold allowances help to offset other ratepayer electric costs.
Clean Energy Incentive Program
As part of the Clean Power Plan, all states may participate in the Clean Energy Incentive Program (CEIP).
The CEIP rewards early implementation of energy efficiency measures in low-income households or
businesses and early implementation of solar and wind projects. Under the CEIP, these two types of
projects are awarded emission allowances (which program administrators and developers can then
resell to generate revenue) from two separate pools:
1. State pool: Each state may award allowances to early-acting low-income energy efficiency and renewable energy projects, up to the limit of the number of allowances each state is awarded under the Clean Power Plan in the first compliance period of 2022-2024. For Kentucky, this means that there are, in theory, 231 million emission allowances available.
2. Federal pool: EPA will match each emissions allowance distributed by the state up to a set level. For Kentucky, there are 15 million allowances available for distribution from EPA. These 15 million allowances are subdivided into two equal pools—one for low-income energy efficiency programs and one for renewable energy projects.
41 Ratepayers may, however, see increased or decreased costs associated with switching to lower-carbon electricity resources.

Synapse Energy Economics, Inc. Empowering Kentucky B34
Under the CEIP, low-income programs receive twice as much credit as renewable energy projects.
Despite these incentives, and despite the incentives put in place under the Empower Kentucky Plan, only
a fraction of the allowances available under the CEIP are distributed to Kentucky.42 For low-income
programs, a total of 2 million allowances are distributed: 1 million each under the state and federal
pools. For renewable energy projects, a total of 0.2 million allowances are distributed, also split equally
between the state and federal pools. Collectively, this means that just 8 percent of the total available
allowances in Kentucky’s federal pool are distributed and that just 0.5 percent of the total available
allowances in Kentucky’s state pool are distributed. Because of these low levels and the relative ease of
compliance nationwide (with respect to the Reference case) in the first compliance period, it is unlikely
these allowances will be worth a substantial value individually. As such, they likely will not significantly
impact the overall implementation costs of low-income energy efficiency programs or renewable energy
projects.
CO2 price adder
In addition to the Clean Power Plan, a key part of the Empower Kentucky Plan is the enactment of an in-
state carbon price. This carbon adder is a cost paid by Kentucky utilities above and beyond any costs
they incur from purchasing allowances to meet compliance under the Clean Power Plan. In this scenario,
we assume that a $1 per short ton adder comes into effect in 2018 and increases gradually until it
reaches $3 per short ton in 2030, where it is sustained into the future.43 We assume that this price is
applied to both in-state emitting power plants and to electricity imports into Kentucky (where imports
are priced according to the CO2 emissions rate of their originating state). We also exclude biomass from
consideration as a low-carbon or carbon neutral resource.
Unlike the Clean Power Plan, this policy is not a cap on emissions that results in a CO2 price. Instead, it is
an explicit price on CO2 emissions that makes emitting plants more costly to operate and drives down
total emissions.
As with the cost impacts associated the Clean Power Plan, we assume that costs associated with the
Kentucky-specific CO2 price adder are recirculated to electric ratepayers. However, we assume that 20
percent of the costs generated from the CO2 price adder are removed from the electric sector and used
to fund a just transition for Kentucky workers. Initiatives would include job training and education;
financial support for affected workers and communities; local infrastructure and job creation initiatives;
42 We assume low-income programs in Kentucky to make up 18 percent of all energy efficiency savings in a given year.
43 During this analysis, we found that increasing energy efficiency and implementing an RPS policy alone were not enough to
reduce Kentucky’s CO2 emissions to meet its target under the Clean Power Plan. Instead, Kentucky utilities achieve compliance through a combination of in-state reductions and allowance purchases. Furthermore, this early iteration did not generate revenue to support just transition efforts. We therefore examined an array of CO2 price scenarios and selected the level that achieved KFTC goals for pollution reductions while not accelerating the build out of a new natural gas infrastructure.

Synapse Energy Economics, Inc. Empowering Kentucky B35
and support for local innovation and entrepreneurship.44 From 2018 to 2032, the Empower Kentucky
Plan creates $387 million to support a just transition for Kentucky’s coal workers and communities.
44 To learn more about KFTC’s plan for a just transition for the state’s coal workers, and economy as a whole, see:
https://www.kftc.org/sites/default/files/docs/resources/kftcs_just_transition_framework.pdf