Employment Situation ofEmployment Situation of …10.3 11.5 10 12 Men Women 8.1 8.0 7.8 6 8 4 0 2...
21
Employment Situation of Employment Situation of Veterans 2009 Submitted with the Statement of Philip L Rones Philip L. Rones Deputy Commissioner Bureau of Labor Statistics bf h before the Subcommittee on Economic Opportunity of the House Committee on Veterans’ Affairs April 15, 2010 Statement available online at Statement available online at http://www.bls.gov/cps/demographics.htm#vets
Transcript of Employment Situation ofEmployment Situation of …10.3 11.5 10 12 Men Women 8.1 8.0 7.8 6 8 4 0 2...

Employment Situation ofEmployment Situation of Veterans 2009
Submitted with the Statement of
Philip L RonesPhilip L. RonesDeputy Commissioner
Bureau of Labor Statistics
b f hbefore theSubcommittee on Economic Opportunity
of the House Committee on Veterans’ Affairs
April 15, 2010
Statement available online atStatement available online athttp://www.bls.gov/cps/demographics.htm#vets

Where do the data come from?
The data are collected as part of the Current Population The data are collected as part of the Current Population Survey (CPS). The CPS is a monthly survey of about 60,000 households.
The CPS is a joint program between the Bureau of Labor Statistics (BLS) and the Census Bureau.
It is the source of civilian employment and unemployment data, including the nationalunemployment data, including the national unemployment rate.
Q ti i l d d i th th t id tif Questions are included in the survey that identify veterans and their period of service (when they served).
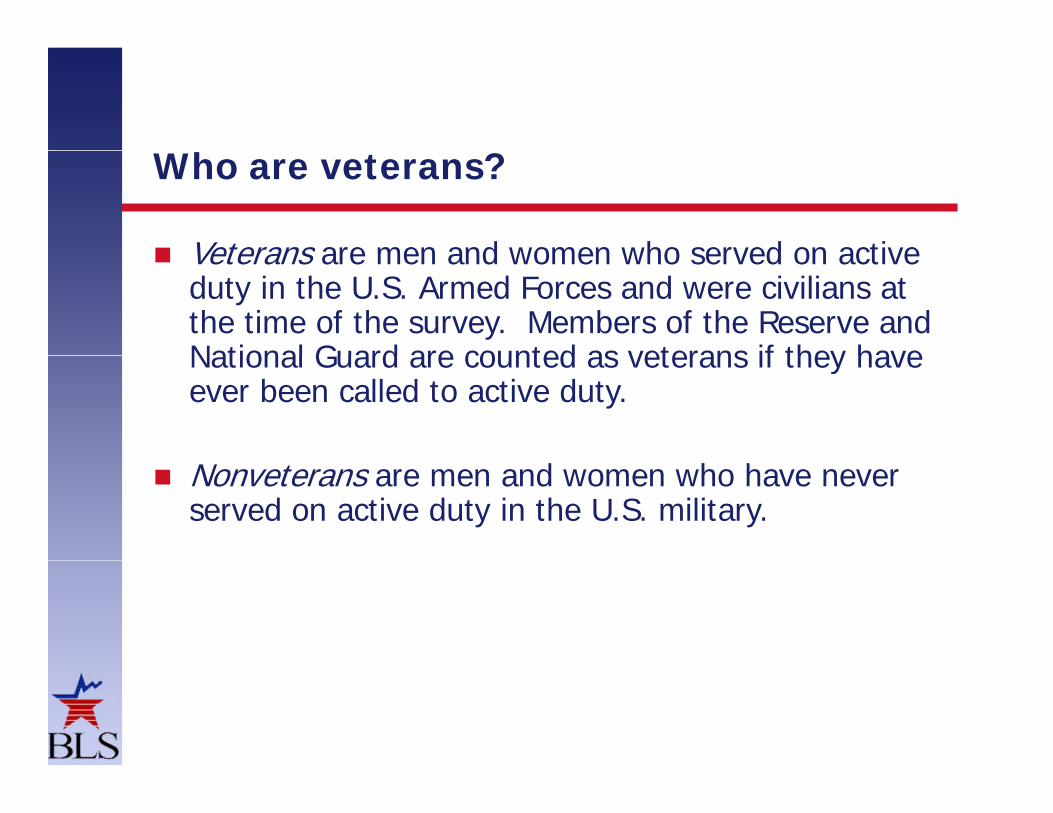
Who are veterans?
Veterans are men and women who served on active Veterans are men and women who served on active duty in the U.S. Armed Forces and were civilians at the time of the survey. Members of the Reserve and National Guard are counted as veterans if they haveNational Guard are counted as veterans if they have ever been called to active duty.
Nonveterans are men and women who have never served on active duty in the U.S. military.

Periods of Service
Labor force statistics are available by these periods of Labor force statistics are available by these periods of service:
Gulf War era II = Sept. 2001- present Gulf War era I = Aug. 1990 - Aug. 2001Vietnam era = Aug. 1964 - April 1975Korean War = July 1950 - Jan 1955Korean War July 1950 Jan. 1955World War II = Dec. 1941- Dec. 1946Other service periods = All other time periods
“Other service periods” are the dates between war periods:May 1975 - July 1990, Jan. 1947 - June 1950,Feb. 1955 - July 1964, Nov. 1941 or earlier
NOTE: The CPS monthly survey does not identify where a veteran served.

Data on veterans are available monthly from the Current Population Survey (CPS)
Veterans data are published monthly in the Veterans data are published monthly in the Employment Situation news release.
Additional tables are available from BLS on topics such pas:
Age, sex, race, and Hispanic ethnicity
Occupation and industry
Full or part-time status Full or part time status
Class of worker (private, government, self-employed, unpaid family worker)
Duration of unemployment

Additional data are available from the veterans supplement
Collected every 2 years since 1985; conducted Collected every 2 years since 1985; conducted annually beginning in 2009. (August 2009, July 2010, August 2011, August 2012).
Co-sponsored by the Veterans’ Employment and Training Service (VETS) and the Department of Veterans Affairs (VA). ( )
Provides additional information about veterans such as presence and rating of service-connectedas presence and rating of service connected disability, Reserve or National Guard status, and service in a combat or war zone.

E l Si i f VEmployment Situation of Veterans
Characteristics of veterans

Chart 1. Of the 22 million veterans, the largest group is from WWII Korean War and Vietnam era
Gulf War-era II
group is from WWII, Korean War, and Vietnam era
veterans (8.7%)
Gulf War-era I veterans (13 1%)
Other service periods (26.8%)
veterans (13.1%)
WWII, Korean War, and Vietnam-era veterans (51.3%)veterans (51.3%)
NOTE: Gulf War-era II veterans served anywhere on active duty since September 2001. Gulf War-era I veterans served anywhere between August 1990 and August 2001.
SOURCE: Bureau of Labor Statistics, Current Population Survey, annual averages 2009

Chart 2. Most veterans are men
Percent of total
8 3
1890
100
WomenMen
56
60
70
80
92 97
82
30
40
50
44
0
10
20
30
0
Veterans WWII, Korean War,and Vietnam era
Gulf War-era IIveterans
Nonveterans
SOURCE: Bureau of Labor Statistics, Current Population Survey, annual averages 2009
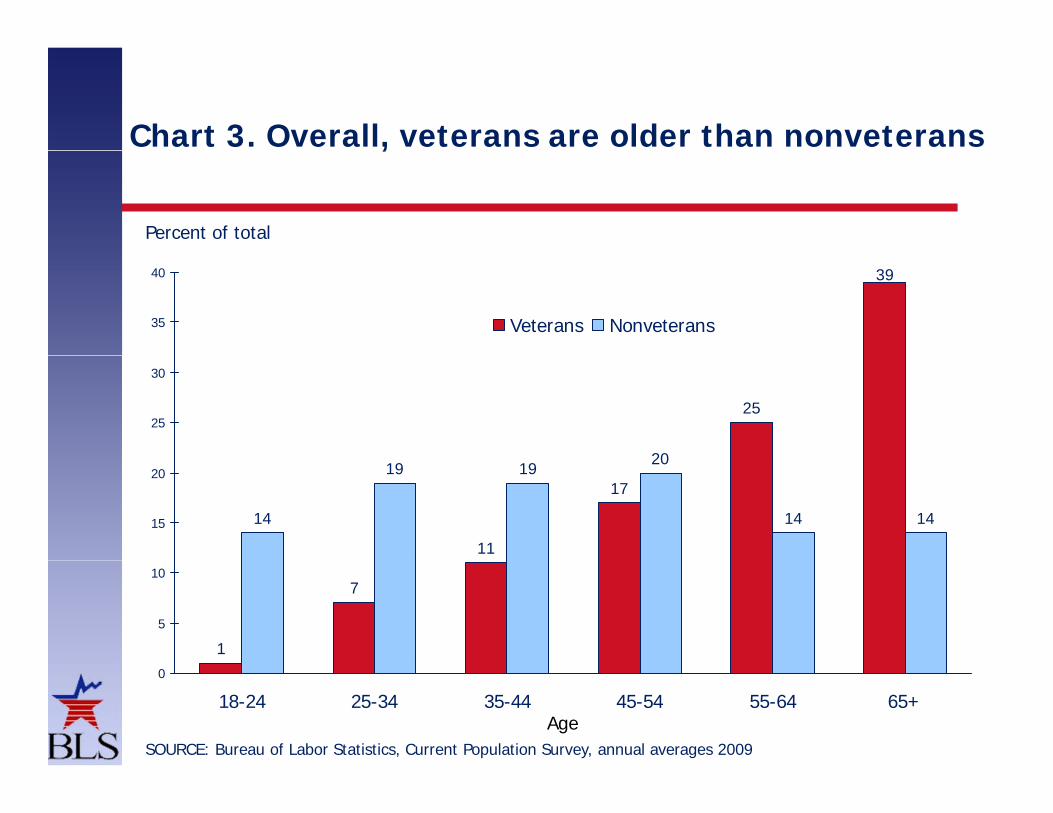
Chart 3. Overall, veterans are older than nonveterans,
Percent of total
39
35
40
Veterans Nonveterans
25
20
25
30
11
17
14
19 1920
14 1415
20
1
7
5
10
0
18-24 25-34 35-44 45-54 55-64 65+
SOURCE: Bureau of Labor Statistics, Current Population Survey, annual averages 2009
Age

Chart 4. Most Gulf War-era II veterans are under 35 years old35 years old
Percent of total
49
45
50
55
Gulf War-era II veterans
Nonveterans
30
35
40
45
16 161514
19 19 20
14 14
20
25
30
4
0
14 14 14
5
10
15
0
18-24 25-34 35-44 45-54 55-64 65+
SOURCE: Bureau of Labor Statistics, Current Population Survey, annual averages 2009
Age
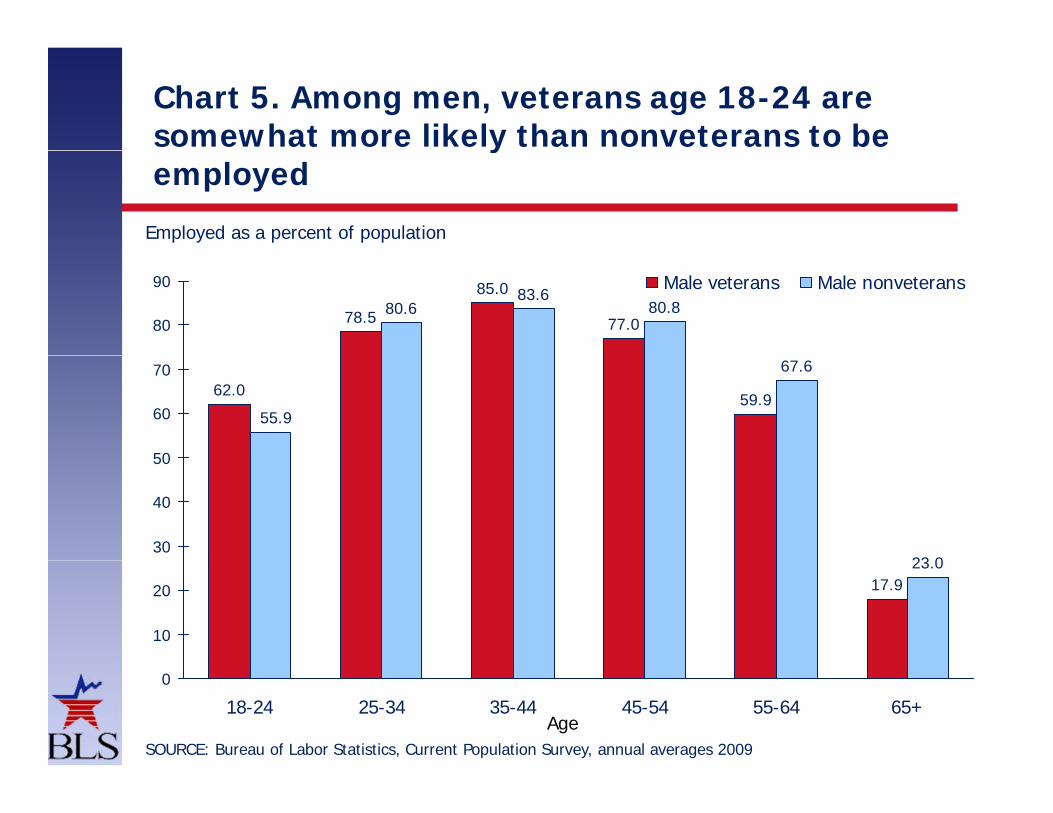
Chart 5. Among men, veterans age 18-24 are somewhat more likely than nonveterans to be yemployed
Employed as a percent of population
78.5
85.0
77.080.6
83.680.8
80
90 Male veterans Male nonveterans
62.059.9
67.6
55.9
50
60
70
23 030
40
50
17.923.0
10
20
0
18-24 25-34 35-44 45-54 55-64 65+
SOURCE: Bureau of Labor Statistics, Current Population Survey, annual averages 2009
Age

Chart 6. Women of similar ages are employed at about the same ratesabout the same rates
Employed as a percent of population
66.5
75.2 74.3
68.6 70.4 71.470
80Female veterans Female nonveterans
55.8 53.956.455.4
50
60
30
40
9.512.8
10
20
0
18-24 25-34 35-44 45-54 55-64 65+
SOURCE: Bureau of Labor Statistics, Current Population Survey, annual averages 2009
Age

Chart 7. WWII, Korean War, and Vietnam-era veterans tend to have lower employment rates, p y ,largely reflecting their age
Employed as a percent of population
75.081.0
70
80
90
50.155.1
50
60
70
35.4
20
30
40
0
10
Veterans, all Gulf War era II Gulf War era I WWII, Korean Other serviceservice periods War, and Vietnam
eraperiods
SOURCE: Bureau of Labor Statistics, Current Population Survey, annual averages 2009

Chart 8. Employment varies little by combat statusp y y
Employed as a percent of population
75.080.1
75.0
83.2
80
90Combat veterans Noncombat veterans
43.9
51.451.455.2
50
60
70
29.1
36.1
20
30
40
0
10
Veterans, all Gulf War era II Gulf War era I WWII, Korean Other serviceservice periods War, and Vietnam
eraperiods
NOTE: Combat or war zone status was not reported for about 1 in 6 veterans.
SOURCE: Bureau of Labor Statistics, Current Population Survey, annual averages 2009

Chart 9. Male veterans and female veterans have similar unemployment rates by period of servicesimilar unemployment rates by period of service
Unemployment rate
9.910.3
11.5
10
12 Men Women
8.1 8.0 7.8
6
8
4
6
0
2
Veterans Gulf War-era II veterans NonveteransNOTE: The unemployment rates of male and female Gulf War-era II veterans are similar. The unemployment rate for female Gulf War-era II veterans is based on a relatively small sample. Small samples have large standard errors.
SOURCE: Bureau of Labor Statistics, Current Population Survey, annual averages 2009

Chart 10. Among veterans who served sometime since August 1990, there is little difference in the unemployment rates of those with or without a
Unemployment rate
unemployment rates of those with or without a service-connected disability
10.4
9 1
11.4
9 19.710
12
9.1 9.1
6
8
4
6
0
2
Disabled, total Less than 30 30 to 50 percent 60 percent or Not disabled,percent disabled
pdisabled
phigher disabled
Service-connected disability status
SOURCE: Bureau of Labor Statistics, Current Population Survey, August 2009 veterans supplement

Chart 11. Among veterans who served sometime since August 1990, those with a service-connected disability are less likely to be employed than those
Employed as a percent of population
disability are less likely to be employed than those without a service-connected disability
70.7
77.3 75.781.9
70
80
90
55.8
50
60
70
20
30
40
0
10
Disabled, total Less than 30 30 to 50 percent 60 percent or Not disabled,percent disabled
pdisabled
phigher disabled
Service-connected disability status
SOURCE: Bureau of Labor Statistics, Current Population Survey, August 2009 veterans supplement

Chart 12. 1 of 5 employed disabled veterans works for the Federal governmentworks for the Federal government
Percent of employed
12.2 13.812.4
8.1 9.8 6.6
80
100Other workers
State and local government workers
7.6 19.9
60
Federal government workers
Private l l
2.1
77.568.9
61.1
40
nonagricultural wage and salary workers
0
20
Nonveterans Nondisabled veterans Disabled veterans
NOTE: “Other workers” includes persons employed in agriculture, the unincorporated self-employed, and unpaid family workers. Totals may not add to 100 percent because of rounding. SOURCE: Bureau of Labor Statistics, Current Population Survey, August 2009 veterans supplement

Chart 13. Current or past members of the Reserve or National Guard have higher employment rates and lower unemployment rates than veterans who neverlower unemployment rates than veterans who never were members of the Reserve or National Guard
Gulf War-era II veterans, Gulf War-era II veterans,
100
August 2009
Employed as a percent of population
August 2009
13 816
Unemployment rate
77.2 73.2
60
8010.6
13.8
10121416
20
40
2468
0Current or past member of the
Reserve or National Guard
Never a member of the Reserve or National Guard
02
Current or past member of the
Reserve or National Guard
Never a member of the Reserve or National Guard
SOURCE: Bureau of Labor Statistics, Current Population Survey, August 2009 veterans supplement
National Guard National Guard
Further information is available at:
http://www bls gov/cps/demographics htm#vetshttp://www.bls.gov/cps/demographics.htm#vets
or by calling (202) 691-6378