
Employment Land Review 2011 - 2031 - … · supply in the City and wider PUA going forward and...
115
Plymouth City Council Employment Land Review 2011 - 2031 March 2015
Transcript of Employment Land Review 2011 - 2031 - … · supply in the City and wider PUA going forward and...

Plymouth City Council
Employment Land Review 2011 - 2031March 2015

Ove Arup & Partners Ltd
63 St Thomas St
Bristol
BS1 6JZ
www.arup.com

Plymouth City Council Employment Land Review 2011-2031
| Final | March 2015
Contents
Page
1 Introduction 1
1.1 Purpose of the 2014 Employment Land Review 1 1.2 Structure of the ELR 1
2 Employment Land Review Approach & Parameters 3
2.1 Policy & Guidance for ELR’s 3 2.2 2014 ELR approach & methodology 6 2.3 Defining the study area 8 2.4 Neighbouring authority’s ELRs 9 2.5 Economic Sectors 13 2.6 Sub-division of Plymouth for land supply monitoring
purposes. 14 2.7 Consultation 15
3 Property Market & Socio-economic Context 17
3.1 National Policy 17 3.2 Local Policy & Economic Strategy 18 3.3 Historic inward investment enquiry data 23 3.4 Local Economic Strategy Influences 24 3.5 The spatial requirements of priority economic sectors 27 3.6 Market Signals: Views of Property Agents 31 3.7 Market Signals: ELR Monitoring Information 34 3.8 Economic Strategy & Market Signals: summary 37
4 Forecasting future employment space requirements 39
4.1 Overview 39 4.2 Approach 39 4.3 Low employment growth scenario 45 4.4 Medium employment growth scenario 47 4.5 High employment growth scenario (Pattern 1) 49 4.6 High employment growth scenario (Pattern 2) 51 4.7 Implications for employment space 53 4.8 Summary 54
5 Supply of Employment Land 56
5.2 Estimated quantity of employment land 2014 58 5.3 Distribution of employment land across the City 60 5.4 Quality of existing employment land supply 62 5.5 Summary 66

Plymouth City Council Employment Land Review 2011-2031
| Final | March 2015
6 Recommendations 68
6.1 Drivers of Change 68 6.2 Matching demand with land supply 69 6.3 Capitalising on City Deal & LEP funding 72 6.4 Further analysis of windfall 73 6.5 Safeguarding sites for priority sector use 73 6.6 Intermodal freight & alternatives to highway-based
distribution 74 6.7 The Role of the LAA in Employment Site Allocation 76 6.8 Data collation for ELR monitoring 77
Appendix A
Plymouth Study Area
Appendix B
SIC Codes
Appendix C
Employment Land Sub-Areas
Appendix D
Inward Investment Enquiries
Appendix E
Call for Sites
Appendix F
Schedule of Sites 2014
Appendix G
Employment Land Supply Map
Appendix H
PIMTP Sites Map

Plymouth City Council Employment Land Review 2011-2031
| Final | March 2015 Page 1
1 Introduction
1.1 Purpose of the 2014 Employment Land Review An Employment Land Review (ELR) was last prepared for Plymouth City Council 2006 to inform the preparation of the Local Development Framework. The Core Strategy (adopted April 2007) set out an aim to unlock Plymouth’s potential and undertake sustained economic improvement, in order for the city to become the economic hub of the far South West. In order to facilitate substantial growth in the number of jobs and foster growth of economic sectors, the Core Strategy made an allowance for 84ha of land within the urban area of Plymouth.
During the period since the Core Strategy was adopted, the UK’s economic output peaked in the first quarter of 2008, but the global financial crisis then resulted in the longest and deepest recession since comparable records began in the 1950s. Even within these challenging circumstances, the development of employment premises within the City has continued, although the city has not been immune to the impacts of recession.
Looking ahead, the preparation of the Plymouth Plan is being undertaken during a period of greater optimism around the growth prospects of the UK and Plymouth specifically. The British Chamber of Commerce expects the national economy to surpass the previous 2008 peak during 2014, while acknowledging that there remain longer-term problems and advising that re-balancing of the economy is critical.
Plymouth City Council remains ambitious about delivering economic transformation and is planning for housing and employment development on the basis of strong economic growth forecasts. Within this context, this ELR update seeks to inform preparation of the Plymouth Plan by undertaking the following principal roles:
firstly, present projections for economic and employment growth andtranslate these into employment land requirements for the period 2011-31;
secondly, establish the current availability of employment land andundertake an appraisal of the prospects of these sites coming forward fordevelopment; and
finally, set out recommendations on the safeguarding of employment landand potential designation of new employment land, taking into account theinformation derived above, together with appreciation of other driverssuch as the refreshed Local Economic Strategy and the commercialdevelopments and planned investments underpinned by the Plymouth andSouth West Peninsula City Deal.
1.2 Structure of the ELR This ELR is organised into five main sections:
Chapter 2 ‘ELR approach and parameters’ sets out policy and guidanceinforming the study, defines the study area and parameters for the ELRupdate, and provides an overview of the methodology followed.

Plymouth City Council Employment Land Review 2011-2031
| Final | March 2015 Page 2
Chapter 3 ‘Property market and socio-economic context’ investigates theoverall economic strategy for the study area and trends in employmentland investment and development since the adoption of the Plymouth CoreStrategy in 2007.
Chapter 4 ‘Forecasting future requirements for employment space’ sets outthe results of economic forecasting and translates this into projectedemployment land requirements. It also includes commentary onanticipated employment land demand for key sectors and the advice ofland agents on market signals and potential priority areas.
Chapter 5 ‘Supply of employment land’ identifies the current supply ofemployment land within the City and analyses its distribution and quality.
Chapter 6 ‘Recommendations’ draws together the information fromprevious chapters, sets out the results of the balancing of the need and landsupply in the City and wider PUA going forward and offers somerecommendations on further feasibility work to facilitate delivery of sites.

Plymouth City Council Employment Land Review 2011-2031
| Final | March 2015 Page 3
2 Employment Land Review Approach & Parameters
2.1 Policy & Guidance for ELR’s
2.1.1 National Planning Policy Framework
Building a strong, competitive economy
The National Planning Policy Framework (NPPF, March 2012) emphasises the weight to be given to planning for economic development (para. 20):
“Planning should operate to encourage and not act as an impediment to sustainable growth. Therefore significant weight should be placed on the need to support economic growth through the planning system.”
More specific guidance on factors to be considered when undertaking an ELR and the nature of ELR outputs are provided at paragraph 21 of NPPF:
“In drawing up Local Plans, local planning authorities should:
Set out a clear economic vision and strategy for the area which positively andproactively encourages sustainable economic growth. – In the Plymouthcontext this vision statement would be heavily informed by the recentlyrefreshed Local Economic Strategy, as well the findings of this ELR.
Set criteria, or identify strategic sites, for local and inward investment tomatch the strategy and to meet anticipated needs over the plan period.
Support existing business sectors, taking account of whether they areexpanding or contracting and, where possible, identify and plan for new oremerging sectors likely to locate in their area. Policies should be flexibleenough to accommodate needs not anticipated in the plan and to allow a rapidresponse to changes in economic circumstances. PCC could, for instance,consider the allocation of new sites that are flexible in terms of usage and/orcontingency allocations.
Plan positively for the location, promotion and expansion of clusters ornetworks of knowledge driven, creative or high technology industries.
Identify priority areas for economic regeneration, infrastructure provision andenvironmental enhancement. PCC has been very pro-active in this respect inthe past, developing and adopting a series of Area Action Plans (AAP’s)within the Local Development Framework. The focus for the Plymouth Planis expected to remain on the areas identified through the AAP’s
Facilitate flexible working practices such as the integration of residential andcommercial uses within the same site. The NPPF uses the example of live-work accommodation, but other forms of mixed-use development could beexplored. Investment enquiries to PCC over the last decade suggest that theremay be a pent up demand for smaller units.
And finally, Councils are urged to be flexible and responsive to “market signals” (para. 22):

Plymouth City Council Employment Land Review 2011-2031
| Final | March 2015 Page 4
“Planning policies should avoid the long term protection of sites allocated for employment use where there is no reasonable prospect of a site being used for that purpose. Land allocations should be regularly reviewed.”
It is the role of the employment land review process to consider why long-standing employment allocations have not come forward and if so, whether a flexible approach to development on these sites would be more appropriate. This this will be one of the main purposes of the Land Availability Assessment that will follow this report in due course.
Plan-making
The importance of engagement with the Local Enterprise Partnership (LEP), neighbouring authorities and the business community is emphasised in the NPPF (paragraphs 155 and 160):
“Early and meaningful engagement and collaboration with neighbourhoods, local organisations and businesses is essential.”
“LPAs should have a clear understanding of business needs within the economic markets operating in and across their area. To achieve this, they should:
work together with county and neighbouring authorities and with LEPs toprepare and maintain a robust evidence base to understand both existingbusiness needs and likely changes in the market; and
work closely with the business community to understand their changingneeds and identify and address barriers to investment…”
The scope of consultation undertaken for the 2014 ELR, which relates to the wider engagement undertaken for the refresh of the Local Economic Strategy and the progression of the City Deal, is set out at section 2.7.
ELR guidance is set out at para.161 of the NPPF, including the fundamental requirements of a study at bullet 2 (underlined here):
“Local planning authorities should use this evidence base to assess:
the needs for land or floorspace for economic development, including boththe quantitative and qualitative needs for all foreseeable types of economicactivity over the plan period, including for retail and leisure development;
the existing and future supply of land available for economic developmentand its sufficiency and suitability to meet the identified needs. Reviews ofland available for economic development should be undertaken at thesame time as, or combined with, Strategic Housing Land AvailabilityAssessments and should include a reappraisal of the suitability ofpreviously allocated land;
locations of deprivation which may benefit from planned remedial action;and
the needs of the food production industry and any barriers to investmentthat planning can resolve.”
Elements of NPPF policy are repeated where helpful and for emphasis throughout this study.

Plymouth City Council Employment Land Review 2011-2031
| Final | March 2015 Page 5
2.1.2 National guidance
The online National Planning Practice Guidance, published by the DCLG on the 6th March 2014, superseded previous planning guidance for a number of subjects, including ELRs. The section ‘Assessment of housing and economic development needs’ sets out criteria for the review of employment land. The following guidance is provided:
“Needs for all land uses should address both the total number of homes or quantity of economic development floorspace needed based on quantitative assessments, but also on an understanding of the qualitative requirements of each market segment.” – Section 3.2 of this report considers Economic Strategy factors influencing employment land policy, while the appraisal of sites takes into account qualitative as well as quantitative factors.
The consideration of scenarios is also encouraged: “Assessing development needs should be proportionate and does not require local councils to consider purely hypothetical future scenarios, only future scenarios that could be reasonably expected to occur.”
Within this study a range of economic forecasts are presented to enable the consideration of different growth scenarios (see Chapter 4).
The online guidance sets out work stages which remain broadly aligned with those of the earlier ODPM guidance. These can be summarised as:
Stage A - define the functional economic market area – see section 2.3. Stage B – assess the current situation: recent patterns of employment land
supply and loss to other uses; market intelligence; market signals; public information on land and premises requirements; information on constraints (e.g. infrastructure); the locational and premises requirements of particular types of businesses; and identification of oversupply and evidence of market failure.
Stage C – forecast future trends: develop an idea of future needs based on a range of data; market segments should be identified; a gap analysis of land provision should be undertaken.
Stage D – core outputs: plan makers should set out clear conclusions and any assumptions made in reaching these conclusions on the level of quantitative and qualitative predicted need.
The National Planning Practice Guidance superseded the publication ‘Planning – Employment Land Reviews: Guidance Note’ (ODPM, Dec 2004) which provided guidance on undertaking ELRs. The 2004 guidance recommends a three stage approach:
Taking stock of the existing situation;
Creating a picture of new requirements; and
Identifying a ‘new’ portfolio of sites.
The following section sets out the methodology for the study based on the NPPF, NPPG and elements of the 2004 guidance which fit within the more recent policy and guidance framework.

Plymouth City Council Employment Land Review 2011-2031
| Final | March 2015 Page 6
2.2 2014 ELR approach & methodology The ELR for the 2011-2031 period has been undertaken following the process illustrated in the diagram below. Further insight into the detail of the methodology is set out in the relevant section of this report. Tasks involving consultation with stakeholders are highlighted within the diagram.
Figure 1 - Summary of ELR approach and steps
Step 1: agree ELR approach and parameters
Define a study area for ELR and commence engagement with neighbouring authorities
Confirm employment sectors and use of Standard Industrial Classification Codes
Define main employment areas within Plymouth
Review of investment queries received by PCC since 2002
Launch of ELR survey and ‘Call for Sites’
Review of Local Development Framework allocations and ELR monitoring
Step 2: developing an understanding of current
socio-economic context and the market drivers
Review refreshed local economic strategy & associated evidence

Plymouth City Council Employment Land Review 2011-2031
| Final | March 2015 Page 7
Create a schedule of existing employment land sites based on 2006 ELR; Plymouth CC Employment Land Survey, Planning Permissions, Plan Allocations & ‘Call for
Undertake appraisal of existing sites and review overall quantity and quality of supply within Plymouth and the PUA
Step 3: creating a picture of future requirements Review the spatial characteristics and
locational preferences of priority economic sectors for Plymouth
Undertake semi-structured interviews with business representatives and property agents to gain their insight on employment land supply and demand factors.
Step 5: recommendations on updating the portfolio of
employment sites and identifying a preferred
strategy
Provide comparison of employment land supply and projected demand and draw on analysis at steps 2, 3 and 4 to set out factors to be considered by the Council
Provide an appraisal of employment site options and identify a preferred strategy for the plan period
Key stakeholder presentation of draft findings, discussion and review
Utilise alternative job growth forecasts for the period to 2031 to establish employment land requirements
Step 4: identify the supply of employment land

Plymouth City Council Employment Land Review 2011-2031
| Final | March 2015 Page 8
2.3 Defining the study area An important early step for the ELR update has been the definition of an effective study area to create a clear picture of the future employment land needs of the City. The previous ELR (2006) used the Travel to Work Area (TTWA) as the study area. Whilst the administrative area of Plymouth does play an important role as the principal economic driver across the TTWA its influence varies greatly across different geographies within the TTWA. Therefore, it was decided that a new study area should be defined for the purposes of this ELR employment land review.
2.3.1 National Guidance
In order to inform the decision on a study area we initially considered the online planning practice guidance from DCLG. The guidance on housing and economic land availability assessments states that:
“…since patterns of economic activity vary from place to place, there is no standard approach to defining a functional economic market area, however, it is possible to define them taking account of factors including:
extent of any Local Enterprise Partnership within the area;
travel to work areas;
housing market area;
flow of goods, services and information within the local economy;
service market for consumers;
administrative area; and
transport network.
We have used this broad ranging definition which allows for a great level of flexibility at the sub regional or city region level.
2.3.2 Agreeing the ELR study area
Following a brief review of existing evidence base documents prepared for PCC, and considering the factors listed above, it was agreed with the Council that the administrative area of the City would be the most suitable boundary for the purposes of forecasting the job growth and resultant employment land requirements to 2031. This geography, in economic forecasting terms, aligns with the sub geography boundaries used to underpin the demographic forecasts underpinning the Plymouth Strategic Housing Market Needs Assessment (GVA/Edge Analytics July 2013). The study area is set out in Appendix A of this report.
With regards to defining the study area in terms of the potential supply of employment land it was agreed with the Council that the Plymouth Principal Urban Area (PPUA) should be considered as it better represents the functional economic area of the City as much of the recent B2 and B8 investment in the area has focussed on areas on the edges of the City. This is consistent with the approach taken in previous ELRs in Plymouth and adjoining councils and recognises the actual urban area of the City. Furthermore any likely requirement

Plymouth City Council Employment Land Review 2011-2031
| Final | March 2015 Page 9
for additional B8 space identified as part of the needs assessment would most likely need to be accommodated at key locations such as Langage or Sherford on the strategic highway network.
The PPUA does not have a detailed boundary that follows parish boundaries but is represented as a broader sub regional area within the Devon Structure Plan (the PPUA was also recognised in the Cornwall; Structure Plan 2004). The Structure Plan was adopted in 2004 covering the period to 2016 and formally revoked in 2013 as part of the cull of the Regional Strategies. The PPUA boundary is also set out in the Plymouth Core Strategy which was adopted in 2007 covering the period to 2021. Broadley Park in Roborough and Langage Industrial Estate and Business Park were also identified in the South Hams and West Devon Borough Council 2006 ELR as making important contributions to the economy of Plymouth, and indicated in the Adopted South Hams Core Strategy as being within the PPUA. The key point is that the PPUA includes Sherford, Langage, and to a lesser extent Broadley Park as strategic locations serving the growth of Plymouth. The PPUA boundary is depicted on the plan at Appendix A.
The Travel to Work Area (TTWA) was discounted as a potential geography for ELR purposes as it is considered more relevant to the commuting geography of the City rather than the PPUA which will “act as the primary focus for major economic investment and regeneration in western Devon...enhance its role as the main commercial centre with the western sub region and provide a ...range of regional services and specialist facilities to meet the needs of its extensive hinterland”1. Given these explicit roles for the PPUA it is considered the more relevant geography for consideration of the employment land requirements of the City.
2.4 Neighbouring authority’s ELRs Having agreed to undertake the assessment of employment land requirements on the basis of the administrative area for the needs assessment and the PPUA in terms of land supply it is important that we have an appreciation of the ELR’s that have been undertaken for neighbouring authorities. It is worth noting that there is cross boundary acceptance that PPUA sites within the South Hams administrative area form part of the potential supply of land to meet the needs of Plymouth. This section briefly summarises the most recent ELRs undertaken in the neighbouring authorities of South Hams, West Devon and Cornwall and includes discussion around key employment sites in close proximity to Plymouth, as well as consideration of employment land market dynamics in the surrounding areas.
2.4.1 South Hams & West Devon BC ELR (December 2006)
A joint ELR was undertaken for Torridge District Council, South Hams District Council, West Devon Borough Council and North Devon District Council in 2006 by GVA.
1 Extracted from Policy ST6 Plymouth Principal Urban Area - Devon Structure Plan Adopted
(2004).

Plymouth City Council Employment Land Review 2011-2031
| Final | March 2015 Page 10
South Hams District Council
The South Hams summary within the 2006 ELR highlighted that there was a real lack of land and commercial premises in the District, but made a distinction between those areas with a strong link to the Plymouth economy (Langage and Roborough) and the distinctively different market for commercial land in the principal market towns of Totnes, Dartmouth and Kingsbridge.
Under the preferred scenario (an increase of 26,000 jobs by 2026), the ELR concluded that South Hams had a deficit of employment land of around 44ha (124ha requirement with 80ha supply). This was made up of a large deficit of B2 and B8 floorspace totalling some 294,000m², with a significant surplus of B1a floorspace of around 80,000m² and a smaller surplus of B1b / B1c floorspace.
Acknowledging that South Hams presents a number of submarkets for employment land and space, the 2006 ELR suggested that areas such as Langage and Broadley Park, Roborough are effectively part of the Plymouth economy and the demand for additional employment land in these locations will be influenced by the relative performance of the City’s economy. Economic growth in the market towns of South Hams is much less directly influenced by the buoyancy of the Plymouth economy.
The conclusion was drawn that South Hams may need to identify further land for employment, particularly post 2016 outside of the PPUA. At the time it was suggested that if the Structure Plan and Local Plan allocations were taken into account, this requirement would likely focus on a balance between a limited amount of land in the A38 corridor and on smaller additional allocations in locations such as Totnes, Dartmouth, Ivybridge and Kingsbridge2.
South Hams adopted its Core Strategy in December 2006. It seeks to provide around 62ha of employment land during the period 2001-16, of which 47ha comprises strategic allocations within the PPUA (Policy CS3), as follows:
Sherford New Community (18ha) Langage Employment Estate (20ha) Broadley Park, Roborough (4ha) The Core Strategy states that these employment allocations3 will help to meet the wider needs of the economic and urban regeneration of Plymouth, although the Sherford allocation is primarily intended to satisfy the local employment needs of the new community where 4,0004 dwellings will also be provided. An Area Action Plan for Sherford was adopted in 2007 setting out further details of the employment proposals for the new community and a Masterplan was subsequently prepared to inform the development. The Masterplan converts the 18ha figure (above) to 67000m2 of B use floorspace (comprising 46900m2 B1,
2 Paragraph 10.30 (South Hams and West Devon Borough Council ELR 2006) 3 Sherford, Langage and Broadley Park 4 this figure has increased since the Core Strategy was adopted

Plymouth City Council Employment Land Review 2011-2031
| Final | March 2015 Page 11
6700m2 B2 and 13400m2 B8). The Area Action Plan acknowledges that Sherford will help to address sub-regional as well as local needs.
The Core Strategy states that these employment allocations will help to meet the wider needs of the economic and urban regeneration of Plymouth, although the Sherford allocation is primarily intended to satisfy the local employment needs in of the new community where 4,000 dwellings will also be provided. An Area Action Plan for Sherford was adopted in 2007 setting out further details of the employment proposals for the new community.
West Devon Borough Council
West Devon had the smallest existing stock of employment floorspace of the four districts in the 2006 ELR, with around 300,000m² in total. More than half of this space is either retail or manufacturing and the main centres of employment are at Tavistock and Okehampton. Demand is primarily focussed around Tavistock, with local indigenous businesses and overspill from Plymouth providing the main stream of demand.
Under the preferred growth scenario, the 2006 ELR identified a land requirement in West Devon for 38.2ha, of which about half is for B8 use, 38% for B2 and 13% for B1. At that time, 19ha of land had already been allocated in plans for employment use, leaving a shortfall of a further 19.2ha. This requirement was expected to focus on those areas with reasonable accessibility to the national road network, in particular Okehampton, and to a lesser extent Tavistock.
West Devon Borough Council’s Adopted Core Strategy (2011) has sought to meet these identified needs in full through the allocation of 10ha of land in Okehampton and 9ha in Tavistock. Both of these sites currently remain undeveloped although supplementary planning guidance has been adopted setting the framework for development on these sites.
The 2006 ELR made an assumption that much of the projected requirement for office space (over 18,000m²) would be met within town centres and in non-business property. At the time it was assumed that some of this demand is likely to be overspill growth from Plymouth directed in the main toward Tavistock. If, in reality, only limited opportunities for B1a office uses were to come forward in the marker town centres, this would place greater pressure on employment allocations. For instance, if only 50% of anticipated growth in town centres were achieved, in theory 2.3ha of additional employment land would be required.
In the case of West Devon, the 2006 ELR identified a significant undersupply of employment land, particularly for warehousing, but indicated that the preference may be for increasing the supply of land in the north of the Borough along the A30 corridor, rather than areas close to Plymouth. A potential relationship with the Plymouth office market was identified, with the possibility that undersupply within the City and Tavistock would result in pressure on a limited existing supply of employment land. As we note later the undersupply in Plymouth identified at the time seems to have reversed into an oversupply situation in 2014. This is further discussed later in the report.

Plymouth City Council Employment Land Review 2011-2031
| Final | March 2015 Page 12
2.4.2 Cornwall Council ELR (Nov 2010)
Although Cornwall does not form part of the agreed study area for this ELR it is helpful to appreciate Cornwall’s employment land requirements in areas adjacent to the City. The most recent Cornwall ELR was prepared in 2010. This study utilised TTWAs to group employment sites. Parts of the TTWAs for St Austell and Saltash & Torpoint (an adjusted version of the Plymouth TTWA) are of most relevance to the employment land market of Plymouth.
Saltash & Torpoint
For Saltash & Torpoint, the 63ha of developed employment land supply is predominantly located in Saltash. The sites were found to vary in quality and although less than 1% was assessed to be of ‘good quality’, only 6% was found to be ‘poor quality’.
There were also 12 identified undeveloped employment sites within the TTWA, primarily at Callington, Saltash and Torpoint. Within Callington the most significant is the Moss Side Industrial Estate, where an extension is planned to both the east (4.8ha) and to the north (3.4ha) to provide additional general industrial/warehousing space. At Saltash, there was undeveloped land within the Moorlands Lane Trading Estate (4.75ha) and Saltash Parkway (1.76ha). Both estates are located to the south of the A38 in close proximity and comprise modern and attractive general industrial and warehouse space. At Torpoint there were a number of undeveloped plots within the Trevor Industrial Estate totalling 4.1ha5.
In 2010, a total of 28.89ha of undeveloped sites were identified within the Saltash & Torpoint TTWA.
St Austell
The St Austell TTWA contains 34% of Cornwall’s total assessed employment land supply (264ha) in a wide variety of locations.
There are a large number of undeveloped sites concentrated around St Austell, St Columb Major, Bodmin and Liskeard. Land at Moorlands Business Park, Liskeard, was the subject to an outline planning permission for 3.5ha of industrial and office use, so potentially capable of being delivered in the short term6. In 2010, a total of 3.76ha of undeveloped sites was identified within the Moorlands Business Park and Liskeard Business Centre.
The overall demand & supply picture for Cornwall
With respect to the overall demand and supply balance, the 2010 ELR concluded that there was a need for 150ha of available employment land for planning purposes to 2026. In terms of the current available land supply, the amount of undeveloped employment land in the County (some with extant planning
5 Paragraphs 7.37 – 7.39, and Table 7.8 (Cornwall Council ELR 2010) 6 Paragraphs 7.40, 7,41 and Table 7.9 (Cornwall Council ELR 2010)

Plymouth City Council Employment Land Review 2011-2031
| Final | March 2015 Page 13
permission but not yet started) available to meet this demand was identified at approximately 206ha. This is broadly equivalent to about 37 years of supply at past rates of development in the County7.
2.5 Economic Sectors
2.5.1 Defining economic sectors for ELR purposes
Paragraph 161 of the National Planning Policy Framework (NPPF) establishes the need for ELRs to take a broad overview of all economic sectors, stating a local authority should assess:
“the needs for land or floorspace for economic development, including both the quantitative and qualitative needs for all foreseeable types of economic development over the plan period, including for retail and leisure development.”
The DCLG online planning practice guidance (NPPG, Part 4) advises that plan makers should consider an “assessment of employment land by sub-areas and market segment, where there are distinct property market areas within authorities”, as well as “the locational and premises requirements of particular types of businesses.”
This ELR seeks to provide broad coverage of all economic sectors, while also seeking at times to look in further detail at some specific economic markets and sectors that are of particular significance to the City, such as marine, advanced manufacturing and healthcare related services. On this basis, all the UK Standard Industrial Classification (SIC) Codes are covered by the ELR, with the exception of ‘U - Activities of Extraterritorial Organisations and Bodies’ (which is also not covered by the available job forecasts). Where it comes to providing more sector specific analysis, the focus will be on the specific needs of the priority sectors for Plymouth, as identified within the Local Economic Strategy 2006 – 2021.
2.5.2 Economic evidence base
An important element of the Local Economic Strategy for Plymouth (2006 – 2021), produced alongside the Core Strategy, was the emphasis on promoting priority sectors for growth. Sector choice, promotion and development was a central theme of the Economic Strategy, although it was clearly stated at the time that a sector focus was not intended to be exclusive, but rather to give an emphasis on where scarce marketing and product resource development resources should be concentrated.
The six priority sectors identified within the Local Economic Strategy were (see sections 3.2 and 3.4 for further details):
Advanced Engineering / Manufacturing
Marine Industries
Medical and Healthcare
7 Paragraphs 9.2 & 9.3 (Cornwall Council ELR 2010)

Plymouth City Council Employment Land Review 2011-2031
| Final | March 2015 Page 14
Business Services
Tourism and Leisure
Creative Industries
In recent years, a number of standalone research papers have been prepared relating to the six priority sectors. These papers have informed the debate on the prospects, role and land requirements of the priority sectors:
‘Prospects for Plymouth’s Priority Economic Sectors’ (Arup, July 2011) ‘Prospects for Plymouth’s Priority Economic Sectors – Addendum 1: Medical
and Healthcare Sector’ (Arup, February 2013) ‘Marine Industries Demand Study – initial findings to Inform City Deal
Negotiating Document’ (Arup presentation, July 2013)
In some instances, the priority sectors have been defined in very specific terms using more detailed breakdowns of the SIC Codes. To facilitate read-across between previous reports and this ELR study, a chart setting out the SIC Codes covered by relevant reports and economic forecasts is provided at Appendix B
2.6 Sub-division of Plymouth for land supply monitoring purposes.
Guidance on preparing ELRs advises that the locational and premises requirements of particular types of businesses should be considered, including the extent to which one location can meet the needs of a mix of types of businesses (ODPM ELR Guidance, paragraph 5.15). Following agreement of the ELR study area as a whole we sought to identify the main employment land clusters and sit these within a defined set of sub areas of the City. Following discussions with Council officers, it was agreed that the following sub areas would provide a good basis for analysis of land supply across the City as a whole:
City centre & waterfront – stretching from Devonport in the west, round the waterfront to Cattedown in the east, and north to incorporate the city centre and allocations around the railway station.
A38 corridor east – this area extends east from the A386 Manadon Hill/A38 Parkway junction to include the employment areas at Longbridge Industrial Park and Parkway Industrial Estate at Marsh Mills.
A38 corridor west - this area extends east from the A386 Manadon Hill/A38 Parkway junction to include the employment areas at Burrington Industrial Estate and Ernesettle.
A386 Northern corridor – this area has its focus at Estover Industrial Estate in the north east of the City and A386/Derriford Road roundabout in Derriford, but also extends north to include the employment land at Roborough (on the border between the City and South Hams District).
Plymstock – located to the southeast of the River Plym, the area of Plymstock includes the industrial parks at Breakwater Wharf, Oreston; Sugar Mill Business Park; and Pomphlett Industrial Estate.
Plympton – located in the east of the city, this area includes the Kingsleat Industrial Area and Newnham Industrial Estate. Langage Industrial Estate is

Plymouth City Council Employment Land Review 2011-2031
| Final | March 2015 Page 15
located at the eastern boundary of the Plymouth City administrative area and mainly within South Hams District.
These boundaries of these sub-areas are detailed in Appendix C.
2.7 Consultation Preparation of this ELR has been informed by consultation with neighbouring local authorities, land agents, businesses and the wider community. Consultation has been undertaken by the following means:
A Plymouth Employment Land Survey and Call for Sites 2013 (see further details below).
Duty to co-operate meetings with Cornwall Council, South Hams District Council and West Devon Borough Council.
Semi-structured phone interviews with land agents active in the Plymouth market.
Semi-structured phone interviews with key landholders and representatives of businesses and employers in the city including the Chamber of Commerce.
Presentation and debate of emerging ELR outputs to a Local Economic Strategy and/or Growth Point and Regeneration Forum meeting.
It should be noted that consultation undertaken for the ELR has formed an element of broader consultation exercises undertaken by the Council to inform preparation of the Plymouth Plan. Further summary information on the Employment Land Survey and Call for Sites is provided below. The outcomes of the consultation activities are referred to where relevant throughout this report.
2.7.1 Employment Land Survey & Call for Sites
The online employment land survey and call for sites launched on the City Council website on Wed 20th November 2013 and consultation closed on the 18th December 2013 (a four week consultation period). The consultation consisted of two parts:
Part A – a brief survey relating to employment land supply and demand; and Part B – a call for sites that may be suitable for development for employment
purposes.
As employment uses do not generate the same land values as residential uses, it was not anticipated that a large number of representations to the call for sites would be received. Nevertheless, it was considered important to provide an opportunity for landowners, developers and public sector organisations to express views on the supply of employment land in the City and to put forward sites for consideration through the plan-making process. A limited number of representations were received; however, this did include information on the potential release of a large area of Network Rail operational land within the City.
An overview of employment land survey and call for sites consultation responses is provided in Appendix E. The key points raised were as follows:

Plymouth City Council Employment Land Review 2011-2031
| Final | March 2015 Page 16
One representation urged the Council to consider that an existing employment site is not considered for as a future employment land designation (Former Imerys Site, Coypool).
Representations promoting a number of sites in the Derriford and Seaton area that were proposed for employment uses in the submission version of the Derriford & Seaton Area Action Plan (December 2012).
Network Rail submitted a representation advising that the existing Laira Rail Depot to the east of the City Centre may be released from operational requirements during the plan period.

Plymouth City Council Employment Land Review 2011-2031
| Final | March 2015 Page 17
3 Property Market & Socio-economic Context
3.1 National Policy The focus of this chapter is to take a look back at investment and development trends over the 8 year period since the last ELR was undertaken in 2006 to develop an understanding of the state of the City’s commercial property market in 2014 as the economic recovery takes hold. Through this analysis we pick up the market signals and trends of recent years for consideration in the planning of future requirements for the City.
3.1.1 UK Industrial Strategy
At the national level in recent years the Government has recognised that changes in the international economy since the 2008 downturn has led to an increase in both competition and opportunities from global markets. In order to enable UK businesses to compete and grow, the Government has developed an industrial strategy, which will set out a long-term, whole of Government approach to how business is supported.
Guidance published in September 2013 sets out the five main strands of the Industrial Strategy:
Skills – working with business to deliver the skills that employers need. Technologies – investment in eight great technologies where the UK has
research expertise Access to finance – creation of a British Business Bank to help remove
barriers to the supply of finance Government procurement – providing businesses advance notice of what the
Government is buying so they can invest in the right skills and equipment Sector partnerships – Strategic partnerships have been developed in eleven
sectors where government and business believe they can make the most difference. Support will be provided for all sectors of the economy.
The selection of priority sectors within the 2006 Plymouth Local Economic Strategy was based on consideration of those sectors where Plymouth has existing strengths or specific competitive advantages. Table 1 below identifies the linkages between the identified priority sectors in Plymouth and the key technologies and strategic sectors within UK Industrial Strategy. This shows that economic sectors with the strongest potential alignment with Government and businesses through UK Industrial Strategy measures are the Medical & Healthcare, Advanced Manufacturing and Marine & Renewables sectors. The only priority sector that does not feature in the table is that of tourism and leisure.
Table 1: Comparison of UK Industrial Strategy sectors and Plymouth priority sectors
UK Industrial Strategy Plymouth 2006 LES
Strategic sectors Key technologies Priority sectors
Aerospace Satellites
Agricultural technology Agri-science
Automotive

Plymouth City Council Employment Land Review 2011-2031
| Final | March 2015 Page 18
UK Industrial Strategy Plymouth 2006 LES
Strategic sectors Key technologies Priority sectors
Construction
Information economy
International education
Life Sciences – UK-led research is improving treatments for a whole range of conditions including rheumatoid arthritis, multiple sclerosis, Alzheimer’s and cancer.
Regenerative medicine Healthcare & Medical; Advanced
manufacturing Synthetic biology
Robotics and autonomous systems
Nuclear
Energy storage
Offshore Wind Marine industries
Oil and gas Marine industries
Professional and business services Big Data Business services; Creative industries
- Advanced materials Advanced manufacturing
Further investigation of specific measures the Government is pursing in relation to these sectors and skills is being undertaken to inform the revised Local Economic Strategy. At this stage, a broad conclusion can be drawn that appropriate employment space should be provided for sectors of importance at both the national and local scales, within The Plymouth Plan. The needs of the healthcare, marine and advanced manufacturing sectors in terms of location and site and space requirements should be considered as part of the ELR.
3.2 Local Policy & Economic Strategy A brief overview and introduction to the Core Strategy and Local Economic Strategy is provided below for context.
3.2.1 Plymouth ELR 2006
The 2006 ELR concluded that the overall quantity of employment land within the City exceeded the projected future demand for the 2016-2026 plan period. This was considered to be a result of high Structure Plan requirements for the provision of 160ha by 2016, while actual take up rates had been found to be half that expected by the Structure Plan figure of 10.66ha per annum. As presented in the table below, the 2006 Plymouth ELR found that the residual supply of employment land would be around 67.5ha by 2016 and 18ha by 2026.
Table 2: 2006 ELR projected residual supply of employment land
Quantity of employment land 2016
Quantity of employment land 2026
Future requirement 57.63ha 107.02ha
With permission 75.28ha 75.28ha
Allocated 49.83ha 49.83ha

Plymouth City Council Employment Land Review 2011-2031
| Final | March 2015 Page 19
Quantity of employment land 2016
Quantity of employment land 2026
Total land 125.11ha8 125.11ha
Residual land 67.48ha 18.09ha
3.2.2 Plymouth Core Strategy (April 2007)
The Core Strategy forecast that, between 2006 and 2026, a total of 37,000 new jobs would be created in the Plymouth TTWA, of which 27,500 new jobs would be created in the PPUA. It was calculated that to achieve this job growth, over 20 years, would require provision of 867,740 sq. m. of additional commercial floorspace on an estimated 84ha of land within the PPUA.
Based on the findings of the 2006 ELR, the employment land requirements of the Core Strategy were broken down into four broad city areas / categories, of which three were particularly significant. Table 3 records the employment land requirements and expected land use types by broad city area.
Table 3: Core Strategy employment land requirements by broad city area
Core Strategy (2007) city areas Employment Land Requirements
By 2016
By 2021
City Centre and Waterfront – comprising a large area covering the City Centre, Cattedown, Sutton Harbour and the Barbican, the Hoe, Millbay and Stonehouse, and Devonport. This will be the primary location for office development, but also for creative industries, tourism and leisure, marine employment and urban regeneration-led initiatives.
6.3ha 3.96ha
Business Parks – Business Parks are substantially located in the Northern Corridor, with a particular focus on the Plymouth International Medical and Technology Park and Plymouth Science Park, but also includes sites in the eastern corridor. Further strategically significant provision for business park development will be proposed, particularly support the Medical and Healthcare sector.
25.5ha 2.58ha
A38 locations – these are the key business areas along the A38 corridor, including Marsh Mills, Ernesettle, Newnham, St Budeaux and Honicknowle. Langage, within South Hams is also located along the A38. Delivery of sustainable linked communities through safeguarding and provision of accessible employment opportunities to the local population.
5.7ha 14.67ha
Other city-wide locations 2.1ha 1.06ha
Totals 39.6ha 22.27ha
The emphasis on employment provision in three key locations, the City Centre and Waterfront, Derriford & Seaton, and the A38 Corridor (in particular to the
8 Employment land figure excludes some sites assessed by the 2006 Plymouth ELR that are neither allocated or subject to planning permission.

Plymouth City Council Employment Land Review 2011-2031
| Final | March 2015 Page 20
east at Langage in neighbouring South Hams), has an important continuing role in economic development, as explored further in this report.
3.2.3 Plymouth Local Economic Strategy 2006-2021
The overarching aim of the Local Economic Strategy was to achieve an improved economic position for the City of Plymouth and seven critical success factors were identified:
Productivity & Competitiveness - high levels of Gross Value Added Business & Enterprise – high levels of employment; and a diverse business
base Knowledge & Technology – a high proportion of employment in knowledge
based activities; and high levels of innovative capacity Skills & Learning – a high quality, adaptable skills base; high levels of
attainment in education; and a positive and aspirational culture. Key centres – a range of well-connected centres and nodes that drive
complementary and mutually reinforcing components of the economy. Participation – Inclusion and access for all communities; and high levels of
economic activity. Leadership – Coordination and championing; and Image & Branding.
Of these success factors, the aim of providing well connected ‘key centres’ is of particular relevance to the 2014 ELR , as well as providing the conditions for a diverse business base, which suggests a wide variety of types of site is required. The Local Economic Strategy included a useful diagram setting out Key Economic Nodes in Plymouth (replicated at Figure 2), while also highlighting that the two areas of the City Centre and Derriford provide the major impetus to the City’s development.
As introduced above, a further important component of the Local Economic Strategy was the identification of the following priority economic sectors for Plymouth:
Advanced engineering – comprising mechanical, precision, electrical and electronics engineering activities;
Business services – this sector includes banking, insurance, accountancy, legal, consultancy, commercial property, security and cleaning services.
Creative industries – creative industries include advertising, architecture, the creative arts, design, photography, film and video, music and performing arts, publishing, TV and radio, and related software and IT activity.
Marine Industries – including activities such as ship/boat building and repair, marine engineering, marine construction, environmental technologies, communications, ship management, agency and freight forwarding, port operations, marine leisure and marine science activities.
Medical and healthcare – comprising the provision of health services by public and private sectors together with manufacture and distribution of pharmaceutical products, medical and surgical equipment and medical research.

Plymouth City Council Employment Land Review 2011-2031
| Final | March 2015 Page 21
Tourism and leisure – sector comprises services for visitors and residents including hotels, restaurants, bars, pubs, clubs, transport, specialist retailers, attractions and entertainments.
The extent, to which development in these sectors has been witnessed in the period since 2006, and the prospects for future growth, is of importance for the ELR given the potential for specific site requirements.

Plymouth City Council Employment Land Review 2011-2031
| Final | March 2015 Page 22
Figure 2 - Plymouth Key Economic Nodes (Source: 2006 ELR)

Plymouth City Council Employment Land Review 2011-2031
| Final | March 2015 Page 23
3.3 Historic inward investment enquiry data A review of investment queries by businesses provides a further lens on trends in the demand for commercial floor-space in the City over the last decade or more. Information has been obtained from the economic development unit within the Council with regards to the level and type of business enquires received. The data covers the period from January 2002 to December 2013 and has been assessed to provide an indication of the requirements of expanding and relocating businesses as well as inward investors. A similar assessment was undertaken for the 2006 ELR and this study seeks to understand the trends over the 12 year time period, along with any shifts in the types of enquiries received since 2006.
3.3.1 Headlines from the 2006 ELR
The 2006 ELR assessed inward investment information for the period October 2001 to July 2005. Some of the key findings from the review of this period’s investment enquiries are summarised here:
Origin of enquiry - The majority of business enquiries were generated from within the UK (just over 80%), with the remaining 7% originating from Europe and approximately 10% being global enquires.
Type of premises sought - the highest number of enquiries had been for industrial premises followed by enquiries for offices, warehousing and workshops.
Size of premises - the most common category of demand in regards to floor-space was shown to be for premises between 100sq. m. -500 sq. m.
In conclusion, the 2006 ELR suggested that demand for land/floor space was low in terms of size. This consequently helped to explain the long term vacancy of larger employment premises throughout Plymouth at the time.
3.3.2 New business enquiries
Since the 2006 ELR there was an immediate and significant drop in the number of business enquiries, a downward trend that continued through to 2006 - 2007. The pattern is illustrated in Appendix D.
The origin of 38% of investment enquiries has been from new businesses, whilst expansion and relocation from outside Plymouth accounts for 32% of enquiries. The full details are included in Appendix D.
In terms of sectors, the largest number of enquiries came from priority sectors, whilst enquiries from advanced engineering and manufacturing dropped, as a proportion from 20% during 2002-2012 to only 5% since 2007.
With regard to premises enquiries, 71% of enquiries were for spaces larger than 100 sq. m. between 2002 and 2013, with a third of all enquiries being for 101-500 sq. m. There was also a high proportion of demand for premises with 1,001 to 10,000 sq. m. of floorspace (around 21%). Full details of requirements are in Appendix D.
3.3.3 Improvements in investment enquiry data capture.
Having reviewed the data we would recommend that the process of monitoring of enquiries data could be improved by recording the reasons why companies decide not to invest in Plymouth. Through undertaking further exploration of enquires, insights could be gained

Plymouth City Council Employment Land Review 2011-2031
| Final | March 2015 Page 24
regarding where and how local plans and policies should be implemented to support key employment sectors and generate economic growth in Plymouth.
Following up on enquires would help to shape a picture of how investor interest develops over time and the role the Council takes in drawing in investment. Improvements to the Council’s data set could enable identification of suitable sites to be promoted for regeneration and development to increase effectiveness in drawing businesses to Plymouth.
The Councils investment enquiries data set could be enhanced though the introduction of separate entry columns for different measurement units i.e. hectares, acres, meters squared, or square foot. This would allow tables to be populated with the units being voiced by the enquirer and immediately converted at a later date.
3.4 Local Economic Strategy Influences As a key building block in the production of the Plymouth Plan, the Council has produced the Local Economic Strategy (LES) review 2013 to 2014. The LES, along with decisions on future employment land safeguarding and allocations, is informed by consideration of economic growth sectors. Some economic sectors may experience organic, market-driven growth, while others may require greater policy and strategy support to ensure that they are given the best possible conditions in which to thrive. A summary review of relevant economic strategies is provided here.
3.4.1 Heart of the South West LEP Strategic Economic Plan 2014 – 2020 (March)
Submitted to Government on the 31st March 2014, the Strategic Economic Plan of the Heart of the South West Local Enterprise Partnership sets out ‘Place-Based’ and ‘Business’ priorities that are considered to be of particular significance for Plymouth. These priorities are set out in
Table 4 below, with those of particular relevance to the ELR process highlighted.
The Strategic Economic Plan (SEP) highlights that the marine manufacturing and research sector, centred on Plymouth, has the potential to drive growth across the whole peninsula. Specific reference is made to the Plymouth and South West Peninsula City Deal, to provide a Marine Industries Production Campus at South Yard, Devonport, which is seen to build on an area of clear competitive advantage in terms of both existing businesses and employment and leading marine research (see Section 3.5.2 for further details). The marine sector is therefore recognised to be of sub-regional, and not only local, importance. The SEP also highlights the importance of the northern corridor a key location for growth to occur focused around the A386 and junctions with the A38 and the existing key assets of Derriford Hospital, the University of St Mark and St John, and Plymouth Science Park.
Table 4 - Heart of the South West LEP 'Place Based' and 'Business' Priorities
Creating the Conditions for Growth
Maximising Employment Opportunities
Building on our distinctiveness
‘Place Based’ Priorities
The enabling landscape The infrastructure and
facilities to create more and better employment
The infrastructure and facilities needed for
transformational change

Plymouth City Council Employment Land Review 2011-2031
| Final | March 2015 Page 25
Transport and accessibility Enterprise infrastructure Opening up specialist sites
for marine sector development
Sustainable solutions to flood and water catchment
management
Investing in strategic employment sites in our main towns and cities
Investing in science park and innovation infrastructure for
nuclear, marine, environmental sciences and
aerospace.
Unlocking the delivery of stalled housing sites Digital infrastructure Maximising our
environmental assets
Energy infrastructure - -
‘Business’ Priorities
Creating a favourable business environment – “a
growth hub”
Achieving more sustainable and broadly-based business – “the Global Market Growth
Package”
“Transformational investment”
Simpler, more coherent business support
Reaching new markets (including web-fuelled, supply chain and public
sector)
Golden opportunities – catapults and networks
Tailoring national policies and programmes to local
potential Globalisation (exports and
inward investments)
Horizontal innovation – capacity building, grand
challenges and innovation for all
Improved access to finance platform - -
3.4.2 Cornwall & Isles of Scilly LEP Strategic Economic Plan 2014 - 2020
The Cornwall & Isles of Scilly SEP sets out a series of headline interventions for the area immediately adjacent to Plymouth. Those considered to be of greatest relevance to the ELR are highlighted below. Notably, the broader sub-regional relevance of the City Deal marine energy park initiative is emphasised by the LEP. Potential links with the medical & healthcare, creative industries and tourism priority sectors for Plymouth provide further opportunities for collaboration:
Newquay Cornwall Airport (NCA) – development of the UKs only aerospace focussed enterprise zone.
Marine Renewables – early wins identified include the opening of the Hayle Marine Renewables Business Park (by 2015/16) and this project is regarded as a major contributor to the success of the Plymouth and South West Peninsula City Deal.
Geothermal energy development Locally-owned energy network schemes Agri-tech business growth and infrastructure programmes Smarthomes and e-health – this involves a number of pilot projects around low carbon
and smart homes, e-health and ageing care. There could be an important linkage here with the Plymouth medical & healthcare sector.

Plymouth City Council Employment Land Review 2011-2031
| Final | March 2015 Page 26
Bespoke business ‘Growth Hub’- this intervention area also links with the Plymouth and South West Peninsula City Deal and its application within Cornwall and the Isles of Scilly.
Creative and digital industries as enabling technologies – this refers to the operation of creative, cultural and digital media hubs and platforms.
Hub and spoke support for other ‘bedrock sectors, including tourism. Transport infrastructure, including strategic road, rail, port and airport investments Flood resilience, involving increased flood defence works Digital connectivity – completion of superfast roll-out and ultrafast connectivity in key
locations Smart Grid energy network pilots Housing and new ways of living, focussing on delivery of key infrastructure Skills, talent and raising aspirations Community capacity and resilience programmes Isles of Scilly connectivity, water and sewerage Hub and spoke support for other ‘bedrock sectors, including tourism.
3.4.3 Plymouth Local Economic Strategy Review
To inform preparation of the ELR the Council has provided emerging information relating to the refresh of the Plymouth Local Economic Strategy. Proposed initiatives for the LES are organised under eight flagships:
Mayflower 2020 and Culture – a major event to highlight the city’s cultural offer and raise its profile in global markets.
Ocean City infrastructure programme – accelerated infrastructure delivery, including key infrastructure supporting Mayflower 2020 including the Marine Industries Production Campus, City Centre Innovation Centre, Visitor Economy Capital Plan and Plymouth Science Park Phase 5.
Digital Economy – Delivering the skills, demand stimulation and business opportunities to make the most of the city’s strong digital connectivity.
Business Growth & Investment – Development of a coherent business support offer. Learning and talent development – a major civic approach to learning and skills
development. People, communities and institutions – Initiatives to ensure all sectors of the community
can participate in and benefit from city growth and development. Leadership and delivery management – Building a confident, coherent leadership team
with all the major institutions buying into the Plymouth ‘project’.
As with the LEPs strategic economic strategies, not all initiatives are of direct relevance to employment land supply, although successful initiatives and more rapid economic development will clearly bolster demand. The effect of the success of these strategies on job growth is reflected in the scenarios we have built later in this report to establish the levels of job creation and floorspace demands. Our High (2) scenario assumes successful delivery of the following key components of the ‘Ocean City Infrastructure Programme’.

Plymouth City Council Employment Land Review 2011-2031
| Final | March 2015 Page 27
Table 5 - Components of the 'Ocean City infrastructure programme'
Infrastructure project Implication for ELR
Marine Industries Production Campus
The City Deal proposal for Devonport is included as strategic option within this report.
Cruise Liner Terminal Proposed as a major infrastructure project supporting the tourism economy and a key element of the Mayflower 2020 plans, there is clearly a very limited selection of sites that could accommodate a cruise liner terminal. Implications for adjoining land in terms of provision of terminal facilities and potential implications for adjoining existing/proposed land uses would need to be considered.
Exhibition and conference centre D class uses including premises for assembly and leisure are covered by the ELR and therefore appropriate that a specific allowance is made for the provision of this facility.
Plymouth Science Park Phase 5 Plymouth Science Park is covered by this report as a strategically important employment site for the City, particularly for the medical and healthcare sector.
3.5 The spatial requirements of priority economic sectors This section of the ELR draws on other studies to consider the more specific characteristics and demands of the Plymouth priority sectors. It should be highlighted that the six priority sectors are drawn from the previous LES and that the update of the LES places less emphasis on a sectorial approach going forward. Nevertheless, taking into account the continuing importance of sectors such as maritime, as confirmed by the City Deal, and medical & healthcare for the city economy, these considerations remain useful insights to the spatial needs of key sectors.
3.5.1 Advanced Engineering
For the advanced engineering sector the ‘Prospects for Plymouth’s Priority Sector’ (July 2011) report identifies the following locational factors as being of importance:
Access to market and the strategic road network is vitally important and therefore, in the case of Plymouth, proximity of sites to the A38.
Potential to provide relatively high levels of car parking to broaden the geographical labour pool from which more specialist skills can be drawn.
A high level of energy performance, as increasing automation of processes makes energy cost and efficiency an important factor.
For some sub-sectors, the nature of neighbouring uses can be important, in relation to both a clustering of related supply chain companies and capability in particular production processes.
The employment forecasts for Plymouth suggest a continuing decline in the manufacturing sector, so if the Council wishes to slow, halt or reverse this trend, careful consideration needs to be given to site supply. It has been doing this through the success of Plymouth Science Park and PIMTP amongst others. Over and above this ensuring the availability of good quality sites in the A38 East corridor in particular could be a priority.

Plymouth City Council Employment Land Review 2011-2031
| Final | March 2015 Page 28
3.5.2 Marine Industries
Considerable effort has been devoted to strategies for promoting growth in the marine industries sector through the Plymouth and South West Peninsula City Deal bid process. The main points and recommendations arising from a ‘Marine Industries Demand Study’ and the Prospects report are summarised here:
There is a strong recovery in the marine leisure industry, following a downturn during the period 2007/08 to 2009/10, and the South West region of England has the highest level of employment in this sector in the country.
There is a low level of offshore wind power supply chain activity in the South West, with activity concentrated in Scotland, the eastern seaboard and North West. The greatest opportunities in this sub-sector may lie in the supply of high voltage subsea cabling and related transformers, where the need for additional manufacturing capacity is forecast.
The UK is a front-runner in developing and deploying wave and tidal technologies and opportunities exist in the supply chain to support the leadership of UK businesses in this sector. Also applicable to offshore wind, the design and supply of electrical architecture for connecting renewables arrays is identified as an opportunity area for research and product development.
Design of dynamic position vessels for deploying renewable energy generators, which can remain on position in the most energetic positions (e.g. high velocity tides), is underway. There is a push for involvement by South West teams.
There is evidence of significant clustering in the marine industries sector, with firms seeking to locate close both clients and related firms in their supply chain.
Direct waterside access is not a pre-requisite for all firms, as the sector is extremely diverse, but clearly for some activities direct water access is absolutely crucial. Examples include the ship and boat building and consumer sub-sectors.
Surrounding land uses can be an important factor for the activities that can be undertaken at waterside sites, particular for those businesses that require the capability to be able to operate round the clock without conflict with neighbouring occupiers.
Affordability of premises can be an important factor, with some businesses attracted to more peripheral locations that offer reasonable proximity to other activity in the sector, but which may have reduced public transport connectivity and local services.
Sites with direct waterfront access within the City are limited and given the strength in job growth in the marine industries sector (see Chapter 4 for the details) should be safeguarded from loss to other non-related uses.
3.5.3 Medical & Healthcare sector
A ‘Medical and Healthcare’ addendum to the ‘Prospects for Plymouth’s Priority Sectors’ report was prepared by Arup in February 2013. The research used Companies House data to undertake specific analysis of the distribution of medical and healthcare sector registered companies.
It is acknowledged that there are omissions from this data set. For example, the NHS is a major employer in the City, but as a public sector organisation it is not registered with Companies House. Representations submitted to the Derriford & Seaton AAP examination with respect to this evidence also pointed out that in some cases companies may be registered at the address of their solicitors or accountant, rather than their actual business location, so the data required a health warning when trying to establish the location and clustering of

Plymouth City Council Employment Land Review 2011-2031
| Final | March 2015 Page 29
healthcare businesses across the City. Further investigation found this to be the case for around 35% of the circa 150 registered companies considered. The main findings from the review of the company location map (based on revised data) are as follows:
General medical practice activities, dental practice activities and other human health activities represent around 80% of all healthcare employers in Plymouth and can be seen to have the widest geographic spread. This is what would be expected, with companies offering services directly to the communities within which they are located across different parts of the City.
There are greater concentrations of activity within the PL1 post code area, within the City Centre & Waterfront area; and the PL6 post code area that incorporates Derriford & Seaton.
There are two concentrations of activity in the northern corridor of the City, in the namely: Plymouth Science Park, PIMTP and Darklake View. This distribution of businesses and occurrence of City centre and northern corridor clusters of activity is in alignment with the objective of a ‘bi-polar’ City set out in the Core Strategy9.
Plymouth Science Park and PIMTP are located in close proximity to Derriford Hospital, forming a cluster of activity in the sector. Further brief details of these two strategically significant sites are provided below.
Plymouth Science Park: Formerly known as Plymouth Science Park was established through a collaboration of the University of Plymouth and Plymouth City Council and is located adjacent to the main Derriford Hospital campus. The park has successfully incubated and grown a number of medical technology and biotech related companies. Resident medical and healthcare businesses include:
Cardio Analytics Centre for Health and Environmental Statistics iNet Biomedical Medical Education National Blood Service NHS Education South West Occupational Health for primary care Peninsula Medical School Plymouth Hospital NHS Legal Trust Plymouth Hospital NHS Trust Research and Development PMS Clinical Neurology Research PMS Diabetes Clinical Research Centre PMS Respiratory Research Unit S & S Dental Services South West Care Homes
Plymouth International Medical and Technology Park (PIMTP) - PIMTP is another significant area for employment within the Derriford area. PIMTP is located on the former
9 Plymouth City Council (2006) Core Strategy (Paragraph 6.9)

Plymouth City Council Employment Land Review 2011-2031
| Final | March 2015 Page 30
Seaton Barracks, to the east of the A386, close to Derriford Hospital and the Plymouth Science Park. PIMTP is owned and marketed by the Council following its transfer from the South West of England Regional Development Agency (RDA) in 2011.
Although much development has already taken place on the original PIMTP area there remains at least 13.01 hectares of land suitable for further development (excluding site J shown on Appendix H and land that has already been given planning consent for employment uses as part of the Seaton Neighbourhood Proposal – see site I on Appendix H). In addition to this we are also aware that the Western Morning News building could be another significant opportunity.
PIMTP was chosen as the ideal location for one of only three new Radiology Academies in the country, as well as a new Peninsula NHS Treatment Centre, specialising in orthopaedic diagnostic treatment and rehabilitation. Biovault Technical, the UK’s largest private tissue bank, is also located at PIMTP. As a private tissue bank working directly with the NHS, the company is seeking to establish a regional human tissue storage and processing facility with low start-up costs.
Further notable companies located in the northern corridor include BD. BD is based at Belliver Industrial Estate to the north of the hospital and Plymouth Airport. As a leading global medical company it develops, manufactures and sells medical devices, instrument systems and reagents. The company’s plant in Plymouth manufactures a broad range of blood collection products and systems including BD tubes for haematology, coagulation and special chemistries, and supplies markets across Europe and around the world. The Plymouth facility, which employs approximately 720 staff, also manufactures labware products used by medical researchers. Looking ahead to the Plymouth Plan and a future employment land strategy, the following main conclusions can be drawn for the medical sector:
A strong clustering of medical and healthcare activities within the Derriford and Seaton area is evident. Locational factors for those involved in product development and supply can include proximity to clients and supply-chain partners, a prestige effect around facilities (for example in relation to client facing R&D centres), and proximity to healthcare providers such as Derriford Hospital.
For other direct healthcare providers (GPs, Dentists, Physiotherapists, etc), which make up a substantial proportion of the sector in Plymouth, accessibility for a local client base within communities is clearly the major factor. Availability of adequate parking can be of great importance, although providing the option of public transport is still desirable for those instances where client personal mobility is not impaired.
3.5.4 Business Services
The ‘Prospects for Plymouth’s Priority Sectors’ report advises that at the national and international level the business services sector is highly geographically mobile, although offices within Plymouth tend to serve a second order local demand for services. The locational decisions of companies re-locating within or moving to Plymouth are therefore expected to be influenced by:
Demand for central locations with good public transport and highways accessibility,although business parks and out of town locations may also be selected where largerfacilities (such as call centres) are required.
Plymouth City Council Employment Land Review 2011-2031
| Final | March 2015 Page 31
Cost effective premises likely to be a key driver as office space requirements tend to be fairly generic, although prestige may also play a role.
In summary, providing an adequate supply of office space of good standard within the City Centre, and potentially close to the railway station will be beneficial in supporting the sector. This should be supported by the potential for office development in key nodal locations where a range of local services will be on offer, in particular at Derriford & Seaton.
3.5.5 Creative Industries
Firms in the creative sector are considered to have a propensity to co-locate with other firms in the sector and to develop clusters of activity. The level of potential interaction and trading between different firms in the sector is higher than observed in many other sectors of the economy. Consequently, proximity to both the potential outside market and other firms in the sector (or internal market) is a key factor driving the locational decisions of firms in the industry.
The characteristics of the general surrounding area in which firms are located are particularly important. The sector is characterised by SMEs and a desire to be near local facilities (e.g. cafes, restaurants, business services) and transport options (including rail). Fairly central locations are therefore typically preferable to sites further out which may be considered isolated. For some parts of the sector, and in particular the higher value sub-sectors such as digital media, the availability of high speed internet is paramount. This factor can also sometimes confer additional attractiveness on more central locations.
Flexibility of premises is vital for many SMEs in the sector whose workload is highly variable due to the project nature of the work. Premises that offer short term leases and the ability to expand and contract the extent of floorspace taken are preferred. Affordability of space is also an important consideration, both for SMEs in the higher value of the sector and the lower value crafts and textiles based activity.
3.6 Market Signals: Views of Property Agents During the course of preparing the ELR semi-structured interviews have been held with commercial property agents and representatives of the business sector. Consultation is strongly promoted by the NPPF and the Council has been keen to ensure that the experience, knowledge and recommendations of these organisations feed into the ELR process. To date conversations to inform the ELR have been held with representatives of the following:
Chamber of Commerce
Maitland’s Estate Agents
Stratton Creber Commercial Property Consultants
Vickery Holman Property Consultants
The main points arising from these meetings are summarised below, under the headings that were used during the semi-structured interviews:

Plymouth City Council Employment Land Review 2011-2031
| Final | March 2015 Page 32
3.6.1 Nature of investment enquiries received
Question: Have you experienced a shift in the demand for premises in Plymouth during the period from 2006 until now?
A decline in activity has been experienced during the years of recession. Turnover in the letting of existing B class premises is increasing again, although not yet at the levels experienced during 2003/04 for instance.
With respect to construction of new premises, there is very limited developer interest at present as rental rates do not support viable development projects. Pre-lets would be necessary to bring forward large schemes, but there is currently not the inward investment interest that would enable this. New office buildings in the Derriford & Seaton area attract higher rentals (£14-15/ sq. m.) than the typically older (cellular) office stock in the City Centre (£11-12/sq. m.).
The following overall trends for different types of B use classes used are observed:
B1 Business – demand for office premises has been steady with demand now starting to increase. There is a good supply of existing space still to be let (e.g. Sutton Harbour, St Andrews Court, and the Royal Buildings – St Andrews Cross). Studio 5-11 on Millbay Road has been slow to let, but is now fully occupied. Overall it was considered that there is sufficient supply of vacant B1 premises for around 2 years.
B2 General Industrial – Manufacturing has been on a steady decline in Plymouth for many years and there is not the major inward investment that would drive demand for larger sites. Despite this existing locally based manufacturing businesses seem to be achieving strong sales growth in recent years which is driving demand for extensions to existing sites. There is also still domestic, home-grown, demand for B2 premises that typically involves relatively modest up-sizing. A significant trend in the demand for specialised high tech light industry was also identified, for which B1c units can be appropriate. These types of user are as comfortable in science and business park environments as B1 officer users.
B8 Storage & Distribution – the forecast for the relative increase in B8 floorspace is in line with national trends. One agent advises that they were currently dealing with two enquiries, one involving premises for 100,000 sq. ft. There is interest from food retailed in Plymouth for regional logistics and distribution space.
Question 2: In your view, is there a high demand for particular types of employment land or premises in Plymouth – in terms of use, size of premises or location?
A point reiterated on a number of occasions during the interviews was the need for and demand for premises within the A38 east corridor into Plymouth, in particular at Langage (located mainly within South Hams District). The suggestion was made that further plots need to come forward at Langage within the 2-5 year time period as demand is expected to pick-up over that timeframe. Langage was specifically recommended on the basis of its accessibility from the east, with further travel through to waterfront sites adding unwelcome additional travel times for certain types of businesses. This point was illustrated with an example of an online mail order business, which for the Plymouth area would only look at Langage.

Plymouth City Council Employment Land Review 2011-2031
| Final | March 2015 Page 33
Question 3: Other than the economic recession, what do you see as the main market trends influencing the take up of employment land in the city and surrounding area?
And, can you site any key reasons why companies decide to locate, or not, in Plymouth – in particular any local factors the Council could assist in addressing?
In responding to these questions, two principal themes were identified. Firstly, the remoteness of Plymouth from the east and midlands (London and Birmingham) is a key factor, and therefore investment in sites within the A38 East corridor was consistently suggested as essential. Agents highlighted the importance of driving time regulations for commercial vehicles in influencing the locational decisions of businesses. It was expressed that, while Council is actively supported waterfront regeneration (e.g. Millbay and Devonport) and encouraging the marine sector, often these sites are on the wrong side of the City for many companies. To encourage wider benefits from potential economic development to the east of the city, it was advised that improved transport links to the City Centre would be important (travel time from Langage to the Centre is around 20 minutes).
Given the relative remoteness of Plymouth, the importance of encouraging retention and growth of local firms was also emphasised, rather than a strategy of over-reliance on inward investment.
The second theme identified was the importance of grant funding and public sector support for kick-starting commercial development schemes, which otherwise entails a high level of risk for developers or would simply be unviable. Reference was made to the loss of the SWRDA and HCA’s tighter focus on mixed use or residential schemes, as well as incentives for businesses to invest, in comparison to Cornwall which has benefitted over a longer timeframe from European Union funding.
It was suggested that options for public sector support for schemes should be explored further. Reference was made to a previous Devon County Council initiative whereby the Council operated a policy of pre-letting new development to act as guarantor. While this results in public liability for rental payments, it was suggested that premises were generally let once constructed.
With reference to the local market, it was pointed out that business rates and property prices are typically lower in neighbouring Cornwall. This can be viewed as a strength for the employment land market within the wider Plymouth TTWA and ELR study area, in terms of the ability to cater to highly cost sensitive sectors.
Question 4: In terms of the portfolio of properties you are managing – are you able to indicate the proportion of vacant premises and how this compares to previous years?
It was suggested that the proportion of vacant premises remaining has been diminishing since last year, while one agent suggested that there is sufficient supply remaining for around 2 years.

Plymouth City Council Employment Land Review 2011-2031
| Final | March 2015 Page 34
3.6.2 Employment land supply and demand
Question 5: Are certain types of employment sites or premises difficult to find in Plymouth (is there an undersupply)?
It was emphasised that being able to offer a choice of sites is important, and currently there are limited options in terms of sites that are ‘shovel ready’. This general comment is of importance with reference to the quantity of ‘available, suitable and deliverable’ sites within the City. In particular, for larger sites in the order of 5,000 – 10,000sq. m., the advice was given that this can be difficult to cater for within Plymouth.
In terms of increasing the supply of office space in the short-term, it was recommended that there is scope for a programme of refurbishing existing buildings in the first part of the plan period. Older office buildings are often cellular in terms of layout and less attractive in the current market.
Should proposals for big industry (B2) come forward, then Langage within South Hams was promoted as a good option as there is potential to offer 10-15% discounts on energy and gas prices due to the co-location with power station.
Question 6: Are there certain types of employment sites or premises where there is an oversupply (surplus) in Plymouth?
The advice was given that there is no obvious oversupply of employment land in Plymouth, particularly taking account of the need to allow for choice and a certain level of churn within the market.
3.6.3 Alder King Market Monitor 2014
This report provides a review of the commercial market in the South West of England and Wales, using data and market analysis from 12 key regional centres, including Plymouth. The report makes the following observations about the office and industrial property markets in Plymouth;
Supply of office space currently far outstrips demand; however there is a lack of ‘Grade A’ space. Headline rents of City Centre and out of town locations are similar, with City Centre rents declining in the last 5 years to fall below those in out of town locations
The underlying trend in demand for industrial premises over the last 5 years is positive, whilst supply has fallen slightly. The supply is heavily weighted towards smaller units; with only 10% of available buildings being in excess of 1,000 sq. m. Headline rents have remained static over the last 5 years.
3.7 Market Signals: ELR Monitoring Information This section of the report seeks to take a look at employment land development rates over the period since the Core Strategy was adopted, utilising the Councils monitoring information.
3.7.1 Core Strategy Objectives and Targets
Strategic Objective 6 of the Core Strategy, ‘Delivering the Economic Strategy’, sought to ‘set a spatial planning framework through the LDF that supports the Councils Economic Strategy and Action Plan, helping to make Plymouth a place where people, business and an

Plymouth City Council Employment Land Review 2011-2031
| Final | March 2015 Page 35
outstanding natural environment converge to bring about sustainable prosperity and wellbeing for all.’ Progress towards achieving the strategic objective was to be measured against the following targets:
Delivery of employment land in the city, to achieve in the PPUA at least 4 hectares per annum employment land between 2006 and 2016, and 4.5 hectares per annum between 2016 and 2021.
Delivery of 13,000 m² new office development within the city per annum.
A net increase in the number of employees of approximately 1,800 per annum.
Identification of at least one site to be safeguarded for a major high quality inward investment opportunity, including potential public sector office relocations or a private sector regional headquarters.
Performance during the period 2006 - 2013 against each of these targets is summarised below, based on analysis of the Councils AMR information.
3.7.2 Employment land delivered (Ha) 2006-12
A total of 30.84 Ha of employment land (mixed B use classes) was delivered over the 7 year period, which is a good performance overall given the economic circumstances of the time. Based on the 2006 ELR employment land supply of 125.11 ha, the total supply of employment land would therefore have been reduced to 94.27 ha over the monitoring period. This does not, however, account for further employment land allocated through the Local Development Framework.
Average annual employment land delivery of 4.41ha per annum exceeds the target of 4 ha per annum established within the Core Strategy, although this hides large fluctuations from year to year. For instance, only 1.47ha was delivered during 2011/12. Notably, the equivalent average annual land taken up over the period 1995 to 2005 was 1.42ha10, so significantly lower than the overall pace of development during more recent years. As shown in Table 6, if the average employment land delivery rate of 4.41ha was to be maintained throughout the Plymouth Plan period (18 years to 2031), a total employment land requirement of 79.38ha would result. The scenarios set out in the table below are compared with employment land requirements based on economic projections in Chapter 4 of this ELR.
Table 6 - Projected employment land requirements based on historic development rates
1995 to 2005 2006 to 2013
1995 to 2013
Average annual employment land delivery 1.42Ha 4.41Ha 2.63Ha11
Total projected employment land delivery for Plymouth Plan (18 year period)
25.56Ha 79.38Ha 47.34Ha
10 Source: Plymouth Employment Land Review (2006), paragraph 4.16. 11 Note: this calculation allows for the employment land delivered during the intervening year 2005/06 of 2.21Ha, based on Plymouth CC monitoring information.

Plymouth City Council Employment Land Review 2011-2031
| Final | March 2015 Page 36
Figure 3: Annual Monitoring Report: Employment land delivered (Has) 2006-2013
3.7.3 New employment floorspace (m²) 2006-13
The level of employment floorspace delivered between 2006 and 2013 is more consistent year on year than for land, but with an overall downward progression in build rates. An average floorspace delivery figure of 11,344m² (mixed B class uses) is below the monitoring target of 13,000m², although this target was exceeded during the years 2007/08 and 2008/09.
Figure 4 - Annual Monitoring Report: Employment floorspace delivered (Has) 2005-2013

Plymouth City Council Employment Land Review 2011-2031
| Final | March 2015 Page 37
3.7.4 Employment land in the development pipeline (Ha) 2007-13
Monitoring information commencing in 2008 shows that the number of sites with planning permission, where construction has not yet started, has diminished rapidly over the monitoring period. This suggests that there has been an on-going process of building out existing planning permissions or lapsed consents, but limited activity with respect to submission of applications for new development during the years of economic stagnation. Data relating to sites under construction corroborates a view that construction activity has remained relatively stable during the period 2007 to 2013.
Figure 5 - Annual Monitoring Report: Employment Land in the Development Pipeline (Ha) 2007-2013
3.8 Economic Strategy & Market Signals: summary The performance of the priority sectors identified in Section 3.5 has been stable or improving, with marine industries benefitting from developments such as the Plymouth University New Marine Building and increasing employment levels in the sector, whilst medical and healthcare growth has been focussed on the residential care home and nursing home market, and the leisure and tourism sector has experienced some low level growth, but with a mixed performance in different sub-sectors. The advanced engineering sector, business services sector and creative industries have experienced some levels of contraction in the period since

Plymouth City Council Employment Land Review 2011-2031
| Final | March 2015 Page 38
the 2006 ELR. This was particularly acute for the business services sector during 2007/08 at the onset of recession.
The adopted Core Strategy (2007) and 2006 LES established the importance of the City Centre & Waterfront and Derriford & Seaton areas as key nodes for economic development within the City, supported by employment allocations on the A38 corridor and at Langage. The Council also sought to establish conditions for a diverse business base, which would require a wide variety of sites.
The Core Strategy identifies the need to provide 84 hectares of employment land in order to accommodate 27,500 new jobs across the PPUA up to 2016. The strategy states that this will be delivered predominantly from business parks such as those in the A38 Northern Corridor, with a particular focus on Plymouth International Medical and Technology Park and Plymouth Science Park. Moving beyond this period towards 2021, there will be a greater emphasis on development along the A38 corridor with the delivery of new communities such as Sherford requiring provision of accessible employment opportunities to the local population.
Investment queries within Plymouth’s administrative area were predominantly from UK companies, with most enquiries being from businesses requiring small to medium-sized premises between 100 - 500 sq. m. There has been a downward trend in investment enquiries following the 2007 recession, but recently demand for expansion or relocation has begun to increase, with indigenous businesses being key to this. The largest proportion of queries came from businesses in the priority sectors.
The Local Economic Strategy also identifies with the priority sectors, with a focus on marine industries and growth sectors such as the digital economy and science and research industry. The economic strategy states there is a need to invest in all forms of infrastructure, from communications to transport, in order to ensure continued growth in these expanding industries.
The responses from property agents suggests that there had been a steady demand for B1 uses and an increase in demand for B8 requirements in line with national trends. Over the period between 2006 and 2012 there has been a decline in B2 general industrial demands. Despite the steady demand reported for B1 uses, the Alder King Market Monitor report 2014 identified an oversupply of office space in the City.
In terms of the locations with the most demand, there had been a noticeable increase in demand for premises in the A38 East Corridor and Plympton areas over the period 2006-2012. However, there were concerns raised by agents about the accessibility of these areas in relation to the City Centre and Waterfront areas of Plymouth.
A review of Annual Monitoring information reveals that, despite the period of economic stagnation since the Core Strategy was adopted, delivery of employment land has remained relatively high at around 4.41 ha per annum (in comparison to a much lower pace of development of 1.42 ha during the period 1995 to 2005). Maintaining this trend rate of development over the Plymouth Plan period would result in a need for approximately 80ha in total.
Evidence from the ELR suggests there has been an on-going process of building-out existing planning permissions, but perhaps relatively limited activity in terms of the submission of new applications. As a result the supply chain of new premises may be running low.

Plymouth City Council Employment Land Review 2011-2031
| Final | March 2015 Page 39
4 Forecasting future employment space requirements
4.1 Overview This section assesses the total requirement for additional employment space within the Plymouth administrative area in the period to 2031. The assessment considers demand across industrial sectors making up the economy and the implications in terms of the types of B-class use space required.
The analysis within this section does not take into account existing commitments. This aspect is considered and adjustments made following the analysis of the supply side in Chapter 5.
4.2 Approach
4.2.1 Overview
The following diagram illustrates the key stages of the approach to estimating the future requirement for employment space. This process requires a number of assumptions in order to convert forecasts of growth in jobs across different industrial sectors to employment floorspace and land requirements. These are outlined in following sections.
Figure 6 - Approach to Assessing Land Requirements
Source: Arup (2014).
4.2.2 Employment growth scenarios
There are broadly three main forecasting techniques that can be used to forecast employment land requirements. These are:
Employment growth scenarios by sector
Mapping employment in different sectors to B-class uses
Translating employment by use class to floorspace (sq. m.)
Translating floorspace to land requirements (ha)
Converting net to gross employment land requirements

Plymouth City Council Employment Land Review 2011-2031
| Final | March 2015 Page 40
Labour demand forecasts – based on an economic model, these predict changes in employment by sector;
Labour supply forecasts – these take demographic dynamics as the driver and forecast changes in employment; and
Projections of past take-up – these roll forward trends in past take-up of employment land and floorspace.
There are advantages and disadvantages associated with each. Projecting forward past take-up on a linear basis assumes that the property market and economy will continue to behave as it has in the past, and that demand is not constrained by other factors. This is a significant constraint in terms of establishing an informed view of future demand. The approach applied in this ELR is based on labour demand forecasts. The advantage of this approach is that it enables both market conditions and the objectives of economic development policy to be taken into account.
For the purpose of this ELR, the following scenarios for employment growth over the period to 2031 have been analysed:
Scenario 1: Low - 7,102 jobs Scenario 2: Medium - 10,224 jobs Scenario 3: High (Pattern 1) – 18,520 jobs Scenario 4: High (Pattern 2) – 18,520 jobs
These scenarios reflect a range of different potential outcomes for employment growth in Plymouth and have been established through review of a number of independently produced employment forecasts.
The recently published Strategic Housing Market Needs Assessment (SHMNA) covering Plymouth is particularly relevant and forms a part of the evidence base for the emerging Plymouth Plan. The 2013 SHMNA runs three scenarios for projected population change over the plan period. These are based on different forecasts, namely:
Re-based ONS 2010-based Sub-National Population Projections (SNPP)
Employment-led Scenario (Experian), and
Employment-led Scenario (LEFM or Oxford Economics).
In its consideration of economic drivers of change, the 2013 SHMNA reviewed a wide range of forecasts. Plymouth’s economic projections are consistent in that they all show a departure from recent historic performance and an expansion in jobs. The projections suggest a substantial departure from historic employment trends with growth of between 400 and 900 jobs per annum. This compares with a period of job losses on average between 2001 and 2010 and is notably higher than the pace of job growth seen even pre-recession.
It is clear that there are considerable variations in forecast employment growth in Plymouth. Reflecting this range of possibilities, in this ELR the requirement for future employment space is assessed under a range of future scenarios for economic growth over the period to 2031. This enables consideration of the potential impacts of different levels of economic performance in Plymouth. The range of employment growth tested is consistent with the 2013 SHMNA.
Plymouth’s future economic performance will depend on a number of factors including the potential for specific policy measures to stimulate a higher rate of economic growth and the

Plymouth City Council Employment Land Review 2011-2031
| Final | March 2015 Page 41
broader macroeconomic performance of the UK economy. Accordingly, the analysis in the ELR incorporates four alternative scenarios for employment growth over the period.
These scenarios can be considered to represent different outcomes with respect to economic development policy and patterns of structural change in the employment base.
Broadly, the low scenario based on Oxford Economics projections is considered to represent the pessimistic case without taking account of the impact of economic development policy. The medium scenario represents a variation of this projection with higher growth being achieved in sectors with higher expected growth potential.
The two high scenarios take account of two potential alternative patterns of growth, both based on the absolute level of employment growth projected by Experian projections. The high scenario (Pattern 1) is based on Experian’s anticipated structural pattern of growth that includes a significant expansion in public sector jobs. The high scenario (Pattern 2) includes an alternative structural pattern of growth that reflects the emphasis of economic development policy and investment, potential to stem decline in the overall decline of the manufacturing sector through higher growth in advanced manufacturing and anticipated public expenditure reductions. Accordingly, this can be considered to be commensurate with the ‘policy on’ outcome, reflecting the positive economic influence of economic development policy and implementation of LES objectives.
The following table outlines the parameters of the scenarios including the source of employment growth projections and, where applicable, key assumptions applied in the ELR.
Table 7 - ELR Employment Growth Scenarios – 2013 to 2031
Scenario
Employment Growth
2011-2031 Source ELR assumptions
Low 7,102 Oxford Economics 2012 LEP projection
n/a
Medium 10,224 Oxford Economics 2012 LEP projection
Applies 30% higher growth in the following sectors to this projection:
Construction Accommodation, Food Services &
Recreation Professional and Other Private Services
High (1) 18,520 Experian UK Local Markets 2012 projection
n/a
High (2) 18,520 Experian UK Local Markets 2012 projection
Applies a different structural pattern of growth:
Higher growth in: Construction
Finance & Insurance Professional and Other Private Services A smaller contraction in manufacturing
employment A contraction in public sector jobs
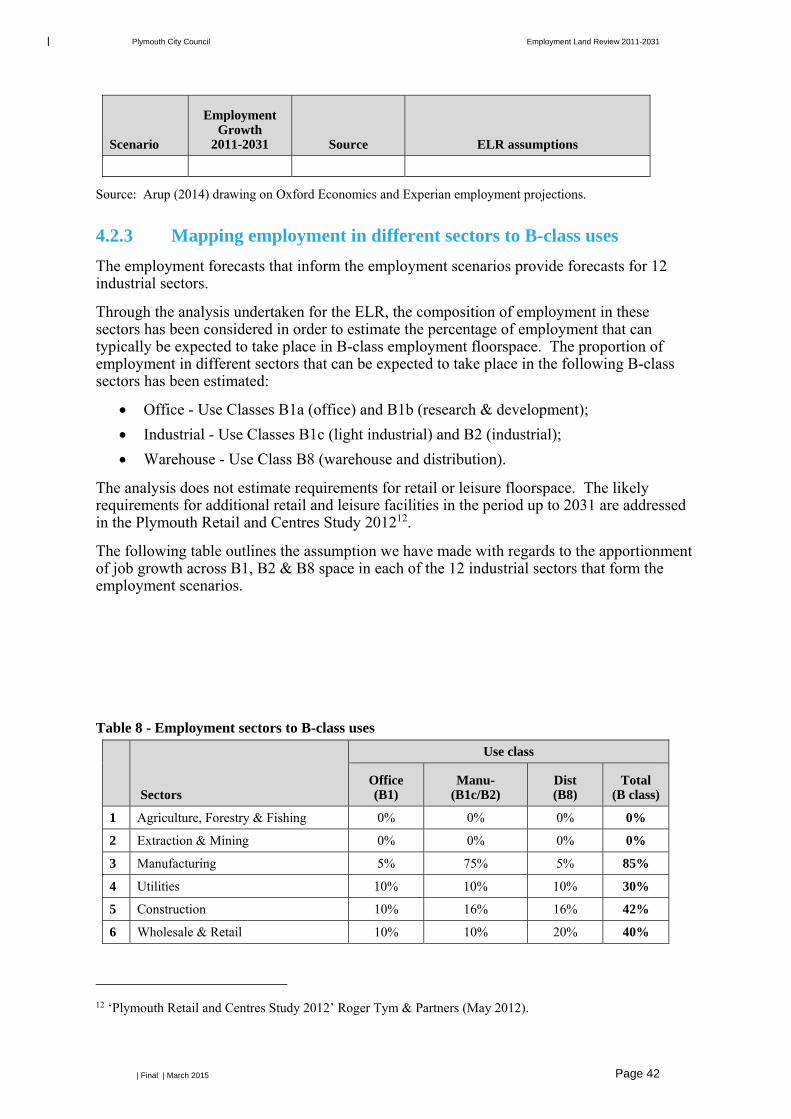
Plymouth City Council Employment Land Review 2011-2031
| Final | March 2015 Page 42
Scenario
Employment Growth
2011-2031 Source ELR assumptions
Source: Arup (2014) drawing on Oxford Economics and Experian employment projections.
4.2.3 Mapping employment in different sectors to B-class uses
The employment forecasts that inform the employment scenarios provide forecasts for 12 industrial sectors.
Through the analysis undertaken for the ELR, the composition of employment in these sectors has been considered in order to estimate the percentage of employment that can typically be expected to take place in B-class employment floorspace. The proportion of employment in different sectors that can be expected to take place in the following B-class sectors has been estimated:
Office - Use Classes B1a (office) and B1b (research & development); Industrial - Use Classes B1c (light industrial) and B2 (industrial); Warehouse - Use Class B8 (warehouse and distribution).
The analysis does not estimate requirements for retail or leisure floorspace. The likely requirements for additional retail and leisure facilities in the period up to 2031 are addressed in the Plymouth Retail and Centres Study 201212.
The following table outlines the assumption we have made with regards to the apportionment of job growth across B1, B2 & B8 space in each of the 12 industrial sectors that form the employment scenarios.
Table 8 - Employment sectors to B-class uses
Sectors
Use class
Office (B1)
Manu- (B1c/B2)
Dist (B8)
Total (B class)
1 Agriculture, Forestry & Fishing 0% 0% 0% 0%
2 Extraction & Mining 0% 0% 0% 0%
3 Manufacturing 5% 75% 5% 85%
4 Utilities 10% 10% 10% 30%
5 Construction 10% 16% 16% 42%
6 Wholesale & Retail 10% 10% 20% 40%
12 ‘Plymouth Retail and Centres Study 2012’ Roger Tym & Partners (May 2012).

Plymouth City Council Employment Land Review 2011-2031
| Final | March 2015 Page 43
7 Transport & storage 10% 10% 40% 60%
8 Accommodation, Food Services & Recreation 5% 20% 10% 35%
9 Information & communication 50% 10% 0% 60%
10 Finance & Insurance 100% 0% 0% 100%
11 Professional & Other Private Services 75% 5% 0% 80%
12 Public Services 70% 0% 10% 80%
Source: Arup (2014).
These assumptions are based on professional experience and established convention applied in undertaking ELRs nationally as well as best practice guidance published by ODPM on Employment Land Reviews13. A review of the local evidence base, including recent local planning applications, has also informed the process.
Not all employment growth will be associated with allocated employment sites; a considerable proportion of jobs in any area will be associated with existing facilities, such as public health and education that will accommodate significant employment growth within existing premises. Accordingly, it is important to take account of the distinction between growth in economic activity that requires additional employment and that instead arises from productivity gains.
In the case of the construction sector, in which significant employment growth is forecast in Plymouth, there isn't a consistent approach across ELRs nationally. The construction sector is also atypical in the nature of demand its demand for employment space (due to the mobile nature of many of its workers). The assumption applied in this ELR is based upon the split between manual and non-manual posts14. This split is used to drive the assumption with manual jobs being mobile and construction site based and non-manual roles requiring a mix of office/B2/B8 space.
4.2.4 Translating employment by use class to floorspace (sq. m.)
In order to translate employment by use class into floorspace requirements, an average employment density (sq. m. per FTE job) is applied.
In this ELR, recent guidance in relation to employment densities published by the HCA15 is utilised, as outlined in the following table.
Table 9 - Employment densities
Sq. m. per job HCA Guide 2nd Edition (2010)
Office space (B1, a, b) 12 General office
Manufacturing space (B1c/B2) 41.5 Average of B1c and B2
Distribution (B8) 70 General
Source: Arup (2014) drawing on HCA Employment Densities Guidance.
13 Employment Land Reviews – Guidance Note ODPM (December 2004) 14 ‘Survey of Employment by Occupation in the Construction Industry 2011’ prepared for CITB Construction Skills (March 2012). 15 ‘Employment Densities Guide’ 2nd Edition, HCA (2010).

Plymouth City Council Employment Land Review 2011-2031
| Final | March 2015 Page 44
Recent local evidence drawn from planning applications for major employment sites in Plymouth has been reviewed in order to validate the application of these densities to Plymouth.
4.2.5 Translating floorspace to land requirements (ha)
Floorspace is translated into land requirements by applying a plot ratio. Plot ratios describe the difference between the level of employment floorspace on a site and the site area. A plot ratio of 1 means that a development of 10,000 sq. m. GEA of floorspace would sit on a 1 hectare (10,000 sq. m.) site. Plot ratios are influenced by the height of buildings, parking standards and other space requirements on the site (e.g. green space and communal areas).
The 2004 ODPM guidance indicates that plot ratios on business parks can vary between 0.25 – 0.4, for industrial premises from 0.35 to 0.45 and for warehouse development between 0.4 – 0.6. Plot ratios for town centre offices can be higher, with densities up to and exceeding 2.0.
In this ELR, the average plot ratios applied are outlined in the following table.
Table 10 – Plot ratios
Plot ratio
Office (B1, a, b)
Town Centre sites - Selected opportunities 3
Town Centre sites - High accessibility 1.5
Town Centre sites – Typical 0.8
Out of centre 0.4
Manufacturing (B1c, B2) 0.4
Distribution (B8) 0.4
Source: Arup (2014) drawing on ODPM Guidance and local evidence.
This approach takes into account the potential for plot ratios for office space to vary considerably depending on location. Offices, especially in town and city centres, can be built at much higher densities and depending on the number of storeys; very high plot ratios are achievable.
To enable this, the following four typologies are defined:
Town centre (selected opportunities) – sites with good accessibility and large building footprint, typically 4-6 storeys in height;
Town centre (high accessibility) – sites with good accessibility; Town centre (typical) – sites located in the town centre with typical characteristics; and Out of centre – sites located out of the town centre.
An average plot ratio of 0.4 has been used for both manufacturing (B1c, B2) and distribution (B8) space. This figure is in line with recognised convention applied in ELRs across the country. A review of recent local planning applications in Plymouth in relation to the precision manufacturing sector (a sector in which growth is anticipated) was also undertaken. This validated the assumption of 0.4 to be reasonable plot ratio.
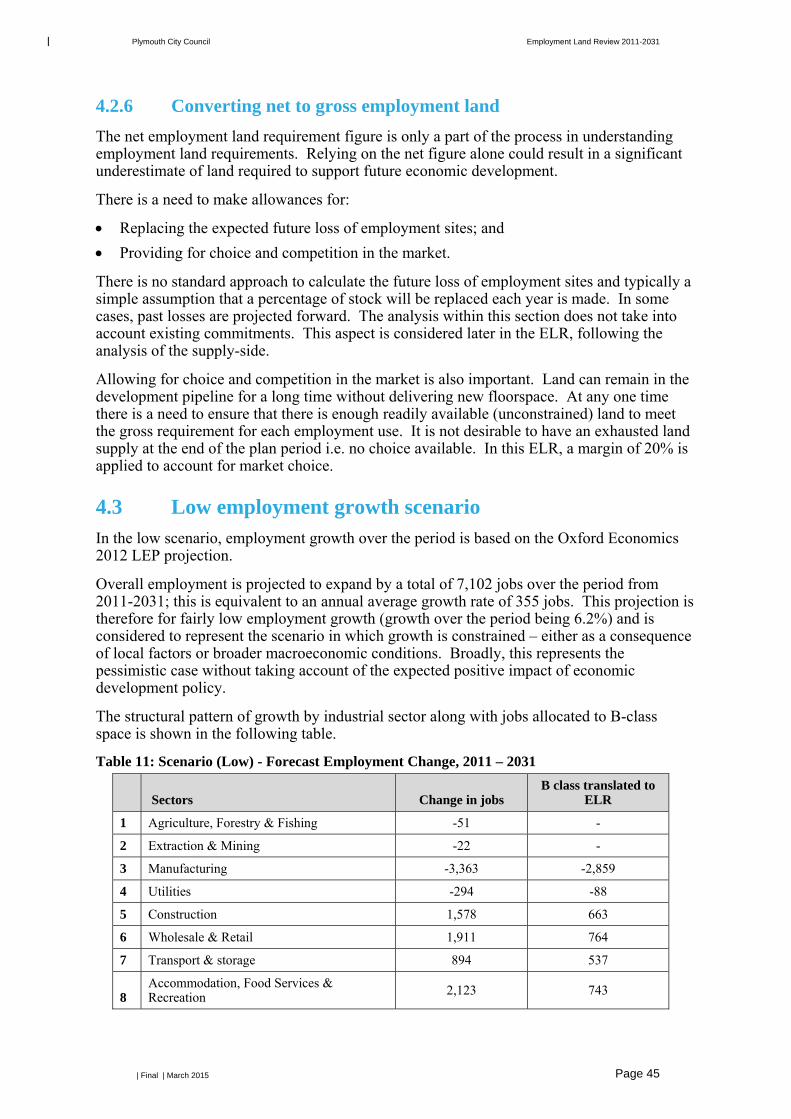
Plymouth City Council Employment Land Review 2011-2031
| Final | March 2015 Page 45
4.2.6 Converting net to gross employment land
The net employment land requirement figure is only a part of the process in understanding employment land requirements. Relying on the net figure alone could result in a significant underestimate of land required to support future economic development.
There is a need to make allowances for:
Replacing the expected future loss of employment sites; and Providing for choice and competition in the market.
There is no standard approach to calculate the future loss of employment sites and typically a simple assumption that a percentage of stock will be replaced each year is made. In some cases, past losses are projected forward. The analysis within this section does not take into account existing commitments. This aspect is considered later in the ELR, following the analysis of the supply-side.
Allowing for choice and competition in the market is also important. Land can remain in the development pipeline for a long time without delivering new floorspace. At any one time there is a need to ensure that there is enough readily available (unconstrained) land to meet the gross requirement for each employment use. It is not desirable to have an exhausted land supply at the end of the plan period i.e. no choice available. In this ELR, a margin of 20% is applied to account for market choice.
4.3 Low employment growth scenario In the low scenario, employment growth over the period is based on the Oxford Economics 2012 LEP projection.
Overall employment is projected to expand by a total of 7,102 jobs over the period from 2011-2031; this is equivalent to an annual average growth rate of 355 jobs. This projection is therefore for fairly low employment growth (growth over the period being 6.2%) and is considered to represent the scenario in which growth is constrained – either as a consequence of local factors or broader macroeconomic conditions. Broadly, this represents the pessimistic case without taking account of the expected positive impact of economic development policy.
The structural pattern of growth by industrial sector along with jobs allocated to B-class space is shown in the following table.
Table 11: Scenario (Low) - Forecast Employment Change, 2011 – 2031
Sectors Change in jobs B class translated to
ELR
1 Agriculture, Forestry & Fishing -51 -
2 Extraction & Mining -22 -
3 Manufacturing -3,363 -2,859
4 Utilities -294 -88
5 Construction 1,578 663
6 Wholesale & Retail 1,911 764
7 Transport & storage 894 537
8 Accommodation, Food Services & Recreation 2,123 743

Plymouth City Council Employment Land Review 2011-2031
| Final | March 2015 Page 46
9 Information & communication 251 151
10 Finance & Insurance -274 -274
11 Professional & Other Private Services 5,266 4,212
12 Public Services -916 -733
7,102 3,116
Source: Arup (2014) using Oxford Economics forecasts.
According to the forecasts, the largest expansions in employment are expected in the professional & other private services (+5,266 jobs), accommodation, food services & recreation (+2,123 jobs) and wholesale & retail (+1,911 jobs) sectors.
Only a proportion of the growth in these sectors is assumed to translate into a requirement for core B-class space (as outlined previously in Table 6). The following table provides an overview of projected employment growth translated into B-class floorspace class categories.

Plymouth City Council Employment Land Review 2011-2031
| Final | March 2015 Page 47
Table 12: Scenario (Low) - Forecast Employment Change by Use Class, 2011 – 2031
Sectors Office (B1)
Manu (B1c/B2)
Dist (B8)
Total (B class)
1 Agriculture, Forestry & Fishing - - - -
2 Extraction & Mining - - - -
3 Manufacturing -168 -2,523 -168 -2,859
4 Utilities -29 -29 -29 -88
5 Construction 158 252 252 663
6 Wholesale & Retail 191 191 382 764
7 Transport & storage 89 89 358 537
8 Accommodation, Food Services & Recreation 106 425 212 743
9 Information & communication 126 25 - 151
10 Finance & Insurance -274 - - -274
11 Professional & Other Private Services 3,949 263 - 4,212
12 Public Services -641 - -92 -733
Total 3,506 -1,306 916 3,116
Source: Arup (2014) using Oxford Economics forecasts.
These forecasts indicate an overall expansion of around 3,116 jobs in the core B-class use categories over the period to 2031. This is driven by projected expansions in employment in sectors associated with office and distribution space that outweighs the projected jobs losses in the manufacturing sector.
4.4 Medium employment growth scenario The medium employment growth scenario is a variation of the low scenario; reflecting the potential for higher growth to be achieved in selected sectors. It is based on the Oxford Economics 2012 LEP projection with an adjustment applied.
The scenario assumes that total employment growth over the period is 30% higher than in the low scenario in the following three sectors:
Construction; Accommodation, food services & recreation; and Professional and other private services.
These are sectors that demonstrate particular growth potential in Plymouth.
Overall employment is projected to expand by a total of 10,224 jobs over the period from 2011 to 2031; this is equivalent to an annual average growth rate of 511 jobs. This projection is therefore for moderate employment growth (growth of 8.8% over the period) and could be considered to represent the scenario in which growth is not significantly constrained – either as a consequence of local factors or broader macroeconomic conditions. It is not considered to reflect the potential for positive impacts arising from proactive economic development policy however.
The structural pattern of growth by industrial sector along with jobs allocated to B-class space is shown in the following table.

Plymouth City Council Employment Land Review 2011-2031
| Final | March 2015 Page 48
Table 13: Scenario (Medium) - Forecast Employment Change, 2011 – 2031
Sectors Change in jobs B class translated
to ELR
1 Agriculture, Forestry & Fishing -51 -
2 Extraction & Mining -22 -
3 Manufacturing -3,363 -2,859
4 Utilities -294 -88
5 Construction 2,135 897
6 Wholesale & Retail 1,911 764
7 Transport & storage 894 537
8 Accommodation, Food Services & Recreation 2,836 993
9 Information & communication 251 151
10 Finance & Insurance -274 -274
11 Professional & Other Private Services 7,118 5,695
12 Public Services -916 -733
10,224 5,081
Source: Arup (2014) using Oxford Economics forecasts.
In this scenario, the largest expansions in employment are expected in the professional & other private services (+7,118 jobs), accommodation, food services & recreation (+2,836 jobs) and construction (+2,135 jobs).
Only a proportion of the growth in these sectors is assumed to translate into a requirement for core B-class space (as outlined previously in Table 6). The following table provides an overview of projected employment growth translated into B-class floorspace class categories.
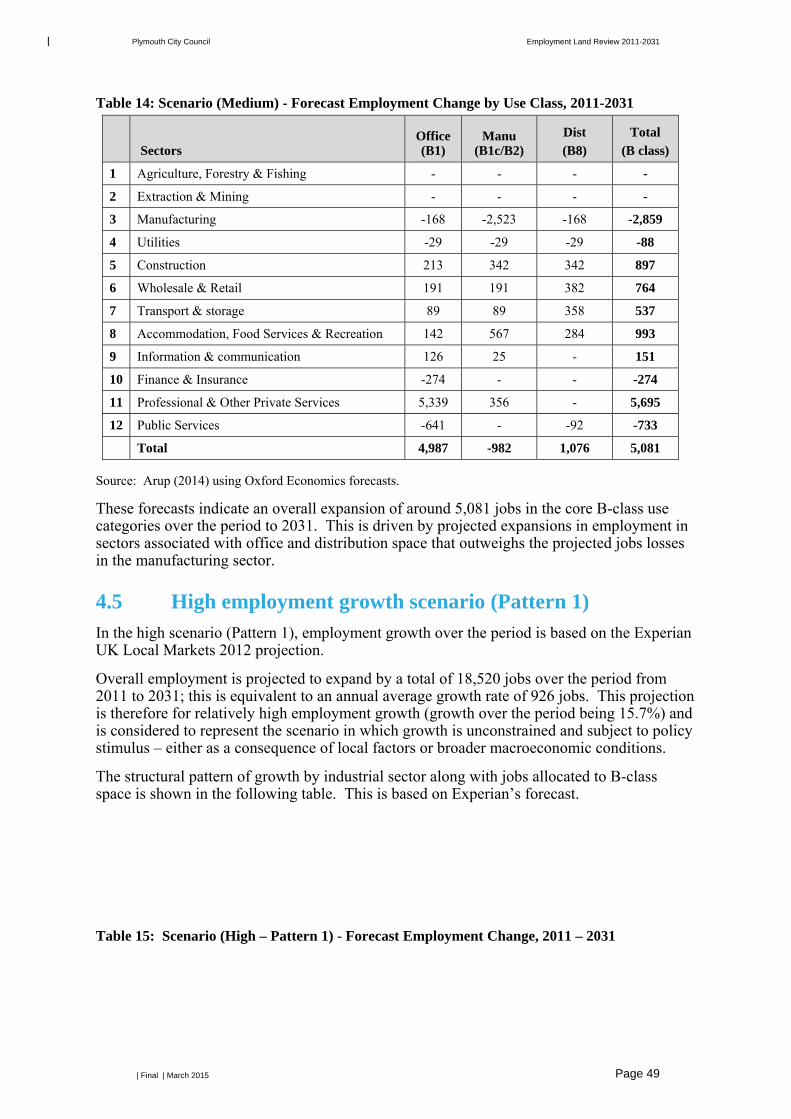
Plymouth City Council Employment Land Review 2011-2031
| Final | March 2015 Page 49
Table 14: Scenario (Medium) - Forecast Employment Change by Use Class, 2011-2031
Sectors Office (B1)
Manu (B1c/B2)
Dist (B8)
Total (B class)
1 Agriculture, Forestry & Fishing - - - -
2 Extraction & Mining - - - -
3 Manufacturing -168 -2,523 -168 -2,859
4 Utilities -29 -29 -29 -88
5 Construction 213 342 342 897
6 Wholesale & Retail 191 191 382 764
7 Transport & storage 89 89 358 537
8 Accommodation, Food Services & Recreation 142 567 284 993
9 Information & communication 126 25 - 151
10 Finance & Insurance -274 - - -274
11 Professional & Other Private Services 5,339 356 - 5,695
12 Public Services -641 - -92 -733
Total 4,987 -982 1,076 5,081
Source: Arup (2014) using Oxford Economics forecasts.
These forecasts indicate an overall expansion of around 5,081 jobs in the core B-class use categories over the period to 2031. This is driven by projected expansions in employment in sectors associated with office and distribution space that outweighs the projected jobs losses in the manufacturing sector.
4.5 High employment growth scenario (Pattern 1) In the high scenario (Pattern 1), employment growth over the period is based on the Experian UK Local Markets 2012 projection.
Overall employment is projected to expand by a total of 18,520 jobs over the period from 2011 to 2031; this is equivalent to an annual average growth rate of 926 jobs. This projection is therefore for relatively high employment growth (growth over the period being 15.7%) and is considered to represent the scenario in which growth is unconstrained and subject to policy stimulus – either as a consequence of local factors or broader macroeconomic conditions.
The structural pattern of growth by industrial sector along with jobs allocated to B-class space is shown in the following table. This is based on Experian’s forecast.
Table 15: Scenario (High – Pattern 1) - Forecast Employment Change, 2011 – 2031

Plymouth City Council Employment Land Review 2011-2031
| Final | March 2015 Page 50
Sectors Change in jobs
B class translated to ELR
1 Agriculture, Forestry & Fishing -100 -
2 Extraction & Mining -20 -
3 Manufacturing -2,650 -2,253
4 Utilities 310 93
5 Construction 340 143
6 Wholesale & Retail 2,310 924
7 Transport & storage 1,470 882
8 Accommodation, Food Services & Recreation 2,800 980
9 Information & communication 710 426
10 Finance & Insurance 440 440
11 Professional & Other Private Services 7,350 5,880
12 Public Services 5,560 4,448
18,520 11,963
Source: Arup (2014) using Experian forecasts.
According to the forecasts, the largest expansions in employment are expected in the professional & other private services (+7,350 jobs), public services (+5,560 jobs) and accommodation, food services & recreation (+2,800 jobs) sectors. This pattern of growth therefore includes a significant expansion in public sector jobs alongside private sector employment.
Only a proportion of the growth in these sectors is assumed to translate into a requirement for core B-class space (as outlined previously in Table 6). The following table provides an overview of projected employment growth translated into B-class floorspace class categories.
Table 16: Scenario (High -Pattern 1) - Forecast Employment Change by Use Class, 2011 – 2031
Sectors Office (B1)
Manu (B1c/B2)
Dist. (B8)
Total (B class)
1 Agriculture, Forestry & Fishing - - - -
2 Extraction & Mining - - - -
3 Manufacturing -133 -1,988 -133 -2,253
4 Utilities 31 31 31 93
5 Construction 34 54 54 143
6 Wholesale & Retail 231 231 462 924
7 Transport & storage 147 147 588 882
8 Accommodation, Food Services & Recreation 140 560 280 980
9 Information & communication 355 71 - 426
10 Finance & Insurance 440 - - 440
11 Professional & Other Private Services 5,513 368 - 5,880

Plymouth City Council Employment Land Review 2011-2031
| Final | March 2015 Page 51
Sectors Office (B1)
Manu (B1c/B2)
Dist. (B8)
Total (B class)
12 Public Services 3,892 - 556 4,448
Total 10,650 -526 1,839 11,963
Source: Arup (2014) using Experian forecasts.
These forecasts indicate an overall expansion of around 11,963 jobs in the core B-class use categories over the period to 2031. This is driven by projected expansions in employment in sectors associated with office and distribution space.
4.6 High employment growth scenario (Pattern 2) In the high scenario (Pattern 2), employment growth over the period is based on the Experian UK Local Markets 2012 projection with an adjustment to the structural of pattern of growth toward the private sector. The aggregate level of employment growth over the period remains unchanged.
The scenario assumes the following changes to the structural pattern of growth projected by the Experian projections:
Higher growth in private sector employment in three key sectors: construction, finance & insurance and professional & other private services;
A smaller contraction in manufacturing employment; and A contraction in public sector jobs.
These changes result in an alternative structural pattern of growth that reflects the emphasis of economic development policy and investment in private sector job creation. The potential to stem the overall decline of the manufacturing sector is championed through higher growth in the advanced manufacturing sub-sector, as well as the expected impact of public expenditure reduction on public sector employment. Accordingly, this can be considered to be commensurate with the ‘policy on’ outcome, reflecting the positive economic influence of economic development policy. In particular, this structural pattern of growth is more consistent with the emphasis of economic development policy and investment than that in the high scenario (Pattern 1).
Overall employment is projected to expand by a total of 18,520 jobs over the period from 2011 to 2031; this is equivalent to an annual average growth rate of 926 jobs. This projection is therefore for relatively high employment growth (growth over the period being 15.7%).
The structural pattern of growth by industrial sector along with jobs allocated to B-class space is shown in the following table. This is based on Experian’s forecast with adjustments made based on local economic intelligence and discussions with the economic development department of PCC.
Table 17: Scenario (High – Pattern 2) - Forecast Employment Change, 2011 – 2031
Sectors Change in jobs
B class translated to ELR
1 Agriculture, Forestry & Fishing -51 -
2 Extraction & Mining -22 -

Plymouth City Council Employment Land Review 2011-2031
| Final | March 2015 Page 52
3 Manufacturing -1,000 -850
4 Utilities -294 -88
5 Construction 3,156 1,325
6 Wholesale & Retail 1,911 764
7 Transport & storage 894 537
8 Accommodation, Food Services & Recreation 2,836 993
9 Information & communication 377 226
10 Finance & Insurance 750 750
11 Professional & Other Private Services 10,880 8,704
12 Public Services -916 -733
18,520 11,628
Source: Arup (2014) using Experian forecasts.
In this scenario, the largest expansions in employment are expected in the professional & other private services (+10,880 jobs), construction (+3,156 jobs) and accommodation, food services & recreation (+2,836 jobs) sectors.
Only a proportion of the growth in these sectors is assumed to translate into a requirement for core B-class space (as outlined previously in Table 6). The following table provides an overview of projected employment growth translated into B-class floorspace class categories.
Table 18: Scenario (High – Pattern 2) - Forecast Employment Change by Use Class, 2011 – 2031
Sectors Office (B1)
Manu (B1c/B2)
Dist (B8)
Total (B class)
1 Agriculture, Forestry & Fishing - - - -
2 Extraction & Mining - - - -
3 Manufacturing -50 -750 -50 -850
4 Utilities -29 -29 -29 -88
5 Construction 316 505 505 1,325
6 Wholesale & Retail 191 191 382 764
7 Transport & storage 89 89 358 537
8 Accommodation, Food Services & Recreation 142 567 284 993
9 Information & communication 189 38 - 226
10 Finance & Insurance 750 - - 750
11 Professional & Other Private Services 8,160 544 - 8,704
12 Public Services -641 - -92 -733
Total 9,116 1,155 1,357 11,628
Source: Arup (2014) using Experian forecasts.
This scenario indicates an overall expansion of around 11,628 jobs in the core B-class use categories over the period to 2031. This is driven primarily by projected expansion in

Plymouth City Council Employment Land Review 2011-2031
| Final | March 2015 Page 53
employment in sectors associated with office space, and to a lesser extent in manufacturing and distribution space.
4.7 Implications for employment space Drawing together the results from the alternative employment growth scenarios, the following table summarises the net floor-space requirement up to 2031 by core B-class use. This is based on the employment densities established in Table 9.
Table 19: Net Floorspace Requirements (sq. m.), 2011 – 2031
Net floorspace needs (sq. m.) 2011-2031
Low Medium High (1) High (2)
Office space (B1, a, b) 42,076 59,846 127,800 109,391
Manufacturing space (B1c/B2) -54,196 -40,739 -21,812 47,927
Distribution (B8) 64,086 75,312 128,723 95,016
Total B-class space 51,966 94,419 234,711 252,334
Source: Arup (2014) using Oxford Economics and Experian forecasts.
These forecasts reflect a range of potential space requirements. For office space (B1, a, b), the range is between 42,076 sq. m. and 127,800 sq. m. For manufacturing space (B1c/B2), it is from -54,196 sq. m. to 47,927 sq. m. and for distribution (B8) between 64,086 sq. m. and 128,723 sq. m.
To allow for choice, competition and healthy churn in the market, a margin should be applied to these figures. The results of applying a 20% margin (also used in other contemporary ELRs) are shown in the following table. Table 20 – Net Floorspace Requirements (sq. m.) with 20% Margin, 2011 – 2031
Net floorspace needs (sq. m.) 2011-2031
Low Medium High (1) High (2)
Office space (B1, a, b) 50,491 71,815 153,360 131,269
Manufacturing space (B1c/B2) -54,196 -40,739 -21,812 57,512
Distribution (B8) 76,903 90, 374 154,468 114,019
Total B-class space 73,198 121,450 329,640 302,800
Source: Arup (2014) using Oxford Economics and Experian forecasts. Note: Margin only applied to positive floorspace requirements.
Net floorspace requirements are translated into land requirements by applying a plot ratio (using the ratios established in Table 10). The resulting land requirements are set out in the following table:
Table 21: Net Land Requirements (ha), 2011 – 2031
Net land needs (ha) 2011-2031
Low Medium High (1) High (2)
Office space (B1, a, b) 4.73 6.72 14.36 12.29
Manufacturing space (B1c/B2) -13.55 -10.18 -5.45 11.98
Distribution (B8) 16.02 18.83 32.18 23.75
Total B-class space 7.20 15.37 41.09 48.03

Plymouth City Council Employment Land Review 2011-2031
| Final | March 2015 Page 54
Source: Arup (2014) using Oxford Economics and Experian forecasts.
To allow for choice and competition in the market, a margin can be applied. The results of applying a 20% margin are shown in Table 22. Other local authorities have taken the approach of adding two years’ additional supply to net land requirements as a buffer to ensure supply is not constrained, but this has not been done with the results presented below.
Table 22 – Net Land Requirements (ha) with 20% Margin, 2011 – 2031
Low Medium High (1) High (2)
Office space (B1, a, b) 5.67 8.07 17.23 14.75
Manufacturing space (B1c/B2) -13.55 -10.18 -5.45 14.38
Distribution (B8) 19.23 22.59 38.62 28.50
Total B-class space 11.35 20.48 50.40 57.63
Source: Arup (2014) using Oxford Economics and Experian forecasts. Note: Margin only applied to positive floorspace requirements.
As outlined in the approach, further granularity is provided to the analysis by taking into account the potential for plot ratios for office space to vary considerably depending on location. The results are outlined by typology in the following table:
Table 23 : Office Land Requirements (ha), 2011 – 2031
Low Medium High (1) High (2)
Town Centre sites - Selected opportunities 0.47 0.67 1.44 1.23
Town Centre sites - High accessibility 0.47 0.67 1.44 1.23
Town Centre sites – Typical 1.42 2.02 4.31 3.69
Out of centre 2.36 3.36 7.18 6.15
Total Office Space 4.73 6.72 14.36 12.29
Source: Arup (2014) using Oxford Economics and Experian forecasts.
A 20% margin can also be applied to these figures:
Table 24: Office Land Requirements (ha) with 20% Margin, 2011 – 2031
Low Medium High (1) High (2)
Town Centre sites - Selected opportunities 0.57 0.81 1.72 1.47
Town Centre sites - High accessibility 0.57 0.81 1.72 1.47
Town Centre sites – Typical 1.70 2.42 5.17 4.42
Out of centre 2.84 4.03 8.62 7.37
Total Office Space 5.67 8.07 17.23 14.75
Source: Arup (2014) using Oxford Economics and Experian forecasts.
4.8 Summary The analysis summarised in this Chapter forms the basis of the assessed requirement for future employment space under four alternative future scenarios for employment growth in Plymouth over the period to 2031.

Plymouth City Council Employment Land Review 2011-2031
| Final | March 2015 Page 55
This enables consideration of the potential impacts of different levels of economic performance in Plymouth on employment land requirements. Plymouth’s future economic performance will depend on a number of factors including the potential for specific policy measures to stimulate a higher rate of economic growth as well as the broader macroeconomic performance of the UK economy. The implementation of the recently agreed City Deal and emerging Local Economic Strategy will also be critical in unlocking growth and improving competitiveness across sectors.
Given the aspirations of the Plymouth Plan for a step change in growth over the period the high pattern of growth encapsulated in Scenario 4 has been selected as the option which should be considered with respect to the resulting demand for employment land.
Plymouth City Council Employment Land Review 2011-2031
| Final | March 2015 Page 56
5 Supply of Employment Land
5.1.1 Building a picture of the existing employment land supply
In response to the analysis undertaken within Section 4, it is necessary to identify both the quantity and distribution of existing employment land, and assess the viability and deliverability of future sites to respond to the potential growth or shrinkage of the demand for B1, B2 and B8 employment space as forecast in Chapter 4.
In order to establish a baseline of the existing supply of employment land and premises available within the Plymouth administrative area (and areas of the PPUA adjacent to the administrative boundary), data from the following sources has been compared and aligned:
the 2006 Plymouth ELR;
the PCC Employment Land Survey 2012-13,
consented and lapsed planning permissions backdated to April 201116; and
representations received through the 2013 Call for Sites.
The composite land and sites schedule which pulls together data from these four sources has been reviewed and agreed with PCC officers as an accurate record of the current land supply as of July 2014. The steps taken to derive the schedule are explained in further detail below.
5.1.2 Sites carrying forward from the 2006 ELR
The 2006 ELR identified 54 potential employment sites, comprising of sites in the following three categories:
Local Plan allocations; Sites with planning permission; and Vacant industrial sites.
Overall, the 2006 ELR identified an employment land supply of approximately 165ha. This figure included sites partly or wholly within South Hams at Langage, Sherford and Roborough. Discounting sites in neighbouring authority areas resulted in an overall supply within the administrative boundary of around 94ha (in 2006). We have reviewed this list to discount sites from the 2006 schedule that have been subsequently developed and fully implemented. The change in status of the 2006 ELR rollover sites was reviewed and updated during the process of preparing the 2014 land supply position.
5.1.3 Opportunities identified through the 2013 Call for Sites
Section 2.7.1 of this study provides a summary of the feedback received through the ELR survey and call for sites consultation which took place in the last quarter of 2013. An overview of the results from the call for sites can be found in Appendix E. Representations
16 The base year for the job forecasts within the ELR Employment Growth Scenarios was set as 2011. To correspond with this base year it was agreed that April 2011 should be the starting point for the supply side analysis. All planning permissions (live and lapsed) for B1, B2 & B8 use types between 1st April 2011 and Quarter 2 of 2014 were identified and incorporated into the overall employment land supply.

Plymouth City Council Employment Land Review 2011-2031
| Final | March 2015 Page 57
were received in relation to the following sites, which have not previously been identified through the review work:
Stonehouse Creek Car Park: this land is owned by the Council and measures approx. 1.17ha (2.9 acres). It is possible that in the future this land will be used as a park and ride facility for Royal William Yard, providing enabling infrastructure for the mixed-use development.
Former Imerys Site, Coypool: the representation received states that this site, which is allocated in the Plymouth Waste Development Plan Document (2008), should not be reconsidered for future employment use. 17
Laira Rail Depot: the representation from Network Rail states there is a possibility that some or all of the 7.6ha (19 acre) and 2.85ha (7 acre) sites could be released from current railway operational land requirements for development during the plan period.
With respect to the former Imerys site, it will be for the Council to decide whether the existing status of the site should be safeguarded or if the site should be released for an alternative use. However for ELR update purposes we have assumed that both Laira Rail Depot and Coypool could form part of the employment land supply, albeit towards the end of the plan period. Stonehouse Creek Car Park has been removed from the supply as alternative use as a park and ride facility for Royal William Yard is being actively considered by the Council.
5.1.4 Desk-based site appraisals and site visits
Established employment areas across the City have also been surveyed to identify the extent of undeveloped plots, stock vacancy rates and opportunities for infill, intensification or demolition and redevelopment of older stock. The information collected was informed by a desk-based study including a planning history search, map data and ownership data, amongst a number of other criteria set out in Section 5.4. These were then checked and confirmed for accuracy during a site appraisal workshop with Plymouth City Council.
5.1.5 Employment Land Supply - 2014 Site Schedule
Information rolled forward from the 2006 ELR, the 2013 call for sites, data from planning permissions, sites identified through the appraisal process, and sites allocated for employment in development plans were collated to produce an updated schedule of sites dated September 2014. The information within the 2014 Site Schedule (Appendix F) is based on the following sources of data:
Existing employment sites with potential for intensification and expansion; Planning permissions – all planning permissions, including those that have lapsed, that
contain an element of B class land use where planning decisions were made from April 2011 to the end of 2013.
17 Whilst PCC recognise the representation made by Imerys regarding the Coypool site, it should be noted that the Council wish to see at least some, if not all, of the site put forward for employment use.
Further work is required to assess the appropriateness of certain uses on the site following the Council recommendation to remove the site’s allocation in the Waste DPD.

Plymouth City Council Employment Land Review 2011-2031
| Final | March 2015 Page 58
Sites allocated in adopted plans – site allocations in the Core Strategy and the 6 adopted Area Action Plans for Central Park, City Centre and University, Devonport, Millbay and Stonehouse, North Plymstock and Sutton Harbour.
Sites put forward from the call for sites undertaken as part of this ELR update – this includes the Laira Rail Depot and Coypool.
Other sites – these include; sites formerly owned by the MOD, and sites put forward in development plan documents such as the Waste DPD and the Derriford and Seaton AAP (submission version 2012) that may come forward for development for employment uses.
5.2 Estimated quantity of employment land 2014 Within the administrative area a total of 126 sites have been identified for further consideration as employment sites for the plan period to 2031. 110 of these sites, have withstood further evaluation and are expected to contribute to the actual employment land supply with the Plymouth Plan period.
Sites that had been through the planning process, whether implemented, granted and not yet built, or lapsed, were considered to be appropriate for inclusion in the employment land supply. Other sites, sites for intensification or expansion, and sites put forward in development plans were assessed in terms of deliverability. This assessment included:
Determining whether the landowner was willing to develop the land or if it was available for development.
Identifying if the site is suitable for development as guided by the local development plan and other appropriate policy and market and industry requirements.
Investigating how achievable the development is in terms of viability And if it is viable, understanding the capacity of a developer to implement and let or sell
the development over the Plymouth Plan period, to 2031
7 sites were identified as being available and suitable for intensification and expansion using the process discussed above.
By applying the approach above, 78 planning applications had either been implemented or were in the planning process and had been identified as being likely to come forward for development within the plan period
Lapsed permissions have also been included. These sites have been considered appropriate for employment use through the consents process, however for a variety of reasons the sites have not yet been implemented. There is the potential that these applications may be renewed or built out in the plan period so we have allowed for them in the 2014 land supply estimate.
Totalling all sites together that were considered to meet the necessary criteria above, the baseline employment land supply for Plymouth is estimated to be circa 99.6 ha within Plymouth’s Administrative Area as of September 2014. The table below provides a more detailed breakdown of the categories of employment land deemed available over the plan period within the administrative area and the South Hams part of the PPUA.

Plymouth City Council Employment Land Review 2011-2031
| Final | March 2015 Page 59
Table 25 – 2014 Arup estimated baseline employment land supply within the Administrative Area
Main employment areas
Intensification on existing
employment sites
Planning permissions – lapsed, completed
or pending completion
Sites allocated or put forward in Development
Plans
Other Sites
Sub-total
Plymouth Administrative Area 7.2ha 44.3ha 11.4ha 36.7ha 99.6Ha18
Langage Business Park and Industrial Estate and Roborough Industrial Estate are located beyond Plymouth City Council’s administrative area. However, these employment areas serve the needs of the city, and therefore should be considered in any supply figure. As such, it is considered that 42 hectares19, including 4 at Roborough, 18 at Sherford and 20 at Langage should be included in the Employment Land Supply.
18 Figures rounded (figures may not sum total presented) 19 This figure has been taken from South Hams Core Strategy (2006). 20ha was earmarked for employment uses in an eastern extension to Langage, (and 4ha at Roborough), but not formally allocated.
Note that consent for a sizeable Solar Farm has been given at Langage (Application No. 49/0277/11/F). The solar farm has now been implemented, and spans a total 19.25 hectares, of which 17.95 hectares is within the area of land earmarked for the 20 ha eastern extension to Langage (as set out in South Hams Core Strategy). The remaining 1.3 ha falls within the original extension to Langage which was allocated in the 1996 local plan.
Although the solar farm has temporarily taken a significant proportion of the land earmarked for the eastern extension of Langage (the solar farm consent is for 25 years), the potential employment land in this vicinity still exceeds 20 ha.
Discussion will be needed with South Hams through the ‘Duty to Cooperate’ to determine an appropriate course of action in terms of formally allocating this potential employment land for employment uses.

Plymouth City Council Employment Land Review 2011-2031
| Final | March 2015 Page 60
5.3 Distribution of employment land across the City Utilising the main employment land areas established for the study, consideration has been given to the distribution of current employment land supply. Table 26 details the breakdown of supply by broad locations within Plymouth (the defined employment sub-areas) and within the South Hams part of the PPUA. Table 26 - Employment land supply by sub area within the PPUA
Main employment areas
Intensification on existing
employment sites
Planning permissions –
lapsed, completed or
pending completion
Sites allocated or put forward
in Development
Plans
Other Sites Sub-totals20
A38 Corridor – East
0 0.56ha 0 6.4ha 6.96ha
A38 Corridor – West
0 6.2ha 0 3.2ha 9.4ha
A386 Northern Corridor
5.36ha 7.96ha 0 23.64ha 36.96ha
City Centre & Waterfront
0 19.1ha 11.4ha 0.47ha 30.97ha
Plympton 1.82ha 5.59ha 0 0 7.41ha Plymstock 0 4.93ha 0 3ha 7.93ha South Hams part of PPUA
0 0 0 42ha 42ha
Sub Totals 7.2ha 44.3ha 11.4ha 78.7ha 141.6320
Source: Arup estimate 2014
Based on the figures set out in Tables 25 & 26, Figures 7 and 8, and the map of employment land supply at Appendix G, the following main points are derived;
Sites classified as ‘Other sites’, that have been identified through Call for Sites, part of PIMTP and other redevelopment opportunities, make up the largest proportion of employment land supply within the Plymouth administrative area, and spatially the largest pipeline of sites is located in the A386 Northern Corridor (based on inclusion of the submission version Derriford and Seaton AAP sites). In this location the allocated sites are fewer in number but larger in size.
The second largest pipeline of plan allocations and sites previously identified in the Local Plan is located in the City Centre & Waterfront area, with the total land available in this sub-area made up predominantly of smaller sites.
20 Figures Rounded (figures may not sum total presented)

Plymouth City Council Employment Land Review 2011-2031
| Final | March 2015 Page 61
As would be expected, given the Core Strategy approach of pursuing two main nodes of development at the City Centre & Waterfront and Derriford and Seaton (A386 Northern Corridor), strategic site allocations elsewhere in the administrative area are limited.
Outside of the administrative area within the South Hams part of the PPUA allocations make up a significant proportion of the overall land supply (42ha).

Plymouth City Council Employment Land Review 2011-2031
| Final | March 2015 Page 62
Figure 7: Distribution of Employment Land Supply across the administrative area.
5.4 Quality of existing employment land supply Of the 126 identified sites, 110 were identified as being deliverable or potentially deliverable’ within the plan period to 2031 to form the Gross Theoretical Land Supply of 99.6 hectares. This figure is the total of all the land parcels that have been idenitifed as having potential for B-class development.
The 110 sites had been assessed using the methodology set out in Paragraph 19 of the online planning practice guidance for land availability assessment (LAA) which seeks to capture several aspects of the quality of existing employment land. These are included below for reference:
“physical limitations or problems such as access, infrastructure, ground conditions, flood risk, hazardous risks, pollution or contamination;
potential impacts including the effect upon landscapes including landscape features, nature and heritage conservation;
appropriateness and likely market attractiveness for the type of development proposed;
contribution to regeneration priority areas;
environmental & amenity impacts experienced by would be occupiers and neighbouring areas.”
Only rollover allocations, sites previously identified in development plans, sites with potential for intensification or expansion, and sites from the Call for Sites 2013were subject to this assessment on the basis that the sites with planning permissions have already been subject to consideration and found suitable. These were assessed during a site appraisal
7%
9%
37%
31%
8%
8%
A38 Corridor – East A38 Corridor – West A386 Northern Corridor
City Centre & Waterfront Plympton Plymstock
Plymouth City Council Employment Land Review 2011-2031
| Final | March 2015 Page 63
workshop between Arup and Plymouth City Council and a number of site visits were carried out to further assess certain sites. The sites were assessed using the following criteria:
Land use: for which land use classes is the site considered to be appropriate:
B1 Business – offices, research and development, and light industry appropriate in a residential area.
B2 General Industrial B8 Storage or Distribution
Ownership & Planning Status: likelihood of the owner developing the site or making it available for development and planning status of the site.
Adjoining land use or potential conflict with surroundings: potential conflicts with adjacent uses or physical limitations on development
Quality of site: is the site cleared, what is the current use
Accessibility: highways transport access, levels of parking and public transport accessibility
Further to this approach of assessing the sites for employment use to identify a Gross Theoretical Land Supply, the assessment process was refined to determine a proportion of these sites that can be considered to have a higher potential to deliver B Class development in the short to medium term. These sites are considered to be less complex to deliver, and consist of planning permissions (those that have lapsed, those that have been completed since 2011 and those where the development is pending completion) and sites allocated or put forward in development plans.
This collective set of sites is defined as being the Net Theoretical Land Supply.
The Gross Theoretical Land Supply consists of sites that are allocated, those that are consented, and sites that are not yet formally allocated which could be developed or intensified for employment use.
The Net Theoretical Land Supply is the proportion of the gross theoretical land supply considered to have a higher potential to deliver B Class development in the short to medium term. These sites are considered to be less complex to deliver, and consist of planning permissions (those that have lapsed, those that have been completed since 2011 and those where the development is pending completion) and sites allocated or put forward in development plans.
Sites in the Net Theoretical Land Supply total 55.7 hectares within the administrative area, approximately half of the Gross Theoretical Land Supply.
5.4.1 Deliverability of allocated employment sites.
A notable finding of the site appraisal workshop and site visits was that a number of the sites included in the schedule were determined to have a degree of uncertainty in terms of deliverability. It is considered that there are significant delivery challenges to overcome for some of these sites which will require a proactive approach to unlocking the opportunities within the plan period to 2031. The challenging sites include complex opportunities for redevelopment where viability and abnormal cost is the barrier, complex leasehold arrangements with respect to intensification or redevelopment of Council industrial areas and sites allocated in AAPs that currently had different uses or ownership issues. It was found that around half of the sites including in the original schedule had some uncertainty in terms of availability or deliverability.

Plymouth City Council Employment Land Review 2011-2031
| Final | March 2015 Page 64
Examples of sites where concerted effort will be needed to facilitate delivery in the Plymouth Plan period include:
North Cross & Railway Station: There is a partnership initiative currently underway to tackle the viability and abnormal cost challenges, including highways reconfiguration, of this topographically complex site. With public sector intervention there is reasonable potential that a scheme will come forward by 2031.
Friary Park: this allocation was originally earmarked for a mixture of residential, office and active ground floor commercial uses. It has recently been redeveloped in part, a further extension of the existing retail park is currently underway, and redevelopment of the remainder is consequently seen as unlikely.
Coxside & Barbican Car Park: this car park is still utilised and the proposed remodelling of the site would involve extensive work and a sympathetic architectural solution. The proposals include the introduction of active commercial frontages at ground level, the retention of car parking and the provision of upper floor uses, potentially office space. The market alone is unlikely to deliver this solution so proactive partnership working will most certainly be necessary to achieve this outcome.
Despite a number of sites being discounted at this stage, a high proportion of the allocated employment land, identified in the columns 4 and 5 of Table 26, is considered deliverable, notably within the City Centre and Waterfront and Northern Corridor sub-areas. The discounting process does not necessarily mean the sites will not be able to be brought forward for development; it simply means further more detailed consideration needs to be given to demonstrate that some of the sites could be included in the employment land supply. Further feasibility work is recommended as the Plymouth Plan progresses to identify the barriers to delivery which may be able to be overcome through public sector intervention, partnership working or cross subsidisation through the packaging of Council owned sites.
5.4.2 Appropriate land uses for employment sites
A number of planning permissions and site allocations within the 2014 ELR Site Schedule use floorspace estimates extracted from original planning applications or development plan policies. However, this level of information was not available for all the sites in the schedule. For those planning applications and allocations that did not specify floorspace, a plot ratio was applied to the sites gross developable area in order to calculate the net floorspace potential of the site. Table 10 in Chapter 4 details the plot ratios used to calculate floorspace for the demand scenarios. In order to calculate the floorspace for the employment land supply for those sites where floorspace hadn’t been specified, a plot ratio of 0.4 was applied to sites allocated for B2 and B8 uses, and out of centre B1 uses.
Making the assumption that most B1 spaces in the City Centre and Waterfront would be classed as ‘Town Centre Sites – Typical’21, with a small proportion being considered as having ‘High Accessibility’ and an even smaller proportion being ‘Selected opportunities’, a plot ratio of 1 was applied to all B1 uses in the City Centre and Waterfront employment sub-area.
The site appraisal process and planning application information has also provided preliminary estimates of the proportions of existing employment land that are considered appropriate for different employment land uses. As the employment land forecasts at Chapter 4 are broken
21 See Table 10, Section 4

Plymouth City Council Employment Land Review 2011-2031
| Final | March 2015 Page 65
down by use class, this enables an overview of the on-going fitness for purpose of existing development plan allocations in particular.
Each site that was determined to be deliverable was assigned a use under B1, B2 or B8 use classes. This was informed by information from planning applications, plan allocations or determined following site appraisals. Where there were multiple uses a combination of the classes were assigned. In order to calculate the split of different use in terms of floorspace (m2), the same proportions were used as those in Table 8 from Chapter 4. For example, a wholesale and retail unit with all 3 use classes present would attribute 50% of floorspace to B8 uses, with the remaining floorspace split equally between B1 and B2.
Another example would be for a transport & storage use, where 15% of the floorspace would be attributed to B1 uses, a further 15% to B2 with 60% of the use being B8 uses. If the use was just B1 and B8, for example, a distribution centre with an office, the B1 use would account for 20% of the floorspace and the remaining 80% would be for B8 use.
The table and figure below details the estimated total supply of floorspace generated by sites within the 2014 Site Schedule split between B1, B2 & B8 use classes.
Table 27: Total estimated floorspace generated by 2014 ELR Site Schedule
Use Classes Total
B1 B2 B8
Estimated floorspace potential by use class from identified land supply within the administrative area (sq. m.)
423,061 88,971 146,683 658,716
Estimated floorspace potential by use class from identified land supply within the South Hams part of the PPUA (sq. m.)
46,900 85,200 91,900 224,000
Source: Arup estimate 2014
Table 28 sets out the estimated supply by use class in each of the sub areas of the City (the administrative area). This illustrates the dominance of B1 suitable land & space and the importance of both the A386 Northern Corridor and City Centre & Waterfront areas for delivering employment land. The table also identifies the importance of Plympton with regard to the supply of B8 land, with this use class dominating the area.
Table 28 - Extent of employment land by use class across sub areas of the City Sub area of Plymouth administrative area
Extent of appropriate employment floorspace supply by use class (m2)
B1 B2 B8
A38 Corridor – East 742 2,133 5,751
A38 Corridor – West 2300 11,960 41,100
A386 Northern Corridor 144,240 23,234 36,624
City Centre & Waterfront 263,743 31,232 13,143
Plympton 2,229 6,972 23,558
Plymstock 9,807 13,440 26,508
Sub-totals22 423,061 88,971 146,683
22 Figures rounded (figures may not sum total presented)

Plymouth City Council Employment Land Review 2011-2031
| Final | March 2015 Page 66
Source: Arup estimate 2014
Inferences that can be drawn from this exercise are as follows:
Sites within the City & Waterfront area are, in the majority of cases, considered to be better suited for B1 business use. While there remain some sites that are considered to be suitable for B2 Industrial and B8 Storage and Distribution uses, these are now relatively limited (approximately 44,000 sq. m).
Waterfront regeneration has been a major success story for Plymouth, but a high proportion of residential development means that the potential for conflict with B2 and B8 uses on neighbouring sites in these areas will have increased. Proposals would need to be considered on a case by case basis, but overall the opportunities for larger scale B2 and B8 uses are diminishing in this area. Sites such as RM Turnchapel and South Yard will provide choice for larger scale manufacturing going forward.
Overall, this analysis suggests that there is greatest potential for B1 (Office, R&D and light industrial development) uses at existing employment land allocations in both the City Centre & Waterfront and Northern Corridor main employment areas. This offers at least two main locations for new office related business. The majority of this potential development is from planning permissions, both consented (since 2011), consents pending implementation, and plan allocations.
As reported previously, options for businesses to locate at allocated sites in other parts of the City, and particularly the A38 Corridor East, are very limited for all use classes (excluding site options within the PPUA).
5.5 Summary A summary of the main points arising is provided below:
The total land supply within the PPUA is 141.6 hectares, with this equating to an estimated 882,716 m2 of additional employment floorspace potential.
Over half of the employment land supply is made up of sites that have been identified through Call for Sites or the ELR process, are part of PIMTP and other redevelopment opportunities.
Over 14 hectares of employment land is allocated allocated in adopted Area Action Plans, and the first deposit Plymouth Local Plan
In line with the Core Strategy, the greatest availability of land within the City, comprises sites within the A386 Northern Corridor which includes Derriford and the surrounding established industrial areas - 36.96 ha, and a range of sites in the City Centre & Waterfront area - 30.97 ha (Refer to Table 26 above). The availability of sites elsewhere within the City is relatively limited. For instance, there are no plan allocations in the A38 corridor west, Plympton and Plymstock and options within the A38 corridor east are limited to a handful of planning permissions. The Imerys site at Coypool, has the potential to offer a large employment allocation in Plympton. Locations outside of the administrative area within the PPUA such as Langage and Roborough could have a role to play in providing large scale employment allocations given that land supply to the east of the City is limited and market signals have identified a noticeable increase in demand for premises with close proximity to the A38 and in the Plympton sub-area over recent years.
Overall analysis suggests that there is ample potential development opportunities for B-class uses across Plymouth. These include significant portions of land in both the City Centre & Waterfront and Northern Corridor main employment areas. This offers at least two main location options for businesses and institutions.

Plymouth City Council Employment Land Review 2011-2031
| Final | March 2015 Page 67
Despite there being more than ample employment land identified within the City, an initial review of site quality through the site appraisal process has identified a large proportion of the sites are not ready for immediate development. Whilst these sites are suited to the needs of the market and the priority economic sectors in a number of established locations across the City, including the City Centre, Waterfront and Derriford, there are also a number of sites that require intervention from the public sector to make the sites attractive to investors.
As part of duty to co-operate discussions, and maximising development potential across the city, we would recommend working together with neighbouring authorities, landowners and developers to facilitate the delivery of the Gross Theoretical Land Supply.
This would maximise developability of potential new locations such as the Imerys site which could come on stream and nuture opportunities within the PPUA such as further extensions to Langage and land around Deep Lane Junction at Sherford.
This issue should be factored into PCC’s representations to the Cornwall and South Hams Local Plans, whilst South Hams’ representations on the forthcoming Plymouth Plan and this Employment Land Review would be welcomed.
Finally, some of the sites that have been included in the baseline employment land supply have been allocated since the adoption of the First Deposit Local Plan 1995-2011 and the Local Development Framework Core Strategy (adopted 2007). These sites have remained undeveloped despite being allocated, and often have no history of interest through discussions with developers or lapsed permissions. This would suggest a closer examination of potential public sector interventions is necessary at the next stages of the preparation of the Plymouth Plan. Viability may well be an issue and enabling infrastructure to improve the potential of the sites could be required.

Plymouth City Council Employment Land Review 2011-2031
| Final | March 2015 Page 68
6 Recommendations
This section draws together the information from the preceding chapters to set out conclusions and recommendations for Plymouth City Council. These points should then be taken forward to inform a preferred strategy and policy responses to managing employment land in Plymouth. This chapter analyses the relationship between the need for additional land to address demand, and identifies strategies to ensure the demand scenarios can be satisfied.
6.1 Drivers of Change
6.1.1 Market Signals
Moving forward, it is important to have an employment land strategy that makes consideration for market signals. The NPPF requires local planning authorities to take account of and respond to market signals to ensure that there is adequate provision of the correct types of employment land.
As expected, and in line with the rest of the UK, the number of investment enquiries in Plymouth reduced following the recession. However as the city emerges from the recession, an upward trend in demand for employment land within both the administrative area and beyond within the PPUA has begun to develop. Recent enquiries suggest there is very strong interest in the future role that the Plymouth city region plays in key economic sectors such as marine renewables and healthcare as well as its role as a centre for distribution and logistics for the far South West. Business investment enquiries have increased significantly over the last two years and new businesses in Plymouth are now forming at rates which have not been seen since before the recession.
This demand has been focussed on the priority sectors identified in the Local Economic Strategy, with the highest number of investment enquiries (Appendix D) coming from businesses in marine industries, healthcare and research and business services. This indicates that demand for B2 space is likely to come from high-tech industries rather than traditional manufacturing businesses. Certain sectors will value waterfront access, and the development of South Yard will be central to meeting that need. Others will favour proximity to other hi-tech businesses and choose locations such as Plymouth Science Park.
Of the priority sectors, creative industries raised the second highest number of queries; this suggests that another high proportion of demand for a mixture of B1 and B2 space could come from artisan and bespoke creative manufacturers rather than traditional heavy industry. These types of business don’t require large format buildings or large plots they require flexibility of space and terms and will be looking to locations where similar like -minded businesses are congregating in the City. Royal William Yard has been most successful in creating this vibe and brand. Can it be replicated elsewhere in the City?
Generally demand and take up of employment land will grow as the economic recovery gathers pace, and initial feedback from Plymouth based agents and the business community is positive in this respect. The review of investment enquiries indicates that there is a steady level of demand for employment land for B1 uses, with a small decrease in demand for B2 space and an increase in B8 in line with the rest of the UK. The research has also revealed that the highest demand is for small to medium-sized premises between 100-500 square metres, with the largest proportion of that demand in accessible locations in the A38 corridor and Plympton areas.
The ELR monitoring revealed that delivery of land each year has varied greatly between 2006 and 2012. However, over that period, an average of 4.41ha has been delivered annually which
Plymouth City Council Employment Land Review 2011-2031
| Final | March 2015 Page 69
exceeds the Core Strategy target of 4ha. In recent years, the delivery of employment land has been predominantly for B1 uses and the supply of this type of space now outstrips demand.
6.1.2 Policy Considerations
Any future strategy regarding employment land must consider employment related policies set out in development plan documents. The evidence set out in this ELR suggests that on the whole, existing employment land related policies are being successfully implemented; the Core Strategy aims to deliver 4.5ha per year within the administrative area between 2016 and 2021 and with the current figure at 4.4ha per annum, this is not an unrealistic target.
The Core Strategy indicates that beyond 2016, employment land will be predominantly delivered from locations in and around the A38 corridor. This would indicate a change in focus from the regeneration of the Waterfront and City Centre development to the delivery of larger premises in more accessible locations. In reality a major shift in emphasis is unlikely to happen as the delivery of schemes planned now and in recent years within the City Centre and Waterfront and Derriford area come to fruition. There will however need to be a refocusing on the needs of inward investors looking for large scale employment sites on the edge of the City.
Previously identified land in the adopted AAP’s and sites put forward in earlier development plans that remain unimplemented currently make up approximately 45% of the employment land supply. These sites will not be sufficient in isolation to address the demand set out in the employment scenarios developed for this ELR. Opportunities beyond the administrative area within the PPUA will need to be look at more closely to serve the demands of the City, particularly larger format B2 and B8 with a need for direct access to the A38. Also the opportunity for new sites to come on stream, such as the Imerys site in Coypool, need to be considered in more detail.
6.2 Matching demand with land supply Here we seek to bring together the demand generated from the employment scenarios set out in Chapter 4 with the employment land supply estimates from Chapter 5 respectively. The employment scenarios used for comparison purposes is the High (Pattern 2) scenario which provide for 18,520 jobs. These scenarios include an allowance for policy interventions to maximise job growth and are in line with the household projections underpinning the SHMNA. The High (Pattern 2) estimate including the 20% margin estimates is used as this allows for healthy churn or choice of employment space in the local marketplace.
6.2.1 Comparing the needs of the market with the supply of employment land
Using the High (Pattern 2) scenario optimistic job growth scenario shows that there is more than sufficient land supply within the administrative area of Plymouth to meet forecast demands if the aggregate total B class space figure is used. The net land requirement for this scenario is 57.63 ha in aggregate whereas the Gross Theoretical Land Supply is estimated to be 99.6 hectares within the administrative area.
During the Land Availability Assessment process to be undertaken as part of the later stages of the Plymouth Plan, some of the sites that make up the Gross Theoretical Land Supply may not be progressed for B-class use. This could be for a number of reasons including; LPA preference for competing uses (such as residential), infrastructure constraints, lack of viability or amenity issues. As such the gross figure of 99.6 hectares will potentially reduce.

Plymouth City Council Employment Land Review 2011-2031
| Final | March 2015 Page 70
It is not the place of the ELR to assess in detail which of the identified Gross Theorectical Supply sites should come forward for alternative uses.
For the purposes of this study we have assumed the suitability of each site for each use class based on information derived from previous allocations and consents alone. Given this, the current land supply picture should be regarded as a best estimate which will require further testing when considering further refinement to the strategy for each employment use class and specific site allocations.
In terms of sites with a higher B-class development potential in the short to medium term, (Net Theoretical Land Supply) there are 55.7 hectares to meet the land requirements, inclusive of a 20% margin to account for churn, of 57.63 hectares. This illustrates that employment sites in the ‘other sites’ category, and those put forward for ‘expansion or intensification’ such as Coypool and the Land to the west of Ernesettle Lane have a significant role to play in providing space for jobs in Plymouth.
The role of Plymouth City Council in the delivery of these sites is the proactive management of consents through the development management process, and proactively engaging in early pre-application discussions with developers to unlock delivery of allocated sites. This could be through the aligning the need for enabling infrastructure with LEP funding opportunities or support in the production of masterplans or development briefs to manage down the risks of development for commercial investors.
A breakdown of the comparison of land requirements and the Gross Theoretical Land Supply by use class is set out in the table below.
Table 29 - Comparing forecast employment land needs with supply within Plymouth’s administrative area (excludes PPUA sites)
Forecast Net Land Requirement (Ha) 2011-2031
Forecast Gross Theoretical land supply
(Ha) 2011-2031
Forecast Net Theoretical land supply
(Ha) 2011-2031 High (2) High (2) (20%
Margin)
Office space (B1, a, b) 12.29 14.75 40.7 28.3
Manufacturing space (B1c/B2) 11.98 14.38 22.2 15.4
Distribution (B8) 23.75 28.5 36.7 12
Total B-class space 48.03 57.63 99.6 55.7
The comparison indicates that there should be sufficient land considered appropriate for office, manufacturing, and distribution uses. Should all of the land identified in the Gross Theoretical Land Supply be delivered, there would be additional land beyond the forecast net land requirement for each use (B1, B2, B8).
The final column of Table 29 sets out the supply of sites in the Net Theoretical Supply. This identifies that there is sufficient supply of readily available sites for office uses, and for manufacturing. However, there is only around half of the required number of sites to meet B8 demand that are in the Net Theoretical Land Supply and therefore considered to be readily available.
It should be noted that the figures above are simply indicative of what the initial split of employment land might be, considering the basic factors of developability set out in section 5.3. Detailed technical appraisal of each site’s feasibility for B1, B2 or B8 has not been carried out. For example each site has not been appraised in relation to factors such as utility capacity (water, power supply), nor have detailed transport assessments been carried out or

Plymouth City Council Employment Land Review 2011-2031
| Final | March 2015 Page 71
assessment of limiting factors associated with adjacent land uses. Going through this more refined feasibility exercise through the Land Availability Assessment process could have a bearing on the current assumptions made with respect to use class and developable area for certain sites.
6.2.2 Accommodating needs within the PPUA
The NPPF promotes ‘planning strategically across boundaries’ and Plymouth City Council has a duty to cooperate with its neighbouring councils and vice-versa; i.e. with South Hams, West Devon and Cornwall, in order to identify, where necessary, how needs for land appropriate for B uses can be satisfied in locations immediately adjacent to the administrative boundary.
There is an expectation that Plymouth City Council will work collaboratively with South Hams and Cornwall Council specifically to ensure the availability and successful delivery of sites suitable for employment uses to serve the needs of the City and wider sub region. The role that locations such as Langage Industrial Park, Broadley Park and Sherford, all located in South Hams’ administrative area, could play in the employment land supply strategy for Plymouth should be considered as the Plymouth Plan progresses. These sites, whilst out of the jurisdiction of Plymouth City Council, are considered to be in the Plymouth Principal Urban Area (PUA) due to their important role within Plymouth’s economy.
The South Hams Core Strategy, adopted in 2006, states that Langage will ‘help to meet the wider needs of the economic and urban regeneration of Plymouth’ and ‘help to meet the strategic needs of the city’. As a result it seems appropriate that this site is considered in any employment land review for the City.
Whilst the South Hams Core Strategy identifies the provision of employment land at Sherford as being ‘primarily about meeting more local needs’, employment land at Sherford has also been included in Plymouth’s theoretical employment land supply in this Employment Land Review. Housing provision at Sherford is being counted towards meeting Plymouth’s housing need. This housing need is based upon an above trend growth in population which in turn is based upon a substantial increase in the number of jobs expected to be created in Plymouth over the plan period. As Sherford is a location where homes are being provided for people coming to the city to take up new jobs, it follows that the employment land being provided to meet local needs in Sherford should also be counted against the City’s employment land requirements. There is also a clear potential for employment provision at Sherford to support the strategic employment needs of Plymouth, given that the Sherford Masterplan envisages B2 and B8 uses being concentrated in locations close to the A38 and to Deep Lane junction in particular.
For the purposes of this Employment Land Review, it is considered that all of the 67000m2 B1, B2 and B8 floorspace at Sherford forms part of Plymouth’s theoretical employment land supply in the period to 2031. However, in arriving at this conclusion, it should be noted that the Sherford Masterplan envisages the full commercial potential of Sherford being reached in 15 to 25 years. The development has though, been delayed by a number of years, and phasing continues to be adapted to respond to current market conditions. It is therefore unlikely that all of the theoretical supply at Sherford will be realised within the 2031 timeframe of this Employment Land Review, although opportunities that are considered to be attractive to the market, such as the B8 opportunities close to the Deep Lane junction, are likely to be realised sooner.
Whilst this ELR identifies that there is sufficient theoretical supply of land for B8 uses in the PUA, it is important to understand and plan for the full range of B8 uses, including the largest scale operations for which there is naturally a shortage of suitable sites. Recent inward

Plymouth City Council Employment Land Review 2011-2031
| Final | March 2015 Page 72
investment enquiries suggests that proposals for stand-alone B8 facilities of up to 45000m2 in scale may need to be accommodated and, given this interest, there is a need to reconsider whether there is a need to allocate further land for such purposes either close to the A38 in South Hams or in Cornwall. For example, Langage Industrial Estate in South Hams is particularly well suited to accommodating B8 uses due to its immediate proximity to the A38 Eastern Corridor.
6.2.3 Total Identified Land Supply within the PPUA
In summary the ELR has identified a supply of 141.6 hectares of land within the PPUA for B1 (a/b), B2/B1c and B8 employment uses. However, when these figures are broken down by different employment land type, the picture becomes a little more complex (see table below). Table 30: Comparing need with land supply beyond the administrative area to include the PPUA
Forecast Net Land Requirement (Ha)
2011-2031
Forecast Net Theoretical land supply (Ha) – administrative area 2011-2031
Forecast Gross Theoretical land supply - administrative area (Ha) 2011-2031
Forecast Gross Theoretical land supply - PPUA (Ha) 2011-2031
High (2) (20% Margin)
Office space (B1, a, b) 14.75 28.3 40.7 52.7
Manufacturing space (B1c/B2)
14.38 15.4 22.2 37.2
Distribution (B8) 28.50 12 36.7 51.7
Total B-class space 57.63 55.7 99.6 141.6
Source: Arup 2014 estimate
The forecasts suggest that existing undeveloped land at Langage, Sherford and Broadley Park could potentially make significant contributions to meeting the needs of the City. This is particularly the case when the administrative area of Plymouth has at best, limited capacity to accommodate the largest B8 investment opportunities as outlined earlier.
Further discussions with South Hams under the duty to co-operate are necessary to understand the detailed position with regards to the extent of land remaining undeveloped from the original allocations. It remains unclear without this information whether there is a need to consider further extensions to established PPUA employment locations such as Langage.
6.3 Capitalising on City Deal & LEP funding The Council is also now in a position to capitalise on City Deal and LEP funds to fast track its employment land pipeline and enable challenging sites. A number of the employment allocations within the updated 2014 land supply schedule are rollover sites from the 2006 ELR and the previous Local Plan. These sites have remained unimplemented and this may be for a number of reasons. Without some form of public sector intervention to bring them to market they are very likely to remain so. Through proactive feasibility and viability assessment work PCC should seek to identify those Council owned sites which should be supported and brought to market using the leverage of secured City Deal or LEP funds.

Plymouth City Council Employment Land Review 2011-2031
| Final | March 2015 Page 73
The success of the Plymouth and South West Peninsula City Deal means that strategic investments in employment sites such as South Yard have now been brought to the market to address the needs of marine related businesses. Outline Planning consent was granted in March 2015 to redevelop the 7.5 hectares of South Yard, providing approximately 25,000 sq m of employment floorspace. Within the March 2015 budget, South Yard, including the area being transferred to the Council was also conditionally approved to become a new Enterprise Zone (EZ) site. Redevelopment is expected to commence in 2016.
Funds secured through the Heart of the South West LEP’s Strategic Economic Plan will also benefit employment land release in Plymouth over the next few years through support to:
Phase 5 of Plymouth Science Park – allocated £3m with £2m released in 2015-16 Deep Lane Junction & Sherford access – allocated £2m with £1m in 2015-16 Investment in Plymouth Eastern Corridor (Charles Cross, Exeter St improvements and
Strategic Cycle Network) - £5.5m indicative allocation for implementation in 2016-17
6.4 Further analysis of windfall A further area of analysis which would beneficial at the next stage of plan preparation would be analysis of B1, B2 & B8 floorspace generated from historic windfall consents over the last decade within the administrative are. This supply could take the form of demolition, redevelopment and intensification of existing employment space, changes of use or extensions to existing commercial development rather than floorspace generated from allocated sites. Analysis of this supply would identify the levels of floorspace generated from unknown opportunities. Although historic data it would provide an estimate of the levels of employment floorspace that could come forward as an element of the land supply over the plan period to 2031. The analysis will require forensic examination of the Council’s consents database for the period 2001-2011.
6.5 Safeguarding sites for priority sector use There is a need to safeguard sites appropriate for employment use by the priority sectors identified in the Local Economic Strategy, given that there is a finite supply of land suited to such businesses.
There is a limited remaining supply of land with direct waterfront access in Plymouth and it is therefore strongly recommended that such sites are safeguarded for future commercial purposes. Safeguarding waterfront sites will have the effect of maintaining overall supply and choice for marine related sectors. Sites identified within this ELR that have direct waterfront access which should be safeguarded for businesses requiring direct access to the water are:
RM Turnchapel South Yard, Devonport Trinity Pier & Millbay.
Other sites of particular importance are those sites with that offer access to rail or water as potential interchange locations between different modes of freight. More on this is set out below.
Beyond this, the Council should also seek to protect vacant premises for employment use from conversion to other uses. All markets operate with a level of ‘churn’ in properties (i.e. a healthy market will still have a proportion of vacancies), and policies should be considered to protect premises from being converted or redeveloped for other uses without being given

Plymouth City Council Employment Land Review 2011-2031
| Final | March 2015 Page 74
sufficient time to be reoccupied. ‘Sufficient time’ could vary dependent upon the market, but typically, two years is considered an appropriate level of time.
The Government’s changes to Permitted Development Rights allowing conversion of B1a (office uses) to C3 (dwelling houses) will limit the Council’s ability to blanket protect older office space, but the Council could consider an Article 4 Direction to remove these Permitted Development Rights within areas where it wishes to protect B1 use.
6.6 Intermodal freight & alternatives to highway-based distribution
As identified in Section 6.2, whilst Plymouth appears to have sufficient space for B8 uses, however, the portfolio of large format sites for distribution and storage is limited. Consideration should be given to options for a modal shift for a proportion of this demand through rail freight and short sea shipping options. The feasibility for an intermodal freight logistics park should be revisited.
Recent figures have indicated an expansion in non-highway-based modes of distribution, with B8 demand across the UK coming predominantly from growth in rail freight and short sea shipping. The amount of goods moved by rail increased by over 2 billion tonne kilometres in the period 2009-2013 (FTA Logistics Report 201323), whilst the UK now has the largest amount of short sea shipping in the EU (Eurostat 201224).
As progressive cities restrict freight vehicle access to their centres we are likely to see a radical change to the way goods are delivered. Trains and electric bikes will soon play a big part in the supply chain that brings parcels to your door.
As place-making becomes more of a priority for cities we are witnessing the return to greater levels of pedestrianism in city centres. They are becoming friendlier for cycling – something that heavy goods vehicles are not. And they’re also increasingly imposing access restrictions, with Europe leading the way in low-emission zones.
Many cities are being choked by traffic (pollution in Oxford Street in London was recently measured at three times over the EU limit). This is putting pressure on civic leaders to legislate polluting vehicles out of their city centres, not least because the EU is looking to levy fines on cities that transgress these legislative requirements. Although Ocean City enjoys much cleaner air than some of its counterparts a city wide Air Quality Management Area is soon to be declared in Plymouth due to excess levels of nitrogen oxide caused by traffic. Given this we think it appropriate to briefly consider opportunities for taking some of the logistics movements to and from and within Plymouth off the highway.
While it’s politically difficult to ban cars from city centres, it’s easier to legislate for goods vehicles. And because they’re significant contributors to nitrogen dioxide and particulate emissions, public opinion tends to support cities that create low-emissions zones where polluting vehicles are banned or must pay more to enter. All this will make it increasingly harder for the logistics industry to deliver into cities as it has until now. They’ll be under pressure to use electric vehicles in cities, which won’t have the range to reach as many destinations in cities from regional distribution centres. So in time they will have to rethink their approach.
23 PwC (2013) Freight Transport Association; The Logistics Report 24 European Commission (2012) Maritime transport statistics; short sea shipping of goods

Plymouth City Council Employment Land Review 2011-2031
| Final | March 2015 Page 75
What will this mean? We think we’ll see longer-distance haulage distribution get bigger, with a much greater use of container trains, big trucks and ships. Within cities, the opposite will happen: delivery vehicles will get smaller.
The growth of port centric logistics, where goods are sorted at the port they arrive at prior to being distributed, will further improve access to rail and water networks. Logistics facilities on the perimeter of cities will then facilitate the transfer from bulk containers to city containers.
We also expect a shift to rail carrying more freight, although not necessarily in a traditional way. For example there are pilot projects looking at how passenger trains could be used to move more freight. Outside peak times, there is certainly capacity for this. It’s also a very reliable and fast way of getting into city centres, which is why there are already companies in the UK with viable businesses doing it. This is another reason for the South West Peninsula Task Force to maintain its lobbying for electrification beyond Bristol. Plymouth to London by road might take four hours, or five on a bad day. Jump on a train and your parcel could be there in less than three hours with electrification.
Other countries, such as Germany and France, are putting more of their high-value freight on their rail networks. The German city of Dresden has a cargo tram system, and Amsterdam has trialled the same approach. With countries in the Middle East also investing in rail for freight as well as for passengers, it is clear that rail has an increasingly important part to play in the future of logistics.
6.6.1 Intermodal rail freight opportunities in Plymouth
There is evidence of an increased demand for rail freight in the sub region, and Plymouth specifically, in recent years. In 2012 a study was undertaken to test the market interest in the development of rail freight in Plymouth and Cornwall25. A number of locations were identified with potential to be developed for intermodal rail freight facilities. One of the preferred locations was identified as Tavistock Junction in the A38 East Corridor. It was identified as having the potential to be developed as a small ‘strategic rail freight interchange’, the capital cost of developing the facility was estimated at approximately £4 million. Soft market testing of Tavistock Junction with rail freight operators and retailers proved in principal interest yet little progress seems to have been made in the progression of the concept despite the specific mention of support for rail freight locations within the Heart of the South West LEP’s Growth Deal 2015-16 earlier in the year.
Although the land availability around Tavistock Junction is relatively limited and in we would recommend that the potential for a facility at Tavistock Junction is re-examined as part of a more specific B8 strategy and site allocations feasibility for the City. We would also recommend that the potential for an intermodal facility at Laira Depot is also considered given it has been identified through the call for sites as a medium to longer term opportunity. The technical feasibility of rail freight links to Langage could also be considered given the strategic sites proximity to the mainline railway.
25 ORS (2012) Plymouth and Cornwall; Review of Retail Rail Freight Potential

Plymouth City Council Employment Land Review 2011-2031
| Final | March 2015 Page 76
6.7 The Role of the LAA in Employment Site Allocation
There are some significant sites contributing to the Gross Theoretical Land Supply; these include the former Imerys site at Coypool, the Ship (former site of Western Morning News), and the Land to the West of Ernesettle Lane.
Each of these sites have been included in the Gross Theoretical Land Supply. These sites have not been allocated but could be comprehensively redeveloped for employment use. It is worth noting that some or parts of these sites suffer infrastructure constraints or deliverability challenges. As such, they have not been included in the Net Theoretical Land Supply, the supply of sites which are considered to have a high development potential for B-class uses in the short to medium term.
The former Imerys site at Coypool, referred to as Coypool China Clay Works in the Waste DPD, has the potential to be developed for employment use due to its close proximity to the A38 and the Park and Ride. A railway line links the site to Tavistock Yard to the south, and as such options could be explored to link to the wider development of rail freight in Plymouth as set out in Section 6.6. However, the current mineral processing use would require the site to be remediated and restored, and the site is in multiple ownership. There are potentially a number of other competing uses that have been proposed for the site that could also reduce the developable area of this site for employment uses. As such, Plymouth City Council should work closely with the landowners and interested parties to ensure a successful outcome for all.
The Land West of Ernesettle Lane was formerly used by Plymouth University for sports pitches. The site is within the Ministry of Defence’s DSDA Explosive Storage Safeguarding Area at Ernesettle. This restricts the types of uses on the site, however the site could be developable for B2 and B8 uses subject to building design and construction considerations between the ‘yellow’ and ‘purple’ lines (also shown on the Waste DPD Proposals Map 2008) to meet suitable standards agreed with the MoD to address the safety of occupiers and the wider area. It should be noted that this site is in a good location, surrounded by similar employment uses, with good links to the A38.
Other sites, such as St Budeaux Bypass and The Northern Triangle have been discounted from this employment land supply, despite being previously identified for employment uses in previous plans.
St Budeaux Bypass has been discounted on the basis of previous studies undertaken by Arup and Knight Frank in 2010. The reports reached the following conclusion;
“In general the assumed development levels are too small to support the costs of enabling the highways infrastructure needed. With all scenarios considered the significant cost of off and onsite infrastructure works impacts significantly upon the financial viability of the proposals given the comparatively small scale and inefficient use of land proposed.
As a result of discussions with Plymouth City Council around initial scenario tests, further sensitivity analysis were undertaken by way of varying key inputs. Knight Frank sensitivity tested both of the commercial scenarios on the basis of no developers profit. This is naturally considered to be an unrealistic basis for the development to move forward. On this assumption both scenarios still result in significant negative land values.”26
26 Arup (2010) Mowhay Road, Plymouth. Site Appraisal.

Plymouth City Council Employment Land Review 2011-2031
| Final | March 2015 Page 77
Despite this, the site should be assessed as part of the LAA process to see whether current market signals and policy considerations indicate towards a preferred development option.
There is a long term aspiration for the redevelopment of the Northern Triangle area to the north of Mayflower Street in the City Centre. However, this has been discounted from the supply as it is considered challenging to deliver, and unlikely to come forward in the Plymouth Plan period. The area could still be assessed for a variety of uses as part of the LAA process.
The former Western Morning News site, the Ship, is currently being marketed for redevelopment. The existing building on the site is not considered to be appropriate for the uses demanded by the market, however there are a number of organisations that wish to have the structure listed. As a result, questions remain over the future of the Ship. This would remove any potential to redevelopment the whole site. As such, this site is considered to be in the Gross Theoretical Land Supply, but is not likely to be delivered in the short term, and therefore not included in the Net Theoretical Land Supply.
As a result of the deliverability issues highlighted above, it is the recommendation of this report is that Plymouth City Council must take a proactive approach to developing sites that are solely included in the Gross Theoretical Land Supply and work in partnership with developers, landowners and other stakeholders to maximise the deliverability and viability of these sites.
6.8 Data collation for ELR monitoring This ELR will form part of the evidence base in support of emerging employment policies within the Plymouth Plan. In order that the views set out in this report remain contemporary the underlying data will need updating periodically in response to the drivers and signals discussed.
We would recommend that Plymouth City Council carry out regular surveys of existing employment areas to quantify B-Class floorspace and identify its quality and suitability for purpose. The Site Schedule can be used as the baseline supply position but will need to be periodically updated. Vacancies in employment areas should be monitored in order for the Council to identify the potential need for intervention. Intervention could come through the preparation of planning briefs, collaborative working with landowners or direct public sector intervention.
Information should be collected and shared within the Council to inform wider economic development and help to develop a more proactive approach to planning and development. The indicators to inform this approach include:
Annual collection of data regarding vacant units and land Improvement to the scope of inward investment enquiry data collated, most notably exit
data (i.e. reasons for enquiries not being pursued) Job growth data across each sector Regular reviews of the employment land survey and site schedule Business surveys
Plymouth City Council should also maintain regular communication with local commercial property agents and take on the knowledge and recommendations of market reviews and other market information produced by agents and other members of the business community.

Plymouth City Council Employment Land Review 2011-2031
| Final | March 2015
Appendix A
Plymouth Study Area

Plymouth City Council Employment Land Review 2011-2031
| Final | March 2015
A1 Plymouth Administrative Area

Plymouth City Council Employment Land Review 2011-2031
| Final | March 2015
A2 Plymouth Principal Urban Area

Plymouth City Council Employment Land Review 2011-2031
| Revised Final Draft | January 2015
Appendix B
SIC Codes

Plymouth City Council Employment Land Review 2011-2031
| Revised Final Draft | January 2015
B1 Broad SIC Code Comparison Table
SIC Code Section SIC Code Division
Description
Plymouth 2006 ELR (Baker Associates)
Prospects for Plymouth's Priority Economic Sectors Addendum 1: Medical & Healthcare Sector (Arup, 2013)
HotSW Forcasts Oxford Economics (March 2013)
RED Group PBS historical data and forcasts
A AGRICULTURE, FORESTRY AND FISHING
01 Crop and animal production, hunting and related service activities
˜ ˜ 02 Forestry and logging
03 Fishing and aquaculture
B MINING ANDQUARRYING
05 Mining of coal and lignite
˜ ˜
06 Extraction of crude petroleum and natural gas
07 Mining of metal ores
08 Other mining and quarrying
09 Mining support service activities
C MANUFACTURING
10 Manufacture of food products
˜ ˜ ˜
11 Manufacture of beverages
12 Manufacture of tobacco products
13 Manufacture of textiles
14 Manufacture of wearing apparel
15 Manufacture of leather and related products

Plymouth City Council Employment Land Review 2011-2031
| Revised Final Draft | January 2015
SIC Code Section SIC Code Division
Description
Plymouth 2006 ELR (Baker Associates)
Prospects for Plymouth's Priority Economic Sectors Addendum 1: Medical & Healthcare Sector (Arup, 2013)
HotSW Forcasts Oxford Economics (March 2013)
RED Group PBS historical data and forcasts
16 Manufacture of wood and of products of wood and cork, except furniture; manufacture of articles of straw and plaiting materials
17 Manufacture of paper and paper products
18 Printing and reproduction of recorded media
19 Manufacture of coke and refined petroleum products
20 Manufacture of chemicals and chemical products
2059 Manufacture of other chemical products
21 Manufacture of basic pharmaceutical products and pharmaceutical preparations
2110 Manufacture of basic pharmaceutical products; 2120 Manufacture of pharmaceutical preparations
22 Manufacture of rubber and plastic products
23 Manufacture of other non-metallic mineral products
24 Manufacture of basic metals
25 Manufacture of fabricated metal products, except machinery and equipment
26 Manufacture of computer, electronic and optical products
2680 Manufacture of magnetic and optical media
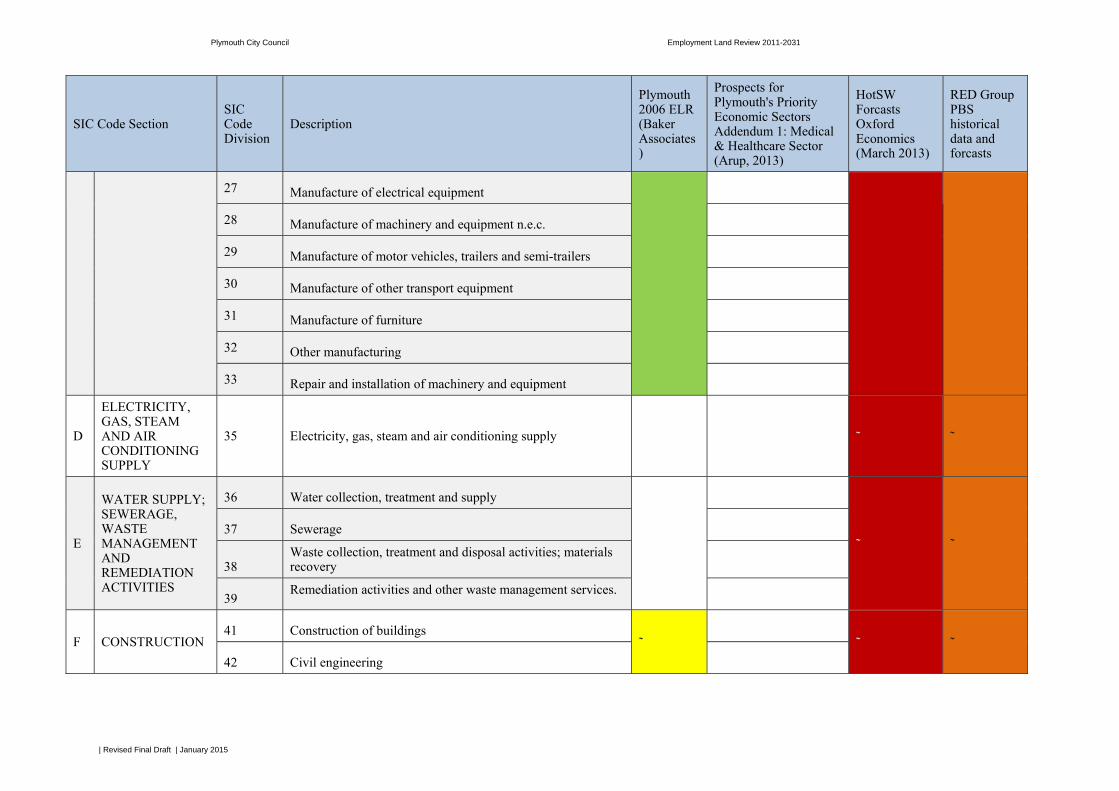
Plymouth City Council Employment Land Review 2011-2031
| Revised Final Draft | January 2015
SIC Code Section SIC Code Division
Description
Plymouth 2006 ELR (Baker Associates)
Prospects for Plymouth's Priority Economic Sectors Addendum 1: Medical & Healthcare Sector (Arup, 2013)
HotSW Forcasts Oxford Economics (March 2013)
RED Group PBS historical data and forcasts
27 Manufacture of electrical equipment
28 Manufacture of machinery and equipment n.e.c.
29 Manufacture of motor vehicles, trailers and semi-trailers
30 Manufacture of other transport equipment
31 Manufacture of furniture
32 Other manufacturing
33 Repair and installation of machinery and equipment
D
ELECTRICITY, GAS, STEAM AND AIR CONDITIONING SUPPLY
35 Electricity, gas, steam and air conditioning supply ˜ ˜
E
WATER SUPPLY; SEWERAGE, WASTE MANAGEMENT AND REMEDIATION ACTIVITIES
36 Water collection, treatment and supply
˜ ˜ 37 Sewerage
38 Waste collection, treatment and disposal activities; materials recovery
39 Remediation activities and other waste management services.
F CONSTRUCTION 41 Construction of buildings
˜ ˜ ˜ 42 Civil engineering
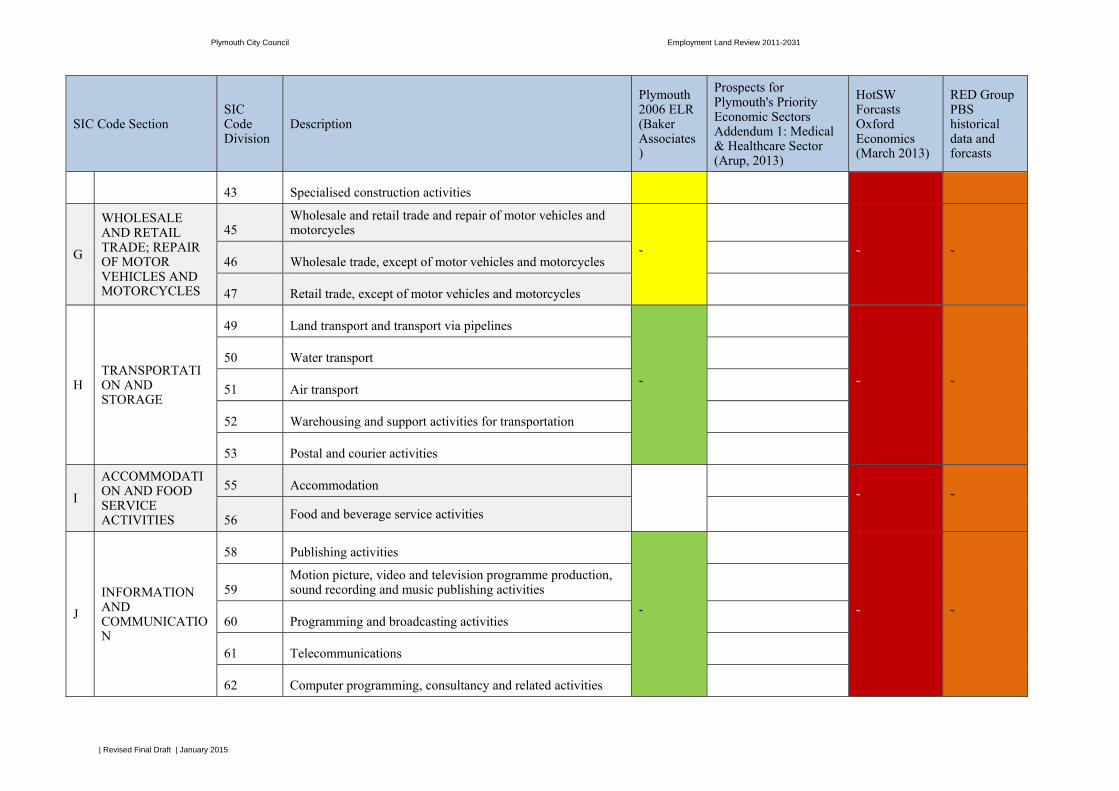
Plymouth City Council Employment Land Review 2011-2031
| Revised Final Draft | January 2015
SIC Code Section SIC Code Division
Description
Plymouth 2006 ELR (Baker Associates)
Prospects for Plymouth's Priority Economic Sectors Addendum 1: Medical & Healthcare Sector (Arup, 2013)
HotSW Forcasts Oxford Economics (March 2013)
RED Group PBS historical data and forcasts
43 Specialised construction activities
G
WHOLESALE AND RETAIL TRADE; REPAIR OF MOTOR VEHICLES AND MOTORCYCLES
45 Wholesale and retail trade and repair of motor vehicles and motorcycles
˜
˜ ˜ 46 Wholesale trade, except of motor vehicles and motorcycles
47 Retail trade, except of motor vehicles and motorcycles
H TRANSPORTATION AND STORAGE
49 Land transport and transport via pipelines
˜
˜ ˜
50 Water transport
51 Air transport
52 Warehousing and support activities for transportation
53 Postal and courier activities
I
ACCOMMODATION AND FOOD SERVICE ACTIVITIES
55 Accommodation
˜ ˜
56 Food and beverage service activities
J
INFORMATION AND COMMUNICATION
58 Publishing activities
˜
˜ ˜
59 Motion picture, video and television programme production, sound recording and music publishing activities
60 Programming and broadcasting activities
61 Telecommunications
62 Computer programming, consultancy and related activities

Plymouth City Council Employment Land Review 2011-2031
| Revised Final Draft | January 2015
SIC Code Section SIC Code Division
Description
Plymouth 2006 ELR (Baker Associates)
Prospects for Plymouth's Priority Economic Sectors Addendum 1: Medical & Healthcare Sector (Arup, 2013)
HotSW Forcasts Oxford Economics (March 2013)
RED Group PBS historical data and forcasts
63 Information service activities
K FINANCIAL AND INSURANCE ACTIVITIES
64 Financial service activities, except insurance and pension funding
˜ ˜ ˜ 65 Insurance, reinsurance and pension funding, except compulsory social security
66 Activities auxiliary to financial services and insurance activities
L REAL ESTATEACTIVITIES 68 Real estate activities ˜ ˜
M
PROFESSIONAL, SCIENTIFIC AND TECHNICAL ACTIVITIES
69 Legal and accounting activities
˜ ˜ ˜
70 Activities of head offices; management consultancy activities
71 Architectural and engineering activities; technical testing and analysis
72 Scientific research and development
73 Advertising and market research
74 Other professional, scientific and technical activities
75 Veterinary activities
N
ADMINISTRATIVE AND SUPPORT SERVICE ACTIVITIES
77 Rental and leasing activities
˜ ˜ 78 Employment activities
79 Travel agency, tour operator and other reservation service and related activities

Plymouth City Council Employment Land Review 2011-2031
| Revised Final Draft | January 2015
SIC Code Section SIC Code Division
Description
Plymouth 2006 ELR (Baker Associates)
Prospects for Plymouth's Priority Economic Sectors Addendum 1: Medical & Healthcare Sector (Arup, 2013)
HotSW Forcasts Oxford Economics (March 2013)
RED Group PBS historical data and forcasts
80 Security and investigation activities
81 Services to buildings and landscape activities
82 Office administrative, office support and other business support activities
O
PUBLIC ADMINISTRATION AND DEFENCE; COMPULSORY SOCIAL SECURITY
84 Public administration and defence; compulsory social security
˜
˜ ˜
P EDUCATION 85 Education ˜ ˜ ˜
Q
HUMAN HEALTH AND SOCIAL WORK ACTIVITIES
86 Human health activities
˜
8610 Hospital Activities; 8622 Specialist Medical Practice Activities; 8623 Dental Practice Activities; 8690 Other Human Health Activities
˜ ˜
87 Residential care activities
88 Social work activities without accommodation
R ARTS,ENTERTAINMEN
90 Creative, arts and entertainment activities ˜ ˜ ˜
91 Libraries, archives, museums and other cultural activities

Plymouth City Council Employment Land Review 2011-2031
| Revised Final Draft | January 2015
SIC Code Section SIC Code Division
Description
Plymouth 2006 ELR (Baker Associates)
Prospects for Plymouth's Priority Economic Sectors Addendum 1: Medical & Healthcare Sector (Arup, 2013)
HotSW Forcasts Oxford Economics (March 2013)
RED Group PBS historical data and forcasts
T AND RECREATION 92 Gambling and betting activities
93 Sports activities and amusement and recreation activities
S OTHER SERVICEACTIVITIES
94 Activities of membership organisations
˜ ˜ 95 Repair of computers and personal and household goods
96 Other personal service activities
T
ACTIVITIES OF HOUSEHOLDS AS EMPLOYERS; UNDIFFERENTIATED GOODS-AND SERVICES-PRODUCING ACTIVITIES OF
97 Activities of households as employers of domestic personnel
˜ 98 Undifferentiated goods- and services-producing activities of
private households for own use
U
ACTIVITIES OF EXTRATERRITORIAL ORGANISATIONS AND BODIES
99 Activities of extraterritorial organisations and bodies

Plymouth City Council Employment Land Review 2011-2031
| Revised Final Draft | January 2015
Appendix C
Employment Land Sub-Areas

Plymstock
City Centre and Waterfront
A38 Corridor West
A38 Corridor East
A386 Northern Corridor
Plympton
Job No237095-00Drawing No Issue005 P1
Drawing StatusIssue
Job Title
Client
63 St Thomas Street Bristol BS1 6JZ United Kingdomt +44 11 7976 5432 f +44 11 7976 5433www.arup.com
0 1,300 2,600650
Metres
LegendELR Main Employment LandAreas
!°
© Arup
Plymouth City Council
Plymouth Employment Land Review 2011 - 2031
A3
\\Global\Europe\Bristol\Jobs\230xxx\230601-00\4.30_Drgs\2_GIS\4-84 Map Documents\PLA_Planning\Employment_Land_Site_Status_Map_2014_V1_21.03.2014ND_A3Vacant Sites edit.mxd
08/09
/2014
14:54
:52
Appendix G - Employment Land Supply Map
Scale at A31:50,000
Contains Ordnance Survey data © Crown copyright and database right 2013
Issue Date By Chkd Appd
P1 2014-09-08 MM RM EP

Plymouth City Council Employment Land Review 2011-2031
| Final | March 2015
Appendix D
Inward Investment Enquiries
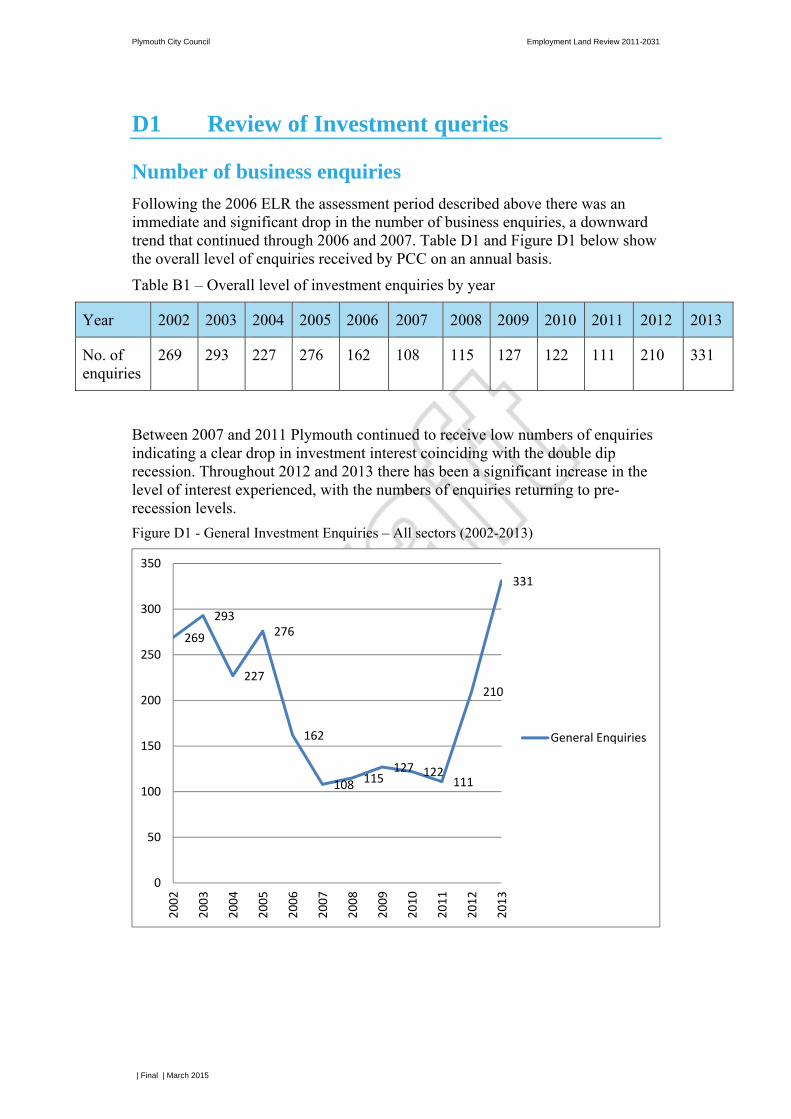
Plymouth City Council Employment Land Review 2011-2031
| Final | March 2015
D1 Review of Investment queries
Number of business enquiries
Following the 2006 ELR the assessment period described above there was an immediate and significant drop in the number of business enquiries, a downward trend that continued through 2006 and 2007. Table D1 and Figure D1 below show the overall level of enquiries received by PCC on an annual basis.
Table B1 – Overall level of investment enquiries by year
Year 2002 2003 2004 2005 2006 2007 2008 2009 2010 2011 2012 2013
No. of enquiries
269 293 227 276 162 108 115 127 122 111 210 331
Between 2007 and 2011 Plymouth continued to receive low numbers of enquiries indicating a clear drop in investment interest coinciding with the double dip recession. Throughout 2012 and 2013 there has been a significant increase in the level of interest experienced, with the numbers of enquiries returning to pre-recession levels. Figure D1 - General Investment Enquiries – All sectors (2002-2013)
269
293
227
276
162
108 115127 122
111
210
331
0
50
100
150
200
250
300
350
2002
2003
2004
2005
2006
2007
2008
2009
2010
2011
2012
2013
General Enquiries

Plymouth City Council Employment Land Review 2011-2031
| Final | March 2015
Reason and origin of investment enquiry
Table D2 sets out the origin of investment queries to Plymouth, within five broad categories, as well as the reason for considering investment in the city. The origin categories referred to include expansion from outside Plymouth, expansion from within Plymouth, new businesses and relocation from both outside and within Plymouth.
New businesses account for 38% of the overall total for the five groups, increasing as a proportion of total enquiries during the period since 2006, which is potentially positive for Plymouth. Both expansion and relocation from outside Plymouth result in a combined percentage of 32% and enquiries regarding expansion within Plymouth which will also require additional land, amounts to 13%. Table D2 - Origin of investment enquiry and developer reason for enquiry
Year 2002 2003 2004 2005 2006 2007 2008 2009 2010 2011 2012 2013 Total
Acquisition 1 1 1 2 0 0 0 0 0 0 9 15 29
Downsizing 0 0 0 0 0 1 0 0 1 1 2 2 7
Expansion from outside Plymouth
49 23 19 13 8 10 6 15 13 13 22 16 207
Expansion within Plymouth
16 3 9 14 2 8 5 2 7 5 15 32 118
Familiarisation Visit 0 0 0 0 0 0 0 0 0 1 2 0 3
Investment 0 0 0 0 0 0 0 0 2 2 6 4 14
Joint Venture 6 16 8 28 8 9 57 62 61 0 1 1 257

Plymouth City Council Employment Land Review 2011-2031
| Final | March 2015
Year 2002 2003 2004 2005 2006 2007 2008 2009 2010 2011 2012 2013 Total
New business 35 16 19 19 10 13 8 10 8 11 75 120 344
Relocation from outside Plymouth
17 13 12 6 1 10 5 2 1 3 7 3 80
Relocation within Plymouth
25 28 14 21 1 9 6 7 4 4 9 24 152
Supply sourcing 1 1 0 0 1 0 0 0 0 0 1 4 8
Temporary project 0 0 0 0 0 1 0 0 1 0 5 13 20

Plymouth City Council Employment Land Review 2011-2031
| Final | March 2015
Figure D2 - Origin of investment enquiry and developer reason for enquiry

Plymouth City Council Employment Land Review 2011-2031
| Final | March 2015
Investment enquiries by sector
The data enables a breakdown of enquiries by sector, based on ‘best fit’ to SIC codes (see Appendix B) for a comparison table of investment enquiry categories and SIC codes) and the priority sectors established within the 2006 Economic Strategy. Table D3 – Investment enquiries by SIC Code
Year Priority Code/ SIC Code
2002 2003 2004 2005 2006 2007 2008 2009 2010 2011 2012 2013 Total
Plymouth Local Economic Strategy Priority Sectors
Advanced Engineering/ Manufacturing P1 49 62 55 52 28 16 7 9 10 6 5 6 305
Marine Industries P2 7 6 5 5 3 4 1 0 3 5 7 4 50
Medical and Health P3 7 7 9 12 5 2 7 3 4 4 1 7 68
Business Services P4 10 15 10 16 7 10 1 0 5 3 10 18 105
Tourism P5 0 0 0 0 0 1 0 1 0 3 11 10 26
Creative Industries P6 8 14 12 21 7 4 0 4 0 6 13 18 107
Other sectors
Agricultural and Fishing A 2 2 0 4 0 0 3 1 0 0 0 3 15
Charity - 5 0 3 4 5 3 1 1 0 0 6 8 36
Construction F 12 12 9 4 1 1 1 2 1 1 17 13 74
Distribution 52 9 10 5 1 2 2 0 1 0 1 1 1 33
Education and Training P 1 4 1 5 2 1 0 0 1 3 8 15 41

Plymouth City Council Employment Land Review 2011-2031
| Final | March 2015
Year Priority Code/ SIC Code
2002 2003 2004 2005 2006 2007 2008 2009 2010 2011 2012 2013 Total
Electricity Gas and Water Supply D 1 4 1 4 1 2 3 0 1 1 0 0 18
Hotels and Restaurants I 5 1 7 5 6 9 1 4 4 5 12 17 76
Other Services S 56 67 40 64 43 32 76 90 80 9 24 30 611
Public Administration and Defence O 5 4 0 5 0 1 3 1 2 0 1 1 23
Renewables and Green Industries - 6 4 2 8 6 3 0 2 4 5 4 8 52
Retail Trade and Wholesale 46 & 47 25 17 16 6 8 2 0 1 1 3 27 50 156
Sale and Repair of Motor Vehicles/Cycle 45 8 12 8 10 4 6 1 2 2 1 6 15 75
Social Enterprise 93 0 0 0 0 0 0 0 0 0 0 3 0 3
Transport H 24 12 9 14 6 4 6 4 2 1 0 7 89
Unknown - 29 40 33 36 28 5 4 2 2 51 55 100 385
It is difficult to draw clear conclusions on a sector by sector basis, given the large proportion of enquiries that fall within the ‘Other Services’ and ‘Unknown’ categories. Nevertheless, the enquiries specifically relating to the priority sectors can be seen to make up around 28% (2002 – 2013), dropping to 19% during 2007 – 2013, although the average for the whole 12 year period hides that the priority sectors made up 35% of all enquiries during the earliest data collection period (2002 – 2006). In particular, enquiries relating to Advanced Engineering / Manufacturing dropped, as a proportion, from 20% during 2002-2012 to only 5% since 2007.

Plymouth City Council Employment Land Review 2011-2031
| Final | March 2015
There are no further sectors that show dramatic increases or reductions in the number of enquiries as a proportion of the total during the period 2007 – 2013.

Plymouth City Council Employment Land Review 2011-2031
| Final | March 2015
Figure D3 - Investment enquiries by SIC Code

Plymouth City Council Employment Land Review 2011-2031
| Final | March 2015
Investment enquiries by floorspace sought
As shown in Table 9 and Figure 12, floorspace enquiries range from between 0-15 sqm up-to over 10,000. Similar to the position recorded within the 2006 ELR, the highest proportion of enquiries are for the floorspace range 101 to 500sqm, which at 33% is double that recorded for most other floorspace ranges. The second highest proportion of enquiries is for the floorspace range 1,001 to 10,000sqm, which suggests there is demand for larger premises, although this is a particularly large floorspace range. In relative terms, there are very few enquiries for premises providing floorspace of 10,000sqm or more.
Table D4 - Investment enquiries by floorspace sought
Size in sqm 2002 2003 2004 2005 2006 2007 2008 2009 2010 2011 2012 2013 Total
Unspecified 97 126 85 133 103 71 91 77 90 66 142 210 1291
0-50 11 16 14 19 8 6 2 10 4 2 11 21 124
51-100 26 23 17 27 12 4 5 8 5 7 10 17 161
101-500 53 54 45 39 22 7 8 5 11 14 18 48 324
501-1,000 30 23 20 16 8 8 - 5 2 7 11 16 146
1,001-10,000 36 28 33 26 6 12 7 15 8 12 13 9 205
Over 10,000 4 4 2 2 2 0 1 0 0 0 3 1 18

Plymouth City Council Employment Land Review 2011-2031
| Final | March 2015
Figure D4 - Investment enquiries by floorspace sought

Plymouth City Council Employment Land Review 2011-2031
| Final | March 2015

Plymouth City Council Employment Land Review 2011-2031
| Final | March 2015
Appendix E
Call for Sites

Plymouth City Council Employment Land Review 2011-2031
| Final | March 2015
Overview of responses to the Employment Land Survey and Call for Sites
Response ID No. / Response Organisation
Part A – Survey on employment land supply and demand Part B – Call for Sites
Types of employment land in undersupply or with surplus
Site attributes Site Size Site Name/Address Proposed use Ownership Current uses needing to be re-located
1 Office premises (surplus) n/a n/a n/a n/a n/a n/a
3 Fast food chains (surplus) n/a n/a n/a n/a n/a n/a
5 Industrial units (undersupply) none specified Large site
Broadley Ind Est (South Hams District Council)
Business (B1) General industrial (B2) Storage or distribution (B8)
Maristow Tuckett Trust unknown
Quod
Strategically important sites at Derriford/Seaton (undersupply)
Proximity to existing Medical, Technology and Business Park
Large strategic site
The Seaton Barracks Parade Ground site Business (B1)
Parade Ground owned by PCC, Other ownerships unknown
unknown
Quod
Strategically important sites at Derr iford/Seaton (undersupply)
Proximity to existing Medical, Technology and Business Park
Large strategic site
North West Quadrant, Derriford Road, Plymouth
Business (B1) Wharfside Regeneration (Devon) Limited
Buildings to be demolished

Plymouth City Council Employment Land Review 2011-2031
| Final | March 2015
Response ID No. / Response Organisation
Part A – Survey on employment land supply and demand Part B – Call for Sites
Types of employment land in undersupply or with surplus
Site attributes Site Size Site Name/Address Proposed use Ownership Current uses needing to be re-located
Network Rail
N/A N/A N/A Laira Rail Light Maintenance Depot
Some or all may be released for development post – 2018.
Network Rail
N/A N/A N/A Plymouth Station
Redevelopment of Intercity House and car park may incorporate employment uses.
Network Rail
PCLPlanning Ltd N/A N/A N/A Former Imerys Site,
Coypool, Plymouth Not available for future employment use.
Not confirmed N/A
Plymouth City Council – Economic Development
N/A N/A N/A
Seaton Neighbourhood Business (B1) Plymouth City
Council N/A
Glacis Park, Derriford Business (B1)
North West Quadrant, Derriford
Business (B1) and small-scale retail
Plymouth International Medical & Technology Park (PIMTP)
Business (B1)
Plot D430, Derriford Business (B1) – northeast ‘quarter’ of the site.
Former Parade Ground, Seaton Barracks, Derriford
Business (B1) and mix of retail (A2, A3,

Plymouth City Council Employment Land Review 2011-2031
| Final | March 2015
Response ID No. / Response Organisation
Part A – Survey on employment land supply and demand Part B – Call for Sites
Types of employment land in undersupply or with surplus
Site attributes Site Size Site Name/Address Proposed use Ownership Current uses needing to be re-located
A4 and A5), plus residential.
Stonehouse Creek Car Park
Park & Ride facility for Royal William Yard.

Plymouth City Council Employment Land Review 2011-2031
| Final | March 2015
Appendix F
Schedule of Sites 2014
[This schedule is available as a separate file on the Plymouth City Council website]

Plymouth City Council Employment Land Review 2011-2031
| Final | March 2015
Appendix G
Employment Land Supply Map

Plymstock
City Centre and Waterfront
A38 Corridor West
A38 Corridor East
A386 Northern Corridor
Plympton
Job No237095-00Drawing No Issue005 P1
Drawing StatusIssue
Job Title
Client
63 St Thomas Street Bristol BS1 6JZ United Kingdomt +44 11 7976 5432 f +44 11 7976 5433www.arup.com
0 1,300 2,600650
Metres
LegendSite_Name
Employment Land Supply 2015PIMTPELR Main Employment LandAreas
!°
© Arup
Plymouth City Council
Plymouth Employment Land Review 2011 - 2031
A3
\\Global\Europe\Bristol\Jobs\230xxx\230601-00\4.30_Drgs\2_GIS\4-84 Map Documents\PLA_Planning\Employment_Land_Site_Status_Map_2014_V1_21.03.2014ND_A3Vacant Sites edit.mxd
08/09
/2014
14:54
:52
Appendix G - Employment Land Supply Map
Scale at A31:50,000
Contains Ordnance Survey data © Crown copyright and database right 2013
Issue Date By Chkd Appd
P1 2014-09-08 MM RM EP

Plymouth City Council Employment Land Review 2011-2031
| Final | March 2015
Appendix H
PIMTP Sites Map

BAC
I
D
H G
F
E
J
THESHIP
PLYMOUTH INTERNATIONALMEDICAL AND
TECHNOLOGY PARK
N
© Crown copyright and database rights 2014Ordnance Survey 100018633
Site Area Description / NotesDevelopment site.A 2.05
Development site. B 2.06
Development site. Known as Former Seaton Barracks Parade Ground.D 5.36
Expansion site for Hellermann Tyton. Also known as ‘Site E320’. Planning application numbers 08/02218/FUL and 10/01146/FUL.
Development site. 1.27 ha figure includes 0.349 ha ‘K2 Medical Supplies’ site (William Prance Road). Planning application number 14/00519/FUL.E 1.27
C* 1.04
Development site.
Development site.
Development site.
Seaton Neighbourhood. Includes 8000m2 B1 office development as part of mixed use, primarily residential development of phases A1and A2 (this plandoes not show the full extent of the proposed development). Planning application number 12/02027/OUT
I
H 0.47
G 0.55
F 0.21
J
THESHIP
Site for new primary school. Planning application number 14/01615/FUL.
Redevelopment opportunity. Former site of Western Morning News, vacated 2008/09
*Note that Site C has been developed, i.e. is not vacant, but is included within the employment land supply because developed post 2011 (start date for assessing employment land need).
in hectares
1.84
5.02