
Employment Cost Indexes, 1975-99 Cost Indexes, 1975-99 ... (wages and salaries, and em-ployer costs...
165
Employment Cost Indexes, 1975-99 U.S. Department of Labor Alexis M. Herman, Secretary Bureau of Labor Statistics Katharine G. Abraham, Commissioner September 2000 Bulletin 2532
Transcript of Employment Cost Indexes, 1975-99 Cost Indexes, 1975-99 ... (wages and salaries, and em-ployer costs...
Employment Cost Indexes,1975-99U.S. Department of LaborAlexis M. Herman, Secretary
Bureau of Labor StatisticsKatharine G. Abraham, Commissioner
September 2000
Bulletin 2532
iii
Preface
This bulletin provides data on the Bureau of LaborStatistics’ major measure of compensation costtrends: The Employment Cost Index (ECI). The ECI
is a fixed-employment-weighted index that tracks quar-terly changes in labor costs (wages and salaries, and em-ployer costs for employee benefits), free from the influ-ence of employment shifts among occupations andindustries. The bulletin presents complete historical dataon the ECI from its inception in September 1975 throughDecember 1999, and reviews recent trends in compensa-tion costs. In addition, it provides measures of precision inits component subindexes and copies of articles examin-ing the data.
The ECI is prepared in the Bureau’s Office of Compen-sation and Working Conditions (OCWC), which producesa variety of compensation measures. Work is currently un-der way to integrate all the OCWC compensation measuresinto a single comprehensive statistical program, the Na-tional Compensation Survey (NCS). The NCS replaces threeBureau programs that provide data on employer costs forwages and salaries, as well as benefits, and on benefit inci-dence and provisions.
The NCS is being implemented in two phases. In thefirst phase, the NCS has focused on measures of occupa-tional earnings, replacing the Occupational CompensationSurvey Program with a revised data collection proceduredesigned to provide broader coverage of occupations in thecivilian non-Federal and nonfarm economy. During the nextphase, the ECI and the Employee Benefits Survey—whichstudies the incidence and detailed characteristics of em-
ployer-provided benefits—will be incorporated into theNCS. The data collected also will be used to compile theEmployer Costs for Employee Compensation, which pro-vides the cost per hour worked for wages and benefits. Whenfully implemented, data for all NCS products will be col-lected from a single sample of establishments.
The published estimates for the components of the NCSare presented in separate reports. Data for occupational earn-ings appear in a variety of local area and national bulletins.Historical hourly cost levels data are presented in a sepa-rate publication. Employee Benefits Survey data will con-tinue to be published separately through the year 2000. Af-ter that, new benefit incidence and provisions products willbe published as a part of the NCS.
Staff of the Office of Compensation and Working Con-ditions prepared this bulletin. The office’s Statistical Meth-ods Group was responsible for the survey sample design,nonresponse adjustments, sample error computations, andother statistical procedures. Fieldwork for the survey wasdirected by the Bureau’s Assistant Regional Commission-ers for Operations. Collection procedures and systems de-sign were provided by the Division of Directly CollectedPeriodic Surveys.
Material in this publication is in the public domain and,with appropriate credit, may be reproduced without per-mission. Further information about the ECI and other NCSproducts is available at http://www.bls.gov/ecthome.htm.Information in this publication is available to sensory im-paired individuals upon request: Voice phone: (202) 691-5200; Federal Relay Service: 1-800-877-8339.

iv
Contents
Chapter
I. Introduction ................................................................................................................................................... 1Background .............................................................................................................................................. 1Uses.......................................................................................................................................................... 2Limitations ............................................................................................................................................... 2
II. Employment Cost Index: Trends in compensation ....................................................................................... 3Wages and salaries compared with benefits ............................................................................................ 3Private industry compared with State and local government ................................................................. 4Pay changes by occupational group ......................................................................................................... 4Pay changes by industry group ................................................................................................................ 6Pay changes by bargaining unit status..................................................................................................... 7Pay changes by region ............................................................................................................................. 8Current- and constant-dollar wage and salary changes .......................................................................... 8
Text tables:
Average annual percent changes in wages and salaries by:1. Occupational group in private industry, selected periods, 1975-99 ......................................................... 62. Private industry group, December 1978-December 1999 .........................................................................73. Region, private industry, selected periods, 1975-99 ................................................................................. 8
Percent changes:4. ECI for wages and salaries in private industry and in the Consumer Price Index for All Urban
Consumers (CPI-U), 1976-99 ..................................................................................................................... 8
Charts:
1. Coverage of the Employment Cost Index, 1999 ....................................................................................... 2
Changes in:2. Wages and salaries and benefit costs, civilian workers, 1983-99 .............................................................33. Compensation costs, private industry and State and local governments, 1983-99 .................................. 54. White- and blue-collar workers, private industry, 1977-99 ...................................................................... 55. Wages and salaries in goods- and service-producing industries, private industry, 1977-99.................... 66. Wages and salaries for union and nonunion workers, private industry, 1977-99 .................................... 77. Current- and constant-dollar wages and salaries, private industry, 1977-99 ........................................... 9
Page
v
Contents—Continued
Reference tables
Seasonally adjusted data
Total compensation costs: 01. Civilian, State and local government, and private industry workers, by occupational and industry
group, 1980-99 .......................................................................................................................................... 010
Wages and salaries: 02. Civilian, State and local government, and private industry workers, by occupational and industry
group, 1980-99 .......................................................................................................................................... 016Benefit costs:
03. Civilian, State and local government, and private industry workers, by occupational and industry group, 1980-99 ............................................................................................................................................. 023
Not seasonally adjusted data
Total compensation costs: 04. Civilian workers by occupational and industry group, 1981-99 ................................................................027 05. State and local government workers by occupational and industry group, 1981-99 .................................033 06. Private industry workers by occupational and industry group, 1979-99 ...................................................039 07. Private industry workers by bargaining status, region, and area size, 1979-99 ........................................060
Wages and salaries: 08. Civilian workers by occupational and industry group, 1981-99 ................................................................068 09. State and local government workers by occupational and industry group, 1981-99 .................................074 10. Private industry workers by occupational and industry group, 1975-99 ...................................................080 11. Private industry workers by bargaining status, region, and area size, 1975-99 ........................................ 105
Benefit costs:12. Civilian, State and local government, and private industry workers by occupational and industry group, 1979-99 ............................................................................................................................................... 114
Appendixes
Appendix A. Description of the survey, estimation methods, and measures of data reliability ...................... 120
Standard errors for 12-month percent changes, Employment Cost Index, March 1995-December 1999, not seasonally adjusted:
A-1. Total compensation ............................................................................................................................... 126A-2. Wages and salaries ............................................................................................................................... 140A-3. Benefits ................................................................................................................................................. 154
Employment cost index seasonal factors:
A-4. For selected industries and occupational groups, 2000 ....................................................................... 156
Page
vi
Appendix B. Classification by industry, occupation, geographic region, union status, and area size ............... 157
Appendix C. Selected research articles ............................................................................................................... 159
Related Articles
Technical aspects of the ECI:
Lettau, Michael K., Loewenstein, Mark A., and Cushner, Aaron. “Is the ECI sensitive to the method of ......aggregation?,” Monthly Labor Review, June 1997, pp. 3-11. ..................................................................... 160
O’Conor, Karen and Wong, William. “Measuring the precision of the Employment Cost Index,”Monthly Labor Review, March 1989, pp. 29-36. ........................................................................................ 169
Schwenk, Albert E. “Employment Cost Index rebased to June 1989,” Monthly Labor Review,April 1990, pp. 38-39. ................................................................................................................................. 177
Schwenk, Albert E. “Introducing 1990 Weights for the Employment Cost Index,” Compensationand Working Conditions, June 1995, pp. 1-5. ............................................................................................. 179
Wood, G. Donald. “Estimation procedures for the Employment Cost Index,” Monthly Labor Review,May 1982, pp. 40-42. ................................................................................................................................... 184
Analysis of ECI data:
Schwenk, Albert E. “Trends in the Differences Between Union and Nonunion Workers in Pay Using theEmployment Cost Index,” Compensation and Working Conditions, September 1996, pp. 27-33. ............ 187
Schwenk, Albert E. “Differences Among Private Industry Occupational Groups in Pay Levels and Trends,”Compensation and Working Conditons, Winter 1997, pp. 12-18. .............................................................. 194
Schwenk, Albert E. “Measuring Trends in the Structure and Levels of Employer Costs for EmployeeCompensation,” Compensation and Working Conditions, Summer 1997, pp. 3-14. ................................. 201
Schwenk, Albert E. “Trends in Health Insurance Costs,” Compensation and Working Conditions,Spring 1999, pp. 24-28 ................................................................................................................................ 213
Schwenk, Albert E. “Compensation Cost Trends in Private Industry and State and Local Governments,”Compensation and Working Conditions, Fall 1999, pp. 13-18. .................................................................. 218
Shelly, Wayne M. “Comparing Trends in Components of the Employment Cost Index,” Compensationand Working Conditions, Summer 1997, pp. 44-51. ................................................................................... 224
Uses of ECI data:
Schwenk, Albert E. “Escalation in Employer Costs for Employee Compensation: A Guide forContracting Parties,” Compensation and Working Conditions, Spring 1997, pp. 3-10. ............................ 232
Contents—Continued
Page
1
Chapter I. Introduction
The Employment Cost Index (ECI) was developed inthe early 1970’s in response to policy makers‘ needfor a timely, accurate, and comprehensive indicator
of changes in employers’ labor costs that was free from theinfluence of employment shifts among industries and occu-pations. The ECI is published in the month following thereference months of March, June, September, and Decem-ber. It covers both wages and salaries and employer costsfor employee benefits. All occupations and establishmentsin the private nonfarm sector and State and local govern-ment are represented. This broad coverage permits analy-sis of labor cost changes for a major portion of the U.S.economy. The objective of measuring change unaffected byemployment shifts is accomplished by holding fixed overtime the distribution of employment among industries andoccupations, and by narrowly defining the jobs for whichdata are collected each quarter so that all workers in the jobcarry out the same task at roughly the same level of skill.
BackgroundECI statistics were first published for September-Decem-ber 1975 and continued to develop afterwards. In 1975, theywere limited to private industry wage and salary changesby major occupational and industry groups, region, unionstatus, and area size. Over time, new series were added. In1980, measures of total compensation cost changes (em-ployer costs for employee benefits, in addition to wages andsalaries) were developed for more comprehensive estimatesof the changes to labor costs. Separate estimates for thechanges in benefit costs were added for the private sector in1979, then for civilian workers in 1981, and finally for Stateand local governments in 1989.
Benefits covered by the ECI survey are: Paid leave (va-cations, holidays, sick leave, and other paid leave); supple-mental pay (premium pay for work in addition to the regu-lar work schedule, such as overtime and work on weekendsand holidays; shift differentials; and nonproduction bonusessuch as lump-sum payments provided in lieu of wage in-creases); life insurance; short-term and long-term disabil-ity benefits; health benefits; retirement and savings ben-efits (defined benefit and defined contribution plans); legallyrequired benefits (Social Security, medicare, Federal and
State unemployment insurance, and workers’ compensa-tion); and other benefits (severance pay and supplementalunemployment insurance).1
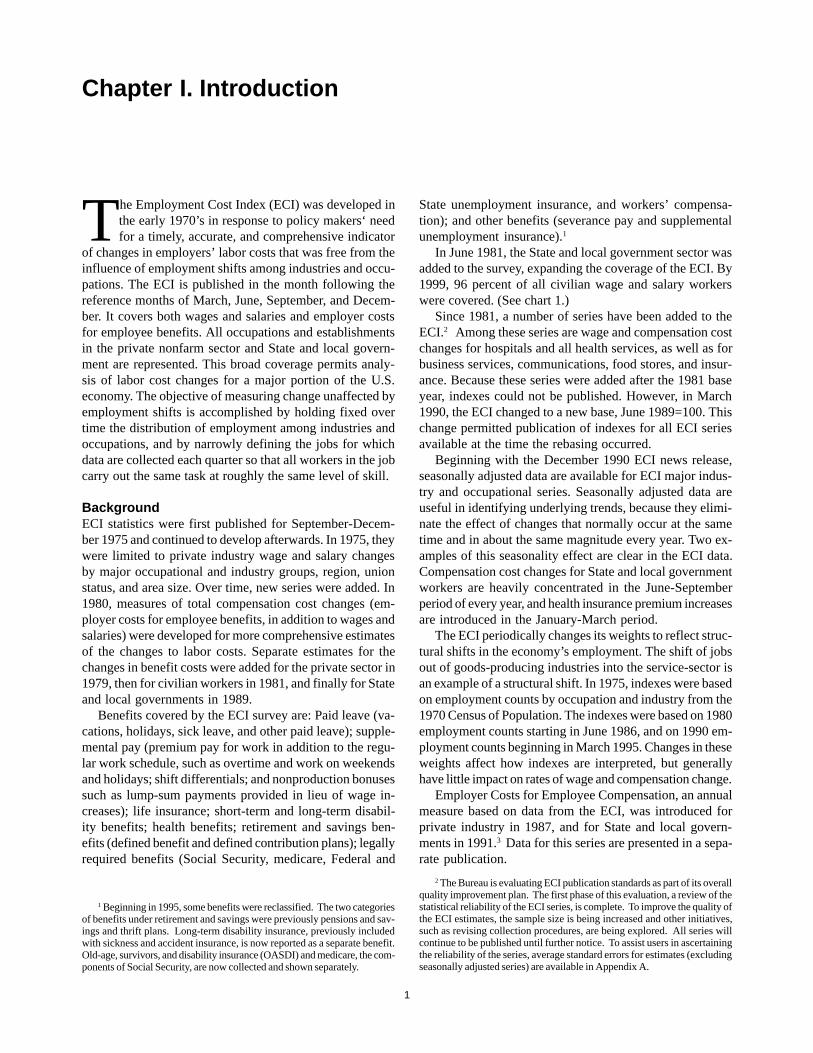
In June 1981, the State and local government sector wasadded to the survey, expanding the coverage of the ECI. By1999, 96 percent of all civilian wage and salary workerswere covered. (See chart 1.)
Since 1981, a number of series have been added to theECI.2 Among these series are wage and compensation costchanges for hospitals and all health services, as well as forbusiness services, communications, food stores, and insur-ance. Because these series were added after the 1981 baseyear, indexes could not be published. However, in March1990, the ECI changed to a new base, June 1989=100. Thischange permitted publication of indexes for all ECI seriesavailable at the time the rebasing occurred.
Beginning with the December 1990 ECI news release,seasonally adjusted data are available for ECI major indus-try and occupational series. Seasonally adjusted data areuseful in identifying underlying trends, because they elimi-nate the effect of changes that normally occur at the sametime and in about the same magnitude every year. Two ex-amples of this seasonality effect are clear in the ECI data.Compensation cost changes for State and local governmentworkers are heavily concentrated in the June-Septemberperiod of every year, and health insurance premium increasesare introduced in the January-March period.
The ECI periodically changes its weights to reflect struc-tural shifts in the economy’s employment. The shift of jobsout of goods-producing industries into the service-sector isan example of a structural shift. In 1975, indexes were basedon employment counts by occupation and industry from the1970 Census of Population. The indexes were based on 1980employment counts starting in June 1986, and on 1990 em-ployment counts beginning in March 1995. Changes in theseweights affect how indexes are interpreted, but generallyhave little impact on rates of wage and compensation change.
Employer Costs for Employee Compensation, an annualmeasure based on data from the ECI, was introduced forprivate industry in 1987, and for State and local govern-ments in 1991.3 Data for this series are presented in a sepa-rate publication.
1 Beginning in 1995, some benefits were reclassified. The two categoriesof benefits under retirement and savings were previously pensions and sav-ings and thrift plans. Long-term disability insurance, previously includedwith sickness and accident insurance, is now reported as a separate benefit.Old-age, survivors, and disability insurance (OASDI) and medicare, the com-ponents of Social Security, are now collected and shown separately.
2 The Bureau is evaluating ECI publication standards as part of its overallquality improvement plan. The first phase of this evaluation, a review of thestatistical reliability of the ECI series, is complete. To improve the quality ofthe ECI estimates, the sample size is being increased and other initiatives,such as revising collection procedures, are being explored. All series willcontinue to be published until further notice. To assist users in ascertainingthe reliability of the series, average standard errors for estimates (excludingseasonally adjusted series) are available in Appendix A.
2
UsesThe ECI was developed primarily to aid in economic analy-sis, and that remains its most important use. Analysts andpolicy makers, including the Federal Reserve Board, usethe ECI to form monetary policies and to monitor the ef-fects of those policies.
The ECI has proven useful in a number of other ways. Itis used to forecast wage trends and facilitate wage and ben-efit cost planning. The ECI serves as a guide in negotia-tions in collective bargaining. Several health cost contain-ment laws, including one for medicare, use the ECI as anadjustment factor to determine the allowable increases inhospital and physician charges. Increasingly, the ECI isbeing used as a labor cost escalator in long-term purchas-
ing and service contracts in both the private and public sec-tors in the United States as well as in other countries. 4
The ECI is also used in the Federal pay-setting process.The Ethics Reform Act of 1989 specifies that the pay ofCongress, Federal judges, and top Government officialswould be increased each year by the change in wages andsalaries for private industry workers (an ECI measure), less0.5 percentage point.5 The Federal Employees Pay Compa-rability Act of 1990 specifies that the ECI will be used toadjust pay for General Schedule employees. 6
The ECI also is used to develop measures of nationaleconomic performance and welfare. For example, the ECIis used to update the income side of the National Incomeand Product Accounts of the U.S. Department of Commerce,Bureau of Economic Analysis. Also, the Health Care Fi-nancing Administration of the U.S. Department of Healthand Human Services uses the ECI to estimate aggregateexpenditures for health care.
LimitationsLike other statistical series, the ECI has limitations. It doesnot cover all employers and employees, although it doescover nearly all workers in the civilian, non-Federaleconomy. It excludes the self-employed, as well as farm,private household, and Federal Government employees.Because it is based on a probability sample, the ECI surveyis subject to sampling errors that may cause the estimatesto deviate from the results that would be obtained if therecords of all establishments could be used in the calcula-tions. Because probability samples are used, standard er-rors can be calculated and are presented in appendix A ofthis bulletin. Standard errors can be used to measure theprecision of the estimates.
4 For guidance in using the ECI as an escalator, see Albert E. Schwenk,“Escalation in Employer Costs for Employee Compensation: A Guide forContracting Parties,” Compensation and Working Conditions, Spring 1997,pp. 3-9. This article is reprinted in appendix C of this bulletin.
5 See Public Law 101-154—November 30, 1989.6 See Public Law 101-509—November 5, 1990.
3 The data for 1986 were made available in 1997 and are now included inEmployer Costs for Employee Compensation, 1986-1999, Bulletin 2526(Bureau of Labor Statistics, March 2000).
CHART 1. Coverage of the Employment CostIndex, total civilian employment, 1999
Private industry83%
State and localgovernment
13%
Not covered:Federal government,
agriculture,households
4% ¯
3
Chapter II. Employment Cost Index:Trends in Compensation
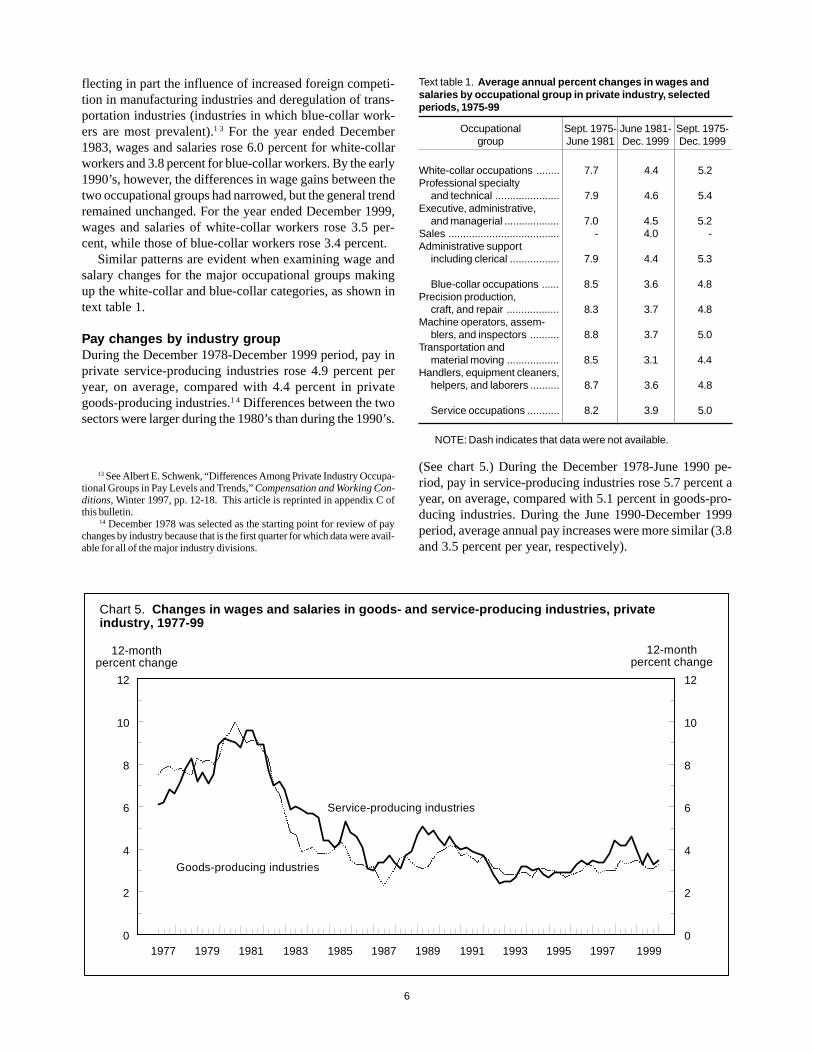
The Employment Cost Index (ECI) for total compen-sation increased 115.2 percent from June 1981 toDecember 1999 for civilian (private industry and
State and local government) workers. During the first 12months of that period, compensation costs increased 7.4percent. (See reference table 4.) Over the ensuing 5-yearperiod, June 1982-87, the rate of increase slowed steadilyto 3.4 percent in the 12 months ended in June 1987. Thispattern was reversed with the year ended in December 1987,as the growth in compensation costs began to accelerate.By March 1990, the annual rate of increase had climbed to5.5 percent, but then once again began to decline. Duringthe March 1995-June 1997 period, the 12-month percentchanges remained in the 2.7-percent to 2.9-percent range.In September 1997, compensation costs picked up slightly,and by September 1998, the 12-month change peaked at3.7 percent; it subsequently tapered off, remaining in the3.1-percent to 3.4-percent range.
Complete historical data for all ECI series are presentedin tables 1 through 12.7 Data presented in tables 1 through3 are seasonally adjusted, while data in tables 4 through 12
are not seasonally adjusted. The tables include data for ci-vilian, private industry, and State and local governmentworkers by occupational and industry group. The tables alsoinclude data by region, bargaining status, and establish-ment size for private industry workers, and separate datafor the aircraft manufacturing industry.
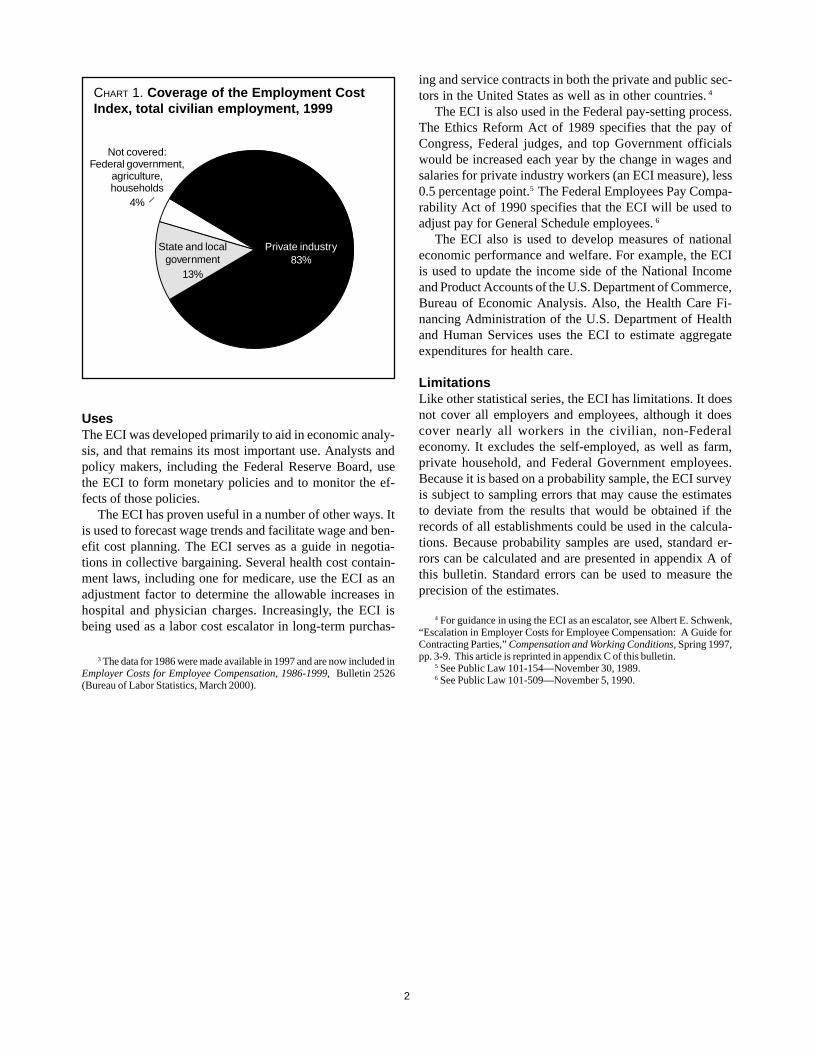
Wages and salaries compared with benefitsBetween June 1981 (when measures of compensation changefor all civilian workers were introduced) and December1999, the rate of increase in benefit costs outpaced the in-crease in wages and salaries (139 percent and 106 percent,respectively). Benefit increases were significantly higherthan wage and salary gains for every year ending in De-cember during 1983 and 1984 as well as between 1988 and1993. (See chart 2.) During 1985-87, wage and salary On
7 Beginning with the ECI news release for March 1990, ECI Indexes wererebased to June 1989=100. Previously, the base was June 1981=100. Anexplanation of the rebasing methodology is provided in Albert E. Schwenk,“ECI rebased to June 1989,” Monthly Labor Review, April 1990, pp.38-39.This article is reprinted in appendix C of this bulletin.
19910
2
4
6
8
10
12
0
2
4
6
8
10
12
Chart 2. Changes in wages and salaries and benefit costs, civilian workers, 1983-99
12-monthpercent change
Benefit costs
Wages and salaries
12-monthpercent change
1983 1985 1987 1989 1993 1995 1997 1999

4
changes were similar to benefit cost changes. Between 1988and 1994, benefit costs were growing at a faster pace, andbeginning in the third quarter of 1995, gains in wages andsalaries have been greater than gains in benefit costs, al-though the difference has narrowed over this period. Thispattern can be attributed primarily to fluctuations over timein the rate of change in health benefit costs and in the So-cial Security tax rate.8
The rates of increase for wages and salaries and for ben-efits slowed from 1981 to 1987. Factors such as the 1981-82 recession, foreign competition, and lower price increasesare thought to have contributed to the rapid slowdown inwage gains. At the same time, benefit costs were influencedby yearly boosts in the employer’s Social Security tax rateand a steady rise in health benefit costs.
Beginning in 1985, however, the rate of increase for ben-efit costs slowed even more. The slowdown in benefit costincreases was brought about by a decline in the growth ofhealth benefit costs, combined with a rapid decrease in thegrowth of retirement plan costs and smaller increases inthe Social Security tax rate.9
To relieve pressure on their health benefit expenditures,employers undertook several cost-containment measures.These measures included more self-funding of healthplans,1 0 increasing the availability of nontraditional planalternatives, such as health maintenance organizations andpreferred provider organizations, and increased cost shar-ing by employees.
The steep decline in the growth of pension costs reflecteda substantial rise in the value of pension fund portfolios overthe 1981-87 period.1 1 Employer cost-containment measures,such as increased numbers of defined contribution plans inprivate industry, also were important in stabilizing costs.
Over the year ended in December 1988, benefit costs ofcivilian workers rose 7.0 percent, compared with a rise of4.3 percent for wages and salaries. In 1988, the rate of in-crease in health benefit costs accelerated. Also, a SocialSecurity tax increase of 5 percent (from 7.15 to 7.51 per-cent) was instituted.
Benefit costs continued to rise more rapidly than wagesand salaries through 1994. For the year ended in June 1995and continuing through the year ended in December 1999,benefit cost increases lagged behind wage and salary in-creases, although the difference in the 12-month percent-age increases over the past year has narrowed. These dif-ferences, however, are not statistically significant. For theyear ending December 1999, wages and salaries increased3.5 percent, compared with 3.3 percent for benefit costs.
The slight acceleration in benefit costs over the last 3years reflects in part the recent growth in health care costs.
8 For an examination of fluctuations in health insurance costs over thepast 20 years, see Albert E. Schwenk, “Trends in Health Insurance Costs,”Compensation and Working Conditions, Spring 1999, pp.24-28. This ar-ticle is reprinted in appendix C of this bulletin.
9 See Bradley Braden, “Increases in employer costs for employee benefitsdampen dramatically,” Monthly Labor Review, July 1988, pp.3-7.
10 Schwenk, “Trends in Health Insurance Costs,” pp.24-28.11 Braden, “Increases in employer costs,” pp.6-7.
12 Ideally, an examination of employer labor costs over time would focuson total compensation—both wages and salaries—and benefits. This discus-sion is limited to changes in wages and salaries in private industry becausethis series has the longest data history.
the other hand, other factors have had stabilizing effects onthe increase in benefit costs. For example, the Social Secu-rity tax rate has not been raised above its January 1990level of 7.65 percent, although the taxable earnings ceilingincreased each year by the change in average wages. Theceiling for the medicare portion was more than doubled, to$125,000, in 1991, and was eliminated in 1994.
Private industry compared with State and localgovernmentThe different occupational and industry distribution in pri-vate industry and State and local government explains dif-ferences in the rate of change in compensation for theirworkers. Professional specialty and technical occupationsare more prevalent in State and local government than inprivate industry (approximately one-half and one-fifth oftotal employment, respectively). Furthermore, the compen-sation packages of the two sectors also differ. For example,Social Security coverage is almost universal in private in-dustry, but absent for many State and local governmentworkers. Public sector workers are more likely to partici-pate in defined benefit retirement plans than are those inthe private sector. The growth in participation in definedcontribution plans during the 1990s has been largely lim-ited to private industry.
Over the period between June 1981 and December 1999,compensation increases for State and local governmentworkers outpaced those in private industry (135 percent and111 percent, respectively). For the first 10 years of thisperiod, total compensation consistently increased more rap-idly in the public sector. However, in September 1991, thispattern reversed. (See chart 3.) The slowdown in State andlocal government compensation gains relative to privateindustry increases during the early 1990s reflects the tightbudget environment in the public sector typical of that pe-riod. For most of the mid- to late 1990s, the increases havebeen similar, between 2.5 and 3.5 percent, in both privateand public sectors. In the year ended December 1999, com-pensation costs rose by the same amount in both sectors,3.4 percent.
Pay changes by occupational groupECI data on wage and salary changes are available for mostmajor occupational groups beginning in September 1975,while the ECI series on compensation costs starts in De-cember 1985. This section summarizes changes in wagesand salaries from 1975.1 2
Between September 1975 and December 1999, wagesand salaries in private industry increased 227 percent forwhite-collar workers and 198 percent for blue-collar work-ers. During the late 1970’s, blue-collar wage gains weregenerally higher than those for white-collar workers. (Seechart 4.) In the early 1980’s this pattern was reversed, re-

5
19910
2
4
6
8
10
12
0
2
4
6
8
10
12
Chart 3. Changes in total compensation, private industry and State and local government, 1983-99
12-monthpercent change
State and local government workers
Private industry workers
12-monthpercent change
1983 1985 1987 1989 1993 1995 1997 1999
19850
2
4
6
8
10
12
0
2
4
6
8
10
12
Chart 4. Changes in wages and salaries for white- and blue-collar workers, private industry,1977-99
12-monthpercent change
White-collar workers
Blue-collar workers
12-monthpercent change
1977 1979 1981 1983 1987 1989 1991 1993 1995 1997 1999
6
flecting in part the influence of increased foreign competi-tion in manufacturing industries and deregulation of trans-portation industries (industries in which blue-collar work-ers are most prevalent).1 3 For the year ended December1983, wages and salaries rose 6.0 percent for white-collarworkers and 3.8 percent for blue-collar workers. By the early1990’s, however, the differences in wage gains between thetwo occupational groups had narrowed, but the general trendremained unchanged. For the year ended December 1999,wages and salaries of white-collar workers rose 3.5 per-cent, while those of blue-collar workers rose 3.4 percent.
Similar patterns are evident when examining wage andsalary changes for the major occupational groups makingup the white-collar and blue-collar categories, as shown intext table 1.
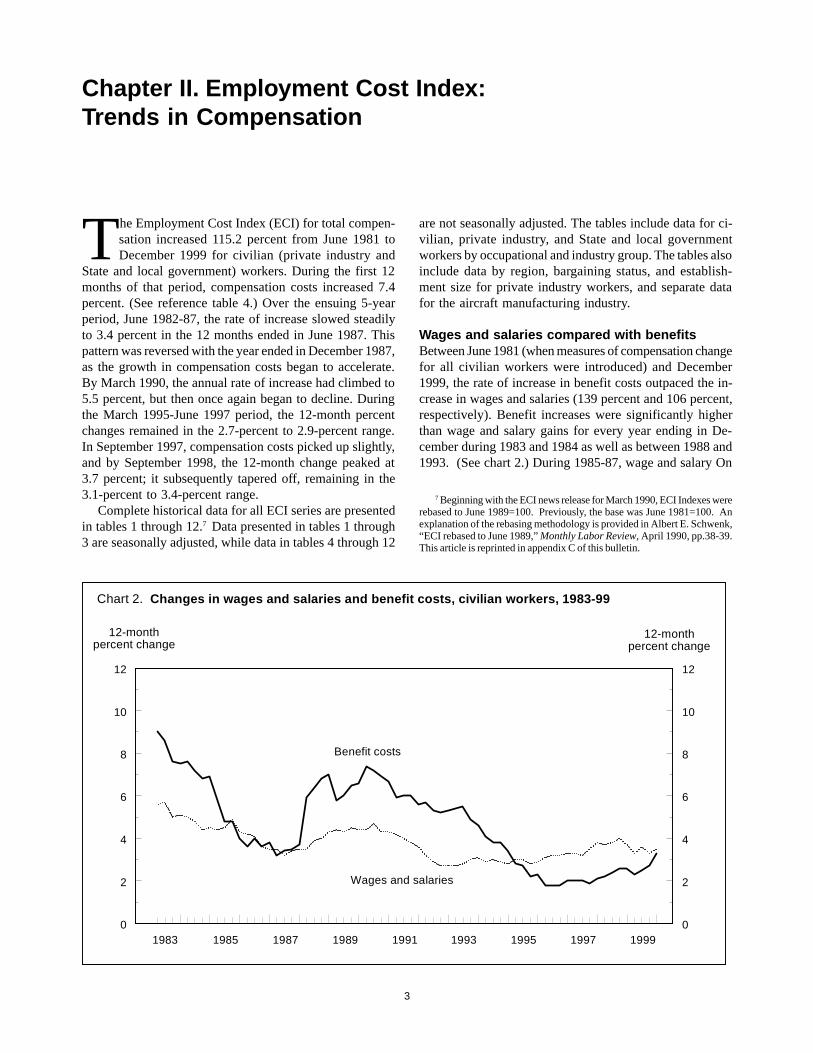
Pay changes by industry groupDuring the December 1978-December 1999 period, pay inprivate service-producing industries rose 4.9 percent peryear, on average, compared with 4.4 percent in privategoods-producing industries.1 4 Differences between the twosectors were larger during the 1980’s than during the 1990’s.
(See chart 5.) During the December 1978-June 1990 pe-riod, pay in service-producing industries rose 5.7 percent ayear, on average, compared with 5.1 percent in goods-pro-ducing industries. During the June 1990-December 1999period, average annual pay increases were more similar (3.8and 3.5 percent per year, respectively).
Text table 1. Average annual percent changes in wages andsalaries by occupational group in private industry, selectedperiods, 1975-99
White-collar occupations ........ 7.7 4.4 5.2Professional specialty
and technical ...................... 7.9 4.6 5.4Executive, administrative,
and managerial ................... 7.0 4.5 5.2Sales ...................................... - 4.0 -Administrative support
including clerical ................. 7.9 4.4 5.3
Blue-collar occupations ...... 8.5 3.6 4.8Precision production,
craft, and repair .................. 8.3 3.7 4.8Machine operators, assem-
blers, and inspectors .......... 8.8 3.7 5.0Transportation and
material moving .................. 8.5 3.1 4.4Handlers, equipment cleaners,
helpers, and laborers .......... 8.7 3.6 4.8
Service occupations ........... 8.2 3.9 5.0
NOTE: Dash indicates that data were not available.
13 See Albert E. Schwenk, “Differences Among Private Industry Occupa-tional Groups in Pay Levels and Trends,” Compensation and Working Con-ditions, Winter 1997, pp. 12-18. This article is reprinted in appendix C ofthis bulletin.
14 December 1978 was selected as the starting point for review of paychanges by industry because that is the first quarter for which data were avail-able for all of the major industry divisions.
Occupationalgroup
Sept. 1975-June 1981
June 1981-Dec. 1999
Sept. 1975-Dec. 1999
19770
2
4
6
8
10
12
0
2
4
6
8
10
12
Chart 5. Changes in wages and salaries in goods- and service-producing industries, privateindustry, 1977-99
12-monthpercent change
Service-producing industries
Goods-producing industries
12-monthpercent change
1979 1981 1983 1985 1987 1989 1991 1993 1995 1997 1999

7
Average annual wage and salary increases for the broadindustry groups mask wide differences among industrieswithin these groups. (See text table 2.) Over the December1978-June 1990 period, for example, average annual paygains for service-producing industries ranged from 4.9 per-cent in retail trade to 6.5 percent in service industries. There
were patterns in the data, however. Comparing goods- andservice-producing industries, the range of variation wasgenerally narrower during the June 1990-December 1999period than during the earlier period. For example, be-tween December 1978 and June 1990, annual pay gainsaveraged 6.5 percent for services industry workers and 4.4percent for construction workers, while during the 1990-99period annual pay increases averaged 3.9 percent and 3.1percent, respectively.
Pay changes by bargaining unit statusThe relationship between union and nonunion pay gainsin private industry has varied substantially over time.1 5
(See chart 6.) During 1975-82, for example, union pay con-sistently rose more rapidly than nonunion pay. In contrast,between December 1982 and December 1999, nonunionpay typically rose faster, although the difference betweenunion and nonunion pay was smaller during the latter halfof the period. Over the entire period, nonunion pay rose anaverage of 5.1 percent per year and union pay rose 4.8percent.
Text table 2. Average annual percent changes in wages andsalaries by private industry group, December 1978-December1999
Private industry .................. 5.5 3.7 4.7
Goods-producing industries .......................... 5.1 3.5 4.4Construction ....................... 4.4 3.1 3.9Manufacturing ..................... 5.2 3.6 4.6Service-producing industries .......................... 5.7 3.8 4.9
Transportation and public utilities .............................. 5.1 3.5 4.4
Wholesale trade ................. 5.9 4.0 5.1Retail trade ......................... 4.9 3.5 4.3 Finance, insurance, andreal estate .......................... 6.0 4.1 5.2
Service industries ............... 6.5 3.9 5.3
Industrygroup
Dec. 1978-June 1990
June 1990-Dec. 1999
Sept. 1978-Dec. 1999
15 For a discussion of union-nonunion differences in rates of wage andcompensation change, see Albert E. Schwenk, “Trends in the DifferencesBetween Union and Nonunion Workers in Pay Using the Employment CostIndex,” Compensation and Working Conditions, September 1996, pp. 27-33. This article is reprinted in appendix C of this bulletin.
19770
2
4
6
8
10
12
0
2
4
6
8
10
12
Chart 6. Changes in wages and salaries for union and nonunion workers, private industry, 1977-99
12-monthpercent change
Nonunion workers
Union workers
12-monthpercent change
1979 1981 1983 1985 1987 1989 1991 1993 1995 1997 1999
8
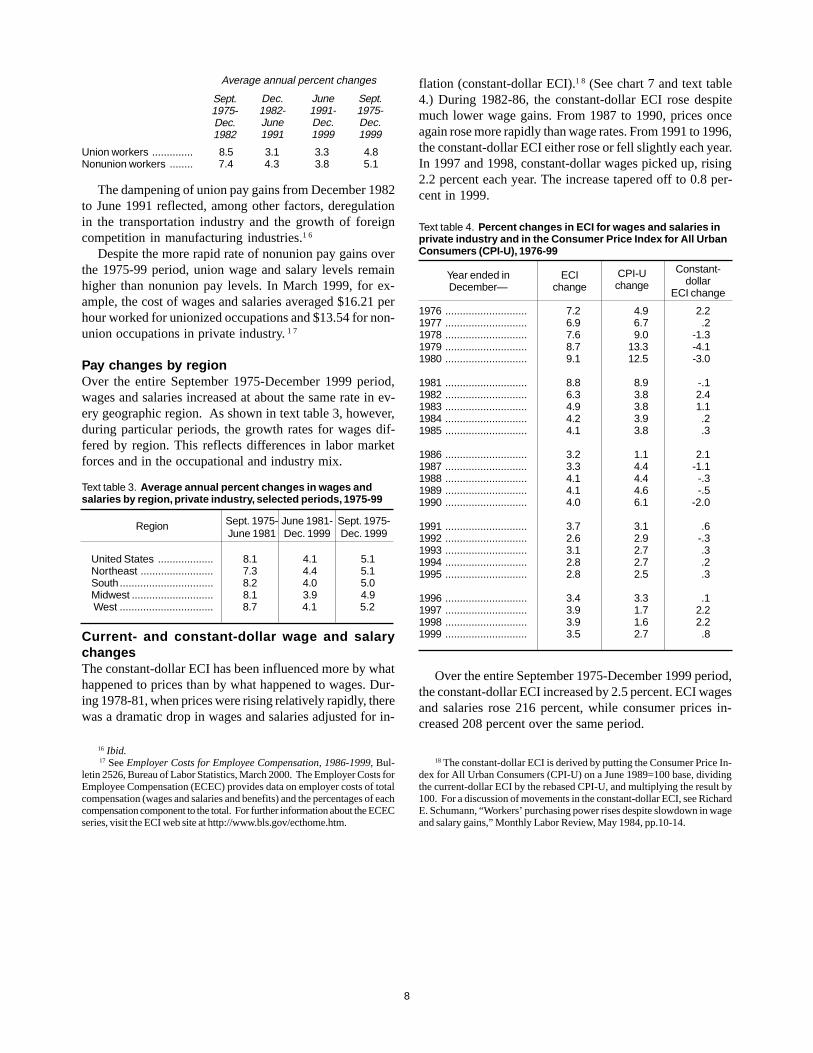
Average annual percent changes
Union workers .............. 8.5 3.1 3.3 4.8Nonunion workers ........ 7.4 4.3 3.8 5.1
The dampening of union pay gains from December 1982to June 1991 reflected, among other factors, deregulationin the transportation industry and the growth of foreigncompetition in manufacturing industries.1 6
Despite the more rapid rate of nonunion pay gains overthe 1975-99 period, union wage and salary levels remainhigher than nonunion pay levels. In March 1999, for ex-ample, the cost of wages and salaries averaged $16.21 perhour worked for unionized occupations and $13.54 for non-union occupations in private industry. 1 7
Pay changes by regionOver the entire September 1975-December 1999 period,wages and salaries increased at about the same rate in ev-ery geographic region. As shown in text table 3, however,during particular periods, the growth rates for wages dif-fered by region. This reflects differences in labor marketforces and in the occupational and industry mix.
Text table 3. Average annual percent changes in wages andsalaries by region, private industry, selected periods, 1975-99
United States ................... 8.1 4.1 5.1Northeast ......................... 7.3 4.4 5.1South ................................ 8.2 4.0 5.0Midwest ............................ 8.1 3.9 4.9 West ................................ 8.7 4.1 5.2
Current- and constant-dollar wage and salarychangesThe constant-dollar ECI has been influenced more by whathappened to prices than by what happened to wages. Dur-ing 1978-81, when prices were rising relatively rapidly, therewas a dramatic drop in wages and salaries adjusted for in-
Sept.1975-Dec.1982
Dec.1982-June1991
June1991-Dec.1999
Sept.1975-Dec.1999
16 Ibid.17 See Employer Costs for Employee Compensation, 1986-1999, Bul-
letin 2526, Bureau of Labor Statistics, March 2000. The Employer Costs forEmployee Compensation (ECEC) provides data on employer costs of totalcompensation (wages and salaries and benefits) and the percentages of eachcompensation component to the total. For further information about the ECECseries, visit the ECI web site at http://www.bls.gov/ecthome.htm.
18 The constant-dollar ECI is derived by putting the Consumer Price In-dex for All Urban Consumers (CPI-U) on a June 1989=100 base, dividingthe current-dollar ECI by the rebased CPI-U, and multiplying the result by100. For a discussion of movements in the constant-dollar ECI, see RichardE. Schumann, “Workers’ purchasing power rises despite slowdown in wageand salary gains,” Monthly Labor Review, May 1984, pp.10-14.
Region Sept. 1975-June 1981
June 1981-Dec. 1999
Sept. 1975-Dec. 1999
flation (constant-dollar ECI).1 8 (See chart 7 and text table4.) During 1982-86, the constant-dollar ECI rose despitemuch lower wage gains. From 1987 to 1990, prices onceagain rose more rapidly than wage rates. From 1991 to 1996,the constant-dollar ECI either rose or fell slightly each year.In 1997 and 1998, constant-dollar wages picked up, rising2.2 percent each year. The increase tapered off to 0.8 per-cent in 1999.
Text table 4. Percent changes in ECI for wages and salaries inprivate industry and in the Consumer Price Index for All UrbanConsumers (CPI-U), 1976-99
1976 ............................ 7.2 4.9 2.21977 ............................ 6.9 6.7 .21978 ............................ 7.6 9.0 -1.31979 ............................ 8.7 13.3 -4.11980 ............................ 9.1 12.5 -3.0
1981 ............................ 8.8 8.9 -.11982 ............................ 6.3 3.8 2.41983 ............................ 4.9 3.8 1.11984 ............................ 4.2 3.9 .21985 ............................ 4.1 3.8 .3
1986 ............................ 3.2 1.1 2.11987 ............................ 3.3 4.4 -1.11988 ............................ 4.1 4.4 -.31989 ............................ 4.1 4.6 -.51990 ............................ 4.0 6.1 -2.0
1991 ............................ 3.7 3.1 .61992 ............................ 2.6 2.9 -.31993 ............................ 3.1 2.7 .31994 ............................ 2.8 2.7 .21995 ............................ 2.8 2.5 .3
1996 ............................ 3.4 3.3 .11997 ............................ 3.9 1.7 2.21998 ............................ 3.9 1.6 2.21999 ............................ 3.5 2.7 .8
Over the entire September 1975-December 1999 period,the constant-dollar ECI increased by 2.5 percent. ECI wagesand salaries rose 216 percent, while consumer prices in-creased 208 percent over the same period.
ECIchange
Constant-dollar
ECI change
Year ended inDecember—
CPI-Uchange

9
1977-6
-3
0
3
6
9
12
-6
-3
0
3
6
9
12
Chart 7. Changes in current- and constant-dollar wages and salaries, private industry, 1977-99
12-monthpercent change
Current-dollarwages and salaries
12-monthpercent change
Constant-dollarwages and salaries
1979 1981 1983 1985 1987 1989 1991 1993 1995 1997 1999

Table 1. Total compensation,1 civilian, State and local government, and private industry workers: Employment Cost Index by occupational and industry group, 1980-99
(Seasonally adjusted)
Series and year
Indexes (June 1989=100) Percent changes for
March June Sept. Dec.3 months ended–
March June Sept. Dec.
Civilian workers2: 1982 ............................................... 71.7 72.8 74.2 75.3 – 1.5 1.9 1.5 1983 ............................................... 76.3 77.4 78.4 79.5 1.3 1.4 1.3 1.4 1984 ............................................... 80.7 81.7 82.4 83.5 1.5 1.2 .9 1.3 1985 ............................................... 84.5 85.4 86.4 87.1 1.2 1.1 1.2 .8 1986 ............................................... 87.9 88.5 89.1 89.9 .9 .7 .7 .9 1987 ............................................... 90.6 91.4 92.2 93.1 .8 .9 .9 1.0 1988 ............................................... 94.4 95.5 96.5 97.7 1.4 1.2 1.0 1.2 1989 ............................................... 98.8 100.0 101.4 102.7 1.1 1.2 1.4 1.3 1990 ............................................... 104.0 105.4 106.6 107.7 1.3 1.3 1.1 1.0 1991 ............................................... 108.9 110.2 111.2 112.2 1.1 1.2 .9 .9 1992 ............................................... 113.3 114.1 115.0 116.1 1.0 .7 .8 1.0 1993 ............................................... 117.2 118.2 119.2 120.1 .9 .9 .8 .8 1994 ............................................... 121.2 122.3 123.3 124.0 .7 .9 .8 .6 1995 ............................................... 124.9 125.8 126.5 127.4 .7 .7 .6 .7 1996 ............................................... 128.2 129.3 130.1 131.0 .6 .9 .6 .7 1997 ............................................... 131.9 132.9 133.9 135.2 .7 .8 .8 1.0 1998 ............................................... 136.2 137.4 138.7 139.7 .7 .9 .9 .7 1999 ............................................... 140.2 141.7 142.9 144.5 .4 1.1 .8 1.1
State and local government: 1982 ............................................... 67.2 68.2 70.0 70.9 – 1.5 2.6 1.3 1983 ............................................... 71.9 73.0 73.9 75.0 1.4 1.5 1.2 1.5 1984 ............................................... 76.4 77.5 78.7 80.0 1.9 1.4 1.5 1.7 1985 ............................................... 81.2 82.2 83.5 84.6 1.5 1.2 1.6 1.3 1986 ............................................... 85.6 86.8 87.8 88.9 1.2 1.4 1.2 1.3 1987 ............................................... 89.8 90.9 91.5 92.8 1.0 1.2 .7 1.4 1988 ............................................... 94.2 95.3 96.5 98.1 1.5 1.2 1.3 1.7 1989 ............................................... 99.3 100.8 102.7 104.2 1.2 1.5 1.9 1.5 1990 ............................................... 105.7 107.3 108.8 110.3 1.4 1.5 1.4 1.4 1991 ............................................... 111.7 112.7 113.3 114.2 1.3 .9 .5 .8 1992 ............................................... 115.2 116.4 117.2 118.5 .9 1.0 .7 1.1 1993 ............................................... 119.3 120.1 120.8 121.7 .7 .7 .6 .7 1994 ............................................... 122.7 123.6 124.6 125.3 .8 .7 .8 .6 1995 ............................................... 126.4 127.4 128.3 129.1 .9 .8 .7 .6 1996 ............................................... 129.9 130.8 131.5 132.5 .6 .7 .5 .8 1997 ............................................... 133.2 133.9 134.6 135.5 .5 .5 .5 .7 1998 ............................................... 136.5 137.5 138.5 139.5 .7 .7 .7 .7 1999 ............................................... 140.4 141.5 142.6 144.2 .6 .8 .8 1.1
Private industry3: 1980 ............................................... 60.8 62.3 63.7 65.2 – 2.5 2.2 2.4 1981 ............................................... 67.3 68.7 70.0 71.4 3.2 2.1 1.9 2.0 1982 ............................................... 72.5 73.5 75.0 76.1 1.5 1.4 2.0 1.5 1983 ............................................... 77.1 78.2 79.2 80.3 1.3 1.4 1.3 1.4 1984 ............................................... 81.4 82.4 83.0 84.1 1.4 1.2 .7 1.3 1985 ............................................... 85.0 85.9 86.9 87.5 1.1 1.1 1.2 .7 1986 ............................................... 88.3 89.0 89.6 90.2 .9 .8 .7 .7 1987 ............................................... 90.9 91.6 92.5 93.3 .8 .8 1.0 .9 1988 ............................................... 94.5 95.7 96.6 97.8 1.3 1.3 .9 1.2 1989 ............................................... 98.9 100.0 101.2 102.4 1.1 1.1 1.2 1.2 1990 ............................................... 103.8 105.1 106.2 107.2 1.4 1.3 1.0 .9 1991 ............................................... 108.4 109.7 110.9 111.9 1.1 1.2 1.1 .9 1992 ............................................... 113.0 113.7 114.7 115.7 1.0 .6 .9 .9 1993 ............................................... 116.9 117.9 118.9 119.9 1.0 .9 .8 .8 1994 ............................................... 120.9 121.9 123.0 123.7 .8 .8 .9 .6 1995 ............................................... 124.5 125.4 126.1 127.0 .6 .7 .6 .7 1996 ............................................... 127.9 128.9 129.7 130.7 .7 .8 .6 .8 1997 ............................................... 131.6 132.7 133.7 135.2 .7 .8 .8 1.1 1998 ............................................... 136.1 137.3 138.7 139.7 .7 .9 1.0 .7 1999 ............................................... 140.2 141.8 143.0 144.5 .4 1.2 .8 1.0
See footnotes at end of table.
10

Table 1. Total compensation,1 civilian, State and local government, and private industry workers: Employment Cost Index by occupational and industry group, 1980-99
(Seasonally adjusted) — Continued
Series and year
Indexes (June 1989=100) Percent changes for
March June Sept. Dec.3 months ended–
March June Sept. Dec.
White-collar occupations: 1982 ............................................... 70.4 71.3 72.8 73.9 – – – – 1983 ............................................... 75.0 76.0 77.4 78.6 1.5 1.3 1.8 1.6 1984 ............................................... 79.7 80.8 81.3 82.6 1.4 1.4 .6 1.6 1985 ............................................... 83.6 84.6 85.6 86.6 1.2 1.2 1.2 1.2 1986 ............................................... 87.3 88.2 88.7 89.6 .8 1.0 .6 1.0 1987 ............................................... 90.5 91.1 92.1 92.9 1.0 .7 1.1 .9 1988 ............................................... 93.8 95.0 96.1 97.5 1.0 1.3 1.2 1.5 1989 ............................................... 98.8 99.9 101.3 102.6 1.3 1.1 1.4 1.3 1990 ............................................... 104.0 105.4 106.6 107.6 1.4 1.3 1.1 .9 1991 ............................................... 108.9 110.2 111.4 112.4 1.2 1.2 1.1 .9 1992 ............................................... 113.3 114.1 115.0 116.1 .8 .7 .8 1.0 1993 ............................................... 117.3 118.2 119.3 120.4 1.0 .8 .9 .9 1994 ............................................... 121.4 122.4 123.4 124.3 .8 .8 .8 .7 1995 ............................................... 125.2 126.2 126.9 127.8 .7 .8 .6 .7 1996 ............................................... 128.9 130.0 131.0 132.0 .9 .9 .8 .8 1997 ............................................... 133.0 134.1 135.1 137.0 .8 .8 .7 1.4 1998 ............................................... 138.0 139.4 141.0 142.3 .7 1.0 1.1 .9 1999 ............................................... 142.3 144.1 145.5 147.2 .0 1.3 1.0 1.2
Blue-collar occupations: 1980 ............................................... 62.8 64.4 66.0 67.6 – 2.5 2.5 2.4 1981 ............................................... 69.5 71.1 72.6 74.1 2.8 2.3 2.1 2.1 1982 ............................................... 75.0 76.1 77.4 78.5 1.2 1.5 1.7 1.4 1983 ............................................... 79.6 80.7 81.4 82.4 1.4 1.4 .9 1.2 1984 ............................................... 83.5 84.2 84.9 85.9 1.3 .8 .8 1.2 1985 ............................................... 86.6 87.3 88.2 88.6 .8 .8 1.0 .5 1986 ............................................... 89.3 89.8 90.5 91.1 .8 .6 .8 .7 1987 ............................................... 91.2 92.1 92.9 93.9 .1 1.0 .9 1.1 1988 ............................................... 95.3 96.3 97.1 98.1 1.5 1.0 .8 1.0 1989 ............................................... 98.7 99.9 101.1 102.1 .6 1.2 1.2 1.0 1990 ............................................... 103.4 104.6 105.6 106.6 1.3 1.2 1.0 .9 1991 ............................................... 107.8 108.9 110.2 111.2 1.1 1.0 1.2 .9 1992 ............................................... 112.4 113.3 114.3 115.2 1.1 .8 .9 .8 1993 ............................................... 116.5 117.6 118.6 119.5 1.1 .9 .9 .8 1994 ............................................... 120.3 121.1 122.2 122.8 .7 .7 .9 .5 1995 ............................................... 123.5 124.3 125.0 125.8 .6 .6 .6 .6 1996 ............................................... 126.6 127.5 128.0 129.2 .6 .7 .4 .9 1997 ............................................... 129.6 130.7 131.6 132.5 .3 .8 .7 .7 1998 ............................................... 133.2 134.2 135.1 136.1 .5 .8 .7 .7 1999 ............................................... 137.0 138.1 139.3 140.7 .7 .8 .9 1.0
Service occupations: 1980 ............................................... 61.1 62.3 63.8 64.9 – 2.0 2.4 1.7 1981 ............................................... 67.5 68.5 70.0 70.8 4.0 1.5 2.2 1.1 1982 ............................................... 72.5 74.0 75.4 76.7 2.4 2.1 1.9 1.7 1983 ............................................... 77.3 78.5 79.0 80.8 .8 1.6 .6 2.3 1984 ............................................... 82.5 83.1 84.4 85.9 2.1 .7 1.6 1.8 1985 ............................................... 85.9 86.7 88.1 88.5 .0 .9 1.6 .5 1986 ............................................... 89.0 89.8 90.5 91.2 .6 .9 .8 .8 1987 ............................................... 91.9 92.6 92.9 93.4 .8 .8 .3 .5 1988 ............................................... 94.5 95.7 97.1 98.2 1.4 1.3 1.5 1.1 1989 ............................................... 99.1 100.1 101.1 102.5 .9 1.0 1.0 1.4 1990 ............................................... 103.8 105.0 105.7 107.4 1.3 1.2 .7 1.6 1991 ............................................... 108.2 110.0 111.5 112.5 .8 1.7 1.4 .9 1992 ............................................... 113.5 114.3 115.4 115.9 .9 .7 1.0 .4 1993 ............................................... 117.2 118.1 118.9 119.5 1.0 .8 .7 .5 1994 ............................................... 120.5 121.0 121.7 122.8 .9 .4 .6 .9 1995 ............................................... 123.3 124.0 124.5 125.0 .4 .6 .4 .4 1996 ............................................... 125.6 126.4 127.1 128.5 .5 .6 .6 1.1
See footnotes at end of table.
11
Table 1. Total compensation,1 civilian, State and local government, and private industry workers: Employment Cost Index by occupational and industry group, 1980-99
(Seasonally adjusted) — Continued
Series and year
Indexes (June 1989=100) Percent changes for
March June Sept. Dec.3 months ended–
March June Sept. Dec.
Service occupations: 1997 ............................................... 129.5 130.7 132.7 133.7 0.8 0.9 1.5 0.8 1998 ............................................... 134.9 135.8 136.9 137.6 .9 .7 .8 .5 1999 ............................................... 139.1 140.4 140.5 142.1 1.1 .9 .1 1.1
Goods-producing industries4: 1980 ............................................... 62.5 63.9 65.5 67.0 – 2.2 2.5 2.3 1981 ............................................... 69.0 70.6 72.1 73.5 3.0 2.3 2.1 1.9 1982 ............................................... 74.7 75.7 77.2 78.1 1.6 1.3 2.0 1.2 1983 ............................................... 79.2 80.1 81.0 81.8 1.4 1.1 1.1 1.0 1984 ............................................... 82.9 83.6 84.5 85.6 1.3 .8 1.1 1.3 1985 ............................................... 86.6 87.2 87.9 88.4 1.2 .7 .8 .6 1986 ............................................... 89.2 90.1 90.6 91.2 .9 1.0 .6 .7 1987 ............................................... 91.5 92.1 93.0 94.0 .3 .7 1.0 1.1 1988 ............................................... 95.5 96.5 97.2 98.1 1.6 1.0 .7 .9 1989 ............................................... 98.9 100.0 101.2 102.3 .9 1.1 1.2 1.1 1990 ............................................... 103.8 105.1 106.2 107.2 1.5 1.3 1.0 .9 1991 ............................................... 108.4 109.7 110.8 112.0 1.1 1.2 1.0 1.1 1992 ............................................... 113.3 114.1 115.2 116.2 1.2 .7 1.0 .9 1993 ............................................... 117.8 118.8 119.7 120.6 1.4 .8 .8 .8 1994 ............................................... 121.8 123.0 123.9 124.6 .8 1.0 .7 .6 1995 ............................................... 125.5 126.2 126.8 127.8 .7 .6 .5 .8 1996 ............................................... 128.5 129.6 130.4 131.2 .5 .9 .6 .6 1997 ............................................... 131.7 132.9 133.8 134.3 .4 .9 .7 .4 1998 ............................................... 135.2 136.3 137.2 137.9 .7 .8 .7 .5 1999 ............................................... 138.9 139.8 141.0 142.5 .7 .6 .9 1.1
Construction5: 1985 ............................................... 86.2 86.9 87.5 88.4 1.2 .8 .7 1.0 1986 ............................................... 88.6 89.7 90.5 90.9 .2 1.2 .9 .4 1987 ............................................... 91.6 92.5 93.3 94.2 .8 1.0 .9 1.0 1988 ............................................... 95.3 96.2 97.1 98.2 1.2 .9 .9 1.1 1989 ............................................... 99.1 99.8 101.1 102.6 .9 .7 1.3 1.5 1990 ............................................... 103.2 104.1 105.0 105.8 .6 .9 .9 .8 1991 ............................................... 107.5 108.4 109.1 110.1 1.6 .8 .6 .9 1992 ............................................... 110.7 111.6 112.9 114.0 .5 .8 1.2 1.0 1993 ............................................... 115.1 115.8 116.5 116.8 1.0 .6 .6 .3 1994 ............................................... 118.8 120.0 121.1 121.1 1.7 1.0 .9 .0 1995 ............................................... 121.3 121.8 122.7 123.7 .2 .4 .7 .8 1996 ............................................... 124.6 125.1 125.5 126.7 .7 .4 .3 1.0 1997 ............................................... 127.5 128.5 129.3 130.0 .6 .8 .6 .5 1998 ............................................... 130.9 132.5 133.0 134.6 .7 1.2 .4 1.2 1999 ............................................... 135.9 136.6 137.5 139.0 1.0 .5 .7 1.1
Manufacturing: 1980 ............................................... 61.6 63.1 64.5 66.1 – 2.4 2.2 2.5 1981 ............................................... 68.2 69.7 71.1 72.7 3.2 2.2 2.0 2.3 1982 ............................................... 73.7 74.8 76.2 77.2 1.4 1.5 1.9 1.3 1983 ............................................... 78.2 79.2 80.1 81.0 1.3 1.3 1.1 1.1 1984 ............................................... 82.0 83.0 83.9 85.1 1.2 1.2 1.1 1.4 1985 ............................................... 86.1 86.8 87.5 88.0 1.2 .8 .8 .6 1986 ............................................... 88.7 89.7 90.2 90.9 .8 1.1 .6 .8 1987 ............................................... 90.9 91.7 92.6 93.7 .0 .9 1.0 1.2 1988 ............................................... 95.1 96.1 96.9 97.8 1.5 1.1 .8 .9 1989 ............................................... 98.7 99.9 101.2 102.4 .8 1.2 1.3 1.2 1990 ............................................... 103.8 105.1 106.4 107.5 1.5 1.3 1.2 1.0 1991 ............................................... 108.4 109.9 111.2 112.4 .8 1.4 1.2 1.1 1992 ............................................... 113.8 114.7 115.7 116.8 1.2 .8 .9 1.0 1993 ............................................... 118.5 119.6 120.6 121.6 1.5 .9 .8 .8 1994 ............................................... 122.4 123.4 124.5 125.3 .7 .8 .9 .6
See footnotes at end of table.
12
Table 1. Total compensation,1 civilian, State and local government, and private industry workers: Employment Cost Index by occupational and industry group, 1980-99
(Seasonally adjusted) — Continued
Series and year
Indexes (June 1989=100) Percent changes for
March June Sept. Dec.3 months ended–
March June Sept. Dec.
Manufacturing: 1995 ............................................... 126.1 126.8 127.3 128.4 0.6 0.6 0.4 0.9 1996 ............................................... 129.1 130.3 131.2 132.1 .5 .9 .7 .7 1997 ............................................... 132.5 133.6 134.5 135.3 .3 .8 .7 .6 1998 ............................................... 136.3 137.1 138.1 138.9 .7 .6 .7 .6 1999 ............................................... 139.8 140.7 142.0 143.6 .6 .6 .9 1.1
Manufacturing, durable goods: 1985 ............................................... – – – 88.8 – – – .7 1986 ............................................... 89.4 90.1 90.7 91.3 .7 .8 .7 .7 1987 ............................................... 91.1 91.9 92.7 93.7 -.2 .9 .9 1.1 1988 ............................................... 95.4 96.4 97.1 97.9 1.8 1.0 .7 .8 1989 ............................................... 98.7 99.9 101.2 102.5 .7 1.2 1.3 1.3 1990 ............................................... 103.8 105.0 106.3 107.5 1.3 1.2 1.2 1.1 1991 ............................................... 108.3 109.8 111.2 112.4 .7 1.4 1.3 1.1 1992 ............................................... 113.9 114.7 115.8 117.0 1.3 .7 1.0 1.0 1993 ............................................... 118.8 119.9 121.0 122.1 1.5 .9 .9 .9 1994 ............................................... 122.8 123.7 125.1 126.0 .6 .7 1.1 .7 1995 ............................................... 126.9 127.6 128.2 129.1 .7 .6 .5 .7 1996 ............................................... 129.7 131.1 131.9 132.7 .5 1.1 .6 .6 1997 ............................................... 133.0 134.1 134.9 135.7 .2 .8 .6 .6 1998 ............................................... 136.6 137.4 138.4 139.2 .7 .6 .7 .6 1999 ............................................... 140.0 141.0 142.2 144.0 .6 .7 .9 1.3
Manufacturing, nondurable goods: 1985 ............................................... – – – 86.7 – – – .5 1986 ............................................... 87.6 88.9 89.4 90.2 1.0 1.5 .6 .9 1987 ............................................... 90.6 91.2 92.3 93.6 .4 .7 1.2 1.4 1988 ............................................... 94.7 95.5 96.5 97.7 1.2 .8 1.0 1.2 1989 ............................................... 98.7 99.9 101.2 102.1 1.0 1.2 1.3 .9 1990 ............................................... 104.0 105.4 106.6 107.6 1.9 1.3 1.1 .9 1991 ............................................... 108.7 110.0 111.3 112.5 1.0 1.2 1.2 1.1 1992 ............................................... 113.7 114.5 115.5 116.5 1.1 .7 .9 .9 1993 ............................................... 117.8 118.8 119.8 120.5 1.1 .8 .8 .6 1994 ............................................... 121.6 122.6 123.3 124.0 .9 .8 .6 .6 1995 ............................................... 124.6 125.2 125.8 127.2 .5 .5 .5 1.1 1996 ............................................... 128.2 128.8 130.1 131.2 .8 .5 1.0 .8 1997 ............................................... 131.6 132.9 133.8 134.7 .3 1.0 .7 .7 1998 ............................................... 135.8 136.6 137.7 138.4 .8 .6 .8 .5 1999 ............................................... 139.5 140.3 141.6 143.0 .8 .6 .9 1.0
Service-producing industries6: 1980 ............................................... 60.0 62.3 62.4 61.8 – – – – 1981 ............................................... 66.4 68.5 68.3 68.0 2.8 2.3 2.1 2.1 1982 ............................................... 71.0 72.8 73.2 73.3 4.4 2.5 .5 .1 1983 ............................................... 75.5 77.2 77.7 78.4 3.0 2.3 .6 .9 1984 ............................................... 80.3 81.6 81.7 82.8 2.4 1.6 .1 1.3 1985 ............................................... 83.7 84.8 86.0 86.7 1.1 1.3 1.4 .8 1986 ............................................... 87.5 88.2 88.7 89.5 .9 .8 .6 .9 1987 ............................................... 90.5 91.2 92.0 92.8 1.0 .8 .9 .9 1988 ............................................... 93.8 95.0 96.1 97.6 1.1 1.3 1.2 1.6 1989 ............................................... 98.9 100.0 101.2 102.5 1.3 1.1 1.2 1.3 1990 ............................................... 103.8 105.1 106.2 107.2 1.3 1.3 1.0 .9 1991 ............................................... 108.4 109.7 110.9 111.8 1.1 1.2 1.1 .8 1992 ............................................... 112.7 113.5 114.3 115.3 .8 .7 .7 .9 1993 ............................................... 116.3 117.2 118.3 119.4 .9 .8 .9 .9 1994 ............................................... 120.3 121.2 122.2 123.0 .7 .7 .8 .7 1995 ............................................... 124.0 125.0 125.8 126.5 .8 .8 .6 .6 1996 ............................................... 127.6 128.6 129.4 130.4 .9 .8 .6 .8 1997 ............................................... 131.5 132.6 133.7 135.6 .8 .8 .8 1.4
See footnotes at end of table.
13
Table 1. Total compensation,1 civilian, State and local government, and private industry workers: Employment Cost Index by occupational and industry group, 1980-99
(Seasonally adjusted) — Continued
Series and year
Indexes (June 1989=100) Percent changes for
March June Sept. Dec.3 months ended–
March June Sept. Dec.
Service-producing industries6: 1998 ............................................... 136.6 137.8 139.5 140.6 0.7 0.9 1.2 0.8 1999 ............................................... 140.7 142.7 143.9 145.5 .1 1.4 .8 1.1
Transportation and public utilities7: 1985 ............................................... 87.5 88.3 89.6 90.2 .6 .9 1.5 .7 1986 ............................................... 91.1 91.3 91.8 92.2 1.0 .2 .5 .4 1987 ............................................... 92.9 93.8 94.3 95.0 .8 1.0 .5 .7 1988 ............................................... 95.8 96.6 97.4 97.8 .7 .8 .8 .4 1989 ............................................... 98.7 99.8 100.6 101.5 .9 1.1 .8 .9 1990 ............................................... 103.0 103.1 104.1 105.4 1.5 .1 1.0 1.2 1991 ............................................... 105.9 107.6 108.9 110.0 .5 1.6 1.2 1.0 1992 ............................................... 111.0 111.8 112.8 113.8 .9 .7 .9 .9 1993 ............................................... 114.6 116.0 116.7 117.8 .7 1.2 .6 .9 1994 ............................................... 119.0 119.8 121.3 122.4 1.0 .7 1.3 .9 1995 ............................................... 123.8 124.8 125.9 126.8 1.1 .8 .9 .7 1996 ............................................... 127.6 128.5 129.3 130.6 .6 .7 .6 1.0 1997 ............................................... 131.0 131.8 132.9 134.4 .3 .6 .8 1.1 1998 ............................................... 135.6 137.2 138.5 139.5 .9 1.2 .9 .7 1999 ............................................... 139.5 141.0 141.8 142.5 .0 1.1 .6 .5
Wholesale trade5: 1986 ............................................... 86.5 87.0 87.8 88.8 .7 .6 .9 1.1 1987 ............................................... 89.8 90.8 91.6 92.3 1.0 1.1 .9 .8 1988 ............................................... 93.2 94.4 95.5 96.3 .9 1.3 1.2 .8 1989 ............................................... 98.7 99.8 102.5 104.7 2.6 1.1 2.7 2.1 1990 ............................................... 105.0 105.2 105.8 106.6 .4 .2 .6 .8 1991 ............................................... 107.9 109.3 110.7 111.3 1.2 1.3 1.3 .5 1992 ............................................... 112.6 113.2 113.2 114.5 1.2 .5 .0 1.1 1993 ............................................... 115.4 116.1 116.6 118.0 .7 .6 .4 1.2 1994 ............................................... 118.0 119.4 120.6 121.7 .0 1.2 1.0 .9 1995 ............................................... 123.2 124.5 126.1 127.3 1.2 1.1 1.3 1.0 1996 ............................................... 127.5 129.1 129.9 131.2 .2 1.3 .6 1.0 1997 ............................................... 132.8 133.6 134.6 135.4 1.2 .6 .7 .6 1998 ............................................... 137.6 138.4 140.8 143.1 1.6 .6 1.7 1.6 1999 ............................................... 142.6 144.4 146.3 148.8 -.3 1.3 1.3 1.7
Retail trade: 1985 ............................................... 85.6 86.5 88.0 89.0 .8 1.1 1.7 1.1 1986 ............................................... 89.3 89.7 90.4 91.0 .3 .4 .8 .7 1987 ............................................... 91.5 92.3 92.8 93.2 .5 .9 .5 .4 1988 ............................................... 94.7 96.1 97.1 98.6 1.6 1.5 1.0 1.5 1989 ............................................... 99.3 99.8 100.9 101.8 .7 .5 1.1 .9 1990 ............................................... 103.2 104.6 105.3 106.3 1.4 1.4 .7 .9 1991 ............................................... 107.5 108.7 109.9 110.7 1.2 1.1 1.1 .7 1992 ............................................... 111.0 111.9 112.7 113.6 .3 .8 .7 .8 1993 ............................................... 114.8 115.4 116.0 116.9 1.1 .5 .5 .8 1994 ............................................... 117.7 119.0 120.1 120.4 .5 1.1 .9 .2 1995 ............................................... 121.0 121.7 122.3 123.0 .5 .6 .5 .6 1996 ............................................... 124.6 124.7 125.9 127.7 1.3 .1 1.0 1.4 1997 ............................................... 128.6 129.6 130.8 132.0 .7 .8 .9 .9 1998 ............................................... 133.2 134.3 135.6 135.9 .9 .8 1.0 .2 1999 ............................................... 136.9 139.0 139.6 141.0 .7 1.5 .4 1.0
Finance, insurance, and real estate5,8: 1985 ............................................... 83.1 83.0 84.6 85.9 – -.1 1.9 1.5 1986 ............................................... 86.7 87.4 87.9 88.6 .9 .8 .6 .8 1987 ............................................... 90.9 90.0 90.2 90.4 2.6 -1.0 .2 .2 1988 ............................................... 91.5 92.8 92.9 96.2 1.2 1.4 .1 3.6 1989 ............................................... 98.3 100.0 100.4 101.4 2.2 1.7 .4 1.0
See footnotes at end of table.
14
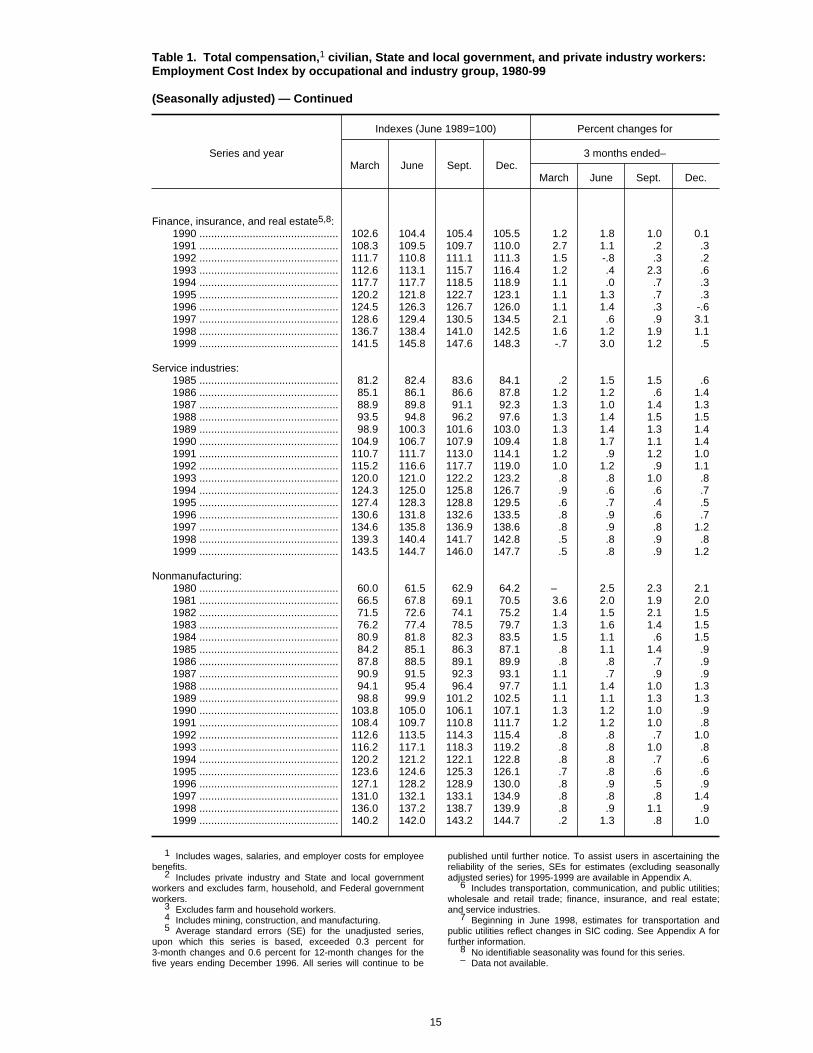
Table 1. Total compensation,1 civilian, State and local government, and private industry workers: Employment Cost Index by occupational and industry group, 1980-99
(Seasonally adjusted) — Continued
Series and year
Indexes (June 1989=100) Percent changes for
March June Sept. Dec.3 months ended–
March June Sept. Dec.
Finance, insurance, and real estate5,8: 1990 ............................................... 102.6 104.4 105.4 105.5 1.2 1.8 1.0 0.1 1991 ............................................... 108.3 109.5 109.7 110.0 2.7 1.1 .2 .3 1992 ............................................... 111.7 110.8 111.1 111.3 1.5 -.8 .3 .2 1993 ............................................... 112.6 113.1 115.7 116.4 1.2 .4 2.3 .6 1994 ............................................... 117.7 117.7 118.5 118.9 1.1 .0 .7 .3 1995 ............................................... 120.2 121.8 122.7 123.1 1.1 1.3 .7 .3 1996 ............................................... 124.5 126.3 126.7 126.0 1.1 1.4 .3 -.6 1997 ............................................... 128.6 129.4 130.5 134.5 2.1 .6 .9 3.1 1998 ............................................... 136.7 138.4 141.0 142.5 1.6 1.2 1.9 1.1 1999 ............................................... 141.5 145.8 147.6 148.3 -.7 3.0 1.2 .5
Service industries: 1985 ............................................... 81.2 82.4 83.6 84.1 .2 1.5 1.5 .6 1986 ............................................... 85.1 86.1 86.6 87.8 1.2 1.2 .6 1.4 1987 ............................................... 88.9 89.8 91.1 92.3 1.3 1.0 1.4 1.3 1988 ............................................... 93.5 94.8 96.2 97.6 1.3 1.4 1.5 1.5 1989 ............................................... 98.9 100.3 101.6 103.0 1.3 1.4 1.3 1.4 1990 ............................................... 104.9 106.7 107.9 109.4 1.8 1.7 1.1 1.4 1991 ............................................... 110.7 111.7 113.0 114.1 1.2 .9 1.2 1.0 1992 ............................................... 115.2 116.6 117.7 119.0 1.0 1.2 .9 1.1 1993 ............................................... 120.0 121.0 122.2 123.2 .8 .8 1.0 .8 1994 ............................................... 124.3 125.0 125.8 126.7 .9 .6 .6 .7 1995 ............................................... 127.4 128.3 128.8 129.5 .6 .7 .4 .5 1996 ............................................... 130.6 131.8 132.6 133.5 .8 .9 .6 .7 1997 ............................................... 134.6 135.8 136.9 138.6 .8 .9 .8 1.2 1998 ............................................... 139.3 140.4 141.7 142.8 .5 .8 .9 .8 1999 ............................................... 143.5 144.7 146.0 147.7 .5 .8 .9 1.2
Nonmanufacturing: 1980 ............................................... 60.0 61.5 62.9 64.2 – 2.5 2.3 2.1 1981 ............................................... 66.5 67.8 69.1 70.5 3.6 2.0 1.9 2.0 1982 ............................................... 71.5 72.6 74.1 75.2 1.4 1.5 2.1 1.5 1983 ............................................... 76.2 77.4 78.5 79.7 1.3 1.6 1.4 1.5 1984 ............................................... 80.9 81.8 82.3 83.5 1.5 1.1 .6 1.5 1985 ............................................... 84.2 85.1 86.3 87.1 .8 1.1 1.4 .9 1986 ............................................... 87.8 88.5 89.1 89.9 .8 .8 .7 .9 1987 ............................................... 90.9 91.5 92.3 93.1 1.1 .7 .9 .9 1988 ............................................... 94.1 95.4 96.4 97.7 1.1 1.4 1.0 1.3 1989 ............................................... 98.8 99.9 101.2 102.5 1.1 1.1 1.3 1.3 1990 ............................................... 103.8 105.0 106.1 107.1 1.3 1.2 1.0 .9 1991 ............................................... 108.4 109.7 110.8 111.7 1.2 1.2 1.0 .8 1992 ............................................... 112.6 113.5 114.3 115.4 .8 .8 .7 1.0 1993 ............................................... 116.2 117.1 118.3 119.2 .8 .8 1.0 .8 1994 ............................................... 120.2 121.2 122.1 122.8 .8 .8 .7 .6 1995 ............................................... 123.6 124.6 125.3 126.1 .7 .8 .6 .6 1996 ............................................... 127.1 128.2 128.9 130.0 .8 .9 .5 .9 1997 ............................................... 131.0 132.1 133.1 134.9 .8 .8 .8 1.4 1998 ............................................... 136.0 137.2 138.7 139.9 .8 .9 1.1 .9 1999 ............................................... 140.2 142.0 143.2 144.7 .2 1.3 .8 1.0
1 Includes wages, salaries, and employer costs for employeebenefits.
2 Includes private industry and State and local governmentworkers and excludes farm, household, and Federal governmentworkers.
3 Excludes farm and household workers.4 Includes mining, construction, and manufacturing.5 Average standard errors (SE) for the unadjusted series,
upon which this series is based, exceeded 0.3 percent for3-month changes and 0.6 percent for 12-month changes for thefive years ending December 1996. All series will continue to be
published until further notice. To assist users in ascertaining thereliability of the series, SEs for estimates (excluding seasonallyadjusted series) for 1995-1999 are available in Appendix A.
6 Includes transportation, communication, and public utilities;wholesale and retail trade; finance, insurance, and real estate;and service industries.
7 Beginning in June 1998, estimates for transportation andpublic utilities reflect changes in SIC coding. See Appendix A forfurther information.
8 No identifiable seasonality was found for this series.– Data not available.
15
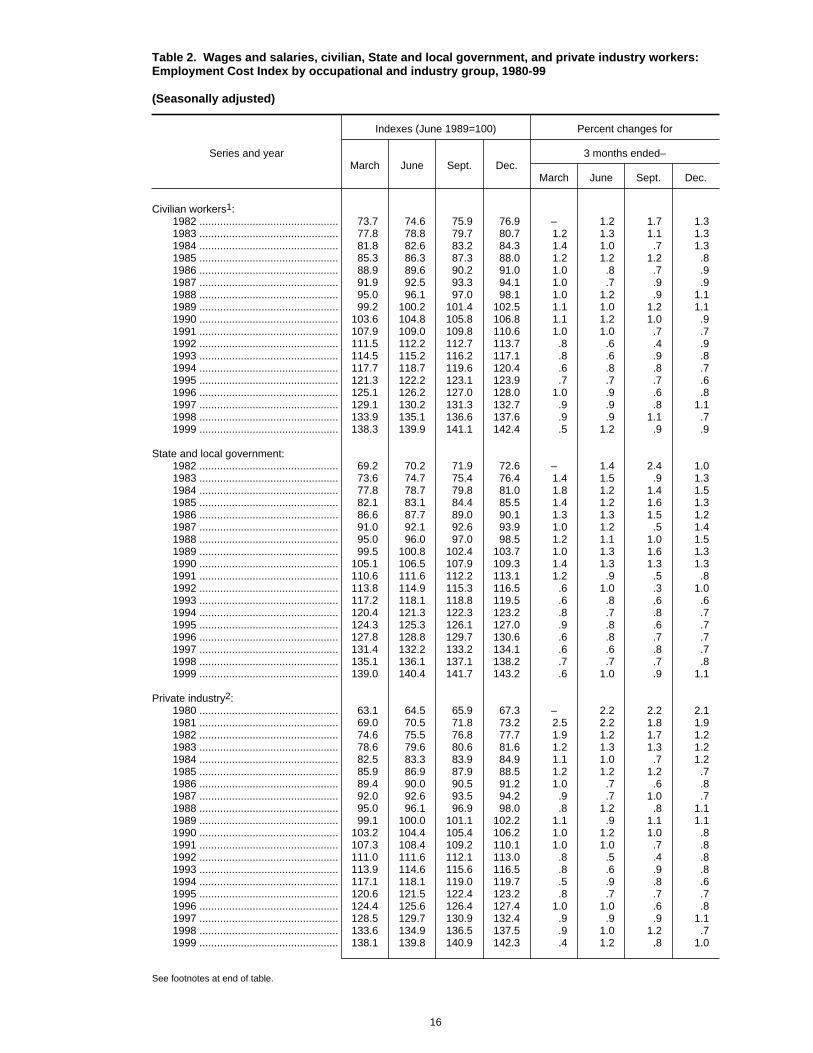
Table 2. Wages and salaries, civilian, State and local government, and private industry workers: Employment Cost Index by occupational and industry group, 1980-99
(Seasonally adjusted)
Series and year
Indexes (June 1989=100) Percent changes for
March June Sept. Dec.3 months ended–
March June Sept. Dec.
Civilian workers1: 1982 ............................................... 73.7 74.6 75.9 76.9 – 1.2 1.7 1.3 1983 ............................................... 77.8 78.8 79.7 80.7 1.2 1.3 1.1 1.3 1984 ............................................... 81.8 82.6 83.2 84.3 1.4 1.0 .7 1.3 1985 ............................................... 85.3 86.3 87.3 88.0 1.2 1.2 1.2 .8 1986 ............................................... 88.9 89.6 90.2 91.0 1.0 .8 .7 .9 1987 ............................................... 91.9 92.5 93.3 94.1 1.0 .7 .9 .9 1988 ............................................... 95.0 96.1 97.0 98.1 1.0 1.2 .9 1.1 1989 ............................................... 99.2 100.2 101.4 102.5 1.1 1.0 1.2 1.1 1990 ............................................... 103.6 104.8 105.8 106.8 1.1 1.2 1.0 .9 1991 ............................................... 107.9 109.0 109.8 110.6 1.0 1.0 .7 .7 1992 ............................................... 111.5 112.2 112.7 113.7 .8 .6 .4 .9 1993 ............................................... 114.5 115.2 116.2 117.1 .8 .6 .9 .8 1994 ............................................... 117.7 118.7 119.6 120.4 .6 .8 .8 .7 1995 ............................................... 121.3 122.2 123.1 123.9 .7 .7 .7 .6 1996 ............................................... 125.1 126.2 127.0 128.0 1.0 .9 .6 .8 1997 ............................................... 129.1 130.2 131.3 132.7 .9 .9 .8 1.1 1998 ............................................... 133.9 135.1 136.6 137.6 .9 .9 1.1 .7 1999 ............................................... 138.3 139.9 141.1 142.4 .5 1.2 .9 .9
State and local government: 1982 ............................................... 69.2 70.2 71.9 72.6 – 1.4 2.4 1.0 1983 ............................................... 73.6 74.7 75.4 76.4 1.4 1.5 .9 1.3 1984 ............................................... 77.8 78.7 79.8 81.0 1.8 1.2 1.4 1.5 1985 ............................................... 82.1 83.1 84.4 85.5 1.4 1.2 1.6 1.3 1986 ............................................... 86.6 87.7 89.0 90.1 1.3 1.3 1.5 1.2 1987 ............................................... 91.0 92.1 92.6 93.9 1.0 1.2 .5 1.4 1988 ............................................... 95.0 96.0 97.0 98.5 1.2 1.1 1.0 1.5 1989 ............................................... 99.5 100.8 102.4 103.7 1.0 1.3 1.6 1.3 1990 ............................................... 105.1 106.5 107.9 109.3 1.4 1.3 1.3 1.3 1991 ............................................... 110.6 111.6 112.2 113.1 1.2 .9 .5 .8 1992 ............................................... 113.8 114.9 115.3 116.5 .6 1.0 .3 1.0 1993 ............................................... 117.2 118.1 118.8 119.5 .6 .8 .6 .6 1994 ............................................... 120.4 121.3 122.3 123.2 .8 .7 .8 .7 1995 ............................................... 124.3 125.3 126.1 127.0 .9 .8 .6 .7 1996 ............................................... 127.8 128.8 129.7 130.6 .6 .8 .7 .7 1997 ............................................... 131.4 132.2 133.2 134.1 .6 .6 .8 .7 1998 ............................................... 135.1 136.1 137.1 138.2 .7 .7 .7 .8 1999 ............................................... 139.0 140.4 141.7 143.2 .6 1.0 .9 1.1
Private industry2: 1980 ............................................... 63.1 64.5 65.9 67.3 – 2.2 2.2 2.1 1981 ............................................... 69.0 70.5 71.8 73.2 2.5 2.2 1.8 1.9 1982 ............................................... 74.6 75.5 76.8 77.7 1.9 1.2 1.7 1.2 1983 ............................................... 78.6 79.6 80.6 81.6 1.2 1.3 1.3 1.2 1984 ............................................... 82.5 83.3 83.9 84.9 1.1 1.0 .7 1.2 1985 ............................................... 85.9 86.9 87.9 88.5 1.2 1.2 1.2 .7 1986 ............................................... 89.4 90.0 90.5 91.2 1.0 .7 .6 .8 1987 ............................................... 92.0 92.6 93.5 94.2 .9 .7 1.0 .7 1988 ............................................... 95.0 96.1 96.9 98.0 .8 1.2 .8 1.1 1989 ............................................... 99.1 100.0 101.1 102.2 1.1 .9 1.1 1.1 1990 ............................................... 103.2 104.4 105.4 106.2 1.0 1.2 1.0 .8 1991 ............................................... 107.3 108.4 109.2 110.1 1.0 1.0 .7 .8 1992 ............................................... 111.0 111.6 112.1 113.0 .8 .5 .4 .8 1993 ............................................... 113.9 114.6 115.6 116.5 .8 .6 .9 .8 1994 ............................................... 117.1 118.1 119.0 119.7 .5 .9 .8 .6 1995 ............................................... 120.6 121.5 122.4 123.2 .8 .7 .7 .7 1996 ............................................... 124.4 125.6 126.4 127.4 1.0 1.0 .6 .8 1997 ............................................... 128.5 129.7 130.9 132.4 .9 .9 .9 1.1 1998 ............................................... 133.6 134.9 136.5 137.5 .9 1.0 1.2 .7 1999 ............................................... 138.1 139.8 140.9 142.3 .4 1.2 .8 1.0
See footnotes at end of table.
16
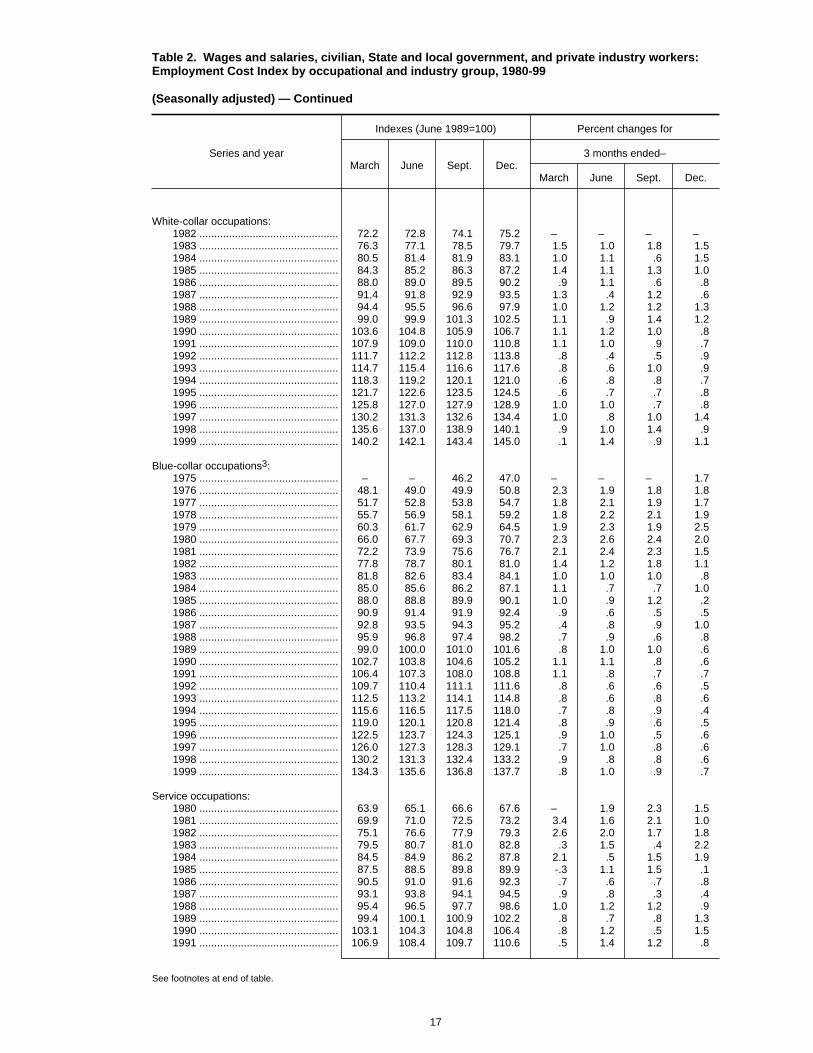
Table 2. Wages and salaries, civilian, State and local government, and private industry workers: Employment Cost Index by occupational and industry group, 1980-99
(Seasonally adjusted) — Continued
Series and year
Indexes (June 1989=100) Percent changes for
March June Sept. Dec.3 months ended–
March June Sept. Dec.
White-collar occupations: 1982 ............................................... 72.2 72.8 74.1 75.2 – – – – 1983 ............................................... 76.3 77.1 78.5 79.7 1.5 1.0 1.8 1.5 1984 ............................................... 80.5 81.4 81.9 83.1 1.0 1.1 .6 1.5 1985 ............................................... 84.3 85.2 86.3 87.2 1.4 1.1 1.3 1.0 1986 ............................................... 88.0 89.0 89.5 90.2 .9 1.1 .6 .8 1987 ............................................... 91.4 91.8 92.9 93.5 1.3 .4 1.2 .6 1988 ............................................... 94.4 95.5 96.6 97.9 1.0 1.2 1.2 1.3 1989 ............................................... 99.0 99.9 101.3 102.5 1.1 .9 1.4 1.2 1990 ............................................... 103.6 104.8 105.9 106.7 1.1 1.2 1.0 .8 1991 ............................................... 107.9 109.0 110.0 110.8 1.1 1.0 .9 .7 1992 ............................................... 111.7 112.2 112.8 113.8 .8 .4 .5 .9 1993 ............................................... 114.7 115.4 116.6 117.6 .8 .6 1.0 .9 1994 ............................................... 118.3 119.2 120.1 121.0 .6 .8 .8 .7 1995 ............................................... 121.7 122.6 123.5 124.5 .6 .7 .7 .8 1996 ............................................... 125.8 127.0 127.9 128.9 1.0 1.0 .7 .8 1997 ............................................... 130.2 131.3 132.6 134.4 1.0 .8 1.0 1.4 1998 ............................................... 135.6 137.0 138.9 140.1 .9 1.0 1.4 .9 1999 ............................................... 140.2 142.1 143.4 145.0 .1 1.4 .9 1.1
Blue-collar occupations3: 1975 ............................................... – – 46.2 47.0 – – – 1.7 1976 ............................................... 48.1 49.0 49.9 50.8 2.3 1.9 1.8 1.8 1977 ............................................... 51.7 52.8 53.8 54.7 1.8 2.1 1.9 1.7 1978 ............................................... 55.7 56.9 58.1 59.2 1.8 2.2 2.1 1.9 1979 ............................................... 60.3 61.7 62.9 64.5 1.9 2.3 1.9 2.5 1980 ............................................... 66.0 67.7 69.3 70.7 2.3 2.6 2.4 2.0 1981 ............................................... 72.2 73.9 75.6 76.7 2.1 2.4 2.3 1.5 1982 ............................................... 77.8 78.7 80.1 81.0 1.4 1.2 1.8 1.1 1983 ............................................... 81.8 82.6 83.4 84.1 1.0 1.0 1.0 .8 1984 ............................................... 85.0 85.6 86.2 87.1 1.1 .7 .7 1.0 1985 ............................................... 88.0 88.8 89.9 90.1 1.0 .9 1.2 .2 1986 ............................................... 90.9 91.4 91.9 92.4 .9 .6 .5 .5 1987 ............................................... 92.8 93.5 94.3 95.2 .4 .8 .9 1.0 1988 ............................................... 95.9 96.8 97.4 98.2 .7 .9 .6 .8 1989 ............................................... 99.0 100.0 101.0 101.6 .8 1.0 1.0 .6 1990 ............................................... 102.7 103.8 104.6 105.2 1.1 1.1 .8 .6 1991 ............................................... 106.4 107.3 108.0 108.8 1.1 .8 .7 .7 1992 ............................................... 109.7 110.4 111.1 111.6 .8 .6 .6 .5 1993 ............................................... 112.5 113.2 114.1 114.8 .8 .6 .8 .6 1994 ............................................... 115.6 116.5 117.5 118.0 .7 .8 .9 .4 1995 ............................................... 119.0 120.1 120.8 121.4 .8 .9 .6 .5 1996 ............................................... 122.5 123.7 124.3 125.1 .9 1.0 .5 .6 1997 ............................................... 126.0 127.3 128.3 129.1 .7 1.0 .8 .6 1998 ............................................... 130.2 131.3 132.4 133.2 .9 .8 .8 .6 1999 ............................................... 134.3 135.6 136.8 137.7 .8 1.0 .9 .7
Service occupations: 1980 ............................................... 63.9 65.1 66.6 67.6 – 1.9 2.3 1.5 1981 ............................................... 69.9 71.0 72.5 73.2 3.4 1.6 2.1 1.0 1982 ............................................... 75.1 76.6 77.9 79.3 2.6 2.0 1.7 1.8 1983 ............................................... 79.5 80.7 81.0 82.8 .3 1.5 .4 2.2 1984 ............................................... 84.5 84.9 86.2 87.8 2.1 .5 1.5 1.9 1985 ............................................... 87.5 88.5 89.8 89.9 -.3 1.1 1.5 .1 1986 ............................................... 90.5 91.0 91.6 92.3 .7 .6 .7 .8 1987 ............................................... 93.1 93.8 94.1 94.5 .9 .8 .3 .4 1988 ............................................... 95.4 96.5 97.7 98.6 1.0 1.2 1.2 .9 1989 ............................................... 99.4 100.1 100.9 102.2 .8 .7 .8 1.3 1990 ............................................... 103.1 104.3 104.8 106.4 .8 1.2 .5 1.5 1991 ............................................... 106.9 108.4 109.7 110.6 .5 1.4 1.2 .8
See footnotes at end of table.
17
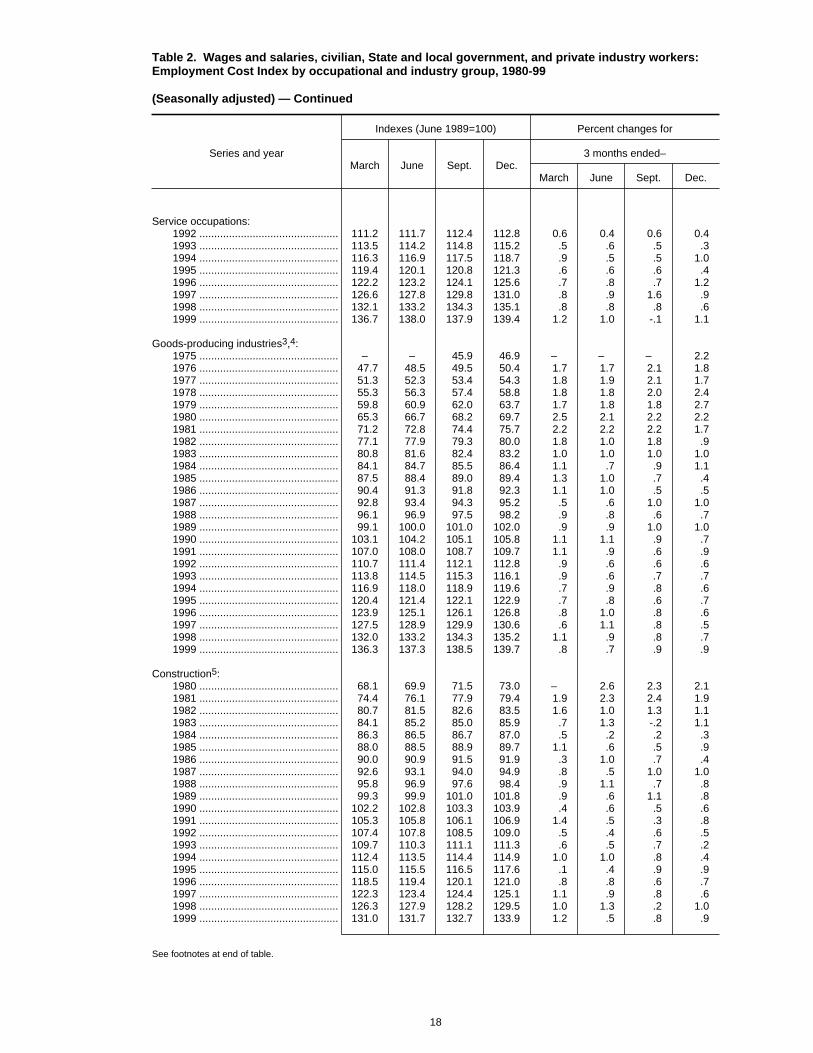
Table 2. Wages and salaries, civilian, State and local government, and private industry workers: Employment Cost Index by occupational and industry group, 1980-99
(Seasonally adjusted) — Continued
Series and year
Indexes (June 1989=100) Percent changes for
March June Sept. Dec.3 months ended–
March June Sept. Dec.
Service occupations: 1992 ............................................... 111.2 111.7 112.4 112.8 0.6 0.4 0.6 0.4 1993 ............................................... 113.5 114.2 114.8 115.2 .5 .6 .5 .3 1994 ............................................... 116.3 116.9 117.5 118.7 .9 .5 .5 1.0 1995 ............................................... 119.4 120.1 120.8 121.3 .6 .6 .6 .4 1996 ............................................... 122.2 123.2 124.1 125.6 .7 .8 .7 1.2 1997 ............................................... 126.6 127.8 129.8 131.0 .8 .9 1.6 .9 1998 ............................................... 132.1 133.2 134.3 135.1 .8 .8 .8 .6 1999 ............................................... 136.7 138.0 137.9 139.4 1.2 1.0 -.1 1.1
Goods-producing industries3,4: 1975 ............................................... – – 45.9 46.9 – – – 2.2 1976 ............................................... 47.7 48.5 49.5 50.4 1.7 1.7 2.1 1.8 1977 ............................................... 51.3 52.3 53.4 54.3 1.8 1.9 2.1 1.7 1978 ............................................... 55.3 56.3 57.4 58.8 1.8 1.8 2.0 2.4 1979 ............................................... 59.8 60.9 62.0 63.7 1.7 1.8 1.8 2.7 1980 ............................................... 65.3 66.7 68.2 69.7 2.5 2.1 2.2 2.2 1981 ............................................... 71.2 72.8 74.4 75.7 2.2 2.2 2.2 1.7 1982 ............................................... 77.1 77.9 79.3 80.0 1.8 1.0 1.8 .9 1983 ............................................... 80.8 81.6 82.4 83.2 1.0 1.0 1.0 1.0 1984 ............................................... 84.1 84.7 85.5 86.4 1.1 .7 .9 1.1 1985 ............................................... 87.5 88.4 89.0 89.4 1.3 1.0 .7 .4 1986 ............................................... 90.4 91.3 91.8 92.3 1.1 1.0 .5 .5 1987 ............................................... 92.8 93.4 94.3 95.2 .5 .6 1.0 1.0 1988 ............................................... 96.1 96.9 97.5 98.2 .9 .8 .6 .7 1989 ............................................... 99.1 100.0 101.0 102.0 .9 .9 1.0 1.0 1990 ............................................... 103.1 104.2 105.1 105.8 1.1 1.1 .9 .7 1991 ............................................... 107.0 108.0 108.7 109.7 1.1 .9 .6 .9 1992 ............................................... 110.7 111.4 112.1 112.8 .9 .6 .6 .6 1993 ............................................... 113.8 114.5 115.3 116.1 .9 .6 .7 .7 1994 ............................................... 116.9 118.0 118.9 119.6 .7 .9 .8 .6 1995 ............................................... 120.4 121.4 122.1 122.9 .7 .8 .6 .7 1996 ............................................... 123.9 125.1 126.1 126.8 .8 1.0 .8 .6 1997 ............................................... 127.5 128.9 129.9 130.6 .6 1.1 .8 .5 1998 ............................................... 132.0 133.2 134.3 135.2 1.1 .9 .8 .7 1999 ............................................... 136.3 137.3 138.5 139.7 .8 .7 .9 .9
Construction5: 1980 ............................................... 68.1 69.9 71.5 73.0 – 2.6 2.3 2.1 1981 ............................................... 74.4 76.1 77.9 79.4 1.9 2.3 2.4 1.9 1982 ............................................... 80.7 81.5 82.6 83.5 1.6 1.0 1.3 1.1 1983 ............................................... 84.1 85.2 85.0 85.9 .7 1.3 -.2 1.1 1984 ............................................... 86.3 86.5 86.7 87.0 .5 .2 .2 .3 1985 ............................................... 88.0 88.5 88.9 89.7 1.1 .6 .5 .9 1986 ............................................... 90.0 90.9 91.5 91.9 .3 1.0 .7 .4 1987 ............................................... 92.6 93.1 94.0 94.9 .8 .5 1.0 1.0 1988 ............................................... 95.8 96.9 97.6 98.4 .9 1.1 .7 .8 1989 ............................................... 99.3 99.9 101.0 101.8 .9 .6 1.1 .8 1990 ............................................... 102.2 102.8 103.3 103.9 .4 .6 .5 .6 1991 ............................................... 105.3 105.8 106.1 106.9 1.4 .5 .3 .8 1992 ............................................... 107.4 107.8 108.5 109.0 .5 .4 .6 .5 1993 ............................................... 109.7 110.3 111.1 111.3 .6 .5 .7 .2 1994 ............................................... 112.4 113.5 114.4 114.9 1.0 1.0 .8 .4 1995 ............................................... 115.0 115.5 116.5 117.6 .1 .4 .9 .9 1996 ............................................... 118.5 119.4 120.1 121.0 .8 .8 .6 .7 1997 ............................................... 122.3 123.4 124.4 125.1 1.1 .9 .8 .6 1998 ............................................... 126.3 127.9 128.2 129.5 1.0 1.3 .2 1.0 1999 ............................................... 131.0 131.7 132.7 133.9 1.2 .5 .8 .9
See footnotes at end of table.
18
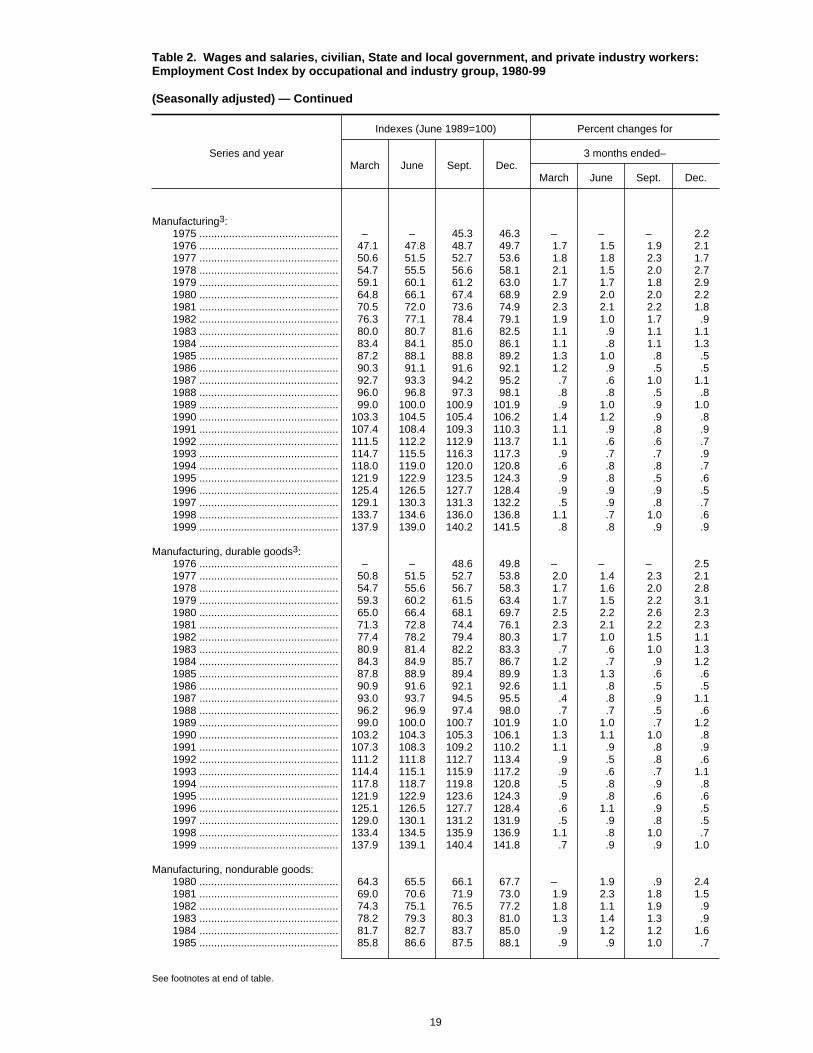
Table 2. Wages and salaries, civilian, State and local government, and private industry workers: Employment Cost Index by occupational and industry group, 1980-99
(Seasonally adjusted) — Continued
Series and year
Indexes (June 1989=100) Percent changes for
March June Sept. Dec.3 months ended–
March June Sept. Dec.
Manufacturing3: 1975 ............................................... – – 45.3 46.3 – – – 2.2 1976 ............................................... 47.1 47.8 48.7 49.7 1.7 1.5 1.9 2.1 1977 ............................................... 50.6 51.5 52.7 53.6 1.8 1.8 2.3 1.7 1978 ............................................... 54.7 55.5 56.6 58.1 2.1 1.5 2.0 2.7 1979 ............................................... 59.1 60.1 61.2 63.0 1.7 1.7 1.8 2.9 1980 ............................................... 64.8 66.1 67.4 68.9 2.9 2.0 2.0 2.2 1981 ............................................... 70.5 72.0 73.6 74.9 2.3 2.1 2.2 1.8 1982 ............................................... 76.3 77.1 78.4 79.1 1.9 1.0 1.7 .9 1983 ............................................... 80.0 80.7 81.6 82.5 1.1 .9 1.1 1.1 1984 ............................................... 83.4 84.1 85.0 86.1 1.1 .8 1.1 1.3 1985 ............................................... 87.2 88.1 88.8 89.2 1.3 1.0 .8 .5 1986 ............................................... 90.3 91.1 91.6 92.1 1.2 .9 .5 .5 1987 ............................................... 92.7 93.3 94.2 95.2 .7 .6 1.0 1.1 1988 ............................................... 96.0 96.8 97.3 98.1 .8 .8 .5 .8 1989 ............................................... 99.0 100.0 100.9 101.9 .9 1.0 .9 1.0 1990 ............................................... 103.3 104.5 105.4 106.2 1.4 1.2 .9 .8 1991 ............................................... 107.4 108.4 109.3 110.3 1.1 .9 .8 .9 1992 ............................................... 111.5 112.2 112.9 113.7 1.1 .6 .6 .7 1993 ............................................... 114.7 115.5 116.3 117.3 .9 .7 .7 .9 1994 ............................................... 118.0 119.0 120.0 120.8 .6 .8 .8 .7 1995 ............................................... 121.9 122.9 123.5 124.3 .9 .8 .5 .6 1996 ............................................... 125.4 126.5 127.7 128.4 .9 .9 .9 .5 1997 ............................................... 129.1 130.3 131.3 132.2 .5 .9 .8 .7 1998 ............................................... 133.7 134.6 136.0 136.8 1.1 .7 1.0 .6 1999 ............................................... 137.9 139.0 140.2 141.5 .8 .8 .9 .9
Manufacturing, durable goods3: 1976 ............................................... – – 48.6 49.8 – – – 2.5 1977 ............................................... 50.8 51.5 52.7 53.8 2.0 1.4 2.3 2.1 1978 ............................................... 54.7 55.6 56.7 58.3 1.7 1.6 2.0 2.8 1979 ............................................... 59.3 60.2 61.5 63.4 1.7 1.5 2.2 3.1 1980 ............................................... 65.0 66.4 68.1 69.7 2.5 2.2 2.6 2.3 1981 ............................................... 71.3 72.8 74.4 76.1 2.3 2.1 2.2 2.3 1982 ............................................... 77.4 78.2 79.4 80.3 1.7 1.0 1.5 1.1 1983 ............................................... 80.9 81.4 82.2 83.3 .7 .6 1.0 1.3 1984 ............................................... 84.3 84.9 85.7 86.7 1.2 .7 .9 1.2 1985 ............................................... 87.8 88.9 89.4 89.9 1.3 1.3 .6 .6 1986 ............................................... 90.9 91.6 92.1 92.6 1.1 .8 .5 .5 1987 ............................................... 93.0 93.7 94.5 95.5 .4 .8 .9 1.1 1988 ............................................... 96.2 96.9 97.4 98.0 .7 .7 .5 .6 1989 ............................................... 99.0 100.0 100.7 101.9 1.0 1.0 .7 1.2 1990 ............................................... 103.2 104.3 105.3 106.1 1.3 1.1 1.0 .8 1991 ............................................... 107.3 108.3 109.2 110.2 1.1 .9 .8 .9 1992 ............................................... 111.2 111.8 112.7 113.4 .9 .5 .8 .6 1993 ............................................... 114.4 115.1 115.9 117.2 .9 .6 .7 1.1 1994 ............................................... 117.8 118.7 119.8 120.8 .5 .8 .9 .8 1995 ............................................... 121.9 122.9 123.6 124.3 .9 .8 .6 .6 1996 ............................................... 125.1 126.5 127.7 128.4 .6 1.1 .9 .5 1997 ............................................... 129.0 130.1 131.2 131.9 .5 .9 .8 .5 1998 ............................................... 133.4 134.5 135.9 136.9 1.1 .8 1.0 .7 1999 ............................................... 137.9 139.1 140.4 141.8 .7 .9 .9 1.0
Manufacturing, nondurable goods: 1980 ............................................... 64.3 65.5 66.1 67.7 – 1.9 .9 2.4 1981 ............................................... 69.0 70.6 71.9 73.0 1.9 2.3 1.8 1.5 1982 ............................................... 74.3 75.1 76.5 77.2 1.8 1.1 1.9 .9 1983 ............................................... 78.2 79.3 80.3 81.0 1.3 1.4 1.3 .9 1984 ............................................... 81.7 82.7 83.7 85.0 .9 1.2 1.2 1.6 1985 ............................................... 85.8 86.6 87.5 88.1 .9 .9 1.0 .7
See footnotes at end of table.
19

Table 2. Wages and salaries, civilian, State and local government, and private industry workers: Employment Cost Index by occupational and industry group, 1980-99
(Seasonally adjusted) — Continued
Series and year
Indexes (June 1989=100) Percent changes for
March June Sept. Dec.3 months ended–
March June Sept. Dec.
Manufacturing, nondurable goods: 1986 ............................................... 89.0 90.3 90.6 91.4 1.0 1.5 0.3 0.9 1987 ............................................... 92.1 92.5 93.8 94.8 .8 .4 1.4 1.1 1988 ............................................... 95.7 96.4 97.2 98.3 .9 .7 .8 1.1 1989 ............................................... 98.9 99.9 101.1 101.9 .6 1.0 1.2 .8 1990 ............................................... 103.5 104.7 105.7 106.4 1.6 1.2 1.0 .7 1991 ............................................... 107.5 108.5 109.5 110.7 1.0 .9 .9 1.1 1992 ............................................... 111.7 112.7 113.3 114.5 .8 .9 .5 1.1 1993 ............................................... 115.4 116.2 117.0 117.6 .8 .7 .7 .5 1994 ............................................... 118.2 119.4 120.4 121.0 .4 1.0 .8 .5 1995 ............................................... 121.8 122.8 123.4 124.6 .7 .8 .5 1.0 1996 ............................................... 125.7 126.4 127.7 128.6 .9 .6 1.0 .7 1997 ............................................... 129.2 130.5 131.5 132.8 .5 1.0 .8 1.0 1998 ............................................... 134.0 134.8 136.1 137.0 .9 .6 1.0 .7 1999 ............................................... 137.8 138.6 139.8 141.1 .6 .6 .9 .9
Service-producing industries6: 1980 ............................................... 61.4 62.7 64.1 65.3 – 2.1 2.2 1.9 1981 ............................................... 67.3 68.7 69.8 71.1 3.1 2.1 1.6 1.9 1982 ............................................... 72.6 73.5 74.7 75.9 2.1 1.2 1.6 1.6 1983 ............................................... 76.9 77.9 79.1 80.2 1.3 1.3 1.5 1.4 1984 ............................................... 81.3 82.2 82.6 83.7 1.4 1.1 .5 1.3 1985 ............................................... 84.6 85.7 87.0 87.8 1.1 1.3 1.5 .9 1986 ............................................... 88.5 89.2 89.7 90.4 .8 .8 .6 .8 1987 ............................................... 91.5 92.1 92.9 93.5 1.2 .7 .9 .6 1988 ............................................... 94.3 95.5 96.5 97.9 .9 1.3 1.0 1.5 1989 ............................................... 99.2 100.0 101.2 102.3 1.3 .8 1.2 1.1 1990 ............................................... 103.3 104.6 105.6 106.4 1.0 1.3 1.0 .8 1991 ............................................... 107.5 108.7 109.6 110.3 1.0 1.1 .8 .6 1992 ............................................... 111.1 111.7 112.2 113.1 .7 .5 .4 .8 1993 ............................................... 113.9 114.7 115.8 116.7 .7 .7 1.0 .8 1994 ............................................... 117.3 118.2 119.1 119.8 .5 .8 .8 .6 1995 ............................................... 120.7 121.6 122.5 123.3 .8 .7 .7 .7 1996 ............................................... 124.7 125.8 126.6 127.6 1.1 .9 .6 .8 1997 ............................................... 129.0 130.1 131.4 133.2 1.1 .9 1.0 1.4 1998 ............................................... 134.4 135.6 137.5 138.5 .9 .9 1.4 .7 1999 ............................................... 138.9 140.8 142.0 143.4 .3 1.4 .9 1.0
Transportation and public utilities7: 1980 ............................................... 65.3 66.7 68.7 70.8 – 2.1 3.0 3.1 1981 ............................................... 72.2 73.9 75.3 76.7 2.0 2.4 1.9 1.9 1982 ............................................... 78.1 79.0 80.9 82.2 1.8 1.2 2.4 1.6 1983 ............................................... 83.4 84.8 85.5 86.4 1.5 1.7 .8 1.1 1984 ............................................... 87.6 88.2 88.5 89.4 1.4 .7 .3 1.0 1985 ............................................... 89.9 90.8 92.1 92.7 .6 1.0 1.4 .7 1986 ............................................... 93.3 93.6 94.0 94.4 .6 .3 .4 .4 1987 ............................................... 94.7 95.5 96.0 96.4 .3 .8 .5 .4 1988 ............................................... 97.1 97.8 98.5 98.8 .7 .7 .7 .3 1989 ............................................... 99.5 99.9 100.6 101.4 .7 .4 .7 .8 1990 ............................................... 102.6 103.1 104.0 104.8 1.2 .5 .9 .8 1991 ............................................... 105.4 106.5 107.6 108.9 .6 1.0 1.0 1.2 1992 ............................................... 109.7 110.5 111.2 111.9 .8 .7 .6 .6 1993 ............................................... 112.8 114.0 114.7 115.5 .8 1.1 .6 .7 1994 ............................................... 116.3 117.2 118.9 119.7 .7 .8 1.5 .7 1995 ............................................... 121.1 122.1 122.9 123.7 1.2 .8 .7 .7 1996 ............................................... 124.5 125.1 125.9 127.0 .6 .5 .6 .9 1997 ............................................... 128.1 129.0 130.1 131.3 .9 .7 .9 .9 1998 ............................................... 132.0 133.0 134.3 135.1 .5 .8 1.0 .6 1999 ............................................... 135.2 137.0 137.5 137.9 .1 1.3 .4 .3
See footnotes at end of table.
20
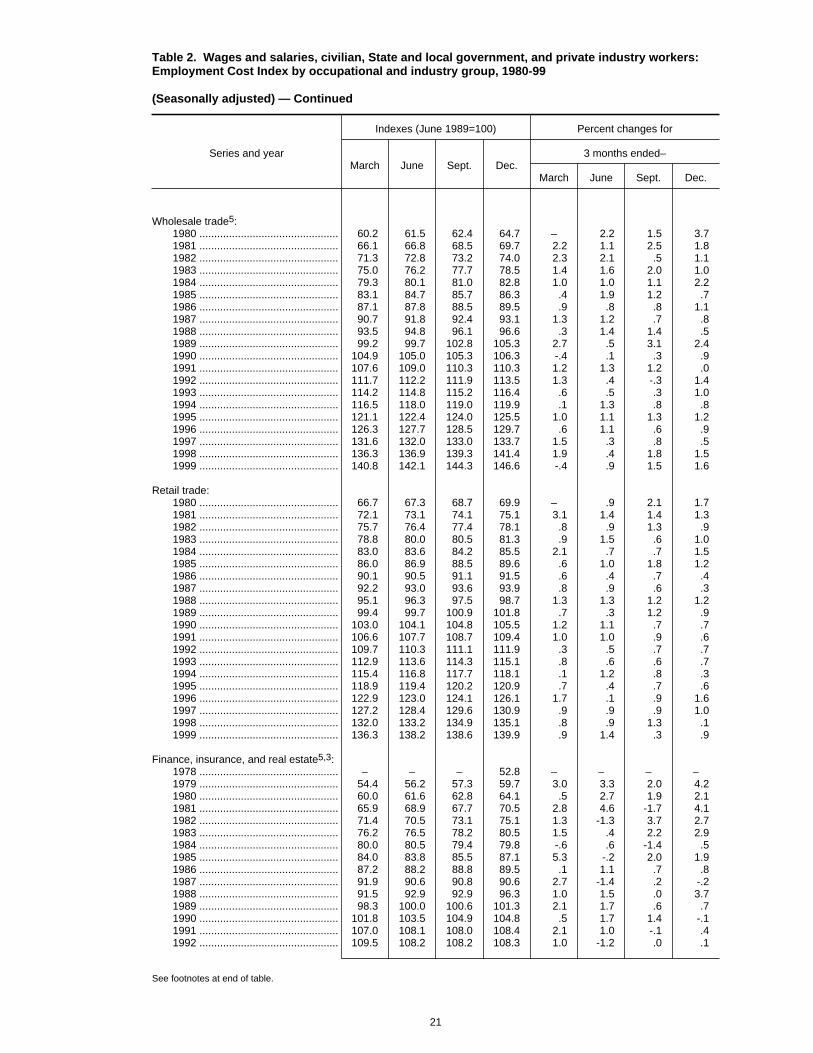
Table 2. Wages and salaries, civilian, State and local government, and private industry workers: Employment Cost Index by occupational and industry group, 1980-99
(Seasonally adjusted) — Continued
Series and year
Indexes (June 1989=100) Percent changes for
March June Sept. Dec.3 months ended–
March June Sept. Dec.
Wholesale trade5: 1980 ............................................... 60.2 61.5 62.4 64.7 – 2.2 1.5 3.7 1981 ............................................... 66.1 66.8 68.5 69.7 2.2 1.1 2.5 1.8 1982 ............................................... 71.3 72.8 73.2 74.0 2.3 2.1 .5 1.1 1983 ............................................... 75.0 76.2 77.7 78.5 1.4 1.6 2.0 1.0 1984 ............................................... 79.3 80.1 81.0 82.8 1.0 1.0 1.1 2.2 1985 ............................................... 83.1 84.7 85.7 86.3 .4 1.9 1.2 .7 1986 ............................................... 87.1 87.8 88.5 89.5 .9 .8 .8 1.1 1987 ............................................... 90.7 91.8 92.4 93.1 1.3 1.2 .7 .8 1988 ............................................... 93.5 94.8 96.1 96.6 .3 1.4 1.4 .5 1989 ............................................... 99.2 99.7 102.8 105.3 2.7 .5 3.1 2.4 1990 ............................................... 104.9 105.0 105.3 106.3 -.4 .1 .3 .9 1991 ............................................... 107.6 109.0 110.3 110.3 1.2 1.3 1.2 .0 1992 ............................................... 111.7 112.2 111.9 113.5 1.3 .4 -.3 1.4 1993 ............................................... 114.2 114.8 115.2 116.4 .6 .5 .3 1.0 1994 ............................................... 116.5 118.0 119.0 119.9 .1 1.3 .8 .8 1995 ............................................... 121.1 122.4 124.0 125.5 1.0 1.1 1.3 1.2 1996 ............................................... 126.3 127.7 128.5 129.7 .6 1.1 .6 .9 1997 ............................................... 131.6 132.0 133.0 133.7 1.5 .3 .8 .5 1998 ............................................... 136.3 136.9 139.3 141.4 1.9 .4 1.8 1.5 1999 ............................................... 140.8 142.1 144.3 146.6 -.4 .9 1.5 1.6
Retail trade: 1980 ............................................... 66.7 67.3 68.7 69.9 – .9 2.1 1.7 1981 ............................................... 72.1 73.1 74.1 75.1 3.1 1.4 1.4 1.3 1982 ............................................... 75.7 76.4 77.4 78.1 .8 .9 1.3 .9 1983 ............................................... 78.8 80.0 80.5 81.3 .9 1.5 .6 1.0 1984 ............................................... 83.0 83.6 84.2 85.5 2.1 .7 .7 1.5 1985 ............................................... 86.0 86.9 88.5 89.6 .6 1.0 1.8 1.2 1986 ............................................... 90.1 90.5 91.1 91.5 .6 .4 .7 .4 1987 ............................................... 92.2 93.0 93.6 93.9 .8 .9 .6 .3 1988 ............................................... 95.1 96.3 97.5 98.7 1.3 1.3 1.2 1.2 1989 ............................................... 99.4 99.7 100.9 101.8 .7 .3 1.2 .9 1990 ............................................... 103.0 104.1 104.8 105.5 1.2 1.1 .7 .7 1991 ............................................... 106.6 107.7 108.7 109.4 1.0 1.0 .9 .6 1992 ............................................... 109.7 110.3 111.1 111.9 .3 .5 .7 .7 1993 ............................................... 112.9 113.6 114.3 115.1 .8 .6 .6 .7 1994 ............................................... 115.4 116.8 117.7 118.1 .1 1.2 .8 .3 1995 ............................................... 118.9 119.4 120.2 120.9 .7 .4 .7 .6 1996 ............................................... 122.9 123.0 124.1 126.1 1.7 .1 .9 1.6 1997 ............................................... 127.2 128.4 129.6 130.9 .9 .9 .9 1.0 1998 ............................................... 132.0 133.2 134.9 135.1 .8 .9 1.3 .1 1999 ............................................... 136.3 138.2 138.6 139.9 .9 1.4 .3 .9
Finance, insurance, and real estate5,3: 1978 ............................................... – – – 52.8 – – – – 1979 ............................................... 54.4 56.2 57.3 59.7 3.0 3.3 2.0 4.2 1980 ............................................... 60.0 61.6 62.8 64.1 .5 2.7 1.9 2.1 1981 ............................................... 65.9 68.9 67.7 70.5 2.8 4.6 -1.7 4.1 1982 ............................................... 71.4 70.5 73.1 75.1 1.3 -1.3 3.7 2.7 1983 ............................................... 76.2 76.5 78.2 80.5 1.5 .4 2.2 2.9 1984 ............................................... 80.0 80.5 79.4 79.8 -.6 .6 -1.4 .5 1985 ............................................... 84.0 83.8 85.5 87.1 5.3 -.2 2.0 1.9 1986 ............................................... 87.2 88.2 88.8 89.5 .1 1.1 .7 .8 1987 ............................................... 91.9 90.6 90.8 90.6 2.7 -1.4 .2 -.2 1988 ............................................... 91.5 92.9 92.9 96.3 1.0 1.5 .0 3.7 1989 ............................................... 98.3 100.0 100.6 101.3 2.1 1.7 .6 .7 1990 ............................................... 101.8 103.5 104.9 104.8 .5 1.7 1.4 -.1 1991 ............................................... 107.0 108.1 108.0 108.4 2.1 1.0 -.1 .4 1992 ............................................... 109.5 108.2 108.2 108.3 1.0 -1.2 .0 .1
See footnotes at end of table.
21
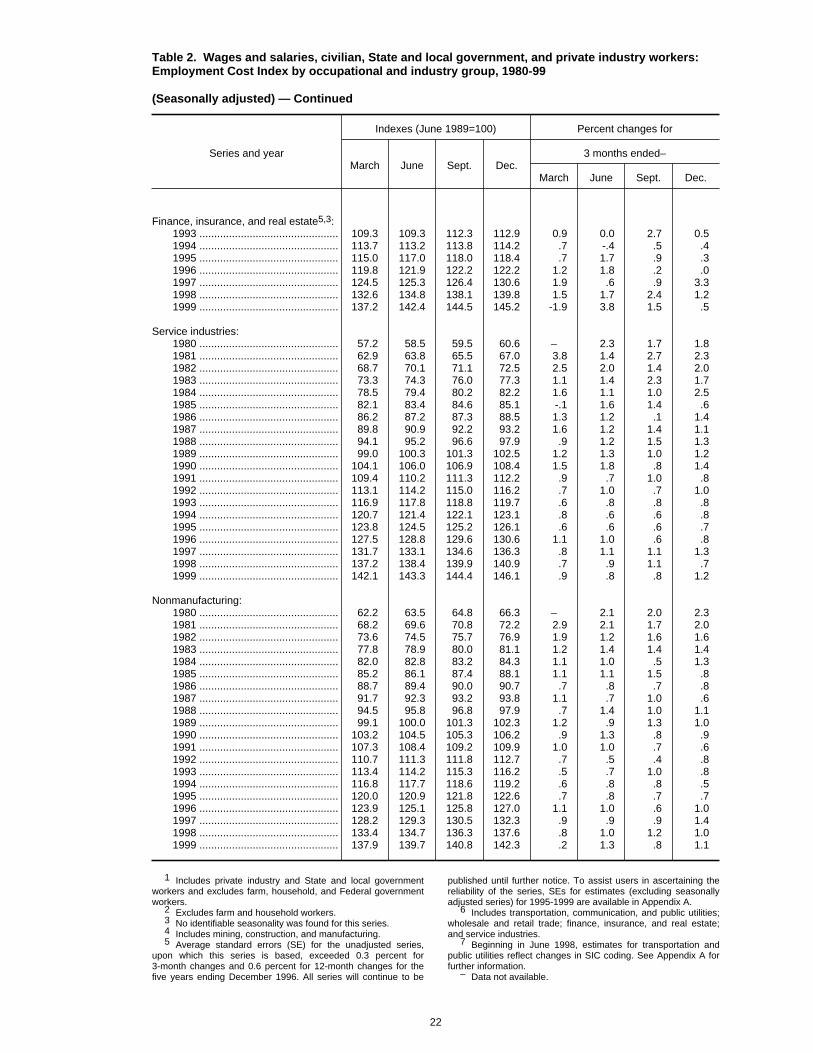
Table 2. Wages and salaries, civilian, State and local government, and private industry workers: Employment Cost Index by occupational and industry group, 1980-99
(Seasonally adjusted) — Continued
Series and year
Indexes (June 1989=100) Percent changes for
March June Sept. Dec.3 months ended–
March June Sept. Dec.
Finance, insurance, and real estate5,3: 1993 ............................................... 109.3 109.3 112.3 112.9 0.9 0.0 2.7 0.5 1994 ............................................... 113.7 113.2 113.8 114.2 .7 -.4 .5 .4 1995 ............................................... 115.0 117.0 118.0 118.4 .7 1.7 .9 .3 1996 ............................................... 119.8 121.9 122.2 122.2 1.2 1.8 .2 .0 1997 ............................................... 124.5 125.3 126.4 130.6 1.9 .6 .9 3.3 1998 ............................................... 132.6 134.8 138.1 139.8 1.5 1.7 2.4 1.2 1999 ............................................... 137.2 142.4 144.5 145.2 -1.9 3.8 1.5 .5
Service industries: 1980 ............................................... 57.2 58.5 59.5 60.6 – 2.3 1.7 1.8 1981 ............................................... 62.9 63.8 65.5 67.0 3.8 1.4 2.7 2.3 1982 ............................................... 68.7 70.1 71.1 72.5 2.5 2.0 1.4 2.0 1983 ............................................... 73.3 74.3 76.0 77.3 1.1 1.4 2.3 1.7 1984 ............................................... 78.5 79.4 80.2 82.2 1.6 1.1 1.0 2.5 1985 ............................................... 82.1 83.4 84.6 85.1 -.1 1.6 1.4 .6 1986 ............................................... 86.2 87.2 87.3 88.5 1.3 1.2 .1 1.4 1987 ............................................... 89.8 90.9 92.2 93.2 1.6 1.2 1.4 1.1 1988 ............................................... 94.1 95.2 96.6 97.9 .9 1.2 1.5 1.3 1989 ............................................... 99.0 100.3 101.3 102.5 1.2 1.3 1.0 1.2 1990 ............................................... 104.1 106.0 106.9 108.4 1.5 1.8 .8 1.4 1991 ............................................... 109.4 110.2 111.3 112.2 .9 .7 1.0 .8 1992 ............................................... 113.1 114.2 115.0 116.2 .7 1.0 .7 1.0 1993 ............................................... 116.9 117.8 118.8 119.7 .6 .8 .8 .8 1994 ............................................... 120.7 121.4 122.1 123.1 .8 .6 .6 .8 1995 ............................................... 123.8 124.5 125.2 126.1 .6 .6 .6 .7 1996 ............................................... 127.5 128.8 129.6 130.6 1.1 1.0 .6 .8 1997 ............................................... 131.7 133.1 134.6 136.3 .8 1.1 1.1 1.3 1998 ............................................... 137.2 138.4 139.9 140.9 .7 .9 1.1 .7 1999 ............................................... 142.1 143.3 144.4 146.1 .9 .8 .8 1.2
Nonmanufacturing: 1980 ............................................... 62.2 63.5 64.8 66.3 – 2.1 2.0 2.3 1981 ............................................... 68.2 69.6 70.8 72.2 2.9 2.1 1.7 2.0 1982 ............................................... 73.6 74.5 75.7 76.9 1.9 1.2 1.6 1.6 1983 ............................................... 77.8 78.9 80.0 81.1 1.2 1.4 1.4 1.4 1984 ............................................... 82.0 82.8 83.2 84.3 1.1 1.0 .5 1.3 1985 ............................................... 85.2 86.1 87.4 88.1 1.1 1.1 1.5 .8 1986 ............................................... 88.7 89.4 90.0 90.7 .7 .8 .7 .8 1987 ............................................... 91.7 92.3 93.2 93.8 1.1 .7 1.0 .6 1988 ............................................... 94.5 95.8 96.8 97.9 .7 1.4 1.0 1.1 1989 ............................................... 99.1 100.0 101.3 102.3 1.2 .9 1.3 1.0 1990 ............................................... 103.2 104.5 105.3 106.2 .9 1.3 .8 .9 1991 ............................................... 107.3 108.4 109.2 109.9 1.0 1.0 .7 .6 1992 ............................................... 110.7 111.3 111.8 112.7 .7 .5 .4 .8 1993 ............................................... 113.4 114.2 115.3 116.2 .5 .7 1.0 .8 1994 ............................................... 116.8 117.7 118.6 119.2 .6 .8 .8 .5 1995 ............................................... 120.0 120.9 121.8 122.6 .7 .8 .7 .7 1996 ............................................... 123.9 125.1 125.8 127.0 1.1 1.0 .6 1.0 1997 ............................................... 128.2 129.3 130.5 132.3 .9 .9 .9 1.4 1998 ............................................... 133.4 134.7 136.3 137.6 .8 1.0 1.2 1.0 1999 ............................................... 137.9 139.7 140.8 142.3 .2 1.3 .8 1.1
1 Includes private industry and State and local governmentworkers and excludes farm, household, and Federal governmentworkers.
2 Excludes farm and household workers.3 No identifiable seasonality was found for this series.4 Includes mining, construction, and manufacturing.5 Average standard errors (SE) for the unadjusted series,
upon which this series is based, exceeded 0.3 percent for3-month changes and 0.6 percent for 12-month changes for thefive years ending December 1996. All series will continue to be
published until further notice. To assist users in ascertaining thereliability of the series, SEs for estimates (excluding seasonallyadjusted series) for 1995-1999 are available in Appendix A.
6 Includes transportation, communication, and public utilities;wholesale and retail trade; finance, insurance, and real estate;and service industries.
7 Beginning in June 1998, estimates for transportation andpublic utilities reflect changes in SIC coding. See Appendix A forfurther information.
– Data not available.
22
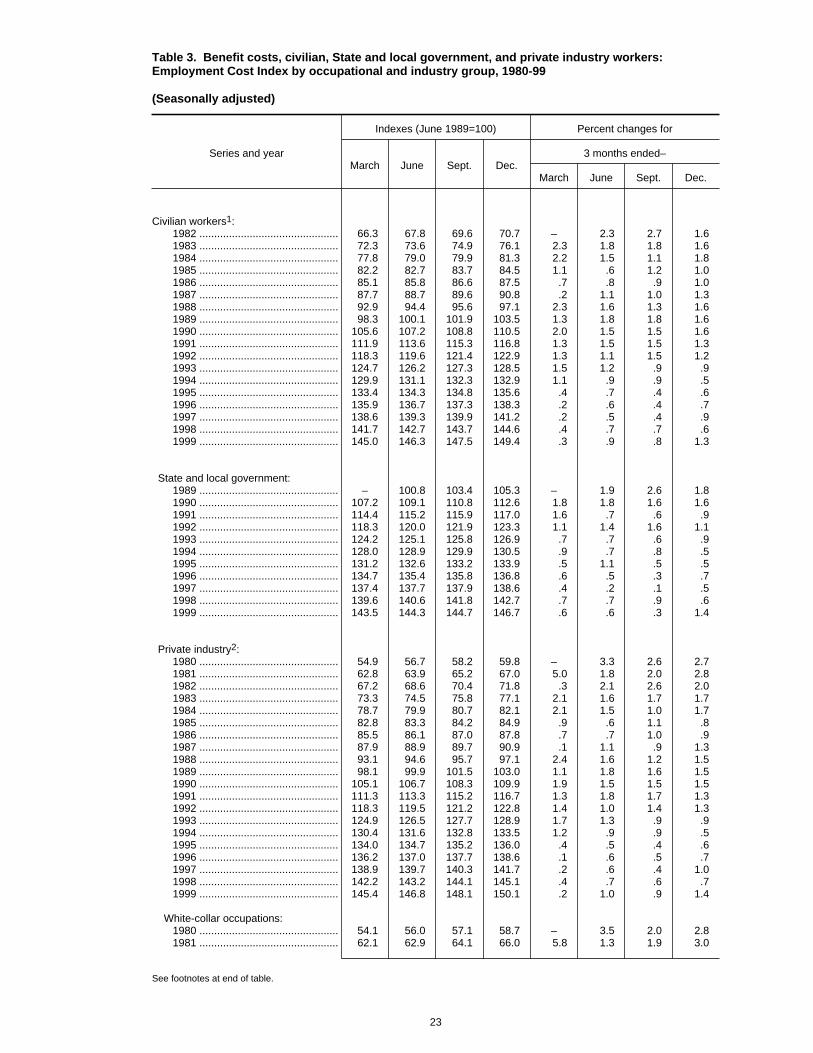
Table 3. Benefit costs, civilian, State and local government, and private industry workers: Employment Cost Index by occupational and industry group, 1980-99
(Seasonally adjusted)
Series and year
Indexes (June 1989=100) Percent changes for
March June Sept. Dec.3 months ended–
March June Sept. Dec.
Civilian workers1: 1982 ............................................... 66.3 67.8 69.6 70.7 – 2.3 2.7 1.6 1983 ............................................... 72.3 73.6 74.9 76.1 2.3 1.8 1.8 1.6 1984 ............................................... 77.8 79.0 79.9 81.3 2.2 1.5 1.1 1.8 1985 ............................................... 82.2 82.7 83.7 84.5 1.1 .6 1.2 1.0 1986 ............................................... 85.1 85.8 86.6 87.5 .7 .8 .9 1.0 1987 ............................................... 87.7 88.7 89.6 90.8 .2 1.1 1.0 1.3 1988 ............................................... 92.9 94.4 95.6 97.1 2.3 1.6 1.3 1.6 1989 ............................................... 98.3 100.1 101.9 103.5 1.3 1.8 1.8 1.6 1990 ............................................... 105.6 107.2 108.8 110.5 2.0 1.5 1.5 1.6 1991 ............................................... 111.9 113.6 115.3 116.8 1.3 1.5 1.5 1.3 1992 ............................................... 118.3 119.6 121.4 122.9 1.3 1.1 1.5 1.2 1993 ............................................... 124.7 126.2 127.3 128.5 1.5 1.2 .9 .9 1994 ............................................... 129.9 131.1 132.3 132.9 1.1 .9 .9 .5 1995 ............................................... 133.4 134.3 134.8 135.6 .4 .7 .4 .6 1996 ............................................... 135.9 136.7 137.3 138.3 .2 .6 .4 .7 1997 ............................................... 138.6 139.3 139.9 141.2 .2 .5 .4 .9 1998 ............................................... 141.7 142.7 143.7 144.6 .4 .7 .7 .6 1999 ............................................... 145.0 146.3 147.5 149.4 .3 .9 .8 1.3
State and local government: 1989 ............................................... – 100.8 103.4 105.3 – 1.9 2.6 1.8 1990 ............................................... 107.2 109.1 110.8 112.6 1.8 1.8 1.6 1.6 1991 ............................................... 114.4 115.2 115.9 117.0 1.6 .7 .6 .9 1992 ............................................... 118.3 120.0 121.9 123.3 1.1 1.4 1.6 1.1 1993 ............................................... 124.2 125.1 125.8 126.9 .7 .7 .6 .9 1994 ............................................... 128.0 128.9 129.9 130.5 .9 .7 .8 .5 1995 ............................................... 131.2 132.6 133.2 133.9 .5 1.1 .5 .5 1996 ............................................... 134.7 135.4 135.8 136.8 .6 .5 .3 .7 1997 ............................................... 137.4 137.7 137.9 138.6 .4 .2 .1 .5 1998 ............................................... 139.6 140.6 141.8 142.7 .7 .7 .9 .6 1999 ............................................... 143.5 144.3 144.7 146.7 .6 .6 .3 1.4
Private industry2: 1980 ............................................... 54.9 56.7 58.2 59.8 – 3.3 2.6 2.7 1981 ............................................... 62.8 63.9 65.2 67.0 5.0 1.8 2.0 2.8 1982 ............................................... 67.2 68.6 70.4 71.8 .3 2.1 2.6 2.0 1983 ............................................... 73.3 74.5 75.8 77.1 2.1 1.6 1.7 1.7 1984 ............................................... 78.7 79.9 80.7 82.1 2.1 1.5 1.0 1.7 1985 ............................................... 82.8 83.3 84.2 84.9 .9 .6 1.1 .8 1986 ............................................... 85.5 86.1 87.0 87.8 .7 .7 1.0 .9 1987 ............................................... 87.9 88.9 89.7 90.9 .1 1.1 .9 1.3 1988 ............................................... 93.1 94.6 95.7 97.1 2.4 1.6 1.2 1.5 1989 ............................................... 98.1 99.9 101.5 103.0 1.1 1.8 1.6 1.5 1990 ............................................... 105.1 106.7 108.3 109.9 1.9 1.5 1.5 1.5 1991 ............................................... 111.3 113.3 115.2 116.7 1.3 1.8 1.7 1.3 1992 ............................................... 118.3 119.5 121.2 122.8 1.4 1.0 1.4 1.3 1993 ............................................... 124.9 126.5 127.7 128.9 1.7 1.3 .9 .9 1994 ............................................... 130.4 131.6 132.8 133.5 1.2 .9 .9 .5 1995 ............................................... 134.0 134.7 135.2 136.0 .4 .5 .4 .6 1996 ............................................... 136.2 137.0 137.7 138.6 .1 .6 .5 .7 1997 ............................................... 138.9 139.7 140.3 141.7 .2 .6 .4 1.0 1998 ............................................... 142.2 143.2 144.1 145.1 .4 .7 .6 .7 1999 ............................................... 145.4 146.8 148.1 150.1 .2 1.0 .9 1.4
White-collar occupations: 1980 ............................................... 54.1 56.0 57.1 58.7 – 3.5 2.0 2.8 1981 ............................................... 62.1 62.9 64.1 66.0 5.8 1.3 1.9 3.0
See footnotes at end of table.
23
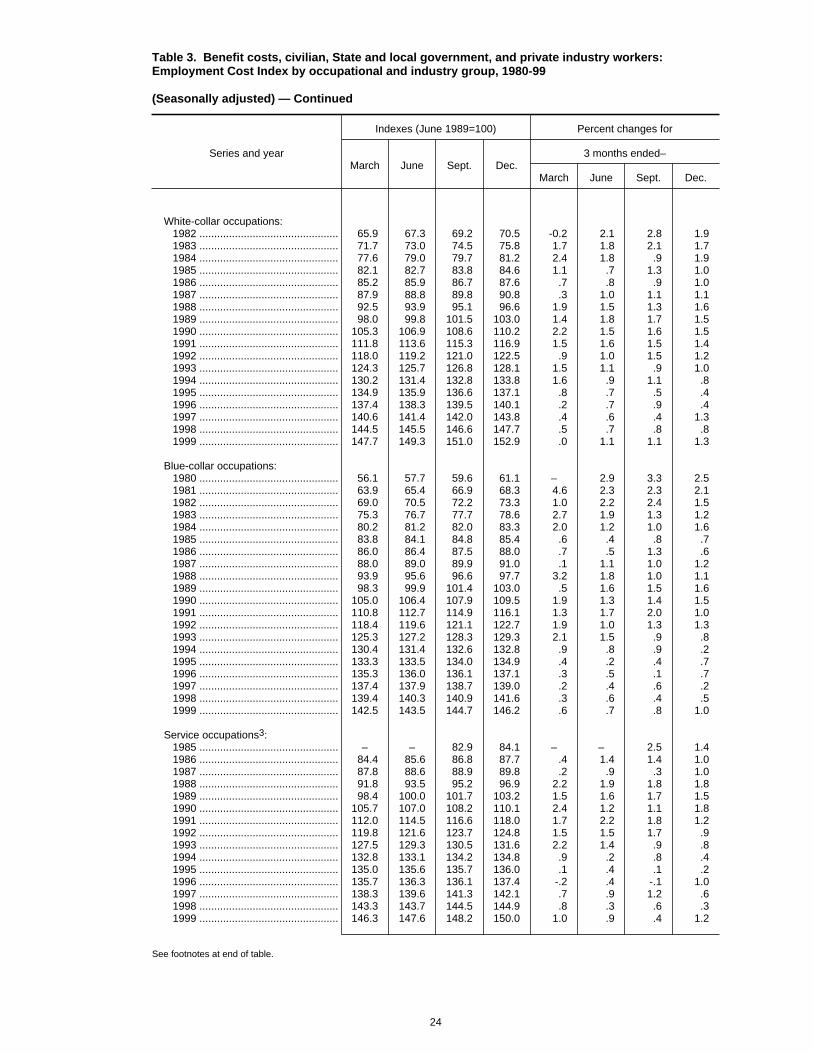
Table 3. Benefit costs, civilian, State and local government, and private industry workers: Employment Cost Index by occupational and industry group, 1980-99
(Seasonally adjusted) — Continued
Series and year
Indexes (June 1989=100) Percent changes for
March June Sept. Dec.3 months ended–
March June Sept. Dec.
White-collar occupations: 1982 ............................................... 65.9 67.3 69.2 70.5 -0.2 2.1 2.8 1.9 1983 ............................................... 71.7 73.0 74.5 75.8 1.7 1.8 2.1 1.7 1984 ............................................... 77.6 79.0 79.7 81.2 2.4 1.8 .9 1.9 1985 ............................................... 82.1 82.7 83.8 84.6 1.1 .7 1.3 1.0 1986 ............................................... 85.2 85.9 86.7 87.6 .7 .8 .9 1.0 1987 ............................................... 87.9 88.8 89.8 90.8 .3 1.0 1.1 1.1 1988 ............................................... 92.5 93.9 95.1 96.6 1.9 1.5 1.3 1.6 1989 ............................................... 98.0 99.8 101.5 103.0 1.4 1.8 1.7 1.5 1990 ............................................... 105.3 106.9 108.6 110.2 2.2 1.5 1.6 1.5 1991 ............................................... 111.8 113.6 115.3 116.9 1.5 1.6 1.5 1.4 1992 ............................................... 118.0 119.2 121.0 122.5 .9 1.0 1.5 1.2 1993 ............................................... 124.3 125.7 126.8 128.1 1.5 1.1 .9 1.0 1994 ............................................... 130.2 131.4 132.8 133.8 1.6 .9 1.1 .8 1995 ............................................... 134.9 135.9 136.6 137.1 .8 .7 .5 .4 1996 ............................................... 137.4 138.3 139.5 140.1 .2 .7 .9 .4 1997 ............................................... 140.6 141.4 142.0 143.8 .4 .6 .4 1.3 1998 ............................................... 144.5 145.5 146.6 147.7 .5 .7 .8 .8 1999 ............................................... 147.7 149.3 151.0 152.9 .0 1.1 1.1 1.3
Blue-collar occupations: 1980 ............................................... 56.1 57.7 59.6 61.1 – 2.9 3.3 2.5 1981 ............................................... 63.9 65.4 66.9 68.3 4.6 2.3 2.3 2.1 1982 ............................................... 69.0 70.5 72.2 73.3 1.0 2.2 2.4 1.5 1983 ............................................... 75.3 76.7 77.7 78.6 2.7 1.9 1.3 1.2 1984 ............................................... 80.2 81.2 82.0 83.3 2.0 1.2 1.0 1.6 1985 ............................................... 83.8 84.1 84.8 85.4 .6 .4 .8 .7 1986 ............................................... 86.0 86.4 87.5 88.0 .7 .5 1.3 .6 1987 ............................................... 88.0 89.0 89.9 91.0 .1 1.1 1.0 1.2 1988 ............................................... 93.9 95.6 96.6 97.7 3.2 1.8 1.0 1.1 1989 ............................................... 98.3 99.9 101.4 103.0 .5 1.6 1.5 1.6 1990 ............................................... 105.0 106.4 107.9 109.5 1.9 1.3 1.4 1.5 1991 ............................................... 110.8 112.7 114.9 116.1 1.3 1.7 2.0 1.0 1992 ............................................... 118.4 119.6 121.1 122.7 1.9 1.0 1.3 1.3 1993 ............................................... 125.3 127.2 128.3 129.3 2.1 1.5 .9 .8 1994 ............................................... 130.4 131.4 132.6 132.8 .9 .8 .9 .2 1995 ............................................... 133.3 133.5 134.0 134.9 .4 .2 .4 .7 1996 ............................................... 135.3 136.0 136.1 137.1 .3 .5 .1 .7 1997 ............................................... 137.4 137.9 138.7 139.0 .2 .4 .6 .2 1998 ............................................... 139.4 140.3 140.9 141.6 .3 .6 .4 .5 1999 ............................................... 142.5 143.5 144.7 146.2 .6 .7 .8 1.0
Service occupations3: 1985 ............................................... – – 82.9 84.1 – – 2.5 1.4 1986 ............................................... 84.4 85.6 86.8 87.7 .4 1.4 1.4 1.0 1987 ............................................... 87.8 88.6 88.9 89.8 .2 .9 .3 1.0 1988 ............................................... 91.8 93.5 95.2 96.9 2.2 1.9 1.8 1.8 1989 ............................................... 98.4 100.0 101.7 103.2 1.5 1.6 1.7 1.5 1990 ............................................... 105.7 107.0 108.2 110.1 2.4 1.2 1.1 1.8 1991 ............................................... 112.0 114.5 116.6 118.0 1.7 2.2 1.8 1.2 1992 ............................................... 119.8 121.6 123.7 124.8 1.5 1.5 1.7 .9 1993 ............................................... 127.5 129.3 130.5 131.6 2.2 1.4 .9 .8 1994 ............................................... 132.8 133.1 134.2 134.8 .9 .2 .8 .4 1995 ............................................... 135.0 135.6 135.7 136.0 .1 .4 .1 .2 1996 ............................................... 135.7 136.3 136.1 137.4 -.2 .4 -.1 1.0 1997 ............................................... 138.3 139.6 141.3 142.1 .7 .9 1.2 .6 1998 ............................................... 143.3 143.7 144.5 144.9 .8 .3 .6 .3 1999 ............................................... 146.3 147.6 148.2 150.0 1.0 .9 .4 1.2
See footnotes at end of table.
24
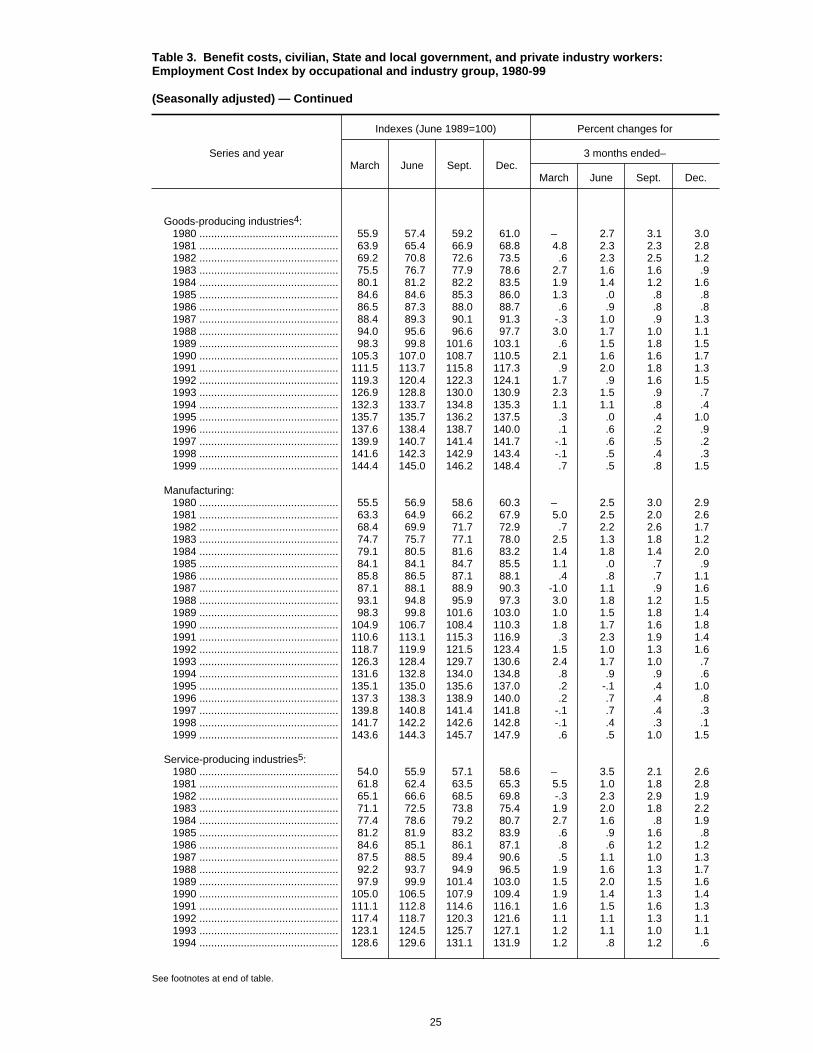
Table 3. Benefit costs, civilian, State and local government, and private industry workers: Employment Cost Index by occupational and industry group, 1980-99
(Seasonally adjusted) — Continued
Series and year
Indexes (June 1989=100) Percent changes for
March June Sept. Dec.3 months ended–
March June Sept. Dec.
Goods-producing industries4: 1980 ............................................... 55.9 57.4 59.2 61.0 – 2.7 3.1 3.0 1981 ............................................... 63.9 65.4 66.9 68.8 4.8 2.3 2.3 2.8 1982 ............................................... 69.2 70.8 72.6 73.5 .6 2.3 2.5 1.2 1983 ............................................... 75.5 76.7 77.9 78.6 2.7 1.6 1.6 .9 1984 ............................................... 80.1 81.2 82.2 83.5 1.9 1.4 1.2 1.6 1985 ............................................... 84.6 84.6 85.3 86.0 1.3 .0 .8 .8 1986 ............................................... 86.5 87.3 88.0 88.7 .6 .9 .8 .8 1987 ............................................... 88.4 89.3 90.1 91.3 -.3 1.0 .9 1.3 1988 ............................................... 94.0 95.6 96.6 97.7 3.0 1.7 1.0 1.1 1989 ............................................... 98.3 99.8 101.6 103.1 .6 1.5 1.8 1.5 1990 ............................................... 105.3 107.0 108.7 110.5 2.1 1.6 1.6 1.7 1991 ............................................... 111.5 113.7 115.8 117.3 .9 2.0 1.8 1.3 1992 ............................................... 119.3 120.4 122.3 124.1 1.7 .9 1.6 1.5 1993 ............................................... 126.9 128.8 130.0 130.9 2.3 1.5 .9 .7 1994 ............................................... 132.3 133.7 134.8 135.3 1.1 1.1 .8 .4 1995 ............................................... 135.7 135.7 136.2 137.5 .3 .0 .4 1.0 1996 ............................................... 137.6 138.4 138.7 140.0 .1 .6 .2 .9 1997 ............................................... 139.9 140.7 141.4 141.7 -.1 .6 .5 .2 1998 ............................................... 141.6 142.3 142.9 143.4 -.1 .5 .4 .3 1999 ............................................... 144.4 145.0 146.2 148.4 .7 .5 .8 1.5
Manufacturing: 1980 ............................................... 55.5 56.9 58.6 60.3 – 2.5 3.0 2.9 1981 ............................................... 63.3 64.9 66.2 67.9 5.0 2.5 2.0 2.6 1982 ............................................... 68.4 69.9 71.7 72.9 .7 2.2 2.6 1.7 1983 ............................................... 74.7 75.7 77.1 78.0 2.5 1.3 1.8 1.2 1984 ............................................... 79.1 80.5 81.6 83.2 1.4 1.8 1.4 2.0 1985 ............................................... 84.1 84.1 84.7 85.5 1.1 .0 .7 .9 1986 ............................................... 85.8 86.5 87.1 88.1 .4 .8 .7 1.1 1987 ............................................... 87.1 88.1 88.9 90.3 -1.0 1.1 .9 1.6 1988 ............................................... 93.1 94.8 95.9 97.3 3.0 1.8 1.2 1.5 1989 ............................................... 98.3 99.8 101.6 103.0 1.0 1.5 1.8 1.4 1990 ............................................... 104.9 106.7 108.4 110.3 1.8 1.7 1.6 1.8 1991 ............................................... 110.6 113.1 115.3 116.9 .3 2.3 1.9 1.4 1992 ............................................... 118.7 119.9 121.5 123.4 1.5 1.0 1.3 1.6 1993 ............................................... 126.3 128.4 129.7 130.6 2.4 1.7 1.0 .7 1994 ............................................... 131.6 132.8 134.0 134.8 .8 .9 .9 .6 1995 ............................................... 135.1 135.0 135.6 137.0 .2 -.1 .4 1.0 1996 ............................................... 137.3 138.3 138.9 140.0 .2 .7 .4 .8 1997 ............................................... 139.8 140.8 141.4 141.8 -.1 .7 .4 .3 1998 ............................................... 141.7 142.2 142.6 142.8 -.1 .4 .3 .1 1999 ............................................... 143.6 144.3 145.7 147.9 .6 .5 1.0 1.5
Service-producing industries5: 1980 ............................................... 54.0 55.9 57.1 58.6 – 3.5 2.1 2.6 1981 ............................................... 61.8 62.4 63.5 65.3 5.5 1.0 1.8 2.8 1982 ............................................... 65.1 66.6 68.5 69.8 -.3 2.3 2.9 1.9 1983 ............................................... 71.1 72.5 73.8 75.4 1.9 2.0 1.8 2.2 1984 ............................................... 77.4 78.6 79.2 80.7 2.7 1.6 .8 1.9 1985 ............................................... 81.2 81.9 83.2 83.9 .6 .9 1.6 .8 1986 ............................................... 84.6 85.1 86.1 87.1 .8 .6 1.2 1.2 1987 ............................................... 87.5 88.5 89.4 90.6 .5 1.1 1.0 1.3 1988 ............................................... 92.2 93.7 94.9 96.5 1.9 1.6 1.3 1.7 1989 ............................................... 97.9 99.9 101.4 103.0 1.5 2.0 1.5 1.6 1990 ............................................... 105.0 106.5 107.9 109.4 1.9 1.4 1.3 1.4 1991 ............................................... 111.1 112.8 114.6 116.1 1.6 1.5 1.6 1.3 1992 ............................................... 117.4 118.7 120.3 121.6 1.1 1.1 1.3 1.1 1993 ............................................... 123.1 124.5 125.7 127.1 1.2 1.1 1.0 1.1 1994 ............................................... 128.6 129.6 131.1 131.9 1.2 .8 1.2 .6
See footnotes at end of table.
25

Table 3. Benefit costs, civilian, State and local government, and private industry workers: Employment Cost Index by occupational and industry group, 1980-99
(Seasonally adjusted) — Continued
Series and year
Indexes (June 1989=100) Percent changes for
March June Sept. Dec.3 months ended–
March June Sept. Dec.
Service-producing industries5: 1995 ............................................... 133.0 134.0 134.7 135.1 0.8 0.8 0.5 0.3 1996 ............................................... 135.3 136.1 137.1 137.8 .1 .6 .7 .5 1997 ............................................... 138.3 139.1 139.7 141.8 .4 .6 .4 1.5 1998 ............................................... 142.5 143.7 144.8 146.1 .5 .8 .8 .9 1999 ............................................... 145.9 147.8 149.3 151.1 -.1 1.3 1.0 1.2
Nonmanufacturing: 1980 ............................................... 54.5 56.4 57.8 59.3 – 3.5 2.5 2.6 1981 ............................................... 62.3 63.2 64.6 66.3 5.1 1.4 2.2 2.6 1982 ............................................... 66.3 67.7 69.6 70.8 .0 2.1 2.8 1.7 1983 ............................................... 72.2 73.7 74.9 76.4 2.0 2.1 1.6 2.0 1984 ............................................... 78.3 79.3 80.0 81.3 2.5 1.3 .9 1.6 1985 ............................................... 81.8 82.5 83.9 84.7 .6 .9 1.7 1.0 1986 ............................................... 85.3 85.8 86.9 87.8 .7 .6 1.3 1.0 1987 ............................................... 88.5 89.4 90.3 91.4 .8 1.0 1.0 1.2 1988 ............................................... 93.0 94.4 95.5 97.2 1.9 1.5 1.2 1.8 1989 ............................................... 97.9 99.9 101.4 103.2 .7 2.0 1.5 1.8 1990 ............................................... 105.1 106.8 108.2 109.8 1.8 1.6 1.3 1.5 1991 ............................................... 111.6 113.3 115.1 116.7 1.7 1.5 1.6 1.4 1992 ............................................... 117.9 119.3 121.0 122.5 1.0 1.2 1.4 1.2 1993 ............................................... 123.9 125.4 126.4 127.8 1.1 1.2 .8 1.1 1994 ............................................... 129.7 130.7 132.1 132.7 1.5 .8 1.1 .5 1995 ............................................... 133.7 134.6 135.3 135.6 .8 .7 .5 .2 1996 ............................................... 135.8 136.6 137.4 138.2 .1 .6 .6 .6 1997 ............................................... 138.8 139.4 140.1 141.8 .4 .4 .5 1.2 1998 ............................................... 142.6 143.8 144.9 146.1 .6 .8 .8 .8 1999 ............................................... 146.2 147.9 149.3 151.0 .1 1.2 .9 1.1
1 Includes private industry and State and local governmentworkers and excludes farm, household, and Federal governmentworkers.
2 Excludes farm and household workers.3 Average standard errors (SE) for the unadjusted series,
upon which this series is based, exceeded 0.3 percent for3-month changes and 0.6 percent for 12-month changes for thefive years ending December 1996. All series will continue to be
published until further notice. To assist users in ascertaining thereliability of the series, SEs for estimates (excluding seasonallyadjusted series) for 1995-1999 are available in Appendix A.
4 Includes mining, construction, and manufacturing.5 Includes transportation, communication, and public utilities;
wholesale and retail trade; finance, insurance, and real estate;and service industries.
– Data not available.
26

Table 4. Total compensation,1 civilian workers: Employment Cost Index by occupational and industry group,1981-99
(Not seasonally adjusted)
Series and year
Indexes (June 1989=100) Percent changes for
March June Sept. Dec.3 months ended– 12 months ended–
March June Sept. Dec. March June Sept. Dec.
Civilian workers2: 1981 ....................................... – 67.2 68.9 70.2 – – 2.5 1.9 – – – – 1982 ....................................... 71.4 72.2 73.9 74.8 1.7 1.1 2.4 1.2 – 7.4 7.3 6.6 1983 ....................................... 76.0 76.9 78.2 79.1 1.6 1.2 1.7 1.2 6.4 6.5 5.8 5.7 1984 ....................................... 80.5 81.1 82.2 83.2 1.8 .7 1.4 1.2 5.9 5.5 5.1 5.2 1985 ....................................... 84.3 84.9 86.2 86.8 1.3 .7 1.5 .7 4.7 4.7 4.9 4.3 1986 ....................................... 87.7 88.3 89.3 89.9 1.0 .7 1.1 .7 4.0 4.0 3.6 3.6 1987 ....................................... 90.7 91.3 92.3 93.1 .9 .7 1.1 .9 3.4 3.4 3.4 3.6 1988 ....................................... 94.4 95.4 96.7 97.7 1.4 1.1 1.4 1.0 4.1 4.5 4.8 4.9 1989 ....................................... 98.9 100.0 101.6 102.6 1.2 1.1 1.6 1.0 4.8 4.8 5.1 5.0 1990 ....................................... 104.3 105.4 106.9 107.6 1.7 1.1 1.4 .7 5.5 5.4 5.2 4.9 1991 ....................................... 109.1 110.2 111.5 112.2 1.4 1.0 1.2 .6 4.6 4.6 4.3 4.3 1992 ....................................... 113.5 114.2 115.4 116.1 1.2 .6 1.1 .6 4.0 3.6 3.5 3.5 1993 ....................................... 117.5 118.3 119.5 120.2 1.2 .7 1.0 .6 3.5 3.6 3.6 3.5 1994 ....................................... 121.3 122.1 123.3 123.8 .9 .7 1.0 .4 3.2 3.2 3.2 3.0 1995 ....................................... 124.8 125.6 126.6 127.2 .8 .6 .8 .5 2.9 2.9 2.7 2.7 1996 ....................................... 128.3 129.2 130.2 130.9 .9 .7 .8 .5 2.8 2.9 2.8 2.9 1997 ....................................... 132.0 132.8 134.1 135.2 .8 .6 1.0 .8 2.9 2.8 3.0 3.3 1998 ....................................... 136.3 137.4 139.0 139.8 .8 .8 1.2 .6 3.3 3.5 3.7 3.4 1999 ....................................... 140.4 141.8 143.3 144.6 .4 1.0 1.1 .9 3.0 3.2 3.1 3.4
Civilian workers, excluding sales: 1981 ....................................... – 67.0 69.0 70.2 – – 3.0 1.7 – – – – 1982 ....................................... 71.4 72.3 74.1 74.9 1.7 1.3 2.5 1.1 – 7.9 7.4 6.7 1983 ....................................... 76.2 77.0 78.4 79.2 1.7 1.0 1.8 1.0 6.7 6.5 5.8 5.7 1984 ....................................... 80.6 81.3 82.4 83.4 1.8 .9 1.4 1.2 5.8 5.6 5.1 5.3 1985 ....................................... 84.3 84.9 86.3 86.7 1.1 .7 1.6 .5 4.6 4.4 4.7 4.0 1986 ....................................... 87.7 88.3 89.3 89.9 1.2 .7 1.1 .7 4.0 4.0 3.5 3.7 1987 ....................................... 90.8 91.4 92.6 93.3 1.0 .7 1.3 .8 3.5 3.5 3.7 3.8 1988 ....................................... 94.7 95.6 96.9 97.8 1.5 1.0 1.4 .9 4.3 4.6 4.6 4.8 1989 ....................................... 99.0 100.0 101.6 102.5 1.2 1.0 1.6 .9 4.5 4.6 4.9 4.8 1990 ....................................... 104.3 105.4 106.9 107.8 1.8 1.1 1.4 .8 5.4 5.4 5.2 5.2 1991 ....................................... 109.2 110.2 111.7 112.4 1.3 .9 1.4 .6 4.7 4.6 4.5 4.3 1992 ....................................... 113.6 114.4 115.7 116.4 1.1 .7 1.1 .6 4.0 3.8 3.6 3.6 1993 ....................................... 117.9 118.7 119.8 120.5 1.3 .7 .9 .6 3.8 3.8 3.5 3.5 1994 ....................................... 121.6 122.4 123.7 124.2 .9 .7 1.1 .4 3.1 3.1 3.3 3.1 1995 ....................................... 125.2 125.9 126.9 127.5 .8 .6 .8 .5 3.0 2.9 2.6 2.7 1996 ....................................... 128.6 129.4 130.5 131.2 .9 .6 .9 .5 2.7 2.8 2.8 2.9 1997 ....................................... 132.1 133.0 134.2 135.3 .7 .7 .9 .8 2.7 2.8 2.8 3.1 1998 ....................................... 136.4 137.4 138.8 139.5 .8 .7 1.0 .5 3.3 3.3 3.4 3.1 1999 ....................................... 140.5 141.7 143.2 144.5 .7 .9 1.1 .9 3.0 3.1 3.2 3.6
White-collar occupations: 1981 ....................................... – 65.2 66.9 68.4 – – 2.6 2.2 – – – – 1982 ....................................... 69.4 70.2 72.2 72.9 1.5 1.2 2.8 1.0 – 7.7 7.9 6.6 1983 ....................................... 74.1 74.9 76.7 77.5 1.6 1.1 2.4 1.0 6.8 6.7 6.2 6.3 1984 ....................................... 78.8 79.6 80.8 81.8 1.7 1.0 1.5 1.2 6.3 6.3 5.3 5.5 1985 ....................................... 83.0 83.6 85.2 85.8 1.5 .7 1.9 .7 5.3 5.0 5.4 4.9 1986 ....................................... 86.8 87.5 88.7 89.2 1.2 .8 1.4 .6 4.6 4.7 4.1 4.0 1987 ....................................... 90.3 90.8 92.0 92.7 1.2 .6 1.3 .8 4.0 3.8 3.7 3.9 1988 ....................................... 94.0 95.0 96.4 97.6 1.4 1.1 1.5 1.2 4.1 4.6 4.8 5.3 1989 ....................................... 99.0 100.0 102.0 102.9 1.4 1.0 2.0 .9 5.3 5.3 5.8 5.4 1990 ....................................... 104.6 105.8 107.5 108.3 1.7 1.1 1.6 .7 5.7 5.8 5.4 5.2 1991 ....................................... 109.8 110.8 112.1 112.8 1.4 .9 1.2 .6 5.0 4.7 4.3 4.2 1992 ....................................... 113.9 114.6 115.8 116.6 1.0 .6 1.0 .7 3.7 3.4 3.3 3.4 1993 ....................................... 117.9 118.6 119.9 120.6 1.1 .6 1.1 .6 3.5 3.5 3.5 3.4 1994 ....................................... 121.8 122.6 123.9 124.4 1.0 .7 1.1 .4 3.3 3.4 3.3 3.2 1995 ....................................... 125.5 126.3 127.4 128.0 .9 .6 .9 .5 3.0 3.0 2.8 2.9 1996 ....................................... 129.1 130.0 131.3 131.9 .9 .7 1.0 .5 2.9 2.9 3.1 3.0
See footnotes at end of table.
27
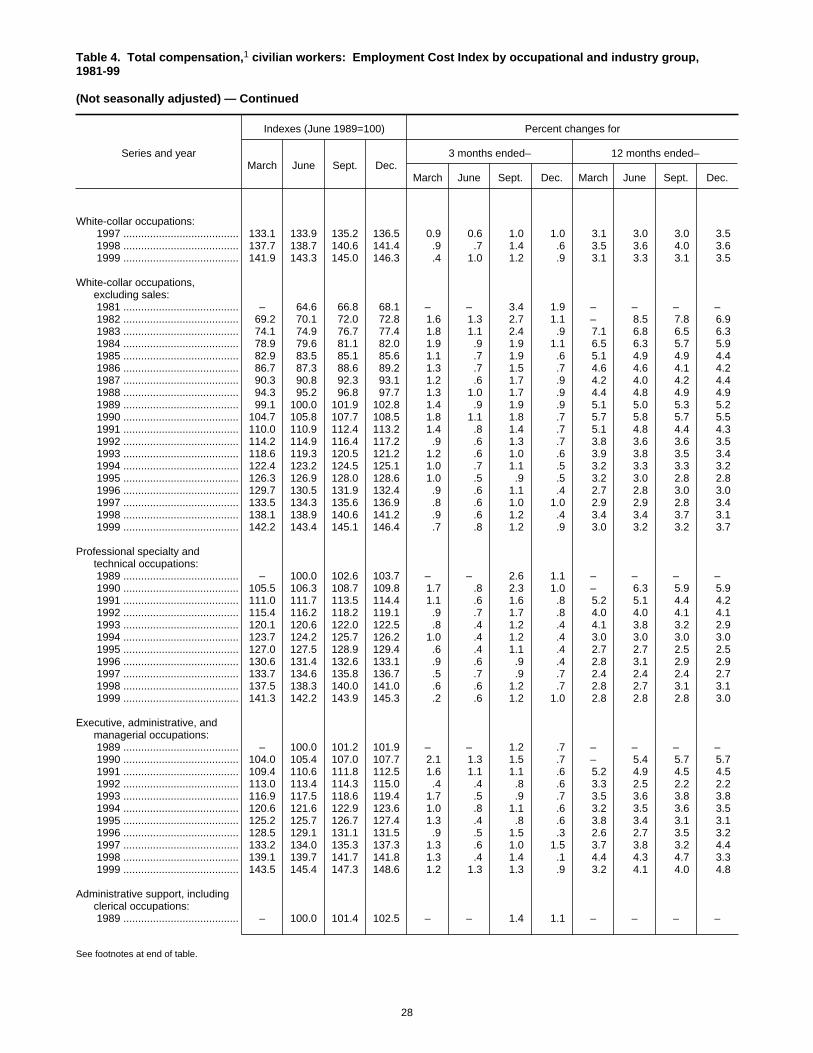
Table 4. Total compensation,1 civilian workers: Employment Cost Index by occupational and industry group,1981-99
(Not seasonally adjusted) — Continued
Series and year
Indexes (June 1989=100) Percent changes for
March June Sept. Dec.3 months ended– 12 months ended–
March June Sept. Dec. March June Sept. Dec.
White-collar occupations: 1997 ....................................... 133.1 133.9 135.2 136.5 0.9 0.6 1.0 1.0 3.1 3.0 3.0 3.5 1998 ....................................... 137.7 138.7 140.6 141.4 .9 .7 1.4 .6 3.5 3.6 4.0 3.6 1999 ....................................... 141.9 143.3 145.0 146.3 .4 1.0 1.2 .9 3.1 3.3 3.1 3.5
White-collar occupations,excluding sales:
1981 ....................................... – 64.6 66.8 68.1 – – 3.4 1.9 – – – – 1982 ....................................... 69.2 70.1 72.0 72.8 1.6 1.3 2.7 1.1 – 8.5 7.8 6.9 1983 ....................................... 74.1 74.9 76.7 77.4 1.8 1.1 2.4 .9 7.1 6.8 6.5 6.3 1984 ....................................... 78.9 79.6 81.1 82.0 1.9 .9 1.9 1.1 6.5 6.3 5.7 5.9 1985 ....................................... 82.9 83.5 85.1 85.6 1.1 .7 1.9 .6 5.1 4.9 4.9 4.4 1986 ....................................... 86.7 87.3 88.6 89.2 1.3 .7 1.5 .7 4.6 4.6 4.1 4.2 1987 ....................................... 90.3 90.8 92.3 93.1 1.2 .6 1.7 .9 4.2 4.0 4.2 4.4 1988 ....................................... 94.3 95.2 96.8 97.7 1.3 1.0 1.7 .9 4.4 4.8 4.9 4.9 1989 ....................................... 99.1 100.0 101.9 102.8 1.4 .9 1.9 .9 5.1 5.0 5.3 5.2 1990 ....................................... 104.7 105.8 107.7 108.5 1.8 1.1 1.8 .7 5.7 5.8 5.7 5.5 1991 ....................................... 110.0 110.9 112.4 113.2 1.4 .8 1.4 .7 5.1 4.8 4.4 4.3 1992 ....................................... 114.2 114.9 116.4 117.2 .9 .6 1.3 .7 3.8 3.6 3.6 3.5 1993 ....................................... 118.6 119.3 120.5 121.2 1.2 .6 1.0 .6 3.9 3.8 3.5 3.4 1994 ....................................... 122.4 123.2 124.5 125.1 1.0 .7 1.1 .5 3.2 3.3 3.3 3.2 1995 ....................................... 126.3 126.9 128.0 128.6 1.0 .5 .9 .5 3.2 3.0 2.8 2.8 1996 ....................................... 129.7 130.5 131.9 132.4 .9 .6 1.1 .4 2.7 2.8 3.0 3.0 1997 ....................................... 133.5 134.3 135.6 136.9 .8 .6 1.0 1.0 2.9 2.9 2.8 3.4 1998 ....................................... 138.1 138.9 140.6 141.2 .9 .6 1.2 .4 3.4 3.4 3.7 3.1 1999 ....................................... 142.2 143.4 145.1 146.4 .7 .8 1.2 .9 3.0 3.2 3.2 3.7
Professional specialty andtechnical occupations:
1989 ....................................... – 100.0 102.6 103.7 – – 2.6 1.1 – – – – 1990 ....................................... 105.5 106.3 108.7 109.8 1.7 .8 2.3 1.0 – 6.3 5.9 5.9 1991 ....................................... 111.0 111.7 113.5 114.4 1.1 .6 1.6 .8 5.2 5.1 4.4 4.2 1992 ....................................... 115.4 116.2 118.2 119.1 .9 .7 1.7 .8 4.0 4.0 4.1 4.1 1993 ....................................... 120.1 120.6 122.0 122.5 .8 .4 1.2 .4 4.1 3.8 3.2 2.9 1994 ....................................... 123.7 124.2 125.7 126.2 1.0 .4 1.2 .4 3.0 3.0 3.0 3.0 1995 ....................................... 127.0 127.5 128.9 129.4 .6 .4 1.1 .4 2.7 2.7 2.5 2.5 1996 ....................................... 130.6 131.4 132.6 133.1 .9 .6 .9 .4 2.8 3.1 2.9 2.9 1997 ....................................... 133.7 134.6 135.8 136.7 .5 .7 .9 .7 2.4 2.4 2.4 2.7 1998 ....................................... 137.5 138.3 140.0 141.0 .6 .6 1.2 .7 2.8 2.7 3.1 3.1 1999 ....................................... 141.3 142.2 143.9 145.3 .2 .6 1.2 1.0 2.8 2.8 2.8 3.0
Executive, administrative, andmanagerial occupations:
1989 ....................................... – 100.0 101.2 101.9 – – 1.2 .7 – – – – 1990 ....................................... 104.0 105.4 107.0 107.7 2.1 1.3 1.5 .7 – 5.4 5.7 5.7 1991 ....................................... 109.4 110.6 111.8 112.5 1.6 1.1 1.1 .6 5.2 4.9 4.5 4.5 1992 ....................................... 113.0 113.4 114.3 115.0 .4 .4 .8 .6 3.3 2.5 2.2 2.2 1993 ....................................... 116.9 117.5 118.6 119.4 1.7 .5 .9 .7 3.5 3.6 3.8 3.8 1994 ....................................... 120.6 121.6 122.9 123.6 1.0 .8 1.1 .6 3.2 3.5 3.6 3.5 1995 ....................................... 125.2 125.7 126.7 127.4 1.3 .4 .8 .6 3.8 3.4 3.1 3.1 1996 ....................................... 128.5 129.1 131.1 131.5 .9 .5 1.5 .3 2.6 2.7 3.5 3.2 1997 ....................................... 133.2 134.0 135.3 137.3 1.3 .6 1.0 1.5 3.7 3.8 3.2 4.4 1998 ....................................... 139.1 139.7 141.7 141.8 1.3 .4 1.4 .1 4.4 4.3 4.7 3.3 1999 ....................................... 143.5 145.4 147.3 148.6 1.2 1.3 1.3 .9 3.2 4.1 4.0 4.8
Administrative support, includingclerical occupations:
1989 ....................................... – 100.0 101.4 102.5 – – 1.4 1.1 – – – –
See footnotes at end of table.
28
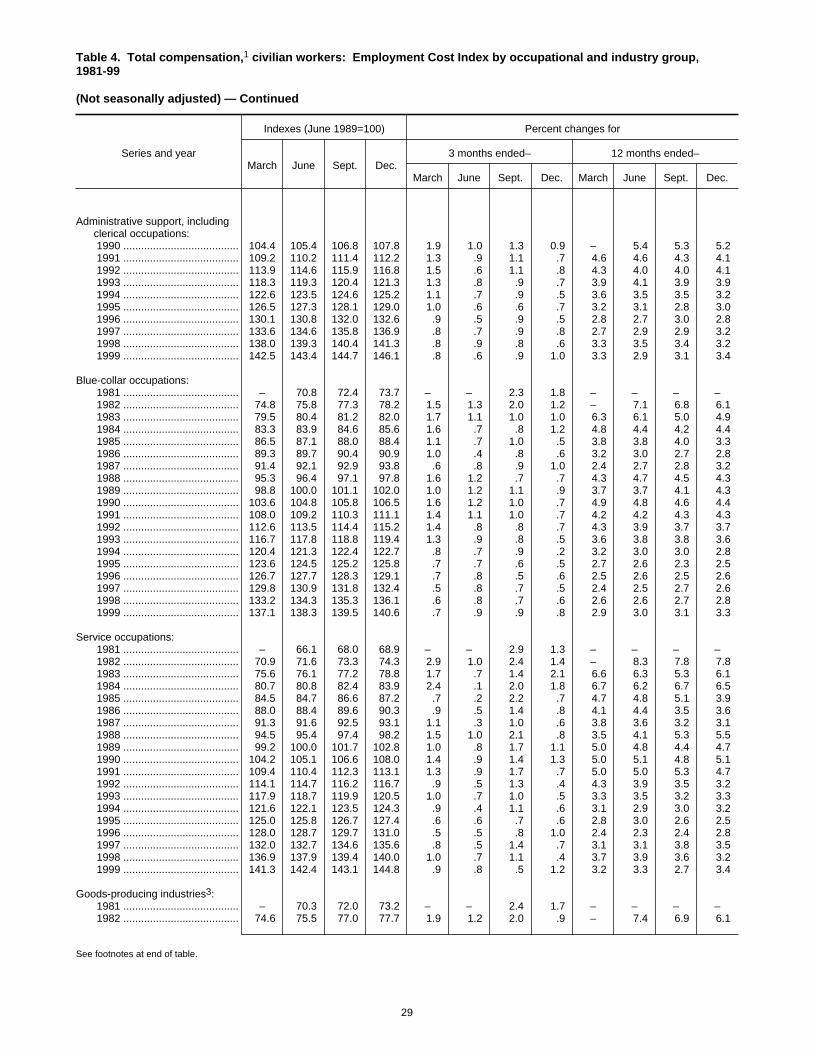
Table 4. Total compensation,1 civilian workers: Employment Cost Index by occupational and industry group,1981-99
(Not seasonally adjusted) — Continued
Series and year
Indexes (June 1989=100) Percent changes for
March June Sept. Dec.3 months ended– 12 months ended–
March June Sept. Dec. March June Sept. Dec.
Administrative support, includingclerical occupations:
1990 ....................................... 104.4 105.4 106.8 107.8 1.9 1.0 1.3 0.9 – 5.4 5.3 5.2 1991 ....................................... 109.2 110.2 111.4 112.2 1.3 .9 1.1 .7 4.6 4.6 4.3 4.1 1992 ....................................... 113.9 114.6 115.9 116.8 1.5 .6 1.1 .8 4.3 4.0 4.0 4.1 1993 ....................................... 118.3 119.3 120.4 121.3 1.3 .8 .9 .7 3.9 4.1 3.9 3.9 1994 ....................................... 122.6 123.5 124.6 125.2 1.1 .7 .9 .5 3.6 3.5 3.5 3.2 1995 ....................................... 126.5 127.3 128.1 129.0 1.0 .6 .6 .7 3.2 3.1 2.8 3.0 1996 ....................................... 130.1 130.8 132.0 132.6 .9 .5 .9 .5 2.8 2.7 3.0 2.8 1997 ....................................... 133.6 134.6 135.8 136.9 .8 .7 .9 .8 2.7 2.9 2.9 3.2 1998 ....................................... 138.0 139.3 140.4 141.3 .8 .9 .8 .6 3.3 3.5 3.4 3.2 1999 ....................................... 142.5 143.4 144.7 146.1 .8 .6 .9 1.0 3.3 2.9 3.1 3.4
Blue-collar occupations: 1981 ....................................... – 70.8 72.4 73.7 – – 2.3 1.8 – – – – 1982 ....................................... 74.8 75.8 77.3 78.2 1.5 1.3 2.0 1.2 – 7.1 6.8 6.1 1983 ....................................... 79.5 80.4 81.2 82.0 1.7 1.1 1.0 1.0 6.3 6.1 5.0 4.9 1984 ....................................... 83.3 83.9 84.6 85.6 1.6 .7 .8 1.2 4.8 4.4 4.2 4.4 1985 ....................................... 86.5 87.1 88.0 88.4 1.1 .7 1.0 .5 3.8 3.8 4.0 3.3 1986 ....................................... 89.3 89.7 90.4 90.9 1.0 .4 .8 .6 3.2 3.0 2.7 2.8 1987 ....................................... 91.4 92.1 92.9 93.8 .6 .8 .9 1.0 2.4 2.7 2.8 3.2 1988 ....................................... 95.3 96.4 97.1 97.8 1.6 1.2 .7 .7 4.3 4.7 4.5 4.3 1989 ....................................... 98.8 100.0 101.1 102.0 1.0 1.2 1.1 .9 3.7 3.7 4.1 4.3 1990 ....................................... 103.6 104.8 105.8 106.5 1.6 1.2 1.0 .7 4.9 4.8 4.6 4.4 1991 ....................................... 108.0 109.2 110.3 111.1 1.4 1.1 1.0 .7 4.2 4.2 4.3 4.3 1992 ....................................... 112.6 113.5 114.4 115.2 1.4 .8 .8 .7 4.3 3.9 3.7 3.7 1993 ....................................... 116.7 117.8 118.8 119.4 1.3 .9 .8 .5 3.6 3.8 3.8 3.6 1994 ....................................... 120.4 121.3 122.4 122.7 .8 .7 .9 .2 3.2 3.0 3.0 2.8 1995 ....................................... 123.6 124.5 125.2 125.8 .7 .7 .6 .5 2.7 2.6 2.3 2.5 1996 ....................................... 126.7 127.7 128.3 129.1 .7 .8 .5 .6 2.5 2.6 2.5 2.6 1997 ....................................... 129.8 130.9 131.8 132.4 .5 .8 .7 .5 2.4 2.5 2.7 2.6 1998 ....................................... 133.2 134.3 135.3 136.1 .6 .8 .7 .6 2.6 2.6 2.7 2.8 1999 ....................................... 137.1 138.3 139.5 140.6 .7 .9 .9 .8 2.9 3.0 3.1 3.3
Service occupations: 1981 ....................................... – 66.1 68.0 68.9 – – 2.9 1.3 – – – – 1982 ....................................... 70.9 71.6 73.3 74.3 2.9 1.0 2.4 1.4 – 8.3 7.8 7.8 1983 ....................................... 75.6 76.1 77.2 78.8 1.7 .7 1.4 2.1 6.6 6.3 5.3 6.1 1984 ....................................... 80.7 80.8 82.4 83.9 2.4 .1 2.0 1.8 6.7 6.2 6.7 6.5 1985 ....................................... 84.5 84.7 86.6 87.2 .7 .2 2.2 .7 4.7 4.8 5.1 3.9 1986 ....................................... 88.0 88.4 89.6 90.3 .9 .5 1.4 .8 4.1 4.4 3.5 3.6 1987 ....................................... 91.3 91.6 92.5 93.1 1.1 .3 1.0 .6 3.8 3.6 3.2 3.1 1988 ....................................... 94.5 95.4 97.4 98.2 1.5 1.0 2.1 .8 3.5 4.1 5.3 5.5 1989 ....................................... 99.2 100.0 101.7 102.8 1.0 .8 1.7 1.1 5.0 4.8 4.4 4.7 1990 ....................................... 104.2 105.1 106.6 108.0 1.4 .9 1.4 1.3 5.0 5.1 4.8 5.1 1991 ....................................... 109.4 110.4 112.3 113.1 1.3 .9 1.7 .7 5.0 5.0 5.3 4.7 1992 ....................................... 114.1 114.7 116.2 116.7 .9 .5 1.3 .4 4.3 3.9 3.5 3.2 1993 ....................................... 117.9 118.7 119.9 120.5 1.0 .7 1.0 .5 3.3 3.5 3.2 3.3 1994 ....................................... 121.6 122.1 123.5 124.3 .9 .4 1.1 .6 3.1 2.9 3.0 3.2 1995 ....................................... 125.0 125.8 126.7 127.4 .6 .6 .7 .6 2.8 3.0 2.6 2.5 1996 ....................................... 128.0 128.7 129.7 131.0 .5 .5 .8 1.0 2.4 2.3 2.4 2.8 1997 ....................................... 132.0 132.7 134.6 135.6 .8 .5 1.4 .7 3.1 3.1 3.8 3.5 1998 ....................................... 136.9 137.9 139.4 140.0 1.0 .7 1.1 .4 3.7 3.9 3.6 3.2 1999 ....................................... 141.3 142.4 143.1 144.8 .9 .8 .5 1.2 3.2 3.3 2.7 3.4
Goods-producing industries3: 1981 ....................................... – 70.3 72.0 73.2 – – 2.4 1.7 – – – – 1982 ....................................... 74.6 75.5 77.0 77.7 1.9 1.2 2.0 .9 – 7.4 6.9 6.1
See footnotes at end of table.
29
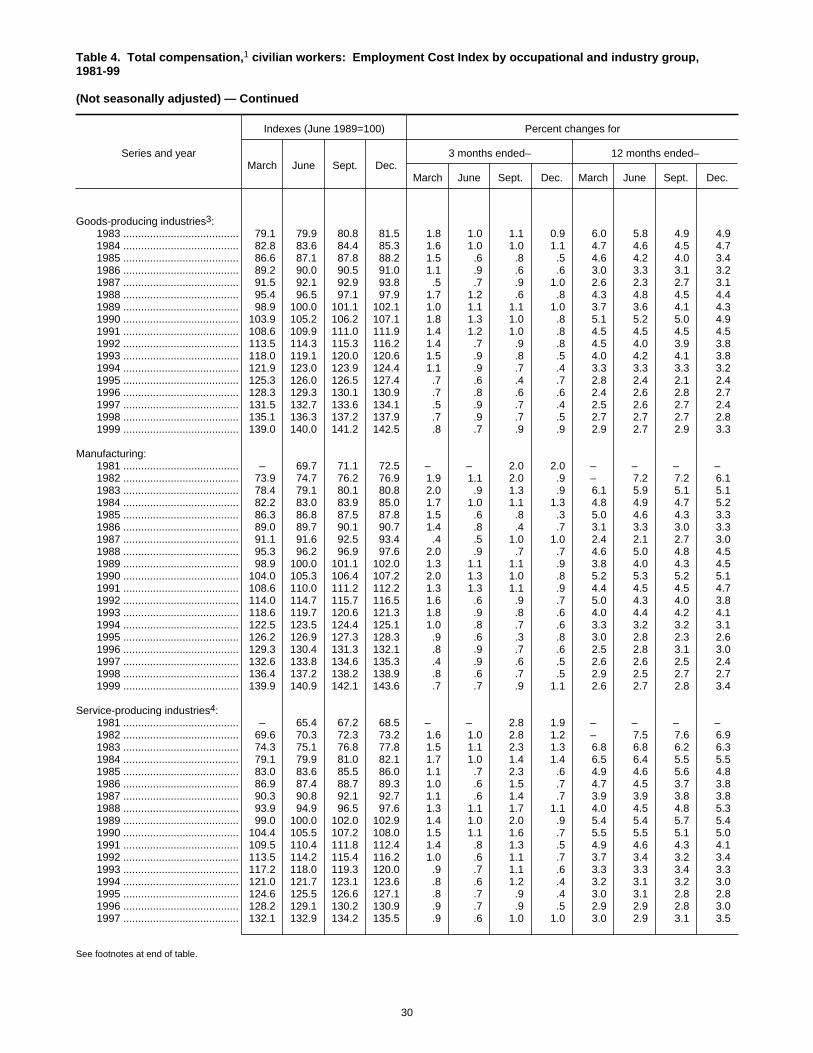
Table 4. Total compensation,1 civilian workers: Employment Cost Index by occupational and industry group,1981-99
(Not seasonally adjusted) — Continued
Series and year
Indexes (June 1989=100) Percent changes for
March June Sept. Dec.3 months ended– 12 months ended–
March June Sept. Dec. March June Sept. Dec.
Goods-producing industries3: 1983 ....................................... 79.1 79.9 80.8 81.5 1.8 1.0 1.1 0.9 6.0 5.8 4.9 4.9 1984 ....................................... 82.8 83.6 84.4 85.3 1.6 1.0 1.0 1.1 4.7 4.6 4.5 4.7 1985 ....................................... 86.6 87.1 87.8 88.2 1.5 .6 .8 .5 4.6 4.2 4.0 3.4 1986 ....................................... 89.2 90.0 90.5 91.0 1.1 .9 .6 .6 3.0 3.3 3.1 3.2 1987 ....................................... 91.5 92.1 92.9 93.8 .5 .7 .9 1.0 2.6 2.3 2.7 3.1 1988 ....................................... 95.4 96.5 97.1 97.9 1.7 1.2 .6 .8 4.3 4.8 4.5 4.4 1989 ....................................... 98.9 100.0 101.1 102.1 1.0 1.1 1.1 1.0 3.7 3.6 4.1 4.3 1990 ....................................... 103.9 105.2 106.2 107.1 1.8 1.3 1.0 .8 5.1 5.2 5.0 4.9 1991 ....................................... 108.6 109.9 111.0 111.9 1.4 1.2 1.0 .8 4.5 4.5 4.5 4.5 1992 ....................................... 113.5 114.3 115.3 116.2 1.4 .7 .9 .8 4.5 4.0 3.9 3.8 1993 ....................................... 118.0 119.1 120.0 120.6 1.5 .9 .8 .5 4.0 4.2 4.1 3.8 1994 ....................................... 121.9 123.0 123.9 124.4 1.1 .9 .7 .4 3.3 3.3 3.3 3.2 1995 ....................................... 125.3 126.0 126.5 127.4 .7 .6 .4 .7 2.8 2.4 2.1 2.4 1996 ....................................... 128.3 129.3 130.1 130.9 .7 .8 .6 .6 2.4 2.6 2.8 2.7 1997 ....................................... 131.5 132.7 133.6 134.1 .5 .9 .7 .4 2.5 2.6 2.7 2.4 1998 ....................................... 135.1 136.3 137.2 137.9 .7 .9 .7 .5 2.7 2.7 2.7 2.8 1999 ....................................... 139.0 140.0 141.2 142.5 .8 .7 .9 .9 2.9 2.7 2.9 3.3
Manufacturing: 1981 ....................................... – 69.7 71.1 72.5 – – 2.0 2.0 – – – – 1982 ....................................... 73.9 74.7 76.2 76.9 1.9 1.1 2.0 .9 – 7.2 7.2 6.1 1983 ....................................... 78.4 79.1 80.1 80.8 2.0 .9 1.3 .9 6.1 5.9 5.1 5.1 1984 ....................................... 82.2 83.0 83.9 85.0 1.7 1.0 1.1 1.3 4.8 4.9 4.7 5.2 1985 ....................................... 86.3 86.8 87.5 87.8 1.5 .6 .8 .3 5.0 4.6 4.3 3.3 1986 ....................................... 89.0 89.7 90.1 90.7 1.4 .8 .4 .7 3.1 3.3 3.0 3.3 1987 ....................................... 91.1 91.6 92.5 93.4 .4 .5 1.0 1.0 2.4 2.1 2.7 3.0 1988 ....................................... 95.3 96.2 96.9 97.6 2.0 .9 .7 .7 4.6 5.0 4.8 4.5 1989 ....................................... 98.9 100.0 101.1 102.0 1.3 1.1 1.1 .9 3.8 4.0 4.3 4.5 1990 ....................................... 104.0 105.3 106.4 107.2 2.0 1.3 1.0 .8 5.2 5.3 5.2 5.1 1991 ....................................... 108.6 110.0 111.2 112.2 1.3 1.3 1.1 .9 4.4 4.5 4.5 4.7 1992 ....................................... 114.0 114.7 115.7 116.5 1.6 .6 .9 .7 5.0 4.3 4.0 3.8 1993 ....................................... 118.6 119.7 120.6 121.3 1.8 .9 .8 .6 4.0 4.4 4.2 4.1 1994 ....................................... 122.5 123.5 124.4 125.1 1.0 .8 .7 .6 3.3 3.2 3.2 3.1 1995 ....................................... 126.2 126.9 127.3 128.3 .9 .6 .3 .8 3.0 2.8 2.3 2.6 1996 ....................................... 129.3 130.4 131.3 132.1 .8 .9 .7 .6 2.5 2.8 3.1 3.0 1997 ....................................... 132.6 133.8 134.6 135.3 .4 .9 .6 .5 2.6 2.6 2.5 2.4 1998 ....................................... 136.4 137.2 138.2 138.9 .8 .6 .7 .5 2.9 2.5 2.7 2.7 1999 ....................................... 139.9 140.9 142.1 143.6 .7 .7 .9 1.1 2.6 2.7 2.8 3.4
Service-producing industries4: 1981 ....................................... – 65.4 67.2 68.5 – – 2.8 1.9 – – – – 1982 ....................................... 69.6 70.3 72.3 73.2 1.6 1.0 2.8 1.2 – 7.5 7.6 6.9 1983 ....................................... 74.3 75.1 76.8 77.8 1.5 1.1 2.3 1.3 6.8 6.8 6.2 6.3 1984 ....................................... 79.1 79.9 81.0 82.1 1.7 1.0 1.4 1.4 6.5 6.4 5.5 5.5 1985 ....................................... 83.0 83.6 85.5 86.0 1.1 .7 2.3 .6 4.9 4.6 5.6 4.8 1986 ....................................... 86.9 87.4 88.7 89.3 1.0 .6 1.5 .7 4.7 4.5 3.7 3.8 1987 ....................................... 90.3 90.8 92.1 92.7 1.1 .6 1.4 .7 3.9 3.9 3.8 3.8 1988 ....................................... 93.9 94.9 96.5 97.6 1.3 1.1 1.7 1.1 4.0 4.5 4.8 5.3 1989 ....................................... 99.0 100.0 102.0 102.9 1.4 1.0 2.0 .9 5.4 5.4 5.7 5.4 1990 ....................................... 104.4 105.5 107.2 108.0 1.5 1.1 1.6 .7 5.5 5.5 5.1 5.0 1991 ....................................... 109.5 110.4 111.8 112.4 1.4 .8 1.3 .5 4.9 4.6 4.3 4.1 1992 ....................................... 113.5 114.2 115.4 116.2 1.0 .6 1.1 .7 3.7 3.4 3.2 3.4 1993 ....................................... 117.2 118.0 119.3 120.0 .9 .7 1.1 .6 3.3 3.3 3.4 3.3 1994 ....................................... 121.0 121.7 123.1 123.6 .8 .6 1.2 .4 3.2 3.1 3.2 3.0 1995 ....................................... 124.6 125.5 126.6 127.1 .8 .7 .9 .4 3.0 3.1 2.8 2.8 1996 ....................................... 128.2 129.1 130.2 130.9 .9 .7 .9 .5 2.9 2.9 2.8 3.0 1997 ....................................... 132.1 132.9 134.2 135.5 .9 .6 1.0 1.0 3.0 2.9 3.1 3.5
See footnotes at end of table.
30
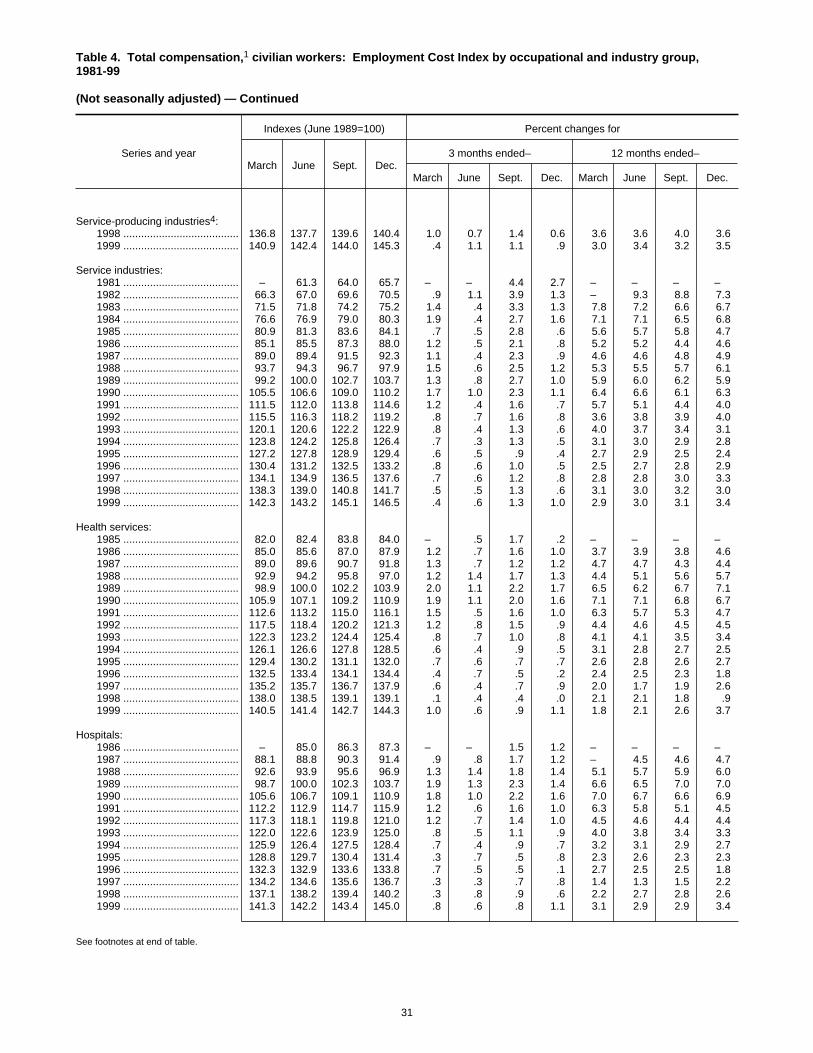
Table 4. Total compensation,1 civilian workers: Employment Cost Index by occupational and industry group,1981-99
(Not seasonally adjusted) — Continued
Series and year
Indexes (June 1989=100) Percent changes for
March June Sept. Dec.3 months ended– 12 months ended–
March June Sept. Dec. March June Sept. Dec.
Service-producing industries4: 1998 ....................................... 136.8 137.7 139.6 140.4 1.0 0.7 1.4 0.6 3.6 3.6 4.0 3.6 1999 ....................................... 140.9 142.4 144.0 145.3 .4 1.1 1.1 .9 3.0 3.4 3.2 3.5
Service industries: 1981 ....................................... – 61.3 64.0 65.7 – – 4.4 2.7 – – – – 1982 ....................................... 66.3 67.0 69.6 70.5 .9 1.1 3.9 1.3 – 9.3 8.8 7.3 1983 ....................................... 71.5 71.8 74.2 75.2 1.4 .4 3.3 1.3 7.8 7.2 6.6 6.7 1984 ....................................... 76.6 76.9 79.0 80.3 1.9 .4 2.7 1.6 7.1 7.1 6.5 6.8 1985 ....................................... 80.9 81.3 83.6 84.1 .7 .5 2.8 .6 5.6 5.7 5.8 4.7 1986 ....................................... 85.1 85.5 87.3 88.0 1.2 .5 2.1 .8 5.2 5.2 4.4 4.6 1987 ....................................... 89.0 89.4 91.5 92.3 1.1 .4 2.3 .9 4.6 4.6 4.8 4.9 1988 ....................................... 93.7 94.3 96.7 97.9 1.5 .6 2.5 1.2 5.3 5.5 5.7 6.1 1989 ....................................... 99.2 100.0 102.7 103.7 1.3 .8 2.7 1.0 5.9 6.0 6.2 5.9 1990 ....................................... 105.5 106.6 109.0 110.2 1.7 1.0 2.3 1.1 6.4 6.6 6.1 6.3 1991 ....................................... 111.5 112.0 113.8 114.6 1.2 .4 1.6 .7 5.7 5.1 4.4 4.0 1992 ....................................... 115.5 116.3 118.2 119.2 .8 .7 1.6 .8 3.6 3.8 3.9 4.0 1993 ....................................... 120.1 120.6 122.2 122.9 .8 .4 1.3 .6 4.0 3.7 3.4 3.1 1994 ....................................... 123.8 124.2 125.8 126.4 .7 .3 1.3 .5 3.1 3.0 2.9 2.8 1995 ....................................... 127.2 127.8 128.9 129.4 .6 .5 .9 .4 2.7 2.9 2.5 2.4 1996 ....................................... 130.4 131.2 132.5 133.2 .8 .6 1.0 .5 2.5 2.7 2.8 2.9 1997 ....................................... 134.1 134.9 136.5 137.6 .7 .6 1.2 .8 2.8 2.8 3.0 3.3 1998 ....................................... 138.3 139.0 140.8 141.7 .5 .5 1.3 .6 3.1 3.0 3.2 3.0 1999 ....................................... 142.3 143.2 145.1 146.5 .4 .6 1.3 1.0 2.9 3.0 3.1 3.4
Health services: 1985 ....................................... 82.0 82.4 83.8 84.0 – .5 1.7 .2 – – – – 1986 ....................................... 85.0 85.6 87.0 87.9 1.2 .7 1.6 1.0 3.7 3.9 3.8 4.6 1987 ....................................... 89.0 89.6 90.7 91.8 1.3 .7 1.2 1.2 4.7 4.7 4.3 4.4 1988 ....................................... 92.9 94.2 95.8 97.0 1.2 1.4 1.7 1.3 4.4 5.1 5.6 5.7 1989 ....................................... 98.9 100.0 102.2 103.9 2.0 1.1 2.2 1.7 6.5 6.2 6.7 7.1 1990 ....................................... 105.9 107.1 109.2 110.9 1.9 1.1 2.0 1.6 7.1 7.1 6.8 6.7 1991 ....................................... 112.6 113.2 115.0 116.1 1.5 .5 1.6 1.0 6.3 5.7 5.3 4.7 1992 ....................................... 117.5 118.4 120.2 121.3 1.2 .8 1.5 .9 4.4 4.6 4.5 4.5 1993 ....................................... 122.3 123.2 124.4 125.4 .8 .7 1.0 .8 4.1 4.1 3.5 3.4 1994 ....................................... 126.1 126.6 127.8 128.5 .6 .4 .9 .5 3.1 2.8 2.7 2.5 1995 ....................................... 129.4 130.2 131.1 132.0 .7 .6 .7 .7 2.6 2.8 2.6 2.7 1996 ....................................... 132.5 133.4 134.1 134.4 .4 .7 .5 .2 2.4 2.5 2.3 1.8 1997 ....................................... 135.2 135.7 136.7 137.9 .6 .4 .7 .9 2.0 1.7 1.9 2.6 1998 ....................................... 138.0 138.5 139.1 139.1 .1 .4 .4 .0 2.1 2.1 1.8 .9 1999 ....................................... 140.5 141.4 142.7 144.3 1.0 .6 .9 1.1 1.8 2.1 2.6 3.7
Hospitals: 1986 ....................................... – 85.0 86.3 87.3 – – 1.5 1.2 – – – – 1987 ....................................... 88.1 88.8 90.3 91.4 .9 .8 1.7 1.2 – 4.5 4.6 4.7 1988 ....................................... 92.6 93.9 95.6 96.9 1.3 1.4 1.8 1.4 5.1 5.7 5.9 6.0 1989 ....................................... 98.7 100.0 102.3 103.7 1.9 1.3 2.3 1.4 6.6 6.5 7.0 7.0 1990 ....................................... 105.6 106.7 109.1 110.9 1.8 1.0 2.2 1.6 7.0 6.7 6.6 6.9 1991 ....................................... 112.2 112.9 114.7 115.9 1.2 .6 1.6 1.0 6.3 5.8 5.1 4.5 1992 ....................................... 117.3 118.1 119.8 121.0 1.2 .7 1.4 1.0 4.5 4.6 4.4 4.4 1993 ....................................... 122.0 122.6 123.9 125.0 .8 .5 1.1 .9 4.0 3.8 3.4 3.3 1994 ....................................... 125.9 126.4 127.5 128.4 .7 .4 .9 .7 3.2 3.1 2.9 2.7 1995 ....................................... 128.8 129.7 130.4 131.4 .3 .7 .5 .8 2.3 2.6 2.3 2.3 1996 ....................................... 132.3 132.9 133.6 133.8 .7 .5 .5 .1 2.7 2.5 2.5 1.8 1997 ....................................... 134.2 134.6 135.6 136.7 .3 .3 .7 .8 1.4 1.3 1.5 2.2 1998 ....................................... 137.1 138.2 139.4 140.2 .3 .8 .9 .6 2.2 2.7 2.8 2.6 1999 ....................................... 141.3 142.2 143.4 145.0 .8 .6 .8 1.1 3.1 2.9 2.9 3.4
See footnotes at end of table.
31
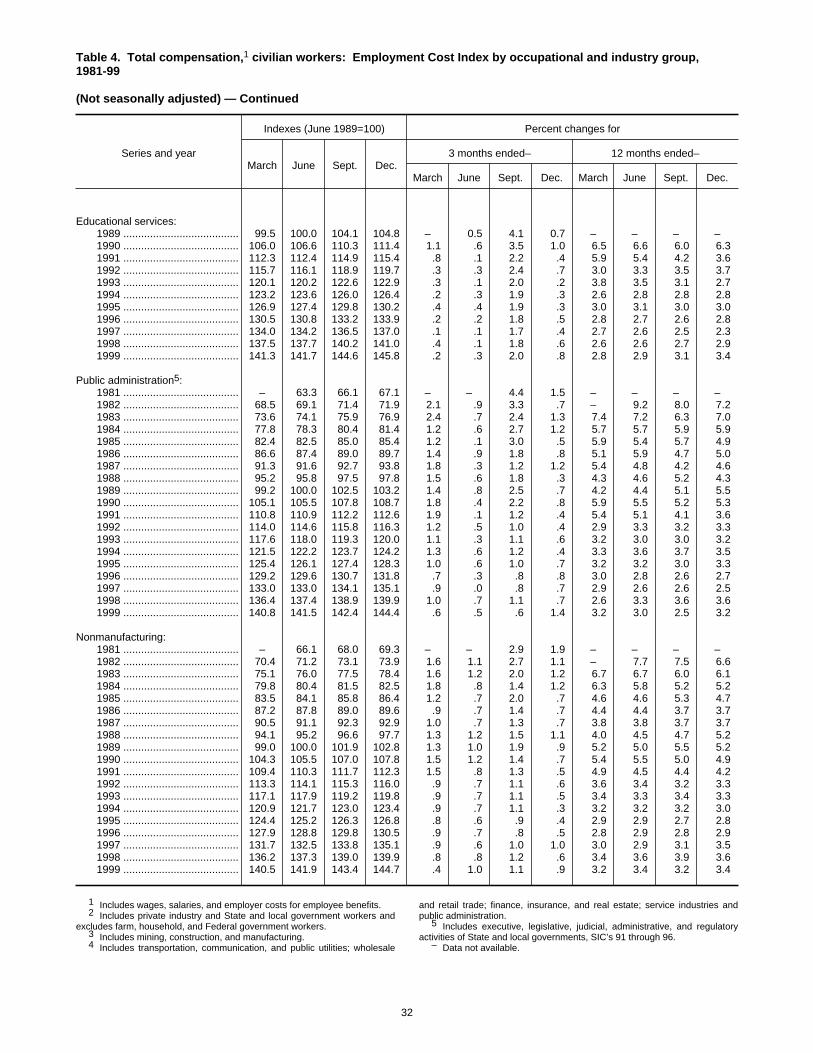
Table 4. Total compensation,1 civilian workers: Employment Cost Index by occupational and industry group,1981-99
(Not seasonally adjusted) — Continued
Series and year
Indexes (June 1989=100) Percent changes for
March June Sept. Dec.3 months ended– 12 months ended–
March June Sept. Dec. March June Sept. Dec.
Educational services: 1989 ....................................... 99.5 100.0 104.1 104.8 – 0.5 4.1 0.7 – – – – 1990 ....................................... 106.0 106.6 110.3 111.4 1.1 .6 3.5 1.0 6.5 6.6 6.0 6.3 1991 ....................................... 112.3 112.4 114.9 115.4 .8 .1 2.2 .4 5.9 5.4 4.2 3.6 1992 ....................................... 115.7 116.1 118.9 119.7 .3 .3 2.4 .7 3.0 3.3 3.5 3.7 1993 ....................................... 120.1 120.2 122.6 122.9 .3 .1 2.0 .2 3.8 3.5 3.1 2.7 1994 ....................................... 123.2 123.6 126.0 126.4 .2 .3 1.9 .3 2.6 2.8 2.8 2.8 1995 ....................................... 126.9 127.4 129.8 130.2 .4 .4 1.9 .3 3.0 3.1 3.0 3.0 1996 ....................................... 130.5 130.8 133.2 133.9 .2 .2 1.8 .5 2.8 2.7 2.6 2.8 1997 ....................................... 134.0 134.2 136.5 137.0 .1 .1 1.7 .4 2.7 2.6 2.5 2.3 1998 ....................................... 137.5 137.7 140.2 141.0 .4 .1 1.8 .6 2.6 2.6 2.7 2.9 1999 ....................................... 141.3 141.7 144.6 145.8 .2 .3 2.0 .8 2.8 2.9 3.1 3.4
Public administration5: 1981 ....................................... – 63.3 66.1 67.1 – – 4.4 1.5 – – – – 1982 ....................................... 68.5 69.1 71.4 71.9 2.1 .9 3.3 .7 – 9.2 8.0 7.2 1983 ....................................... 73.6 74.1 75.9 76.9 2.4 .7 2.4 1.3 7.4 7.2 6.3 7.0 1984 ....................................... 77.8 78.3 80.4 81.4 1.2 .6 2.7 1.2 5.7 5.7 5.9 5.9 1985 ....................................... 82.4 82.5 85.0 85.4 1.2 .1 3.0 .5 5.9 5.4 5.7 4.9 1986 ....................................... 86.6 87.4 89.0 89.7 1.4 .9 1.8 .8 5.1 5.9 4.7 5.0 1987 ....................................... 91.3 91.6 92.7 93.8 1.8 .3 1.2 1.2 5.4 4.8 4.2 4.6 1988 ....................................... 95.2 95.8 97.5 97.8 1.5 .6 1.8 .3 4.3 4.6 5.2 4.3 1989 ....................................... 99.2 100.0 102.5 103.2 1.4 .8 2.5 .7 4.2 4.4 5.1 5.5 1990 ....................................... 105.1 105.5 107.8 108.7 1.8 .4 2.2 .8 5.9 5.5 5.2 5.3 1991 ....................................... 110.8 110.9 112.2 112.6 1.9 .1 1.2 .4 5.4 5.1 4.1 3.6 1992 ....................................... 114.0 114.6 115.8 116.3 1.2 .5 1.0 .4 2.9 3.3 3.2 3.3 1993 ....................................... 117.6 118.0 119.3 120.0 1.1 .3 1.1 .6 3.2 3.0 3.0 3.2 1994 ....................................... 121.5 122.2 123.7 124.2 1.3 .6 1.2 .4 3.3 3.6 3.7 3.5 1995 ....................................... 125.4 126.1 127.4 128.3 1.0 .6 1.0 .7 3.2 3.2 3.0 3.3 1996 ....................................... 129.2 129.6 130.7 131.8 .7 .3 .8 .8 3.0 2.8 2.6 2.7 1997 ....................................... 133.0 133.0 134.1 135.1 .9 .0 .8 .7 2.9 2.6 2.6 2.5 1998 ....................................... 136.4 137.4 138.9 139.9 1.0 .7 1.1 .7 2.6 3.3 3.6 3.6 1999 ....................................... 140.8 141.5 142.4 144.4 .6 .5 .6 1.4 3.2 3.0 2.5 3.2
Nonmanufacturing: 1981 ....................................... – 66.1 68.0 69.3 – – 2.9 1.9 – – – – 1982 ....................................... 70.4 71.2 73.1 73.9 1.6 1.1 2.7 1.1 – 7.7 7.5 6.6 1983 ....................................... 75.1 76.0 77.5 78.4 1.6 1.2 2.0 1.2 6.7 6.7 6.0 6.1 1984 ....................................... 79.8 80.4 81.5 82.5 1.8 .8 1.4 1.2 6.3 5.8 5.2 5.2 1985 ....................................... 83.5 84.1 85.8 86.4 1.2 .7 2.0 .7 4.6 4.6 5.3 4.7 1986 ....................................... 87.2 87.8 89.0 89.6 .9 .7 1.4 .7 4.4 4.4 3.7 3.7 1987 ....................................... 90.5 91.1 92.3 92.9 1.0 .7 1.3 .7 3.8 3.8 3.7 3.7 1988 ....................................... 94.1 95.2 96.6 97.7 1.3 1.2 1.5 1.1 4.0 4.5 4.7 5.2 1989 ....................................... 99.0 100.0 101.9 102.8 1.3 1.0 1.9 .9 5.2 5.0 5.5 5.2 1990 ....................................... 104.3 105.5 107.0 107.8 1.5 1.2 1.4 .7 5.4 5.5 5.0 4.9 1991 ....................................... 109.4 110.3 111.7 112.3 1.5 .8 1.3 .5 4.9 4.5 4.4 4.2 1992 ....................................... 113.3 114.1 115.3 116.0 .9 .7 1.1 .6 3.6 3.4 3.2 3.3 1993 ....................................... 117.1 117.9 119.2 119.8 .9 .7 1.1 .5 3.4 3.3 3.4 3.3 1994 ....................................... 120.9 121.7 123.0 123.4 .9 .7 1.1 .3 3.2 3.2 3.2 3.0 1995 ....................................... 124.4 125.2 126.3 126.8 .8 .6 .9 .4 2.9 2.9 2.7 2.8 1996 ....................................... 127.9 128.8 129.8 130.5 .9 .7 .8 .5 2.8 2.9 2.8 2.9 1997 ....................................... 131.7 132.5 133.8 135.1 .9 .6 1.0 1.0 3.0 2.9 3.1 3.5 1998 ....................................... 136.2 137.3 139.0 139.9 .8 .8 1.2 .6 3.4 3.6 3.9 3.6 1999 ....................................... 140.5 141.9 143.4 144.7 .4 1.0 1.1 .9 3.2 3.4 3.2 3.4
1 Includes wages, salaries, and employer costs for employee benefits.2 Includes private industry and State and local government workers and
excludes farm, household, and Federal government workers.3 Includes mining, construction, and manufacturing.4 Includes transportation, communication, and public utilities; wholesale
and retail trade; finance, insurance, and real estate; service industries andpublic administration.
5 Includes executive, legislative, judicial, administrative, and regulatoryactivities of State and local governments, SIC’s 91 through 96.
– Data not available.
32
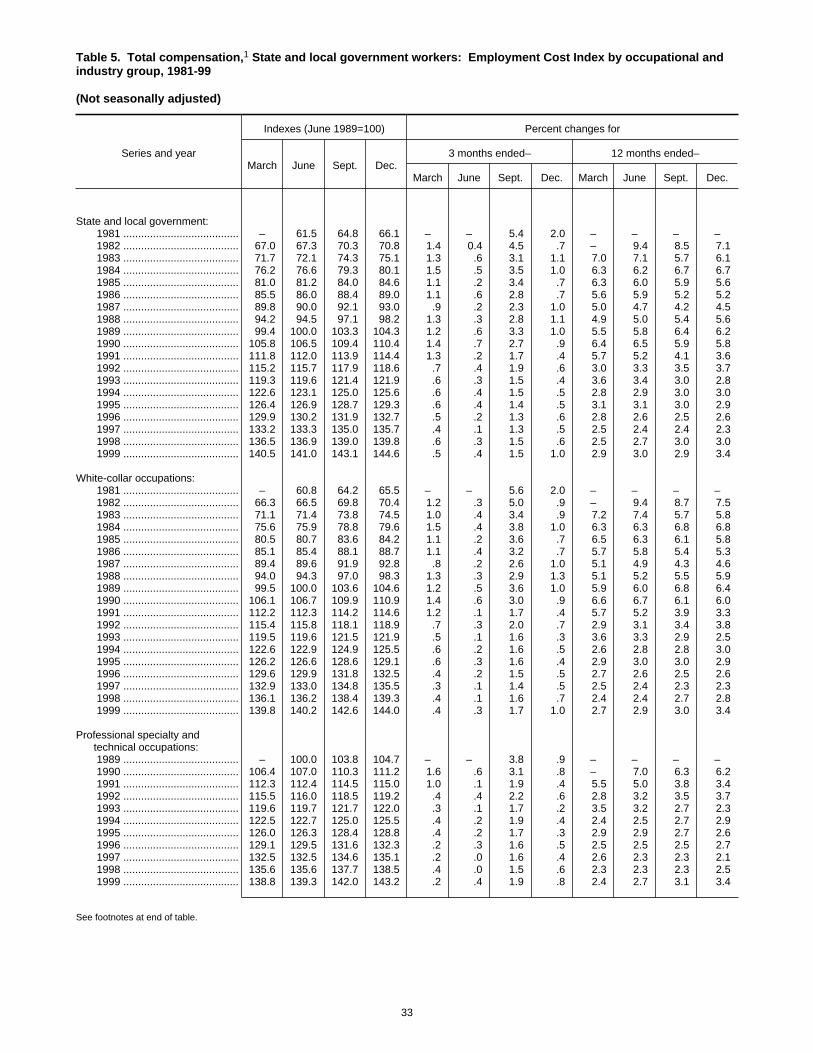
Table 5. Total compensation,1 State and local government workers: Employment Cost Index by occupational andindustry group, 1981-99
(Not seasonally adjusted)
Series and year
Indexes (June 1989=100) Percent changes for
March June Sept. Dec.3 months ended– 12 months ended–
March June Sept. Dec. March June Sept. Dec.
State and local government: 1981 ....................................... – 61.5 64.8 66.1 – – 5.4 2.0 – – – – 1982 ....................................... 67.0 67.3 70.3 70.8 1.4 0.4 4.5 .7 – 9.4 8.5 7.1 1983 ....................................... 71.7 72.1 74.3 75.1 1.3 .6 3.1 1.1 7.0 7.1 5.7 6.1 1984 ....................................... 76.2 76.6 79.3 80.1 1.5 .5 3.5 1.0 6.3 6.2 6.7 6.7 1985 ....................................... 81.0 81.2 84.0 84.6 1.1 .2 3.4 .7 6.3 6.0 5.9 5.6 1986 ....................................... 85.5 86.0 88.4 89.0 1.1 .6 2.8 .7 5.6 5.9 5.2 5.2 1987 ....................................... 89.8 90.0 92.1 93.0 .9 .2 2.3 1.0 5.0 4.7 4.2 4.5 1988 ....................................... 94.2 94.5 97.1 98.2 1.3 .3 2.8 1.1 4.9 5.0 5.4 5.6 1989 ....................................... 99.4 100.0 103.3 104.3 1.2 .6 3.3 1.0 5.5 5.8 6.4 6.2 1990 ....................................... 105.8 106.5 109.4 110.4 1.4 .7 2.7 .9 6.4 6.5 5.9 5.8 1991 ....................................... 111.8 112.0 113.9 114.4 1.3 .2 1.7 .4 5.7 5.2 4.1 3.6 1992 ....................................... 115.2 115.7 117.9 118.6 .7 .4 1.9 .6 3.0 3.3 3.5 3.7 1993 ....................................... 119.3 119.6 121.4 121.9 .6 .3 1.5 .4 3.6 3.4 3.0 2.8 1994 ....................................... 122.6 123.1 125.0 125.6 .6 .4 1.5 .5 2.8 2.9 3.0 3.0 1995 ....................................... 126.4 126.9 128.7 129.3 .6 .4 1.4 .5 3.1 3.1 3.0 2.9 1996 ....................................... 129.9 130.2 131.9 132.7 .5 .2 1.3 .6 2.8 2.6 2.5 2.6 1997 ....................................... 133.2 133.3 135.0 135.7 .4 .1 1.3 .5 2.5 2.4 2.4 2.3 1998 ....................................... 136.5 136.9 139.0 139.8 .6 .3 1.5 .6 2.5 2.7 3.0 3.0 1999 ....................................... 140.5 141.0 143.1 144.6 .5 .4 1.5 1.0 2.9 3.0 2.9 3.4
White-collar occupations: 1981 ....................................... – 60.8 64.2 65.5 – – 5.6 2.0 – – – – 1982 ....................................... 66.3 66.5 69.8 70.4 1.2 .3 5.0 .9 – 9.4 8.7 7.5 1983 ....................................... 71.1 71.4 73.8 74.5 1.0 .4 3.4 .9 7.2 7.4 5.7 5.8 1984 ....................................... 75.6 75.9 78.8 79.6 1.5 .4 3.8 1.0 6.3 6.3 6.8 6.8 1985 ....................................... 80.5 80.7 83.6 84.2 1.1 .2 3.6 .7 6.5 6.3 6.1 5.8 1986 ....................................... 85.1 85.4 88.1 88.7 1.1 .4 3.2 .7 5.7 5.8 5.4 5.3 1987 ....................................... 89.4 89.6 91.9 92.8 .8 .2 2.6 1.0 5.1 4.9 4.3 4.6 1988 ....................................... 94.0 94.3 97.0 98.3 1.3 .3 2.9 1.3 5.1 5.2 5.5 5.9 1989 ....................................... 99.5 100.0 103.6 104.6 1.2 .5 3.6 1.0 5.9 6.0 6.8 6.4 1990 ....................................... 106.1 106.7 109.9 110.9 1.4 .6 3.0 .9 6.6 6.7 6.1 6.0 1991 ....................................... 112.2 112.3 114.2 114.6 1.2 .1 1.7 .4 5.7 5.2 3.9 3.3 1992 ....................................... 115.4 115.8 118.1 118.9 .7 .3 2.0 .7 2.9 3.1 3.4 3.8 1993 ....................................... 119.5 119.6 121.5 121.9 .5 .1 1.6 .3 3.6 3.3 2.9 2.5 1994 ....................................... 122.6 122.9 124.9 125.5 .6 .2 1.6 .5 2.6 2.8 2.8 3.0 1995 ....................................... 126.2 126.6 128.6 129.1 .6 .3 1.6 .4 2.9 3.0 3.0 2.9 1996 ....................................... 129.6 129.9 131.8 132.5 .4 .2 1.5 .5 2.7 2.6 2.5 2.6 1997 ....................................... 132.9 133.0 134.8 135.5 .3 .1 1.4 .5 2.5 2.4 2.3 2.3 1998 ....................................... 136.1 136.2 138.4 139.3 .4 .1 1.6 .7 2.4 2.4 2.7 2.8 1999 ....................................... 139.8 140.2 142.6 144.0 .4 .3 1.7 1.0 2.7 2.9 3.0 3.4
Professional specialty andtechnical occupations:
1989 ....................................... – 100.0 103.8 104.7 – – 3.8 .9 – – – – 1990 ....................................... 106.4 107.0 110.3 111.2 1.6 .6 3.1 .8 – 7.0 6.3 6.2 1991 ....................................... 112.3 112.4 114.5 115.0 1.0 .1 1.9 .4 5.5 5.0 3.8 3.4 1992 ....................................... 115.5 116.0 118.5 119.2 .4 .4 2.2 .6 2.8 3.2 3.5 3.7 1993 ....................................... 119.6 119.7 121.7 122.0 .3 .1 1.7 .2 3.5 3.2 2.7 2.3 1994 ....................................... 122.5 122.7 125.0 125.5 .4 .2 1.9 .4 2.4 2.5 2.7 2.9 1995 ....................................... 126.0 126.3 128.4 128.8 .4 .2 1.7 .3 2.9 2.9 2.7 2.6 1996 ....................................... 129.1 129.5 131.6 132.3 .2 .3 1.6 .5 2.5 2.5 2.5 2.7 1997 ....................................... 132.5 132.5 134.6 135.1 .2 .0 1.6 .4 2.6 2.3 2.3 2.1 1998 ....................................... 135.6 135.6 137.7 138.5 .4 .0 1.5 .6 2.3 2.3 2.3 2.5 1999 ....................................... 138.8 139.3 142.0 143.2 .2 .4 1.9 .8 2.4 2.7 3.1 3.4
See footnotes at end of table.
33
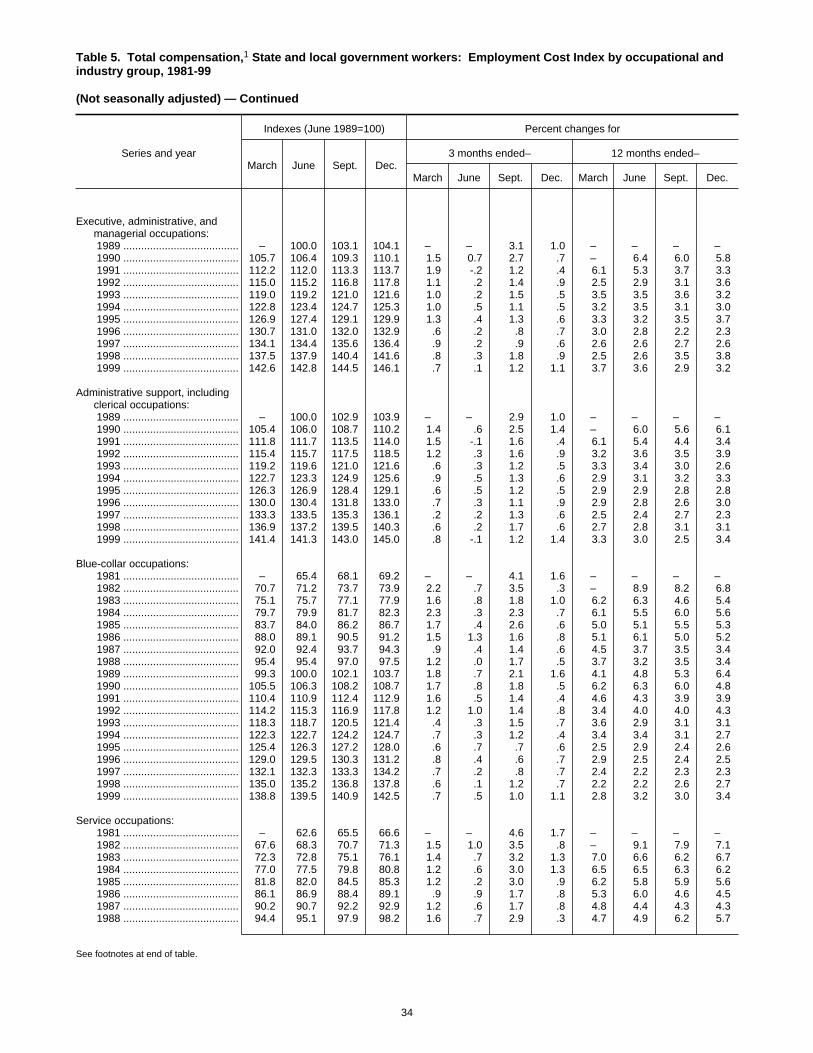
Table 5. Total compensation,1 State and local government workers: Employment Cost Index by occupational andindustry group, 1981-99
(Not seasonally adjusted) — Continued
Series and year
Indexes (June 1989=100) Percent changes for
March June Sept. Dec.3 months ended– 12 months ended–
March June Sept. Dec. March June Sept. Dec.
Executive, administrative, andmanagerial occupations:
1989 ....................................... – 100.0 103.1 104.1 – – 3.1 1.0 – – – – 1990 ....................................... 105.7 106.4 109.3 110.1 1.5 0.7 2.7 .7 – 6.4 6.0 5.8 1991 ....................................... 112.2 112.0 113.3 113.7 1.9 -.2 1.2 .4 6.1 5.3 3.7 3.3 1992 ....................................... 115.0 115.2 116.8 117.8 1.1 .2 1.4 .9 2.5 2.9 3.1 3.6 1993 ....................................... 119.0 119.2 121.0 121.6 1.0 .2 1.5 .5 3.5 3.5 3.6 3.2 1994 ....................................... 122.8 123.4 124.7 125.3 1.0 .5 1.1 .5 3.2 3.5 3.1 3.0 1995 ....................................... 126.9 127.4 129.1 129.9 1.3 .4 1.3 .6 3.3 3.2 3.5 3.7 1996 ....................................... 130.7 131.0 132.0 132.9 .6 .2 .8 .7 3.0 2.8 2.2 2.3 1997 ....................................... 134.1 134.4 135.6 136.4 .9 .2 .9 .6 2.6 2.6 2.7 2.6 1998 ....................................... 137.5 137.9 140.4 141.6 .8 .3 1.8 .9 2.5 2.6 3.5 3.8 1999 ....................................... 142.6 142.8 144.5 146.1 .7 .1 1.2 1.1 3.7 3.6 2.9 3.2
Administrative support, includingclerical occupations:
1989 ....................................... – 100.0 102.9 103.9 – – 2.9 1.0 – – – – 1990 ....................................... 105.4 106.0 108.7 110.2 1.4 .6 2.5 1.4 – 6.0 5.6 6.1 1991 ....................................... 111.8 111.7 113.5 114.0 1.5 -.1 1.6 .4 6.1 5.4 4.4 3.4 1992 ....................................... 115.4 115.7 117.5 118.5 1.2 .3 1.6 .9 3.2 3.6 3.5 3.9 1993 ....................................... 119.2 119.6 121.0 121.6 .6 .3 1.2 .5 3.3 3.4 3.0 2.6 1994 ....................................... 122.7 123.3 124.9 125.6 .9 .5 1.3 .6 2.9 3.1 3.2 3.3 1995 ....................................... 126.3 126.9 128.4 129.1 .6 .5 1.2 .5 2.9 2.9 2.8 2.8 1996 ....................................... 130.0 130.4 131.8 133.0 .7 .3 1.1 .9 2.9 2.8 2.6 3.0 1997 ....................................... 133.3 133.5 135.3 136.1 .2 .2 1.3 .6 2.5 2.4 2.7 2.3 1998 ....................................... 136.9 137.2 139.5 140.3 .6 .2 1.7 .6 2.7 2.8 3.1 3.1 1999 ....................................... 141.4 141.3 143.0 145.0 .8 -.1 1.2 1.4 3.3 3.0 2.5 3.4
Blue-collar occupations: 1981 ....................................... – 65.4 68.1 69.2 – – 4.1 1.6 – – – – 1982 ....................................... 70.7 71.2 73.7 73.9 2.2 .7 3.5 .3 – 8.9 8.2 6.8 1983 ....................................... 75.1 75.7 77.1 77.9 1.6 .8 1.8 1.0 6.2 6.3 4.6 5.4 1984 ....................................... 79.7 79.9 81.7 82.3 2.3 .3 2.3 .7 6.1 5.5 6.0 5.6 1985 ....................................... 83.7 84.0 86.2 86.7 1.7 .4 2.6 .6 5.0 5.1 5.5 5.3 1986 ....................................... 88.0 89.1 90.5 91.2 1.5 1.3 1.6 .8 5.1 6.1 5.0 5.2 1987 ....................................... 92.0 92.4 93.7 94.3 .9 .4 1.4 .6 4.5 3.7 3.5 3.4 1988 ....................................... 95.4 95.4 97.0 97.5 1.2 .0 1.7 .5 3.7 3.2 3.5 3.4 1989 ....................................... 99.3 100.0 102.1 103.7 1.8 .7 2.1 1.6 4.1 4.8 5.3 6.4 1990 ....................................... 105.5 106.3 108.2 108.7 1.7 .8 1.8 .5 6.2 6.3 6.0 4.8 1991 ....................................... 110.4 110.9 112.4 112.9 1.6 .5 1.4 .4 4.6 4.3 3.9 3.9 1992 ....................................... 114.2 115.3 116.9 117.8 1.2 1.0 1.4 .8 3.4 4.0 4.0 4.3 1993 ....................................... 118.3 118.7 120.5 121.4 .4 .3 1.5 .7 3.6 2.9 3.1 3.1 1994 ....................................... 122.3 122.7 124.2 124.7 .7 .3 1.2 .4 3.4 3.4 3.1 2.7 1995 ....................................... 125.4 126.3 127.2 128.0 .6 .7 .7 .6 2.5 2.9 2.4 2.6 1996 ....................................... 129.0 129.5 130.3 131.2 .8 .4 .6 .7 2.9 2.5 2.4 2.5 1997 ....................................... 132.1 132.3 133.3 134.2 .7 .2 .8 .7 2.4 2.2 2.3 2.3 1998 ....................................... 135.0 135.2 136.8 137.8 .6 .1 1.2 .7 2.2 2.2 2.6 2.7 1999 ....................................... 138.8 139.5 140.9 142.5 .7 .5 1.0 1.1 2.8 3.2 3.0 3.4
Service occupations: 1981 ....................................... – 62.6 65.5 66.6 – – 4.6 1.7 – – – – 1982 ....................................... 67.6 68.3 70.7 71.3 1.5 1.0 3.5 .8 – 9.1 7.9 7.1 1983 ....................................... 72.3 72.8 75.1 76.1 1.4 .7 3.2 1.3 7.0 6.6 6.2 6.7 1984 ....................................... 77.0 77.5 79.8 80.8 1.2 .6 3.0 1.3 6.5 6.5 6.3 6.2 1985 ....................................... 81.8 82.0 84.5 85.3 1.2 .2 3.0 .9 6.2 5.8 5.9 5.6 1986 ....................................... 86.1 86.9 88.4 89.1 .9 .9 1.7 .8 5.3 6.0 4.6 4.5 1987 ....................................... 90.2 90.7 92.2 92.9 1.2 .6 1.7 .8 4.8 4.4 4.3 4.3 1988 ....................................... 94.4 95.1 97.9 98.2 1.6 .7 2.9 .3 4.7 4.9 6.2 5.7
See footnotes at end of table.
34
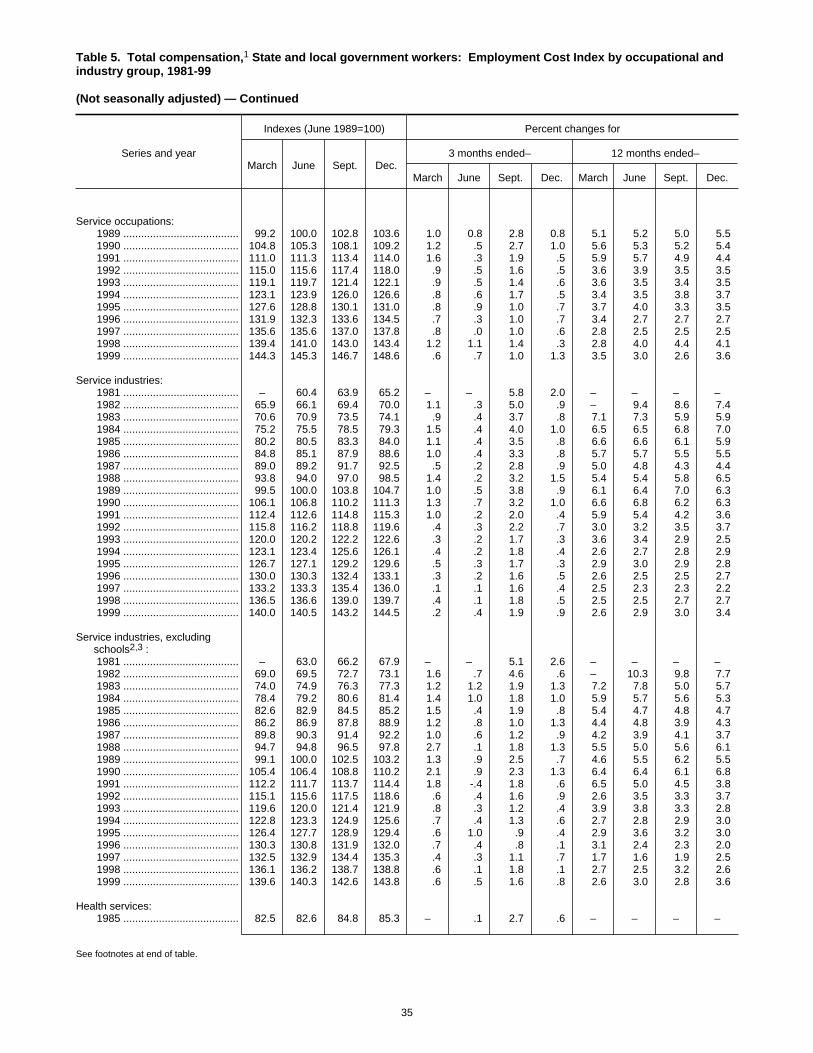
Table 5. Total compensation,1 State and local government workers: Employment Cost Index by occupational andindustry group, 1981-99
(Not seasonally adjusted) — Continued
Series and year
Indexes (June 1989=100) Percent changes for
March June Sept. Dec.3 months ended– 12 months ended–
March June Sept. Dec. March June Sept. Dec.
Service occupations: 1989 ....................................... 99.2 100.0 102.8 103.6 1.0 0.8 2.8 0.8 5.1 5.2 5.0 5.5 1990 ....................................... 104.8 105.3 108.1 109.2 1.2 .5 2.7 1.0 5.6 5.3 5.2 5.4 1991 ....................................... 111.0 111.3 113.4 114.0 1.6 .3 1.9 .5 5.9 5.7 4.9 4.4 1992 ....................................... 115.0 115.6 117.4 118.0 .9 .5 1.6 .5 3.6 3.9 3.5 3.5 1993 ....................................... 119.1 119.7 121.4 122.1 .9 .5 1.4 .6 3.6 3.5 3.4 3.5 1994 ....................................... 123.1 123.9 126.0 126.6 .8 .6 1.7 .5 3.4 3.5 3.8 3.7 1995 ....................................... 127.6 128.8 130.1 131.0 .8 .9 1.0 .7 3.7 4.0 3.3 3.5 1996 ....................................... 131.9 132.3 133.6 134.5 .7 .3 1.0 .7 3.4 2.7 2.7 2.7 1997 ....................................... 135.6 135.6 137.0 137.8 .8 .0 1.0 .6 2.8 2.5 2.5 2.5 1998 ....................................... 139.4 141.0 143.0 143.4 1.2 1.1 1.4 .3 2.8 4.0 4.4 4.1 1999 ....................................... 144.3 145.3 146.7 148.6 .6 .7 1.0 1.3 3.5 3.0 2.6 3.6
Service industries: 1981 ....................................... – 60.4 63.9 65.2 – – 5.8 2.0 – – – – 1982 ....................................... 65.9 66.1 69.4 70.0 1.1 .3 5.0 .9 – 9.4 8.6 7.4 1983 ....................................... 70.6 70.9 73.5 74.1 .9 .4 3.7 .8 7.1 7.3 5.9 5.9 1984 ....................................... 75.2 75.5 78.5 79.3 1.5 .4 4.0 1.0 6.5 6.5 6.8 7.0 1985 ....................................... 80.2 80.5 83.3 84.0 1.1 .4 3.5 .8 6.6 6.6 6.1 5.9 1986 ....................................... 84.8 85.1 87.9 88.6 1.0 .4 3.3 .8 5.7 5.7 5.5 5.5 1987 ....................................... 89.0 89.2 91.7 92.5 .5 .2 2.8 .9 5.0 4.8 4.3 4.4 1988 ....................................... 93.8 94.0 97.0 98.5 1.4 .2 3.2 1.5 5.4 5.4 5.8 6.5 1989 ....................................... 99.5 100.0 103.8 104.7 1.0 .5 3.8 .9 6.1 6.4 7.0 6.3 1990 ....................................... 106.1 106.8 110.2 111.3 1.3 .7 3.2 1.0 6.6 6.8 6.2 6.3 1991 ....................................... 112.4 112.6 114.8 115.3 1.0 .2 2.0 .4 5.9 5.4 4.2 3.6 1992 ....................................... 115.8 116.2 118.8 119.6 .4 .3 2.2 .7 3.0 3.2 3.5 3.7 1993 ....................................... 120.0 120.2 122.2 122.6 .3 .2 1.7 .3 3.6 3.4 2.9 2.5 1994 ....................................... 123.1 123.4 125.6 126.1 .4 .2 1.8 .4 2.6 2.7 2.8 2.9 1995 ....................................... 126.7 127.1 129.2 129.6 .5 .3 1.7 .3 2.9 3.0 2.9 2.8 1996 ....................................... 130.0 130.3 132.4 133.1 .3 .2 1.6 .5 2.6 2.5 2.5 2.7 1997 ....................................... 133.2 133.3 135.4 136.0 .1 .1 1.6 .4 2.5 2.3 2.3 2.2 1998 ....................................... 136.5 136.6 139.0 139.7 .4 .1 1.8 .5 2.5 2.5 2.7 2.7 1999 ....................................... 140.0 140.5 143.2 144.5 .2 .4 1.9 .9 2.6 2.9 3.0 3.4
Service industries, excludingschools2,3 :
1981 ....................................... – 63.0 66.2 67.9 – – 5.1 2.6 – – – – 1982 ....................................... 69.0 69.5 72.7 73.1 1.6 .7 4.6 .6 – 10.3 9.8 7.7 1983 ....................................... 74.0 74.9 76.3 77.3 1.2 1.2 1.9 1.3 7.2 7.8 5.0 5.7 1984 ....................................... 78.4 79.2 80.6 81.4 1.4 1.0 1.8 1.0 5.9 5.7 5.6 5.3 1985 ....................................... 82.6 82.9 84.5 85.2 1.5 .4 1.9 .8 5.4 4.7 4.8 4.7 1986 ....................................... 86.2 86.9 87.8 88.9 1.2 .8 1.0 1.3 4.4 4.8 3.9 4.3 1987 ....................................... 89.8 90.3 91.4 92.2 1.0 .6 1.2 .9 4.2 3.9 4.1 3.7 1988 ....................................... 94.7 94.8 96.5 97.8 2.7 .1 1.8 1.3 5.5 5.0 5.6 6.1 1989 ....................................... 99.1 100.0 102.5 103.2 1.3 .9 2.5 .7 4.6 5.5 6.2 5.5 1990 ....................................... 105.4 106.4 108.8 110.2 2.1 .9 2.3 1.3 6.4 6.4 6.1 6.8 1991 ....................................... 112.2 111.7 113.7 114.4 1.8 -.4 1.8 .6 6.5 5.0 4.5 3.8 1992 ....................................... 115.1 115.6 117.5 118.6 .6 .4 1.6 .9 2.6 3.5 3.3 3.7 1993 ....................................... 119.6 120.0 121.4 121.9 .8 .3 1.2 .4 3.9 3.8 3.3 2.8 1994 ....................................... 122.8 123.3 124.9 125.6 .7 .4 1.3 .6 2.7 2.8 2.9 3.0 1995 ....................................... 126.4 127.7 128.9 129.4 .6 1.0 .9 .4 2.9 3.6 3.2 3.0 1996 ....................................... 130.3 130.8 131.9 132.0 .7 .4 .8 .1 3.1 2.4 2.3 2.0 1997 ....................................... 132.5 132.9 134.4 135.3 .4 .3 1.1 .7 1.7 1.6 1.9 2.5 1998 ....................................... 136.1 136.2 138.7 138.8 .6 .1 1.8 .1 2.7 2.5 3.2 2.6 1999 ....................................... 139.6 140.3 142.6 143.8 .6 .5 1.6 .8 2.6 3.0 2.8 3.6
Health services: 1985 ....................................... 82.5 82.6 84.8 85.3 – .1 2.7 .6 – – – –
See footnotes at end of table.
35

Table 5. Total compensation,1 State and local government workers: Employment Cost Index by occupational andindustry group, 1981-99
(Not seasonally adjusted) — Continued
Series and year
Indexes (June 1989=100) Percent changes for
March June Sept. Dec.3 months ended– 12 months ended–
March June Sept. Dec. March June Sept. Dec.
Health services: 1986 ....................................... 86.0 86.8 88.1 88.8 0.8 0.9 1.5 0.8 4.2 5.1 3.9 4.1 1987 ....................................... 89.5 90.1 92.0 93.0 .8 .7 2.1 1.1 4.1 3.8 4.4 4.7 1988 ....................................... 94.0 94.4 96.5 97.3 1.1 .4 2.2 .8 5.0 4.8 4.9 4.6 1989 ....................................... 98.8 100.0 103.1 104.2 1.5 1.2 3.1 1.1 5.1 5.9 6.8 7.1 1990 ....................................... 106.2 106.9 109.9 111.1 1.9 .7 2.8 1.1 7.5 6.9 6.6 6.6 1991 ....................................... 112.6 112.2 113.9 114.9 1.4 -.4 1.5 .9 6.0 5.0 3.6 3.4 1992 ....................................... 115.9 116.8 118.6 119.4 .9 .8 1.5 .7 2.9 4.1 4.1 3.9 1993 ....................................... 120.2 120.7 122.2 123.1 .7 .4 1.2 .7 3.7 3.3 3.0 3.1 1994 ....................................... 124.2 125.2 127.2 127.7 .9 .8 1.6 .4 3.3 3.7 4.1 3.7 1995 ....................................... 128.4 129.8 131.0 131.6 .5 1.1 .9 .5 3.4 3.7 3.0 3.1 1996 ....................................... 132.5 133.1 134.0 134.1 .7 .5 .7 .1 3.2 2.5 2.3 1.9 1997 ....................................... 134.5 134.9 136.0 137.2 .3 .3 .8 .9 1.5 1.4 1.5 2.3 1998 ....................................... 137.9 138.0 140.3 140.7 .5 .1 1.7 .3 2.5 2.3 3.2 2.6 1999 ....................................... 141.2 142.0 144.2 145.8 .4 .6 1.5 1.1 2.4 2.9 2.8 3.6
Hospitals: 1988 ....................................... 94.0 94.8 97.0 97.6 – .9 2.3 .6 – – – – 1989 ....................................... 98.6 100.0 103.2 104.5 1.0 1.4 3.2 1.3 4.9 5.5 6.4 7.1 1990 ....................................... 106.0 107.0 109.8 111.4 1.4 .9 2.6 1.5 7.5 7.0 6.4 6.6 1991 ....................................... 112.2 112.1 114.1 115.2 .7 -.1 1.8 1.0 5.8 4.8 3.9 3.4 1992 ....................................... 115.9 116.7 118.6 119.4 .6 .7 1.6 .7 3.3 4.1 3.9 3.6 1993 ....................................... 120.0 120.4 122.0 123.3 .5 .3 1.3 1.1 3.5 3.2 2.9 3.3 1994 ....................................... 123.7 124.5 127.0 127.7 .3 .6 2.0 .6 3.1 3.4 4.1 3.6 1995 ....................................... 128.4 129.9 131.1 131.7 .5 1.2 .9 .5 3.8 4.3 3.2 3.1 1996 ....................................... 132.6 133.2 134.2 134.3 .7 .5 .8 .1 3.3 2.5 2.4 2.0 1997 ....................................... 134.8 135.2 136.3 137.6 .4 .3 .8 1.0 1.7 1.5 1.6 2.5 1998 ....................................... 138.4 138.4 140.7 141.2 .6 .0 1.7 .4 2.7 2.4 3.2 2.6 1999 ....................................... 141.7 142.7 144.8 146.3 .4 .7 1.5 1.0 2.4 3.1 2.9 3.6
Educational services: 1989 ....................................... 99.5 100.0 104.1 104.9 – .5 4.1 .8 – – – – 1990 ....................................... 106.2 106.8 110.3 111.4 1.2 .6 3.3 1.0 6.7 6.8 6.0 6.2 1991 ....................................... 112.4 112.6 114.9 115.3 .9 .2 2.0 .3 5.8 5.4 4.2 3.5 1992 ....................................... 115.7 116.1 118.9 119.7 .3 .3 2.4 .7 2.9 3.1 3.5 3.8 1993 ....................................... 120.0 120.1 122.3 122.7 .3 .1 1.8 .3 3.7 3.4 2.9 2.5 1994 ....................................... 122.9 123.1 125.5 126.0 .2 .2 1.9 .4 2.4 2.5 2.6 2.7 1995 ....................................... 126.5 126.8 129.0 129.4 .4 .2 1.7 .3 2.9 3.0 2.8 2.7 1996 ....................................... 129.7 130.0 132.3 133.0 .2 .2 1.8 .5 2.5 2.5 2.6 2.8 1997 ....................................... 133.1 133.2 135.4 135.9 .1 .1 1.7 .4 2.6 2.5 2.3 2.2 1998 ....................................... 136.3 136.5 138.8 139.6 .3 .1 1.7 .6 2.4 2.5 2.5 2.7 1999 ....................................... 139.9 140.3 143.1 144.4 .2 .3 2.0 .9 2.6 2.8 3.1 3.4
Schools: 1981 ....................................... – 59.6 63.2 64.3 – – 6.0 1.7 – – – – 1982 ....................................... 64.9 65.0 68.4 69.0 .9 .2 5.2 .9 – 9.1 8.2 7.3 1983 ....................................... 69.5 69.7 72.6 73.1 .7 .3 4.2 .7 7.1 7.2 6.1 5.9 1984 ....................................... 74.2 74.3 77.8 78.7 1.5 .1 4.7 1.2 6.8 6.6 7.2 7.7 1985 ....................................... 79.5 79.7 82.9 83.6 1.0 .3 4.0 .8 7.1 7.3 6.6 6.2 1986 ....................................... 84.3 84.4 88.0 88.4 .8 .1 4.3 .5 6.0 5.9 6.2 5.7 1987 ....................................... 88.7 88.9 91.8 92.7 .3 .2 3.3 1.0 5.2 5.3 4.3 4.9 1988 ....................................... 93.4 93.7 97.2 98.7 .8 .3 3.7 1.5 5.3 5.4 5.9 6.5 1989 ....................................... 99.6 100.0 104.4 105.3 .9 .4 4.4 .9 6.6 6.7 7.4 6.7 1990 ....................................... 106.4 106.9 110.6 111.6 1.0 .5 3.5 .9 6.8 6.9 5.9 6.0 1991 ....................................... 112.5 112.9 115.2 115.6 .8 .4 2.0 .3 5.7 5.6 4.2 3.6 1992 ....................................... 116.0 116.4 119.2 119.9 .3 .3 2.4 .6 3.1 3.1 3.5 3.7 1993 ....................................... 120.2 120.3 122.5 122.9 .3 .1 1.8 .3 3.6 3.4 2.8 2.5 1994 ....................................... 123.2 123.4 125.9 126.3 .2 .2 2.0 .3 2.5 2.6 2.8 2.8
See footnotes at end of table.
36

Table 5. Total compensation,1 State and local government workers: Employment Cost Index by occupational andindustry group, 1981-99
(Not seasonally adjusted) — Continued
Series and year
Indexes (June 1989=100) Percent changes for
March June Sept. Dec.3 months ended– 12 months ended–
March June Sept. Dec. March June Sept. Dec.
Schools: 1995 ....................................... 126.8 127.1 129.4 129.8 0.4 0.2 1.8 0.3 2.9 3.0 2.8 2.8 1996 ....................................... 130.0 130.3 132.6 133.4 .2 .2 1.8 .6 2.5 2.5 2.5 2.8 1997 ....................................... 133.4 133.5 135.7 136.2 .0 .1 1.6 .4 2.6 2.5 2.3 2.1 1998 ....................................... 136.6 136.7 139.1 139.9 .3 .1 1.8 .6 2.4 2.4 2.5 2.7 1999 ....................................... 140.2 140.6 143.5 144.7 .2 .3 2.1 .8 2.6 2.9 3.2 3.4
Elementary and secondaryschools:
1981 ....................................... – 58.9 62.6 63.7 – – 6.3 1.8 – – – – 1982 ....................................... 64.3 64.4 68.0 68.6 .9 .2 5.6 .9 – 9.3 8.6 7.7 1983 ....................................... 69.0 69.1 72.6 72.9 .6 .1 5.1 .4 7.3 7.3 6.8 6.3 1984 ....................................... 73.8 74.0 77.8 78.6 1.2 .3 5.1 1.0 7.0 7.1 7.2 7.8 1985 ....................................... 79.1 79.2 82.9 83.6 .6 .1 4.7 .8 7.2 7.0 6.6 6.4 1986 ....................................... 84.2 84.3 87.9 88.5 .7 .1 4.3 .7 6.4 6.4 6.0 5.9 1987 ....................................... 88.6 88.7 92.1 92.9 .1 .1 3.8 .9 5.2 5.2 4.8 5.0 1988 ....................................... 93.5 93.8 97.4 99.1 .6 .3 3.8 1.7 5.5 5.7 5.8 6.7 1989 ....................................... 99.6 100.0 104.6 105.5 .5 .4 4.6 .9 6.5 6.6 7.4 6.5 1990 ....................................... 106.5 107.1 111.1 112.1 .9 .6 3.7 .9 6.9 7.1 6.2 6.3 1991 ....................................... 112.9 113.0 115.7 116.2 .7 .1 2.4 .4 6.0 5.5 4.1 3.7 1992 ....................................... 116.6 117.1 119.9 120.7 .3 .4 2.4 .7 3.3 3.6 3.6 3.9 1993 ....................................... 120.7 120.8 123.0 123.6 .0 .1 1.8 .5 3.5 3.2 2.6 2.4 1994 ....................................... 123.7 123.8 126.3 126.5 .1 .1 2.0 .2 2.5 2.5 2.7 2.3 1995 ....................................... 127.1 127.4 129.8 130.1 .5 .2 1.9 .2 2.7 2.9 2.8 2.8 1996 ....................................... 130.2 130.5 132.6 133.1 .1 .2 1.6 .4 2.4 2.4 2.2 2.3 1997 ....................................... 133.1 133.3 135.5 135.8 .0 .2 1.7 .2 2.2 2.1 2.2 2.0 1998 ....................................... 136.1 136.2 138.8 139.3 .2 .1 1.9 .4 2.3 2.2 2.4 2.6 1999 ....................................... 139.6 140.0 142.9 144.1 .2 .3 2.1 .8 2.6 2.8 3.0 3.4
Colleges and universities: 1989 ....................................... 99.6 100.0 103.4 104.7 – .4 3.4 1.3 – – – – 1990 ....................................... 106.1 106.3 109.2 110.2 1.3 .2 2.7 .9 6.5 6.3 5.6 5.3 1991 ....................................... 111.3 112.5 113.4 113.5 1.0 1.1 .8 .1 4.9 5.8 3.8 3.0 1992 ....................................... 114.0 114.1 116.9 117.2 .4 .1 2.5 .3 2.4 1.4 3.1 3.3 1993 ....................................... 118.4 118.5 120.8 120.7 1.0 .1 1.9 -.1 3.9 3.9 3.3 3.0 1994 ....................................... 121.5 122.0 124.5 125.5 .7 .4 2.0 .8 2.6 3.0 3.1 4.0 1995 ....................................... 126.0 126.1 128.0 128.7 .4 .1 1.5 .5 3.7 3.4 2.8 2.5 1996 ....................................... 129.4 129.9 132.5 134.0 .5 .4 2.0 1.1 2.7 3.0 3.5 4.1 1997 ....................................... 134.3 134.1 136.3 137.2 .2 -.1 1.6 .7 3.8 3.2 2.9 2.4 1998 ....................................... 137.9 138.1 140.1 141.5 .5 .1 1.4 1.0 2.7 3.0 2.8 3.1 1999 ....................................... 141.7 142.1 144.8 146.5 .1 .3 1.9 1.2 2.8 2.9 3.4 3.5
Public administration4: 1981 ....................................... – 63.3 66.1 67.1 – – 4.4 1.5 – – – – 1982 ....................................... 68.5 69.1 71.4 71.9 2.1 .9 3.3 .7 – 9.2 8.0 7.2 1983 ....................................... 73.6 74.1 75.9 76.9 2.4 .7 2.4 1.3 7.4 7.2 6.3 7.0 1984 ....................................... 77.8 78.3 80.4 81.4 1.2 .6 2.7 1.2 5.7 5.7 5.9 5.9 1985 ....................................... 82.4 82.5 85.0 85.4 1.2 .1 3.0 .5 5.9 5.4 5.7 4.9 1986 ....................................... 86.6 87.4 89.0 89.7 1.4 .9 1.8 .8 5.1 5.9 4.7 5.0 1987 ....................................... 91.3 91.6 92.7 93.8 1.8 .3 1.2 1.2 5.4 4.8 4.2 4.6 1988 ....................................... 95.2 95.8 97.5 97.8 1.5 .6 1.8 .3 4.3 4.6 5.2 4.3 1989 ....................................... 99.2 100.0 102.5 103.2 1.4 .8 2.5 .7 4.2 4.4 5.1 5.5 1990 ....................................... 105.1 105.5 107.8 108.7 1.8 .4 2.2 .8 5.9 5.5 5.2 5.3 1991 ....................................... 110.8 110.9 112.2 112.6 1.9 .1 1.2 .4 5.4 5.1 4.1 3.6 1992 ....................................... 114.0 114.6 115.8 116.3 1.2 .5 1.0 .4 2.9 3.3 3.2 3.3 1993 ....................................... 117.6 118.0 119.3 120.0 1.1 .3 1.1 .6 3.2 3.0 3.0 3.2 1994 ....................................... 121.5 122.2 123.7 124.2 1.3 .6 1.2 .4 3.3 3.6 3.7 3.5 1995 ....................................... 125.4 126.1 127.4 128.3 1.0 .6 1.0 .7 3.2 3.2 3.0 3.3
See footnotes at end of table.
37
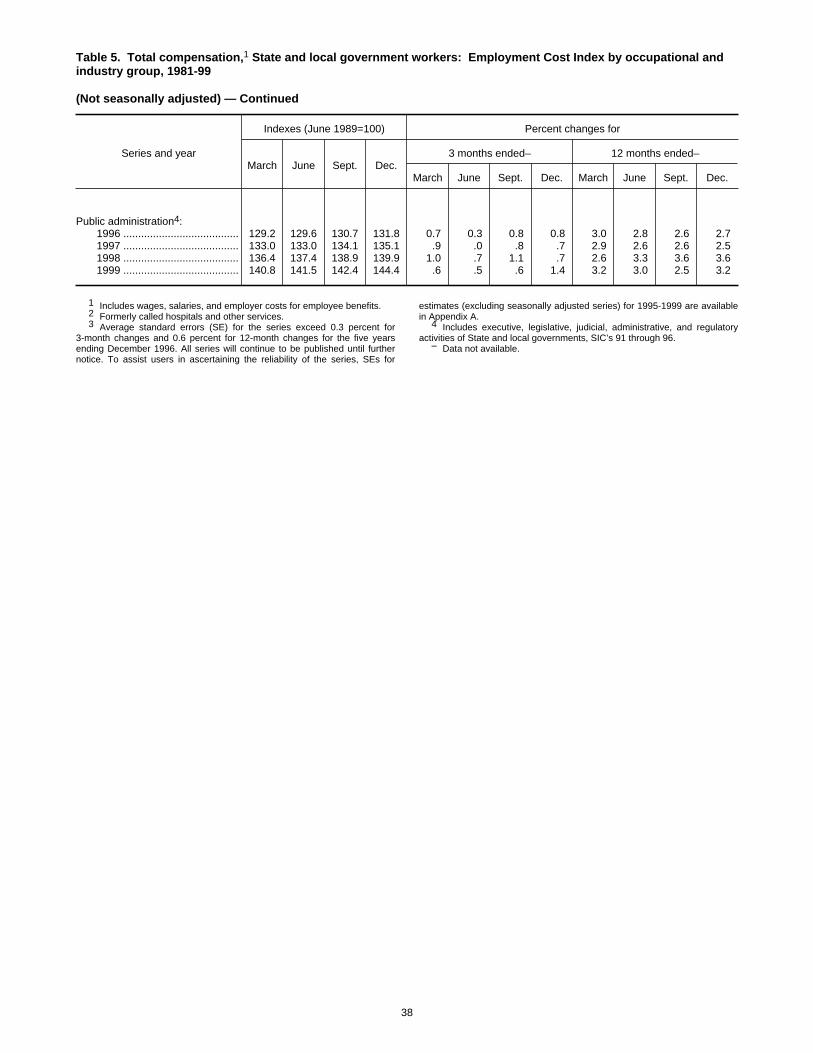
Table 5. Total compensation,1 State and local government workers: Employment Cost Index by occupational andindustry group, 1981-99
(Not seasonally adjusted) — Continued
Series and year
Indexes (June 1989=100) Percent changes for
March June Sept. Dec.3 months ended– 12 months ended–
March June Sept. Dec. March June Sept. Dec.
Public administration4: 1996 ....................................... 129.2 129.6 130.7 131.8 0.7 0.3 0.8 0.8 3.0 2.8 2.6 2.7 1997 ....................................... 133.0 133.0 134.1 135.1 .9 .0 .8 .7 2.9 2.6 2.6 2.5 1998 ....................................... 136.4 137.4 138.9 139.9 1.0 .7 1.1 .7 2.6 3.3 3.6 3.6 1999 ....................................... 140.8 141.5 142.4 144.4 .6 .5 .6 1.4 3.2 3.0 2.5 3.2
1 Includes wages, salaries, and employer costs for employee benefits.2 Formerly called hospitals and other services.3 Average standard errors (SE) for the series exceed 0.3 percent for
3-month changes and 0.6 percent for 12-month changes for the five yearsending December 1996. All series will continue to be published until furthernotice. To assist users in ascertaining the reliability of the series, SEs for
estimates (excluding seasonally adjusted series) for 1995-1999 are availablein Appendix A.
4 Includes executive, legislative, judicial, administrative, and regulatoryactivities of State and local governments, SIC’s 91 through 96.
– Data not available.
38
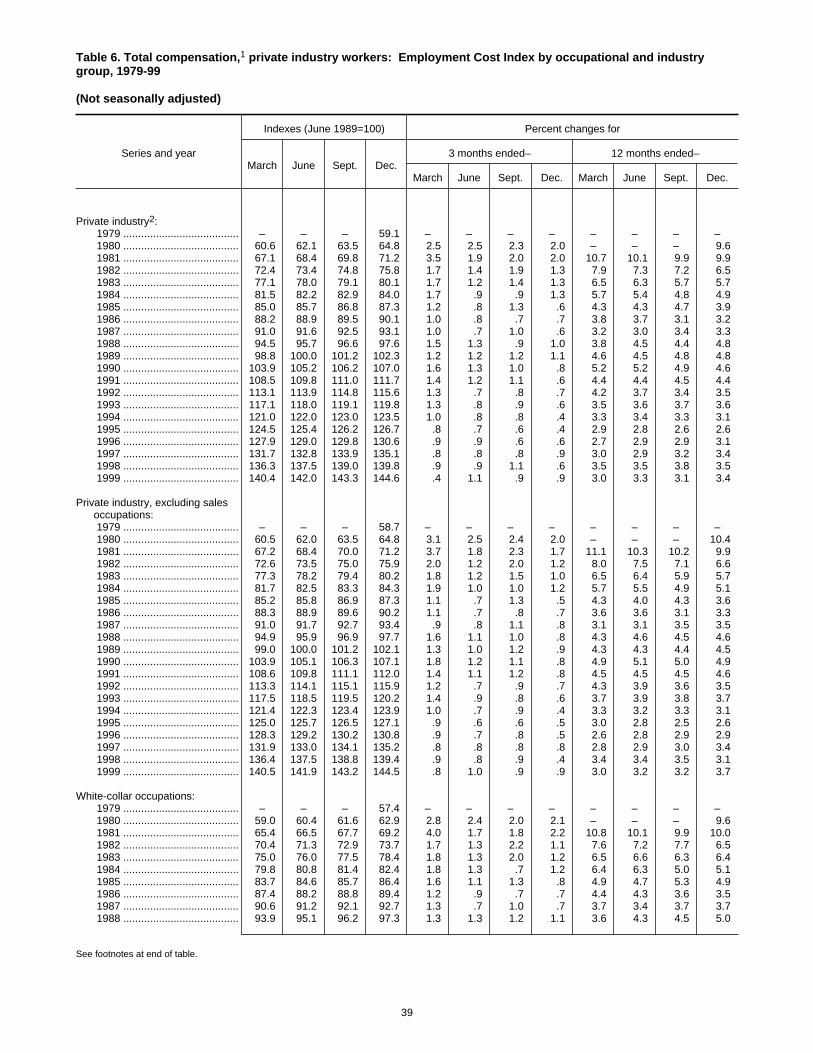
Table 6. Total compensation,1 private industry workers: Employment Cost Index by occupational and industrygroup, 1979-99
(Not seasonally adjusted)
Series and year
Indexes (June 1989=100) Percent changes for
March June Sept. Dec.3 months ended– 12 months ended–
March June Sept. Dec. March June Sept. Dec.
Private industry2: 1979 ....................................... – – – 59.1 – – – – – – – – 1980 ....................................... 60.6 62.1 63.5 64.8 2.5 2.5 2.3 2.0 – – – 9.6 1981 ....................................... 67.1 68.4 69.8 71.2 3.5 1.9 2.0 2.0 10.7 10.1 9.9 9.9 1982 ....................................... 72.4 73.4 74.8 75.8 1.7 1.4 1.9 1.3 7.9 7.3 7.2 6.5 1983 ....................................... 77.1 78.0 79.1 80.1 1.7 1.2 1.4 1.3 6.5 6.3 5.7 5.7 1984 ....................................... 81.5 82.2 82.9 84.0 1.7 .9 .9 1.3 5.7 5.4 4.8 4.9 1985 ....................................... 85.0 85.7 86.8 87.3 1.2 .8 1.3 .6 4.3 4.3 4.7 3.9 1986 ....................................... 88.2 88.9 89.5 90.1 1.0 .8 .7 .7 3.8 3.7 3.1 3.2 1987 ....................................... 91.0 91.6 92.5 93.1 1.0 .7 1.0 .6 3.2 3.0 3.4 3.3 1988 ....................................... 94.5 95.7 96.6 97.6 1.5 1.3 .9 1.0 3.8 4.5 4.4 4.8 1989 ....................................... 98.8 100.0 101.2 102.3 1.2 1.2 1.2 1.1 4.6 4.5 4.8 4.8 1990 ....................................... 103.9 105.2 106.2 107.0 1.6 1.3 1.0 .8 5.2 5.2 4.9 4.6 1991 ....................................... 108.5 109.8 111.0 111.7 1.4 1.2 1.1 .6 4.4 4.4 4.5 4.4 1992 ....................................... 113.1 113.9 114.8 115.6 1.3 .7 .8 .7 4.2 3.7 3.4 3.5 1993 ....................................... 117.1 118.0 119.1 119.8 1.3 .8 .9 .6 3.5 3.6 3.7 3.6 1994 ....................................... 121.0 122.0 123.0 123.5 1.0 .8 .8 .4 3.3 3.4 3.3 3.1 1995 ....................................... 124.5 125.4 126.2 126.7 .8 .7 .6 .4 2.9 2.8 2.6 2.6 1996 ....................................... 127.9 129.0 129.8 130.6 .9 .9 .6 .6 2.7 2.9 2.9 3.1 1997 ....................................... 131.7 132.8 133.9 135.1 .8 .8 .8 .9 3.0 2.9 3.2 3.4 1998 ....................................... 136.3 137.5 139.0 139.8 .9 .9 1.1 .6 3.5 3.5 3.8 3.5 1999 ....................................... 140.4 142.0 143.3 144.6 .4 1.1 .9 .9 3.0 3.3 3.1 3.4
Private industry, excluding salesoccupations:
1979 ....................................... – – – 58.7 – – – – – – – – 1980 ....................................... 60.5 62.0 63.5 64.8 3.1 2.5 2.4 2.0 – – – 10.4 1981 ....................................... 67.2 68.4 70.0 71.2 3.7 1.8 2.3 1.7 11.1 10.3 10.2 9.9 1982 ....................................... 72.6 73.5 75.0 75.9 2.0 1.2 2.0 1.2 8.0 7.5 7.1 6.6 1983 ....................................... 77.3 78.2 79.4 80.2 1.8 1.2 1.5 1.0 6.5 6.4 5.9 5.7 1984 ....................................... 81.7 82.5 83.3 84.3 1.9 1.0 1.0 1.2 5.7 5.5 4.9 5.1 1985 ....................................... 85.2 85.8 86.9 87.3 1.1 .7 1.3 .5 4.3 4.0 4.3 3.6 1986 ....................................... 88.3 88.9 89.6 90.2 1.1 .7 .8 .7 3.6 3.6 3.1 3.3 1987 ....................................... 91.0 91.7 92.7 93.4 .9 .8 1.1 .8 3.1 3.1 3.5 3.5 1988 ....................................... 94.9 95.9 96.9 97.7 1.6 1.1 1.0 .8 4.3 4.6 4.5 4.6 1989 ....................................... 99.0 100.0 101.2 102.1 1.3 1.0 1.2 .9 4.3 4.3 4.4 4.5 1990 ....................................... 103.9 105.1 106.3 107.1 1.8 1.2 1.1 .8 4.9 5.1 5.0 4.9 1991 ....................................... 108.6 109.8 111.1 112.0 1.4 1.1 1.2 .8 4.5 4.5 4.5 4.6 1992 ....................................... 113.3 114.1 115.1 115.9 1.2 .7 .9 .7 4.3 3.9 3.6 3.5 1993 ....................................... 117.5 118.5 119.5 120.2 1.4 .9 .8 .6 3.7 3.9 3.8 3.7 1994 ....................................... 121.4 122.3 123.4 123.9 1.0 .7 .9 .4 3.3 3.2 3.3 3.1 1995 ....................................... 125.0 125.7 126.5 127.1 .9 .6 .6 .5 3.0 2.8 2.5 2.6 1996 ....................................... 128.3 129.2 130.2 130.8 .9 .7 .8 .5 2.6 2.8 2.9 2.9 1997 ....................................... 131.9 133.0 134.1 135.2 .8 .8 .8 .8 2.8 2.9 3.0 3.4 1998 ....................................... 136.4 137.5 138.8 139.4 .9 .8 .9 .4 3.4 3.4 3.5 3.1 1999 ....................................... 140.5 141.9 143.2 144.5 .8 1.0 .9 .9 3.0 3.2 3.2 3.7
White-collar occupations: 1979 ....................................... – – – 57.4 – – – – – – – – 1980 ....................................... 59.0 60.4 61.6 62.9 2.8 2.4 2.0 2.1 – – – 9.6 1981 ....................................... 65.4 66.5 67.7 69.2 4.0 1.7 1.8 2.2 10.8 10.1 9.9 10.0 1982 ....................................... 70.4 71.3 72.9 73.7 1.7 1.3 2.2 1.1 7.6 7.2 7.7 6.5 1983 ....................................... 75.0 76.0 77.5 78.4 1.8 1.3 2.0 1.2 6.5 6.6 6.3 6.4 1984 ....................................... 79.8 80.8 81.4 82.4 1.8 1.3 .7 1.2 6.4 6.3 5.0 5.1 1985 ....................................... 83.7 84.6 85.7 86.4 1.6 1.1 1.3 .8 4.9 4.7 5.3 4.9 1986 ....................................... 87.4 88.2 88.8 89.4 1.2 .9 .7 .7 4.4 4.3 3.6 3.5 1987 ....................................... 90.6 91.2 92.1 92.7 1.3 .7 1.0 .7 3.7 3.4 3.7 3.7 1988 ....................................... 93.9 95.1 96.2 97.3 1.3 1.3 1.2 1.1 3.6 4.3 4.5 5.0
See footnotes at end of table.
39

Table 6. Total compensation,1 private industry workers: Employment Cost Index by occupational and industrygroup, 1979-99
(Not seasonally adjusted) — Continued
Series and year
Indexes (June 1989=100) Percent changes for
March June Sept. Dec.3 months ended– 12 months ended–
March June Sept. Dec. March June Sept. Dec.
White-collar occupations: 1989 ....................................... 98.9 100.0 101.4 102.4 1.6 1.1 1.4 1.0 5.3 5.2 5.4 5.2 1990 ....................................... 104.1 105.5 106.7 107.4 1.7 1.3 1.1 .7 5.3 5.5 5.2 4.9 1991 ....................................... 109.0 110.3 111.4 112.2 1.5 1.2 1.0 .7 4.7 4.5 4.4 4.5 1992 ....................................... 113.4 114.2 115.1 115.9 1.1 .7 .8 .7 4.0 3.5 3.3 3.3 1993 ....................................... 117.4 118.3 119.4 120.2 1.3 .8 .9 .7 3.5 3.6 3.7 3.7 1994 ....................................... 121.5 122.5 123.5 124.1 1.1 .8 .8 .5 3.5 3.6 3.4 3.2 1995 ....................................... 125.3 126.2 127.0 127.6 1.0 .7 .6 .5 3.1 3.0 2.8 2.8 1996 ....................................... 129.0 130.0 131.1 131.7 1.1 .8 .8 .5 3.0 3.0 3.2 3.2 1997 ....................................... 133.1 134.1 135.2 136.7 1.1 .8 .8 1.1 3.2 3.2 3.1 3.8 1998 ....................................... 138.1 139.4 141.1 142.0 1.0 .9 1.2 .6 3.8 4.0 4.4 3.9 1999 ....................................... 142.4 144.1 145.6 146.9 .3 1.2 1.0 .9 3.1 3.4 3.2 3.5
White-collar occupations,excluding sales:
1979 ....................................... – – – 56.7 – – – – – – – – 1980 ....................................... 58.6 60.0 61.2 62.5 3.4 2.4 2.0 2.1 – – – 10.2 1981 ....................................... 65.1 66.1 67.7 69.0 4.2 1.5 2.4 1.9 11.1 10.2 10.6 10.4 1982 ....................................... 70.3 71.3 72.9 73.6 1.9 1.4 2.2 1.0 8.0 7.9 7.7 6.7 1983 ....................................... 75.2 76.2 77.7 78.5 2.2 1.3 2.0 1.0 7.0 6.9 6.6 6.7 1984 ....................................... 80.1 81.0 81.9 82.9 2.0 1.1 1.1 1.2 6.5 6.3 5.4 5.6 1985 ....................................... 83.7 84.6 85.7 86.1 1.0 1.1 1.3 .5 4.5 4.4 4.6 3.9 1986 ....................................... 87.3 88.1 88.7 89.4 1.4 .9 .7 .8 4.3 4.1 3.5 3.8 1987 ....................................... 90.6 91.3 92.5 93.2 1.3 .8 1.3 .8 3.8 3.6 4.3 4.3 1988 ....................................... 94.5 95.5 96.7 97.5 1.4 1.1 1.3 .8 4.3 4.6 4.5 4.6 1989 ....................................... 99.0 100.0 101.3 102.2 1.5 1.0 1.3 .9 4.8 4.7 4.8 4.8 1990 ....................................... 104.2 105.4 106.9 107.7 2.0 1.2 1.4 .7 5.3 5.4 5.5 5.4 1991 ....................................... 109.2 110.4 111.8 112.7 1.4 1.1 1.3 .8 4.8 4.7 4.6 4.6 1992 ....................................... 113.8 114.6 115.8 116.6 1.0 .7 1.0 .7 4.2 3.8 3.6 3.5 1993 ....................................... 118.3 119.2 120.2 121.0 1.5 .8 .8 .7 4.0 4.0 3.8 3.8 1994 ....................................... 122.4 123.3 124.4 125.1 1.2 .7 .9 .6 3.5 3.4 3.5 3.4 1995 ....................................... 126.3 127.0 127.8 128.6 1.0 .6 .6 .6 3.2 3.0 2.7 2.8 1996 ....................................... 129.9 130.7 132.0 132.5 1.0 .6 1.0 .4 2.9 2.9 3.3 3.0 1997 ....................................... 133.7 134.8 135.9 137.4 .9 .8 .8 1.1 2.9 3.1 3.0 3.7 1998 ....................................... 138.8 139.9 141.3 141.9 1.0 .8 1.0 .4 3.8 3.8 4.0 3.3 1999 ....................................... 143.0 144.5 146.0 147.3 .8 1.0 1.0 .9 3.0 3.3 3.3 3.8
Professional specialty andtechnical occupations:
1985 ....................................... – – – 86.1 – – – – – – – – 1986 ....................................... 87.1 87.8 88.6 89.3 1.2 .8 .9 .8 – – – 3.7 1987 ....................................... 90.3 90.8 92.1 92.9 1.1 .6 1.4 .9 3.7 3.4 4.0 4.0 1988 ....................................... 94.3 95.4 96.9 97.5 1.5 1.2 1.6 .6 4.4 5.1 5.2 5.0 1989 ....................................... 99.0 100.0 101.8 102.9 1.5 1.0 1.8 1.1 5.0 4.8 5.1 5.5 1990 ....................................... 104.9 105.8 107.5 108.7 1.9 .9 1.6 1.1 6.0 5.8 5.6 5.6 1991 ....................................... 110.1 111.1 112.8 113.9 1.3 .9 1.5 1.0 5.0 5.0 4.9 4.8 1992 ....................................... 115.3 116.4 118.0 119.0 1.2 1.0 1.4 .8 4.7 4.8 4.6 4.5 1993 ....................................... 120.4 121.3 122.2 122.9 1.2 .7 .7 .6 4.4 4.2 3.6 3.3 1994 ....................................... 124.6 125.3 126.3 126.8 1.4 .6 .8 .4 3.5 3.3 3.4 3.2 1995 ....................................... 127.7 128.4 129.3 129.9 .7 .5 .7 .5 2.5 2.5 2.4 2.4 1996 ....................................... 131.6 132.6 133.3 133.7 1.3 .8 .5 .3 3.1 3.3 3.1 2.9 1997 ....................................... 134.6 135.9 136.7 137.8 .7 1.0 .6 .8 2.3 2.5 2.6 3.1 1998 ....................................... 138.8 140.1 141.6 142.6 .7 .9 1.1 .7 3.1 3.1 3.6 3.5 1999 ....................................... 142.9 144.1 145.2 146.7 .2 .8 .8 1.0 3.0 2.9 2.5 2.9
Executive, administrative, andmanagerial occupations:
1985 ....................................... – – – 86.4 – – – – – – – –
See footnotes at end of table.
40
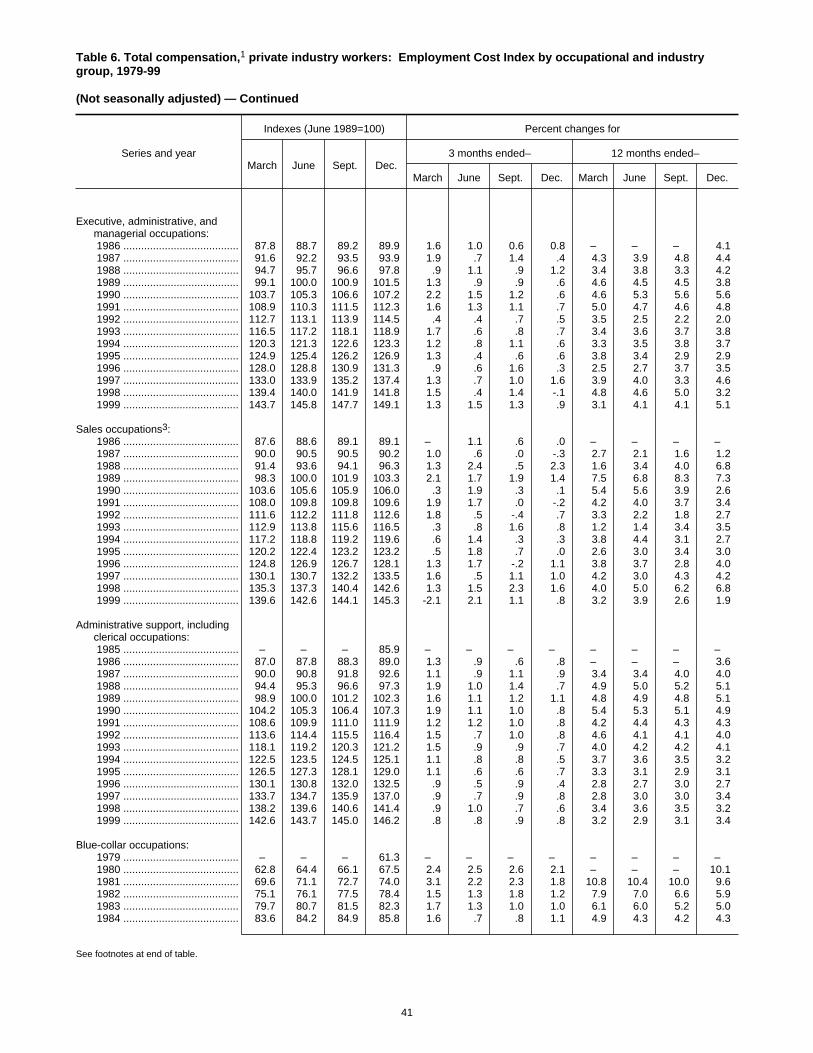
Table 6. Total compensation,1 private industry workers: Employment Cost Index by occupational and industrygroup, 1979-99
(Not seasonally adjusted) — Continued
Series and year
Indexes (June 1989=100) Percent changes for
March June Sept. Dec.3 months ended– 12 months ended–
March June Sept. Dec. March June Sept. Dec.
Executive, administrative, andmanagerial occupations:
1986 ....................................... 87.8 88.7 89.2 89.9 1.6 1.0 0.6 0.8 – – – 4.1 1987 ....................................... 91.6 92.2 93.5 93.9 1.9 .7 1.4 .4 4.3 3.9 4.8 4.4 1988 ....................................... 94.7 95.7 96.6 97.8 .9 1.1 .9 1.2 3.4 3.8 3.3 4.2 1989 ....................................... 99.1 100.0 100.9 101.5 1.3 .9 .9 .6 4.6 4.5 4.5 3.8 1990 ....................................... 103.7 105.3 106.6 107.2 2.2 1.5 1.2 .6 4.6 5.3 5.6 5.6 1991 ....................................... 108.9 110.3 111.5 112.3 1.6 1.3 1.1 .7 5.0 4.7 4.6 4.8 1992 ....................................... 112.7 113.1 113.9 114.5 .4 .4 .7 .5 3.5 2.5 2.2 2.0 1993 ....................................... 116.5 117.2 118.1 118.9 1.7 .6 .8 .7 3.4 3.6 3.7 3.8 1994 ....................................... 120.3 121.3 122.6 123.3 1.2 .8 1.1 .6 3.3 3.5 3.8 3.7 1995 ....................................... 124.9 125.4 126.2 126.9 1.3 .4 .6 .6 3.8 3.4 2.9 2.9 1996 ....................................... 128.0 128.8 130.9 131.3 .9 .6 1.6 .3 2.5 2.7 3.7 3.5 1997 ....................................... 133.0 133.9 135.2 137.4 1.3 .7 1.0 1.6 3.9 4.0 3.3 4.6 1998 ....................................... 139.4 140.0 141.9 141.8 1.5 .4 1.4 -.1 4.8 4.6 5.0 3.2 1999 ....................................... 143.7 145.8 147.7 149.1 1.3 1.5 1.3 .9 3.1 4.1 4.1 5.1
Sales occupations3: 1986 ....................................... 87.6 88.6 89.1 89.1 – 1.1 .6 .0 – – – – 1987 ....................................... 90.0 90.5 90.5 90.2 1.0 .6 .0 -.3 2.7 2.1 1.6 1.2 1988 ....................................... 91.4 93.6 94.1 96.3 1.3 2.4 .5 2.3 1.6 3.4 4.0 6.8 1989 ....................................... 98.3 100.0 101.9 103.3 2.1 1.7 1.9 1.4 7.5 6.8 8.3 7.3 1990 ....................................... 103.6 105.6 105.9 106.0 .3 1.9 .3 .1 5.4 5.6 3.9 2.6 1991 ....................................... 108.0 109.8 109.8 109.6 1.9 1.7 .0 -.2 4.2 4.0 3.7 3.4 1992 ....................................... 111.6 112.2 111.8 112.6 1.8 .5 -.4 .7 3.3 2.2 1.8 2.7 1993 ....................................... 112.9 113.8 115.6 116.5 .3 .8 1.6 .8 1.2 1.4 3.4 3.5 1994 ....................................... 117.2 118.8 119.2 119.6 .6 1.4 .3 .3 3.8 4.4 3.1 2.7 1995 ....................................... 120.2 122.4 123.2 123.2 .5 1.8 .7 .0 2.6 3.0 3.4 3.0 1996 ....................................... 124.8 126.9 126.7 128.1 1.3 1.7 -.2 1.1 3.8 3.7 2.8 4.0 1997 ....................................... 130.1 130.7 132.2 133.5 1.6 .5 1.1 1.0 4.2 3.0 4.3 4.2 1998 ....................................... 135.3 137.3 140.4 142.6 1.3 1.5 2.3 1.6 4.0 5.0 6.2 6.8 1999 ....................................... 139.6 142.6 144.1 145.3 -2.1 2.1 1.1 .8 3.2 3.9 2.6 1.9
Administrative support, includingclerical occupations:
1985 ....................................... – – – 85.9 – – – – – – – – 1986 ....................................... 87.0 87.8 88.3 89.0 1.3 .9 .6 .8 – – – 3.6 1987 ....................................... 90.0 90.8 91.8 92.6 1.1 .9 1.1 .9 3.4 3.4 4.0 4.0 1988 ....................................... 94.4 95.3 96.6 97.3 1.9 1.0 1.4 .7 4.9 5.0 5.2 5.1 1989 ....................................... 98.9 100.0 101.2 102.3 1.6 1.1 1.2 1.1 4.8 4.9 4.8 5.1 1990 ....................................... 104.2 105.3 106.4 107.3 1.9 1.1 1.0 .8 5.4 5.3 5.1 4.9 1991 ....................................... 108.6 109.9 111.0 111.9 1.2 1.2 1.0 .8 4.2 4.4 4.3 4.3 1992 ....................................... 113.6 114.4 115.5 116.4 1.5 .7 1.0 .8 4.6 4.1 4.1 4.0 1993 ....................................... 118.1 119.2 120.3 121.2 1.5 .9 .9 .7 4.0 4.2 4.2 4.1 1994 ....................................... 122.5 123.5 124.5 125.1 1.1 .8 .8 .5 3.7 3.6 3.5 3.2 1995 ....................................... 126.5 127.3 128.1 129.0 1.1 .6 .6 .7 3.3 3.1 2.9 3.1 1996 ....................................... 130.1 130.8 132.0 132.5 .9 .5 .9 .4 2.8 2.7 3.0 2.7 1997 ....................................... 133.7 134.7 135.9 137.0 .9 .7 .9 .8 2.8 3.0 3.0 3.4 1998 ....................................... 138.2 139.6 140.6 141.4 .9 1.0 .7 .6 3.4 3.6 3.5 3.2 1999 ....................................... 142.6 143.7 145.0 146.2 .8 .8 .9 .8 3.2 2.9 3.1 3.4
Blue-collar occupations: 1979 ....................................... – – – 61.3 – – – – – – – – 1980 ....................................... 62.8 64.4 66.1 67.5 2.4 2.5 2.6 2.1 – – – 10.1 1981 ....................................... 69.6 71.1 72.7 74.0 3.1 2.2 2.3 1.8 10.8 10.4 10.0 9.6 1982 ....................................... 75.1 76.1 77.5 78.4 1.5 1.3 1.8 1.2 7.9 7.0 6.6 5.9 1983 ....................................... 79.7 80.7 81.5 82.3 1.7 1.3 1.0 1.0 6.1 6.0 5.2 5.0 1984 ....................................... 83.6 84.2 84.9 85.8 1.6 .7 .8 1.1 4.9 4.3 4.2 4.3
See footnotes at end of table.
41
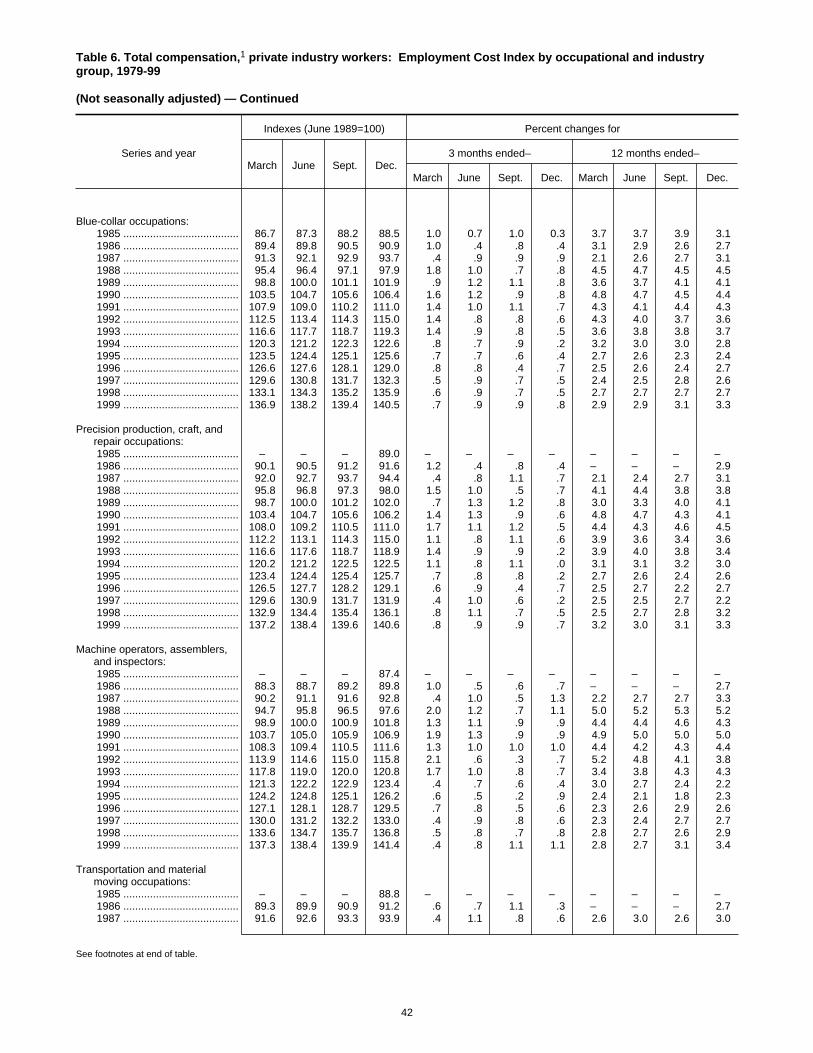
Table 6. Total compensation,1 private industry workers: Employment Cost Index by occupational and industrygroup, 1979-99
(Not seasonally adjusted) — Continued
Series and year
Indexes (June 1989=100) Percent changes for
March June Sept. Dec.3 months ended– 12 months ended–
March June Sept. Dec. March June Sept. Dec.
Blue-collar occupations: 1985 ....................................... 86.7 87.3 88.2 88.5 1.0 0.7 1.0 0.3 3.7 3.7 3.9 3.1 1986 ....................................... 89.4 89.8 90.5 90.9 1.0 .4 .8 .4 3.1 2.9 2.6 2.7 1987 ....................................... 91.3 92.1 92.9 93.7 .4 .9 .9 .9 2.1 2.6 2.7 3.1 1988 ....................................... 95.4 96.4 97.1 97.9 1.8 1.0 .7 .8 4.5 4.7 4.5 4.5 1989 ....................................... 98.8 100.0 101.1 101.9 .9 1.2 1.1 .8 3.6 3.7 4.1 4.1 1990 ....................................... 103.5 104.7 105.6 106.4 1.6 1.2 .9 .8 4.8 4.7 4.5 4.4 1991 ....................................... 107.9 109.0 110.2 111.0 1.4 1.0 1.1 .7 4.3 4.1 4.4 4.3 1992 ....................................... 112.5 113.4 114.3 115.0 1.4 .8 .8 .6 4.3 4.0 3.7 3.6 1993 ....................................... 116.6 117.7 118.7 119.3 1.4 .9 .8 .5 3.6 3.8 3.8 3.7 1994 ....................................... 120.3 121.2 122.3 122.6 .8 .7 .9 .2 3.2 3.0 3.0 2.8 1995 ....................................... 123.5 124.4 125.1 125.6 .7 .7 .6 .4 2.7 2.6 2.3 2.4 1996 ....................................... 126.6 127.6 128.1 129.0 .8 .8 .4 .7 2.5 2.6 2.4 2.7 1997 ....................................... 129.6 130.8 131.7 132.3 .5 .9 .7 .5 2.4 2.5 2.8 2.6 1998 ....................................... 133.1 134.3 135.2 135.9 .6 .9 .7 .5 2.7 2.7 2.7 2.7 1999 ....................................... 136.9 138.2 139.4 140.5 .7 .9 .9 .8 2.9 2.9 3.1 3.3
Precision production, craft, andrepair occupations:
1985 ....................................... – – – 89.0 – – – – – – – – 1986 ....................................... 90.1 90.5 91.2 91.6 1.2 .4 .8 .4 – – – 2.9 1987 ....................................... 92.0 92.7 93.7 94.4 .4 .8 1.1 .7 2.1 2.4 2.7 3.1 1988 ....................................... 95.8 96.8 97.3 98.0 1.5 1.0 .5 .7 4.1 4.4 3.8 3.8 1989 ....................................... 98.7 100.0 101.2 102.0 .7 1.3 1.2 .8 3.0 3.3 4.0 4.1 1990 ....................................... 103.4 104.7 105.6 106.2 1.4 1.3 .9 .6 4.8 4.7 4.3 4.1 1991 ....................................... 108.0 109.2 110.5 111.0 1.7 1.1 1.2 .5 4.4 4.3 4.6 4.5 1992 ....................................... 112.2 113.1 114.3 115.0 1.1 .8 1.1 .6 3.9 3.6 3.4 3.6 1993 ....................................... 116.6 117.6 118.7 118.9 1.4 .9 .9 .2 3.9 4.0 3.8 3.4 1994 ....................................... 120.2 121.2 122.5 122.5 1.1 .8 1.1 .0 3.1 3.1 3.2 3.0 1995 ....................................... 123.4 124.4 125.4 125.7 .7 .8 .8 .2 2.7 2.6 2.4 2.6 1996 ....................................... 126.5 127.7 128.2 129.1 .6 .9 .4 .7 2.5 2.7 2.2 2.7 1997 ....................................... 129.6 130.9 131.7 131.9 .4 1.0 .6 .2 2.5 2.5 2.7 2.2 1998 ....................................... 132.9 134.4 135.4 136.1 .8 1.1 .7 .5 2.5 2.7 2.8 3.2 1999 ....................................... 137.2 138.4 139.6 140.6 .8 .9 .9 .7 3.2 3.0 3.1 3.3
Machine operators, assemblers,and inspectors:
1985 ....................................... – – – 87.4 – – – – – – – – 1986 ....................................... 88.3 88.7 89.2 89.8 1.0 .5 .6 .7 – – – 2.7 1987 ....................................... 90.2 91.1 91.6 92.8 .4 1.0 .5 1.3 2.2 2.7 2.7 3.3 1988 ....................................... 94.7 95.8 96.5 97.6 2.0 1.2 .7 1.1 5.0 5.2 5.3 5.2 1989 ....................................... 98.9 100.0 100.9 101.8 1.3 1.1 .9 .9 4.4 4.4 4.6 4.3 1990 ....................................... 103.7 105.0 105.9 106.9 1.9 1.3 .9 .9 4.9 5.0 5.0 5.0 1991 ....................................... 108.3 109.4 110.5 111.6 1.3 1.0 1.0 1.0 4.4 4.2 4.3 4.4 1992 ....................................... 113.9 114.6 115.0 115.8 2.1 .6 .3 .7 5.2 4.8 4.1 3.8 1993 ....................................... 117.8 119.0 120.0 120.8 1.7 1.0 .8 .7 3.4 3.8 4.3 4.3 1994 ....................................... 121.3 122.2 122.9 123.4 .4 .7 .6 .4 3.0 2.7 2.4 2.2 1995 ....................................... 124.2 124.8 125.1 126.2 .6 .5 .2 .9 2.4 2.1 1.8 2.3 1996 ....................................... 127.1 128.1 128.7 129.5 .7 .8 .5 .6 2.3 2.6 2.9 2.6 1997 ....................................... 130.0 131.2 132.2 133.0 .4 .9 .8 .6 2.3 2.4 2.7 2.7 1998 ....................................... 133.6 134.7 135.7 136.8 .5 .8 .7 .8 2.8 2.7 2.6 2.9 1999 ....................................... 137.3 138.4 139.9 141.4 .4 .8 1.1 1.1 2.8 2.7 3.1 3.4
Transportation and materialmoving occupations:
1985 ....................................... – – – 88.8 – – – – – – – – 1986 ....................................... 89.3 89.9 90.9 91.2 .6 .7 1.1 .3 – – – 2.7 1987 ....................................... 91.6 92.6 93.3 93.9 .4 1.1 .8 .6 2.6 3.0 2.6 3.0
See footnotes at end of table.
42
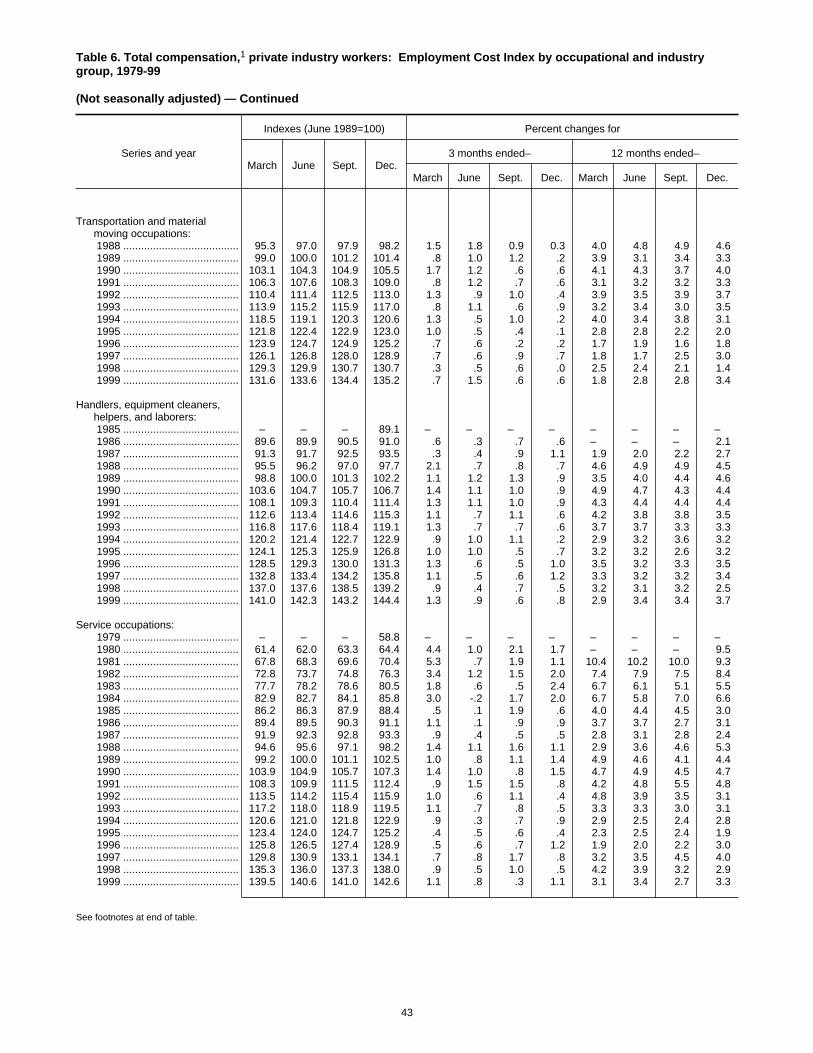
Table 6. Total compensation,1 private industry workers: Employment Cost Index by occupational and industrygroup, 1979-99
(Not seasonally adjusted) — Continued
Series and year
Indexes (June 1989=100) Percent changes for
March June Sept. Dec.3 months ended– 12 months ended–
March June Sept. Dec. March June Sept. Dec.
Transportation and materialmoving occupations:
1988 ....................................... 95.3 97.0 97.9 98.2 1.5 1.8 0.9 0.3 4.0 4.8 4.9 4.6 1989 ....................................... 99.0 100.0 101.2 101.4 .8 1.0 1.2 .2 3.9 3.1 3.4 3.3 1990 ....................................... 103.1 104.3 104.9 105.5 1.7 1.2 .6 .6 4.1 4.3 3.7 4.0 1991 ....................................... 106.3 107.6 108.3 109.0 .8 1.2 .7 .6 3.1 3.2 3.2 3.3 1992 ....................................... 110.4 111.4 112.5 113.0 1.3 .9 1.0 .4 3.9 3.5 3.9 3.7 1993 ....................................... 113.9 115.2 115.9 117.0 .8 1.1 .6 .9 3.2 3.4 3.0 3.5 1994 ....................................... 118.5 119.1 120.3 120.6 1.3 .5 1.0 .2 4.0 3.4 3.8 3.1 1995 ....................................... 121.8 122.4 122.9 123.0 1.0 .5 .4 .1 2.8 2.8 2.2 2.0 1996 ....................................... 123.9 124.7 124.9 125.2 .7 .6 .2 .2 1.7 1.9 1.6 1.8 1997 ....................................... 126.1 126.8 128.0 128.9 .7 .6 .9 .7 1.8 1.7 2.5 3.0 1998 ....................................... 129.3 129.9 130.7 130.7 .3 .5 .6 .0 2.5 2.4 2.1 1.4 1999 ....................................... 131.6 133.6 134.4 135.2 .7 1.5 .6 .6 1.8 2.8 2.8 3.4
Handlers, equipment cleaners,helpers, and laborers:
1985 ....................................... – – – 89.1 – – – – – – – – 1986 ....................................... 89.6 89.9 90.5 91.0 .6 .3 .7 .6 – – – 2.1 1987 ....................................... 91.3 91.7 92.5 93.5 .3 .4 .9 1.1 1.9 2.0 2.2 2.7 1988 ....................................... 95.5 96.2 97.0 97.7 2.1 .7 .8 .7 4.6 4.9 4.9 4.5 1989 ....................................... 98.8 100.0 101.3 102.2 1.1 1.2 1.3 .9 3.5 4.0 4.4 4.6 1990 ....................................... 103.6 104.7 105.7 106.7 1.4 1.1 1.0 .9 4.9 4.7 4.3 4.4 1991 ....................................... 108.1 109.3 110.4 111.4 1.3 1.1 1.0 .9 4.3 4.4 4.4 4.4 1992 ....................................... 112.6 113.4 114.6 115.3 1.1 .7 1.1 .6 4.2 3.8 3.8 3.5 1993 ....................................... 116.8 117.6 118.4 119.1 1.3 .7 .7 .6 3.7 3.7 3.3 3.3 1994 ....................................... 120.2 121.4 122.7 122.9 .9 1.0 1.1 .2 2.9 3.2 3.6 3.2 1995 ....................................... 124.1 125.3 125.9 126.8 1.0 1.0 .5 .7 3.2 3.2 2.6 3.2 1996 ....................................... 128.5 129.3 130.0 131.3 1.3 .6 .5 1.0 3.5 3.2 3.3 3.5 1997 ....................................... 132.8 133.4 134.2 135.8 1.1 .5 .6 1.2 3.3 3.2 3.2 3.4 1998 ....................................... 137.0 137.6 138.5 139.2 .9 .4 .7 .5 3.2 3.1 3.2 2.5 1999 ....................................... 141.0 142.3 143.2 144.4 1.3 .9 .6 .8 2.9 3.4 3.4 3.7
Service occupations: 1979 ....................................... – – – 58.8 – – – – – – – – 1980 ....................................... 61.4 62.0 63.3 64.4 4.4 1.0 2.1 1.7 – – – 9.5 1981 ....................................... 67.8 68.3 69.6 70.4 5.3 .7 1.9 1.1 10.4 10.2 10.0 9.3 1982 ....................................... 72.8 73.7 74.8 76.3 3.4 1.2 1.5 2.0 7.4 7.9 7.5 8.4 1983 ....................................... 77.7 78.2 78.6 80.5 1.8 .6 .5 2.4 6.7 6.1 5.1 5.5 1984 ....................................... 82.9 82.7 84.1 85.8 3.0 -.2 1.7 2.0 6.7 5.8 7.0 6.6 1985 ....................................... 86.2 86.3 87.9 88.4 .5 .1 1.9 .6 4.0 4.4 4.5 3.0 1986 ....................................... 89.4 89.5 90.3 91.1 1.1 .1 .9 .9 3.7 3.7 2.7 3.1 1987 ....................................... 91.9 92.3 92.8 93.3 .9 .4 .5 .5 2.8 3.1 2.8 2.4 1988 ....................................... 94.6 95.6 97.1 98.2 1.4 1.1 1.6 1.1 2.9 3.6 4.6 5.3 1989 ....................................... 99.2 100.0 101.1 102.5 1.0 .8 1.1 1.4 4.9 4.6 4.1 4.4 1990 ....................................... 103.9 104.9 105.7 107.3 1.4 1.0 .8 1.5 4.7 4.9 4.5 4.7 1991 ....................................... 108.3 109.9 111.5 112.4 .9 1.5 1.5 .8 4.2 4.8 5.5 4.8 1992 ....................................... 113.5 114.2 115.4 115.9 1.0 .6 1.1 .4 4.8 3.9 3.5 3.1 1993 ....................................... 117.2 118.0 118.9 119.5 1.1 .7 .8 .5 3.3 3.3 3.0 3.1 1994 ....................................... 120.6 121.0 121.8 122.9 .9 .3 .7 .9 2.9 2.5 2.4 2.8 1995 ....................................... 123.4 124.0 124.7 125.2 .4 .5 .6 .4 2.3 2.5 2.4 1.9 1996 ....................................... 125.8 126.5 127.4 128.9 .5 .6 .7 1.2 1.9 2.0 2.2 3.0 1997 ....................................... 129.8 130.9 133.1 134.1 .7 .8 1.7 .8 3.2 3.5 4.5 4.0 1998 ....................................... 135.3 136.0 137.3 138.0 .9 .5 1.0 .5 4.2 3.9 3.2 2.9 1999 ....................................... 139.5 140.6 141.0 142.6 1.1 .8 .3 1.1 3.1 3.4 2.7 3.3
See footnotes at end of table.
43
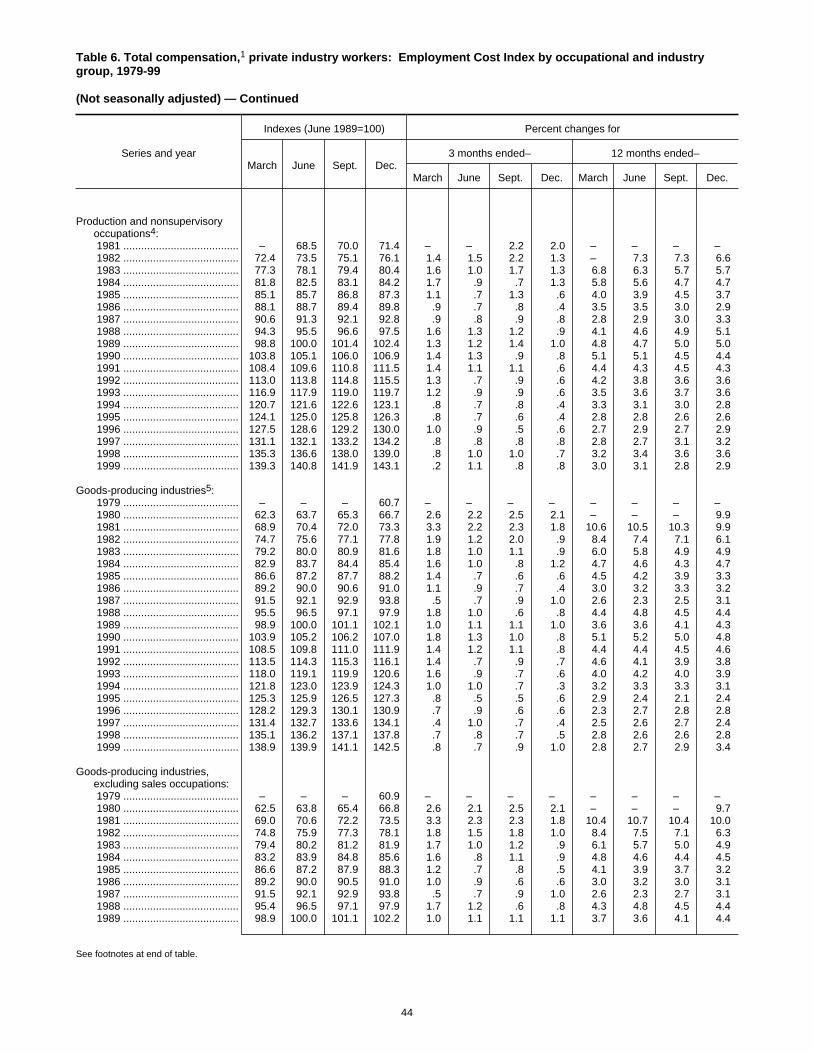
Table 6. Total compensation,1 private industry workers: Employment Cost Index by occupational and industrygroup, 1979-99
(Not seasonally adjusted) — Continued
Series and year
Indexes (June 1989=100) Percent changes for
March June Sept. Dec.3 months ended– 12 months ended–
March June Sept. Dec. March June Sept. Dec.
Production and nonsupervisoryoccupations4:
1981 ....................................... – 68.5 70.0 71.4 – – 2.2 2.0 – – – – 1982 ....................................... 72.4 73.5 75.1 76.1 1.4 1.5 2.2 1.3 – 7.3 7.3 6.6 1983 ....................................... 77.3 78.1 79.4 80.4 1.6 1.0 1.7 1.3 6.8 6.3 5.7 5.7 1984 ....................................... 81.8 82.5 83.1 84.2 1.7 .9 .7 1.3 5.8 5.6 4.7 4.7 1985 ....................................... 85.1 85.7 86.8 87.3 1.1 .7 1.3 .6 4.0 3.9 4.5 3.7 1986 ....................................... 88.1 88.7 89.4 89.8 .9 .7 .8 .4 3.5 3.5 3.0 2.9 1987 ....................................... 90.6 91.3 92.1 92.8 .9 .8 .9 .8 2.8 2.9 3.0 3.3 1988 ....................................... 94.3 95.5 96.6 97.5 1.6 1.3 1.2 .9 4.1 4.6 4.9 5.1 1989 ....................................... 98.8 100.0 101.4 102.4 1.3 1.2 1.4 1.0 4.8 4.7 5.0 5.0 1990 ....................................... 103.8 105.1 106.0 106.9 1.4 1.3 .9 .8 5.1 5.1 4.5 4.4 1991 ....................................... 108.4 109.6 110.8 111.5 1.4 1.1 1.1 .6 4.4 4.3 4.5 4.3 1992 ....................................... 113.0 113.8 114.8 115.5 1.3 .7 .9 .6 4.2 3.8 3.6 3.6 1993 ....................................... 116.9 117.9 119.0 119.7 1.2 .9 .9 .6 3.5 3.6 3.7 3.6 1994 ....................................... 120.7 121.6 122.6 123.1 .8 .7 .8 .4 3.3 3.1 3.0 2.8 1995 ....................................... 124.1 125.0 125.8 126.3 .8 .7 .6 .4 2.8 2.8 2.6 2.6 1996 ....................................... 127.5 128.6 129.2 130.0 1.0 .9 .5 .6 2.7 2.9 2.7 2.9 1997 ....................................... 131.1 132.1 133.2 134.2 .8 .8 .8 .8 2.8 2.7 3.1 3.2 1998 ....................................... 135.3 136.6 138.0 139.0 .8 1.0 1.0 .7 3.2 3.4 3.6 3.6 1999 ....................................... 139.3 140.8 141.9 143.1 .2 1.1 .8 .8 3.0 3.1 2.8 2.9
Goods-producing industries5: 1979 ....................................... – – – 60.7 – – – – – – – – 1980 ....................................... 62.3 63.7 65.3 66.7 2.6 2.2 2.5 2.1 – – – 9.9 1981 ....................................... 68.9 70.4 72.0 73.3 3.3 2.2 2.3 1.8 10.6 10.5 10.3 9.9 1982 ....................................... 74.7 75.6 77.1 77.8 1.9 1.2 2.0 .9 8.4 7.4 7.1 6.1 1983 ....................................... 79.2 80.0 80.9 81.6 1.8 1.0 1.1 .9 6.0 5.8 4.9 4.9 1984 ....................................... 82.9 83.7 84.4 85.4 1.6 1.0 .8 1.2 4.7 4.6 4.3 4.7 1985 ....................................... 86.6 87.2 87.7 88.2 1.4 .7 .6 .6 4.5 4.2 3.9 3.3 1986 ....................................... 89.2 90.0 90.6 91.0 1.1 .9 .7 .4 3.0 3.2 3.3 3.2 1987 ....................................... 91.5 92.1 92.9 93.8 .5 .7 .9 1.0 2.6 2.3 2.5 3.1 1988 ....................................... 95.5 96.5 97.1 97.9 1.8 1.0 .6 .8 4.4 4.8 4.5 4.4 1989 ....................................... 98.9 100.0 101.1 102.1 1.0 1.1 1.1 1.0 3.6 3.6 4.1 4.3 1990 ....................................... 103.9 105.2 106.2 107.0 1.8 1.3 1.0 .8 5.1 5.2 5.0 4.8 1991 ....................................... 108.5 109.8 111.0 111.9 1.4 1.2 1.1 .8 4.4 4.4 4.5 4.6 1992 ....................................... 113.5 114.3 115.3 116.1 1.4 .7 .9 .7 4.6 4.1 3.9 3.8 1993 ....................................... 118.0 119.1 119.9 120.6 1.6 .9 .7 .6 4.0 4.2 4.0 3.9 1994 ....................................... 121.8 123.0 123.9 124.3 1.0 1.0 .7 .3 3.2 3.3 3.3 3.1 1995 ....................................... 125.3 125.9 126.5 127.3 .8 .5 .5 .6 2.9 2.4 2.1 2.4 1996 ....................................... 128.2 129.3 130.1 130.9 .7 .9 .6 .6 2.3 2.7 2.8 2.8 1997 ....................................... 131.4 132.7 133.6 134.1 .4 1.0 .7 .4 2.5 2.6 2.7 2.4 1998 ....................................... 135.1 136.2 137.1 137.8 .7 .8 .7 .5 2.8 2.6 2.6 2.8 1999 ....................................... 138.9 139.9 141.1 142.5 .8 .7 .9 1.0 2.8 2.7 2.9 3.4
Goods-producing industries,excluding sales occupations:
1979 ....................................... – – – 60.9 – – – – – – – – 1980 ....................................... 62.5 63.8 65.4 66.8 2.6 2.1 2.5 2.1 – – – 9.7 1981 ....................................... 69.0 70.6 72.2 73.5 3.3 2.3 2.3 1.8 10.4 10.7 10.4 10.0 1982 ....................................... 74.8 75.9 77.3 78.1 1.8 1.5 1.8 1.0 8.4 7.5 7.1 6.3 1983 ....................................... 79.4 80.2 81.2 81.9 1.7 1.0 1.2 .9 6.1 5.7 5.0 4.9 1984 ....................................... 83.2 83.9 84.8 85.6 1.6 .8 1.1 .9 4.8 4.6 4.4 4.5 1985 ....................................... 86.6 87.2 87.9 88.3 1.2 .7 .8 .5 4.1 3.9 3.7 3.2 1986 ....................................... 89.2 90.0 90.5 91.0 1.0 .9 .6 .6 3.0 3.2 3.0 3.1 1987 ....................................... 91.5 92.1 92.9 93.8 .5 .7 .9 1.0 2.6 2.3 2.7 3.1 1988 ....................................... 95.4 96.5 97.1 97.9 1.7 1.2 .6 .8 4.3 4.8 4.5 4.4 1989 ....................................... 98.9 100.0 101.1 102.2 1.0 1.1 1.1 1.1 3.7 3.6 4.1 4.4
See footnotes at end of table.
44
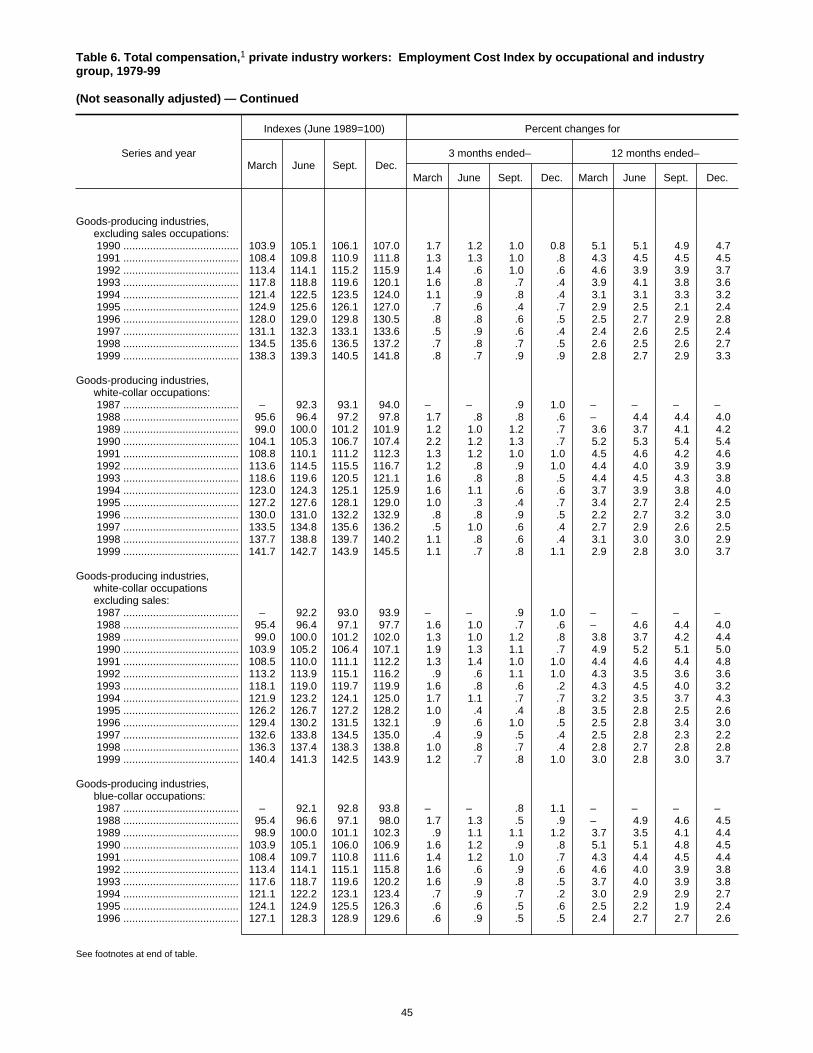
Table 6. Total compensation,1 private industry workers: Employment Cost Index by occupational and industrygroup, 1979-99
(Not seasonally adjusted) — Continued
Series and year
Indexes (June 1989=100) Percent changes for
March June Sept. Dec.3 months ended– 12 months ended–
March June Sept. Dec. March June Sept. Dec.
Goods-producing industries,excluding sales occupations:
1990 ....................................... 103.9 105.1 106.1 107.0 1.7 1.2 1.0 0.8 5.1 5.1 4.9 4.7 1991 ....................................... 108.4 109.8 110.9 111.8 1.3 1.3 1.0 .8 4.3 4.5 4.5 4.5 1992 ....................................... 113.4 114.1 115.2 115.9 1.4 .6 1.0 .6 4.6 3.9 3.9 3.7 1993 ....................................... 117.8 118.8 119.6 120.1 1.6 .8 .7 .4 3.9 4.1 3.8 3.6 1994 ....................................... 121.4 122.5 123.5 124.0 1.1 .9 .8 .4 3.1 3.1 3.3 3.2 1995 ....................................... 124.9 125.6 126.1 127.0 .7 .6 .4 .7 2.9 2.5 2.1 2.4 1996 ....................................... 128.0 129.0 129.8 130.5 .8 .8 .6 .5 2.5 2.7 2.9 2.8 1997 ....................................... 131.1 132.3 133.1 133.6 .5 .9 .6 .4 2.4 2.6 2.5 2.4 1998 ....................................... 134.5 135.6 136.5 137.2 .7 .8 .7 .5 2.6 2.5 2.6 2.7 1999 ....................................... 138.3 139.3 140.5 141.8 .8 .7 .9 .9 2.8 2.7 2.9 3.3
Goods-producing industries,white-collar occupations:
1987 ....................................... – 92.3 93.1 94.0 – – .9 1.0 – – – – 1988 ....................................... 95.6 96.4 97.2 97.8 1.7 .8 .8 .6 – 4.4 4.4 4.0 1989 ....................................... 99.0 100.0 101.2 101.9 1.2 1.0 1.2 .7 3.6 3.7 4.1 4.2 1990 ....................................... 104.1 105.3 106.7 107.4 2.2 1.2 1.3 .7 5.2 5.3 5.4 5.4 1991 ....................................... 108.8 110.1 111.2 112.3 1.3 1.2 1.0 1.0 4.5 4.6 4.2 4.6 1992 ....................................... 113.6 114.5 115.5 116.7 1.2 .8 .9 1.0 4.4 4.0 3.9 3.9 1993 ....................................... 118.6 119.6 120.5 121.1 1.6 .8 .8 .5 4.4 4.5 4.3 3.8 1994 ....................................... 123.0 124.3 125.1 125.9 1.6 1.1 .6 .6 3.7 3.9 3.8 4.0 1995 ....................................... 127.2 127.6 128.1 129.0 1.0 .3 .4 .7 3.4 2.7 2.4 2.5 1996 ....................................... 130.0 131.0 132.2 132.9 .8 .8 .9 .5 2.2 2.7 3.2 3.0 1997 ....................................... 133.5 134.8 135.6 136.2 .5 1.0 .6 .4 2.7 2.9 2.6 2.5 1998 ....................................... 137.7 138.8 139.7 140.2 1.1 .8 .6 .4 3.1 3.0 3.0 2.9 1999 ....................................... 141.7 142.7 143.9 145.5 1.1 .7 .8 1.1 2.9 2.8 3.0 3.7
Goods-producing industries,white-collar occupationsexcluding sales:
1987 ....................................... – 92.2 93.0 93.9 – – .9 1.0 – – – – 1988 ....................................... 95.4 96.4 97.1 97.7 1.6 1.0 .7 .6 – 4.6 4.4 4.0 1989 ....................................... 99.0 100.0 101.2 102.0 1.3 1.0 1.2 .8 3.8 3.7 4.2 4.4 1990 ....................................... 103.9 105.2 106.4 107.1 1.9 1.3 1.1 .7 4.9 5.2 5.1 5.0 1991 ....................................... 108.5 110.0 111.1 112.2 1.3 1.4 1.0 1.0 4.4 4.6 4.4 4.8 1992 ....................................... 113.2 113.9 115.1 116.2 .9 .6 1.1 1.0 4.3 3.5 3.6 3.6 1993 ....................................... 118.1 119.0 119.7 119.9 1.6 .8 .6 .2 4.3 4.5 4.0 3.2 1994 ....................................... 121.9 123.2 124.1 125.0 1.7 1.1 .7 .7 3.2 3.5 3.7 4.3 1995 ....................................... 126.2 126.7 127.2 128.2 1.0 .4 .4 .8 3.5 2.8 2.5 2.6 1996 ....................................... 129.4 130.2 131.5 132.1 .9 .6 1.0 .5 2.5 2.8 3.4 3.0 1997 ....................................... 132.6 133.8 134.5 135.0 .4 .9 .5 .4 2.5 2.8 2.3 2.2 1998 ....................................... 136.3 137.4 138.3 138.8 1.0 .8 .7 .4 2.8 2.7 2.8 2.8 1999 ....................................... 140.4 141.3 142.5 143.9 1.2 .7 .8 1.0 3.0 2.8 3.0 3.7
Goods-producing industries,blue-collar occupations:
1987 ....................................... – 92.1 92.8 93.8 – – .8 1.1 – – – – 1988 ....................................... 95.4 96.6 97.1 98.0 1.7 1.3 .5 .9 – 4.9 4.6 4.5 1989 ....................................... 98.9 100.0 101.1 102.3 .9 1.1 1.1 1.2 3.7 3.5 4.1 4.4 1990 ....................................... 103.9 105.1 106.0 106.9 1.6 1.2 .9 .8 5.1 5.1 4.8 4.5 1991 ....................................... 108.4 109.7 110.8 111.6 1.4 1.2 1.0 .7 4.3 4.4 4.5 4.4 1992 ....................................... 113.4 114.1 115.1 115.8 1.6 .6 .9 .6 4.6 4.0 3.9 3.8 1993 ....................................... 117.6 118.7 119.6 120.2 1.6 .9 .8 .5 3.7 4.0 3.9 3.8 1994 ....................................... 121.1 122.2 123.1 123.4 .7 .9 .7 .2 3.0 2.9 2.9 2.7 1995 ....................................... 124.1 124.9 125.5 126.3 .6 .6 .5 .6 2.5 2.2 1.9 2.4 1996 ....................................... 127.1 128.3 128.9 129.6 .6 .9 .5 .5 2.4 2.7 2.7 2.6
See footnotes at end of table.
45
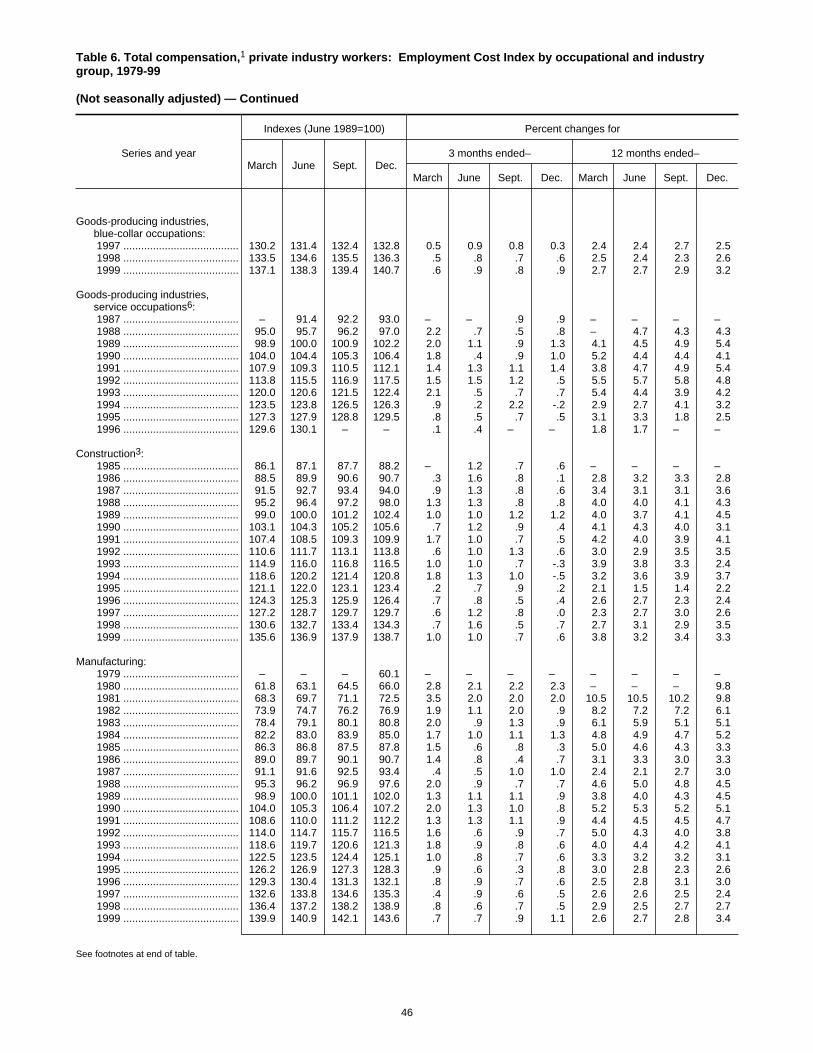
Table 6. Total compensation,1 private industry workers: Employment Cost Index by occupational and industrygroup, 1979-99
(Not seasonally adjusted) — Continued
Series and year
Indexes (June 1989=100) Percent changes for
March June Sept. Dec.3 months ended– 12 months ended–
March June Sept. Dec. March June Sept. Dec.
Goods-producing industries,blue-collar occupations:
1997 ....................................... 130.2 131.4 132.4 132.8 0.5 0.9 0.8 0.3 2.4 2.4 2.7 2.5 1998 ....................................... 133.5 134.6 135.5 136.3 .5 .8 .7 .6 2.5 2.4 2.3 2.6 1999 ....................................... 137.1 138.3 139.4 140.7 .6 .9 .8 .9 2.7 2.7 2.9 3.2
Goods-producing industries,service occupations6:
1987 ....................................... – 91.4 92.2 93.0 – – .9 .9 – – – – 1988 ....................................... 95.0 95.7 96.2 97.0 2.2 .7 .5 .8 – 4.7 4.3 4.3 1989 ....................................... 98.9 100.0 100.9 102.2 2.0 1.1 .9 1.3 4.1 4.5 4.9 5.4 1990 ....................................... 104.0 104.4 105.3 106.4 1.8 .4 .9 1.0 5.2 4.4 4.4 4.1 1991 ....................................... 107.9 109.3 110.5 112.1 1.4 1.3 1.1 1.4 3.8 4.7 4.9 5.4 1992 ....................................... 113.8 115.5 116.9 117.5 1.5 1.5 1.2 .5 5.5 5.7 5.8 4.8 1993 ....................................... 120.0 120.6 121.5 122.4 2.1 .5 .7 .7 5.4 4.4 3.9 4.2 1994 ....................................... 123.5 123.8 126.5 126.3 .9 .2 2.2 -.2 2.9 2.7 4.1 3.2 1995 ....................................... 127.3 127.9 128.8 129.5 .8 .5 .7 .5 3.1 3.3 1.8 2.5 1996 ....................................... 129.6 130.1 – – .1 .4 – – 1.8 1.7 – –
Construction3: 1985 ....................................... 86.1 87.1 87.7 88.2 – 1.2 .7 .6 – – – – 1986 ....................................... 88.5 89.9 90.6 90.7 .3 1.6 .8 .1 2.8 3.2 3.3 2.8 1987 ....................................... 91.5 92.7 93.4 94.0 .9 1.3 .8 .6 3.4 3.1 3.1 3.6 1988 ....................................... 95.2 96.4 97.2 98.0 1.3 1.3 .8 .8 4.0 4.0 4.1 4.3 1989 ....................................... 99.0 100.0 101.2 102.4 1.0 1.0 1.2 1.2 4.0 3.7 4.1 4.5 1990 ....................................... 103.1 104.3 105.2 105.6 .7 1.2 .9 .4 4.1 4.3 4.0 3.1 1991 ....................................... 107.4 108.5 109.3 109.9 1.7 1.0 .7 .5 4.2 4.0 3.9 4.1 1992 ....................................... 110.6 111.7 113.1 113.8 .6 1.0 1.3 .6 3.0 2.9 3.5 3.5 1993 ....................................... 114.9 116.0 116.8 116.5 1.0 1.0 .7 -.3 3.9 3.8 3.3 2.4 1994 ....................................... 118.6 120.2 121.4 120.8 1.8 1.3 1.0 -.5 3.2 3.6 3.9 3.7 1995 ....................................... 121.1 122.0 123.1 123.4 .2 .7 .9 .2 2.1 1.5 1.4 2.2 1996 ....................................... 124.3 125.3 125.9 126.4 .7 .8 .5 .4 2.6 2.7 2.3 2.4 1997 ....................................... 127.2 128.7 129.7 129.7 .6 1.2 .8 .0 2.3 2.7 3.0 2.6 1998 ....................................... 130.6 132.7 133.4 134.3 .7 1.6 .5 .7 2.7 3.1 2.9 3.5 1999 ....................................... 135.6 136.9 137.9 138.7 1.0 1.0 .7 .6 3.8 3.2 3.4 3.3
Manufacturing: 1979 ....................................... – – – 60.1 – – – – – – – – 1980 ....................................... 61.8 63.1 64.5 66.0 2.8 2.1 2.2 2.3 – – – 9.8 1981 ....................................... 68.3 69.7 71.1 72.5 3.5 2.0 2.0 2.0 10.5 10.5 10.2 9.8 1982 ....................................... 73.9 74.7 76.2 76.9 1.9 1.1 2.0 .9 8.2 7.2 7.2 6.1 1983 ....................................... 78.4 79.1 80.1 80.8 2.0 .9 1.3 .9 6.1 5.9 5.1 5.1 1984 ....................................... 82.2 83.0 83.9 85.0 1.7 1.0 1.1 1.3 4.8 4.9 4.7 5.2 1985 ....................................... 86.3 86.8 87.5 87.8 1.5 .6 .8 .3 5.0 4.6 4.3 3.3 1986 ....................................... 89.0 89.7 90.1 90.7 1.4 .8 .4 .7 3.1 3.3 3.0 3.3 1987 ....................................... 91.1 91.6 92.5 93.4 .4 .5 1.0 1.0 2.4 2.1 2.7 3.0 1988 ....................................... 95.3 96.2 96.9 97.6 2.0 .9 .7 .7 4.6 5.0 4.8 4.5 1989 ....................................... 98.9 100.0 101.1 102.0 1.3 1.1 1.1 .9 3.8 4.0 4.3 4.5 1990 ....................................... 104.0 105.3 106.4 107.2 2.0 1.3 1.0 .8 5.2 5.3 5.2 5.1 1991 ....................................... 108.6 110.0 111.2 112.2 1.3 1.3 1.1 .9 4.4 4.5 4.5 4.7 1992 ....................................... 114.0 114.7 115.7 116.5 1.6 .6 .9 .7 5.0 4.3 4.0 3.8 1993 ....................................... 118.6 119.7 120.6 121.3 1.8 .9 .8 .6 4.0 4.4 4.2 4.1 1994 ....................................... 122.5 123.5 124.4 125.1 1.0 .8 .7 .6 3.3 3.2 3.2 3.1 1995 ....................................... 126.2 126.9 127.3 128.3 .9 .6 .3 .8 3.0 2.8 2.3 2.6 1996 ....................................... 129.3 130.4 131.3 132.1 .8 .9 .7 .6 2.5 2.8 3.1 3.0 1997 ....................................... 132.6 133.8 134.6 135.3 .4 .9 .6 .5 2.6 2.6 2.5 2.4 1998 ....................................... 136.4 137.2 138.2 138.9 .8 .6 .7 .5 2.9 2.5 2.7 2.7 1999 ....................................... 139.9 140.9 142.1 143.6 .7 .7 .9 1.1 2.6 2.7 2.8 3.4
See footnotes at end of table.
46
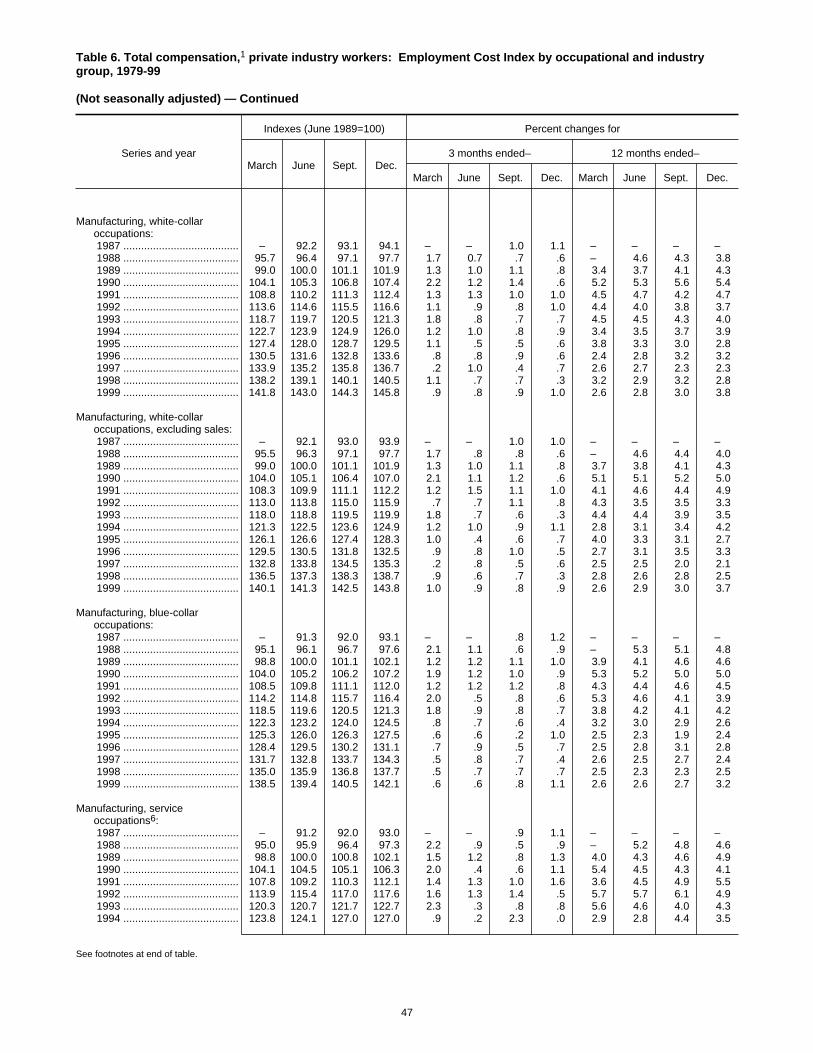
Table 6. Total compensation,1 private industry workers: Employment Cost Index by occupational and industrygroup, 1979-99
(Not seasonally adjusted) — Continued
Series and year
Indexes (June 1989=100) Percent changes for
March June Sept. Dec.3 months ended– 12 months ended–
March June Sept. Dec. March June Sept. Dec.
Manufacturing, white-collaroccupations:
1987 ....................................... – 92.2 93.1 94.1 – – 1.0 1.1 – – – – 1988 ....................................... 95.7 96.4 97.1 97.7 1.7 0.7 .7 .6 – 4.6 4.3 3.8 1989 ....................................... 99.0 100.0 101.1 101.9 1.3 1.0 1.1 .8 3.4 3.7 4.1 4.3 1990 ....................................... 104.1 105.3 106.8 107.4 2.2 1.2 1.4 .6 5.2 5.3 5.6 5.4 1991 ....................................... 108.8 110.2 111.3 112.4 1.3 1.3 1.0 1.0 4.5 4.7 4.2 4.7 1992 ....................................... 113.6 114.6 115.5 116.6 1.1 .9 .8 1.0 4.4 4.0 3.8 3.7 1993 ....................................... 118.7 119.7 120.5 121.3 1.8 .8 .7 .7 4.5 4.5 4.3 4.0 1994 ....................................... 122.7 123.9 124.9 126.0 1.2 1.0 .8 .9 3.4 3.5 3.7 3.9 1995 ....................................... 127.4 128.0 128.7 129.5 1.1 .5 .5 .6 3.8 3.3 3.0 2.8 1996 ....................................... 130.5 131.6 132.8 133.6 .8 .8 .9 .6 2.4 2.8 3.2 3.2 1997 ....................................... 133.9 135.2 135.8 136.7 .2 1.0 .4 .7 2.6 2.7 2.3 2.3 1998 ....................................... 138.2 139.1 140.1 140.5 1.1 .7 .7 .3 3.2 2.9 3.2 2.8 1999 ....................................... 141.8 143.0 144.3 145.8 .9 .8 .9 1.0 2.6 2.8 3.0 3.8
Manufacturing, white-collaroccupations, excluding sales:
1987 ....................................... – 92.1 93.0 93.9 – – 1.0 1.0 – – – – 1988 ....................................... 95.5 96.3 97.1 97.7 1.7 .8 .8 .6 – 4.6 4.4 4.0 1989 ....................................... 99.0 100.0 101.1 101.9 1.3 1.0 1.1 .8 3.7 3.8 4.1 4.3 1990 ....................................... 104.0 105.1 106.4 107.0 2.1 1.1 1.2 .6 5.1 5.1 5.2 5.0 1991 ....................................... 108.3 109.9 111.1 112.2 1.2 1.5 1.1 1.0 4.1 4.6 4.4 4.9 1992 ....................................... 113.0 113.8 115.0 115.9 .7 .7 1.1 .8 4.3 3.5 3.5 3.3 1993 ....................................... 118.0 118.8 119.5 119.9 1.8 .7 .6 .3 4.4 4.4 3.9 3.5 1994 ....................................... 121.3 122.5 123.6 124.9 1.2 1.0 .9 1.1 2.8 3.1 3.4 4.2 1995 ....................................... 126.1 126.6 127.4 128.3 1.0 .4 .6 .7 4.0 3.3 3.1 2.7 1996 ....................................... 129.5 130.5 131.8 132.5 .9 .8 1.0 .5 2.7 3.1 3.5 3.3 1997 ....................................... 132.8 133.8 134.5 135.3 .2 .8 .5 .6 2.5 2.5 2.0 2.1 1998 ....................................... 136.5 137.3 138.3 138.7 .9 .6 .7 .3 2.8 2.6 2.8 2.5 1999 ....................................... 140.1 141.3 142.5 143.8 1.0 .9 .8 .9 2.6 2.9 3.0 3.7
Manufacturing, blue-collaroccupations:
1987 ....................................... – 91.3 92.0 93.1 – – .8 1.2 – – – – 1988 ....................................... 95.1 96.1 96.7 97.6 2.1 1.1 .6 .9 – 5.3 5.1 4.8 1989 ....................................... 98.8 100.0 101.1 102.1 1.2 1.2 1.1 1.0 3.9 4.1 4.6 4.6 1990 ....................................... 104.0 105.2 106.2 107.2 1.9 1.2 1.0 .9 5.3 5.2 5.0 5.0 1991 ....................................... 108.5 109.8 111.1 112.0 1.2 1.2 1.2 .8 4.3 4.4 4.6 4.5 1992 ....................................... 114.2 114.8 115.7 116.4 2.0 .5 .8 .6 5.3 4.6 4.1 3.9 1993 ....................................... 118.5 119.6 120.5 121.3 1.8 .9 .8 .7 3.8 4.2 4.1 4.2 1994 ....................................... 122.3 123.2 124.0 124.5 .8 .7 .6 .4 3.2 3.0 2.9 2.6 1995 ....................................... 125.3 126.0 126.3 127.5 .6 .6 .2 1.0 2.5 2.3 1.9 2.4 1996 ....................................... 128.4 129.5 130.2 131.1 .7 .9 .5 .7 2.5 2.8 3.1 2.8 1997 ....................................... 131.7 132.8 133.7 134.3 .5 .8 .7 .4 2.6 2.5 2.7 2.4 1998 ....................................... 135.0 135.9 136.8 137.7 .5 .7 .7 .7 2.5 2.3 2.3 2.5 1999 ....................................... 138.5 139.4 140.5 142.1 .6 .6 .8 1.1 2.6 2.6 2.7 3.2
Manufacturing, serviceoccupations6:
1987 ....................................... – 91.2 92.0 93.0 – – .9 1.1 – – – – 1988 ....................................... 95.0 95.9 96.4 97.3 2.2 .9 .5 .9 – 5.2 4.8 4.6 1989 ....................................... 98.8 100.0 100.8 102.1 1.5 1.2 .8 1.3 4.0 4.3 4.6 4.9 1990 ....................................... 104.1 104.5 105.1 106.3 2.0 .4 .6 1.1 5.4 4.5 4.3 4.1 1991 ....................................... 107.8 109.2 110.3 112.1 1.4 1.3 1.0 1.6 3.6 4.5 4.9 5.5 1992 ....................................... 113.9 115.4 117.0 117.6 1.6 1.3 1.4 .5 5.7 5.7 6.1 4.9 1993 ....................................... 120.3 120.7 121.7 122.7 2.3 .3 .8 .8 5.6 4.6 4.0 4.3 1994 ....................................... 123.8 124.1 127.0 127.0 .9 .2 2.3 .0 2.9 2.8 4.4 3.5
See footnotes at end of table.
47
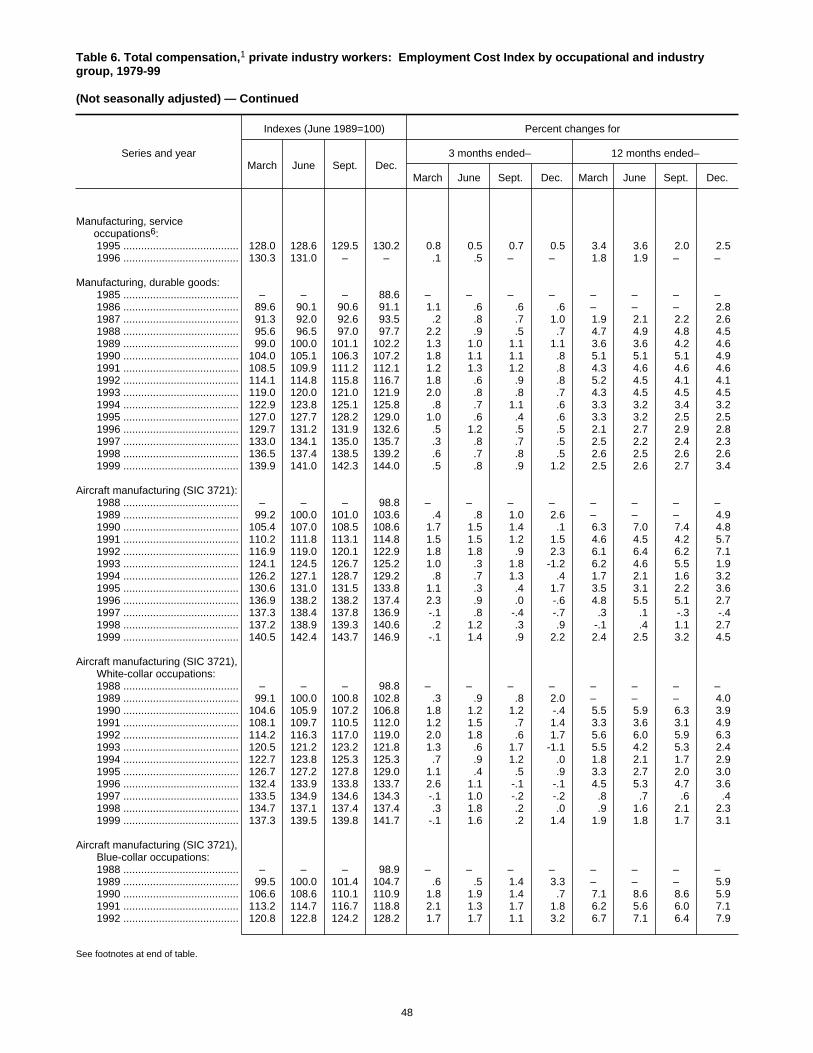
Table 6. Total compensation,1 private industry workers: Employment Cost Index by occupational and industrygroup, 1979-99
(Not seasonally adjusted) — Continued
Series and year
Indexes (June 1989=100) Percent changes for
March June Sept. Dec.3 months ended– 12 months ended–
March June Sept. Dec. March June Sept. Dec.
Manufacturing, serviceoccupations6:
1995 ....................................... 128.0 128.6 129.5 130.2 0.8 0.5 0.7 0.5 3.4 3.6 2.0 2.5 1996 ....................................... 130.3 131.0 – – .1 .5 – – 1.8 1.9 – –
Manufacturing, durable goods: 1985 ....................................... – – – 88.6 – – – – – – – – 1986 ....................................... 89.6 90.1 90.6 91.1 1.1 .6 .6 .6 – – – 2.8 1987 ....................................... 91.3 92.0 92.6 93.5 .2 .8 .7 1.0 1.9 2.1 2.2 2.6 1988 ....................................... 95.6 96.5 97.0 97.7 2.2 .9 .5 .7 4.7 4.9 4.8 4.5 1989 ....................................... 99.0 100.0 101.1 102.2 1.3 1.0 1.1 1.1 3.6 3.6 4.2 4.6 1990 ....................................... 104.0 105.1 106.3 107.2 1.8 1.1 1.1 .8 5.1 5.1 5.1 4.9 1991 ....................................... 108.5 109.9 111.2 112.1 1.2 1.3 1.2 .8 4.3 4.6 4.6 4.6 1992 ....................................... 114.1 114.8 115.8 116.7 1.8 .6 .9 .8 5.2 4.5 4.1 4.1 1993 ....................................... 119.0 120.0 121.0 121.9 2.0 .8 .8 .7 4.3 4.5 4.5 4.5 1994 ....................................... 122.9 123.8 125.1 125.8 .8 .7 1.1 .6 3.3 3.2 3.4 3.2 1995 ....................................... 127.0 127.7 128.2 129.0 1.0 .6 .4 .6 3.3 3.2 2.5 2.5 1996 ....................................... 129.7 131.2 131.9 132.6 .5 1.2 .5 .5 2.1 2.7 2.9 2.8 1997 ....................................... 133.0 134.1 135.0 135.7 .3 .8 .7 .5 2.5 2.2 2.4 2.3 1998 ....................................... 136.5 137.4 138.5 139.2 .6 .7 .8 .5 2.6 2.5 2.6 2.6 1999 ....................................... 139.9 141.0 142.3 144.0 .5 .8 .9 1.2 2.5 2.6 2.7 3.4
Aircraft manufacturing (SIC 3721): 1988 ....................................... – – – 98.8 – – – – – – – – 1989 ....................................... 99.2 100.0 101.0 103.6 .4 .8 1.0 2.6 – – – 4.9 1990 ....................................... 105.4 107.0 108.5 108.6 1.7 1.5 1.4 .1 6.3 7.0 7.4 4.8 1991 ....................................... 110.2 111.8 113.1 114.8 1.5 1.5 1.2 1.5 4.6 4.5 4.2 5.7 1992 ....................................... 116.9 119.0 120.1 122.9 1.8 1.8 .9 2.3 6.1 6.4 6.2 7.1 1993 ....................................... 124.1 124.5 126.7 125.2 1.0 .3 1.8 -1.2 6.2 4.6 5.5 1.9 1994 ....................................... 126.2 127.1 128.7 129.2 .8 .7 1.3 .4 1.7 2.1 1.6 3.2 1995 ....................................... 130.6 131.0 131.5 133.8 1.1 .3 .4 1.7 3.5 3.1 2.2 3.6 1996 ....................................... 136.9 138.2 138.2 137.4 2.3 .9 .0 -.6 4.8 5.5 5.1 2.7 1997 ....................................... 137.3 138.4 137.8 136.9 -.1 .8 -.4 -.7 .3 .1 -.3 -.4 1998 ....................................... 137.2 138.9 139.3 140.6 .2 1.2 .3 .9 -.1 .4 1.1 2.7 1999 ....................................... 140.5 142.4 143.7 146.9 -.1 1.4 .9 2.2 2.4 2.5 3.2 4.5
Aircraft manufacturing (SIC 3721), White-collar occupations:
1988 ....................................... – – – 98.8 – – – – – – – – 1989 ....................................... 99.1 100.0 100.8 102.8 .3 .9 .8 2.0 – – – 4.0 1990 ....................................... 104.6 105.9 107.2 106.8 1.8 1.2 1.2 -.4 5.5 5.9 6.3 3.9 1991 ....................................... 108.1 109.7 110.5 112.0 1.2 1.5 .7 1.4 3.3 3.6 3.1 4.9 1992 ....................................... 114.2 116.3 117.0 119.0 2.0 1.8 .6 1.7 5.6 6.0 5.9 6.3 1993 ....................................... 120.5 121.2 123.2 121.8 1.3 .6 1.7 -1.1 5.5 4.2 5.3 2.4 1994 ....................................... 122.7 123.8 125.3 125.3 .7 .9 1.2 .0 1.8 2.1 1.7 2.9 1995 ....................................... 126.7 127.2 127.8 129.0 1.1 .4 .5 .9 3.3 2.7 2.0 3.0 1996 ....................................... 132.4 133.9 133.8 133.7 2.6 1.1 -.1 -.1 4.5 5.3 4.7 3.6 1997 ....................................... 133.5 134.9 134.6 134.3 -.1 1.0 -.2 -.2 .8 .7 .6 .4 1998 ....................................... 134.7 137.1 137.4 137.4 .3 1.8 .2 .0 .9 1.6 2.1 2.3 1999 ....................................... 137.3 139.5 139.8 141.7 -.1 1.6 .2 1.4 1.9 1.8 1.7 3.1
Aircraft manufacturing (SIC 3721), Blue-collar occupations:
1988 ....................................... – – – 98.9 – – – – – – – – 1989 ....................................... 99.5 100.0 101.4 104.7 .6 .5 1.4 3.3 – – – 5.9 1990 ....................................... 106.6 108.6 110.1 110.9 1.8 1.9 1.4 .7 7.1 8.6 8.6 5.9 1991 ....................................... 113.2 114.7 116.7 118.8 2.1 1.3 1.7 1.8 6.2 5.6 6.0 7.1 1992 ....................................... 120.8 122.8 124.2 128.2 1.7 1.7 1.1 3.2 6.7 7.1 6.4 7.9
See footnotes at end of table.
48

Table 6. Total compensation,1 private industry workers: Employment Cost Index by occupational and industrygroup, 1979-99
(Not seasonally adjusted) — Continued
Series and year
Indexes (June 1989=100) Percent changes for
March June Sept. Dec.3 months ended– 12 months ended–
March June Sept. Dec. March June Sept. Dec.
Aircraft manufacturing (SIC 3721), Blue-collar occupations:
1993 ....................................... 129.2 129.2 131.5 129.8 0.8 0.0 1.8 -1.3 7.0 5.2 5.9 1.2 1994 ....................................... 130.9 131.5 133.2 134.2 .8 .5 1.3 .8 1.3 1.8 1.3 3.4 1995 ....................................... 135.7 136.1 136.3 140.5 1.1 .3 .1 3.1 3.7 3.5 2.3 4.7 1996 ....................................... 143.3 144.1 144.4 142.3 2.0 .6 .2 -1.5 5.6 5.9 5.9 1.3 1997 ....................................... 142.3 142.8 141.8 139.6 .0 .4 -.7 -1.6 -.7 -.9 -1.8 -1.9 1998 ....................................... 139.6 140.1 140.8 144.4 .0 .4 .5 2.6 -1.9 -1.9 -.7 3.4 1999 ....................................... 144.3 145.7 149.0 154.4 -.1 1.0 2.3 3.6 3.4 4.0 5.8 6.9
Manufacturing, nondurable goods: 1985 ....................................... – – – 86.5 – – – – – – – – 1986 ....................................... 87.7 88.9 89.4 90.0 1.4 1.4 .6 .7 – – – 4.0 1987 ....................................... 90.7 91.2 92.3 93.4 .8 .6 1.2 1.2 3.4 2.6 3.2 3.8 1988 ....................................... 94.8 95.6 96.5 97.5 1.5 .8 .9 1.0 4.5 4.8 4.6 4.4 1989 ....................................... 98.8 100.0 101.2 101.9 1.3 1.2 1.2 .7 4.2 4.6 4.9 4.5 1990 ....................................... 104.1 105.5 106.6 107.4 2.2 1.3 1.0 .8 5.4 5.5 5.3 5.4 1991 ....................................... 108.8 110.1 111.2 112.3 1.3 1.2 1.0 1.0 4.5 4.4 4.3 4.6 1992 ....................................... 113.8 114.7 115.4 116.3 1.3 .8 .6 .8 4.6 4.2 3.8 3.6 1993 ....................................... 117.9 119.0 119.7 120.3 1.4 .9 .6 .5 3.6 3.7 3.7 3.4 1994 ....................................... 121.7 122.8 123.2 123.8 1.2 .9 .3 .5 3.2 3.2 2.9 2.9 1995 ....................................... 124.7 125.4 125.7 127.0 .7 .6 .2 1.0 2.5 2.1 2.0 2.6 1996 ....................................... 128.3 128.9 130.0 131.0 1.0 .5 .9 .8 2.9 2.8 3.4 3.1 1997 ....................................... 131.7 133.0 133.7 134.5 .5 1.0 .5 .6 2.7 3.2 2.8 2.7 1998 ....................................... 135.9 136.7 137.6 138.2 1.0 .6 .7 .4 3.2 2.8 2.9 2.8 1999 ....................................... 139.6 140.4 141.5 142.8 1.0 .6 .8 .9 2.7 2.7 2.8 3.3
Service-producing industries7: 1979 ....................................... – – – 57.7 – – – – – – – – 1980 ....................................... 59.3 60.7 62.1 63.3 2.8 2.4 2.3 1.9 – – – 9.7 1981 ....................................... 65.8 66.9 68.1 69.5 3.9 1.7 1.8 2.1 11.0 10.2 9.7 9.8 1982 ....................................... 70.6 71.5 73.0 74.1 1.6 1.3 2.1 1.5 7.3 6.9 7.2 6.6 1983 ....................................... 75.4 76.4 77.7 78.9 1.8 1.3 1.7 1.5 6.8 6.9 6.4 6.5 1984 ....................................... 80.3 81.1 81.7 82.9 1.8 1.0 .7 1.5 6.5 6.2 5.1 5.1 1985 ....................................... 83.7 84.5 86.1 86.6 1.0 1.0 1.9 .6 4.2 4.2 5.4 4.5 1986 ....................................... 87.5 88.0 88.8 89.3 1.0 .6 .9 .6 4.5 4.1 3.1 3.1 1987 ....................................... 90.5 91.2 92.1 92.6 1.3 .8 1.0 .5 3.4 3.6 3.7 3.7 1988 ....................................... 93.8 95.1 96.2 97.3 1.3 1.4 1.2 1.1 3.6 4.3 4.5 5.1 1989 ....................................... 98.8 100.0 101.3 102.3 1.5 1.2 1.3 1.0 5.3 5.2 5.3 5.1 1990 ....................................... 103.8 105.2 106.2 107.0 1.5 1.3 1.0 .8 5.1 5.2 4.8 4.6 1991 ....................................... 108.5 109.8 111.0 111.6 1.4 1.2 1.1 .5 4.5 4.4 4.5 4.3 1992 ....................................... 112.8 113.6 114.4 115.2 1.1 .7 .7 .7 4.0 3.5 3.1 3.2 1993 ....................................... 116.4 117.3 118.5 119.3 1.0 .8 1.0 .7 3.2 3.3 3.6 3.6 1994 ....................................... 120.4 121.2 122.3 122.8 .9 .7 .9 .4 3.4 3.3 3.2 2.9 1995 ....................................... 123.9 124.9 125.8 126.2 .9 .8 .7 .3 2.9 3.1 2.9 2.8 1996 ....................................... 127.6 128.6 129.5 130.2 1.1 .8 .7 .5 3.0 3.0 2.9 3.2 1997 ....................................... 131.6 132.5 133.8 135.3 1.1 .7 1.0 1.1 3.1 3.0 3.3 3.9 1998 ....................................... 136.7 137.8 139.6 140.5 1.0 .8 1.3 .6 3.9 4.0 4.3 3.8 1999 ....................................... 140.9 142.8 144.1 145.3 .3 1.3 .9 .8 3.1 3.6 3.2 3.4
Service-producing industries,excluding sales occupations:
1979 ....................................... – – – 57.9 – – – – – – – – 1980 ....................................... 59.1 60.5 61.8 63.0 2.1 2.4 2.1 1.9 – – – 8.8 1981 ....................................... 65.6 66.5 68.0 69.3 4.1 1.4 2.3 1.9 11.0 9.9 10.0 10.0 1982 ....................................... 70.5 71.5 73.1 74.1 1.7 1.4 2.2 1.4 7.5 7.5 7.5 6.9 1983 ....................................... 75.5 76.5 77.9 78.9 1.9 1.3 1.8 1.3 7.1 7.0 6.6 6.5 1984 ....................................... 80.5 81.3 82.0 83.2 2.0 1.0 .9 1.5 6.6 6.3 5.3 5.4
See footnotes at end of table.
49

Table 6. Total compensation,1 private industry workers: Employment Cost Index by occupational and industrygroup, 1979-99
(Not seasonally adjusted) — Continued
Series and year
Indexes (June 1989=100) Percent changes for
March June Sept. Dec.3 months ended– 12 months ended–
March June Sept. Dec. March June Sept. Dec.
Service-producing industries,excluding sales occupations:
1985 ....................................... 83.9 84.7 86.2 86.5 0.8 1.0 1.8 0.3 4.2 4.2 5.1 4.0 1986 ....................................... 87.5 88.0 88.8 89.5 1.2 .6 .9 .8 4.3 3.9 3.0 3.5 1987 ....................................... 90.6 91.4 92.5 93.1 1.2 .9 1.2 .6 3.5 3.9 4.2 4.0 1988 ....................................... 94.3 95.4 96.7 97.5 1.3 1.2 1.4 .8 4.1 4.4 4.5 4.7 1989 ....................................... 98.9 100.0 101.2 102.1 1.4 1.1 1.2 .9 4.9 4.8 4.7 4.7 1990 ....................................... 103.9 105.1 106.4 107.3 1.8 1.2 1.2 .8 5.1 5.1 5.1 5.1 1991 ....................................... 108.7 109.9 111.3 112.1 1.3 1.1 1.3 .7 4.6 4.6 4.6 4.5 1992 ....................................... 113.2 114.0 115.1 115.9 1.0 .7 1.0 .7 4.1 3.7 3.4 3.4 1993 ....................................... 117.3 118.3 119.3 120.2 1.2 .9 .8 .8 3.6 3.8 3.6 3.7 1994 ....................................... 121.4 122.1 123.3 123.8 1.0 .6 1.0 .4 3.5 3.2 3.4 3.0 1995 ....................................... 125.0 125.8 126.6 127.2 1.0 .6 .6 .5 3.0 3.0 2.7 2.7 1996 ....................................... 128.4 129.2 130.3 130.9 .9 .6 .9 .5 2.7 2.7 2.9 2.9 1997 ....................................... 132.2 133.3 134.5 136.1 1.0 .8 .9 1.2 3.0 3.2 3.2 4.0 1998 ....................................... 137.4 138.5 140.0 140.6 1.0 .8 1.1 .4 3.9 3.9 4.1 3.3 1999 ....................................... 141.7 143.3 144.6 145.9 .8 1.1 .9 .9 3.1 3.5 3.3 3.8
Service-producing industries,white-collar occupations:
1987 ....................................... – 90.7 91.8 92.1 – – 1.2 .3 – – – – 1988 ....................................... 93.4 94.7 95.9 97.2 1.4 1.4 1.3 1.4 – 4.4 4.5 5.5 1989 ....................................... 98.8 100.0 101.4 102.6 1.6 1.2 1.4 1.2 5.8 5.6 5.7 5.6 1990 ....................................... 104.2 105.5 106.7 107.4 1.6 1.2 1.1 .7 5.5 5.5 5.2 4.7 1991 ....................................... 109.1 110.4 111.5 112.1 1.6 1.2 1.0 .5 4.7 4.6 4.5 4.4 1992 ....................................... 113.4 114.1 114.9 115.7 1.2 .6 .7 .7 3.9 3.4 3.0 3.2 1993 ....................................... 116.9 117.8 119.0 119.8 1.0 .8 1.0 .7 3.1 3.2 3.6 3.5 1994 ....................................... 121.0 121.9 122.9 123.4 1.0 .7 .8 .4 3.5 3.5 3.3 3.0 1995 ....................................... 124.6 125.6 126.5 127.1 1.0 .8 .7 .5 3.0 3.0 2.9 3.0 1996 ....................................... 128.5 129.6 130.6 131.1 1.1 .9 .8 .4 3.1 3.2 3.2 3.1 1997 ....................................... 132.7 133.7 134.9 136.6 1.2 .8 .9 1.3 3.3 3.2 3.3 4.2 1998 ....................................... 138.0 139.3 141.2 142.2 1.0 .9 1.4 .7 4.0 4.2 4.7 4.1 1999 ....................................... 142.3 144.3 145.8 147.0 .1 1.4 1.0 .8 3.1 3.6 3.3 3.4
Service-producing industries,white-collar occupations,excluding sales:
1987 ....................................... – 90.9 92.3 92.9 – – 1.5 .7 – – – – 1988 ....................................... 94.1 95.1 96.6 97.5 1.3 1.1 1.6 .9 – 4.6 4.7 5.0 1989 ....................................... 99.0 100.0 101.4 102.3 1.5 1.0 1.4 .9 5.2 5.2 5.0 4.9 1990 ....................................... 104.4 105.6 107.1 108.0 2.1 1.1 1.4 .8 5.5 5.6 5.6 5.6 1991 ....................................... 109.5 110.6 112.1 113.0 1.4 1.0 1.4 .8 4.9 4.7 4.7 4.6 1992 ....................................... 114.1 114.9 116.1 116.8 1.0 .7 1.0 .6 4.2 3.9 3.6 3.4 1993 ....................................... 118.4 119.3 120.4 121.4 1.4 .8 .9 .8 3.8 3.8 3.7 3.9 1994 ....................................... 122.7 123.4 124.6 125.1 1.1 .6 1.0 .4 3.6 3.4 3.5 3.0 1995 ....................................... 126.4 127.1 128.0 128.7 1.0 .6 .7 .5 3.0 3.0 2.7 2.9 1996 ....................................... 130.0 130.9 132.2 132.6 1.0 .7 1.0 .3 2.8 3.0 3.3 3.0 1997 ....................................... 134.0 135.1 136.3 138.1 1.1 .8 .9 1.3 3.1 3.2 3.1 4.1 1998 ....................................... 139.5 140.6 142.2 142.8 1.0 .8 1.1 .4 4.1 4.1 4.3 3.4 1999 ....................................... 143.8 145.5 147.0 148.3 .7 1.2 1.0 .9 3.1 3.5 3.4 3.9
Service-producing industries,blue-collar occupations:
1987 ....................................... – 92.2 93.0 93.8 – – .9 .9 – – – – 1988 ....................................... 95.2 96.2 97.1 97.5 1.5 1.1 .9 .4 – 4.3 4.4 3.9 1989 ....................................... 98.7 100.0 101.1 101.1 1.2 1.3 1.1 .0 3.7 4.0 4.1 3.7 1990 ....................................... 102.6 103.9 104.8 105.4 1.5 1.3 .9 .6 4.0 3.9 3.7 4.3 1991 ....................................... 106.6 107.6 108.7 109.4 1.1 .9 1.0 .6 3.9 3.6 3.7 3.8
See footnotes at end of table.
50
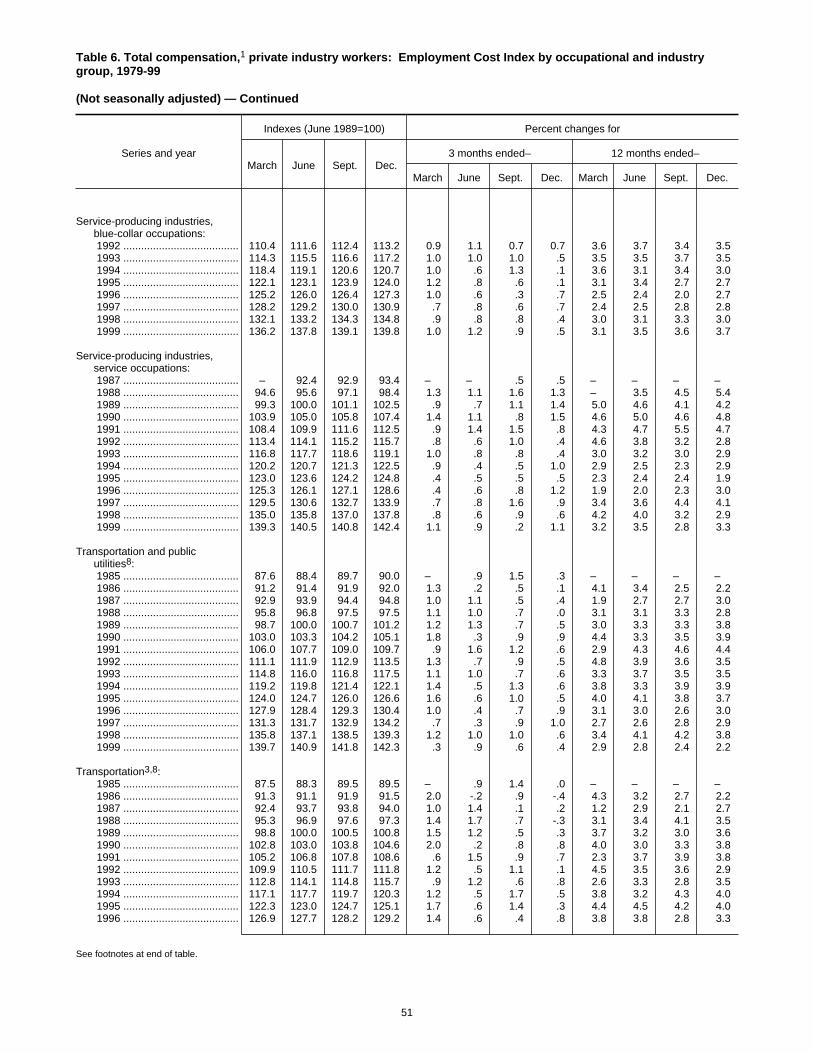
Table 6. Total compensation,1 private industry workers: Employment Cost Index by occupational and industrygroup, 1979-99
(Not seasonally adjusted) — Continued
Series and year
Indexes (June 1989=100) Percent changes for
March June Sept. Dec.3 months ended– 12 months ended–
March June Sept. Dec. March June Sept. Dec.
Service-producing industries,blue-collar occupations:
1992 ....................................... 110.4 111.6 112.4 113.2 0.9 1.1 0.7 0.7 3.6 3.7 3.4 3.5 1993 ....................................... 114.3 115.5 116.6 117.2 1.0 1.0 1.0 .5 3.5 3.5 3.7 3.5 1994 ....................................... 118.4 119.1 120.6 120.7 1.0 .6 1.3 .1 3.6 3.1 3.4 3.0 1995 ....................................... 122.1 123.1 123.9 124.0 1.2 .8 .6 .1 3.1 3.4 2.7 2.7 1996 ....................................... 125.2 126.0 126.4 127.3 1.0 .6 .3 .7 2.5 2.4 2.0 2.7 1997 ....................................... 128.2 129.2 130.0 130.9 .7 .8 .6 .7 2.4 2.5 2.8 2.8 1998 ....................................... 132.1 133.2 134.3 134.8 .9 .8 .8 .4 3.0 3.1 3.3 3.0 1999 ....................................... 136.2 137.8 139.1 139.8 1.0 1.2 .9 .5 3.1 3.5 3.6 3.7
Service-producing industries,service occupations:
1987 ....................................... – 92.4 92.9 93.4 – – .5 .5 – – – – 1988 ....................................... 94.6 95.6 97.1 98.4 1.3 1.1 1.6 1.3 – 3.5 4.5 5.4 1989 ....................................... 99.3 100.0 101.1 102.5 .9 .7 1.1 1.4 5.0 4.6 4.1 4.2 1990 ....................................... 103.9 105.0 105.8 107.4 1.4 1.1 .8 1.5 4.6 5.0 4.6 4.8 1991 ....................................... 108.4 109.9 111.6 112.5 .9 1.4 1.5 .8 4.3 4.7 5.5 4.7 1992 ....................................... 113.4 114.1 115.2 115.7 .8 .6 1.0 .4 4.6 3.8 3.2 2.8 1993 ....................................... 116.8 117.7 118.6 119.1 1.0 .8 .8 .4 3.0 3.2 3.0 2.9 1994 ....................................... 120.2 120.7 121.3 122.5 .9 .4 .5 1.0 2.9 2.5 2.3 2.9 1995 ....................................... 123.0 123.6 124.2 124.8 .4 .5 .5 .5 2.3 2.4 2.4 1.9 1996 ....................................... 125.3 126.1 127.1 128.6 .4 .6 .8 1.2 1.9 2.0 2.3 3.0 1997 ....................................... 129.5 130.6 132.7 133.9 .7 .8 1.6 .9 3.4 3.6 4.4 4.1 1998 ....................................... 135.0 135.8 137.0 137.8 .8 .6 .9 .6 4.2 4.0 3.2 2.9 1999 ....................................... 139.3 140.5 140.8 142.4 1.1 .9 .2 1.1 3.2 3.5 2.8 3.3
Transportation and publicutilities8:
1985 ....................................... 87.6 88.4 89.7 90.0 – .9 1.5 .3 – – – – 1986 ....................................... 91.2 91.4 91.9 92.0 1.3 .2 .5 .1 4.1 3.4 2.5 2.2 1987 ....................................... 92.9 93.9 94.4 94.8 1.0 1.1 .5 .4 1.9 2.7 2.7 3.0 1988 ....................................... 95.8 96.8 97.5 97.5 1.1 1.0 .7 .0 3.1 3.1 3.3 2.8 1989 ....................................... 98.7 100.0 100.7 101.2 1.2 1.3 .7 .5 3.0 3.3 3.3 3.8 1990 ....................................... 103.0 103.3 104.2 105.1 1.8 .3 .9 .9 4.4 3.3 3.5 3.9 1991 ....................................... 106.0 107.7 109.0 109.7 .9 1.6 1.2 .6 2.9 4.3 4.6 4.4 1992 ....................................... 111.1 111.9 112.9 113.5 1.3 .7 .9 .5 4.8 3.9 3.6 3.5 1993 ....................................... 114.8 116.0 116.8 117.5 1.1 1.0 .7 .6 3.3 3.7 3.5 3.5 1994 ....................................... 119.2 119.8 121.4 122.1 1.4 .5 1.3 .6 3.8 3.3 3.9 3.9 1995 ....................................... 124.0 124.7 126.0 126.6 1.6 .6 1.0 .5 4.0 4.1 3.8 3.7 1996 ....................................... 127.9 128.4 129.3 130.4 1.0 .4 .7 .9 3.1 3.0 2.6 3.0 1997 ....................................... 131.3 131.7 132.9 134.2 .7 .3 .9 1.0 2.7 2.6 2.8 2.9 1998 ....................................... 135.8 137.1 138.5 139.3 1.2 1.0 1.0 .6 3.4 4.1 4.2 3.8 1999 ....................................... 139.7 140.9 141.8 142.3 .3 .9 .6 .4 2.9 2.8 2.4 2.2
Transportation3,8: 1985 ....................................... 87.5 88.3 89.5 89.5 – .9 1.4 .0 – – – – 1986 ....................................... 91.3 91.1 91.9 91.5 2.0 -.2 .9 -.4 4.3 3.2 2.7 2.2 1987 ....................................... 92.4 93.7 93.8 94.0 1.0 1.4 .1 .2 1.2 2.9 2.1 2.7 1988 ....................................... 95.3 96.9 97.6 97.3 1.4 1.7 .7 -.3 3.1 3.4 4.1 3.5 1989 ....................................... 98.8 100.0 100.5 100.8 1.5 1.2 .5 .3 3.7 3.2 3.0 3.6 1990 ....................................... 102.8 103.0 103.8 104.6 2.0 .2 .8 .8 4.0 3.0 3.3 3.8 1991 ....................................... 105.2 106.8 107.8 108.6 .6 1.5 .9 .7 2.3 3.7 3.9 3.8 1992 ....................................... 109.9 110.5 111.7 111.8 1.2 .5 1.1 .1 4.5 3.5 3.6 2.9 1993 ....................................... 112.8 114.1 114.8 115.7 .9 1.2 .6 .8 2.6 3.3 2.8 3.5 1994 ....................................... 117.1 117.7 119.7 120.3 1.2 .5 1.7 .5 3.8 3.2 4.3 4.0 1995 ....................................... 122.3 123.0 124.7 125.1 1.7 .6 1.4 .3 4.4 4.5 4.2 4.0 1996 ....................................... 126.9 127.7 128.2 129.2 1.4 .6 .4 .8 3.8 3.8 2.8 3.3
See footnotes at end of table.
51
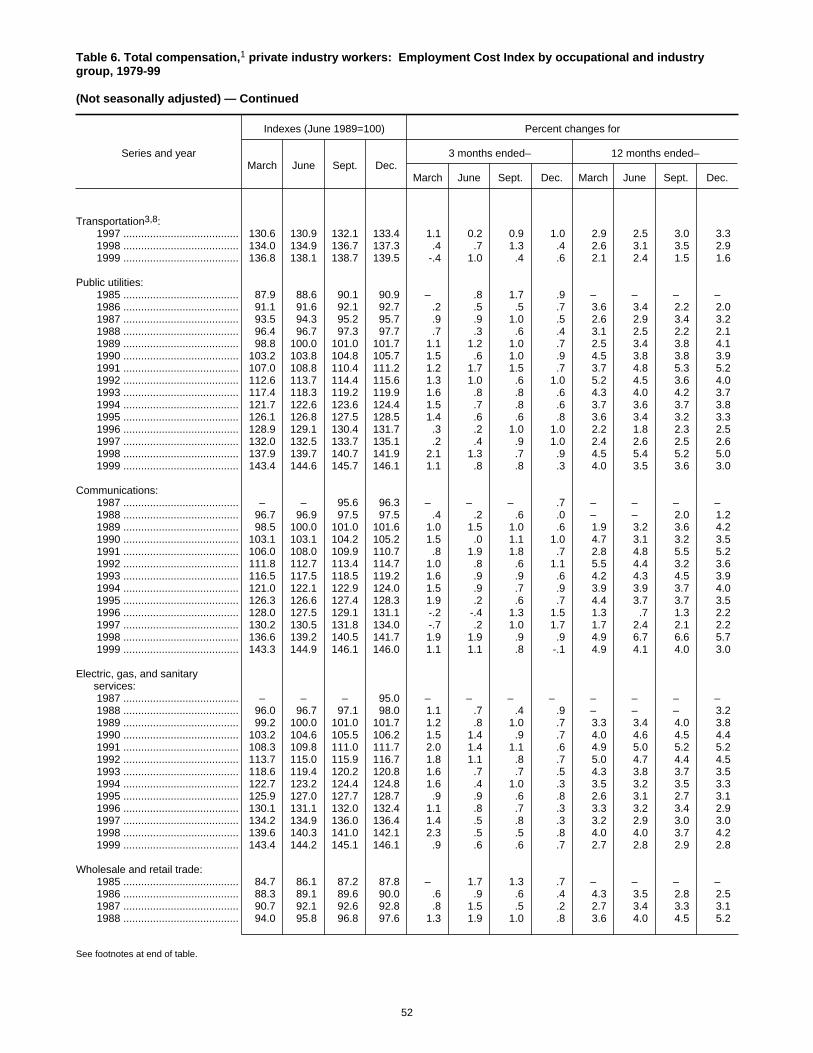
Table 6. Total compensation,1 private industry workers: Employment Cost Index by occupational and industrygroup, 1979-99
(Not seasonally adjusted) — Continued
Series and year
Indexes (June 1989=100) Percent changes for
March June Sept. Dec.3 months ended– 12 months ended–
March June Sept. Dec. March June Sept. Dec.
Transportation3,8: 1997 ....................................... 130.6 130.9 132.1 133.4 1.1 0.2 0.9 1.0 2.9 2.5 3.0 3.3 1998 ....................................... 134.0 134.9 136.7 137.3 .4 .7 1.3 .4 2.6 3.1 3.5 2.9 1999 ....................................... 136.8 138.1 138.7 139.5 -.4 1.0 .4 .6 2.1 2.4 1.5 1.6
Public utilities: 1985 ....................................... 87.9 88.6 90.1 90.9 – .8 1.7 .9 – – – – 1986 ....................................... 91.1 91.6 92.1 92.7 .2 .5 .5 .7 3.6 3.4 2.2 2.0 1987 ....................................... 93.5 94.3 95.2 95.7 .9 .9 1.0 .5 2.6 2.9 3.4 3.2 1988 ....................................... 96.4 96.7 97.3 97.7 .7 .3 .6 .4 3.1 2.5 2.2 2.1 1989 ....................................... 98.8 100.0 101.0 101.7 1.1 1.2 1.0 .7 2.5 3.4 3.8 4.1 1990 ....................................... 103.2 103.8 104.8 105.7 1.5 .6 1.0 .9 4.5 3.8 3.8 3.9 1991 ....................................... 107.0 108.8 110.4 111.2 1.2 1.7 1.5 .7 3.7 4.8 5.3 5.2 1992 ....................................... 112.6 113.7 114.4 115.6 1.3 1.0 .6 1.0 5.2 4.5 3.6 4.0 1993 ....................................... 117.4 118.3 119.2 119.9 1.6 .8 .8 .6 4.3 4.0 4.2 3.7 1994 ....................................... 121.7 122.6 123.6 124.4 1.5 .7 .8 .6 3.7 3.6 3.7 3.8 1995 ....................................... 126.1 126.8 127.5 128.5 1.4 .6 .6 .8 3.6 3.4 3.2 3.3 1996 ....................................... 128.9 129.1 130.4 131.7 .3 .2 1.0 1.0 2.2 1.8 2.3 2.5 1997 ....................................... 132.0 132.5 133.7 135.1 .2 .4 .9 1.0 2.4 2.6 2.5 2.6 1998 ....................................... 137.9 139.7 140.7 141.9 2.1 1.3 .7 .9 4.5 5.4 5.2 5.0 1999 ....................................... 143.4 144.6 145.7 146.1 1.1 .8 .8 .3 4.0 3.5 3.6 3.0
Communications: 1987 ....................................... – – 95.6 96.3 – – – .7 – – – – 1988 ....................................... 96.7 96.9 97.5 97.5 .4 .2 .6 .0 – – 2.0 1.2 1989 ....................................... 98.5 100.0 101.0 101.6 1.0 1.5 1.0 .6 1.9 3.2 3.6 4.2 1990 ....................................... 103.1 103.1 104.2 105.2 1.5 .0 1.1 1.0 4.7 3.1 3.2 3.5 1991 ....................................... 106.0 108.0 109.9 110.7 .8 1.9 1.8 .7 2.8 4.8 5.5 5.2 1992 ....................................... 111.8 112.7 113.4 114.7 1.0 .8 .6 1.1 5.5 4.4 3.2 3.6 1993 ....................................... 116.5 117.5 118.5 119.2 1.6 .9 .9 .6 4.2 4.3 4.5 3.9 1994 ....................................... 121.0 122.1 122.9 124.0 1.5 .9 .7 .9 3.9 3.9 3.7 4.0 1995 ....................................... 126.3 126.6 127.4 128.3 1.9 .2 .6 .7 4.4 3.7 3.7 3.5 1996 ....................................... 128.0 127.5 129.1 131.1 -.2 -.4 1.3 1.5 1.3 .7 1.3 2.2 1997 ....................................... 130.2 130.5 131.8 134.0 -.7 .2 1.0 1.7 1.7 2.4 2.1 2.2 1998 ....................................... 136.6 139.2 140.5 141.7 1.9 1.9 .9 .9 4.9 6.7 6.6 5.7 1999 ....................................... 143.3 144.9 146.1 146.0 1.1 1.1 .8 -.1 4.9 4.1 4.0 3.0
Electric, gas, and sanitaryservices:
1987 ....................................... – – – 95.0 – – – – – – – – 1988 ....................................... 96.0 96.7 97.1 98.0 1.1 .7 .4 .9 – – – 3.2 1989 ....................................... 99.2 100.0 101.0 101.7 1.2 .8 1.0 .7 3.3 3.4 4.0 3.8 1990 ....................................... 103.2 104.6 105.5 106.2 1.5 1.4 .9 .7 4.0 4.6 4.5 4.4 1991 ....................................... 108.3 109.8 111.0 111.7 2.0 1.4 1.1 .6 4.9 5.0 5.2 5.2 1992 ....................................... 113.7 115.0 115.9 116.7 1.8 1.1 .8 .7 5.0 4.7 4.4 4.5 1993 ....................................... 118.6 119.4 120.2 120.8 1.6 .7 .7 .5 4.3 3.8 3.7 3.5 1994 ....................................... 122.7 123.2 124.4 124.8 1.6 .4 1.0 .3 3.5 3.2 3.5 3.3 1995 ....................................... 125.9 127.0 127.7 128.7 .9 .9 .6 .8 2.6 3.1 2.7 3.1 1996 ....................................... 130.1 131.1 132.0 132.4 1.1 .8 .7 .3 3.3 3.2 3.4 2.9 1997 ....................................... 134.2 134.9 136.0 136.4 1.4 .5 .8 .3 3.2 2.9 3.0 3.0 1998 ....................................... 139.6 140.3 141.0 142.1 2.3 .5 .5 .8 4.0 4.0 3.7 4.2 1999 ....................................... 143.4 144.2 145.1 146.1 .9 .6 .6 .7 2.7 2.8 2.9 2.8
Wholesale and retail trade: 1985 ....................................... 84.7 86.1 87.2 87.8 – 1.7 1.3 .7 – – – – 1986 ....................................... 88.3 89.1 89.6 90.0 .6 .9 .6 .4 4.3 3.5 2.8 2.5 1987 ....................................... 90.7 92.1 92.6 92.8 .8 1.5 .5 .2 2.7 3.4 3.3 3.1 1988 ....................................... 94.0 95.8 96.8 97.6 1.3 1.9 1.0 .8 3.6 4.0 4.5 5.2
See footnotes at end of table.
52
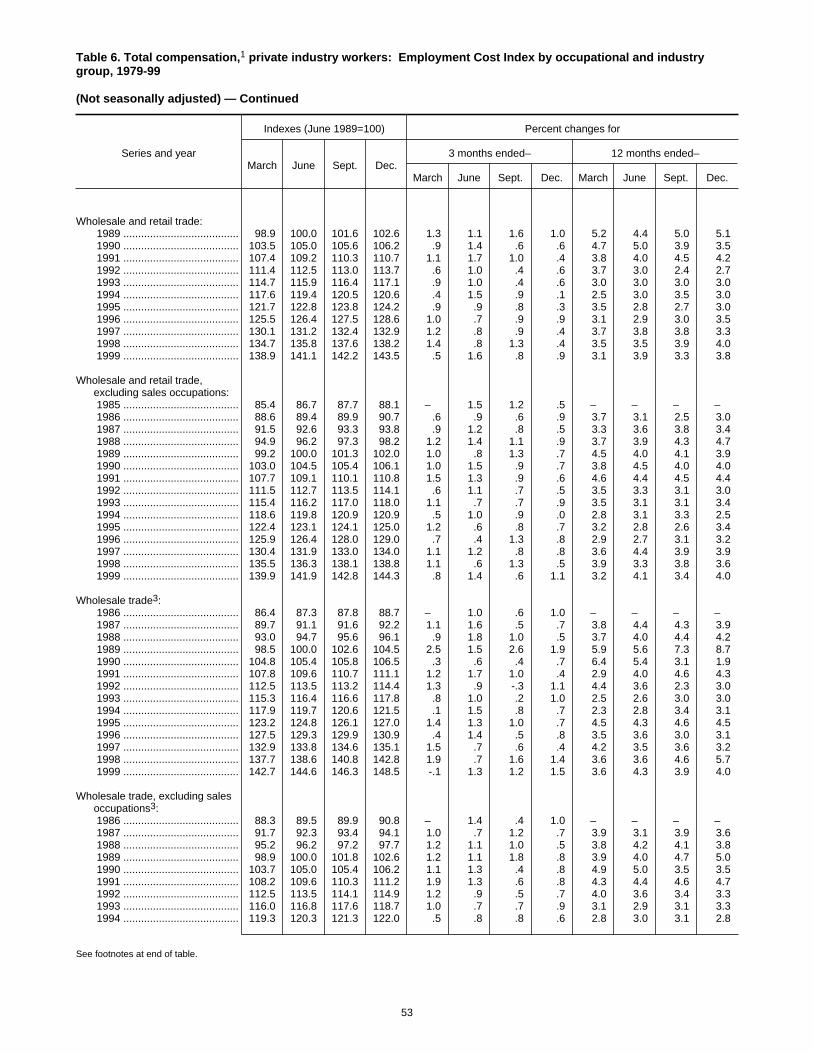
Table 6. Total compensation,1 private industry workers: Employment Cost Index by occupational and industrygroup, 1979-99
(Not seasonally adjusted) — Continued
Series and year
Indexes (June 1989=100) Percent changes for
March June Sept. Dec.3 months ended– 12 months ended–
March June Sept. Dec. March June Sept. Dec.
Wholesale and retail trade: 1989 ....................................... 98.9 100.0 101.6 102.6 1.3 1.1 1.6 1.0 5.2 4.4 5.0 5.1 1990 ....................................... 103.5 105.0 105.6 106.2 .9 1.4 .6 .6 4.7 5.0 3.9 3.5 1991 ....................................... 107.4 109.2 110.3 110.7 1.1 1.7 1.0 .4 3.8 4.0 4.5 4.2 1992 ....................................... 111.4 112.5 113.0 113.7 .6 1.0 .4 .6 3.7 3.0 2.4 2.7 1993 ....................................... 114.7 115.9 116.4 117.1 .9 1.0 .4 .6 3.0 3.0 3.0 3.0 1994 ....................................... 117.6 119.4 120.5 120.6 .4 1.5 .9 .1 2.5 3.0 3.5 3.0 1995 ....................................... 121.7 122.8 123.8 124.2 .9 .9 .8 .3 3.5 2.8 2.7 3.0 1996 ....................................... 125.5 126.4 127.5 128.6 1.0 .7 .9 .9 3.1 2.9 3.0 3.5 1997 ....................................... 130.1 131.2 132.4 132.9 1.2 .8 .9 .4 3.7 3.8 3.8 3.3 1998 ....................................... 134.7 135.8 137.6 138.2 1.4 .8 1.3 .4 3.5 3.5 3.9 4.0 1999 ....................................... 138.9 141.1 142.2 143.5 .5 1.6 .8 .9 3.1 3.9 3.3 3.8
Wholesale and retail trade,excluding sales occupations:
1985 ....................................... 85.4 86.7 87.7 88.1 – 1.5 1.2 .5 – – – – 1986 ....................................... 88.6 89.4 89.9 90.7 .6 .9 .6 .9 3.7 3.1 2.5 3.0 1987 ....................................... 91.5 92.6 93.3 93.8 .9 1.2 .8 .5 3.3 3.6 3.8 3.4 1988 ....................................... 94.9 96.2 97.3 98.2 1.2 1.4 1.1 .9 3.7 3.9 4.3 4.7 1989 ....................................... 99.2 100.0 101.3 102.0 1.0 .8 1.3 .7 4.5 4.0 4.1 3.9 1990 ....................................... 103.0 104.5 105.4 106.1 1.0 1.5 .9 .7 3.8 4.5 4.0 4.0 1991 ....................................... 107.7 109.1 110.1 110.8 1.5 1.3 .9 .6 4.6 4.4 4.5 4.4 1992 ....................................... 111.5 112.7 113.5 114.1 .6 1.1 .7 .5 3.5 3.3 3.1 3.0 1993 ....................................... 115.4 116.2 117.0 118.0 1.1 .7 .7 .9 3.5 3.1 3.1 3.4 1994 ....................................... 118.6 119.8 120.9 120.9 .5 1.0 .9 .0 2.8 3.1 3.3 2.5 1995 ....................................... 122.4 123.1 124.1 125.0 1.2 .6 .8 .7 3.2 2.8 2.6 3.4 1996 ....................................... 125.9 126.4 128.0 129.0 .7 .4 1.3 .8 2.9 2.7 3.1 3.2 1997 ....................................... 130.4 131.9 133.0 134.0 1.1 1.2 .8 .8 3.6 4.4 3.9 3.9 1998 ....................................... 135.5 136.3 138.1 138.8 1.1 .6 1.3 .5 3.9 3.3 3.8 3.6 1999 ....................................... 139.9 141.9 142.8 144.3 .8 1.4 .6 1.1 3.2 4.1 3.4 4.0
Wholesale trade3: 1986 ....................................... 86.4 87.3 87.8 88.7 – 1.0 .6 1.0 – – – – 1987 ....................................... 89.7 91.1 91.6 92.2 1.1 1.6 .5 .7 3.8 4.4 4.3 3.9 1988 ....................................... 93.0 94.7 95.6 96.1 .9 1.8 1.0 .5 3.7 4.0 4.4 4.2 1989 ....................................... 98.5 100.0 102.6 104.5 2.5 1.5 2.6 1.9 5.9 5.6 7.3 8.7 1990 ....................................... 104.8 105.4 105.8 106.5 .3 .6 .4 .7 6.4 5.4 3.1 1.9 1991 ....................................... 107.8 109.6 110.7 111.1 1.2 1.7 1.0 .4 2.9 4.0 4.6 4.3 1992 ....................................... 112.5 113.5 113.2 114.4 1.3 .9 -.3 1.1 4.4 3.6 2.3 3.0 1993 ....................................... 115.3 116.4 116.6 117.8 .8 1.0 .2 1.0 2.5 2.6 3.0 3.0 1994 ....................................... 117.9 119.7 120.6 121.5 .1 1.5 .8 .7 2.3 2.8 3.4 3.1 1995 ....................................... 123.2 124.8 126.1 127.0 1.4 1.3 1.0 .7 4.5 4.3 4.6 4.5 1996 ....................................... 127.5 129.3 129.9 130.9 .4 1.4 .5 .8 3.5 3.6 3.0 3.1 1997 ....................................... 132.9 133.8 134.6 135.1 1.5 .7 .6 .4 4.2 3.5 3.6 3.2 1998 ....................................... 137.7 138.6 140.8 142.8 1.9 .7 1.6 1.4 3.6 3.6 4.6 5.7 1999 ....................................... 142.7 144.6 146.3 148.5 -.1 1.3 1.2 1.5 3.6 4.3 3.9 4.0
Wholesale trade, excluding salesoccupations3:
1986 ....................................... 88.3 89.5 89.9 90.8 – 1.4 .4 1.0 – – – – 1987 ....................................... 91.7 92.3 93.4 94.1 1.0 .7 1.2 .7 3.9 3.1 3.9 3.6 1988 ....................................... 95.2 96.2 97.2 97.7 1.2 1.1 1.0 .5 3.8 4.2 4.1 3.8 1989 ....................................... 98.9 100.0 101.8 102.6 1.2 1.1 1.8 .8 3.9 4.0 4.7 5.0 1990 ....................................... 103.7 105.0 105.4 106.2 1.1 1.3 .4 .8 4.9 5.0 3.5 3.5 1991 ....................................... 108.2 109.6 110.3 111.2 1.9 1.3 .6 .8 4.3 4.4 4.6 4.7 1992 ....................................... 112.5 113.5 114.1 114.9 1.2 .9 .5 .7 4.0 3.6 3.4 3.3 1993 ....................................... 116.0 116.8 117.6 118.7 1.0 .7 .7 .9 3.1 2.9 3.1 3.3 1994 ....................................... 119.3 120.3 121.3 122.0 .5 .8 .8 .6 2.8 3.0 3.1 2.8
See footnotes at end of table.
53

Table 6. Total compensation,1 private industry workers: Employment Cost Index by occupational and industrygroup, 1979-99
(Not seasonally adjusted) — Continued
Series and year
Indexes (June 1989=100) Percent changes for
March June Sept. Dec.3 months ended– 12 months ended–
March June Sept. Dec. March June Sept. Dec.
Wholesale trade, excluding salesoccupations3:
1995 ....................................... 124.4 125.1 126.2 127.1 2.0 0.6 0.9 0.7 4.3 4.0 4.0 4.2 1996 ....................................... 127.4 128.7 130.0 130.9 .2 1.0 1.0 .7 2.4 2.9 3.0 3.0 1997 ....................................... 132.6 133.7 134.5 135.4 1.3 .8 .6 .7 4.1 3.9 3.5 3.4 1998 ....................................... 137.0 138.2 140.0 141.2 1.2 .9 1.3 .9 3.3 3.4 4.1 4.3 1999 ....................................... 142.4 144.0 145.8 147.4 .8 1.1 1.3 1.1 3.9 4.2 4.1 4.4
Retail trade: 1985 ....................................... 85.5 86.7 88.1 88.8 – 1.4 1.6 .8 – – – – 1986 ....................................... 89.2 89.9 90.5 90.8 .5 .8 .7 .3 4.3 3.7 2.7 2.3 1987 ....................................... 91.3 92.5 93.0 93.0 .6 1.3 .5 .0 2.4 2.9 2.8 2.4 1988 ....................................... 94.5 96.3 97.3 98.4 1.6 1.9 1.0 1.1 3.5 4.1 4.6 5.8 1989 ....................................... 99.1 100.0 101.1 101.6 .7 .9 1.1 .5 4.9 3.8 3.9 3.3 1990 ....................................... 103.0 104.8 105.5 106.0 1.4 1.7 .7 .5 3.9 4.8 4.4 4.3 1991 ....................................... 107.3 109.0 110.1 110.5 1.2 1.6 1.0 .4 4.2 4.0 4.4 4.2 1992 ....................................... 110.8 112.1 112.9 113.4 .3 1.2 .7 .4 3.3 2.8 2.5 2.6 1993 ....................................... 114.5 115.6 116.2 116.8 1.0 1.0 .5 .5 3.3 3.1 2.9 3.0 1994 ....................................... 117.5 119.2 120.4 120.1 .6 1.4 1.0 -.2 2.6 3.1 3.6 2.8 1995 ....................................... 120.9 121.8 122.6 122.7 .7 .7 .7 .1 2.9 2.2 1.8 2.2 1996 ....................................... 124.5 124.8 126.2 127.4 1.5 .2 1.1 1.0 3.0 2.5 2.9 3.8 1997 ....................................... 128.5 129.7 131.1 131.7 .9 .9 1.1 .5 3.2 3.9 3.9 3.4 1998 ....................................... 133.1 134.4 135.9 135.6 1.1 1.0 1.1 -.2 3.6 3.6 3.7 3.0 1999 ....................................... 136.8 139.1 140.0 140.7 .9 1.7 .6 .5 2.8 3.5 3.0 3.8
General merchandise stores3: 1988 ....................................... – 97.2 98.5 99.6 – – 1.3 1.1 – – – – 1989 ....................................... 100.5 100.0 100.4 101.5 .9 -.5 .4 1.1 – 2.9 1.9 1.9 1990 ....................................... 102.6 105.7 105.9 106.9 1.1 3.0 .2 .9 2.1 5.7 5.5 5.3 1991 ....................................... 108.3 110.1 111.2 111.1 1.3 1.7 1.0 -.1 5.6 4.2 5.0 3.9 1992 ....................................... 111.7 112.9 113.3 113.3 .5 1.1 .4 .0 3.1 2.5 1.9 2.0 1993 ....................................... 114.1 114.7 115.5 116.3 .7 .5 .7 .7 2.1 1.6 1.9 2.6 1994 ....................................... 115.3 118.0 118.7 119.3 -.9 2.3 .6 .5 1.1 2.9 2.8 2.6 1995 ....................................... 120.1 120.7 121.0 121.7 .7 .5 .2 .6 4.2 2.3 1.9 2.0 1996 ....................................... 122.4 123.6 124.6 126.3 .6 1.0 .8 1.4 1.9 2.4 3.0 3.8 1997 ....................................... 126.4 127.7 128.6 130.0 .1 1.0 .7 1.1 3.3 3.3 3.2 2.9 1998 ....................................... 131.2 133.0 133.2 134.0 .9 1.4 .2 .6 3.8 4.2 3.6 3.1 1999 ....................................... 135.0 135.6 137.2 138.3 .7 .4 1.2 .8 2.9 2.0 3.0 3.2
Food stores3: 1987 ....................................... – – 94.5 95.5 – – – 1.1 – – – – 1988 ....................................... 96.3 96.8 97.1 98.2 .8 .5 .3 1.1 – – 2.8 2.8 1989 ....................................... 99.8 100.0 100.8 101.7 1.6 .2 .8 .9 3.6 3.3 3.8 3.6 1990 ....................................... 103.2 104.6 105.7 106.4 1.5 1.4 1.1 .7 3.4 4.6 4.9 4.6 1991 ....................................... 107.5 109.3 110.3 111.7 1.0 1.7 .9 1.3 4.2 4.5 4.4 5.0 1992 ....................................... 112.6 113.6 114.2 115.1 .8 .9 .5 .8 4.7 3.9 3.5 3.0 1993 ....................................... 115.9 117.2 117.1 118.3 .7 1.1 -.1 1.0 2.9 3.2 2.5 2.8 1994 ....................................... 119.6 120.6 120.3 120.0 1.1 .8 -.2 -.2 3.2 2.9 2.7 1.4 1995 ....................................... 120.8 120.7 121.8 122.4 .7 -.1 .9 .5 1.0 .1 1.2 2.0 1996 ....................................... 123.6 124.4 127.0 128.4 1.0 .6 2.1 1.1 2.3 3.1 4.3 4.9 1997 ....................................... 128.2 128.2 129.8 129.4 -.2 .0 1.2 -.3 3.7 3.1 2.2 .8 1998 ....................................... 131.3 132.9 133.7 132.7 1.5 1.2 .6 -.7 2.4 3.7 3.0 2.6 1999 ....................................... 134.3 135.7 137.0 138.1 1.2 1.0 1.0 .8 2.3 2.1 2.5 4.1
Finance, insurance, and realestate3:
1985 ....................................... 83.1 83.0 84.6 85.9 – -.1 1.9 1.5 – – – – 1986 ....................................... 86.7 87.4 87.9 88.6 .9 .8 .6 .8 4.3 5.3 3.9 3.1
See footnotes at end of table.
54
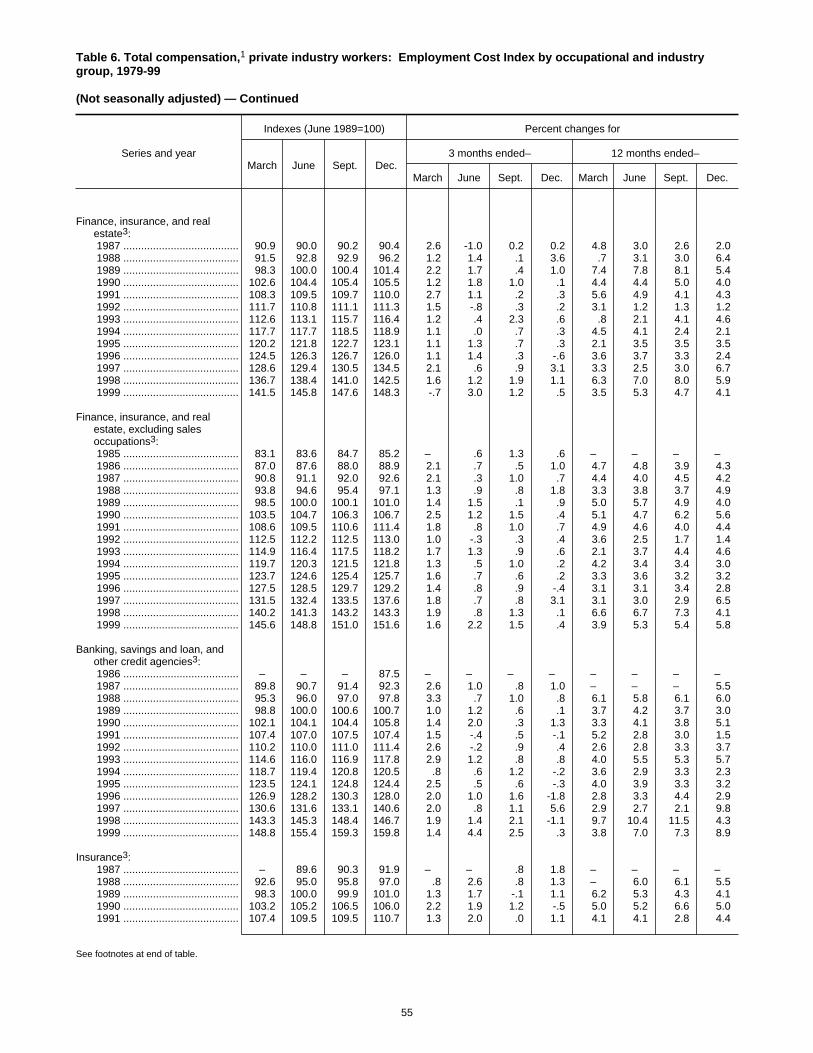
Table 6. Total compensation,1 private industry workers: Employment Cost Index by occupational and industrygroup, 1979-99
(Not seasonally adjusted) — Continued
Series and year
Indexes (June 1989=100) Percent changes for
March June Sept. Dec.3 months ended– 12 months ended–
March June Sept. Dec. March June Sept. Dec.
Finance, insurance, and realestate3:
1987 ....................................... 90.9 90.0 90.2 90.4 2.6 -1.0 0.2 0.2 4.8 3.0 2.6 2.0 1988 ....................................... 91.5 92.8 92.9 96.2 1.2 1.4 .1 3.6 .7 3.1 3.0 6.4 1989 ....................................... 98.3 100.0 100.4 101.4 2.2 1.7 .4 1.0 7.4 7.8 8.1 5.4 1990 ....................................... 102.6 104.4 105.4 105.5 1.2 1.8 1.0 .1 4.4 4.4 5.0 4.0 1991 ....................................... 108.3 109.5 109.7 110.0 2.7 1.1 .2 .3 5.6 4.9 4.1 4.3 1992 ....................................... 111.7 110.8 111.1 111.3 1.5 -.8 .3 .2 3.1 1.2 1.3 1.2 1993 ....................................... 112.6 113.1 115.7 116.4 1.2 .4 2.3 .6 .8 2.1 4.1 4.6 1994 ....................................... 117.7 117.7 118.5 118.9 1.1 .0 .7 .3 4.5 4.1 2.4 2.1 1995 ....................................... 120.2 121.8 122.7 123.1 1.1 1.3 .7 .3 2.1 3.5 3.5 3.5 1996 ....................................... 124.5 126.3 126.7 126.0 1.1 1.4 .3 -.6 3.6 3.7 3.3 2.4 1997 ....................................... 128.6 129.4 130.5 134.5 2.1 .6 .9 3.1 3.3 2.5 3.0 6.7 1998 ....................................... 136.7 138.4 141.0 142.5 1.6 1.2 1.9 1.1 6.3 7.0 8.0 5.9 1999 ....................................... 141.5 145.8 147.6 148.3 -.7 3.0 1.2 .5 3.5 5.3 4.7 4.1
Finance, insurance, and realestate, excluding salesoccupations3:
1985 ....................................... 83.1 83.6 84.7 85.2 – .6 1.3 .6 – – – – 1986 ....................................... 87.0 87.6 88.0 88.9 2.1 .7 .5 1.0 4.7 4.8 3.9 4.3 1987 ....................................... 90.8 91.1 92.0 92.6 2.1 .3 1.0 .7 4.4 4.0 4.5 4.2 1988 ....................................... 93.8 94.6 95.4 97.1 1.3 .9 .8 1.8 3.3 3.8 3.7 4.9 1989 ....................................... 98.5 100.0 100.1 101.0 1.4 1.5 .1 .9 5.0 5.7 4.9 4.0 1990 ....................................... 103.5 104.7 106.3 106.7 2.5 1.2 1.5 .4 5.1 4.7 6.2 5.6 1991 ....................................... 108.6 109.5 110.6 111.4 1.8 .8 1.0 .7 4.9 4.6 4.0 4.4 1992 ....................................... 112.5 112.2 112.5 113.0 1.0 -.3 .3 .4 3.6 2.5 1.7 1.4 1993 ....................................... 114.9 116.4 117.5 118.2 1.7 1.3 .9 .6 2.1 3.7 4.4 4.6 1994 ....................................... 119.7 120.3 121.5 121.8 1.3 .5 1.0 .2 4.2 3.4 3.4 3.0 1995 ....................................... 123.7 124.6 125.4 125.7 1.6 .7 .6 .2 3.3 3.6 3.2 3.2 1996 ....................................... 127.5 128.5 129.7 129.2 1.4 .8 .9 -.4 3.1 3.1 3.4 2.8 1997 ....................................... 131.5 132.4 133.5 137.6 1.8 .7 .8 3.1 3.1 3.0 2.9 6.5 1998 ....................................... 140.2 141.3 143.2 143.3 1.9 .8 1.3 .1 6.6 6.7 7.3 4.1 1999 ....................................... 145.6 148.8 151.0 151.6 1.6 2.2 1.5 .4 3.9 5.3 5.4 5.8
Banking, savings and loan, andother credit agencies3:
1986 ....................................... – – – 87.5 – – – – – – – – 1987 ....................................... 89.8 90.7 91.4 92.3 2.6 1.0 .8 1.0 – – – 5.5 1988 ....................................... 95.3 96.0 97.0 97.8 3.3 .7 1.0 .8 6.1 5.8 6.1 6.0 1989 ....................................... 98.8 100.0 100.6 100.7 1.0 1.2 .6 .1 3.7 4.2 3.7 3.0 1990 ....................................... 102.1 104.1 104.4 105.8 1.4 2.0 .3 1.3 3.3 4.1 3.8 5.1 1991 ....................................... 107.4 107.0 107.5 107.4 1.5 -.4 .5 -.1 5.2 2.8 3.0 1.5 1992 ....................................... 110.2 110.0 111.0 111.4 2.6 -.2 .9 .4 2.6 2.8 3.3 3.7 1993 ....................................... 114.6 116.0 116.9 117.8 2.9 1.2 .8 .8 4.0 5.5 5.3 5.7 1994 ....................................... 118.7 119.4 120.8 120.5 .8 .6 1.2 -.2 3.6 2.9 3.3 2.3 1995 ....................................... 123.5 124.1 124.8 124.4 2.5 .5 .6 -.3 4.0 3.9 3.3 3.2 1996 ....................................... 126.9 128.2 130.3 128.0 2.0 1.0 1.6 -1.8 2.8 3.3 4.4 2.9 1997 ....................................... 130.6 131.6 133.1 140.6 2.0 .8 1.1 5.6 2.9 2.7 2.1 9.8 1998 ....................................... 143.3 145.3 148.4 146.7 1.9 1.4 2.1 -1.1 9.7 10.4 11.5 4.3 1999 ....................................... 148.8 155.4 159.3 159.8 1.4 4.4 2.5 .3 3.8 7.0 7.3 8.9
Insurance3: 1987 ....................................... – 89.6 90.3 91.9 – – .8 1.8 – – – – 1988 ....................................... 92.6 95.0 95.8 97.0 .8 2.6 .8 1.3 – 6.0 6.1 5.5 1989 ....................................... 98.3 100.0 99.9 101.0 1.3 1.7 -.1 1.1 6.2 5.3 4.3 4.1 1990 ....................................... 103.2 105.2 106.5 106.0 2.2 1.9 1.2 -.5 5.0 5.2 6.6 5.0 1991 ....................................... 107.4 109.5 109.5 110.7 1.3 2.0 .0 1.1 4.1 4.1 2.8 4.4
See footnotes at end of table.
55

Table 6. Total compensation,1 private industry workers: Employment Cost Index by occupational and industrygroup, 1979-99
(Not seasonally adjusted) — Continued
Series and year
Indexes (June 1989=100) Percent changes for
March June Sept. Dec.3 months ended– 12 months ended–
March June Sept. Dec. March June Sept. Dec.
Insurance3: 1992 ....................................... 113.2 114.7 114.9 115.2 2.3 1.3 0.2 0.3 5.4 4.7 4.9 4.1 1993 ....................................... 114.3 116.1 117.4 119.7 -.8 1.6 1.1 2.0 1.0 1.2 2.2 3.9 1994 ....................................... 119.9 120.5 121.5 122.3 .2 .5 .8 .7 4.9 3.8 3.5 2.2 1995 ....................................... 123.5 124.6 124.9 125.9 1.0 .9 .2 .8 3.0 3.4 2.8 2.9 1996 ....................................... 127.6 128.2 129.3 129.6 1.4 .5 .9 .2 3.3 2.9 3.5 2.9 1997 ....................................... 131.9 132.1 133.1 134.8 1.8 .2 .8 1.3 3.4 3.0 2.9 4.0 1998 ....................................... 137.4 138.9 141.9 141.7 1.9 1.1 2.2 -.1 4.2 5.1 6.6 5.1 1999 ....................................... 141.7 144.0 144.5 145.8 .0 1.6 .3 .9 3.1 3.7 1.8 2.9
Insurance, excluding salesoccupations3:
1987 ....................................... – 90.9 91.9 92.3 – – 1.1 .4 – – – – 1988 ....................................... 93.8 95.3 96.5 97.3 1.6 1.6 1.3 .8 – 4.8 5.0 5.4 1989 ....................................... 98.6 100.0 101.0 101.8 1.3 1.4 1.0 .8 5.1 4.9 4.7 4.6 1990 ....................................... 104.5 106.1 106.8 107.6 2.7 1.5 .7 .7 6.0 6.1 5.7 5.7 1991 ....................................... 108.7 110.3 111.4 112.5 1.0 1.5 1.0 1.0 4.0 4.0 4.3 4.6 1992 ....................................... 113.9 115.7 116.1 117.2 1.2 1.6 .3 .9 4.8 4.9 4.2 4.2 1993 ....................................... 118.6 120.6 121.8 122.7 1.2 1.7 1.0 .7 4.1 4.2 4.9 4.7 1994 ....................................... 124.4 125.0 126.0 126.5 1.4 .5 .8 .4 4.9 3.6 3.4 3.1 1995 ....................................... 127.6 129.0 129.6 130.2 .9 1.1 .5 .5 2.6 3.2 2.9 2.9 1996 ....................................... 132.1 132.7 133.4 133.5 1.5 .5 .5 .1 3.5 2.9 2.9 2.5 1997 ....................................... 136.0 136.6 137.4 138.6 1.9 .4 .6 .9 3.0 2.9 3.0 3.8 1998 ....................................... 140.0 140.9 141.6 142.5 1.0 .6 .5 .6 2.9 3.1 3.1 2.8 1999 ....................................... 144.5 145.4 146.2 147.0 1.4 .6 .6 .5 3.2 3.2 3.2 3.2
Service industries: 1985 ....................................... 81.3 82.0 83.8 84.1 – .9 2.2 .4 – – – – 1986 ....................................... 85.3 85.8 86.8 87.7 1.4 .6 1.2 1.0 4.9 4.6 3.6 4.3 1987 ....................................... 89.0 89.5 91.3 92.2 1.5 .6 2.0 1.0 4.3 4.3 5.2 5.1 1988 ....................................... 93.6 94.5 96.4 97.5 1.5 1.0 2.0 1.1 5.2 5.6 5.6 5.7 1989 ....................................... 99.0 100.0 101.8 102.9 1.5 1.0 1.8 1.1 5.8 5.8 5.6 5.5 1990 ....................................... 105.0 106.5 108.1 109.3 2.0 1.4 1.5 1.1 6.1 6.5 6.2 6.2 1991 ....................................... 110.8 111.5 113.1 114.0 1.4 .6 1.4 .8 5.5 4.7 4.6 4.3 1992 ....................................... 115.3 116.4 117.8 118.9 1.1 1.0 1.2 .9 4.1 4.4 4.2 4.3 1993 ....................................... 120.1 120.9 122.3 123.1 1.0 .7 1.2 .7 4.2 3.9 3.8 3.5 1994 ....................................... 124.4 124.9 125.9 126.6 1.1 .4 .8 .6 3.6 3.3 2.9 2.8 1995 ....................................... 127.5 128.2 128.9 129.4 .7 .5 .5 .4 2.5 2.6 2.4 2.2 1996 ....................................... 130.7 131.7 132.7 133.4 1.0 .8 .8 .5 2.5 2.7 2.9 3.1 1997 ....................................... 134.6 135.7 137.0 138.5 .9 .8 1.0 1.1 3.0 3.0 3.2 3.8 1998 ....................................... 139.3 140.3 141.8 142.7 .6 .7 1.1 .6 3.5 3.4 3.5 3.0 1999 ....................................... 143.5 144.6 146.1 147.6 .6 .8 1.0 1.0 3.0 3.1 3.0 3.4
Business services3: 1986 ....................................... – – – 87.2 – – – – – – – – 1987 ....................................... 88.5 89.5 91.7 92.5 1.5 1.1 2.5 .9 – – – 6.1 1988 ....................................... 93.8 94.9 96.2 97.2 1.4 1.2 1.4 1.0 6.0 6.0 4.9 5.1 1989 ....................................... 98.1 100.0 100.7 101.3 .9 1.9 .7 .6 4.6 5.4 4.7 4.2 1990 ....................................... 103.6 105.3 106.3 107.4 2.3 1.6 .9 1.0 5.6 5.3 5.6 6.0 1991 ....................................... 110.3 110.4 110.0 111.1 2.7 .1 -.4 1.0 6.5 4.8 3.5 3.4 1992 ....................................... 112.5 113.6 115.2 115.9 1.3 1.0 1.4 .6 2.0 2.9 4.7 4.3 1993 ....................................... 116.5 117.4 118.1 118.6 .5 .8 .6 .4 3.6 3.3 2.5 2.3 1994 ....................................... 121.3 122.1 122.4 123.0 2.3 .7 .2 .5 4.1 4.0 3.6 3.7 1995 ....................................... 124.5 125.3 125.7 126.3 1.2 .6 .3 .5 2.6 2.6 2.7 2.7 1996 ....................................... 128.9 129.2 130.2 131.8 2.1 .2 .8 1.2 3.5 3.1 3.6 4.4 1997 ....................................... 133.3 134.2 136.3 138.6 1.1 .7 1.6 1.7 3.4 3.9 4.7 5.2 1998 ....................................... 139.5 140.7 143.5 145.9 .6 .9 2.0 1.7 4.7 4.8 5.3 5.3 1999 ....................................... 147.5 148.7 150.7 151.9 1.1 .8 1.3 .8 5.7 5.7 5.0 4.1
See footnotes at end of table.
56
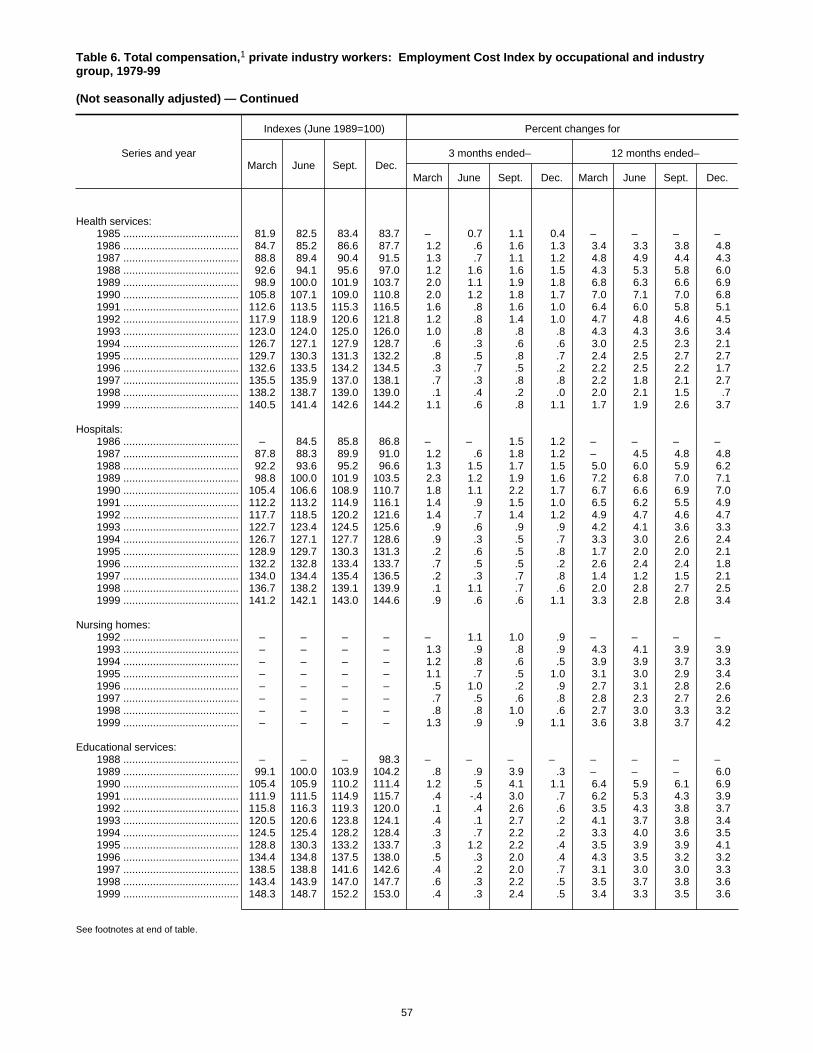
Table 6. Total compensation,1 private industry workers: Employment Cost Index by occupational and industrygroup, 1979-99
(Not seasonally adjusted) — Continued
Series and year
Indexes (June 1989=100) Percent changes for
March June Sept. Dec.3 months ended– 12 months ended–
March June Sept. Dec. March June Sept. Dec.
Health services: 1985 ....................................... 81.9 82.5 83.4 83.7 – 0.7 1.1 0.4 – – – – 1986 ....................................... 84.7 85.2 86.6 87.7 1.2 .6 1.6 1.3 3.4 3.3 3.8 4.8 1987 ....................................... 88.8 89.4 90.4 91.5 1.3 .7 1.1 1.2 4.8 4.9 4.4 4.3 1988 ....................................... 92.6 94.1 95.6 97.0 1.2 1.6 1.6 1.5 4.3 5.3 5.8 6.0 1989 ....................................... 98.9 100.0 101.9 103.7 2.0 1.1 1.9 1.8 6.8 6.3 6.6 6.9 1990 ....................................... 105.8 107.1 109.0 110.8 2.0 1.2 1.8 1.7 7.0 7.1 7.0 6.8 1991 ....................................... 112.6 113.5 115.3 116.5 1.6 .8 1.6 1.0 6.4 6.0 5.8 5.1 1992 ....................................... 117.9 118.9 120.6 121.8 1.2 .8 1.4 1.0 4.7 4.8 4.6 4.5 1993 ....................................... 123.0 124.0 125.0 126.0 1.0 .8 .8 .8 4.3 4.3 3.6 3.4 1994 ....................................... 126.7 127.1 127.9 128.7 .6 .3 .6 .6 3.0 2.5 2.3 2.1 1995 ....................................... 129.7 130.3 131.3 132.2 .8 .5 .8 .7 2.4 2.5 2.7 2.7 1996 ....................................... 132.6 133.5 134.2 134.5 .3 .7 .5 .2 2.2 2.5 2.2 1.7 1997 ....................................... 135.5 135.9 137.0 138.1 .7 .3 .8 .8 2.2 1.8 2.1 2.7 1998 ....................................... 138.2 138.7 139.0 139.0 .1 .4 .2 .0 2.0 2.1 1.5 .7 1999 ....................................... 140.5 141.4 142.6 144.2 1.1 .6 .8 1.1 1.7 1.9 2.6 3.7
Hospitals: 1986 ....................................... – 84.5 85.8 86.8 – – 1.5 1.2 – – – – 1987 ....................................... 87.8 88.3 89.9 91.0 1.2 .6 1.8 1.2 – 4.5 4.8 4.8 1988 ....................................... 92.2 93.6 95.2 96.6 1.3 1.5 1.7 1.5 5.0 6.0 5.9 6.2 1989 ....................................... 98.8 100.0 101.9 103.5 2.3 1.2 1.9 1.6 7.2 6.8 7.0 7.1 1990 ....................................... 105.4 106.6 108.9 110.7 1.8 1.1 2.2 1.7 6.7 6.6 6.9 7.0 1991 ....................................... 112.2 113.2 114.9 116.1 1.4 .9 1.5 1.0 6.5 6.2 5.5 4.9 1992 ....................................... 117.7 118.5 120.2 121.6 1.4 .7 1.4 1.2 4.9 4.7 4.6 4.7 1993 ....................................... 122.7 123.4 124.5 125.6 .9 .6 .9 .9 4.2 4.1 3.6 3.3 1994 ....................................... 126.7 127.1 127.7 128.6 .9 .3 .5 .7 3.3 3.0 2.6 2.4 1995 ....................................... 128.9 129.7 130.3 131.3 .2 .6 .5 .8 1.7 2.0 2.0 2.1 1996 ....................................... 132.2 132.8 133.4 133.7 .7 .5 .5 .2 2.6 2.4 2.4 1.8 1997 ....................................... 134.0 134.4 135.4 136.5 .2 .3 .7 .8 1.4 1.2 1.5 2.1 1998 ....................................... 136.7 138.2 139.1 139.9 .1 1.1 .7 .6 2.0 2.8 2.7 2.5 1999 ....................................... 141.2 142.1 143.0 144.6 .9 .6 .6 1.1 3.3 2.8 2.8 3.4
Nursing homes: 1992 ....................................... – – – – – 1.1 1.0 .9 – – – – 1993 ....................................... – – – – 1.3 .9 .8 .9 4.3 4.1 3.9 3.9 1994 ....................................... – – – – 1.2 .8 .6 .5 3.9 3.9 3.7 3.3 1995 ....................................... – – – – 1.1 .7 .5 1.0 3.1 3.0 2.9 3.4 1996 ....................................... – – – – .5 1.0 .2 .9 2.7 3.1 2.8 2.6 1997 ....................................... – – – – .7 .5 .6 .8 2.8 2.3 2.7 2.6 1998 ....................................... – – – – .8 .8 1.0 .6 2.7 3.0 3.3 3.2 1999 ....................................... – – – – 1.3 .9 .9 1.1 3.6 3.8 3.7 4.2
Educational services: 1988 ....................................... – – – 98.3 – – – – – – – – 1989 ....................................... 99.1 100.0 103.9 104.2 .8 .9 3.9 .3 – – – 6.0 1990 ....................................... 105.4 105.9 110.2 111.4 1.2 .5 4.1 1.1 6.4 5.9 6.1 6.9 1991 ....................................... 111.9 111.5 114.9 115.7 .4 -.4 3.0 .7 6.2 5.3 4.3 3.9 1992 ....................................... 115.8 116.3 119.3 120.0 .1 .4 2.6 .6 3.5 4.3 3.8 3.7 1993 ....................................... 120.5 120.6 123.8 124.1 .4 .1 2.7 .2 4.1 3.7 3.8 3.4 1994 ....................................... 124.5 125.4 128.2 128.4 .3 .7 2.2 .2 3.3 4.0 3.6 3.5 1995 ....................................... 128.8 130.3 133.2 133.7 .3 1.2 2.2 .4 3.5 3.9 3.9 4.1 1996 ....................................... 134.4 134.8 137.5 138.0 .5 .3 2.0 .4 4.3 3.5 3.2 3.2 1997 ....................................... 138.5 138.8 141.6 142.6 .4 .2 2.0 .7 3.1 3.0 3.0 3.3 1998 ....................................... 143.4 143.9 147.0 147.7 .6 .3 2.2 .5 3.5 3.7 3.8 3.6 1999 ....................................... 148.3 148.7 152.2 153.0 .4 .3 2.4 .5 3.4 3.3 3.5 3.6
See footnotes at end of table.
57
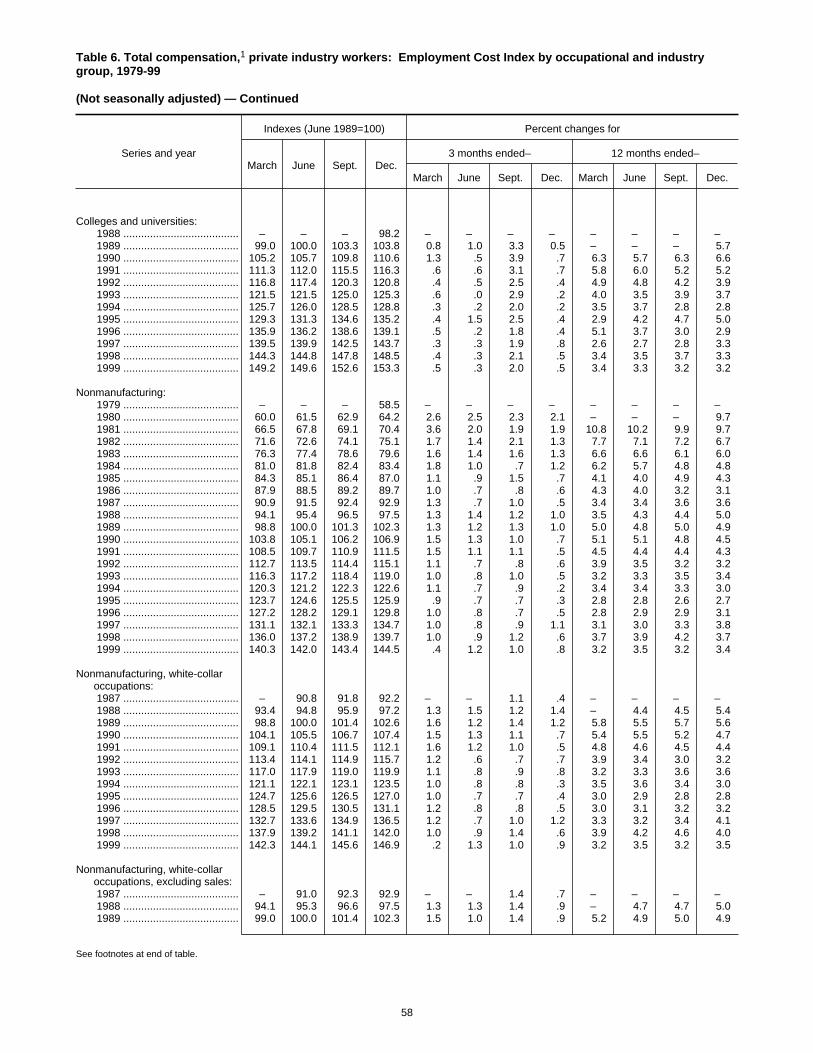
Table 6. Total compensation,1 private industry workers: Employment Cost Index by occupational and industrygroup, 1979-99
(Not seasonally adjusted) — Continued
Series and year
Indexes (June 1989=100) Percent changes for
March June Sept. Dec.3 months ended– 12 months ended–
March June Sept. Dec. March June Sept. Dec.
Colleges and universities: 1988 ....................................... – – – 98.2 – – – – – – – – 1989 ....................................... 99.0 100.0 103.3 103.8 0.8 1.0 3.3 0.5 – – – 5.7 1990 ....................................... 105.2 105.7 109.8 110.6 1.3 .5 3.9 .7 6.3 5.7 6.3 6.6 1991 ....................................... 111.3 112.0 115.5 116.3 .6 .6 3.1 .7 5.8 6.0 5.2 5.2 1992 ....................................... 116.8 117.4 120.3 120.8 .4 .5 2.5 .4 4.9 4.8 4.2 3.9 1993 ....................................... 121.5 121.5 125.0 125.3 .6 .0 2.9 .2 4.0 3.5 3.9 3.7 1994 ....................................... 125.7 126.0 128.5 128.8 .3 .2 2.0 .2 3.5 3.7 2.8 2.8 1995 ....................................... 129.3 131.3 134.6 135.2 .4 1.5 2.5 .4 2.9 4.2 4.7 5.0 1996 ....................................... 135.9 136.2 138.6 139.1 .5 .2 1.8 .4 5.1 3.7 3.0 2.9 1997 ....................................... 139.5 139.9 142.5 143.7 .3 .3 1.9 .8 2.6 2.7 2.8 3.3 1998 ....................................... 144.3 144.8 147.8 148.5 .4 .3 2.1 .5 3.4 3.5 3.7 3.3 1999 ....................................... 149.2 149.6 152.6 153.3 .5 .3 2.0 .5 3.4 3.3 3.2 3.2
Nonmanufacturing: 1979 ....................................... – – – 58.5 – – – – – – – – 1980 ....................................... 60.0 61.5 62.9 64.2 2.6 2.5 2.3 2.1 – – – 9.7 1981 ....................................... 66.5 67.8 69.1 70.4 3.6 2.0 1.9 1.9 10.8 10.2 9.9 9.7 1982 ....................................... 71.6 72.6 74.1 75.1 1.7 1.4 2.1 1.3 7.7 7.1 7.2 6.7 1983 ....................................... 76.3 77.4 78.6 79.6 1.6 1.4 1.6 1.3 6.6 6.6 6.1 6.0 1984 ....................................... 81.0 81.8 82.4 83.4 1.8 1.0 .7 1.2 6.2 5.7 4.8 4.8 1985 ....................................... 84.3 85.1 86.4 87.0 1.1 .9 1.5 .7 4.1 4.0 4.9 4.3 1986 ....................................... 87.9 88.5 89.2 89.7 1.0 .7 .8 .6 4.3 4.0 3.2 3.1 1987 ....................................... 90.9 91.5 92.4 92.9 1.3 .7 1.0 .5 3.4 3.4 3.6 3.6 1988 ....................................... 94.1 95.4 96.5 97.5 1.3 1.4 1.2 1.0 3.5 4.3 4.4 5.0 1989 ....................................... 98.8 100.0 101.3 102.3 1.3 1.2 1.3 1.0 5.0 4.8 5.0 4.9 1990 ....................................... 103.8 105.1 106.2 106.9 1.5 1.3 1.0 .7 5.1 5.1 4.8 4.5 1991 ....................................... 108.5 109.7 110.9 111.5 1.5 1.1 1.1 .5 4.5 4.4 4.4 4.3 1992 ....................................... 112.7 113.5 114.4 115.1 1.1 .7 .8 .6 3.9 3.5 3.2 3.2 1993 ....................................... 116.3 117.2 118.4 119.0 1.0 .8 1.0 .5 3.2 3.3 3.5 3.4 1994 ....................................... 120.3 121.2 122.3 122.6 1.1 .7 .9 .2 3.4 3.4 3.3 3.0 1995 ....................................... 123.7 124.6 125.5 125.9 .9 .7 .7 .3 2.8 2.8 2.6 2.7 1996 ....................................... 127.2 128.2 129.1 129.8 1.0 .8 .7 .5 2.8 2.9 2.9 3.1 1997 ....................................... 131.1 132.1 133.3 134.7 1.0 .8 .9 1.1 3.1 3.0 3.3 3.8 1998 ....................................... 136.0 137.2 138.9 139.7 1.0 .9 1.2 .6 3.7 3.9 4.2 3.7 1999 ....................................... 140.3 142.0 143.4 144.5 .4 1.2 1.0 .8 3.2 3.5 3.2 3.4
Nonmanufacturing, white-collaroccupations:
1987 ....................................... – 90.8 91.8 92.2 – – 1.1 .4 – – – – 1988 ....................................... 93.4 94.8 95.9 97.2 1.3 1.5 1.2 1.4 – 4.4 4.5 5.4 1989 ....................................... 98.8 100.0 101.4 102.6 1.6 1.2 1.4 1.2 5.8 5.5 5.7 5.6 1990 ....................................... 104.1 105.5 106.7 107.4 1.5 1.3 1.1 .7 5.4 5.5 5.2 4.7 1991 ....................................... 109.1 110.4 111.5 112.1 1.6 1.2 1.0 .5 4.8 4.6 4.5 4.4 1992 ....................................... 113.4 114.1 114.9 115.7 1.2 .6 .7 .7 3.9 3.4 3.0 3.2 1993 ....................................... 117.0 117.9 119.0 119.9 1.1 .8 .9 .8 3.2 3.3 3.6 3.6 1994 ....................................... 121.1 122.1 123.1 123.5 1.0 .8 .8 .3 3.5 3.6 3.4 3.0 1995 ....................................... 124.7 125.6 126.5 127.0 1.0 .7 .7 .4 3.0 2.9 2.8 2.8 1996 ....................................... 128.5 129.5 130.5 131.1 1.2 .8 .8 .5 3.0 3.1 3.2 3.2 1997 ....................................... 132.7 133.6 134.9 136.5 1.2 .7 1.0 1.2 3.3 3.2 3.4 4.1 1998 ....................................... 137.9 139.2 141.1 142.0 1.0 .9 1.4 .6 3.9 4.2 4.6 4.0 1999 ....................................... 142.3 144.1 145.6 146.9 .2 1.3 1.0 .9 3.2 3.5 3.2 3.5
Nonmanufacturing, white-collaroccupations, excluding sales:
1987 ....................................... – 91.0 92.3 92.9 – – 1.4 .7 – – – – 1988 ....................................... 94.1 95.3 96.6 97.5 1.3 1.3 1.4 .9 – 4.7 4.7 5.0 1989 ....................................... 99.0 100.0 101.4 102.3 1.5 1.0 1.4 .9 5.2 4.9 5.0 4.9
See footnotes at end of table.
58
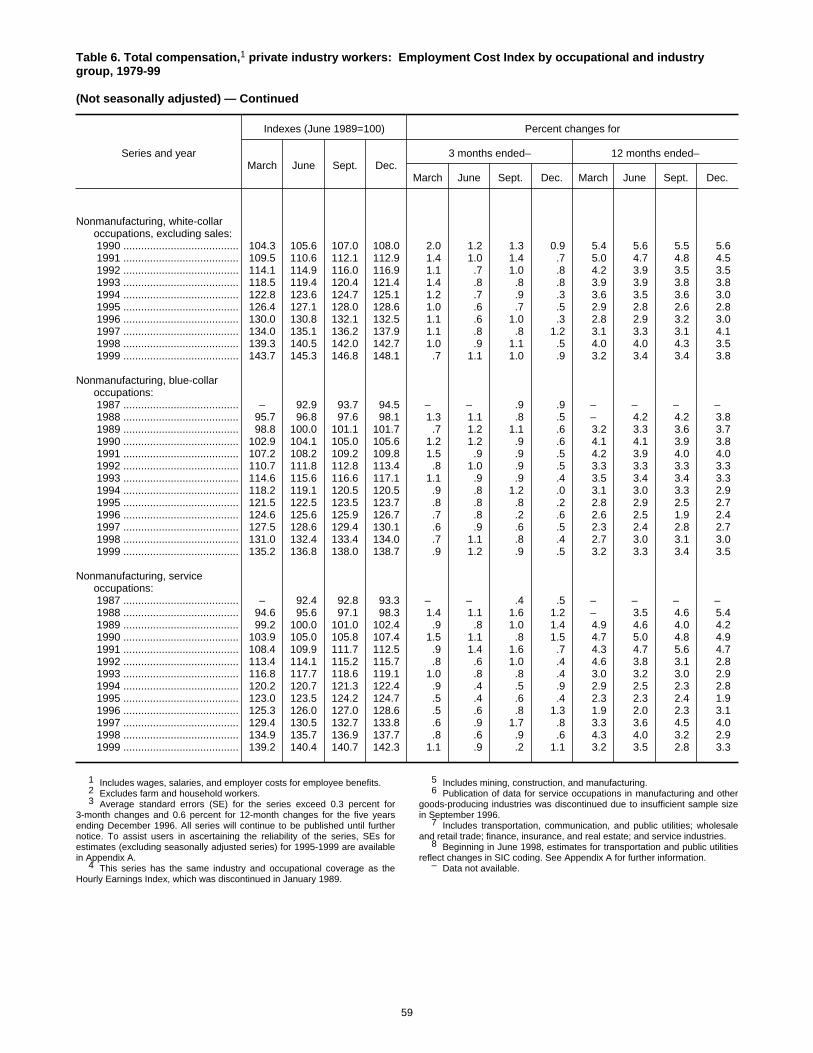
Table 6. Total compensation,1 private industry workers: Employment Cost Index by occupational and industrygroup, 1979-99
(Not seasonally adjusted) — Continued
Series and year
Indexes (June 1989=100) Percent changes for
March June Sept. Dec.3 months ended– 12 months ended–
March June Sept. Dec. March June Sept. Dec.
Nonmanufacturing, white-collaroccupations, excluding sales:
1990 ....................................... 104.3 105.6 107.0 108.0 2.0 1.2 1.3 0.9 5.4 5.6 5.5 5.6 1991 ....................................... 109.5 110.6 112.1 112.9 1.4 1.0 1.4 .7 5.0 4.7 4.8 4.5 1992 ....................................... 114.1 114.9 116.0 116.9 1.1 .7 1.0 .8 4.2 3.9 3.5 3.5 1993 ....................................... 118.5 119.4 120.4 121.4 1.4 .8 .8 .8 3.9 3.9 3.8 3.8 1994 ....................................... 122.8 123.6 124.7 125.1 1.2 .7 .9 .3 3.6 3.5 3.6 3.0 1995 ....................................... 126.4 127.1 128.0 128.6 1.0 .6 .7 .5 2.9 2.8 2.6 2.8 1996 ....................................... 130.0 130.8 132.1 132.5 1.1 .6 1.0 .3 2.8 2.9 3.2 3.0 1997 ....................................... 134.0 135.1 136.2 137.9 1.1 .8 .8 1.2 3.1 3.3 3.1 4.1 1998 ....................................... 139.3 140.5 142.0 142.7 1.0 .9 1.1 .5 4.0 4.0 4.3 3.5 1999 ....................................... 143.7 145.3 146.8 148.1 .7 1.1 1.0 .9 3.2 3.4 3.4 3.8
Nonmanufacturing, blue-collaroccupations:
1987 ....................................... – 92.9 93.7 94.5 – – .9 .9 – – – – 1988 ....................................... 95.7 96.8 97.6 98.1 1.3 1.1 .8 .5 – 4.2 4.2 3.8 1989 ....................................... 98.8 100.0 101.1 101.7 .7 1.2 1.1 .6 3.2 3.3 3.6 3.7 1990 ....................................... 102.9 104.1 105.0 105.6 1.2 1.2 .9 .6 4.1 4.1 3.9 3.8 1991 ....................................... 107.2 108.2 109.2 109.8 1.5 .9 .9 .5 4.2 3.9 4.0 4.0 1992 ....................................... 110.7 111.8 112.8 113.4 .8 1.0 .9 .5 3.3 3.3 3.3 3.3 1993 ....................................... 114.6 115.6 116.6 117.1 1.1 .9 .9 .4 3.5 3.4 3.4 3.3 1994 ....................................... 118.2 119.1 120.5 120.5 .9 .8 1.2 .0 3.1 3.0 3.3 2.9 1995 ....................................... 121.5 122.5 123.5 123.7 .8 .8 .8 .2 2.8 2.9 2.5 2.7 1996 ....................................... 124.6 125.6 125.9 126.7 .7 .8 .2 .6 2.6 2.5 1.9 2.4 1997 ....................................... 127.5 128.6 129.4 130.1 .6 .9 .6 .5 2.3 2.4 2.8 2.7 1998 ....................................... 131.0 132.4 133.4 134.0 .7 1.1 .8 .4 2.7 3.0 3.1 3.0 1999 ....................................... 135.2 136.8 138.0 138.7 .9 1.2 .9 .5 3.2 3.3 3.4 3.5
Nonmanufacturing, serviceoccupations:
1987 ....................................... – 92.4 92.8 93.3 – – .4 .5 – – – – 1988 ....................................... 94.6 95.6 97.1 98.3 1.4 1.1 1.6 1.2 – 3.5 4.6 5.4 1989 ....................................... 99.2 100.0 101.0 102.4 .9 .8 1.0 1.4 4.9 4.6 4.0 4.2 1990 ....................................... 103.9 105.0 105.8 107.4 1.5 1.1 .8 1.5 4.7 5.0 4.8 4.9 1991 ....................................... 108.4 109.9 111.7 112.5 .9 1.4 1.6 .7 4.3 4.7 5.6 4.7 1992 ....................................... 113.4 114.1 115.2 115.7 .8 .6 1.0 .4 4.6 3.8 3.1 2.8 1993 ....................................... 116.8 117.7 118.6 119.1 1.0 .8 .8 .4 3.0 3.2 3.0 2.9 1994 ....................................... 120.2 120.7 121.3 122.4 .9 .4 .5 .9 2.9 2.5 2.3 2.8 1995 ....................................... 123.0 123.5 124.2 124.7 .5 .4 .6 .4 2.3 2.3 2.4 1.9 1996 ....................................... 125.3 126.0 127.0 128.6 .5 .6 .8 1.3 1.9 2.0 2.3 3.1 1997 ....................................... 129.4 130.5 132.7 133.8 .6 .9 1.7 .8 3.3 3.6 4.5 4.0 1998 ....................................... 134.9 135.7 136.9 137.7 .8 .6 .9 .6 4.3 4.0 3.2 2.9 1999 ....................................... 139.2 140.4 140.7 142.3 1.1 .9 .2 1.1 3.2 3.5 2.8 3.3
1 Includes wages, salaries, and employer costs for employee benefits.2 Excludes farm and household workers.3 Average standard errors (SE) for the series exceed 0.3 percent for
3-month changes and 0.6 percent for 12-month changes for the five yearsending December 1996. All series will continue to be published until furthernotice. To assist users in ascertaining the reliability of the series, SEs forestimates (excluding seasonally adjusted series) for 1995-1999 are availablein Appendix A.
4 This series has the same industry and occupational coverage as theHourly Earnings Index, which was discontinued in January 1989.
5 Includes mining, construction, and manufacturing.6 Publication of data for service occupations in manufacturing and other
goods-producing industries was discontinued due to insufficient sample sizein September 1996.
7 Includes transportation, communication, and public utilities; wholesaleand retail trade; finance, insurance, and real estate; and service industries.
8 Beginning in June 1998, estimates for transportation and public utilitiesreflect changes in SIC coding. See Appendix A for further information.
– Data not available.
59
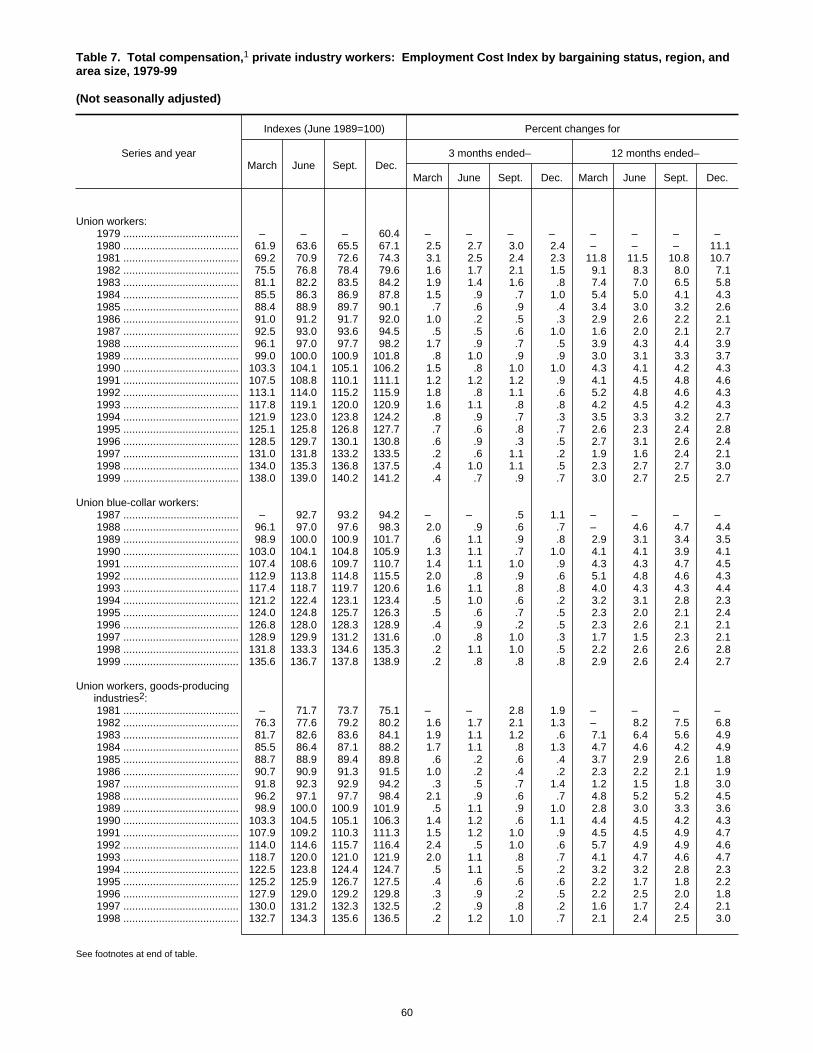
Table 7. Total compensation,1 private industry workers: Employment Cost Index by bargaining status, region, andarea size, 1979-99
(Not seasonally adjusted)
Series and year
Indexes (June 1989=100) Percent changes for
March June Sept. Dec.3 months ended– 12 months ended–
March June Sept. Dec. March June Sept. Dec.
Union workers: 1979 ....................................... – – – 60.4 – – – – – – – – 1980 ....................................... 61.9 63.6 65.5 67.1 2.5 2.7 3.0 2.4 – – – 11.1 1981 ....................................... 69.2 70.9 72.6 74.3 3.1 2.5 2.4 2.3 11.8 11.5 10.8 10.7 1982 ....................................... 75.5 76.8 78.4 79.6 1.6 1.7 2.1 1.5 9.1 8.3 8.0 7.1 1983 ....................................... 81.1 82.2 83.5 84.2 1.9 1.4 1.6 .8 7.4 7.0 6.5 5.8 1984 ....................................... 85.5 86.3 86.9 87.8 1.5 .9 .7 1.0 5.4 5.0 4.1 4.3 1985 ....................................... 88.4 88.9 89.7 90.1 .7 .6 .9 .4 3.4 3.0 3.2 2.6 1986 ....................................... 91.0 91.2 91.7 92.0 1.0 .2 .5 .3 2.9 2.6 2.2 2.1 1987 ....................................... 92.5 93.0 93.6 94.5 .5 .5 .6 1.0 1.6 2.0 2.1 2.7 1988 ....................................... 96.1 97.0 97.7 98.2 1.7 .9 .7 .5 3.9 4.3 4.4 3.9 1989 ....................................... 99.0 100.0 100.9 101.8 .8 1.0 .9 .9 3.0 3.1 3.3 3.7 1990 ....................................... 103.3 104.1 105.1 106.2 1.5 .8 1.0 1.0 4.3 4.1 4.2 4.3 1991 ....................................... 107.5 108.8 110.1 111.1 1.2 1.2 1.2 .9 4.1 4.5 4.8 4.6 1992 ....................................... 113.1 114.0 115.2 115.9 1.8 .8 1.1 .6 5.2 4.8 4.6 4.3 1993 ....................................... 117.8 119.1 120.0 120.9 1.6 1.1 .8 .8 4.2 4.5 4.2 4.3 1994 ....................................... 121.9 123.0 123.8 124.2 .8 .9 .7 .3 3.5 3.3 3.2 2.7 1995 ....................................... 125.1 125.8 126.8 127.7 .7 .6 .8 .7 2.6 2.3 2.4 2.8 1996 ....................................... 128.5 129.7 130.1 130.8 .6 .9 .3 .5 2.7 3.1 2.6 2.4 1997 ....................................... 131.0 131.8 133.2 133.5 .2 .6 1.1 .2 1.9 1.6 2.4 2.1 1998 ....................................... 134.0 135.3 136.8 137.5 .4 1.0 1.1 .5 2.3 2.7 2.7 3.0 1999 ....................................... 138.0 139.0 140.2 141.2 .4 .7 .9 .7 3.0 2.7 2.5 2.7
Union blue-collar workers: 1987 ....................................... – 92.7 93.2 94.2 – – .5 1.1 – – – – 1988 ....................................... 96.1 97.0 97.6 98.3 2.0 .9 .6 .7 – 4.6 4.7 4.4 1989 ....................................... 98.9 100.0 100.9 101.7 .6 1.1 .9 .8 2.9 3.1 3.4 3.5 1990 ....................................... 103.0 104.1 104.8 105.9 1.3 1.1 .7 1.0 4.1 4.1 3.9 4.1 1991 ....................................... 107.4 108.6 109.7 110.7 1.4 1.1 1.0 .9 4.3 4.3 4.7 4.5 1992 ....................................... 112.9 113.8 114.8 115.5 2.0 .8 .9 .6 5.1 4.8 4.6 4.3 1993 ....................................... 117.4 118.7 119.7 120.6 1.6 1.1 .8 .8 4.0 4.3 4.3 4.4 1994 ....................................... 121.2 122.4 123.1 123.4 .5 1.0 .6 .2 3.2 3.1 2.8 2.3 1995 ....................................... 124.0 124.8 125.7 126.3 .5 .6 .7 .5 2.3 2.0 2.1 2.4 1996 ....................................... 126.8 128.0 128.3 128.9 .4 .9 .2 .5 2.3 2.6 2.1 2.1 1997 ....................................... 128.9 129.9 131.2 131.6 .0 .8 1.0 .3 1.7 1.5 2.3 2.1 1998 ....................................... 131.8 133.3 134.6 135.3 .2 1.1 1.0 .5 2.2 2.6 2.6 2.8 1999 ....................................... 135.6 136.7 137.8 138.9 .2 .8 .8 .8 2.9 2.6 2.4 2.7
Union workers, goods-producingindustries2:
1981 ....................................... – 71.7 73.7 75.1 – – 2.8 1.9 – – – – 1982 ....................................... 76.3 77.6 79.2 80.2 1.6 1.7 2.1 1.3 – 8.2 7.5 6.8 1983 ....................................... 81.7 82.6 83.6 84.1 1.9 1.1 1.2 .6 7.1 6.4 5.6 4.9 1984 ....................................... 85.5 86.4 87.1 88.2 1.7 1.1 .8 1.3 4.7 4.6 4.2 4.9 1985 ....................................... 88.7 88.9 89.4 89.8 .6 .2 .6 .4 3.7 2.9 2.6 1.8 1986 ....................................... 90.7 90.9 91.3 91.5 1.0 .2 .4 .2 2.3 2.2 2.1 1.9 1987 ....................................... 91.8 92.3 92.9 94.2 .3 .5 .7 1.4 1.2 1.5 1.8 3.0 1988 ....................................... 96.2 97.1 97.7 98.4 2.1 .9 .6 .7 4.8 5.2 5.2 4.5 1989 ....................................... 98.9 100.0 100.9 101.9 .5 1.1 .9 1.0 2.8 3.0 3.3 3.6 1990 ....................................... 103.3 104.5 105.1 106.3 1.4 1.2 .6 1.1 4.4 4.5 4.2 4.3 1991 ....................................... 107.9 109.2 110.3 111.3 1.5 1.2 1.0 .9 4.5 4.5 4.9 4.7 1992 ....................................... 114.0 114.6 115.7 116.4 2.4 .5 1.0 .6 5.7 4.9 4.9 4.6 1993 ....................................... 118.7 120.0 121.0 121.9 2.0 1.1 .8 .7 4.1 4.7 4.6 4.7 1994 ....................................... 122.5 123.8 124.4 124.7 .5 1.1 .5 .2 3.2 3.2 2.8 2.3 1995 ....................................... 125.2 125.9 126.7 127.5 .4 .6 .6 .6 2.2 1.7 1.8 2.2 1996 ....................................... 127.9 129.0 129.2 129.8 .3 .9 .2 .5 2.2 2.5 2.0 1.8 1997 ....................................... 130.0 131.2 132.3 132.5 .2 .9 .8 .2 1.6 1.7 2.4 2.1 1998 ....................................... 132.7 134.3 135.6 136.5 .2 1.2 1.0 .7 2.1 2.4 2.5 3.0
See footnotes at end of table.
60
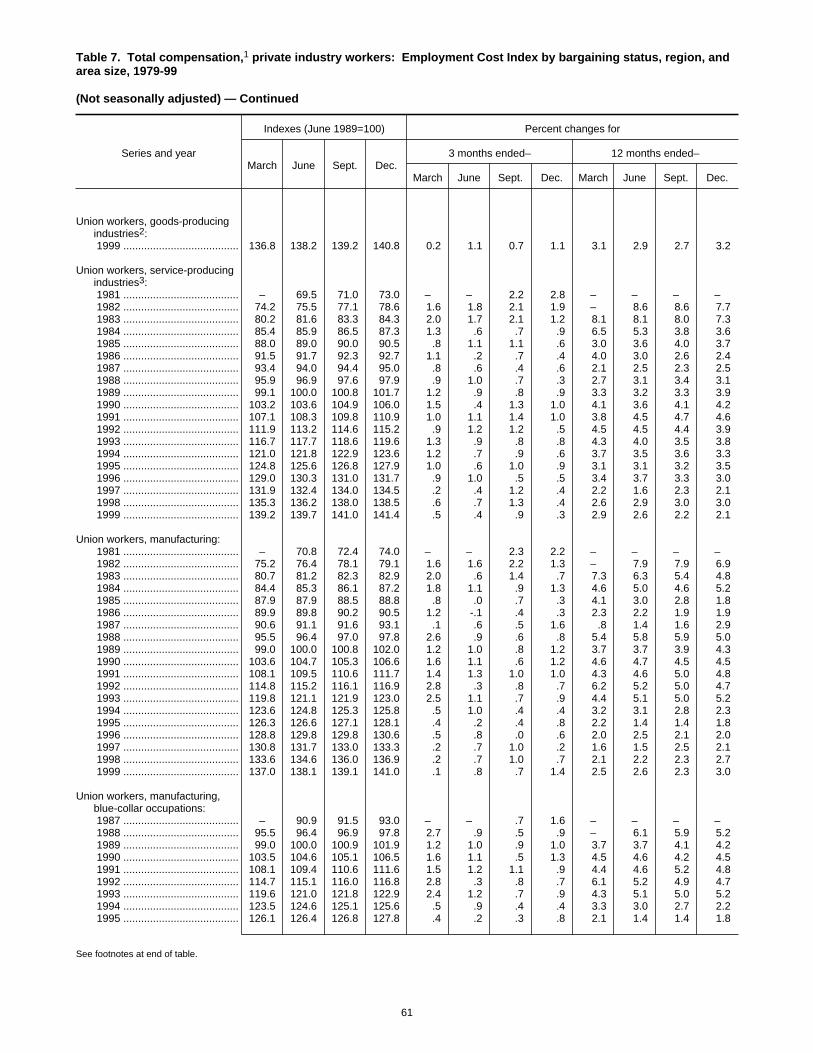
Table 7. Total compensation,1 private industry workers: Employment Cost Index by bargaining status, region, andarea size, 1979-99
(Not seasonally adjusted) — Continued
Series and year
Indexes (June 1989=100) Percent changes for
March June Sept. Dec.3 months ended– 12 months ended–
March June Sept. Dec. March June Sept. Dec.
Union workers, goods-producingindustries2:
1999 ....................................... 136.8 138.2 139.2 140.8 0.2 1.1 0.7 1.1 3.1 2.9 2.7 3.2
Union workers, service-producingindustries3:
1981 ....................................... – 69.5 71.0 73.0 – – 2.2 2.8 – – – – 1982 ....................................... 74.2 75.5 77.1 78.6 1.6 1.8 2.1 1.9 – 8.6 8.6 7.7 1983 ....................................... 80.2 81.6 83.3 84.3 2.0 1.7 2.1 1.2 8.1 8.1 8.0 7.3 1984 ....................................... 85.4 85.9 86.5 87.3 1.3 .6 .7 .9 6.5 5.3 3.8 3.6 1985 ....................................... 88.0 89.0 90.0 90.5 .8 1.1 1.1 .6 3.0 3.6 4.0 3.7 1986 ....................................... 91.5 91.7 92.3 92.7 1.1 .2 .7 .4 4.0 3.0 2.6 2.4 1987 ....................................... 93.4 94.0 94.4 95.0 .8 .6 .4 .6 2.1 2.5 2.3 2.5 1988 ....................................... 95.9 96.9 97.6 97.9 .9 1.0 .7 .3 2.7 3.1 3.4 3.1 1989 ....................................... 99.1 100.0 100.8 101.7 1.2 .9 .8 .9 3.3 3.2 3.3 3.9 1990 ....................................... 103.2 103.6 104.9 106.0 1.5 .4 1.3 1.0 4.1 3.6 4.1 4.2 1991 ....................................... 107.1 108.3 109.8 110.9 1.0 1.1 1.4 1.0 3.8 4.5 4.7 4.6 1992 ....................................... 111.9 113.2 114.6 115.2 .9 1.2 1.2 .5 4.5 4.5 4.4 3.9 1993 ....................................... 116.7 117.7 118.6 119.6 1.3 .9 .8 .8 4.3 4.0 3.5 3.8 1994 ....................................... 121.0 121.8 122.9 123.6 1.2 .7 .9 .6 3.7 3.5 3.6 3.3 1995 ....................................... 124.8 125.6 126.8 127.9 1.0 .6 1.0 .9 3.1 3.1 3.2 3.5 1996 ....................................... 129.0 130.3 131.0 131.7 .9 1.0 .5 .5 3.4 3.7 3.3 3.0 1997 ....................................... 131.9 132.4 134.0 134.5 .2 .4 1.2 .4 2.2 1.6 2.3 2.1 1998 ....................................... 135.3 136.2 138.0 138.5 .6 .7 1.3 .4 2.6 2.9 3.0 3.0 1999 ....................................... 139.2 139.7 141.0 141.4 .5 .4 .9 .3 2.9 2.6 2.2 2.1
Union workers, manufacturing: 1981 ....................................... – 70.8 72.4 74.0 – – 2.3 2.2 – – – – 1982 ....................................... 75.2 76.4 78.1 79.1 1.6 1.6 2.2 1.3 – 7.9 7.9 6.9 1983 ....................................... 80.7 81.2 82.3 82.9 2.0 .6 1.4 .7 7.3 6.3 5.4 4.8 1984 ....................................... 84.4 85.3 86.1 87.2 1.8 1.1 .9 1.3 4.6 5.0 4.6 5.2 1985 ....................................... 87.9 87.9 88.5 88.8 .8 .0 .7 .3 4.1 3.0 2.8 1.8 1986 ....................................... 89.9 89.8 90.2 90.5 1.2 -.1 .4 .3 2.3 2.2 1.9 1.9 1987 ....................................... 90.6 91.1 91.6 93.1 .1 .6 .5 1.6 .8 1.4 1.6 2.9 1988 ....................................... 95.5 96.4 97.0 97.8 2.6 .9 .6 .8 5.4 5.8 5.9 5.0 1989 ....................................... 99.0 100.0 100.8 102.0 1.2 1.0 .8 1.2 3.7 3.7 3.9 4.3 1990 ....................................... 103.6 104.7 105.3 106.6 1.6 1.1 .6 1.2 4.6 4.7 4.5 4.5 1991 ....................................... 108.1 109.5 110.6 111.7 1.4 1.3 1.0 1.0 4.3 4.6 5.0 4.8 1992 ....................................... 114.8 115.2 116.1 116.9 2.8 .3 .8 .7 6.2 5.2 5.0 4.7 1993 ....................................... 119.8 121.1 121.9 123.0 2.5 1.1 .7 .9 4.4 5.1 5.0 5.2 1994 ....................................... 123.6 124.8 125.3 125.8 .5 1.0 .4 .4 3.2 3.1 2.8 2.3 1995 ....................................... 126.3 126.6 127.1 128.1 .4 .2 .4 .8 2.2 1.4 1.4 1.8 1996 ....................................... 128.8 129.8 129.8 130.6 .5 .8 .0 .6 2.0 2.5 2.1 2.0 1997 ....................................... 130.8 131.7 133.0 133.3 .2 .7 1.0 .2 1.6 1.5 2.5 2.1 1998 ....................................... 133.6 134.6 136.0 136.9 .2 .7 1.0 .7 2.1 2.2 2.3 2.7 1999 ....................................... 137.0 138.1 139.1 141.0 .1 .8 .7 1.4 2.5 2.6 2.3 3.0
Union workers, manufacturing,blue-collar occupations:
1987 ....................................... – 90.9 91.5 93.0 – – .7 1.6 – – – – 1988 ....................................... 95.5 96.4 96.9 97.8 2.7 .9 .5 .9 – 6.1 5.9 5.2 1989 ....................................... 99.0 100.0 100.9 101.9 1.2 1.0 .9 1.0 3.7 3.7 4.1 4.2 1990 ....................................... 103.5 104.6 105.1 106.5 1.6 1.1 .5 1.3 4.5 4.6 4.2 4.5 1991 ....................................... 108.1 109.4 110.6 111.6 1.5 1.2 1.1 .9 4.4 4.6 5.2 4.8 1992 ....................................... 114.7 115.1 116.0 116.8 2.8 .3 .8 .7 6.1 5.2 4.9 4.7 1993 ....................................... 119.6 121.0 121.8 122.9 2.4 1.2 .7 .9 4.3 5.1 5.0 5.2 1994 ....................................... 123.5 124.6 125.1 125.6 .5 .9 .4 .4 3.3 3.0 2.7 2.2 1995 ....................................... 126.1 126.4 126.8 127.8 .4 .2 .3 .8 2.1 1.4 1.4 1.8
See footnotes at end of table.
61
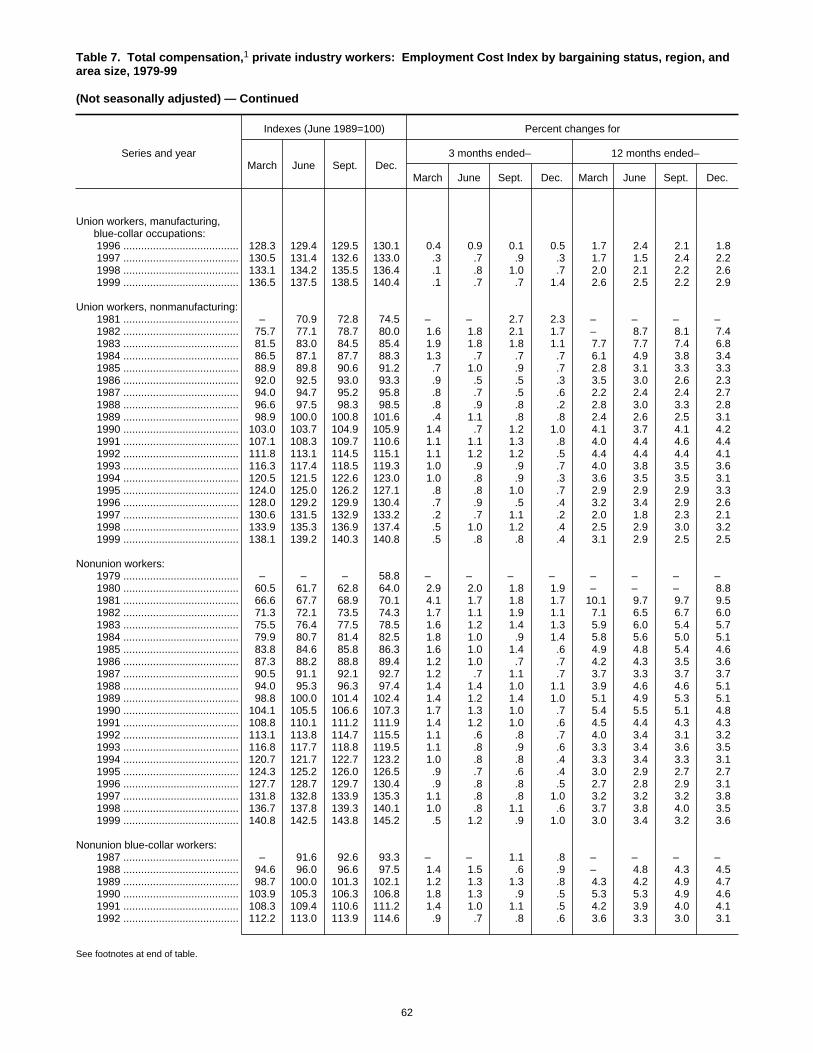
Table 7. Total compensation,1 private industry workers: Employment Cost Index by bargaining status, region, andarea size, 1979-99
(Not seasonally adjusted) — Continued
Series and year
Indexes (June 1989=100) Percent changes for
March June Sept. Dec.3 months ended– 12 months ended–
March June Sept. Dec. March June Sept. Dec.
Union workers, manufacturing,blue-collar occupations:
1996 ....................................... 128.3 129.4 129.5 130.1 0.4 0.9 0.1 0.5 1.7 2.4 2.1 1.8 1997 ....................................... 130.5 131.4 132.6 133.0 .3 .7 .9 .3 1.7 1.5 2.4 2.2 1998 ....................................... 133.1 134.2 135.5 136.4 .1 .8 1.0 .7 2.0 2.1 2.2 2.6 1999 ....................................... 136.5 137.5 138.5 140.4 .1 .7 .7 1.4 2.6 2.5 2.2 2.9
Union workers, nonmanufacturing: 1981 ....................................... – 70.9 72.8 74.5 – – 2.7 2.3 – – – – 1982 ....................................... 75.7 77.1 78.7 80.0 1.6 1.8 2.1 1.7 – 8.7 8.1 7.4 1983 ....................................... 81.5 83.0 84.5 85.4 1.9 1.8 1.8 1.1 7.7 7.7 7.4 6.8 1984 ....................................... 86.5 87.1 87.7 88.3 1.3 .7 .7 .7 6.1 4.9 3.8 3.4 1985 ....................................... 88.9 89.8 90.6 91.2 .7 1.0 .9 .7 2.8 3.1 3.3 3.3 1986 ....................................... 92.0 92.5 93.0 93.3 .9 .5 .5 .3 3.5 3.0 2.6 2.3 1987 ....................................... 94.0 94.7 95.2 95.8 .8 .7 .5 .6 2.2 2.4 2.4 2.7 1988 ....................................... 96.6 97.5 98.3 98.5 .8 .9 .8 .2 2.8 3.0 3.3 2.8 1989 ....................................... 98.9 100.0 100.8 101.6 .4 1.1 .8 .8 2.4 2.6 2.5 3.1 1990 ....................................... 103.0 103.7 104.9 105.9 1.4 .7 1.2 1.0 4.1 3.7 4.1 4.2 1991 ....................................... 107.1 108.3 109.7 110.6 1.1 1.1 1.3 .8 4.0 4.4 4.6 4.4 1992 ....................................... 111.8 113.1 114.5 115.1 1.1 1.2 1.2 .5 4.4 4.4 4.4 4.1 1993 ....................................... 116.3 117.4 118.5 119.3 1.0 .9 .9 .7 4.0 3.8 3.5 3.6 1994 ....................................... 120.5 121.5 122.6 123.0 1.0 .8 .9 .3 3.6 3.5 3.5 3.1 1995 ....................................... 124.0 125.0 126.2 127.1 .8 .8 1.0 .7 2.9 2.9 2.9 3.3 1996 ....................................... 128.0 129.2 129.9 130.4 .7 .9 .5 .4 3.2 3.4 2.9 2.6 1997 ....................................... 130.6 131.5 132.9 133.2 .2 .7 1.1 .2 2.0 1.8 2.3 2.1 1998 ....................................... 133.9 135.3 136.9 137.4 .5 1.0 1.2 .4 2.5 2.9 3.0 3.2 1999 ....................................... 138.1 139.2 140.3 140.8 .5 .8 .8 .4 3.1 2.9 2.5 2.5
Nonunion workers: 1979 ....................................... – – – 58.8 – – – – – – – – 1980 ....................................... 60.5 61.7 62.8 64.0 2.9 2.0 1.8 1.9 – – – 8.8 1981 ....................................... 66.6 67.7 68.9 70.1 4.1 1.7 1.8 1.7 10.1 9.7 9.7 9.5 1982 ....................................... 71.3 72.1 73.5 74.3 1.7 1.1 1.9 1.1 7.1 6.5 6.7 6.0 1983 ....................................... 75.5 76.4 77.5 78.5 1.6 1.2 1.4 1.3 5.9 6.0 5.4 5.7 1984 ....................................... 79.9 80.7 81.4 82.5 1.8 1.0 .9 1.4 5.8 5.6 5.0 5.1 1985 ....................................... 83.8 84.6 85.8 86.3 1.6 1.0 1.4 .6 4.9 4.8 5.4 4.6 1986 ....................................... 87.3 88.2 88.8 89.4 1.2 1.0 .7 .7 4.2 4.3 3.5 3.6 1987 ....................................... 90.5 91.1 92.1 92.7 1.2 .7 1.1 .7 3.7 3.3 3.7 3.7 1988 ....................................... 94.0 95.3 96.3 97.4 1.4 1.4 1.0 1.1 3.9 4.6 4.6 5.1 1989 ....................................... 98.8 100.0 101.4 102.4 1.4 1.2 1.4 1.0 5.1 4.9 5.3 5.1 1990 ....................................... 104.1 105.5 106.6 107.3 1.7 1.3 1.0 .7 5.4 5.5 5.1 4.8 1991 ....................................... 108.8 110.1 111.2 111.9 1.4 1.2 1.0 .6 4.5 4.4 4.3 4.3 1992 ....................................... 113.1 113.8 114.7 115.5 1.1 .6 .8 .7 4.0 3.4 3.1 3.2 1993 ....................................... 116.8 117.7 118.8 119.5 1.1 .8 .9 .6 3.3 3.4 3.6 3.5 1994 ....................................... 120.7 121.7 122.7 123.2 1.0 .8 .8 .4 3.3 3.4 3.3 3.1 1995 ....................................... 124.3 125.2 126.0 126.5 .9 .7 .6 .4 3.0 2.9 2.7 2.7 1996 ....................................... 127.7 128.7 129.7 130.4 .9 .8 .8 .5 2.7 2.8 2.9 3.1 1997 ....................................... 131.8 132.8 133.9 135.3 1.1 .8 .8 1.0 3.2 3.2 3.2 3.8 1998 ....................................... 136.7 137.8 139.3 140.1 1.0 .8 1.1 .6 3.7 3.8 4.0 3.5 1999 ....................................... 140.8 142.5 143.8 145.2 .5 1.2 .9 1.0 3.0 3.4 3.2 3.6
Nonunion blue-collar workers: 1987 ....................................... – 91.6 92.6 93.3 – – 1.1 .8 – – – – 1988 ....................................... 94.6 96.0 96.6 97.5 1.4 1.5 .6 .9 – 4.8 4.3 4.5 1989 ....................................... 98.7 100.0 101.3 102.1 1.2 1.3 1.3 .8 4.3 4.2 4.9 4.7 1990 ....................................... 103.9 105.3 106.3 106.8 1.8 1.3 .9 .5 5.3 5.3 4.9 4.6 1991 ....................................... 108.3 109.4 110.6 111.2 1.4 1.0 1.1 .5 4.2 3.9 4.0 4.1 1992 ....................................... 112.2 113.0 113.9 114.6 .9 .7 .8 .6 3.6 3.3 3.0 3.1
See footnotes at end of table.
62
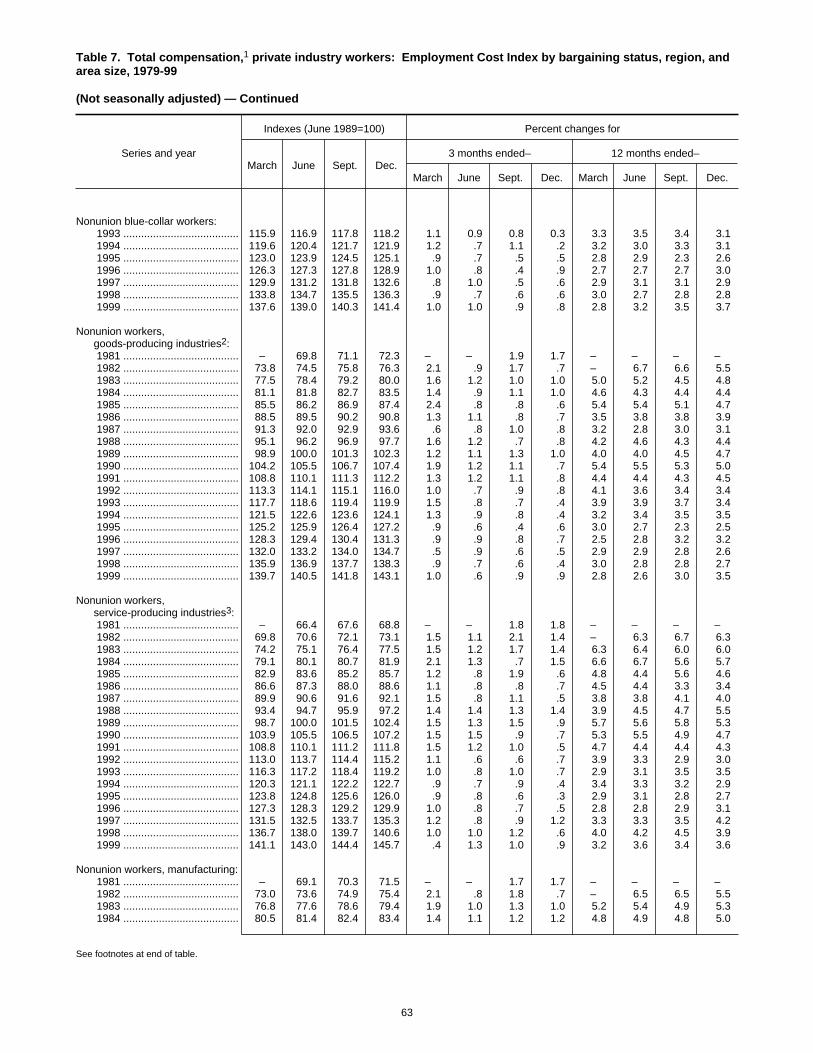
Table 7. Total compensation,1 private industry workers: Employment Cost Index by bargaining status, region, andarea size, 1979-99
(Not seasonally adjusted) — Continued
Series and year
Indexes (June 1989=100) Percent changes for
March June Sept. Dec.3 months ended– 12 months ended–
March June Sept. Dec. March June Sept. Dec.
Nonunion blue-collar workers: 1993 ....................................... 115.9 116.9 117.8 118.2 1.1 0.9 0.8 0.3 3.3 3.5 3.4 3.1 1994 ....................................... 119.6 120.4 121.7 121.9 1.2 .7 1.1 .2 3.2 3.0 3.3 3.1 1995 ....................................... 123.0 123.9 124.5 125.1 .9 .7 .5 .5 2.8 2.9 2.3 2.6 1996 ....................................... 126.3 127.3 127.8 128.9 1.0 .8 .4 .9 2.7 2.7 2.7 3.0 1997 ....................................... 129.9 131.2 131.8 132.6 .8 1.0 .5 .6 2.9 3.1 3.1 2.9 1998 ....................................... 133.8 134.7 135.5 136.3 .9 .7 .6 .6 3.0 2.7 2.8 2.8 1999 ....................................... 137.6 139.0 140.3 141.4 1.0 1.0 .9 .8 2.8 3.2 3.5 3.7
Nonunion workers,goods-producing industries2:
1981 ....................................... – 69.8 71.1 72.3 – – 1.9 1.7 – – – – 1982 ....................................... 73.8 74.5 75.8 76.3 2.1 .9 1.7 .7 – 6.7 6.6 5.5 1983 ....................................... 77.5 78.4 79.2 80.0 1.6 1.2 1.0 1.0 5.0 5.2 4.5 4.8 1984 ....................................... 81.1 81.8 82.7 83.5 1.4 .9 1.1 1.0 4.6 4.3 4.4 4.4 1985 ....................................... 85.5 86.2 86.9 87.4 2.4 .8 .8 .6 5.4 5.4 5.1 4.7 1986 ....................................... 88.5 89.5 90.2 90.8 1.3 1.1 .8 .7 3.5 3.8 3.8 3.9 1987 ....................................... 91.3 92.0 92.9 93.6 .6 .8 1.0 .8 3.2 2.8 3.0 3.1 1988 ....................................... 95.1 96.2 96.9 97.7 1.6 1.2 .7 .8 4.2 4.6 4.3 4.4 1989 ....................................... 98.9 100.0 101.3 102.3 1.2 1.1 1.3 1.0 4.0 4.0 4.5 4.7 1990 ....................................... 104.2 105.5 106.7 107.4 1.9 1.2 1.1 .7 5.4 5.5 5.3 5.0 1991 ....................................... 108.8 110.1 111.3 112.2 1.3 1.2 1.1 .8 4.4 4.4 4.3 4.5 1992 ....................................... 113.3 114.1 115.1 116.0 1.0 .7 .9 .8 4.1 3.6 3.4 3.4 1993 ....................................... 117.7 118.6 119.4 119.9 1.5 .8 .7 .4 3.9 3.9 3.7 3.4 1994 ....................................... 121.5 122.6 123.6 124.1 1.3 .9 .8 .4 3.2 3.4 3.5 3.5 1995 ....................................... 125.2 125.9 126.4 127.2 .9 .6 .4 .6 3.0 2.7 2.3 2.5 1996 ....................................... 128.3 129.4 130.4 131.3 .9 .9 .8 .7 2.5 2.8 3.2 3.2 1997 ....................................... 132.0 133.2 134.0 134.7 .5 .9 .6 .5 2.9 2.9 2.8 2.6 1998 ....................................... 135.9 136.9 137.7 138.3 .9 .7 .6 .4 3.0 2.8 2.8 2.7 1999 ....................................... 139.7 140.5 141.8 143.1 1.0 .6 .9 .9 2.8 2.6 3.0 3.5
Nonunion workers,service-producing industries3:
1981 ....................................... – 66.4 67.6 68.8 – – 1.8 1.8 – – – – 1982 ....................................... 69.8 70.6 72.1 73.1 1.5 1.1 2.1 1.4 – 6.3 6.7 6.3 1983 ....................................... 74.2 75.1 76.4 77.5 1.5 1.2 1.7 1.4 6.3 6.4 6.0 6.0 1984 ....................................... 79.1 80.1 80.7 81.9 2.1 1.3 .7 1.5 6.6 6.7 5.6 5.7 1985 ....................................... 82.9 83.6 85.2 85.7 1.2 .8 1.9 .6 4.8 4.4 5.6 4.6 1986 ....................................... 86.6 87.3 88.0 88.6 1.1 .8 .8 .7 4.5 4.4 3.3 3.4 1987 ....................................... 89.9 90.6 91.6 92.1 1.5 .8 1.1 .5 3.8 3.8 4.1 4.0 1988 ....................................... 93.4 94.7 95.9 97.2 1.4 1.4 1.3 1.4 3.9 4.5 4.7 5.5 1989 ....................................... 98.7 100.0 101.5 102.4 1.5 1.3 1.5 .9 5.7 5.6 5.8 5.3 1990 ....................................... 103.9 105.5 106.5 107.2 1.5 1.5 .9 .7 5.3 5.5 4.9 4.7 1991 ....................................... 108.8 110.1 111.2 111.8 1.5 1.2 1.0 .5 4.7 4.4 4.4 4.3 1992 ....................................... 113.0 113.7 114.4 115.2 1.1 .6 .6 .7 3.9 3.3 2.9 3.0 1993 ....................................... 116.3 117.2 118.4 119.2 1.0 .8 1.0 .7 2.9 3.1 3.5 3.5 1994 ....................................... 120.3 121.1 122.2 122.7 .9 .7 .9 .4 3.4 3.3 3.2 2.9 1995 ....................................... 123.8 124.8 125.6 126.0 .9 .8 .6 .3 2.9 3.1 2.8 2.7 1996 ....................................... 127.3 128.3 129.2 129.9 1.0 .8 .7 .5 2.8 2.8 2.9 3.1 1997 ....................................... 131.5 132.5 133.7 135.3 1.2 .8 .9 1.2 3.3 3.3 3.5 4.2 1998 ....................................... 136.7 138.0 139.7 140.6 1.0 1.0 1.2 .6 4.0 4.2 4.5 3.9 1999 ....................................... 141.1 143.0 144.4 145.7 .4 1.3 1.0 .9 3.2 3.6 3.4 3.6
Nonunion workers, manufacturing: 1981 ....................................... – 69.1 70.3 71.5 – – 1.7 1.7 – – – – 1982 ....................................... 73.0 73.6 74.9 75.4 2.1 .8 1.8 .7 – 6.5 6.5 5.5 1983 ....................................... 76.8 77.6 78.6 79.4 1.9 1.0 1.3 1.0 5.2 5.4 4.9 5.3 1984 ....................................... 80.5 81.4 82.4 83.4 1.4 1.1 1.2 1.2 4.8 4.9 4.8 5.0
See footnotes at end of table.
63
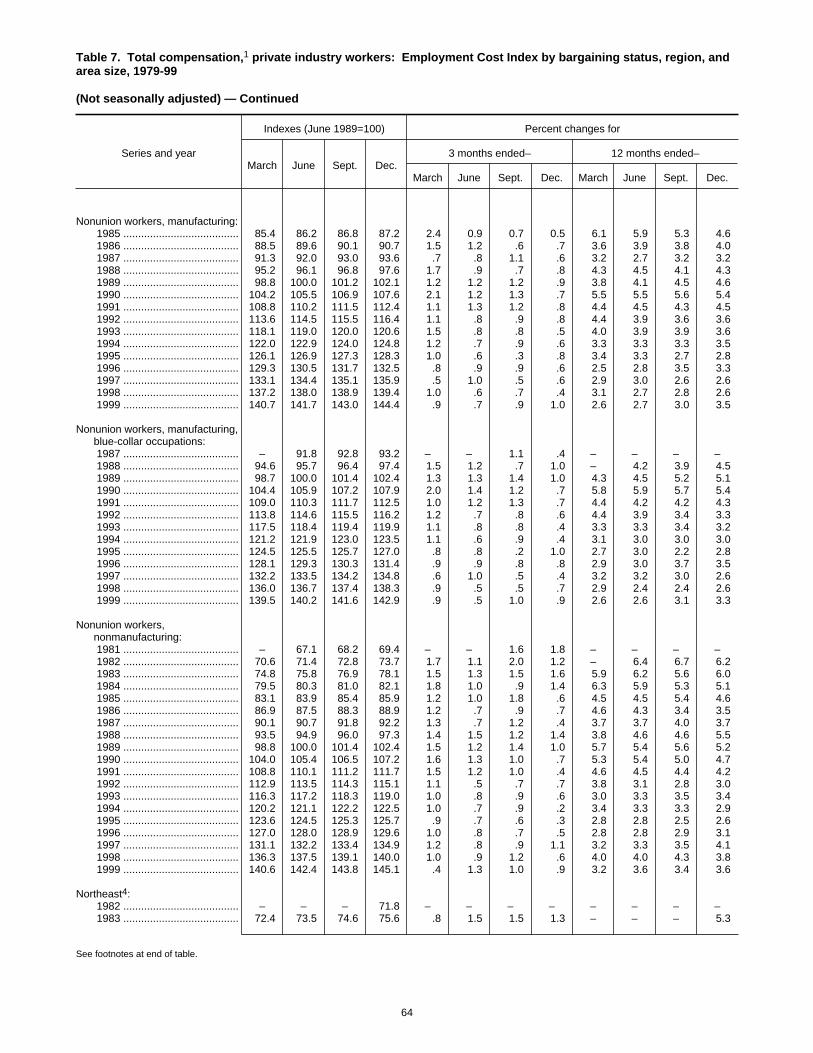
Table 7. Total compensation,1 private industry workers: Employment Cost Index by bargaining status, region, andarea size, 1979-99
(Not seasonally adjusted) — Continued
Series and year
Indexes (June 1989=100) Percent changes for
March June Sept. Dec.3 months ended– 12 months ended–
March June Sept. Dec. March June Sept. Dec.
Nonunion workers, manufacturing: 1985 ....................................... 85.4 86.2 86.8 87.2 2.4 0.9 0.7 0.5 6.1 5.9 5.3 4.6 1986 ....................................... 88.5 89.6 90.1 90.7 1.5 1.2 .6 .7 3.6 3.9 3.8 4.0 1987 ....................................... 91.3 92.0 93.0 93.6 .7 .8 1.1 .6 3.2 2.7 3.2 3.2 1988 ....................................... 95.2 96.1 96.8 97.6 1.7 .9 .7 .8 4.3 4.5 4.1 4.3 1989 ....................................... 98.8 100.0 101.2 102.1 1.2 1.2 1.2 .9 3.8 4.1 4.5 4.6 1990 ....................................... 104.2 105.5 106.9 107.6 2.1 1.2 1.3 .7 5.5 5.5 5.6 5.4 1991 ....................................... 108.8 110.2 111.5 112.4 1.1 1.3 1.2 .8 4.4 4.5 4.3 4.5 1992 ....................................... 113.6 114.5 115.5 116.4 1.1 .8 .9 .8 4.4 3.9 3.6 3.6 1993 ....................................... 118.1 119.0 120.0 120.6 1.5 .8 .8 .5 4.0 3.9 3.9 3.6 1994 ....................................... 122.0 122.9 124.0 124.8 1.2 .7 .9 .6 3.3 3.3 3.3 3.5 1995 ....................................... 126.1 126.9 127.3 128.3 1.0 .6 .3 .8 3.4 3.3 2.7 2.8 1996 ....................................... 129.3 130.5 131.7 132.5 .8 .9 .9 .6 2.5 2.8 3.5 3.3 1997 ....................................... 133.1 134.4 135.1 135.9 .5 1.0 .5 .6 2.9 3.0 2.6 2.6 1998 ....................................... 137.2 138.0 138.9 139.4 1.0 .6 .7 .4 3.1 2.7 2.8 2.6 1999 ....................................... 140.7 141.7 143.0 144.4 .9 .7 .9 1.0 2.6 2.7 3.0 3.5
Nonunion workers, manufacturing,blue-collar occupations:
1987 ....................................... – 91.8 92.8 93.2 – – 1.1 .4 – – – – 1988 ....................................... 94.6 95.7 96.4 97.4 1.5 1.2 .7 1.0 – 4.2 3.9 4.5 1989 ....................................... 98.7 100.0 101.4 102.4 1.3 1.3 1.4 1.0 4.3 4.5 5.2 5.1 1990 ....................................... 104.4 105.9 107.2 107.9 2.0 1.4 1.2 .7 5.8 5.9 5.7 5.4 1991 ....................................... 109.0 110.3 111.7 112.5 1.0 1.2 1.3 .7 4.4 4.2 4.2 4.3 1992 ....................................... 113.8 114.6 115.5 116.2 1.2 .7 .8 .6 4.4 3.9 3.4 3.3 1993 ....................................... 117.5 118.4 119.4 119.9 1.1 .8 .8 .4 3.3 3.3 3.4 3.2 1994 ....................................... 121.2 121.9 123.0 123.5 1.1 .6 .9 .4 3.1 3.0 3.0 3.0 1995 ....................................... 124.5 125.5 125.7 127.0 .8 .8 .2 1.0 2.7 3.0 2.2 2.8 1996 ....................................... 128.1 129.3 130.3 131.4 .9 .9 .8 .8 2.9 3.0 3.7 3.5 1997 ....................................... 132.2 133.5 134.2 134.8 .6 1.0 .5 .4 3.2 3.2 3.0 2.6 1998 ....................................... 136.0 136.7 137.4 138.3 .9 .5 .5 .7 2.9 2.4 2.4 2.6 1999 ....................................... 139.5 140.2 141.6 142.9 .9 .5 1.0 .9 2.6 2.6 3.1 3.3
Nonunion workers,nonmanufacturing:
1981 ....................................... – 67.1 68.2 69.4 – – 1.6 1.8 – – – – 1982 ....................................... 70.6 71.4 72.8 73.7 1.7 1.1 2.0 1.2 – 6.4 6.7 6.2 1983 ....................................... 74.8 75.8 76.9 78.1 1.5 1.3 1.5 1.6 5.9 6.2 5.6 6.0 1984 ....................................... 79.5 80.3 81.0 82.1 1.8 1.0 .9 1.4 6.3 5.9 5.3 5.1 1985 ....................................... 83.1 83.9 85.4 85.9 1.2 1.0 1.8 .6 4.5 4.5 5.4 4.6 1986 ....................................... 86.9 87.5 88.3 88.9 1.2 .7 .9 .7 4.6 4.3 3.4 3.5 1987 ....................................... 90.1 90.7 91.8 92.2 1.3 .7 1.2 .4 3.7 3.7 4.0 3.7 1988 ....................................... 93.5 94.9 96.0 97.3 1.4 1.5 1.2 1.4 3.8 4.6 4.6 5.5 1989 ....................................... 98.8 100.0 101.4 102.4 1.5 1.2 1.4 1.0 5.7 5.4 5.6 5.2 1990 ....................................... 104.0 105.4 106.5 107.2 1.6 1.3 1.0 .7 5.3 5.4 5.0 4.7 1991 ....................................... 108.8 110.1 111.2 111.7 1.5 1.2 1.0 .4 4.6 4.5 4.4 4.2 1992 ....................................... 112.9 113.5 114.3 115.1 1.1 .5 .7 .7 3.8 3.1 2.8 3.0 1993 ....................................... 116.3 117.2 118.3 119.0 1.0 .8 .9 .6 3.0 3.3 3.5 3.4 1994 ....................................... 120.2 121.1 122.2 122.5 1.0 .7 .9 .2 3.4 3.3 3.3 2.9 1995 ....................................... 123.6 124.5 125.3 125.7 .9 .7 .6 .3 2.8 2.8 2.5 2.6 1996 ....................................... 127.0 128.0 128.9 129.6 1.0 .8 .7 .5 2.8 2.8 2.9 3.1 1997 ....................................... 131.1 132.2 133.4 134.9 1.2 .8 .9 1.1 3.2 3.3 3.5 4.1 1998 ....................................... 136.3 137.5 139.1 140.0 1.0 .9 1.2 .6 4.0 4.0 4.3 3.8 1999 ....................................... 140.6 142.4 143.8 145.1 .4 1.3 1.0 .9 3.2 3.6 3.4 3.6
Northeast4: 1982 ....................................... – – – 71.8 – – – – – – – – 1983 ....................................... 72.4 73.5 74.6 75.6 .8 1.5 1.5 1.3 – – – 5.3
See footnotes at end of table.
64
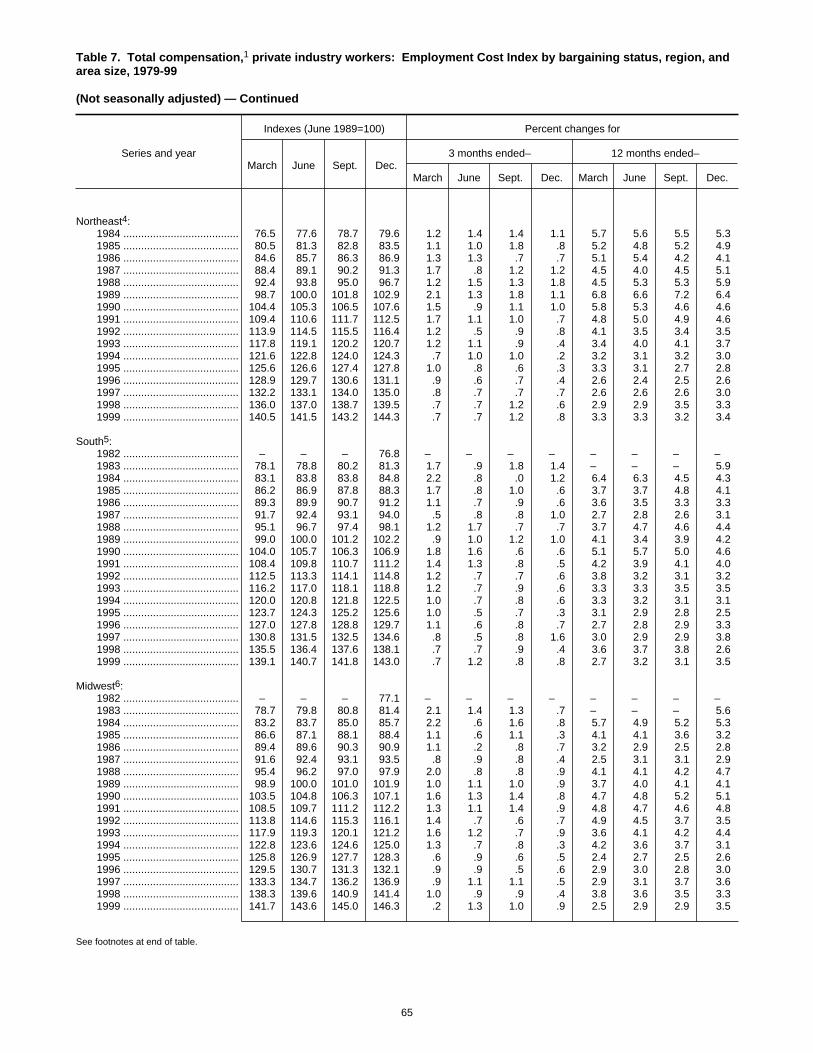
Table 7. Total compensation,1 private industry workers: Employment Cost Index by bargaining status, region, andarea size, 1979-99
(Not seasonally adjusted) — Continued
Series and year
Indexes (June 1989=100) Percent changes for
March June Sept. Dec.3 months ended– 12 months ended–
March June Sept. Dec. March June Sept. Dec.
Northeast4: 1984 ....................................... 76.5 77.6 78.7 79.6 1.2 1.4 1.4 1.1 5.7 5.6 5.5 5.3 1985 ....................................... 80.5 81.3 82.8 83.5 1.1 1.0 1.8 .8 5.2 4.8 5.2 4.9 1986 ....................................... 84.6 85.7 86.3 86.9 1.3 1.3 .7 .7 5.1 5.4 4.2 4.1 1987 ....................................... 88.4 89.1 90.2 91.3 1.7 .8 1.2 1.2 4.5 4.0 4.5 5.1 1988 ....................................... 92.4 93.8 95.0 96.7 1.2 1.5 1.3 1.8 4.5 5.3 5.3 5.9 1989 ....................................... 98.7 100.0 101.8 102.9 2.1 1.3 1.8 1.1 6.8 6.6 7.2 6.4 1990 ....................................... 104.4 105.3 106.5 107.6 1.5 .9 1.1 1.0 5.8 5.3 4.6 4.6 1991 ....................................... 109.4 110.6 111.7 112.5 1.7 1.1 1.0 .7 4.8 5.0 4.9 4.6 1992 ....................................... 113.9 114.5 115.5 116.4 1.2 .5 .9 .8 4.1 3.5 3.4 3.5 1993 ....................................... 117.8 119.1 120.2 120.7 1.2 1.1 .9 .4 3.4 4.0 4.1 3.7 1994 ....................................... 121.6 122.8 124.0 124.3 .7 1.0 1.0 .2 3.2 3.1 3.2 3.0 1995 ....................................... 125.6 126.6 127.4 127.8 1.0 .8 .6 .3 3.3 3.1 2.7 2.8 1996 ....................................... 128.9 129.7 130.6 131.1 .9 .6 .7 .4 2.6 2.4 2.5 2.6 1997 ....................................... 132.2 133.1 134.0 135.0 .8 .7 .7 .7 2.6 2.6 2.6 3.0 1998 ....................................... 136.0 137.0 138.7 139.5 .7 .7 1.2 .6 2.9 2.9 3.5 3.3 1999 ....................................... 140.5 141.5 143.2 144.3 .7 .7 1.2 .8 3.3 3.3 3.2 3.4
South5: 1982 ....................................... – – – 76.8 – – – – – – – – 1983 ....................................... 78.1 78.8 80.2 81.3 1.7 .9 1.8 1.4 – – – 5.9 1984 ....................................... 83.1 83.8 83.8 84.8 2.2 .8 .0 1.2 6.4 6.3 4.5 4.3 1985 ....................................... 86.2 86.9 87.8 88.3 1.7 .8 1.0 .6 3.7 3.7 4.8 4.1 1986 ....................................... 89.3 89.9 90.7 91.2 1.1 .7 .9 .6 3.6 3.5 3.3 3.3 1987 ....................................... 91.7 92.4 93.1 94.0 .5 .8 .8 1.0 2.7 2.8 2.6 3.1 1988 ....................................... 95.1 96.7 97.4 98.1 1.2 1.7 .7 .7 3.7 4.7 4.6 4.4 1989 ....................................... 99.0 100.0 101.2 102.2 .9 1.0 1.2 1.0 4.1 3.4 3.9 4.2 1990 ....................................... 104.0 105.7 106.3 106.9 1.8 1.6 .6 .6 5.1 5.7 5.0 4.6 1991 ....................................... 108.4 109.8 110.7 111.2 1.4 1.3 .8 .5 4.2 3.9 4.1 4.0 1992 ....................................... 112.5 113.3 114.1 114.8 1.2 .7 .7 .6 3.8 3.2 3.1 3.2 1993 ....................................... 116.2 117.0 118.1 118.8 1.2 .7 .9 .6 3.3 3.3 3.5 3.5 1994 ....................................... 120.0 120.8 121.8 122.5 1.0 .7 .8 .6 3.3 3.2 3.1 3.1 1995 ....................................... 123.7 124.3 125.2 125.6 1.0 .5 .7 .3 3.1 2.9 2.8 2.5 1996 ....................................... 127.0 127.8 128.8 129.7 1.1 .6 .8 .7 2.7 2.8 2.9 3.3 1997 ....................................... 130.8 131.5 132.5 134.6 .8 .5 .8 1.6 3.0 2.9 2.9 3.8 1998 ....................................... 135.5 136.4 137.6 138.1 .7 .7 .9 .4 3.6 3.7 3.8 2.6 1999 ....................................... 139.1 140.7 141.8 143.0 .7 1.2 .8 .8 2.7 3.2 3.1 3.5
Midwest6: 1982 ....................................... – – – 77.1 – – – – – – – – 1983 ....................................... 78.7 79.8 80.8 81.4 2.1 1.4 1.3 .7 – – – 5.6 1984 ....................................... 83.2 83.7 85.0 85.7 2.2 .6 1.6 .8 5.7 4.9 5.2 5.3 1985 ....................................... 86.6 87.1 88.1 88.4 1.1 .6 1.1 .3 4.1 4.1 3.6 3.2 1986 ....................................... 89.4 89.6 90.3 90.9 1.1 .2 .8 .7 3.2 2.9 2.5 2.8 1987 ....................................... 91.6 92.4 93.1 93.5 .8 .9 .8 .4 2.5 3.1 3.1 2.9 1988 ....................................... 95.4 96.2 97.0 97.9 2.0 .8 .8 .9 4.1 4.1 4.2 4.7 1989 ....................................... 98.9 100.0 101.0 101.9 1.0 1.1 1.0 .9 3.7 4.0 4.1 4.1 1990 ....................................... 103.5 104.8 106.3 107.1 1.6 1.3 1.4 .8 4.7 4.8 5.2 5.1 1991 ....................................... 108.5 109.7 111.2 112.2 1.3 1.1 1.4 .9 4.8 4.7 4.6 4.8 1992 ....................................... 113.8 114.6 115.3 116.1 1.4 .7 .6 .7 4.9 4.5 3.7 3.5 1993 ....................................... 117.9 119.3 120.1 121.2 1.6 1.2 .7 .9 3.6 4.1 4.2 4.4 1994 ....................................... 122.8 123.6 124.6 125.0 1.3 .7 .8 .3 4.2 3.6 3.7 3.1 1995 ....................................... 125.8 126.9 127.7 128.3 .6 .9 .6 .5 2.4 2.7 2.5 2.6 1996 ....................................... 129.5 130.7 131.3 132.1 .9 .9 .5 .6 2.9 3.0 2.8 3.0 1997 ....................................... 133.3 134.7 136.2 136.9 .9 1.1 1.1 .5 2.9 3.1 3.7 3.6 1998 ....................................... 138.3 139.6 140.9 141.4 1.0 .9 .9 .4 3.8 3.6 3.5 3.3 1999 ....................................... 141.7 143.6 145.0 146.3 .2 1.3 1.0 .9 2.5 2.9 2.9 3.5
See footnotes at end of table.
65
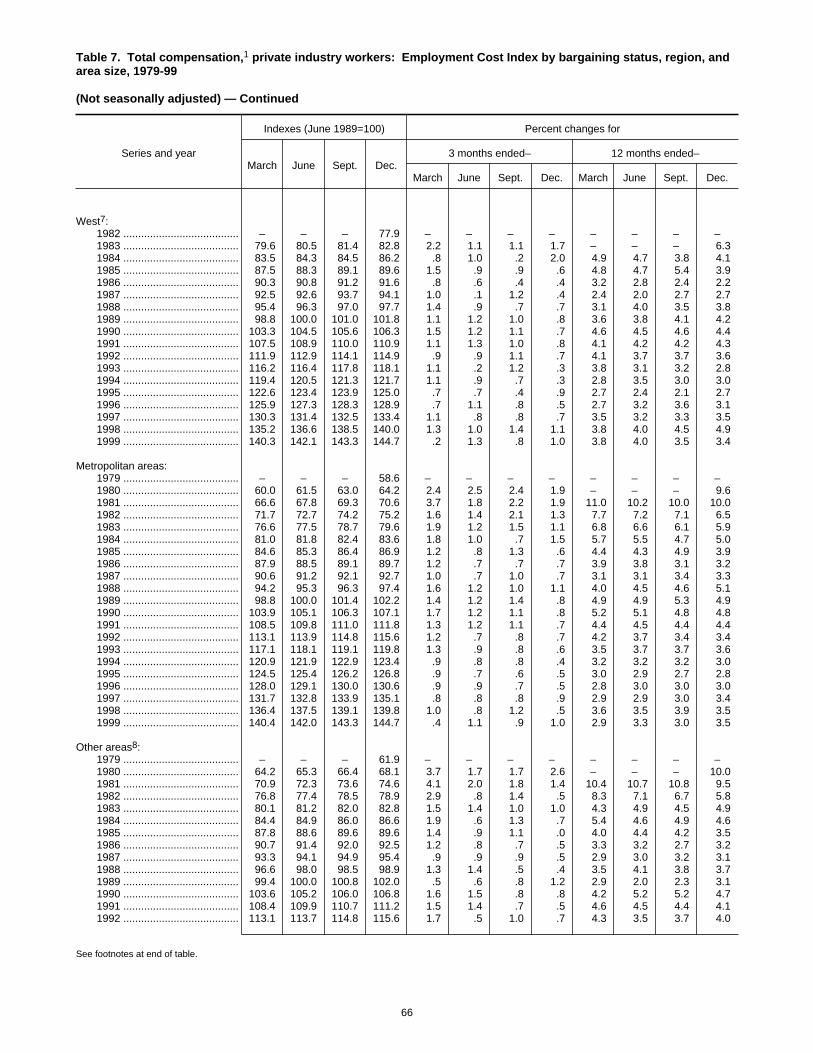
Table 7. Total compensation,1 private industry workers: Employment Cost Index by bargaining status, region, andarea size, 1979-99
(Not seasonally adjusted) — Continued
Series and year
Indexes (June 1989=100) Percent changes for
March June Sept. Dec.3 months ended– 12 months ended–
March June Sept. Dec. March June Sept. Dec.
West7: 1982 ....................................... – – – 77.9 – – – – – – – – 1983 ....................................... 79.6 80.5 81.4 82.8 2.2 1.1 1.1 1.7 – – – 6.3 1984 ....................................... 83.5 84.3 84.5 86.2 .8 1.0 .2 2.0 4.9 4.7 3.8 4.1 1985 ....................................... 87.5 88.3 89.1 89.6 1.5 .9 .9 .6 4.8 4.7 5.4 3.9 1986 ....................................... 90.3 90.8 91.2 91.6 .8 .6 .4 .4 3.2 2.8 2.4 2.2 1987 ....................................... 92.5 92.6 93.7 94.1 1.0 .1 1.2 .4 2.4 2.0 2.7 2.7 1988 ....................................... 95.4 96.3 97.0 97.7 1.4 .9 .7 .7 3.1 4.0 3.5 3.8 1989 ....................................... 98.8 100.0 101.0 101.8 1.1 1.2 1.0 .8 3.6 3.8 4.1 4.2 1990 ....................................... 103.3 104.5 105.6 106.3 1.5 1.2 1.1 .7 4.6 4.5 4.6 4.4 1991 ....................................... 107.5 108.9 110.0 110.9 1.1 1.3 1.0 .8 4.1 4.2 4.2 4.3 1992 ....................................... 111.9 112.9 114.1 114.9 .9 .9 1.1 .7 4.1 3.7 3.7 3.6 1993 ....................................... 116.2 116.4 117.8 118.1 1.1 .2 1.2 .3 3.8 3.1 3.2 2.8 1994 ....................................... 119.4 120.5 121.3 121.7 1.1 .9 .7 .3 2.8 3.5 3.0 3.0 1995 ....................................... 122.6 123.4 123.9 125.0 .7 .7 .4 .9 2.7 2.4 2.1 2.7 1996 ....................................... 125.9 127.3 128.3 128.9 .7 1.1 .8 .5 2.7 3.2 3.6 3.1 1997 ....................................... 130.3 131.4 132.5 133.4 1.1 .8 .8 .7 3.5 3.2 3.3 3.5 1998 ....................................... 135.2 136.6 138.5 140.0 1.3 1.0 1.4 1.1 3.8 4.0 4.5 4.9 1999 ....................................... 140.3 142.1 143.3 144.7 .2 1.3 .8 1.0 3.8 4.0 3.5 3.4
Metropolitan areas: 1979 ....................................... – – – 58.6 – – – – – – – – 1980 ....................................... 60.0 61.5 63.0 64.2 2.4 2.5 2.4 1.9 – – – 9.6 1981 ....................................... 66.6 67.8 69.3 70.6 3.7 1.8 2.2 1.9 11.0 10.2 10.0 10.0 1982 ....................................... 71.7 72.7 74.2 75.2 1.6 1.4 2.1 1.3 7.7 7.2 7.1 6.5 1983 ....................................... 76.6 77.5 78.7 79.6 1.9 1.2 1.5 1.1 6.8 6.6 6.1 5.9 1984 ....................................... 81.0 81.8 82.4 83.6 1.8 1.0 .7 1.5 5.7 5.5 4.7 5.0 1985 ....................................... 84.6 85.3 86.4 86.9 1.2 .8 1.3 .6 4.4 4.3 4.9 3.9 1986 ....................................... 87.9 88.5 89.1 89.7 1.2 .7 .7 .7 3.9 3.8 3.1 3.2 1987 ....................................... 90.6 91.2 92.1 92.7 1.0 .7 1.0 .7 3.1 3.1 3.4 3.3 1988 ....................................... 94.2 95.3 96.3 97.4 1.6 1.2 1.0 1.1 4.0 4.5 4.6 5.1 1989 ....................................... 98.8 100.0 101.4 102.2 1.4 1.2 1.4 .8 4.9 4.9 5.3 4.9 1990 ....................................... 103.9 105.1 106.3 107.1 1.7 1.2 1.1 .8 5.2 5.1 4.8 4.8 1991 ....................................... 108.5 109.8 111.0 111.8 1.3 1.2 1.1 .7 4.4 4.5 4.4 4.4 1992 ....................................... 113.1 113.9 114.8 115.6 1.2 .7 .8 .7 4.2 3.7 3.4 3.4 1993 ....................................... 117.1 118.1 119.1 119.8 1.3 .9 .8 .6 3.5 3.7 3.7 3.6 1994 ....................................... 120.9 121.9 122.9 123.4 .9 .8 .8 .4 3.2 3.2 3.2 3.0 1995 ....................................... 124.5 125.4 126.2 126.8 .9 .7 .6 .5 3.0 2.9 2.7 2.8 1996 ....................................... 128.0 129.1 130.0 130.6 .9 .9 .7 .5 2.8 3.0 3.0 3.0 1997 ....................................... 131.7 132.8 133.9 135.1 .8 .8 .8 .9 2.9 2.9 3.0 3.4 1998 ....................................... 136.4 137.5 139.1 139.8 1.0 .8 1.2 .5 3.6 3.5 3.9 3.5 1999 ....................................... 140.4 142.0 143.3 144.7 .4 1.1 .9 1.0 2.9 3.3 3.0 3.5
Other areas8: 1979 ....................................... – – – 61.9 – – – – – – – – 1980 ....................................... 64.2 65.3 66.4 68.1 3.7 1.7 1.7 2.6 – – – 10.0 1981 ....................................... 70.9 72.3 73.6 74.6 4.1 2.0 1.8 1.4 10.4 10.7 10.8 9.5 1982 ....................................... 76.8 77.4 78.5 78.9 2.9 .8 1.4 .5 8.3 7.1 6.7 5.8 1983 ....................................... 80.1 81.2 82.0 82.8 1.5 1.4 1.0 1.0 4.3 4.9 4.5 4.9 1984 ....................................... 84.4 84.9 86.0 86.6 1.9 .6 1.3 .7 5.4 4.6 4.9 4.6 1985 ....................................... 87.8 88.6 89.6 89.6 1.4 .9 1.1 .0 4.0 4.4 4.2 3.5 1986 ....................................... 90.7 91.4 92.0 92.5 1.2 .8 .7 .5 3.3 3.2 2.7 3.2 1987 ....................................... 93.3 94.1 94.9 95.4 .9 .9 .9 .5 2.9 3.0 3.2 3.1 1988 ....................................... 96.6 98.0 98.5 98.9 1.3 1.4 .5 .4 3.5 4.1 3.8 3.7 1989 ....................................... 99.4 100.0 100.8 102.0 .5 .6 .8 1.2 2.9 2.0 2.3 3.1 1990 ....................................... 103.6 105.2 106.0 106.8 1.6 1.5 .8 .8 4.2 5.2 5.2 4.7 1991 ....................................... 108.4 109.9 110.7 111.2 1.5 1.4 .7 .5 4.6 4.5 4.4 4.1 1992 ....................................... 113.1 113.7 114.8 115.6 1.7 .5 1.0 .7 4.3 3.5 3.7 4.0
See footnotes at end of table.
66

Table 7. Total compensation,1 private industry workers: Employment Cost Index by bargaining status, region, andarea size, 1979-99
(Not seasonally adjusted) — Continued
Series and year
Indexes (June 1989=100) Percent changes for
March June Sept. Dec.3 months ended– 12 months ended–
March June Sept. Dec. March June Sept. Dec.
Other areas8: 1993 ....................................... 117.0 117.8 118.7 119.7 1.2 0.7 0.8 0.8 3.4 3.6 3.4 3.5 1994 ....................................... 121.3 122.5 123.2 123.5 1.3 1.0 .6 .2 3.7 4.0 3.8 3.2 1995 ....................................... 124.8 125.3 126.1 126.5 1.1 .4 .6 .3 2.9 2.3 2.4 2.4 1996 ....................................... 127.2 128.0 128.7 130.2 .6 .6 .5 1.2 1.9 2.2 2.1 2.9 1997 ....................................... 131.4 132.4 133.8 135.3 .9 .8 1.1 1.1 3.3 3.4 4.0 3.9 1998 ....................................... 135.9 137.1 138.2 139.4 .4 .9 .8 .9 3.4 3.5 3.3 3.0 1999 ....................................... 140.5 141.8 143.1 143.6 .8 .9 .9 .3 3.4 3.4 3.5 3.0
1 Includes wages, salaries, and employer costs for employee benefits.2 Includes mining, construction, and manufacturing.3 Includes transportation, communication, and public utilities; wholesale
and retail trade; finance, insurance, and real estate; and service industries.4 The Northeast region includes the following States: Connecticut,
Maine, Massachusetts, New Hampshire, New Jersey, New York,Pennsylvania, Rhode Island, and Vermont.
5 The South region includes the following States: Alabama, Arkansas,Delaware, District of Columbia, Florida, Georgia, Kentucky, Louisiana,Maryland, Mississippi, North Carolina, Oklahoma, South Carolina,
Tennessee, Texas, Virginia, and West Virginia.6 The Midwest region includes the following States: Illinois, Indiana,
Iowa, Kansas, Michigan, Minnesota, Missouri, Nebraska, North Dakota, Ohio,South Dakota, and Wisconsin.
7 The West region includes the following States: Alaska, Arizona,California, Colorado, Hawaii, Idaho, Montana, Nevada, New Mexico, Oregon,Utah, Washington, and Wyoming.
8 Other areas refers to all other locations which are not defined as ametropolitan statistical area by the U.S. Office of Management and Budget.
– Data not available.
67
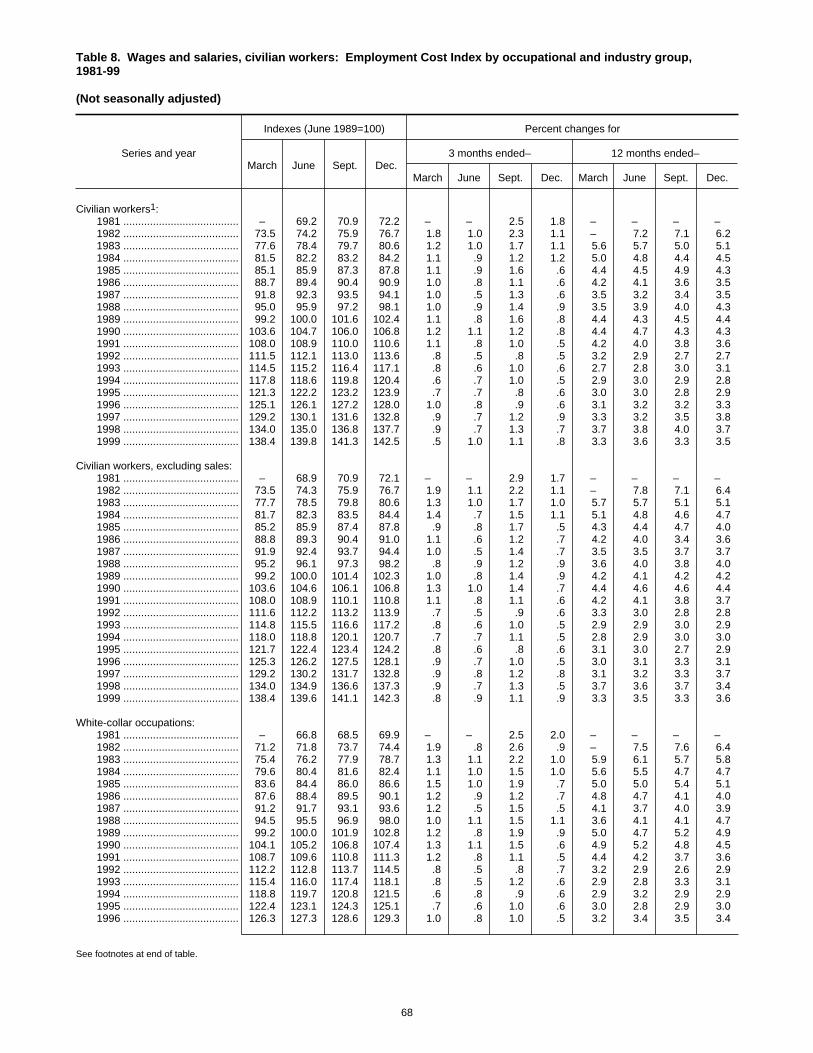
Table 8. Wages and salaries, civilian workers: Employment Cost Index by occupational and industry group,1981-99
(Not seasonally adjusted)
Series and year
Indexes (June 1989=100) Percent changes for
March June Sept. Dec.3 months ended– 12 months ended–
March June Sept. Dec. March June Sept. Dec.
Civilian workers1: 1981 ....................................... – 69.2 70.9 72.2 – – 2.5 1.8 – – – – 1982 ....................................... 73.5 74.2 75.9 76.7 1.8 1.0 2.3 1.1 – 7.2 7.1 6.2 1983 ....................................... 77.6 78.4 79.7 80.6 1.2 1.0 1.7 1.1 5.6 5.7 5.0 5.1 1984 ....................................... 81.5 82.2 83.2 84.2 1.1 .9 1.2 1.2 5.0 4.8 4.4 4.5 1985 ....................................... 85.1 85.9 87.3 87.8 1.1 .9 1.6 .6 4.4 4.5 4.9 4.3 1986 ....................................... 88.7 89.4 90.4 90.9 1.0 .8 1.1 .6 4.2 4.1 3.6 3.5 1987 ....................................... 91.8 92.3 93.5 94.1 1.0 .5 1.3 .6 3.5 3.2 3.4 3.5 1988 ....................................... 95.0 95.9 97.2 98.1 1.0 .9 1.4 .9 3.5 3.9 4.0 4.3 1989 ....................................... 99.2 100.0 101.6 102.4 1.1 .8 1.6 .8 4.4 4.3 4.5 4.4 1990 ....................................... 103.6 104.7 106.0 106.8 1.2 1.1 1.2 .8 4.4 4.7 4.3 4.3 1991 ....................................... 108.0 108.9 110.0 110.6 1.1 .8 1.0 .5 4.2 4.0 3.8 3.6 1992 ....................................... 111.5 112.1 113.0 113.6 .8 .5 .8 .5 3.2 2.9 2.7 2.7 1993 ....................................... 114.5 115.2 116.4 117.1 .8 .6 1.0 .6 2.7 2.8 3.0 3.1 1994 ....................................... 117.8 118.6 119.8 120.4 .6 .7 1.0 .5 2.9 3.0 2.9 2.8 1995 ....................................... 121.3 122.2 123.2 123.9 .7 .7 .8 .6 3.0 3.0 2.8 2.9 1996 ....................................... 125.1 126.1 127.2 128.0 1.0 .8 .9 .6 3.1 3.2 3.2 3.3 1997 ....................................... 129.2 130.1 131.6 132.8 .9 .7 1.2 .9 3.3 3.2 3.5 3.8 1998 ....................................... 134.0 135.0 136.8 137.7 .9 .7 1.3 .7 3.7 3.8 4.0 3.7 1999 ....................................... 138.4 139.8 141.3 142.5 .5 1.0 1.1 .8 3.3 3.6 3.3 3.5
Civilian workers, excluding sales: 1981 ....................................... – 68.9 70.9 72.1 – – 2.9 1.7 – – – – 1982 ....................................... 73.5 74.3 75.9 76.7 1.9 1.1 2.2 1.1 – 7.8 7.1 6.4 1983 ....................................... 77.7 78.5 79.8 80.6 1.3 1.0 1.7 1.0 5.7 5.7 5.1 5.1 1984 ....................................... 81.7 82.3 83.5 84.4 1.4 .7 1.5 1.1 5.1 4.8 4.6 4.7 1985 ....................................... 85.2 85.9 87.4 87.8 .9 .8 1.7 .5 4.3 4.4 4.7 4.0 1986 ....................................... 88.8 89.3 90.4 91.0 1.1 .6 1.2 .7 4.2 4.0 3.4 3.6 1987 ....................................... 91.9 92.4 93.7 94.4 1.0 .5 1.4 .7 3.5 3.5 3.7 3.7 1988 ....................................... 95.2 96.1 97.3 98.2 .8 .9 1.2 .9 3.6 4.0 3.8 4.0 1989 ....................................... 99.2 100.0 101.4 102.3 1.0 .8 1.4 .9 4.2 4.1 4.2 4.2 1990 ....................................... 103.6 104.6 106.1 106.8 1.3 1.0 1.4 .7 4.4 4.6 4.6 4.4 1991 ....................................... 108.0 108.9 110.1 110.8 1.1 .8 1.1 .6 4.2 4.1 3.8 3.7 1992 ....................................... 111.6 112.2 113.2 113.9 .7 .5 .9 .6 3.3 3.0 2.8 2.8 1993 ....................................... 114.8 115.5 116.6 117.2 .8 .6 1.0 .5 2.9 2.9 3.0 2.9 1994 ....................................... 118.0 118.8 120.1 120.7 .7 .7 1.1 .5 2.8 2.9 3.0 3.0 1995 ....................................... 121.7 122.4 123.4 124.2 .8 .6 .8 .6 3.1 3.0 2.7 2.9 1996 ....................................... 125.3 126.2 127.5 128.1 .9 .7 1.0 .5 3.0 3.1 3.3 3.1 1997 ....................................... 129.2 130.2 131.7 132.8 .9 .8 1.2 .8 3.1 3.2 3.3 3.7 1998 ....................................... 134.0 134.9 136.6 137.3 .9 .7 1.3 .5 3.7 3.6 3.7 3.4 1999 ....................................... 138.4 139.6 141.1 142.3 .8 .9 1.1 .9 3.3 3.5 3.3 3.6
White-collar occupations: 1981 ....................................... – 66.8 68.5 69.9 – – 2.5 2.0 – – – – 1982 ....................................... 71.2 71.8 73.7 74.4 1.9 .8 2.6 .9 – 7.5 7.6 6.4 1983 ....................................... 75.4 76.2 77.9 78.7 1.3 1.1 2.2 1.0 5.9 6.1 5.7 5.8 1984 ....................................... 79.6 80.4 81.6 82.4 1.1 1.0 1.5 1.0 5.6 5.5 4.7 4.7 1985 ....................................... 83.6 84.4 86.0 86.6 1.5 1.0 1.9 .7 5.0 5.0 5.4 5.1 1986 ....................................... 87.6 88.4 89.5 90.1 1.2 .9 1.2 .7 4.8 4.7 4.1 4.0 1987 ....................................... 91.2 91.7 93.1 93.6 1.2 .5 1.5 .5 4.1 3.7 4.0 3.9 1988 ....................................... 94.5 95.5 96.9 98.0 1.0 1.1 1.5 1.1 3.6 4.1 4.1 4.7 1989 ....................................... 99.2 100.0 101.9 102.8 1.2 .8 1.9 .9 5.0 4.7 5.2 4.9 1990 ....................................... 104.1 105.2 106.8 107.4 1.3 1.1 1.5 .6 4.9 5.2 4.8 4.5 1991 ....................................... 108.7 109.6 110.8 111.3 1.2 .8 1.1 .5 4.4 4.2 3.7 3.6 1992 ....................................... 112.2 112.8 113.7 114.5 .8 .5 .8 .7 3.2 2.9 2.6 2.9 1993 ....................................... 115.4 116.0 117.4 118.1 .8 .5 1.2 .6 2.9 2.8 3.3 3.1 1994 ....................................... 118.8 119.7 120.8 121.5 .6 .8 .9 .6 2.9 3.2 2.9 2.9 1995 ....................................... 122.4 123.1 124.3 125.1 .7 .6 1.0 .6 3.0 2.8 2.9 3.0 1996 ....................................... 126.3 127.3 128.6 129.3 1.0 .8 1.0 .5 3.2 3.4 3.5 3.4
See footnotes at end of table.
68
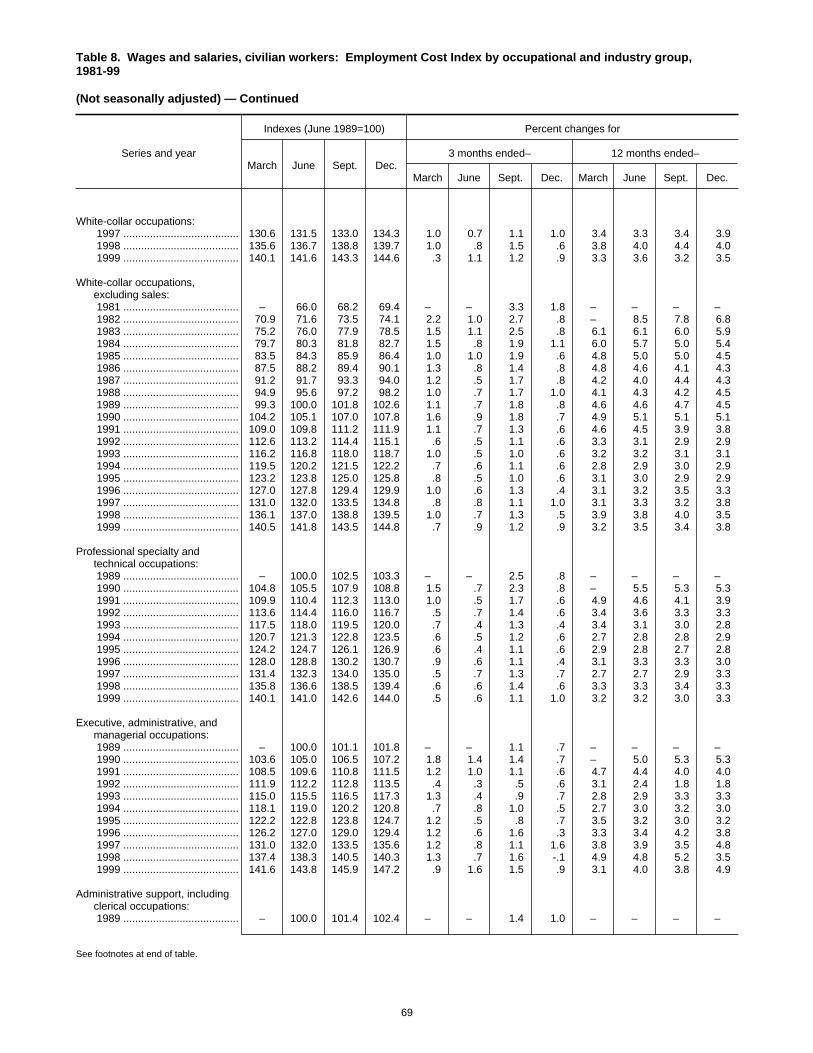
Table 8. Wages and salaries, civilian workers: Employment Cost Index by occupational and industry group,1981-99
(Not seasonally adjusted) — Continued
Series and year
Indexes (June 1989=100) Percent changes for
March June Sept. Dec.3 months ended– 12 months ended–
March June Sept. Dec. March June Sept. Dec.
White-collar occupations: 1997 ....................................... 130.6 131.5 133.0 134.3 1.0 0.7 1.1 1.0 3.4 3.3 3.4 3.9 1998 ....................................... 135.6 136.7 138.8 139.7 1.0 .8 1.5 .6 3.8 4.0 4.4 4.0 1999 ....................................... 140.1 141.6 143.3 144.6 .3 1.1 1.2 .9 3.3 3.6 3.2 3.5
White-collar occupations,excluding sales:
1981 ....................................... – 66.0 68.2 69.4 – – 3.3 1.8 – – – – 1982 ....................................... 70.9 71.6 73.5 74.1 2.2 1.0 2.7 .8 – 8.5 7.8 6.8 1983 ....................................... 75.2 76.0 77.9 78.5 1.5 1.1 2.5 .8 6.1 6.1 6.0 5.9 1984 ....................................... 79.7 80.3 81.8 82.7 1.5 .8 1.9 1.1 6.0 5.7 5.0 5.4 1985 ....................................... 83.5 84.3 85.9 86.4 1.0 1.0 1.9 .6 4.8 5.0 5.0 4.5 1986 ....................................... 87.5 88.2 89.4 90.1 1.3 .8 1.4 .8 4.8 4.6 4.1 4.3 1987 ....................................... 91.2 91.7 93.3 94.0 1.2 .5 1.7 .8 4.2 4.0 4.4 4.3 1988 ....................................... 94.9 95.6 97.2 98.2 1.0 .7 1.7 1.0 4.1 4.3 4.2 4.5 1989 ....................................... 99.3 100.0 101.8 102.6 1.1 .7 1.8 .8 4.6 4.6 4.7 4.5 1990 ....................................... 104.2 105.1 107.0 107.8 1.6 .9 1.8 .7 4.9 5.1 5.1 5.1 1991 ....................................... 109.0 109.8 111.2 111.9 1.1 .7 1.3 .6 4.6 4.5 3.9 3.8 1992 ....................................... 112.6 113.2 114.4 115.1 .6 .5 1.1 .6 3.3 3.1 2.9 2.9 1993 ....................................... 116.2 116.8 118.0 118.7 1.0 .5 1.0 .6 3.2 3.2 3.1 3.1 1994 ....................................... 119.5 120.2 121.5 122.2 .7 .6 1.1 .6 2.8 2.9 3.0 2.9 1995 ....................................... 123.2 123.8 125.0 125.8 .8 .5 1.0 .6 3.1 3.0 2.9 2.9 1996 ....................................... 127.0 127.8 129.4 129.9 1.0 .6 1.3 .4 3.1 3.2 3.5 3.3 1997 ....................................... 131.0 132.0 133.5 134.8 .8 .8 1.1 1.0 3.1 3.3 3.2 3.8 1998 ....................................... 136.1 137.0 138.8 139.5 1.0 .7 1.3 .5 3.9 3.8 4.0 3.5 1999 ....................................... 140.5 141.8 143.5 144.8 .7 .9 1.2 .9 3.2 3.5 3.4 3.8
Professional specialty andtechnical occupations:
1989 ....................................... – 100.0 102.5 103.3 – – 2.5 .8 – – – – 1990 ....................................... 104.8 105.5 107.9 108.8 1.5 .7 2.3 .8 – 5.5 5.3 5.3 1991 ....................................... 109.9 110.4 112.3 113.0 1.0 .5 1.7 .6 4.9 4.6 4.1 3.9 1992 ....................................... 113.6 114.4 116.0 116.7 .5 .7 1.4 .6 3.4 3.6 3.3 3.3 1993 ....................................... 117.5 118.0 119.5 120.0 .7 .4 1.3 .4 3.4 3.1 3.0 2.8 1994 ....................................... 120.7 121.3 122.8 123.5 .6 .5 1.2 .6 2.7 2.8 2.8 2.9 1995 ....................................... 124.2 124.7 126.1 126.9 .6 .4 1.1 .6 2.9 2.8 2.7 2.8 1996 ....................................... 128.0 128.8 130.2 130.7 .9 .6 1.1 .4 3.1 3.3 3.3 3.0 1997 ....................................... 131.4 132.3 134.0 135.0 .5 .7 1.3 .7 2.7 2.7 2.9 3.3 1998 ....................................... 135.8 136.6 138.5 139.4 .6 .6 1.4 .6 3.3 3.3 3.4 3.3 1999 ....................................... 140.1 141.0 142.6 144.0 .5 .6 1.1 1.0 3.2 3.2 3.0 3.3
Executive, administrative, andmanagerial occupations:
1989 ....................................... – 100.0 101.1 101.8 – – 1.1 .7 – – – – 1990 ....................................... 103.6 105.0 106.5 107.2 1.8 1.4 1.4 .7 – 5.0 5.3 5.3 1991 ....................................... 108.5 109.6 110.8 111.5 1.2 1.0 1.1 .6 4.7 4.4 4.0 4.0 1992 ....................................... 111.9 112.2 112.8 113.5 .4 .3 .5 .6 3.1 2.4 1.8 1.8 1993 ....................................... 115.0 115.5 116.5 117.3 1.3 .4 .9 .7 2.8 2.9 3.3 3.3 1994 ....................................... 118.1 119.0 120.2 120.8 .7 .8 1.0 .5 2.7 3.0 3.2 3.0 1995 ....................................... 122.2 122.8 123.8 124.7 1.2 .5 .8 .7 3.5 3.2 3.0 3.2 1996 ....................................... 126.2 127.0 129.0 129.4 1.2 .6 1.6 .3 3.3 3.4 4.2 3.8 1997 ....................................... 131.0 132.0 133.5 135.6 1.2 .8 1.1 1.6 3.8 3.9 3.5 4.8 1998 ....................................... 137.4 138.3 140.5 140.3 1.3 .7 1.6 -.1 4.9 4.8 5.2 3.5 1999 ....................................... 141.6 143.8 145.9 147.2 .9 1.6 1.5 .9 3.1 4.0 3.8 4.9
Administrative support, includingclerical occupations:
1989 ....................................... – 100.0 101.4 102.4 – – 1.4 1.0 – – – –
See footnotes at end of table.
69

Table 8. Wages and salaries, civilian workers: Employment Cost Index by occupational and industry group,1981-99
(Not seasonally adjusted) — Continued
Series and year
Indexes (June 1989=100) Percent changes for
March June Sept. Dec.3 months ended– 12 months ended–
March June Sept. Dec. March June Sept. Dec.
Administrative support, includingclerical occupations:
1990 ....................................... 103.7 104.7 105.9 106.7 1.3 1.0 1.1 0.8 – 4.7 4.4 4.2 1991 ....................................... 107.9 108.8 109.9 110.6 1.1 .8 1.0 .6 4.1 3.9 3.8 3.7 1992 ....................................... 111.8 112.5 113.4 114.2 1.1 .6 .8 .7 3.6 3.4 3.2 3.3 1993 ....................................... 115.3 116.1 117.1 118.0 1.0 .7 .9 .8 3.1 3.2 3.3 3.3 1994 ....................................... 118.9 119.8 120.9 121.6 .8 .8 .9 .6 3.1 3.2 3.2 3.1 1995 ....................................... 122.8 123.4 124.3 125.2 1.0 .5 .7 .7 3.3 3.0 2.8 3.0 1996 ....................................... 126.4 127.1 128.4 129.1 1.0 .6 1.0 .5 2.9 3.0 3.3 3.1 1997 ....................................... 130.4 131.4 132.7 133.7 1.0 .8 1.0 .8 3.2 3.4 3.3 3.6 1998 ....................................... 135.0 136.2 137.5 138.6 1.0 .9 1.0 .8 3.5 3.7 3.6 3.7 1999 ....................................... 140.0 140.9 142.3 143.5 1.0 .6 1.0 .8 3.7 3.5 3.5 3.5
Blue-collar occupations: 1981 ....................................... – 73.5 75.3 76.5 – – 2.4 1.6 – – – – 1982 ....................................... 77.6 78.5 79.9 80.7 1.4 1.2 1.8 1.0 – 6.8 6.1 5.5 1983 ....................................... 81.5 82.4 83.2 83.8 1.0 1.1 1.0 .7 5.0 5.0 4.1 3.8 1984 ....................................... 84.8 85.4 86.0 86.9 1.2 .7 .7 1.0 4.0 3.6 3.4 3.7 1985 ....................................... 87.7 88.6 89.7 89.9 .9 1.0 1.2 .2 3.4 3.7 4.3 3.5 1986 ....................................... 90.7 91.2 91.9 92.4 .9 .6 .8 .5 3.4 2.9 2.5 2.8 1987 ....................................... 92.8 93.5 94.3 95.1 .4 .8 .9 .8 2.3 2.5 2.6 2.9 1988 ....................................... 95.9 96.8 97.4 98.1 .8 .9 .6 .7 3.3 3.5 3.3 3.2 1989 ....................................... 99.0 100.0 101.0 101.7 .9 1.0 1.0 .7 3.2 3.3 3.7 3.7 1990 ....................................... 102.8 103.9 104.7 105.4 1.1 1.1 .8 .7 3.8 3.9 3.7 3.6 1991 ....................................... 106.6 107.4 108.2 108.9 1.1 .8 .7 .6 3.7 3.4 3.3 3.3 1992 ....................................... 109.8 110.6 111.3 111.9 .8 .7 .6 .5 3.0 3.0 2.9 2.8 1993 ....................................... 112.7 113.4 114.4 115.0 .7 .6 .9 .5 2.6 2.5 2.8 2.8 1994 ....................................... 115.8 116.7 117.8 118.2 .7 .8 .9 .3 2.8 2.9 3.0 2.8 1995 ....................................... 119.2 120.3 121.1 121.7 .8 .9 .7 .5 2.9 3.1 2.8 3.0 1996 ....................................... 122.8 123.9 124.5 125.4 .9 .9 .5 .7 3.0 3.0 2.8 3.0 1997 ....................................... 126.2 127.5 128.4 129.3 .6 1.0 .7 .7 2.8 2.9 3.1 3.1 1998 ....................................... 130.4 131.4 132.6 133.3 .9 .8 .9 .5 3.3 3.1 3.3 3.1 1999 ....................................... 134.5 135.8 137.0 137.9 .9 1.0 .9 .7 3.1 3.3 3.3 3.5
Service occupations: 1981 ....................................... – 69.1 70.8 71.5 – – 2.5 1.0 – – – – 1982 ....................................... 73.8 74.5 76.0 77.2 3.2 .9 2.0 1.6 – 7.8 7.3 8.0 1983 ....................................... 78.2 78.7 79.5 81.1 1.3 .6 1.0 2.0 6.0 5.6 4.6 5.1 1984 ....................................... 82.9 82.7 84.5 85.8 2.2 -.2 2.2 1.5 6.0 5.1 6.3 5.8 1985 ....................................... 86.2 86.5 88.4 88.8 .5 .3 2.2 .5 4.0 4.6 4.6 3.5 1986 ....................................... 89.6 89.8 91.0 91.7 .9 .2 1.3 .8 3.9 3.8 2.9 3.3 1987 ....................................... 92.7 93.0 93.9 94.3 1.1 .3 1.0 .4 3.5 3.6 3.2 2.8 1988 ....................................... 95.3 96.2 97.9 98.7 1.1 .9 1.8 .8 2.8 3.4 4.3 4.7 1989 ....................................... 99.4 100.0 101.4 102.5 .7 .6 1.4 1.1 4.3 4.0 3.6 3.9 1990 ....................................... 103.4 104.2 105.6 106.8 .9 .8 1.3 1.1 4.0 4.2 4.1 4.2 1991 ....................................... 107.8 108.9 110.6 111.3 .9 1.0 1.6 .6 4.3 4.5 4.7 4.2 1992 ....................................... 111.9 112.4 113.4 113.8 .5 .4 .9 .4 3.8 3.2 2.5 2.2 1993 ....................................... 114.5 115.2 116.1 116.6 .6 .6 .8 .4 2.3 2.5 2.4 2.5 1994 ....................................... 117.5 118.1 119.4 120.4 .8 .5 1.1 .8 2.6 2.5 2.8 3.3 1995 ....................................... 121.2 121.8 122.8 123.4 .7 .5 .8 .5 3.1 3.1 2.8 2.5 1996 ....................................... 124.2 124.9 126.2 127.6 .6 .6 1.0 1.1 2.5 2.5 2.8 3.4 1997 ....................................... 128.6 129.3 131.5 132.6 .8 .5 1.7 .8 3.5 3.5 4.2 3.9 1998 ....................................... 133.7 134.5 136.1 137.0 .8 .6 1.2 .7 4.0 4.0 3.5 3.3 1999 ....................................... 138.3 139.4 140.1 141.7 .9 .8 .5 1.1 3.4 3.6 2.9 3.4
Goods-producing industries2: 1981 ....................................... – 72.6 74.3 75.6 – – 2.3 1.7 – – – – 1982 ....................................... 77.1 77.9 79.2 79.9 2.0 1.0 1.7 .9 – 7.3 6.6 5.7
See footnotes at end of table.
70
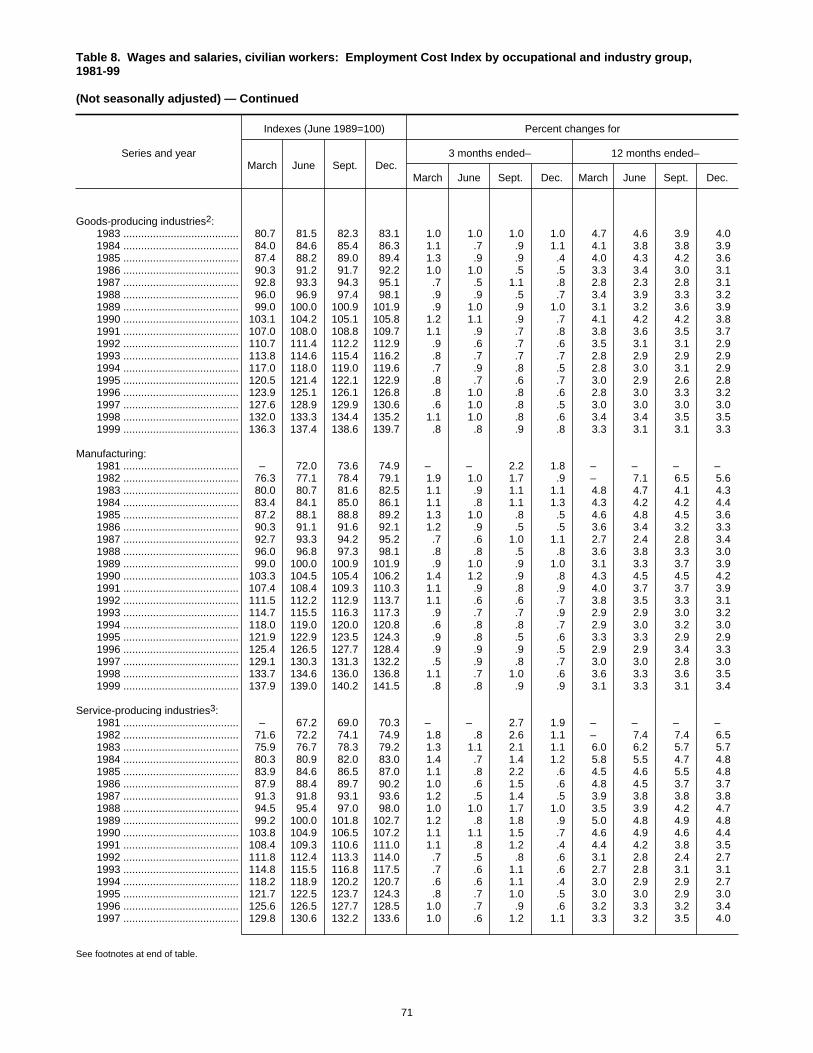
Table 8. Wages and salaries, civilian workers: Employment Cost Index by occupational and industry group,1981-99
(Not seasonally adjusted) — Continued
Series and year
Indexes (June 1989=100) Percent changes for
March June Sept. Dec.3 months ended– 12 months ended–
March June Sept. Dec. March June Sept. Dec.
Goods-producing industries2: 1983 ....................................... 80.7 81.5 82.3 83.1 1.0 1.0 1.0 1.0 4.7 4.6 3.9 4.0 1984 ....................................... 84.0 84.6 85.4 86.3 1.1 .7 .9 1.1 4.1 3.8 3.8 3.9 1985 ....................................... 87.4 88.2 89.0 89.4 1.3 .9 .9 .4 4.0 4.3 4.2 3.6 1986 ....................................... 90.3 91.2 91.7 92.2 1.0 1.0 .5 .5 3.3 3.4 3.0 3.1 1987 ....................................... 92.8 93.3 94.3 95.1 .7 .5 1.1 .8 2.8 2.3 2.8 3.1 1988 ....................................... 96.0 96.9 97.4 98.1 .9 .9 .5 .7 3.4 3.9 3.3 3.2 1989 ....................................... 99.0 100.0 100.9 101.9 .9 1.0 .9 1.0 3.1 3.2 3.6 3.9 1990 ....................................... 103.1 104.2 105.1 105.8 1.2 1.1 .9 .7 4.1 4.2 4.2 3.8 1991 ....................................... 107.0 108.0 108.8 109.7 1.1 .9 .7 .8 3.8 3.6 3.5 3.7 1992 ....................................... 110.7 111.4 112.2 112.9 .9 .6 .7 .6 3.5 3.1 3.1 2.9 1993 ....................................... 113.8 114.6 115.4 116.2 .8 .7 .7 .7 2.8 2.9 2.9 2.9 1994 ....................................... 117.0 118.0 119.0 119.6 .7 .9 .8 .5 2.8 3.0 3.1 2.9 1995 ....................................... 120.5 121.4 122.1 122.9 .8 .7 .6 .7 3.0 2.9 2.6 2.8 1996 ....................................... 123.9 125.1 126.1 126.8 .8 1.0 .8 .6 2.8 3.0 3.3 3.2 1997 ....................................... 127.6 128.9 129.9 130.6 .6 1.0 .8 .5 3.0 3.0 3.0 3.0 1998 ....................................... 132.0 133.3 134.4 135.2 1.1 1.0 .8 .6 3.4 3.4 3.5 3.5 1999 ....................................... 136.3 137.4 138.6 139.7 .8 .8 .9 .8 3.3 3.1 3.1 3.3
Manufacturing: 1981 ....................................... – 72.0 73.6 74.9 – – 2.2 1.8 – – – – 1982 ....................................... 76.3 77.1 78.4 79.1 1.9 1.0 1.7 .9 – 7.1 6.5 5.6 1983 ....................................... 80.0 80.7 81.6 82.5 1.1 .9 1.1 1.1 4.8 4.7 4.1 4.3 1984 ....................................... 83.4 84.1 85.0 86.1 1.1 .8 1.1 1.3 4.3 4.2 4.2 4.4 1985 ....................................... 87.2 88.1 88.8 89.2 1.3 1.0 .8 .5 4.6 4.8 4.5 3.6 1986 ....................................... 90.3 91.1 91.6 92.1 1.2 .9 .5 .5 3.6 3.4 3.2 3.3 1987 ....................................... 92.7 93.3 94.2 95.2 .7 .6 1.0 1.1 2.7 2.4 2.8 3.4 1988 ....................................... 96.0 96.8 97.3 98.1 .8 .8 .5 .8 3.6 3.8 3.3 3.0 1989 ....................................... 99.0 100.0 100.9 101.9 .9 1.0 .9 1.0 3.1 3.3 3.7 3.9 1990 ....................................... 103.3 104.5 105.4 106.2 1.4 1.2 .9 .8 4.3 4.5 4.5 4.2 1991 ....................................... 107.4 108.4 109.3 110.3 1.1 .9 .8 .9 4.0 3.7 3.7 3.9 1992 ....................................... 111.5 112.2 112.9 113.7 1.1 .6 .6 .7 3.8 3.5 3.3 3.1 1993 ....................................... 114.7 115.5 116.3 117.3 .9 .7 .7 .9 2.9 2.9 3.0 3.2 1994 ....................................... 118.0 119.0 120.0 120.8 .6 .8 .8 .7 2.9 3.0 3.2 3.0 1995 ....................................... 121.9 122.9 123.5 124.3 .9 .8 .5 .6 3.3 3.3 2.9 2.9 1996 ....................................... 125.4 126.5 127.7 128.4 .9 .9 .9 .5 2.9 2.9 3.4 3.3 1997 ....................................... 129.1 130.3 131.3 132.2 .5 .9 .8 .7 3.0 3.0 2.8 3.0 1998 ....................................... 133.7 134.6 136.0 136.8 1.1 .7 1.0 .6 3.6 3.3 3.6 3.5 1999 ....................................... 137.9 139.0 140.2 141.5 .8 .8 .9 .9 3.1 3.3 3.1 3.4
Service-producing industries3: 1981 ....................................... – 67.2 69.0 70.3 – – 2.7 1.9 – – – – 1982 ....................................... 71.6 72.2 74.1 74.9 1.8 .8 2.6 1.1 – 7.4 7.4 6.5 1983 ....................................... 75.9 76.7 78.3 79.2 1.3 1.1 2.1 1.1 6.0 6.2 5.7 5.7 1984 ....................................... 80.3 80.9 82.0 83.0 1.4 .7 1.4 1.2 5.8 5.5 4.7 4.8 1985 ....................................... 83.9 84.6 86.5 87.0 1.1 .8 2.2 .6 4.5 4.6 5.5 4.8 1986 ....................................... 87.9 88.4 89.7 90.2 1.0 .6 1.5 .6 4.8 4.5 3.7 3.7 1987 ....................................... 91.3 91.8 93.1 93.6 1.2 .5 1.4 .5 3.9 3.8 3.8 3.8 1988 ....................................... 94.5 95.4 97.0 98.0 1.0 1.0 1.7 1.0 3.5 3.9 4.2 4.7 1989 ....................................... 99.2 100.0 101.8 102.7 1.2 .8 1.8 .9 5.0 4.8 4.9 4.8 1990 ....................................... 103.8 104.9 106.5 107.2 1.1 1.1 1.5 .7 4.6 4.9 4.6 4.4 1991 ....................................... 108.4 109.3 110.6 111.0 1.1 .8 1.2 .4 4.4 4.2 3.8 3.5 1992 ....................................... 111.8 112.4 113.3 114.0 .7 .5 .8 .6 3.1 2.8 2.4 2.7 1993 ....................................... 114.8 115.5 116.8 117.5 .7 .6 1.1 .6 2.7 2.8 3.1 3.1 1994 ....................................... 118.2 118.9 120.2 120.7 .6 .6 1.1 .4 3.0 2.9 2.9 2.7 1995 ....................................... 121.7 122.5 123.7 124.3 .8 .7 1.0 .5 3.0 3.0 2.9 3.0 1996 ....................................... 125.6 126.5 127.7 128.5 1.0 .7 .9 .6 3.2 3.3 3.2 3.4 1997 ....................................... 129.8 130.6 132.2 133.6 1.0 .6 1.2 1.1 3.3 3.2 3.5 4.0
See footnotes at end of table.
71

Table 8. Wages and salaries, civilian workers: Employment Cost Index by occupational and industry group,1981-99
(Not seasonally adjusted) — Continued
Series and year
Indexes (June 1989=100) Percent changes for
March June Sept. Dec.3 months ended– 12 months ended–
March June Sept. Dec. March June Sept. Dec.
Service-producing industries3: 1998 ....................................... 134.8 135.7 137.8 138.7 0.9 0.7 1.5 0.7 3.9 3.9 4.2 3.8 1999 ....................................... 139.2 140.7 142.3 143.5 .4 1.1 1.1 .8 3.3 3.7 3.3 3.5
Service industries: 1981 ....................................... – 63.1 65.9 67.3 – – 4.4 2.1 – – – – 1982 ....................................... 68.6 69.1 71.5 72.2 1.9 .7 3.5 1.0 – 9.5 8.5 7.3 1983 ....................................... 73.1 73.4 75.8 76.6 1.2 .4 3.3 1.1 6.6 6.2 6.0 6.1 1984 ....................................... 77.8 78.2 80.3 81.4 1.6 .5 2.7 1.4 6.4 6.5 5.9 6.3 1985 ....................................... 81.9 82.4 84.7 85.1 .6 .6 2.8 .5 5.3 5.4 5.5 4.5 1986 ....................................... 86.1 86.5 88.3 89.1 1.2 .5 2.1 .9 5.1 5.0 4.3 4.7 1987 ....................................... 90.1 90.5 92.7 93.6 1.1 .4 2.4 1.0 4.6 4.6 5.0 5.1 1988 ....................................... 94.4 94.9 97.2 98.3 .9 .5 2.4 1.1 4.8 4.9 4.9 5.0 1989 ....................................... 99.4 100.0 102.5 103.3 1.1 .6 2.5 .8 5.3 5.4 5.5 5.1 1990 ....................................... 104.8 105.9 108.1 109.2 1.5 1.0 2.1 1.0 5.4 5.9 5.5 5.7 1991 ....................................... 110.2 110.7 112.4 113.0 .9 .5 1.5 .5 5.2 4.5 4.0 3.5 1992 ....................................... 113.7 114.3 115.9 116.7 .6 .5 1.4 .7 3.2 3.3 3.1 3.3 1993 ....................................... 117.4 117.8 119.5 120.0 .6 .3 1.4 .4 3.3 3.1 3.1 2.8 1994 ....................................... 120.9 121.3 122.8 123.5 .8 .3 1.2 .6 3.0 3.0 2.8 2.9 1995 ....................................... 124.4 124.8 126.2 126.9 .7 .3 1.1 .6 2.9 2.9 2.8 2.8 1996 ....................................... 128.0 128.9 130.3 131.1 .9 .7 1.1 .6 2.9 3.3 3.2 3.3 1997 ....................................... 132.0 132.9 134.8 136.0 .7 .7 1.4 .9 3.1 3.1 3.5 3.7 1998 ....................................... 136.9 137.6 139.6 140.5 .7 .5 1.5 .6 3.7 3.5 3.6 3.3 1999 ....................................... 141.5 142.3 144.1 145.5 .7 .6 1.3 1.0 3.4 3.4 3.2 3.6
Health services: 1985 ....................................... 82.3 82.9 84.0 84.2 – .7 1.3 .2 – – – – 1986 ....................................... 85.1 85.7 87.2 88.2 1.1 .7 1.8 1.1 3.4 3.4 3.8 4.8 1987 ....................................... 89.4 90.0 91.3 92.3 1.4 .7 1.4 1.1 5.1 5.0 4.7 4.6 1988 ....................................... 92.9 94.4 96.1 97.4 .7 1.6 1.8 1.4 3.9 4.9 5.3 5.5 1989 ....................................... 99.0 100.0 102.0 103.5 1.6 1.0 2.0 1.5 6.6 5.9 6.1 6.3 1990 ....................................... 105.3 106.2 108.3 109.7 1.7 .9 2.0 1.3 6.4 6.2 6.2 6.0 1991 ....................................... 111.1 111.8 113.4 114.5 1.3 .6 1.4 1.0 5.5 5.3 4.7 4.4 1992 ....................................... 115.4 116.2 117.7 118.6 .8 .7 1.3 .8 3.9 3.9 3.8 3.6 1993 ....................................... 119.5 120.3 121.4 122.2 .8 .7 .9 .7 3.6 3.5 3.1 3.0 1994 ....................................... 122.8 123.4 124.4 125.4 .5 .5 .8 .8 2.8 2.6 2.5 2.6 1995 ....................................... 126.1 126.6 127.5 128.4 .6 .4 .7 .7 2.7 2.6 2.5 2.4 1996 ....................................... 129.3 130.0 130.8 131.4 .7 .5 .6 .5 2.5 2.7 2.6 2.3 1997 ....................................... 132.4 133.1 134.3 135.4 .8 .5 .9 .8 2.4 2.4 2.7 3.0 1998 ....................................... 136.2 136.5 137.6 137.6 .6 .2 .8 .0 2.9 2.6 2.5 1.6 1999 ....................................... 138.8 139.7 140.9 142.5 .9 .6 .9 1.1 1.9 2.3 2.4 3.6
Hospitals: 1986 ....................................... – 85.3 86.6 87.6 – – 1.5 1.2 – – – – 1987 ....................................... 88.7 89.3 90.9 92.0 1.3 .7 1.8 1.2 – 4.7 5.0 5.0 1988 ....................................... 92.9 94.3 96.0 97.3 1.0 1.5 1.8 1.4 4.7 5.6 5.6 5.8 1989 ....................................... 98.9 100.0 102.2 103.5 1.6 1.1 2.2 1.3 6.5 6.0 6.5 6.4 1990 ....................................... 105.0 106.0 108.3 109.8 1.4 1.0 2.2 1.4 6.2 6.0 6.0 6.1 1991 ....................................... 110.8 111.5 113.1 114.3 .9 .6 1.4 1.1 5.5 5.2 4.4 4.1 1992 ....................................... 115.2 115.7 117.1 118.0 .8 .4 1.2 .8 4.0 3.8 3.5 3.2 1993 ....................................... 118.9 119.5 120.7 121.7 .8 .5 1.0 .8 3.2 3.3 3.1 3.1 1994 ....................................... 122.4 123.0 124.0 124.9 .6 .5 .8 .7 2.9 2.9 2.7 2.6 1995 ....................................... 125.5 126.0 126.8 127.8 .5 .4 .6 .8 2.5 2.4 2.3 2.3 1996 ....................................... 128.6 129.2 130.0 130.5 .6 .5 .6 .4 2.5 2.5 2.5 2.1 1997 ....................................... 131.0 131.5 132.5 133.6 .4 .4 .8 .8 1.9 1.8 1.9 2.4 1998 ....................................... 134.2 135.1 136.4 137.1 .4 .7 1.0 .5 2.4 2.7 2.9 2.6 1999 ....................................... 138.1 138.8 140.1 141.6 .7 .5 .9 1.1 2.9 2.7 2.7 3.3
See footnotes at end of table.
72

Table 8. Wages and salaries, civilian workers: Employment Cost Index by occupational and industry group,1981-99
(Not seasonally adjusted) — Continued
Series and year
Indexes (June 1989=100) Percent changes for
March June Sept. Dec.3 months ended– 12 months ended–
March June Sept. Dec. March June Sept. Dec.
Educational services: 1989 ....................................... 99.5 100.0 103.8 104.4 – 0.5 3.8 0.6 – – – – 1990 ....................................... 105.4 105.8 109.6 110.4 1.0 .4 3.6 .7 5.9 5.8 5.6 5.7 1991 ....................................... 111.1 111.1 113.6 114.0 .6 .0 2.3 .4 5.4 5.0 3.6 3.3 1992 ....................................... 114.1 114.4 116.9 117.5 .1 .3 2.2 .5 2.7 3.0 2.9 3.1 1993 ....................................... 117.9 118.0 120.4 120.7 .3 .1 2.0 .2 3.3 3.1 3.0 2.7 1994 ....................................... 121.0 121.3 123.8 124.3 .2 .2 2.1 .4 2.6 2.8 2.8 3.0 1995 ....................................... 125.0 125.1 127.8 128.5 .6 .1 2.2 .5 3.3 3.1 3.2 3.4 1996 ....................................... 128.8 129.1 131.6 132.3 .2 .2 1.9 .5 3.0 3.2 3.0 3.0 1997 ....................................... 132.5 132.6 135.3 135.9 .2 .1 2.0 .4 2.9 2.7 2.8 2.7 1998 ....................................... 136.3 136.5 139.1 140.0 .3 .1 1.9 .6 2.9 2.9 2.8 3.0 1999 ....................................... 140.2 140.6 143.7 144.7 .1 .3 2.2 .7 2.9 3.0 3.3 3.4
Public administration4: 1981 ....................................... – 65.9 68.4 69.5 – – 3.8 1.6 – – – – 1982 ....................................... 70.8 71.4 73.7 74.2 1.9 .8 3.2 .7 – 8.3 7.7 6.8 1983 ....................................... 75.5 76.0 77.9 78.7 1.8 .7 2.5 1.0 6.6 6.4 5.7 6.1 1984 ....................................... 79.3 79.9 81.9 82.8 .8 .8 2.5 1.1 5.0 5.1 5.1 5.2 1985 ....................................... 83.7 83.8 86.6 87.0 1.1 .1 3.3 .5 5.5 4.9 5.7 5.1 1986 ....................................... 88.1 88.7 90.6 91.0 1.3 .7 2.1 .4 5.3 5.8 4.6 4.6 1987 ....................................... 92.6 92.9 93.9 94.7 1.8 .3 1.1 .9 5.1 4.7 3.6 4.1 1988 ....................................... 95.8 96.4 98.1 98.4 1.2 .6 1.8 .3 3.5 3.8 4.5 3.9 1989 ....................................... 99.4 100.0 102.1 102.8 1.0 .6 2.1 .7 3.8 3.7 4.1 4.5 1990 ....................................... 104.3 104.6 106.5 107.3 1.5 .3 1.8 .8 4.9 4.6 4.3 4.4 1991 ....................................... 109.1 109.5 110.6 110.9 1.7 .4 1.0 .3 4.6 4.7 3.8 3.4 1992 ....................................... 111.9 112.4 113.1 113.6 .9 .4 .6 .4 2.6 2.6 2.3 2.4 1993 ....................................... 114.4 114.9 115.9 116.6 .7 .4 .9 .6 2.2 2.2 2.5 2.6 1994 ....................................... 117.9 118.5 119.9 120.6 1.1 .5 1.2 .6 3.1 3.1 3.5 3.4 1995 ....................................... 121.9 122.3 123.2 124.1 1.1 .3 .7 .7 3.4 3.2 2.8 2.9 1996 ....................................... 124.9 125.3 126.6 127.7 .6 .3 1.0 .9 2.5 2.5 2.8 2.9 1997 ....................................... 128.9 129.0 130.3 131.4 .9 .1 1.0 .8 3.2 3.0 2.9 2.9 1998 ....................................... 132.7 133.2 134.8 135.9 1.0 .4 1.2 .8 2.9 3.3 3.5 3.4 1999 ....................................... 136.9 137.8 139.5 141.5 .7 .7 1.2 1.4 3.2 3.5 3.5 4.1
Nonmanufacturing: 1981 ....................................... – 68.0 69.9 71.1 – – 2.8 1.7 – – – – 1982 ....................................... 72.4 73.1 74.9 75.7 1.8 1.0 2.5 1.1 – 7.5 7.2 6.5 1983 ....................................... 76.7 77.6 79.0 79.9 1.3 1.2 1.8 1.1 5.9 6.2 5.5 5.5 1984 ....................................... 80.9 81.4 82.5 83.4 1.3 .6 1.4 1.1 5.5 4.9 4.4 4.4 1985 ....................................... 84.3 85.0 86.8 87.3 1.1 .8 2.1 .6 4.2 4.4 5.2 4.7 1986 ....................................... 88.2 88.7 89.9 90.5 1.0 .6 1.4 .7 4.6 4.4 3.6 3.7 1987 ....................................... 91.5 92.0 93.3 93.7 1.1 .5 1.4 .4 3.7 3.7 3.8 3.5 1988 ....................................... 94.6 95.6 97.1 98.0 1.0 1.1 1.6 .9 3.4 3.9 4.1 4.6 1989 ....................................... 99.2 100.0 101.8 102.6 1.2 .8 1.8 .8 4.9 4.6 4.8 4.7 1990 ....................................... 103.7 104.8 106.2 106.9 1.1 1.1 1.3 .7 4.5 4.8 4.3 4.2 1991 ....................................... 108.1 109.0 110.2 110.7 1.1 .8 1.1 .5 4.2 4.0 3.8 3.6 1992 ....................................... 111.5 112.0 113.0 113.6 .7 .4 .9 .5 3.1 2.8 2.5 2.6 1993 ....................................... 114.4 115.1 116.4 117.0 .7 .6 1.1 .5 2.6 2.8 3.0 3.0 1994 ....................................... 117.7 118.5 119.7 120.2 .6 .7 1.0 .4 2.9 3.0 2.8 2.7 1995 ....................................... 121.1 121.9 123.1 123.7 .7 .7 1.0 .5 2.9 2.9 2.8 2.9 1996 ....................................... 125.0 125.9 127.0 127.8 1.1 .7 .9 .6 3.2 3.3 3.2 3.3 1997 ....................................... 129.1 130.0 131.5 132.8 1.0 .7 1.2 1.0 3.3 3.3 3.5 3.9 1998 ....................................... 134.0 135.1 137.0 137.8 .9 .8 1.4 .6 3.8 3.9 4.2 3.8 1999 ....................................... 138.4 139.9 141.5 142.6 .4 1.1 1.1 .8 3.3 3.6 3.3 3.5
1 Includes private industry and State and local government workers andexcludes farm, household, and Federal government workers.
2 Includes mining, construction, and manufacturing.3 Includes transportation, communication, and public utilities; wholesale
and retail trade; finance, insurance, and real estate; service industries and
public administration.4 Includes executive, legislative, judicial, administrative, and regulatory
activities of State and local governments, SIC’s 91 through 96.– Data not available.
73

Table 9. Wages and salaries, State and local government workers: Employment Cost Index by occupational andindustry group, 1981-99
(Not seasonally adjusted)
Series and year
Indexes (June 1989=100) Percent changes for
March June Sept. Dec.3 months ended– 12 months ended–
March June Sept. Dec. March June Sept. Dec.
State and local government: 1981 ....................................... – 63.9 67.0 68.3 – – 4.9 1.9 – – – – 1982 ....................................... 69.1 69.4 72.5 72.8 1.2 0.4 4.5 .4 – 8.6 8.2 6.6 1983 ....................................... 73.5 73.9 76.1 76.6 1.0 .5 3.0 .7 6.4 6.5 5.0 5.2 1984 ....................................... 77.7 77.9 80.5 81.2 1.4 .3 3.3 .9 5.7 5.4 5.8 6.0 1985 ....................................... 82.0 82.2 85.1 85.7 1.0 .2 3.5 .7 5.5 5.5 5.7 5.5 1986 ....................................... 86.5 86.8 89.7 90.3 .9 .3 3.3 .7 5.5 5.6 5.4 5.4 1987 ....................................... 91.0 91.2 93.3 94.1 .8 .2 2.3 .9 5.2 5.1 4.0 4.2 1988 ....................................... 95.0 95.2 97.7 98.7 1.0 .2 2.6 1.0 4.4 4.4 4.7 4.9 1989 ....................................... 99.5 100.0 103.1 103.9 .8 .5 3.1 .8 4.7 5.0 5.5 5.3 1990 ....................................... 105.1 105.7 108.6 109.4 1.2 .6 2.7 .7 5.6 5.7 5.3 5.3 1991 ....................................... 110.6 110.9 112.8 113.2 1.1 .3 1.7 .4 5.2 4.9 3.9 3.5 1992 ....................................... 113.8 114.2 115.9 116.6 .5 .4 1.5 .6 2.9 3.0 2.7 3.0 1993 ....................................... 117.2 117.4 119.3 119.7 .5 .2 1.6 .3 3.0 2.8 2.9 2.7 1994 ....................................... 120.4 120.7 122.8 123.4 .6 .2 1.7 .5 2.7 2.8 2.9 3.1 1995 ....................................... 124.3 124.6 126.6 127.3 .7 .2 1.6 .6 3.2 3.2 3.1 3.2 1996 ....................................... 127.8 128.1 130.1 130.9 .4 .2 1.6 .6 2.8 2.8 2.8 2.8 1997 ....................................... 131.4 131.5 133.6 134.4 .4 .1 1.6 .6 2.8 2.7 2.7 2.7 1998 ....................................... 135.1 135.4 137.6 138.5 .5 .2 1.6 .7 2.8 3.0 3.0 3.1 1999 ....................................... 139.0 139.6 142.2 143.5 .4 .4 1.9 .9 2.9 3.1 3.3 3.6
White-collar occupations: 1981 ....................................... – 63.0 66.4 67.7 – – 5.4 2.0 – – – – 1982 ....................................... 68.4 68.6 72.0 72.2 1.0 .3 5.0 .3 – 8.9 8.4 6.6 1983 ....................................... 72.8 73.2 75.5 76.0 .8 .5 3.1 .7 6.4 6.7 4.9 5.3 1984 ....................................... 77.0 77.2 80.1 80.7 1.3 .3 3.8 .7 5.8 5.5 6.1 6.2 1985 ....................................... 81.5 81.7 84.6 85.3 1.0 .2 3.5 .8 5.8 5.8 5.6 5.7 1986 ....................................... 86.1 86.3 89.4 90.0 .9 .2 3.6 .7 5.6 5.6 5.7 5.5 1987 ....................................... 90.7 90.8 93.1 94.1 .8 .1 2.5 1.1 5.3 5.2 4.1 4.6 1988 ....................................... 94.8 95.0 97.6 98.8 .7 .2 2.7 1.2 4.5 4.6 4.8 5.0 1989 ....................................... 99.6 100.0 103.4 104.2 .8 .4 3.4 .8 5.1 5.3 5.9 5.5 1990 ....................................... 105.5 106.0 109.2 109.9 1.2 .5 3.0 .6 5.9 6.0 5.6 5.5 1991 ....................................... 111.0 111.2 113.1 113.5 1.0 .2 1.7 .4 5.2 4.9 3.6 3.3 1992 ....................................... 114.0 114.3 116.2 116.9 .4 .3 1.7 .6 2.7 2.8 2.7 3.0 1993 ....................................... 117.5 117.6 119.6 119.9 .5 .1 1.7 .3 3.1 2.9 2.9 2.6 1994 ....................................... 120.6 120.9 122.9 123.6 .6 .2 1.7 .6 2.6 2.8 2.8 3.1 1995 ....................................... 124.4 124.6 126.8 127.4 .6 .2 1.8 .5 3.2 3.1 3.2 3.1 1996 ....................................... 127.9 128.2 130.3 131.1 .4 .2 1.6 .6 2.8 2.9 2.8 2.9 1997 ....................................... 131.4 131.5 133.7 134.5 .2 .1 1.7 .6 2.7 2.6 2.6 2.6 1998 ....................................... 135.0 135.2 137.6 138.5 .4 .1 1.8 .7 2.7 2.8 2.9 3.0 1999 ....................................... 138.9 139.3 142.1 143.4 .3 .3 2.0 .9 2.9 3.0 3.3 3.5
Professional specialty andtechnical occupations:
1989 ....................................... – 100.0 103.7 104.4 – – 3.7 .7 – – – – 1990 ....................................... 105.8 106.3 109.8 110.6 1.3 .5 3.3 .7 – 6.3 5.9 5.9 1991 ....................................... 111.5 111.7 113.8 114.2 .8 .2 1.9 .4 5.4 5.1 3.6 3.3 1992 ....................................... 114.5 114.8 117.0 117.6 .3 .3 1.9 .5 2.7 2.8 2.8 3.0 1993 ....................................... 118.1 118.2 120.4 120.7 .4 .1 1.9 .2 3.1 3.0 2.9 2.6 1994 ....................................... 121.1 121.3 123.6 124.2 .3 .2 1.9 .5 2.5 2.6 2.7 2.9 1995 ....................................... 124.8 125.0 127.4 128.0 .5 .2 1.9 .5 3.1 3.1 3.1 3.1 1996 ....................................... 128.3 128.6 131.1 131.7 .2 .2 1.9 .5 2.8 2.9 2.9 2.9 1997 ....................................... 131.9 132.0 134.4 135.1 .2 .1 1.8 .5 2.8 2.6 2.5 2.6 1998 ....................................... 135.5 135.6 137.9 138.7 .3 .1 1.7 .6 2.7 2.7 2.6 2.7 1999 ....................................... 138.9 139.4 142.5 143.6 .1 .4 2.2 .8 2.5 2.8 3.3 3.5
See footnotes at end of table.
74
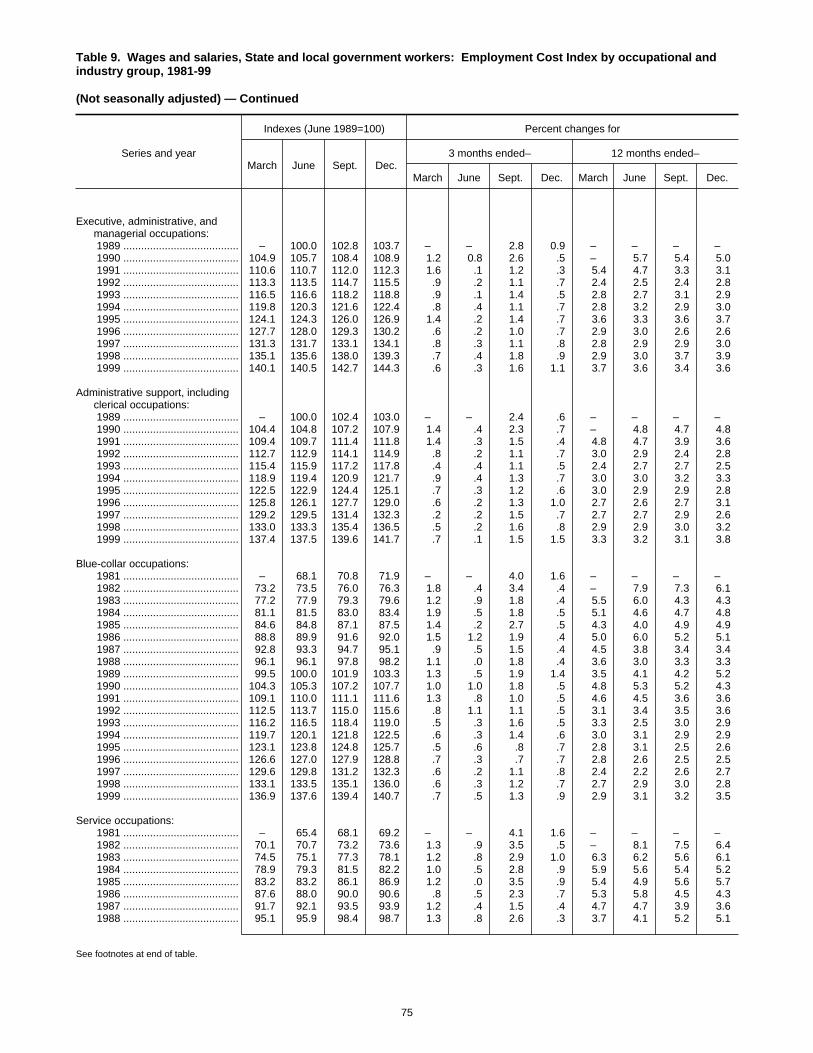
Table 9. Wages and salaries, State and local government workers: Employment Cost Index by occupational andindustry group, 1981-99
(Not seasonally adjusted) — Continued
Series and year
Indexes (June 1989=100) Percent changes for
March June Sept. Dec.3 months ended– 12 months ended–
March June Sept. Dec. March June Sept. Dec.
Executive, administrative, andmanagerial occupations:
1989 ....................................... – 100.0 102.8 103.7 – – 2.8 0.9 – – – – 1990 ....................................... 104.9 105.7 108.4 108.9 1.2 0.8 2.6 .5 – 5.7 5.4 5.0 1991 ....................................... 110.6 110.7 112.0 112.3 1.6 .1 1.2 .3 5.4 4.7 3.3 3.1 1992 ....................................... 113.3 113.5 114.7 115.5 .9 .2 1.1 .7 2.4 2.5 2.4 2.8 1993 ....................................... 116.5 116.6 118.2 118.8 .9 .1 1.4 .5 2.8 2.7 3.1 2.9 1994 ....................................... 119.8 120.3 121.6 122.4 .8 .4 1.1 .7 2.8 3.2 2.9 3.0 1995 ....................................... 124.1 124.3 126.0 126.9 1.4 .2 1.4 .7 3.6 3.3 3.6 3.7 1996 ....................................... 127.7 128.0 129.3 130.2 .6 .2 1.0 .7 2.9 3.0 2.6 2.6 1997 ....................................... 131.3 131.7 133.1 134.1 .8 .3 1.1 .8 2.8 2.9 2.9 3.0 1998 ....................................... 135.1 135.6 138.0 139.3 .7 .4 1.8 .9 2.9 3.0 3.7 3.9 1999 ....................................... 140.1 140.5 142.7 144.3 .6 .3 1.6 1.1 3.7 3.6 3.4 3.6
Administrative support, includingclerical occupations:
1989 ....................................... – 100.0 102.4 103.0 – – 2.4 .6 – – – – 1990 ....................................... 104.4 104.8 107.2 107.9 1.4 .4 2.3 .7 – 4.8 4.7 4.8 1991 ....................................... 109.4 109.7 111.4 111.8 1.4 .3 1.5 .4 4.8 4.7 3.9 3.6 1992 ....................................... 112.7 112.9 114.1 114.9 .8 .2 1.1 .7 3.0 2.9 2.4 2.8 1993 ....................................... 115.4 115.9 117.2 117.8 .4 .4 1.1 .5 2.4 2.7 2.7 2.5 1994 ....................................... 118.9 119.4 120.9 121.7 .9 .4 1.3 .7 3.0 3.0 3.2 3.3 1995 ....................................... 122.5 122.9 124.4 125.1 .7 .3 1.2 .6 3.0 2.9 2.9 2.8 1996 ....................................... 125.8 126.1 127.7 129.0 .6 .2 1.3 1.0 2.7 2.6 2.7 3.1 1997 ....................................... 129.2 129.5 131.4 132.3 .2 .2 1.5 .7 2.7 2.7 2.9 2.6 1998 ....................................... 133.0 133.3 135.4 136.5 .5 .2 1.6 .8 2.9 2.9 3.0 3.2 1999 ....................................... 137.4 137.5 139.6 141.7 .7 .1 1.5 1.5 3.3 3.2 3.1 3.8
Blue-collar occupations: 1981 ....................................... – 68.1 70.8 71.9 – – 4.0 1.6 – – – – 1982 ....................................... 73.2 73.5 76.0 76.3 1.8 .4 3.4 .4 – 7.9 7.3 6.1 1983 ....................................... 77.2 77.9 79.3 79.6 1.2 .9 1.8 .4 5.5 6.0 4.3 4.3 1984 ....................................... 81.1 81.5 83.0 83.4 1.9 .5 1.8 .5 5.1 4.6 4.7 4.8 1985 ....................................... 84.6 84.8 87.1 87.5 1.4 .2 2.7 .5 4.3 4.0 4.9 4.9 1986 ....................................... 88.8 89.9 91.6 92.0 1.5 1.2 1.9 .4 5.0 6.0 5.2 5.1 1987 ....................................... 92.8 93.3 94.7 95.1 .9 .5 1.5 .4 4.5 3.8 3.4 3.4 1988 ....................................... 96.1 96.1 97.8 98.2 1.1 .0 1.8 .4 3.6 3.0 3.3 3.3 1989 ....................................... 99.5 100.0 101.9 103.3 1.3 .5 1.9 1.4 3.5 4.1 4.2 5.2 1990 ....................................... 104.3 105.3 107.2 107.7 1.0 1.0 1.8 .5 4.8 5.3 5.2 4.3 1991 ....................................... 109.1 110.0 111.1 111.6 1.3 .8 1.0 .5 4.6 4.5 3.6 3.6 1992 ....................................... 112.5 113.7 115.0 115.6 .8 1.1 1.1 .5 3.1 3.4 3.5 3.6 1993 ....................................... 116.2 116.5 118.4 119.0 .5 .3 1.6 .5 3.3 2.5 3.0 2.9 1994 ....................................... 119.7 120.1 121.8 122.5 .6 .3 1.4 .6 3.0 3.1 2.9 2.9 1995 ....................................... 123.1 123.8 124.8 125.7 .5 .6 .8 .7 2.8 3.1 2.5 2.6 1996 ....................................... 126.6 127.0 127.9 128.8 .7 .3 .7 .7 2.8 2.6 2.5 2.5 1997 ....................................... 129.6 129.8 131.2 132.3 .6 .2 1.1 .8 2.4 2.2 2.6 2.7 1998 ....................................... 133.1 133.5 135.1 136.0 .6 .3 1.2 .7 2.7 2.9 3.0 2.8 1999 ....................................... 136.9 137.6 139.4 140.7 .7 .5 1.3 .9 2.9 3.1 3.2 3.5
Service occupations: 1981 ....................................... – 65.4 68.1 69.2 – – 4.1 1.6 – – – – 1982 ....................................... 70.1 70.7 73.2 73.6 1.3 .9 3.5 .5 – 8.1 7.5 6.4 1983 ....................................... 74.5 75.1 77.3 78.1 1.2 .8 2.9 1.0 6.3 6.2 5.6 6.1 1984 ....................................... 78.9 79.3 81.5 82.2 1.0 .5 2.8 .9 5.9 5.6 5.4 5.2 1985 ....................................... 83.2 83.2 86.1 86.9 1.2 .0 3.5 .9 5.4 4.9 5.6 5.7 1986 ....................................... 87.6 88.0 90.0 90.6 .8 .5 2.3 .7 5.3 5.8 4.5 4.3 1987 ....................................... 91.7 92.1 93.5 93.9 1.2 .4 1.5 .4 4.7 4.7 3.9 3.6 1988 ....................................... 95.1 95.9 98.4 98.7 1.3 .8 2.6 .3 3.7 4.1 5.2 5.1
See footnotes at end of table.
75
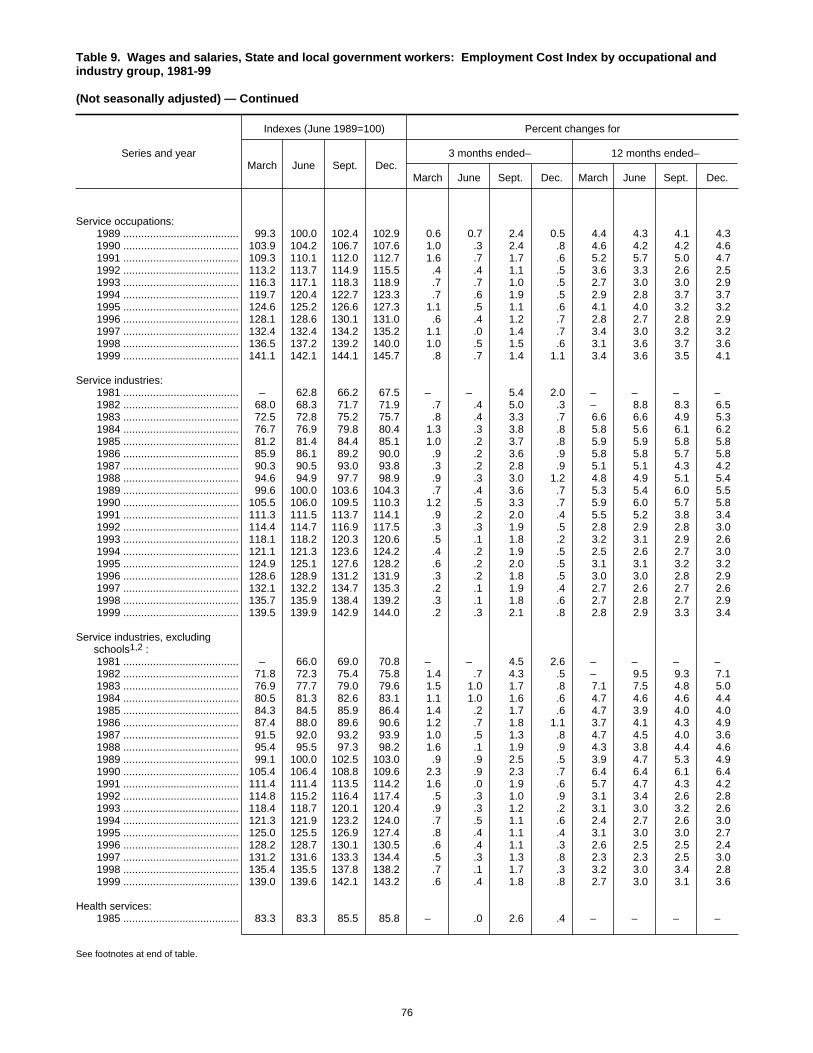
Table 9. Wages and salaries, State and local government workers: Employment Cost Index by occupational andindustry group, 1981-99
(Not seasonally adjusted) — Continued
Series and year
Indexes (June 1989=100) Percent changes for
March June Sept. Dec.3 months ended– 12 months ended–
March June Sept. Dec. March June Sept. Dec.
Service occupations: 1989 ....................................... 99.3 100.0 102.4 102.9 0.6 0.7 2.4 0.5 4.4 4.3 4.1 4.3 1990 ....................................... 103.9 104.2 106.7 107.6 1.0 .3 2.4 .8 4.6 4.2 4.2 4.6 1991 ....................................... 109.3 110.1 112.0 112.7 1.6 .7 1.7 .6 5.2 5.7 5.0 4.7 1992 ....................................... 113.2 113.7 114.9 115.5 .4 .4 1.1 .5 3.6 3.3 2.6 2.5 1993 ....................................... 116.3 117.1 118.3 118.9 .7 .7 1.0 .5 2.7 3.0 3.0 2.9 1994 ....................................... 119.7 120.4 122.7 123.3 .7 .6 1.9 .5 2.9 2.8 3.7 3.7 1995 ....................................... 124.6 125.2 126.6 127.3 1.1 .5 1.1 .6 4.1 4.0 3.2 3.2 1996 ....................................... 128.1 128.6 130.1 131.0 .6 .4 1.2 .7 2.8 2.7 2.8 2.9 1997 ....................................... 132.4 132.4 134.2 135.2 1.1 .0 1.4 .7 3.4 3.0 3.2 3.2 1998 ....................................... 136.5 137.2 139.2 140.0 1.0 .5 1.5 .6 3.1 3.6 3.7 3.6 1999 ....................................... 141.1 142.1 144.1 145.7 .8 .7 1.4 1.1 3.4 3.6 3.5 4.1
Service industries: 1981 ....................................... – 62.8 66.2 67.5 – – 5.4 2.0 – – – – 1982 ....................................... 68.0 68.3 71.7 71.9 .7 .4 5.0 .3 – 8.8 8.3 6.5 1983 ....................................... 72.5 72.8 75.2 75.7 .8 .4 3.3 .7 6.6 6.6 4.9 5.3 1984 ....................................... 76.7 76.9 79.8 80.4 1.3 .3 3.8 .8 5.8 5.6 6.1 6.2 1985 ....................................... 81.2 81.4 84.4 85.1 1.0 .2 3.7 .8 5.9 5.9 5.8 5.8 1986 ....................................... 85.9 86.1 89.2 90.0 .9 .2 3.6 .9 5.8 5.8 5.7 5.8 1987 ....................................... 90.3 90.5 93.0 93.8 .3 .2 2.8 .9 5.1 5.1 4.3 4.2 1988 ....................................... 94.6 94.9 97.7 98.9 .9 .3 3.0 1.2 4.8 4.9 5.1 5.4 1989 ....................................... 99.6 100.0 103.6 104.3 .7 .4 3.6 .7 5.3 5.4 6.0 5.5 1990 ....................................... 105.5 106.0 109.5 110.3 1.2 .5 3.3 .7 5.9 6.0 5.7 5.8 1991 ....................................... 111.3 111.5 113.7 114.1 .9 .2 2.0 .4 5.5 5.2 3.8 3.4 1992 ....................................... 114.4 114.7 116.9 117.5 .3 .3 1.9 .5 2.8 2.9 2.8 3.0 1993 ....................................... 118.1 118.2 120.3 120.6 .5 .1 1.8 .2 3.2 3.1 2.9 2.6 1994 ....................................... 121.1 121.3 123.6 124.2 .4 .2 1.9 .5 2.5 2.6 2.7 3.0 1995 ....................................... 124.9 125.1 127.6 128.2 .6 .2 2.0 .5 3.1 3.1 3.2 3.2 1996 ....................................... 128.6 128.9 131.2 131.9 .3 .2 1.8 .5 3.0 3.0 2.8 2.9 1997 ....................................... 132.1 132.2 134.7 135.3 .2 .1 1.9 .4 2.7 2.6 2.7 2.6 1998 ....................................... 135.7 135.9 138.4 139.2 .3 .1 1.8 .6 2.7 2.8 2.7 2.9 1999 ....................................... 139.5 139.9 142.9 144.0 .2 .3 2.1 .8 2.8 2.9 3.3 3.4
Service industries, excludingschools1,2 :
1981 ....................................... – 66.0 69.0 70.8 – – 4.5 2.6 – – – – 1982 ....................................... 71.8 72.3 75.4 75.8 1.4 .7 4.3 .5 – 9.5 9.3 7.1 1983 ....................................... 76.9 77.7 79.0 79.6 1.5 1.0 1.7 .8 7.1 7.5 4.8 5.0 1984 ....................................... 80.5 81.3 82.6 83.1 1.1 1.0 1.6 .6 4.7 4.6 4.6 4.4 1985 ....................................... 84.3 84.5 85.9 86.4 1.4 .2 1.7 .6 4.7 3.9 4.0 4.0 1986 ....................................... 87.4 88.0 89.6 90.6 1.2 .7 1.8 1.1 3.7 4.1 4.3 4.9 1987 ....................................... 91.5 92.0 93.2 93.9 1.0 .5 1.3 .8 4.7 4.5 4.0 3.6 1988 ....................................... 95.4 95.5 97.3 98.2 1.6 .1 1.9 .9 4.3 3.8 4.4 4.6 1989 ....................................... 99.1 100.0 102.5 103.0 .9 .9 2.5 .5 3.9 4.7 5.3 4.9 1990 ....................................... 105.4 106.4 108.8 109.6 2.3 .9 2.3 .7 6.4 6.4 6.1 6.4 1991 ....................................... 111.4 111.4 113.5 114.2 1.6 .0 1.9 .6 5.7 4.7 4.3 4.2 1992 ....................................... 114.8 115.2 116.4 117.4 .5 .3 1.0 .9 3.1 3.4 2.6 2.8 1993 ....................................... 118.4 118.7 120.1 120.4 .9 .3 1.2 .2 3.1 3.0 3.2 2.6 1994 ....................................... 121.3 121.9 123.2 124.0 .7 .5 1.1 .6 2.4 2.7 2.6 3.0 1995 ....................................... 125.0 125.5 126.9 127.4 .8 .4 1.1 .4 3.1 3.0 3.0 2.7 1996 ....................................... 128.2 128.7 130.1 130.5 .6 .4 1.1 .3 2.6 2.5 2.5 2.4 1997 ....................................... 131.2 131.6 133.3 134.4 .5 .3 1.3 .8 2.3 2.3 2.5 3.0 1998 ....................................... 135.4 135.5 137.8 138.2 .7 .1 1.7 .3 3.2 3.0 3.4 2.8 1999 ....................................... 139.0 139.6 142.1 143.2 .6 .4 1.8 .8 2.7 3.0 3.1 3.6
Health services: 1985 ....................................... 83.3 83.3 85.5 85.8 – .0 2.6 .4 – – – –
See footnotes at end of table.
76
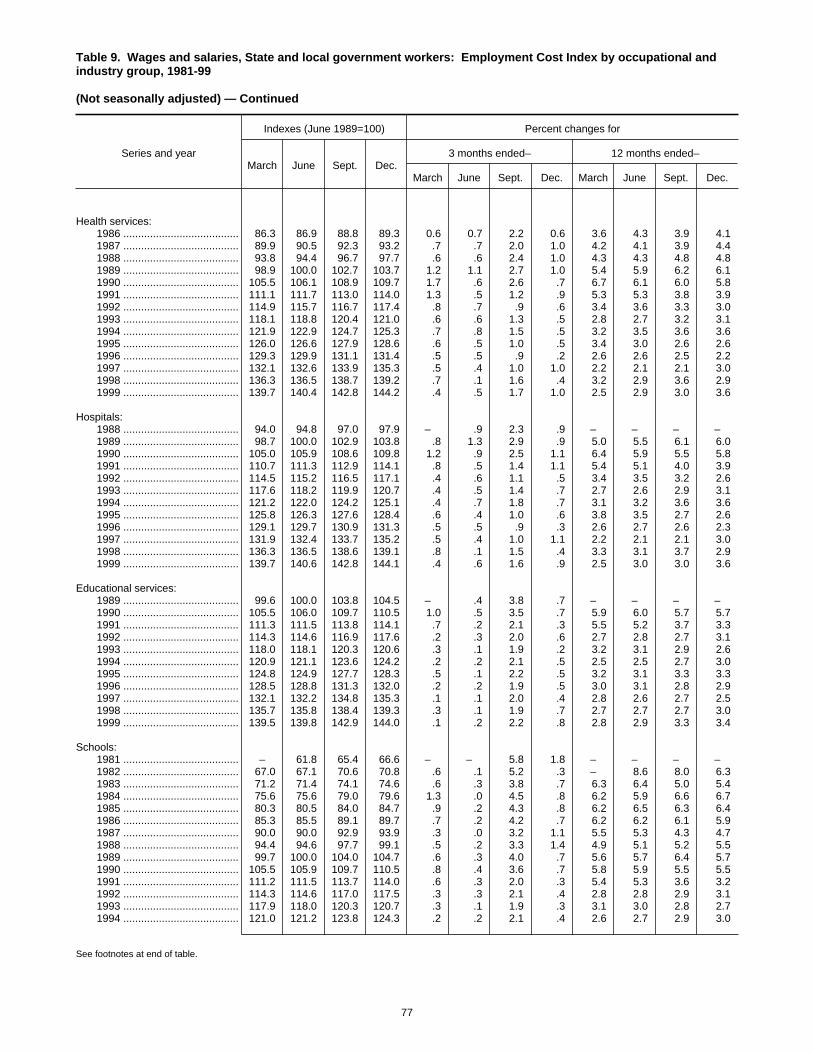
Table 9. Wages and salaries, State and local government workers: Employment Cost Index by occupational andindustry group, 1981-99
(Not seasonally adjusted) — Continued
Series and year
Indexes (June 1989=100) Percent changes for
March June Sept. Dec.3 months ended– 12 months ended–
March June Sept. Dec. March June Sept. Dec.
Health services: 1986 ....................................... 86.3 86.9 88.8 89.3 0.6 0.7 2.2 0.6 3.6 4.3 3.9 4.1 1987 ....................................... 89.9 90.5 92.3 93.2 .7 .7 2.0 1.0 4.2 4.1 3.9 4.4 1988 ....................................... 93.8 94.4 96.7 97.7 .6 .6 2.4 1.0 4.3 4.3 4.8 4.8 1989 ....................................... 98.9 100.0 102.7 103.7 1.2 1.1 2.7 1.0 5.4 5.9 6.2 6.1 1990 ....................................... 105.5 106.1 108.9 109.7 1.7 .6 2.6 .7 6.7 6.1 6.0 5.8 1991 ....................................... 111.1 111.7 113.0 114.0 1.3 .5 1.2 .9 5.3 5.3 3.8 3.9 1992 ....................................... 114.9 115.7 116.7 117.4 .8 .7 .9 .6 3.4 3.6 3.3 3.0 1993 ....................................... 118.1 118.8 120.4 121.0 .6 .6 1.3 .5 2.8 2.7 3.2 3.1 1994 ....................................... 121.9 122.9 124.7 125.3 .7 .8 1.5 .5 3.2 3.5 3.6 3.6 1995 ....................................... 126.0 126.6 127.9 128.6 .6 .5 1.0 .5 3.4 3.0 2.6 2.6 1996 ....................................... 129.3 129.9 131.1 131.4 .5 .5 .9 .2 2.6 2.6 2.5 2.2 1997 ....................................... 132.1 132.6 133.9 135.3 .5 .4 1.0 1.0 2.2 2.1 2.1 3.0 1998 ....................................... 136.3 136.5 138.7 139.2 .7 .1 1.6 .4 3.2 2.9 3.6 2.9 1999 ....................................... 139.7 140.4 142.8 144.2 .4 .5 1.7 1.0 2.5 2.9 3.0 3.6
Hospitals: 1988 ....................................... 94.0 94.8 97.0 97.9 – .9 2.3 .9 – – – – 1989 ....................................... 98.7 100.0 102.9 103.8 .8 1.3 2.9 .9 5.0 5.5 6.1 6.0 1990 ....................................... 105.0 105.9 108.6 109.8 1.2 .9 2.5 1.1 6.4 5.9 5.5 5.8 1991 ....................................... 110.7 111.3 112.9 114.1 .8 .5 1.4 1.1 5.4 5.1 4.0 3.9 1992 ....................................... 114.5 115.2 116.5 117.1 .4 .6 1.1 .5 3.4 3.5 3.2 2.6 1993 ....................................... 117.6 118.2 119.9 120.7 .4 .5 1.4 .7 2.7 2.6 2.9 3.1 1994 ....................................... 121.2 122.0 124.2 125.1 .4 .7 1.8 .7 3.1 3.2 3.6 3.6 1995 ....................................... 125.8 126.3 127.6 128.4 .6 .4 1.0 .6 3.8 3.5 2.7 2.6 1996 ....................................... 129.1 129.7 130.9 131.3 .5 .5 .9 .3 2.6 2.7 2.6 2.3 1997 ....................................... 131.9 132.4 133.7 135.2 .5 .4 1.0 1.1 2.2 2.1 2.1 3.0 1998 ....................................... 136.3 136.5 138.6 139.1 .8 .1 1.5 .4 3.3 3.1 3.7 2.9 1999 ....................................... 139.7 140.6 142.8 144.1 .4 .6 1.6 .9 2.5 3.0 3.0 3.6
Educational services: 1989 ....................................... 99.6 100.0 103.8 104.5 – .4 3.8 .7 – – – – 1990 ....................................... 105.5 106.0 109.7 110.5 1.0 .5 3.5 .7 5.9 6.0 5.7 5.7 1991 ....................................... 111.3 111.5 113.8 114.1 .7 .2 2.1 .3 5.5 5.2 3.7 3.3 1992 ....................................... 114.3 114.6 116.9 117.6 .2 .3 2.0 .6 2.7 2.8 2.7 3.1 1993 ....................................... 118.0 118.1 120.3 120.6 .3 .1 1.9 .2 3.2 3.1 2.9 2.6 1994 ....................................... 120.9 121.1 123.6 124.2 .2 .2 2.1 .5 2.5 2.5 2.7 3.0 1995 ....................................... 124.8 124.9 127.7 128.3 .5 .1 2.2 .5 3.2 3.1 3.3 3.3 1996 ....................................... 128.5 128.8 131.3 132.0 .2 .2 1.9 .5 3.0 3.1 2.8 2.9 1997 ....................................... 132.1 132.2 134.8 135.3 .1 .1 2.0 .4 2.8 2.6 2.7 2.5 1998 ....................................... 135.7 135.8 138.4 139.3 .3 .1 1.9 .7 2.7 2.7 2.7 3.0 1999 ....................................... 139.5 139.8 142.9 144.0 .1 .2 2.2 .8 2.8 2.9 3.3 3.4
Schools: 1981 ....................................... – 61.8 65.4 66.6 – – 5.8 1.8 – – – – 1982 ....................................... 67.0 67.1 70.6 70.8 .6 .1 5.2 .3 – 8.6 8.0 6.3 1983 ....................................... 71.2 71.4 74.1 74.6 .6 .3 3.8 .7 6.3 6.4 5.0 5.4 1984 ....................................... 75.6 75.6 79.0 79.6 1.3 .0 4.5 .8 6.2 5.9 6.6 6.7 1985 ....................................... 80.3 80.5 84.0 84.7 .9 .2 4.3 .8 6.2 6.5 6.3 6.4 1986 ....................................... 85.3 85.5 89.1 89.7 .7 .2 4.2 .7 6.2 6.2 6.1 5.9 1987 ....................................... 90.0 90.0 92.9 93.9 .3 .0 3.2 1.1 5.5 5.3 4.3 4.7 1988 ....................................... 94.4 94.6 97.7 99.1 .5 .2 3.3 1.4 4.9 5.1 5.2 5.5 1989 ....................................... 99.7 100.0 104.0 104.7 .6 .3 4.0 .7 5.6 5.7 6.4 5.7 1990 ....................................... 105.5 105.9 109.7 110.5 .8 .4 3.6 .7 5.8 5.9 5.5 5.5 1991 ....................................... 111.2 111.5 113.7 114.0 .6 .3 2.0 .3 5.4 5.3 3.6 3.2 1992 ....................................... 114.3 114.6 117.0 117.5 .3 .3 2.1 .4 2.8 2.8 2.9 3.1 1993 ....................................... 117.9 118.0 120.3 120.7 .3 .1 1.9 .3 3.1 3.0 2.8 2.7 1994 ....................................... 121.0 121.2 123.8 124.3 .2 .2 2.1 .4 2.6 2.7 2.9 3.0
See footnotes at end of table.
77
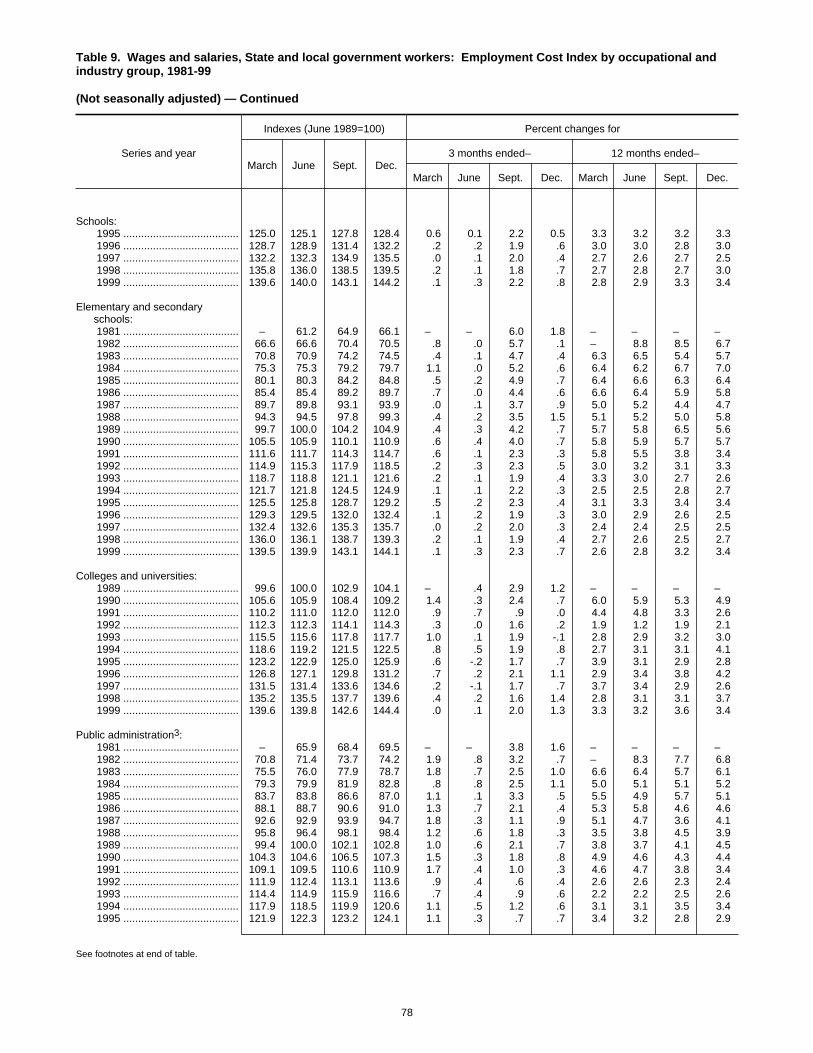
Table 9. Wages and salaries, State and local government workers: Employment Cost Index by occupational andindustry group, 1981-99
(Not seasonally adjusted) — Continued
Series and year
Indexes (June 1989=100) Percent changes for
March June Sept. Dec.3 months ended– 12 months ended–
March June Sept. Dec. March June Sept. Dec.
Schools: 1995 ....................................... 125.0 125.1 127.8 128.4 0.6 0.1 2.2 0.5 3.3 3.2 3.2 3.3 1996 ....................................... 128.7 128.9 131.4 132.2 .2 .2 1.9 .6 3.0 3.0 2.8 3.0 1997 ....................................... 132.2 132.3 134.9 135.5 .0 .1 2.0 .4 2.7 2.6 2.7 2.5 1998 ....................................... 135.8 136.0 138.5 139.5 .2 .1 1.8 .7 2.7 2.8 2.7 3.0 1999 ....................................... 139.6 140.0 143.1 144.2 .1 .3 2.2 .8 2.8 2.9 3.3 3.4
Elementary and secondaryschools:
1981 ....................................... – 61.2 64.9 66.1 – – 6.0 1.8 – – – – 1982 ....................................... 66.6 66.6 70.4 70.5 .8 .0 5.7 .1 – 8.8 8.5 6.7 1983 ....................................... 70.8 70.9 74.2 74.5 .4 .1 4.7 .4 6.3 6.5 5.4 5.7 1984 ....................................... 75.3 75.3 79.2 79.7 1.1 .0 5.2 .6 6.4 6.2 6.7 7.0 1985 ....................................... 80.1 80.3 84.2 84.8 .5 .2 4.9 .7 6.4 6.6 6.3 6.4 1986 ....................................... 85.4 85.4 89.2 89.7 .7 .0 4.4 .6 6.6 6.4 5.9 5.8 1987 ....................................... 89.7 89.8 93.1 93.9 .0 .1 3.7 .9 5.0 5.2 4.4 4.7 1988 ....................................... 94.3 94.5 97.8 99.3 .4 .2 3.5 1.5 5.1 5.2 5.0 5.8 1989 ....................................... 99.7 100.0 104.2 104.9 .4 .3 4.2 .7 5.7 5.8 6.5 5.6 1990 ....................................... 105.5 105.9 110.1 110.9 .6 .4 4.0 .7 5.8 5.9 5.7 5.7 1991 ....................................... 111.6 111.7 114.3 114.7 .6 .1 2.3 .3 5.8 5.5 3.8 3.4 1992 ....................................... 114.9 115.3 117.9 118.5 .2 .3 2.3 .5 3.0 3.2 3.1 3.3 1993 ....................................... 118.7 118.8 121.1 121.6 .2 .1 1.9 .4 3.3 3.0 2.7 2.6 1994 ....................................... 121.7 121.8 124.5 124.9 .1 .1 2.2 .3 2.5 2.5 2.8 2.7 1995 ....................................... 125.5 125.8 128.7 129.2 .5 .2 2.3 .4 3.1 3.3 3.4 3.4 1996 ....................................... 129.3 129.5 132.0 132.4 .1 .2 1.9 .3 3.0 2.9 2.6 2.5 1997 ....................................... 132.4 132.6 135.3 135.7 .0 .2 2.0 .3 2.4 2.4 2.5 2.5 1998 ....................................... 136.0 136.1 138.7 139.3 .2 .1 1.9 .4 2.7 2.6 2.5 2.7 1999 ....................................... 139.5 139.9 143.1 144.1 .1 .3 2.3 .7 2.6 2.8 3.2 3.4
Colleges and universities: 1989 ....................................... 99.6 100.0 102.9 104.1 – .4 2.9 1.2 – – – – 1990 ....................................... 105.6 105.9 108.4 109.2 1.4 .3 2.4 .7 6.0 5.9 5.3 4.9 1991 ....................................... 110.2 111.0 112.0 112.0 .9 .7 .9 .0 4.4 4.8 3.3 2.6 1992 ....................................... 112.3 112.3 114.1 114.3 .3 .0 1.6 .2 1.9 1.2 1.9 2.1 1993 ....................................... 115.5 115.6 117.8 117.7 1.0 .1 1.9 -.1 2.8 2.9 3.2 3.0 1994 ....................................... 118.6 119.2 121.5 122.5 .8 .5 1.9 .8 2.7 3.1 3.1 4.1 1995 ....................................... 123.2 122.9 125.0 125.9 .6 -.2 1.7 .7 3.9 3.1 2.9 2.8 1996 ....................................... 126.8 127.1 129.8 131.2 .7 .2 2.1 1.1 2.9 3.4 3.8 4.2 1997 ....................................... 131.5 131.4 133.6 134.6 .2 -.1 1.7 .7 3.7 3.4 2.9 2.6 1998 ....................................... 135.2 135.5 137.7 139.6 .4 .2 1.6 1.4 2.8 3.1 3.1 3.7 1999 ....................................... 139.6 139.8 142.6 144.4 .0 .1 2.0 1.3 3.3 3.2 3.6 3.4
Public administration3: 1981 ....................................... – 65.9 68.4 69.5 – – 3.8 1.6 – – – – 1982 ....................................... 70.8 71.4 73.7 74.2 1.9 .8 3.2 .7 – 8.3 7.7 6.8 1983 ....................................... 75.5 76.0 77.9 78.7 1.8 .7 2.5 1.0 6.6 6.4 5.7 6.1 1984 ....................................... 79.3 79.9 81.9 82.8 .8 .8 2.5 1.1 5.0 5.1 5.1 5.2 1985 ....................................... 83.7 83.8 86.6 87.0 1.1 .1 3.3 .5 5.5 4.9 5.7 5.1 1986 ....................................... 88.1 88.7 90.6 91.0 1.3 .7 2.1 .4 5.3 5.8 4.6 4.6 1987 ....................................... 92.6 92.9 93.9 94.7 1.8 .3 1.1 .9 5.1 4.7 3.6 4.1 1988 ....................................... 95.8 96.4 98.1 98.4 1.2 .6 1.8 .3 3.5 3.8 4.5 3.9 1989 ....................................... 99.4 100.0 102.1 102.8 1.0 .6 2.1 .7 3.8 3.7 4.1 4.5 1990 ....................................... 104.3 104.6 106.5 107.3 1.5 .3 1.8 .8 4.9 4.6 4.3 4.4 1991 ....................................... 109.1 109.5 110.6 110.9 1.7 .4 1.0 .3 4.6 4.7 3.8 3.4 1992 ....................................... 111.9 112.4 113.1 113.6 .9 .4 .6 .4 2.6 2.6 2.3 2.4 1993 ....................................... 114.4 114.9 115.9 116.6 .7 .4 .9 .6 2.2 2.2 2.5 2.6 1994 ....................................... 117.9 118.5 119.9 120.6 1.1 .5 1.2 .6 3.1 3.1 3.5 3.4 1995 ....................................... 121.9 122.3 123.2 124.1 1.1 .3 .7 .7 3.4 3.2 2.8 2.9
See footnotes at end of table.
78

Table 9. Wages and salaries, State and local government workers: Employment Cost Index by occupational andindustry group, 1981-99
(Not seasonally adjusted) — Continued
Series and year
Indexes (June 1989=100) Percent changes for
March June Sept. Dec.3 months ended– 12 months ended–
March June Sept. Dec. March June Sept. Dec.
Public administration3: 1996 ....................................... 124.9 125.3 126.6 127.7 0.6 0.3 1.0 0.9 2.5 2.5 2.8 2.9 1997 ....................................... 128.9 129.0 130.3 131.4 .9 .1 1.0 .8 3.2 3.0 2.9 2.9 1998 ....................................... 132.7 133.2 134.8 135.9 1.0 .4 1.2 .8 2.9 3.3 3.5 3.4 1999 ....................................... 136.9 137.8 139.5 141.5 .7 .7 1.2 1.4 3.2 3.5 3.5 4.1
1 Formerly called hospitals and other services.2 Average standard errors (SE) for the series exceed 0.3 percent for
3-month changes and 0.6 percent for 12-month changes for the five yearsending December 1996. All series will continue to be published until furthernotice. To assist users in ascertaining the reliability of the series, SEs for
estimates (excluding seasonally adjusted series) for 1995-1999 are availablein Appendix A.
3 Includes executive, legislative, judicial, administrative, and regulatoryactivities of State and local governments, SIC’s 91 through 96.
– Data not available.
79
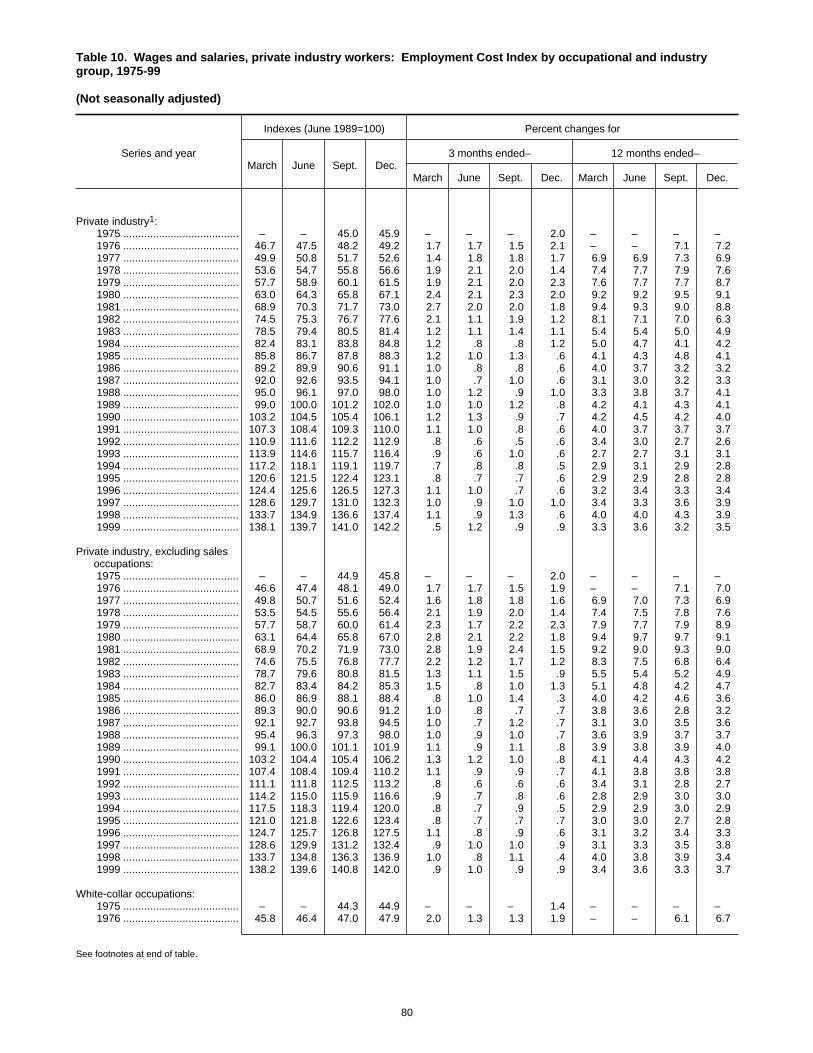
Table 10. Wages and salaries, private industry workers: Employment Cost Index by occupational and industrygroup, 1975-99
(Not seasonally adjusted)
Series and year
Indexes (June 1989=100) Percent changes for
March June Sept. Dec.3 months ended– 12 months ended–
March June Sept. Dec. March June Sept. Dec.
Private industry1: 1975 ....................................... – – 45.0 45.9 – – – 2.0 – – – – 1976 ....................................... 46.7 47.5 48.2 49.2 1.7 1.7 1.5 2.1 – – 7.1 7.2 1977 ....................................... 49.9 50.8 51.7 52.6 1.4 1.8 1.8 1.7 6.9 6.9 7.3 6.9 1978 ....................................... 53.6 54.7 55.8 56.6 1.9 2.1 2.0 1.4 7.4 7.7 7.9 7.6 1979 ....................................... 57.7 58.9 60.1 61.5 1.9 2.1 2.0 2.3 7.6 7.7 7.7 8.7 1980 ....................................... 63.0 64.3 65.8 67.1 2.4 2.1 2.3 2.0 9.2 9.2 9.5 9.1 1981 ....................................... 68.9 70.3 71.7 73.0 2.7 2.0 2.0 1.8 9.4 9.3 9.0 8.8 1982 ....................................... 74.5 75.3 76.7 77.6 2.1 1.1 1.9 1.2 8.1 7.1 7.0 6.3 1983 ....................................... 78.5 79.4 80.5 81.4 1.2 1.1 1.4 1.1 5.4 5.4 5.0 4.9 1984 ....................................... 82.4 83.1 83.8 84.8 1.2 .8 .8 1.2 5.0 4.7 4.1 4.2 1985 ....................................... 85.8 86.7 87.8 88.3 1.2 1.0 1.3 .6 4.1 4.3 4.8 4.1 1986 ....................................... 89.2 89.9 90.6 91.1 1.0 .8 .8 .6 4.0 3.7 3.2 3.2 1987 ....................................... 92.0 92.6 93.5 94.1 1.0 .7 1.0 .6 3.1 3.0 3.2 3.3 1988 ....................................... 95.0 96.1 97.0 98.0 1.0 1.2 .9 1.0 3.3 3.8 3.7 4.1 1989 ....................................... 99.0 100.0 101.2 102.0 1.0 1.0 1.2 .8 4.2 4.1 4.3 4.1 1990 ....................................... 103.2 104.5 105.4 106.1 1.2 1.3 .9 .7 4.2 4.5 4.2 4.0 1991 ....................................... 107.3 108.4 109.3 110.0 1.1 1.0 .8 .6 4.0 3.7 3.7 3.7 1992 ....................................... 110.9 111.6 112.2 112.9 .8 .6 .5 .6 3.4 3.0 2.7 2.6 1993 ....................................... 113.9 114.6 115.7 116.4 .9 .6 1.0 .6 2.7 2.7 3.1 3.1 1994 ....................................... 117.2 118.1 119.1 119.7 .7 .8 .8 .5 2.9 3.1 2.9 2.8 1995 ....................................... 120.6 121.5 122.4 123.1 .8 .7 .7 .6 2.9 2.9 2.8 2.8 1996 ....................................... 124.4 125.6 126.5 127.3 1.1 1.0 .7 .6 3.2 3.4 3.3 3.4 1997 ....................................... 128.6 129.7 131.0 132.3 1.0 .9 1.0 1.0 3.4 3.3 3.6 3.9 1998 ....................................... 133.7 134.9 136.6 137.4 1.1 .9 1.3 .6 4.0 4.0 4.3 3.9 1999 ....................................... 138.1 139.7 141.0 142.2 .5 1.2 .9 .9 3.3 3.6 3.2 3.5
Private industry, excluding salesoccupations:
1975 ....................................... – – 44.9 45.8 – – – 2.0 – – – – 1976 ....................................... 46.6 47.4 48.1 49.0 1.7 1.7 1.5 1.9 – – 7.1 7.0 1977 ....................................... 49.8 50.7 51.6 52.4 1.6 1.8 1.8 1.6 6.9 7.0 7.3 6.9 1978 ....................................... 53.5 54.5 55.6 56.4 2.1 1.9 2.0 1.4 7.4 7.5 7.8 7.6 1979 ....................................... 57.7 58.7 60.0 61.4 2.3 1.7 2.2 2.3 7.9 7.7 7.9 8.9 1980 ....................................... 63.1 64.4 65.8 67.0 2.8 2.1 2.2 1.8 9.4 9.7 9.7 9.1 1981 ....................................... 68.9 70.2 71.9 73.0 2.8 1.9 2.4 1.5 9.2 9.0 9.3 9.0 1982 ....................................... 74.6 75.5 76.8 77.7 2.2 1.2 1.7 1.2 8.3 7.5 6.8 6.4 1983 ....................................... 78.7 79.6 80.8 81.5 1.3 1.1 1.5 .9 5.5 5.4 5.2 4.9 1984 ....................................... 82.7 83.4 84.2 85.3 1.5 .8 1.0 1.3 5.1 4.8 4.2 4.7 1985 ....................................... 86.0 86.9 88.1 88.4 .8 1.0 1.4 .3 4.0 4.2 4.6 3.6 1986 ....................................... 89.3 90.0 90.6 91.2 1.0 .8 .7 .7 3.8 3.6 2.8 3.2 1987 ....................................... 92.1 92.7 93.8 94.5 1.0 .7 1.2 .7 3.1 3.0 3.5 3.6 1988 ....................................... 95.4 96.3 97.3 98.0 1.0 .9 1.0 .7 3.6 3.9 3.7 3.7 1989 ....................................... 99.1 100.0 101.1 101.9 1.1 .9 1.1 .8 3.9 3.8 3.9 4.0 1990 ....................................... 103.2 104.4 105.4 106.2 1.3 1.2 1.0 .8 4.1 4.4 4.3 4.2 1991 ....................................... 107.4 108.4 109.4 110.2 1.1 .9 .9 .7 4.1 3.8 3.8 3.8 1992 ....................................... 111.1 111.8 112.5 113.2 .8 .6 .6 .6 3.4 3.1 2.8 2.7 1993 ....................................... 114.2 115.0 115.9 116.6 .9 .7 .8 .6 2.8 2.9 3.0 3.0 1994 ....................................... 117.5 118.3 119.4 120.0 .8 .7 .9 .5 2.9 2.9 3.0 2.9 1995 ....................................... 121.0 121.8 122.6 123.4 .8 .7 .7 .7 3.0 3.0 2.7 2.8 1996 ....................................... 124.7 125.7 126.8 127.5 1.1 .8 .9 .6 3.1 3.2 3.4 3.3 1997 ....................................... 128.6 129.9 131.2 132.4 .9 1.0 1.0 .9 3.1 3.3 3.5 3.8 1998 ....................................... 133.7 134.8 136.3 136.9 1.0 .8 1.1 .4 4.0 3.8 3.9 3.4 1999 ....................................... 138.2 139.6 140.8 142.0 .9 1.0 .9 .9 3.4 3.6 3.3 3.7
White-collar occupations: 1975 ....................................... – – 44.3 44.9 – – – 1.4 – – – – 1976 ....................................... 45.8 46.4 47.0 47.9 2.0 1.3 1.3 1.9 – – 6.1 6.7
See footnotes at end of table.
80
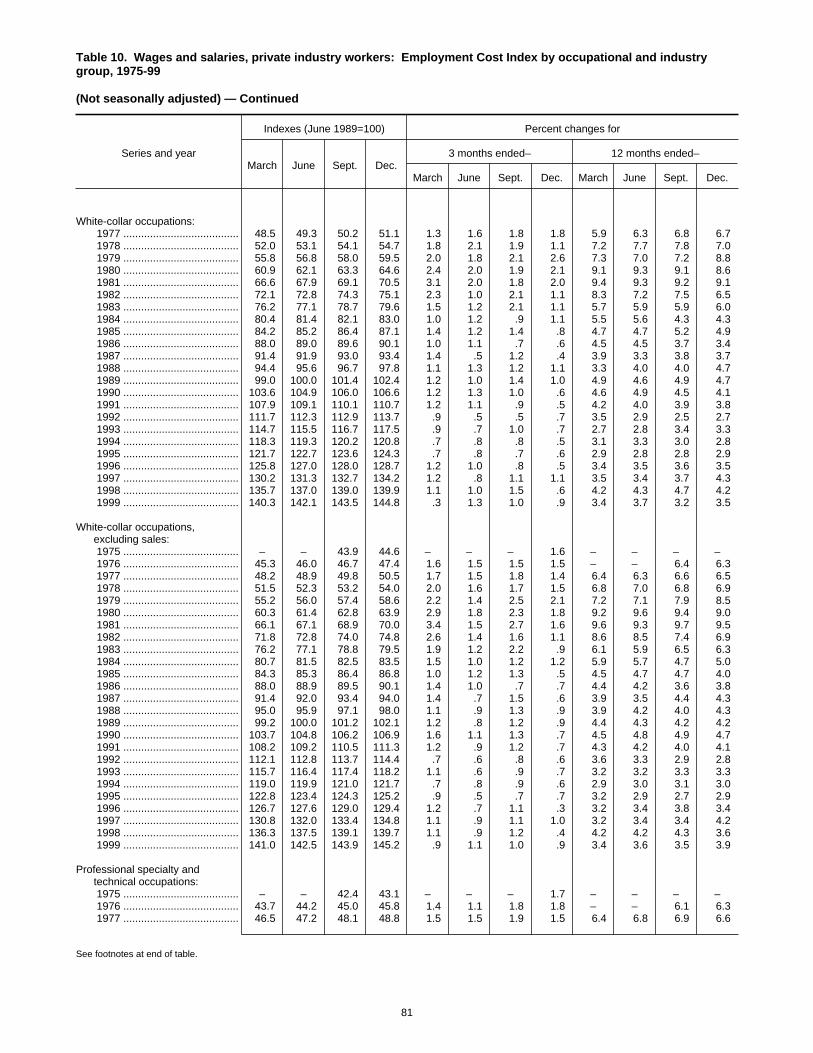
Table 10. Wages and salaries, private industry workers: Employment Cost Index by occupational and industrygroup, 1975-99
(Not seasonally adjusted) — Continued
Series and year
Indexes (June 1989=100) Percent changes for
March June Sept. Dec.3 months ended– 12 months ended–
March June Sept. Dec. March June Sept. Dec.
White-collar occupations: 1977 ....................................... 48.5 49.3 50.2 51.1 1.3 1.6 1.8 1.8 5.9 6.3 6.8 6.7 1978 ....................................... 52.0 53.1 54.1 54.7 1.8 2.1 1.9 1.1 7.2 7.7 7.8 7.0 1979 ....................................... 55.8 56.8 58.0 59.5 2.0 1.8 2.1 2.6 7.3 7.0 7.2 8.8 1980 ....................................... 60.9 62.1 63.3 64.6 2.4 2.0 1.9 2.1 9.1 9.3 9.1 8.6 1981 ....................................... 66.6 67.9 69.1 70.5 3.1 2.0 1.8 2.0 9.4 9.3 9.2 9.1 1982 ....................................... 72.1 72.8 74.3 75.1 2.3 1.0 2.1 1.1 8.3 7.2 7.5 6.5 1983 ....................................... 76.2 77.1 78.7 79.6 1.5 1.2 2.1 1.1 5.7 5.9 5.9 6.0 1984 ....................................... 80.4 81.4 82.1 83.0 1.0 1.2 .9 1.1 5.5 5.6 4.3 4.3 1985 ....................................... 84.2 85.2 86.4 87.1 1.4 1.2 1.4 .8 4.7 4.7 5.2 4.9 1986 ....................................... 88.0 89.0 89.6 90.1 1.0 1.1 .7 .6 4.5 4.5 3.7 3.4 1987 ....................................... 91.4 91.9 93.0 93.4 1.4 .5 1.2 .4 3.9 3.3 3.8 3.7 1988 ....................................... 94.4 95.6 96.7 97.8 1.1 1.3 1.2 1.1 3.3 4.0 4.0 4.7 1989 ....................................... 99.0 100.0 101.4 102.4 1.2 1.0 1.4 1.0 4.9 4.6 4.9 4.7 1990 ....................................... 103.6 104.9 106.0 106.6 1.2 1.3 1.0 .6 4.6 4.9 4.5 4.1 1991 ....................................... 107.9 109.1 110.1 110.7 1.2 1.1 .9 .5 4.2 4.0 3.9 3.8 1992 ....................................... 111.7 112.3 112.9 113.7 .9 .5 .5 .7 3.5 2.9 2.5 2.7 1993 ....................................... 114.7 115.5 116.7 117.5 .9 .7 1.0 .7 2.7 2.8 3.4 3.3 1994 ....................................... 118.3 119.3 120.2 120.8 .7 .8 .8 .5 3.1 3.3 3.0 2.8 1995 ....................................... 121.7 122.7 123.6 124.3 .7 .8 .7 .6 2.9 2.8 2.8 2.9 1996 ....................................... 125.8 127.0 128.0 128.7 1.2 1.0 .8 .5 3.4 3.5 3.6 3.5 1997 ....................................... 130.2 131.3 132.7 134.2 1.2 .8 1.1 1.1 3.5 3.4 3.7 4.3 1998 ....................................... 135.7 137.0 139.0 139.9 1.1 1.0 1.5 .6 4.2 4.3 4.7 4.2 1999 ....................................... 140.3 142.1 143.5 144.8 .3 1.3 1.0 .9 3.4 3.7 3.2 3.5
White-collar occupations,excluding sales:
1975 ....................................... – – 43.9 44.6 – – – 1.6 – – – – 1976 ....................................... 45.3 46.0 46.7 47.4 1.6 1.5 1.5 1.5 – – 6.4 6.3 1977 ....................................... 48.2 48.9 49.8 50.5 1.7 1.5 1.8 1.4 6.4 6.3 6.6 6.5 1978 ....................................... 51.5 52.3 53.2 54.0 2.0 1.6 1.7 1.5 6.8 7.0 6.8 6.9 1979 ....................................... 55.2 56.0 57.4 58.6 2.2 1.4 2.5 2.1 7.2 7.1 7.9 8.5 1980 ....................................... 60.3 61.4 62.8 63.9 2.9 1.8 2.3 1.8 9.2 9.6 9.4 9.0 1981 ....................................... 66.1 67.1 68.9 70.0 3.4 1.5 2.7 1.6 9.6 9.3 9.7 9.5 1982 ....................................... 71.8 72.8 74.0 74.8 2.6 1.4 1.6 1.1 8.6 8.5 7.4 6.9 1983 ....................................... 76.2 77.1 78.8 79.5 1.9 1.2 2.2 .9 6.1 5.9 6.5 6.3 1984 ....................................... 80.7 81.5 82.5 83.5 1.5 1.0 1.2 1.2 5.9 5.7 4.7 5.0 1985 ....................................... 84.3 85.3 86.4 86.8 1.0 1.2 1.3 .5 4.5 4.7 4.7 4.0 1986 ....................................... 88.0 88.9 89.5 90.1 1.4 1.0 .7 .7 4.4 4.2 3.6 3.8 1987 ....................................... 91.4 92.0 93.4 94.0 1.4 .7 1.5 .6 3.9 3.5 4.4 4.3 1988 ....................................... 95.0 95.9 97.1 98.0 1.1 .9 1.3 .9 3.9 4.2 4.0 4.3 1989 ....................................... 99.2 100.0 101.2 102.1 1.2 .8 1.2 .9 4.4 4.3 4.2 4.2 1990 ....................................... 103.7 104.8 106.2 106.9 1.6 1.1 1.3 .7 4.5 4.8 4.9 4.7 1991 ....................................... 108.2 109.2 110.5 111.3 1.2 .9 1.2 .7 4.3 4.2 4.0 4.1 1992 ....................................... 112.1 112.8 113.7 114.4 .7 .6 .8 .6 3.6 3.3 2.9 2.8 1993 ....................................... 115.7 116.4 117.4 118.2 1.1 .6 .9 .7 3.2 3.2 3.3 3.3 1994 ....................................... 119.0 119.9 121.0 121.7 .7 .8 .9 .6 2.9 3.0 3.1 3.0 1995 ....................................... 122.8 123.4 124.3 125.2 .9 .5 .7 .7 3.2 2.9 2.7 2.9 1996 ....................................... 126.7 127.6 129.0 129.4 1.2 .7 1.1 .3 3.2 3.4 3.8 3.4 1997 ....................................... 130.8 132.0 133.4 134.8 1.1 .9 1.1 1.0 3.2 3.4 3.4 4.2 1998 ....................................... 136.3 137.5 139.1 139.7 1.1 .9 1.2 .4 4.2 4.2 4.3 3.6 1999 ....................................... 141.0 142.5 143.9 145.2 .9 1.1 1.0 .9 3.4 3.6 3.5 3.9
Professional specialty andtechnical occupations:
1975 ....................................... – – 42.4 43.1 – – – 1.7 – – – – 1976 ....................................... 43.7 44.2 45.0 45.8 1.4 1.1 1.8 1.8 – – 6.1 6.3 1977 ....................................... 46.5 47.2 48.1 48.8 1.5 1.5 1.9 1.5 6.4 6.8 6.9 6.6
See footnotes at end of table.
81
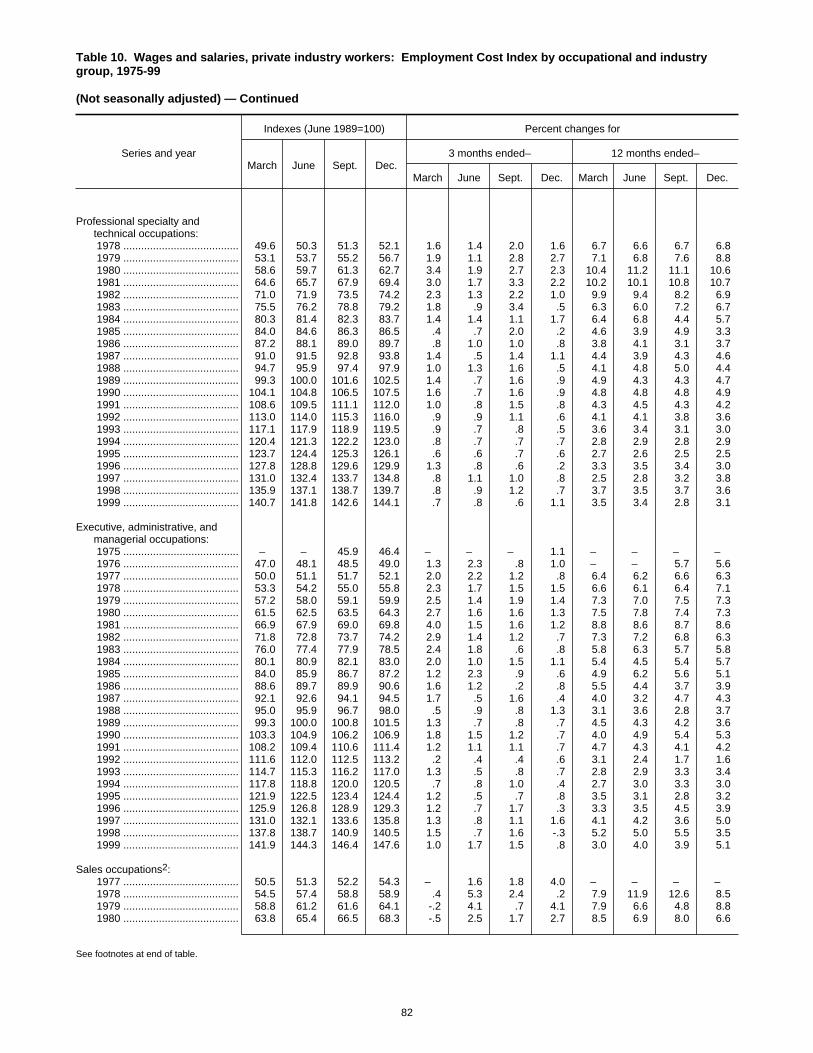
Table 10. Wages and salaries, private industry workers: Employment Cost Index by occupational and industrygroup, 1975-99
(Not seasonally adjusted) — Continued
Series and year
Indexes (June 1989=100) Percent changes for
March June Sept. Dec.3 months ended– 12 months ended–
March June Sept. Dec. March June Sept. Dec.
Professional specialty andtechnical occupations:
1978 ....................................... 49.6 50.3 51.3 52.1 1.6 1.4 2.0 1.6 6.7 6.6 6.7 6.8 1979 ....................................... 53.1 53.7 55.2 56.7 1.9 1.1 2.8 2.7 7.1 6.8 7.6 8.8 1980 ....................................... 58.6 59.7 61.3 62.7 3.4 1.9 2.7 2.3 10.4 11.2 11.1 10.6 1981 ....................................... 64.6 65.7 67.9 69.4 3.0 1.7 3.3 2.2 10.2 10.1 10.8 10.7 1982 ....................................... 71.0 71.9 73.5 74.2 2.3 1.3 2.2 1.0 9.9 9.4 8.2 6.9 1983 ....................................... 75.5 76.2 78.8 79.2 1.8 .9 3.4 .5 6.3 6.0 7.2 6.7 1984 ....................................... 80.3 81.4 82.3 83.7 1.4 1.4 1.1 1.7 6.4 6.8 4.4 5.7 1985 ....................................... 84.0 84.6 86.3 86.5 .4 .7 2.0 .2 4.6 3.9 4.9 3.3 1986 ....................................... 87.2 88.1 89.0 89.7 .8 1.0 1.0 .8 3.8 4.1 3.1 3.7 1987 ....................................... 91.0 91.5 92.8 93.8 1.4 .5 1.4 1.1 4.4 3.9 4.3 4.6 1988 ....................................... 94.7 95.9 97.4 97.9 1.0 1.3 1.6 .5 4.1 4.8 5.0 4.4 1989 ....................................... 99.3 100.0 101.6 102.5 1.4 .7 1.6 .9 4.9 4.3 4.3 4.7 1990 ....................................... 104.1 104.8 106.5 107.5 1.6 .7 1.6 .9 4.8 4.8 4.8 4.9 1991 ....................................... 108.6 109.5 111.1 112.0 1.0 .8 1.5 .8 4.3 4.5 4.3 4.2 1992 ....................................... 113.0 114.0 115.3 116.0 .9 .9 1.1 .6 4.1 4.1 3.8 3.6 1993 ....................................... 117.1 117.9 118.9 119.5 .9 .7 .8 .5 3.6 3.4 3.1 3.0 1994 ....................................... 120.4 121.3 122.2 123.0 .8 .7 .7 .7 2.8 2.9 2.8 2.9 1995 ....................................... 123.7 124.4 125.3 126.1 .6 .6 .7 .6 2.7 2.6 2.5 2.5 1996 ....................................... 127.8 128.8 129.6 129.9 1.3 .8 .6 .2 3.3 3.5 3.4 3.0 1997 ....................................... 131.0 132.4 133.7 134.8 .8 1.1 1.0 .8 2.5 2.8 3.2 3.8 1998 ....................................... 135.9 137.1 138.7 139.7 .8 .9 1.2 .7 3.7 3.5 3.7 3.6 1999 ....................................... 140.7 141.8 142.6 144.1 .7 .8 .6 1.1 3.5 3.4 2.8 3.1
Executive, administrative, andmanagerial occupations:
1975 ....................................... – – 45.9 46.4 – – – 1.1 – – – – 1976 ....................................... 47.0 48.1 48.5 49.0 1.3 2.3 .8 1.0 – – 5.7 5.6 1977 ....................................... 50.0 51.1 51.7 52.1 2.0 2.2 1.2 .8 6.4 6.2 6.6 6.3 1978 ....................................... 53.3 54.2 55.0 55.8 2.3 1.7 1.5 1.5 6.6 6.1 6.4 7.1 1979 ....................................... 57.2 58.0 59.1 59.9 2.5 1.4 1.9 1.4 7.3 7.0 7.5 7.3 1980 ....................................... 61.5 62.5 63.5 64.3 2.7 1.6 1.6 1.3 7.5 7.8 7.4 7.3 1981 ....................................... 66.9 67.9 69.0 69.8 4.0 1.5 1.6 1.2 8.8 8.6 8.7 8.6 1982 ....................................... 71.8 72.8 73.7 74.2 2.9 1.4 1.2 .7 7.3 7.2 6.8 6.3 1983 ....................................... 76.0 77.4 77.9 78.5 2.4 1.8 .6 .8 5.8 6.3 5.7 5.8 1984 ....................................... 80.1 80.9 82.1 83.0 2.0 1.0 1.5 1.1 5.4 4.5 5.4 5.7 1985 ....................................... 84.0 85.9 86.7 87.2 1.2 2.3 .9 .6 4.9 6.2 5.6 5.1 1986 ....................................... 88.6 89.7 89.9 90.6 1.6 1.2 .2 .8 5.5 4.4 3.7 3.9 1987 ....................................... 92.1 92.6 94.1 94.5 1.7 .5 1.6 .4 4.0 3.2 4.7 4.3 1988 ....................................... 95.0 95.9 96.7 98.0 .5 .9 .8 1.3 3.1 3.6 2.8 3.7 1989 ....................................... 99.3 100.0 100.8 101.5 1.3 .7 .8 .7 4.5 4.3 4.2 3.6 1990 ....................................... 103.3 104.9 106.2 106.9 1.8 1.5 1.2 .7 4.0 4.9 5.4 5.3 1991 ....................................... 108.2 109.4 110.6 111.4 1.2 1.1 1.1 .7 4.7 4.3 4.1 4.2 1992 ....................................... 111.6 112.0 112.5 113.2 .2 .4 .4 .6 3.1 2.4 1.7 1.6 1993 ....................................... 114.7 115.3 116.2 117.0 1.3 .5 .8 .7 2.8 2.9 3.3 3.4 1994 ....................................... 117.8 118.8 120.0 120.5 .7 .8 1.0 .4 2.7 3.0 3.3 3.0 1995 ....................................... 121.9 122.5 123.4 124.4 1.2 .5 .7 .8 3.5 3.1 2.8 3.2 1996 ....................................... 125.9 126.8 128.9 129.3 1.2 .7 1.7 .3 3.3 3.5 4.5 3.9 1997 ....................................... 131.0 132.1 133.6 135.8 1.3 .8 1.1 1.6 4.1 4.2 3.6 5.0 1998 ....................................... 137.8 138.7 140.9 140.5 1.5 .7 1.6 -.3 5.2 5.0 5.5 3.5 1999 ....................................... 141.9 144.3 146.4 147.6 1.0 1.7 1.5 .8 3.0 4.0 3.9 5.1
Sales occupations2: 1977 ....................................... 50.5 51.3 52.2 54.3 – 1.6 1.8 4.0 – – – – 1978 ....................................... 54.5 57.4 58.8 58.9 .4 5.3 2.4 .2 7.9 11.9 12.6 8.5 1979 ....................................... 58.8 61.2 61.6 64.1 -.2 4.1 .7 4.1 7.9 6.6 4.8 8.8 1980 ....................................... 63.8 65.4 66.5 68.3 -.5 2.5 1.7 2.7 8.5 6.9 8.0 6.6
See footnotes at end of table.
82
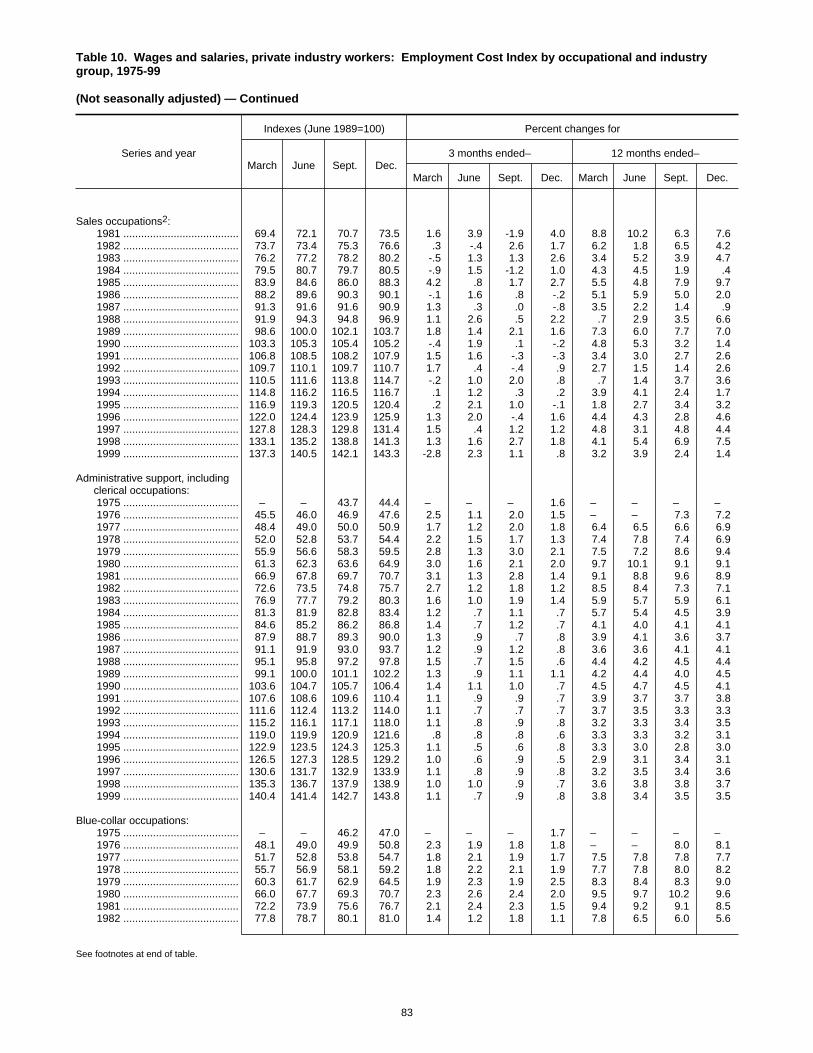
Table 10. Wages and salaries, private industry workers: Employment Cost Index by occupational and industrygroup, 1975-99
(Not seasonally adjusted) — Continued
Series and year
Indexes (June 1989=100) Percent changes for
March June Sept. Dec.3 months ended– 12 months ended–
March June Sept. Dec. March June Sept. Dec.
Sales occupations2: 1981 ....................................... 69.4 72.1 70.7 73.5 1.6 3.9 -1.9 4.0 8.8 10.2 6.3 7.6 1982 ....................................... 73.7 73.4 75.3 76.6 .3 -.4 2.6 1.7 6.2 1.8 6.5 4.2 1983 ....................................... 76.2 77.2 78.2 80.2 -.5 1.3 1.3 2.6 3.4 5.2 3.9 4.7 1984 ....................................... 79.5 80.7 79.7 80.5 -.9 1.5 -1.2 1.0 4.3 4.5 1.9 .4 1985 ....................................... 83.9 84.6 86.0 88.3 4.2 .8 1.7 2.7 5.5 4.8 7.9 9.7 1986 ....................................... 88.2 89.6 90.3 90.1 -.1 1.6 .8 -.2 5.1 5.9 5.0 2.0 1987 ....................................... 91.3 91.6 91.6 90.9 1.3 .3 .0 -.8 3.5 2.2 1.4 .9 1988 ....................................... 91.9 94.3 94.8 96.9 1.1 2.6 .5 2.2 .7 2.9 3.5 6.6 1989 ....................................... 98.6 100.0 102.1 103.7 1.8 1.4 2.1 1.6 7.3 6.0 7.7 7.0 1990 ....................................... 103.3 105.3 105.4 105.2 -.4 1.9 .1 -.2 4.8 5.3 3.2 1.4 1991 ....................................... 106.8 108.5 108.2 107.9 1.5 1.6 -.3 -.3 3.4 3.0 2.7 2.6 1992 ....................................... 109.7 110.1 109.7 110.7 1.7 .4 -.4 .9 2.7 1.5 1.4 2.6 1993 ....................................... 110.5 111.6 113.8 114.7 -.2 1.0 2.0 .8 .7 1.4 3.7 3.6 1994 ....................................... 114.8 116.2 116.5 116.7 .1 1.2 .3 .2 3.9 4.1 2.4 1.7 1995 ....................................... 116.9 119.3 120.5 120.4 .2 2.1 1.0 -.1 1.8 2.7 3.4 3.2 1996 ....................................... 122.0 124.4 123.9 125.9 1.3 2.0 -.4 1.6 4.4 4.3 2.8 4.6 1997 ....................................... 127.8 128.3 129.8 131.4 1.5 .4 1.2 1.2 4.8 3.1 4.8 4.4 1998 ....................................... 133.1 135.2 138.8 141.3 1.3 1.6 2.7 1.8 4.1 5.4 6.9 7.5 1999 ....................................... 137.3 140.5 142.1 143.3 -2.8 2.3 1.1 .8 3.2 3.9 2.4 1.4
Administrative support, includingclerical occupations:
1975 ....................................... – – 43.7 44.4 – – – 1.6 – – – – 1976 ....................................... 45.5 46.0 46.9 47.6 2.5 1.1 2.0 1.5 – – 7.3 7.2 1977 ....................................... 48.4 49.0 50.0 50.9 1.7 1.2 2.0 1.8 6.4 6.5 6.6 6.9 1978 ....................................... 52.0 52.8 53.7 54.4 2.2 1.5 1.7 1.3 7.4 7.8 7.4 6.9 1979 ....................................... 55.9 56.6 58.3 59.5 2.8 1.3 3.0 2.1 7.5 7.2 8.6 9.4 1980 ....................................... 61.3 62.3 63.6 64.9 3.0 1.6 2.1 2.0 9.7 10.1 9.1 9.1 1981 ....................................... 66.9 67.8 69.7 70.7 3.1 1.3 2.8 1.4 9.1 8.8 9.6 8.9 1982 ....................................... 72.6 73.5 74.8 75.7 2.7 1.2 1.8 1.2 8.5 8.4 7.3 7.1 1983 ....................................... 76.9 77.7 79.2 80.3 1.6 1.0 1.9 1.4 5.9 5.7 5.9 6.1 1984 ....................................... 81.3 81.9 82.8 83.4 1.2 .7 1.1 .7 5.7 5.4 4.5 3.9 1985 ....................................... 84.6 85.2 86.2 86.8 1.4 .7 1.2 .7 4.1 4.0 4.1 4.1 1986 ....................................... 87.9 88.7 89.3 90.0 1.3 .9 .7 .8 3.9 4.1 3.6 3.7 1987 ....................................... 91.1 91.9 93.0 93.7 1.2 .9 1.2 .8 3.6 3.6 4.1 4.1 1988 ....................................... 95.1 95.8 97.2 97.8 1.5 .7 1.5 .6 4.4 4.2 4.5 4.4 1989 ....................................... 99.1 100.0 101.1 102.2 1.3 .9 1.1 1.1 4.2 4.4 4.0 4.5 1990 ....................................... 103.6 104.7 105.7 106.4 1.4 1.1 1.0 .7 4.5 4.7 4.5 4.1 1991 ....................................... 107.6 108.6 109.6 110.4 1.1 .9 .9 .7 3.9 3.7 3.7 3.8 1992 ....................................... 111.6 112.4 113.2 114.0 1.1 .7 .7 .7 3.7 3.5 3.3 3.3 1993 ....................................... 115.2 116.1 117.1 118.0 1.1 .8 .9 .8 3.2 3.3 3.4 3.5 1994 ....................................... 119.0 119.9 120.9 121.6 .8 .8 .8 .6 3.3 3.3 3.2 3.1 1995 ....................................... 122.9 123.5 124.3 125.3 1.1 .5 .6 .8 3.3 3.0 2.8 3.0 1996 ....................................... 126.5 127.3 128.5 129.2 1.0 .6 .9 .5 2.9 3.1 3.4 3.1 1997 ....................................... 130.6 131.7 132.9 133.9 1.1 .8 .9 .8 3.2 3.5 3.4 3.6 1998 ....................................... 135.3 136.7 137.9 138.9 1.0 1.0 .9 .7 3.6 3.8 3.8 3.7 1999 ....................................... 140.4 141.4 142.7 143.8 1.1 .7 .9 .8 3.8 3.4 3.5 3.5
Blue-collar occupations: 1975 ....................................... – – 46.2 47.0 – – – 1.7 – – – – 1976 ....................................... 48.1 49.0 49.9 50.8 2.3 1.9 1.8 1.8 – – 8.0 8.1 1977 ....................................... 51.7 52.8 53.8 54.7 1.8 2.1 1.9 1.7 7.5 7.8 7.8 7.7 1978 ....................................... 55.7 56.9 58.1 59.2 1.8 2.2 2.1 1.9 7.7 7.8 8.0 8.2 1979 ....................................... 60.3 61.7 62.9 64.5 1.9 2.3 1.9 2.5 8.3 8.4 8.3 9.0 1980 ....................................... 66.0 67.7 69.3 70.7 2.3 2.6 2.4 2.0 9.5 9.7 10.2 9.6 1981 ....................................... 72.2 73.9 75.6 76.7 2.1 2.4 2.3 1.5 9.4 9.2 9.1 8.5 1982 ....................................... 77.8 78.7 80.1 81.0 1.4 1.2 1.8 1.1 7.8 6.5 6.0 5.6
See footnotes at end of table.
83
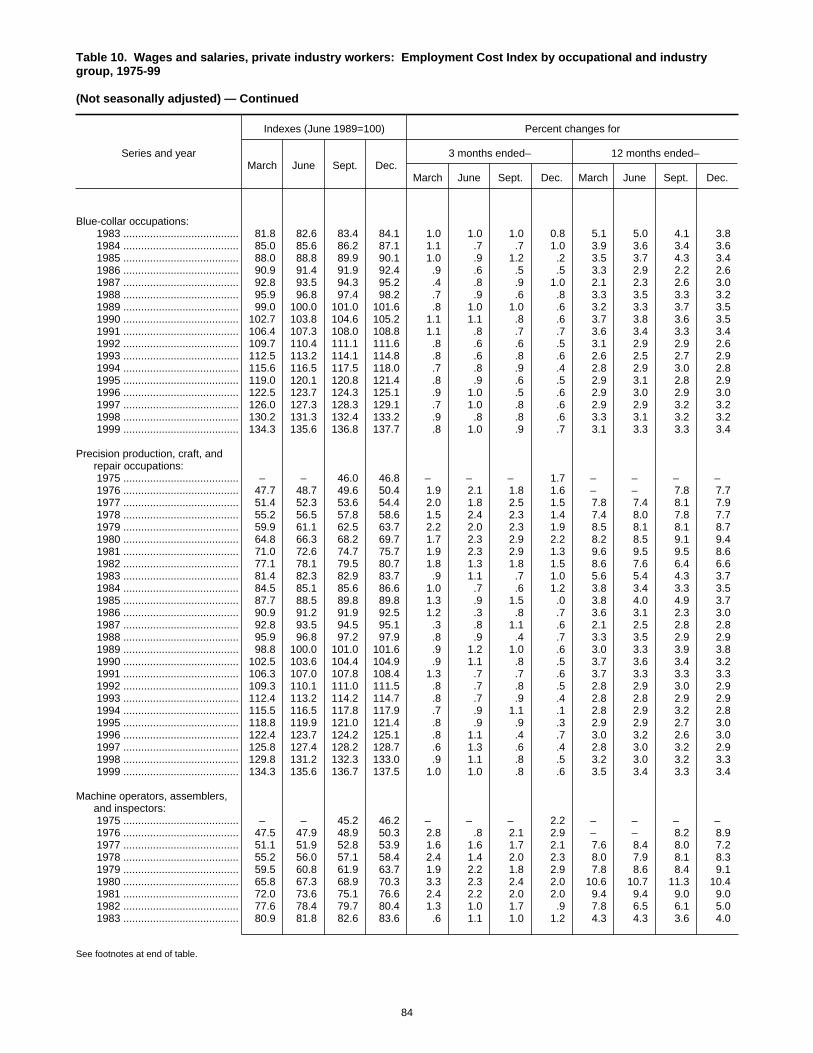
Table 10. Wages and salaries, private industry workers: Employment Cost Index by occupational and industrygroup, 1975-99
(Not seasonally adjusted) — Continued
Series and year
Indexes (June 1989=100) Percent changes for
March June Sept. Dec.3 months ended– 12 months ended–
March June Sept. Dec. March June Sept. Dec.
Blue-collar occupations: 1983 ....................................... 81.8 82.6 83.4 84.1 1.0 1.0 1.0 0.8 5.1 5.0 4.1 3.8 1984 ....................................... 85.0 85.6 86.2 87.1 1.1 .7 .7 1.0 3.9 3.6 3.4 3.6 1985 ....................................... 88.0 88.8 89.9 90.1 1.0 .9 1.2 .2 3.5 3.7 4.3 3.4 1986 ....................................... 90.9 91.4 91.9 92.4 .9 .6 .5 .5 3.3 2.9 2.2 2.6 1987 ....................................... 92.8 93.5 94.3 95.2 .4 .8 .9 1.0 2.1 2.3 2.6 3.0 1988 ....................................... 95.9 96.8 97.4 98.2 .7 .9 .6 .8 3.3 3.5 3.3 3.2 1989 ....................................... 99.0 100.0 101.0 101.6 .8 1.0 1.0 .6 3.2 3.3 3.7 3.5 1990 ....................................... 102.7 103.8 104.6 105.2 1.1 1.1 .8 .6 3.7 3.8 3.6 3.5 1991 ....................................... 106.4 107.3 108.0 108.8 1.1 .8 .7 .7 3.6 3.4 3.3 3.4 1992 ....................................... 109.7 110.4 111.1 111.6 .8 .6 .6 .5 3.1 2.9 2.9 2.6 1993 ....................................... 112.5 113.2 114.1 114.8 .8 .6 .8 .6 2.6 2.5 2.7 2.9 1994 ....................................... 115.6 116.5 117.5 118.0 .7 .8 .9 .4 2.8 2.9 3.0 2.8 1995 ....................................... 119.0 120.1 120.8 121.4 .8 .9 .6 .5 2.9 3.1 2.8 2.9 1996 ....................................... 122.5 123.7 124.3 125.1 .9 1.0 .5 .6 2.9 3.0 2.9 3.0 1997 ....................................... 126.0 127.3 128.3 129.1 .7 1.0 .8 .6 2.9 2.9 3.2 3.2 1998 ....................................... 130.2 131.3 132.4 133.2 .9 .8 .8 .6 3.3 3.1 3.2 3.2 1999 ....................................... 134.3 135.6 136.8 137.7 .8 1.0 .9 .7 3.1 3.3 3.3 3.4
Precision production, craft, andrepair occupations:
1975 ....................................... – – 46.0 46.8 – – – 1.7 – – – – 1976 ....................................... 47.7 48.7 49.6 50.4 1.9 2.1 1.8 1.6 – – 7.8 7.7 1977 ....................................... 51.4 52.3 53.6 54.4 2.0 1.8 2.5 1.5 7.8 7.4 8.1 7.9 1978 ....................................... 55.2 56.5 57.8 58.6 1.5 2.4 2.3 1.4 7.4 8.0 7.8 7.7 1979 ....................................... 59.9 61.1 62.5 63.7 2.2 2.0 2.3 1.9 8.5 8.1 8.1 8.7 1980 ....................................... 64.8 66.3 68.2 69.7 1.7 2.3 2.9 2.2 8.2 8.5 9.1 9.4 1981 ....................................... 71.0 72.6 74.7 75.7 1.9 2.3 2.9 1.3 9.6 9.5 9.5 8.6 1982 ....................................... 77.1 78.1 79.5 80.7 1.8 1.3 1.8 1.5 8.6 7.6 6.4 6.6 1983 ....................................... 81.4 82.3 82.9 83.7 .9 1.1 .7 1.0 5.6 5.4 4.3 3.7 1984 ....................................... 84.5 85.1 85.6 86.6 1.0 .7 .6 1.2 3.8 3.4 3.3 3.5 1985 ....................................... 87.7 88.5 89.8 89.8 1.3 .9 1.5 .0 3.8 4.0 4.9 3.7 1986 ....................................... 90.9 91.2 91.9 92.5 1.2 .3 .8 .7 3.6 3.1 2.3 3.0 1987 ....................................... 92.8 93.5 94.5 95.1 .3 .8 1.1 .6 2.1 2.5 2.8 2.8 1988 ....................................... 95.9 96.8 97.2 97.9 .8 .9 .4 .7 3.3 3.5 2.9 2.9 1989 ....................................... 98.8 100.0 101.0 101.6 .9 1.2 1.0 .6 3.0 3.3 3.9 3.8 1990 ....................................... 102.5 103.6 104.4 104.9 .9 1.1 .8 .5 3.7 3.6 3.4 3.2 1991 ....................................... 106.3 107.0 107.8 108.4 1.3 .7 .7 .6 3.7 3.3 3.3 3.3 1992 ....................................... 109.3 110.1 111.0 111.5 .8 .7 .8 .5 2.8 2.9 3.0 2.9 1993 ....................................... 112.4 113.2 114.2 114.7 .8 .7 .9 .4 2.8 2.8 2.9 2.9 1994 ....................................... 115.5 116.5 117.8 117.9 .7 .9 1.1 .1 2.8 2.9 3.2 2.8 1995 ....................................... 118.8 119.9 121.0 121.4 .8 .9 .9 .3 2.9 2.9 2.7 3.0 1996 ....................................... 122.4 123.7 124.2 125.1 .8 1.1 .4 .7 3.0 3.2 2.6 3.0 1997 ....................................... 125.8 127.4 128.2 128.7 .6 1.3 .6 .4 2.8 3.0 3.2 2.9 1998 ....................................... 129.8 131.2 132.3 133.0 .9 1.1 .8 .5 3.2 3.0 3.2 3.3 1999 ....................................... 134.3 135.6 136.7 137.5 1.0 1.0 .8 .6 3.5 3.4 3.3 3.4
Machine operators, assemblers,and inspectors:
1975 ....................................... – – 45.2 46.2 – – – 2.2 – – – – 1976 ....................................... 47.5 47.9 48.9 50.3 2.8 .8 2.1 2.9 – – 8.2 8.9 1977 ....................................... 51.1 51.9 52.8 53.9 1.6 1.6 1.7 2.1 7.6 8.4 8.0 7.2 1978 ....................................... 55.2 56.0 57.1 58.4 2.4 1.4 2.0 2.3 8.0 7.9 8.1 8.3 1979 ....................................... 59.5 60.8 61.9 63.7 1.9 2.2 1.8 2.9 7.8 8.6 8.4 9.1 1980 ....................................... 65.8 67.3 68.9 70.3 3.3 2.3 2.4 2.0 10.6 10.7 11.3 10.4 1981 ....................................... 72.0 73.6 75.1 76.6 2.4 2.2 2.0 2.0 9.4 9.4 9.0 9.0 1982 ....................................... 77.6 78.4 79.7 80.4 1.3 1.0 1.7 .9 7.8 6.5 6.1 5.0 1983 ....................................... 80.9 81.8 82.6 83.6 .6 1.1 1.0 1.2 4.3 4.3 3.6 4.0
See footnotes at end of table.
84
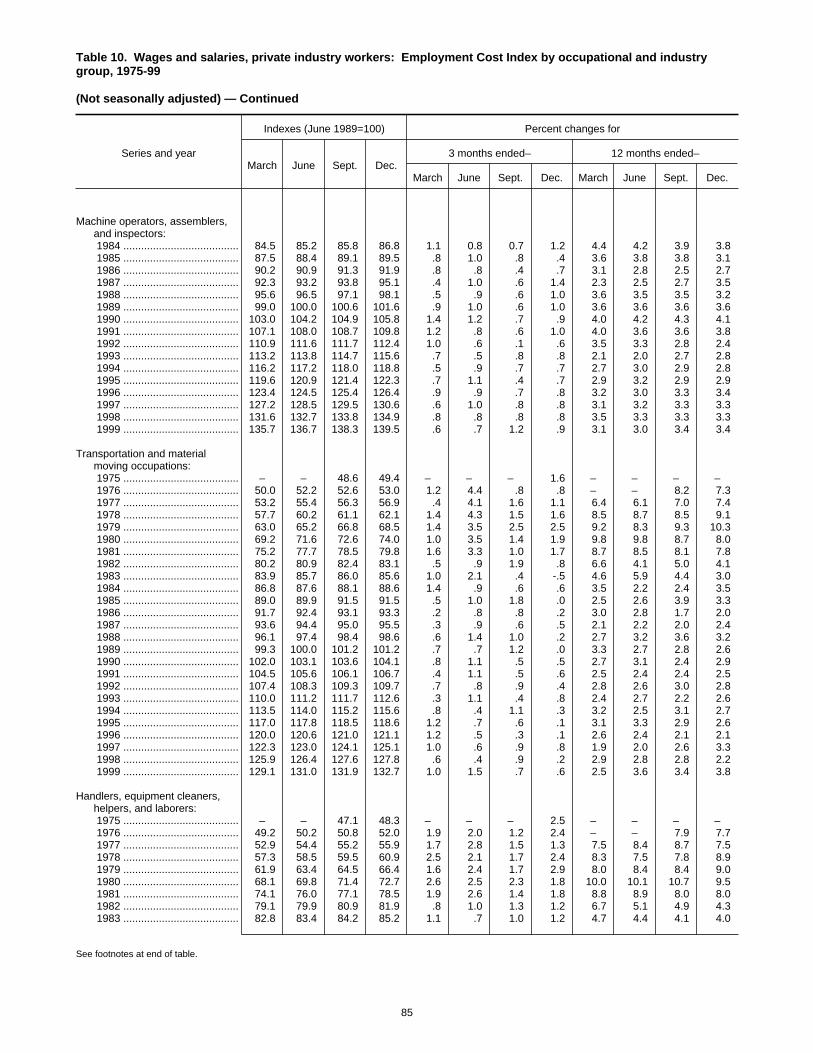
Table 10. Wages and salaries, private industry workers: Employment Cost Index by occupational and industrygroup, 1975-99
(Not seasonally adjusted) — Continued
Series and year
Indexes (June 1989=100) Percent changes for
March June Sept. Dec.3 months ended– 12 months ended–
March June Sept. Dec. March June Sept. Dec.
Machine operators, assemblers,and inspectors:
1984 ....................................... 84.5 85.2 85.8 86.8 1.1 0.8 0.7 1.2 4.4 4.2 3.9 3.8 1985 ....................................... 87.5 88.4 89.1 89.5 .8 1.0 .8 .4 3.6 3.8 3.8 3.1 1986 ....................................... 90.2 90.9 91.3 91.9 .8 .8 .4 .7 3.1 2.8 2.5 2.7 1987 ....................................... 92.3 93.2 93.8 95.1 .4 1.0 .6 1.4 2.3 2.5 2.7 3.5 1988 ....................................... 95.6 96.5 97.1 98.1 .5 .9 .6 1.0 3.6 3.5 3.5 3.2 1989 ....................................... 99.0 100.0 100.6 101.6 .9 1.0 .6 1.0 3.6 3.6 3.6 3.6 1990 ....................................... 103.0 104.2 104.9 105.8 1.4 1.2 .7 .9 4.0 4.2 4.3 4.1 1991 ....................................... 107.1 108.0 108.7 109.8 1.2 .8 .6 1.0 4.0 3.6 3.6 3.8 1992 ....................................... 110.9 111.6 111.7 112.4 1.0 .6 .1 .6 3.5 3.3 2.8 2.4 1993 ....................................... 113.2 113.8 114.7 115.6 .7 .5 .8 .8 2.1 2.0 2.7 2.8 1994 ....................................... 116.2 117.2 118.0 118.8 .5 .9 .7 .7 2.7 3.0 2.9 2.8 1995 ....................................... 119.6 120.9 121.4 122.3 .7 1.1 .4 .7 2.9 3.2 2.9 2.9 1996 ....................................... 123.4 124.5 125.4 126.4 .9 .9 .7 .8 3.2 3.0 3.3 3.4 1997 ....................................... 127.2 128.5 129.5 130.6 .6 1.0 .8 .8 3.1 3.2 3.3 3.3 1998 ....................................... 131.6 132.7 133.8 134.9 .8 .8 .8 .8 3.5 3.3 3.3 3.3 1999 ....................................... 135.7 136.7 138.3 139.5 .6 .7 1.2 .9 3.1 3.0 3.4 3.4
Transportation and materialmoving occupations:
1975 ....................................... – – 48.6 49.4 – – – 1.6 – – – – 1976 ....................................... 50.0 52.2 52.6 53.0 1.2 4.4 .8 .8 – – 8.2 7.3 1977 ....................................... 53.2 55.4 56.3 56.9 .4 4.1 1.6 1.1 6.4 6.1 7.0 7.4 1978 ....................................... 57.7 60.2 61.1 62.1 1.4 4.3 1.5 1.6 8.5 8.7 8.5 9.1 1979 ....................................... 63.0 65.2 66.8 68.5 1.4 3.5 2.5 2.5 9.2 8.3 9.3 10.3 1980 ....................................... 69.2 71.6 72.6 74.0 1.0 3.5 1.4 1.9 9.8 9.8 8.7 8.0 1981 ....................................... 75.2 77.7 78.5 79.8 1.6 3.3 1.0 1.7 8.7 8.5 8.1 7.8 1982 ....................................... 80.2 80.9 82.4 83.1 .5 .9 1.9 .8 6.6 4.1 5.0 4.1 1983 ....................................... 83.9 85.7 86.0 85.6 1.0 2.1 .4 -.5 4.6 5.9 4.4 3.0 1984 ....................................... 86.8 87.6 88.1 88.6 1.4 .9 .6 .6 3.5 2.2 2.4 3.5 1985 ....................................... 89.0 89.9 91.5 91.5 .5 1.0 1.8 .0 2.5 2.6 3.9 3.3 1986 ....................................... 91.7 92.4 93.1 93.3 .2 .8 .8 .2 3.0 2.8 1.7 2.0 1987 ....................................... 93.6 94.4 95.0 95.5 .3 .9 .6 .5 2.1 2.2 2.0 2.4 1988 ....................................... 96.1 97.4 98.4 98.6 .6 1.4 1.0 .2 2.7 3.2 3.6 3.2 1989 ....................................... 99.3 100.0 101.2 101.2 .7 .7 1.2 .0 3.3 2.7 2.8 2.6 1990 ....................................... 102.0 103.1 103.6 104.1 .8 1.1 .5 .5 2.7 3.1 2.4 2.9 1991 ....................................... 104.5 105.6 106.1 106.7 .4 1.1 .5 .6 2.5 2.4 2.4 2.5 1992 ....................................... 107.4 108.3 109.3 109.7 .7 .8 .9 .4 2.8 2.6 3.0 2.8 1993 ....................................... 110.0 111.2 111.7 112.6 .3 1.1 .4 .8 2.4 2.7 2.2 2.6 1994 ....................................... 113.5 114.0 115.2 115.6 .8 .4 1.1 .3 3.2 2.5 3.1 2.7 1995 ....................................... 117.0 117.8 118.5 118.6 1.2 .7 .6 .1 3.1 3.3 2.9 2.6 1996 ....................................... 120.0 120.6 121.0 121.1 1.2 .5 .3 .1 2.6 2.4 2.1 2.1 1997 ....................................... 122.3 123.0 124.1 125.1 1.0 .6 .9 .8 1.9 2.0 2.6 3.3 1998 ....................................... 125.9 126.4 127.6 127.8 .6 .4 .9 .2 2.9 2.8 2.8 2.2 1999 ....................................... 129.1 131.0 131.9 132.7 1.0 1.5 .7 .6 2.5 3.6 3.4 3.8
Handlers, equipment cleaners,helpers, and laborers:
1975 ....................................... – – 47.1 48.3 – – – 2.5 – – – – 1976 ....................................... 49.2 50.2 50.8 52.0 1.9 2.0 1.2 2.4 – – 7.9 7.7 1977 ....................................... 52.9 54.4 55.2 55.9 1.7 2.8 1.5 1.3 7.5 8.4 8.7 7.5 1978 ....................................... 57.3 58.5 59.5 60.9 2.5 2.1 1.7 2.4 8.3 7.5 7.8 8.9 1979 ....................................... 61.9 63.4 64.5 66.4 1.6 2.4 1.7 2.9 8.0 8.4 8.4 9.0 1980 ....................................... 68.1 69.8 71.4 72.7 2.6 2.5 2.3 1.8 10.0 10.1 10.7 9.5 1981 ....................................... 74.1 76.0 77.1 78.5 1.9 2.6 1.4 1.8 8.8 8.9 8.0 8.0 1982 ....................................... 79.1 79.9 80.9 81.9 .8 1.0 1.3 1.2 6.7 5.1 4.9 4.3 1983 ....................................... 82.8 83.4 84.2 85.2 1.1 .7 1.0 1.2 4.7 4.4 4.1 4.0
See footnotes at end of table.
85
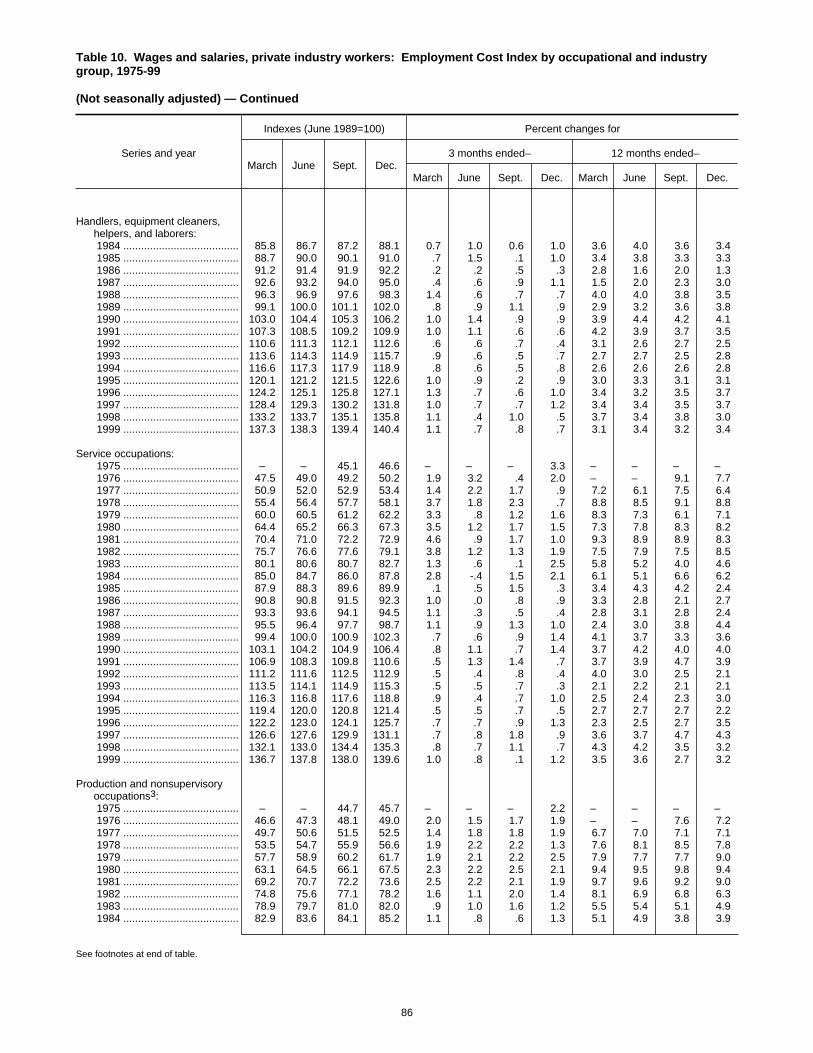
Table 10. Wages and salaries, private industry workers: Employment Cost Index by occupational and industrygroup, 1975-99
(Not seasonally adjusted) — Continued
Series and year
Indexes (June 1989=100) Percent changes for
March June Sept. Dec.3 months ended– 12 months ended–
March June Sept. Dec. March June Sept. Dec.
Handlers, equipment cleaners,helpers, and laborers:
1984 ....................................... 85.8 86.7 87.2 88.1 0.7 1.0 0.6 1.0 3.6 4.0 3.6 3.4 1985 ....................................... 88.7 90.0 90.1 91.0 .7 1.5 .1 1.0 3.4 3.8 3.3 3.3 1986 ....................................... 91.2 91.4 91.9 92.2 .2 .2 .5 .3 2.8 1.6 2.0 1.3 1987 ....................................... 92.6 93.2 94.0 95.0 .4 .6 .9 1.1 1.5 2.0 2.3 3.0 1988 ....................................... 96.3 96.9 97.6 98.3 1.4 .6 .7 .7 4.0 4.0 3.8 3.5 1989 ....................................... 99.1 100.0 101.1 102.0 .8 .9 1.1 .9 2.9 3.2 3.6 3.8 1990 ....................................... 103.0 104.4 105.3 106.2 1.0 1.4 .9 .9 3.9 4.4 4.2 4.1 1991 ....................................... 107.3 108.5 109.2 109.9 1.0 1.1 .6 .6 4.2 3.9 3.7 3.5 1992 ....................................... 110.6 111.3 112.1 112.6 .6 .6 .7 .4 3.1 2.6 2.7 2.5 1993 ....................................... 113.6 114.3 114.9 115.7 .9 .6 .5 .7 2.7 2.7 2.5 2.8 1994 ....................................... 116.6 117.3 117.9 118.9 .8 .6 .5 .8 2.6 2.6 2.6 2.8 1995 ....................................... 120.1 121.2 121.5 122.6 1.0 .9 .2 .9 3.0 3.3 3.1 3.1 1996 ....................................... 124.2 125.1 125.8 127.1 1.3 .7 .6 1.0 3.4 3.2 3.5 3.7 1997 ....................................... 128.4 129.3 130.2 131.8 1.0 .7 .7 1.2 3.4 3.4 3.5 3.7 1998 ....................................... 133.2 133.7 135.1 135.8 1.1 .4 1.0 .5 3.7 3.4 3.8 3.0 1999 ....................................... 137.3 138.3 139.4 140.4 1.1 .7 .8 .7 3.1 3.4 3.2 3.4
Service occupations: 1975 ....................................... – – 45.1 46.6 – – – 3.3 – – – – 1976 ....................................... 47.5 49.0 49.2 50.2 1.9 3.2 .4 2.0 – – 9.1 7.7 1977 ....................................... 50.9 52.0 52.9 53.4 1.4 2.2 1.7 .9 7.2 6.1 7.5 6.4 1978 ....................................... 55.4 56.4 57.7 58.1 3.7 1.8 2.3 .7 8.8 8.5 9.1 8.8 1979 ....................................... 60.0 60.5 61.2 62.2 3.3 .8 1.2 1.6 8.3 7.3 6.1 7.1 1980 ....................................... 64.4 65.2 66.3 67.3 3.5 1.2 1.7 1.5 7.3 7.8 8.3 8.2 1981 ....................................... 70.4 71.0 72.2 72.9 4.6 .9 1.7 1.0 9.3 8.9 8.9 8.3 1982 ....................................... 75.7 76.6 77.6 79.1 3.8 1.2 1.3 1.9 7.5 7.9 7.5 8.5 1983 ....................................... 80.1 80.6 80.7 82.7 1.3 .6 .1 2.5 5.8 5.2 4.0 4.6 1984 ....................................... 85.0 84.7 86.0 87.8 2.8 -.4 1.5 2.1 6.1 5.1 6.6 6.2 1985 ....................................... 87.9 88.3 89.6 89.9 .1 .5 1.5 .3 3.4 4.3 4.2 2.4 1986 ....................................... 90.8 90.8 91.5 92.3 1.0 .0 .8 .9 3.3 2.8 2.1 2.7 1987 ....................................... 93.3 93.6 94.1 94.5 1.1 .3 .5 .4 2.8 3.1 2.8 2.4 1988 ....................................... 95.5 96.4 97.7 98.7 1.1 .9 1.3 1.0 2.4 3.0 3.8 4.4 1989 ....................................... 99.4 100.0 100.9 102.3 .7 .6 .9 1.4 4.1 3.7 3.3 3.6 1990 ....................................... 103.1 104.2 104.9 106.4 .8 1.1 .7 1.4 3.7 4.2 4.0 4.0 1991 ....................................... 106.9 108.3 109.8 110.6 .5 1.3 1.4 .7 3.7 3.9 4.7 3.9 1992 ....................................... 111.2 111.6 112.5 112.9 .5 .4 .8 .4 4.0 3.0 2.5 2.1 1993 ....................................... 113.5 114.1 114.9 115.3 .5 .5 .7 .3 2.1 2.2 2.1 2.1 1994 ....................................... 116.3 116.8 117.6 118.8 .9 .4 .7 1.0 2.5 2.4 2.3 3.0 1995 ....................................... 119.4 120.0 120.8 121.4 .5 .5 .7 .5 2.7 2.7 2.7 2.2 1996 ....................................... 122.2 123.0 124.1 125.7 .7 .7 .9 1.3 2.3 2.5 2.7 3.5 1997 ....................................... 126.6 127.6 129.9 131.1 .7 .8 1.8 .9 3.6 3.7 4.7 4.3 1998 ....................................... 132.1 133.0 134.4 135.3 .8 .7 1.1 .7 4.3 4.2 3.5 3.2 1999 ....................................... 136.7 137.8 138.0 139.6 1.0 .8 .1 1.2 3.5 3.6 2.7 3.2
Production and nonsupervisoryoccupations3:
1975 ....................................... – – 44.7 45.7 – – – 2.2 – – – – 1976 ....................................... 46.6 47.3 48.1 49.0 2.0 1.5 1.7 1.9 – – 7.6 7.2 1977 ....................................... 49.7 50.6 51.5 52.5 1.4 1.8 1.8 1.9 6.7 7.0 7.1 7.1 1978 ....................................... 53.5 54.7 55.9 56.6 1.9 2.2 2.2 1.3 7.6 8.1 8.5 7.8 1979 ....................................... 57.7 58.9 60.2 61.7 1.9 2.1 2.2 2.5 7.9 7.7 7.7 9.0 1980 ....................................... 63.1 64.5 66.1 67.5 2.3 2.2 2.5 2.1 9.4 9.5 9.8 9.4 1981 ....................................... 69.2 70.7 72.2 73.6 2.5 2.2 2.1 1.9 9.7 9.6 9.2 9.0 1982 ....................................... 74.8 75.6 77.1 78.2 1.6 1.1 2.0 1.4 8.1 6.9 6.8 6.3 1983 ....................................... 78.9 79.7 81.0 82.0 .9 1.0 1.6 1.2 5.5 5.4 5.1 4.9 1984 ....................................... 82.9 83.6 84.1 85.2 1.1 .8 .6 1.3 5.1 4.9 3.8 3.9
See footnotes at end of table.
86
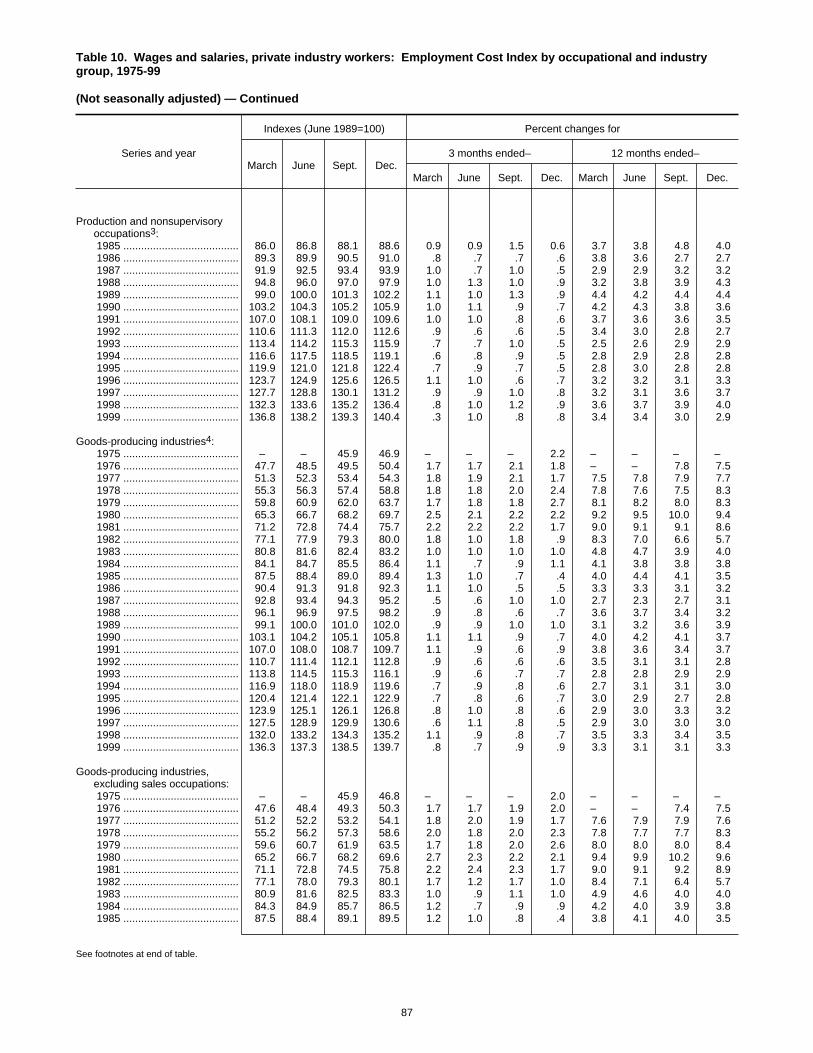
Table 10. Wages and salaries, private industry workers: Employment Cost Index by occupational and industrygroup, 1975-99
(Not seasonally adjusted) — Continued
Series and year
Indexes (June 1989=100) Percent changes for
March June Sept. Dec.3 months ended– 12 months ended–
March June Sept. Dec. March June Sept. Dec.
Production and nonsupervisoryoccupations3:
1985 ....................................... 86.0 86.8 88.1 88.6 0.9 0.9 1.5 0.6 3.7 3.8 4.8 4.0 1986 ....................................... 89.3 89.9 90.5 91.0 .8 .7 .7 .6 3.8 3.6 2.7 2.7 1987 ....................................... 91.9 92.5 93.4 93.9 1.0 .7 1.0 .5 2.9 2.9 3.2 3.2 1988 ....................................... 94.8 96.0 97.0 97.9 1.0 1.3 1.0 .9 3.2 3.8 3.9 4.3 1989 ....................................... 99.0 100.0 101.3 102.2 1.1 1.0 1.3 .9 4.4 4.2 4.4 4.4 1990 ....................................... 103.2 104.3 105.2 105.9 1.0 1.1 .9 .7 4.2 4.3 3.8 3.6 1991 ....................................... 107.0 108.1 109.0 109.6 1.0 1.0 .8 .6 3.7 3.6 3.6 3.5 1992 ....................................... 110.6 111.3 112.0 112.6 .9 .6 .6 .5 3.4 3.0 2.8 2.7 1993 ....................................... 113.4 114.2 115.3 115.9 .7 .7 1.0 .5 2.5 2.6 2.9 2.9 1994 ....................................... 116.6 117.5 118.5 119.1 .6 .8 .9 .5 2.8 2.9 2.8 2.8 1995 ....................................... 119.9 121.0 121.8 122.4 .7 .9 .7 .5 2.8 3.0 2.8 2.8 1996 ....................................... 123.7 124.9 125.6 126.5 1.1 1.0 .6 .7 3.2 3.2 3.1 3.3 1997 ....................................... 127.7 128.8 130.1 131.2 .9 .9 1.0 .8 3.2 3.1 3.6 3.7 1998 ....................................... 132.3 133.6 135.2 136.4 .8 1.0 1.2 .9 3.6 3.7 3.9 4.0 1999 ....................................... 136.8 138.2 139.3 140.4 .3 1.0 .8 .8 3.4 3.4 3.0 2.9
Goods-producing industries4: 1975 ....................................... – – 45.9 46.9 – – – 2.2 – – – – 1976 ....................................... 47.7 48.5 49.5 50.4 1.7 1.7 2.1 1.8 – – 7.8 7.5 1977 ....................................... 51.3 52.3 53.4 54.3 1.8 1.9 2.1 1.7 7.5 7.8 7.9 7.7 1978 ....................................... 55.3 56.3 57.4 58.8 1.8 1.8 2.0 2.4 7.8 7.6 7.5 8.3 1979 ....................................... 59.8 60.9 62.0 63.7 1.7 1.8 1.8 2.7 8.1 8.2 8.0 8.3 1980 ....................................... 65.3 66.7 68.2 69.7 2.5 2.1 2.2 2.2 9.2 9.5 10.0 9.4 1981 ....................................... 71.2 72.8 74.4 75.7 2.2 2.2 2.2 1.7 9.0 9.1 9.1 8.6 1982 ....................................... 77.1 77.9 79.3 80.0 1.8 1.0 1.8 .9 8.3 7.0 6.6 5.7 1983 ....................................... 80.8 81.6 82.4 83.2 1.0 1.0 1.0 1.0 4.8 4.7 3.9 4.0 1984 ....................................... 84.1 84.7 85.5 86.4 1.1 .7 .9 1.1 4.1 3.8 3.8 3.8 1985 ....................................... 87.5 88.4 89.0 89.4 1.3 1.0 .7 .4 4.0 4.4 4.1 3.5 1986 ....................................... 90.4 91.3 91.8 92.3 1.1 1.0 .5 .5 3.3 3.3 3.1 3.2 1987 ....................................... 92.8 93.4 94.3 95.2 .5 .6 1.0 1.0 2.7 2.3 2.7 3.1 1988 ....................................... 96.1 96.9 97.5 98.2 .9 .8 .6 .7 3.6 3.7 3.4 3.2 1989 ....................................... 99.1 100.0 101.0 102.0 .9 .9 1.0 1.0 3.1 3.2 3.6 3.9 1990 ....................................... 103.1 104.2 105.1 105.8 1.1 1.1 .9 .7 4.0 4.2 4.1 3.7 1991 ....................................... 107.0 108.0 108.7 109.7 1.1 .9 .6 .9 3.8 3.6 3.4 3.7 1992 ....................................... 110.7 111.4 112.1 112.8 .9 .6 .6 .6 3.5 3.1 3.1 2.8 1993 ....................................... 113.8 114.5 115.3 116.1 .9 .6 .7 .7 2.8 2.8 2.9 2.9 1994 ....................................... 116.9 118.0 118.9 119.6 .7 .9 .8 .6 2.7 3.1 3.1 3.0 1995 ....................................... 120.4 121.4 122.1 122.9 .7 .8 .6 .7 3.0 2.9 2.7 2.8 1996 ....................................... 123.9 125.1 126.1 126.8 .8 1.0 .8 .6 2.9 3.0 3.3 3.2 1997 ....................................... 127.5 128.9 129.9 130.6 .6 1.1 .8 .5 2.9 3.0 3.0 3.0 1998 ....................................... 132.0 133.2 134.3 135.2 1.1 .9 .8 .7 3.5 3.3 3.4 3.5 1999 ....................................... 136.3 137.3 138.5 139.7 .8 .7 .9 .9 3.3 3.1 3.1 3.3
Goods-producing industries,excluding sales occupations:
1975 ....................................... – – 45.9 46.8 – – – 2.0 – – – – 1976 ....................................... 47.6 48.4 49.3 50.3 1.7 1.7 1.9 2.0 – – 7.4 7.5 1977 ....................................... 51.2 52.2 53.2 54.1 1.8 2.0 1.9 1.7 7.6 7.9 7.9 7.6 1978 ....................................... 55.2 56.2 57.3 58.6 2.0 1.8 2.0 2.3 7.8 7.7 7.7 8.3 1979 ....................................... 59.6 60.7 61.9 63.5 1.7 1.8 2.0 2.6 8.0 8.0 8.0 8.4 1980 ....................................... 65.2 66.7 68.2 69.6 2.7 2.3 2.2 2.1 9.4 9.9 10.2 9.6 1981 ....................................... 71.1 72.8 74.5 75.8 2.2 2.4 2.3 1.7 9.0 9.1 9.2 8.9 1982 ....................................... 77.1 78.0 79.3 80.1 1.7 1.2 1.7 1.0 8.4 7.1 6.4 5.7 1983 ....................................... 80.9 81.6 82.5 83.3 1.0 .9 1.1 1.0 4.9 4.6 4.0 4.0 1984 ....................................... 84.3 84.9 85.7 86.5 1.2 .7 .9 .9 4.2 4.0 3.9 3.8 1985 ....................................... 87.5 88.4 89.1 89.5 1.2 1.0 .8 .4 3.8 4.1 4.0 3.5
See footnotes at end of table.
87
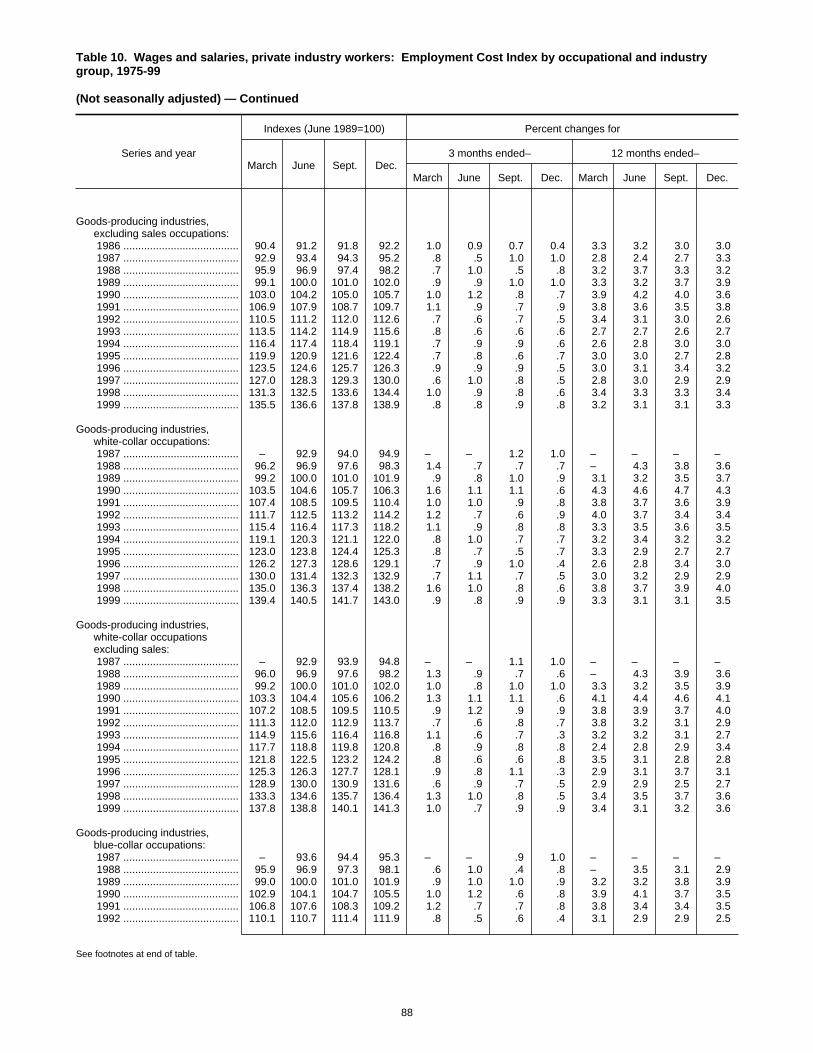
Table 10. Wages and salaries, private industry workers: Employment Cost Index by occupational and industrygroup, 1975-99
(Not seasonally adjusted) — Continued
Series and year
Indexes (June 1989=100) Percent changes for
March June Sept. Dec.3 months ended– 12 months ended–
March June Sept. Dec. March June Sept. Dec.
Goods-producing industries,excluding sales occupations:
1986 ....................................... 90.4 91.2 91.8 92.2 1.0 0.9 0.7 0.4 3.3 3.2 3.0 3.0 1987 ....................................... 92.9 93.4 94.3 95.2 .8 .5 1.0 1.0 2.8 2.4 2.7 3.3 1988 ....................................... 95.9 96.9 97.4 98.2 .7 1.0 .5 .8 3.2 3.7 3.3 3.2 1989 ....................................... 99.1 100.0 101.0 102.0 .9 .9 1.0 1.0 3.3 3.2 3.7 3.9 1990 ....................................... 103.0 104.2 105.0 105.7 1.0 1.2 .8 .7 3.9 4.2 4.0 3.6 1991 ....................................... 106.9 107.9 108.7 109.7 1.1 .9 .7 .9 3.8 3.6 3.5 3.8 1992 ....................................... 110.5 111.2 112.0 112.6 .7 .6 .7 .5 3.4 3.1 3.0 2.6 1993 ....................................... 113.5 114.2 114.9 115.6 .8 .6 .6 .6 2.7 2.7 2.6 2.7 1994 ....................................... 116.4 117.4 118.4 119.1 .7 .9 .9 .6 2.6 2.8 3.0 3.0 1995 ....................................... 119.9 120.9 121.6 122.4 .7 .8 .6 .7 3.0 3.0 2.7 2.8 1996 ....................................... 123.5 124.6 125.7 126.3 .9 .9 .9 .5 3.0 3.1 3.4 3.2 1997 ....................................... 127.0 128.3 129.3 130.0 .6 1.0 .8 .5 2.8 3.0 2.9 2.9 1998 ....................................... 131.3 132.5 133.6 134.4 1.0 .9 .8 .6 3.4 3.3 3.3 3.4 1999 ....................................... 135.5 136.6 137.8 138.9 .8 .8 .9 .8 3.2 3.1 3.1 3.3
Goods-producing industries,white-collar occupations:
1987 ....................................... – 92.9 94.0 94.9 – – 1.2 1.0 – – – – 1988 ....................................... 96.2 96.9 97.6 98.3 1.4 .7 .7 .7 – 4.3 3.8 3.6 1989 ....................................... 99.2 100.0 101.0 101.9 .9 .8 1.0 .9 3.1 3.2 3.5 3.7 1990 ....................................... 103.5 104.6 105.7 106.3 1.6 1.1 1.1 .6 4.3 4.6 4.7 4.3 1991 ....................................... 107.4 108.5 109.5 110.4 1.0 1.0 .9 .8 3.8 3.7 3.6 3.9 1992 ....................................... 111.7 112.5 113.2 114.2 1.2 .7 .6 .9 4.0 3.7 3.4 3.4 1993 ....................................... 115.4 116.4 117.3 118.2 1.1 .9 .8 .8 3.3 3.5 3.6 3.5 1994 ....................................... 119.1 120.3 121.1 122.0 .8 1.0 .7 .7 3.2 3.4 3.2 3.2 1995 ....................................... 123.0 123.8 124.4 125.3 .8 .7 .5 .7 3.3 2.9 2.7 2.7 1996 ....................................... 126.2 127.3 128.6 129.1 .7 .9 1.0 .4 2.6 2.8 3.4 3.0 1997 ....................................... 130.0 131.4 132.3 132.9 .7 1.1 .7 .5 3.0 3.2 2.9 2.9 1998 ....................................... 135.0 136.3 137.4 138.2 1.6 1.0 .8 .6 3.8 3.7 3.9 4.0 1999 ....................................... 139.4 140.5 141.7 143.0 .9 .8 .9 .9 3.3 3.1 3.1 3.5
Goods-producing industries,white-collar occupationsexcluding sales:
1987 ....................................... – 92.9 93.9 94.8 – – 1.1 1.0 – – – – 1988 ....................................... 96.0 96.9 97.6 98.2 1.3 .9 .7 .6 – 4.3 3.9 3.6 1989 ....................................... 99.2 100.0 101.0 102.0 1.0 .8 1.0 1.0 3.3 3.2 3.5 3.9 1990 ....................................... 103.3 104.4 105.6 106.2 1.3 1.1 1.1 .6 4.1 4.4 4.6 4.1 1991 ....................................... 107.2 108.5 109.5 110.5 .9 1.2 .9 .9 3.8 3.9 3.7 4.0 1992 ....................................... 111.3 112.0 112.9 113.7 .7 .6 .8 .7 3.8 3.2 3.1 2.9 1993 ....................................... 114.9 115.6 116.4 116.8 1.1 .6 .7 .3 3.2 3.2 3.1 2.7 1994 ....................................... 117.7 118.8 119.8 120.8 .8 .9 .8 .8 2.4 2.8 2.9 3.4 1995 ....................................... 121.8 122.5 123.2 124.2 .8 .6 .6 .8 3.5 3.1 2.8 2.8 1996 ....................................... 125.3 126.3 127.7 128.1 .9 .8 1.1 .3 2.9 3.1 3.7 3.1 1997 ....................................... 128.9 130.0 130.9 131.6 .6 .9 .7 .5 2.9 2.9 2.5 2.7 1998 ....................................... 133.3 134.6 135.7 136.4 1.3 1.0 .8 .5 3.4 3.5 3.7 3.6 1999 ....................................... 137.8 138.8 140.1 141.3 1.0 .7 .9 .9 3.4 3.1 3.2 3.6
Goods-producing industries,blue-collar occupations:
1987 ....................................... – 93.6 94.4 95.3 – – .9 1.0 – – – – 1988 ....................................... 95.9 96.9 97.3 98.1 .6 1.0 .4 .8 – 3.5 3.1 2.9 1989 ....................................... 99.0 100.0 101.0 101.9 .9 1.0 1.0 .9 3.2 3.2 3.8 3.9 1990 ....................................... 102.9 104.1 104.7 105.5 1.0 1.2 .6 .8 3.9 4.1 3.7 3.5 1991 ....................................... 106.8 107.6 108.3 109.2 1.2 .7 .7 .8 3.8 3.4 3.4 3.5 1992 ....................................... 110.1 110.7 111.4 111.9 .8 .5 .6 .4 3.1 2.9 2.9 2.5
See footnotes at end of table.
88
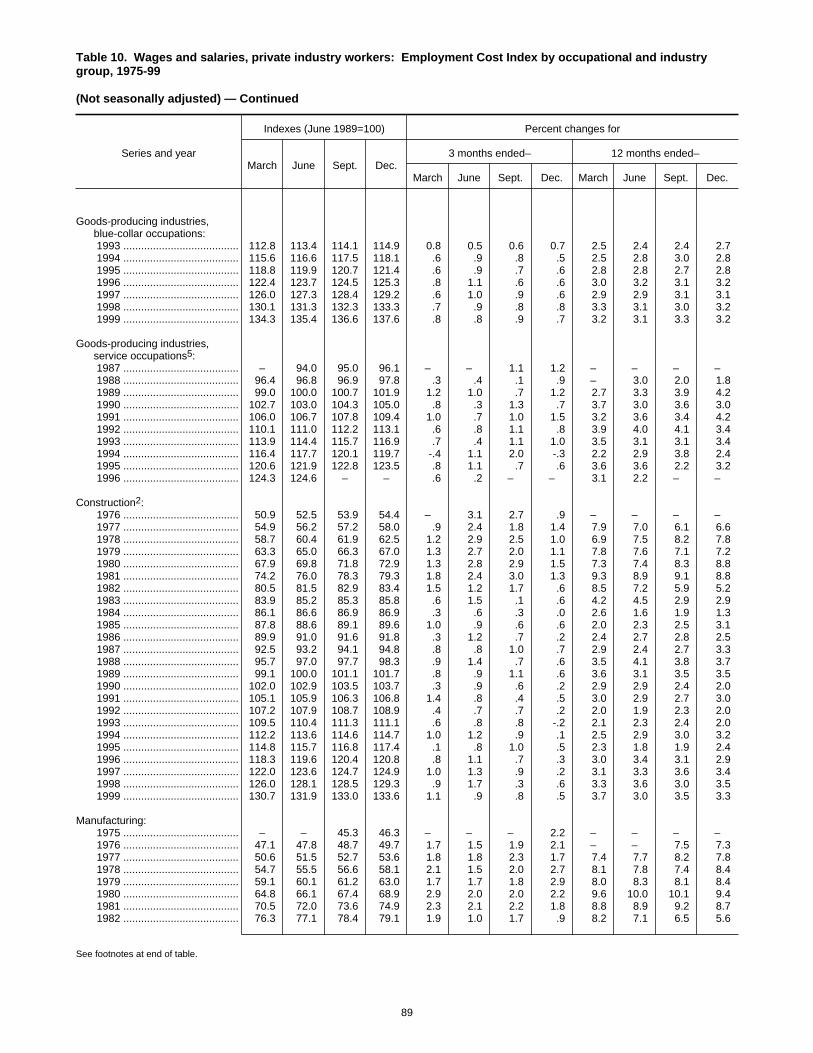
Table 10. Wages and salaries, private industry workers: Employment Cost Index by occupational and industrygroup, 1975-99
(Not seasonally adjusted) — Continued
Series and year
Indexes (June 1989=100) Percent changes for
March June Sept. Dec.3 months ended– 12 months ended–
March June Sept. Dec. March June Sept. Dec.
Goods-producing industries,blue-collar occupations:
1993 ....................................... 112.8 113.4 114.1 114.9 0.8 0.5 0.6 0.7 2.5 2.4 2.4 2.7 1994 ....................................... 115.6 116.6 117.5 118.1 .6 .9 .8 .5 2.5 2.8 3.0 2.8 1995 ....................................... 118.8 119.9 120.7 121.4 .6 .9 .7 .6 2.8 2.8 2.7 2.8 1996 ....................................... 122.4 123.7 124.5 125.3 .8 1.1 .6 .6 3.0 3.2 3.1 3.2 1997 ....................................... 126.0 127.3 128.4 129.2 .6 1.0 .9 .6 2.9 2.9 3.1 3.1 1998 ....................................... 130.1 131.3 132.3 133.3 .7 .9 .8 .8 3.3 3.1 3.0 3.2 1999 ....................................... 134.3 135.4 136.6 137.6 .8 .8 .9 .7 3.2 3.1 3.3 3.2
Goods-producing industries,service occupations5:
1987 ....................................... – 94.0 95.0 96.1 – – 1.1 1.2 – – – – 1988 ....................................... 96.4 96.8 96.9 97.8 .3 .4 .1 .9 – 3.0 2.0 1.8 1989 ....................................... 99.0 100.0 100.7 101.9 1.2 1.0 .7 1.2 2.7 3.3 3.9 4.2 1990 ....................................... 102.7 103.0 104.3 105.0 .8 .3 1.3 .7 3.7 3.0 3.6 3.0 1991 ....................................... 106.0 106.7 107.8 109.4 1.0 .7 1.0 1.5 3.2 3.6 3.4 4.2 1992 ....................................... 110.1 111.0 112.2 113.1 .6 .8 1.1 .8 3.9 4.0 4.1 3.4 1993 ....................................... 113.9 114.4 115.7 116.9 .7 .4 1.1 1.0 3.5 3.1 3.1 3.4 1994 ....................................... 116.4 117.7 120.1 119.7 -.4 1.1 2.0 -.3 2.2 2.9 3.8 2.4 1995 ....................................... 120.6 121.9 122.8 123.5 .8 1.1 .7 .6 3.6 3.6 2.2 3.2 1996 ....................................... 124.3 124.6 – – .6 .2 – – 3.1 2.2 – –
Construction2: 1976 ....................................... 50.9 52.5 53.9 54.4 – 3.1 2.7 .9 – – – – 1977 ....................................... 54.9 56.2 57.2 58.0 .9 2.4 1.8 1.4 7.9 7.0 6.1 6.6 1978 ....................................... 58.7 60.4 61.9 62.5 1.2 2.9 2.5 1.0 6.9 7.5 8.2 7.8 1979 ....................................... 63.3 65.0 66.3 67.0 1.3 2.7 2.0 1.1 7.8 7.6 7.1 7.2 1980 ....................................... 67.9 69.8 71.8 72.9 1.3 2.8 2.9 1.5 7.3 7.4 8.3 8.8 1981 ....................................... 74.2 76.0 78.3 79.3 1.8 2.4 3.0 1.3 9.3 8.9 9.1 8.8 1982 ....................................... 80.5 81.5 82.9 83.4 1.5 1.2 1.7 .6 8.5 7.2 5.9 5.2 1983 ....................................... 83.9 85.2 85.3 85.8 .6 1.5 .1 .6 4.2 4.5 2.9 2.9 1984 ....................................... 86.1 86.6 86.9 86.9 .3 .6 .3 .0 2.6 1.6 1.9 1.3 1985 ....................................... 87.8 88.6 89.1 89.6 1.0 .9 .6 .6 2.0 2.3 2.5 3.1 1986 ....................................... 89.9 91.0 91.6 91.8 .3 1.2 .7 .2 2.4 2.7 2.8 2.5 1987 ....................................... 92.5 93.2 94.1 94.8 .8 .8 1.0 .7 2.9 2.4 2.7 3.3 1988 ....................................... 95.7 97.0 97.7 98.3 .9 1.4 .7 .6 3.5 4.1 3.8 3.7 1989 ....................................... 99.1 100.0 101.1 101.7 .8 .9 1.1 .6 3.6 3.1 3.5 3.5 1990 ....................................... 102.0 102.9 103.5 103.7 .3 .9 .6 .2 2.9 2.9 2.4 2.0 1991 ....................................... 105.1 105.9 106.3 106.8 1.4 .8 .4 .5 3.0 2.9 2.7 3.0 1992 ....................................... 107.2 107.9 108.7 108.9 .4 .7 .7 .2 2.0 1.9 2.3 2.0 1993 ....................................... 109.5 110.4 111.3 111.1 .6 .8 .8 -.2 2.1 2.3 2.4 2.0 1994 ....................................... 112.2 113.6 114.6 114.7 1.0 1.2 .9 .1 2.5 2.9 3.0 3.2 1995 ....................................... 114.8 115.7 116.8 117.4 .1 .8 1.0 .5 2.3 1.8 1.9 2.4 1996 ....................................... 118.3 119.6 120.4 120.8 .8 1.1 .7 .3 3.0 3.4 3.1 2.9 1997 ....................................... 122.0 123.6 124.7 124.9 1.0 1.3 .9 .2 3.1 3.3 3.6 3.4 1998 ....................................... 126.0 128.1 128.5 129.3 .9 1.7 .3 .6 3.3 3.6 3.0 3.5 1999 ....................................... 130.7 131.9 133.0 133.6 1.1 .9 .8 .5 3.7 3.0 3.5 3.3
Manufacturing: 1975 ....................................... – – 45.3 46.3 – – – 2.2 – – – – 1976 ....................................... 47.1 47.8 48.7 49.7 1.7 1.5 1.9 2.1 – – 7.5 7.3 1977 ....................................... 50.6 51.5 52.7 53.6 1.8 1.8 2.3 1.7 7.4 7.7 8.2 7.8 1978 ....................................... 54.7 55.5 56.6 58.1 2.1 1.5 2.0 2.7 8.1 7.8 7.4 8.4 1979 ....................................... 59.1 60.1 61.2 63.0 1.7 1.7 1.8 2.9 8.0 8.3 8.1 8.4 1980 ....................................... 64.8 66.1 67.4 68.9 2.9 2.0 2.0 2.2 9.6 10.0 10.1 9.4 1981 ....................................... 70.5 72.0 73.6 74.9 2.3 2.1 2.2 1.8 8.8 8.9 9.2 8.7 1982 ....................................... 76.3 77.1 78.4 79.1 1.9 1.0 1.7 .9 8.2 7.1 6.5 5.6
See footnotes at end of table.
89
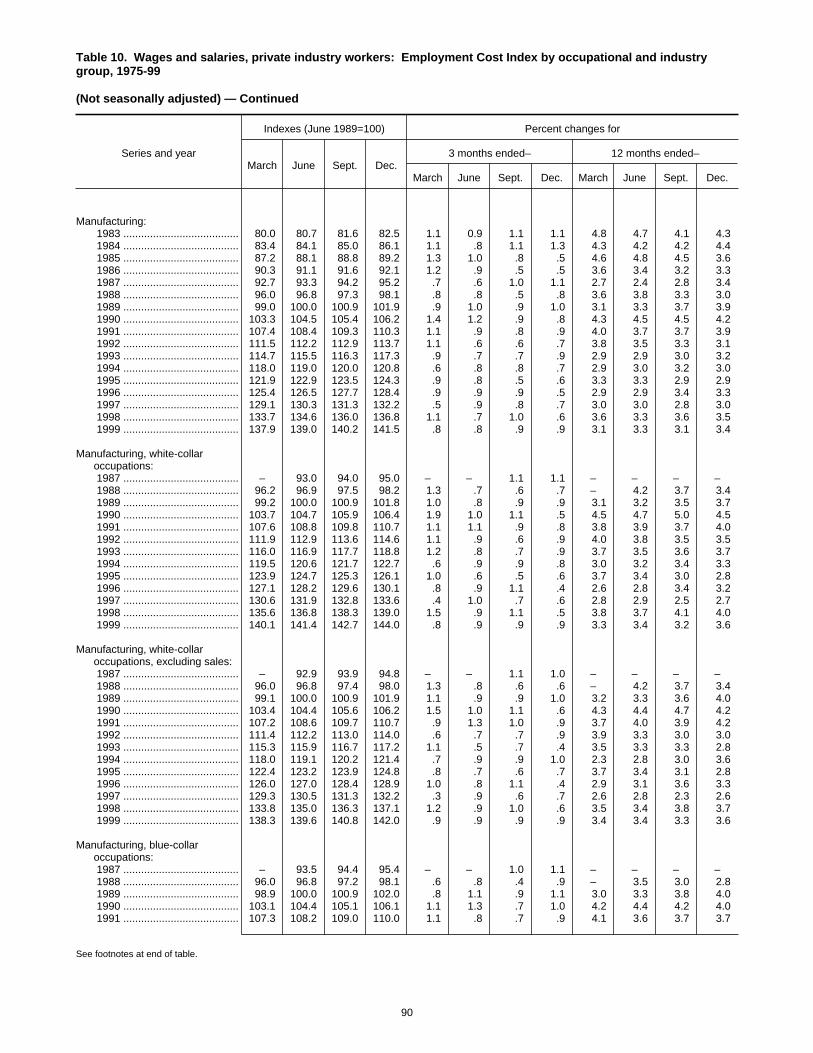
Table 10. Wages and salaries, private industry workers: Employment Cost Index by occupational and industrygroup, 1975-99
(Not seasonally adjusted) — Continued
Series and year
Indexes (June 1989=100) Percent changes for
March June Sept. Dec.3 months ended– 12 months ended–
March June Sept. Dec. March June Sept. Dec.
Manufacturing: 1983 ....................................... 80.0 80.7 81.6 82.5 1.1 0.9 1.1 1.1 4.8 4.7 4.1 4.3 1984 ....................................... 83.4 84.1 85.0 86.1 1.1 .8 1.1 1.3 4.3 4.2 4.2 4.4 1985 ....................................... 87.2 88.1 88.8 89.2 1.3 1.0 .8 .5 4.6 4.8 4.5 3.6 1986 ....................................... 90.3 91.1 91.6 92.1 1.2 .9 .5 .5 3.6 3.4 3.2 3.3 1987 ....................................... 92.7 93.3 94.2 95.2 .7 .6 1.0 1.1 2.7 2.4 2.8 3.4 1988 ....................................... 96.0 96.8 97.3 98.1 .8 .8 .5 .8 3.6 3.8 3.3 3.0 1989 ....................................... 99.0 100.0 100.9 101.9 .9 1.0 .9 1.0 3.1 3.3 3.7 3.9 1990 ....................................... 103.3 104.5 105.4 106.2 1.4 1.2 .9 .8 4.3 4.5 4.5 4.2 1991 ....................................... 107.4 108.4 109.3 110.3 1.1 .9 .8 .9 4.0 3.7 3.7 3.9 1992 ....................................... 111.5 112.2 112.9 113.7 1.1 .6 .6 .7 3.8 3.5 3.3 3.1 1993 ....................................... 114.7 115.5 116.3 117.3 .9 .7 .7 .9 2.9 2.9 3.0 3.2 1994 ....................................... 118.0 119.0 120.0 120.8 .6 .8 .8 .7 2.9 3.0 3.2 3.0 1995 ....................................... 121.9 122.9 123.5 124.3 .9 .8 .5 .6 3.3 3.3 2.9 2.9 1996 ....................................... 125.4 126.5 127.7 128.4 .9 .9 .9 .5 2.9 2.9 3.4 3.3 1997 ....................................... 129.1 130.3 131.3 132.2 .5 .9 .8 .7 3.0 3.0 2.8 3.0 1998 ....................................... 133.7 134.6 136.0 136.8 1.1 .7 1.0 .6 3.6 3.3 3.6 3.5 1999 ....................................... 137.9 139.0 140.2 141.5 .8 .8 .9 .9 3.1 3.3 3.1 3.4
Manufacturing, white-collaroccupations:
1987 ....................................... – 93.0 94.0 95.0 – – 1.1 1.1 – – – – 1988 ....................................... 96.2 96.9 97.5 98.2 1.3 .7 .6 .7 – 4.2 3.7 3.4 1989 ....................................... 99.2 100.0 100.9 101.8 1.0 .8 .9 .9 3.1 3.2 3.5 3.7 1990 ....................................... 103.7 104.7 105.9 106.4 1.9 1.0 1.1 .5 4.5 4.7 5.0 4.5 1991 ....................................... 107.6 108.8 109.8 110.7 1.1 1.1 .9 .8 3.8 3.9 3.7 4.0 1992 ....................................... 111.9 112.9 113.6 114.6 1.1 .9 .6 .9 4.0 3.8 3.5 3.5 1993 ....................................... 116.0 116.9 117.7 118.8 1.2 .8 .7 .9 3.7 3.5 3.6 3.7 1994 ....................................... 119.5 120.6 121.7 122.7 .6 .9 .9 .8 3.0 3.2 3.4 3.3 1995 ....................................... 123.9 124.7 125.3 126.1 1.0 .6 .5 .6 3.7 3.4 3.0 2.8 1996 ....................................... 127.1 128.2 129.6 130.1 .8 .9 1.1 .4 2.6 2.8 3.4 3.2 1997 ....................................... 130.6 131.9 132.8 133.6 .4 1.0 .7 .6 2.8 2.9 2.5 2.7 1998 ....................................... 135.6 136.8 138.3 139.0 1.5 .9 1.1 .5 3.8 3.7 4.1 4.0 1999 ....................................... 140.1 141.4 142.7 144.0 .8 .9 .9 .9 3.3 3.4 3.2 3.6
Manufacturing, white-collaroccupations, excluding sales:
1987 ....................................... – 92.9 93.9 94.8 – – 1.1 1.0 – – – – 1988 ....................................... 96.0 96.8 97.4 98.0 1.3 .8 .6 .6 – 4.2 3.7 3.4 1989 ....................................... 99.1 100.0 100.9 101.9 1.1 .9 .9 1.0 3.2 3.3 3.6 4.0 1990 ....................................... 103.4 104.4 105.6 106.2 1.5 1.0 1.1 .6 4.3 4.4 4.7 4.2 1991 ....................................... 107.2 108.6 109.7 110.7 .9 1.3 1.0 .9 3.7 4.0 3.9 4.2 1992 ....................................... 111.4 112.2 113.0 114.0 .6 .7 .7 .9 3.9 3.3 3.0 3.0 1993 ....................................... 115.3 115.9 116.7 117.2 1.1 .5 .7 .4 3.5 3.3 3.3 2.8 1994 ....................................... 118.0 119.1 120.2 121.4 .7 .9 .9 1.0 2.3 2.8 3.0 3.6 1995 ....................................... 122.4 123.2 123.9 124.8 .8 .7 .6 .7 3.7 3.4 3.1 2.8 1996 ....................................... 126.0 127.0 128.4 128.9 1.0 .8 1.1 .4 2.9 3.1 3.6 3.3 1997 ....................................... 129.3 130.5 131.3 132.2 .3 .9 .6 .7 2.6 2.8 2.3 2.6 1998 ....................................... 133.8 135.0 136.3 137.1 1.2 .9 1.0 .6 3.5 3.4 3.8 3.7 1999 ....................................... 138.3 139.6 140.8 142.0 .9 .9 .9 .9 3.4 3.4 3.3 3.6
Manufacturing, blue-collaroccupations:
1987 ....................................... – 93.5 94.4 95.4 – – 1.0 1.1 – – – – 1988 ....................................... 96.0 96.8 97.2 98.1 .6 .8 .4 .9 – 3.5 3.0 2.8 1989 ....................................... 98.9 100.0 100.9 102.0 .8 1.1 .9 1.1 3.0 3.3 3.8 4.0 1990 ....................................... 103.1 104.4 105.1 106.1 1.1 1.3 .7 1.0 4.2 4.4 4.2 4.0 1991 ....................................... 107.3 108.2 109.0 110.0 1.1 .8 .7 .9 4.1 3.6 3.7 3.7
See footnotes at end of table.
90
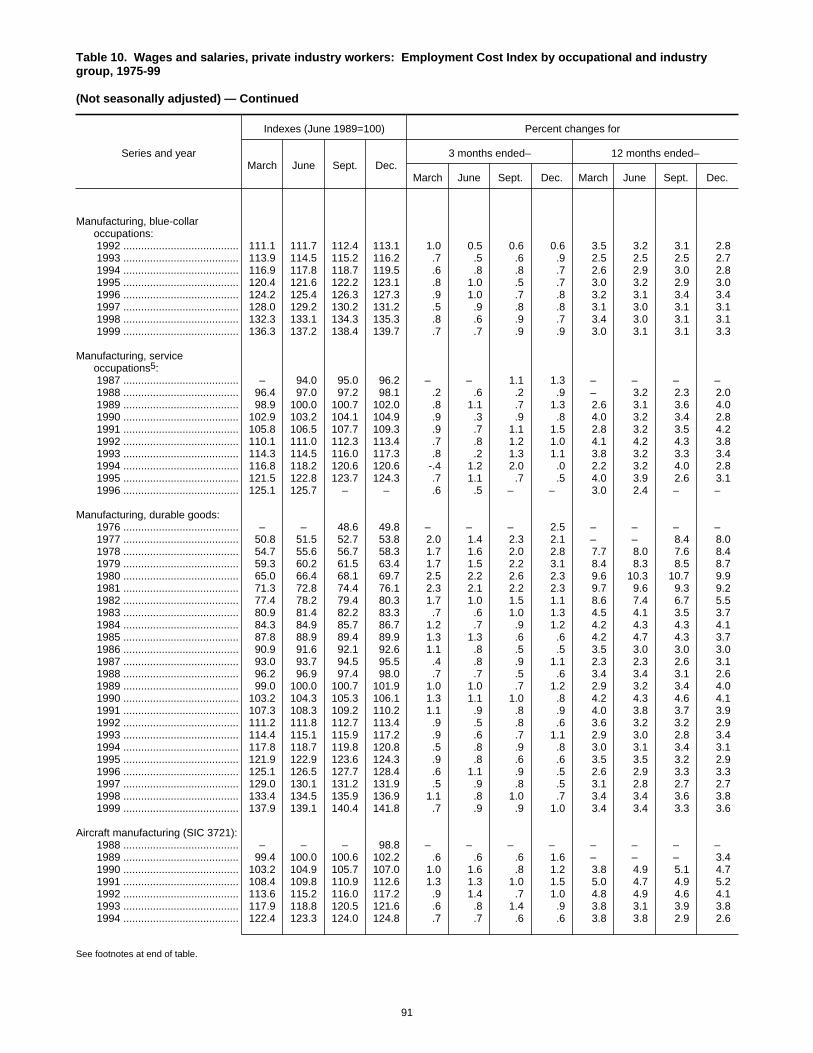
Table 10. Wages and salaries, private industry workers: Employment Cost Index by occupational and industrygroup, 1975-99
(Not seasonally adjusted) — Continued
Series and year
Indexes (June 1989=100) Percent changes for
March June Sept. Dec.3 months ended– 12 months ended–
March June Sept. Dec. March June Sept. Dec.
Manufacturing, blue-collaroccupations:
1992 ....................................... 111.1 111.7 112.4 113.1 1.0 0.5 0.6 0.6 3.5 3.2 3.1 2.8 1993 ....................................... 113.9 114.5 115.2 116.2 .7 .5 .6 .9 2.5 2.5 2.5 2.7 1994 ....................................... 116.9 117.8 118.7 119.5 .6 .8 .8 .7 2.6 2.9 3.0 2.8 1995 ....................................... 120.4 121.6 122.2 123.1 .8 1.0 .5 .7 3.0 3.2 2.9 3.0 1996 ....................................... 124.2 125.4 126.3 127.3 .9 1.0 .7 .8 3.2 3.1 3.4 3.4 1997 ....................................... 128.0 129.2 130.2 131.2 .5 .9 .8 .8 3.1 3.0 3.1 3.1 1998 ....................................... 132.3 133.1 134.3 135.3 .8 .6 .9 .7 3.4 3.0 3.1 3.1 1999 ....................................... 136.3 137.2 138.4 139.7 .7 .7 .9 .9 3.0 3.1 3.1 3.3
Manufacturing, serviceoccupations5:
1987 ....................................... – 94.0 95.0 96.2 – – 1.1 1.3 – – – – 1988 ....................................... 96.4 97.0 97.2 98.1 .2 .6 .2 .9 – 3.2 2.3 2.0 1989 ....................................... 98.9 100.0 100.7 102.0 .8 1.1 .7 1.3 2.6 3.1 3.6 4.0 1990 ....................................... 102.9 103.2 104.1 104.9 .9 .3 .9 .8 4.0 3.2 3.4 2.8 1991 ....................................... 105.8 106.5 107.7 109.3 .9 .7 1.1 1.5 2.8 3.2 3.5 4.2 1992 ....................................... 110.1 111.0 112.3 113.4 .7 .8 1.2 1.0 4.1 4.2 4.3 3.8 1993 ....................................... 114.3 114.5 116.0 117.3 .8 .2 1.3 1.1 3.8 3.2 3.3 3.4 1994 ....................................... 116.8 118.2 120.6 120.6 -.4 1.2 2.0 .0 2.2 3.2 4.0 2.8 1995 ....................................... 121.5 122.8 123.7 124.3 .7 1.1 .7 .5 4.0 3.9 2.6 3.1 1996 ....................................... 125.1 125.7 – – .6 .5 – – 3.0 2.4 – –
Manufacturing, durable goods: 1976 ....................................... – – 48.6 49.8 – – – 2.5 – – – – 1977 ....................................... 50.8 51.5 52.7 53.8 2.0 1.4 2.3 2.1 – – 8.4 8.0 1978 ....................................... 54.7 55.6 56.7 58.3 1.7 1.6 2.0 2.8 7.7 8.0 7.6 8.4 1979 ....................................... 59.3 60.2 61.5 63.4 1.7 1.5 2.2 3.1 8.4 8.3 8.5 8.7 1980 ....................................... 65.0 66.4 68.1 69.7 2.5 2.2 2.6 2.3 9.6 10.3 10.7 9.9 1981 ....................................... 71.3 72.8 74.4 76.1 2.3 2.1 2.2 2.3 9.7 9.6 9.3 9.2 1982 ....................................... 77.4 78.2 79.4 80.3 1.7 1.0 1.5 1.1 8.6 7.4 6.7 5.5 1983 ....................................... 80.9 81.4 82.2 83.3 .7 .6 1.0 1.3 4.5 4.1 3.5 3.7 1984 ....................................... 84.3 84.9 85.7 86.7 1.2 .7 .9 1.2 4.2 4.3 4.3 4.1 1985 ....................................... 87.8 88.9 89.4 89.9 1.3 1.3 .6 .6 4.2 4.7 4.3 3.7 1986 ....................................... 90.9 91.6 92.1 92.6 1.1 .8 .5 .5 3.5 3.0 3.0 3.0 1987 ....................................... 93.0 93.7 94.5 95.5 .4 .8 .9 1.1 2.3 2.3 2.6 3.1 1988 ....................................... 96.2 96.9 97.4 98.0 .7 .7 .5 .6 3.4 3.4 3.1 2.6 1989 ....................................... 99.0 100.0 100.7 101.9 1.0 1.0 .7 1.2 2.9 3.2 3.4 4.0 1990 ....................................... 103.2 104.3 105.3 106.1 1.3 1.1 1.0 .8 4.2 4.3 4.6 4.1 1991 ....................................... 107.3 108.3 109.2 110.2 1.1 .9 .8 .9 4.0 3.8 3.7 3.9 1992 ....................................... 111.2 111.8 112.7 113.4 .9 .5 .8 .6 3.6 3.2 3.2 2.9 1993 ....................................... 114.4 115.1 115.9 117.2 .9 .6 .7 1.1 2.9 3.0 2.8 3.4 1994 ....................................... 117.8 118.7 119.8 120.8 .5 .8 .9 .8 3.0 3.1 3.4 3.1 1995 ....................................... 121.9 122.9 123.6 124.3 .9 .8 .6 .6 3.5 3.5 3.2 2.9 1996 ....................................... 125.1 126.5 127.7 128.4 .6 1.1 .9 .5 2.6 2.9 3.3 3.3 1997 ....................................... 129.0 130.1 131.2 131.9 .5 .9 .8 .5 3.1 2.8 2.7 2.7 1998 ....................................... 133.4 134.5 135.9 136.9 1.1 .8 1.0 .7 3.4 3.4 3.6 3.8 1999 ....................................... 137.9 139.1 140.4 141.8 .7 .9 .9 1.0 3.4 3.4 3.3 3.6
Aircraft manufacturing (SIC 3721): 1988 ....................................... – – – 98.8 – – – – – – – – 1989 ....................................... 99.4 100.0 100.6 102.2 .6 .6 .6 1.6 – – – 3.4 1990 ....................................... 103.2 104.9 105.7 107.0 1.0 1.6 .8 1.2 3.8 4.9 5.1 4.7 1991 ....................................... 108.4 109.8 110.9 112.6 1.3 1.3 1.0 1.5 5.0 4.7 4.9 5.2 1992 ....................................... 113.6 115.2 116.0 117.2 .9 1.4 .7 1.0 4.8 4.9 4.6 4.1 1993 ....................................... 117.9 118.8 120.5 121.6 .6 .8 1.4 .9 3.8 3.1 3.9 3.8 1994 ....................................... 122.4 123.3 124.0 124.8 .7 .7 .6 .6 3.8 3.8 2.9 2.6
See footnotes at end of table.
91

Table 10. Wages and salaries, private industry workers: Employment Cost Index by occupational and industrygroup, 1975-99
(Not seasonally adjusted) — Continued
Series and year
Indexes (June 1989=100) Percent changes for
March June Sept. Dec.3 months ended– 12 months ended–
March June Sept. Dec. March June Sept. Dec.
Aircraft manufacturing (SIC 3721): 1995 ....................................... 125.7 126.5 127.4 128.1 0.7 0.6 0.7 0.5 2.7 2.6 2.7 2.6 1996 ....................................... 129.0 130.3 130.6 130.9 .7 1.0 .2 .2 2.6 3.0 2.5 2.2 1997 ....................................... 132.0 133.5 133.3 134.0 .8 1.1 -.1 .5 2.3 2.5 2.1 2.4 1998 ....................................... 135.1 136.9 137.2 138.3 .8 1.3 .2 .8 2.3 2.5 2.9 3.2 1999 ....................................... 139.4 141.5 142.7 143.6 .8 1.5 .8 .6 3.2 3.4 4.0 3.8
Aircraft manufacturing (SIC 3721), White-collar occupations:
1988 ....................................... – – – 98.7 – – – – – – – – 1989 ....................................... 99.3 100.0 100.4 101.5 .6 .7 .4 1.1 – – – 2.8 1990 ....................................... 102.3 103.8 104.2 105.0 .8 1.5 .4 .8 3.0 3.8 3.8 3.4 1991 ....................................... 106.0 107.4 107.9 108.9 1.0 1.3 .5 .9 3.6 3.5 3.6 3.7 1992 ....................................... 110.0 111.6 112.2 113.1 1.0 1.5 .5 .8 3.8 3.9 4.0 3.9 1993 ....................................... 113.9 115.2 116.7 117.3 .7 1.1 1.3 .5 3.5 3.2 4.0 3.7 1994 ....................................... 118.1 119.1 119.8 120.2 .7 .8 .6 .3 3.7 3.4 2.7 2.5 1995 ....................................... 121.0 121.6 122.7 123.2 .7 .5 .9 .4 2.5 2.1 2.4 2.5 1996 ....................................... 124.1 125.9 126.1 126.5 .7 1.5 .2 .3 2.6 3.5 2.8 2.7 1997 ....................................... 127.8 129.6 129.3 129.8 1.0 1.4 -.2 .4 3.0 2.9 2.5 2.6 1998 ....................................... 131.2 133.7 133.9 134.5 1.1 1.9 .1 .4 2.7 3.2 3.6 3.6 1999 ....................................... 135.5 138.0 138.3 139.1 .7 1.8 .2 .6 3.3 3.2 3.3 3.4
Aircraft manufacturing (SIC 3721), Blue-collar occupations:
1988 ....................................... – – – 98.9 – – – – – – – – 1989 ....................................... 99.6 100.0 100.9 103.3 .7 .4 .9 2.4 – – – 4.4 1990 ....................................... 104.6 106.7 107.8 110.0 1.3 2.0 1.0 2.0 5.0 6.7 6.8 6.5 1991 ....................................... 112.0 113.5 115.4 118.0 1.8 1.3 1.7 2.3 7.1 6.4 7.1 7.3 1992 ....................................... 119.0 120.5 121.5 123.3 .8 1.3 .8 1.5 6.3 6.2 5.3 4.5 1993 ....................................... 123.9 124.1 126.1 127.9 .5 .2 1.6 1.4 4.1 3.0 3.8 3.7 1994 ....................................... 128.7 129.4 130.2 131.7 .6 .5 .6 1.2 3.9 4.3 3.3 3.0 1995 ....................................... 132.7 133.6 134.1 135.1 .8 .7 .4 .7 3.1 3.2 3.0 2.6 1996 ....................................... 136.1 136.4 137.0 137.1 .7 .2 .4 .1 2.6 2.1 2.2 1.5 1997 ....................................... 137.7 138.8 138.4 139.6 .4 .8 -.3 .9 1.2 1.8 1.0 1.8 1998 ....................................... 140.1 140.5 141.0 143.2 .4 .3 .4 1.6 1.7 1.2 1.9 2.6 1999 ....................................... 144.5 145.5 148.9 149.9 .9 .7 2.3 .7 3.1 3.6 5.6 4.7
Manufacturing, nondurable goods: 1976 ....................................... – – 48.7 49.4 – – – 1.4 – – – – 1977 ....................................... 50.4 51.5 52.5 53.4 2.0 2.2 1.9 1.7 – – 7.8 8.1 1978 ....................................... 54.6 55.4 56.3 57.7 2.2 1.5 1.6 2.5 8.3 7.6 7.2 8.1 1979 ....................................... 58.6 59.9 60.6 62.2 1.6 2.2 1.2 2.6 7.3 8.1 7.6 7.8 1980 ....................................... 64.3 65.5 66.2 67.6 3.4 1.9 1.1 2.1 9.7 9.3 9.2 8.7 1981 ....................................... 69.1 70.6 72.0 72.8 2.2 2.2 2.0 1.1 7.5 7.8 8.8 7.7 1982 ....................................... 74.4 75.1 76.6 77.0 2.2 .9 2.0 .5 7.7 6.4 6.4 5.8 1983 ....................................... 78.3 79.3 80.4 80.9 1.7 1.3 1.4 .6 5.2 5.6 5.0 5.1 1984 ....................................... 81.8 82.7 83.8 84.9 1.1 1.1 1.3 1.3 4.5 4.3 4.2 4.9 1985 ....................................... 85.9 86.6 87.6 88.0 1.2 .8 1.2 .5 5.0 4.7 4.5 3.7 1986 ....................................... 89.1 90.3 90.7 91.3 1.3 1.3 .4 .7 3.7 4.3 3.5 3.8 1987 ....................................... 92.2 92.5 93.8 94.7 1.0 .3 1.4 1.0 3.5 2.4 3.4 3.7 1988 ....................................... 95.8 96.5 97.2 98.2 1.2 .7 .7 1.0 3.9 4.3 3.6 3.7 1989 ....................................... 99.0 100.0 101.1 101.8 .8 1.0 1.1 .7 3.3 3.6 4.0 3.7 1990 ....................................... 103.6 104.8 105.7 106.3 1.8 1.2 .9 .6 4.6 4.8 4.5 4.4 1991 ....................................... 107.6 108.6 109.4 110.6 1.2 .9 .7 1.1 3.9 3.6 3.5 4.0 1992 ....................................... 111.8 112.8 113.2 114.3 1.1 .9 .4 1.0 3.9 3.9 3.5 3.3 1993 ....................................... 115.5 116.3 116.9 117.5 1.0 .7 .5 .5 3.3 3.1 3.3 2.8 1994 ....................................... 118.3 119.5 120.3 120.8 .7 1.0 .7 .4 2.4 2.8 2.9 2.8 1995 ....................................... 121.9 122.9 123.3 124.4 .9 .8 .3 .9 3.0 2.8 2.5 3.0
See footnotes at end of table.
92

Table 10. Wages and salaries, private industry workers: Employment Cost Index by occupational and industrygroup, 1975-99
(Not seasonally adjusted) — Continued
Series and year
Indexes (June 1989=100) Percent changes for
March June Sept. Dec.3 months ended– 12 months ended–
March June Sept. Dec. March June Sept. Dec.
Manufacturing, nondurable goods: 1996 ....................................... 125.8 126.5 127.6 128.5 1.1 0.6 0.9 0.7 3.2 2.9 3.5 3.3 1997 ....................................... 129.3 130.6 131.4 132.6 .6 1.0 .6 .9 2.8 3.2 3.0 3.2 1998 ....................................... 134.2 134.9 136.0 136.8 1.2 .5 .8 .6 3.8 3.3 3.5 3.2 1999 ....................................... 138.0 138.7 139.7 140.9 .9 .5 .7 .9 2.8 2.8 2.7 3.0
Service-producing industries6: 1975 ....................................... – – 44.3 45.1 – – – 1.8 – – – – 1976 ....................................... 46.0 46.8 47.3 48.2 2.0 1.7 1.1 1.9 – – 6.8 6.9 1977 ....................................... 48.8 49.7 50.5 51.4 1.2 1.8 1.6 1.8 6.1 6.2 6.8 6.6 1978 ....................................... 52.3 53.6 54.7 55.1 1.8 2.5 2.1 .7 7.2 7.8 8.3 7.2 1979 ....................................... 56.3 57.4 58.8 60.0 2.2 2.0 2.4 2.0 7.6 7.1 7.5 8.9 1980 ....................................... 61.5 62.6 64.1 65.3 2.5 1.8 2.4 1.9 9.2 9.1 9.0 8.8 1981 ....................................... 67.4 68.6 69.8 71.1 3.2 1.8 1.7 1.9 9.6 9.6 8.9 8.9 1982 ....................................... 72.6 73.4 74.8 75.9 2.1 1.1 1.9 1.5 7.7 7.0 7.2 6.8 1983 ....................................... 76.9 77.8 79.2 80.2 1.3 1.2 1.8 1.3 5.9 6.0 5.9 5.7 1984 ....................................... 81.3 82.1 82.7 83.7 1.4 1.0 .7 1.2 5.7 5.5 4.4 4.4 1985 ....................................... 84.6 85.6 87.1 87.7 1.1 1.2 1.8 .7 4.1 4.3 5.3 4.8 1986 ....................................... 88.5 89.1 89.8 90.3 .9 .7 .8 .6 4.6 4.1 3.1 3.0 1987 ....................................... 91.5 92.1 93.1 93.4 1.3 .7 1.1 .3 3.4 3.4 3.7 3.4 1988 ....................................... 94.3 95.5 96.7 97.8 1.0 1.3 1.3 1.1 3.1 3.7 3.9 4.7 1989 ....................................... 99.1 100.0 101.4 102.2 1.3 .9 1.4 .8 5.1 4.7 4.9 4.5 1990 ....................................... 103.3 104.6 105.7 106.3 1.1 1.3 1.1 .6 4.2 4.6 4.2 4.0 1991 ....................................... 107.5 108.7 109.7 110.2 1.1 1.1 .9 .5 4.1 3.9 3.8 3.7 1992 ....................................... 111.1 111.7 112.3 113.0 .8 .5 .5 .6 3.3 2.8 2.4 2.5 1993 ....................................... 113.9 114.7 115.9 116.6 .8 .7 1.0 .6 2.5 2.7 3.2 3.2 1994 ....................................... 117.3 118.2 119.2 119.7 .6 .8 .8 .4 3.0 3.1 2.8 2.7 1995 ....................................... 120.7 121.6 122.6 123.2 .8 .7 .8 .5 2.9 2.9 2.9 2.9 1996 ....................................... 124.7 125.8 126.7 127.5 1.2 .9 .7 .6 3.3 3.5 3.3 3.5 1997 ....................................... 129.0 130.1 131.5 133.1 1.2 .9 1.1 1.2 3.4 3.4 3.8 4.4 1998 ....................................... 134.4 135.6 137.6 138.4 1.0 .9 1.5 .6 4.2 4.2 4.6 4.0 1999 ....................................... 138.9 140.8 142.1 143.3 .4 1.4 .9 .8 3.3 3.8 3.3 3.5
Service-producing industries,excluding sales occupations:
1975 ....................................... – – 44.2 44.9 – – – 1.6 – – – – 1976 ....................................... 45.8 46.6 47.2 47.9 2.0 1.7 1.3 1.5 – – 6.8 6.7 1977 ....................................... 48.7 49.6 50.4 51.1 1.7 1.8 1.6 1.4 6.3 6.4 6.8 6.7 1978 ....................................... 52.2 53.2 54.2 54.7 2.2 1.9 1.9 .9 7.2 7.3 7.5 7.0 1979 ....................................... 56.1 57.0 58.4 59.6 2.6 1.6 2.5 2.1 7.5 7.1 7.7 9.0 1980 ....................................... 61.2 62.4 63.7 64.9 2.7 2.0 2.1 1.9 9.1 9.5 9.1 8.9 1981 ....................................... 67.1 68.1 69.8 70.8 3.4 1.5 2.5 1.4 9.6 9.1 9.6 9.1 1982 ....................................... 72.6 73.5 74.7 75.7 2.5 1.2 1.6 1.3 8.2 7.9 7.0 6.9 1983 ....................................... 77.1 78.1 79.4 80.2 1.8 1.3 1.7 1.0 6.2 6.3 6.3 5.9 1984 ....................................... 81.6 82.2 83.1 84.3 1.7 .7 1.1 1.4 5.8 5.2 4.7 5.1 1985 ....................................... 84.8 85.8 87.3 87.5 .6 1.2 1.7 .2 3.9 4.4 5.1 3.8 1986 ....................................... 88.5 89.0 89.7 90.4 1.1 .6 .8 .8 4.4 3.7 2.7 3.3 1987 ....................................... 91.5 92.2 93.5 94.0 1.2 .8 1.4 .5 3.4 3.6 4.2 4.0 1988 ....................................... 94.9 95.8 97.1 98.0 1.0 .9 1.4 .9 3.7 3.9 3.9 4.3 1989 ....................................... 99.2 100.0 101.2 101.8 1.2 .8 1.2 .6 4.5 4.4 4.2 3.9 1990 ....................................... 103.4 104.5 105.8 106.6 1.6 1.1 1.2 .8 4.2 4.5 4.5 4.7 1991 ....................................... 107.7 108.7 110.0 110.7 1.0 .9 1.2 .6 4.2 4.0 4.0 3.8 1992 ....................................... 111.5 112.2 113.0 113.7 .7 .6 .7 .6 3.5 3.2 2.7 2.7 1993 ....................................... 114.8 115.6 116.6 117.4 1.0 .7 .9 .7 3.0 3.0 3.2 3.3 1994 ....................................... 118.3 119.0 120.2 120.7 .8 .6 1.0 .4 3.0 2.9 3.1 2.8 1995 ....................................... 121.8 122.5 123.4 124.2 .9 .6 .7 .6 3.0 2.9 2.7 2.9 1996 ....................................... 125.6 126.5 127.6 128.3 1.1 .7 .9 .5 3.1 3.3 3.4 3.3 1997 ....................................... 129.7 130.9 132.3 133.9 1.1 .9 1.1 1.2 3.3 3.5 3.7 4.4
See footnotes at end of table.
93
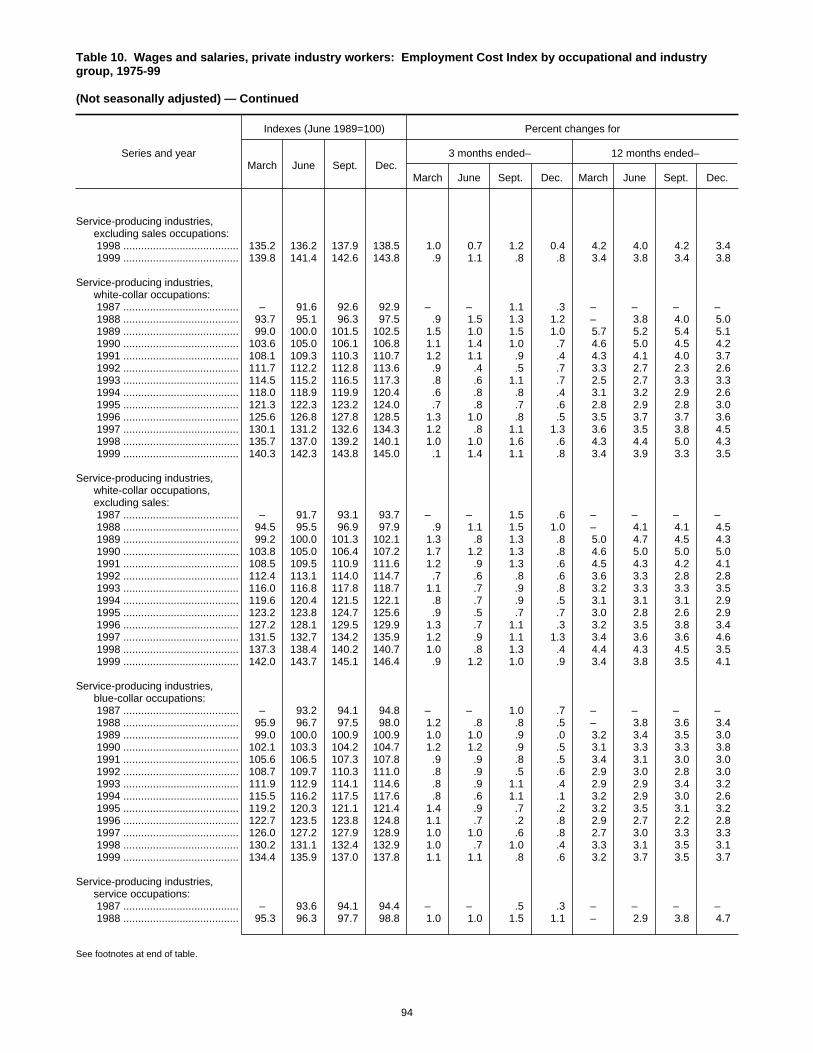
Table 10. Wages and salaries, private industry workers: Employment Cost Index by occupational and industrygroup, 1975-99
(Not seasonally adjusted) — Continued
Series and year
Indexes (June 1989=100) Percent changes for
March June Sept. Dec.3 months ended– 12 months ended–
March June Sept. Dec. March June Sept. Dec.
Service-producing industries,excluding sales occupations:
1998 ....................................... 135.2 136.2 137.9 138.5 1.0 0.7 1.2 0.4 4.2 4.0 4.2 3.4 1999 ....................................... 139.8 141.4 142.6 143.8 .9 1.1 .8 .8 3.4 3.8 3.4 3.8
Service-producing industries,white-collar occupations:
1987 ....................................... – 91.6 92.6 92.9 – – 1.1 .3 – – – – 1988 ....................................... 93.7 95.1 96.3 97.5 .9 1.5 1.3 1.2 – 3.8 4.0 5.0 1989 ....................................... 99.0 100.0 101.5 102.5 1.5 1.0 1.5 1.0 5.7 5.2 5.4 5.1 1990 ....................................... 103.6 105.0 106.1 106.8 1.1 1.4 1.0 .7 4.6 5.0 4.5 4.2 1991 ....................................... 108.1 109.3 110.3 110.7 1.2 1.1 .9 .4 4.3 4.1 4.0 3.7 1992 ....................................... 111.7 112.2 112.8 113.6 .9 .4 .5 .7 3.3 2.7 2.3 2.6 1993 ....................................... 114.5 115.2 116.5 117.3 .8 .6 1.1 .7 2.5 2.7 3.3 3.3 1994 ....................................... 118.0 118.9 119.9 120.4 .6 .8 .8 .4 3.1 3.2 2.9 2.6 1995 ....................................... 121.3 122.3 123.2 124.0 .7 .8 .7 .6 2.8 2.9 2.8 3.0 1996 ....................................... 125.6 126.8 127.8 128.5 1.3 1.0 .8 .5 3.5 3.7 3.7 3.6 1997 ....................................... 130.1 131.2 132.6 134.3 1.2 .8 1.1 1.3 3.6 3.5 3.8 4.5 1998 ....................................... 135.7 137.0 139.2 140.1 1.0 1.0 1.6 .6 4.3 4.4 5.0 4.3 1999 ....................................... 140.3 142.3 143.8 145.0 .1 1.4 1.1 .8 3.4 3.9 3.3 3.5
Service-producing industries,white-collar occupations,excluding sales:
1987 ....................................... – 91.7 93.1 93.7 – – 1.5 .6 – – – – 1988 ....................................... 94.5 95.5 96.9 97.9 .9 1.1 1.5 1.0 – 4.1 4.1 4.5 1989 ....................................... 99.2 100.0 101.3 102.1 1.3 .8 1.3 .8 5.0 4.7 4.5 4.3 1990 ....................................... 103.8 105.0 106.4 107.2 1.7 1.2 1.3 .8 4.6 5.0 5.0 5.0 1991 ....................................... 108.5 109.5 110.9 111.6 1.2 .9 1.3 .6 4.5 4.3 4.2 4.1 1992 ....................................... 112.4 113.1 114.0 114.7 .7 .6 .8 .6 3.6 3.3 2.8 2.8 1993 ....................................... 116.0 116.8 117.8 118.7 1.1 .7 .9 .8 3.2 3.3 3.3 3.5 1994 ....................................... 119.6 120.4 121.5 122.1 .8 .7 .9 .5 3.1 3.1 3.1 2.9 1995 ....................................... 123.2 123.8 124.7 125.6 .9 .5 .7 .7 3.0 2.8 2.6 2.9 1996 ....................................... 127.2 128.1 129.5 129.9 1.3 .7 1.1 .3 3.2 3.5 3.8 3.4 1997 ....................................... 131.5 132.7 134.2 135.9 1.2 .9 1.1 1.3 3.4 3.6 3.6 4.6 1998 ....................................... 137.3 138.4 140.2 140.7 1.0 .8 1.3 .4 4.4 4.3 4.5 3.5 1999 ....................................... 142.0 143.7 145.1 146.4 .9 1.2 1.0 .9 3.4 3.8 3.5 4.1
Service-producing industries,blue-collar occupations:
1987 ....................................... – 93.2 94.1 94.8 – – 1.0 .7 – – – – 1988 ....................................... 95.9 96.7 97.5 98.0 1.2 .8 .8 .5 – 3.8 3.6 3.4 1989 ....................................... 99.0 100.0 100.9 100.9 1.0 1.0 .9 .0 3.2 3.4 3.5 3.0 1990 ....................................... 102.1 103.3 104.2 104.7 1.2 1.2 .9 .5 3.1 3.3 3.3 3.8 1991 ....................................... 105.6 106.5 107.3 107.8 .9 .9 .8 .5 3.4 3.1 3.0 3.0 1992 ....................................... 108.7 109.7 110.3 111.0 .8 .9 .5 .6 2.9 3.0 2.8 3.0 1993 ....................................... 111.9 112.9 114.1 114.6 .8 .9 1.1 .4 2.9 2.9 3.4 3.2 1994 ....................................... 115.5 116.2 117.5 117.6 .8 .6 1.1 .1 3.2 2.9 3.0 2.6 1995 ....................................... 119.2 120.3 121.1 121.4 1.4 .9 .7 .2 3.2 3.5 3.1 3.2 1996 ....................................... 122.7 123.5 123.8 124.8 1.1 .7 .2 .8 2.9 2.7 2.2 2.8 1997 ....................................... 126.0 127.2 127.9 128.9 1.0 1.0 .6 .8 2.7 3.0 3.3 3.3 1998 ....................................... 130.2 131.1 132.4 132.9 1.0 .7 1.0 .4 3.3 3.1 3.5 3.1 1999 ....................................... 134.4 135.9 137.0 137.8 1.1 1.1 .8 .6 3.2 3.7 3.5 3.7
Service-producing industries,service occupations:
1987 ....................................... – 93.6 94.1 94.4 – – .5 .3 – – – – 1988 ....................................... 95.3 96.3 97.7 98.8 1.0 1.0 1.5 1.1 – 2.9 3.8 4.7
See footnotes at end of table.
94

Table 10. Wages and salaries, private industry workers: Employment Cost Index by occupational and industrygroup, 1975-99
(Not seasonally adjusted) — Continued
Series and year
Indexes (June 1989=100) Percent changes for
March June Sept. Dec.3 months ended– 12 months ended–
March June Sept. Dec. March June Sept. Dec.
Service-producing industries,service occupations:
1989 ....................................... 99.4 100.0 100.8 102.3 0.6 0.6 0.8 1.5 4.3 3.8 3.2 3.5 1990 ....................................... 103.2 104.3 105.0 106.5 .9 1.1 .7 1.4 3.8 4.3 4.2 4.1 1991 ....................................... 107.0 108.4 110.0 110.7 .5 1.3 1.5 .6 3.7 3.9 4.8 3.9 1992 ....................................... 111.3 111.7 112.6 112.9 .5 .4 .8 .3 4.0 3.0 2.4 2.0 1993 ....................................... 113.5 114.1 114.9 115.2 .5 .5 .7 .3 2.0 2.1 2.0 2.0 1994 ....................................... 116.3 116.7 117.3 118.7 1.0 .3 .5 1.2 2.5 2.3 2.1 3.0 1995 ....................................... 119.3 119.8 120.7 121.3 .5 .4 .8 .5 2.6 2.7 2.9 2.2 1996 ....................................... 122.0 122.8 124.0 125.6 .6 .7 1.0 1.3 2.3 2.5 2.7 3.5 1997 ....................................... 126.5 127.5 129.8 131.0 .7 .8 1.8 .9 3.7 3.8 4.7 4.3 1998 ....................................... 132.1 133.0 134.2 135.2 .8 .7 .9 .7 4.4 4.3 3.4 3.2 1999 ....................................... 136.7 137.8 138.0 139.6 1.1 .8 .1 1.2 3.5 3.6 2.8 3.3
Transportation and publicutilities7:
1975 ....................................... – – 44.3 45.5 – – – 2.7 – – – – 1976 ....................................... 46.4 47.7 48.3 49.4 2.0 2.8 1.3 2.3 – – 9.0 8.6 1977 ....................................... 50.3 51.8 52.9 54.0 1.8 3.0 2.1 2.1 8.4 8.6 9.5 9.3 1978 ....................................... 54.8 55.9 57.1 58.1 1.5 2.0 2.1 1.8 8.9 7.9 7.9 7.6 1979 ....................................... 59.6 60.6 62.3 63.6 2.6 1.7 2.8 2.1 8.8 8.4 9.1 9.5 1980 ....................................... 65.2 66.7 68.8 70.7 2.5 2.3 3.1 2.8 9.4 10.1 10.4 11.2 1981 ....................................... 72.2 73.9 75.4 76.6 2.1 2.4 2.0 1.6 10.7 10.8 9.6 8.3 1982 ....................................... 78.1 79.0 80.9 82.1 2.0 1.2 2.4 1.5 8.2 6.9 7.3 7.2 1983 ....................................... 83.4 84.8 85.5 86.3 1.6 1.7 .8 .9 6.8 7.3 5.7 5.1 1984 ....................................... 87.6 88.2 88.6 89.2 1.5 .7 .5 .7 5.0 4.0 3.6 3.4 1985 ....................................... 89.9 90.8 92.2 92.5 .8 1.0 1.5 .3 2.6 2.9 4.1 3.7 1986 ....................................... 93.3 93.6 94.1 94.2 .9 .3 .5 .1 3.8 3.1 2.1 1.8 1987 ....................................... 94.7 95.6 96.1 96.2 .5 1.0 .5 .1 1.5 2.1 2.1 2.1 1988 ....................................... 97.0 97.9 98.7 98.6 .8 .9 .8 -.1 2.4 2.4 2.7 2.5 1989 ....................................... 99.5 100.0 100.7 101.2 .9 .5 .7 .5 2.6 2.1 2.0 2.6 1990 ....................................... 102.6 103.2 104.1 104.6 1.4 .6 .9 .5 3.1 3.2 3.4 3.4 1991 ....................................... 105.4 106.6 107.7 108.4 .8 1.1 1.0 .6 2.7 3.3 3.5 3.6 1992 ....................................... 109.7 110.6 111.2 111.8 1.2 .8 .5 .5 4.1 3.8 3.2 3.1 1993 ....................................... 112.9 114.0 114.7 115.4 1.0 1.0 .6 .6 2.9 3.1 3.1 3.2 1994 ....................................... 116.4 117.2 118.9 119.6 .9 .7 1.5 .6 3.1 2.8 3.7 3.6 1995 ....................................... 121.2 122.0 122.9 123.7 1.3 .7 .7 .7 4.1 4.1 3.4 3.4 1996 ....................................... 124.6 125.0 125.9 127.0 .7 .3 .7 .9 2.8 2.5 2.4 2.7 1997 ....................................... 128.2 128.8 130.1 131.3 .9 .5 1.0 .9 2.9 3.0 3.3 3.4 1998 ....................................... 132.1 132.8 134.3 135.1 .6 .5 1.1 .6 3.0 3.1 3.2 2.9 1999 ....................................... 135.4 136.8 137.5 137.9 .2 1.0 .5 .3 2.5 3.0 2.4 2.1
Transportation2,7: 1985 ....................................... 91.2 92.2 93.6 93.5 – 1.1 1.5 -.1 – – – – 1986 ....................................... 94.5 94.5 95.0 94.7 1.1 .0 .5 -.3 3.6 2.5 1.5 1.3 1987 ....................................... 94.9 96.1 96.5 96.3 .2 1.3 .4 -.2 .4 1.7 1.6 1.7 1988 ....................................... 97.1 98.2 99.0 98.7 .8 1.1 .8 -.3 2.3 2.2 2.6 2.5 1989 ....................................... 99.4 100.0 100.6 100.7 .7 .6 .6 .1 2.4 1.8 1.6 2.0 1990 ....................................... 102.3 102.3 103.3 103.5 1.6 .0 1.0 .2 2.9 2.3 2.7 2.8 1991 ....................................... 104.3 105.5 106.6 107.0 .8 1.2 1.0 .4 2.0 3.1 3.2 3.4 1992 ....................................... 108.3 109.2 109.8 109.9 1.2 .8 .5 .1 3.8 3.5 3.0 2.7 1993 ....................................... 110.8 112.0 112.6 113.4 .8 1.1 .5 .7 2.3 2.6 2.6 3.2 1994 ....................................... 114.2 114.8 116.7 117.5 .7 .5 1.7 .7 3.1 2.5 3.6 3.6 1995 ....................................... 119.0 119.8 121.0 121.6 1.3 .7 1.0 .5 4.2 4.4 3.7 3.5 1996 ....................................... 122.9 123.2 123.8 124.7 1.1 .2 .5 .7 3.3 2.8 2.3 2.5 1997 ....................................... 126.5 126.9 128.5 129.5 1.4 .3 1.3 .8 2.9 3.0 3.8 3.8 1998 ....................................... 130.1 130.4 132.4 132.9 .5 .2 1.5 .4 2.8 2.8 3.0 2.6 1999 ....................................... 132.3 133.7 134.4 134.9 -.5 1.1 .5 .4 1.7 2.5 1.5 1.5
See footnotes at end of table.
95
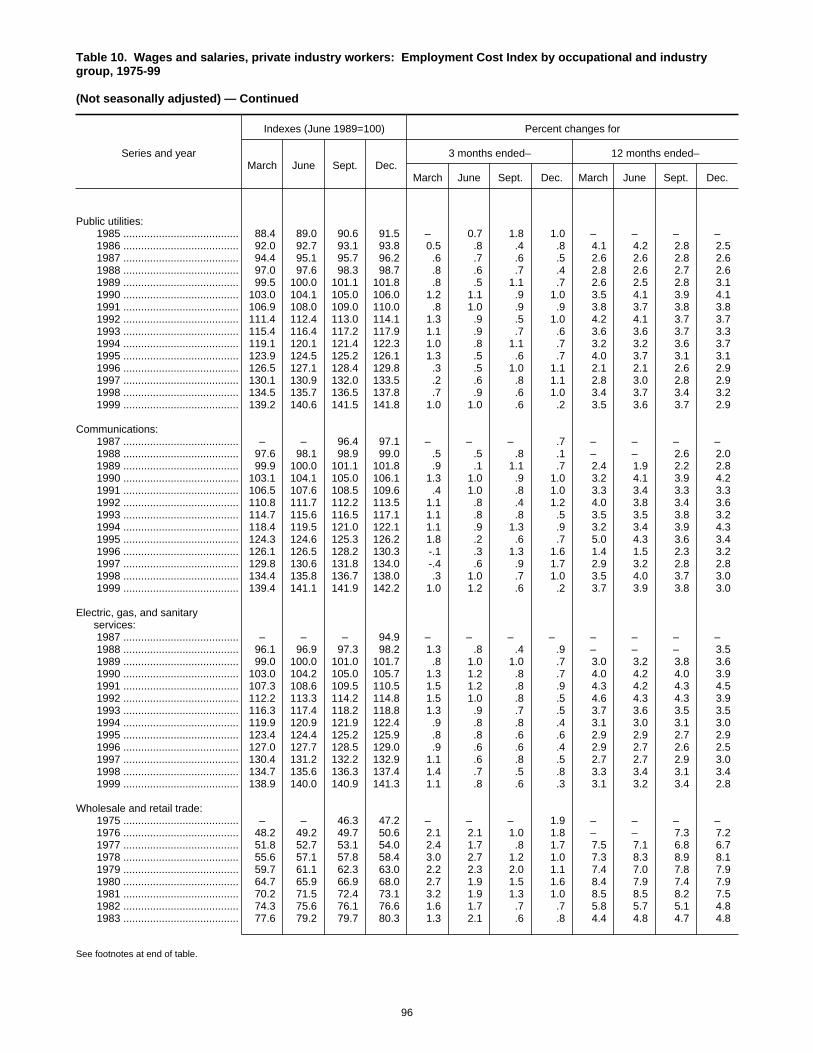
Table 10. Wages and salaries, private industry workers: Employment Cost Index by occupational and industrygroup, 1975-99
(Not seasonally adjusted) — Continued
Series and year
Indexes (June 1989=100) Percent changes for
March June Sept. Dec.3 months ended– 12 months ended–
March June Sept. Dec. March June Sept. Dec.
Public utilities: 1985 ....................................... 88.4 89.0 90.6 91.5 – 0.7 1.8 1.0 – – – – 1986 ....................................... 92.0 92.7 93.1 93.8 0.5 .8 .4 .8 4.1 4.2 2.8 2.5 1987 ....................................... 94.4 95.1 95.7 96.2 .6 .7 .6 .5 2.6 2.6 2.8 2.6 1988 ....................................... 97.0 97.6 98.3 98.7 .8 .6 .7 .4 2.8 2.6 2.7 2.6 1989 ....................................... 99.5 100.0 101.1 101.8 .8 .5 1.1 .7 2.6 2.5 2.8 3.1 1990 ....................................... 103.0 104.1 105.0 106.0 1.2 1.1 .9 1.0 3.5 4.1 3.9 4.1 1991 ....................................... 106.9 108.0 109.0 110.0 .8 1.0 .9 .9 3.8 3.7 3.8 3.8 1992 ....................................... 111.4 112.4 113.0 114.1 1.3 .9 .5 1.0 4.2 4.1 3.7 3.7 1993 ....................................... 115.4 116.4 117.2 117.9 1.1 .9 .7 .6 3.6 3.6 3.7 3.3 1994 ....................................... 119.1 120.1 121.4 122.3 1.0 .8 1.1 .7 3.2 3.2 3.6 3.7 1995 ....................................... 123.9 124.5 125.2 126.1 1.3 .5 .6 .7 4.0 3.7 3.1 3.1 1996 ....................................... 126.5 127.1 128.4 129.8 .3 .5 1.0 1.1 2.1 2.1 2.6 2.9 1997 ....................................... 130.1 130.9 132.0 133.5 .2 .6 .8 1.1 2.8 3.0 2.8 2.9 1998 ....................................... 134.5 135.7 136.5 137.8 .7 .9 .6 1.0 3.4 3.7 3.4 3.2 1999 ....................................... 139.2 140.6 141.5 141.8 1.0 1.0 .6 .2 3.5 3.6 3.7 2.9
Communications: 1987 ....................................... – – 96.4 97.1 – – – .7 – – – – 1988 ....................................... 97.6 98.1 98.9 99.0 .5 .5 .8 .1 – – 2.6 2.0 1989 ....................................... 99.9 100.0 101.1 101.8 .9 .1 1.1 .7 2.4 1.9 2.2 2.8 1990 ....................................... 103.1 104.1 105.0 106.1 1.3 1.0 .9 1.0 3.2 4.1 3.9 4.2 1991 ....................................... 106.5 107.6 108.5 109.6 .4 1.0 .8 1.0 3.3 3.4 3.3 3.3 1992 ....................................... 110.8 111.7 112.2 113.5 1.1 .8 .4 1.2 4.0 3.8 3.4 3.6 1993 ....................................... 114.7 115.6 116.5 117.1 1.1 .8 .8 .5 3.5 3.5 3.8 3.2 1994 ....................................... 118.4 119.5 121.0 122.1 1.1 .9 1.3 .9 3.2 3.4 3.9 4.3 1995 ....................................... 124.3 124.6 125.3 126.2 1.8 .2 .6 .7 5.0 4.3 3.6 3.4 1996 ....................................... 126.1 126.5 128.2 130.3 -.1 .3 1.3 1.6 1.4 1.5 2.3 3.2 1997 ....................................... 129.8 130.6 131.8 134.0 -.4 .6 .9 1.7 2.9 3.2 2.8 2.8 1998 ....................................... 134.4 135.8 136.7 138.0 .3 1.0 .7 1.0 3.5 4.0 3.7 3.0 1999 ....................................... 139.4 141.1 141.9 142.2 1.0 1.2 .6 .2 3.7 3.9 3.8 3.0
Electric, gas, and sanitaryservices:
1987 ....................................... – – – 94.9 – – – – – – – – 1988 ....................................... 96.1 96.9 97.3 98.2 1.3 .8 .4 .9 – – – 3.5 1989 ....................................... 99.0 100.0 101.0 101.7 .8 1.0 1.0 .7 3.0 3.2 3.8 3.6 1990 ....................................... 103.0 104.2 105.0 105.7 1.3 1.2 .8 .7 4.0 4.2 4.0 3.9 1991 ....................................... 107.3 108.6 109.5 110.5 1.5 1.2 .8 .9 4.3 4.2 4.3 4.5 1992 ....................................... 112.2 113.3 114.2 114.8 1.5 1.0 .8 .5 4.6 4.3 4.3 3.9 1993 ....................................... 116.3 117.4 118.2 118.8 1.3 .9 .7 .5 3.7 3.6 3.5 3.5 1994 ....................................... 119.9 120.9 121.9 122.4 .9 .8 .8 .4 3.1 3.0 3.1 3.0 1995 ....................................... 123.4 124.4 125.2 125.9 .8 .8 .6 .6 2.9 2.9 2.7 2.9 1996 ....................................... 127.0 127.7 128.5 129.0 .9 .6 .6 .4 2.9 2.7 2.6 2.5 1997 ....................................... 130.4 131.2 132.2 132.9 1.1 .6 .8 .5 2.7 2.7 2.9 3.0 1998 ....................................... 134.7 135.6 136.3 137.4 1.4 .7 .5 .8 3.3 3.4 3.1 3.4 1999 ....................................... 138.9 140.0 140.9 141.3 1.1 .8 .6 .3 3.1 3.2 3.4 2.8
Wholesale and retail trade: 1975 ....................................... – – 46.3 47.2 – – – 1.9 – – – – 1976 ....................................... 48.2 49.2 49.7 50.6 2.1 2.1 1.0 1.8 – – 7.3 7.2 1977 ....................................... 51.8 52.7 53.1 54.0 2.4 1.7 .8 1.7 7.5 7.1 6.8 6.7 1978 ....................................... 55.6 57.1 57.8 58.4 3.0 2.7 1.2 1.0 7.3 8.3 8.9 8.1 1979 ....................................... 59.7 61.1 62.3 63.0 2.2 2.3 2.0 1.1 7.4 7.0 7.8 7.9 1980 ....................................... 64.7 65.9 66.9 68.0 2.7 1.9 1.5 1.6 8.4 7.9 7.4 7.9 1981 ....................................... 70.2 71.5 72.4 73.1 3.2 1.9 1.3 1.0 8.5 8.5 8.2 7.5 1982 ....................................... 74.3 75.6 76.1 76.6 1.6 1.7 .7 .7 5.8 5.7 5.1 4.8 1983 ....................................... 77.6 79.2 79.7 80.3 1.3 2.1 .6 .8 4.4 4.8 4.7 4.8
See footnotes at end of table.
96
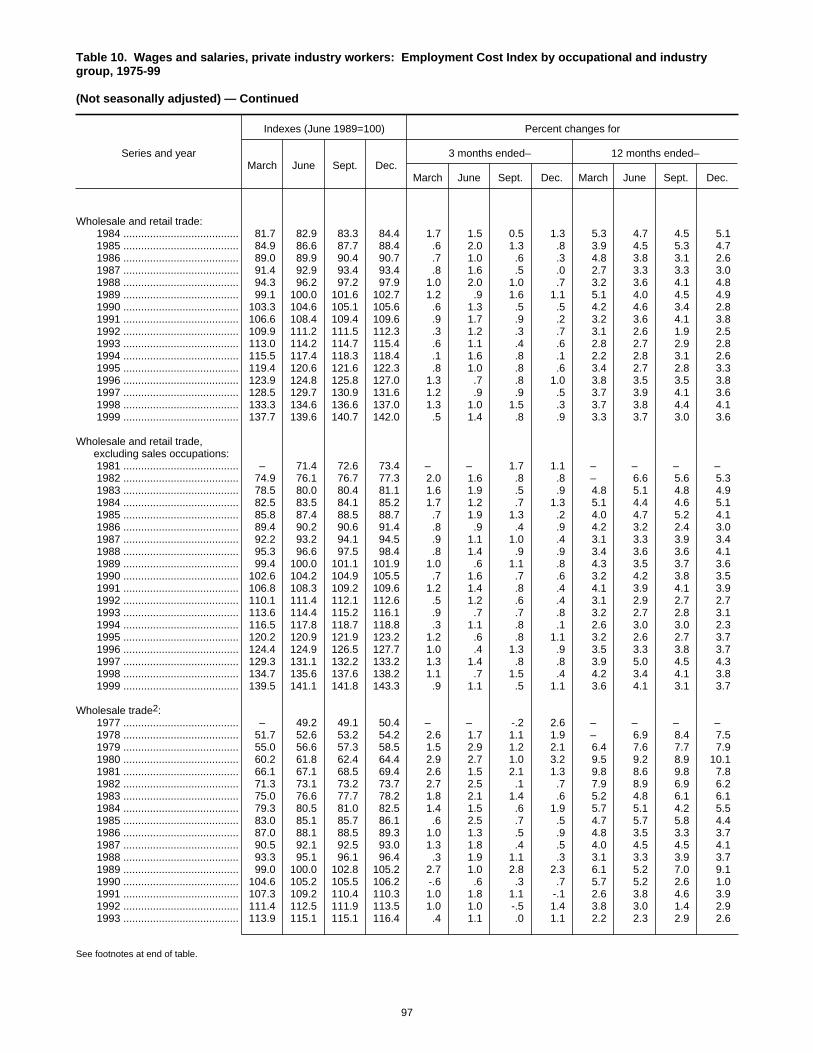
Table 10. Wages and salaries, private industry workers: Employment Cost Index by occupational and industrygroup, 1975-99
(Not seasonally adjusted) — Continued
Series and year
Indexes (June 1989=100) Percent changes for
March June Sept. Dec.3 months ended– 12 months ended–
March June Sept. Dec. March June Sept. Dec.
Wholesale and retail trade: 1984 ....................................... 81.7 82.9 83.3 84.4 1.7 1.5 0.5 1.3 5.3 4.7 4.5 5.1 1985 ....................................... 84.9 86.6 87.7 88.4 .6 2.0 1.3 .8 3.9 4.5 5.3 4.7 1986 ....................................... 89.0 89.9 90.4 90.7 .7 1.0 .6 .3 4.8 3.8 3.1 2.6 1987 ....................................... 91.4 92.9 93.4 93.4 .8 1.6 .5 .0 2.7 3.3 3.3 3.0 1988 ....................................... 94.3 96.2 97.2 97.9 1.0 2.0 1.0 .7 3.2 3.6 4.1 4.8 1989 ....................................... 99.1 100.0 101.6 102.7 1.2 .9 1.6 1.1 5.1 4.0 4.5 4.9 1990 ....................................... 103.3 104.6 105.1 105.6 .6 1.3 .5 .5 4.2 4.6 3.4 2.8 1991 ....................................... 106.6 108.4 109.4 109.6 .9 1.7 .9 .2 3.2 3.6 4.1 3.8 1992 ....................................... 109.9 111.2 111.5 112.3 .3 1.2 .3 .7 3.1 2.6 1.9 2.5 1993 ....................................... 113.0 114.2 114.7 115.4 .6 1.1 .4 .6 2.8 2.7 2.9 2.8 1994 ....................................... 115.5 117.4 118.3 118.4 .1 1.6 .8 .1 2.2 2.8 3.1 2.6 1995 ....................................... 119.4 120.6 121.6 122.3 .8 1.0 .8 .6 3.4 2.7 2.8 3.3 1996 ....................................... 123.9 124.8 125.8 127.0 1.3 .7 .8 1.0 3.8 3.5 3.5 3.8 1997 ....................................... 128.5 129.7 130.9 131.6 1.2 .9 .9 .5 3.7 3.9 4.1 3.6 1998 ....................................... 133.3 134.6 136.6 137.0 1.3 1.0 1.5 .3 3.7 3.8 4.4 4.1 1999 ....................................... 137.7 139.6 140.7 142.0 .5 1.4 .8 .9 3.3 3.7 3.0 3.6
Wholesale and retail trade,excluding sales occupations:
1981 ....................................... – 71.4 72.6 73.4 – – 1.7 1.1 – – – – 1982 ....................................... 74.9 76.1 76.7 77.3 2.0 1.6 .8 .8 – 6.6 5.6 5.3 1983 ....................................... 78.5 80.0 80.4 81.1 1.6 1.9 .5 .9 4.8 5.1 4.8 4.9 1984 ....................................... 82.5 83.5 84.1 85.2 1.7 1.2 .7 1.3 5.1 4.4 4.6 5.1 1985 ....................................... 85.8 87.4 88.5 88.7 .7 1.9 1.3 .2 4.0 4.7 5.2 4.1 1986 ....................................... 89.4 90.2 90.6 91.4 .8 .9 .4 .9 4.2 3.2 2.4 3.0 1987 ....................................... 92.2 93.2 94.1 94.5 .9 1.1 1.0 .4 3.1 3.3 3.9 3.4 1988 ....................................... 95.3 96.6 97.5 98.4 .8 1.4 .9 .9 3.4 3.6 3.6 4.1 1989 ....................................... 99.4 100.0 101.1 101.9 1.0 .6 1.1 .8 4.3 3.5 3.7 3.6 1990 ....................................... 102.6 104.2 104.9 105.5 .7 1.6 .7 .6 3.2 4.2 3.8 3.5 1991 ....................................... 106.8 108.3 109.2 109.6 1.2 1.4 .8 .4 4.1 3.9 4.1 3.9 1992 ....................................... 110.1 111.4 112.1 112.6 .5 1.2 .6 .4 3.1 2.9 2.7 2.7 1993 ....................................... 113.6 114.4 115.2 116.1 .9 .7 .7 .8 3.2 2.7 2.8 3.1 1994 ....................................... 116.5 117.8 118.7 118.8 .3 1.1 .8 .1 2.6 3.0 3.0 2.3 1995 ....................................... 120.2 120.9 121.9 123.2 1.2 .6 .8 1.1 3.2 2.6 2.7 3.7 1996 ....................................... 124.4 124.9 126.5 127.7 1.0 .4 1.3 .9 3.5 3.3 3.8 3.7 1997 ....................................... 129.3 131.1 132.2 133.2 1.3 1.4 .8 .8 3.9 5.0 4.5 4.3 1998 ....................................... 134.7 135.6 137.6 138.2 1.1 .7 1.5 .4 4.2 3.4 4.1 3.8 1999 ....................................... 139.5 141.1 141.8 143.3 .9 1.1 .5 1.1 3.6 4.1 3.1 3.7
Wholesale trade2: 1977 ....................................... – 49.2 49.1 50.4 – – -.2 2.6 – – – – 1978 ....................................... 51.7 52.6 53.2 54.2 2.6 1.7 1.1 1.9 – 6.9 8.4 7.5 1979 ....................................... 55.0 56.6 57.3 58.5 1.5 2.9 1.2 2.1 6.4 7.6 7.7 7.9 1980 ....................................... 60.2 61.8 62.4 64.4 2.9 2.7 1.0 3.2 9.5 9.2 8.9 10.1 1981 ....................................... 66.1 67.1 68.5 69.4 2.6 1.5 2.1 1.3 9.8 8.6 9.8 7.8 1982 ....................................... 71.3 73.1 73.2 73.7 2.7 2.5 .1 .7 7.9 8.9 6.9 6.2 1983 ....................................... 75.0 76.6 77.7 78.2 1.8 2.1 1.4 .6 5.2 4.8 6.1 6.1 1984 ....................................... 79.3 80.5 81.0 82.5 1.4 1.5 .6 1.9 5.7 5.1 4.2 5.5 1985 ....................................... 83.0 85.1 85.7 86.1 .6 2.5 .7 .5 4.7 5.7 5.8 4.4 1986 ....................................... 87.0 88.1 88.5 89.3 1.0 1.3 .5 .9 4.8 3.5 3.3 3.7 1987 ....................................... 90.5 92.1 92.5 93.0 1.3 1.8 .4 .5 4.0 4.5 4.5 4.1 1988 ....................................... 93.3 95.1 96.1 96.4 .3 1.9 1.1 .3 3.1 3.3 3.9 3.7 1989 ....................................... 99.0 100.0 102.8 105.2 2.7 1.0 2.8 2.3 6.1 5.2 7.0 9.1 1990 ....................................... 104.6 105.2 105.5 106.2 -.6 .6 .3 .7 5.7 5.2 2.6 1.0 1991 ....................................... 107.3 109.2 110.4 110.3 1.0 1.8 1.1 -.1 2.6 3.8 4.6 3.9 1992 ....................................... 111.4 112.5 111.9 113.5 1.0 1.0 -.5 1.4 3.8 3.0 1.4 2.9 1993 ....................................... 113.9 115.1 115.1 116.4 .4 1.1 .0 1.1 2.2 2.3 2.9 2.6
See footnotes at end of table.
97

Table 10. Wages and salaries, private industry workers: Employment Cost Index by occupational and industrygroup, 1975-99
(Not seasonally adjusted) — Continued
Series and year
Indexes (June 1989=100) Percent changes for
March June Sept. Dec.3 months ended– 12 months ended–
March June Sept. Dec. March June Sept. Dec.
Wholesale trade2: 1994 ....................................... 116.2 118.3 118.9 119.9 -0.2 1.8 0.5 0.8 2.0 2.8 3.3 3.0 1995 ....................................... 120.9 122.7 123.9 125.5 .8 1.5 1.0 1.3 4.0 3.7 4.2 4.7 1996 ....................................... 126.1 128.0 128.5 129.6 .5 1.5 .4 .9 4.3 4.3 3.7 3.3 1997 ....................................... 131.4 132.2 133.0 133.6 1.4 .6 .6 .5 4.2 3.3 3.5 3.1 1998 ....................................... 136.2 137.1 139.3 141.3 1.9 .7 1.6 1.4 3.7 3.7 4.7 5.8 1999 ....................................... 140.7 142.3 144.3 146.5 -.4 1.1 1.4 1.5 3.3 3.8 3.6 3.7
Wholesale trade, excluding salesoccupations2:
1981 ....................................... – 70.0 71.6 72.7 – – 2.3 1.5 – – – – 1982 ....................................... 74.9 76.6 77.0 77.3 3.0 2.3 .5 .4 – 9.4 7.5 6.3 1983 ....................................... 78.9 80.1 80.9 81.6 2.1 1.5 1.0 .9 5.3 4.6 5.1 5.6 1984 ....................................... 82.9 83.5 84.5 85.8 1.6 .7 1.2 1.5 5.1 4.2 4.4 5.1 1985 ....................................... 86.5 87.8 88.7 88.9 .8 1.5 1.0 .2 4.3 5.1 5.0 3.6 1986 ....................................... 89.4 90.6 91.0 91.8 .6 1.3 .4 .9 3.4 3.2 2.6 3.3 1987 ....................................... 92.7 93.3 94.4 95.2 1.0 .6 1.2 .8 3.7 3.0 3.7 3.7 1988 ....................................... 95.7 96.7 97.7 98.3 .5 1.0 1.0 .6 3.2 3.6 3.5 3.3 1989 ....................................... 99.2 100.0 101.7 102.5 .9 .8 1.7 .8 3.7 3.4 4.1 4.3 1990 ....................................... 103.2 104.7 105.2 105.9 .7 1.5 .5 .7 4.0 4.7 3.4 3.3 1991 ....................................... 107.9 109.2 109.8 110.5 1.9 1.2 .5 .6 4.6 4.3 4.4 4.3 1992 ....................................... 111.5 112.7 113.3 114.1 .9 1.1 .5 .7 3.3 3.2 3.2 3.3 1993 ....................................... 114.7 115.5 116.3 117.5 .5 .7 .7 1.0 2.9 2.5 2.6 3.0 1994 ....................................... 117.8 118.8 119.6 120.2 .3 .8 .7 .5 2.7 2.9 2.8 2.3 1995 ....................................... 122.2 122.9 123.7 125.7 1.7 .6 .7 1.6 3.7 3.5 3.4 4.6 1996 ....................................... 126.3 127.6 128.9 129.8 .5 1.0 1.0 .7 3.4 3.8 4.2 3.3 1997 ....................................... 131.8 132.8 133.9 135.0 1.5 .8 .8 .8 4.4 4.1 3.9 4.0 1998 ....................................... 136.5 137.8 139.6 140.8 1.1 1.0 1.3 .9 3.6 3.8 4.3 4.3 1999 ....................................... 141.9 143.0 144.8 146.4 .8 .8 1.3 1.1 4.0 3.8 3.7 4.0
Retail trade: 1976 ....................................... – – 51.7 52.5 – – – 1.5 – – – – 1977 ....................................... 53.2 54.1 54.9 55.5 1.3 1.7 1.5 1.1 – – 6.2 5.7 1978 ....................................... 57.3 59.1 59.8 60.3 3.2 3.1 1.2 .8 7.7 9.2 8.9 8.6 1979 ....................................... 61.6 63.0 64.4 65.0 2.2 2.3 2.2 .9 7.5 6.6 7.7 7.8 1980 ....................................... 66.6 67.6 68.8 69.6 2.5 1.5 1.8 1.2 8.1 7.3 6.8 7.1 1981 ....................................... 72.0 73.4 74.1 74.8 3.4 1.9 1.0 .9 8.1 8.6 7.7 7.5 1982 ....................................... 75.6 76.7 77.4 77.8 1.1 1.5 .9 .5 5.0 4.5 4.5 4.0 1983 ....................................... 78.7 80.3 80.6 81.1 1.2 2.0 .4 .6 4.1 4.7 4.1 4.2 1984 ....................................... 82.8 83.9 84.3 85.3 2.1 1.3 .5 1.2 5.2 4.5 4.6 5.2 1985 ....................................... 85.8 87.2 88.6 89.4 .6 1.6 1.6 .9 3.6 3.9 5.1 4.8 1986 ....................................... 89.9 90.8 91.3 91.3 .6 1.0 .6 .0 4.8 4.1 3.0 2.1 1987 ....................................... 91.9 93.3 93.8 93.7 .7 1.5 .5 -.1 2.2 2.8 2.7 2.6 1988 ....................................... 94.8 96.6 97.7 98.5 1.2 1.9 1.1 .8 3.2 3.5 4.2 5.1 1989 ....................................... 99.1 100.0 101.0 101.6 .6 .9 1.0 .6 4.5 3.5 3.4 3.1 1990 ....................................... 102.7 104.4 105.0 105.3 1.1 1.7 .6 .3 3.6 4.4 4.0 3.6 1991 ....................................... 106.2 108.0 109.0 109.2 .9 1.7 .9 .2 3.4 3.4 3.8 3.7 1992 ....................................... 109.3 110.6 111.3 111.8 .1 1.2 .6 .4 2.9 2.4 2.1 2.4 1993 ....................................... 112.6 113.8 114.5 115.0 .7 1.1 .6 .4 3.0 2.9 2.9 2.9 1994 ....................................... 115.2 117.0 118.0 117.8 .2 1.6 .9 -.2 2.3 2.8 3.1 2.4 1995 ....................................... 118.7 119.6 120.5 120.6 .8 .8 .8 .1 3.0 2.2 2.1 2.4 1996 ....................................... 122.8 123.1 124.4 125.8 1.8 .2 1.1 1.1 3.5 2.9 3.2 4.3 1997 ....................................... 127.1 128.5 129.9 130.6 1.0 1.1 1.1 .5 3.5 4.4 4.4 3.8 1998 ....................................... 131.9 133.3 135.2 134.8 1.0 1.1 1.4 -.3 3.8 3.7 4.1 3.2 1999 ....................................... 136.2 138.3 138.9 139.6 1.0 1.5 .4 .5 3.3 3.8 2.7 3.6
General merchandise stores2: 1988 ....................................... – 95.6 97.0 98.2 – – 1.5 1.2 – – – –
See footnotes at end of table.
98
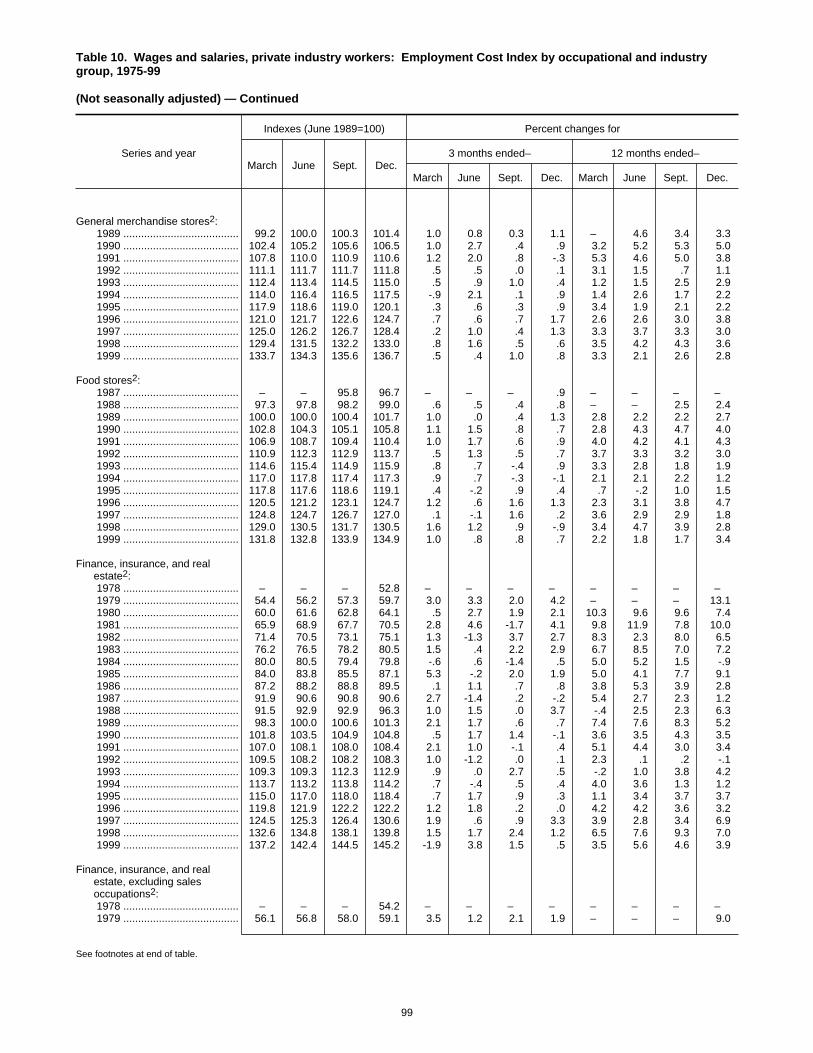
Table 10. Wages and salaries, private industry workers: Employment Cost Index by occupational and industrygroup, 1975-99
(Not seasonally adjusted) — Continued
Series and year
Indexes (June 1989=100) Percent changes for
March June Sept. Dec.3 months ended– 12 months ended–
March June Sept. Dec. March June Sept. Dec.
General merchandise stores2: 1989 ....................................... 99.2 100.0 100.3 101.4 1.0 0.8 0.3 1.1 – 4.6 3.4 3.3 1990 ....................................... 102.4 105.2 105.6 106.5 1.0 2.7 .4 .9 3.2 5.2 5.3 5.0 1991 ....................................... 107.8 110.0 110.9 110.6 1.2 2.0 .8 -.3 5.3 4.6 5.0 3.8 1992 ....................................... 111.1 111.7 111.7 111.8 .5 .5 .0 .1 3.1 1.5 .7 1.1 1993 ....................................... 112.4 113.4 114.5 115.0 .5 .9 1.0 .4 1.2 1.5 2.5 2.9 1994 ....................................... 114.0 116.4 116.5 117.5 -.9 2.1 .1 .9 1.4 2.6 1.7 2.2 1995 ....................................... 117.9 118.6 119.0 120.1 .3 .6 .3 .9 3.4 1.9 2.1 2.2 1996 ....................................... 121.0 121.7 122.6 124.7 .7 .6 .7 1.7 2.6 2.6 3.0 3.8 1997 ....................................... 125.0 126.2 126.7 128.4 .2 1.0 .4 1.3 3.3 3.7 3.3 3.0 1998 ....................................... 129.4 131.5 132.2 133.0 .8 1.6 .5 .6 3.5 4.2 4.3 3.6 1999 ....................................... 133.7 134.3 135.6 136.7 .5 .4 1.0 .8 3.3 2.1 2.6 2.8
Food stores2: 1987 ....................................... – – 95.8 96.7 – – – .9 – – – – 1988 ....................................... 97.3 97.8 98.2 99.0 .6 .5 .4 .8 – – 2.5 2.4 1989 ....................................... 100.0 100.0 100.4 101.7 1.0 .0 .4 1.3 2.8 2.2 2.2 2.7 1990 ....................................... 102.8 104.3 105.1 105.8 1.1 1.5 .8 .7 2.8 4.3 4.7 4.0 1991 ....................................... 106.9 108.7 109.4 110.4 1.0 1.7 .6 .9 4.0 4.2 4.1 4.3 1992 ....................................... 110.9 112.3 112.9 113.7 .5 1.3 .5 .7 3.7 3.3 3.2 3.0 1993 ....................................... 114.6 115.4 114.9 115.9 .8 .7 -.4 .9 3.3 2.8 1.8 1.9 1994 ....................................... 117.0 117.8 117.4 117.3 .9 .7 -.3 -.1 2.1 2.1 2.2 1.2 1995 ....................................... 117.8 117.6 118.6 119.1 .4 -.2 .9 .4 .7 -.2 1.0 1.5 1996 ....................................... 120.5 121.2 123.1 124.7 1.2 .6 1.6 1.3 2.3 3.1 3.8 4.7 1997 ....................................... 124.8 124.7 126.7 127.0 .1 -.1 1.6 .2 3.6 2.9 2.9 1.8 1998 ....................................... 129.0 130.5 131.7 130.5 1.6 1.2 .9 -.9 3.4 4.7 3.9 2.8 1999 ....................................... 131.8 132.8 133.9 134.9 1.0 .8 .8 .7 2.2 1.8 1.7 3.4
Finance, insurance, and realestate2:
1978 ....................................... – – – 52.8 – – – – – – – – 1979 ....................................... 54.4 56.2 57.3 59.7 3.0 3.3 2.0 4.2 – – – 13.1 1980 ....................................... 60.0 61.6 62.8 64.1 .5 2.7 1.9 2.1 10.3 9.6 9.6 7.4 1981 ....................................... 65.9 68.9 67.7 70.5 2.8 4.6 -1.7 4.1 9.8 11.9 7.8 10.0 1982 ....................................... 71.4 70.5 73.1 75.1 1.3 -1.3 3.7 2.7 8.3 2.3 8.0 6.5 1983 ....................................... 76.2 76.5 78.2 80.5 1.5 .4 2.2 2.9 6.7 8.5 7.0 7.2 1984 ....................................... 80.0 80.5 79.4 79.8 -.6 .6 -1.4 .5 5.0 5.2 1.5 -.9 1985 ....................................... 84.0 83.8 85.5 87.1 5.3 -.2 2.0 1.9 5.0 4.1 7.7 9.1 1986 ....................................... 87.2 88.2 88.8 89.5 .1 1.1 .7 .8 3.8 5.3 3.9 2.8 1987 ....................................... 91.9 90.6 90.8 90.6 2.7 -1.4 .2 -.2 5.4 2.7 2.3 1.2 1988 ....................................... 91.5 92.9 92.9 96.3 1.0 1.5 .0 3.7 -.4 2.5 2.3 6.3 1989 ....................................... 98.3 100.0 100.6 101.3 2.1 1.7 .6 .7 7.4 7.6 8.3 5.2 1990 ....................................... 101.8 103.5 104.9 104.8 .5 1.7 1.4 -.1 3.6 3.5 4.3 3.5 1991 ....................................... 107.0 108.1 108.0 108.4 2.1 1.0 -.1 .4 5.1 4.4 3.0 3.4 1992 ....................................... 109.5 108.2 108.2 108.3 1.0 -1.2 .0 .1 2.3 .1 .2 -.1 1993 ....................................... 109.3 109.3 112.3 112.9 .9 .0 2.7 .5 -.2 1.0 3.8 4.2 1994 ....................................... 113.7 113.2 113.8 114.2 .7 -.4 .5 .4 4.0 3.6 1.3 1.2 1995 ....................................... 115.0 117.0 118.0 118.4 .7 1.7 .9 .3 1.1 3.4 3.7 3.7 1996 ....................................... 119.8 121.9 122.2 122.2 1.2 1.8 .2 .0 4.2 4.2 3.6 3.2 1997 ....................................... 124.5 125.3 126.4 130.6 1.9 .6 .9 3.3 3.9 2.8 3.4 6.9 1998 ....................................... 132.6 134.8 138.1 139.8 1.5 1.7 2.4 1.2 6.5 7.6 9.3 7.0 1999 ....................................... 137.2 142.4 144.5 145.2 -1.9 3.8 1.5 .5 3.5 5.6 4.6 3.9
Finance, insurance, and realestate, excluding salesoccupations2:
1978 ....................................... – – – 54.2 – – – – – – – – 1979 ....................................... 56.1 56.8 58.0 59.1 3.5 1.2 2.1 1.9 – – – 9.0
See footnotes at end of table.
99
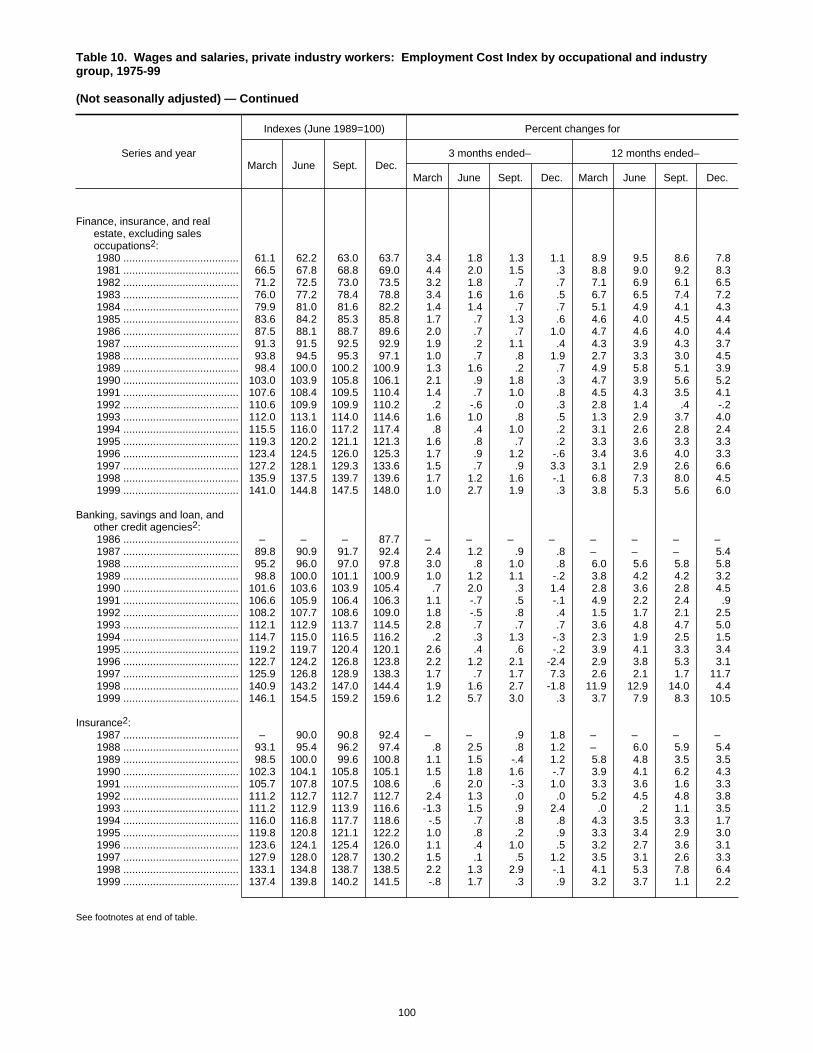
Table 10. Wages and salaries, private industry workers: Employment Cost Index by occupational and industrygroup, 1975-99
(Not seasonally adjusted) — Continued
Series and year
Indexes (June 1989=100) Percent changes for
March June Sept. Dec.3 months ended– 12 months ended–
March June Sept. Dec. March June Sept. Dec.
Finance, insurance, and realestate, excluding salesoccupations2:
1980 ....................................... 61.1 62.2 63.0 63.7 3.4 1.8 1.3 1.1 8.9 9.5 8.6 7.8 1981 ....................................... 66.5 67.8 68.8 69.0 4.4 2.0 1.5 .3 8.8 9.0 9.2 8.3 1982 ....................................... 71.2 72.5 73.0 73.5 3.2 1.8 .7 .7 7.1 6.9 6.1 6.5 1983 ....................................... 76.0 77.2 78.4 78.8 3.4 1.6 1.6 .5 6.7 6.5 7.4 7.2 1984 ....................................... 79.9 81.0 81.6 82.2 1.4 1.4 .7 .7 5.1 4.9 4.1 4.3 1985 ....................................... 83.6 84.2 85.3 85.8 1.7 .7 1.3 .6 4.6 4.0 4.5 4.4 1986 ....................................... 87.5 88.1 88.7 89.6 2.0 .7 .7 1.0 4.7 4.6 4.0 4.4 1987 ....................................... 91.3 91.5 92.5 92.9 1.9 .2 1.1 .4 4.3 3.9 4.3 3.7 1988 ....................................... 93.8 94.5 95.3 97.1 1.0 .7 .8 1.9 2.7 3.3 3.0 4.5 1989 ....................................... 98.4 100.0 100.2 100.9 1.3 1.6 .2 .7 4.9 5.8 5.1 3.9 1990 ....................................... 103.0 103.9 105.8 106.1 2.1 .9 1.8 .3 4.7 3.9 5.6 5.2 1991 ....................................... 107.6 108.4 109.5 110.4 1.4 .7 1.0 .8 4.5 4.3 3.5 4.1 1992 ....................................... 110.6 109.9 109.9 110.2 .2 -.6 .0 .3 2.8 1.4 .4 -.2 1993 ....................................... 112.0 113.1 114.0 114.6 1.6 1.0 .8 .5 1.3 2.9 3.7 4.0 1994 ....................................... 115.5 116.0 117.2 117.4 .8 .4 1.0 .2 3.1 2.6 2.8 2.4 1995 ....................................... 119.3 120.2 121.1 121.3 1.6 .8 .7 .2 3.3 3.6 3.3 3.3 1996 ....................................... 123.4 124.5 126.0 125.3 1.7 .9 1.2 -.6 3.4 3.6 4.0 3.3 1997 ....................................... 127.2 128.1 129.3 133.6 1.5 .7 .9 3.3 3.1 2.9 2.6 6.6 1998 ....................................... 135.9 137.5 139.7 139.6 1.7 1.2 1.6 -.1 6.8 7.3 8.0 4.5 1999 ....................................... 141.0 144.8 147.5 148.0 1.0 2.7 1.9 .3 3.8 5.3 5.6 6.0
Banking, savings and loan, andother credit agencies2:
1986 ....................................... – – – 87.7 – – – – – – – – 1987 ....................................... 89.8 90.9 91.7 92.4 2.4 1.2 .9 .8 – – – 5.4 1988 ....................................... 95.2 96.0 97.0 97.8 3.0 .8 1.0 .8 6.0 5.6 5.8 5.8 1989 ....................................... 98.8 100.0 101.1 100.9 1.0 1.2 1.1 -.2 3.8 4.2 4.2 3.2 1990 ....................................... 101.6 103.6 103.9 105.4 .7 2.0 .3 1.4 2.8 3.6 2.8 4.5 1991 ....................................... 106.6 105.9 106.4 106.3 1.1 -.7 .5 -.1 4.9 2.2 2.4 .9 1992 ....................................... 108.2 107.7 108.6 109.0 1.8 -.5 .8 .4 1.5 1.7 2.1 2.5 1993 ....................................... 112.1 112.9 113.7 114.5 2.8 .7 .7 .7 3.6 4.8 4.7 5.0 1994 ....................................... 114.7 115.0 116.5 116.2 .2 .3 1.3 -.3 2.3 1.9 2.5 1.5 1995 ....................................... 119.2 119.7 120.4 120.1 2.6 .4 .6 -.2 3.9 4.1 3.3 3.4 1996 ....................................... 122.7 124.2 126.8 123.8 2.2 1.2 2.1 -2.4 2.9 3.8 5.3 3.1 1997 ....................................... 125.9 126.8 128.9 138.3 1.7 .7 1.7 7.3 2.6 2.1 1.7 11.7 1998 ....................................... 140.9 143.2 147.0 144.4 1.9 1.6 2.7 -1.8 11.9 12.9 14.0 4.4 1999 ....................................... 146.1 154.5 159.2 159.6 1.2 5.7 3.0 .3 3.7 7.9 8.3 10.5
Insurance2: 1987 ....................................... – 90.0 90.8 92.4 – – .9 1.8 – – – – 1988 ....................................... 93.1 95.4 96.2 97.4 .8 2.5 .8 1.2 – 6.0 5.9 5.4 1989 ....................................... 98.5 100.0 99.6 100.8 1.1 1.5 -.4 1.2 5.8 4.8 3.5 3.5 1990 ....................................... 102.3 104.1 105.8 105.1 1.5 1.8 1.6 -.7 3.9 4.1 6.2 4.3 1991 ....................................... 105.7 107.8 107.5 108.6 .6 2.0 -.3 1.0 3.3 3.6 1.6 3.3 1992 ....................................... 111.2 112.7 112.7 112.7 2.4 1.3 .0 .0 5.2 4.5 4.8 3.8 1993 ....................................... 111.2 112.9 113.9 116.6 -1.3 1.5 .9 2.4 .0 .2 1.1 3.5 1994 ....................................... 116.0 116.8 117.7 118.6 -.5 .7 .8 .8 4.3 3.5 3.3 1.7 1995 ....................................... 119.8 120.8 121.1 122.2 1.0 .8 .2 .9 3.3 3.4 2.9 3.0 1996 ....................................... 123.6 124.1 125.4 126.0 1.1 .4 1.0 .5 3.2 2.7 3.6 3.1 1997 ....................................... 127.9 128.0 128.7 130.2 1.5 .1 .5 1.2 3.5 3.1 2.6 3.3 1998 ....................................... 133.1 134.8 138.7 138.5 2.2 1.3 2.9 -.1 4.1 5.3 7.8 6.4 1999 ....................................... 137.4 139.8 140.2 141.5 -.8 1.7 .3 .9 3.2 3.7 1.1 2.2
See footnotes at end of table.
100
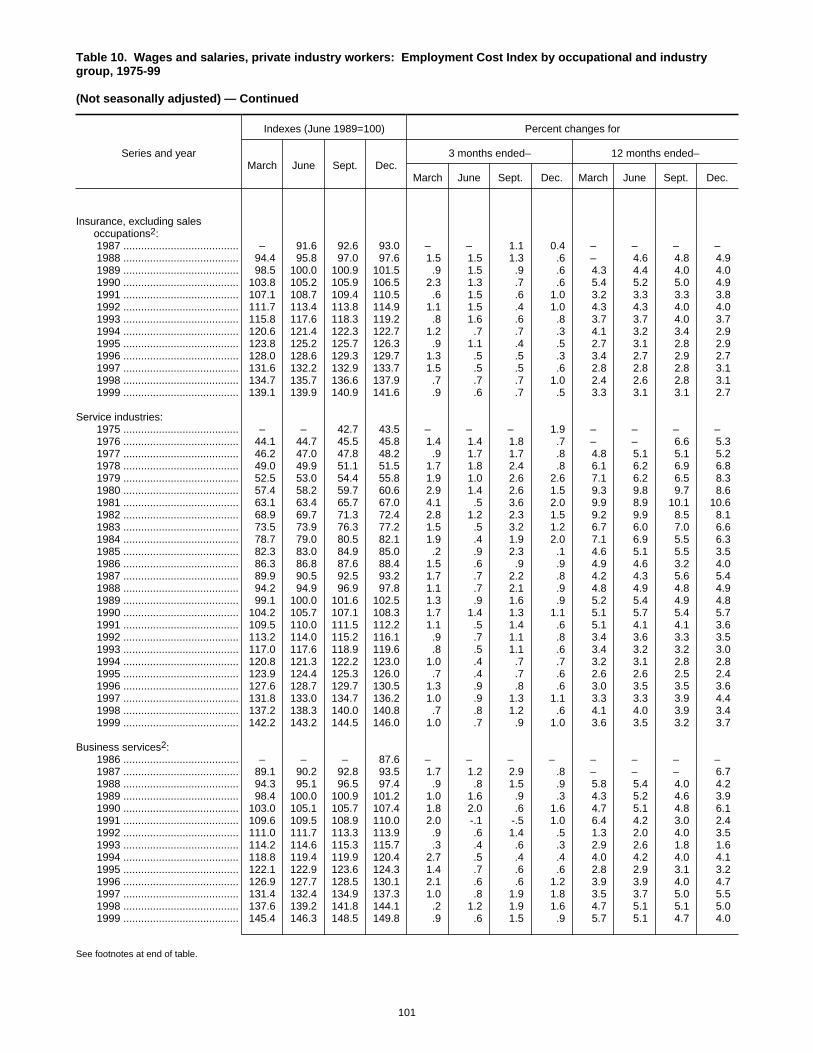
Table 10. Wages and salaries, private industry workers: Employment Cost Index by occupational and industrygroup, 1975-99
(Not seasonally adjusted) — Continued
Series and year
Indexes (June 1989=100) Percent changes for
March June Sept. Dec.3 months ended– 12 months ended–
March June Sept. Dec. March June Sept. Dec.
Insurance, excluding salesoccupations2:
1987 ....................................... – 91.6 92.6 93.0 – – 1.1 0.4 – – – – 1988 ....................................... 94.4 95.8 97.0 97.6 1.5 1.5 1.3 .6 – 4.6 4.8 4.9 1989 ....................................... 98.5 100.0 100.9 101.5 .9 1.5 .9 .6 4.3 4.4 4.0 4.0 1990 ....................................... 103.8 105.2 105.9 106.5 2.3 1.3 .7 .6 5.4 5.2 5.0 4.9 1991 ....................................... 107.1 108.7 109.4 110.5 .6 1.5 .6 1.0 3.2 3.3 3.3 3.8 1992 ....................................... 111.7 113.4 113.8 114.9 1.1 1.5 .4 1.0 4.3 4.3 4.0 4.0 1993 ....................................... 115.8 117.6 118.3 119.2 .8 1.6 .6 .8 3.7 3.7 4.0 3.7 1994 ....................................... 120.6 121.4 122.3 122.7 1.2 .7 .7 .3 4.1 3.2 3.4 2.9 1995 ....................................... 123.8 125.2 125.7 126.3 .9 1.1 .4 .5 2.7 3.1 2.8 2.9 1996 ....................................... 128.0 128.6 129.3 129.7 1.3 .5 .5 .3 3.4 2.7 2.9 2.7 1997 ....................................... 131.6 132.2 132.9 133.7 1.5 .5 .5 .6 2.8 2.8 2.8 3.1 1998 ....................................... 134.7 135.7 136.6 137.9 .7 .7 .7 1.0 2.4 2.6 2.8 3.1 1999 ....................................... 139.1 139.9 140.9 141.6 .9 .6 .7 .5 3.3 3.1 3.1 2.7
Service industries: 1975 ....................................... – – 42.7 43.5 – – – 1.9 – – – – 1976 ....................................... 44.1 44.7 45.5 45.8 1.4 1.4 1.8 .7 – – 6.6 5.3 1977 ....................................... 46.2 47.0 47.8 48.2 .9 1.7 1.7 .8 4.8 5.1 5.1 5.2 1978 ....................................... 49.0 49.9 51.1 51.5 1.7 1.8 2.4 .8 6.1 6.2 6.9 6.8 1979 ....................................... 52.5 53.0 54.4 55.8 1.9 1.0 2.6 2.6 7.1 6.2 6.5 8.3 1980 ....................................... 57.4 58.2 59.7 60.6 2.9 1.4 2.6 1.5 9.3 9.8 9.7 8.6 1981 ....................................... 63.1 63.4 65.7 67.0 4.1 .5 3.6 2.0 9.9 8.9 10.1 10.6 1982 ....................................... 68.9 69.7 71.3 72.4 2.8 1.2 2.3 1.5 9.2 9.9 8.5 8.1 1983 ....................................... 73.5 73.9 76.3 77.2 1.5 .5 3.2 1.2 6.7 6.0 7.0 6.6 1984 ....................................... 78.7 79.0 80.5 82.1 1.9 .4 1.9 2.0 7.1 6.9 5.5 6.3 1985 ....................................... 82.3 83.0 84.9 85.0 .2 .9 2.3 .1 4.6 5.1 5.5 3.5 1986 ....................................... 86.3 86.8 87.6 88.4 1.5 .6 .9 .9 4.9 4.6 3.2 4.0 1987 ....................................... 89.9 90.5 92.5 93.2 1.7 .7 2.2 .8 4.2 4.3 5.6 5.4 1988 ....................................... 94.2 94.9 96.9 97.8 1.1 .7 2.1 .9 4.8 4.9 4.8 4.9 1989 ....................................... 99.1 100.0 101.6 102.5 1.3 .9 1.6 .9 5.2 5.4 4.9 4.8 1990 ....................................... 104.2 105.7 107.1 108.3 1.7 1.4 1.3 1.1 5.1 5.7 5.4 5.7 1991 ....................................... 109.5 110.0 111.5 112.2 1.1 .5 1.4 .6 5.1 4.1 4.1 3.6 1992 ....................................... 113.2 114.0 115.2 116.1 .9 .7 1.1 .8 3.4 3.6 3.3 3.5 1993 ....................................... 117.0 117.6 118.9 119.6 .8 .5 1.1 .6 3.4 3.2 3.2 3.0 1994 ....................................... 120.8 121.3 122.2 123.0 1.0 .4 .7 .7 3.2 3.1 2.8 2.8 1995 ....................................... 123.9 124.4 125.3 126.0 .7 .4 .7 .6 2.6 2.6 2.5 2.4 1996 ....................................... 127.6 128.7 129.7 130.5 1.3 .9 .8 .6 3.0 3.5 3.5 3.6 1997 ....................................... 131.8 133.0 134.7 136.2 1.0 .9 1.3 1.1 3.3 3.3 3.9 4.4 1998 ....................................... 137.2 138.3 140.0 140.8 .7 .8 1.2 .6 4.1 4.0 3.9 3.4 1999 ....................................... 142.2 143.2 144.5 146.0 1.0 .7 .9 1.0 3.6 3.5 3.2 3.7
Business services2: 1986 ....................................... – – – 87.6 – – – – – – – – 1987 ....................................... 89.1 90.2 92.8 93.5 1.7 1.2 2.9 .8 – – – 6.7 1988 ....................................... 94.3 95.1 96.5 97.4 .9 .8 1.5 .9 5.8 5.4 4.0 4.2 1989 ....................................... 98.4 100.0 100.9 101.2 1.0 1.6 .9 .3 4.3 5.2 4.6 3.9 1990 ....................................... 103.0 105.1 105.7 107.4 1.8 2.0 .6 1.6 4.7 5.1 4.8 6.1 1991 ....................................... 109.6 109.5 108.9 110.0 2.0 -.1 -.5 1.0 6.4 4.2 3.0 2.4 1992 ....................................... 111.0 111.7 113.3 113.9 .9 .6 1.4 .5 1.3 2.0 4.0 3.5 1993 ....................................... 114.2 114.6 115.3 115.7 .3 .4 .6 .3 2.9 2.6 1.8 1.6 1994 ....................................... 118.8 119.4 119.9 120.4 2.7 .5 .4 .4 4.0 4.2 4.0 4.1 1995 ....................................... 122.1 122.9 123.6 124.3 1.4 .7 .6 .6 2.8 2.9 3.1 3.2 1996 ....................................... 126.9 127.7 128.5 130.1 2.1 .6 .6 1.2 3.9 3.9 4.0 4.7 1997 ....................................... 131.4 132.4 134.9 137.3 1.0 .8 1.9 1.8 3.5 3.7 5.0 5.5 1998 ....................................... 137.6 139.2 141.8 144.1 .2 1.2 1.9 1.6 4.7 5.1 5.1 5.0 1999 ....................................... 145.4 146.3 148.5 149.8 .9 .6 1.5 .9 5.7 5.1 4.7 4.0
See footnotes at end of table.
101

Table 10. Wages and salaries, private industry workers: Employment Cost Index by occupational and industrygroup, 1975-99
(Not seasonally adjusted) — Continued
Series and year
Indexes (June 1989=100) Percent changes for
March June Sept. Dec.3 months ended– 12 months ended–
March June Sept. Dec. March June Sept. Dec.
Health services: 1985 ....................................... 82.1 82.8 83.6 83.8 – 0.9 1.0 0.2 – – – – 1986 ....................................... 84.8 85.4 86.8 88.0 1.2 .7 1.6 1.4 3.3 3.1 3.8 5.0 1987 ....................................... 89.2 89.8 91.1 92.1 1.4 .7 1.4 1.1 5.2 5.2 5.0 4.7 1988 ....................................... 92.7 94.4 96.0 97.3 .7 1.8 1.7 1.4 3.9 5.1 5.4 5.6 1989 ....................................... 99.1 100.0 101.9 103.5 1.8 .9 1.9 1.6 6.9 5.9 6.1 6.4 1990 ....................................... 105.3 106.3 108.1 109.7 1.7 .9 1.7 1.5 6.3 6.3 6.1 6.0 1991 ....................................... 111.1 111.9 113.5 114.6 1.3 .7 1.4 1.0 5.5 5.3 5.0 4.5 1992 ....................................... 115.6 116.3 117.9 118.9 .9 .6 1.4 .8 4.1 3.9 3.9 3.8 1993 ....................................... 119.8 120.7 121.7 122.6 .8 .8 .8 .7 3.6 3.8 3.2 3.1 1994 ....................................... 123.1 123.5 124.3 125.4 .4 .3 .6 .9 2.8 2.3 2.1 2.3 1995 ....................................... 126.2 126.7 127.5 128.4 .6 .4 .6 .7 2.5 2.6 2.6 2.4 1996 ....................................... 129.3 130.1 130.8 131.4 .7 .6 .5 .5 2.5 2.7 2.6 2.3 1997 ....................................... 132.5 133.2 134.3 135.4 .8 .5 .8 .8 2.5 2.4 2.7 3.0 1998 ....................................... 136.2 136.5 137.5 137.4 .6 .2 .7 -.1 2.8 2.5 2.4 1.5 1999 ....................................... 138.7 139.6 140.6 142.2 .9 .6 .7 1.1 1.8 2.3 2.3 3.5
Hospitals: 1986 ....................................... – 84.7 85.8 87.1 – – 1.3 1.5 – – – – 1987 ....................................... 88.2 88.8 90.4 91.5 1.3 .7 1.8 1.2 – 4.8 5.4 5.1 1988 ....................................... 92.5 94.0 95.6 96.9 1.1 1.6 1.7 1.4 4.9 5.9 5.8 5.9 1989 ....................................... 98.9 100.0 101.9 103.3 2.1 1.1 1.9 1.4 6.9 6.4 6.6 6.6 1990 ....................................... 105.0 106.0 108.2 109.8 1.6 1.0 2.1 1.5 6.2 6.0 6.2 6.3 1991 ....................................... 110.8 111.6 113.2 114.4 .9 .7 1.4 1.1 5.5 5.3 4.6 4.2 1992 ....................................... 115.4 115.9 117.3 118.3 .9 .4 1.2 .9 4.2 3.9 3.6 3.4 1993 ....................................... 119.3 119.9 121.0 122.0 .8 .5 .9 .8 3.4 3.5 3.2 3.1 1994 ....................................... 122.8 123.3 123.9 124.8 .7 .4 .5 .7 2.9 2.8 2.4 2.3 1995 ....................................... 125.4 125.9 126.6 127.7 .5 .4 .6 .9 2.1 2.1 2.2 2.3 1996 ....................................... 128.5 129.1 129.7 130.3 .6 .5 .5 .5 2.5 2.5 2.4 2.0 1997 ....................................... 130.7 131.2 132.2 133.2 .3 .4 .8 .8 1.7 1.6 1.9 2.2 1998 ....................................... 133.6 134.7 135.8 136.5 .3 .8 .8 .5 2.2 2.7 2.7 2.5 1999 ....................................... 137.6 138.3 139.3 140.9 .8 .5 .7 1.1 3.0 2.7 2.6 3.2
Nursing homes: 1992 ....................................... – – – – – 1.0 .9 .9 – – – – 1993 ....................................... – – – – 1.1 .8 .9 .8 4.0 3.8 3.8 3.7 1994 ....................................... – – – – 1.4 .8 .8 .6 4.0 3.9 3.8 3.6 1995 ....................................... – – – – 1.1 .8 .5 .9 3.3 3.4 3.0 3.3 1996 ....................................... – – – – .8 .6 .4 1.0 3.1 2.8 2.8 2.8 1997 ....................................... – – – – 1.1 .4 .8 .8 3.1 3.0 3.3 3.1 1998 ....................................... – – – – 1.3 .8 1.0 .5 3.3 3.7 3.9 3.7 1999 ....................................... – – – – 1.4 .9 .9 1.1 3.8 3.9 3.8 4.4
Educational services: 1988 ....................................... – – – 98.8 – – – – – – – – 1989 ....................................... 99.1 100.0 103.7 103.9 .3 .9 3.7 .2 – – – 5.2 1990 ....................................... 104.7 105.0 109.2 110.2 .8 .3 4.0 .9 5.7 5.0 5.3 6.1 1991 ....................................... 110.3 109.7 113.0 113.7 .1 -.5 3.0 .6 5.3 4.5 3.5 3.2 1992 ....................................... 113.4 113.6 116.5 117.1 -.3 .2 2.6 .5 2.8 3.6 3.1 3.0 1993 ....................................... 117.5 117.4 120.7 120.9 .3 -.1 2.8 .2 3.6 3.3 3.6 3.2 1994 ....................................... 121.2 122.2 124.9 125.1 .2 .8 2.2 .2 3.1 4.1 3.5 3.5 1995 ....................................... 125.6 125.9 128.6 129.4 .4 .2 2.1 .6 3.6 3.0 3.0 3.4 1996 ....................................... 130.1 130.4 133.3 133.8 .5 .2 2.2 .4 3.6 3.6 3.7 3.4 1997 ....................................... 134.5 134.8 137.8 138.4 .5 .2 2.2 .4 3.4 3.4 3.4 3.4 1998 ....................................... 139.1 139.6 142.8 143.5 .5 .4 2.3 .5 3.4 3.6 3.6 3.7 1999 ....................................... 143.9 144.2 147.5 148.2 .3 .2 2.3 .5 3.5 3.3 3.3 3.3
See footnotes at end of table.
102
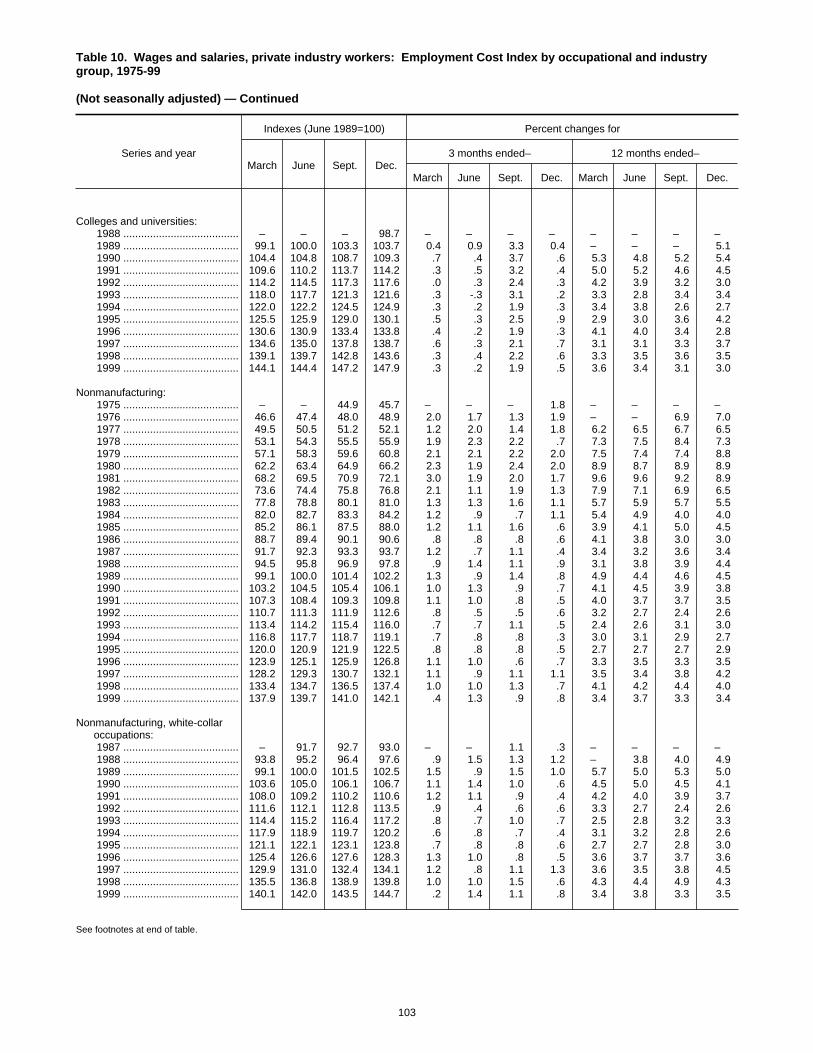
Table 10. Wages and salaries, private industry workers: Employment Cost Index by occupational and industrygroup, 1975-99
(Not seasonally adjusted) — Continued
Series and year
Indexes (June 1989=100) Percent changes for
March June Sept. Dec.3 months ended– 12 months ended–
March June Sept. Dec. March June Sept. Dec.
Colleges and universities: 1988 ....................................... – – – 98.7 – – – – – – – – 1989 ....................................... 99.1 100.0 103.3 103.7 0.4 0.9 3.3 0.4 – – – 5.1 1990 ....................................... 104.4 104.8 108.7 109.3 .7 .4 3.7 .6 5.3 4.8 5.2 5.4 1991 ....................................... 109.6 110.2 113.7 114.2 .3 .5 3.2 .4 5.0 5.2 4.6 4.5 1992 ....................................... 114.2 114.5 117.3 117.6 .0 .3 2.4 .3 4.2 3.9 3.2 3.0 1993 ....................................... 118.0 117.7 121.3 121.6 .3 -.3 3.1 .2 3.3 2.8 3.4 3.4 1994 ....................................... 122.0 122.2 124.5 124.9 .3 .2 1.9 .3 3.4 3.8 2.6 2.7 1995 ....................................... 125.5 125.9 129.0 130.1 .5 .3 2.5 .9 2.9 3.0 3.6 4.2 1996 ....................................... 130.6 130.9 133.4 133.8 .4 .2 1.9 .3 4.1 4.0 3.4 2.8 1997 ....................................... 134.6 135.0 137.8 138.7 .6 .3 2.1 .7 3.1 3.1 3.3 3.7 1998 ....................................... 139.1 139.7 142.8 143.6 .3 .4 2.2 .6 3.3 3.5 3.6 3.5 1999 ....................................... 144.1 144.4 147.2 147.9 .3 .2 1.9 .5 3.6 3.4 3.1 3.0
Nonmanufacturing: 1975 ....................................... – – 44.9 45.7 – – – 1.8 – – – – 1976 ....................................... 46.6 47.4 48.0 48.9 2.0 1.7 1.3 1.9 – – 6.9 7.0 1977 ....................................... 49.5 50.5 51.2 52.1 1.2 2.0 1.4 1.8 6.2 6.5 6.7 6.5 1978 ....................................... 53.1 54.3 55.5 55.9 1.9 2.3 2.2 .7 7.3 7.5 8.4 7.3 1979 ....................................... 57.1 58.3 59.6 60.8 2.1 2.1 2.2 2.0 7.5 7.4 7.4 8.8 1980 ....................................... 62.2 63.4 64.9 66.2 2.3 1.9 2.4 2.0 8.9 8.7 8.9 8.9 1981 ....................................... 68.2 69.5 70.9 72.1 3.0 1.9 2.0 1.7 9.6 9.6 9.2 8.9 1982 ....................................... 73.6 74.4 75.8 76.8 2.1 1.1 1.9 1.3 7.9 7.1 6.9 6.5 1983 ....................................... 77.8 78.8 80.1 81.0 1.3 1.3 1.6 1.1 5.7 5.9 5.7 5.5 1984 ....................................... 82.0 82.7 83.3 84.2 1.2 .9 .7 1.1 5.4 4.9 4.0 4.0 1985 ....................................... 85.2 86.1 87.5 88.0 1.2 1.1 1.6 .6 3.9 4.1 5.0 4.5 1986 ....................................... 88.7 89.4 90.1 90.6 .8 .8 .8 .6 4.1 3.8 3.0 3.0 1987 ....................................... 91.7 92.3 93.3 93.7 1.2 .7 1.1 .4 3.4 3.2 3.6 3.4 1988 ....................................... 94.5 95.8 96.9 97.8 .9 1.4 1.1 .9 3.1 3.8 3.9 4.4 1989 ....................................... 99.1 100.0 101.4 102.2 1.3 .9 1.4 .8 4.9 4.4 4.6 4.5 1990 ....................................... 103.2 104.5 105.4 106.1 1.0 1.3 .9 .7 4.1 4.5 3.9 3.8 1991 ....................................... 107.3 108.4 109.3 109.8 1.1 1.0 .8 .5 4.0 3.7 3.7 3.5 1992 ....................................... 110.7 111.3 111.9 112.6 .8 .5 .5 .6 3.2 2.7 2.4 2.6 1993 ....................................... 113.4 114.2 115.4 116.0 .7 .7 1.1 .5 2.4 2.6 3.1 3.0 1994 ....................................... 116.8 117.7 118.7 119.1 .7 .8 .8 .3 3.0 3.1 2.9 2.7 1995 ....................................... 120.0 120.9 121.9 122.5 .8 .8 .8 .5 2.7 2.7 2.7 2.9 1996 ....................................... 123.9 125.1 125.9 126.8 1.1 1.0 .6 .7 3.3 3.5 3.3 3.5 1997 ....................................... 128.2 129.3 130.7 132.1 1.1 .9 1.1 1.1 3.5 3.4 3.8 4.2 1998 ....................................... 133.4 134.7 136.5 137.4 1.0 1.0 1.3 .7 4.1 4.2 4.4 4.0 1999 ....................................... 137.9 139.7 141.0 142.1 .4 1.3 .9 .8 3.4 3.7 3.3 3.4
Nonmanufacturing, white-collaroccupations:
1987 ....................................... – 91.7 92.7 93.0 – – 1.1 .3 – – – – 1988 ....................................... 93.8 95.2 96.4 97.6 .9 1.5 1.3 1.2 – 3.8 4.0 4.9 1989 ....................................... 99.1 100.0 101.5 102.5 1.5 .9 1.5 1.0 5.7 5.0 5.3 5.0 1990 ....................................... 103.6 105.0 106.1 106.7 1.1 1.4 1.0 .6 4.5 5.0 4.5 4.1 1991 ....................................... 108.0 109.2 110.2 110.6 1.2 1.1 .9 .4 4.2 4.0 3.9 3.7 1992 ....................................... 111.6 112.1 112.8 113.5 .9 .4 .6 .6 3.3 2.7 2.4 2.6 1993 ....................................... 114.4 115.2 116.4 117.2 .8 .7 1.0 .7 2.5 2.8 3.2 3.3 1994 ....................................... 117.9 118.9 119.7 120.2 .6 .8 .7 .4 3.1 3.2 2.8 2.6 1995 ....................................... 121.1 122.1 123.1 123.8 .7 .8 .8 .6 2.7 2.7 2.8 3.0 1996 ....................................... 125.4 126.6 127.6 128.3 1.3 1.0 .8 .5 3.6 3.7 3.7 3.6 1997 ....................................... 129.9 131.0 132.4 134.1 1.2 .8 1.1 1.3 3.6 3.5 3.8 4.5 1998 ....................................... 135.5 136.8 138.9 139.8 1.0 1.0 1.5 .6 4.3 4.4 4.9 4.3 1999 ....................................... 140.1 142.0 143.5 144.7 .2 1.4 1.1 .8 3.4 3.8 3.3 3.5
See footnotes at end of table.
103
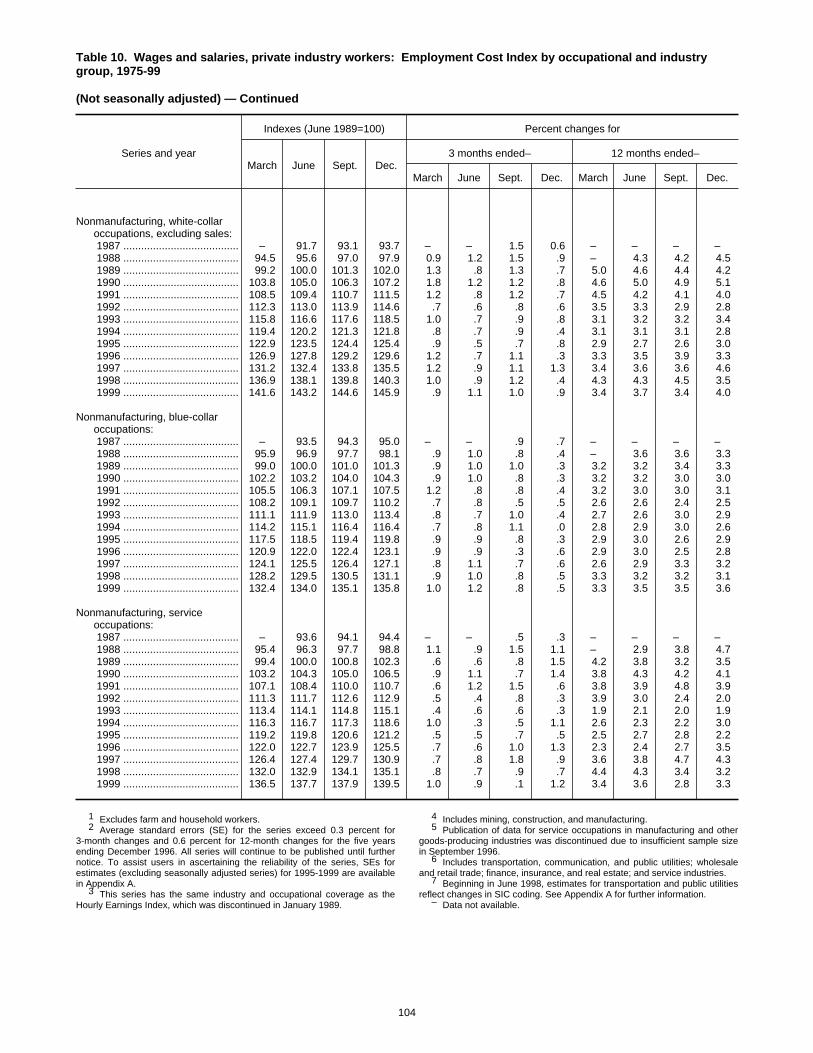
Table 10. Wages and salaries, private industry workers: Employment Cost Index by occupational and industrygroup, 1975-99
(Not seasonally adjusted) — Continued
Series and year
Indexes (June 1989=100) Percent changes for
March June Sept. Dec.3 months ended– 12 months ended–
March June Sept. Dec. March June Sept. Dec.
Nonmanufacturing, white-collaroccupations, excluding sales:
1987 ....................................... – 91.7 93.1 93.7 – – 1.5 0.6 – – – – 1988 ....................................... 94.5 95.6 97.0 97.9 0.9 1.2 1.5 .9 – 4.3 4.2 4.5 1989 ....................................... 99.2 100.0 101.3 102.0 1.3 .8 1.3 .7 5.0 4.6 4.4 4.2 1990 ....................................... 103.8 105.0 106.3 107.2 1.8 1.2 1.2 .8 4.6 5.0 4.9 5.1 1991 ....................................... 108.5 109.4 110.7 111.5 1.2 .8 1.2 .7 4.5 4.2 4.1 4.0 1992 ....................................... 112.3 113.0 113.9 114.6 .7 .6 .8 .6 3.5 3.3 2.9 2.8 1993 ....................................... 115.8 116.6 117.6 118.5 1.0 .7 .9 .8 3.1 3.2 3.2 3.4 1994 ....................................... 119.4 120.2 121.3 121.8 .8 .7 .9 .4 3.1 3.1 3.1 2.8 1995 ....................................... 122.9 123.5 124.4 125.4 .9 .5 .7 .8 2.9 2.7 2.6 3.0 1996 ....................................... 126.9 127.8 129.2 129.6 1.2 .7 1.1 .3 3.3 3.5 3.9 3.3 1997 ....................................... 131.2 132.4 133.8 135.5 1.2 .9 1.1 1.3 3.4 3.6 3.6 4.6 1998 ....................................... 136.9 138.1 139.8 140.3 1.0 .9 1.2 .4 4.3 4.3 4.5 3.5 1999 ....................................... 141.6 143.2 144.6 145.9 .9 1.1 1.0 .9 3.4 3.7 3.4 4.0
Nonmanufacturing, blue-collaroccupations:
1987 ....................................... – 93.5 94.3 95.0 – – .9 .7 – – – – 1988 ....................................... 95.9 96.9 97.7 98.1 .9 1.0 .8 .4 – 3.6 3.6 3.3 1989 ....................................... 99.0 100.0 101.0 101.3 .9 1.0 1.0 .3 3.2 3.2 3.4 3.3 1990 ....................................... 102.2 103.2 104.0 104.3 .9 1.0 .8 .3 3.2 3.2 3.0 3.0 1991 ....................................... 105.5 106.3 107.1 107.5 1.2 .8 .8 .4 3.2 3.0 3.0 3.1 1992 ....................................... 108.2 109.1 109.7 110.2 .7 .8 .5 .5 2.6 2.6 2.4 2.5 1993 ....................................... 111.1 111.9 113.0 113.4 .8 .7 1.0 .4 2.7 2.6 3.0 2.9 1994 ....................................... 114.2 115.1 116.4 116.4 .7 .8 1.1 .0 2.8 2.9 3.0 2.6 1995 ....................................... 117.5 118.5 119.4 119.8 .9 .9 .8 .3 2.9 3.0 2.6 2.9 1996 ....................................... 120.9 122.0 122.4 123.1 .9 .9 .3 .6 2.9 3.0 2.5 2.8 1997 ....................................... 124.1 125.5 126.4 127.1 .8 1.1 .7 .6 2.6 2.9 3.3 3.2 1998 ....................................... 128.2 129.5 130.5 131.1 .9 1.0 .8 .5 3.3 3.2 3.2 3.1 1999 ....................................... 132.4 134.0 135.1 135.8 1.0 1.2 .8 .5 3.3 3.5 3.5 3.6
Nonmanufacturing, serviceoccupations:
1987 ....................................... – 93.6 94.1 94.4 – – .5 .3 – – – – 1988 ....................................... 95.4 96.3 97.7 98.8 1.1 .9 1.5 1.1 – 2.9 3.8 4.7 1989 ....................................... 99.4 100.0 100.8 102.3 .6 .6 .8 1.5 4.2 3.8 3.2 3.5 1990 ....................................... 103.2 104.3 105.0 106.5 .9 1.1 .7 1.4 3.8 4.3 4.2 4.1 1991 ....................................... 107.1 108.4 110.0 110.7 .6 1.2 1.5 .6 3.8 3.9 4.8 3.9 1992 ....................................... 111.3 111.7 112.6 112.9 .5 .4 .8 .3 3.9 3.0 2.4 2.0 1993 ....................................... 113.4 114.1 114.8 115.1 .4 .6 .6 .3 1.9 2.1 2.0 1.9 1994 ....................................... 116.3 116.7 117.3 118.6 1.0 .3 .5 1.1 2.6 2.3 2.2 3.0 1995 ....................................... 119.2 119.8 120.6 121.2 .5 .5 .7 .5 2.5 2.7 2.8 2.2 1996 ....................................... 122.0 122.7 123.9 125.5 .7 .6 1.0 1.3 2.3 2.4 2.7 3.5 1997 ....................................... 126.4 127.4 129.7 130.9 .7 .8 1.8 .9 3.6 3.8 4.7 4.3 1998 ....................................... 132.0 132.9 134.1 135.1 .8 .7 .9 .7 4.4 4.3 3.4 3.2 1999 ....................................... 136.5 137.7 137.9 139.5 1.0 .9 .1 1.2 3.4 3.6 2.8 3.3
1 Excludes farm and household workers.2 Average standard errors (SE) for the series exceed 0.3 percent for
3-month changes and 0.6 percent for 12-month changes for the five yearsending December 1996. All series will continue to be published until furthernotice. To assist users in ascertaining the reliability of the series, SEs forestimates (excluding seasonally adjusted series) for 1995-1999 are availablein Appendix A.
3 This series has the same industry and occupational coverage as theHourly Earnings Index, which was discontinued in January 1989.
4 Includes mining, construction, and manufacturing.5 Publication of data for service occupations in manufacturing and other
goods-producing industries was discontinued due to insufficient sample sizein September 1996.
6 Includes transportation, communication, and public utilities; wholesaleand retail trade; finance, insurance, and real estate; and service industries.
7 Beginning in June 1998, estimates for transportation and public utilitiesreflect changes in SIC coding. See Appendix A for further information.
– Data not available.
104
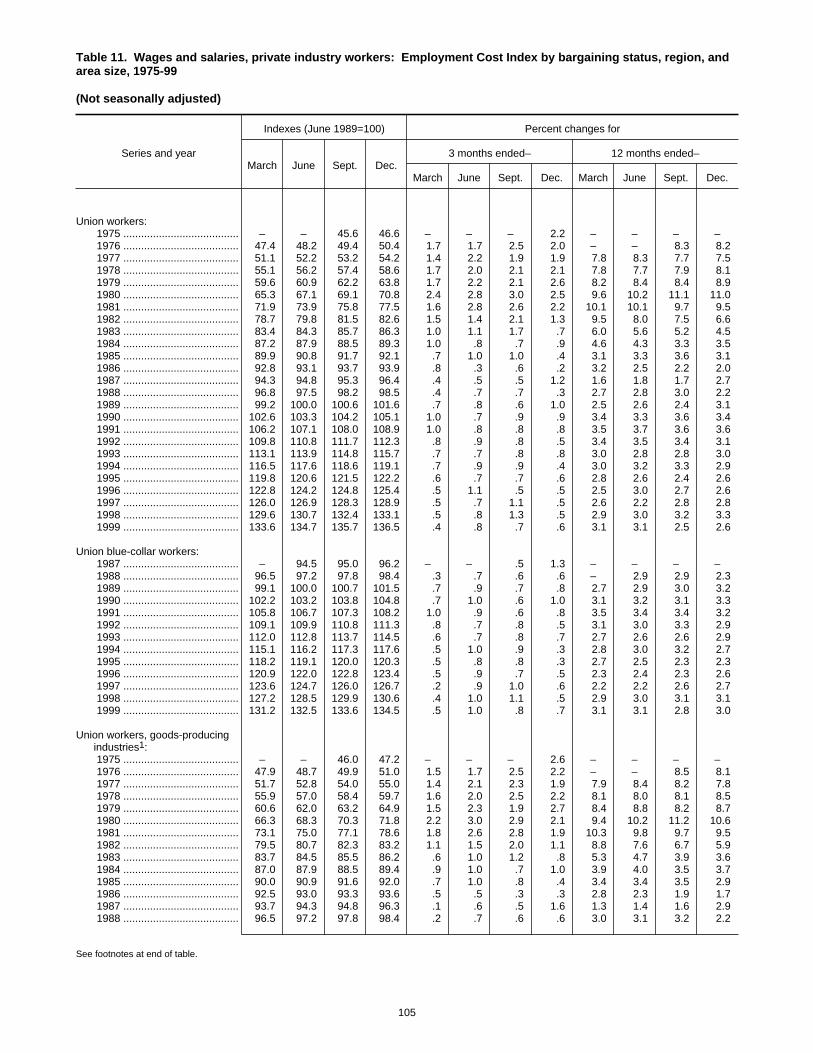
Table 11. Wages and salaries, private industry workers: Employment Cost Index by bargaining status, region, andarea size, 1975-99
(Not seasonally adjusted)
Series and year
Indexes (June 1989=100) Percent changes for
March June Sept. Dec.3 months ended– 12 months ended–
March June Sept. Dec. March June Sept. Dec.
Union workers: 1975 ....................................... – – 45.6 46.6 – – – 2.2 – – – – 1976 ....................................... 47.4 48.2 49.4 50.4 1.7 1.7 2.5 2.0 – – 8.3 8.2 1977 ....................................... 51.1 52.2 53.2 54.2 1.4 2.2 1.9 1.9 7.8 8.3 7.7 7.5 1978 ....................................... 55.1 56.2 57.4 58.6 1.7 2.0 2.1 2.1 7.8 7.7 7.9 8.1 1979 ....................................... 59.6 60.9 62.2 63.8 1.7 2.2 2.1 2.6 8.2 8.4 8.4 8.9 1980 ....................................... 65.3 67.1 69.1 70.8 2.4 2.8 3.0 2.5 9.6 10.2 11.1 11.0 1981 ....................................... 71.9 73.9 75.8 77.5 1.6 2.8 2.6 2.2 10.1 10.1 9.7 9.5 1982 ....................................... 78.7 79.8 81.5 82.6 1.5 1.4 2.1 1.3 9.5 8.0 7.5 6.6 1983 ....................................... 83.4 84.3 85.7 86.3 1.0 1.1 1.7 .7 6.0 5.6 5.2 4.5 1984 ....................................... 87.2 87.9 88.5 89.3 1.0 .8 .7 .9 4.6 4.3 3.3 3.5 1985 ....................................... 89.9 90.8 91.7 92.1 .7 1.0 1.0 .4 3.1 3.3 3.6 3.1 1986 ....................................... 92.8 93.1 93.7 93.9 .8 .3 .6 .2 3.2 2.5 2.2 2.0 1987 ....................................... 94.3 94.8 95.3 96.4 .4 .5 .5 1.2 1.6 1.8 1.7 2.7 1988 ....................................... 96.8 97.5 98.2 98.5 .4 .7 .7 .3 2.7 2.8 3.0 2.2 1989 ....................................... 99.2 100.0 100.6 101.6 .7 .8 .6 1.0 2.5 2.6 2.4 3.1 1990 ....................................... 102.6 103.3 104.2 105.1 1.0 .7 .9 .9 3.4 3.3 3.6 3.4 1991 ....................................... 106.2 107.1 108.0 108.9 1.0 .8 .8 .8 3.5 3.7 3.6 3.6 1992 ....................................... 109.8 110.8 111.7 112.3 .8 .9 .8 .5 3.4 3.5 3.4 3.1 1993 ....................................... 113.1 113.9 114.8 115.7 .7 .7 .8 .8 3.0 2.8 2.8 3.0 1994 ....................................... 116.5 117.6 118.6 119.1 .7 .9 .9 .4 3.0 3.2 3.3 2.9 1995 ....................................... 119.8 120.6 121.5 122.2 .6 .7 .7 .6 2.8 2.6 2.4 2.6 1996 ....................................... 122.8 124.2 124.8 125.4 .5 1.1 .5 .5 2.5 3.0 2.7 2.6 1997 ....................................... 126.0 126.9 128.3 128.9 .5 .7 1.1 .5 2.6 2.2 2.8 2.8 1998 ....................................... 129.6 130.7 132.4 133.1 .5 .8 1.3 .5 2.9 3.0 3.2 3.3 1999 ....................................... 133.6 134.7 135.7 136.5 .4 .8 .7 .6 3.1 3.1 2.5 2.6
Union blue-collar workers: 1987 ....................................... – 94.5 95.0 96.2 – – .5 1.3 – – – – 1988 ....................................... 96.5 97.2 97.8 98.4 .3 .7 .6 .6 – 2.9 2.9 2.3 1989 ....................................... 99.1 100.0 100.7 101.5 .7 .9 .7 .8 2.7 2.9 3.0 3.2 1990 ....................................... 102.2 103.2 103.8 104.8 .7 1.0 .6 1.0 3.1 3.2 3.1 3.3 1991 ....................................... 105.8 106.7 107.3 108.2 1.0 .9 .6 .8 3.5 3.4 3.4 3.2 1992 ....................................... 109.1 109.9 110.8 111.3 .8 .7 .8 .5 3.1 3.0 3.3 2.9 1993 ....................................... 112.0 112.8 113.7 114.5 .6 .7 .8 .7 2.7 2.6 2.6 2.9 1994 ....................................... 115.1 116.2 117.3 117.6 .5 1.0 .9 .3 2.8 3.0 3.2 2.7 1995 ....................................... 118.2 119.1 120.0 120.3 .5 .8 .8 .3 2.7 2.5 2.3 2.3 1996 ....................................... 120.9 122.0 122.8 123.4 .5 .9 .7 .5 2.3 2.4 2.3 2.6 1997 ....................................... 123.6 124.7 126.0 126.7 .2 .9 1.0 .6 2.2 2.2 2.6 2.7 1998 ....................................... 127.2 128.5 129.9 130.6 .4 1.0 1.1 .5 2.9 3.0 3.1 3.1 1999 ....................................... 131.2 132.5 133.6 134.5 .5 1.0 .8 .7 3.1 3.1 2.8 3.0
Union workers, goods-producingindustries1:
1975 ....................................... – – 46.0 47.2 – – – 2.6 – – – – 1976 ....................................... 47.9 48.7 49.9 51.0 1.5 1.7 2.5 2.2 – – 8.5 8.1 1977 ....................................... 51.7 52.8 54.0 55.0 1.4 2.1 2.3 1.9 7.9 8.4 8.2 7.8 1978 ....................................... 55.9 57.0 58.4 59.7 1.6 2.0 2.5 2.2 8.1 8.0 8.1 8.5 1979 ....................................... 60.6 62.0 63.2 64.9 1.5 2.3 1.9 2.7 8.4 8.8 8.2 8.7 1980 ....................................... 66.3 68.3 70.3 71.8 2.2 3.0 2.9 2.1 9.4 10.2 11.2 10.6 1981 ....................................... 73.1 75.0 77.1 78.6 1.8 2.6 2.8 1.9 10.3 9.8 9.7 9.5 1982 ....................................... 79.5 80.7 82.3 83.2 1.1 1.5 2.0 1.1 8.8 7.6 6.7 5.9 1983 ....................................... 83.7 84.5 85.5 86.2 .6 1.0 1.2 .8 5.3 4.7 3.9 3.6 1984 ....................................... 87.0 87.9 88.5 89.4 .9 1.0 .7 1.0 3.9 4.0 3.5 3.7 1985 ....................................... 90.0 90.9 91.6 92.0 .7 1.0 .8 .4 3.4 3.4 3.5 2.9 1986 ....................................... 92.5 93.0 93.3 93.6 .5 .5 .3 .3 2.8 2.3 1.9 1.7 1987 ....................................... 93.7 94.3 94.8 96.3 .1 .6 .5 1.6 1.3 1.4 1.6 2.9 1988 ....................................... 96.5 97.2 97.8 98.4 .2 .7 .6 .6 3.0 3.1 3.2 2.2
See footnotes at end of table.
105

Table 11. Wages and salaries, private industry workers: Employment Cost Index by bargaining status, region, andarea size, 1975-99
(Not seasonally adjusted) — Continued
Series and year
Indexes (June 1989=100) Percent changes for
March June Sept. Dec.3 months ended– 12 months ended–
March June Sept. Dec. March June Sept. Dec.
Union workers, goods-producingindustries1:
1989 ....................................... 99.0 100.0 100.6 101.6 0.6 1.0 0.6 1.0 2.6 2.9 2.9 3.3 1990 ....................................... 102.3 103.5 104.0 105.0 .7 1.2 .5 1.0 3.3 3.5 3.4 3.3 1991 ....................................... 106.2 107.1 107.7 108.7 1.1 .8 .6 .9 3.8 3.5 3.6 3.5 1992 ....................................... 109.6 110.2 111.1 111.7 .8 .5 .8 .5 3.2 2.9 3.2 2.8 1993 ....................................... 112.2 113.0 113.8 114.8 .4 .7 .7 .9 2.4 2.5 2.4 2.8 1994 ....................................... 115.4 116.7 117.5 117.9 .5 1.1 .7 .3 2.9 3.3 3.3 2.7 1995 ....................................... 118.4 119.3 120.2 120.6 .4 .8 .8 .3 2.6 2.2 2.3 2.3 1996 ....................................... 121.3 122.5 123.2 123.6 .6 1.0 .6 .3 2.4 2.7 2.5 2.5 1997 ....................................... 124.1 125.4 126.6 127.1 .4 1.0 1.0 .4 2.3 2.4 2.8 2.8 1998 ....................................... 127.9 129.4 131.0 131.7 .6 1.2 1.2 .5 3.1 3.2 3.5 3.6 1999 ....................................... 132.3 133.8 134.9 136.1 .5 1.1 .8 .9 3.4 3.4 3.0 3.3
Union workers, service-producingindustries2:
1975 ....................................... – – 44.8 45.9 – – – 2.5 – – – – 1976 ....................................... 46.6 47.5 48.6 49.5 1.5 1.9 2.3 1.9 – – 8.5 7.8 1977 ....................................... 50.1 51.3 52.0 53.0 1.2 2.4 1.4 1.9 7.5 8.0 7.0 7.1 1978 ....................................... 53.8 54.9 55.9 56.8 1.5 2.0 1.8 1.6 7.4 7.0 7.5 7.2 1979 ....................................... 58.0 59.1 60.8 62.1 2.1 1.9 2.9 2.1 7.8 7.7 8.8 9.3 1980 ....................................... 63.7 65.2 67.1 69.1 2.6 2.4 2.9 3.0 9.8 10.3 10.4 11.3 1981 ....................................... 70.3 72.3 73.9 76.2 1.7 2.8 2.2 3.1 10.4 10.9 10.1 10.3 1982 ....................................... 77.4 78.7 80.3 81.6 1.6 1.7 2.0 1.6 10.1 8.9 8.7 7.1 1983 ....................................... 83.0 84.2 86.1 86.7 1.7 1.4 2.3 .7 7.2 7.0 7.2 6.3 1984 ....................................... 87.7 88.1 88.5 89.2 1.2 .5 .5 .8 5.7 4.6 2.8 2.9 1985 ....................................... 89.7 90.8 91.8 92.3 .6 1.2 1.1 .5 2.3 3.1 3.7 3.5 1986 ....................................... 93.2 93.4 94.3 94.6 1.0 .2 1.0 .3 3.9 2.9 2.7 2.5 1987 ....................................... 95.2 95.5 96.0 96.5 .6 .3 .5 .5 2.1 2.2 1.8 2.0 1988 ....................................... 97.1 97.8 98.8 98.8 .6 .7 1.0 .0 2.0 2.4 2.9 2.4 1989 ....................................... 99.6 100.0 100.7 101.7 .8 .4 .7 1.0 2.6 2.2 1.9 2.9 1990 ....................................... 102.9 103.1 104.4 105.2 1.2 .2 1.3 .8 3.3 3.1 3.7 3.4 1991 ....................................... 106.1 107.0 108.4 109.2 .9 .8 1.3 .7 3.1 3.8 3.8 3.8 1992 ....................................... 110.1 111.5 112.5 113.1 .8 1.3 .9 .5 3.8 4.2 3.8 3.6 1993 ....................................... 114.2 115.1 116.0 116.8 1.0 .8 .8 .7 3.7 3.2 3.1 3.3 1994 ....................................... 118.0 118.7 120.1 120.6 1.0 .6 1.2 .4 3.3 3.1 3.5 3.3 1995 ....................................... 121.6 122.3 123.2 124.2 .8 .6 .7 .8 3.1 3.0 2.6 3.0 1996 ....................................... 124.8 126.2 126.8 127.6 .5 1.1 .5 .6 2.6 3.2 2.9 2.7 1997 ....................................... 128.2 128.8 130.4 131.2 .5 .5 1.2 .6 2.7 2.1 2.8 2.8 1998 ....................................... 131.8 132.2 134.1 134.8 .5 .3 1.4 .5 2.8 2.6 2.8 2.7 1999 ....................................... 135.4 135.8 136.8 137.2 .4 .3 .7 .3 2.7 2.7 2.0 1.8
Union workers, manufacturing: 1976 ....................................... – – 48.7 50.1 – – – 2.9 – – – – 1977 ....................................... 50.8 51.8 53.1 54.2 1.4 2.0 2.5 2.1 – – 9.0 8.2 1978 ....................................... 55.1 56.0 57.4 58.9 1.7 1.6 2.5 2.6 8.5 8.1 8.1 8.7 1979 ....................................... 59.9 61.1 62.3 64.4 1.7 2.0 2.0 3.4 8.7 9.1 8.5 9.3 1980 ....................................... 66.1 67.9 69.8 71.5 2.6 2.7 2.8 2.4 10.4 11.1 12.0 11.0 1981 ....................................... 72.7 74.4 76.3 77.9 1.7 2.3 2.6 2.1 10.0 9.6 9.3 9.0 1982 ....................................... 78.8 79.8 81.5 82.4 1.2 1.3 2.1 1.1 8.4 7.3 6.8 5.8 1983 ....................................... 82.9 83.6 84.6 85.4 .6 .8 1.2 .9 5.2 4.8 3.8 3.6 1984 ....................................... 86.4 87.1 87.9 88.9 1.2 .8 .9 1.1 4.2 4.2 3.9 4.1 1985 ....................................... 89.6 90.6 91.4 91.7 .8 1.1 .9 .3 3.7 4.0 4.0 3.1 1986 ....................................... 92.4 92.7 93.0 93.4 .8 .3 .3 .4 3.1 2.3 1.8 1.9 1987 ....................................... 93.5 93.9 94.5 96.2 .1 .4 .6 1.8 1.2 1.3 1.6 3.0 1988 ....................................... 96.4 97.0 97.5 98.3 .2 .6 .5 .8 3.1 3.3 3.2 2.2 1989 ....................................... 99.0 100.0 100.5 101.7 .7 1.0 .5 1.2 2.7 3.1 3.1 3.5 1990 ....................................... 102.6 103.8 104.3 105.5 .9 1.2 .5 1.2 3.6 3.8 3.8 3.7
See footnotes at end of table.
106
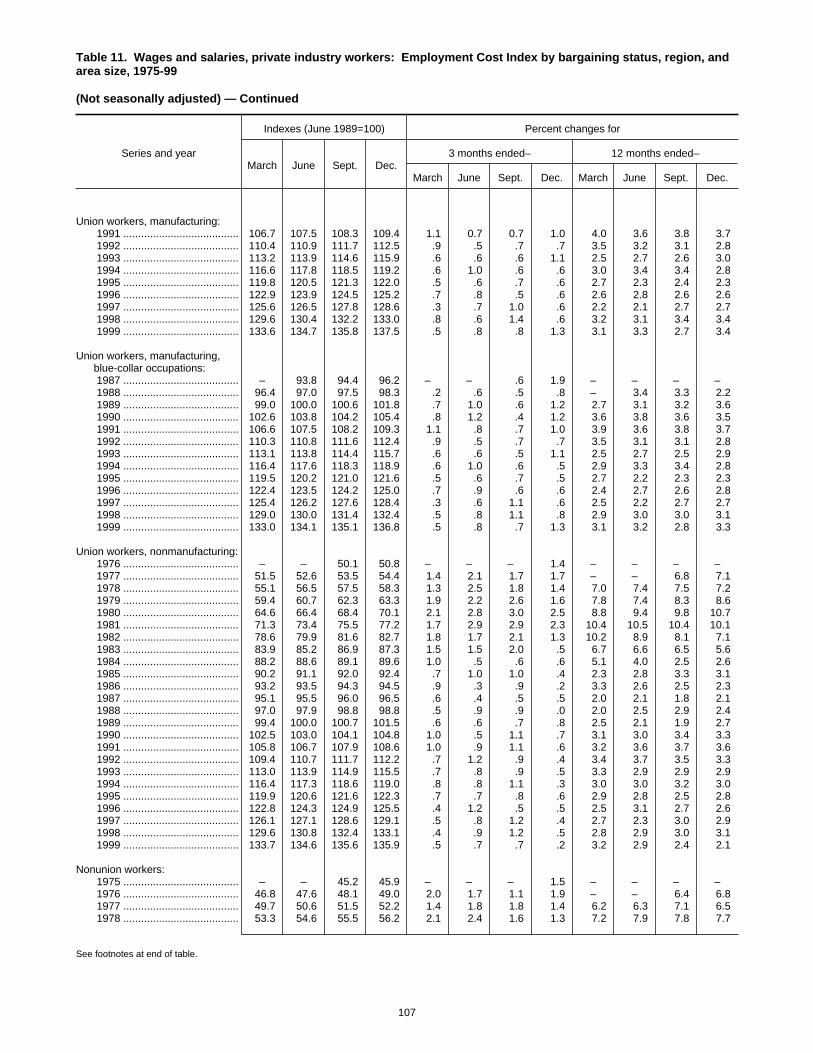
Table 11. Wages and salaries, private industry workers: Employment Cost Index by bargaining status, region, andarea size, 1975-99
(Not seasonally adjusted) — Continued
Series and year
Indexes (June 1989=100) Percent changes for
March June Sept. Dec.3 months ended– 12 months ended–
March June Sept. Dec. March June Sept. Dec.
Union workers, manufacturing: 1991 ....................................... 106.7 107.5 108.3 109.4 1.1 0.7 0.7 1.0 4.0 3.6 3.8 3.7 1992 ....................................... 110.4 110.9 111.7 112.5 .9 .5 .7 .7 3.5 3.2 3.1 2.8 1993 ....................................... 113.2 113.9 114.6 115.9 .6 .6 .6 1.1 2.5 2.7 2.6 3.0 1994 ....................................... 116.6 117.8 118.5 119.2 .6 1.0 .6 .6 3.0 3.4 3.4 2.8 1995 ....................................... 119.8 120.5 121.3 122.0 .5 .6 .7 .6 2.7 2.3 2.4 2.3 1996 ....................................... 122.9 123.9 124.5 125.2 .7 .8 .5 .6 2.6 2.8 2.6 2.6 1997 ....................................... 125.6 126.5 127.8 128.6 .3 .7 1.0 .6 2.2 2.1 2.7 2.7 1998 ....................................... 129.6 130.4 132.2 133.0 .8 .6 1.4 .6 3.2 3.1 3.4 3.4 1999 ....................................... 133.6 134.7 135.8 137.5 .5 .8 .8 1.3 3.1 3.3 2.7 3.4
Union workers, manufacturing,blue-collar occupations:
1987 ....................................... – 93.8 94.4 96.2 – – .6 1.9 – – – – 1988 ....................................... 96.4 97.0 97.5 98.3 .2 .6 .5 .8 – 3.4 3.3 2.2 1989 ....................................... 99.0 100.0 100.6 101.8 .7 1.0 .6 1.2 2.7 3.1 3.2 3.6 1990 ....................................... 102.6 103.8 104.2 105.4 .8 1.2 .4 1.2 3.6 3.8 3.6 3.5 1991 ....................................... 106.6 107.5 108.2 109.3 1.1 .8 .7 1.0 3.9 3.6 3.8 3.7 1992 ....................................... 110.3 110.8 111.6 112.4 .9 .5 .7 .7 3.5 3.1 3.1 2.8 1993 ....................................... 113.1 113.8 114.4 115.7 .6 .6 .5 1.1 2.5 2.7 2.5 2.9 1994 ....................................... 116.4 117.6 118.3 118.9 .6 1.0 .6 .5 2.9 3.3 3.4 2.8 1995 ....................................... 119.5 120.2 121.0 121.6 .5 .6 .7 .5 2.7 2.2 2.3 2.3 1996 ....................................... 122.4 123.5 124.2 125.0 .7 .9 .6 .6 2.4 2.7 2.6 2.8 1997 ....................................... 125.4 126.2 127.6 128.4 .3 .6 1.1 .6 2.5 2.2 2.7 2.7 1998 ....................................... 129.0 130.0 131.4 132.4 .5 .8 1.1 .8 2.9 3.0 3.0 3.1 1999 ....................................... 133.0 134.1 135.1 136.8 .5 .8 .7 1.3 3.1 3.2 2.8 3.3
Union workers, nonmanufacturing: 1976 ....................................... – – 50.1 50.8 – – – 1.4 – – – – 1977 ....................................... 51.5 52.6 53.5 54.4 1.4 2.1 1.7 1.7 – – 6.8 7.1 1978 ....................................... 55.1 56.5 57.5 58.3 1.3 2.5 1.8 1.4 7.0 7.4 7.5 7.2 1979 ....................................... 59.4 60.7 62.3 63.3 1.9 2.2 2.6 1.6 7.8 7.4 8.3 8.6 1980 ....................................... 64.6 66.4 68.4 70.1 2.1 2.8 3.0 2.5 8.8 9.4 9.8 10.7 1981 ....................................... 71.3 73.4 75.5 77.2 1.7 2.9 2.9 2.3 10.4 10.5 10.4 10.1 1982 ....................................... 78.6 79.9 81.6 82.7 1.8 1.7 2.1 1.3 10.2 8.9 8.1 7.1 1983 ....................................... 83.9 85.2 86.9 87.3 1.5 1.5 2.0 .5 6.7 6.6 6.5 5.6 1984 ....................................... 88.2 88.6 89.1 89.6 1.0 .5 .6 .6 5.1 4.0 2.5 2.6 1985 ....................................... 90.2 91.1 92.0 92.4 .7 1.0 1.0 .4 2.3 2.8 3.3 3.1 1986 ....................................... 93.2 93.5 94.3 94.5 .9 .3 .9 .2 3.3 2.6 2.5 2.3 1987 ....................................... 95.1 95.5 96.0 96.5 .6 .4 .5 .5 2.0 2.1 1.8 2.1 1988 ....................................... 97.0 97.9 98.8 98.8 .5 .9 .9 .0 2.0 2.5 2.9 2.4 1989 ....................................... 99.4 100.0 100.7 101.5 .6 .6 .7 .8 2.5 2.1 1.9 2.7 1990 ....................................... 102.5 103.0 104.1 104.8 1.0 .5 1.1 .7 3.1 3.0 3.4 3.3 1991 ....................................... 105.8 106.7 107.9 108.6 1.0 .9 1.1 .6 3.2 3.6 3.7 3.6 1992 ....................................... 109.4 110.7 111.7 112.2 .7 1.2 .9 .4 3.4 3.7 3.5 3.3 1993 ....................................... 113.0 113.9 114.9 115.5 .7 .8 .9 .5 3.3 2.9 2.9 2.9 1994 ....................................... 116.4 117.3 118.6 119.0 .8 .8 1.1 .3 3.0 3.0 3.2 3.0 1995 ....................................... 119.9 120.6 121.6 122.3 .7 .7 .8 .6 2.9 2.8 2.5 2.8 1996 ....................................... 122.8 124.3 124.9 125.5 .4 1.2 .5 .5 2.5 3.1 2.7 2.6 1997 ....................................... 126.1 127.1 128.6 129.1 .5 .8 1.2 .4 2.7 2.3 3.0 2.9 1998 ....................................... 129.6 130.8 132.4 133.1 .4 .9 1.2 .5 2.8 2.9 3.0 3.1 1999 ....................................... 133.7 134.6 135.6 135.9 .5 .7 .7 .2 3.2 2.9 2.4 2.1
Nonunion workers: 1975 ....................................... – – 45.2 45.9 – – – 1.5 – – – – 1976 ....................................... 46.8 47.6 48.1 49.0 2.0 1.7 1.1 1.9 – – 6.4 6.8 1977 ....................................... 49.7 50.6 51.5 52.2 1.4 1.8 1.8 1.4 6.2 6.3 7.1 6.5 1978 ....................................... 53.3 54.6 55.5 56.2 2.1 2.4 1.6 1.3 7.2 7.9 7.8 7.7
See footnotes at end of table.
107
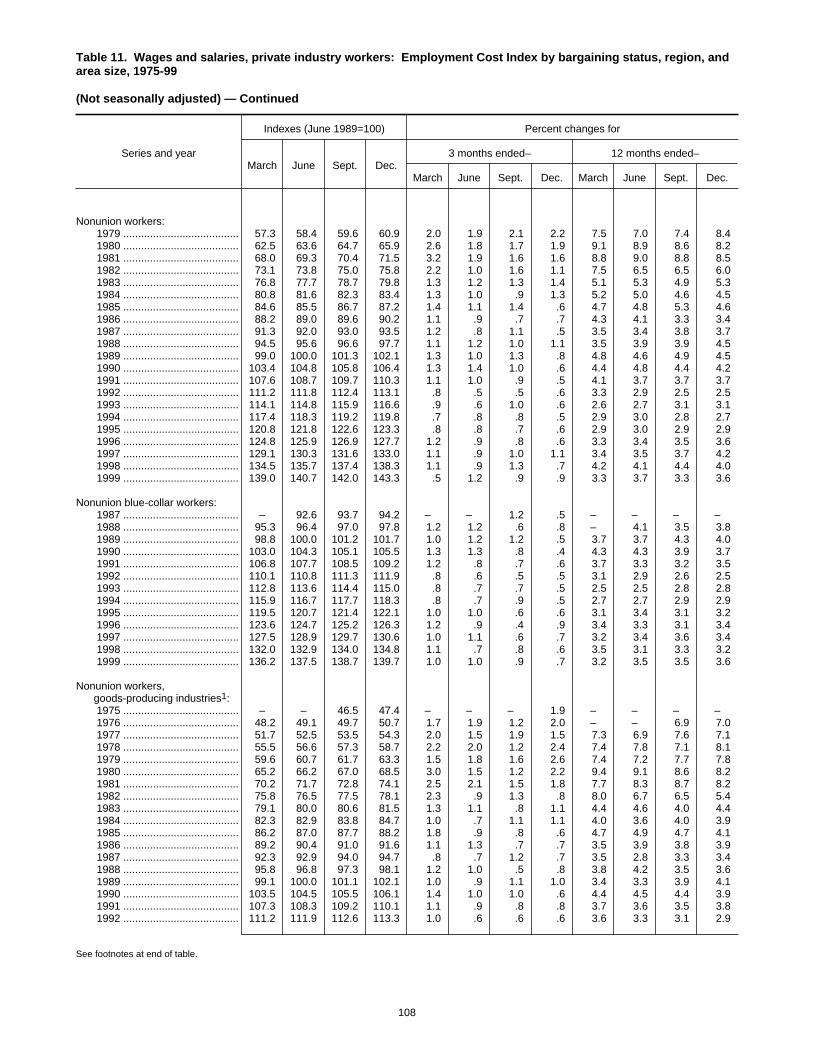
Table 11. Wages and salaries, private industry workers: Employment Cost Index by bargaining status, region, andarea size, 1975-99
(Not seasonally adjusted) — Continued
Series and year
Indexes (June 1989=100) Percent changes for
March June Sept. Dec.3 months ended– 12 months ended–
March June Sept. Dec. March June Sept. Dec.
Nonunion workers: 1979 ....................................... 57.3 58.4 59.6 60.9 2.0 1.9 2.1 2.2 7.5 7.0 7.4 8.4 1980 ....................................... 62.5 63.6 64.7 65.9 2.6 1.8 1.7 1.9 9.1 8.9 8.6 8.2 1981 ....................................... 68.0 69.3 70.4 71.5 3.2 1.9 1.6 1.6 8.8 9.0 8.8 8.5 1982 ....................................... 73.1 73.8 75.0 75.8 2.2 1.0 1.6 1.1 7.5 6.5 6.5 6.0 1983 ....................................... 76.8 77.7 78.7 79.8 1.3 1.2 1.3 1.4 5.1 5.3 4.9 5.3 1984 ....................................... 80.8 81.6 82.3 83.4 1.3 1.0 .9 1.3 5.2 5.0 4.6 4.5 1985 ....................................... 84.6 85.5 86.7 87.2 1.4 1.1 1.4 .6 4.7 4.8 5.3 4.6 1986 ....................................... 88.2 89.0 89.6 90.2 1.1 .9 .7 .7 4.3 4.1 3.3 3.4 1987 ....................................... 91.3 92.0 93.0 93.5 1.2 .8 1.1 .5 3.5 3.4 3.8 3.7 1988 ....................................... 94.5 95.6 96.6 97.7 1.1 1.2 1.0 1.1 3.5 3.9 3.9 4.5 1989 ....................................... 99.0 100.0 101.3 102.1 1.3 1.0 1.3 .8 4.8 4.6 4.9 4.5 1990 ....................................... 103.4 104.8 105.8 106.4 1.3 1.4 1.0 .6 4.4 4.8 4.4 4.2 1991 ....................................... 107.6 108.7 109.7 110.3 1.1 1.0 .9 .5 4.1 3.7 3.7 3.7 1992 ....................................... 111.2 111.8 112.4 113.1 .8 .5 .5 .6 3.3 2.9 2.5 2.5 1993 ....................................... 114.1 114.8 115.9 116.6 .9 .6 1.0 .6 2.6 2.7 3.1 3.1 1994 ....................................... 117.4 118.3 119.2 119.8 .7 .8 .8 .5 2.9 3.0 2.8 2.7 1995 ....................................... 120.8 121.8 122.6 123.3 .8 .8 .7 .6 2.9 3.0 2.9 2.9 1996 ....................................... 124.8 125.9 126.9 127.7 1.2 .9 .8 .6 3.3 3.4 3.5 3.6 1997 ....................................... 129.1 130.3 131.6 133.0 1.1 .9 1.0 1.1 3.4 3.5 3.7 4.2 1998 ....................................... 134.5 135.7 137.4 138.3 1.1 .9 1.3 .7 4.2 4.1 4.4 4.0 1999 ....................................... 139.0 140.7 142.0 143.3 .5 1.2 .9 .9 3.3 3.7 3.3 3.6
Nonunion blue-collar workers: 1987 ....................................... – 92.6 93.7 94.2 – – 1.2 .5 – – – – 1988 ....................................... 95.3 96.4 97.0 97.8 1.2 1.2 .6 .8 – 4.1 3.5 3.8 1989 ....................................... 98.8 100.0 101.2 101.7 1.0 1.2 1.2 .5 3.7 3.7 4.3 4.0 1990 ....................................... 103.0 104.3 105.1 105.5 1.3 1.3 .8 .4 4.3 4.3 3.9 3.7 1991 ....................................... 106.8 107.7 108.5 109.2 1.2 .8 .7 .6 3.7 3.3 3.2 3.5 1992 ....................................... 110.1 110.8 111.3 111.9 .8 .6 .5 .5 3.1 2.9 2.6 2.5 1993 ....................................... 112.8 113.6 114.4 115.0 .8 .7 .7 .5 2.5 2.5 2.8 2.8 1994 ....................................... 115.9 116.7 117.7 118.3 .8 .7 .9 .5 2.7 2.7 2.9 2.9 1995 ....................................... 119.5 120.7 121.4 122.1 1.0 1.0 .6 .6 3.1 3.4 3.1 3.2 1996 ....................................... 123.6 124.7 125.2 126.3 1.2 .9 .4 .9 3.4 3.3 3.1 3.4 1997 ....................................... 127.5 128.9 129.7 130.6 1.0 1.1 .6 .7 3.2 3.4 3.6 3.4 1998 ....................................... 132.0 132.9 134.0 134.8 1.1 .7 .8 .6 3.5 3.1 3.3 3.2 1999 ....................................... 136.2 137.5 138.7 139.7 1.0 1.0 .9 .7 3.2 3.5 3.5 3.6
Nonunion workers,goods-producing industries1:
1975 ....................................... – – 46.5 47.4 – – – 1.9 – – – – 1976 ....................................... 48.2 49.1 49.7 50.7 1.7 1.9 1.2 2.0 – – 6.9 7.0 1977 ....................................... 51.7 52.5 53.5 54.3 2.0 1.5 1.9 1.5 7.3 6.9 7.6 7.1 1978 ....................................... 55.5 56.6 57.3 58.7 2.2 2.0 1.2 2.4 7.4 7.8 7.1 8.1 1979 ....................................... 59.6 60.7 61.7 63.3 1.5 1.8 1.6 2.6 7.4 7.2 7.7 7.8 1980 ....................................... 65.2 66.2 67.0 68.5 3.0 1.5 1.2 2.2 9.4 9.1 8.6 8.2 1981 ....................................... 70.2 71.7 72.8 74.1 2.5 2.1 1.5 1.8 7.7 8.3 8.7 8.2 1982 ....................................... 75.8 76.5 77.5 78.1 2.3 .9 1.3 .8 8.0 6.7 6.5 5.4 1983 ....................................... 79.1 80.0 80.6 81.5 1.3 1.1 .8 1.1 4.4 4.6 4.0 4.4 1984 ....................................... 82.3 82.9 83.8 84.7 1.0 .7 1.1 1.1 4.0 3.6 4.0 3.9 1985 ....................................... 86.2 87.0 87.7 88.2 1.8 .9 .8 .6 4.7 4.9 4.7 4.1 1986 ....................................... 89.2 90.4 91.0 91.6 1.1 1.3 .7 .7 3.5 3.9 3.8 3.9 1987 ....................................... 92.3 92.9 94.0 94.7 .8 .7 1.2 .7 3.5 2.8 3.3 3.4 1988 ....................................... 95.8 96.8 97.3 98.1 1.2 1.0 .5 .8 3.8 4.2 3.5 3.6 1989 ....................................... 99.1 100.0 101.1 102.1 1.0 .9 1.1 1.0 3.4 3.3 3.9 4.1 1990 ....................................... 103.5 104.5 105.5 106.1 1.4 1.0 1.0 .6 4.4 4.5 4.4 3.9 1991 ....................................... 107.3 108.3 109.2 110.1 1.1 .9 .8 .8 3.7 3.6 3.5 3.8 1992 ....................................... 111.2 111.9 112.6 113.3 1.0 .6 .6 .6 3.6 3.3 3.1 2.9
See footnotes at end of table.
108

Table 11. Wages and salaries, private industry workers: Employment Cost Index by bargaining status, region, andarea size, 1975-99
(Not seasonally adjusted) — Continued
Series and year
Indexes (June 1989=100) Percent changes for
March June Sept. Dec.3 months ended– 12 months ended–
March June Sept. Dec. March June Sept. Dec.
Nonunion workers,goods-producing industries1:
1993 ....................................... 114.4 115.2 116.0 116.7 1.0 0.7 0.7 0.6 2.9 2.9 3.0 3.0 1994 ....................................... 117.6 118.6 119.5 120.3 .8 .9 .8 .7 2.8 3.0 3.0 3.1 1995 ....................................... 121.3 122.2 122.9 123.8 .8 .7 .6 .7 3.1 3.0 2.8 2.9 1996 ....................................... 124.9 126.1 127.3 128.0 .9 1.0 1.0 .5 3.0 3.2 3.6 3.4 1997 ....................................... 128.9 130.2 131.2 132.0 .7 1.0 .8 .6 3.2 3.3 3.1 3.1 1998 ....................................... 133.6 134.7 135.7 136.5 1.2 .8 .7 .6 3.6 3.5 3.4 3.4 1999 ....................................... 137.8 138.8 140.0 141.1 1.0 .7 .9 .8 3.1 3.0 3.2 3.4
Nonunion workers,service-producing industries2:
1975 ....................................... – – 44.5 45.1 – – – 1.3 – – – – 1976 ....................................... 46.1 46.8 47.2 48.1 2.2 1.5 .9 1.9 – – 6.1 6.7 1977 ....................................... 48.6 49.5 50.3 51.1 1.0 1.9 1.6 1.6 5.4 5.8 6.6 6.2 1978 ....................................... 52.2 53.5 54.6 54.8 2.2 2.5 2.1 .4 7.4 8.1 8.5 7.2 1979 ....................................... 56.1 57.2 58.4 59.7 2.4 2.0 2.1 2.2 7.5 6.9 7.0 8.9 1980 ....................................... 61.0 62.2 63.5 64.5 2.2 2.0 2.1 1.6 8.7 8.7 8.7 8.0 1981 ....................................... 66.8 67.9 69.1 70.1 3.6 1.6 1.8 1.4 9.5 9.2 8.8 8.7 1982 ....................................... 71.7 72.3 73.6 74.6 2.3 .8 1.8 1.4 7.3 6.5 6.5 6.4 1983 ....................................... 75.6 76.5 77.7 78.8 1.3 1.2 1.6 1.4 5.4 5.8 5.6 5.6 1984 ....................................... 80.0 80.8 81.5 82.6 1.5 1.0 .9 1.3 5.8 5.6 4.9 4.8 1985 ....................................... 83.6 84.5 86.2 86.8 1.2 1.1 2.0 .7 4.5 4.6 5.8 5.1 1986 ....................................... 87.6 88.2 88.9 89.5 .9 .7 .8 .7 4.8 4.4 3.1 3.1 1987 ....................................... 90.8 91.4 92.5 92.9 1.5 .7 1.2 .4 3.7 3.6 4.0 3.8 1988 ....................................... 93.8 95.1 96.3 97.6 1.0 1.4 1.3 1.3 3.3 4.0 4.1 5.1 1989 ....................................... 98.9 100.0 101.4 102.2 1.3 1.1 1.4 .8 5.4 5.2 5.3 4.7 1990 ....................................... 103.4 104.9 105.9 106.5 1.2 1.5 1.0 .6 4.6 4.9 4.4 4.2 1991 ....................................... 107.8 108.9 109.9 110.4 1.2 1.0 .9 .5 4.3 3.8 3.8 3.7 1992 ....................................... 111.2 111.7 112.3 113.0 .7 .4 .5 .6 3.2 2.6 2.2 2.4 1993 ....................................... 113.8 114.6 115.9 116.6 .7 .7 1.1 .6 2.3 2.6 3.2 3.2 1994 ....................................... 117.2 118.1 119.0 119.5 .5 .8 .8 .4 3.0 3.1 2.7 2.5 1995 ....................................... 120.5 121.5 122.4 123.0 .8 .8 .7 .5 2.8 2.9 2.9 2.9 1996 ....................................... 124.6 125.7 126.6 127.5 1.3 .9 .7 .7 3.4 3.5 3.4 3.7 1997 ....................................... 129.1 130.2 131.6 133.2 1.3 .9 1.1 1.2 3.6 3.6 3.9 4.5 1998 ....................................... 134.6 135.9 137.9 138.8 1.1 1.0 1.5 .7 4.3 4.4 4.8 4.2 1999 ....................................... 139.3 141.3 142.6 143.9 .4 1.4 .9 .9 3.5 4.0 3.4 3.7
Nonunion workers, manufacturing: 1976 ....................................... – – 49.2 49.9 – – – 1.4 – – – – 1977 ....................................... 51.0 51.8 52.9 53.7 2.2 1.6 2.1 1.5 – – 7.5 7.6 1978 ....................................... 54.9 55.7 56.5 57.9 2.2 1.5 1.4 2.5 7.6 7.5 6.8 7.8 1979 ....................................... 58.9 59.9 60.8 62.5 1.7 1.7 1.5 2.8 7.3 7.5 7.6 7.9 1980 ....................................... 64.4 65.3 66.1 67.5 3.0 1.4 1.2 2.1 9.3 9.0 8.7 8.0 1981 ....................................... 69.2 70.7 71.9 73.1 2.5 2.2 1.7 1.7 7.5 8.3 8.8 8.3 1982 ....................................... 74.9 75.5 76.5 77.2 2.5 .8 1.3 .9 8.2 6.8 6.4 5.6 1983 ....................................... 78.3 79.1 79.9 80.8 1.4 1.0 1.0 1.1 4.5 4.8 4.4 4.7 1984 ....................................... 81.6 82.4 83.4 84.5 1.0 1.0 1.2 1.3 4.2 4.2 4.4 4.6 1985 ....................................... 85.9 86.8 87.5 88.0 1.7 1.0 .8 .6 5.3 5.3 4.9 4.1 1986 ....................................... 89.2 90.3 90.9 91.6 1.4 1.2 .7 .8 3.8 4.0 3.9 4.1 1987 ....................................... 92.4 93.0 94.1 94.7 .9 .6 1.2 .6 3.6 3.0 3.5 3.4 1988 ....................................... 95.8 96.7 97.2 98.0 1.2 .9 .5 .8 3.7 4.0 3.3 3.5 1989 ....................................... 98.9 100.0 101.0 102.0 .9 1.1 1.0 1.0 3.2 3.4 3.9 4.1 1990 ....................................... 103.6 104.8 105.9 106.5 1.6 1.2 1.0 .6 4.8 4.8 4.9 4.4 1991 ....................................... 107.7 108.8 109.7 110.7 1.1 1.0 .8 .9 4.0 3.8 3.6 3.9 1992 ....................................... 111.9 112.7 113.4 114.2 1.1 .7 .6 .7 3.9 3.6 3.4 3.2 1993 ....................................... 115.4 116.1 117.0 117.9 1.1 .6 .8 .8 3.1 3.0 3.2 3.2 1994 ....................................... 118.6 119.5 120.5 121.5 .6 .8 .8 .8 2.8 2.9 3.0 3.1
See footnotes at end of table.
109

Table 11. Wages and salaries, private industry workers: Employment Cost Index by bargaining status, region, andarea size, 1975-99
(Not seasonally adjusted) — Continued
Series and year
Indexes (June 1989=100) Percent changes for
March June Sept. Dec.3 months ended– 12 months ended–
March June Sept. Dec. March June Sept. Dec.
Nonunion workers, manufacturing: 1995 ....................................... 122.7 123.8 124.3 125.2 1.0 0.9 0.4 0.7 3.5 3.6 3.2 3.0 1996 ....................................... 126.3 127.5 128.8 129.6 .9 1.0 1.0 .6 2.9 3.0 3.6 3.5 1997 ....................................... 130.3 131.7 132.6 133.5 .5 1.1 .7 .7 3.2 3.3 3.0 3.0 1998 ....................................... 135.1 136.2 137.3 138.2 1.2 .8 .8 .7 3.7 3.4 3.5 3.5 1999 ....................................... 139.4 140.5 141.7 142.9 .9 .8 .9 .8 3.2 3.2 3.2 3.4
Nonunion workers, manufacturing,blue-collar occupations:
1987 ....................................... – 93.1 94.2 94.4 – – 1.2 .2 – – – – 1988 ....................................... 95.4 96.3 96.8 97.8 1.1 .9 .5 1.0 – 3.4 2.8 3.6 1989 ....................................... 98.7 100.0 101.2 102.2 .9 1.3 1.2 1.0 3.5 3.8 4.5 4.5 1990 ....................................... 103.6 105.0 106.0 106.7 1.4 1.4 1.0 .7 5.0 5.0 4.7 4.4 1991 ....................................... 107.9 108.8 109.7 110.7 1.1 .8 .8 .9 4.2 3.6 3.5 3.7 1992 ....................................... 111.9 112.5 113.1 113.7 1.1 .5 .5 .5 3.7 3.4 3.1 2.7 1993 ....................................... 114.6 115.2 116.0 116.7 .8 .5 .7 .6 2.4 2.4 2.6 2.6 1994 ....................................... 117.5 118.1 119.1 120.0 .7 .5 .8 .8 2.5 2.5 2.7 2.8 1995 ....................................... 121.2 122.6 123.1 124.2 1.0 1.2 .4 .9 3.1 3.8 3.4 3.5 1996 ....................................... 125.4 126.7 127.8 128.8 1.0 1.0 .9 .8 3.5 3.3 3.8 3.7 1997 ....................................... 129.8 131.2 132.0 133.0 .8 1.1 .6 .8 3.5 3.6 3.3 3.3 1998 ....................................... 134.4 135.1 136.2 137.2 1.1 .5 .8 .7 3.5 3.0 3.2 3.2 1999 ....................................... 138.5 139.2 140.5 141.6 .9 .5 .9 .8 3.1 3.0 3.2 3.2
Nonunion workers,nonmanufacturing:
1976 ....................................... – – 47.7 48.6 – – – 1.9 – – – – 1977 ....................................... 49.2 50.1 50.8 51.6 1.2 1.8 1.4 1.6 – – 6.5 6.2 1978 ....................................... 52.7 54.1 55.2 55.5 2.1 2.7 2.0 .5 7.1 8.0 8.7 7.6 1979 ....................................... 56.7 57.9 59.1 60.4 2.2 2.1 2.1 2.2 7.6 7.0 7.1 8.8 1980 ....................................... 61.7 62.8 64.1 65.2 2.2 1.8 2.1 1.7 8.8 8.5 8.5 7.9 1981 ....................................... 67.5 68.7 69.8 70.9 3.5 1.8 1.6 1.6 9.4 9.4 8.9 8.7 1982 ....................................... 72.5 73.1 74.4 75.3 2.3 .8 1.8 1.2 7.4 6.4 6.6 6.2 1983 ....................................... 76.2 77.2 78.3 79.4 1.2 1.3 1.4 1.4 5.1 5.6 5.2 5.4 1984 ....................................... 80.5 81.2 81.9 82.9 1.4 .9 .9 1.2 5.6 5.2 4.6 4.4 1985 ....................................... 84.0 84.9 86.5 87.0 1.3 1.1 1.9 .6 4.3 4.6 5.6 4.9 1986 ....................................... 87.8 88.5 89.1 89.7 .9 .8 .7 .7 4.5 4.2 3.0 3.1 1987 ....................................... 90.9 91.6 92.7 93.0 1.3 .8 1.2 .3 3.5 3.5 4.0 3.7 1988 ....................................... 94.0 95.3 96.4 97.7 1.1 1.4 1.2 1.3 3.4 4.0 4.0 5.1 1989 ....................................... 99.0 100.0 101.4 102.3 1.3 1.0 1.4 .9 5.3 4.9 5.2 4.7 1990 ....................................... 103.3 104.8 105.7 106.3 1.0 1.5 .9 .6 4.3 4.8 4.2 3.9 1991 ....................................... 107.6 108.7 109.6 110.1 1.2 1.0 .8 .5 4.2 3.7 3.7 3.6 1992 ....................................... 110.9 111.4 112.0 112.7 .7 .5 .5 .6 3.1 2.5 2.2 2.4 1993 ....................................... 113.5 114.3 115.5 116.1 .7 .7 1.0 .5 2.3 2.6 3.1 3.0 1994 ....................................... 116.9 117.8 118.7 119.1 .7 .8 .8 .3 3.0 3.1 2.8 2.6 1995 ....................................... 120.0 121.0 121.9 122.6 .8 .8 .7 .6 2.7 2.7 2.7 2.9 1996 ....................................... 124.2 125.2 126.1 127.0 1.3 .8 .7 .7 3.5 3.5 3.4 3.6 1997 ....................................... 128.5 129.7 131.1 132.6 1.2 .9 1.1 1.1 3.5 3.6 4.0 4.4 1998 ....................................... 134.0 135.3 137.1 138.0 1.1 1.0 1.3 .7 4.3 4.3 4.6 4.1 1999 ....................................... 138.6 140.5 141.8 143.0 .4 1.4 .9 .8 3.4 3.8 3.4 3.6
Northeast3: 1975 ....................................... – – 43.9 44.6 – – – 1.6 – – – – 1976 ....................................... 45.0 45.6 46.8 47.6 .9 1.3 2.6 1.7 – – 6.6 6.7 1977 ....................................... 48.1 49.0 49.9 50.7 1.1 1.9 1.8 1.6 6.9 7.5 6.6 6.5 1978 ....................................... 51.5 52.4 53.3 54.2 1.6 1.7 1.7 1.7 7.1 6.9 6.8 6.9 1979 ....................................... 55.0 56.0 56.9 58.2 1.5 1.8 1.6 2.3 6.8 6.9 6.8 7.4 1980 ....................................... 59.6 60.9 62.0 63.2 2.4 2.2 1.8 1.9 8.4 8.8 9.0 8.6 1981 ....................................... 64.7 65.8 66.9 68.7 2.4 1.7 1.7 2.7 8.6 8.0 7.9 8.7
See footnotes at end of table.
110
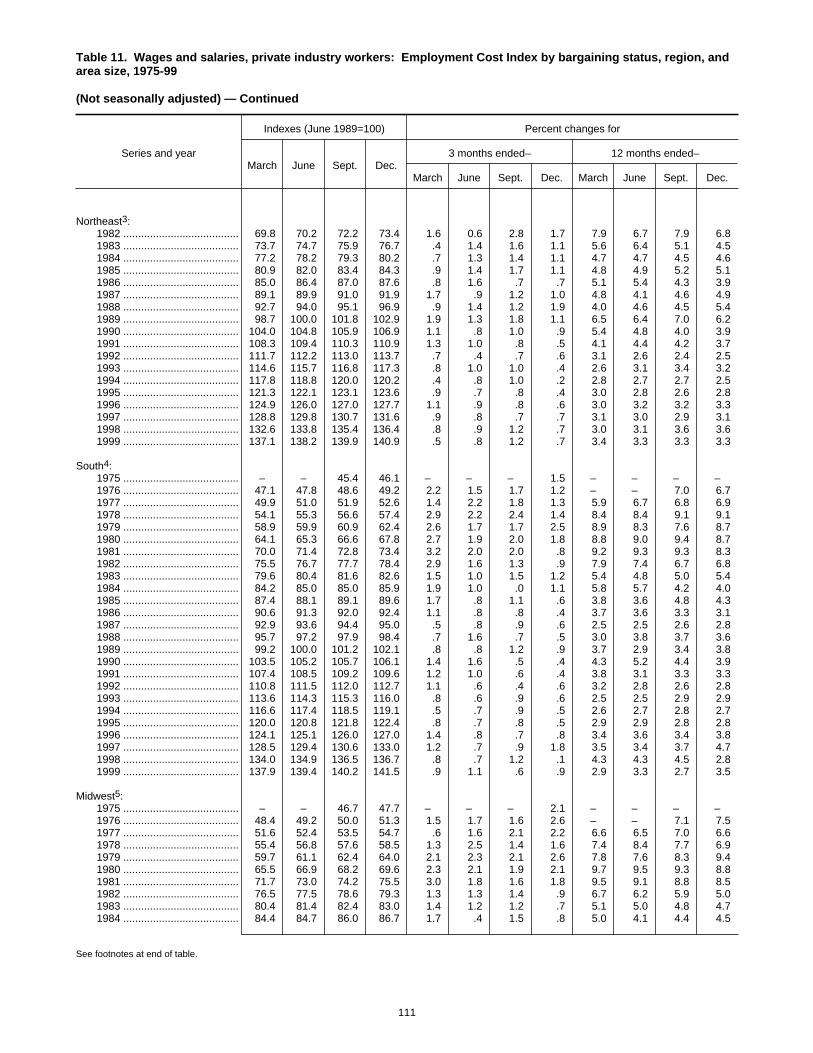
Table 11. Wages and salaries, private industry workers: Employment Cost Index by bargaining status, region, andarea size, 1975-99
(Not seasonally adjusted) — Continued
Series and year
Indexes (June 1989=100) Percent changes for
March June Sept. Dec.3 months ended– 12 months ended–
March June Sept. Dec. March June Sept. Dec.
Northeast3: 1982 ....................................... 69.8 70.2 72.2 73.4 1.6 0.6 2.8 1.7 7.9 6.7 7.9 6.8 1983 ....................................... 73.7 74.7 75.9 76.7 .4 1.4 1.6 1.1 5.6 6.4 5.1 4.5 1984 ....................................... 77.2 78.2 79.3 80.2 .7 1.3 1.4 1.1 4.7 4.7 4.5 4.6 1985 ....................................... 80.9 82.0 83.4 84.3 .9 1.4 1.7 1.1 4.8 4.9 5.2 5.1 1986 ....................................... 85.0 86.4 87.0 87.6 .8 1.6 .7 .7 5.1 5.4 4.3 3.9 1987 ....................................... 89.1 89.9 91.0 91.9 1.7 .9 1.2 1.0 4.8 4.1 4.6 4.9 1988 ....................................... 92.7 94.0 95.1 96.9 .9 1.4 1.2 1.9 4.0 4.6 4.5 5.4 1989 ....................................... 98.7 100.0 101.8 102.9 1.9 1.3 1.8 1.1 6.5 6.4 7.0 6.2 1990 ....................................... 104.0 104.8 105.9 106.9 1.1 .8 1.0 .9 5.4 4.8 4.0 3.9 1991 ....................................... 108.3 109.4 110.3 110.9 1.3 1.0 .8 .5 4.1 4.4 4.2 3.7 1992 ....................................... 111.7 112.2 113.0 113.7 .7 .4 .7 .6 3.1 2.6 2.4 2.5 1993 ....................................... 114.6 115.7 116.8 117.3 .8 1.0 1.0 .4 2.6 3.1 3.4 3.2 1994 ....................................... 117.8 118.8 120.0 120.2 .4 .8 1.0 .2 2.8 2.7 2.7 2.5 1995 ....................................... 121.3 122.1 123.1 123.6 .9 .7 .8 .4 3.0 2.8 2.6 2.8 1996 ....................................... 124.9 126.0 127.0 127.7 1.1 .9 .8 .6 3.0 3.2 3.2 3.3 1997 ....................................... 128.8 129.8 130.7 131.6 .9 .8 .7 .7 3.1 3.0 2.9 3.1 1998 ....................................... 132.6 133.8 135.4 136.4 .8 .9 1.2 .7 3.0 3.1 3.6 3.6 1999 ....................................... 137.1 138.2 139.9 140.9 .5 .8 1.2 .7 3.4 3.3 3.3 3.3
South4: 1975 ....................................... – – 45.4 46.1 – – – 1.5 – – – – 1976 ....................................... 47.1 47.8 48.6 49.2 2.2 1.5 1.7 1.2 – – 7.0 6.7 1977 ....................................... 49.9 51.0 51.9 52.6 1.4 2.2 1.8 1.3 5.9 6.7 6.8 6.9 1978 ....................................... 54.1 55.3 56.6 57.4 2.9 2.2 2.4 1.4 8.4 8.4 9.1 9.1 1979 ....................................... 58.9 59.9 60.9 62.4 2.6 1.7 1.7 2.5 8.9 8.3 7.6 8.7 1980 ....................................... 64.1 65.3 66.6 67.8 2.7 1.9 2.0 1.8 8.8 9.0 9.4 8.7 1981 ....................................... 70.0 71.4 72.8 73.4 3.2 2.0 2.0 .8 9.2 9.3 9.3 8.3 1982 ....................................... 75.5 76.7 77.7 78.4 2.9 1.6 1.3 .9 7.9 7.4 6.7 6.8 1983 ....................................... 79.6 80.4 81.6 82.6 1.5 1.0 1.5 1.2 5.4 4.8 5.0 5.4 1984 ....................................... 84.2 85.0 85.0 85.9 1.9 1.0 .0 1.1 5.8 5.7 4.2 4.0 1985 ....................................... 87.4 88.1 89.1 89.6 1.7 .8 1.1 .6 3.8 3.6 4.8 4.3 1986 ....................................... 90.6 91.3 92.0 92.4 1.1 .8 .8 .4 3.7 3.6 3.3 3.1 1987 ....................................... 92.9 93.6 94.4 95.0 .5 .8 .9 .6 2.5 2.5 2.6 2.8 1988 ....................................... 95.7 97.2 97.9 98.4 .7 1.6 .7 .5 3.0 3.8 3.7 3.6 1989 ....................................... 99.2 100.0 101.2 102.1 .8 .8 1.2 .9 3.7 2.9 3.4 3.8 1990 ....................................... 103.5 105.2 105.7 106.1 1.4 1.6 .5 .4 4.3 5.2 4.4 3.9 1991 ....................................... 107.4 108.5 109.2 109.6 1.2 1.0 .6 .4 3.8 3.1 3.3 3.3 1992 ....................................... 110.8 111.5 112.0 112.7 1.1 .6 .4 .6 3.2 2.8 2.6 2.8 1993 ....................................... 113.6 114.3 115.3 116.0 .8 .6 .9 .6 2.5 2.5 2.9 2.9 1994 ....................................... 116.6 117.4 118.5 119.1 .5 .7 .9 .5 2.6 2.7 2.8 2.7 1995 ....................................... 120.0 120.8 121.8 122.4 .8 .7 .8 .5 2.9 2.9 2.8 2.8 1996 ....................................... 124.1 125.1 126.0 127.0 1.4 .8 .7 .8 3.4 3.6 3.4 3.8 1997 ....................................... 128.5 129.4 130.6 133.0 1.2 .7 .9 1.8 3.5 3.4 3.7 4.7 1998 ....................................... 134.0 134.9 136.5 136.7 .8 .7 1.2 .1 4.3 4.3 4.5 2.8 1999 ....................................... 137.9 139.4 140.2 141.5 .9 1.1 .6 .9 2.9 3.3 2.7 3.5
Midwest5: 1975 ....................................... – – 46.7 47.7 – – – 2.1 – – – – 1976 ....................................... 48.4 49.2 50.0 51.3 1.5 1.7 1.6 2.6 – – 7.1 7.5 1977 ....................................... 51.6 52.4 53.5 54.7 .6 1.6 2.1 2.2 6.6 6.5 7.0 6.6 1978 ....................................... 55.4 56.8 57.6 58.5 1.3 2.5 1.4 1.6 7.4 8.4 7.7 6.9 1979 ....................................... 59.7 61.1 62.4 64.0 2.1 2.3 2.1 2.6 7.8 7.6 8.3 9.4 1980 ....................................... 65.5 66.9 68.2 69.6 2.3 2.1 1.9 2.1 9.7 9.5 9.3 8.8 1981 ....................................... 71.7 73.0 74.2 75.5 3.0 1.8 1.6 1.8 9.5 9.1 8.8 8.5 1982 ....................................... 76.5 77.5 78.6 79.3 1.3 1.3 1.4 .9 6.7 6.2 5.9 5.0 1983 ....................................... 80.4 81.4 82.4 83.0 1.4 1.2 1.2 .7 5.1 5.0 4.8 4.7 1984 ....................................... 84.4 84.7 86.0 86.7 1.7 .4 1.5 .8 5.0 4.1 4.4 4.5
See footnotes at end of table.
111
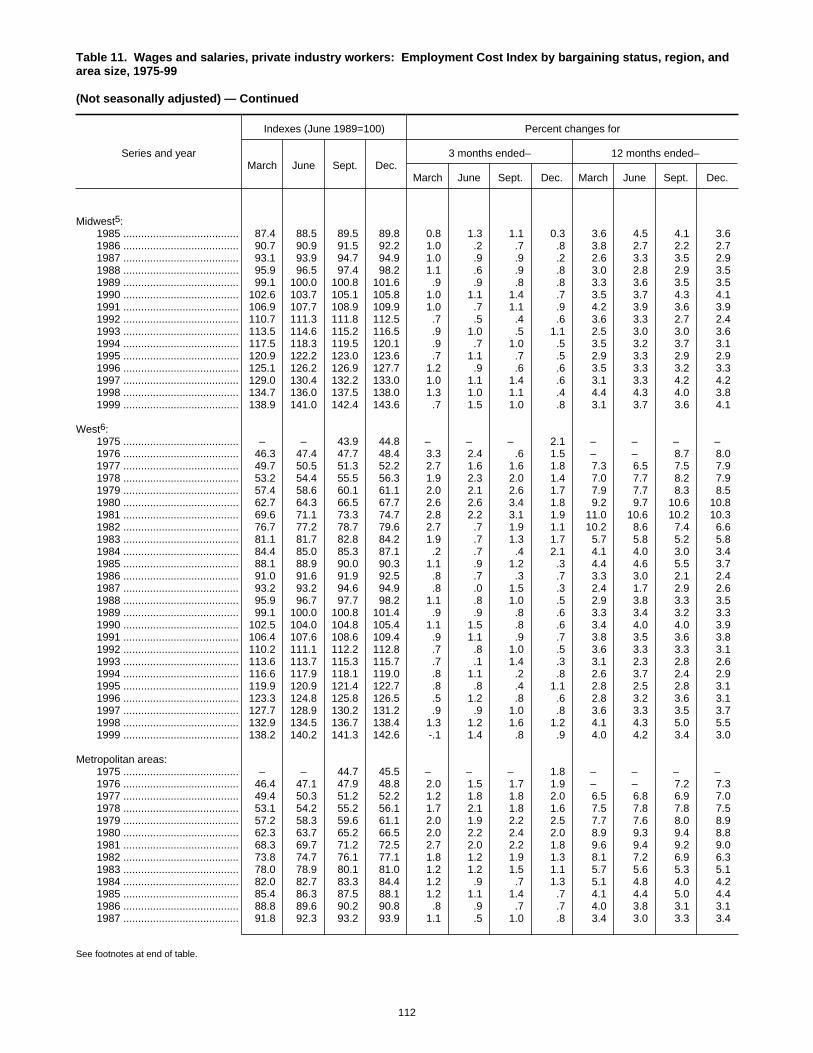
Table 11. Wages and salaries, private industry workers: Employment Cost Index by bargaining status, region, andarea size, 1975-99
(Not seasonally adjusted) — Continued
Series and year
Indexes (June 1989=100) Percent changes for
March June Sept. Dec.3 months ended– 12 months ended–
March June Sept. Dec. March June Sept. Dec.
Midwest5: 1985 ....................................... 87.4 88.5 89.5 89.8 0.8 1.3 1.1 0.3 3.6 4.5 4.1 3.6 1986 ....................................... 90.7 90.9 91.5 92.2 1.0 .2 .7 .8 3.8 2.7 2.2 2.7 1987 ....................................... 93.1 93.9 94.7 94.9 1.0 .9 .9 .2 2.6 3.3 3.5 2.9 1988 ....................................... 95.9 96.5 97.4 98.2 1.1 .6 .9 .8 3.0 2.8 2.9 3.5 1989 ....................................... 99.1 100.0 100.8 101.6 .9 .9 .8 .8 3.3 3.6 3.5 3.5 1990 ....................................... 102.6 103.7 105.1 105.8 1.0 1.1 1.4 .7 3.5 3.7 4.3 4.1 1991 ....................................... 106.9 107.7 108.9 109.9 1.0 .7 1.1 .9 4.2 3.9 3.6 3.9 1992 ....................................... 110.7 111.3 111.8 112.5 .7 .5 .4 .6 3.6 3.3 2.7 2.4 1993 ....................................... 113.5 114.6 115.2 116.5 .9 1.0 .5 1.1 2.5 3.0 3.0 3.6 1994 ....................................... 117.5 118.3 119.5 120.1 .9 .7 1.0 .5 3.5 3.2 3.7 3.1 1995 ....................................... 120.9 122.2 123.0 123.6 .7 1.1 .7 .5 2.9 3.3 2.9 2.9 1996 ....................................... 125.1 126.2 126.9 127.7 1.2 .9 .6 .6 3.5 3.3 3.2 3.3 1997 ....................................... 129.0 130.4 132.2 133.0 1.0 1.1 1.4 .6 3.1 3.3 4.2 4.2 1998 ....................................... 134.7 136.0 137.5 138.0 1.3 1.0 1.1 .4 4.4 4.3 4.0 3.8 1999 ....................................... 138.9 141.0 142.4 143.6 .7 1.5 1.0 .8 3.1 3.7 3.6 4.1
West6: 1975 ....................................... – – 43.9 44.8 – – – 2.1 – – – – 1976 ....................................... 46.3 47.4 47.7 48.4 3.3 2.4 .6 1.5 – – 8.7 8.0 1977 ....................................... 49.7 50.5 51.3 52.2 2.7 1.6 1.6 1.8 7.3 6.5 7.5 7.9 1978 ....................................... 53.2 54.4 55.5 56.3 1.9 2.3 2.0 1.4 7.0 7.7 8.2 7.9 1979 ....................................... 57.4 58.6 60.1 61.1 2.0 2.1 2.6 1.7 7.9 7.7 8.3 8.5 1980 ....................................... 62.7 64.3 66.5 67.7 2.6 2.6 3.4 1.8 9.2 9.7 10.6 10.8 1981 ....................................... 69.6 71.1 73.3 74.7 2.8 2.2 3.1 1.9 11.0 10.6 10.2 10.3 1982 ....................................... 76.7 77.2 78.7 79.6 2.7 .7 1.9 1.1 10.2 8.6 7.4 6.6 1983 ....................................... 81.1 81.7 82.8 84.2 1.9 .7 1.3 1.7 5.7 5.8 5.2 5.8 1984 ....................................... 84.4 85.0 85.3 87.1 .2 .7 .4 2.1 4.1 4.0 3.0 3.4 1985 ....................................... 88.1 88.9 90.0 90.3 1.1 .9 1.2 .3 4.4 4.6 5.5 3.7 1986 ....................................... 91.0 91.6 91.9 92.5 .8 .7 .3 .7 3.3 3.0 2.1 2.4 1987 ....................................... 93.2 93.2 94.6 94.9 .8 .0 1.5 .3 2.4 1.7 2.9 2.6 1988 ....................................... 95.9 96.7 97.7 98.2 1.1 .8 1.0 .5 2.9 3.8 3.3 3.5 1989 ....................................... 99.1 100.0 100.8 101.4 .9 .9 .8 .6 3.3 3.4 3.2 3.3 1990 ....................................... 102.5 104.0 104.8 105.4 1.1 1.5 .8 .6 3.4 4.0 4.0 3.9 1991 ....................................... 106.4 107.6 108.6 109.4 .9 1.1 .9 .7 3.8 3.5 3.6 3.8 1992 ....................................... 110.2 111.1 112.2 112.8 .7 .8 1.0 .5 3.6 3.3 3.3 3.1 1993 ....................................... 113.6 113.7 115.3 115.7 .7 .1 1.4 .3 3.1 2.3 2.8 2.6 1994 ....................................... 116.6 117.9 118.1 119.0 .8 1.1 .2 .8 2.6 3.7 2.4 2.9 1995 ....................................... 119.9 120.9 121.4 122.7 .8 .8 .4 1.1 2.8 2.5 2.8 3.1 1996 ....................................... 123.3 124.8 125.8 126.5 .5 1.2 .8 .6 2.8 3.2 3.6 3.1 1997 ....................................... 127.7 128.9 130.2 131.2 .9 .9 1.0 .8 3.6 3.3 3.5 3.7 1998 ....................................... 132.9 134.5 136.7 138.4 1.3 1.2 1.6 1.2 4.1 4.3 5.0 5.5 1999 ....................................... 138.2 140.2 141.3 142.6 -.1 1.4 .8 .9 4.0 4.2 3.4 3.0
Metropolitan areas: 1975 ....................................... – – 44.7 45.5 – – – 1.8 – – – – 1976 ....................................... 46.4 47.1 47.9 48.8 2.0 1.5 1.7 1.9 – – 7.2 7.3 1977 ....................................... 49.4 50.3 51.2 52.2 1.2 1.8 1.8 2.0 6.5 6.8 6.9 7.0 1978 ....................................... 53.1 54.2 55.2 56.1 1.7 2.1 1.8 1.6 7.5 7.8 7.8 7.5 1979 ....................................... 57.2 58.3 59.6 61.1 2.0 1.9 2.2 2.5 7.7 7.6 8.0 8.9 1980 ....................................... 62.3 63.7 65.2 66.5 2.0 2.2 2.4 2.0 8.9 9.3 9.4 8.8 1981 ....................................... 68.3 69.7 71.2 72.5 2.7 2.0 2.2 1.8 9.6 9.4 9.2 9.0 1982 ....................................... 73.8 74.7 76.1 77.1 1.8 1.2 1.9 1.3 8.1 7.2 6.9 6.3 1983 ....................................... 78.0 78.9 80.1 81.0 1.2 1.2 1.5 1.1 5.7 5.6 5.3 5.1 1984 ....................................... 82.0 82.7 83.3 84.4 1.2 .9 .7 1.3 5.1 4.8 4.0 4.2 1985 ....................................... 85.4 86.3 87.5 88.1 1.2 1.1 1.4 .7 4.1 4.4 5.0 4.4 1986 ....................................... 88.8 89.6 90.2 90.8 .8 .9 .7 .7 4.0 3.8 3.1 3.1 1987 ....................................... 91.8 92.3 93.2 93.9 1.1 .5 1.0 .8 3.4 3.0 3.3 3.4
See footnotes at end of table.
112
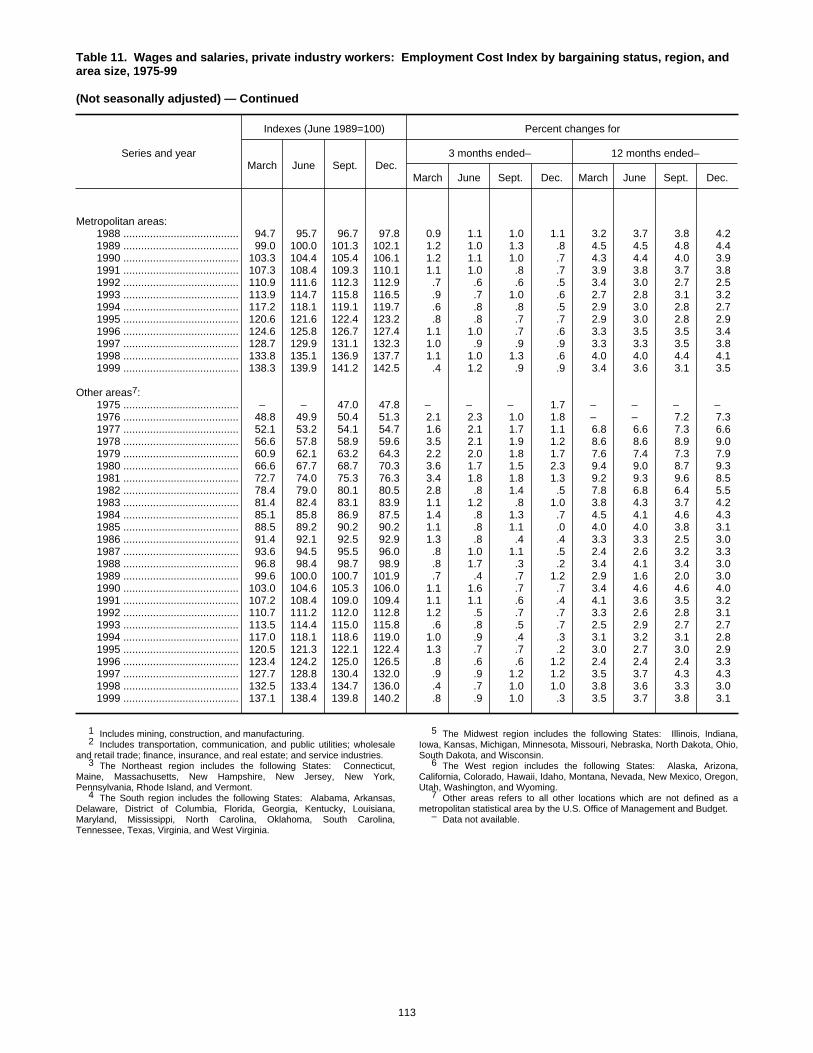
Table 11. Wages and salaries, private industry workers: Employment Cost Index by bargaining status, region, andarea size, 1975-99
(Not seasonally adjusted) — Continued
Series and year
Indexes (June 1989=100) Percent changes for
March June Sept. Dec.3 months ended– 12 months ended–
March June Sept. Dec. March June Sept. Dec.
Metropolitan areas: 1988 ....................................... 94.7 95.7 96.7 97.8 0.9 1.1 1.0 1.1 3.2 3.7 3.8 4.2 1989 ....................................... 99.0 100.0 101.3 102.1 1.2 1.0 1.3 .8 4.5 4.5 4.8 4.4 1990 ....................................... 103.3 104.4 105.4 106.1 1.2 1.1 1.0 .7 4.3 4.4 4.0 3.9 1991 ....................................... 107.3 108.4 109.3 110.1 1.1 1.0 .8 .7 3.9 3.8 3.7 3.8 1992 ....................................... 110.9 111.6 112.3 112.9 .7 .6 .6 .5 3.4 3.0 2.7 2.5 1993 ....................................... 113.9 114.7 115.8 116.5 .9 .7 1.0 .6 2.7 2.8 3.1 3.2 1994 ....................................... 117.2 118.1 119.1 119.7 .6 .8 .8 .5 2.9 3.0 2.8 2.7 1995 ....................................... 120.6 121.6 122.4 123.2 .8 .8 .7 .7 2.9 3.0 2.8 2.9 1996 ....................................... 124.6 125.8 126.7 127.4 1.1 1.0 .7 .6 3.3 3.5 3.5 3.4 1997 ....................................... 128.7 129.9 131.1 132.3 1.0 .9 .9 .9 3.3 3.3 3.5 3.8 1998 ....................................... 133.8 135.1 136.9 137.7 1.1 1.0 1.3 .6 4.0 4.0 4.4 4.1 1999 ....................................... 138.3 139.9 141.2 142.5 .4 1.2 .9 .9 3.4 3.6 3.1 3.5
Other areas7: 1975 ....................................... – – 47.0 47.8 – – – 1.7 – – – – 1976 ....................................... 48.8 49.9 50.4 51.3 2.1 2.3 1.0 1.8 – – 7.2 7.3 1977 ....................................... 52.1 53.2 54.1 54.7 1.6 2.1 1.7 1.1 6.8 6.6 7.3 6.6 1978 ....................................... 56.6 57.8 58.9 59.6 3.5 2.1 1.9 1.2 8.6 8.6 8.9 9.0 1979 ....................................... 60.9 62.1 63.2 64.3 2.2 2.0 1.8 1.7 7.6 7.4 7.3 7.9 1980 ....................................... 66.6 67.7 68.7 70.3 3.6 1.7 1.5 2.3 9.4 9.0 8.7 9.3 1981 ....................................... 72.7 74.0 75.3 76.3 3.4 1.8 1.8 1.3 9.2 9.3 9.6 8.5 1982 ....................................... 78.4 79.0 80.1 80.5 2.8 .8 1.4 .5 7.8 6.8 6.4 5.5 1983 ....................................... 81.4 82.4 83.1 83.9 1.1 1.2 .8 1.0 3.8 4.3 3.7 4.2 1984 ....................................... 85.1 85.8 86.9 87.5 1.4 .8 1.3 .7 4.5 4.1 4.6 4.3 1985 ....................................... 88.5 89.2 90.2 90.2 1.1 .8 1.1 .0 4.0 4.0 3.8 3.1 1986 ....................................... 91.4 92.1 92.5 92.9 1.3 .8 .4 .4 3.3 3.3 2.5 3.0 1987 ....................................... 93.6 94.5 95.5 96.0 .8 1.0 1.1 .5 2.4 2.6 3.2 3.3 1988 ....................................... 96.8 98.4 98.7 98.9 .8 1.7 .3 .2 3.4 4.1 3.4 3.0 1989 ....................................... 99.6 100.0 100.7 101.9 .7 .4 .7 1.2 2.9 1.6 2.0 3.0 1990 ....................................... 103.0 104.6 105.3 106.0 1.1 1.6 .7 .7 3.4 4.6 4.6 4.0 1991 ....................................... 107.2 108.4 109.0 109.4 1.1 1.1 .6 .4 4.1 3.6 3.5 3.2 1992 ....................................... 110.7 111.2 112.0 112.8 1.2 .5 .7 .7 3.3 2.6 2.8 3.1 1993 ....................................... 113.5 114.4 115.0 115.8 .6 .8 .5 .7 2.5 2.9 2.7 2.7 1994 ....................................... 117.0 118.1 118.6 119.0 1.0 .9 .4 .3 3.1 3.2 3.1 2.8 1995 ....................................... 120.5 121.3 122.1 122.4 1.3 .7 .7 .2 3.0 2.7 3.0 2.9 1996 ....................................... 123.4 124.2 125.0 126.5 .8 .6 .6 1.2 2.4 2.4 2.4 3.3 1997 ....................................... 127.7 128.8 130.4 132.0 .9 .9 1.2 1.2 3.5 3.7 4.3 4.3 1998 ....................................... 132.5 133.4 134.7 136.0 .4 .7 1.0 1.0 3.8 3.6 3.3 3.0 1999 ....................................... 137.1 138.4 139.8 140.2 .8 .9 1.0 .3 3.5 3.7 3.8 3.1
1 Includes mining, construction, and manufacturing.2 Includes transportation, communication, and public utilities; wholesale
and retail trade; finance, insurance, and real estate; and service industries.3 The Northeast region includes the following States: Connecticut,
Maine, Massachusetts, New Hampshire, New Jersey, New York,Pennsylvania, Rhode Island, and Vermont.
4 The South region includes the following States: Alabama, Arkansas,Delaware, District of Columbia, Florida, Georgia, Kentucky, Louisiana,Maryland, Mississippi, North Carolina, Oklahoma, South Carolina,Tennessee, Texas, Virginia, and West Virginia.
5 The Midwest region includes the following States: Illinois, Indiana,Iowa, Kansas, Michigan, Minnesota, Missouri, Nebraska, North Dakota, Ohio,South Dakota, and Wisconsin.
6 The West region includes the following States: Alaska, Arizona,California, Colorado, Hawaii, Idaho, Montana, Nevada, New Mexico, Oregon,Utah, Washington, and Wyoming.
7 Other areas refers to all other locations which are not defined as ametropolitan statistical area by the U.S. Office of Management and Budget.
– Data not available.
113
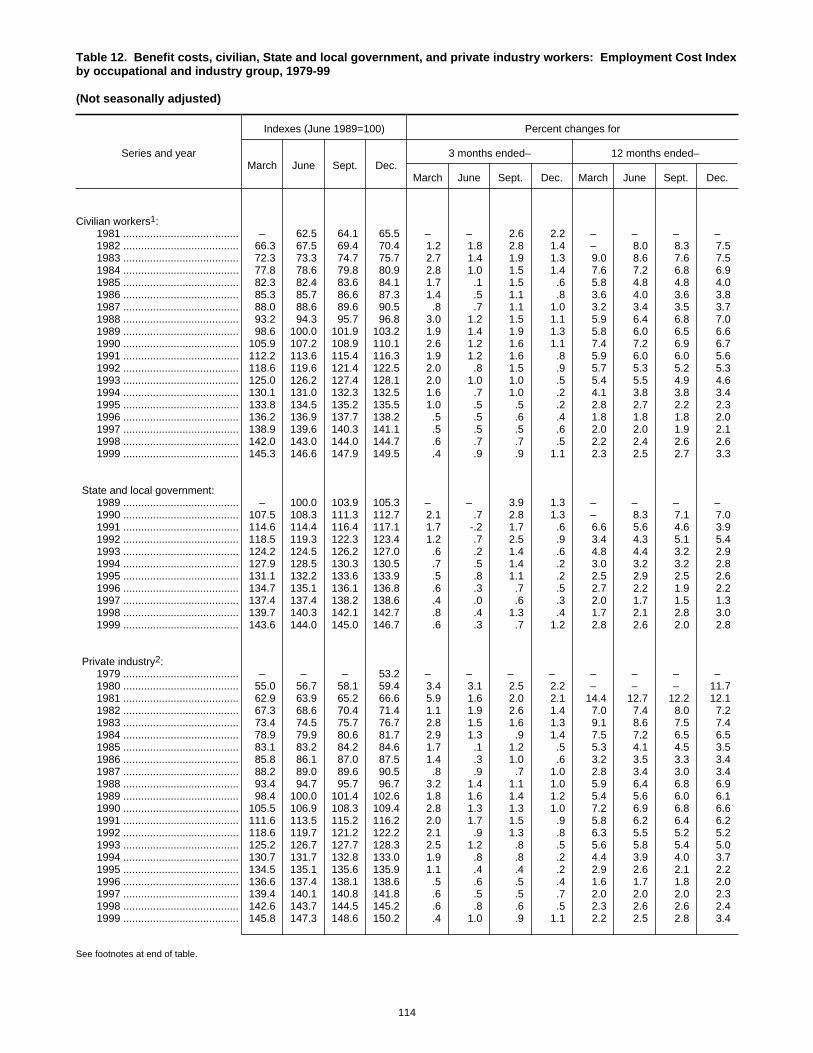
Table 12. Benefit costs, civilian, State and local government, and private industry workers: Employment Cost Indexby occupational and industry group, 1979-99
(Not seasonally adjusted)
Series and year
Indexes (June 1989=100) Percent changes for
March June Sept. Dec.3 months ended– 12 months ended–
March June Sept. Dec. March June Sept. Dec.
Civilian workers1: 1981 ....................................... – 62.5 64.1 65.5 – – 2.6 2.2 – – – – 1982 ....................................... 66.3 67.5 69.4 70.4 1.2 1.8 2.8 1.4 – 8.0 8.3 7.5 1983 ....................................... 72.3 73.3 74.7 75.7 2.7 1.4 1.9 1.3 9.0 8.6 7.6 7.5 1984 ....................................... 77.8 78.6 79.8 80.9 2.8 1.0 1.5 1.4 7.6 7.2 6.8 6.9 1985 ....................................... 82.3 82.4 83.6 84.1 1.7 .1 1.5 .6 5.8 4.8 4.8 4.0 1986 ....................................... 85.3 85.7 86.6 87.3 1.4 .5 1.1 .8 3.6 4.0 3.6 3.8 1987 ....................................... 88.0 88.6 89.6 90.5 .8 .7 1.1 1.0 3.2 3.4 3.5 3.7 1988 ....................................... 93.2 94.3 95.7 96.8 3.0 1.2 1.5 1.1 5.9 6.4 6.8 7.0 1989 ....................................... 98.6 100.0 101.9 103.2 1.9 1.4 1.9 1.3 5.8 6.0 6.5 6.6 1990 ....................................... 105.9 107.2 108.9 110.1 2.6 1.2 1.6 1.1 7.4 7.2 6.9 6.7 1991 ....................................... 112.2 113.6 115.4 116.3 1.9 1.2 1.6 .8 5.9 6.0 6.0 5.6 1992 ....................................... 118.6 119.6 121.4 122.5 2.0 .8 1.5 .9 5.7 5.3 5.2 5.3 1993 ....................................... 125.0 126.2 127.4 128.1 2.0 1.0 1.0 .5 5.4 5.5 4.9 4.6 1994 ....................................... 130.1 131.0 132.3 132.5 1.6 .7 1.0 .2 4.1 3.8 3.8 3.4 1995 ....................................... 133.8 134.5 135.2 135.5 1.0 .5 .5 .2 2.8 2.7 2.2 2.3 1996 ....................................... 136.2 136.9 137.7 138.2 .5 .5 .6 .4 1.8 1.8 1.8 2.0 1997 ....................................... 138.9 139.6 140.3 141.1 .5 .5 .5 .6 2.0 2.0 1.9 2.1 1998 ....................................... 142.0 143.0 144.0 144.7 .6 .7 .7 .5 2.2 2.4 2.6 2.6 1999 ....................................... 145.3 146.6 147.9 149.5 .4 .9 .9 1.1 2.3 2.5 2.7 3.3
State and local government: 1989 ....................................... – 100.0 103.9 105.3 – – 3.9 1.3 – – – – 1990 ....................................... 107.5 108.3 111.3 112.7 2.1 .7 2.8 1.3 – 8.3 7.1 7.0 1991 ....................................... 114.6 114.4 116.4 117.1 1.7 -.2 1.7 .6 6.6 5.6 4.6 3.9 1992 ....................................... 118.5 119.3 122.3 123.4 1.2 .7 2.5 .9 3.4 4.3 5.1 5.4 1993 ....................................... 124.2 124.5 126.2 127.0 .6 .2 1.4 .6 4.8 4.4 3.2 2.9 1994 ....................................... 127.9 128.5 130.3 130.5 .7 .5 1.4 .2 3.0 3.2 3.2 2.8 1995 ....................................... 131.1 132.2 133.6 133.9 .5 .8 1.1 .2 2.5 2.9 2.5 2.6 1996 ....................................... 134.7 135.1 136.1 136.8 .6 .3 .7 .5 2.7 2.2 1.9 2.2 1997 ....................................... 137.4 137.4 138.2 138.6 .4 .0 .6 .3 2.0 1.7 1.5 1.3 1998 ....................................... 139.7 140.3 142.1 142.7 .8 .4 1.3 .4 1.7 2.1 2.8 3.0 1999 ....................................... 143.6 144.0 145.0 146.7 .6 .3 .7 1.2 2.8 2.6 2.0 2.8
Private industry2: 1979 ....................................... – – – 53.2 – – – – – – – – 1980 ....................................... 55.0 56.7 58.1 59.4 3.4 3.1 2.5 2.2 – – – 11.7 1981 ....................................... 62.9 63.9 65.2 66.6 5.9 1.6 2.0 2.1 14.4 12.7 12.2 12.1 1982 ....................................... 67.3 68.6 70.4 71.4 1.1 1.9 2.6 1.4 7.0 7.4 8.0 7.2 1983 ....................................... 73.4 74.5 75.7 76.7 2.8 1.5 1.6 1.3 9.1 8.6 7.5 7.4 1984 ....................................... 78.9 79.9 80.6 81.7 2.9 1.3 .9 1.4 7.5 7.2 6.5 6.5 1985 ....................................... 83.1 83.2 84.2 84.6 1.7 .1 1.2 .5 5.3 4.1 4.5 3.5 1986 ....................................... 85.8 86.1 87.0 87.5 1.4 .3 1.0 .6 3.2 3.5 3.3 3.4 1987 ....................................... 88.2 89.0 89.6 90.5 .8 .9 .7 1.0 2.8 3.4 3.0 3.4 1988 ....................................... 93.4 94.7 95.7 96.7 3.2 1.4 1.1 1.0 5.9 6.4 6.8 6.9 1989 ....................................... 98.4 100.0 101.4 102.6 1.8 1.6 1.4 1.2 5.4 5.6 6.0 6.1 1990 ....................................... 105.5 106.9 108.3 109.4 2.8 1.3 1.3 1.0 7.2 6.9 6.8 6.6 1991 ....................................... 111.6 113.5 115.2 116.2 2.0 1.7 1.5 .9 5.8 6.2 6.4 6.2 1992 ....................................... 118.6 119.7 121.2 122.2 2.1 .9 1.3 .8 6.3 5.5 5.2 5.2 1993 ....................................... 125.2 126.7 127.7 128.3 2.5 1.2 .8 .5 5.6 5.8 5.4 5.0 1994 ....................................... 130.7 131.7 132.8 133.0 1.9 .8 .8 .2 4.4 3.9 4.0 3.7 1995 ....................................... 134.5 135.1 135.6 135.9 1.1 .4 .4 .2 2.9 2.6 2.1 2.2 1996 ....................................... 136.6 137.4 138.1 138.6 .5 .6 .5 .4 1.6 1.7 1.8 2.0 1997 ....................................... 139.4 140.1 140.8 141.8 .6 .5 .5 .7 2.0 2.0 2.0 2.3 1998 ....................................... 142.6 143.7 144.5 145.2 .6 .8 .6 .5 2.3 2.6 2.6 2.4 1999 ....................................... 145.8 147.3 148.6 150.2 .4 1.0 .9 1.1 2.2 2.5 2.8 3.4
See footnotes at end of table.
114
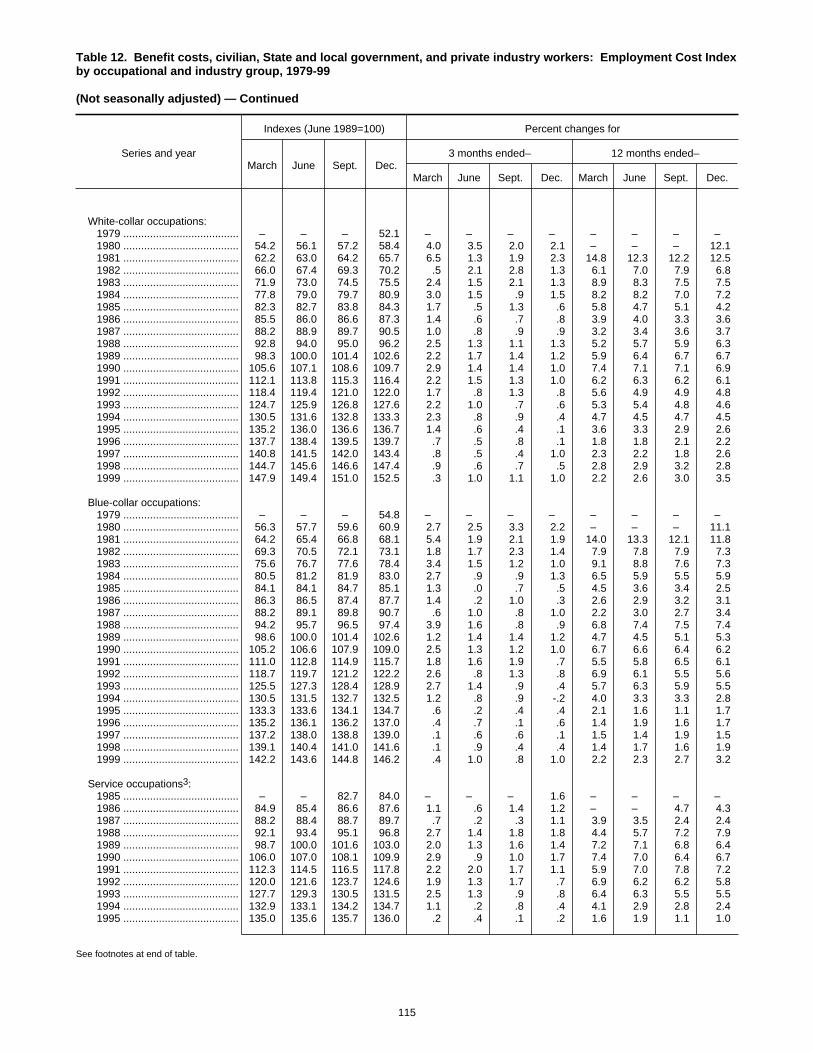
Table 12. Benefit costs, civilian, State and local government, and private industry workers: Employment Cost Indexby occupational and industry group, 1979-99
(Not seasonally adjusted) — Continued
Series and year
Indexes (June 1989=100) Percent changes for
March June Sept. Dec.3 months ended– 12 months ended–
March June Sept. Dec. March June Sept. Dec.
White-collar occupations: 1979 ....................................... – – – 52.1 – – – – – – – – 1980 ....................................... 54.2 56.1 57.2 58.4 4.0 3.5 2.0 2.1 – – – 12.1 1981 ....................................... 62.2 63.0 64.2 65.7 6.5 1.3 1.9 2.3 14.8 12.3 12.2 12.5 1982 ....................................... 66.0 67.4 69.3 70.2 .5 2.1 2.8 1.3 6.1 7.0 7.9 6.8 1983 ....................................... 71.9 73.0 74.5 75.5 2.4 1.5 2.1 1.3 8.9 8.3 7.5 7.5 1984 ....................................... 77.8 79.0 79.7 80.9 3.0 1.5 .9 1.5 8.2 8.2 7.0 7.2 1985 ....................................... 82.3 82.7 83.8 84.3 1.7 .5 1.3 .6 5.8 4.7 5.1 4.2 1986 ....................................... 85.5 86.0 86.6 87.3 1.4 .6 .7 .8 3.9 4.0 3.3 3.6 1987 ....................................... 88.2 88.9 89.7 90.5 1.0 .8 .9 .9 3.2 3.4 3.6 3.7 1988 ....................................... 92.8 94.0 95.0 96.2 2.5 1.3 1.1 1.3 5.2 5.7 5.9 6.3 1989 ....................................... 98.3 100.0 101.4 102.6 2.2 1.7 1.4 1.2 5.9 6.4 6.7 6.7 1990 ....................................... 105.6 107.1 108.6 109.7 2.9 1.4 1.4 1.0 7.4 7.1 7.1 6.9 1991 ....................................... 112.1 113.8 115.3 116.4 2.2 1.5 1.3 1.0 6.2 6.3 6.2 6.1 1992 ....................................... 118.4 119.4 121.0 122.0 1.7 .8 1.3 .8 5.6 4.9 4.9 4.8 1993 ....................................... 124.7 125.9 126.8 127.6 2.2 1.0 .7 .6 5.3 5.4 4.8 4.6 1994 ....................................... 130.5 131.6 132.8 133.3 2.3 .8 .9 .4 4.7 4.5 4.7 4.5 1995 ....................................... 135.2 136.0 136.6 136.7 1.4 .6 .4 .1 3.6 3.3 2.9 2.6 1996 ....................................... 137.7 138.4 139.5 139.7 .7 .5 .8 .1 1.8 1.8 2.1 2.2 1997 ....................................... 140.8 141.5 142.0 143.4 .8 .5 .4 1.0 2.3 2.2 1.8 2.6 1998 ....................................... 144.7 145.6 146.6 147.4 .9 .6 .7 .5 2.8 2.9 3.2 2.8 1999 ....................................... 147.9 149.4 151.0 152.5 .3 1.0 1.1 1.0 2.2 2.6 3.0 3.5
Blue-collar occupations: 1979 ....................................... – – – 54.8 – – – – – – – – 1980 ....................................... 56.3 57.7 59.6 60.9 2.7 2.5 3.3 2.2 – – – 11.1 1981 ....................................... 64.2 65.4 66.8 68.1 5.4 1.9 2.1 1.9 14.0 13.3 12.1 11.8 1982 ....................................... 69.3 70.5 72.1 73.1 1.8 1.7 2.3 1.4 7.9 7.8 7.9 7.3 1983 ....................................... 75.6 76.7 77.6 78.4 3.4 1.5 1.2 1.0 9.1 8.8 7.6 7.3 1984 ....................................... 80.5 81.2 81.9 83.0 2.7 .9 .9 1.3 6.5 5.9 5.5 5.9 1985 ....................................... 84.1 84.1 84.7 85.1 1.3 .0 .7 .5 4.5 3.6 3.4 2.5 1986 ....................................... 86.3 86.5 87.4 87.7 1.4 .2 1.0 .3 2.6 2.9 3.2 3.1 1987 ....................................... 88.2 89.1 89.8 90.7 .6 1.0 .8 1.0 2.2 3.0 2.7 3.4 1988 ....................................... 94.2 95.7 96.5 97.4 3.9 1.6 .8 .9 6.8 7.4 7.5 7.4 1989 ....................................... 98.6 100.0 101.4 102.6 1.2 1.4 1.4 1.2 4.7 4.5 5.1 5.3 1990 ....................................... 105.2 106.6 107.9 109.0 2.5 1.3 1.2 1.0 6.7 6.6 6.4 6.2 1991 ....................................... 111.0 112.8 114.9 115.7 1.8 1.6 1.9 .7 5.5 5.8 6.5 6.1 1992 ....................................... 118.7 119.7 121.2 122.2 2.6 .8 1.3 .8 6.9 6.1 5.5 5.6 1993 ....................................... 125.5 127.3 128.4 128.9 2.7 1.4 .9 .4 5.7 6.3 5.9 5.5 1994 ....................................... 130.5 131.5 132.7 132.5 1.2 .8 .9 -.2 4.0 3.3 3.3 2.8 1995 ....................................... 133.3 133.6 134.1 134.7 .6 .2 .4 .4 2.1 1.6 1.1 1.7 1996 ....................................... 135.2 136.1 136.2 137.0 .4 .7 .1 .6 1.4 1.9 1.6 1.7 1997 ....................................... 137.2 138.0 138.8 139.0 .1 .6 .6 .1 1.5 1.4 1.9 1.5 1998 ....................................... 139.1 140.4 141.0 141.6 .1 .9 .4 .4 1.4 1.7 1.6 1.9 1999 ....................................... 142.2 143.6 144.8 146.2 .4 1.0 .8 1.0 2.2 2.3 2.7 3.2
Service occupations3: 1985 ....................................... – – 82.7 84.0 – – – 1.6 – – – – 1986 ....................................... 84.9 85.4 86.6 87.6 1.1 .6 1.4 1.2 – – 4.7 4.3 1987 ....................................... 88.2 88.4 88.7 89.7 .7 .2 .3 1.1 3.9 3.5 2.4 2.4 1988 ....................................... 92.1 93.4 95.1 96.8 2.7 1.4 1.8 1.8 4.4 5.7 7.2 7.9 1989 ....................................... 98.7 100.0 101.6 103.0 2.0 1.3 1.6 1.4 7.2 7.1 6.8 6.4 1990 ....................................... 106.0 107.0 108.1 109.9 2.9 .9 1.0 1.7 7.4 7.0 6.4 6.7 1991 ....................................... 112.3 114.5 116.5 117.8 2.2 2.0 1.7 1.1 5.9 7.0 7.8 7.2 1992 ....................................... 120.0 121.6 123.7 124.6 1.9 1.3 1.7 .7 6.9 6.2 6.2 5.8 1993 ....................................... 127.7 129.3 130.5 131.5 2.5 1.3 .9 .8 6.4 6.3 5.5 5.5 1994 ....................................... 132.9 133.1 134.2 134.7 1.1 .2 .8 .4 4.1 2.9 2.8 2.4 1995 ....................................... 135.0 135.6 135.7 136.0 .2 .4 .1 .2 1.6 1.9 1.1 1.0
See footnotes at end of table.
115
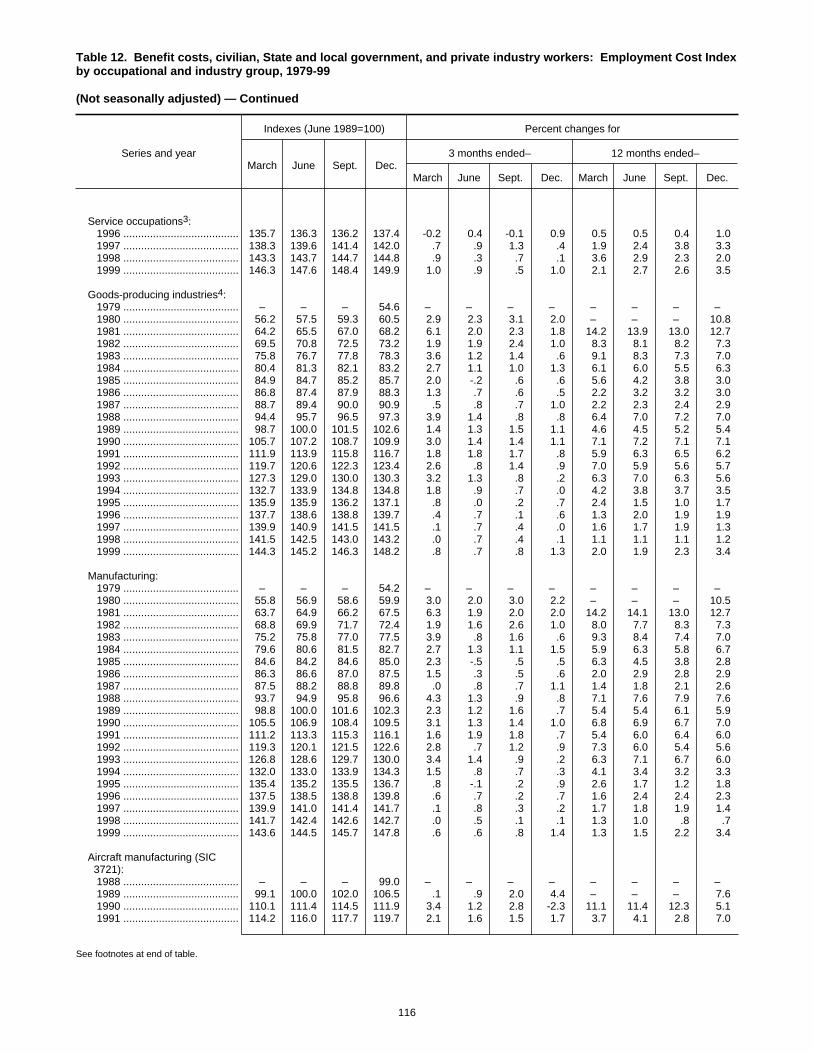
Table 12. Benefit costs, civilian, State and local government, and private industry workers: Employment Cost Indexby occupational and industry group, 1979-99
(Not seasonally adjusted) — Continued
Series and year
Indexes (June 1989=100) Percent changes for
March June Sept. Dec.3 months ended– 12 months ended–
March June Sept. Dec. March June Sept. Dec.
Service occupations3: 1996 ....................................... 135.7 136.3 136.2 137.4 -0.2 0.4 -0.1 0.9 0.5 0.5 0.4 1.0 1997 ....................................... 138.3 139.6 141.4 142.0 .7 .9 1.3 .4 1.9 2.4 3.8 3.3 1998 ....................................... 143.3 143.7 144.7 144.8 .9 .3 .7 .1 3.6 2.9 2.3 2.0 1999 ....................................... 146.3 147.6 148.4 149.9 1.0 .9 .5 1.0 2.1 2.7 2.6 3.5
Goods-producing industries4: 1979 ....................................... – – – 54.6 – – – – – – – – 1980 ....................................... 56.2 57.5 59.3 60.5 2.9 2.3 3.1 2.0 – – – 10.8 1981 ....................................... 64.2 65.5 67.0 68.2 6.1 2.0 2.3 1.8 14.2 13.9 13.0 12.7 1982 ....................................... 69.5 70.8 72.5 73.2 1.9 1.9 2.4 1.0 8.3 8.1 8.2 7.3 1983 ....................................... 75.8 76.7 77.8 78.3 3.6 1.2 1.4 .6 9.1 8.3 7.3 7.0 1984 ....................................... 80.4 81.3 82.1 83.2 2.7 1.1 1.0 1.3 6.1 6.0 5.5 6.3 1985 ....................................... 84.9 84.7 85.2 85.7 2.0 -.2 .6 .6 5.6 4.2 3.8 3.0 1986 ....................................... 86.8 87.4 87.9 88.3 1.3 .7 .6 .5 2.2 3.2 3.2 3.0 1987 ....................................... 88.7 89.4 90.0 90.9 .5 .8 .7 1.0 2.2 2.3 2.4 2.9 1988 ....................................... 94.4 95.7 96.5 97.3 3.9 1.4 .8 .8 6.4 7.0 7.2 7.0 1989 ....................................... 98.7 100.0 101.5 102.6 1.4 1.3 1.5 1.1 4.6 4.5 5.2 5.4 1990 ....................................... 105.7 107.2 108.7 109.9 3.0 1.4 1.4 1.1 7.1 7.2 7.1 7.1 1991 ....................................... 111.9 113.9 115.8 116.7 1.8 1.8 1.7 .8 5.9 6.3 6.5 6.2 1992 ....................................... 119.7 120.6 122.3 123.4 2.6 .8 1.4 .9 7.0 5.9 5.6 5.7 1993 ....................................... 127.3 129.0 130.0 130.3 3.2 1.3 .8 .2 6.3 7.0 6.3 5.6 1994 ....................................... 132.7 133.9 134.8 134.8 1.8 .9 .7 .0 4.2 3.8 3.7 3.5 1995 ....................................... 135.9 135.9 136.2 137.1 .8 .0 .2 .7 2.4 1.5 1.0 1.7 1996 ....................................... 137.7 138.6 138.8 139.7 .4 .7 .1 .6 1.3 2.0 1.9 1.9 1997 ....................................... 139.9 140.9 141.5 141.5 .1 .7 .4 .0 1.6 1.7 1.9 1.3 1998 ....................................... 141.5 142.5 143.0 143.2 .0 .7 .4 .1 1.1 1.1 1.1 1.2 1999 ....................................... 144.3 145.2 146.3 148.2 .8 .7 .8 1.3 2.0 1.9 2.3 3.4
Manufacturing: 1979 ....................................... – – – 54.2 – – – – – – – – 1980 ....................................... 55.8 56.9 58.6 59.9 3.0 2.0 3.0 2.2 – – – 10.5 1981 ....................................... 63.7 64.9 66.2 67.5 6.3 1.9 2.0 2.0 14.2 14.1 13.0 12.7 1982 ....................................... 68.8 69.9 71.7 72.4 1.9 1.6 2.6 1.0 8.0 7.7 8.3 7.3 1983 ....................................... 75.2 75.8 77.0 77.5 3.9 .8 1.6 .6 9.3 8.4 7.4 7.0 1984 ....................................... 79.6 80.6 81.5 82.7 2.7 1.3 1.1 1.5 5.9 6.3 5.8 6.7 1985 ....................................... 84.6 84.2 84.6 85.0 2.3 -.5 .5 .5 6.3 4.5 3.8 2.8 1986 ....................................... 86.3 86.6 87.0 87.5 1.5 .3 .5 .6 2.0 2.9 2.8 2.9 1987 ....................................... 87.5 88.2 88.8 89.8 .0 .8 .7 1.1 1.4 1.8 2.1 2.6 1988 ....................................... 93.7 94.9 95.8 96.6 4.3 1.3 .9 .8 7.1 7.6 7.9 7.6 1989 ....................................... 98.8 100.0 101.6 102.3 2.3 1.2 1.6 .7 5.4 5.4 6.1 5.9 1990 ....................................... 105.5 106.9 108.4 109.5 3.1 1.3 1.4 1.0 6.8 6.9 6.7 7.0 1991 ....................................... 111.2 113.3 115.3 116.1 1.6 1.9 1.8 .7 5.4 6.0 6.4 6.0 1992 ....................................... 119.3 120.1 121.5 122.6 2.8 .7 1.2 .9 7.3 6.0 5.4 5.6 1993 ....................................... 126.8 128.6 129.7 130.0 3.4 1.4 .9 .2 6.3 7.1 6.7 6.0 1994 ....................................... 132.0 133.0 133.9 134.3 1.5 .8 .7 .3 4.1 3.4 3.2 3.3 1995 ....................................... 135.4 135.2 135.5 136.7 .8 -.1 .2 .9 2.6 1.7 1.2 1.8 1996 ....................................... 137.5 138.5 138.8 139.8 .6 .7 .2 .7 1.6 2.4 2.4 2.3 1997 ....................................... 139.9 141.0 141.4 141.7 .1 .8 .3 .2 1.7 1.8 1.9 1.4 1998 ....................................... 141.7 142.4 142.6 142.7 .0 .5 .1 .1 1.3 1.0 .8 .7 1999 ....................................... 143.6 144.5 145.7 147.8 .6 .6 .8 1.4 1.3 1.5 2.2 3.4
Aircraft manufacturing (SIC3721):
1988 ....................................... – – – 99.0 – – – – – – – – 1989 ....................................... 99.1 100.0 102.0 106.5 .1 .9 2.0 4.4 – – – 7.6 1990 ....................................... 110.1 111.4 114.5 111.9 3.4 1.2 2.8 -2.3 11.1 11.4 12.3 5.1 1991 ....................................... 114.2 116.0 117.7 119.7 2.1 1.6 1.5 1.7 3.7 4.1 2.8 7.0
See footnotes at end of table.
116
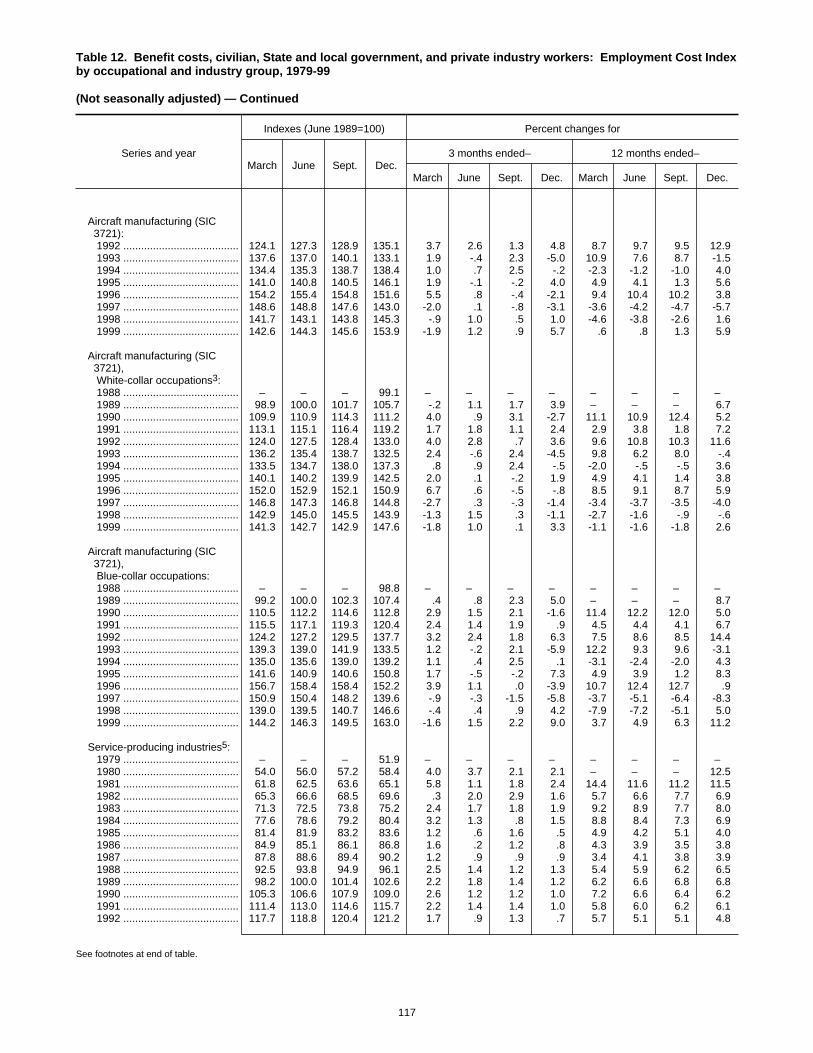
Table 12. Benefit costs, civilian, State and local government, and private industry workers: Employment Cost Indexby occupational and industry group, 1979-99
(Not seasonally adjusted) — Continued
Series and year
Indexes (June 1989=100) Percent changes for
March June Sept. Dec.3 months ended– 12 months ended–
March June Sept. Dec. March June Sept. Dec.
Aircraft manufacturing (SIC3721):
1992 ....................................... 124.1 127.3 128.9 135.1 3.7 2.6 1.3 4.8 8.7 9.7 9.5 12.9 1993 ....................................... 137.6 137.0 140.1 133.1 1.9 -.4 2.3 -5.0 10.9 7.6 8.7 -1.5 1994 ....................................... 134.4 135.3 138.7 138.4 1.0 .7 2.5 -.2 -2.3 -1.2 -1.0 4.0 1995 ....................................... 141.0 140.8 140.5 146.1 1.9 -.1 -.2 4.0 4.9 4.1 1.3 5.6 1996 ....................................... 154.2 155.4 154.8 151.6 5.5 .8 -.4 -2.1 9.4 10.4 10.2 3.8 1997 ....................................... 148.6 148.8 147.6 143.0 -2.0 .1 -.8 -3.1 -3.6 -4.2 -4.7 -5.7 1998 ....................................... 141.7 143.1 143.8 145.3 -.9 1.0 .5 1.0 -4.6 -3.8 -2.6 1.6 1999 ....................................... 142.6 144.3 145.6 153.9 -1.9 1.2 .9 5.7 .6 .8 1.3 5.9
Aircraft manufacturing (SIC3721), White-collar occupations3:
1988 ....................................... – – – 99.1 – – – – – – – – 1989 ....................................... 98.9 100.0 101.7 105.7 -.2 1.1 1.7 3.9 – – – 6.7 1990 ....................................... 109.9 110.9 114.3 111.2 4.0 .9 3.1 -2.7 11.1 10.9 12.4 5.2 1991 ....................................... 113.1 115.1 116.4 119.2 1.7 1.8 1.1 2.4 2.9 3.8 1.8 7.2 1992 ....................................... 124.0 127.5 128.4 133.0 4.0 2.8 .7 3.6 9.6 10.8 10.3 11.6 1993 ....................................... 136.2 135.4 138.7 132.5 2.4 -.6 2.4 -4.5 9.8 6.2 8.0 -.4 1994 ....................................... 133.5 134.7 138.0 137.3 .8 .9 2.4 -.5 -2.0 -.5 -.5 3.6 1995 ....................................... 140.1 140.2 139.9 142.5 2.0 .1 -.2 1.9 4.9 4.1 1.4 3.8 1996 ....................................... 152.0 152.9 152.1 150.9 6.7 .6 -.5 -.8 8.5 9.1 8.7 5.9 1997 ....................................... 146.8 147.3 146.8 144.8 -2.7 .3 -.3 -1.4 -3.4 -3.7 -3.5 -4.0 1998 ....................................... 142.9 145.0 145.5 143.9 -1.3 1.5 .3 -1.1 -2.7 -1.6 -.9 -.6 1999 ....................................... 141.3 142.7 142.9 147.6 -1.8 1.0 .1 3.3 -1.1 -1.6 -1.8 2.6
Aircraft manufacturing (SIC3721), Blue-collar occupations:
1988 ....................................... – – – 98.8 – – – – – – – – 1989 ....................................... 99.2 100.0 102.3 107.4 .4 .8 2.3 5.0 – – – 8.7 1990 ....................................... 110.5 112.2 114.6 112.8 2.9 1.5 2.1 -1.6 11.4 12.2 12.0 5.0 1991 ....................................... 115.5 117.1 119.3 120.4 2.4 1.4 1.9 .9 4.5 4.4 4.1 6.7 1992 ....................................... 124.2 127.2 129.5 137.7 3.2 2.4 1.8 6.3 7.5 8.6 8.5 14.4 1993 ....................................... 139.3 139.0 141.9 133.5 1.2 -.2 2.1 -5.9 12.2 9.3 9.6 -3.1 1994 ....................................... 135.0 135.6 139.0 139.2 1.1 .4 2.5 .1 -3.1 -2.4 -2.0 4.3 1995 ....................................... 141.6 140.9 140.6 150.8 1.7 -.5 -.2 7.3 4.9 3.9 1.2 8.3 1996 ....................................... 156.7 158.4 158.4 152.2 3.9 1.1 .0 -3.9 10.7 12.4 12.7 .9 1997 ....................................... 150.9 150.4 148.2 139.6 -.9 -.3 -1.5 -5.8 -3.7 -5.1 -6.4 -8.3 1998 ....................................... 139.0 139.5 140.7 146.6 -.4 .4 .9 4.2 -7.9 -7.2 -5.1 5.0 1999 ....................................... 144.2 146.3 149.5 163.0 -1.6 1.5 2.2 9.0 3.7 4.9 6.3 11.2
Service-producing industries5: 1979 ....................................... – – – 51.9 – – – – – – – – 1980 ....................................... 54.0 56.0 57.2 58.4 4.0 3.7 2.1 2.1 – – – 12.5 1981 ....................................... 61.8 62.5 63.6 65.1 5.8 1.1 1.8 2.4 14.4 11.6 11.2 11.5 1982 ....................................... 65.3 66.6 68.5 69.6 .3 2.0 2.9 1.6 5.7 6.6 7.7 6.9 1983 ....................................... 71.3 72.5 73.8 75.2 2.4 1.7 1.8 1.9 9.2 8.9 7.7 8.0 1984 ....................................... 77.6 78.6 79.2 80.4 3.2 1.3 .8 1.5 8.8 8.4 7.3 6.9 1985 ....................................... 81.4 81.9 83.2 83.6 1.2 .6 1.6 .5 4.9 4.2 5.1 4.0 1986 ....................................... 84.9 85.1 86.1 86.8 1.6 .2 1.2 .8 4.3 3.9 3.5 3.8 1987 ....................................... 87.8 88.6 89.4 90.2 1.2 .9 .9 .9 3.4 4.1 3.8 3.9 1988 ....................................... 92.5 93.8 94.9 96.1 2.5 1.4 1.2 1.3 5.4 5.9 6.2 6.5 1989 ....................................... 98.2 100.0 101.4 102.6 2.2 1.8 1.4 1.2 6.2 6.6 6.8 6.8 1990 ....................................... 105.3 106.6 107.9 109.0 2.6 1.2 1.2 1.0 7.2 6.6 6.4 6.2 1991 ....................................... 111.4 113.0 114.6 115.7 2.2 1.4 1.4 1.0 5.8 6.0 6.2 6.1 1992 ....................................... 117.7 118.8 120.4 121.2 1.7 .9 1.3 .7 5.7 5.1 5.1 4.8
See footnotes at end of table.
117
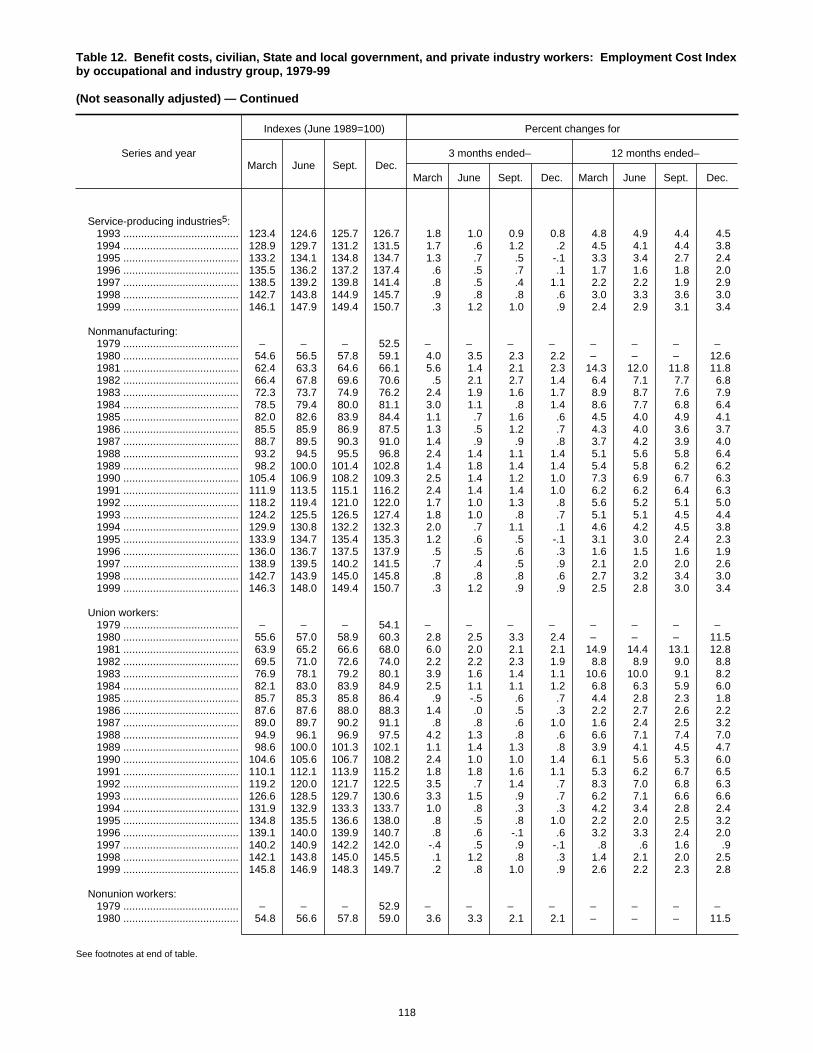
Table 12. Benefit costs, civilian, State and local government, and private industry workers: Employment Cost Indexby occupational and industry group, 1979-99
(Not seasonally adjusted) — Continued
Series and year
Indexes (June 1989=100) Percent changes for
March June Sept. Dec.3 months ended– 12 months ended–
March June Sept. Dec. March June Sept. Dec.
Service-producing industries5: 1993 ....................................... 123.4 124.6 125.7 126.7 1.8 1.0 0.9 0.8 4.8 4.9 4.4 4.5 1994 ....................................... 128.9 129.7 131.2 131.5 1.7 .6 1.2 .2 4.5 4.1 4.4 3.8 1995 ....................................... 133.2 134.1 134.8 134.7 1.3 .7 .5 -.1 3.3 3.4 2.7 2.4 1996 ....................................... 135.5 136.2 137.2 137.4 .6 .5 .7 .1 1.7 1.6 1.8 2.0 1997 ....................................... 138.5 139.2 139.8 141.4 .8 .5 .4 1.1 2.2 2.2 1.9 2.9 1998 ....................................... 142.7 143.8 144.9 145.7 .9 .8 .8 .6 3.0 3.3 3.6 3.0 1999 ....................................... 146.1 147.9 149.4 150.7 .3 1.2 1.0 .9 2.4 2.9 3.1 3.4
Nonmanufacturing: 1979 ....................................... – – – 52.5 – – – – – – – – 1980 ....................................... 54.6 56.5 57.8 59.1 4.0 3.5 2.3 2.2 – – – 12.6 1981 ....................................... 62.4 63.3 64.6 66.1 5.6 1.4 2.1 2.3 14.3 12.0 11.8 11.8 1982 ....................................... 66.4 67.8 69.6 70.6 .5 2.1 2.7 1.4 6.4 7.1 7.7 6.8 1983 ....................................... 72.3 73.7 74.9 76.2 2.4 1.9 1.6 1.7 8.9 8.7 7.6 7.9 1984 ....................................... 78.5 79.4 80.0 81.1 3.0 1.1 .8 1.4 8.6 7.7 6.8 6.4 1985 ....................................... 82.0 82.6 83.9 84.4 1.1 .7 1.6 .6 4.5 4.0 4.9 4.1 1986 ....................................... 85.5 85.9 86.9 87.5 1.3 .5 1.2 .7 4.3 4.0 3.6 3.7 1987 ....................................... 88.7 89.5 90.3 91.0 1.4 .9 .9 .8 3.7 4.2 3.9 4.0 1988 ....................................... 93.2 94.5 95.5 96.8 2.4 1.4 1.1 1.4 5.1 5.6 5.8 6.4 1989 ....................................... 98.2 100.0 101.4 102.8 1.4 1.8 1.4 1.4 5.4 5.8 6.2 6.2 1990 ....................................... 105.4 106.9 108.2 109.3 2.5 1.4 1.2 1.0 7.3 6.9 6.7 6.3 1991 ....................................... 111.9 113.5 115.1 116.2 2.4 1.4 1.4 1.0 6.2 6.2 6.4 6.3 1992 ....................................... 118.2 119.4 121.0 122.0 1.7 1.0 1.3 .8 5.6 5.2 5.1 5.0 1993 ....................................... 124.2 125.5 126.5 127.4 1.8 1.0 .8 .7 5.1 5.1 4.5 4.4 1994 ....................................... 129.9 130.8 132.2 132.3 2.0 .7 1.1 .1 4.6 4.2 4.5 3.8 1995 ....................................... 133.9 134.7 135.4 135.3 1.2 .6 .5 -.1 3.1 3.0 2.4 2.3 1996 ....................................... 136.0 136.7 137.5 137.9 .5 .5 .6 .3 1.6 1.5 1.6 1.9 1997 ....................................... 138.9 139.5 140.2 141.5 .7 .4 .5 .9 2.1 2.0 2.0 2.6 1998 ....................................... 142.7 143.9 145.0 145.8 .8 .8 .8 .6 2.7 3.2 3.4 3.0 1999 ....................................... 146.3 148.0 149.4 150.7 .3 1.2 .9 .9 2.5 2.8 3.0 3.4
Union workers: 1979 ....................................... – – – 54.1 – – – – – – – – 1980 ....................................... 55.6 57.0 58.9 60.3 2.8 2.5 3.3 2.4 – – – 11.5 1981 ....................................... 63.9 65.2 66.6 68.0 6.0 2.0 2.1 2.1 14.9 14.4 13.1 12.8 1982 ....................................... 69.5 71.0 72.6 74.0 2.2 2.2 2.3 1.9 8.8 8.9 9.0 8.8 1983 ....................................... 76.9 78.1 79.2 80.1 3.9 1.6 1.4 1.1 10.6 10.0 9.1 8.2 1984 ....................................... 82.1 83.0 83.9 84.9 2.5 1.1 1.1 1.2 6.8 6.3 5.9 6.0 1985 ....................................... 85.7 85.3 85.8 86.4 .9 -.5 .6 .7 4.4 2.8 2.3 1.8 1986 ....................................... 87.6 87.6 88.0 88.3 1.4 .0 .5 .3 2.2 2.7 2.6 2.2 1987 ....................................... 89.0 89.7 90.2 91.1 .8 .8 .6 1.0 1.6 2.4 2.5 3.2 1988 ....................................... 94.9 96.1 96.9 97.5 4.2 1.3 .8 .6 6.6 7.1 7.4 7.0 1989 ....................................... 98.6 100.0 101.3 102.1 1.1 1.4 1.3 .8 3.9 4.1 4.5 4.7 1990 ....................................... 104.6 105.6 106.7 108.2 2.4 1.0 1.0 1.4 6.1 5.6 5.3 6.0 1991 ....................................... 110.1 112.1 113.9 115.2 1.8 1.8 1.6 1.1 5.3 6.2 6.7 6.5 1992 ....................................... 119.2 120.0 121.7 122.5 3.5 .7 1.4 .7 8.3 7.0 6.8 6.3 1993 ....................................... 126.6 128.5 129.7 130.6 3.3 1.5 .9 .7 6.2 7.1 6.6 6.6 1994 ....................................... 131.9 132.9 133.3 133.7 1.0 .8 .3 .3 4.2 3.4 2.8 2.4 1995 ....................................... 134.8 135.5 136.6 138.0 .8 .5 .8 1.0 2.2 2.0 2.5 3.2 1996 ....................................... 139.1 140.0 139.9 140.7 .8 .6 -.1 .6 3.2 3.3 2.4 2.0 1997 ....................................... 140.2 140.9 142.2 142.0 -.4 .5 .9 -.1 .8 .6 1.6 .9 1998 ....................................... 142.1 143.8 145.0 145.5 .1 1.2 .8 .3 1.4 2.1 2.0 2.5 1999 ....................................... 145.8 146.9 148.3 149.7 .2 .8 1.0 .9 2.6 2.2 2.3 2.8
Nonunion workers: 1979 ....................................... – – – 52.9 – – – – – – – – 1980 ....................................... 54.8 56.6 57.8 59.0 3.6 3.3 2.1 2.1 – – – 11.5
See footnotes at end of table.
118
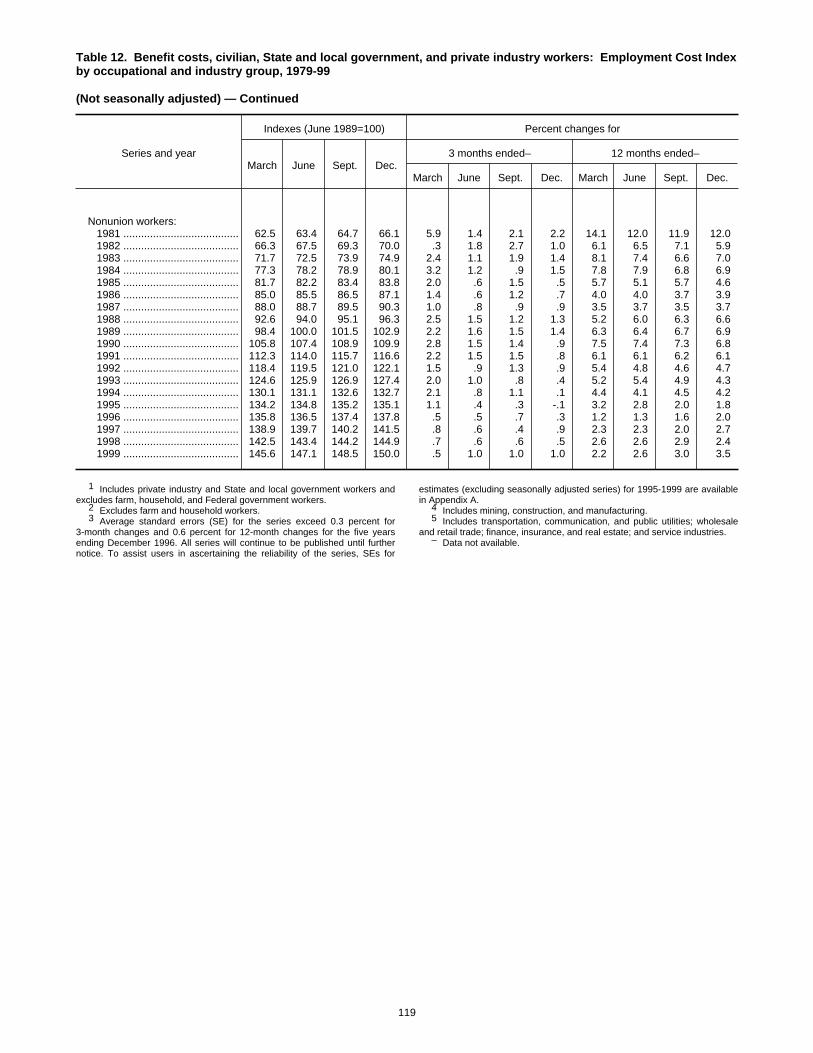
Table 12. Benefit costs, civilian, State and local government, and private industry workers: Employment Cost Indexby occupational and industry group, 1979-99
(Not seasonally adjusted) — Continued
Series and year
Indexes (June 1989=100) Percent changes for
March June Sept. Dec.3 months ended– 12 months ended–
March June Sept. Dec. March June Sept. Dec.
Nonunion workers: 1981 ....................................... 62.5 63.4 64.7 66.1 5.9 1.4 2.1 2.2 14.1 12.0 11.9 12.0 1982 ....................................... 66.3 67.5 69.3 70.0 .3 1.8 2.7 1.0 6.1 6.5 7.1 5.9 1983 ....................................... 71.7 72.5 73.9 74.9 2.4 1.1 1.9 1.4 8.1 7.4 6.6 7.0 1984 ....................................... 77.3 78.2 78.9 80.1 3.2 1.2 .9 1.5 7.8 7.9 6.8 6.9 1985 ....................................... 81.7 82.2 83.4 83.8 2.0 .6 1.5 .5 5.7 5.1 5.7 4.6 1986 ....................................... 85.0 85.5 86.5 87.1 1.4 .6 1.2 .7 4.0 4.0 3.7 3.9 1987 ....................................... 88.0 88.7 89.5 90.3 1.0 .8 .9 .9 3.5 3.7 3.5 3.7 1988 ....................................... 92.6 94.0 95.1 96.3 2.5 1.5 1.2 1.3 5.2 6.0 6.3 6.6 1989 ....................................... 98.4 100.0 101.5 102.9 2.2 1.6 1.5 1.4 6.3 6.4 6.7 6.9 1990 ....................................... 105.8 107.4 108.9 109.9 2.8 1.5 1.4 .9 7.5 7.4 7.3 6.8 1991 ....................................... 112.3 114.0 115.7 116.6 2.2 1.5 1.5 .8 6.1 6.1 6.2 6.1 1992 ....................................... 118.4 119.5 121.0 122.1 1.5 .9 1.3 .9 5.4 4.8 4.6 4.7 1993 ....................................... 124.6 125.9 126.9 127.4 2.0 1.0 .8 .4 5.2 5.4 4.9 4.3 1994 ....................................... 130.1 131.1 132.6 132.7 2.1 .8 1.1 .1 4.4 4.1 4.5 4.2 1995 ....................................... 134.2 134.8 135.2 135.1 1.1 .4 .3 -.1 3.2 2.8 2.0 1.8 1996 ....................................... 135.8 136.5 137.4 137.8 .5 .5 .7 .3 1.2 1.3 1.6 2.0 1997 ....................................... 138.9 139.7 140.2 141.5 .8 .6 .4 .9 2.3 2.3 2.0 2.7 1998 ....................................... 142.5 143.4 144.2 144.9 .7 .6 .6 .5 2.6 2.6 2.9 2.4 1999 ....................................... 145.6 147.1 148.5 150.0 .5 1.0 1.0 1.0 2.2 2.6 3.0 3.5
1 Includes private industry and State and local government workers andexcludes farm, household, and Federal government workers.
2 Excludes farm and household workers.3 Average standard errors (SE) for the series exceed 0.3 percent for
3-month changes and 0.6 percent for 12-month changes for the five yearsending December 1996. All series will continue to be published until furthernotice. To assist users in ascertaining the reliability of the series, SEs for
estimates (excluding seasonally adjusted series) for 1995-1999 are availablein Appendix A.
4 Includes mining, construction, and manufacturing.5 Includes transportation, communication, and public utilities; wholesale
and retail trade; finance, insurance, and real estate; and service industries.– Data not available.
119

120
The Employment Cost Index (ECI) is based on compen-sation cost data obtained from a survey of establish-
ments. The survey covers all occupations within the pri-vate economy (excluding farms, households, and the self-employed) and the public sector (excluding the FederalGovernment). In the December 1999 quarter, the ECIsample included about 27,100 occupations within 6,300sample establishments in the private sector and about 4,000occupations within nearly 800 establishments in State andlocal governments.
Sample designThe Bureau of Labor Statistics is in the process of integrat-ing three compensation surveys into a single survey with acommon sample design and sample of establishments, theNational Compensation Survey (NCS). During the firstphase of this effort, NCS has focused on measures of occu-pational earnings. It has replaced the Occupational Com-pensation Survey Program (OCSP) with a revised data col-lection procedure geared toward broader coverage ofoccupations in the overall economy. During the next stage,three other surveys are being incorporated into NCS: TheEmployee Benefits Survey (EBS), the Employment CostIndex (ECI), and the Employer Costs for Employee Com-pensation series, a measure of labor cost levels developedusing ECI data.
As a first step towards integrating ECI into NCS, theECI sample replacement groups initiated in 1997 weredrawn from NCS area-based, cross-industry samples. Sub-sequent ECI replacement groups are being drawn from theNCS sample. The NCS-ECI private industry sample willbe completely integrated in 2001.
The NCS area-based sample of establishments is selectedin two stages. In the first stage, sample areas are selectedby first dividing the entire area of the United States intoprimary sampling units (PSUs). In most States, a PSU con-sists of a county or a number of contiguous counties. Thereare 33 areas that are selected with certainty; others are se-lected with probability proportional to their employment.
At the second stage, BLS statisticians select a sample ofbusiness establishments and State and local government op-erations within each selected area. The individual business
establishment and government operations to be studied areselected using a probability-proportionate-to-size techniquewithin each industry sampled. That is, larger establishments,in terms of total employment, have a greater chance of se-lection than do smaller establishments.
The NCS sample will be split into five equal replace-ment groups. Each group will be nationally representativeand will be replaced every 5 years.1
Establishments are classified by industry as defined bythe Standard Industrial Classification Manual (SIC) pre-pared by the U.S. Office of Management and Budget. In1996, some establishments in Motor freight transportationand warehousing (SIC 42), Transportation by air (SIC 45),and Transportation services (SIC 47) were reclassified intoAir courier services (SIC 4513), which includes supportestablishments. While the establishments in question wereengaged in the delivery of letters, parcels, and packages,they were operated by enterprises engaged in furnishing airdelivery of individually addressed letters, parcels, and pack-ages. The ECI sample introduced these reclassifications withthe June 1998 reference period.
How are occupations selected? After the sample of estab-lishments is drawn, occupations are selected in each sampledestablishment using a probability-proportional-to-employ-ment size sampling technique. That is, a fixed number ofoccupations are selected in each establishment, giving oc-cupations with greater employment a greater chance of se-lection. The number of occupations selected depends on thetotal employment of the establishment.
Probability selection of occupations is designed to ob-tain a statistically representative sample of occupations forboth a survey area and nationwide. Occupational samplingis done by a BLS representative during a personal visit inwhich initial wage and benefit information is collected.Occupations are defined narrowly to ensure that homoge-neous groups of employees are studied.
Each narrowly defined occupation selected is classi-fied into one of the following 10 major occupational groups:
Appendix A. Description of theSurvey, Estimation Methods,and Measures of DataReliability
1 There is one exception to this rule. Large establishments—those desig-nated as certainty units—will remain in the sample longer than 5 years.
121
Professional specialty occupations; technical occupations;executive, administrative, and managerial occupations; salesoccupations; administrative support, including clerical oc-cupations; precision production, craft, and repair occupa-tions; machine operators, assemblers, and inspectors; trans-portation and material moving occupations; handlers,equipment cleaners, helpers, and laborers; and service oc-cupations.
The ECI survey occupational classification system wasoriginally based on the classification system used in the1970 Census of Population. Beginning in June 1986, theoccupations were redefined according to the classificationsystem used in the 1980 census, which is based on the Stan-dard Occupational Classification (SOC) system.2
Collection methodsBLS field economists initiate data collection during a visitto the sample reporting unit. The wage and benefit infor-
mation is summarized in a report that is sent to the respon-dent each quarter to review. The respondent reports anychanges resulting from the review to BLS, usually by mailor telephone. Data are collected for the pay period includ-ing the 12th day of the survey months—March, June, Sep-tember, and December.
Collecting wage and salary data. During the initial visitand in each subsequent quarterly update for which an es-tablishment is in the ECI sample, BLS field economistscollect the average hourly straight-time wage rate of eachof the sampled occupations.
Collecting benefit cost data. Benefit costs are measured asa cost at a particular point in time rather than in the form ofa past expenditure.3 That is, annual costs are calculatedbased on the current price of benefits and current plan pro-visions. The annual cost is then divided by the annual hoursworked to yield the cost per hour worked for each benefit.
The information needed to calculate benefit costs de-pends on the specific benefit plan. However, the followingexamples illustrate, for some basic plans, the information
Definition of Compensation Components
Wages and salaries—the straight-time hourly wage rate or, for workers not paid on an hourlybasis, straight-time earnings divided by corresponding hours. Straight-time wage and salaryrates are based on total earnings before payroll deductions, excluding premium pay for over-time and for work on weekends and holidays, shift differentials, and nonproduction bonusessuch as lump-sum payments provided in lieu of wage increases. Production bonuses, incen-tive earnings, commission payments, and cost-of-living adjustments are included in straight-time wage and salary rates.
Benefits covered by the survey are:
Paid leave—vacations, holidays, sick leave, and other paid leave.
Supplemental pay—premium pay for overtime and for work on weekends and holidays, shiftdifferentials, and nonproduction bonuses, such as lump-sum payments provided in lieu ofwage increases.
Insurance benefits—health, life, and short- and long-term disability insurance.
Retirement and savings benefits—defined benefit and defined contribution plans.
Legally required benefits—Social Security (OASDI and medicare), Federal and State unem-ployment insurance, and workers’ compensation.
Other benefits—severance pay and supplemental unemployment plans.
2 For a discussion of the change in the classification system and the effectof the change on ECI estimates, see Albert E. Schwenk, “Introducing newweights for the Employment Cost Index,” Monthly Labor Review, June 1985,pp. 22-27. When 1990 weights were introduced in March 1995, there wereessentially no changes in the occupational classification system. See AlbertE. Schwenk, “Introducing 1990 Weights for the Employment Cost Index,”Compensation and Working Conditions, June 1995, reprinted in appendixC of this bulletin.
3 See Felicia Nathan, “Analyzing employer costs for wages, salaries, andbenefits,” Monthly Labor Review, October 1987, pp. 3-11.
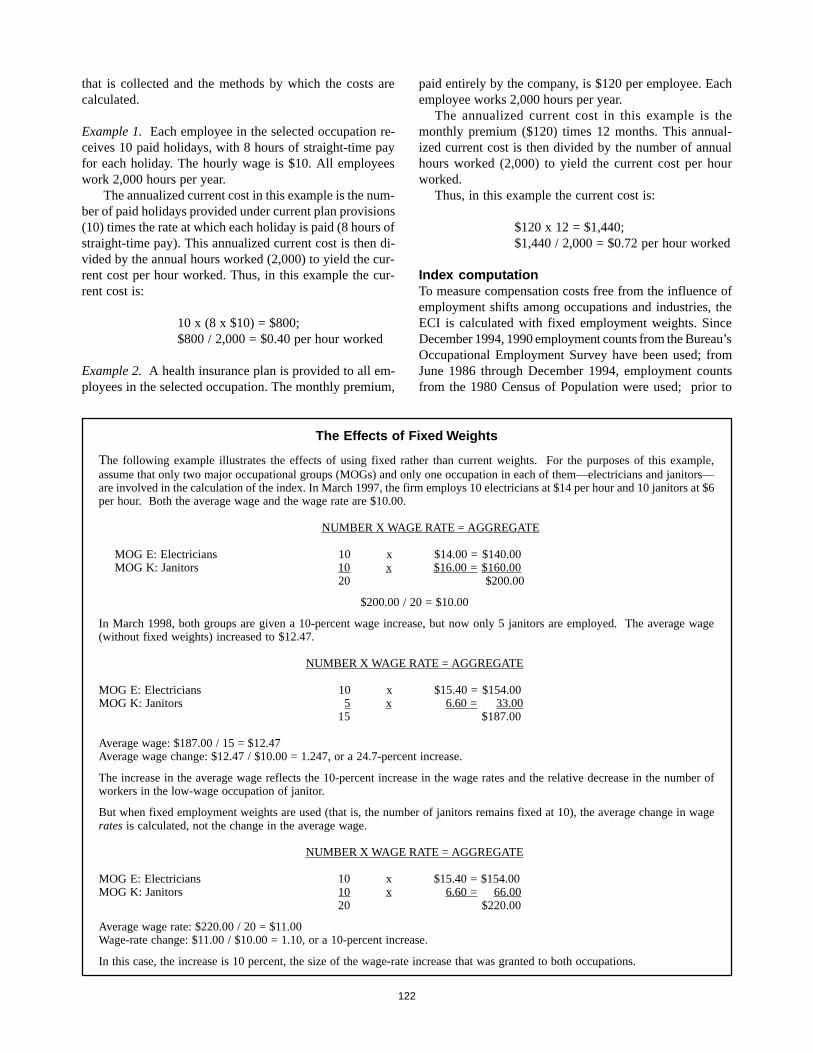
122
that is collected and the methods by which the costs arecalculated.
Example 1. Each employee in the selected occupation re-ceives 10 paid holidays, with 8 hours of straight-time payfor each holiday. The hourly wage is $10. All employeeswork 2,000 hours per year.
The annualized current cost in this example is the num-ber of paid holidays provided under current plan provisions(10) times the rate at which each holiday is paid (8 hours ofstraight-time pay). This annualized current cost is then di-vided by the annual hours worked (2,000) to yield the cur-rent cost per hour worked. Thus, in this example the cur-rent cost is:
10 x (8 x $10) = $800;$800 / 2,000 = $0.40 per hour worked
Example 2. A health insurance plan is provided to all em-ployees in the selected occupation. The monthly premium,
paid entirely by the company, is $120 per employee. Eachemployee works 2,000 hours per year.
The annualized current cost in this example is themonthly premium ($120) times 12 months. This annual-ized current cost is then divided by the number of annualhours worked (2,000) to yield the current cost per hourworked.
Thus, in this example the current cost is:
$120 x 12 = $1,440;$1,440 / 2,000 = $0.72 per hour worked
Index computationTo measure compensation costs free from the influence ofemployment shifts among occupations and industries, theECI is calculated with fixed employment weights. SinceDecember 1994, 1990 employment counts from the Bureau’sOccupational Employment Survey have been used; fromJune 1986 through December 1994, employment countsfrom the 1980 Census of Population were used; prior to
The Effects of Fixed Weights
The following example illustrates the effects of using fixed rather than current weights. For the purposes of this example,assume that only two major occupational groups (MOGs) and only one occupation in each of them—electricians and janitors—are involved in the calculation of the index. In March 1997, the firm employs 10 electricians at $14 per hour and 10 janitors at $6per hour. Both the average wage and the wage rate are $10.00.
NUMBER X WAGE RATE = AGGREGATE
MOG E: Electricians 10 x $14.00 = $140.00MOG K: Janitors 10 x $16.00 =$160.00
20 $200.00
$200.00 / 20 = $10.00
In March 1998, both groups are given a 10-percent wage increase, but now only 5 janitors are employed. The average wage(without fixed weights) increased to $12.47.
NUMBER X WAGE RATE = AGGREGATE
MOG E: Electricians 10 x $15.40 = $154.00MOG K: Janitors 15 x $16.60 = $133.00
15 $187.00
Average wage: $187.00 / 15 = $12.47Average wage change: $12.47 / $10.00 = 1.247, or a 24.7-percent increase.
The increase in the average wage reflects the 10-percent increase in the wage rates and the relative decrease in the number ofworkers in the low-wage occupation of janitor.
But when fixed employment weights are used (that is, the number of janitors remains fixed at 10), the average change in wagerates is calculated, not the change in the average wage.
NUMBER X WAGE RATE = AGGREGATE
MOG E: Electricians 10 x $15.40 = $154.00MOG K: Janitors 10 x $16.60 =$166.00
20 $220.00
Average wage rate: $220.00 / 20 = $11.00Wage-rate change: $11.00 / $10.00 = 1.10, or a 10-percent increase.
In this case, the increase is 10 percent, the size of the wage-rate increase that was granted to both occupations.
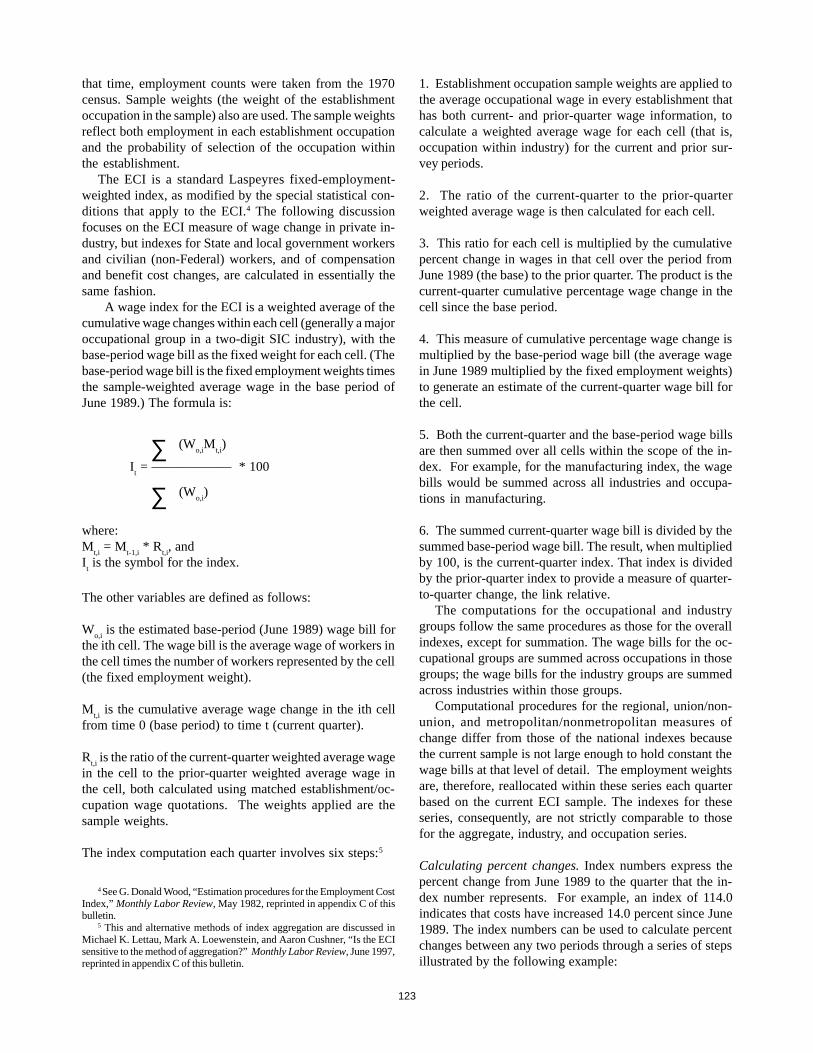
123
that time, employment counts were taken from the 1970census. Sample weights (the weight of the establishmentoccupation in the sample) also are used. The sample weightsreflect both employment in each establishment occupationand the probability of selection of the occupation withinthe establishment.
The ECI is a standard Laspeyres fixed-employment-weighted index, as modified by the special statistical con-ditions that apply to the ECI.4 The following discussionfocuses on the ECI measure of wage change in private in-dustry, but indexes for State and local government workersand civilian (non-Federal) workers, and of compensationand benefit cost changes, are calculated in essentially thesame fashion.
A wage index for the ECI is a weighted average of thecumulative wage changes within each cell (generally a majoroccupational group in a two-digit SIC industry), with thebase-period wage bill as the fixed weight for each cell. (Thebase-period wage bill is the fixed employment weights timesthe sample-weighted average wage in the base period ofJune 1989.) The formula is:
∑ (Wo,i
Mt,i)
It = —————— * 100
∑ (Wo,i
)
where:M
t,i = M
t-1,i * R
t,i, and
It is the symbol for the index.
The other variables are defined as follows:
Wo,i
is the estimated base-period (June 1989) wage bill forthe ith cell. The wage bill is the average wage of workers inthe cell times the number of workers represented by the cell(the fixed employment weight).
Mt,i is the cumulative average wage change in the ith cell
from time 0 (base period) to time t (current quarter).
Rt,i is the ratio of the current-quarter weighted average wage
in the cell to the prior-quarter weighted average wage inthe cell, both calculated using matched establishment/oc-cupation wage quotations. The weights applied are thesample weights.
The index computation each quarter involves six steps:5
1. Establishment occupation sample weights are applied tothe average occupational wage in every establishment thathas both current- and prior-quarter wage information, tocalculate a weighted average wage for each cell (that is,occupation within industry) for the current and prior sur-vey periods.
2. The ratio of the current-quarter to the prior-quarterweighted average wage is then calculated for each cell.
3. This ratio for each cell is multiplied by the cumulativepercent change in wages in that cell over the period fromJune 1989 (the base) to the prior quarter. The product is thecurrent-quarter cumulative percentage wage change in thecell since the base period.
4. This measure of cumulative percentage wage change ismultiplied by the base-period wage bill (the average wagein June 1989 multiplied by the fixed employment weights)to generate an estimate of the current-quarter wage bill forthe cell.
5. Both the current-quarter and the base-period wage billsare then summed over all cells within the scope of the in-dex. For example, for the manufacturing index, the wagebills would be summed across all industries and occupa-tions in manufacturing.
6. The summed current-quarter wage bill is divided by thesummed base-period wage bill. The result, when multipliedby 100, is the current-quarter index. That index is dividedby the prior-quarter index to provide a measure of quarter-to-quarter change, the link relative.
The computations for the occupational and industrygroups follow the same procedures as those for the overallindexes, except for summation. The wage bills for the oc-cupational groups are summed across occupations in thosegroups; the wage bills for the industry groups are summedacross industries within those groups.
Computational procedures for the regional, union/non-union, and metropolitan/nonmetropolitan measures ofchange differ from those of the national indexes becausethe current sample is not large enough to hold constant thewage bills at that level of detail. The employment weightsare, therefore, reallocated within these series each quarterbased on the current ECI sample. The indexes for theseseries, consequently, are not strictly comparable to thosefor the aggregate, industry, and occupation series.
Calculating percent changes. Index numbers express thepercent change from June 1989 to the quarter that the in-dex number represents. For example, an index of 114.0indicates that costs have increased 14.0 percent since June1989. The index numbers can be used to calculate percentchanges between any two periods through a series of stepsillustrated by the following example:
4 See G. Donald Wood, “Estimation procedures for the Employment CostIndex,” Monthly Labor Review, May 1982, reprinted in appendix C of thisbulletin.
5 This and alternative methods of index aggregation are discussed inMichael K. Lettau, Mark A. Loewenstein, and Aaron Cushner, “Is the ECIsensitive to the method of aggregation?” Monthly Labor Review, June 1997,reprinted in appendix C of this bulletin.
124
ECI current index 120.0Earlier index 114.0Difference 6.0Divided by earlier index 114.0Equals 0.053Results multiplied by 100 0.053 x 100Equals percent change 5.3
Reference tables 1 through 12 provide indexes as wellas 3-month and 12-month percent changes for all ECI se-ries. The percent changes are included as a convenience tousers. Summing the percent changes does not yield a per-cent change between two periods spanning several quartersor years. The percent changes must be compounded. Forexample, the compounded 9-month percent change fromthe three consecutive 3-month changes of 1.1 percent, 1.2percent, and 1.9 percent is calculated as follows:
1.011 x 1.012 x 1.019 = 1.043 or 4.3 percent.
Calculating the percent difference between two indexnumbers (as illustrated in the first example) yields the sameresult as compounding percent changes (except for round-ing, which may cause small differences).
In March 1990, the ECI began publishing indexes witha base period June 1989=100, rather than June 1981=100.The rebasing was done so that indexes would be availablefor all published ECI series.6
Reliability of the estimatesThere are two types of errors possible in the estimates fromthe ECI as well as any other sample survey—sampling andnonsampling errors.
Sampling errors. Because the ECI is a sample survey, it issubject to sampling errors. Sampling errors are differencesthat occur between the results computed from a sample ofobservations and those computed from all observations inthe population. The estimates derived from different samplesselected using the same sample design may differ from eachother.
A measure of the variation among these differing esti-mates is the standard error. Standard errors can be used tomeasure the precision with which an estimate from a par-ticular sample approximates the average result of all pos-sible samples. The chances are about 68 out of 100 that anestimate from the survey differs from a complete popula-tion figure by less than the standard error. The chances areabout 90 out of 100 that this difference would be less than1.6 times the standard error. All the statements of compari-sons appearing in this publication are significant at the 1.6-standard-error level or better, unless otherwise indicated.
This means that, for differences cited, the estimated differ-ence is greater than 1.6 times the standard error of the dif-ference.
The method used for computing the standard errors forthe 12-month percent change in the ECI is called “balancedrepeated replication.” Each industry sample is divided intoa number of variance strata, and the sample in each vari-ance stratum is divided into half-samples. The percentchange estimates are replicated 128 times using the datafrom one half-sample from each stratum instead of the datafrom both half-samples. The ECI uses standard errors toevaluate published series. Currently, in the higher levelaggregate series, the standard errors for 3-month changesare generally 0.1 percent or less; for 12-month changes,standard errors are generally 0.25 percent or less. Currently,in the lower level series, standard errors are generally 0.3percent or less for 3-month changes and 0.6 percent or lessfor 12-month changes. Standard errors for 12-monthchanges in published wage, benefit, and compensation costchanges for 1995-99 are provided in tables A-1 through A-3.
The formula used for calculating the variances, and inturn the standard errors, for the percent changes is:
∑=
−=128
1
2o,,os, 128/)RR()R( VAR
isis
where:
Rs,o
is the 12-month percent change for characteristic ‘s’calculated using the full sample;
and Rs,i is the 12-month percent change for characteristic
‘s’ calculated using the ith balanced half-sample.
The standard error is the square root of the variance.
For a more detailed discussion of sampling andnonsampling error in the ECI, see Karen O’Conor andWilliam Wong, “Measuring the precision of the Employ-ment Cost Index,” Monthly Labor Review, March 1989,reprinted in appendix C of this bulletin.
Nonsampling errors. These errors have a number of poten-tial sources. The primary sources are (1) survey nonresponseand (2) data collection and processing errors, such as in-correct information provided by respondents, definitionaldifficulties, and errors in recording, coding, and process-ing data obtained.
Nonsampling errors are not measured. However, the ECIprogram has implemented procedures for reducingnonsampling errors, primarily through quality assuranceprograms. The quality assurance programs include the useof data collection reinterviews, observed interviews, com-puter edits of the data, and systematic professional review
6 See Albert E. Schwenk, “Employment Cost Index rebased to June 1989,”Monthly Labor Review, April 1990, reprinted in appendix C of this bulletin.
125
of the reports on which the data are recorded. These pro-grams serve as a training device to provide feedback to thefield staff on errors. They also provide information onsources of error that can be remedied by improved collec-tion instructions or data processing edits. Extensive train-ing of field economists also is conducted to maintain highstandards in data collection.
Because not all sample units respond to the ECI survey,nonresponse adjustment is required. For permanent refus-als identified during initial data collection, the weights ofresponding units are adjusted to reflect nonresponse by simi-lar establishments. For temporary nonresponses for wagedata during update quarters, or if some benefit data aremissing, the missing data are imputed on the basis of infor-mation provided by similar establishments.
Seasonal adjustmentOver the course of a year, the rate of wage and benefit changeis affected by events that follow a more or less regular pat-tern each year. For example, wage and benefit adjustmentsin State and local governments, especially schools, are con-centrated in the June-September period. Increases in theSocial Security tax rate and earnings ceiling, when theyoccur, always take effect in the December-March period.Wage and benefit adjustments in construction often occurin the summer during which there is the most activity inthe industry.
Adjusting for these seasonal patterns makes it easier toobserve the cyclical and other nonseasonal movements inthe series. In evaluating changes in a seasonally adjustedseries, it is important to note that seasonal adjustment ismerely an approximation based on past experience. Sea-sonally adjusted estimates have a broader margin of pos-sible error than the original data on which they are based,
because they are not only subject to sampling and othererrors but also are affected by the uncertainties of the sea-sonal adjustment process itself. Seasonally adjusted ECImajor industry and occupational data were first released inDecember 1990.7 After the December quarter, seasonal ad-justment factors are calculated for use during the comingyear. (See table A-4.)
ECI series are seasonally adjusted using either direct orcomposite estimates. Most industry and occupational se-ries, such as construction, for example, are adjusted directly.The civilian, State and local, private, and manufacturingseries are composite estimates. The seasonally adjusted ci-vilian compensation series, for example, is computed byaggregating the following independently adjusted series:Private goods-producing wages, private goods-producingbenefits, private service-producing wages, private service-producing benefits, State and local wages, and State andlocal benefits. (Goods-producing wages has no identifiableseasonality, so the seasonally adjusted and unadjusted se-ries are identical.)
7 From December 1990 to December 1998, BLS used the X11-ARIMA-88 seasonal adjustment programs. ARIMA is an acronym for Auto-Regres-sive Integrated Moving Average. For a detailed discussion of ARIMA meth-ods see Box, George E.P. and Gwilym M. Jenkins, Time Series Analysis:Forecasting and Control, Holden-Day, San Francisco, 1976. The X11-ARIMA-88 program was developed at Statistics Canada as an extension ofthe standard X11 and X11-ARIMA methods. For a detailed description of theX11-ARIMA-88 method, see Dagum, Estella Bee, X11-ARIMA-88 SeasonalAdjustment Method, Statistics Canada, October 1988.
In March 1999, BLS began using the X12-ARIMA seasonal adjustmentprogram to estimate seasonal factors. This is an improvement that did notaffect the continuity of the historical data. The X12-ARIMA method is anenhanced version of the X-11 Variant of Census Method II. For a detaileddescription of the X12-ARIMA method see Findley, David F., Brian C. Monsel,William R. Bell, Mark C. Otto, and Bor-Chung Chen, “New Capabilities andMethods of the X-12-ARIMA Seasonal Adjustment Program,” in Journal ofBusiness and Economic Statistics, April 1998, Vol. 16, Number 2.
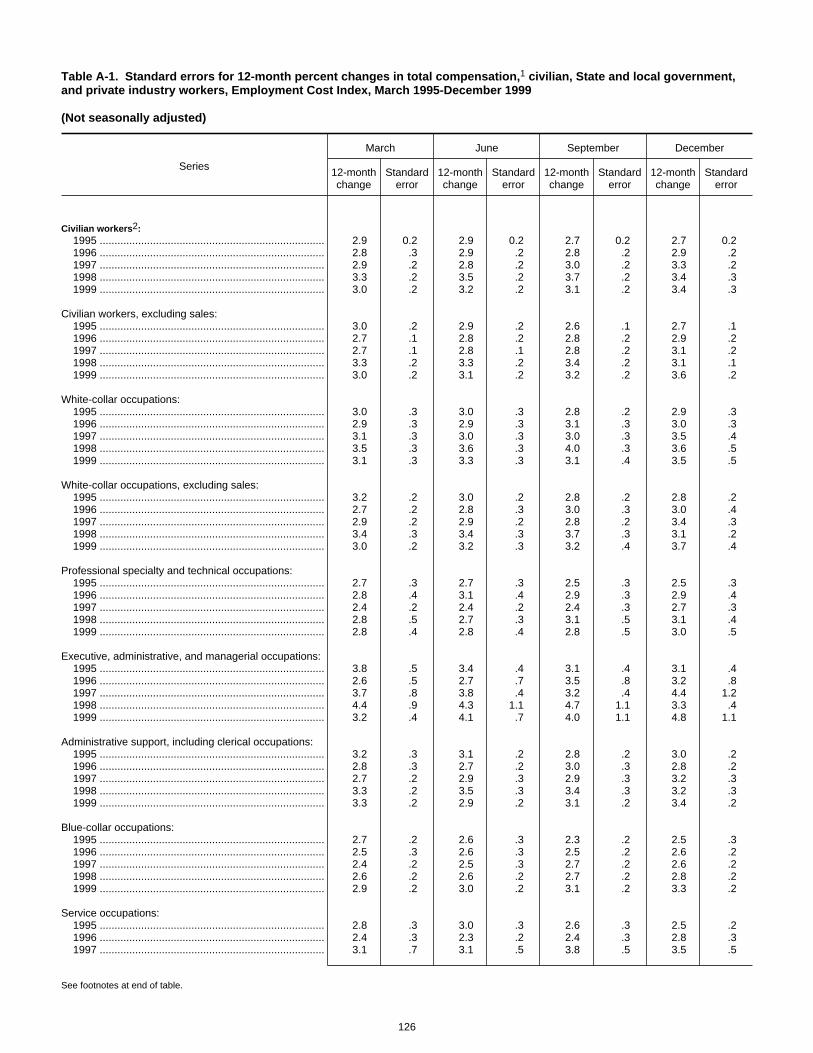
Table A-1. Standard errors for 12-month percent changes in total compensation,1 civilian, State and local government,and private industry workers, Employment Cost Index, March 1995-December 1999
(Not seasonally adjusted)
Series
March June September December
12-monthchange
Standarderror
12-monthchange
Standarderror
12-monthchange
Standarderror
12-monthchange
Standarderror
Civilian workers2:1995 ............................................................................ 2.9 0.2 2.9 0.2 2.7 0.2 2.7 0.21996 ............................................................................ 2.8 .3 2.9 .2 2.8 .2 2.9 .21997 ............................................................................ 2.9 .2 2.8 .2 3.0 .2 3.3 .21998 ............................................................................ 3.3 .2 3.5 .2 3.7 .2 3.4 .31999 ............................................................................ 3.0 .2 3.2 .2 3.1 .2 3.4 .3
Civilian workers, excluding sales:1995 ............................................................................ 3.0 .2 2.9 .2 2.6 .1 2.7 .11996 ............................................................................ 2.7 .1 2.8 .2 2.8 .2 2.9 .21997 ............................................................................ 2.7 .1 2.8 .1 2.8 .2 3.1 .21998 ............................................................................ 3.3 .2 3.3 .2 3.4 .2 3.1 .11999 ............................................................................ 3.0 .2 3.1 .2 3.2 .2 3.6 .2
White-collar occupations:1995 ............................................................................ 3.0 .3 3.0 .3 2.8 .2 2.9 .31996 ............................................................................ 2.9 .3 2.9 .3 3.1 .3 3.0 .31997 ............................................................................ 3.1 .3 3.0 .3 3.0 .3 3.5 .41998 ............................................................................ 3.5 .3 3.6 .3 4.0 .3 3.6 .51999 ............................................................................ 3.1 .3 3.3 .3 3.1 .4 3.5 .5
White-collar occupations, excluding sales:1995 ............................................................................ 3.2 .2 3.0 .2 2.8 .2 2.8 .21996 ............................................................................ 2.7 .2 2.8 .3 3.0 .3 3.0 .41997 ............................................................................ 2.9 .2 2.9 .2 2.8 .2 3.4 .31998 ............................................................................ 3.4 .3 3.4 .3 3.7 .3 3.1 .21999 ............................................................................ 3.0 .2 3.2 .3 3.2 .4 3.7 .4
Professional specialty and technical occupations:1995 ............................................................................ 2.7 .3 2.7 .3 2.5 .3 2.5 .31996 ............................................................................ 2.8 .4 3.1 .4 2.9 .3 2.9 .41997 ............................................................................ 2.4 .2 2.4 .2 2.4 .3 2.7 .31998 ............................................................................ 2.8 .5 2.7 .3 3.1 .5 3.1 .41999 ............................................................................ 2.8 .4 2.8 .4 2.8 .5 3.0 .5
Executive, administrative, and managerial occupations:1995 ............................................................................ 3.8 .5 3.4 .4 3.1 .4 3.1 .41996 ............................................................................ 2.6 .5 2.7 .7 3.5 .8 3.2 .81997 ............................................................................ 3.7 .8 3.8 .4 3.2 .4 4.4 1.21998 ............................................................................ 4.4 .9 4.3 1.1 4.7 1.1 3.3 .41999 ............................................................................ 3.2 .4 4.1 .7 4.0 1.1 4.8 1.1
Administrative support, including clerical occupations:1995 ............................................................................ 3.2 .3 3.1 .2 2.8 .2 3.0 .21996 ............................................................................ 2.8 .3 2.7 .2 3.0 .3 2.8 .21997 ............................................................................ 2.7 .2 2.9 .3 2.9 .3 3.2 .31998 ............................................................................ 3.3 .2 3.5 .3 3.4 .3 3.2 .31999 ............................................................................ 3.3 .2 2.9 .2 3.1 .2 3.4 .2
Blue-collar occupations:1995 ............................................................................ 2.7 .2 2.6 .3 2.3 .2 2.5 .31996 ............................................................................ 2.5 .3 2.6 .3 2.5 .2 2.6 .21997 ............................................................................ 2.4 .2 2.5 .3 2.7 .2 2.6 .21998 ............................................................................ 2.6 .2 2.6 .2 2.7 .2 2.8 .21999 ............................................................................ 2.9 .2 3.0 .2 3.1 .2 3.3 .2
Service occupations:1995 ............................................................................ 2.8 .3 3.0 .3 2.6 .3 2.5 .21996 ............................................................................ 2.4 .3 2.3 .2 2.4 .3 2.8 .31997 ............................................................................ 3.1 .7 3.1 .5 3.8 .5 3.5 .5
See footnotes at end of table.
126

Table A-1. Standard errors for 12-month percent changes in total compensation,1 civilian, State and local government,and private industry workers, Employment Cost Index, March 1995-December 1999
(Not seasonally adjusted) — Continued
Series
March June September December
12-monthchange
Standarderror
12-monthchange
Standarderror
12-monthchange
Standarderror
12-monthchange
Standarderror
Service occupations:1998 ............................................................................ 3.7 0.5 3.9 0.5 3.6 0.5 3.2 0.51999 ............................................................................ 3.2 .4 3.3 .6 2.7 .5 3.4 .4
Goods-producing industries3:1995 ............................................................................ 2.8 .4 2.4 .3 2.1 .3 2.4 .31996 ............................................................................ 2.4 .4 2.6 .3 2.8 .2 2.7 .31997 ............................................................................ 2.5 .2 2.6 .2 2.7 .3 2.4 .31998 ............................................................................ 2.7 .3 2.7 .3 2.7 .2 2.8 .21999 ............................................................................ 2.9 .2 2.7 .2 2.9 .2 3.3 .2
Manufacturing:1995 ............................................................................ 3.0 .3 2.8 .4 2.3 .3 2.6 .41996 ............................................................................ 2.5 .4 2.8 .4 3.1 .3 3.0 .41997 ............................................................................ 2.6 .2 2.6 .3 2.5 .3 2.4 .31998 ............................................................................ 2.9 .3 2.5 .3 2.7 .3 2.7 .31999 ............................................................................ 2.6 .2 2.7 .2 2.8 .2 3.4 .2
Service-producing industries:1995 ............................................................................ 3.0 .2 3.1 .2 2.8 .2 2.8 .31996 ............................................................................ 2.9 .2 2.9 .3 2.8 .3 3.0 .31997 ............................................................................ 3.0 .3 2.9 .3 3.1 .2 3.5 .31998 ............................................................................ 3.6 .3 3.6 .3 4.0 .3 3.6 .51999 ............................................................................ 3.0 .2 3.4 .3 3.2 .3 3.5 .5
Services industries:1995 ............................................................................ 2.7 .2 2.9 .1 2.5 .2 2.4 .21996 ............................................................................ 2.5 .2 2.7 .4 2.8 .4 2.9 .31997 ............................................................................ 2.8 .4 2.8 .2 3.0 .2 3.3 .31998 ............................................................................ 3.1 .3 3.0 .2 3.2 .3 3.0 .21999 ............................................................................ 2.9 .3 3.0 .3 3.1 .4 3.4 .4
Health services:1995 ............................................................................ 2.6 .3 2.8 .2 2.6 .2 2.7 .31996 ............................................................................ 2.4 .3 2.5 .3 2.3 .3 1.8 .31997 ............................................................................ 2.0 .4 1.7 .4 1.9 .4 2.6 .41998 ............................................................................ 2.1 .3 2.1 .4 1.8 .8 .9 1.01999 ............................................................................ 1.8 .9 2.1 .8 2.6 .7 3.7 .6
Hospitals:1995 ............................................................................ 2.3 .3 2.6 .2 2.3 .2 2.3 .31996 ............................................................................ 2.7 .3 2.5 .2 2.5 .2 1.8 .21997 ............................................................................ 1.4 .2 1.3 .2 1.5 .2 2.2 .21998 ............................................................................ 2.2 .2 2.7 .3 2.8 .2 2.6 .21999 ............................................................................ 3.1 .3 2.9 .3 2.9 .2 3.4 .3
Educational services:1995 ............................................................................ 3.0 .2 3.1 .2 3.0 .3 3.0 .21996 ............................................................................ 2.8 .3 2.7 .3 2.6 .3 2.8 .31997 ............................................................................ 2.7 .2 2.6 .2 2.5 .2 2.3 .11998 ............................................................................ 2.6 .2 2.6 .1 2.7 .2 2.9 .21999 ............................................................................ 2.8 .2 2.9 .2 3.1 .1 3.4 .2
Public administration4:1995 ............................................................................ 3.2 .3 3.2 .2 3.0 .2 3.3 .31996 ............................................................................ 3.0 .3 2.8 .3 2.6 .3 2.7 .21997 ............................................................................ 2.9 .2 2.6 .2 2.6 .3 2.5 .21998 ............................................................................ 2.6 .3 3.3 .2 3.6 .4 3.6 .31999 ............................................................................ 3.2 .4 3.0 .3 2.5 .5 3.2 .6
See footnotes at end of table.
127

Table A-1. Standard errors for 12-month percent changes in total compensation,1 civilian, State and local government,and private industry workers, Employment Cost Index, March 1995-December 1999
(Not seasonally adjusted) — Continued
Series
March June September December
12-monthchange
Standarderror
12-monthchange
Standarderror
12-monthchange
Standarderror
12-monthchange
Standarderror
Nonmanufacturing:1995 ............................................................................ 2.9 0.2 2.9 0.2 2.7 0.2 2.8 0.31996 ............................................................................ 2.8 .2 2.9 .2 2.8 .3 2.9 .31997 ............................................................................ 3.0 .3 2.9 .3 3.1 .2 3.5 .31998 ............................................................................ 3.4 .3 3.6 .3 3.9 .3 3.6 .41999 ............................................................................ 3.2 .2 3.4 .2 3.2 .3 3.4 .4
State and local government workers:1995 ............................................................................ 3.1 .2 3.1 .2 3.0 .3 2.9 .21996 ............................................................................ 2.8 .2 2.6 .2 2.5 .2 2.6 .21997 ............................................................................ 2.5 .2 2.4 .1 2.4 .1 2.3 .11998 ............................................................................ 2.5 .1 2.7 .1 3.0 .2 3.0 .21999 ............................................................................ 2.9 .2 3.0 .2 2.9 .2 3.4 .2
White-collar occupations:1995 ............................................................................ 2.9 .1 3.0 .2 3.0 .3 2.9 .21996 ............................................................................ 2.7 .3 2.6 .3 2.5 .2 2.6 .31997 ............................................................................ 2.5 .3 2.4 .2 2.3 .1 2.3 .11998 ............................................................................ 2.4 .1 2.4 .1 2.7 .2 2.8 .21999 ............................................................................ 2.7 .2 2.9 .2 3.0 .2 3.4 .2
Professional specialty and technical occupations:1995 ............................................................................ 2.9 .2 2.9 .2 2.7 .3 2.6 .31996 ............................................................................ 2.5 .4 2.5 .4 2.5 .2 2.7 .31997 ............................................................................ 2.6 .2 2.3 .2 2.3 .2 2.1 .11998 ............................................................................ 2.3 .2 2.3 .2 2.3 .2 2.5 .21999 ............................................................................ 2.4 .2 2.7 .2 3.1 .2 3.4 .2
Executive, administrative, and managerial occupations:1995 ............................................................................ 3.3 .7 3.2 .7 3.5 .7 3.7 .71996 ............................................................................ 3.0 .3 2.8 .4 2.2 .4 2.3 .41997 ............................................................................ 2.6 .5 2.6 .3 2.7 .5 2.6 .41998 ............................................................................ 2.5 .4 2.6 .4 3.5 .6 3.8 .61999 ............................................................................ 3.7 .6 3.6 .5 2.9 .3 3.2 .3
Administrative support, including clerical occupations:1995 ............................................................................ 2.9 .2 2.9 .6 2.8 .4 2.8 .51996 ............................................................................ 2.9 .5 2.8 .3 2.6 .3 3.0 .31997 ............................................................................ 2.5 .2 2.4 .2 2.7 .3 2.3 .31998 ............................................................................ 2.7 .2 2.8 .2 3.1 .3 3.1 .31999 ............................................................................ 3.3 .3 3.0 .3 2.5 .3 3.4 .4
Blue-collar occupations:1995 ............................................................................ 2.5 .4 2.9 .3 2.4 .4 2.6 .31996 ............................................................................ 2.9 .3 2.5 .2 2.4 .3 2.5 .31997 ............................................................................ 2.4 .4 2.2 .4 2.3 .4 2.3 .41998 ............................................................................ 2.2 .2 2.2 .2 2.6 .2 2.7 .71999 ............................................................................ 2.8 .8 3.2 .9 3.0 .6 3.4 .5
Service occupations:1995 ............................................................................ 3.7 .4 4.0 .3 3.3 .4 3.5 .41996 ............................................................................ 3.4 .3 2.7 .3 2.7 .3 2.7 .31997 ............................................................................ 2.8 .5 2.5 .4 2.5 .5 2.5 .51998 ............................................................................ 2.8 .6 4.0 .6 4.4 .6 4.1 .71999 ............................................................................ 3.5 .5 3.0 .5 2.6 .4 3.6 .4
Service industries:1995 ............................................................................ 2.9 .2 3.0 .2 2.9 .3 2.8 .31996 ............................................................................ 2.6 .3 2.5 .3 2.5 .2 2.7 .2
See footnotes at end of table.
128

Table A-1. Standard errors for 12-month percent changes in total compensation,1 civilian, State and local government,and private industry workers, Employment Cost Index, March 1995-December 1999
(Not seasonally adjusted) — Continued
Series
March June September December
12-monthchange
Standarderror
12-monthchange
Standarderror
12-monthchange
Standarderror
12-monthchange
Standarderror
Service industries:1997 ............................................................................ 2.5 0.2 2.3 0.2 2.3 0.2 2.2 0.11998 ............................................................................ 2.5 .2 2.5 .1 2.7 .2 2.7 .21999 ............................................................................ 2.6 .2 2.9 .2 3.0 .1 3.4 .2
Service industries, excluding schools5:1995 ............................................................................ 2.9 .3 3.6 .3 3.2 1.0 3.0 .71996 ............................................................................ 3.1 .9 2.4 1.0 2.3 .7 2.0 1.21997 ............................................................................ 1.7 .2 1.6 .2 1.9 .3 2.5 .31998 ............................................................................ 2.7 .3 2.5 .3 3.2 .3 2.6 .31999 ............................................................................ 2.6 .3 3.0 .2 2.8 .2 3.6 .3
Health services:1995 ............................................................................ 3.4 .4 3.7 .4 3.0 .3 3.1 .31996 ............................................................................ 3.2 .3 2.5 .3 2.3 .4 1.9 .31997 ............................................................................ 1.5 .2 1.4 .2 1.5 .3 2.3 .31998 ............................................................................ 2.5 .4 2.3 .4 3.2 .5 2.6 .51999 ............................................................................ 2.4 .3 2.9 .3 2.8 .3 3.6 .3
Hospitals:1995 ............................................................................ 3.8 .3 4.3 .4 3.2 .3 3.1 .31996 ............................................................................ 3.3 .3 2.5 .4 2.4 .2 2.0 .31997 ............................................................................ 1.7 .2 1.5 .2 1.6 .3 2.5 .21998 ............................................................................ 2.7 .4 2.4 .5 3.2 .5 2.6 .51999 ............................................................................ 2.4 .4 3.1 .3 2.9 .3 3.6 .3
Educational services:1995 ............................................................................ 2.9 .2 3.0 .2 2.8 .4 2.7 .31996 ............................................................................ 2.5 .4 2.5 .4 2.6 .3 2.8 .31997 ............................................................................ 2.6 .2 2.5 .2 2.3 .2 2.2 .21998 ............................................................................ 2.4 .2 2.5 .2 2.5 .2 2.7 .21999 ............................................................................ 2.6 .3 2.8 .3 3.1 .2 3.4 .2
Schools:1995 ............................................................................ 2.9 .2 3.0 .2 2.8 .3 2.8 .21996 ............................................................................ 2.5 .3 2.5 .2 2.5 .2 2.8 .31997 ............................................................................ 2.6 .2 2.5 .2 2.3 .2 2.1 .21998 ............................................................................ 2.4 .2 2.4 .2 2.5 .2 2.7 .21999 ............................................................................ 2.6 .2 2.9 .2 3.2 .2 3.4 .2
Elementary and secondary schools:1995 ............................................................................ 2.7 .2 2.9 .2 2.8 .3 2.8 .31996 ............................................................................ 2.4 .2 2.4 .2 2.2 .3 2.3 .31997 ............................................................................ 2.2 .3 2.1 .3 2.2 .2 2.0 .21998 ............................................................................ 2.3 .2 2.2 .2 2.4 .2 2.6 .21999 ............................................................................ 2.6 .3 2.8 .3 3.0 .2 3.4 .2
Colleges and universities:1995 ............................................................................ 3.7 .6 3.4 .3 2.8 .4 2.5 .31996 ............................................................................ 2.7 .8 3.0 .3 3.5 .5 4.1 .41997 ............................................................................ 3.8 .3 3.2 .3 2.9 .2 2.4 .31998 ............................................................................ 2.7 .3 3.0 .3 2.8 .5 3.1 .21999 ............................................................................ 2.8 .2 2.9 .1 3.4 .3 3.5 .5
Public administration4:1995 ............................................................................ 3.2 .3 3.2 .2 3.0 .2 3.3 .31996 ............................................................................ 3.0 .3 2.8 .3 2.6 .3 2.7 .21997 ............................................................................ 2.9 .2 2.6 .2 2.6 .3 2.5 .21998 ............................................................................ 2.6 .3 3.3 .2 3.6 .4 3.6 .31999 ............................................................................ 3.2 .4 3.0 .3 2.5 .5 3.2 .6
See footnotes at end of table.
129
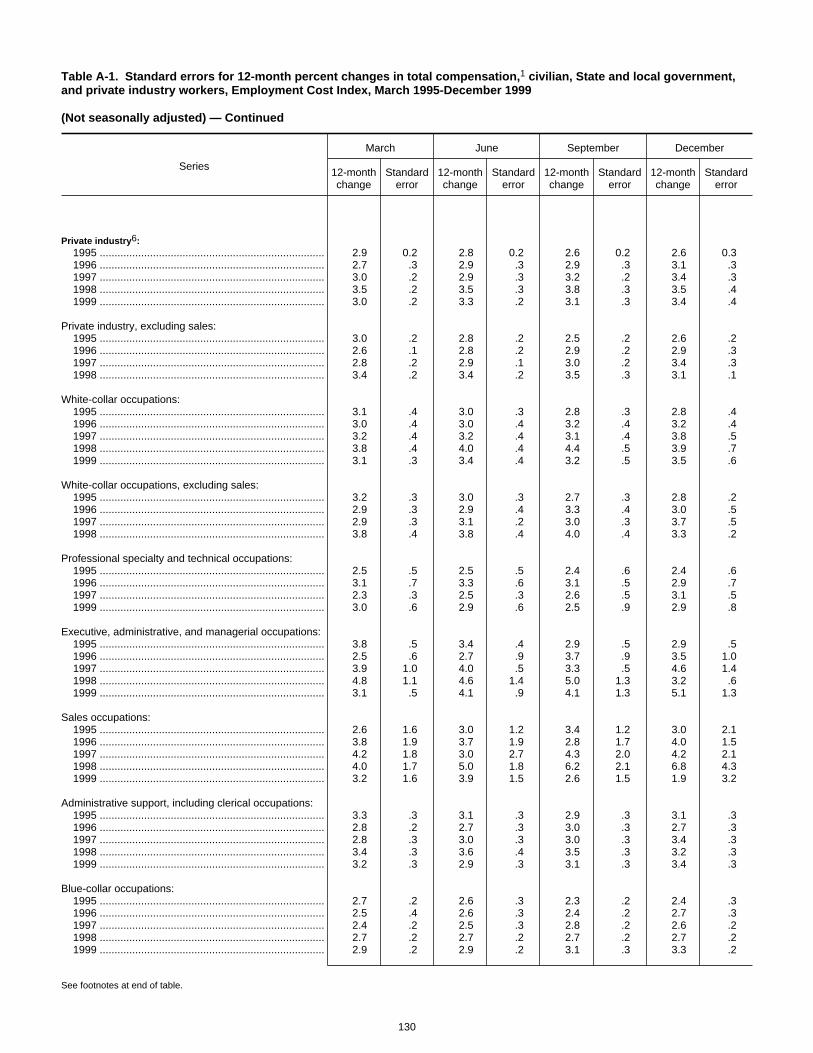
Table A-1. Standard errors for 12-month percent changes in total compensation,1 civilian, State and local government,and private industry workers, Employment Cost Index, March 1995-December 1999
(Not seasonally adjusted) — Continued
Series
March June September December
12-monthchange
Standarderror
12-monthchange
Standarderror
12-monthchange
Standarderror
12-monthchange
Standarderror
Private industry6:1995 ............................................................................ 2.9 0.2 2.8 0.2 2.6 0.2 2.6 0.31996 ............................................................................ 2.7 .3 2.9 .3 2.9 .3 3.1 .31997 ............................................................................ 3.0 .2 2.9 .3 3.2 .2 3.4 .31998 ............................................................................ 3.5 .2 3.5 .3 3.8 .3 3.5 .41999 ............................................................................ 3.0 .2 3.3 .2 3.1 .3 3.4 .4
Private industry, excluding sales:1995 ............................................................................ 3.0 .2 2.8 .2 2.5 .2 2.6 .21996 ............................................................................ 2.6 .1 2.8 .2 2.9 .2 2.9 .31997 ............................................................................ 2.8 .2 2.9 .1 3.0 .2 3.4 .31998 ............................................................................ 3.4 .2 3.4 .2 3.5 .3 3.1 .1
White-collar occupations:1995 ............................................................................ 3.1 .4 3.0 .3 2.8 .3 2.8 .41996 ............................................................................ 3.0 .4 3.0 .4 3.2 .4 3.2 .41997 ............................................................................ 3.2 .4 3.2 .4 3.1 .4 3.8 .51998 ............................................................................ 3.8 .4 4.0 .4 4.4 .5 3.9 .71999 ............................................................................ 3.1 .3 3.4 .4 3.2 .5 3.5 .6
White-collar occupations, excluding sales:1995 ............................................................................ 3.2 .3 3.0 .3 2.7 .3 2.8 .21996 ............................................................................ 2.9 .3 2.9 .4 3.3 .4 3.0 .51997 ............................................................................ 2.9 .3 3.1 .2 3.0 .3 3.7 .51998 ............................................................................ 3.8 .4 3.8 .4 4.0 .4 3.3 .2
Professional specialty and technical occupations:1995 ............................................................................ 2.5 .5 2.5 .5 2.4 .6 2.4 .61996 ............................................................................ 3.1 .7 3.3 .6 3.1 .5 2.9 .71997 ............................................................................ 2.3 .3 2.5 .3 2.6 .5 3.1 .51999 ............................................................................ 3.0 .6 2.9 .6 2.5 .9 2.9 .8
Executive, administrative, and managerial occupations:1995 ............................................................................ 3.8 .5 3.4 .4 2.9 .5 2.9 .51996 ............................................................................ 2.5 .6 2.7 .9 3.7 .9 3.5 1.01997 ............................................................................ 3.9 1.0 4.0 .5 3.3 .5 4.6 1.41998 ............................................................................ 4.8 1.1 4.6 1.4 5.0 1.3 3.2 .61999 ............................................................................ 3.1 .5 4.1 .9 4.1 1.3 5.1 1.3
Sales occupations:1995 ............................................................................ 2.6 1.6 3.0 1.2 3.4 1.2 3.0 2.11996 ............................................................................ 3.8 1.9 3.7 1.9 2.8 1.7 4.0 1.51997 ............................................................................ 4.2 1.8 3.0 2.7 4.3 2.0 4.2 2.11998 ............................................................................ 4.0 1.7 5.0 1.8 6.2 2.1 6.8 4.31999 ............................................................................ 3.2 1.6 3.9 1.5 2.6 1.5 1.9 3.2
Administrative support, including clerical occupations:1995 ............................................................................ 3.3 .3 3.1 .3 2.9 .3 3.1 .31996 ............................................................................ 2.8 .2 2.7 .3 3.0 .3 2.7 .31997 ............................................................................ 2.8 .3 3.0 .3 3.0 .3 3.4 .31998 ............................................................................ 3.4 .3 3.6 .4 3.5 .3 3.2 .31999 ............................................................................ 3.2 .3 2.9 .3 3.1 .3 3.4 .3
Blue-collar occupations:1995 ............................................................................ 2.7 .2 2.6 .3 2.3 .2 2.4 .31996 ............................................................................ 2.5 .4 2.6 .3 2.4 .2 2.7 .31997 ............................................................................ 2.4 .2 2.5 .3 2.8 .2 2.6 .21998 ............................................................................ 2.7 .2 2.7 .2 2.7 .2 2.7 .21999 ............................................................................ 2.9 .2 2.9 .2 3.1 .3 3.3 .2
See footnotes at end of table.
130

Table A-1. Standard errors for 12-month percent changes in total compensation,1 civilian, State and local government,and private industry workers, Employment Cost Index, March 1995-December 1999
(Not seasonally adjusted) — Continued
Series
March June September December
12-monthchange
Standarderror
12-monthchange
Standarderror
12-monthchange
Standarderror
12-monthchange
Standarderror
Precision production, craft, and repair occupations:1995 ............................................................................ 2.7 0.3 2.6 0.4 2.4 0.3 2.6 0.41996 ............................................................................ 2.5 .3 2.7 .2 2.2 .3 2.7 .31997 ............................................................................ 2.5 .3 2.5 .4 2.7 .3 2.2 .31998 ............................................................................ 2.5 .3 2.7 .3 2.8 .3 3.2 .31999 ............................................................................ 3.2 .3 3.0 .3 3.1 .4 3.3 .2
Machine operators, assemblers, and inspectors:1995 ............................................................................ 2.4 .3 2.1 .7 1.8 .3 2.3 .81996 ............................................................................ 2.3 .6 2.6 .9 2.9 .4 2.6 .71997 ............................................................................ 2.3 .4 2.4 .4 2.7 .3 2.7 .31998 ............................................................................ 2.8 .3 2.7 .3 2.6 .4 2.9 .41999 ............................................................................ 2.8 .3 2.7 .3 3.1 .4 3.4 .4
Transportation and material moving occupations:1995 ............................................................................ 2.8 .6 2.8 .4 2.2 .4 2.0 .41996 ............................................................................ 1.7 .7 1.9 .7 1.6 .7 1.8 .51997 ............................................................................ 1.8 .6 1.7 .6 2.5 .5 3.0 .61998 ............................................................................ 2.5 .6 2.4 .4 2.1 .7 1.4 .41999 ............................................................................ 1.8 .5 2.8 .6 2.8 .7 3.4 .6
Handlers, equipment cleaners, helpers, and laborers:1995 ............................................................................ 3.2 .7 3.2 .6 2.6 .7 3.2 .61996 ............................................................................ 3.5 .8 3.2 .8 3.3 .6 3.5 .61997 ............................................................................ 3.3 .6 3.2 .7 3.2 .5 3.4 .51998 ............................................................................ 3.2 .5 3.1 .7 3.2 .6 2.5 .51999 ............................................................................ 2.9 .6 3.4 .7 3.4 .6 3.7 .6
Service occupations:1995 ............................................................................ 2.3 .5 2.5 .4 2.4 .4 1.9 .31996 ............................................................................ 1.9 .4 2.0 .3 2.2 .5 3.0 .51997 ............................................................................ 3.2 .9 3.5 .8 4.5 .7 4.0 .71998 ............................................................................ 4.2 .7 3.9 .7 3.2 .7 2.9 .81999 ............................................................................ 3.1 .7 3.4 .7 2.7 .7 3.3 .6
Goods-producing industries3:1995 ............................................................................ 2.9 .3 2.4 .3 2.1 .3 2.4 .31996 ............................................................................ 2.3 .3 2.7 .3 2.8 .2 2.8 .31997 ............................................................................ 2.5 .2 2.6 .2 2.7 .3 2.4 .31998 ............................................................................ 2.8 .3 2.6 .3 2.6 .2 2.8 .31999 ............................................................................ 2.8 .2 2.7 .2 2.9 .2 3.4 .2
Goods-producing industries, excluding sales occupations:
1995 ............................................................................ 2.9 .3 2.5 .3 2.1 .2 2.4 .31996 ............................................................................ 2.5 .3 2.7 .2 2.9 .2 2.8 .31997 ............................................................................ 2.4 .3 2.6 .3 2.5 .3 2.4 .31998 ............................................................................ 2.6 .3 2.5 .4 2.6 .3 2.7 .31999 ............................................................................ 2.8 .3 2.7 .2 2.9 .3 3.3 .3
Goods-producing industries, white-collar occupations:1995 ............................................................................ 3.4 .7 2.7 .7 2.4 .6 2.5 .51996 ............................................................................ 2.2 .7 2.7 .7 3.2 .6 3.0 .71997 ............................................................................ 2.7 .5 2.9 .6 2.6 .5 2.5 .71998 ............................................................................ 3.1 .6 3.0 .6 3.0 .4 2.9 .61999 ............................................................................ 2.9 .5 2.8 .4 3.0 .4 3.7 .4
Goods-producing industries, white-collar occupations,excluding sales:
1995 ............................................................................ 3.5 .7 2.8 .6 2.5 .6 2.6 .5
See footnotes at end of table.
131

Table A-1. Standard errors for 12-month percent changes in total compensation,1 civilian, State and local government,and private industry workers, Employment Cost Index, March 1995-December 1999
(Not seasonally adjusted) — Continued
Series
March June September December
12-monthchange
Standarderror
12-monthchange
Standarderror
12-monthchange
Standarderror
12-monthchange
Standarderror
Goods-producing industries, white-collar occupations,excluding sales:
1996 ............................................................................ 2.5 0.7 2.8 0.7 3.4 0.6 3.0 0.71997 ............................................................................ 2.5 .5 2.8 .5 2.3 .5 2.2 .61998 ............................................................................ 2.8 .4 2.7 .6 2.8 .4 2.8 .51999 ............................................................................ 3.0 .5 2.8 .3 3.0 .4 3.7 .4
Goods-producing industries, blue-collar occupations:1995 ............................................................................ 2.5 .2 2.2 .4 1.9 .2 2.4 .51996 ............................................................................ 2.4 .4 2.7 .5 2.7 .3 2.6 .31997 ............................................................................ 2.4 .2 2.4 .2 2.7 .2 2.5 .21998 ............................................................................ 2.5 .2 2.4 .2 2.3 .3 2.6 .21999 ............................................................................ 2.7 .2 2.7 .2 2.9 .2 3.2 .2
Goods-producing industries, service occupations7:1995 ............................................................................ 3.1 2.1 3.3 1.8 1.8 1.2 2.5 .91996 ............................................................................ 1.8 .9 1.7 .9 – – – –
Construction:1995 ............................................................................ 2.1 1.0 1.5 1.0 1.4 .9 2.2 .41996 ............................................................................ 2.6 1.1 2.7 1.1 2.3 .9 2.4 1.11997 ............................................................................ 2.3 .5 2.7 .5 3.0 .5 2.6 .51998 ............................................................................ 2.7 .5 3.1 .5 2.9 .5 3.5 .41999 ............................................................................ 3.8 .4 3.2 .5 3.4 .6 3.3 .6
Manufacturing:1995 ............................................................................ 3.0 .3 2.8 .4 2.3 .3 2.6 .41996 ............................................................................ 2.5 .4 2.8 .4 3.1 .3 3.0 .41997 ............................................................................ 2.6 .2 2.6 .3 2.5 .3 2.4 .31998 ............................................................................ 2.9 .3 2.5 .3 2.7 .3 2.7 .31999 ............................................................................ 2.6 .2 2.7 .2 2.8 .2 3.4 .2
Manufacturing, white-collar occupations:1995 ............................................................................ 3.8 .7 3.3 .6 3.0 .6 2.8 .61996 ............................................................................ 2.4 .8 2.8 .6 3.2 .5 3.2 .51997 ............................................................................ 2.6 .5 2.7 .6 2.3 .6 2.3 .71998 ............................................................................ 3.2 .6 2.9 .7 3.2 .5 2.8 .51999 ............................................................................ 2.6 .4 2.8 .4 3.0 .4 3.8 .4
Manufacturing, white-collar occupations, excludingsales:
1995 ............................................................................ 4.0 .6 3.3 .5 3.1 .5 2.7 .51996 ............................................................................ 2.7 .6 3.1 .5 3.5 .4 3.3 .41997 ............................................................................ 2.5 .5 2.5 .6 2.0 .5 2.1 .61998 ............................................................................ 2.8 .5 2.6 .6 2.8 .4 2.5 .41999 ............................................................................ 2.6 .4 2.9 .3 3.0 .4 3.7 .4
Manufacturing, blue-collar occupations:1995 ............................................................................ 2.5 .3 2.3 .5 1.9 .3 2.4 .61996 ............................................................................ 2.5 .5 2.8 .6 3.1 .3 2.8 .51997 ............................................................................ 2.6 .3 2.5 .2 2.7 .3 2.4 .21998 ............................................................................ 2.5 .3 2.3 .3 2.3 .3 2.5 .21999 ............................................................................ 2.6 .2 2.6 .2 2.7 .3 3.2 .3
Manufacturing, service occupations7:1995 ............................................................................ 3.4 2.1 3.6 2.0 2.0 1.2 2.5 1.01996 ............................................................................ 1.8 .9 1.9 .9 – – – –
Manufacturing, durable goods:1995 ............................................................................ 3.3 .5 3.2 .5 2.5 .4 2.5 .5
See footnotes at end of table.
132
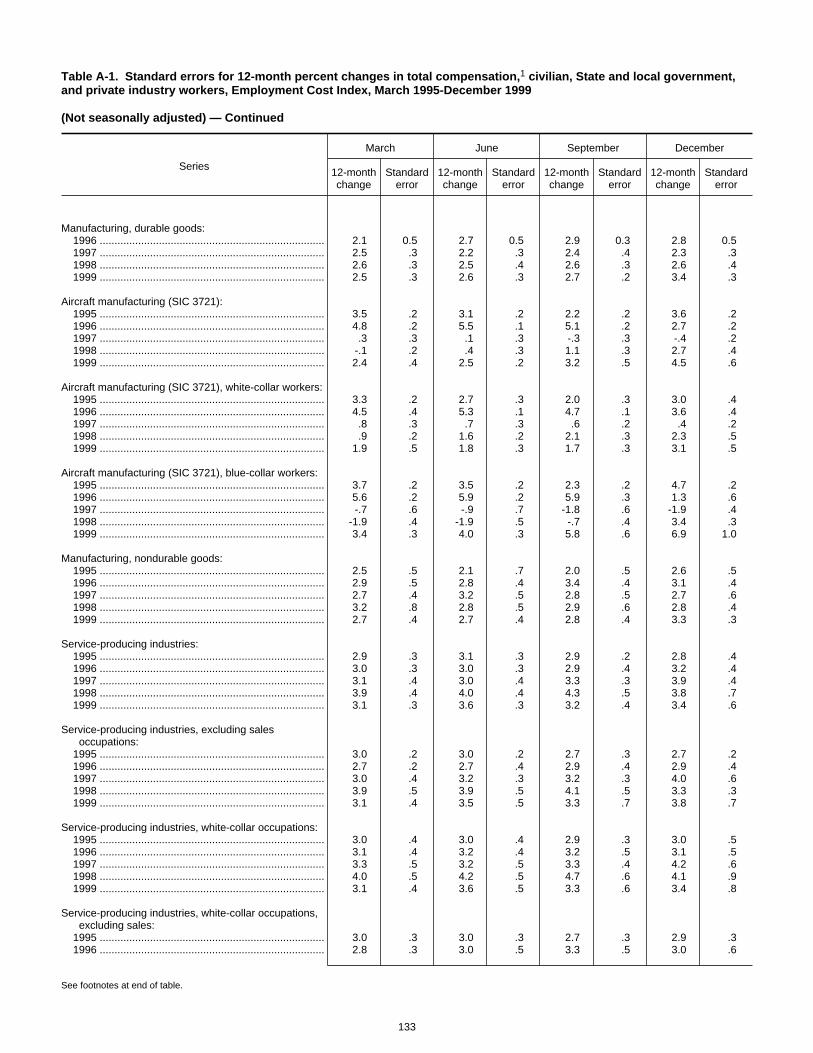
Table A-1. Standard errors for 12-month percent changes in total compensation,1 civilian, State and local government,and private industry workers, Employment Cost Index, March 1995-December 1999
(Not seasonally adjusted) — Continued
Series
March June September December
12-monthchange
Standarderror
12-monthchange
Standarderror
12-monthchange
Standarderror
12-monthchange
Standarderror
Manufacturing, durable goods:1996 ............................................................................ 2.1 0.5 2.7 0.5 2.9 0.3 2.8 0.51997 ............................................................................ 2.5 .3 2.2 .3 2.4 .4 2.3 .31998 ............................................................................ 2.6 .3 2.5 .4 2.6 .3 2.6 .41999 ............................................................................ 2.5 .3 2.6 .3 2.7 .2 3.4 .3
Aircraft manufacturing (SIC 3721):1995 ............................................................................ 3.5 .2 3.1 .2 2.2 .2 3.6 .21996 ............................................................................ 4.8 .2 5.5 .1 5.1 .2 2.7 .21997 ............................................................................ .3 .3 .1 .3 -.3 .3 -.4 .21998 ............................................................................ -.1 .2 .4 .3 1.1 .3 2.7 .41999 ............................................................................ 2.4 .4 2.5 .2 3.2 .5 4.5 .6
Aircraft manufacturing (SIC 3721), white-collar workers:1995 ............................................................................ 3.3 .2 2.7 .3 2.0 .3 3.0 .41996 ............................................................................ 4.5 .4 5.3 .1 4.7 .1 3.6 .41997 ............................................................................ .8 .3 .7 .3 .6 .2 .4 .21998 ............................................................................ .9 .2 1.6 .2 2.1 .3 2.3 .51999 ............................................................................ 1.9 .5 1.8 .3 1.7 .3 3.1 .5
Aircraft manufacturing (SIC 3721), blue-collar workers:1995 ............................................................................ 3.7 .2 3.5 .2 2.3 .2 4.7 .21996 ............................................................................ 5.6 .2 5.9 .2 5.9 .3 1.3 .61997 ............................................................................ -.7 .6 -.9 .7 -1.8 .6 -1.9 .41998 ............................................................................ -1.9 .4 -1.9 .5 -.7 .4 3.4 .31999 ............................................................................ 3.4 .3 4.0 .3 5.8 .6 6.9 1.0
Manufacturing, nondurable goods:1995 ............................................................................ 2.5 .5 2.1 .7 2.0 .5 2.6 .51996 ............................................................................ 2.9 .5 2.8 .4 3.4 .4 3.1 .41997 ............................................................................ 2.7 .4 3.2 .5 2.8 .5 2.7 .61998 ............................................................................ 3.2 .8 2.8 .5 2.9 .6 2.8 .41999 ............................................................................ 2.7 .4 2.7 .4 2.8 .4 3.3 .3
Service-producing industries:1995 ............................................................................ 2.9 .3 3.1 .3 2.9 .2 2.8 .41996 ............................................................................ 3.0 .3 3.0 .3 2.9 .4 3.2 .41997 ............................................................................ 3.1 .4 3.0 .4 3.3 .3 3.9 .41998 ............................................................................ 3.9 .4 4.0 .4 4.3 .5 3.8 .71999 ............................................................................ 3.1 .3 3.6 .3 3.2 .4 3.4 .6
Service-producing industries, excluding salesoccupations:
1995 ............................................................................ 3.0 .2 3.0 .2 2.7 .3 2.7 .21996 ............................................................................ 2.7 .2 2.7 .4 2.9 .4 2.9 .41997 ............................................................................ 3.0 .4 3.2 .3 3.2 .3 4.0 .61998 ............................................................................ 3.9 .5 3.9 .5 4.1 .5 3.3 .31999 ............................................................................ 3.1 .4 3.5 .5 3.3 .7 3.8 .7
Service-producing industries, white-collar occupations:1995 ............................................................................ 3.0 .4 3.0 .4 2.9 .3 3.0 .51996 ............................................................................ 3.1 .4 3.2 .4 3.2 .5 3.1 .51997 ............................................................................ 3.3 .5 3.2 .5 3.3 .4 4.2 .61998 ............................................................................ 4.0 .5 4.2 .5 4.7 .6 4.1 .91999 ............................................................................ 3.1 .4 3.6 .5 3.3 .6 3.4 .8
Service-producing industries, white-collar occupations,excluding sales:
1995 ............................................................................ 3.0 .3 3.0 .3 2.7 .3 2.9 .31996 ............................................................................ 2.8 .3 3.0 .5 3.3 .5 3.0 .6
See footnotes at end of table.
133
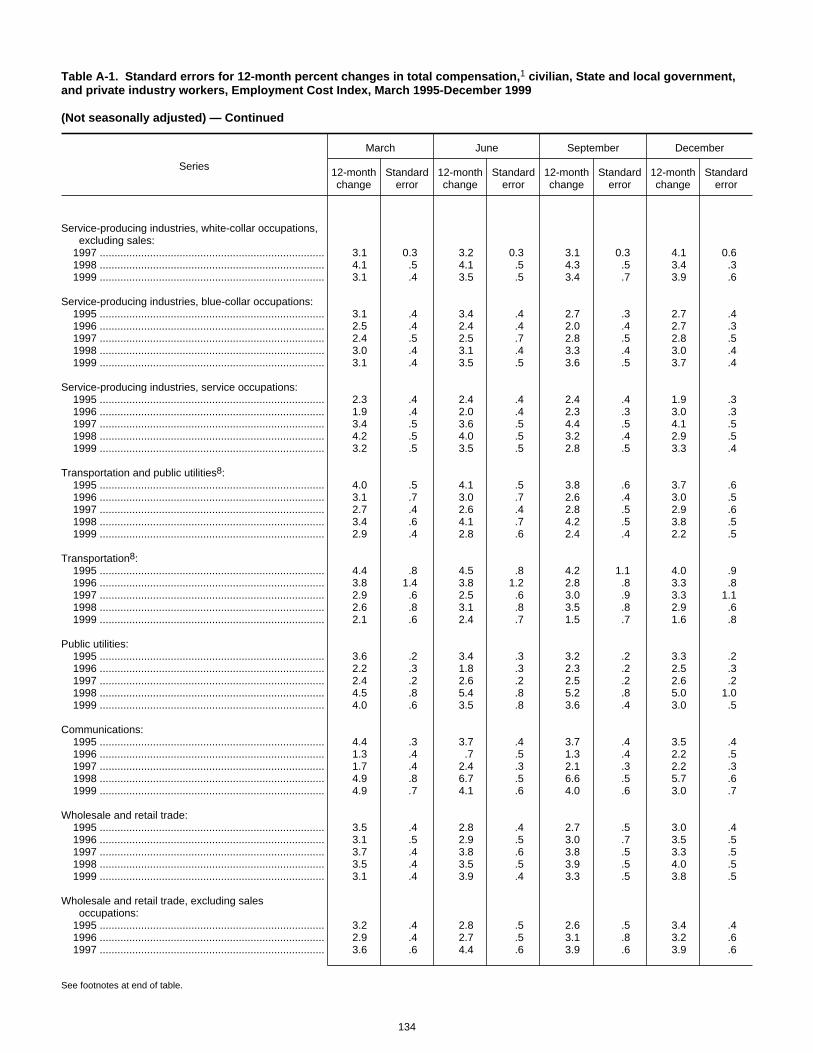
Table A-1. Standard errors for 12-month percent changes in total compensation,1 civilian, State and local government,and private industry workers, Employment Cost Index, March 1995-December 1999
(Not seasonally adjusted) — Continued
Series
March June September December
12-monthchange
Standarderror
12-monthchange
Standarderror
12-monthchange
Standarderror
12-monthchange
Standarderror
Service-producing industries, white-collar occupations,excluding sales:
1997 ............................................................................ 3.1 0.3 3.2 0.3 3.1 0.3 4.1 0.61998 ............................................................................ 4.1 .5 4.1 .5 4.3 .5 3.4 .31999 ............................................................................ 3.1 .4 3.5 .5 3.4 .7 3.9 .6
Service-producing industries, blue-collar occupations:1995 ............................................................................ 3.1 .4 3.4 .4 2.7 .3 2.7 .41996 ............................................................................ 2.5 .4 2.4 .4 2.0 .4 2.7 .31997 ............................................................................ 2.4 .5 2.5 .7 2.8 .5 2.8 .51998 ............................................................................ 3.0 .4 3.1 .4 3.3 .4 3.0 .41999 ............................................................................ 3.1 .4 3.5 .5 3.6 .5 3.7 .4
Service-producing industries, service occupations:1995 ............................................................................ 2.3 .4 2.4 .4 2.4 .4 1.9 .31996 ............................................................................ 1.9 .4 2.0 .4 2.3 .3 3.0 .31997 ............................................................................ 3.4 .5 3.6 .5 4.4 .5 4.1 .51998 ............................................................................ 4.2 .5 4.0 .5 3.2 .4 2.9 .51999 ............................................................................ 3.2 .5 3.5 .5 2.8 .5 3.3 .4
Transportation and public utilities8:1995 ............................................................................ 4.0 .5 4.1 .5 3.8 .6 3.7 .61996 ............................................................................ 3.1 .7 3.0 .7 2.6 .4 3.0 .51997 ............................................................................ 2.7 .4 2.6 .4 2.8 .5 2.9 .61998 ............................................................................ 3.4 .6 4.1 .7 4.2 .5 3.8 .51999 ............................................................................ 2.9 .4 2.8 .6 2.4 .4 2.2 .5
Transportation8:1995 ............................................................................ 4.4 .8 4.5 .8 4.2 1.1 4.0 .91996 ............................................................................ 3.8 1.4 3.8 1.2 2.8 .8 3.3 .81997 ............................................................................ 2.9 .6 2.5 .6 3.0 .9 3.3 1.11998 ............................................................................ 2.6 .8 3.1 .8 3.5 .8 2.9 .61999 ............................................................................ 2.1 .6 2.4 .7 1.5 .7 1.6 .8
Public utilities:1995 ............................................................................ 3.6 .2 3.4 .3 3.2 .2 3.3 .21996 ............................................................................ 2.2 .3 1.8 .3 2.3 .2 2.5 .31997 ............................................................................ 2.4 .2 2.6 .2 2.5 .2 2.6 .21998 ............................................................................ 4.5 .8 5.4 .8 5.2 .8 5.0 1.01999 ............................................................................ 4.0 .6 3.5 .8 3.6 .4 3.0 .5
Communications:1995 ............................................................................ 4.4 .3 3.7 .4 3.7 .4 3.5 .41996 ............................................................................ 1.3 .4 .7 .5 1.3 .4 2.2 .51997 ............................................................................ 1.7 .4 2.4 .3 2.1 .3 2.2 .31998 ............................................................................ 4.9 .8 6.7 .5 6.6 .5 5.7 .61999 ............................................................................ 4.9 .7 4.1 .6 4.0 .6 3.0 .7
Wholesale and retail trade:1995 ............................................................................ 3.5 .4 2.8 .4 2.7 .5 3.0 .41996 ............................................................................ 3.1 .5 2.9 .5 3.0 .7 3.5 .51997 ............................................................................ 3.7 .4 3.8 .6 3.8 .5 3.3 .51998 ............................................................................ 3.5 .4 3.5 .5 3.9 .5 4.0 .51999 ............................................................................ 3.1 .4 3.9 .4 3.3 .5 3.8 .5
Wholesale and retail trade, excluding salesoccupations:
1995 ............................................................................ 3.2 .4 2.8 .5 2.6 .5 3.4 .41996 ............................................................................ 2.9 .4 2.7 .5 3.1 .8 3.2 .61997 ............................................................................ 3.6 .6 4.4 .6 3.9 .6 3.9 .6
See footnotes at end of table.
134
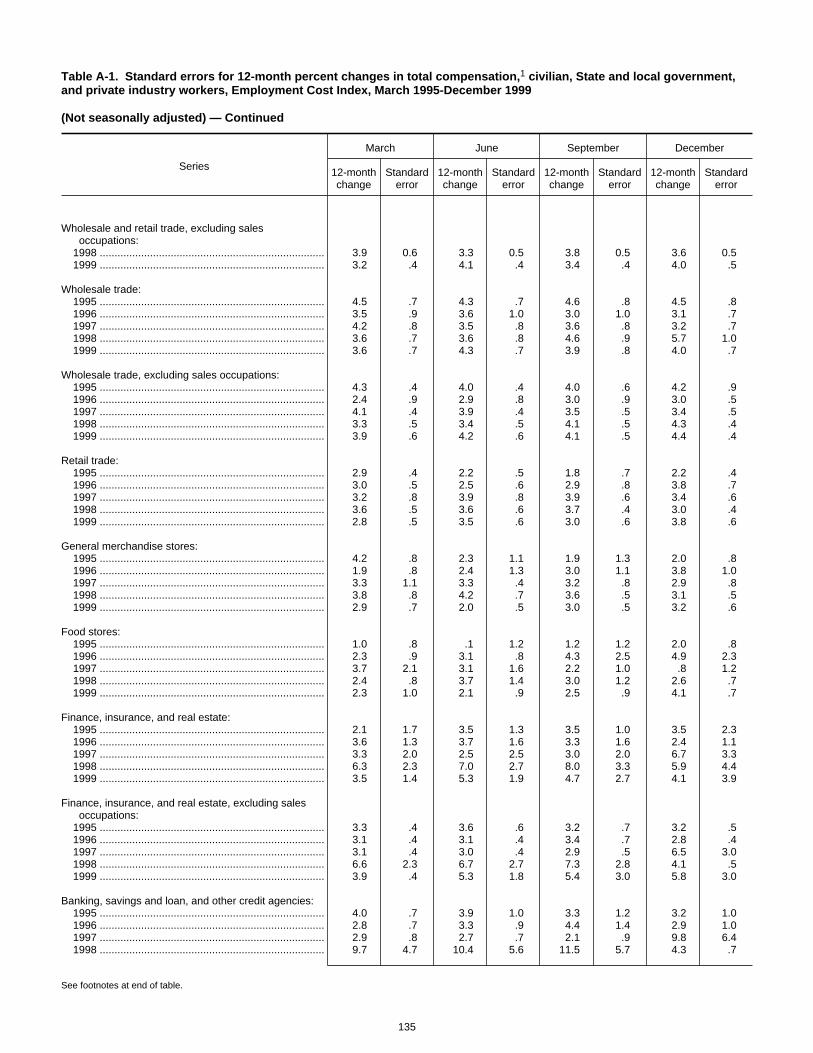
Table A-1. Standard errors for 12-month percent changes in total compensation,1 civilian, State and local government,and private industry workers, Employment Cost Index, March 1995-December 1999
(Not seasonally adjusted) — Continued
Series
March June September December
12-monthchange
Standarderror
12-monthchange
Standarderror
12-monthchange
Standarderror
12-monthchange
Standarderror
Wholesale and retail trade, excluding salesoccupations:
1998 ............................................................................ 3.9 0.6 3.3 0.5 3.8 0.5 3.6 0.51999 ............................................................................ 3.2 .4 4.1 .4 3.4 .4 4.0 .5
Wholesale trade:1995 ............................................................................ 4.5 .7 4.3 .7 4.6 .8 4.5 .81996 ............................................................................ 3.5 .9 3.6 1.0 3.0 1.0 3.1 .71997 ............................................................................ 4.2 .8 3.5 .8 3.6 .8 3.2 .71998 ............................................................................ 3.6 .7 3.6 .8 4.6 .9 5.7 1.01999 ............................................................................ 3.6 .7 4.3 .7 3.9 .8 4.0 .7
Wholesale trade, excluding sales occupations:1995 ............................................................................ 4.3 .4 4.0 .4 4.0 .6 4.2 .91996 ............................................................................ 2.4 .9 2.9 .8 3.0 .9 3.0 .51997 ............................................................................ 4.1 .4 3.9 .4 3.5 .5 3.4 .51998 ............................................................................ 3.3 .5 3.4 .5 4.1 .5 4.3 .41999 ............................................................................ 3.9 .6 4.2 .6 4.1 .5 4.4 .4
Retail trade:1995 ............................................................................ 2.9 .4 2.2 .5 1.8 .7 2.2 .41996 ............................................................................ 3.0 .5 2.5 .6 2.9 .8 3.8 .71997 ............................................................................ 3.2 .8 3.9 .8 3.9 .6 3.4 .61998 ............................................................................ 3.6 .5 3.6 .6 3.7 .4 3.0 .41999 ............................................................................ 2.8 .5 3.5 .6 3.0 .6 3.8 .6
General merchandise stores:1995 ............................................................................ 4.2 .8 2.3 1.1 1.9 1.3 2.0 .81996 ............................................................................ 1.9 .8 2.4 1.3 3.0 1.1 3.8 1.01997 ............................................................................ 3.3 1.1 3.3 .4 3.2 .8 2.9 .81998 ............................................................................ 3.8 .8 4.2 .7 3.6 .5 3.1 .51999 ............................................................................ 2.9 .7 2.0 .5 3.0 .5 3.2 .6
Food stores:1995 ............................................................................ 1.0 .8 .1 1.2 1.2 1.2 2.0 .81996 ............................................................................ 2.3 .9 3.1 .8 4.3 2.5 4.9 2.31997 ............................................................................ 3.7 2.1 3.1 1.6 2.2 1.0 .8 1.21998 ............................................................................ 2.4 .8 3.7 1.4 3.0 1.2 2.6 .71999 ............................................................................ 2.3 1.0 2.1 .9 2.5 .9 4.1 .7
Finance, insurance, and real estate:1995 ............................................................................ 2.1 1.7 3.5 1.3 3.5 1.0 3.5 2.31996 ............................................................................ 3.6 1.3 3.7 1.6 3.3 1.6 2.4 1.11997 ............................................................................ 3.3 2.0 2.5 2.5 3.0 2.0 6.7 3.31998 ............................................................................ 6.3 2.3 7.0 2.7 8.0 3.3 5.9 4.41999 ............................................................................ 3.5 1.4 5.3 1.9 4.7 2.7 4.1 3.9
Finance, insurance, and real estate, excluding salesoccupations:
1995 ............................................................................ 3.3 .4 3.6 .6 3.2 .7 3.2 .51996 ............................................................................ 3.1 .4 3.1 .4 3.4 .7 2.8 .41997 ............................................................................ 3.1 .4 3.0 .4 2.9 .5 6.5 3.01998 ............................................................................ 6.6 2.3 6.7 2.7 7.3 2.8 4.1 .51999 ............................................................................ 3.9 .4 5.3 1.8 5.4 3.0 5.8 3.0
Banking, savings and loan, and other credit agencies:1995 ............................................................................ 4.0 .7 3.9 1.0 3.3 1.2 3.2 1.01996 ............................................................................ 2.8 .7 3.3 .9 4.4 1.4 2.9 1.01997 ............................................................................ 2.9 .8 2.7 .7 2.1 .9 9.8 6.41998 ............................................................................ 9.7 4.7 10.4 5.6 11.5 5.7 4.3 .7
See footnotes at end of table.
135

Table A-1. Standard errors for 12-month percent changes in total compensation,1 civilian, State and local government,and private industry workers, Employment Cost Index, March 1995-December 1999
(Not seasonally adjusted) — Continued
Series
March June September December
12-monthchange
Standarderror
12-monthchange
Standarderror
12-monthchange
Standarderror
12-monthchange
Standarderror
Banking, savings and loan, and other credit agencies:1999 ............................................................................ 3.8 0.5 7.0 3.7 7.3 6.3 8.9 6.1
Insurance:1995 ............................................................................ 3.0 .5 3.4 .5 2.8 .8 2.9 .91996 ............................................................................ 3.3 .8 2.9 .7 3.5 .7 2.9 .71997 ............................................................................ 3.4 .8 3.0 .7 2.9 .7 4.0 .81998 ............................................................................ 4.2 2.2 5.1 2.9 6.6 4.9 5.1 3.61999 ............................................................................ 3.1 1.2 3.7 1.3 1.8 2.4 2.9 1.3
Insurance, excluding sales occupations:1995 ............................................................................ 2.6 .3 3.2 .5 2.9 .6 2.9 .41996 ............................................................................ 3.5 .6 2.9 .4 2.9 .4 2.5 .51997 ............................................................................ 3.0 .4 2.9 .4 3.0 .4 3.8 .51998 ............................................................................ 2.9 .4 3.1 .5 3.1 .6 2.8 .61999 ............................................................................ 3.2 .6 3.2 .5 3.2 .4 3.2 .4
Services industries:1995 ............................................................................ 2.5 .2 2.6 .2 2.4 .2 2.2 .31996 ............................................................................ 2.5 .3 2.7 .6 2.9 .6 3.1 .51997 ............................................................................ 3.0 .5 3.0 .3 3.2 .4 3.8 .41998 ............................................................................ 3.5 .4 3.4 .3 3.5 .4 3.0 .31999 ............................................................................ 3.0 .5 3.1 .5 3.0 .6 3.4 .6
Business services:1995 ............................................................................ 2.6 .8 2.6 .6 2.7 .4 2.7 .51996 ............................................................................ 3.5 .5 3.1 .9 3.6 .9 4.4 .71997 ............................................................................ 3.4 .7 3.9 .4 4.7 .8 5.2 .91998 ............................................................................ 4.7 .7 4.8 .7 5.3 .7 5.3 .81999 ............................................................................ 5.7 .9 5.7 1.4 5.0 1.3 4.1 .8
Health services:1995 ............................................................................ 2.4 .3 2.5 .2 2.7 .2 2.7 .31996 ............................................................................ 2.2 .3 2.5 .3 2.2 .3 1.7 .31997 ............................................................................ 2.2 .5 1.8 .5 2.1 .4 2.7 .51998 ............................................................................ 2.0 .3 2.1 .5 1.5 1.0 .7 1.21999 ............................................................................ 1.7 1.1 1.9 1.0 2.6 .8 3.7 .8
Hospitals:1995 ............................................................................ 1.7 .3 2.0 .3 2.0 .2 2.1 .31996 ............................................................................ 2.6 .3 2.4 .3 2.4 .2 1.8 .21997 ............................................................................ 1.4 .3 1.2 .2 1.5 .2 2.1 .31998 ............................................................................ 2.0 .3 2.8 .3 2.7 .3 2.5 .31999 ............................................................................ 3.3 .3 2.8 .3 2.8 .3 3.4 .4
Nursing homes:1995 ............................................................................ 3.1 .3 3.0 .4 2.9 .3 3.4 .31996 ............................................................................ 2.7 .4 3.1 .5 2.8 .4 2.6 .51997 ............................................................................ 2.8 .5 2.3 .4 2.7 .5 2.6 .41998 ............................................................................ 2.7 .4 3.0 .5 3.3 .4 3.2 .41999 ............................................................................ 3.6 .4 3.8 .3 3.7 .3 4.2 .3
Educational services:1995 ............................................................................ 3.5 .5 3.9 .3 3.9 .4 4.1 .41996 ............................................................................ 4.3 .4 3.5 .3 3.2 .3 3.2 .51997 ............................................................................ 3.1 .4 3.0 .4 3.0 .3 3.3 .31998 ............................................................................ 3.5 .4 3.7 .4 3.8 .3 3.6 .31999 ............................................................................ 3.4 .3 3.3 .3 3.5 .3 3.6 .4
See footnotes at end of table.
136

Table A-1. Standard errors for 12-month percent changes in total compensation,1 civilian, State and local government,and private industry workers, Employment Cost Index, March 1995-December 1999
(Not seasonally adjusted) — Continued
Series
March June September December
12-monthchange
Standarderror
12-monthchange
Standarderror
12-monthchange
Standarderror
12-monthchange
Standarderror
Colleges and universities:1995 ............................................................................ 2.9 0.4 4.2 0.4 4.7 0.3 5.0 0.41996 ............................................................................ 5.1 .4 3.7 .3 3.0 .3 2.9 .31997 ............................................................................ 2.6 .3 2.7 .4 2.8 .2 3.3 .31998 ............................................................................ 3.4 .3 3.5 .3 3.7 .3 3.3 .31999 ............................................................................ 3.4 .2 3.3 .2 3.2 .3 3.2 .3
Nonmanufacturing:1995 ............................................................................ 2.8 .3 2.8 .3 2.6 .2 2.7 .41996 ............................................................................ 2.8 .2 2.9 .3 2.9 .3 3.1 .31997 ............................................................................ 3.1 .3 3.0 .4 3.3 .3 3.8 .41998 ............................................................................ 3.7 .3 3.9 .4 4.2 .4 3.7 .61999 ............................................................................ 3.2 .3 3.5 .3 3.2 .4 3.4 .6
Nonmanufacturing, white-collar occupations:1995 ............................................................................ 3.0 .4 2.9 .4 2.8 .3 2.8 .51996 ............................................................................ 3.0 .3 3.1 .5 3.2 .5 3.2 .51997 ............................................................................ 3.3 .5 3.2 .5 3.4 .4 4.1 .61998 ............................................................................ 3.9 .5 4.2 .5 4.6 .6 4.0 .81999 ............................................................................ 3.2 .4 3.5 .5 3.2 .6 3.5 .8
Nonmanufacturing, white-collar occupations, excludingsales:
1995 ............................................................................ 2.9 .3 2.8 .3 2.6 .3 2.8 .31996 ............................................................................ 2.8 .3 2.9 .5 3.2 .5 3.0 .61997 ............................................................................ 3.1 .3 3.3 .2 3.1 .3 4.1 .61998 ............................................................................ 4.0 .5 4.0 .5 4.3 .5 3.5 .31999 ............................................................................ 3.2 .4 3.4 .5 3.4 .7 3.8 .6
Nonmanufacturing, blue-collar occupations:1995 ............................................................................ 2.8 .3 2.9 .3 2.5 .3 2.7 .31996 ............................................................................ 2.6 .3 2.5 .3 1.9 .3 2.4 .31997 ............................................................................ 2.3 .4 2.4 .4 2.8 .3 2.7 .31998 ............................................................................ 2.7 .4 3.0 .3 3.1 .3 3.0 .31999 ............................................................................ 3.2 .3 3.3 .4 3.4 .4 3.5 .3
Nonmanufacturing, service occupations:1995 ............................................................................ 2.3 .4 2.3 .4 2.4 .4 1.9 .31996 ............................................................................ 1.9 .4 2.0 .3 2.3 .4 3.1 .41997 ............................................................................ 3.3 .5 3.6 .5 4.5 .5 4.0 .51998 ............................................................................ 4.3 .5 4.0 .5 3.2 .4 2.9 .51999 ............................................................................ 3.2 .5 3.5 .5 2.8 .5 3.3 .4
Union workers:1995 ............................................................................ 2.6 .3 2.3 .3 2.4 .4 2.8 .31996 ............................................................................ 2.7 .4 3.1 .5 2.6 .5 2.4 .61997 ............................................................................ 1.9 .6 1.6 .4 2.4 .3 2.1 .31998 ............................................................................ 2.3 .4 2.7 .3 2.7 .3 3.0 .31999 ............................................................................ 3.0 .4 2.7 .5 2.5 .3 2.7 .3
Union workers, goods-producing industries3:1995 ............................................................................ 2.2 .3 1.7 .4 1.8 .5 2.2 .51996 ............................................................................ 2.2 .5 2.5 .4 2.0 .4 1.8 .41997 ............................................................................ 1.6 .4 1.7 .5 2.4 .4 2.1 .31998 ............................................................................ 2.1 .3 2.4 .3 2.5 .3 3.0 .41999 ............................................................................ 3.1 .3 2.9 .3 2.7 .3 3.2 .3
Union workers, service-producing industries:1995 ............................................................................ 3.1 .5 3.1 .6 3.2 .9 3.5 .51996 ............................................................................ 3.4 .6 3.7 1.4 3.3 1.2 3.0 1.5
See footnotes at end of table.
137

Table A-1. Standard errors for 12-month percent changes in total compensation,1 civilian, State and local government,and private industry workers, Employment Cost Index, March 1995-December 1999
(Not seasonally adjusted) — Continued
Series
March June September December
12-monthchange
Standarderror
12-monthchange
Standarderror
12-monthchange
Standarderror
12-monthchange
Standarderror
Union workers, service-producing industries:1997 ............................................................................ 2.2 1.2 1.6 0.5 2.3 0.4 2.1 0.41998 ............................................................................ 2.6 .7 2.9 .5 3.0 .4 3.0 .41999 ............................................................................ 2.9 .7 2.6 .9 2.2 .5 2.1 .6
Union workers, manufacturing:1995 ............................................................................ 2.2 .4 1.4 .4 1.4 .4 1.8 .51996 ............................................................................ 2.0 .6 2.5 .5 2.1 .5 2.0 .51997 ............................................................................ 1.6 .5 1.5 .6 2.5 .5 2.1 .41998 ............................................................................ 2.1 .4 2.2 .3 2.3 .3 2.7 .31999 ............................................................................ 2.5 .3 2.6 .4 2.3 .3 3.0 .3
Union workers, nonmanufacturing:1995 ............................................................................ 2.9 .4 2.9 .5 2.9 .7 3.3 .41996 ............................................................................ 3.2 .4 3.4 1.0 2.9 .9 2.6 1.11997 ............................................................................ 2.0 .9 1.8 .4 2.3 .3 2.1 .41998 ............................................................................ 2.5 .6 2.9 .4 3.0 .3 3.2 .31999 ............................................................................ 3.1 .5 2.9 .8 2.5 .5 2.5 .5
Nonunion workers:1995 ............................................................................ 3.0 .3 2.9 .3 2.7 .2 2.7 .31996 ............................................................................ 2.7 .4 2.8 .3 2.9 .3 3.1 .31997 ............................................................................ 3.2 .2 3.2 .3 3.2 .3 3.8 .31998 ............................................................................ 3.7 .3 3.8 .3 4.0 .3 3.5 .41999 ............................................................................ 3.0 .3 3.4 .3 3.2 .4 3.6 .5
Nonunion workers, goods-producing industries3:1995 ............................................................................ 3.0 .5 2.7 .4 2.3 .4 2.5 .41996 ............................................................................ 2.5 .4 2.8 .4 3.2 .3 3.2 .41997 ............................................................................ 2.9 .2 2.9 .3 2.8 .3 2.6 .31998 ............................................................................ 3.0 .4 2.8 .4 2.8 .3 2.7 .31999 ............................................................................ 2.8 .3 2.6 .2 3.0 .3 3.5 .2
Nonunion workers, service-producing industries:1995 ............................................................................ 2.9 .4 3.1 .3 2.8 .2 2.7 .41996 ............................................................................ 2.8 .3 2.8 .4 2.9 .4 3.1 .31997 ............................................................................ 3.3 .3 3.3 .4 3.5 .4 4.2 .41998 ............................................................................ 4.0 .4 4.2 .4 4.5 .4 3.9 .61999 ............................................................................ 3.2 .4 3.6 .5 3.4 .6 3.6 .7
Nonunion workers, manufacturing:1995 ............................................................................ 3.4 .4 3.3 .4 2.7 .3 2.8 .51996 ............................................................................ 2.5 .5 2.8 .4 3.5 .3 3.3 .41997 ............................................................................ 2.9 .3 3.0 .3 2.6 .4 2.6 .41998 ............................................................................ 3.1 .4 2.7 .4 2.8 .4 2.6 .31999 ............................................................................ 2.6 .3 2.7 .3 3.0 .2 3.5 .3
Nonunion workers, nonmanufacturing:1995 ............................................................................ 2.8 .3 2.8 .3 2.5 .2 2.6 .41996 ............................................................................ 2.8 .3 2.8 .4 2.9 .4 3.1 .31997 ............................................................................ 3.2 .3 3.3 .3 3.5 .4 4.1 .41998 ............................................................................ 4.0 .4 4.0 .4 4.3 .4 3.8 .51999 ............................................................................ 3.2 .4 3.6 .4 3.4 .5 3.6 .6
Northeast9:1995 ............................................................................ 3.3 .4 3.1 .5 2.7 .4 2.8 .41996 ............................................................................ 2.6 .5 2.4 .6 2.5 .7 2.6 .41997 ............................................................................ 2.6 .4 2.6 .3 2.6 .3 3.0 .31998 ............................................................................ 2.9 .3 2.9 .3 3.5 .3 3.3 .41999 ............................................................................ 3.3 .3 3.3 .3 3.2 .2 3.4 .3
See footnotes at end of table.
138
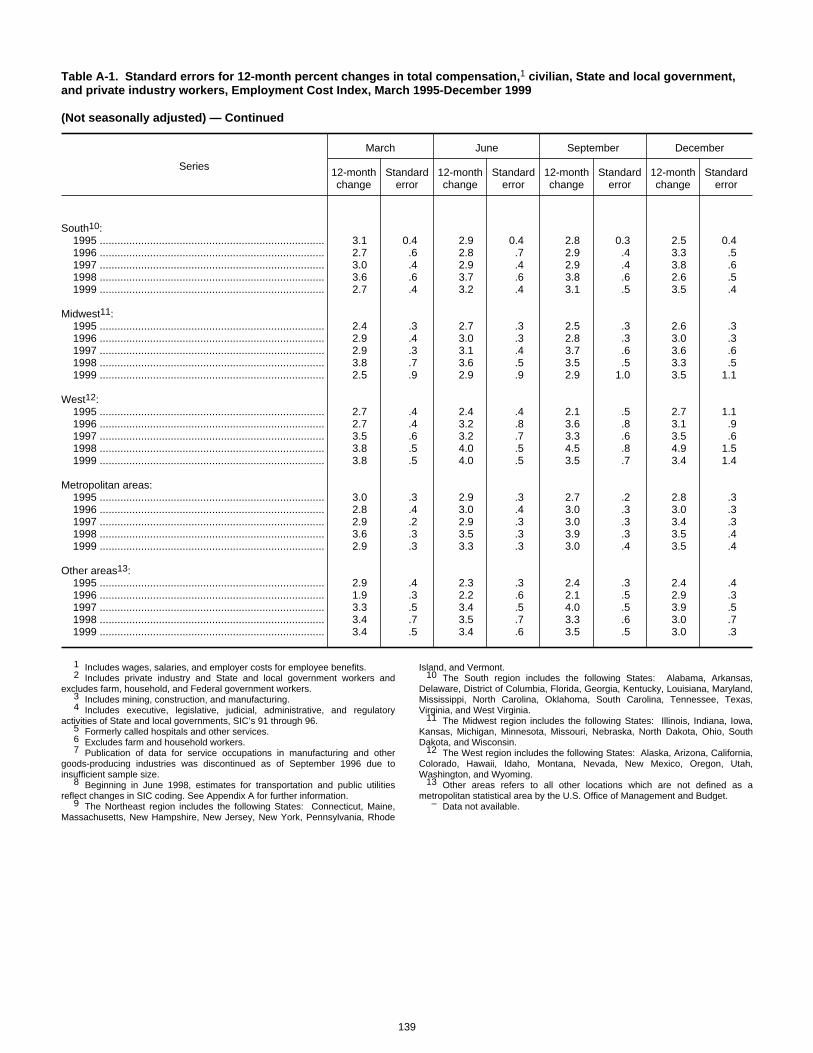
Table A-1. Standard errors for 12-month percent changes in total compensation,1 civilian, State and local government,and private industry workers, Employment Cost Index, March 1995-December 1999
(Not seasonally adjusted) — Continued
Series
March June September December
12-monthchange
Standarderror
12-monthchange
Standarderror
12-monthchange
Standarderror
12-monthchange
Standarderror
South10:1995 ............................................................................ 3.1 0.4 2.9 0.4 2.8 0.3 2.5 0.41996 ............................................................................ 2.7 .6 2.8 .7 2.9 .4 3.3 .51997 ............................................................................ 3.0 .4 2.9 .4 2.9 .4 3.8 .61998 ............................................................................ 3.6 .6 3.7 .6 3.8 .6 2.6 .51999 ............................................................................ 2.7 .4 3.2 .4 3.1 .5 3.5 .4
Midwest11:1995 ............................................................................ 2.4 .3 2.7 .3 2.5 .3 2.6 .31996 ............................................................................ 2.9 .4 3.0 .3 2.8 .3 3.0 .31997 ............................................................................ 2.9 .3 3.1 .4 3.7 .6 3.6 .61998 ............................................................................ 3.8 .7 3.6 .5 3.5 .5 3.3 .51999 ............................................................................ 2.5 .9 2.9 .9 2.9 1.0 3.5 1.1
West12:1995 ............................................................................ 2.7 .4 2.4 .4 2.1 .5 2.7 1.11996 ............................................................................ 2.7 .4 3.2 .8 3.6 .8 3.1 .91997 ............................................................................ 3.5 .6 3.2 .7 3.3 .6 3.5 .61998 ............................................................................ 3.8 .5 4.0 .5 4.5 .8 4.9 1.51999 ............................................................................ 3.8 .5 4.0 .5 3.5 .7 3.4 1.4
Metropolitan areas:1995 ............................................................................ 3.0 .3 2.9 .3 2.7 .2 2.8 .31996 ............................................................................ 2.8 .4 3.0 .4 3.0 .3 3.0 .31997 ............................................................................ 2.9 .2 2.9 .3 3.0 .3 3.4 .31998 ............................................................................ 3.6 .3 3.5 .3 3.9 .3 3.5 .41999 ............................................................................ 2.9 .3 3.3 .3 3.0 .4 3.5 .4
Other areas13:1995 ............................................................................ 2.9 .4 2.3 .3 2.4 .3 2.4 .41996 ............................................................................ 1.9 .3 2.2 .6 2.1 .5 2.9 .31997 ............................................................................ 3.3 .5 3.4 .5 4.0 .5 3.9 .51998 ............................................................................ 3.4 .7 3.5 .7 3.3 .6 3.0 .71999 ............................................................................ 3.4 .5 3.4 .6 3.5 .5 3.0 .3
1 Includes wages, salaries, and employer costs for employee benefits.2 Includes private industry and State and local government workers and
excludes farm, household, and Federal government workers.3 Includes mining, construction, and manufacturing.4 Includes executive, legislative, judicial, administrative, and regulatory
activities of State and local governments, SIC’s 91 through 96.5 Formerly called hospitals and other services.6 Excludes farm and household workers.7 Publication of data for service occupations in manufacturing and other
goods-producing industries was discontinued as of September 1996 due toinsufficient sample size.
8 Beginning in June 1998, estimates for transportation and public utilitiesreflect changes in SIC coding. See Appendix A for further information.
9 The Northeast region includes the following States: Connecticut, Maine,Massachusetts, New Hampshire, New Jersey, New York, Pennsylvania, Rhode
Island, and Vermont.10 The South region includes the following States: Alabama, Arkansas,
Delaware, District of Columbia, Florida, Georgia, Kentucky, Louisiana, Maryland,Mississippi, North Carolina, Oklahoma, South Carolina, Tennessee, Texas,Virginia, and West Virginia.
11 The Midwest region includes the following States: Illinois, Indiana, Iowa,Kansas, Michigan, Minnesota, Missouri, Nebraska, North Dakota, Ohio, SouthDakota, and Wisconsin.
12 The West region includes the following States: Alaska, Arizona, California,Colorado, Hawaii, Idaho, Montana, Nevada, New Mexico, Oregon, Utah,Washington, and Wyoming.
13 Other areas refers to all other locations which are not defined as ametropolitan statistical area by the U.S. Office of Management and Budget.
– Data not available.
139
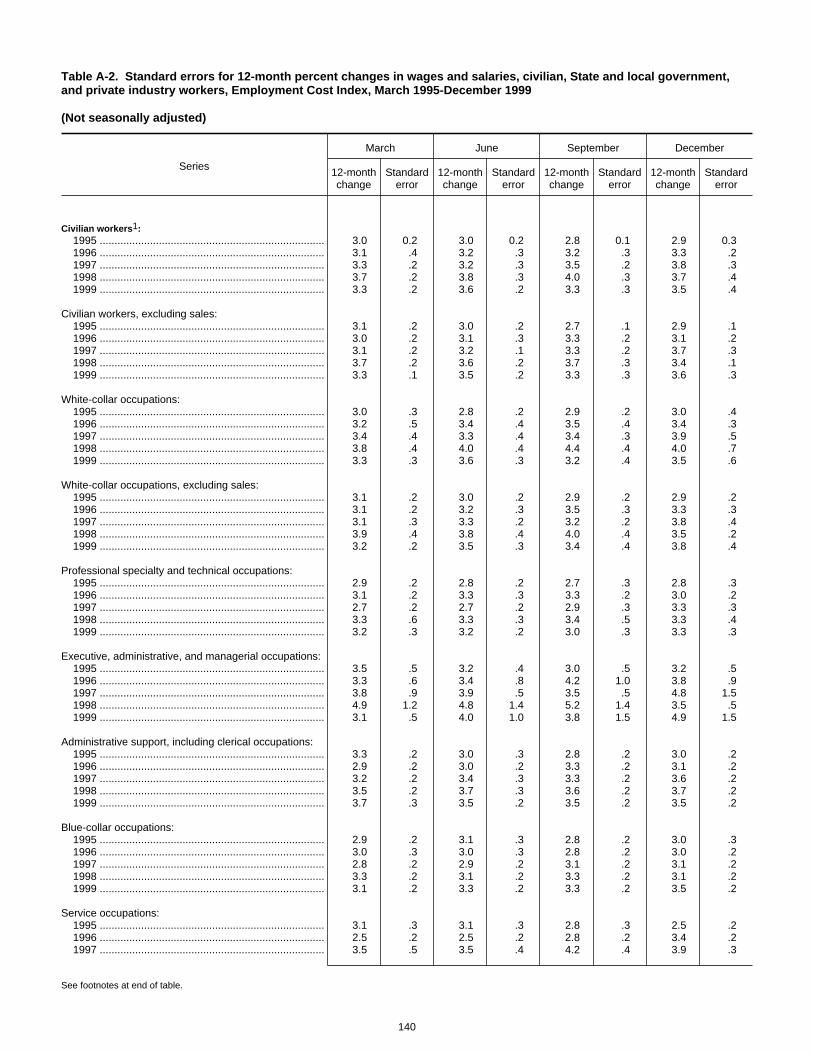
Table A-2. Standard errors for 12-month percent changes in wages and salaries, civilian, State and local government,and private industry workers, Employment Cost Index, March 1995-December 1999
(Not seasonally adjusted)
Series
March June September December
12-monthchange
Standarderror
12-monthchange
Standarderror
12-monthchange
Standarderror
12-monthchange
Standarderror
Civilian workers1:1995 ............................................................................ 3.0 0.2 3.0 0.2 2.8 0.1 2.9 0.31996 ............................................................................ 3.1 .4 3.2 .3 3.2 .3 3.3 .21997 ............................................................................ 3.3 .2 3.2 .3 3.5 .2 3.8 .31998 ............................................................................ 3.7 .2 3.8 .3 4.0 .3 3.7 .41999 ............................................................................ 3.3 .2 3.6 .2 3.3 .3 3.5 .4
Civilian workers, excluding sales:1995 ............................................................................ 3.1 .2 3.0 .2 2.7 .1 2.9 .11996 ............................................................................ 3.0 .2 3.1 .3 3.3 .2 3.1 .21997 ............................................................................ 3.1 .2 3.2 .1 3.3 .2 3.7 .31998 ............................................................................ 3.7 .2 3.6 .2 3.7 .3 3.4 .11999 ............................................................................ 3.3 .1 3.5 .2 3.3 .3 3.6 .3
White-collar occupations:1995 ............................................................................ 3.0 .3 2.8 .2 2.9 .2 3.0 .41996 ............................................................................ 3.2 .5 3.4 .4 3.5 .4 3.4 .31997 ............................................................................ 3.4 .4 3.3 .4 3.4 .3 3.9 .51998 ............................................................................ 3.8 .4 4.0 .4 4.4 .4 4.0 .71999 ............................................................................ 3.3 .3 3.6 .3 3.2 .4 3.5 .6
White-collar occupations, excluding sales:1995 ............................................................................ 3.1 .2 3.0 .2 2.9 .2 2.9 .21996 ............................................................................ 3.1 .2 3.2 .3 3.5 .3 3.3 .31997 ............................................................................ 3.1 .3 3.3 .2 3.2 .2 3.8 .41998 ............................................................................ 3.9 .4 3.8 .4 4.0 .4 3.5 .21999 ............................................................................ 3.2 .2 3.5 .3 3.4 .4 3.8 .4
Professional specialty and technical occupations:1995 ............................................................................ 2.9 .2 2.8 .2 2.7 .3 2.8 .31996 ............................................................................ 3.1 .2 3.3 .3 3.3 .2 3.0 .21997 ............................................................................ 2.7 .2 2.7 .2 2.9 .3 3.3 .31998 ............................................................................ 3.3 .6 3.3 .3 3.4 .5 3.3 .41999 ............................................................................ 3.2 .3 3.2 .2 3.0 .3 3.3 .3
Executive, administrative, and managerial occupations:1995 ............................................................................ 3.5 .5 3.2 .4 3.0 .5 3.2 .51996 ............................................................................ 3.3 .6 3.4 .8 4.2 1.0 3.8 .91997 ............................................................................ 3.8 .9 3.9 .5 3.5 .5 4.8 1.51998 ............................................................................ 4.9 1.2 4.8 1.4 5.2 1.4 3.5 .51999 ............................................................................ 3.1 .5 4.0 1.0 3.8 1.5 4.9 1.5
Administrative support, including clerical occupations:1995 ............................................................................ 3.3 .2 3.0 .3 2.8 .2 3.0 .21996 ............................................................................ 2.9 .2 3.0 .2 3.3 .2 3.1 .21997 ............................................................................ 3.2 .2 3.4 .3 3.3 .2 3.6 .21998 ............................................................................ 3.5 .2 3.7 .3 3.6 .2 3.7 .21999 ............................................................................ 3.7 .3 3.5 .2 3.5 .2 3.5 .2
Blue-collar occupations:1995 ............................................................................ 2.9 .2 3.1 .3 2.8 .2 3.0 .31996 ............................................................................ 3.0 .3 3.0 .3 2.8 .2 3.0 .21997 ............................................................................ 2.8 .2 2.9 .2 3.1 .2 3.1 .21998 ............................................................................ 3.3 .2 3.1 .2 3.3 .2 3.1 .21999 ............................................................................ 3.1 .2 3.3 .2 3.3 .2 3.5 .2
Service occupations:1995 ............................................................................ 3.1 .3 3.1 .3 2.8 .3 2.5 .21996 ............................................................................ 2.5 .2 2.5 .2 2.8 .2 3.4 .21997 ............................................................................ 3.5 .5 3.5 .4 4.2 .4 3.9 .3
See footnotes at end of table.
140

Table A-2. Standard errors for 12-month percent changes in wages and salaries, civilian, State and local government,and private industry workers, Employment Cost Index, March 1995-December 1999
(Not seasonally adjusted) — Continued
Series
March June September December
12-monthchange
Standarderror
12-monthchange
Standarderror
12-monthchange
Standarderror
12-monthchange
Standarderror
Service occupations:1998 ............................................................................ 4.0 0.4 4.0 0.7 3.5 0.4 3.3 0.41999 ............................................................................ 3.4 .3 3.6 .3 2.9 .4 3.4 .4
Goods-producing industries2:1995 ............................................................................ 3.0 .3 2.9 .3 2.6 .2 2.8 .41996 ............................................................................ 2.8 .4 3.0 .4 3.3 .3 3.2 .21997 ............................................................................ 3.0 .2 3.0 .3 3.0 .2 3.0 .21998 ............................................................................ 3.4 .2 3.4 .2 3.5 .2 3.5 .31999 ............................................................................ 3.3 .2 3.1 .1 3.1 .2 3.3 .2
Manufacturing:1995 ............................................................................ 3.3 .3 3.3 .4 2.9 .3 2.9 .41996 ............................................................................ 2.9 .5 2.9 .4 3.4 .4 3.3 .31997 ............................................................................ 3.0 .3 3.0 .4 2.8 .3 3.0 .31998 ............................................................................ 3.6 .3 3.3 .3 3.6 .2 3.5 .31999 ............................................................................ 3.1 .2 3.3 .2 3.1 .2 3.4 .2
Service-producing industries:1995 ............................................................................ 3.0 .3 3.0 .3 2.9 .2 3.0 .41996 ............................................................................ 3.2 .3 3.3 .3 3.2 .3 3.4 .31997 ............................................................................ 3.3 .3 3.2 .3 3.5 .3 4.0 .41998 ............................................................................ 3.9 .3 3.9 .4 4.2 .4 3.8 .61999 ............................................................................ 3.3 .2 3.7 .3 3.3 .4 3.5 .6
Services industries:1995 ............................................................................ 2.9 .2 2.9 .2 2.8 .2 2.8 .21996 ............................................................................ 2.9 .2 3.3 .4 3.2 .4 3.3 .41997 ............................................................................ 3.1 .4 3.1 .2 3.5 .3 3.7 .31998 ............................................................................ 3.7 .3 3.5 .3 3.6 .3 3.3 .21999 ............................................................................ 3.4 .2 3.4 .2 3.2 .3 3.6 .2
Health services:1995 ............................................................................ 2.7 .3 2.6 .2 2.5 .2 2.4 .21996 ............................................................................ 2.5 .2 2.7 .2 2.6 .2 2.3 .21997 ............................................................................ 2.4 .5 2.4 .5 2.7 .5 3.0 .51998 ............................................................................ 2.9 .3 2.6 .3 2.5 .4 1.6 .81999 ............................................................................ 1.9 .7 2.3 .5 2.4 .6 3.6 .6
Hospitals:1995 ............................................................................ 2.5 .2 2.4 .2 2.3 .1 2.3 .21996 ............................................................................ 2.5 .2 2.5 .2 2.5 .2 2.1 .21997 ............................................................................ 1.9 .2 1.8 .2 1.9 .2 2.4 .21998 ............................................................................ 2.4 .2 2.7 .2 2.9 .2 2.6 .21999 ............................................................................ 2.9 .3 2.7 .3 2.7 .3 3.3 .3
Educational services:1995 ............................................................................ 3.3 .2 3.1 .2 3.2 .3 3.4 .41996 ............................................................................ 3.0 .3 3.2 .3 3.0 .3 3.0 .21997 ............................................................................ 2.9 .2 2.7 .2 2.8 .1 2.7 .11998 ............................................................................ 2.9 .1 2.9 .1 2.8 .2 3.0 .21999 ............................................................................ 2.9 .2 3.0 .2 3.3 .2 3.4 .2
Public administration3:1995 ............................................................................ 3.4 .3 3.2 .3 2.8 .2 2.9 .31996 ............................................................................ 2.5 .3 2.5 .2 2.8 .2 2.9 .21997 ............................................................................ 3.2 .3 3.0 .3 2.9 .3 2.9 .21998 ............................................................................ 2.9 .3 3.3 .2 3.5 .3 3.4 .31999 ............................................................................ 3.2 .4 3.5 .3 3.5 .7 4.1 .7
See footnotes at end of table.
141
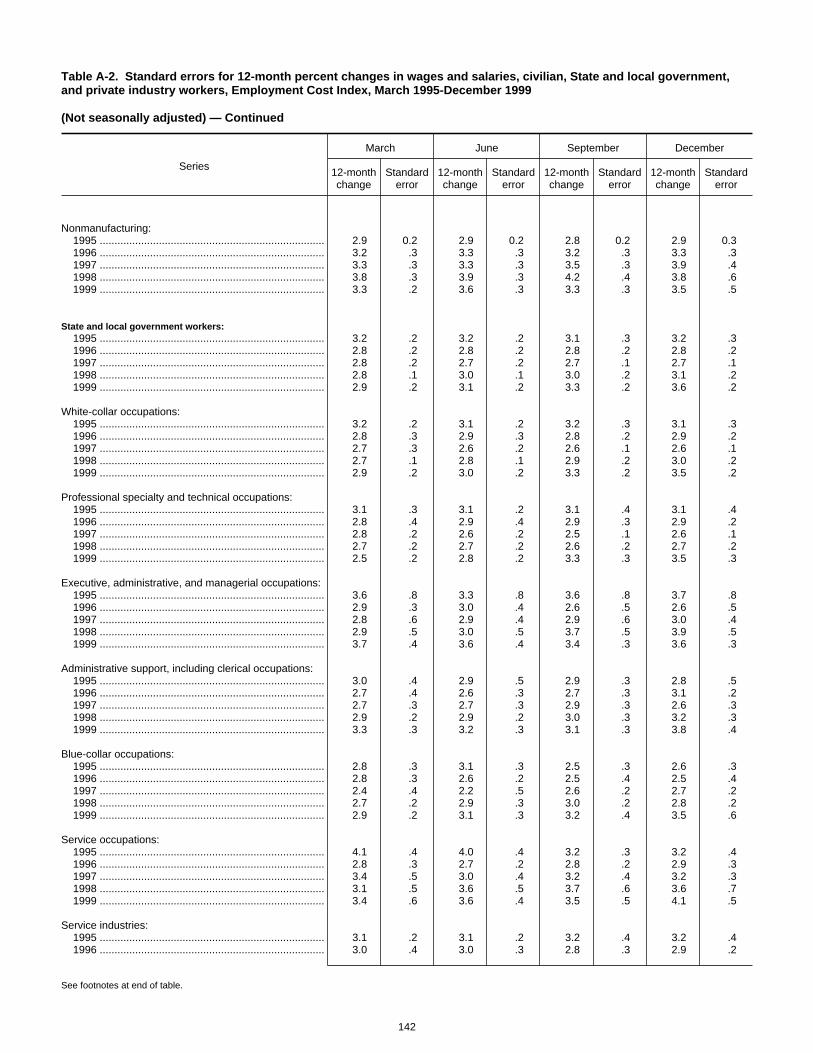
Table A-2. Standard errors for 12-month percent changes in wages and salaries, civilian, State and local government,and private industry workers, Employment Cost Index, March 1995-December 1999
(Not seasonally adjusted) — Continued
Series
March June September December
12-monthchange
Standarderror
12-monthchange
Standarderror
12-monthchange
Standarderror
12-monthchange
Standarderror
Nonmanufacturing:1995 ............................................................................ 2.9 0.2 2.9 0.2 2.8 0.2 2.9 0.31996 ............................................................................ 3.2 .3 3.3 .3 3.2 .3 3.3 .31997 ............................................................................ 3.3 .3 3.3 .3 3.5 .3 3.9 .41998 ............................................................................ 3.8 .3 3.9 .3 4.2 .4 3.8 .61999 ............................................................................ 3.3 .2 3.6 .3 3.3 .3 3.5 .5
State and local government workers:1995 ............................................................................ 3.2 .2 3.2 .2 3.1 .3 3.2 .31996 ............................................................................ 2.8 .2 2.8 .2 2.8 .2 2.8 .21997 ............................................................................ 2.8 .2 2.7 .2 2.7 .1 2.7 .11998 ............................................................................ 2.8 .1 3.0 .1 3.0 .2 3.1 .21999 ............................................................................ 2.9 .2 3.1 .2 3.3 .2 3.6 .2
White-collar occupations:1995 ............................................................................ 3.2 .2 3.1 .2 3.2 .3 3.1 .31996 ............................................................................ 2.8 .3 2.9 .3 2.8 .2 2.9 .21997 ............................................................................ 2.7 .3 2.6 .2 2.6 .1 2.6 .11998 ............................................................................ 2.7 .1 2.8 .1 2.9 .2 3.0 .21999 ............................................................................ 2.9 .2 3.0 .2 3.3 .2 3.5 .2
Professional specialty and technical occupations:1995 ............................................................................ 3.1 .3 3.1 .2 3.1 .4 3.1 .41996 ............................................................................ 2.8 .4 2.9 .4 2.9 .3 2.9 .21997 ............................................................................ 2.8 .2 2.6 .2 2.5 .1 2.6 .11998 ............................................................................ 2.7 .2 2.7 .2 2.6 .2 2.7 .21999 ............................................................................ 2.5 .2 2.8 .2 3.3 .3 3.5 .3
Executive, administrative, and managerial occupations:1995 ............................................................................ 3.6 .8 3.3 .8 3.6 .8 3.7 .81996 ............................................................................ 2.9 .3 3.0 .4 2.6 .5 2.6 .51997 ............................................................................ 2.8 .6 2.9 .4 2.9 .6 3.0 .41998 ............................................................................ 2.9 .5 3.0 .5 3.7 .5 3.9 .51999 ............................................................................ 3.7 .4 3.6 .4 3.4 .3 3.6 .3
Administrative support, including clerical occupations:1995 ............................................................................ 3.0 .4 2.9 .5 2.9 .3 2.8 .51996 ............................................................................ 2.7 .4 2.6 .3 2.7 .3 3.1 .21997 ............................................................................ 2.7 .3 2.7 .3 2.9 .3 2.6 .31998 ............................................................................ 2.9 .2 2.9 .2 3.0 .3 3.2 .31999 ............................................................................ 3.3 .3 3.2 .3 3.1 .3 3.8 .4
Blue-collar occupations:1995 ............................................................................ 2.8 .3 3.1 .3 2.5 .3 2.6 .31996 ............................................................................ 2.8 .3 2.6 .2 2.5 .4 2.5 .41997 ............................................................................ 2.4 .4 2.2 .5 2.6 .2 2.7 .21998 ............................................................................ 2.7 .2 2.9 .3 3.0 .2 2.8 .21999 ............................................................................ 2.9 .2 3.1 .3 3.2 .4 3.5 .6
Service occupations:1995 ............................................................................ 4.1 .4 4.0 .4 3.2 .3 3.2 .41996 ............................................................................ 2.8 .3 2.7 .2 2.8 .2 2.9 .31997 ............................................................................ 3.4 .5 3.0 .4 3.2 .4 3.2 .31998 ............................................................................ 3.1 .5 3.6 .5 3.7 .6 3.6 .71999 ............................................................................ 3.4 .6 3.6 .4 3.5 .5 4.1 .5
Service industries:1995 ............................................................................ 3.1 .2 3.1 .2 3.2 .4 3.2 .41996 ............................................................................ 3.0 .4 3.0 .3 2.8 .3 2.9 .2
See footnotes at end of table.
142
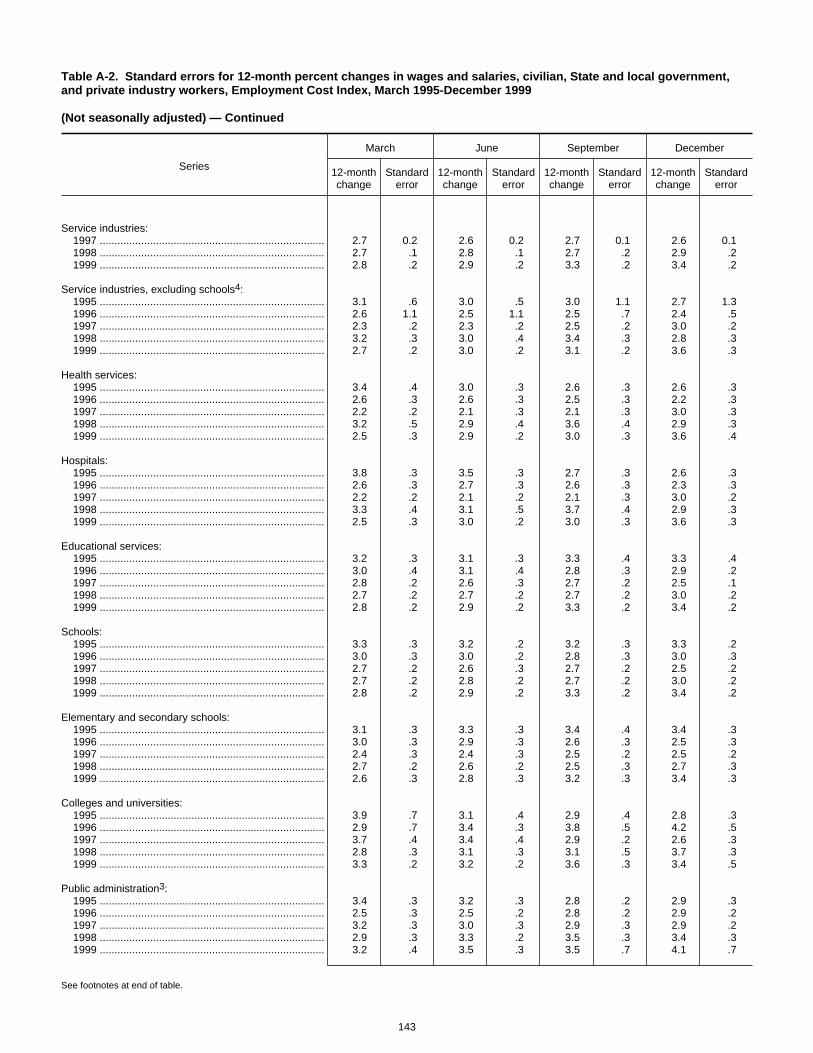
Table A-2. Standard errors for 12-month percent changes in wages and salaries, civilian, State and local government,and private industry workers, Employment Cost Index, March 1995-December 1999
(Not seasonally adjusted) — Continued
Series
March June September December
12-monthchange
Standarderror
12-monthchange
Standarderror
12-monthchange
Standarderror
12-monthchange
Standarderror
Service industries:1997 ............................................................................ 2.7 0.2 2.6 0.2 2.7 0.1 2.6 0.11998 ............................................................................ 2.7 .1 2.8 .1 2.7 .2 2.9 .21999 ............................................................................ 2.8 .2 2.9 .2 3.3 .2 3.4 .2
Service industries, excluding schools4:1995 ............................................................................ 3.1 .6 3.0 .5 3.0 1.1 2.7 1.31996 ............................................................................ 2.6 1.1 2.5 1.1 2.5 .7 2.4 .51997 ............................................................................ 2.3 .2 2.3 .2 2.5 .2 3.0 .21998 ............................................................................ 3.2 .3 3.0 .4 3.4 .3 2.8 .31999 ............................................................................ 2.7 .2 3.0 .2 3.1 .2 3.6 .3
Health services:1995 ............................................................................ 3.4 .4 3.0 .3 2.6 .3 2.6 .31996 ............................................................................ 2.6 .3 2.6 .3 2.5 .3 2.2 .31997 ............................................................................ 2.2 .2 2.1 .3 2.1 .3 3.0 .31998 ............................................................................ 3.2 .5 2.9 .4 3.6 .4 2.9 .31999 ............................................................................ 2.5 .3 2.9 .2 3.0 .3 3.6 .4
Hospitals:1995 ............................................................................ 3.8 .3 3.5 .3 2.7 .3 2.6 .31996 ............................................................................ 2.6 .3 2.7 .3 2.6 .3 2.3 .31997 ............................................................................ 2.2 .2 2.1 .2 2.1 .3 3.0 .21998 ............................................................................ 3.3 .4 3.1 .5 3.7 .4 2.9 .31999 ............................................................................ 2.5 .3 3.0 .2 3.0 .3 3.6 .3
Educational services:1995 ............................................................................ 3.2 .3 3.1 .3 3.3 .4 3.3 .41996 ............................................................................ 3.0 .4 3.1 .4 2.8 .3 2.9 .21997 ............................................................................ 2.8 .2 2.6 .3 2.7 .2 2.5 .11998 ............................................................................ 2.7 .2 2.7 .2 2.7 .2 3.0 .21999 ............................................................................ 2.8 .2 2.9 .2 3.3 .2 3.4 .2
Schools:1995 ............................................................................ 3.3 .3 3.2 .2 3.2 .3 3.3 .21996 ............................................................................ 3.0 .3 3.0 .2 2.8 .3 3.0 .31997 ............................................................................ 2.7 .2 2.6 .3 2.7 .2 2.5 .21998 ............................................................................ 2.7 .2 2.8 .2 2.7 .2 3.0 .21999 ............................................................................ 2.8 .2 2.9 .2 3.3 .2 3.4 .2
Elementary and secondary schools:1995 ............................................................................ 3.1 .3 3.3 .3 3.4 .4 3.4 .31996 ............................................................................ 3.0 .3 2.9 .3 2.6 .3 2.5 .31997 ............................................................................ 2.4 .3 2.4 .3 2.5 .2 2.5 .21998 ............................................................................ 2.7 .2 2.6 .2 2.5 .3 2.7 .31999 ............................................................................ 2.6 .3 2.8 .3 3.2 .3 3.4 .3
Colleges and universities:1995 ............................................................................ 3.9 .7 3.1 .4 2.9 .4 2.8 .31996 ............................................................................ 2.9 .7 3.4 .3 3.8 .5 4.2 .51997 ............................................................................ 3.7 .4 3.4 .4 2.9 .2 2.6 .31998 ............................................................................ 2.8 .3 3.1 .3 3.1 .5 3.7 .31999 ............................................................................ 3.3 .2 3.2 .2 3.6 .3 3.4 .5
Public administration3:1995 ............................................................................ 3.4 .3 3.2 .3 2.8 .2 2.9 .31996 ............................................................................ 2.5 .3 2.5 .2 2.8 .2 2.9 .21997 ............................................................................ 3.2 .3 3.0 .3 2.9 .3 2.9 .21998 ............................................................................ 2.9 .3 3.3 .2 3.5 .3 3.4 .31999 ............................................................................ 3.2 .4 3.5 .3 3.5 .7 4.1 .7
See footnotes at end of table.
143

Table A-2. Standard errors for 12-month percent changes in wages and salaries, civilian, State and local government,and private industry workers, Employment Cost Index, March 1995-December 1999
(Not seasonally adjusted) — Continued
Series
March June September December
12-monthchange
Standarderror
12-monthchange
Standarderror
12-monthchange
Standarderror
12-monthchange
Standarderror
Private industry5:1995 ............................................................................ 2.9 0.3 2.9 0.3 2.8 0.1 2.8 0.31996 ............................................................................ 3.2 .4 3.4 .4 3.3 .3 3.4 .31997 ............................................................................ 3.4 .3 3.3 .3 3.6 .3 3.9 .41998 ............................................................................ 4.0 .3 4.0 .3 4.3 .4 3.9 .61999 ............................................................................ 3.3 .2 3.6 .3 3.2 .3 3.5 .5
Private industry, excluding sales:1995 ............................................................................ 3.0 .1 3.0 .2 2.7 .1 2.8 .21996 ............................................................................ 3.1 .2 3.2 .2 3.4 .2 3.3 .21997 ............................................................................ 3.1 .2 3.3 .2 3.5 .2 3.8 .31998 ............................................................................ 4.0 .3 3.8 .3 3.9 .3 3.4 .1
White-collar occupations:1995 ............................................................................ 2.9 .4 2.8 .4 2.8 .2 2.9 .51996 ............................................................................ 3.4 .6 3.5 .5 3.6 .5 3.5 .41997 ............................................................................ 3.5 .5 3.4 .5 3.7 .4 4.3 .61998 ............................................................................ 4.2 .5 4.3 .5 4.7 .6 4.2 .91999 ............................................................................ 3.4 .3 3.7 .4 3.2 .5 3.5 .8
White-collar occupations, excluding sales:1995 ............................................................................ 3.2 .3 2.9 .2 2.7 .2 2.9 .21996 ............................................................................ 3.2 .3 3.4 .4 3.8 .4 3.4 .51997 ............................................................................ 3.2 .3 3.4 .3 3.4 .3 4.2 .61998 ............................................................................ 4.2 .5 4.2 .5 4.3 .5 3.6 .2
Professional specialty and technical occupations:1995 ............................................................................ 2.7 .4 2.6 .3 2.5 .3 2.5 .31996 ............................................................................ 3.3 .3 3.5 .3 3.4 .3 3.0 .31997 ............................................................................ 2.5 .3 2.8 .4 3.2 .5 3.8 .51999 ............................................................................ 3.5 .4 3.4 .4 2.8 .5 3.1 .4
Executive, administrative, and managerial occupations:1995 ............................................................................ 3.5 .6 3.1 .5 2.8 .5 3.2 .61996 ............................................................................ 3.3 .8 3.5 1.0 4.5 1.2 3.9 1.11997 ............................................................................ 4.1 1.1 4.2 .6 3.6 .6 5.0 1.71998 ............................................................................ 5.2 1.4 5.0 1.7 5.5 1.7 3.5 .61999 ............................................................................ 3.0 .6 4.0 1.2 3.9 1.8 5.1 1.7
Sales occupations:1995 ............................................................................ 1.8 1.8 2.7 1.5 3.4 1.1 3.2 2.51996 ............................................................................ 4.4 2.4 4.3 2.4 2.8 2.1 4.6 2.01997 ............................................................................ 4.8 2.0 3.1 3.1 4.8 2.4 4.4 2.71998 ............................................................................ 4.1 2.1 5.4 2.2 6.9 2.8 7.5 5.51999 ............................................................................ 3.2 1.8 3.9 1.8 2.4 1.8 1.4 4.1
Administrative support, including clerical occupations:1995 ............................................................................ 3.3 .3 3.0 .3 2.8 .3 3.0 .21996 ............................................................................ 2.9 .2 3.1 .3 3.4 .3 3.1 .21997 ............................................................................ 3.2 .2 3.5 .3 3.4 .2 3.6 .31998 ............................................................................ 3.6 .3 3.8 .3 3.8 .2 3.7 .31999 ............................................................................ 3.8 .3 3.4 .3 3.5 .2 3.5 .2
Blue-collar occupations:1995 ............................................................................ 2.9 .2 3.1 .3 2.8 .2 2.9 .31996 ............................................................................ 2.9 .3 3.0 .3 2.9 .2 3.0 .21997 ............................................................................ 2.9 .2 2.9 .2 3.2 .2 3.2 .21998 ............................................................................ 3.3 .2 3.1 .2 3.2 .2 3.2 .21999 ............................................................................ 3.1 .2 3.3 .2 3.3 .2 3.4 .2
See footnotes at end of table.
144
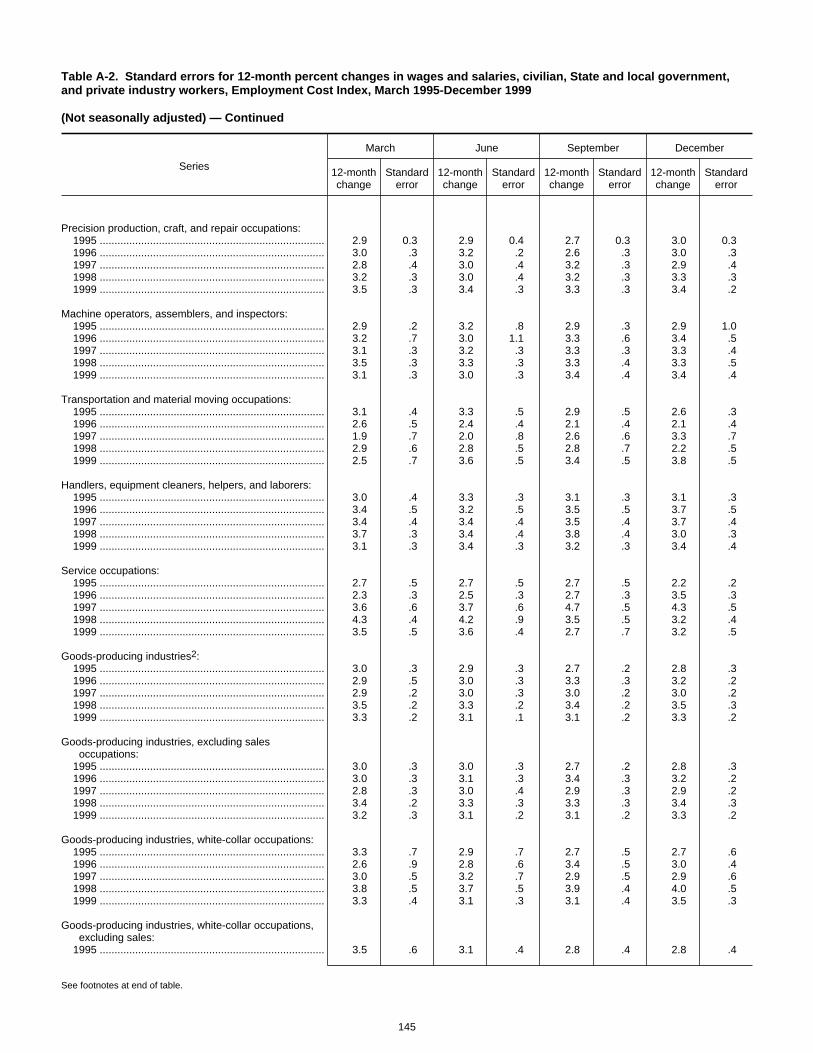
Table A-2. Standard errors for 12-month percent changes in wages and salaries, civilian, State and local government,and private industry workers, Employment Cost Index, March 1995-December 1999
(Not seasonally adjusted) — Continued
Series
March June September December
12-monthchange
Standarderror
12-monthchange
Standarderror
12-monthchange
Standarderror
12-monthchange
Standarderror
Precision production, craft, and repair occupations:1995 ............................................................................ 2.9 0.3 2.9 0.4 2.7 0.3 3.0 0.31996 ............................................................................ 3.0 .3 3.2 .2 2.6 .3 3.0 .31997 ............................................................................ 2.8 .4 3.0 .4 3.2 .3 2.9 .41998 ............................................................................ 3.2 .3 3.0 .4 3.2 .3 3.3 .31999 ............................................................................ 3.5 .3 3.4 .3 3.3 .3 3.4 .2
Machine operators, assemblers, and inspectors:1995 ............................................................................ 2.9 .2 3.2 .8 2.9 .3 2.9 1.01996 ............................................................................ 3.2 .7 3.0 1.1 3.3 .6 3.4 .51997 ............................................................................ 3.1 .3 3.2 .3 3.3 .3 3.3 .41998 ............................................................................ 3.5 .3 3.3 .3 3.3 .4 3.3 .51999 ............................................................................ 3.1 .3 3.0 .3 3.4 .4 3.4 .4
Transportation and material moving occupations:1995 ............................................................................ 3.1 .4 3.3 .5 2.9 .5 2.6 .31996 ............................................................................ 2.6 .5 2.4 .4 2.1 .4 2.1 .41997 ............................................................................ 1.9 .7 2.0 .8 2.6 .6 3.3 .71998 ............................................................................ 2.9 .6 2.8 .5 2.8 .7 2.2 .51999 ............................................................................ 2.5 .7 3.6 .5 3.4 .5 3.8 .5
Handlers, equipment cleaners, helpers, and laborers:1995 ............................................................................ 3.0 .4 3.3 .3 3.1 .3 3.1 .31996 ............................................................................ 3.4 .5 3.2 .5 3.5 .5 3.7 .51997 ............................................................................ 3.4 .4 3.4 .4 3.5 .4 3.7 .41998 ............................................................................ 3.7 .3 3.4 .4 3.8 .4 3.0 .31999 ............................................................................ 3.1 .3 3.4 .3 3.2 .3 3.4 .4
Service occupations:1995 ............................................................................ 2.7 .5 2.7 .5 2.7 .5 2.2 .21996 ............................................................................ 2.3 .3 2.5 .3 2.7 .3 3.5 .31997 ............................................................................ 3.6 .6 3.7 .6 4.7 .5 4.3 .51998 ............................................................................ 4.3 .4 4.2 .9 3.5 .5 3.2 .41999 ............................................................................ 3.5 .5 3.6 .4 2.7 .7 3.2 .5
Goods-producing industries2:1995 ............................................................................ 3.0 .3 2.9 .3 2.7 .2 2.8 .31996 ............................................................................ 2.9 .5 3.0 .3 3.3 .3 3.2 .21997 ............................................................................ 2.9 .2 3.0 .3 3.0 .2 3.0 .21998 ............................................................................ 3.5 .2 3.3 .2 3.4 .2 3.5 .31999 ............................................................................ 3.3 .2 3.1 .1 3.1 .2 3.3 .2
Goods-producing industries, excluding sales occupations:
1995 ............................................................................ 3.0 .3 3.0 .3 2.7 .2 2.8 .31996 ............................................................................ 3.0 .3 3.1 .3 3.4 .3 3.2 .21997 ............................................................................ 2.8 .3 3.0 .4 2.9 .3 2.9 .21998 ............................................................................ 3.4 .2 3.3 .3 3.3 .3 3.4 .31999 ............................................................................ 3.2 .3 3.1 .2 3.1 .2 3.3 .2
Goods-producing industries, white-collar occupations:1995 ............................................................................ 3.3 .7 2.9 .7 2.7 .5 2.7 .61996 ............................................................................ 2.6 .9 2.8 .6 3.4 .5 3.0 .41997 ............................................................................ 3.0 .5 3.2 .7 2.9 .5 2.9 .61998 ............................................................................ 3.8 .5 3.7 .5 3.9 .4 4.0 .51999 ............................................................................ 3.3 .4 3.1 .3 3.1 .4 3.5 .3
Goods-producing industries, white-collar occupations,excluding sales:
1995 ............................................................................ 3.5 .6 3.1 .4 2.8 .4 2.8 .4
See footnotes at end of table.
145
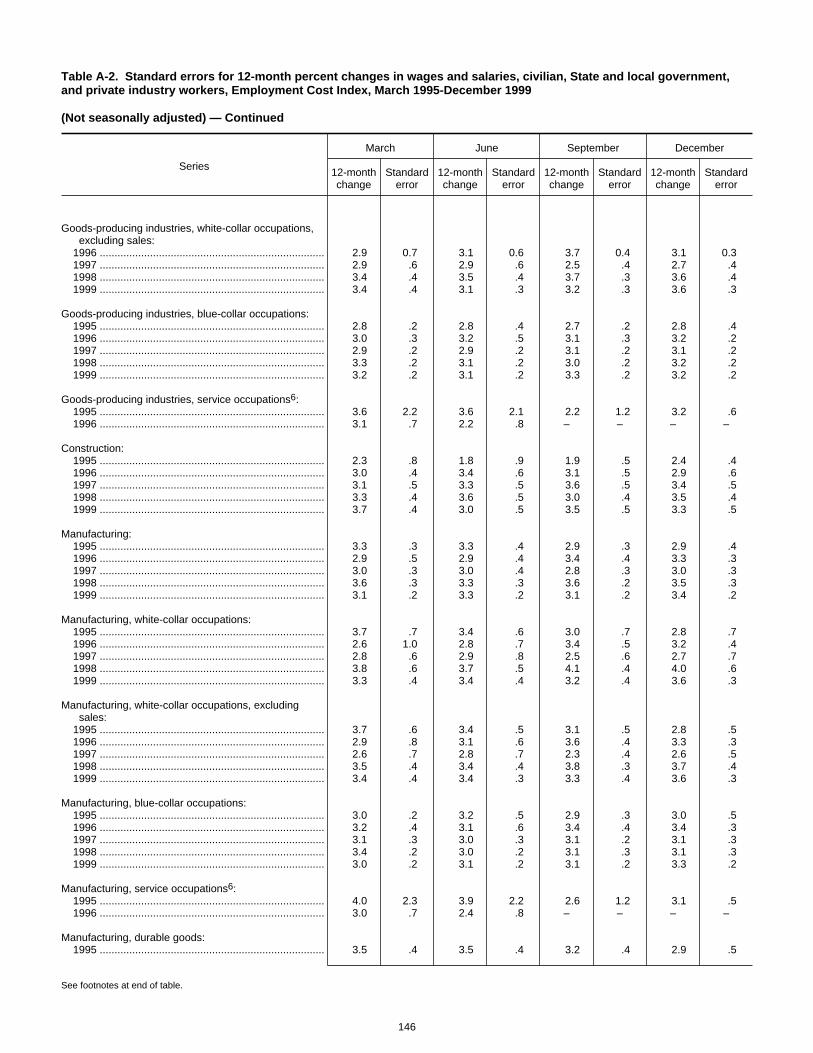
Table A-2. Standard errors for 12-month percent changes in wages and salaries, civilian, State and local government,and private industry workers, Employment Cost Index, March 1995-December 1999
(Not seasonally adjusted) — Continued
Series
March June September December
12-monthchange
Standarderror
12-monthchange
Standarderror
12-monthchange
Standarderror
12-monthchange
Standarderror
Goods-producing industries, white-collar occupations,excluding sales:
1996 ............................................................................ 2.9 0.7 3.1 0.6 3.7 0.4 3.1 0.31997 ............................................................................ 2.9 .6 2.9 .6 2.5 .4 2.7 .41998 ............................................................................ 3.4 .4 3.5 .4 3.7 .3 3.6 .41999 ............................................................................ 3.4 .4 3.1 .3 3.2 .3 3.6 .3
Goods-producing industries, blue-collar occupations:1995 ............................................................................ 2.8 .2 2.8 .4 2.7 .2 2.8 .41996 ............................................................................ 3.0 .3 3.2 .5 3.1 .3 3.2 .21997 ............................................................................ 2.9 .2 2.9 .2 3.1 .2 3.1 .21998 ............................................................................ 3.3 .2 3.1 .2 3.0 .2 3.2 .21999 ............................................................................ 3.2 .2 3.1 .2 3.3 .2 3.2 .2
Goods-producing industries, service occupations6:1995 ............................................................................ 3.6 2.2 3.6 2.1 2.2 1.2 3.2 .61996 ............................................................................ 3.1 .7 2.2 .8 – – – –
Construction:1995 ............................................................................ 2.3 .8 1.8 .9 1.9 .5 2.4 .41996 ............................................................................ 3.0 .4 3.4 .6 3.1 .5 2.9 .61997 ............................................................................ 3.1 .5 3.3 .5 3.6 .5 3.4 .51998 ............................................................................ 3.3 .4 3.6 .5 3.0 .4 3.5 .41999 ............................................................................ 3.7 .4 3.0 .5 3.5 .5 3.3 .5
Manufacturing:1995 ............................................................................ 3.3 .3 3.3 .4 2.9 .3 2.9 .41996 ............................................................................ 2.9 .5 2.9 .4 3.4 .4 3.3 .31997 ............................................................................ 3.0 .3 3.0 .4 2.8 .3 3.0 .31998 ............................................................................ 3.6 .3 3.3 .3 3.6 .2 3.5 .31999 ............................................................................ 3.1 .2 3.3 .2 3.1 .2 3.4 .2
Manufacturing, white-collar occupations:1995 ............................................................................ 3.7 .7 3.4 .6 3.0 .7 2.8 .71996 ............................................................................ 2.6 1.0 2.8 .7 3.4 .5 3.2 .41997 ............................................................................ 2.8 .6 2.9 .8 2.5 .6 2.7 .71998 ............................................................................ 3.8 .6 3.7 .5 4.1 .4 4.0 .61999 ............................................................................ 3.3 .4 3.4 .4 3.2 .4 3.6 .3
Manufacturing, white-collar occupations, excludingsales:
1995 ............................................................................ 3.7 .6 3.4 .5 3.1 .5 2.8 .51996 ............................................................................ 2.9 .8 3.1 .6 3.6 .4 3.3 .31997 ............................................................................ 2.6 .7 2.8 .7 2.3 .4 2.6 .51998 ............................................................................ 3.5 .4 3.4 .4 3.8 .3 3.7 .41999 ............................................................................ 3.4 .4 3.4 .3 3.3 .4 3.6 .3
Manufacturing, blue-collar occupations:1995 ............................................................................ 3.0 .2 3.2 .5 2.9 .3 3.0 .51996 ............................................................................ 3.2 .4 3.1 .6 3.4 .4 3.4 .31997 ............................................................................ 3.1 .3 3.0 .3 3.1 .2 3.1 .31998 ............................................................................ 3.4 .2 3.0 .2 3.1 .3 3.1 .31999 ............................................................................ 3.0 .2 3.1 .2 3.1 .2 3.3 .2
Manufacturing, service occupations6:1995 ............................................................................ 4.0 2.3 3.9 2.2 2.6 1.2 3.1 .51996 ............................................................................ 3.0 .7 2.4 .8 – – – –
Manufacturing, durable goods:1995 ............................................................................ 3.5 .4 3.5 .4 3.2 .4 2.9 .5
See footnotes at end of table.
146
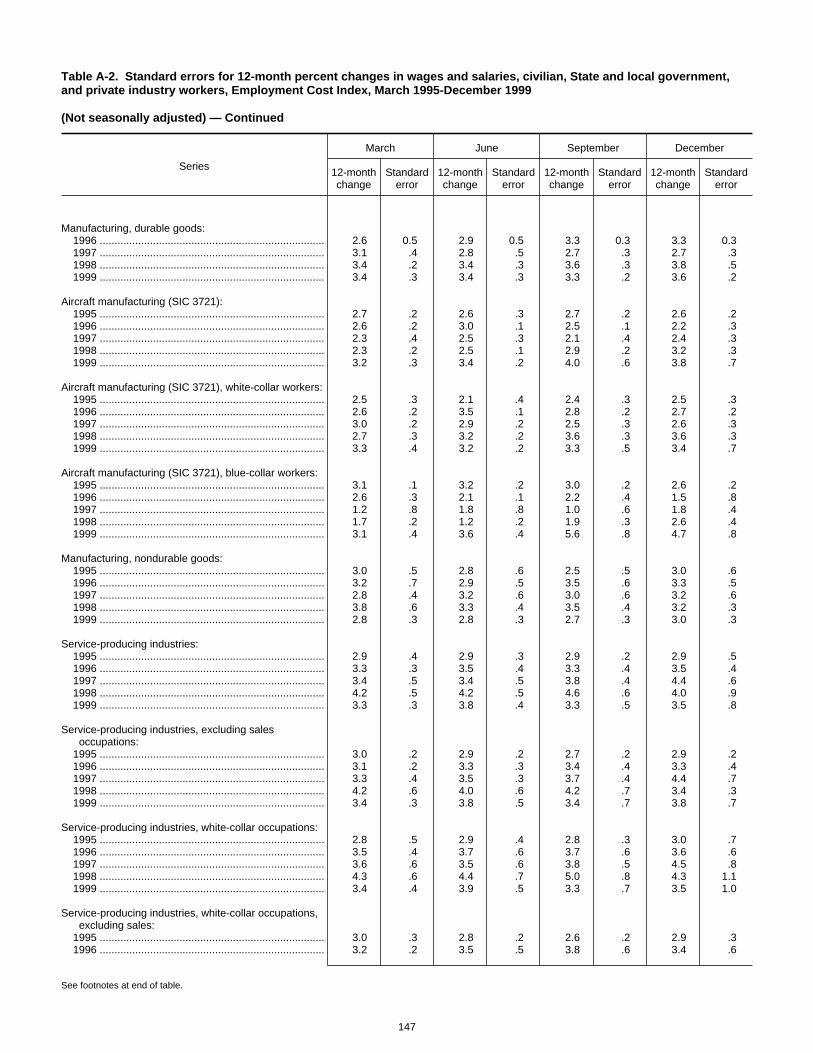
Table A-2. Standard errors for 12-month percent changes in wages and salaries, civilian, State and local government,and private industry workers, Employment Cost Index, March 1995-December 1999
(Not seasonally adjusted) — Continued
Series
March June September December
12-monthchange
Standarderror
12-monthchange
Standarderror
12-monthchange
Standarderror
12-monthchange
Standarderror
Manufacturing, durable goods:1996 ............................................................................ 2.6 0.5 2.9 0.5 3.3 0.3 3.3 0.31997 ............................................................................ 3.1 .4 2.8 .5 2.7 .3 2.7 .31998 ............................................................................ 3.4 .2 3.4 .3 3.6 .3 3.8 .51999 ............................................................................ 3.4 .3 3.4 .3 3.3 .2 3.6 .2
Aircraft manufacturing (SIC 3721):1995 ............................................................................ 2.7 .2 2.6 .3 2.7 .2 2.6 .21996 ............................................................................ 2.6 .2 3.0 .1 2.5 .1 2.2 .31997 ............................................................................ 2.3 .4 2.5 .3 2.1 .4 2.4 .31998 ............................................................................ 2.3 .2 2.5 .1 2.9 .2 3.2 .31999 ............................................................................ 3.2 .3 3.4 .2 4.0 .6 3.8 .7
Aircraft manufacturing (SIC 3721), white-collar workers:1995 ............................................................................ 2.5 .3 2.1 .4 2.4 .3 2.5 .31996 ............................................................................ 2.6 .2 3.5 .1 2.8 .2 2.7 .21997 ............................................................................ 3.0 .2 2.9 .2 2.5 .3 2.6 .31998 ............................................................................ 2.7 .3 3.2 .2 3.6 .3 3.6 .31999 ............................................................................ 3.3 .4 3.2 .2 3.3 .5 3.4 .7
Aircraft manufacturing (SIC 3721), blue-collar workers:1995 ............................................................................ 3.1 .1 3.2 .2 3.0 .2 2.6 .21996 ............................................................................ 2.6 .3 2.1 .1 2.2 .4 1.5 .81997 ............................................................................ 1.2 .8 1.8 .8 1.0 .6 1.8 .41998 ............................................................................ 1.7 .2 1.2 .2 1.9 .3 2.6 .41999 ............................................................................ 3.1 .4 3.6 .4 5.6 .8 4.7 .8
Manufacturing, nondurable goods:1995 ............................................................................ 3.0 .5 2.8 .6 2.5 .5 3.0 .61996 ............................................................................ 3.2 .7 2.9 .5 3.5 .6 3.3 .51997 ............................................................................ 2.8 .4 3.2 .6 3.0 .6 3.2 .61998 ............................................................................ 3.8 .6 3.3 .4 3.5 .4 3.2 .31999 ............................................................................ 2.8 .3 2.8 .3 2.7 .3 3.0 .3
Service-producing industries:1995 ............................................................................ 2.9 .4 2.9 .3 2.9 .2 2.9 .51996 ............................................................................ 3.3 .3 3.5 .4 3.3 .4 3.5 .41997 ............................................................................ 3.4 .5 3.4 .5 3.8 .4 4.4 .61998 ............................................................................ 4.2 .5 4.2 .5 4.6 .6 4.0 .91999 ............................................................................ 3.3 .3 3.8 .4 3.3 .5 3.5 .8
Service-producing industries, excluding salesoccupations:
1995 ............................................................................ 3.0 .2 2.9 .2 2.7 .2 2.9 .21996 ............................................................................ 3.1 .2 3.3 .3 3.4 .4 3.3 .41997 ............................................................................ 3.3 .4 3.5 .3 3.7 .4 4.4 .71998 ............................................................................ 4.2 .6 4.0 .6 4.2 .7 3.4 .31999 ............................................................................ 3.4 .3 3.8 .5 3.4 .7 3.8 .7
Service-producing industries, white-collar occupations:1995 ............................................................................ 2.8 .5 2.9 .4 2.8 .3 3.0 .71996 ............................................................................ 3.5 .4 3.7 .6 3.7 .6 3.6 .61997 ............................................................................ 3.6 .6 3.5 .6 3.8 .5 4.5 .81998 ............................................................................ 4.3 .6 4.4 .7 5.0 .8 4.3 1.11999 ............................................................................ 3.4 .4 3.9 .5 3.3 .7 3.5 1.0
Service-producing industries, white-collar occupations,excluding sales:
1995 ............................................................................ 3.0 .3 2.8 .2 2.6 .2 2.9 .31996 ............................................................................ 3.2 .2 3.5 .5 3.8 .6 3.4 .6
See footnotes at end of table.
147
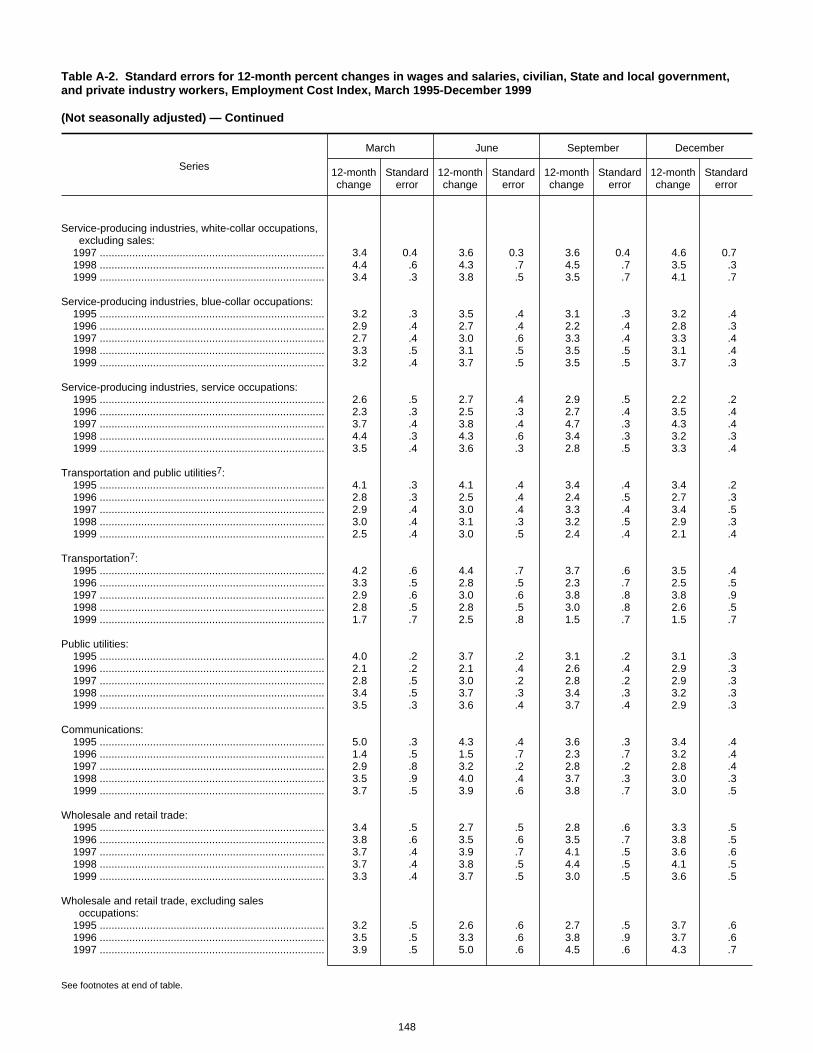
Table A-2. Standard errors for 12-month percent changes in wages and salaries, civilian, State and local government,and private industry workers, Employment Cost Index, March 1995-December 1999
(Not seasonally adjusted) — Continued
Series
March June September December
12-monthchange
Standarderror
12-monthchange
Standarderror
12-monthchange
Standarderror
12-monthchange
Standarderror
Service-producing industries, white-collar occupations,excluding sales:
1997 ............................................................................ 3.4 0.4 3.6 0.3 3.6 0.4 4.6 0.71998 ............................................................................ 4.4 .6 4.3 .7 4.5 .7 3.5 .31999 ............................................................................ 3.4 .3 3.8 .5 3.5 .7 4.1 .7
Service-producing industries, blue-collar occupations:1995 ............................................................................ 3.2 .3 3.5 .4 3.1 .3 3.2 .41996 ............................................................................ 2.9 .4 2.7 .4 2.2 .4 2.8 .31997 ............................................................................ 2.7 .4 3.0 .6 3.3 .4 3.3 .41998 ............................................................................ 3.3 .5 3.1 .5 3.5 .5 3.1 .41999 ............................................................................ 3.2 .4 3.7 .5 3.5 .5 3.7 .3
Service-producing industries, service occupations:1995 ............................................................................ 2.6 .5 2.7 .4 2.9 .5 2.2 .21996 ............................................................................ 2.3 .3 2.5 .3 2.7 .4 3.5 .41997 ............................................................................ 3.7 .4 3.8 .4 4.7 .3 4.3 .41998 ............................................................................ 4.4 .3 4.3 .6 3.4 .3 3.2 .31999 ............................................................................ 3.5 .4 3.6 .3 2.8 .5 3.3 .4
Transportation and public utilities7:1995 ............................................................................ 4.1 .3 4.1 .4 3.4 .4 3.4 .21996 ............................................................................ 2.8 .3 2.5 .4 2.4 .5 2.7 .31997 ............................................................................ 2.9 .4 3.0 .4 3.3 .4 3.4 .51998 ............................................................................ 3.0 .4 3.1 .3 3.2 .5 2.9 .31999 ............................................................................ 2.5 .4 3.0 .5 2.4 .4 2.1 .4
Transportation7:1995 ............................................................................ 4.2 .6 4.4 .7 3.7 .6 3.5 .41996 ............................................................................ 3.3 .5 2.8 .5 2.3 .7 2.5 .51997 ............................................................................ 2.9 .6 3.0 .6 3.8 .8 3.8 .91998 ............................................................................ 2.8 .5 2.8 .5 3.0 .8 2.6 .51999 ............................................................................ 1.7 .7 2.5 .8 1.5 .7 1.5 .7
Public utilities:1995 ............................................................................ 4.0 .2 3.7 .2 3.1 .2 3.1 .31996 ............................................................................ 2.1 .2 2.1 .4 2.6 .4 2.9 .31997 ............................................................................ 2.8 .5 3.0 .2 2.8 .2 2.9 .31998 ............................................................................ 3.4 .5 3.7 .3 3.4 .3 3.2 .31999 ............................................................................ 3.5 .3 3.6 .4 3.7 .4 2.9 .3
Communications:1995 ............................................................................ 5.0 .3 4.3 .4 3.6 .3 3.4 .41996 ............................................................................ 1.4 .5 1.5 .7 2.3 .7 3.2 .41997 ............................................................................ 2.9 .8 3.2 .2 2.8 .2 2.8 .41998 ............................................................................ 3.5 .9 4.0 .4 3.7 .3 3.0 .31999 ............................................................................ 3.7 .5 3.9 .6 3.8 .7 3.0 .5
Wholesale and retail trade:1995 ............................................................................ 3.4 .5 2.7 .5 2.8 .6 3.3 .51996 ............................................................................ 3.8 .6 3.5 .6 3.5 .7 3.8 .51997 ............................................................................ 3.7 .4 3.9 .7 4.1 .5 3.6 .61998 ............................................................................ 3.7 .4 3.8 .5 4.4 .5 4.1 .51999 ............................................................................ 3.3 .4 3.7 .5 3.0 .5 3.6 .5
Wholesale and retail trade, excluding salesoccupations:
1995 ............................................................................ 3.2 .5 2.6 .6 2.7 .5 3.7 .61996 ............................................................................ 3.5 .5 3.3 .6 3.8 .9 3.7 .61997 ............................................................................ 3.9 .5 5.0 .6 4.5 .6 4.3 .7
See footnotes at end of table.
148

Table A-2. Standard errors for 12-month percent changes in wages and salaries, civilian, State and local government,and private industry workers, Employment Cost Index, March 1995-December 1999
(Not seasonally adjusted) — Continued
Series
March June September December
12-monthchange
Standarderror
12-monthchange
Standarderror
12-monthchange
Standarderror
12-monthchange
Standarderror
Wholesale and retail trade, excluding salesoccupations:
1998 ............................................................................ 4.2 0.6 3.4 0.5 4.1 0.4 3.8 0.51999 ............................................................................ 3.6 .5 4.1 .4 3.1 .4 3.7 .5
Wholesale trade:1995 ............................................................................ 4.0 .9 3.7 .9 4.2 .9 4.7 1.21996 ............................................................................ 4.3 1.3 4.3 1.2 3.7 1.3 3.3 .91997 ............................................................................ 4.2 .9 3.3 .9 3.5 .9 3.1 .91998 ............................................................................ 3.7 .7 3.7 .9 4.7 1.1 5.8 1.31999 ............................................................................ 3.3 .7 3.8 .8 3.6 1.0 3.7 .9
Wholesale trade, excluding sales occupations:1995 ............................................................................ 3.7 .5 3.5 .5 3.4 .6 4.6 1.31996 ............................................................................ 3.4 1.3 3.8 1.3 4.2 1.4 3.3 .51997 ............................................................................ 4.4 .4 4.1 .4 3.9 .6 4.0 .61998 ............................................................................ 3.6 .6 3.8 .5 4.3 .6 4.3 .51999 ............................................................................ 4.0 .7 3.8 .6 3.7 .6 4.0 .5
Retail trade:1995 ............................................................................ 3.0 .5 2.2 .6 2.1 .7 2.4 .41996 ............................................................................ 3.5 .6 2.9 .6 3.2 .8 4.3 .71997 ............................................................................ 3.5 .7 4.4 .8 4.4 .6 3.8 .71998 ............................................................................ 3.8 .5 3.7 .5 4.1 .5 3.2 .51999 ............................................................................ 3.3 .5 3.8 .6 2.7 .6 3.6 .6
General merchandise stores:1995 ............................................................................ 3.4 .8 1.9 1.2 2.1 1.5 2.2 1.11996 ............................................................................ 2.6 1.1 2.6 .8 3.0 .5 3.8 .51997 ............................................................................ 3.3 .7 3.7 .5 3.3 .7 3.0 .71998 ............................................................................ 3.5 .7 4.2 .6 4.3 .5 3.6 .61999 ............................................................................ 3.3 .9 2.1 .5 2.6 .5 2.8 .6
Food stores:1995 ............................................................................ .7 1.0 -.2 1.4 1.0 1.1 1.5 .81996 ............................................................................ 2.3 1.0 3.1 1.0 3.8 2.4 4.7 2.41997 ............................................................................ 3.6 1.9 2.9 1.3 2.9 1.1 1.8 1.31998 ............................................................................ 3.4 .6 4.7 1.5 3.9 1.2 2.8 .71999 ............................................................................ 2.2 1.1 1.8 1.2 1.7 1.1 3.4 .8
Finance, insurance, and real estate:1995 ............................................................................ 1.1 2.1 3.4 1.7 3.7 1.3 3.7 2.81996 ............................................................................ 4.2 1.7 4.2 2.1 3.6 2.0 3.2 1.61997 ............................................................................ 3.9 2.2 2.8 2.8 3.4 2.4 6.9 4.31998 ............................................................................ 6.5 3.1 7.6 3.6 9.3 4.4 7.0 5.81999 ............................................................................ 3.5 1.6 5.6 2.4 4.6 3.5 3.9 5.0
Finance, insurance, and real estate, excluding salesoccupations:
1995 ............................................................................ 3.3 .5 3.6 .6 3.3 .8 3.3 .61996 ............................................................................ 3.4 .5 3.6 .5 4.0 .9 3.3 .51997 ............................................................................ 3.1 .4 2.9 .4 2.6 .6 6.6 4.01998 ............................................................................ 6.8 3.1 7.3 3.7 8.0 3.8 4.5 .51999 ............................................................................ 3.8 .3 5.3 2.5 5.6 4.1 6.0 4.1
Banking, savings and loan, and other credit agencies:1995 ............................................................................ 3.9 .9 4.1 1.0 3.3 1.5 3.4 1.11996 ............................................................................ 2.9 .9 3.8 1.3 5.3 1.9 3.1 1.21997 ............................................................................ 2.6 .9 2.1 .8 1.7 1.1 11.7 8.61998 ............................................................................ 11.9 6.4 12.9 7.7 14.0 7.8 4.4 .8
See footnotes at end of table.
149
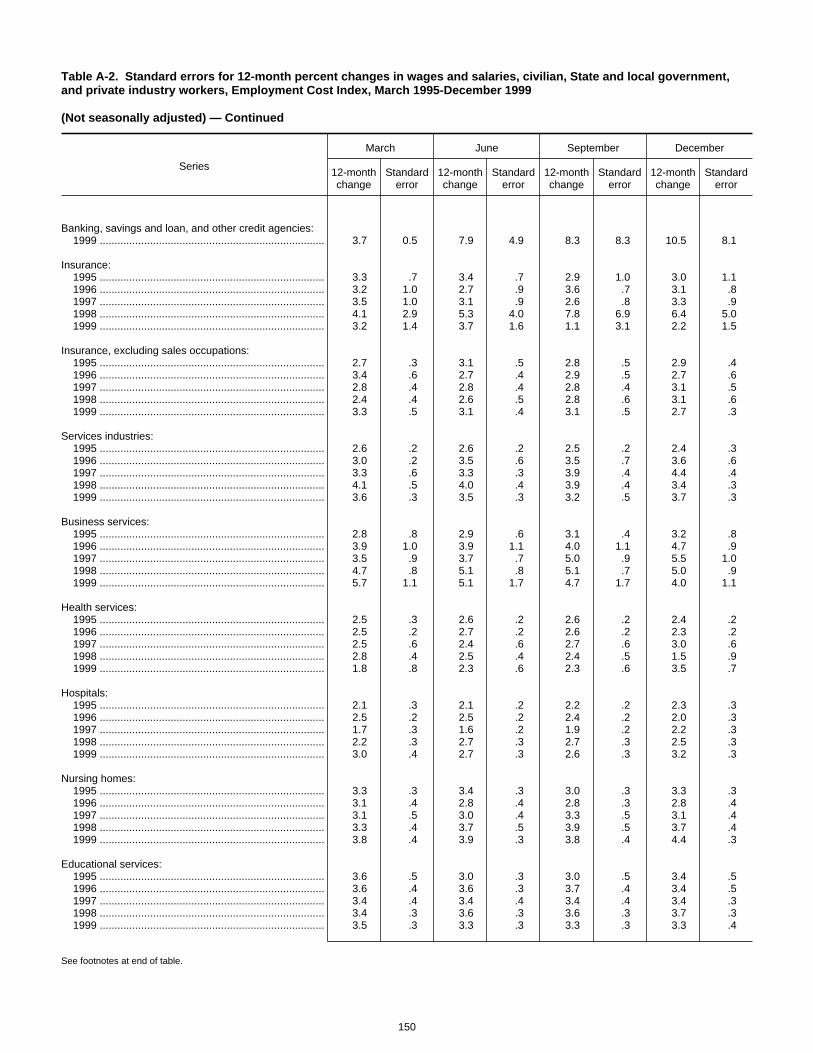
Table A-2. Standard errors for 12-month percent changes in wages and salaries, civilian, State and local government,and private industry workers, Employment Cost Index, March 1995-December 1999
(Not seasonally adjusted) — Continued
Series
March June September December
12-monthchange
Standarderror
12-monthchange
Standarderror
12-monthchange
Standarderror
12-monthchange
Standarderror
Banking, savings and loan, and other credit agencies:1999 ............................................................................ 3.7 0.5 7.9 4.9 8.3 8.3 10.5 8.1
Insurance:1995 ............................................................................ 3.3 .7 3.4 .7 2.9 1.0 3.0 1.11996 ............................................................................ 3.2 1.0 2.7 .9 3.6 .7 3.1 .81997 ............................................................................ 3.5 1.0 3.1 .9 2.6 .8 3.3 .91998 ............................................................................ 4.1 2.9 5.3 4.0 7.8 6.9 6.4 5.01999 ............................................................................ 3.2 1.4 3.7 1.6 1.1 3.1 2.2 1.5
Insurance, excluding sales occupations:1995 ............................................................................ 2.7 .3 3.1 .5 2.8 .5 2.9 .41996 ............................................................................ 3.4 .6 2.7 .4 2.9 .5 2.7 .61997 ............................................................................ 2.8 .4 2.8 .4 2.8 .4 3.1 .51998 ............................................................................ 2.4 .4 2.6 .5 2.8 .6 3.1 .61999 ............................................................................ 3.3 .5 3.1 .4 3.1 .5 2.7 .3
Services industries:1995 ............................................................................ 2.6 .2 2.6 .2 2.5 .2 2.4 .31996 ............................................................................ 3.0 .2 3.5 .6 3.5 .7 3.6 .61997 ............................................................................ 3.3 .6 3.3 .3 3.9 .4 4.4 .41998 ............................................................................ 4.1 .5 4.0 .4 3.9 .4 3.4 .31999 ............................................................................ 3.6 .3 3.5 .3 3.2 .5 3.7 .3
Business services:1995 ............................................................................ 2.8 .8 2.9 .6 3.1 .4 3.2 .81996 ............................................................................ 3.9 1.0 3.9 1.1 4.0 1.1 4.7 .91997 ............................................................................ 3.5 .9 3.7 .7 5.0 .9 5.5 1.01998 ............................................................................ 4.7 .8 5.1 .8 5.1 .7 5.0 .91999 ............................................................................ 5.7 1.1 5.1 1.7 4.7 1.7 4.0 1.1
Health services:1995 ............................................................................ 2.5 .3 2.6 .2 2.6 .2 2.4 .21996 ............................................................................ 2.5 .2 2.7 .2 2.6 .2 2.3 .21997 ............................................................................ 2.5 .6 2.4 .6 2.7 .6 3.0 .61998 ............................................................................ 2.8 .4 2.5 .4 2.4 .5 1.5 .91999 ............................................................................ 1.8 .8 2.3 .6 2.3 .6 3.5 .7
Hospitals:1995 ............................................................................ 2.1 .3 2.1 .2 2.2 .2 2.3 .31996 ............................................................................ 2.5 .2 2.5 .2 2.4 .2 2.0 .31997 ............................................................................ 1.7 .3 1.6 .2 1.9 .2 2.2 .31998 ............................................................................ 2.2 .3 2.7 .3 2.7 .3 2.5 .31999 ............................................................................ 3.0 .4 2.7 .3 2.6 .3 3.2 .3
Nursing homes:1995 ............................................................................ 3.3 .3 3.4 .3 3.0 .3 3.3 .31996 ............................................................................ 3.1 .4 2.8 .4 2.8 .3 2.8 .41997 ............................................................................ 3.1 .5 3.0 .4 3.3 .5 3.1 .41998 ............................................................................ 3.3 .4 3.7 .5 3.9 .5 3.7 .41999 ............................................................................ 3.8 .4 3.9 .3 3.8 .4 4.4 .3
Educational services:1995 ............................................................................ 3.6 .5 3.0 .3 3.0 .5 3.4 .51996 ............................................................................ 3.6 .4 3.6 .3 3.7 .4 3.4 .51997 ............................................................................ 3.4 .4 3.4 .4 3.4 .4 3.4 .31998 ............................................................................ 3.4 .3 3.6 .3 3.6 .3 3.7 .31999 ............................................................................ 3.5 .3 3.3 .3 3.3 .3 3.3 .4
See footnotes at end of table.
150

Table A-2. Standard errors for 12-month percent changes in wages and salaries, civilian, State and local government,and private industry workers, Employment Cost Index, March 1995-December 1999
(Not seasonally adjusted) — Continued
Series
March June September December
12-monthchange
Standarderror
12-monthchange
Standarderror
12-monthchange
Standarderror
12-monthchange
Standarderror
Colleges and universities:1995 ............................................................................ 2.9 0.4 3.0 0.4 3.6 0.4 4.2 0.51996 ............................................................................ 4.1 .4 4.0 .3 3.4 .4 2.8 .31997 ............................................................................ 3.1 .3 3.1 .4 3.3 .2 3.7 .31998 ............................................................................ 3.3 .2 3.5 .2 3.6 .2 3.5 .31999 ............................................................................ 3.6 .2 3.4 .2 3.1 .4 3.0 .3
Nonmanufacturing:1995 ............................................................................ 2.7 .4 2.7 .3 2.7 .2 2.9 .41996 ............................................................................ 3.3 .3 3.5 .4 3.3 .4 3.5 .41997 ............................................................................ 3.5 .4 3.4 .4 3.8 .4 4.2 .51998 ............................................................................ 4.1 .4 4.2 .4 4.4 .5 4.0 .81999 ............................................................................ 3.4 .3 3.7 .4 3.3 .5 3.4 .7
Nonmanufacturing, white-collar occupations:1995 ............................................................................ 2.7 .5 2.7 .4 2.8 .3 3.0 .61996 ............................................................................ 3.6 .5 3.7 .5 3.7 .6 3.6 .51997 ............................................................................ 3.6 .6 3.5 .6 3.8 .5 4.5 .81998 ............................................................................ 4.3 .6 4.4 .6 4.9 .7 4.3 1.11999 ............................................................................ 3.4 .4 3.8 .5 3.3 .7 3.5 1.0
Nonmanufacturing, white-collar occupations, excludingsales:
1995 ............................................................................ 2.9 .2 2.7 .3 2.6 .2 3.0 .21996 ............................................................................ 3.3 .2 3.5 .5 3.9 .6 3.3 .51997 ............................................................................ 3.4 .4 3.6 .3 3.6 .3 4.6 .71998 ............................................................................ 4.3 .6 4.3 .6 4.5 .6 3.5 .31999 ............................................................................ 3.4 .3 3.7 .5 3.4 .7 4.0 .7
Nonmanufacturing, blue-collar occupations:1995 ............................................................................ 2.9 .3 3.0 .3 2.6 .3 2.9 .31996 ............................................................................ 2.9 .3 3.0 .2 2.5 .2 2.8 .21997 ............................................................................ 2.6 .3 2.9 .4 3.3 .3 3.2 .31998 ............................................................................ 3.3 .3 3.2 .3 3.2 .3 3.1 .31999 ............................................................................ 3.3 .3 3.5 .4 3.5 .3 3.6 .2
Nonmanufacturing, service occupations:1995 ............................................................................ 2.5 .5 2.7 .4 2.8 .5 2.2 .21996 ............................................................................ 2.3 .3 2.4 .3 2.7 .4 3.5 .41997 ............................................................................ 3.6 .4 3.8 .4 4.7 .3 4.3 .41998 ............................................................................ 4.4 .3 4.3 .6 3.4 .3 3.2 .31999 ............................................................................ 3.4 .4 3.6 .3 2.8 .5 3.3 .4
Union workers:1995 ............................................................................ 2.8 .2 2.6 .2 2.4 .2 2.6 .21996 ............................................................................ 2.5 .2 3.0 .7 2.7 .7 2.6 .91997 ............................................................................ 2.6 .8 2.2 .3 2.8 .2 2.8 .21998 ............................................................................ 2.9 .2 3.0 .2 3.2 .3 3.3 .41999 ............................................................................ 3.1 .4 3.1 .4 2.5 .2 2.6 .2
Union workers, goods-producing industries2:1995 ............................................................................ 2.6 .2 2.2 .3 2.3 .2 2.3 .31996 ............................................................................ 2.4 .3 2.7 .2 2.5 .3 2.5 .21997 ............................................................................ 2.3 .1 2.4 .2 2.8 .2 2.8 .21998 ............................................................................ 3.1 .3 3.2 .3 3.5 .3 3.6 .31999 ............................................................................ 3.4 .3 3.4 .3 3.0 .3 3.3 .3
Union workers, service-producing industries:1995 ............................................................................ 3.1 .4 3.0 .4 2.6 .4 3.0 .21996 ............................................................................ 2.6 .3 3.2 1.7 2.9 1.8 2.7 2.0
See footnotes at end of table.
151
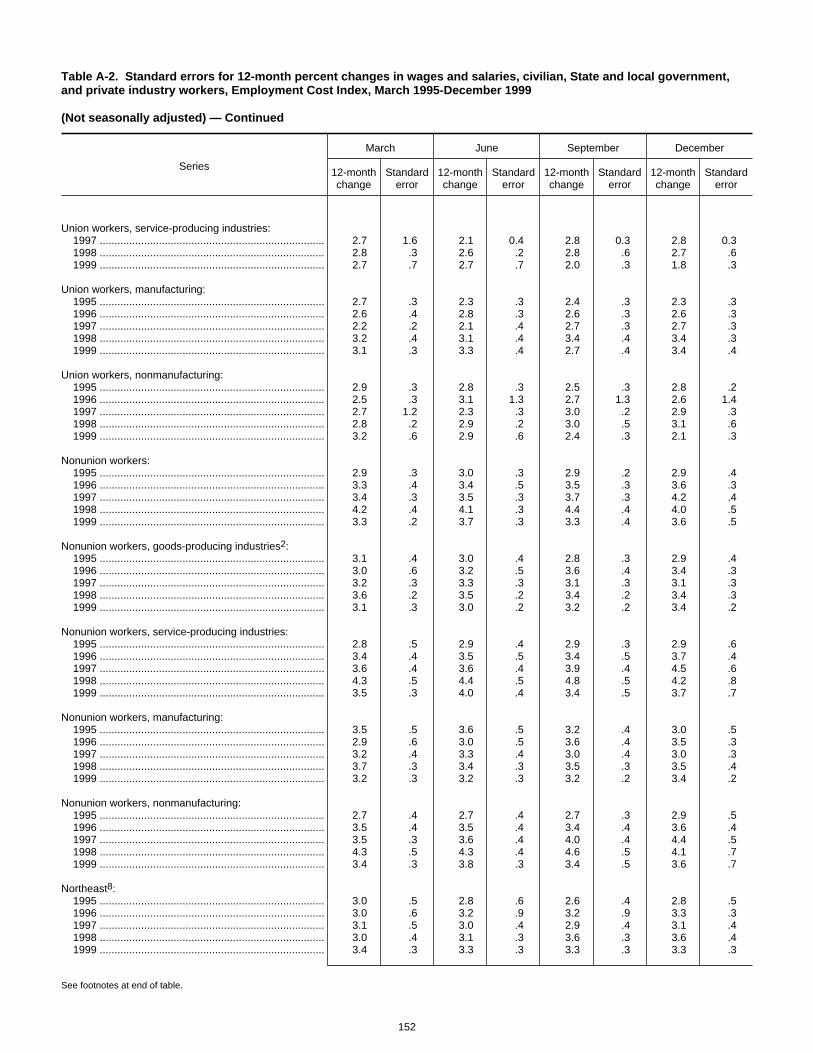
Table A-2. Standard errors for 12-month percent changes in wages and salaries, civilian, State and local government,and private industry workers, Employment Cost Index, March 1995-December 1999
(Not seasonally adjusted) — Continued
Series
March June September December
12-monthchange
Standarderror
12-monthchange
Standarderror
12-monthchange
Standarderror
12-monthchange
Standarderror
Union workers, service-producing industries:1997 ............................................................................ 2.7 1.6 2.1 0.4 2.8 0.3 2.8 0.31998 ............................................................................ 2.8 .3 2.6 .2 2.8 .6 2.7 .61999 ............................................................................ 2.7 .7 2.7 .7 2.0 .3 1.8 .3
Union workers, manufacturing:1995 ............................................................................ 2.7 .3 2.3 .3 2.4 .3 2.3 .31996 ............................................................................ 2.6 .4 2.8 .3 2.6 .3 2.6 .31997 ............................................................................ 2.2 .2 2.1 .4 2.7 .3 2.7 .31998 ............................................................................ 3.2 .4 3.1 .4 3.4 .4 3.4 .31999 ............................................................................ 3.1 .3 3.3 .4 2.7 .4 3.4 .4
Union workers, nonmanufacturing:1995 ............................................................................ 2.9 .3 2.8 .3 2.5 .3 2.8 .21996 ............................................................................ 2.5 .3 3.1 1.3 2.7 1.3 2.6 1.41997 ............................................................................ 2.7 1.2 2.3 .3 3.0 .2 2.9 .31998 ............................................................................ 2.8 .2 2.9 .2 3.0 .5 3.1 .61999 ............................................................................ 3.2 .6 2.9 .6 2.4 .3 2.1 .3
Nonunion workers:1995 ............................................................................ 2.9 .3 3.0 .3 2.9 .2 2.9 .41996 ............................................................................ 3.3 .4 3.4 .5 3.5 .3 3.6 .31997 ............................................................................ 3.4 .3 3.5 .3 3.7 .3 4.2 .41998 ............................................................................ 4.2 .4 4.1 .3 4.4 .4 4.0 .51999 ............................................................................ 3.3 .2 3.7 .3 3.3 .4 3.6 .5
Nonunion workers, goods-producing industries2:1995 ............................................................................ 3.1 .4 3.0 .4 2.8 .3 2.9 .41996 ............................................................................ 3.0 .6 3.2 .5 3.6 .4 3.4 .31997 ............................................................................ 3.2 .3 3.3 .3 3.1 .3 3.1 .31998 ............................................................................ 3.6 .2 3.5 .2 3.4 .2 3.4 .31999 ............................................................................ 3.1 .3 3.0 .2 3.2 .2 3.4 .2
Nonunion workers, service-producing industries:1995 ............................................................................ 2.8 .5 2.9 .4 2.9 .3 2.9 .61996 ............................................................................ 3.4 .4 3.5 .5 3.4 .5 3.7 .41997 ............................................................................ 3.6 .4 3.6 .4 3.9 .4 4.5 .61998 ............................................................................ 4.3 .5 4.4 .5 4.8 .5 4.2 .81999 ............................................................................ 3.5 .3 4.0 .4 3.4 .5 3.7 .7
Nonunion workers, manufacturing:1995 ............................................................................ 3.5 .5 3.6 .5 3.2 .4 3.0 .51996 ............................................................................ 2.9 .6 3.0 .5 3.6 .4 3.5 .31997 ............................................................................ 3.2 .4 3.3 .4 3.0 .4 3.0 .31998 ............................................................................ 3.7 .3 3.4 .3 3.5 .3 3.5 .41999 ............................................................................ 3.2 .3 3.2 .3 3.2 .2 3.4 .2
Nonunion workers, nonmanufacturing:1995 ............................................................................ 2.7 .4 2.7 .4 2.7 .3 2.9 .51996 ............................................................................ 3.5 .4 3.5 .4 3.4 .4 3.6 .41997 ............................................................................ 3.5 .3 3.6 .4 4.0 .4 4.4 .51998 ............................................................................ 4.3 .5 4.3 .4 4.6 .5 4.1 .71999 ............................................................................ 3.4 .3 3.8 .3 3.4 .5 3.6 .7
Northeast8:1995 ............................................................................ 3.0 .5 2.8 .6 2.6 .4 2.8 .51996 ............................................................................ 3.0 .6 3.2 .9 3.2 .9 3.3 .31997 ............................................................................ 3.1 .5 3.0 .4 2.9 .4 3.1 .41998 ............................................................................ 3.0 .4 3.1 .3 3.6 .3 3.6 .41999 ............................................................................ 3.4 .3 3.3 .3 3.3 .3 3.3 .3
See footnotes at end of table.
152
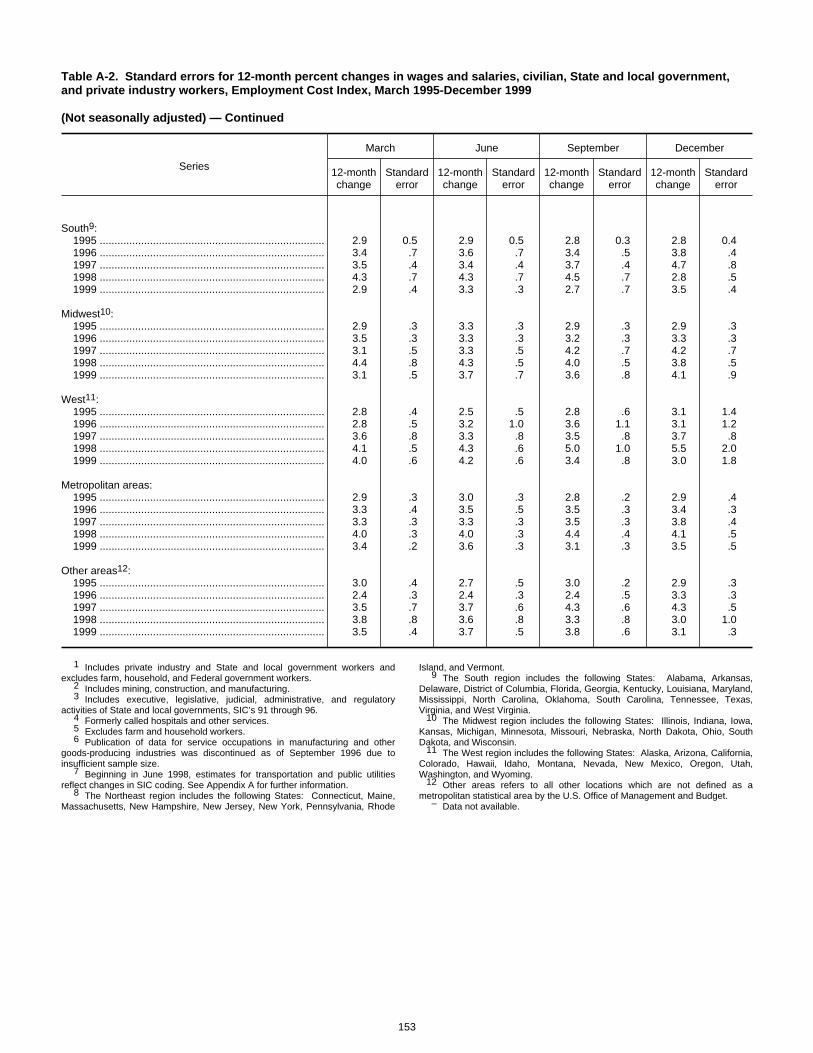
Table A-2. Standard errors for 12-month percent changes in wages and salaries, civilian, State and local government,and private industry workers, Employment Cost Index, March 1995-December 1999
(Not seasonally adjusted) — Continued
Series
March June September December
12-monthchange
Standarderror
12-monthchange
Standarderror
12-monthchange
Standarderror
12-monthchange
Standarderror
South9:1995 ............................................................................ 2.9 0.5 2.9 0.5 2.8 0.3 2.8 0.41996 ............................................................................ 3.4 .7 3.6 .7 3.4 .5 3.8 .41997 ............................................................................ 3.5 .4 3.4 .4 3.7 .4 4.7 .81998 ............................................................................ 4.3 .7 4.3 .7 4.5 .7 2.8 .51999 ............................................................................ 2.9 .4 3.3 .3 2.7 .7 3.5 .4
Midwest10:1995 ............................................................................ 2.9 .3 3.3 .3 2.9 .3 2.9 .31996 ............................................................................ 3.5 .3 3.3 .3 3.2 .3 3.3 .31997 ............................................................................ 3.1 .5 3.3 .5 4.2 .7 4.2 .71998 ............................................................................ 4.4 .8 4.3 .5 4.0 .5 3.8 .51999 ............................................................................ 3.1 .5 3.7 .7 3.6 .8 4.1 .9
West11:1995 ............................................................................ 2.8 .4 2.5 .5 2.8 .6 3.1 1.41996 ............................................................................ 2.8 .5 3.2 1.0 3.6 1.1 3.1 1.21997 ............................................................................ 3.6 .8 3.3 .8 3.5 .8 3.7 .81998 ............................................................................ 4.1 .5 4.3 .6 5.0 1.0 5.5 2.01999 ............................................................................ 4.0 .6 4.2 .6 3.4 .8 3.0 1.8
Metropolitan areas:1995 ............................................................................ 2.9 .3 3.0 .3 2.8 .2 2.9 .41996 ............................................................................ 3.3 .4 3.5 .5 3.5 .3 3.4 .31997 ............................................................................ 3.3 .3 3.3 .3 3.5 .3 3.8 .41998 ............................................................................ 4.0 .3 4.0 .3 4.4 .4 4.1 .51999 ............................................................................ 3.4 .2 3.6 .3 3.1 .3 3.5 .5
Other areas12:1995 ............................................................................ 3.0 .4 2.7 .5 3.0 .2 2.9 .31996 ............................................................................ 2.4 .3 2.4 .3 2.4 .5 3.3 .31997 ............................................................................ 3.5 .7 3.7 .6 4.3 .6 4.3 .51998 ............................................................................ 3.8 .8 3.6 .8 3.3 .8 3.0 1.01999 ............................................................................ 3.5 .4 3.7 .5 3.8 .6 3.1 .3
1 Includes private industry and State and local government workers andexcludes farm, household, and Federal government workers.
2 Includes mining, construction, and manufacturing.3 Includes executive, legislative, judicial, administrative, and regulatory
activities of State and local governments, SIC’s 91 through 96.4 Formerly called hospitals and other services.5 Excludes farm and household workers.6 Publication of data for service occupations in manufacturing and other
goods-producing industries was discontinued as of September 1996 due toinsufficient sample size.
7 Beginning in June 1998, estimates for transportation and public utilitiesreflect changes in SIC coding. See Appendix A for further information.
8 The Northeast region includes the following States: Connecticut, Maine,Massachusetts, New Hampshire, New Jersey, New York, Pennsylvania, Rhode
Island, and Vermont.9 The South region includes the following States: Alabama, Arkansas,
Delaware, District of Columbia, Florida, Georgia, Kentucky, Louisiana, Maryland,Mississippi, North Carolina, Oklahoma, South Carolina, Tennessee, Texas,Virginia, and West Virginia.
10 The Midwest region includes the following States: Illinois, Indiana, Iowa,Kansas, Michigan, Minnesota, Missouri, Nebraska, North Dakota, Ohio, SouthDakota, and Wisconsin.
11 The West region includes the following States: Alaska, Arizona, California,Colorado, Hawaii, Idaho, Montana, Nevada, New Mexico, Oregon, Utah,Washington, and Wyoming.
12 Other areas refers to all other locations which are not defined as ametropolitan statistical area by the U.S. Office of Management and Budget.
– Data not available.
153
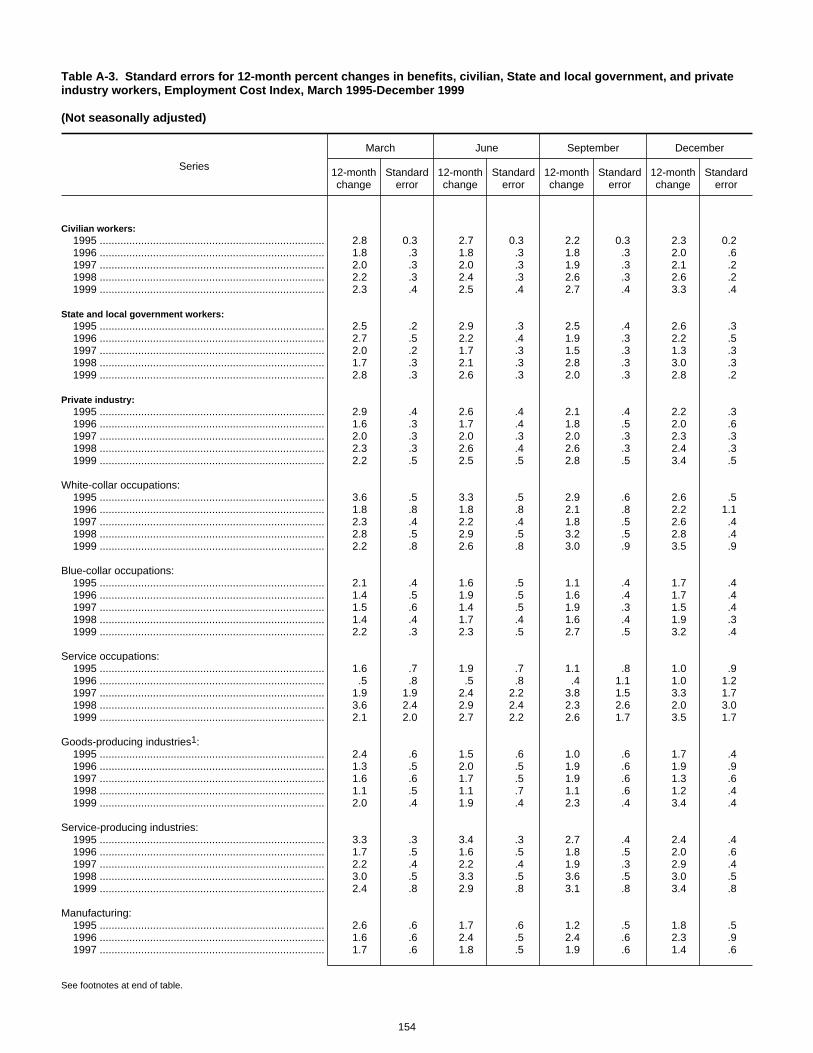
Table A-3. Standard errors for 12-month percent changes in benefits, civilian, State and local government, and privateindustry workers, Employment Cost Index, March 1995-December 1999
(Not seasonally adjusted)
Series
March June September December
12-monthchange
Standarderror
12-monthchange
Standarderror
12-monthchange
Standarderror
12-monthchange
Standarderror
Civilian workers:1995 ............................................................................ 2.8 0.3 2.7 0.3 2.2 0.3 2.3 0.21996 ............................................................................ 1.8 .3 1.8 .3 1.8 .3 2.0 .61997 ............................................................................ 2.0 .3 2.0 .3 1.9 .3 2.1 .21998 ............................................................................ 2.2 .3 2.4 .3 2.6 .3 2.6 .21999 ............................................................................ 2.3 .4 2.5 .4 2.7 .4 3.3 .4
State and local government workers:1995 ............................................................................ 2.5 .2 2.9 .3 2.5 .4 2.6 .31996 ............................................................................ 2.7 .5 2.2 .4 1.9 .3 2.2 .51997 ............................................................................ 2.0 .2 1.7 .3 1.5 .3 1.3 .31998 ............................................................................ 1.7 .3 2.1 .3 2.8 .3 3.0 .31999 ............................................................................ 2.8 .3 2.6 .3 2.0 .3 2.8 .2
Private industry:1995 ............................................................................ 2.9 .4 2.6 .4 2.1 .4 2.2 .31996 ............................................................................ 1.6 .3 1.7 .4 1.8 .5 2.0 .61997 ............................................................................ 2.0 .3 2.0 .3 2.0 .3 2.3 .31998 ............................................................................ 2.3 .3 2.6 .4 2.6 .3 2.4 .31999 ............................................................................ 2.2 .5 2.5 .5 2.8 .5 3.4 .5
White-collar occupations:1995 ............................................................................ 3.6 .5 3.3 .5 2.9 .6 2.6 .51996 ............................................................................ 1.8 .8 1.8 .8 2.1 .8 2.2 1.11997 ............................................................................ 2.3 .4 2.2 .4 1.8 .5 2.6 .41998 ............................................................................ 2.8 .5 2.9 .5 3.2 .5 2.8 .41999 ............................................................................ 2.2 .8 2.6 .8 3.0 .9 3.5 .9
Blue-collar occupations:1995 ............................................................................ 2.1 .4 1.6 .5 1.1 .4 1.7 .41996 ............................................................................ 1.4 .5 1.9 .5 1.6 .4 1.7 .41997 ............................................................................ 1.5 .6 1.4 .5 1.9 .3 1.5 .41998 ............................................................................ 1.4 .4 1.7 .4 1.6 .4 1.9 .31999 ............................................................................ 2.2 .3 2.3 .5 2.7 .5 3.2 .4
Service occupations:1995 ............................................................................ 1.6 .7 1.9 .7 1.1 .8 1.0 .91996 ............................................................................ .5 .8 .5 .8 .4 1.1 1.0 1.21997 ............................................................................ 1.9 1.9 2.4 2.2 3.8 1.5 3.3 1.71998 ............................................................................ 3.6 2.4 2.9 2.4 2.3 2.6 2.0 3.01999 ............................................................................ 2.1 2.0 2.7 2.2 2.6 1.7 3.5 1.7
Goods-producing industries1:1995 ............................................................................ 2.4 .6 1.5 .6 1.0 .6 1.7 .41996 ............................................................................ 1.3 .5 2.0 .5 1.9 .6 1.9 .91997 ............................................................................ 1.6 .6 1.7 .5 1.9 .6 1.3 .61998 ............................................................................ 1.1 .5 1.1 .7 1.1 .6 1.2 .41999 ............................................................................ 2.0 .4 1.9 .4 2.3 .4 3.4 .4
Service-producing industries:1995 ............................................................................ 3.3 .3 3.4 .3 2.7 .4 2.4 .41996 ............................................................................ 1.7 .5 1.6 .5 1.8 .5 2.0 .61997 ............................................................................ 2.2 .4 2.2 .4 1.9 .3 2.9 .41998 ............................................................................ 3.0 .5 3.3 .5 3.6 .5 3.0 .51999 ............................................................................ 2.4 .8 2.9 .8 3.1 .8 3.4 .8
Manufacturing:1995 ............................................................................ 2.6 .6 1.7 .6 1.2 .5 1.8 .51996 ............................................................................ 1.6 .6 2.4 .5 2.4 .6 2.3 .91997 ............................................................................ 1.7 .6 1.8 .5 1.9 .6 1.4 .6
See footnotes at end of table.
154
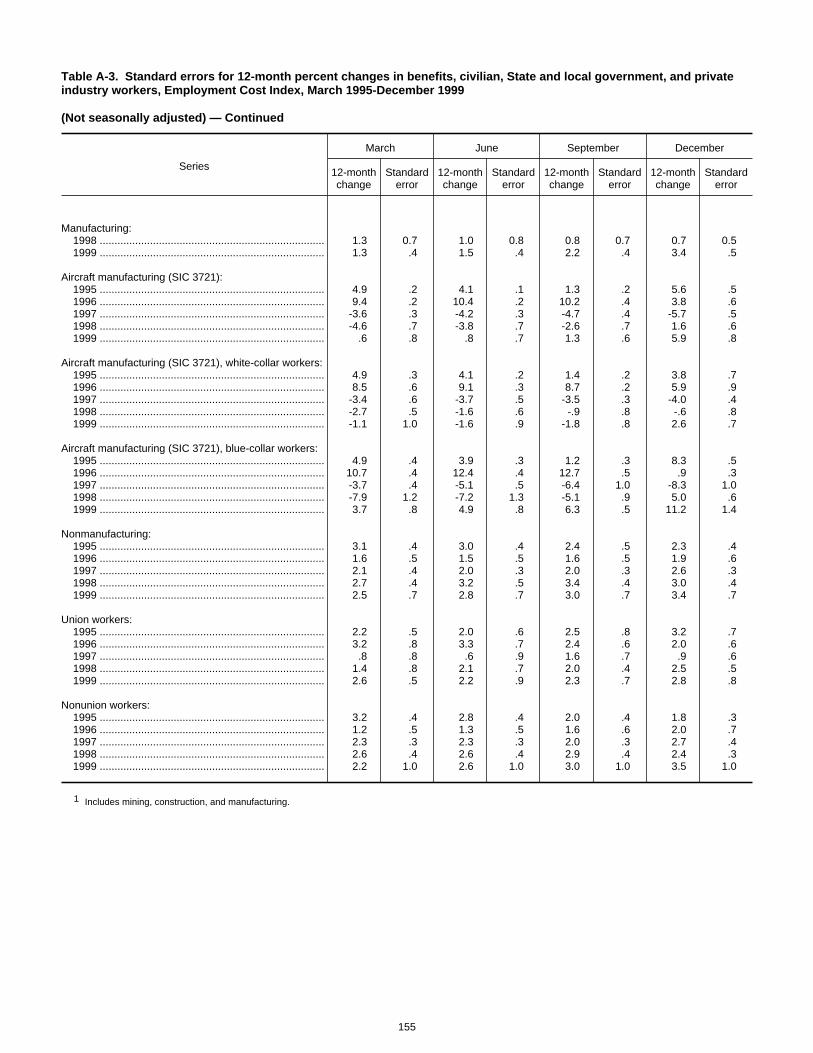
Table A-3. Standard errors for 12-month percent changes in benefits, civilian, State and local government, and privateindustry workers, Employment Cost Index, March 1995-December 1999
(Not seasonally adjusted) — Continued
Series
March June September December
12-monthchange
Standarderror
12-monthchange
Standarderror
12-monthchange
Standarderror
12-monthchange
Standarderror
Manufacturing:1998 ............................................................................ 1.3 0.7 1.0 0.8 0.8 0.7 0.7 0.51999 ............................................................................ 1.3 .4 1.5 .4 2.2 .4 3.4 .5
Aircraft manufacturing (SIC 3721):1995 ............................................................................ 4.9 .2 4.1 .1 1.3 .2 5.6 .51996 ............................................................................ 9.4 .2 10.4 .2 10.2 .4 3.8 .61997 ............................................................................ -3.6 .3 -4.2 .3 -4.7 .4 -5.7 .51998 ............................................................................ -4.6 .7 -3.8 .7 -2.6 .7 1.6 .61999 ............................................................................ .6 .8 .8 .7 1.3 .6 5.9 .8
Aircraft manufacturing (SIC 3721), white-collar workers:1995 ............................................................................ 4.9 .3 4.1 .2 1.4 .2 3.8 .71996 ............................................................................ 8.5 .6 9.1 .3 8.7 .2 5.9 .91997 ............................................................................ -3.4 .6 -3.7 .5 -3.5 .3 -4.0 .41998 ............................................................................ -2.7 .5 -1.6 .6 -.9 .8 -.6 .81999 ............................................................................ -1.1 1.0 -1.6 .9 -1.8 .8 2.6 .7
Aircraft manufacturing (SIC 3721), blue-collar workers:1995 ............................................................................ 4.9 .4 3.9 .3 1.2 .3 8.3 .51996 ............................................................................ 10.7 .4 12.4 .4 12.7 .5 .9 .31997 ............................................................................ -3.7 .4 -5.1 .5 -6.4 1.0 -8.3 1.01998 ............................................................................ -7.9 1.2 -7.2 1.3 -5.1 .9 5.0 .61999 ............................................................................ 3.7 .8 4.9 .8 6.3 .5 11.2 1.4
Nonmanufacturing:1995 ............................................................................ 3.1 .4 3.0 .4 2.4 .5 2.3 .41996 ............................................................................ 1.6 .5 1.5 .5 1.6 .5 1.9 .61997 ............................................................................ 2.1 .4 2.0 .3 2.0 .3 2.6 .31998 ............................................................................ 2.7 .4 3.2 .5 3.4 .4 3.0 .41999 ............................................................................ 2.5 .7 2.8 .7 3.0 .7 3.4 .7
Union workers:1995 ............................................................................ 2.2 .5 2.0 .6 2.5 .8 3.2 .71996 ............................................................................ 3.2 .8 3.3 .7 2.4 .6 2.0 .61997 ............................................................................ .8 .8 .6 .9 1.6 .7 .9 .61998 ............................................................................ 1.4 .8 2.1 .7 2.0 .4 2.5 .51999 ............................................................................ 2.6 .5 2.2 .9 2.3 .7 2.8 .8
Nonunion workers:1995 ............................................................................ 3.2 .4 2.8 .4 2.0 .4 1.8 .31996 ............................................................................ 1.2 .5 1.3 .5 1.6 .6 2.0 .71997 ............................................................................ 2.3 .3 2.3 .3 2.0 .3 2.7 .41998 ............................................................................ 2.6 .4 2.6 .4 2.9 .4 2.4 .31999 ............................................................................ 2.2 1.0 2.6 1.0 3.0 1.0 3.5 1.0
1 Includes mining, construction, and manufacturing.
155

Table A-4. Employment Cost Index seasonal factors, 2000
Series March June September December
State and local governmentsWages and salaries .................................................. 99.964 99.446 100.335 100.258Benefit costs ............................................................. 100.108 99.778 100.071 100.043
Private industry:White-collar workers:
Compensation ...................................................... 99.988 99.954 100.081 99.993Wages and salaries .............................................. 99.953 99.976 100.091 99.993Benefit costs ......................................................... 99.953 99.998 100.016 100.012
Blue-collar workers:Compensation ...................................................... 99.933 100.086 100.077 99.909Benefit costs ......................................................... 99.793 100.081 100.081 100.052
Service workers:Benefit costs ......................................................... 100.055 100.043 100.037 99.844
Goods-producing industries:Benefit costs ......................................................... 99.976 100.076 99.990 99.963
Construction: Compensation ................................................... 99.837 100.179 100.197 99.786 Wages and salaries ........................................... 99.807 100.173 100.228 99.785
Manufacturing: Benefit costs ...................................................... 100.009 100.052 99.928 100.022
Durable goods: Compensation ................................................. 99.945 99.980 100.020 100.063
Nondurable goods: Compensation ................................................. 100.142 100.031 99.939 99.888 Wages and salaries ......................................... 100.132 100.022 99.929 99.918
Service-producing industries:Wages and salaries .............................................. 99.984 99.990 100.072 99.967Benefit costs ......................................................... 100.037 100.025 100.069 99.875
Transportation and public utilities: Compensation ................................................... 100.102 99.947 100.046 99.908 Wages and salaries ........................................... 100.041 99.840 100.101 100.026
Wholesale trade: Compensation ................................................... 99.964 100.072 100.029 99.941 Wages and salaries ........................................... 99.846 99.954 100.062 100.167
Retail trade: Compensation ................................................... 99.877 100.129 100.253 99.745 Wages and salaries ........................................... 99.873 100.167 100.199 99.761
Services: Compensation ................................................... 99.974 99.907 100.045 100.089 Wages and salaries ........................................... 100.055 99.909 100.006 100.037
Nonmanufacturing industries:Compensation ...................................................... 99.957 100.002 100.112 99.943Wages and salaries .............................................. 99.988 99.956 100.101 99.962Benefit costs ......................................................... 99.977 100.015 100.044 99.976
Note: The seasonal factors shown in this table are for seasonal adjustmentsthat are made directly to unadjusted Employment Cost Index series. Seasonal factors for higher level seasonally adjusted indexes are not shownbecause they are implicit factors derived from lower level components.
Seasonal factors for wages and salaries of service occupations have beendeleted from this table because the series no longer meets the criteria foridentifiable and stable seasonality.
156
157
BLS and other Federal agencies follow common systemsto classify establishments and occupations by industry
and occupational group, geographic region, union status,and area size. This appendix briefly describes these classi-fication systems as they apply to the ECI.
IndustryEstablishments in the ECI survey are classified in industrycategories on the basis of the 1987 Standard Industrial Clas-sification (SIC) Manual maintained by the Office of Man-agement and Budget. An establishment is an economic unit,generally a single physical location, in which business isconducted or in which services or industrial operations areperformed. SIC designation normally is based on the pri-mary activity of the establishment.
The industry categories for which data are available fromthe ECI are composed of the following groups of industriesas defined by the SIC manual:
Industry Category SIC’s
Civilian ......................................................... 10-96
State and local governments ........................ 10-96
Private Industry ............................................ 10-89
Goods-producing industries ......................... 10-39
Construction ................................................. 15-17
Manufacturing .............................................. 20-39Durables ........................................................ 24,25,32-39Nondurables .................................................. 20-23,26-31
Service-producing industries ....................... 40-89
Transportation and public utilities ............... 40-49Transportation.......................................... 40-47Public utilities ........................................... 48-49Communications ....................................... 48Electric, gas, and sanitary services ........... 49
Wholesale and retail trade ........................... 50-59Wholesale trade ........................................ 50-51Retail trade ................................................ 52-59General merchandise stores ...................... 53Food stores ................................................ 54
APPENDIX B. Classification by Industry,Occupation, Geographic Region, Union Status,and Area Size
Industry Category SIC’s
Finance, insurance and real estate ............... 60-67Banking, savings and loan, other credit agencies ........................................ 60-61Insurance ................................................... 63-64
Service industries ......................................... 70-89Business services ...................................... 73Health services .......................................... 80Nursing homes .......................................... 805Hospitals ................................................... 806Educational services ................................. 82Schools ......................................................821,822Elementary and secondary ........................ 821Higher education....................................... 822
Public administration ................................... 90-96
OccupationThe ECI classifies occupations into categories defined forthe 1990 Census of Population, which in turn uses Stan-dard Occupational Classification (SOC) occupational group-ings. The following shows the types of occupations thatmake up each of the major occupational groups (in all cases,supervisors are included with the occupation supervised):
Professional specialty occupationsEngineers, architects, and surveyorsMathematical and computer scientistsNatural scientistsHealth diagnosing occupations (physicians, dentists, etc.)Health assessment and treating occupations (registered
nurses, pharmacists, physical therapists, etc.)TeachersLibrarians, archivists, and curatorsSocial scientists and urban plannersSocial, recreation, and religious workersLawyers and judgesWriters, authors, entertainers, and athletes
Technical occupationsHealth technologists and techniciansEngineering and related technologists and technicians
158
Science techniciansMiscellaneous technicians
Executive, administrative, and managerial occupa-tions
Sales occupationsSales workersSales representativesCashiers
Administrative support including clericalComputer equipment operatorsSecretaries, stenographers, and typistsInformation clerksRecords processing clerksDuplicating, mail, and other office machine operatorsMaterial recording, scheduling, and distribution clerksAdjusters and investigators
Precision production, craft, and repair occupations
Mechanics and repairersConstruction trades occupationsExtractive occupationsPrecision metalworking, woodworking, textile, apparel,and other materials occupations
Precision inspectors, testers, and related occupationsPlant and system operators
Machine operators, assemblers, and inspectorsMetalworking, plastic working, and woodworking ma-chine operators
Printing machine operatorsTextile, apparel, and finishing machine operatorsMachine operators, other materialsFabricators, assemblers, and hand working occupa-tions
Production inspectors, testers, samplers, and weighers
Transportation and material moving occupations
Motor vehicle operators Railroad and water transportation operators Moving equipment operators
Handlers, equipment cleaners, helpers, and laborers
Service occupationsProtective service occupationsFood service occupationsHealth service occupations (e.g., health aides and nurs-ing aides)
Cleaning and building service occupationsPersonal service occupations (e.g., barbers, hairdress-ers, and ushers)
NOTE: White collar includes professional specialty andtechnical; executive, administrative, and managerial; sales;and administrative support including clerical. Blue collarincludes precision production, craft, and repair; machineoperators, assemblers, and inspectors; transportation andmaterial moving; and handlers, equipment cleaners, help-ers, and laborers. Production and nonsupervisory includesall workers except white-collar in goods-producing indus-tries and executive, administrative, and managerial in ser-vice-producing industries.
Geographic regionThe four regions for which ECI indexes and cost levels arepublished correspond to the four census regions. The Statecomposition of those regions is as follows:
Northeast—Connecticut, Maine, Massachusetts, NewHampshire, New Jersey, New York, Pennsylvania, RhodeIsland, and Vermont; South—Alabama, Arkansas, Dela-ware, District of Columbia, Florida, Georgia, Kentucky,Louisiana, Maryland, Mississippi, North Carolina, Okla-homa, South Carolina, Tennessee, Texas, Virginia, and WestVirginia; Midwest—Illinois, Indiana, Iowa, Kansas, Michi-gan, Minnesota, Missouri, Nebraska, North Dakota, Ohio,South Dakota, and Wisconsin; and West—Alaska, Arizona,California, Colorado, Hawaii, Idaho, Montana, Nevada,New Mexico, Oregon, Utah, Washington, and Wyoming.
Union statusUnion status is determined separately for each occupationin an establishment. An occupation is considered “union”if all of the following conditions are met:
• A labor organization is recognized as the bargainingagent for workers in the occupation.
• Wage and salary rates are determined through collec-tive bargaining or negotiations
• Settlement terms, which must include wage provi-sions and may include benefit provisions, are em-bodied in a signed, mutually binding collective bar-gaining agreement. (Not all employees of he respec-tive occupation need to belong to the union.)
Metropolitan area designationEach establishment is classified as being either within ametropolitan area or not. The classification is based on the1990 metropolitan area definitions of the U.S. Office ofManagement and Budget.
159
The tables published in this bulletin present the majorfindings of the Employment Cost Index data series.
Survey data also are available in BLS research articles, newsreleases, special bulletins, reports, and electronic media.Articles based on the ECI are published occasionally in theBureau’s Monthly Labor Review and Compensation andWorking Conditions periodicals. The following articles aboutthe ECI are presented here:
Technical aspects of the ECI:Lettau, Michael K., Loewenstein, Mark A., and Cushner,Aaron. “Is the ECI sensitive to the method of aggregation?”Monthly Labor Review, June 1997, pp. 3-11.
O’Conor, Karen and Wong, William. “Measuring the pre-cision of the Employment Cost Index,” Monthly Labor Re-view, March 1989, pp. 29-36.
Schwenk, Albert E. “Employment Cost Index rebased toJune 1989,” Monthly Labor Review, April 1990, pp. 38-39.
Schwenk, Albert E. “Introducing 1990 Weights for theEmployment Cost Index,” Compensation and Working Con-ditions, June 1995, pp. 1-5.
Wood, G. Donald. “Estimation procedures for the Employ-ment Cost Index,” Monthly Labor Review, May 1982, pp.40-42.
Appendix C. Selected ResearchArticles
Analysis of ECI data:Schwenk, Albert E. “Trends in the Differences BetweenUnion and Nonunion Workers in Pay Using the Employ-ment Cost Index,” Compensation and Working Conditions,September 1996, pp. 27-33.
Schwenk, Albert E. “Differences Among Private IndustryOccupational Groups in Pay Levels and Trends,” Compen-sation and Working Conditions, Winter 1997, pp. 12-18.
Schwenk, Albert E. “Measuring Trends in the Structureand Levels of Employer Costs for Employee Compensa-tion,” Compensation and Working Conditions, Summer1997, pp. 3-14.
Schwenk, Albert E. “Trends in Health Insurance Costs,”Compensation and Working Conditions, Spring 1999, pp.24-27.
Schwenk, Albert E. “Compensation Cost Trends in PrivateIndustry and State and Local Governments,” Compensa-tion and Working Conditions, Fall 1999, pp. 13-18.
Shelly, Wayne M. “Comparing Trends in Components ofthe Employment Cost Index,” Compensation and WorkingConditions, Summer 1997, pp. 44-51.
Uses of ECI data:Schwenk, Albert E. “Escalation in Employer Costs for Em-ployee Compensation: A Guide for Contracting Parties,” Com-pensation and Working Conditions, Spring 1997, pp. 3-10.

Employment Cost Indexes,1975-99
Please Note: All selected articles which include (1) Technical aspects ofthe ECI, (2) Analysis of ECI data and (3) Uses of ECI data may beobtained by emailing [email protected] or by calling (202) 691-6199.


![FACTSHEET: PAYMENT OF WAGES AND SALARIES · 1. WHERE CAN I FIND THE LAWS ON PAYMENT OF WAGES AND SALARIES? Part 5 of the Employment Act [Cap 160] (the Act) provides the law on how](https://static.fdocuments.in/doc/165x107/608c1dfe9b8a7c4a260f3af3/factsheet-payment-of-wages-and-salaries-1-where-can-i-find-the-laws-on-payment.jpg)