EMPLOYMENT AND TRAINING ADMINISTRATION - DOL
42
STUDY OF SERVICES AND OUTCOMES: YOUTH OFFENDER DEMONSTRATION GRANT PROJECTS, ROUND I EMPLOYMENT AND TRAINING ADMINISTRATION ____________________________________________________ REPORT NO.: 2E-03-356-0001 DATE ISSUED: March 29, 2002
Transcript of EMPLOYMENT AND TRAINING ADMINISTRATION - DOL

STUDY OF SERVICES AND OUTCOMES: YOUTH OFFENDER DEMONSTRATION
GRANT PROJECTS, ROUND I
EMPLOYMENT AND TRAINING ADMINISTRATION
____________________________________________________
REPORT NO.: 2E-03-356-0001 DATE ISSUED: March 29, 2002

i
TABLE OF CONTENTS
ACRONYMS AND GLOSSARY ............................................................................................ ii EXECUTIVE SUMMARY ......................................................................................................iv BACKGROUND .......................................................................................................................1 PURPOSE, SCOPE AND METHODOLOGY.........................................................................2 FINDINGS AND RECOMMENDATIONS ............................................................................4
Finding A – Differing Types, Intensity and Duration of Services Influence Project Outcomes ................................................................................................... 4
Finding B – Youth Are Not Provided with Comparable Opportunities to Stay and
Succeed in the Projects. ........................................................................... 11
APPENDICES Appendix A – Technical/Methodological Issues ...................................................................15 Appendix B – Selected Bibliography ...................................................................................24 Appendix C – Agency Response .........................................................................................26

ii
ACRONYMS AND GLOSSARY
ACRONYMS DOL United States Department of Labor ETA Employment and Training Administration GED General Equivalency Diploma GOTR Grant Officer’s Technical Representative OIG Office of Inspector General OJJDP Office of Juvenile Justice and Delinquency Prevention UI Unemployment Insurance YODP Youth Offender Demonstration Projects GLOSSARY Chi-square test Statistical test to examine hypotheses about data that
are best summarized by a cross tabulation of two or more variables.
Criminal Justice Involvement Incidence or reoccurrence of arrest, probation, and
incarceration either before or during project participation.
Discriminant Analysis A function for computing a new variable or index that
will parsimoniously represent the differences between two or more groups.
Intensity and Duration of Services Also referred to as “Level of Service.”
None - Did not receive services; may or may not have filled out application for project. Low - Received intake services and limited counseling and employment/educational referrals for less than 3 months. Medium - Received continuous counseling and referrals, for 3 to 6 months.

iii
High - Received intake services, employment and educational counseling and referrals, job development, training and follow-up for 6 months and over.
Juvenile Justice Involvement Incidence or reoccurrence of juvenile arrest, probation,
and incarceration either before or during project participation.
Level of Job Placement None – Did not receive job placement.
Low – Remained in job placement under 3 months. Medium – Remained in job placement from 3 – 6 months. High – Remained in job placement for at least 6 months continuously.
Pearson’s Correlation Coefficient Measurement of the strength of the linear association
between two variables, utilizing the actual data values. Regression Analysis A mathematical model which summarizes the overall
relationship between two or more variables. Statistical Significance Probability that the difference between two or more
groups of variables is not due to chance; usually expressed at the 95% confidence level.
Subsidized Employment Employment placement in which participants’ wage
earnings are paid by the project. Unsubsidized Employment Employment placement in which participants’ wage
earnings are paid by the employer.

iv
EXECUTIVE SUMMARY
The Employment and Training Administration (ETA), in a joint venture with the U.S. Department of Justice, Office of Juvenile Justice and Delinquency Prevention, developed the Youth Offender Demonstration Projects to provide insights into which strategies are most effective for preventing or intervening in juvenile crime and providing transitional work experiences that will lead to long-term employment. In FY 1999, Congress appropriated $12.5 Million to initiate and develop projects aimed at youth offenders and youth at risk of participating in gang activity. Grants were awarded in a first round for a period of 24 months. In FY 2001, $13.9 million was appropriated to continue 10 of the original 14 projects and to expand to 9 other sites. Currently, ETA has $55 Million earmarked for a third round of Youth Offender grants to begin in FY 2002. This study focused on the results of a nationwide survey of the ETA Youth Offender Demonstration Projects, in order to provide ETA management with independent information regarding project practices and preliminary outcomes. We recognize that the Youth Offender Demonstration sites are learning laboratories, and that the purpose of these pilot sites is to gain experience and insight for future rounds. This project may become either a component of the larger Workforce Investment Act, wherein local boards will voluntarily implement such projects based upon community needs, or may become a permanent ETA program. RESULTS OF STUDY
Analysis of the information and data we gathered, along with our site observations and interviews, revealed that ETA has developed a demonstration project which has offered a wide range of types, intensity and duration of services to its participants. Varying intensity and duration of services resulted in different employment and employability outcomes. Moreover, grant sites varied in their definitions and practices of termination and activity status, resulting in the uneven duration of youth participation. We identified areas where ETA can strengthen its ability to serve project participants. Those areas are identified below. Finding A: Differing Types, Intensity and Duration of Services Influence Project
Outcomes Overall, we found that approximately 24% (or 214) of youth ages 18 – 24 (total sample of 907) were placed in either subsidized or unsubsidized employment during the grant period. Further analysis disclosed that these youth had average earnings of $1,409 per quarter, estimated at $5,637 for a year. Our analysis revealed that participants were three times as likely to find work as a control group who did not receive project services and that participants’ average estimated earnings were higher than those of another DOL youth demonstration project. We determined that the intensity of services provided to youth participants varied across sites and had direct bearing upon employment, long-term employability and in criminal justice involvement. Grantees employed a wide range of types and intensity of employment,

v
educational and related services. The highest level of services produced a thirteen-fold greater outcome in higher job placements than the lowest level of services provided. Further, with the same amount of dollars, different sites provided vastly different services. Those grantee sites that had an infrastructure already set up to work with at-risk youth were able to combine funding to deliver services more effectively. Our analysis indicated that overall, 54% of services provided to participants were of medium or high intensity and duration. We noted that the remainder of services provided were of low intensity and duration (involving minimal intake and very limited counseling and referral services) or none. Of participants receiving low services, the vast majority would have benefited from a greater array, intensity and duration of services. Additionally, we found that repeat criminal and juvenile justice involvement was affected primarily by prior criminal involvement and secondarily, by types of services provided. Further regression analysis revealed that the type of intensive services provided also had an effect on recidivism rates: practices in one particular site proved effective in monitoring and deterring criminal justice involvement. We noted that ETA has been successful in developing and continuing to refine a data reporting system, reportable by grantees to ETA on a quarterly basis. While service provision, educational achievement, criminal justice and cumulative job placement numbers were reported to ETA on a consistent basis during Round I, the reliability of the figures provided by the demonstration sites should be further monitored and verified by ETA in future rounds using a variety of administrative and participant case file review methods and interviews. Finding B: Youth Are Not Provided with Comparable Opportunities to Stay and
Succeed in the Projects We found that not all sites provided their participants with comparable opportunities to succeed in the demonstration, because the policies and practices surrounding enrollment, activity status, duration of services, and termination of youth from the projects were uneven and often arbitrarily defined and applied. Our study indicated that clarified policies on enrollment, activity status, and duration of services would further assist in enhancing service delivery practices and potential outcomes. Our review indicated that the definition of an “enrolled” participant varied across sites and often included no distinction between actual enrollees versus applicants. For actual enrollees, the majority were inactive in the projects at time of our review. Moreover, the majority of youth were enrolled a year or later after the start of the grant period and often, participated for well under one year. Furthermore, some sites had a “no termination” policy; others regularly terminated or placed participants on inactive status for a wide range of reasons. Our review indicated that the definition of an “enrolled” participant included no minimal baseline, with inconsistencies in enrollment numbers attributable in part to a lack of clear distinction in counting enrollees versus applicants. We also found that over 80% of sampled participants were not actively receiving services at the time of our review. We counted as inactive, those youth who had not received services or been in contact with the projects for the

vi
last 90 days. While inactive status does not mean that the participant was never served, we noted myriad challenges surrounding attendance: individual participants and families often move out of the area or cannot be reached; truancy is high and school attendance often poor; youth face problems getting to the projects site; and family and behavioral problems may be involved. Lack of youth attendance in counseling, training sessions, and employment were frequently cited as a problem by project managers and counselors.
Some project managers and counselors described the difficulty in undoing a lifetime of negative influence on a young person and emphasized that the project needed to do more to counter such influences on youth. These staff and managers employed an intensive approach of weekly contact and follow-up, whether at the project site, at their school or library, or at their homes. Others felt that participation in the project could not be enforced and, without demonstrated youth initiative or interest, counselors could opt to terminate a youth for non-attendance. Still others felt that an “empowerment” model meant that with proper counseling and services, youth would be able to “graduate” from the project, often within a year, with a positive termination. Promising practices for improved project participation involved the systematic use of incentives, employed in two of the five sites we visited and associated with improved project participation, which could be more widely adopted. RECOMMENDATIONS We recommend that ETA take the following actions to maximize the effectiveness of service practices on the intended outcomes and goals of the Youth Offender Demonstration Projects: 1. Analyze data across sites to assess the relationship between project practices, participants’
services received and project outcomes. 2. Develop and implement in future rounds a strategy for ensuring that the types, intensity and
duration of services rendered provides project participants with the optimal opportunity to succeed in the project. This should include a defined minimal set of services.
3. Verify and monitor educational achievements and job placements currently reported by
grantees on a quarterly basis, via ETA’s program monitors (GOTRs) through more systematic review of participant case files.
4. Develop a clarified and more consistent set of policies and strategies on enrollment. While
flexibility in locally relevant and innovative services should continue to be encouraged, enrollment should include a baseline of minimum services.
5. Verify and monitor services provided, enrollments, and activity status via ETA’s program
monitors (GOTRs) through more systematic review of participant case files and interviews.
6. Utilize monetary and non-monetary participant incentives, including cash rewards, project points, certificates and achievement recognitions to improve project participation and outcomes.

vii
AGENCY RESPONSE AND OIG CONCLUSION In response to the OIG’s official draft report, ETA generally agreed with our findings and recommendations. As a result of corrective actions planned or already taken by ETA, we consider all six recommendations to be resolved. In addition, recommendations 2 and 4 are closed. The remaining recommendations will be closed after those corrective actions are completed and appropriate documentation is provided, as specified in the report. The agency’s complete response is found in Appendix C.

1
BACKGROUND
The US Department of Labor, in a joint venture with the Office of Juvenile Justice and Delinquency Prevention of the Justice Department, developed the Youth Offender Demonstration Projects to provide insights into which strategies are most effective for preventing or intervening in juvenile crime and providing transitional work experiences that will lead to long-term employment. The central goals of the Youth Offender Demonstration Projects (YODP) are to:
“help youth offenders, gang members and youth at risk of gang involvement between the ages of 14 and 24 attain long-term employment at wage levels that will prevent future dependency and to break the cycle of crime and juvenile delinquency that contributes to recidivism.”
In FY 1999, Congress appropriated $12.5 Million to the Employment and Training Administration (ETA) to initiate and develop projects aimed at youth offenders and youth at risk of participating in gang activity. Grants were awarded in a first round for a period of 24 months, beginning in Fall 1999. In FY 2001, $13.9 million was appropriated to continue 10 of the original 14 projects and to expand to 9 other sites. Currently, ETA has $55 Million earmarked for a third round of Youth Offender grants to begin in FY 2002. There are three categories of projects:
(I) Five operate in large communities and are Model Community Projects awarded $1.5 M
each in Round I. Grants were awarded to five communities where comprehensive community-wide approaches addressing the needs of youth have already been established. Grantees provide a combination of services including gang prevention, gang intervention, gang suppression, and alternative sentencing.
(II) Three grants were awarded to juvenile correctional facilities that are developing a
School-to-Work system, for approximately $1.125 M each in Round I. The projects include work-based and school-based learning, job placement, further education, job training, and supportive services in the home communities to which youth return when they are released from the facilities.
(III) Six are Community-Wide Coordination projects and operate in very small communities
(of between 100,000 and 400,000 populations). ETA awarded grants of $300,000 under this category in Round I. These projects are in areas of high crime and school drop-out rates, high unemployment rates, and high levels of gang activity.
Category I and III sites were both funded to provide alternative sentencing and gang prevention activities, while Category I sites were also funded to provide case management and/or aftercare services.

2
PURPOSE, SCOPE AND
METHODOLOGY PURPOSE This study focused on the results of a nationwide survey of the Employment and Training Administration’s Youth Offender Demonstration Projects, in order to provide ETA management with independent information regarding project practices and preliminary outcomes. We recognized that the Youth Offender Demonstration sites are learning laboratories, and that the purpose of these pilot sites is to gain experience and insight should there be interest in either developing the demonstration into a permanent ETA program or in building a component of it into the larger Workforce Investment Act. We also recognized that the demonstration projects under this model are aimed at assisting youth in impoverished communities facing severe problems of high poverty and unemployment and the inter-relatedness of poverty, juvenile crime, child abuse and neglect, school failure and teen pregnancy. The study collected information on the multiple barriers that project participants face in employment and/or self-sufficiency; the types of employment, educational and related assessment, readiness, and placement services provided; the effectiveness and efficacy of these services; and their relationship to the goals of increasing employment/self sufficiency and reducing recidivism and criminal justice involvement. SCOPE Our study questions were as follows: § How are youth participants in ETA’s Youth Offender Demonstration Projects being
educated, trained and placed in employment? § How do the projects effectively intervene in youths’ school performance, participation
in gang activity, and rates of recidivism? These study questions were designed to assist in understanding how service practices are linked to potential outcomes, in order to inform and improve upon the process of service delivery. METHODOLOGY We analyzed data from all the Category I (Model Community Projects/large cities) and Category III (Community-Wide Coordination/small cities) sites from Round I and wage records maintained by Unemployment Insurance (UI) state offices. We conducted site visit in the following randomly selected cities: Philadelphia, Pennsylvania; Denver, Colorado; Bakersfield and Richmond, California; and Knoxville, Tennessee. We also contacted the three Category II juvenile justice facilities and the US Department of Justice which is coordinating

3
the evaluation effort on two of the three sites. Because those project outcomes may involve different methodologies, we decided not to evaluate Category II at this time. Utilizing a stratified random sampling design, we developed two statistical samples, one which consisted of 322 participant case files from sites visited and the second comprised of 907 participants in seven of the sites for which UI wage records were available. Quantitative Methods Outcome variables were derived from case file record review and administrative data. These included measures of GED assistance, recidivism, job placement information recorded in participant files, and wage earnings as reported to the Unemployment Insurance (UI) system for the last five available quarters. We analyzed intensity of employment services, employment placement, and UI wages as distinct outcomes and combined the data sources into scales of intensity of services provided and of job placement (none, low, medium and high). (See Glossary). Our analysis examined the following independent variables reported by the projects: age, gender, ethnicity, criminal justice involvement at the time of entry into the demonstration project, date of entry, and project site. We were unable to employ a pure experimental design because the project did not include randomized treatment and control groups. However, we did impute the difference in employment and wage outcomes between applicants (intake participants) and enrollees in three sites which tracked both groups, one Category I and two Category III site. The evaluation employed several non-experimental statistical methods of bivariate and multivariate analyses including Pearson’s chi-square tests, analyses of variance, linear and logistic regressions, and discriminant analyses. Please see Appendix A for more detailed technical and methodological concerns. Qualitative Methods We conducted interviews with ETA managers and program monitors (GOTRs), grantee project managers and staff, including job developers and counselors. We also interviewed a randomly selected selection of projects participants, who represented a cross-section of ages, gender, ethnicity and prior criminal justice involvement. At each site, we collected data on participants, services delivered, outcomes and client satisfaction. We conducted this study in accordance with the Quality Standards for Inspections published by the President’s Council on Integrity and Efficiency.

4
FINDINGS AND RECOMMENDATIONS
Finding A: Differing Types, Intensity and Duration of Services
Influence Project Outcomes We determined that the intensity of services provided to youth participants varied across sites and had a direct bearing upon employment, long-term employability and in criminal justice involvement. Our study revealed that even within categories, grantees employed a wide range of types and intensity of employment, educational and related services. The spectrum of service offerings across sites ranged from a minimum offering of resume writing and job referrals to a greater combination of structured job search, remedial education, classroom vocational or skills training, drug abuse screening and counseling, and on-the-job training (OJT). Job Placement Outcomes The central goal of the Youth Offender Demonstration Projects (YODP) is to help youth offenders, gang members and youth at risk of gang involvement between the ages of 14 and 24 attain long-term employment at wage levels that will prevent future dependency and to break the cycle of crime and juvenile delinquency that contributes to recidivism. We found that approximately 24% (or 214) of youth ages 18 – 24 (total sample of 907) were placed in either subsidized or unsubsidized employment during the grant period. Further analysis disclosed that these youth had average earnings of $1,409 per quarter, estimated at $5,637 for a year. Figure 1: Universe of Participants Aged 18 – 24 with Reported Post-Enrollment Quarterly Wages
in 7 Grant Sites
Category/City Population of Participants Aged 18-24
Number of Participants with Earnings
% of All Participants with Earnings
Quarterly Wages Per Participant
Category I City A 167 67 40% $1,372 Category I City B 108 30 28% $1,406 Category I City C 43 10 23% $711 Category I City D 121 35 29% $1,812 Category IIII City E 185 24 13% $1,414 Category III City F 173 38 22% $1,007 Category III City G 110 10 9% $1,927 Averages and Totals, 7 cities
907 214 24% $1,409

5
Youth Were Placed in A Wide Range of Subsidized and Unsubsidized Job Types From both administrative data on employment provided by the states and through our survey of five sites, we found that youth were placed in a wide range of subsidized (with earnings paid by the grantee agency) and unsubsidized (with earnings paid by private employers) job types:
Figure 2: Job Placements By Occupational Categories
CARE SERVICE
8%
CLERICAL32%
RETAIL20%
DELIVERY SERVICE
10%
FOOD SERVICE
16%
JANITORIAL12%
CONSTRUC-TION2%
Youth were motivated to seek employment and earnings for a variety of reasons: the majority of youth of all ages we spoke with did not live on their own, yet most expressed an interest in becoming more self-sufficient; in gaining job experience; and in furthering career development. Others had young children to support or had to pay off restitution for property crimes committed. Job placements were made primarily to provide youth with job experience, and also to match participants with their expressed occupational interests and career goals. Job Placement Outcomes Were Influenced By Levels of Service We surveyed the relationship between levels (intensity and duration) of services provided and job placement outcomes. As shown by Figure 3, there is a significant relationship between greater intensity and duration of services offered and job placement outcomes, with differences not attributable to chance. The highest intensity and duration of services, with continual services offered weekly or biweekly for at least six months, produced a thirteen-fold greater outcome in higher job placements than minimal service provision of assessment and intake and limited counseling and referrals lasting less than three months. Our analysis revealed that the differences were statistically significant at the 95% confidence level (with less than 5% of variation attributable to chance).

6
Figure 3: Job Placements and Intensity of Employment Services
2%
8%
27%
0% 10% 20% 30%
low service=<3 mos
med service=3-6 mos
high service=6 mos+
high job=6mos+
med job=3-6 mos
low job=< 3 mos
Our analysis further revealed that job placements were associated with the project’s success in diverting youth from criminal involvement during project enrollment. Youth who got in trouble during project enrollment were not placed in jobs at comparable levels as those who managed to stay out of trouble. (The differences between the two groups were statistically significant at the 95% confidence level.) Levels of Services Varied Across Sites Our analysis indicated that over 46% of services provided across observed sites were low (involving minimal intake and limited counseling and referral services) or none, when in fact the overwhelming majority of those participants could have benefited from a greater array, intensity and duration of services. These were followed by a 34% share of high services (continuous services and at least bimonthly meetings), with 20% of services of moderate intensity and duration. We discovered that with the same amount of dollars, different sites provided vastly different services. Those grantee sites that had an infrastructure already set up to work with at-risk youth were able to combine funding and resources to deliver services more effectively. Category I sites included one private non-profit organization, contracted by the City government, which had provided youth-oriented services for over thirty years. This site offered a range of intensive services offered, including computer classes, GED training, life skills, drug testing, and strong networks of referrals and consistent follow-up. On the other end of the spectrum, another privately contracted organization funded under Category I offered limited job counseling and weak referral and follow-up services for its youth participants. The spectrum of differences within Category III Community Partnership sites included one site which offered limited assistance with employment counseling, resume building and job referrals, and lacked strong follow-up services or actual job development. By contrast, other

7
Category III sites provided comprehensive, consistent counseling and differing ranges of educational, mental health and accompanying referrals. Initial and Repeat Criminal Justice Involvement were Affected by Prior Involvement in the Criminal Justice System and by Types of Service Provided A numeric analysis of arrests and other criminal justice involvement after enrollment yielded a low count of 17 incidents in our sample of 322 participants (5%). However, this figure is not a reliable indicator of recidivism rates, because many youth are already on probation or are currently serving time in alternative sentencing. Moreover, many demonstration sites have not effectively monitored for the information. A comparison of the 17 instances of justice involvement during project enrollment with other enrollees, revealed that the primary distinction between those who became involved or re-involved with criminal activity and those who were not were prior convictions:
Of those who became involved in criminal activity during the demonstration period, the majority (81%) had previously been involved with the criminal justice system, including arrests and probation. By contrast, less than half (48%) of those who did not become involved with the criminal justice system had previously been in trouble with the law.
A logistic regression of criminal justice involvement indicated that a variety of variables—high, medium, and low services and job placements included—had no noticeable effect on recidivism. Aside from prior convictions, only one other variable had a significant effect on recidivism:
One Category I site which was observed to offer intensive services focused on counseling, mentorship and gang prevention, demonstrated a significant effect on preventing criminal involvement and recidivism during project enrollment. The effect was statistically significant at the 95% confidence level (with less than 5% of differences attributable to chance).
The statistical analyses indicate that while criminal justice involvement and/or recidivism during the project period is most significantly affected by a prior history of criminal justice involvement, types of service provided were also associated with the a lower incidence of criminal justice involvement during project enrollment. These findings corroborate our observations, which indicated the efficacy of certain practices in monitoring criminal justice involvement. Some sites worked closely with other institutions, such as schools and probation departments, and had access to youths’ activities and achievements. Participant files in these sites included probation officers’ notes, school attendance records, and academic test scores, as well as documentation of the counselors’ ongoing assessment of participants’ activities and progress. The counselors in these sites had the knowledge and ability to monitor truancy and criminal/gang activity, and successful employment activity.

8
The Collection of Administrative and Project Data Can Be Improved We noted that ETA has been successful in developing and continuing to refine a data reporting system, reportable by grantees to ETA on a quarterly basis. While enrollment, service provision, educational achievement, criminal justice and cumulative job placement numbers were reported to ETA on a consistent basis in Round I, the reliability of the figures provided by the project sites should be further monitored and verified by ETA in future rounds using a variety of administrative and participant case file review methods:
a. ETA’s program monitors (GOTRs) should verify and monitor educational achievements and job placements which are currently being reported on a quarterly basis to ETA, through more systematic review of participant case files.
b. Future grantee sites should also maintain intake files on non-enrollees, for purposes
of comparative research and evaluation on the effects of participation.
The additional steps in data collection and verification should involve a minimal time and cost burden and is useful in 1) monitoring the accuracy of data at the site level and 2) gauging project impact in the future.
Grantees further spoke of the need for better understanding and advancing the state of research on factors which contribute to recidivism and successful long-term employment. One project manager spoke of developing a tracking database which could identify and highlight “triggers” of recidivism, through the development of further methods of tracking participants’ lifestyles and activities, such as measures of mental health, family involvement, and educational participation. Future project and outcome/impact evaluations could assist in this effort by analyzing data across sites to assess the relationship between participants’ recidivism, services received, and project outcomes. Comparison of YODP with Another Youth Job Training Demonstration Project and with Control Group of Non-Participants Our analysis of wage earnings revealed that participants’ average estimated earnings of $5,637 were higher than those of another DOL youth demonstration project, the Youth Opportunity Grant Program, for which youth with reported earnings totaled $4,217 on average for each program year. A comparison of YODP participation in three sites for which data was available revealed that project participation had a positive effect on labor market participation, in comparison with a control group of non-participants. Older youth participants’ labor market participation was three times greater (24%) than that of a control group of youth who were assessed but received no services from the projects (8%). Overall, enrollees also participated in sustained employment rates for at least six months at an almost two-fold higher rate (11%) than the control group (6%) during the project period.

9
Summary Overall, we found that approximately 24% (or 214) of youth ages 18 – 24 (total sample of 907) were placed in either subsidized or unsubsidized employment during the grant period. Further analysis disclosed that these youth had average earnings of $1,409 per quarter, estimated at $5,637 for a year. Our analysis revealed that participants’ average estimated earnings were higher than those of another DOL youth demonstration project and that participants were three times as likely to find work as a control group who did not receive project services. We found that intensity and duration of services influenced job placements, with higher services producing the best job outcomes. Levels of services were significantly affected by site and category differences, with grantees employing a wide range of types and intensity of employment, educational and related services. While more intensive levels of service did not always produce immediate job placement outcomes, overall, the highest levels of service yielding a thirteen-fold greater share of high job placements. Our analysis indicated that 54% of services received were of medium or high intensity and duration. We noted that the remainder of services provided were of low intensity and duration (involving minimal intake and very limited counseling and referral services) or none. Of participants receiving low services, the vast majority would have benefited from a greater array, intensity and duration of services. Grantees spoke of the need for better understanding and advancing the state of research on factors that contribute to successful long-term employment and recidivism. Further project and outcome/impact evaluations could assist in this effort by analyzing data across sites to assess the relationship between services received and project outcomes. . RECOMMENDATIONS
We recommend that ETA: 1. Analyze data across sites to assess the relationship between project practices, participants’
services received and project outcomes. 2. Develop and implement in future rounds a strategy for ensuring that the types, intensity and
duration of services rendered provides project participants with the optimal opportunity to succeed in the project. This should include a defined minimal set of services.
3. Verify and monitor services provided, educational achievements and job placements
currently reported by grantees on a quarterly basis, via ETA’s program monitors (GOTRs) through more systematic review of participant case files.

10
ETA’s Response to Recommendations (1) “In demonstrations, it is difficult to compare one site to another, especially when
different rounds of the experiment (as in the case of the Youth Offender demonstrations) have different project service requirements. However, ETA agrees to incorporate this type of analysis into future evaluations of the Youth Offender Demonstration Projects.”
(2) “ETA already has identified a minimum set of reentry services, beyond WIA and Wagner-
Peyser Act tailored services available at the local One-Stop centers, which has been found to help youth offenders and at-risk youth. This set of reentry services includes gang prevention, alternative sentencing, case-management (route counseling), and aftercare services. To complement locally-based service strategies in each area, ETA required in Round Three grants (SGA/DFA 01-109) that applicants provide these minimal reentry services along with other appropriate workforce development services for youth offenders and at-risk youth. Please know that these reentry services are in addition to those services required in Rounds One and Two.”
(3) “ETA agrees to this recommendation and will conduct more frequent reviews of
grantees’ services and achievements through a systematic assessment by federal project officers of grantees’ quarterly progress and data reports. (ETA initiated this quarterly reporting system for Youth Offender Demonstration Project grants in the summer of 2000.) ETA also agrees to review this issue in its forthcoming Youth Offender Demonstration Project federal review guide, which will include a careful analysis of at least three to five case records per monitoring visit.”
OIG’s Conclusion We concur with the proposed corrective actions and consider recommendations 1 through 3 resolved and recommendation 2 closed. Specifically:
- Recommendation 1 will be closed pending receipt of documentation from ETA that upcoming evaluations of future rounds will incorporate analyses of project practices, services received and project outcomes.
- Recommendation 2 is closed, based on ETA’s identification of a minimum set of
reentry services and the requirement in Round Three grants that applicants provide these minimal services for youth offenders and at-risk youth.
- Recommendation 3 will be closed pending receipt of documentation that more
frequent, systematic reviews of grantees’ services and achievements are being conducted, as required review protocol included in ETA’s March 2002 Federal Review Guide.
Please submit the requested written documentation for recommendations 1 and 3 by no later than September 30, 2002.

11
Finding B: Youth Are Not Provided with Comparable Opportunities to Stay and Succeed in the Projects
We found that not all sites provided their participants with comparable opportunities to succeed in the demonstration, because the policies and practices surrounding enrollment, activity status, duration of services, and termination of youth from the projects were uneven and often arbitrarily defined and applied. Our review indicated that the definition of an “enrolled” participant varied across sites and often included no distinction between actual enrollees versus applicants. For actual enrollees, the majority were inactive in the projects at time of our review. Moreover, the majority of youth were enrolled a year or later after the start of the grant period and often, participated for well under one year. Furthermore, some sites had a “no termination” policy; others regularly terminated or placed participants on inactive status for a wide range of reasons.
Enrollment Figures Are Inconsistently Reported
Our review indicated that the definition of an “enrolled” participant included no minimal baseline. For example, in a few instances, participants who did not receive services (no case file opened) were considered “enrolled.” While the demonstration nature of the projects allowed a good degree of project flexibility, future rounds could benefit from clearer criteria for enrollments.
We determined that possible inconsistencies in enrollment numbers were attributable in part to a lack of clear distinction in counting enrollees versus applicants, as was the case in three of the five cities we visited. Individuals were often referred to the project but did not receive in-depth assessments or other employment and educational services. While we included intake assessment in the category of “minimal service provision,” we noted that in many instances intake assessment was neither in-depth nor was feedback or referrals provided to the youth. In the majority of sites, either intake participants were not tracked or intake participants were also counted as enrollees.
The Majority of Participants Are Inactive
Our review of case files revealed that the majority of youth were enrolled a year or later after the start of the grant period and often, participated for well under one year. Over 80% of sampled participants were not actively receiving services at the time of our review. We counted as inactive, those youth who had not received services or been in contact with the project for the last 90 days. While inactive status does not mean that the participant was never served, we noted a myriad of challenges surrounding attendance: individual participants and families often move out of the area or cannot be reached; truancy is high and school attendance often poor; youth face problems getting to the project site; and family and behavioral problems. Youth attendance in counseling, training sessions, and employment were frequently cited as a problem by project managers and counselors. Some project managers and counselors described the difficulty in undoing a lifetime of negative influence on a young person and emphasized that the project needed to do more to

12
counter such influences on youth. These staff and managers employed an intensive approach of weekly contact and follow-up, whether at the project site, at their school or library, or at their homes. Others felt that participation in the project could not be enforced and, without demonstrated youth initiative or interest, counselors could opt to terminate a youth for non-attendance. Still others felt that an “empowerment” model meant that with proper counseling and services, youth would be able to “graduate” from the project, often within a year, with a positive termination. Terminations Are Inconsistently Applied Terminations of project participants before the end of the grant period occurred at significantly different rates across grant sites, ranging from no terminations to upwards of 50%. We found that not all sites provided their participants with a comparable shot at succeeding in the project, because the policies and practices surrounding termination of youth from the project were uneven and often arbitrarily defined and applied. Terminations are necessary in certain circumstances: for instance, a youth may have been arrested and sentenced to three years in prison; or, a parent may have objections to their child’s continued participation. Moreover, some youth sometimes verbally declined to continue with project participation. However, we noted that there were many terminations that were neither necessary nor sufficiently justified. In one city, participants were terminated from the project for non-attendance at two orientations, even if they had not previously agreed to attend and there was no verification that they received the invitations via phone or mail. In instances where strategic planning on enrollment was not comprehensively conducted, wholesale terminations of students often occurred in the interest of administrative efficiency and the development of more realistic caseworker loads. Because the demonstration nature of the projects tends to emphasize processes rather than outcomes, it is understandable that the practice of terminations has not been uniformly addressed. However, our study indicated that clarified policies on enrollment, activity status, and duration of services would further assist in enhancing service delivery practices and potential outcomes. The Use of Incentives Appears to Improve Project Participation
Promising practices for improved project participation which were implemented in some sites included the use of incentives, such as the use of a wide range of monetary and non-monetary participant incentives. Incentives included cash rewards, project points, gift certificates, and achievement recognitions. These practices, observed in two of the five sites we visited, appeared more effective in encouraging participant retention and individual performance than the threat of terminations. The systematic use of incentives observed in these sites, which demonstrated consistent and continued project participation, could be more widely adopted by other sites.

13
Summary In summary, youth are not provided with comparable opportunities to stay and succeed in the demonstration projects. Our review indicated that the definition of an “enrolled” participant varied across sites and often included no distinction between actual enrollees versus applicants. For actual enrollees, the majority were inactive in the projects at time of our review. Activity status is unevenly and often arbitrarily decided and terminations are inconsistently applied. The demonstration projects could benefit in future rounds from clearer guidelines and possibly a minimal baseline for duration of project participation and for project activity status. Enrollments, duration of project participation and activity status should be clarified and planned as inter-related policies and practices. Our findings indicate that future rounds of grants may benefit from clearer monitoring of enrollments, duration of participation, and activity status, which in turn will assist the in developing more accurate assessments of outcomes including labor market participation and wages.
RECOMMENDATIONS We recommend that ETA: 4. Develop a clarified and more consistent set of policies and strategies on enrollment.
While flexibility in locally relevant and innovative services should continue to be encouraged, enrollment should include a baseline of minimum services.
5. Verify and monitor services provided, enrollments, duration of participation, and
activity status via ETA’s program monitors (GOTRs) through more systematic review of participant case files and interviews.
6. Utilize monetary and non-monetary participant incentives, including cash rewards,
program points, gift certificates, and achievement recognitions to improve project participation and outcomes.
ETA’s Response to Recommendations
(4) “ETA already has distinguished between “recruitment” and “enrollment” in the data elements for round two and future rounds (see attached project-required data elements). In addition, future grants will provide the enhanced services of gang prevention, alternative sentencing, and case management and aftercare services as a complement to existing locally relevant services.”
(5) “ETA agrees to this recommendation and will conduct more frequent reviews of grantees’ enrollments, terminations, and activity status through a systematic

14
assessment by federal project officers of grantees’ quarterly progress and data reports. ETA also agrees to review this issue through a careful analysis of at least three to five case records per monitoring visit via the forthcoming Youth Offender Demonstration Project federal review guide.”
(6) “ETA agrees with the recommendation and will explore this issue further in its federal review guide. In addition, in future rounds ETA will consider incorporating an incentive protocol into the demonstration solicitations to test its efficacy.”
OIG’s Conclusion
We concur with the proposed corrective actions and consider recommendations 4 through 6 resolved and recommendation 4 closed. Specifically:
- Recommendation 4 is closed, based on ETA’s identification of “recruitment” and
“enrollment” in the data elements for round two and future rounds in its project-required data elements and in its March 2002 Federal Review Guide.
- Recommendation 5 will be closed pending receipt of documentation from ETA that
more frequent, systematic reviews of grantees’ enrollments, terminations, and activity status are being conducted, as required review protocol included in ETA’s March 2002 Federal Review Guide.
- Recommendation 6 will be closed pending receipt of documentation from ETA that
incentive protocol has been explored, and if appropriate, incorporated into the demonstration solicitations for future rounds.
Please submit the requested written documentation for recommendations 5 and 6 by no later than September 30, 2002.

15
APPENDIX A
Technical/Methodological Issues

16
I. Bivariate Correlations
Crosstabulation of two variables was employed to look for statistically significant differences not attributable to chance. Pearson’s correlation coefficient measures the strength and direction of the relationship.
Correlations
1 .090 .083 -.027 -.079 .076 -.043 .017 .034 .068 -.029 -.005 -.047
. .337 .084 .325 .094 .102 .238 .387 .283 .127 .315 .465 .216
279 24 279 279 279 279 279 279 279 279 279 279 279
.090 1 -.249 .333 -.111 .238 -.011 .272 .097 -.040 -.252 .586** -.223
.337 . .121 .056 .303 .131 .480 .099 .325 .427 .117 .001 .147
24 24 24 24 24 24 24 24 24 24 24 24 24
.083 -.249 1 -.312** .265** -.039 .063 .010 .107* .016 .150** .021 -.232**
.084 .121 . .000 .000 .246 .130 .426 .028 .389 .004 .356 .000
279 24 319 319 319 319 319 319 319 319 319 319 319
-.027 .333 -.312** 1 .081 -.053 .034 .157** .031 -.036 -.267** -.095* .589**
.325 .056 .000 . .074 .173 .270 .002 .292 .260 .000 .044 .000
279 24 319 319 319 319 319 319 319 319 319 319 319
-.079 -.111 .265** .081 1 .001 -.092 -.085 -.065 .237** .047 -.066 -.103*
.094 .303 .000 .074 . .492 .050 .064 .124 .000 .202 .121 .033
279 24 319 319 319 319 319 319 319 319 319 319 319
.076 .238 -.039 -.053 .001 1 -.055 -.003 -.056 .151** .024 -.054 -.004
.102 .131 .246 .173 .492 . .166 .476 .159 .003 .335 .170 .470
279 24 319 319 319 319 319 319 319 319 319 319 319
-.043 -.011 .063 .034 -.092 -.055 1 .397** .154** -.092 -.059 -.024 -.048
.238 .480 .130 .270 .050 .166 . .000 .003 .051 .145 .337 .196
279 24 319 319 319 319 319 319 319 319 319 319 319
.017 .272 .010 .157** -.085 -.003 .397** 1 .151** -.163** -.171** -.001 .063
.387 .099 .426 .002 .064 .476 .000 . .003 .002 .001 .496 .131
279 24 319 319 319 319 319 319 319 319 319 319 319
.034 .097 .107* .031 -.065 -.056 .154** .151** 1 -.166** -.156** -.061 .116*
.283 .325 .028 .292 .124 .159 .003 .003 . .001 .003 .140 .019
279 24 319 319 319 319 319 319 319 319 319 319 319
.068 -.040 .016 -.036 .237** .151** -.092 -.163** -.166** 1 .031 .013 -.022
.127 .427 .389 .260 .000 .003 .051 .002 .001 . .293 .407 .348
279 24 319 319 319 319 319 319 319 320 320 320 320
-.029 -.252 .150** -.267** .047 .024 -.059 -.171** -.156** .031 1 .021 -.307**
.315 .117 .004 .000 .202 .335 .145 .001 .003 .293 . .352 .000
279 24 319 319 319 319 319 319 319 320 320 320 320
-.005 .586** .021 -.095* -.066 -.054 -.024 -.001 -.061 .013 .021 1 -.194**
.465 .001 .356 .044 .121 .170 .337 .496 .140 .407 .352 . .000
279 24 319 319 319 319 319 319 319 320 320 320 320
-.047 -.223 -.232** .589** -.103* -.004 -.048 .063 .116* -.022 -.307** -.194** 1
.216 .147 .000 .000 .033 .470 .196 .131 .019 .348 .000 .000 .
279 24 319 319 319 319 319 319 319 320 320 320 320
Pearson Correlation
Sig. (1-tailed)
N
Pearson Correlation
Sig. (1-tailed)
N
Pearson Correlation
Sig. (1-tailed)
N
Pearson Correlation
Sig. (1-tailed)
N
Pearson Correlation
Sig. (1-tailed)
N
Pearson Correlation
Sig. (1-tailed)
N
Pearson Correlation
Sig. (1-tailed)
N
Pearson Correlation
Sig. (1-tailed)
N
Pearson Correlation
Sig. (1-tailed)
N
Pearson Correlation
Sig. (1-tailed)
N
Pearson Correlation
Sig. (1-tailed)
N
Pearson Correlation
Sig. (1-tailed)
N
Pearson Correlation
Sig. (1-tailed)
N
DOB
UIWAGES
ETHNIC
SITE
GENDR
RECID
GEDPRIOR
GEDASSIS
ACTIV
PRIORCNV
LOS
JOBPLACE
CATSITE
DOB UIWAGESETHNIC SITE GENDR RECIDGEDPRIORGEDASSISACTIVPRIORCNV LOS JOBPLACECATSITE
Correlation is significant at the 0.01 level (1-tailed).**.
Correlation is significant at the 0.05 level (1-tailed).*.
N = total number of observations for each variable pair.
17
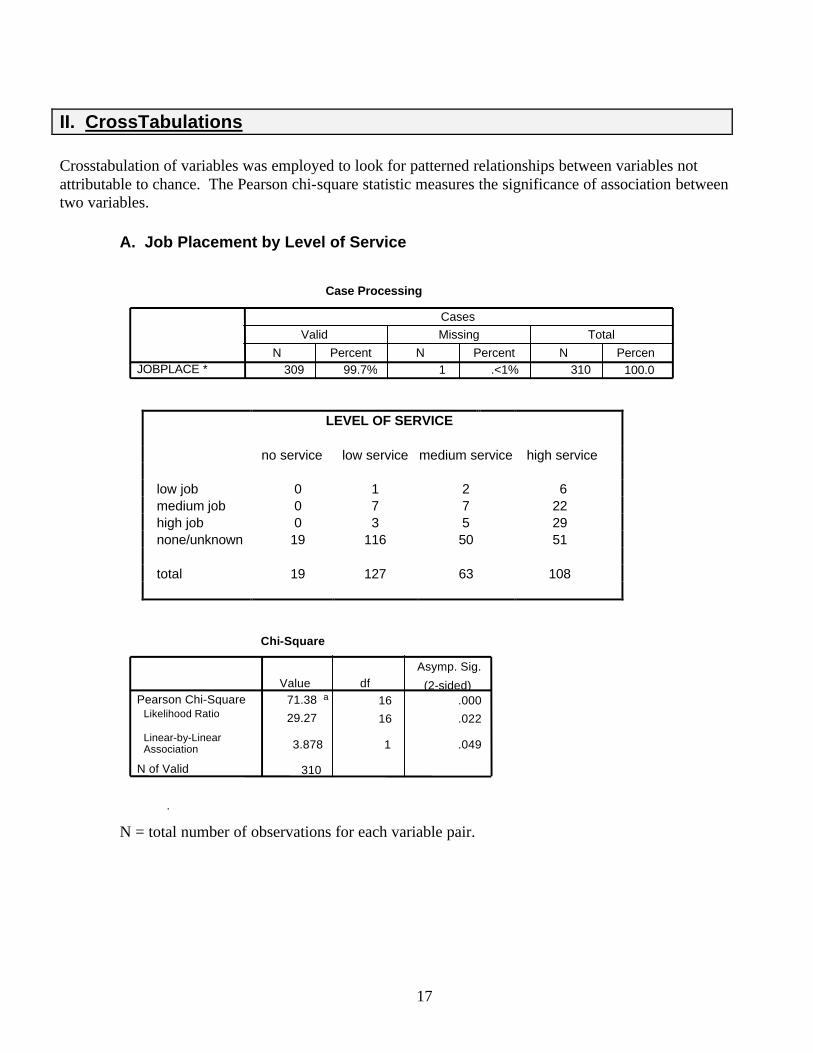
II. CrossTabulations
Crosstabulation of variables was employed to look for patterned relationships between variables not attributable to chance. The Pearson chi-square statistic measures the significance of association between two variables.
A. Job Placement by Level of Service
Case Processing Summary
309 99.7% 1 .<1% 310 100.0%
JOBPLACE * LOS
N Percent N Percent N Percent
Valid Missing Total
Cases
LEVEL OF SERVICE no service low service medium service high service
low job 0 1 2 6 medium job 0 7 7 22 high job 0 3 5 29 none/unknown 19 116 50 51 total 19 127 63 108
Chi-Square
Tests
71.384
a 16 .000 29.272
16 .022
3.878 1 .049
310
Pearson Chi-Square Likelihood Ratio
Linear-by-Linear Association
N of Valid Cases
Value df Asymp. Sig.
(2-sided)
.
N = total number of observations for each variable pair.

18
B. Level of Service by Site
Case Processing Summary
314 98.1% 6 1.9% 320 100.0%LOS * SITEN Percent N Percent N Percent
Valid Missing Total
Cases
LOS * SITE
Crosstabulation Count
2 3 8 13 5 7 12 105 129
10 18 30 6 64 52 17 38 1 108 69 45 80 120 314
None
Low Medium High
LOS
Total
Cat I Site I Cat III Site I Cat I Site II Cat III Site II
SITE Total
Chi-Square Tests
220.875a 9 .000
251.728 9 .000
124.776 1 .000
314
Pearson Chi-Square
Likelihood Ratio
Linear-by-LinearAssociation
N of Valid Cases
Value dfAsymp. Sig.
(2-sided)
4 cells (25.0%) have expected count less than 5. Theminimum expected count is 1.86.
a.
III. Discriminant Analyses Discriminant function analysis, a.k.a. discriminant analysis or DA, is used to classify cases into the values of a categorical dependent, usually a dichotomy. If discriminant function analysis is effective for a set of data, the classification table of correct and incorrect estimates will yield a high percentage correct. Here, discriminant analysis is used to:
• Investigate differences between groups. • Determine the most parsimonious way to distinguish between groups. • Discard variables that exhibit few distinctions among groups.

19
A. Job Placement
Analysis Case Processing Summary
109 34.1
210 65.6
0 .0
1 .3
211 65.9
320 100.0
Unweighted CasesValid
Missing or out-of-rangegroup codes
At least one missingdiscriminating variable
Both missing orout-of-range group codesand at least one missingdiscriminating variable
Total
Excluded
Total
N Percent
Tests of Equality of Group Means
.989 .614 2 106 .543
.970 1.648 2 106 .197
.916 4.831 2 106 .010
.999 .068 2 106 .934
.944 3.117 2 106 .048
.991 .475 2 106 .623
.997 .149 2 106 .862
.953 2.636 2 106 .076
.984 .840 2 106 .435
ACTIV
LEVSVC
RECID
GENDR
SITE
ETHNIC
PRIORCNV
GEDASSIS
GEDPRIOR
Wilks'Lambda F df1 df2 Sig.
Analysis 1 Stepwise Statistics
Variables Entered/Remov
a,b,c,d
RECID .916
1 2 106.000
4.831
2 106.000
.010
Step
1 Entered Statistic
df1 df2 df3 Statistic df1 df2 Sig.
Exact F
Wilks' Lambda
At each step, the variable that minimizes the overall Wilks' Lambda is entered. Maximum number of steps is 18. a. Minimum partial F to enter is 3.84. b. Maximum partial F to remove is 2.71. c. F level, tolerance, or VIN insufficient for further computation. d.

20
Variables in the Analysis
1.000 4.831RECIDStep1
Tolerance F to Remove
We employed several measures in the study in order to learn which one(s) offer the best prediction, in order to determine the ones that discriminate between groups. In our stepwise discriminant function analysis, we built a model of discrimination step-by-step. Specifically, at each step all variables were reviewed and evaluated to determine which one will contribute most to the discrimination between groups. That variable will then be included in the model, and the process starts again. Our discrimination model yielded recidivism as the one factor which had an effect on job placement.
IV. Regressions Regression Analyses were employed to summarize the overall relationship between two or more variables.
Logistic regression is a form of regression used when the observed outcome is restricted to two values, which usually represent the occurrence or non-occurrence of some outcome event, (usually coded as 1 or 0). The predicted values of the dependent variable can be expressed as the probability of the joint occurrence of a specific number of events.
A. Logistic Regression of Site on Level of Service Variables
Entered/Removed
Cat I, Site II, Cat II, Site I , Cat II, Site II
. Enter
Model 1
Variables Entered
Variables Removed
Method
All requested variables entered.
a. Dependent Variable: Level of Service b.
Model
Summary
.333 a .111 .102 .831 Model 1
R R Square
Adjusted R Square
Std. Error of the Estimate
Predictors: (Constant), Cat I, Site II, Cat III, Site I, Cat III, Site II a.

21
ANOVA
27.165
3 9.055 13.124
.000 a 218.023
316 .690 245.187
319
Regression Residual Total
Model 1
Sum of Squares
df Mean Square
F Sig.
Predictors: (Constant), Cat I, Site II, Cat III, Site I, Cat III, Site II a. Dependent Variable: LOS b.
Coefficientsa
3.190 .091 35.204
.000 -.346 .153 -.137 -2.255 .025 -.348 .118 -.193 -2.946 .003 .381 .134 .180 2.834 .005
(Constant) Cat III Site I Cat III Site II
Cat I Site II
Model 1
B Std. Error
Unstandardized Coefficient
s Beta
Standardi zed Coefficien ts
t Sig.
The results of the Logistic Regression of site against level of service revealed statistically significant differences between levels of service provided by site, corroborating the results of the earlier crosstabulation. (Category I, Site I is the excluded category against which comparisons are made). The logistic regression further indicates that Category III sites generally provided lower levels of services, as indicated by the negative Beta coefficients. B. Logistic Regression of Recidivism
Case Processing Summary
319 99.7
1 .3
320 100.0
0 .0
320 100.0
Unweighted Casesa
Included in Analysis
Missing Cases
Total
Selected Cases
Unselected Cases
Total
N Percent
If weight is in effect, see classification table for the totalnumber of cases.
a.

22
Dependent Variable Encoding
0
1
Original ValueNo
Yes
Internal Value
Block 0: Beginning Block Classification Table
302 0 100.0 17 0 .0
94.7
Observed No
Yes RECID
Overall Percentage
Step 0
No Yes RECID
Percentage Correct
Predicted
Constant is included in the model. a. The cut value is .500. b.
Variables in the Equation
-2.877 .249 133.232 1 .000 .056ConstantStep 0B S.E. Wald df Sig. Exp(B)
Variables not in the Equation
.000 1 .983 7.270 1 .007 .186 1 .666 .053 1 .818
2.704 1 .100 .979 1 .323 .004 1 .949 .158 1 .691 .413 1 .520
16.204
9 .063
GENDR PRIORCNV Cat III Site I
Cat III Site II
Cat I Site I
M MEDIUM
LOW
HIGH SUCCESS
Variables
Overall Statistics
Step 0
Score df Sig.
Block 1: Method = Enter
Omnibus Tests of Model Coefficients
18.694 9 .028
18.694 9 .028
18.694 9 .028
Step
Block
Model
Step 1Chi-square df Sig.

23
Model Summary
114.071 .057 .167Step1
-2 Loglikelihood
Cox & SnellR Square
NagelkerkeR Square
Classification Tablea
302 0 100.0
17 0 .0
94.7
ObservedNo
Yes
RECID
Overall Percentage
Step 1No Yes
RECID PercentageCorrect
Predicted
The cut value is .500a.
Variables in the Equation
.256 .377 .462 1 .497 1.292 -2.073 .683 9.223 1 .002 .126
.239 .795 .091 1 .763 1.271 -1.214 1.012 1.439 1 .230 .297 -2.351 1.127 4.346 1 .037 .095 5.755 22.39
5 .066 1 .797 315.90
3 5.981 22.386
.071 1 .789 395.994 5.823 22.39
5 .068 1 .795 338.06
7 -.576 .710 .660 1 .417 .562 -5.360 22.42
2 .057 1 .811 .005
GENDR PRIORCNV Cat III Site II
Cat III Site I
Cat I Site I MEDIUM
LOW HIGH
SUCCESS Constant
Step 1
a
B S.E. Wald df Sig. Exp(B)
The results of the Logistic Regression of recidivism against a variety of other independent variables highlighted two variables which affected criminal involvement or reinvolvement during the project period: prior convictions and Category I Site I. The logistic regression indicates that various levels of service, per se, had no effect on recidivism or criminal involvement. Rather, a record of prior criminal involvement increases the probability of criminal re-involvement during the project period, and that Category I Site I was effective in reducing criminal involvement and re-involvement.

24
APPENDIX B
SELECTED
BIBLIOGRAPHY

25
SELCTED BIBLIOGRAPHY
Audit Findings from First 18 Months of the Three Kulick Youth Opportunity Pilot Sites Office of Inspector General, Office of Audit (Report No. 06-00-002-03-340), 2001. David Brown, et. al. Barriers and Promising Approaches to Workforce and Youth Development, National Youth Employment Coalition, 2001. C.S. Reichardt & C.A. Bormann. Using Regression Models to Estimate Program Effects. In J.S. Wholey, H.P. Hatry & K.E. Newcomer (eds.). Handbook of Practical Program Evaluation (pp. 417-455). San Francisco: Jossey-Bass. Comprehensive Reponses to Youth at Risk: Interim Findings from the SafeFutures Initiative, U.S. Department of Justice, Office of Justice Programs, Office of Juvenile Justice and Delinquency Prevention (NCJ 183841), 2000. Evaluation of the School-to Work/Out of School Youth Demonstration, US Department of Labor, Employment and Training Administration (Research and Evaluation Report Series 00-D), 2000. Employment and Training for Court-Involved Youth, U.S. Department of Justice, Office of Justice Programs, Office of Juvenile Justice and Delinquency Prevention, undated. National Job Corps Study: The Impact of Job Corps on Participants’ Employment and Related Outcomes, U.S. Department of Labor, Employment and Training Administration (Research and Evaluation Monograph Series 01-K), 2001. 1998 National Youth Gang Survey, U.S. Department of Justice, Office of Justice Programs, Office of Juvenile Justice and Delinquency Prevention (NCJ 182210), 2000. OJJDP Research: Making a Difference for Juveniles, Office of Juvenile Justice and Delinquency Prevention (NCJ 177602), 1999. Predictors of Youth Violence, U.S. Department of Justice, Office of Justice Programs, Office of Juvenile Justice and Delinquency Prevention (NCJ 179065), 2000. Preventing Adolescent Gang Involvement, U.S. Department of Justice, Office of Justice Programs, Office of Juvenile Justice and Delinquency Prevention (NCJ 182210), 2000. Prevention of Serious and Violent Juvenile Offending, U.S. Department of Justice, Office of Justice Programs, Office of Juvenile Justice and Delinquency Prevention (NCJ 178898), 2000. R. L. Scheaffer, W. Mendenhall, and L. Ott. Elementary Survey Sampling. PWS-KENT Publishing Company, fourth edition, 1990.

26
APPENDIX C
AGENCY RESPONSE