Employing a novel bioelastomer to toughen polylactide -...
9
Employing a novel bioelastomer to toughen polylactide Hailan Kang a , Bo Qiao a , Runguo Wang a , Zhao Wang a , Liqun Zhang a, b, * , Jun Ma c, ** , Phil Coates d a State Key Laboratory of OrganiceInorganic Composites, Beijing University of Chemical Technology, Beijing 100029, PR China b Key Laboratory of Beijing City for Preparation and Processing of Novel Polymer Materials, Beijing University of Chemical Technology, Beijing 100029, PR China c School of Advanced Manufacturing and Mechanical Engineering, University of South Australia, SA5095, Australia d School of Engineering, Design & Technology, Bradford University, BD7 1DP, UK article info Article history: Received 7 October 2012 Received in revised form 26 January 2013 Accepted 28 February 2013 Available online 13 March 2013 Keywords: Polylactide Bioelastomer Toughness abstract Biodegradable, biocompatible polylactide (PLA) synthesized from renewable resources has attracted extensive interests over the past decades and holds great potential to replace many petroleum-derived plastics. With no loss of biodegradability and biocompatibility, we highly toughened PLA using a novel bioelastomer (BE)esynthesized from biomass diols and diacids. Although PLA and BE are immiscible, BE particles of w1 mm in diameter are uniformly dispersed in the matrix, and this indicates some compatibility between PLA and BE. BE significantly increased the cold crystallization ability of PLA, which was valuable for practical processing and performance. SEM micrographs of fracture surface showed a brittle-to-ductile transition owing to addition of BE. At 11.5 vol%, notched Izod impact strength improved from 2.4 to 10.3 kJ/m 2 , 330% increment; the increase is superior to previous toughening effect by using petroleum-based tougheners. Crown Copyright Ó 2013 Published by Elsevier Ltd. All rights reserved. 1. Introduction Biobased polymers from renewable resources have received considerable interests from academia and industry in recent years, due to environmental concerns for ever-declining petroleum re- sources [1e3]. The use of biobased polymers is currently a major alternative to conventional petroleum-based polymers, and will provide a solution to the environment problem of plastic wastes [4]. Polylactide (PLA) is a polymer produced from renewable resources such as corn on a commercial scale [5]; it is a thermoplastic aliphatic polyester and has been proven viable in replacing petroleum-based plastics in some applications [6]. However, PLA is inherently brittle, which severely limits its application in in- dustries. Toughening PLA has thus attracted great interests. Low-molecular weight plasticizers toughened PLA moderately but this was obtained at the cost of losing stiffness [7e11]. Inor- ganic fillers such as clay improved toughness little, although enhancing stiffness obviously [12e14]. The most practical and economic used methods for toughening PLA is to adopt flexible polymers or elastomers. Poly (ε-caprolactone) (PCL) was the earliest polymer used for toughening PLA [15e21]. Since PCL and PLA are not compatible, compatibilizers such as PLLA-PCL-PLLA triblock copolymer have been developed [18]; it produced an improvement in notched Charpy impact strength from 1.1 to 3.7 kJ/m 2 at 30 wt% PCL. Compatible PLA/PCL blends were prepared through reactive processing induced by catalysts [19] or cross- linkers [20,21]. Jiang et al. [22] improved Izod impact strength by 170% via mixing PLA with 20 wt% poly (butylene adipate-co- terephthalate) (PBAT). Li et al. [23] prepared PLA/poly(ether) ure- thane (PU) blends with improved impact strength from 64 kJ/m 2 to 315 kJ/m 2 . Zhang et al. [24] used polyamide elastomer (PAE) to toughen PLA, resulting in a increase in elongation at break from 5.1% to 194.6% at 10 wt% PAE. PLAwas blended with four synthetic rubbers, including ethyleneepropylene copolymer (EPM), ethyleneeacrylic rubber (AEM), acrylonitrileebutadiene rubber (NBR), and isoprene rubber (IR), but toughening was only achieved by PLA/NBR blend with a 1.8 times higher value of Izod impact strength in comparison with PLA [25]. Even though these polymers toughened PLA effectively, unfortunately these polymers are either nonrenewable or nondegradable. A recent trend for toughening PLA is to adopt degradable, renewable polymers, including starch [26,27], poly (butylene succinate) (PBS) [28,29], poly (hydrox- yalkanoates) [30,31], polymerized soybean oil [32] and poly- amide11 (PA11) [33]; these are fabricated from renewable resources, and upon disposal are able to degrade completely in the environment within dozens of years. Shibata et al. [29] toughened * Corresponding author. State Key Laboratory of OrganiceInorganic Composites, Beijing University of Chemical Technology, Beijing 100029, PR China. ** Corresponding author. E-mail addresses: [email protected] (L. Zhang), [email protected] (J. Ma). Contents lists available at SciVerse ScienceDirect Polymer journal homepage: www.elsevier.com/locate/polymer 0032-3861/$ e see front matter Crown Copyright Ó 2013 Published by Elsevier Ltd. All rights reserved. http://dx.doi.org/10.1016/j.polymer.2013.02.053 Polymer 54 (2013) 2450e2458
Transcript of Employing a novel bioelastomer to toughen polylactide -...
at SciVerse ScienceDirect
Polymer 54 (2013) 2450e2458
Contents lists available
Polymer
journal homepage: www.elsevier .com/locate/polymer
Employing a novel bioelastomer to toughen polylactide
Hailan Kang a, Bo Qiao a, Runguo Wang a, Zhao Wang a, Liqun Zhang a,b,*, Jun Ma c,**, Phil Coates d
a State Key Laboratory of OrganiceInorganic Composites, Beijing University of Chemical Technology, Beijing 100029, PR ChinabKey Laboratory of Beijing City for Preparation and Processing of Novel Polymer Materials, Beijing University of Chemical Technology, Beijing 100029, PR Chinac School of Advanced Manufacturing and Mechanical Engineering, University of South Australia, SA5095, Australiad School of Engineering, Design & Technology, Bradford University, BD7 1DP, UK
a r t i c l e i n f o
Article history:Received 7 October 2012Received in revised form26 January 2013Accepted 28 February 2013Available online 13 March 2013
Keywords:PolylactideBioelastomerToughness
* Corresponding author. State Key Laboratory of OrBeijing University of Chemical Technology, Beijing 10** Corresponding author.
E-mail addresses: [email protected] (L.(J. Ma).
0032-3861/$ e see front matter Crown Copyright �http://dx.doi.org/10.1016/j.polymer.2013.02.053
a b s t r a c t
Biodegradable, biocompatible polylactide (PLA) synthesized from renewable resources has attractedextensive interests over the past decades and holds great potential to replace many petroleum-derivedplastics. With no loss of biodegradability and biocompatibility, we highly toughened PLA using a novelbioelastomer (BE)esynthesized from biomass diols and diacids. Although PLA and BE are immiscible, BEparticles of w1 mm in diameter are uniformly dispersed in the matrix, and this indicates somecompatibility between PLA and BE. BE significantly increased the cold crystallization ability of PLA, whichwas valuable for practical processing and performance. SEM micrographs of fracture surface showed abrittle-to-ductile transition owing to addition of BE. At 11.5 vol%, notched Izod impact strength improvedfrom 2.4 to 10.3 kJ/m2, 330% increment; the increase is superior to previous toughening effect by usingpetroleum-based tougheners.
Crown Copyright � 2013 Published by Elsevier Ltd. All rights reserved.
1. Introduction
Biobased polymers from renewable resources have receivedconsiderable interests from academia and industry in recent years,due to environmental concerns for ever-declining petroleum re-sources [1e3]. The use of biobased polymers is currently a majoralternative to conventional petroleum-based polymers, and willprovide a solution to the environment problem of plastic wastes [4].Polylactide (PLA) is a polymer produced from renewable resourcessuch as corn on a commercial scale [5]; it is a thermoplasticaliphatic polyester and has been proven viable in replacingpetroleum-based plastics in some applications [6]. However, PLA isinherently brittle, which severely limits its application in in-dustries. Toughening PLA has thus attracted great interests.
Low-molecular weight plasticizers toughened PLA moderatelybut this was obtained at the cost of losing stiffness [7e11]. Inor-ganic fillers such as clay improved toughness little, althoughenhancing stiffness obviously [12e14]. The most practical andeconomic used methods for toughening PLA is to adopt flexiblepolymers or elastomers. Poly (ε-caprolactone) (PCL) was the
ganiceInorganic Composites,0029, PR China.
Zhang), [email protected]
2013 Published by Elsevier Ltd. All
earliest polymer used for toughening PLA [15e21]. Since PCL andPLA are not compatible, compatibilizers such as PLLA-PCL-PLLAtriblock copolymer have been developed [18]; it producedan improvement in notched Charpy impact strength from 1.1 to3.7 kJ/m2 at 30 wt% PCL. Compatible PLA/PCL blends were preparedthrough reactive processing induced by catalysts [19] or cross-linkers [20,21]. Jiang et al. [22] improved Izod impact strength by170% via mixing PLA with 20 wt% poly (butylene adipate-co-terephthalate) (PBAT). Li et al. [23] prepared PLA/poly(ether) ure-thane (PU) blends with improved impact strength from 64 kJ/m2 to315 kJ/m2. Zhang et al. [24] used polyamide elastomer (PAE) totoughen PLA, resulting in a increase in elongation at break from5.1% to 194.6% at 10 wt% PAE. PLA was blended with four syntheticrubbers, including ethyleneepropylene copolymer (EPM),ethyleneeacrylic rubber (AEM), acrylonitrileebutadiene rubber(NBR), and isoprene rubber (IR), but toughening was only achievedby PLA/NBR blend with a 1.8 times higher value of Izod impactstrength in comparisonwith PLA [25]. Even though these polymerstoughened PLA effectively, unfortunately these polymers are eithernonrenewable or nondegradable. A recent trend for tougheningPLA is to adopt degradable, renewable polymers, including starch[26,27], poly (butylene succinate) (PBS) [28,29], poly (hydrox-yalkanoates) [30,31], polymerized soybean oil [32] and poly-amide11 (PA11) [33]; these are fabricated from renewableresources, and upon disposal are able to degrade completely in theenvironment within dozens of years. Shibata et al. [29] toughened
rights reserved.
H. Kang et al. / Polymer 54 (2013) 2450e2458 2451
PLLA by poly (butylene succinate-co-L-lactate) (PBSL) and poly(butylene succinate) (PBS); at 10 wt%, these two tougheners ach-ieved 160% and 120% higher elongation at break, respectively.Robertson et al. [32] achieved 400% and 600% increase in elonga-tion at break and tensile toughness by using polymerized soybeanoil, respectively. However, most tougheners derived from renew-able resources are less effective than those derived from petroleumresources in improving the PLA toughness. On the other hand, moststudies used the improved elongation at break rather than thenotched impact strength to gauge the toughening effects, while theimpact testing is far more useful in practice. Therefore, the chal-lenge is to develop biocompatible, highly toughened PLA blendswhich retain both completely renewable origins and ultimate de-gradability if necessary [34].
Considering the fact that elastomers have commonly beenadopted as a second phase polymer for toughening many kinds ofbrittle polymer materials, such as epoxy [35,36], polypropylene[37], poly(methyl methacrylate) [38], and so on, it becomes veryinteresting and important to look for or design/synthesize the newbiobased and biocompatible elastomers to toughen PLA. Recentlywe have developed novel bioelastomers from polymerizing com-mercial biobased monomersdsebacic acid, itaconic acid, succinicacid, propanediol and butanedioldall of which are derived fromrenewable resources [39]. While possessing complete biocompat-ibility, these elastomers exhibit satisfactory elasticity and goodmechanical strength. It is noteworthy that the repeat units of thesebioelastomers are based on ester groups, implying some compati-bility with other ester bond-based polymers such as PLA [7,28].Thus, a hypothesis made in this study is that our bioelastomershave great potential for toughening PLA.
In this work, we will significantly toughen PLA by compoundingwith our synthetic bioelastomer. The morphology, thermal behav-iors, rheological properties andmechanical properties of the blendswill be extensively investigated.
2. Experimental section
2.1. Raw materials
Itaconic acid (IA) (purity 99.0%), succinic acid (SA) (purity99.0%), 1, 3-propanediol (PDO) (purity 99.0%) and 1, 4-butanediol(BDO) (purity 99.0%) were purchased from Alfa Aesar. Sebacicacid (SeA) (purity 99.0%) was obtained fromGuangfu Fine ChemicalInstitute of Tianjin. Tetrabutyl orthotitanate (TBOT), hydroquinoneand phosphorous acid were supplied by Fluka, Beijing Yili FineChenical Co. Ltd, and Sinopharm Chemical Reagent Co. Ltd,respectively. Polylactide (PLA, 5051x) was provided by Nature-works USA. It exhibits a weight-average molecular weight ofw159,000 g/mol, a polydispersity index of 1.67 (GPC analysis), anda glass transition temperature and melting point of 60 �C and152 �C (DSC analysis), respectively. The liquid silicone rubber (SiR)was commercial products and the number-average molecularweight is 20,000 g/mol. The PLA and BE chemical structures areshown in Fig. 1.
Fig. 1. Chemical structures of (a): Polylactide (PLA) and (b): Bioelastomer (BE).
2.2. Synthesis of BE
Our bioelastomer (BE) was synthesized according to our recentwork [39]. In brief, we charged PDO (12.54 g, 0.165 mol), BDO(14.85 g, 0.165 mol), SA (15.04 g, 0.1275 mol), IA (5.85 g, 0.045 mol),SeA (25.76 g, 0.1275 mol), and inhibitors hydroquinone (0.0296 g)and phosphorous acid (0.0074 g) into a 100-ml three-neck flask.The mixture was purged with nitrogen and then heated at 180 �Cfor 2 h; the water formed during the reaction was distilled off. Inthe second phase, after adding TBOT (0.05 wt% relative to thequantity of all reactants) as the catalyst, the mixture was heated to220 �C under reduced pressure (<300 Pa) for 3e4 h until theWeisenberg effect was found. The resulting product BE exhibits aweight-average molecular weight of w181,000 g/mol, a poly-dispersity index of 3.7 (GPC analysis) and a glass transition tem-perature of �56 �C (DSC analysis).
2.3. Sample preparation
PLA and BE were dried in a vacuum oven at 60 �C for 24 h priorto use. Blends were prepared bymelt-mixing BE at different weightratios (0, 5, 10, 15, and 20 wt%) with PLA for 10 min using a HaakeRemix (Remix 600p, Thermal Electron Co., USA) at 170 �C with arotary speed of 80 rpm. All the samples were finally hot-pressedunder 10 MPa at 190 �C for 5 min to produce 1-mm thick sheets.The density of PLA and BEwere 1.24 g/cm3 and 1.06 g/cm3; thus, wewere able to convert wt% to vol%.
2.4. Characterization
The average molecular weight and polydispersity index weredetermined by gel permeation chromatographic (GPC) measure-ments on a Waters Breeze instrument equipped with three watercolumns (Steerage HT3 HT5 HT6E) using tetrahydrofuran as theeluent (1 ml/min) and a Waters 2410 refractive index detector.Polystyrene standard was used for calibration.
Dynamic mechanical thermal analysis was carried out with a VDynamic Mechanical Thermal Analyzer (Rheometric Scientific Co.)with a tension mode at 1 Hz and 3 �C/min from �100 to 150 �C.Differential scanning calorimetry measurements were performedwith a Mettler-Toledo DSC instrument under nitrogen. All sampleswere heated to 200 �C at 50 �C/min and kept isothermal for 5min toremove previous thermal history. Then they were cooledto �100 �C at 10 �C/min, and reheated up to 200 �C at 10 �C/min todetermine glass transition temperature (Tg), cold crystallizationtemperature (Tcc) and melting temperature (Tm). Isothermal crys-tallization behaviors of PLA/BE blends were also evaluated usingDSC by premelting samples at 200 �C for 5 min, followed by rapidcooling to �100 �C and heating to 125 �C at 50 �C/min. Then thesamples were kept at 125 �C for 30 min to allow cold crystallizationfrom the quiescent melt. The exothermic curves of heat flow as afunction of time were recorded. X-ray diffraction (XRD) measure-ments were carried out on a D/Max2500 VB2þ/PC X-ray diffrac-tometer (Rigaku, Japa) with a Cu target radiation for a 2q range of5e50� at an angular resolution of 0.05�. The XRD samples weretreated with the following procedures: (i) all samples were heatedto 200 �C and kept for 5 min; (ii) then they were cooled to roomtemperature at 10 �C/min. The heating/cooling process was in situconducted during the testing.
The morphology of the blends was determined by scanningelectron microscopy (S4700, Hitachi Co., Japan) at 5 kV. Afterimmersing in liquid nitrogen for 10 min, notched samples werefractured by a vice, and then surface-coated with a thin gold layer.The number-average particle diameter (Dn) was determined byNanoMeasurer 1.2 and 100 particles were analyzed per sample. The
H. Kang et al. / Polymer 54 (2013) 2450e24582452
etched samples were immersed into toluene for 10 min at roomtemperature, and then dried under 50 �C in the vacuum oven.Transmission electron microscopy was performed on an H-800-1transmission electron microscope (Hitachi Co., Japan) at 200 kV.The samples were ultramicrotomed at �100 �C to produce sectionsof 60 nm in thickness, and then stained by RuO4 at room temper-ature for 20 min.
Rheological properties were measured by Advanced Rheo-metrics Expansion System (ARES-G2) with a 25 mm plateeplatearrangement. The test was conducted in the frequency 0.01e100 rad/s at strain rate 5% and at 170 �C.
Type-V dumbbell-shaped specimens were molded andmeasured at room temperature according to ASTMD638, by using aCMT 4104 Electrical Tensile Instrument (Shenzhen SANS Test Ma-chine Co., Ltd. China) at 5 mm/min. The notched Izod impactstrength was performed using Ceast, Resil Impactor machine ac-cording to GB/T 1843-2008. A-shaped notches with a radius ofaround 0.2 mm in the impact bars were produced by a Ceastnotcher. At least five specimens were tested for an average value.
3. Results and discussion
3.1. Morphology
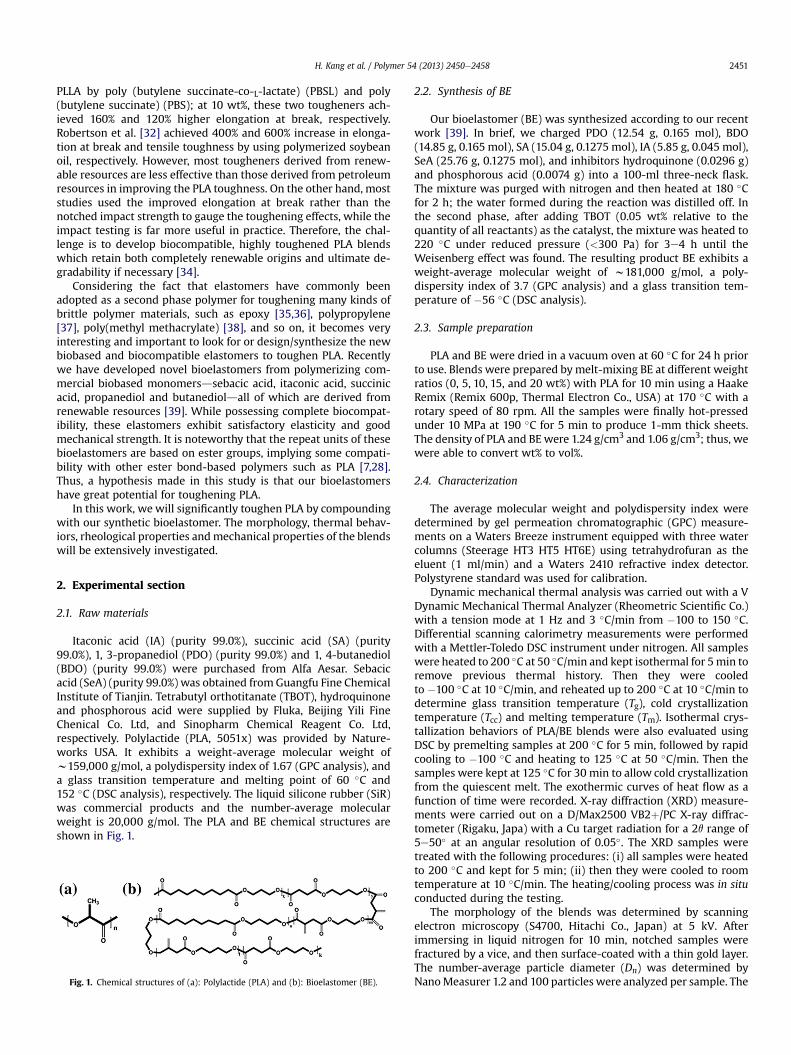
The phase morphology studies can provide the relationship ofthe microstructure and mechanical properties. Therefore, thedetailed phase morphology was evaluated of polylactide (PLA)/bioelastomer (BE) blends using Transmission electron microscopy(TEM) and Scanning electron microscopy (SEM) In Fig. 2a1e4, BEwas observed as the dark phase in TEM micrographs, becauseflexible BE macromolecules have more double bonds than PLAmatrix and these double bonds readily react with RuO4 [40,41].While phase separation is evident at all fractions, BE particles areuniformly dispersed in PLA matrix. Statistics from 100 randomlyselected particles at each fraction show that the number-averageparticle diameter (Dn) increases from 0.99 mm at 5.8 vol% to1.20 mm at 22.6 vol%. In Fig. 2b1e4, a number of voids observedmight be caused by the removal of dispersion phase of BE whenthese specimens were frozen-fractured. These TEM and SEM mi-crographs demonstrate the following features of PLA/BE blends:(i) these BE particles have an average diameter ofw1 mm, and seemto disperse uniformly in matrix; and (ii) the particle geometry isirregular and it is difficult to observe these particles under SEM.
To identify what caused the irregularity of BE particles, anidentical fabrication process was employed to prepare PLA/silicone
Fig. 2. Micrographs of PLA/BE blends with (a1, b1) 5.8 vol% BE, (a2, b2) 11.5 vol% BE, (a3, b3The number-average particle diameter.
rubber (SiR) blend as a comparison. In Fig. S1, large spherical SiRparticles of 7.7 mm in diameter (Dn) are clearly seen, completelydifferent to those BE particles in PLA. Many factors determine thedispersion particle size in blend, such as compatibility, viscositymatch and shear rate; of these, compatibility is the most dominantfactor. If two components in a binary blend have good compati-bility, the dispersion particles would uniformly disperse in thematrix with relatively narrow particle size distribution, and viceversa [42e45]. The far lower particle size of BE may indicate animproved compatibility between BE and PLA, and this will befurther discussed in the following analysis. If a dispersion polymeris incompatiblewith PLA, then the polymerwould exist as sphericalparticles to reduce surface tension; the irregular geometry of BEparticles shows that our PLA/BE blend is different to PLA/SiR blend,implying that PLA and BE have good interfacial interaction.
3.2. Dynamic mechanical thermal analysis
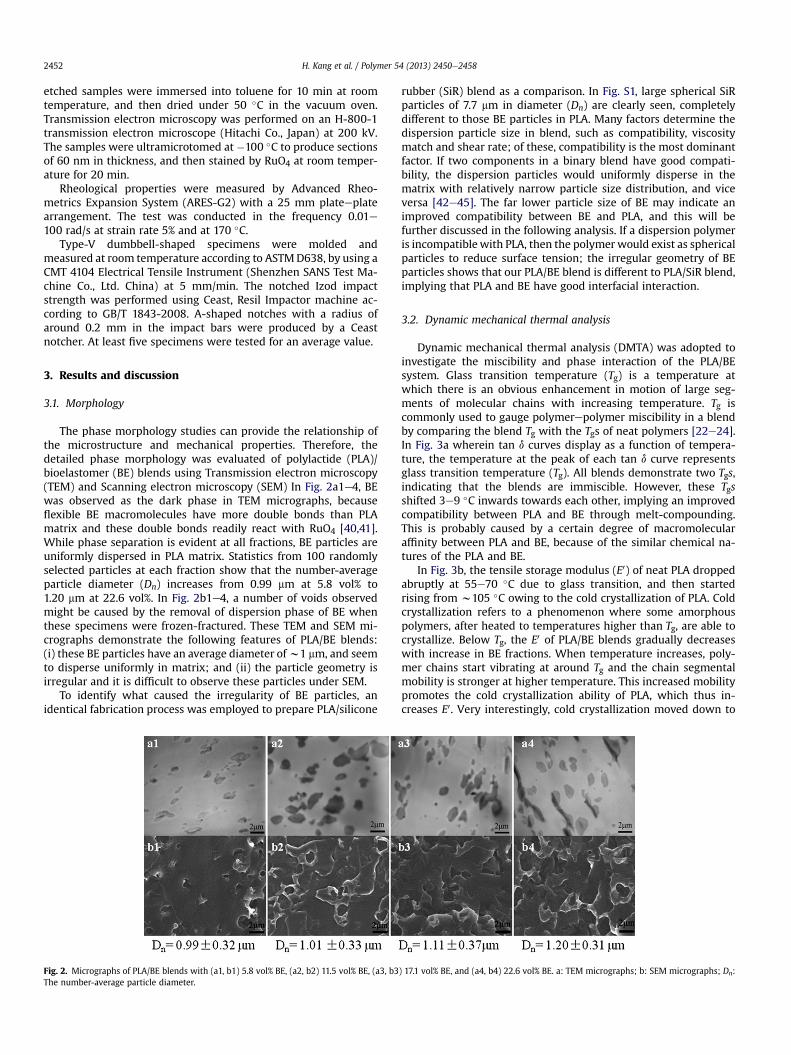
Dynamic mechanical thermal analysis (DMTA) was adopted toinvestigate the miscibility and phase interaction of the PLA/BEsystem. Glass transition temperature (Tg) is a temperature atwhich there is an obvious enhancement in motion of large seg-ments of molecular chains with increasing temperature. Tg iscommonly used to gauge polymerepolymer miscibility in a blendby comparing the blend Tg with the Tgs of neat polymers [22e24].In Fig. 3a wherein tan d curves display as a function of tempera-ture, the temperature at the peak of each tan d curve representsglass transition temperature (Tg). All blends demonstrate two Tgs,indicating that the blends are immiscible. However, these Tgsshifted 3e9 �C inwards towards each other, implying an improvedcompatibility between PLA and BE through melt-compounding.This is probably caused by a certain degree of macromolecularaffinity between PLA and BE, because of the similar chemical na-tures of the PLA and BE.
In Fig. 3b, the tensile storage modulus (E0) of neat PLA droppedabruptly at 55e70 �C due to glass transition, and then startedrising from w105 �C owing to the cold crystallization of PLA. Coldcrystallization refers to a phenomenon where some amorphouspolymers, after heated to temperatures higher than Tg, are able tocrystallize. Below Tg, the E0 of PLA/BE blends gradually decreaseswith increase in BE fractions. When temperature increases, poly-mer chains start vibrating at around Tg and the chain segmentalmobility is stronger at higher temperature. This increased mobilitypromotes the cold crystallization ability of PLA, which thus in-creases E0. Very interestingly, cold crystallization moved down to
) 17.1 vol% BE, and (a4, b4) 22.6 vol% BE. a: TEM micrographs; b: SEM micrographs; Dn:
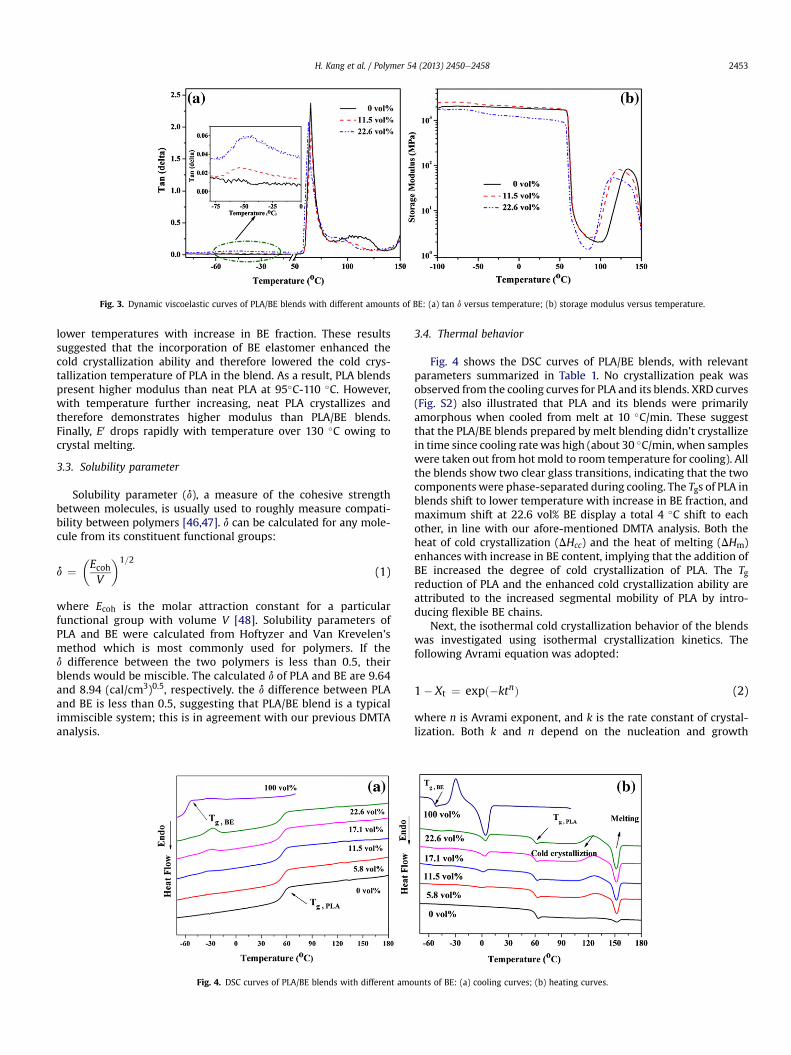
Fig. 3. Dynamic viscoelastic curves of PLA/BE blends with different amounts of BE: (a) tan d versus temperature; (b) storage modulus versus temperature.
H. Kang et al. / Polymer 54 (2013) 2450e2458 2453
lower temperatures with increase in BE fraction. These resultssuggested that the incorporation of BE elastomer enhanced thecold crystallization ability and therefore lowered the cold crys-tallization temperature of PLA in the blend. As a result, PLA blendspresent higher modulus than neat PLA at 95�C-110 �C. However,with temperature further increasing, neat PLA crystallizes andtherefore demonstrates higher modulus than PLA/BE blends.Finally, E0 drops rapidly with temperature over 130 �C owing tocrystal melting.
3.3. Solubility parameter
Solubility parameter (d), a measure of the cohesive strengthbetween molecules, is usually used to roughly measure compati-bility between polymers [46,47]. d can be calculated for any mole-cule from its constituent functional groups:
d ¼�EcohV
�1=2
(1)
where Ecoh is the molar attraction constant for a particularfunctional group with volume V [48]. Solubility parameters ofPLA and BE were calculated from Hoftyzer and Van Krevelen’smethod which is most commonly used for polymers. If thed difference between the two polymers is less than 0.5, theirblends would be miscible. The calculated d of PLA and BE are 9.64and 8.94 (cal/cm3)0.5, respectively. the d difference between PLAand BE is less than 0.5, suggesting that PLA/BE blend is a typicalimmiscible system; this is in agreement with our previous DMTAanalysis.
Fig. 4. DSC curves of PLA/BE blends with different amo
3.4. Thermal behavior
Fig. 4 shows the DSC curves of PLA/BE blends, with relevantparameters summarized in Table 1. No crystallization peak wasobserved from the cooling curves for PLA and its blends. XRD curves(Fig. S2) also illustrated that PLA and its blends were primarilyamorphous when cooled from melt at 10 �C/min. These suggestthat the PLA/BE blends prepared by melt blending didn’t crystallizein time since cooling ratewas high (about 30 �C/min, when sampleswere taken out from hot mold to room temperature for cooling). Allthe blends show two clear glass transitions, indicating that the twocomponents were phase-separated during cooling. The Tgs of PLA inblends shift to lower temperature with increase in BE fraction, andmaximum shift at 22.6 vol% BE display a total 4 �C shift to eachother, in line with our afore-mentioned DMTA analysis. Both theheat of cold crystallization (DHcc) and the heat of melting (DHm)enhances with increase in BE content, implying that the addition ofBE increased the degree of cold crystallization of PLA. The Tgreduction of PLA and the enhanced cold crystallization ability areattributed to the increased segmental mobility of PLA by intro-ducing flexible BE chains.
Next, the isothermal cold crystallization behavior of the blendswas investigated using isothermal crystallization kinetics. Thefollowing Avrami equation was adopted:
1� Xt ¼ expð�ktnÞ (2)
where n is Avrami exponent, and k is the rate constant of crystal-lization. Both k and n depend on the nucleation and growth
unts of BE: (a) cooling curves; (b) heating curves.
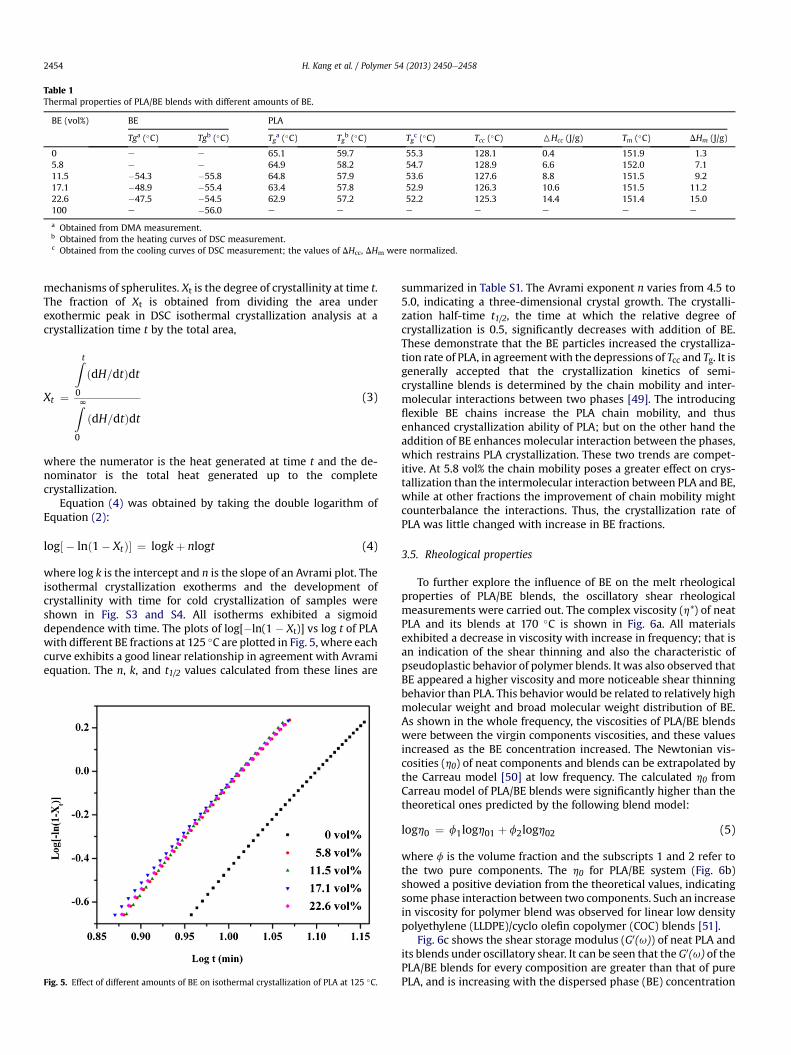
Table 1Thermal properties of PLA/BE blends with different amounts of BE.
BE (vol%) BE PLA
Tga (�C) Tgb (�C) Tga (�C) Tg
b (�C) Tgc (�C) Tcc (�C) 6Hcc (J/g) Tm (�C) DHm (J/g)
0 e e 65.1 59.7 55.3 128.1 0.4 151.9 1.35.8 e e 64.9 58.2 54.7 128.9 6.6 152.0 7.111.5 �54.3 �55.8 64.8 57.9 53.6 127.6 8.8 151.5 9.217.1 �48.9 �55.4 63.4 57.8 52.9 126.3 10.6 151.5 11.222.6 �47.5 �54.5 62.9 57.2 52.2 125.3 14.4 151.4 15.0100 e �56.0 e e e e e e e
a Obtained from DMA measurement.b Obtained from the heating curves of DSC measurement.c Obtained from the cooling curves of DSC measurement; the values of DHcc, DHm were normalized.
H. Kang et al. / Polymer 54 (2013) 2450e24582454
mechanisms of spherulites. Xt is the degree of crystallinity at time t.The fraction of Xt is obtained from dividing the area underexothermic peak in DSC isothermal crystallization analysis at acrystallization time t by the total area,
Xt ¼
Zt
0
ðdH=dtÞdt
ZN
0
ðdH=dtÞdt(3)
where the numerator is the heat generated at time t and the de-nominator is the total heat generated up to the completecrystallization.
Equation (4) was obtained by taking the double logarithm ofEquation (2):
log½ � lnð1� XtÞ� ¼ logkþ nlogt (4)
where log k is the intercept and n is the slope of an Avrami plot. Theisothermal crystallization exotherms and the development ofcrystallinity with time for cold crystallization of samples wereshown in Fig. S3 and S4. All isotherms exhibited a sigmoiddependence with time. The plots of log[�ln(1 � Xt)] vs log t of PLAwith different BE fractions at 125 �C are plotted in Fig. 5, where eachcurve exhibits a good linear relationship in agreement with Avramiequation. The n, k, and t1/2 values calculated from these lines are
Fig. 5. Effect of different amounts of BE on isothermal crystallization of PLA at 125 �C.
summarized in Table S1. The Avrami exponent n varies from 4.5 to5.0, indicating a three-dimensional crystal growth. The crystalli-zation half-time t1/2, the time at which the relative degree ofcrystallization is 0.5, significantly decreases with addition of BE.These demonstrate that the BE particles increased the crystalliza-tion rate of PLA, in agreement with the depressions of Tcc and Tg. It isgenerally accepted that the crystallization kinetics of semi-crystalline blends is determined by the chain mobility and inter-molecular interactions between two phases [49]. The introducingflexible BE chains increase the PLA chain mobility, and thusenhanced crystallization ability of PLA; but on the other hand theaddition of BE enhances molecular interaction between the phases,which restrains PLA crystallization. These two trends are compet-itive. At 5.8 vol% the chain mobility poses a greater effect on crys-tallization than the intermolecular interaction between PLA and BE,while at other fractions the improvement of chain mobility mightcounterbalance the interactions. Thus, the crystallization rate ofPLA was little changed with increase in BE fractions.
3.5. Rheological properties
To further explore the influence of BE on the melt rheologicalproperties of PLA/BE blends, the oscillatory shear rheologicalmeasurements were carried out. The complex viscosity (h*) of neatPLA and its blends at 170 �C is shown in Fig. 6a. All materialsexhibited a decrease in viscosity with increase in frequency; that isan indication of the shear thinning and also the characteristic ofpseudoplastic behavior of polymer blends. It was also observed thatBE appeared a higher viscosity and more noticeable shear thinningbehavior than PLA. This behavior would be related to relatively highmolecular weight and broad molecular weight distribution of BE.As shown in the whole frequency, the viscosities of PLA/BE blendswere between the virgin components viscosities, and these valuesincreased as the BE concentration increased. The Newtonian vis-cosities (h0) of neat components and blends can be extrapolated bythe Carreau model [50] at low frequency. The calculated h0 fromCarreau model of PLA/BE blends were significantly higher than thetheoretical ones predicted by the following blend model:
logh0 ¼ f1logh01 þ f2logh02 (5)
where f is the volume fraction and the subscripts 1 and 2 refer tothe two pure components. The h0 for PLA/BE system (Fig. 6b)showed a positive deviation from the theoretical values, indicatingsome phase interaction between two components. Such an increasein viscosity for polymer blend was observed for linear low densitypolyethylene (LLDPE)/cyclo olefin copolymer (COC) blends [51].
Fig. 6c shows the shear storage modulus (G0(u)) of neat PLA andits blends under oscillatory shear. It can be seen that the G0(u) of thePLA/BE blends for every composition are greater than that of purePLA, and is increasing with the dispersed phase (BE) concentration

Fig. 6. Rheological properties of PLA/BE blends with different amounts of BE: (a) complex viscosity (h﹡); (b) Newtonian viscosities (h0) vs compositions; (c) storage modulus (G’);(d) storage modulus vs loss modulus.
H. Kang et al. / Polymer 54 (2013) 2450e2458 2455
at a low frequency. The enhancement of blend elasticity over PLAcan be attributed to the relaxation of the dispersed phased underslight shear deformation.With increase in BE fraction, it is observedthat the diameter of the dispersed phase increase and the relaxa-tion process of the dispersed phase becomes longer, leading to anincrease of the storage modulus. G0(u) at high frequencies reducedwith BE fraction, since highly deformed BE particles acted as a roleof plasticizer. Moreover, the relationship between the storagemodulus (G0) and the loss modulus (G00) (Han plot) can be used tocharacterize the miscibility of polymer blends [51,52]. The Han plotof PLA/BE blends is displayed in Fig. 6d. It can be clearly observedthat log G0/log G00exhibited linear correlation and close slopes forPLA and 5.8 vol% PLA/BE blend, indicating some compatibility forPLA/BE blend at low concentration of the dispersed phase; otherplots showed nonlinear correlation and the shape of them wereupturning at low modulus. Nonlinear results indicated that PLA/BEblends are immiscible at high concentration of the dispersed phase.
Fig. 7. Typical stressestrain curves of PLA/BE blends with different amounts of BE.
3.6. Toughness and mechanical properties
The toughness of a polymer blend/composite can be measuredby either tensile testing or impact testing, although the latter is ofmore popularity. As shown in Fig. 7 the addition of BE changes thetensile behavior of PLA significantly, with details listed in Table S2.Neat PLA fractures at 7% strain without yielding. By contrast, allblends show distinct yielding which is followed with stable neckgrowth; these blends are fractured at significantly increased elon-gation at break in comparison with neat PLA; a brittle-to-ductiletransition occurs with increase in BE fractions. The blend contain-ing 11.5 vol% BE shows the highest elongation at break 179%, nearly
25-fold improvement over neat PLA. Elongation at break enhanceswith increase in BE fraction until 11.5 vol%, and then decreasesobviously. Tensile strength and tensile modulus of blends reducewith BE content, which is reasonable given the low modulus andtensile strength of elastomer.
The effect of BE on tensile toughness and notched Izod impactstrength is shown in Fig. 8. Tensile toughnessdthe area under thestressestrain curve of a given materialdwas a convenient
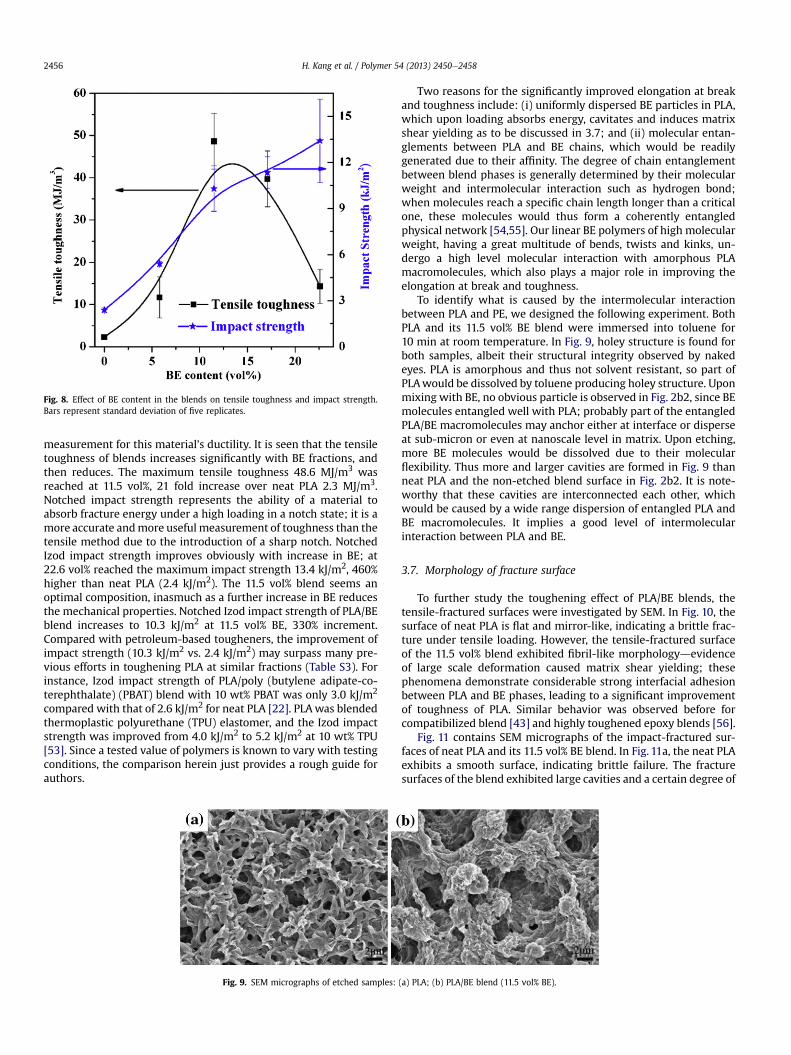
Fig. 8. Effect of BE content in the blends on tensile toughness and impact strength.Bars represent standard deviation of five replicates.
H. Kang et al. / Polymer 54 (2013) 2450e24582456
measurement for this material’s ductility. It is seen that the tensiletoughness of blends increases significantly with BE fractions, andthen reduces. The maximum tensile toughness 48.6 MJ/m3 wasreached at 11.5 vol%, 21 fold increase over neat PLA 2.3 MJ/m3.Notched impact strength represents the ability of a material toabsorb fracture energy under a high loading in a notch state; it is amore accurate andmore useful measurement of toughness than thetensile method due to the introduction of a sharp notch. NotchedIzod impact strength improves obviously with increase in BE; at22.6 vol% reached the maximum impact strength 13.4 kJ/m2, 460%higher than neat PLA (2.4 kJ/m2). The 11.5 vol% blend seems anoptimal composition, inasmuch as a further increase in BE reducesthe mechanical properties. Notched Izod impact strength of PLA/BEblend increases to 10.3 kJ/m2 at 11.5 vol% BE, 330% increment.Compared with petroleum-based tougheners, the improvement ofimpact strength (10.3 kJ/m2 vs. 2.4 kJ/m2) may surpass many pre-vious efforts in toughening PLA at similar fractions (Table S3). Forinstance, Izod impact strength of PLA/poly (butylene adipate-co-terephthalate) (PBAT) blend with 10 wt% PBAT was only 3.0 kJ/m2
compared with that of 2.6 kJ/m2 for neat PLA [22]. PLAwas blendedthermoplastic polyurethane (TPU) elastomer, and the Izod impactstrength was improved from 4.0 kJ/m2 to 5.2 kJ/m2 at 10 wt% TPU[53]. Since a tested value of polymers is known to vary with testingconditions, the comparison herein just provides a rough guide forauthors.
Fig. 9. SEM micrographs of etched samples:
Two reasons for the significantly improved elongation at breakand toughness include: (i) uniformly dispersed BE particles in PLA,which upon loading absorbs energy, cavitates and induces matrixshear yielding as to be discussed in 3.7; and (ii) molecular entan-glements between PLA and BE chains, which would be readilygenerated due to their affinity. The degree of chain entanglementbetween blend phases is generally determined by their molecularweight and intermolecular interaction such as hydrogen bond;when molecules reach a specific chain length longer than a criticalone, these molecules would thus form a coherently entangledphysical network [54,55]. Our linear BE polymers of high molecularweight, having a great multitude of bends, twists and kinks, un-dergo a high level molecular interaction with amorphous PLAmacromolecules, which also plays a major role in improving theelongation at break and toughness.
To identify what is caused by the intermolecular interactionbetween PLA and PE, we designed the following experiment. BothPLA and its 11.5 vol% BE blend were immersed into toluene for10 min at room temperature. In Fig. 9, holey structure is found forboth samples, albeit their structural integrity observed by nakedeyes. PLA is amorphous and thus not solvent resistant, so part ofPLAwould be dissolved by toluene producing holey structure. Uponmixing with BE, no obvious particle is observed in Fig. 2b2, since BEmolecules entangled well with PLA; probably part of the entangledPLA/BE macromolecules may anchor either at interface or disperseat sub-micron or even at nanoscale level in matrix. Upon etching,more BE molecules would be dissolved due to their molecularflexibility. Thus more and larger cavities are formed in Fig. 9 thanneat PLA and the non-etched blend surface in Fig. 2b2. It is note-worthy that these cavities are interconnected each other, whichwould be caused by a wide range dispersion of entangled PLA andBE macromolecules. It implies a good level of intermolecularinteraction between PLA and BE.
3.7. Morphology of fracture surface
To further study the toughening effect of PLA/BE blends, thetensile-fractured surfaces were investigated by SEM. In Fig. 10, thesurface of neat PLA is flat and mirror-like, indicating a brittle frac-ture under tensile loading. However, the tensile-fractured surfaceof the 11.5 vol% blend exhibited fibril-like morphologydevidenceof large scale deformation caused matrix shear yielding; thesephenomena demonstrate considerable strong interfacial adhesionbetween PLA and BE phases, leading to a significant improvementof toughness of PLA. Similar behavior was observed before forcompatibilized blend [43] and highly toughened epoxy blends [56].
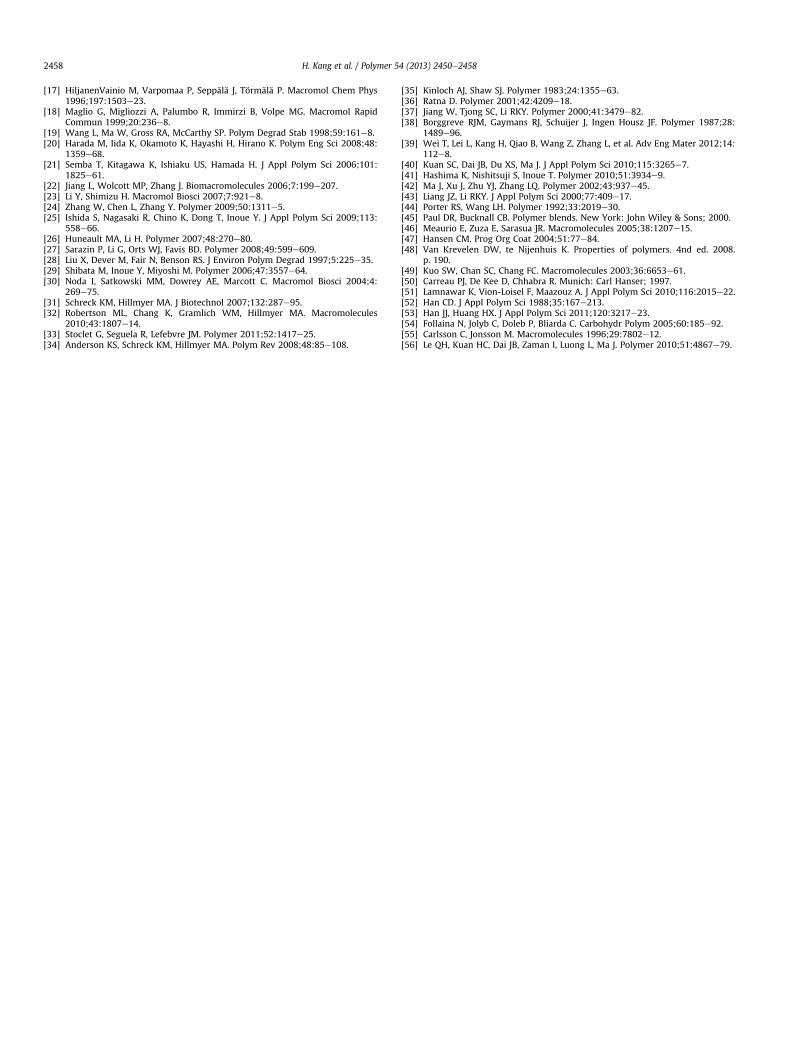
Fig. 11 contains SEM micrographs of the impact-fractured sur-faces of neat PLA and its 11.5 vol% BE blend. In Fig. 11a, the neat PLAexhibits a smooth surface, indicating brittle failure. The fracturesurfaces of the blend exhibited large cavities and a certain degree of
(a) PLA; (b) PLA/BE blend (11.5 vol% BE).
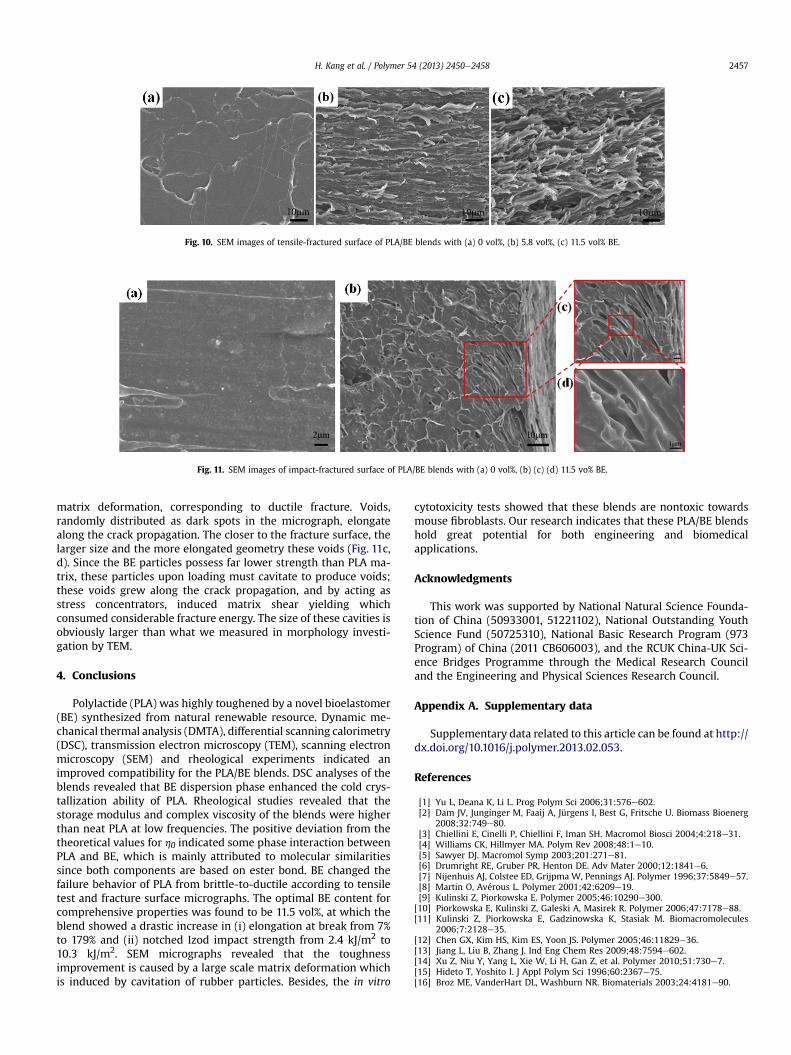
Fig. 10. SEM images of tensile-fractured surface of PLA/BE blends with (a) 0 vol%, (b) 5.8 vol%, (c) 11.5 vol% BE.
Fig. 11. SEM images of impact-fractured surface of PLA/BE blends with (a) 0 vol%, (b) (c) (d) 11.5 vo% BE.
H. Kang et al. / Polymer 54 (2013) 2450e2458 2457
matrix deformation, corresponding to ductile fracture. Voids,randomly distributed as dark spots in the micrograph, elongatealong the crack propagation. The closer to the fracture surface, thelarger size and the more elongated geometry these voids (Fig. 11c,d). Since the BE particles possess far lower strength than PLA ma-trix, these particles upon loading must cavitate to produce voids;these voids grew along the crack propagation, and by acting asstress concentrators, induced matrix shear yielding whichconsumed considerable fracture energy. The size of these cavities isobviously larger than what we measured in morphology investi-gation by TEM.
4. Conclusions
Polylactide (PLA) was highly toughened by a novel bioelastomer(BE) synthesized from natural renewable resource. Dynamic me-chanical thermal analysis (DMTA), differential scanning calorimetry(DSC), transmission electron microscopy (TEM), scanning electronmicroscopy (SEM) and rheological experiments indicated animproved compatibility for the PLA/BE blends. DSC analyses of theblends revealed that BE dispersion phase enhanced the cold crys-tallization ability of PLA. Rheological studies revealed that thestorage modulus and complex viscosity of the blends were higherthan neat PLA at low frequencies. The positive deviation from thetheoretical values for h0 indicated some phase interaction betweenPLA and BE, which is mainly attributed to molecular similaritiessince both components are based on ester bond. BE changed thefailure behavior of PLA from brittle-to-ductile according to tensiletest and fracture surface micrographs. The optimal BE content forcomprehensive properties was found to be 11.5 vol%, at which theblend showed a drastic increase in (i) elongation at break from 7%to 179% and (ii) notched Izod impact strength from 2.4 kJ/m2 to10.3 kJ/m2. SEM micrographs revealed that the toughnessimprovement is caused by a large scale matrix deformation whichis induced by cavitation of rubber particles. Besides, the in vitro
cytotoxicity tests showed that these blends are nontoxic towardsmouse fibroblasts. Our research indicates that these PLA/BE blendshold great potential for both engineering and biomedicalapplications.
Acknowledgments
This work was supported by National Natural Science Founda-tion of China (50933001, 51221102), National Outstanding YouthScience Fund (50725310), National Basic Research Program (973Program) of China (2011 CB606003), and the RCUK China-UK Sci-ence Bridges Programme through the Medical Research Counciland the Engineering and Physical Sciences Research Council.
Appendix A. Supplementary data
Supplementary data related to this article can be found at http://dx.doi.org/10.1016/j.polymer.2013.02.053.
References
[1] Yu L, Deana K, Li L. Prog Polym Sci 2006;31:576e602.[2] Dam JV, Junginger M, Faaij A, Jürgens I, Best G, Fritsche U. Biomass Bioenerg
2008;32:749e80.[3] Chiellini E, Cinelli P, Chiellini F, Iman SH. Macromol Biosci 2004;4:218e31.[4] Williams CK, Hillmyer MA. Polym Rev 2008;48:1e10.[5] Sawyer DJ. Macromol Symp 2003;201:271e81.[6] Drumright RE, Gruber PR, Henton DE. Adv Mater 2000;12:1841e6.[7] Nijenhuis AJ, Colstee ED, Grijpma W, Pennings AJ. Polymer 1996;37:5849e57.[8] Martin O, Avérous L. Polymer 2001;42:6209e19.[9] Kulinski Z, Piorkowska E. Polymer 2005;46:10290e300.
[10] Piorkowska E, Kulinski Z, Galeski A, Masirek R. Polymer 2006;47:7178e88.[11] Kulinski Z, Piorkowska E, Gadzinowska K, Stasiak M. Biomacromolecules
2006;7:2128e35.[12] Chen GX, Kim HS, Kim ES, Yoon JS. Polymer 2005;46:11829e36.[13] Jiang L, Liu B, Zhang J. Ind Eng Chem Res 2009;48:7594e602.[14] Xu Z, Niu Y, Yang L, Xie W, Li H, Gan Z, et al. Polymer 2010;51:730e7.[15] Hideto T, Yoshito I. J Appl Polym Sci 1996;60:2367e75.[16] Broz ME, VanderHart DL, Washburn NR. Biomaterials 2003;24:4181e90.
H. Kang et al. / Polymer 54 (2013) 2450e24582458
[17] HiljanenVainio M, Varpomaa P, Seppälä J, Törmälä P. Macromol Chem Phys1996;197:1503e23.
[18] Maglio G, Migliozzi A, Palumbo R, Immirzi B, Volpe MG. Macromol RapidCommun 1999;20:236e8.
[19] Wang L, Ma W, Gross RA, McCarthy SP. Polym Degrad Stab 1998;59:161e8.[20] Harada M, Iida K, Okamoto K, Hayashi H, Hirano K. Polym Eng Sci 2008;48:
1359e68.[21] Semba T, Kitagawa K, Ishiaku US, Hamada H. J Appl Polym Sci 2006;101:
1825e61.[22] Jiang L, Wolcott MP, Zhang J. Biomacromolecules 2006;7:199e207.[23] Li Y, Shimizu H. Macromol Biosci 2007;7:921e8.[24] Zhang W, Chen L, Zhang Y. Polymer 2009;50:1311e5.[25] Ishida S, Nagasaki R, Chino K, Dong T, Inoue Y. J Appl Polym Sci 2009;113:
558e66.[26] Huneault MA, Li H. Polymer 2007;48:270e80.[27] Sarazin P, Li G, Orts WJ, Favis BD. Polymer 2008;49:599e609.[28] Liu X, Dever M, Fair N, Benson RS. J Environ Polym Degrad 1997;5:225e35.[29] Shibata M, Inoue Y, Miyoshi M. Polymer 2006;47:3557e64.[30] Noda I, Satkowski MM, Dowrey AE, Marcott C. Macromol Biosci 2004;4:
269e75.[31] Schreck KM, Hillmyer MA. J Biotechnol 2007;132:287e95.[32] Robertson ML, Chang K, Gramlich WM, Hillmyer MA. Macromolecules
2010;43:1807e14.[33] Stoclet G, Seguela R, Lefebvre JM. Polymer 2011;52:1417e25.[34] Anderson KS, Schreck KM, Hillmyer MA. Polym Rev 2008;48:85e108.
[35] Kinloch AJ, Shaw SJ. Polymer 1983;24:1355e63.[36] Ratna D. Polymer 2001;42:4209e18.[37] Jiang W, Tjong SC, Li RKY. Polymer 2000;41:3479e82.[38] Borggreve RJM, Gaymans RJ, Schuijer J, Ingen Housz JF. Polymer 1987;28:
1489e96.[39] Wei T, Lei L, Kang H, Qiao B, Wang Z, Zhang L, et al. Adv Eng Mater 2012;14:
112e8.[40] Kuan SC, Dai JB, Du XS, Ma J. J Appl Polym Sci 2010;115:3265e7.[41] Hashima K, Nishitsuji S, Inoue T. Polymer 2010;51:3934e9.[42] Ma J, Xu J, Zhu YJ, Zhang LQ. Polymer 2002;43:937e45.[43] Liang JZ, Li RKY. J Appl Polym Sci 2000;77:409e17.[44] Porter RS, Wang LH. Polymer 1992;33:2019e30.[45] Paul DR, Bucknall CB. Polymer blends. New York: John Wiley & Sons; 2000.[46] Meaurio E, Zuza E, Sarasua JR. Macromolecules 2005;38:1207e15.[47] Hansen CM. Prog Org Coat 2004;51:77e84.[48] Van Krevelen DW, te Nijenhuis K. Properties of polymers. 4nd ed. 2008.
p. 190.[49] Kuo SW, Chan SC, Chang FC. Macromolecules 2003;36:6653e61.[50] Carreau PJ, De Kee D, Chhabra R. Munich: Carl Hanser; 1997.[51] Lamnawar K, Vion-Loisel F, Maazouz A. J Appl Polym Sci 2010;116:2015e22.[52] Han CD. J Appl Polym Sci 1988;35:167e213.[53] Han JJ, Huang HX. J Appl Polym Sci 2011;120:3217e23.[54] Follaina N, Jolyb C, Doleb P, Bliarda C. Carbohydr Polym 2005;60:185e92.[55] Carlsson C, Jonsson M. Macromolecules 1996;29:7802e12.[56] Le QH, Kuan HC, Dai JB, Zaman I, Luong L, Ma J. Polymer 2010;51:4867e79.