EmployerSkills Survey 2015: UK Results 5.8: Training expenditure by size and sector, the proportion...
245
Employer Skills Survey 2015: UK Results Evidence Report 97 May 2016 Amended May 2018
Transcript of EmployerSkills Survey 2015: UK Results 5.8: Training expenditure by size and sector, the proportion...

Employer Skills Survey 2015: UK Results Evidence Report 97May 2016
Amended May 2018

The UK Commission’s Employer Skills Survey 2015: UK Results
David Vivian, Mark Winterbotham, Jan Shury, Andrew Skone James, Jessica Huntley Hewitt, Mark Tweddle and Christabel Downing
IFF Research
Alex Thornton, Rosie Sutton, Carol Stanfield and Adam Leach
UK Commission for Employment and Skills
May 2016 Amended May 2018

Foreword
It is my pleasure to introduce the 2015 Employer Skills Survey (ESS), the third in the series
of UK-wide skills surveys run by the UK Commission for Employment and Skills (UKCES).
The survey gives us insight into the skills issues employers face and the action they are
taking to address them, providing a unique skills perspective alongside other labour market
information. There is no other business survey on this scale: our researchers conducted
over 91,000 interviews with employers from Caithness to Cornwall, Tyrone to Tyneside.
The wealth of data this provides allows us not only to track changes over time but also to
delve down into geographical, industry-sector, and occupational detail.
This year’s survey points to continued growth in recruitment. This adds to other indicators
of consumer and business confidence at the end of 2015, including the UK’s relatively
strong record in employment since 2010.
But what ESS 2015 also shows is the other side of the coin – the dark side of this increase
in recruitment is that a growing number of jobs are being left unfilled because companies
can’t find the right people with the right skills.
An area of real concern is skill shortages faced by the construction sector, a hugely
important sector that contributes nearly £90bn to the UK economy, over a million jobs, and
is strategically important in its contribution to housing, infrastructure and initiatives to
stimulate UK growth. The ESS findings show employers are struggling to fill one in three
construction vacancies, up from one in four in 2013, because they can’t find people with
the right skills.
This cautionary note is just one from a survey that probes far deeper into the “black box”
of how employers respond to the skills challenges that they face, and hints at how these
could contribute to the continuing unsolved puzzle of UK productivity.
On this note, a fascinating area of the survey reports on the skills left unused by UK
employers. One in three employers had at least one member of staff whose skills were
underused. Beneath the headline picture the survey reveals variations, for example, 40 per
cent of employers in the Hotel and Restaurants sector report having staff with unused skills
compared to 20 per cent in Agriculture. Knowing that UK productivity has flatlined since
2008 at the same time as employers know of talent untapped in their workers is not easy
to take in. ESS looks at the underuse of skills from a business perspective (complementing
other data from workers) but this is an area where our understanding is developing and
more work is needed to look at this troubling trend.

2
At UKCES we are proud to have had stewardship of ESS since 2009 and of its extensive
use and value. Having a comprehensive picture of skills requirements and responses
alongside other business practices is essential to effective skills systems. In this, the survey
is a source of international envy. We hope this important source of data remains at the
cornerstone of high quality Labour Market Intelligence.
For now, it remains for me to thank the research staff at UKCES and their survey partners
for the hard work that has gone into this report; my sincere gratitude also goes to each and
every employer who gave their valuable time to answer our survey questions, without
whom we would have no results to report.
Douglas McCormick
UKCES Commissioner and Chief Executive Officer, Sweett Group
3
Table of Contents
Glossary ................................................................................................................ 9
Key findings ....................................................................................................... 11
Executive Summary ........................................................................................... 12
1 Introduction ................................................................................................ 19
1.1 The UK-wide employer skills survey ................................................................... 19
1.2 Methodological overview ...................................................................................... 20
1.2.1 Survey sampling .................................................................................................... 20
1.2.2 Survey questionnaire ............................................................................................ 21
1.2.3 Survey fieldwork .................................................................................................... 22
1.2.4 Data weighting ....................................................................................................... 23
1.3 The nature of UK establishments: describing the survey population ............. 23
1.3.1 Profile of UK business population ....................................................................... 24
1.3.2 Distribution of employers and employment over time ...................................... 26
1.4 Structure of this report .......................................................................................... 28
1.5 Reporting conventions .......................................................................................... 29
2 Recruitment and skill-shortage vacancies .............................................. 31
2.1 Chapter Summary .................................................................................................. 31
2.2 Introduction ............................................................................................................ 32
2.3 Vacancies ............................................................................................................... 33
2.4 Skill-shortage vacancies ....................................................................................... 36
2.5 The incidence, volume and density of skill-shortage vacancies ...................... 36
2.6 Skills lacking in the available labour market ...................................................... 44
2.7 The impact of skill-shortage vacancies on employers ...................................... 48
2.8 Wider recruitment challenges .............................................................................. 49
2.9 Retention difficulties ............................................................................................. 51
2.9.1 Incidence of retention difficulties ........................................................................ 51
2.9.2 Occupational pattern of retention difficulties ..................................................... 52
2.9.3 Reasons for retention difficulties ......................................................................... 53
2.10 Conclusions ........................................................................................................... 55
3 The Internal Skills Challenge .................................................................... 56
3.1 Chapter Summary .................................................................................................. 56
3.2 Introduction ............................................................................................................ 57
3.3 The incidence, volume and density of skills gaps ............................................. 57

4
3.3.1 The sectoral distribution of skills gaps ............................................................... 59
3.3.2 The occupational distribution of skills gaps ...................................................... 61
3.4 The causes of skills gaps ..................................................................................... 64
3.5 Skills lacking internally ......................................................................................... 66
3.6 The impact of skills gaps ...................................................................................... 70
3.7 Employer response to skills gaps ........................................................................ 72
3.8 Skills deficiencies among existing staff and when recruiting staff .................. 74
3.8.1 The relationship between skill-shortage vacancies and skills gaps ................ 74
3.8.2 Skills lacking internally and externally ................................................................ 75
3.9 Conclusions ........................................................................................................... 77
4 Employer perceptions of under-use of skills and qualifications ........... 78
4.1 Chapter Summary .................................................................................................. 78
4.2 Introduction ............................................................................................................ 79
4.3 Prevalence of under-utilisation ............................................................................ 80
4.4 Occupations most affected by under-utilisation ................................................ 80
4.5 Reasons for under-utilisation ............................................................................... 82
4.6 Reasons for under-utilisation ............................................................................... 82
4.7 Under-utilisation by country ................................................................................. 86
4.8 Under-utilisation by establishment size .............................................................. 87
4.9 Under-utilisation by sector ................................................................................... 88
Under-utilisation and other challenges ............................................................................ 90
4.10 Conclusions ........................................................................................................... 91
5 Training and workforce development ...................................................... 92
5.1 Chapter Summary .................................................................................................. 92
5.2 Introduction ............................................................................................................ 94
5.3 Incidence of training and workforce development ............................................. 95
5.4 Number of staff trained ......................................................................................... 96
5.5 Training days .......................................................................................................... 99
5.6 Types of training provided .................................................................................. 101
5.7 Training to qualifications .................................................................................... 103
5.8 Online / e-learning and other self-learning ....................................................... 105
5.9 Investment in Training ........................................................................................ 109
5.10 Barriers and limits on training ............................................................................ 115
5.11 Other development opportunities ...................................................................... 118
5.12 Conclusions ......................................................................................................... 119
6 High performance working practices and product market strategies .......................................................................................................... 120

5
6.1 Chapter Summary ................................................................................................ 120
6.2 Introduction .......................................................................................................... 121
6.3 High Performance Working ................................................................................ 121
6.4 The relationship between HPW and skill shortages ........................................ 125
6.5 The relationship between HPW and skills gaps ............................................... 127
6.6 The relationship between HPW and training .................................................... 128
6.7 Product market strategies .................................................................................. 129
6.8 Deriving a composite Product Market Index ..................................................... 131
6.9 Profiling higher and lower composite PMS score employers ......................... 131
6.10 Relationship between PMS and skill shortages ............................................... 132
6.11 The relationship between PMS and skills gaps ................................................ 134
6.12 The relationship between PMS and training ..................................................... 136
6.13 Conclusion ........................................................................................................... 138
7 Conclusions ............................................................................................. 139
7.1 Introduction .......................................................................................................... 139
7.2 Tracking developments in the UK economy ..................................................... 139
7.3 Changing nature of work .................................................................................... 140
7.4 Training investment ............................................................................................. 141
7.5 Leadership and management ............................................................................. 143
7.6 Skills for a productive workforce ....................................................................... 144
Appendix A: Supplementary Tables ............................................................... 146
Chapter 1: Introduction .................................................................................................... 146
Chapter 2: Recruitment and skill-shortage vacancies .................................................. 149
Chapter 3: The Internal Skills Challenge ........................................................................ 171
Chapter 4: Employer perceptions of under-use of skills and qualifications .............. 190
Chapter 5: Training and workforce development .......................................................... 195
Chapter 6: High Performance Working practices and product market strategies ........................................................................................................................... 212
Appendix B: National Time Series Tables ..................................................... 217
Appendix C: Industry coding .......................................................................... 222
Appendix D: Occupational Coding ................................................................. 226
Appendix E: Sampling Error and Statistical Confidence .............................. 227
Appendix F: Weighted base sizes ................................................................. 229
Appendix G: Unweighted base sizes ............................................................. 230

6
Appendix I: Technical Appendix ..................................................................... 232
Employer Skills Survey: Wave 1 ...................................................................................... 232
Employer Skills Survey: Investment in Training follow-up .......................................... 237
Questionnaire design ....................................................................................................... 239
Appendix J: Bibliography ................................................................................ 240

7
Table of Graphs and Charts Table 1.1 Survey response rates ................................................................................................. 23
Figure 1.1 Headline information on the profile of UK establishments and employment ...... 25
Table 1.2 UK business and employment population by sector, 2013-2015 ............................. 27
Table 1.3 Broad occupational groups ......................................................................................... 29
Figure 2.1 Incidence and density of vacancies overall and by country ................................. 34
Table 2.1 Incidence and density of skill-shortage vacancies (SSVs) by country .................. 37
Figure 2.2 Number and density of skill-shortage vacancies (SSVs), by sector ..................... 38
Figure 2.3 Density and number of skill-shortage vacancies (SSVs), by occupation ............ 40
Figure 2.4 Density of skill-shortage vacancies (SSVs) by sector and occupation within sector ................................................................................................................................. 43
Figure 2.5 Skills lacking among applicants to establishments with at least one skill-shortage vacancy (prompted) ...................................................................................................... 45
Table 2.2 Most common skills lacking among applicants, by occupation .............................. 47
Figure 2.6 Impact of skill-shortage vacancies (prompted) ...................................................... 49
Figure 2.7 Main non-skills-related causes of having hard-to-fill vacancies (unprompted) .. 50
Figure 2.8 Occupations in which most difficulty retaining staff .............................................. 52
Figure 2.9 Reasons for retention difficulties .............................................................................. 54
Figure 3.1 Incidence and density of skills gaps by country .................................................... 58
Figure 3.2 Density of skills gaps by sector ............................................................................... 60
Table 3.1 Number and density of skills gaps by occupation .................................................... 61
Figure 3.3 Density of skills gaps by occupation within sector ................................................ 63
Table 3.2 Main causes of skills gaps (prompted) ....................................................................... 64
Figure 3.4 Skills lacking among staff with skills gaps ............................................................. 67
Table 3.3 Most common skills lacking among staff with skills gaps, by occupation ............ 69
Figure 3.5 Impacts of skills gaps ................................................................................................ 71
Figure 3.6 Actions taken to overcome skills gaps (prompted) ................................................ 73
Figure 3.7 Changes in number of skill-shortage vacancies and skills gaps over time, by sector ................................................................................................................................. 74
Figure 4.1 Occupation most affected by under-utilisation........................................................ 81
Figure 4.2 Reasons for under-utilisation (unprompted) ........................................................... 83
Table 4.1 Reasons for under-utilisation by occupation ........................................................... 85
Table 4.2 Reasons for under-utilisation by sector .................................................................... 89
Figure 4.3 Relationships between under-utilisation and other challenges ............................ 90
Figure 5.1 Training provision over the last 12 months .............................................................. 95
Table 5.1 Number and proportion of staff trained over the last 12 months, by country and establishment size ......................................................................................................................... 97
Figure 5.2 Proportion of staff trained over the last 12 months by occupation (2011 – 2015) ... ................................................................................................................................. 98
Table 5.2 Total training and development days, and days per person trained and per employee by country and establishment size (2011 - 2015) ..................................................... 99
Figure 5.3 Types of training provided over the last 12 months by employers that train (prompted) ............................................................................................................................... 101
Table 5.3 Training to nationally recognised qualifications over the previous 12 months ... 104

8
Table 5.4 Provision of online training or e-learning over the past 12 months by country and establishment size ....................................................................................................................... 106
Figure 5.4 Use of online training and e-learning, and changes in use, by sector ................ 107
Table 5.5 Provision of other self-learning over the previous 12 months by country and establishment size ....................................................................................................................... 108
Table 5.6 Total training expenditure and spend per person trained and per employee (2011 to 2015) ............................................................................................................................... 110
Table 5.7 Total training expenditure broken down by individual components (2011 to 2015) .. ............................................................................................................................... 112
Table 5.8: Training expenditure by size and sector, the proportion spent on off-the-job elements, and the breakdown of total training expenditure (both on-the-job and off-the-job) by key elements ........................................................................................................................... 113
Figure 5.5 Barriers to providing more training ....................................................................... 115
Figure 5.6 Reasons for not providing training in the previous 12 months ......................... 116
Figure 5.7 Employer interest in undertaking more training over the last 12 months than they were able to provide .................................................................................................................... 118
Table 6.1 High Performance Working (HPW) practices according to the five factors ........ 122
Figure 6.1 Employer adoption of High Performance Working (HPW) practices .................. 122
Figure 6.2 Summary of employers’ experiences of skill shortages, skills gaps and training depending on High Performance Working (HPW) classification ........................................... 124
Figure 6.3 Incidence and density of vacancies, hard-to-fill vacancies (HtFVs) and skill-shortage vacancies (SSVs) by HPW classification and size .................................................. 126
Figure 6.4 Incidence and density of skills gaps by HPW classification and size ................ 127
Figure 6.5 Product Market Strategy positions ......................................................................... 130
Table 6.2 Overall composite Product Market Strategy scores .............................................. 131
Table 6.3 Overall composite Product Market Strategy scores by size ................................. 132
Figure 6.6 Incidence of vacancies, hard-to-fill vacancies (HtFVs) and skill-shortage vacancies (SSVs), as well as density of HtFVs, by Product Market Strategy classification 133
Table 6.4 Incidence and density of skills gaps by Product Market Strategy ....................... 134
Table 6.5 Main causes of skills gaps (prompted), by Product Market Strategy .................. 135
Figure 6.7 Incidence of training and proportions of the workforce trained by Product Market Strategy classification .................................................................................................... 136

9
Glossary This glossary gives a short guide to the key terms used in this report:
Establishment (also referred to as workplace, business, employer or site)
A single location of an organisation – for this survey
all have at least two people working at that location.
Vacancy density The number of vacancies as a proportion of all
employment.
Hard-to-fill vacancies Vacancies which are proving difficult to fill, as
defined by the establishment (from the question:
“Are any of these vacancies proving hard to fill?”).
Hard-to-fill vacancy density
The number of hard-to-fill vacancies as a proportion
of all vacancies.
Skill-shortage vacancies (SSVs)
Vacancies which are proving difficult to fill due to
the establishment not being able to find applicants
with the appropriate skills, qualifications or
experience.
Skill-shortage vacancy density
The number of skill-shortage vacancies as a
proportion of all vacancies.
Skills gaps A “skills gap” exists where an employee is deemed
by their employer to be not fully proficient, i.e. is not
able to do their job to the required level. See Annex
H.

10
Skills gap density The number of staff reported as not fully proficient
as a proportion of all employment.
Under-use of skills (skills under-utilisation)
An employee’s skills are under-used / underutilised
if the employer reports a person has both skills and
qualifications that are more advanced than required
to perform the job role they are currently in.
Product Market Strategy (PMS)
An establishment’s PMS score is worked out from
the combined answers to four questions:
• How customised their output is;
• How price dependent their offering is;
• How innovative the establishment is;
• Whether outputs are premium or basic quality.
A high PMS score indicates outputs are
customised, not price-dependent, premium quality
and the establishment often leads the way in
product development.
Level 4 and above qualifications
Qualifications at or above Level 4 on the National
Qualifications Framework. Includes HNDs, HNCs,
foundation degrees and degrees, postgraduate
degrees, and some vocational and professional
qualifications.
Sector For definitions of the different sector groupings used
in this report please refer to Annex C.
Occupations For definitions of the occupational groups used in
this report please refer to Annex D.

11
Key findings
ESS
2011
ESS
2013
ESS
2015
Vacancies and skill-shortage vacancies
% of establishments with any vacancies 14% 15% 19%
% of establishments with any hard-to-fill vacancies 4% 5% 8%
% of establishments with SSVs 3% 4% 6%
% of all vacancies which are SSVs 16% 22% 23%
Number of vacancies 586,500 655,000 927,200
Number of skill-shortage vacancies 91,400 146,200 209,500
Skills gaps
% of establishments with any staff not fully proficient 17% 15% 14%
Number of skills gaps 1,485,500 1,409,900 1,380,200
Number of staff not fully proficient as a % of employment 6% 5% 5%
Training
% of establishments training staff over the last 12 months 65% 66% 66%
% of establishments providing off-the-job training in the last 12 months 47% 49% 49%
% of workforce trained 55% 62% 63%
Total days training 115m 113m 118m
Total training expenditure £43.8bn £43.0bn £45.4bn
Vacancies, skill-shortage vacancies and skills gaps rounded to the nearest 100.
2011 data has been reweighted to be comparable to 2013 data.

12
Executive Summary Introduction
In examining the experiences and practices of over 91,000 employers, the UK
Commission’s Employer Skills Survey (ESS) is the definitive source of intelligence on the
skills challenges employers across the UK are facing and their response in terms of
investment in skills and training.
The survey was first conducted at UK wide level in 2011, and was developed from a series
of surveys conducted in each of the countries of the UK during the 1990s and the 2000s.
The UK survey has been conducted biennially, and the 2015 survey represents the third
edition in the series. This period of time coincides with the UK economy leaving recession
and experiencing relatively sustained economic growth. It explores the skills challenges
that employers face both within their existing workforces and when recruiting, their use of
the skills of their staff, the levels and nature of investment in training and development, and
the relationship between skills challenges, training activity and business strategy.
The study reports on the experiences of employers at the establishment level, rather than
at the enterprise level. The survey covers establishments with at least two people on the
payroll.
Recruitment and skill-shortage vacancies
There was substantial growth in the number of employers active in the recruitment market
in 2015 compared to 2013: 19 per cent of establishments had at least one current vacancy
at the time of ESS 2015 fieldwork, up from 15 per cent in 2013. Moreover, there were
927,000 reported vacancies, almost 300,000 more than two years previously (an increase
of 42 per cent). This strong growth in recruitment activity was evident in all the UK
countries.
Within this buoyant labour market, skill-shortage vacancies presented a growing challenge
for employers in filling their vacancies. Six per cent of all employers had at least one skill-
shortage vacancy at the time of the survey – a significant increase from the four per cent
of employers that reported having such vacancies in 2013. In volume terms, there were
209,500 reported skill-shortage vacancies which was an increase of 43 per cent from the
146,000 reported in 2013. The increase in the number of skill-shortage vacancies was
proportional to the increase in vacancies. Therefore, the density of skill-shortage vacancies
(i.e. the proportion of vacancies that were hard-to-fill because of skill shortages) was largely
unchanged at 23 per cent compared with 22 per cent in 2013 at an overall UK level.

13
There was variation by country, however. The density of skill-shortage vacancies remained
at a similar level to 2013 in both England and Scotland, had increased in Wales but had
decreased in Northern Ireland.
By occupation, there had been a particularly marked increase in the density of skill-
shortage vacancies among Machine Operatives since 2013 (from 25 per cent of all
vacancies to 32 per cent). Skilled Trades continued to be the occupation with the highest
density of skill-shortage vacancies (43 per cent).
Skill-shortage vacancies were caused by a number of people and personal skills and
technical and practical skills lacking amongst applicants. Skills related to operational
aspects of the role, as well as complex analytical skills, were the main technical and
practical skills lacking. The main people and personal skills lacking pertained to time
management, management and leadership, and sales and customer handling skills.
Although the number of skill-shortage vacancies is relatively small, the impacts of skill-
shortage vacancies continued to be significant for employers. Over two-thirds of employers
that had difficulty filling their vacancies solely as a result of skill shortages had experienced
a direct financial impact through either loss of business to competitors, or increased
operating costs.
Skills gaps in the workplace
The vast majority of employers (86 per cent) reported that they had a fully proficient
workforce. However, 14 per cent of employers reported skills gaps within their
establishment, with approximately 1.4 million staff lacking proficiency in their current role
(five per cent of the UK workforce).
The proportion of employers with any skills gaps, and the proportion of the workforce
affected, decreased gradually at UK level between the 2011 and 2015 surveys. This varied
by nation, however. The picture in England was relatively static, while the levels of skills
gaps in Scotland and Wales fell between 2013 and 2015, when it aligned with the
experience among employers in England. Employers in Northern Ireland were the least
likely to report a lack of proficiency in their staff: just nine per cent of employers cited skills
gaps within their establishment (down from 14 per cent in 2013) with these affecting 3.3
per cent of all employees (down from 5.2 per cent in 2013).
At an occupational level, skills gaps continued to be more prevalent in what are traditionally
described as unskilled or semi-skilled occupations, with a notable increase from 2013 in
the proportion of Machine Operatives not being fully proficient in their job role. This was
also the occupation in which there was the greatest increase in the density of skill-shortage
vacancies.

14
The most common skills deemed to be lacking among existing staff were people and
personal skills relating to workload management and teamwork. Specialist, job-specific
skills were also widely considered to be lacking, along with complex analytical skills,
especially among those in high-skill occupations such as Managers and Professionals.
While the proportion of employers and staff affected by skills gaps decreased compared to
2013, the impact of skills gaps increased slightly, and appeared to impact on smaller
businesses in particular.
Retaining staff
Eight per cent of establishments reported that there were specific jobs in which they had
difficulties retaining staff, more commonly in larger establishments and those in the Hotel
and Restaurants, Public Administration, Education and Health and Social Work sectors.
When establishments experience retention difficulties, these tend to be for specific job roles
rather than for all occupations. Establishments experiencing retention difficulties were most
likely to report them among Skilled Trades and Elementary occupations (21 per cent and
19 per cent respectively). In contrast, very few establishments reported retention difficulties
to be mainly among Managers (two per cent).
Employers’ perceptions of under-use of skills and qualifications in the workplace
Some employers may experience a skills imbalance where they perceive that staff are
being “under-utilised”, that is, the skills and qualifications that these staff hold are above
those required for their current role. Three in ten employers reported that they had at least
one employee who fits this description within their establishment (30 per cent), with two
million workers reported to be under-utilised in this way.
There are a number of different reasons given by employers for the under-use of skills. A
quarter (26 per cent) of employers that reported under-use of skills said the reason was
staff not being interested in taking on a higher level role; 15 per cent reported that the
working hours suited them better. These would seem to indicate a personal choice being
made by the individual because these job roles better suit their needs and circumstances.
However, other reasons given by employers related to what could be considered to be a
shortfall in the volume of jobs available that would use their skills, i.e. a lack of demand for
their skills in the labour market. For example, 11 per cent of employers reporting under-
utilisation said the reason was a lack of jobs in the desired higher level role and 10 per cent
reported that they were gaining experience for a higher level role.
Under-utilisation represents not only a waste of individuals’ talent but also potentially a
missed opportunity for employers to increase performance and productivity, improve job
satisfaction and employee well-being, and stimulate investment, enterprise and innovation.

15
Training and staff development
There was little change in the headline training measures between 2015 and the 2013
survey.
It remained the case that two-thirds of employers (66 per cent) had funded or arranged
training or development for their staff over the previous 12 months, with around half
providing any off-the-job training (49 per cent) or on-the-job training (53 per cent). The
proportion of staff being trained in 2015 was also in line with 2013 (63 per cent compared
to 62 per cent) as was the average number of days training per trainee over the period (6.8
days, compared to 6.7 days in 2013). Similarly, the proportion of employers that had
provided any training intended to lead to nationally recognised qualifications remained
unchanged at 31 per cent.
There was, however, an increase in the volume of training, measured in terms of the total
number of training days provided in the previous 12 months. This rose to 118m days in
2015, compared to 113m in 2013 and 115m in 2011.
This increase in the volume of training largely reflected a combination of increased levels
of employment and increased recruitment activity.
While the proportion of the workforce receiving training and the average number of training
days they each received remained unchanged between 2013 and 2015, the size of the
workforce increased, meaning that there was a four per cent increase in the number of
employees trained (from 16.8m to 17.4m).
The evidence also suggests that the increase in training days may be related to increased
recruitment activity, and a consequent increase in induction training. The proportion of
training employers that provided any induction training rose considerably (from 58 per cent
of employers that trained in 2013 to 68 per cent in 2015), as did the proportion of training
employers for whom induction or health and safety training accounted for at least half their
training (from 27 per cent to 32 per cent).
Total employer expenditure on training increased by six per cent between 2013 and 2015,
from £43.0bn to £45.4bn, more than reversing the decrease recorded between 2013 and
2011 (when the figure stood at £43.8bn).
While total expenditure on training was greater, investment per person trained and per
employee remained similar in 2015 to 2013 and 2011.

16
Use of online training or e-learning and of other self-learning was common among training
employers (45 per cent and 38 per cent respectively), and generally increasing, particularly
for online training and e-learning (39 per cent of those using this method at all in the last
two years reporting an increase over the last 12 months, compared with 18 per cent using
it less).
Variations in training levels appear to be driven largely by employer size. The survey
showed that the smallest establishments provided twice as many training days per person
trained and spend, on average, three and a half times more per person trained than the
largest establishments. Reflecting these patterns, businesses in Construction and
Agriculture spend more per person trained than sectors dominated by larger
establishments, such as Public Administration and Health and Social Work. This suggests
that smaller businesses are less likely to benefit from economies of scale in the planning
and implementation of training than their larger counterparts. This is particularly true of
small, single site businesses: small establishments that are part of a larger organisation
appear able to draw on the larger organisation for support in training functions.
Close to a half of employers that trained (46 per cent) wanted to provide more training than
they had been able to do, with the main barriers being a lack of time and a lack of funds for
further training. These reasons suggest that for some businesses, there is a ‘ceiling’ to the
value they place on training, beyond which the training does not provide an adequate return
to their investment, or at least is not perceived to.
Given the constraints businesses have faced in recent years, a maintenance of broadly
consistent training levels is positive; but it does also pose a challenge to UK businesses.
Around 90 per cent of the current labour force have the potential to be active in the labour
market a decade from now (UKCES 2014b). Therefore, the economy cannot rely on initial
education alone to ensure people have the continuously changing skills that are needed:
the workplace is a vital location to develop these skills. Given the importance of skilled
people as a global currency, the survey poses questions about whether these levels and
the types of training businesses are investing significant resources in are adequate to
enable the UK economy to take advantage of opportunities, capitalise on innovation and
secure growth in performance and productivity.

17
High performance working practices and product market strategies
Skills is a derived demand. Employers do not simply provide training or seek to recruit
skilled people as an end in itself, the level and nature of the skills they require is derived
from the business strategy they pursue and from the way they organise their work. As these
strategies drive employers’ demand for skills, it is likely that they will impact on employers’
experiences of skill challenges and the practices they implement to address those
challenges.
Businesses that adopt high performance working practices (HPW) and those that pursue
“very high product market strategies” (PMS, i.e. those who lead the way within their
industry, offer premium products and services with a high degree of customisation and
whose competitive success is not at all price dependent) tend to be more active in the
recruitment market and consequently to have a more frequent experience of skill
shortages: however, they also find it easier to fill their vacancies in the sense that a smaller
proportion of their vacancies are hard-to-fill.
There was a clear relationship between an establishment’s working practices and product
market strategies and their provision of training. HPW employers and those that pursue
higher product market strategies were more likely to have trained their staff and to have
trained a higher proportion of their staff. These employers were also more likely to have
provided training that led to nationally recognised qualifications and to qualifications that
are of a higher level.
Conclusions
The Employer Skills Survey is a vital source of data on skills and the labour market. It offers
a unique insight into the micro decisions that employers make about factors such as
recruitment, training investment and use of skills in the workplace, which underpin the
macro-level trends that drive UK economic growth and productivity levels.
ESS 2015 highlights how changes in the economy are impacting on firms differently.
Overall, vacancies and skill-shortage vacancies have increased significantly over the last
two years, with some sectors in particular facing heightened difficulties in recruiting staff,
such as in Construction and Finance. However, in many cases there has been persistence
over successive waves of the survey in the areas in which difficulties are most commonly
reported. For example, Manufacturing remains one of the sectors most likely to report that
their vacancies are hard to fill for skill related reasons, despite declining employment levels
and this has been persistent over the Employer Skills Survey series throughout the 21st
century; Skilled Trades is the occupation in which employers are most likely to report skill-
shortage vacancies.

18
These variations, in addition to geographical variation, raise questions about how local and
national governments ensure the maximum value of any policy response, which needs to
be mindful of the variations in experiences reported here and the contextual factors which
shape these experiences.
But there are questions for businesses too as the survey raises questions about the levels
of demand for, and use of, skills by employers and whether these are at the right levels for
the business. For example, the survey shows us that a minority of businesses operate high
performance working practices but those that do have a higher demand for skills; that
Managers are the occupational group least likely to receive training, but will be instrumental
in decisions about business and people strategies; that 2 million staff have skills not
currently being used in the workplace and that the impacts of skill shortages reported by
employers have the potential to be very damaging to business, yet the persistence of many
skill deficiencies suggests that training decisions, in some businesses at least, may be sub-
optimal. At a micro-level, these factors may be damaging for the business; at a macro-
level, they could be damaging for the UK economy and hamper the sustainability of UK
economic growth.

19
1 Introduction
1.1 The UK-wide employer skills survey
The UK Commission’s Employer Skills Survey is a biennial study that forms the
cornerstone of its labour market intelligence. It contributes to, and influences, policy and
practice in addressing the skills challenge and prompting growth through people.
This report presents the headline findings from the 2015 survey. It is the third time the study
has been undertaken on a UK-wide basis, having previously been conducted in 2011 and
20131.
This timeframe coincides with the UK economy leaving recession and experiencing a
sustained period of moderate economic growth. While employment levels have increased
over this time, there is mounting evidence of stalling productivity growth (ONS, 2014) that
could hinder the current economic recovery as employers are unable to optimise their
performance. Analysis conducted by the UK Commission has also highlighted the need to
address deep-rooted structural skills and employment challenges – particularly in respect
of youth employment - in order to ensure that conditions are created for a prolonged,
balanced structural recovery. In common with the broader devolution agenda in the UK
there has been an increased focus on driving the skills agenda at a local level, with an
emphasis on encouraging employers, education providers and local government to
address skill shortages that are holding back employment opportunities and business
growth.
Based on over 91,000 interviews with establishments, ESS 2015 enables assessment of
how skills deficiencies are impacting business and organisational performance at both UK-
wide and a more local level. It measures the prevalence, character and impact of skills
challenges, and details the nature and extent of employer investment in skills and training.
It therefore provides a substantial body of evidence that can be used by a wide range of
organisations and audiences.
The Employer Skills Survey is designed to complement and supplement the UK
Commission’s Employer Perspectives Survey series (EPS) which explores the attitudes
and behaviour of employers across the UK as they make decisions about how to engage
with training providers, schools, colleges and individuals in the wider skills system, to obtain
the skills they need.
1 Prior to this the four nations had each run their own skills surveys; each were similar in style but varied in the employer population they covered and the timescales in which they were conducted preventing comparisons across nations. That said, as the population covered by the UK-wide surveys matches that used in England previously it is possible to trace valid time series data for employers in England going back to 1999.

20
This evidence report represents an initial overview of the survey’s findings, in which we:
• Present findings across the UK, including time series analysis comparing the results
to those seen in 2011 and 2013;
• Compare experiences and behaviours between employers across the countries of
the UK;
• Analyse differences in the overall picture by such variables as workplace size and
sector, and where feasible by occupation;
• Examine the interrelationship between the key ESS measures - skills gaps, skill
shortages and workforce development activity.
As well as written commentary, the appendices to this report include abridged data
tabulations detailing key survey measures.
Full UK data tabulations have also been published alongside this report and are available
here: https://www.gov.uk/government/publications/ukces-employer-skills-survey-2015-
supplementary-documents.
1.2 Methodological overview
Like its predecessors, ESS 2015 was carried out in two parts: a core survey of UK
establishments and a follow-up survey looking at the investment employers had made in
providing training to employees in the 12 months previous (the “Investment in Training
Survey”). Both surveys were conducted by telephone.
This section briefly summarises the key features of the methodology adopted across both
surveys. Further detail can be found in the separate Technical Report which accompanies
this report: https://www.gov.uk/government/publications/ukces-employer-skills-survey-
2015-uk-results.
1.2.1 Survey sampling
The population covered by the survey comprised business establishments (as opposed to
enterprises) in the UK with at least two staff (including both employees and working
proprietors). Sole traders and establishments with just one employee (and no working
proprietors) were excluded.
The survey encompasses establishments across the whole of the UK, in all sectors of the
economy (across the commercial, public and charitable spheres). The profile of this
population was established through the Office for National Statistics (ONS) based on data
from the Inter-Departmental Business Register (IDBR) March 2014 statistics (the most up
to date figures available at the time of the survey).
https://www.gov.uk/government/publications/ukces-employer-skills-survey-2015-supplementary-documents

21
The sample of establishments was primarily sourced from Experian’s National Business
Database, supplemented by records supplied directly through the IDBR in order to improve
coverage of establishments in specific sectors and parts of sectors that are
underrepresented in Experian’s database.
Quotas for the main survey were set by size within sector for Scotland, Wales, Northern
Ireland and nine English regions. In addition to geography, sector and size of
establishments, the Investment in Training follow-up survey also ensured robust coverage
by the nature of the training provided (whether establishments provide on-the-job training
only, off-the-job training only, or both). All of the establishments interviewed for the
Investment in Training Survey had been interviewed as part of the core survey and had
given their permission to be contacted for this follow-up research.
1.2.2 Survey questionnaire
The core survey questionnaire was based largely on that used in the 2013 survey.
However, additional areas were added examining how effectively skills and qualifications
are used in the workforce and the provision of online training and self-learning. Questions
relating to the recruitment of education leavers were removed in 2015. These questions
have become part of the suite of questions posed in the UK Commission’s Employer
Perspectives Survey, the most recent findings of which were published in November 2014.
One key change for the 2015 questionnaire related to the methods used to capture the
skills that are lacking in applicants and the skills lacking among internal staff with skills
gaps. A revised framework was adopted for establishing what skills employers find lacking
in the external labour market and within their existing workforce. This nuanced framework
captures a more comprehensive set of skills that allows for the formulation of more specific,
actionable responses to address the skill issues identified. Around half of establishments
were assigned the new skills framework, with the other half assigned the “old” framework.
This report presents data against the new skills framework in the main body: the time series
analysis based on the “old” framework is presented in Tables A.2.12 and A.3.8 in Annex A
for reference.
A further development included the introduction of online prompt cards to assist employers
through the section of the questionnaire that focussed on categorising their employees into
nine different occupational classifications. This was made available to all establishments
with 10 or more employees in a bid to reduce the burden on respondents and improve the
accuracy of categorisation.

22
As in 2013, a modularised questionnaire design was developed where certain sections
(such as questions pertaining to retention difficulties, and those capturing high performance
working practices) were only asked of half of the respondents. The report makes clear
where questions were split in this way; further details are provided in the Technical Report.
The average length of interview for the main survey was 23 minutes.
The questionnaire administered for the previous UK Investment in Training Survey in 2013
was used again in 2015, with an additional question on the amount spent on online training
courses.
Copies of the questionnaires used for both surveys can be found in the Technical Report.
This also provides details of the cognitive testing and piloting undertaken to test the
questionnaires, as well as copies of the online prompt card.
1.2.3 Survey fieldwork
Fieldwork for the core survey was undertaken between March and July 2015, and involved
91,210 interviews.
Fieldwork for the follow-up Investment in Training Survey was undertaken between May
and August 2015, and involved more than 13,000 interviews with establishments that had
taken part in the first survey.
An overall response rate of 42 per cent was achieved for the core survey; this compares
with 44 per cent in 2013 and 39 per cent in 2011.
For the Investment in Training follow-up, respondents were already engaged with the
survey so predictably a much higher response rate was achieved compared to the main
survey: 66 per cent.

23
Table 1.1 Survey response rates
UK England Northern Ireland Scotland Wales
Core survey
Interviews 91,210 75,129 4,019 6,035 6,027
Response rate 42% 42% 50% 42% 44%
Investment in Training follow up
Interviews 13,197 10,056 740 1,111 1,290
Response rate 66% 66% 71% 65% 66%
1.2.4 Data weighting
Findings from the core survey have been weighted and grossed up to accurately represent
the total population of UK establishments in which at least two people work. This has been
done on a size, sector and geographic basis. Separate weights have been generated which
allow findings to be presented (a) based on the number of workplaces reporting a particular
experience, and (b) based on the number of employees and/or job roles affected by
different challenges. The weighting approach has retained consistency with previous
iterations and therefore allows for comparability with 2013 figures. A new weighting
mechanism was also created for reporting the new skills framework, as described in 1.2.2.
Findings from the Investment in Training survey have been weighted and grossed up to
reflect the population of training establishments. These population figures were generated
from the weighted findings of the core survey. A new weighting strategy was implemented
in 2015 solely for the Investment in Training data to further increase the accuracy of the
training spend estimates. This new weighting strategy has also been retrospectively
applied to both the 2011 and 2013 data files meaning some of the figures reported in
Section 5.9 for 2011 and 2013 may differ slightly from the previous reports.
Further detail on data weighting can be found in the separate Technical Report.
1.3 The nature of UK establishments: describing the survey population
In order to give some context to the findings that are presented throughout this report, and
to facilitate understanding of the differences in employers’ experiences and practices, this
section describes some of the key characteristics of the UK establishment population.

24
It is important to note that the statistics presented in this section of the report are variously
based on official counts of establishments provided by the Office of National Statistics
(ONS) and on weighted survey findings; the footnotes on each table or chart detail the
source.
ONS figures show there were around 1.8 million “in-scope” establishments in the UK in
March 2014, with around 28 million people working in them2.
1.3.1 Profile of UK business population
Figure 1.1 summarises key information on the profile of establishments and employment
across the UK, based on ONS data. This reveals that while half of establishments (51 per
cent) are small and employ fewer than five staff, these very small employers account for
just nine per cent of all employment. In contrast, sites with 100 or more staff make up just
two per cent of the employer population, but account for two-fifths (42 per cent) of total
employment. Public sector establishments are much larger than average: they account for
five per cent of all establishments but 18 per cent of all employment (see Table A.1.2 in
Annex A).
2 All establishments with two or more people working at them were in-scope for the survey. See Appendix I for further details.

25
Figure 1.1 Headline information on the profile of UK establishments and employment
42%
25%
24%
9%
2%
9%
38%
51%2-4
5-24
25-99
100+
ESTABLISHMENTS VS EMPLOYMENTEmployer Profile
MULTISITE
SINGLE SITE
33%
67%
RETAIL AND WHOLESALE BUSINESS SERVICES21% 16% 21% 17%
GREATEST PROPORTION OF ESTABLISHMENTS IN…
PRIVATE SECTOR
3RDSECTOR
PUBLICSECTOR
ENGLAND
73%86%
10%9%
17%4%
SCOTLANDPRIVATE SECTOR
3RDSECTOR
PUBLICSECTOR
67%83%
11%10%
21%7%
N. IRELANDPRIVATE SECTOR
3RDSECTOR
PUBLICSECTOR
68%78%
11%14%
20%7%
WALESPRIVATE SECTOR
3RDSECTOR
PUBLICSECTOR
67%85%
8%8%
25%7%
PRIVATE SECTOR
3RDSECTOR
PUBLICSECTOR
UK
72%86%
10%9%
18%5%
Source: ONS Inter-Departmental Business Register (IDBR)
Source: UKCESS 2015
Source: UKCESS 2015
Source: UKCESS 2015
Source: UKCESS 2015
Source: UKCESS 2015
Source: UKCESS 2015
Source: ONS Inter-Departmental Business Register (IDBR)
% = proportion of UK population

26
1.3.2 Distribution of employers and employment over time
The UK business population at the time of the survey consisted of 1.8m establishments;
this represented an increase of 1.3 per cent from the previous survey in 2013. There was
a larger increase in the employment population, from 27.0m in employment in 2013 to
27.8m in 2015 (an increase of 3.0 per cent).
By country, the number of England and Scotland establishments increased by 1.5 and 1.4
per cent respectively from 2013. The picture in Wales was relatively static while the number
of establishments in Northern Ireland had reduced by 2.0 per cent. Employment figures
increased by at least 2.0 per cent across all nations with the exception of Wales, which
decreased by 0.7 per cent.
By size of establishment, the number of businesses sized 10-49 and 100-249 increased by
4.6 and 3.0 per cent respectively from 2013. Changes in other size bands were less
marked.
As in previous years, the Wholesale and Retail and Business Services sectors comprised
the greatest proportion of both establishments and employees. Together they accounted
for over two-fifths of all establishments. Table 1.2 shows the distribution of the business
and employment populations and how these figures changed since 2013. Particularly
noteworthy was the contraction of the Construction, Financial Services and Public
Administration sectors.

27
Table 1.2 UK business and employment population by sector, 2013-2015
Establishment Employment
2013 2015 %
change 2013 2015 % change
UK 1,743,800 1,766,800 1.3 26,959,000 27,755,200 3.0
Agriculture 93,900 97,400 3.7 381,600 402,500 5.5
Manufacturing 102,100 100,300 -1.8 2,364,800 2,371,400 0.3
Electricity, Gas and Water 9,300 10,200 8.7 282,200 294,200 4.3
Construction 162,800 158,800 -2.5 1,251,400 1,192,800 -4.7
Wholesale and Retail 372,400 371,200 -0.3 4,424,000 4,493,600 1.6
Hotels and Restaurants 155,300 159,900 3.0 1,799,600 1,961,400 9.0
Transport and Communications 121,500 128,800 6.0 2,125,800 2,231,000 4.9
Financial Services 40,000 38,300 -4.4 1,033,900 1,005,000 -2.8
Business Services 348,700 363,800 4.3 4,468,100 4,786,300 7.1
Public Administration 21,400 19,800 -7.4 1,432,600 1,356,400 -5.3
Education 57,500 58,100 1.0 2,570,100 2,607,900 1.5
Health and Social Work 130,000 132,500 1.9 3,598,000 3,791,000 5.4
Arts and Other Services 128,700 127,900 -0.7 1,227,100 1,261,800 2.8 Note: Figures are rounded to the nearest 100. They represent population figures as used in the 2013 and 2015 ESS surveys; these were taken from ONS IDBR 2012 and 2014 population figures respectively.

28
1.4 Structure of this report
This report has been structured into five key sections followed by a conclusions chapter.
• Chapter 2: Recruitment and skill-shortage vacancies
This chapter looks at employer recruitment activity, measuring the extent, causes
and impacts of recruitment difficulties, with a particular focus on skill shortages
within the labour market, the nature of these skill shortages and the impact such
labour market failure has on establishments. It then explores the difficulties
employers face in retaining staff, in which occupations these commonly occur, and
the main reasons for their retention difficulties.
• Chapter 3: The internal skills challenge
This chapter explores the extent and nature of skills gaps within the workforce, and
how these affect different occupations, as well as the causes and impact of these
skills deficiencies.
• Chapter 4: Employer perspectives of under-use of skills and qualifications
Chapter 4 covers the under-utilisation of skills where establishments report that
employees have both skills and qualifications beyond those required for their
current job role. It explores the occupations most affected by under-utilisation, and
the reasons for this mismatch between skills and job roles.
• Chapter 5: Employer investment in training and skills
Chapter 5 explores in detail the extent and nature of employer training and
workforce development, including the investment made in training. It examines the
number of staff provided with training over the previous 12 months, the type and
volume of this training, the extent to which employers would have liked to provide
more training and development than they did, and the barriers that prevented
increased training activity.
• Chapter 6: Working practices and product market strategies
Chapter 6 explores the working practices being adopted by employers in regard to
how they manage, develop, engage with and incentivise their staff, and seeks to
assess the prevalence of High Performance Working (HPW) practices.
It also explores the Product Market Strategies (PMS) of employers, and whether
this relates to their skill needs and training practices.
• Chapter 7 Conclusions
The final chapter revisits the key stories emerging from the different strands of the
survey, bringing them together and considering their implications.

29
1.5 Reporting conventions
The survey was carried out at an establishment level. The terms “establishment”,
“employer”, “workplace” and “business unit” are used for this interchangeably throughout
this report to avoid excessive repetition.
Throughout the report unweighted base figures are shown on tables and charts to give an
indication of the statistical reliability of the figures. These figures are always based on the
number of establishments answering a question, as this is the information required to
determine statistical reliability. This means, for example, that where percentages are based
on “all vacancies” (such as the percentage of all vacancies which are hard to fill) the base
figure quoted is the unweighted number of establishments with vacancies.
In a departure from previous surveys, employers in Mining & Quarrying have been
combined with those in Manufacturing for reporting purposes, owing to the relatively low
number of establishments they represent in the UK population. 2011 and 2013 figures for
Manufacturing have thus been adjusted in this report to include Mining & Quarrying to allow
time series comparisons. Appendix C has more information on sector coding.
To aid analysis we have sometimes reported on occupations at a broader classification of
high-skill, middle-skill, service-intensive and labour-intensive roles, as shown in Table 1.3.
Table 1.3 Broad occupational groups
Specific occupation Broad occupational group Managers
High-skill Professionals Associate Professionals Administrative and Clerical
Middle-skill Skilled Trades Caring, Leisure and Other Services
Service-intensive Sales and Customer Service Machine Operatives
Labour-intensive Elementary occupations
In tables, “zero” is denoted as a dash (“-“); and an asterisk is used (“*”) if the figure is larger
than zero but less than 0.5 per cent.
Throughout the report, figures with a base size of fewer than 25 establishments are not
reported (a double asterisk, “**”, is displayed instead), and figures with a base size of 25 to
49 are italicised and should be treated with caution.

30
The scale and scope of data collected by the UK Commission’s Employer Skills Survey
2015 means that it is a valuable research resource supporting detailed and complex
statistical analysis of the inter-relationships between employer characteristics, and their
practices and experiences. The findings presented in this report reflect a descriptive
exploration of the data, however it should be noted that in all cases where differences by
nation, size and sector are commented on they are statistically significant at the 95 per cent
level. Further statistical information can be found in Annex E.
31
2 Recruitment and skill-shortage vacancies
2.1 Chapter Summary
There has been substantial growth in the number of employers active in the recruitment market. Almost one in five employers (19 per cent) had at least one current
vacancy at the time of ESS 2015 fieldwork, an increase of four percentage points compared
to the 2013 survey. Together, employers in 2015 reported in excess of 900,000 vacancies,
an increase of almost 300,000 compared to 2013. This strong growth in recruitment activity
was evident in all the UK countries.
Skill-shortage vacancies present an increasing challenge. These are vacancies that
employers find hard-to-fill due to a lack of skills, qualifications or experience among
applicants. Six per cent of all employers had at least one skill-shortage vacancy at the time
of the survey – a significant increase from the four per cent of employers that reported
having such vacancies in 2013. In volume terms, there were almost 210,000 skill-shortage
vacancies in 2015; a considerable increase from the 150,000 reported in 2013.
The increase in the number of skill-shortage vacancies was proportional to the increase in
vacancies. Therefore, the density of skill-shortage vacancies (i.e. the proportion of
vacancies which employers were struggling to fill because of skill shortages in the available
labour market) was largely unchanged (23 per cent in 2015 compared with 22 per cent in
2013).
By occupation, the highest density of skill-shortage vacancies was recorded in respect of Skilled Trades posts (for which more than two in five vacancies were skill-
shortage vacancies). Employers have faced increased challenges in recruiting sufficiently skilled Machine Operatives. A third of vacancies for Machine Operatives
were hard-to-fill for skills reasons, up from a quarter in 2013.
The skills lacking among applicants spanned both people and personal skills as well as technical and practical related skills. Skills relating to operational aspects of the role,
as well as complex analytical skills, were the main technical and practical skills lacking.
The main people and personal skills lacking commonly related to time management skills,
management and leadership skills, and sales and customer handling skills.
Skill-shortage vacancies continue to have significant impacts for employers.
Reported impacts included those that would have a direct financial impact on the
establishment, such as a loss of business to competitors and increased operating costs.

32
2.2 Introduction
At a macro level, recruitment is an indicator of the health of the labour market and the
economy in general. Indeed, following the recession of the late 2000s, employer skills
surveys generally reported depressed levels of recruitment activity. The previous Employer
Skills Survey in 2013 presented a picture of a UK economy moving towards recovery with
an increase in recruitment activity from 2011.
There can be various reasons for individual employers having vacancies. Depending on
the context, vacancies can be a positive indicator of growth, or present challenges if they
signify a loss of key personnel or high levels of staff turnover.
When employers have vacancies, the labour market is either able to meet employer
requirements (the most common scenario) or it is not. Where employers struggle to fill their
vacancies, this may be due to a lack of skills, qualifications or experience amongst
applicants. Collectively these are known as ‘skill-shortage vacancies’. Vacancies can also
prove ‘hard-to-fill’ for other, non-skills-related reasons. Such reasons principally include a
lack of applicants for the role, issues with applicants’ attitude, personality or motivation, or
specific issues related to the job role (e.g. poor terms and conditions or unsociable hours)
or the recruiting organisation (e.g. remote location or poor transport links).
ESS 2015 provides a detailed understanding of the level and nature of employer demand
for new staff and the ability of the labour market to meet such demand. This sets the context
for then exploring imbalances and mismatches in the labour market that result from a lack
of skills. The key measures used in this chapter are as follows:
Vacancies Hard-to-fill vacancies
Incidence
Density
Skill-shortage vacancies
The proportion of establishments
reporting at least one vacancy
Vacancies as a proportion of all
employment
The proportion of establishments
reporting at least one hard-to-fill
vacancy
Hard-to-fill vacancies as a proportion of all
vacancies
The proportion of establishments
reporting at least one skill-shortage
vacancy
Skill-shortage vacancies as a proportion of all
vacancies
33
Where establishments have skill-shortage vacancies, the survey also provides information
on the skills lacking among applicants. New for ESS 2015 was a revised list of skill
descriptors used to better understand the skills lacking3. Further detail on the changes
made to the skill descriptors is provided in the previous chapter of this report.
Following a brief analysis of vacancies, this chapter focusses on skill-shortage vacancies.
The chapter examines the incidence, volume and profile of skill-shortage vacancies, before
exploring the specific skills that employers found lacking and the impact that skill-shortage
vacancies have had on the establishment. It then closes with a brief discussion of the extent
of wider recruitment challenges that establishments face, including a review of retention
difficulties.
2.3 Vacancies
There was notable growth in the proportion of establishments reporting vacancies between
the 2013 and 2015 studies, pointing to strong labour market activity and positive changes
in the UK economy. Specifically, 19 per cent of all establishments had at least one current
vacancy at the time of ESS 2015 fieldwork. This represents a substantial increase from
2013 when 15 per cent of all establishments had at least one vacancy at the time of
fieldwork.
This increased incidence of recruitment activity was also evident when considering the
proportion of establishments that had successfully recruited at least one new employee
over the 12 months prior to the survey. Just over half (51 per cent) of all establishments
had successfully recruited someone during this period; an increase from the 46 per cent
reported in the 2014 Employer Perspectives Survey (Shury et al., 2014).
In volume terms, there were a total of 927,200 reported vacancies across the UK at the
time of the survey (equivalent to 3.3 per cent of total employment). This represents a
considerable 42 per cent increase compared to the number of vacancies reported in 2013,
which stood at 655,000, equivalent to 2.4 per cent of total employment in 20134.
As shown in Figure 2.1, strong growth in recruitment activity was evident in all the UK
countries and the proportion of employers with at least one current vacancy represented a
return to the broad levels of recruitment activity seen prior to the recession5.
3 Half of employers with skill-shortage vacancies were assigned to the ‘new’ skill descriptors, whereas the other half were assigned to the ‘old’ skill descriptors used in ESS 2011 and 2013 to facilitate comparisons over time. Time series data on the skills lacking among applicants according to the ‘old’ skill descriptors are shown in Tables A.2.12 and A.2.12a in Appendix A. Further information on the changes to the skill descriptors used is provided in the ESS 2015 Technical Report (https://www.gov.uk/government/publications/ukces-employer-skills-survey-2015-uk-results). 4 This large increase in recruitment activity has also been reported by the Office for National Statistics (ONS). The ONS Labour Force Statistics reported that the number of vacancies for May to July 2015 was an increase of 38% from the same period in 2013. 5 In 2003, 2005 and 2007 the proportion of employers in England with at least one vacancy at the time of the respective fieldwork periods was 17 per cent, 17 per cent and 18 per cent respectively (NESS 2003, 2005 and 2007). Due to differences in the populations used (establishments with 1+ employment, rather than the 2+ employment used in the ESS series) and other methodological differences, accurate time-series comparisons are not possible for the other UK nations

34
Figure 2.1 Incidence and density of vacancies overall and by country
The proportion of establishments that reported having at least one vacancy increased with
the size of establishment. Ten per cent of establishments with fewer than five employees
had at least one vacancy, compared with 71 per cent of establishments with 250 or more
employees. Conversely, the density of vacancies (i.e. as a proportion of employment)
decreased with the size of establishment, from 5.8 per cent among those with fewer than
five employees to 2.3 per cent among those with 250 or more employees. The incidence
and density of vacancies has increased across all size bands since 2013.
By sector, the proportion of establishments that reported vacancies ranged from five per
cent in Agriculture to 33 per cent in Education. In density terms, the highest density of
vacancies was recorded in a number of the service-based industries. It was highest in the
Hotels and Restaurants sector (5.3 per cent), Arts, Entertainment, Recreation and Other
Service Activities (5.1 per cent), and Business Services (4.1 per cent). Conversely, the
sector with the lowest density of vacancies was Manufacturing (2.0 per cent), closely
followed by the Electricity, Gas and Water and Education sectors (both 2.1 per cent).
using the nation-specific skills surveys (The Northern Ireland Skills Monitoring Survey [NISMS], The Scottish Employer Skills Survey [SESS] and Future Skills Wales [FSW]).
14%15%
19%
14%15%
20%
10% 10%
13%14%
15%
19%
12%
14%
17%
2.2% 2.4%3.3%
2.2% 2.5%3.4%
2.4% 2.1% 2.7%1.9% 2.4%
3.1%1.9% 2.2%
3.1%
% of establishments with vacancies
Density (vacancies as % of employment)
20132011
UK England N. Ireland Scotland Wales
Base: All establishments (2015: UK: 91,210; England: 75,129; NI: 4,014; Scotland: 6,035; Wales: 6,027)
2015 20132011 2015 20132011 2015 20132011 2015 20132011 2015
Note: see Table A.1.3 in Annex A for 2011 and 2013 base sizes

35
The density of vacancies increased by between a quarter to a half in most sectors between
2013 and 2015. The sector with the biggest increase was Construction where the density
of vacancies increased by 71 per cent (from a vacancy density of 1.8 per cent in 2013 to
3.0 per cent in 20156).
Tables A.2.1 and A.2.2 in Annex A provide a detailed breakdown of recruitment activity by
country, size of establishment and sector.
The survey also identifies the occupational groups where vacancies exist7. The occupation
with the highest density of vacancies was Associate Professionals at 7.9 per cent. This
occupation also had the highest density of vacancies in 2011 and 2013. There was an
increase in vacancy density for all occupation groups between 2013 and 2015 (the sole
exception being Managers which remained unchanged). The increases in vacancy density
were most evident among Skilled Trades and Elementary occupations. The density of
vacancies for Skilled Trades increased from 2.7 per cent in 2013 to 4.5 per cent in 2015
and from 2.1 to 3.5 per cent for Elementary occupations.
Table A.2.3 in Annex A provides a detailed breakdown of recruitment activity by occupation.
6 This increase in vacancy density is most the result of a large increase in the number of vacancies in this sector but also partly due to a decrease in employment in the Construction sector, as detailed earlier in Table 1.2. 7 See Appendix D for the definitions and types of job roles included under the occupational groupings

36
2.4 Skill-shortage vacancies
Where establishments had vacancies, the labour market was largely able to meet the
recruitment needs of employers: only a third of vacancies across the UK were considered
hard-to-fill (33 per cent)8. Where employers had hard-to-fill vacancies, these were mainly
due to a lack of skills, qualifications or experience among applicants (69 per cent of all
vacancies that were hard-to-fill)9. This equates to six per cent of establishments having at
least one skill-shortage vacancy at the time of ESS 2015 fieldwork.
It is important to understand the prevalence and nature of skill-shortage vacancies as an
inability to recruit appropriately skilled labour may act as a brake on business growth and
hinder productivity. The rest of this section explores these skill-shortage vacancies in more
detail.
2.5 The incidence, volume and density of skill-shortage vacancies
The six per cent of establishments with at least one skill-shortage vacancy at the time of
ESS 2015 fieldwork represent a significant increase from the four per cent of
establishments that reported having skill-shortage vacancies in 2013. This indicates that
skill-shortage vacancies present a growing challenge to employers.
Moreover, in volume terms, there was a substantial increase in the number of reported
skill-shortage vacancies compared to 2013: from just under 150,000 to almost 210,000 –
an increase of 43 per cent in the proportion of vacancies that were proving to be hard-to-
fill because applicants lacked the required skills, qualification or experience required for
the role.
This increase in the number of skill-shortage vacancies was broadly in line with the growth
in volume of vacancies (42 per cent) and, thus, the density of skill-shortage vacancies (i.e.
the number of skill-shortage vacancies as a proportion of all vacancies) was largely
unchanged at 23 per cent compared with 22 per cent in 2013.
England, Scotland and Wales each saw the same increase in the proportion of
establishments with skill-shortage vacancies: from four per cent in 2013 to six per cent in
2015. However, the density of skill-shortage vacancies largely remained at a similar level
to 2013 in England and Scotland but increased in Wales (see Table 2.1).
8 Of course very recent vacancies may not be described as hard-to-fill but may become so over time. 9 During the survey, employers were first asked to give their reasons for not being able to fill vacancies spontaneously (i.e. without being presented with a list of possible reasons). Any employers not reporting skills-related issues were then prompted as to whether any of their hard-to-fill vacancies were proving hard-to-fill due to a lack of skills, experience or qualifications among applicants, and these responses combined to give an overall picture of the incidence and volume of skill-shortage vacancies in the market.

37
The picture in Northern Ireland was notably different. Here the proportion of establishments
with skill-shortage vacancies remained at three per cent and the number of skill-shortage
vacancies remained at broadly the same level as in 2013. However, in the context of the
increased number of vacancies, this meant that the density of skill-shortage vacancies
continued to fall (from 18 per cent in 2013 to 14 per cent in 2015; see Table 2.1). This
largely reflects that vacancies in Northern Ireland were ‘easier-to-fill’ compared with
England, Scotland and Wales (the proportion of all vacancies that were hard-to-fill in
Northern Ireland was 21 per cent compared to 33 per cent across the rest of the UK).
Table 2.1 Incidence and density of skill-shortage vacancies (SSVs) by country
% of establishments with an SSV (incidence)
% of vacancies that were SSVs (density)
Unwtd base 2011 2013 2015 2011 2013 2015
2015 % % % % % %
UK 91,210 3 4 6 16 22 23 Country England 75,129 3 4 6 15 22 23 Northern Ireland 4,014 2 3 3 21 18 14 Scotland 6,035 3 4 6 15 25 24 Wales 6,027 3 4 6 18 20 24 Base: Columns 1-3 All establishments (see Table A.1.3 in Annex A for 2011 and 2013 base sizes);
Columns 4-6 All establishments with vacancies
Percentages in Columns 4-6 are shown as a proportion of all vacancies.
The density of skill-shortage vacancies was greater among small establishments than large
establishments. Approaching a third of all vacancies (29 per cent) in establishments with
fewer than five employees were proving hard-to-fill due to difficulties in finding applicants
with appropriate skills, qualifications or experience. This compares with fewer than a fifth
(18 per cent) among establishments with 250 or more employees. The differences between
the smallest and largest establishments were less marked than in ESS 2013 when the
density of skill-shortage vacancies among the smallest establishments was double what it
was among the largest establishments (see Table A.2.5 in Annex A).
The experience of skill-shortage vacancies varied greatly by sector. The density of skill-
shortage vacancies ranged from nine per cent in Public Administration to 35 per cent in
both the Electricity, Gas and Water and Construction sectors (see Figure 2.2).

38
Figure 2.2 Number and density of skill-shortage vacancies (SSVs), by sector
Although there was relatively little change in the density of skill-shortage vacancies across
the UK as whole, the sectoral pattern was considerably different to 2013. The Electricity,
Gas and Water and Construction sectors have the highest densities of skill-shortage
vacancies (both 35 per cent10). This represents a shift from 2013 when skill-shortage
vacancy density was highest in Manufacturing, Business Services and Agriculture.
The number of skill-shortage vacancies in the Construction sector has more than doubled
since 2013: from 5,000 to 12,000. To some extent this reflects the increased recruitment
activity in the sector reported earlier. However, the rate of growth in skill-shortage
vacancies outpaced the growth of vacancies in this sector. This indicates that Construction
employers have faced significant, and increasing, challenges in recruiting sufficiently
skilled labour.
10 Whilst the results for the Electricity, Gas and Water sector are based on a robust number of establishments with vacancies, it should be noted that the number of establishments with skill-shortage vacancies is relatively small (76). When base sizes are relatively small the volumetric (and density) measures are particularly volatile to being influenced by a few establishments with a large number of vacancies/skill-shortage vacancies. Caution should be taken when interpreting these results.
22%
12%
18%
24%
22%
10%
28%
28%
26%
23%
23%
9%
16%
19%
20%
21%
21%
21%
22%
26%
30%
31%
35%
35%
Public Administration
Education
Hotels & Restaurants
Wholesale & Retail
Arts & Other Services
Health & Social Work
Financial Services
Agriculture
Business Services
Manufacturing
Transport & Comms
Construction
Electricity, Gas & Water
2015 SSVdensity
2013 SSVdensity
Base: All establishments with vacancies (see Table A.2.4 in Annex A for base sizes)
Number of SSVs (2015)
2,100
12,000
23,700
14,800
50,600
2,100
6,600
25,600
13,400
26,200
19,400
9,100
3,900

39
In the Financial Services sector the number of skill-shortage vacancies has increased from
2,800 in 2013 to 6,600 in 2015 (the density of skill-shortage vacancies more than doubled
from 10 per cent to 21 per cent11). The Financial Services sector is a substantial contributor
to the UK economy (Tyler, 2015) and so an increased challenge for employers in this sector
to recruit sufficiently skilled labour is of concern. The Financial Services sector has
undergone extensive upheaval following the financial crisis and subsequent recession and
the sector may be seen as less attractive to potential recruits; there are indications that the
proportion of graduates entering this sector has declined gradually since 2006 (HESA,
2015).
Conversely, there was a marked decrease in the density of skill-shortage vacancies in the
Public Administration sector: from 22 per cent in 2013 to nine per cent in 2015.
Tables A.2.4 and A.2.5 in Annex A provide a detailed breakdown of skill-shortage
vacancies by country, size of establishment and sector.
By occupation, it was among Skilled Trades where density of skill-shortage vacancies was
greatest (43 per cent). This occupation has historically had the greatest density of skill-
shortage vacancies, both in ESS 2011 and 2013 but also the legacy surveys conducted in
each of the countries of the UK. The specific job roles that accounted for the largest
proportion of all Skilled Trades skill-shortage vacancies included: Chefs (17 per cent of all
Skilled Trades skill-shortage vacancies), Metal Working Production and Maintenance
Fitters (13 per cent) and Vehicle Technicians, Mechanics and Electricians (13 per cent).
As illustrated in Figure 2.3, the density of skill-shortage vacancies has increased among
Professionals, Skilled Trades, Sales and Customer Service occupations, and Machine
Operatives since 2013.
11 Whilst the results for the Financial Services sector and the Public Administration sector are based on a robust number of establishments with vacancies, it should be noted that the number of establishments with skill-shortage vacancies is relatively small (106 and 44, respectively). When base sizes a relatively small the volumetric (and density) measures are particularly volatile to being influenced by a few establishments with a large number of vacancies/skill-shortage vacancies. Caution should be taken when interpreting these results.

40
Figure 2.3 Density and number of skill-shortage vacancies (SSVs), by occupation
The increase in skill-shortage vacancy density among Machine Operatives was especially
marked. In 2015 there were 60,700 vacancies for Machine Operatives, of which 19,600
were skill-shortage vacancies (a density of 32 per cent), whereas in 2013 there were
30,100 vacancies for Machine Operatives, of which 7,400 were skill-shortage vacancies (a
density of 25 per cent). Overall, this heightened challenge in recruiting Machine Operatives
was a continuation of the trend observed between 2011 and 2013 when the density of skill-
shortage vacancies in this occupation doubled. Employers in each of the UK countries were
experiencing increased difficulties in recruiting sufficiently skilled Machine Operatives but
this was particularly the case in Wales.
Within the broad Machine Operatives grouping, there was a notable increase in the number
of skill-shortage vacancies for the role of Road Transport Drivers (these accounted for 59
per cent of all Machine Operatives skill-shortage vacancies compared with 42 per cent in
2013). More specifically within this Road Transport Drivers grouping, there was a notable
increase in the number of skill-shortage vacancies for Large Goods Vehicle (LGV) drivers
(these accounted for 18 per cent of all skill-shortage vacancies among Machine Operatives
compared with 10 per cent in 2013) 12.
12 This increasing shortage of LGV drivers has been documented elsewhere and has been reported to be exacerbated by the requirements of the Driver Certificate of Professional Competence (Driver CPC) legislation which meant that all professional LGV drivers were required to hold a Driver Qualification Card (DQC) by September 2014 (Winters, 2013).
19% 18%
10%
33%
15%
9%
14%
10%
20%
30%
26%
13%
39%
27%
13%
25%
17%
32%
22%
11%
43%
20%16%
32%
14%
2011 SSV density 2013 SSV density 2015 SSV density
Number of SSVs(2015)
Base for boxes: All establishments (91,210)Base for bars: All establishments with vacancies in each occupation (as shown)
Note: see Table A.2.2 in Annex A for 2011 and 2013 base sizes
4,300 41,500 29,300 9,800 37,800 26,800 15,800 19,600 18,100
(1,335) (4,047) (4,010) (3,231) (3,814) (4,309) (2,971) (1,780) (4,491)2015 base:

41
Occupations that saw a decrease in skill-shortage vacancy density since 2013 included:
Managers, Associate Professionals, Administrative and Clerical staff and, in particular,
Caring, Leisure and Other Services staff (see Figure 2.3). With the exception of Managers,
skill-shortage vacancy density for these occupations was still higher than in 2011.
Although care should be taken to not over-extrapolate because of the small base sizes in
places, exploring occupations within specific sectors where the density of skill-shortage
vacancies was high (30 per cent or more) provides a more detailed and nuanced picture of
employers’ demand for skills and the ability of the labour market to meet these needs.
Figure 2.4 shows the pattern of skill-shortage vacancy density by occupation and
occupation within sector.
A number of these pockets of skill shortages have proved to be persistent over time. The
much higher than average density of skill-shortage vacancies for Skilled Trades has been
evident across a number of sectors for a number of years. Skill-shortage vacancies have
persistently hampered recruitment to Machine Operative roles in Construction and
Professional roles in the Manufacturing, Business Services, Transport and
Communications, and Health and Social Work sectors.
There were also a number of emerging pockets of skill-shortage vacancies, including:
• Associate Professionals in Construction (such as Product, Clothing and Related
Designers and Estimators, Valuers and Assessors) and Financial Services (such
as Insurance Underwriters and Business Sales Executives).
• Skilled Trades in Construction (such as Carpenters and Joiners, Plumbers and
Heating and Ventilating Engineers) and Arts, Entertainment, Recreation and Other
Service activities (such as Gardeners and Landscape Gardeners and Chefs).
• Sales and Customer Service occupations in Transport and Communications (such
as Telephonists and Telephone Salespersons).
• Elementary staff in Construction (such as Foremen and Labourers, Cleaners and
Domestics, and Elementary Storage Occupations).
Conversely, there were some specific occupations within sectors where skill-shortage
vacancy density has fallen. These include:
• Managers in Construction (a decrease in skill-shortage vacancy density from 31 per
cent in 2013 to 23 per cent in 2015).
• Professionals in Public Administration (30 per cent to 10 per cent).
• Associate Professionals in Business Services (34 per cent to 23 per cent).

42
• Caring, Leisure and Other Services in Public Administration (34 per cent to 14 per
cent) and in Arts, Entertainment, Recreation and Other Service activities (31 per
cent to 24 per cent).
• Machine Operatives in Business Services (46 per cent to 26 per cent).
Tables A.2.6 and A.2.6a in Annex A provide a full and detailed breakdown of skill-shortage
vacancy density by occupation within sector.

43
Figure 2.4 Density of skill-shortage vacancies (SSVs) by sector and occupation within sector
= SSV density 30% or above= SSV density between 15% and 29%
= SSV density between 1% and 14%
Figures only shown where base size is greater than 50.See Table A.2.6a in Annex A for base sizes.
37%Hotels & RestaurantsSkilled Trades occupations
9%
16%
19%
20%
21%
21%
21%
22%
26%
30%
31%
35%
35%
Public Admin
Education
Hotels & Restaurants
Wholesale & Retail
Financial Services
Arts & Other Services
Health & Social Work
Agriculture
Business Services
Manufacturing
Transport, Storage & Comms
Construction
Electricity, Gas & Water

44
2.6 Skills lacking in the available labour market
Where establishments struggle to find the skilled recruits that they need from the available
labour supply, there is a clear imperative to understand which skills in particular are in poor
supply.
The skills perceived to be lacking in the labour market can be broadly categorised into two
categories: people and personal skills, and technical and practical skills13.
As illustrated in Figure 2.5, the stand out skill shortage was a lack of specialist skills or
knowledge needed to perform the job role. This was mentioned as being, at least in part,
the cause of almost two-thirds of skill-shortage vacancies (64 per cent).
Among the other technical and practical skills lacking, skills that can be categorised as
‘complex analytical skills’ accounted for a significant proportion of skill-shortage vacancies.
A lack of skills for solving complex problems accounted for 39 per cent of all skill-shortage
vacancies and 29 per cent of all skill-shortage vacancies were attributed to a lack of
complex numerical/statistical skills. These skills are of particular interest given that they are
examples of ‘higher level’ skills that tend to underpin an ability to innovate and adapt.
A considerable proportion of skill-shortage vacancies were attributed to skills related to
operational aspects of the role, namely: knowledge of the products and services offered
(37 per cent) and knowledge of how the organisation works (31 per cent).
People and personal skills can often be less tangible than technical and practical skills, but
they can nevertheless have a big impact on the ability of a potential employee to adapt to
the workplace and be an effective member of staff. The most common people and personal
skill cited as lacking in the labour market was time management skills. This skill was lacking
in almost half of all skill-shortage vacancies (47 per cent).
Among the other people and personal skills lacking, skills related to ‘management and
leadership’ were commonly reported to be lacking, including: persuading and influencing
others (31 per cent), managing or motivating other staff (30 per cent) and setting objectives
and/or planning resources (21 per cent).
Another grouping of skills that were commonly lacking were ‘sales and customer skills’,
including: customer handling skills (39 per cent) and sales skills (25 per cent).
13 As noted in the introduction to this chapter, a new list of skill descriptors was developed for ESS 2015. Half of employers with skill-shortage vacancies were assigned to the ‘new’ skill descriptors, whereas the other half were assigned to the ‘old’ skill descriptors used in ESS 2011 and ESS 2013 to facilitate comparisons over time. Time series data on the skills lacking among applicants according to the ‘old’ skill descriptors are shown in Tables A.2.12 and A.2.12a in Appendix A. Further information on the changes to the skill descriptors used is provided in the ESS 2015 Technical Report (https://www.gov.uk/government/publications/ukces-employer-skills-survey-2015-uk-results).

45
Figure 2.5 Skills lacking among applicants to establishments with at least one skill-shortage vacancy (prompted)14
As discussed earlier in this chapter, there were particular occupations in which there was
a notable challenge for employers to recruit sufficiently skilled labour (Skilled Trades,
Machine Operatives and Professionals). The skills characteristics lacking among
applicants for these occupations and sectors are detailed below.
14 Figure 2.5 illustrates the skills lacking among applicants based on the total number of skill-shortage vacancies (as opposed to establishments with skill-shortage vacancies). It should be noted that employers could cite more than one skill lacking among applicants for each of their skill-shortage vacancies, thus the percentages displayed sum to greater than 100 per cent.
7%
15%
15%
20%
22%
22%
24%
25%
26%
29%
31%
37%
39%
64%
25%
16%
21%
22%
25%
30%
31%
32%
33%
39%
47%
None of the above
Communicating in a foreign language
Manual dexterity
Adapting to new equipment or materials
Advanced or specialist IT skills
Computer literacy / basic IT skills
Basic numerical skills
Writing instructions, reports etc.
Reading/understanding instructions, reports etc.
Complex numerical/statistical skills
Knowledge of how the organisation works
Knowledge of products and services offered
Solving complex problems
Specialist skills or knowledge
None of the above
Making speeches or presentations
Setting objectives for others / planning resources
Instructing, teaching or training people
Sales skills
Managing or motivating other staff
Persuading or influencing others
Managing own feelings / handling those of others
Team working
Customer handling skills
Ability to manage own time and prioritise tasks
People and personal skills lacking among applicants:
Technical and practical skills lacking among applicants:
Base: All establishments with skill-shortage vacancies – up to 2 occupations followed up with the new lists of skill descriptors (3,244)
45% Sales and customer skills
44% Complex analytical
49% Operational
46% Management and leadership

46
The occupation with the highest skill-shortage vacancy density was Skilled Trades. In line
with the general trend, the main skills that candidates for Skilled Trades roles were lacking
were:
• Specialist skills or knowledge needed to perform the role (66 per cent).
• Time management skills (48 per cent).
• Solving complex problems (43 per cent).
• Knowledge of products and services (36 per cent).
In comparison to other occupations there was particular difficulty in finding applicants for
Skilled Trades roles with the appropriate levels of manual dexterity (33 per cent compared
with 15 per cent overall), as well as the ability to adapt to new equipment or materials
(29 per cent compared with 20 per cent overall), and the skills for reading and
understanding instructions, guidelines, manuals or reports (32 per cent compared with
26 per cent overall).
There has been a marked increase in the number and density of skill-shortage vacancies
for Machine Operative roles. The main skills found lacking in the labour market for these
roles included:
• Specialist skills or knowledge to perform the role (57 per cent).
• Time management skills (40 per cent).
• Solving complex problems (35 per cent).
Skill-shortage vacancies accounted for just under a third of all vacancies among
Professional occupations. The skills lacking among applicants for Professional roles
tended to be more focussed on technical and practical skills (34 per cent of all skill-shortage
vacancies for Professional occupations were not ascribed to any of the people or personal
skills, compared with 25 per cent on average across all occupations). Establishments with
skill-shortage vacancies for Professional occupations were more likely to report a shortage
of advanced or specialist IT skills than for other occupations (34 per cent compared with
22 per cent overall).
Table 2.2 shows the three most common skills lacking from applicants by occupation, as
well as the skill areas particularly likely to be in short supply among applicants when
compared to the overall average.

47
Table 2.2 Most common skills lacking among applicants, by occupation
Occupation SSV Density
Skills most commonly lacking
Three skills in short supply compared with average
Managers 17%
Specialist skills or knowledge Knowledge of products and services Knowledge of how the organisation works
Setting objectives / planning resources Managing or motivating other staff Knowledge of how the organisation works
Professionals 32% Specialist skills or knowledge Advanced or specialist IT skills Solving complex problems
Advanced or specialist IT skills Specialist skills or knowledge
Associate Professionals 22%
Specialist skills or knowledge Solving complex problems Persuading or influencing others
Advanced or specialist IT skills Persuading or influencing others Making speeches or presentations
Administrative / Clerical staff 11%
Specialist skills or knowledge Time management and task prioritisation Knowledge of products and services
Reading and understanding instructions, reports etc. Advanced or specialist IT skills Knowledge of products and services
Skilled Trades occupations 43%
Specialist skills or knowledge Time management and task prioritisation Solving complex problems
Manual dexterity Adapting to new equipment or materials Reading/understanding instructions, reports etc.
Caring, Leisure and Other Services
20%
Specialist skills or knowledge Time management and task prioritisation Team working
Team working Managing own or others’ feelings Writing instructions, guidelines, reports etc.
Sales and Customer Services
16%
Customer handling skills Sales skills Time management and task prioritisation
Sales skills Customer handling skills Persuading or influencing others
Machine Operatives 32%
Specialist skills or knowledge Time management and task prioritisation Solving complex problems
Managing own or others’ feelings Sales skills
Elementary staff 14%
Time management and task prioritisation Specialist skills or knowledge Team working
Team working Managing own or others’ feelings Time management and task prioritisation
Base: All establishments with skill-shortage vacancies in each occupation – up to two occupations followed up (3,244).
Tables A.2.7 to A.2.11 in Annex A provide a full breakdown of the skills lacking in the
available labour market in each of the UK nations and by occupation and sector.

48
2.7 The impact of skill-shortage vacancies on employers
Although only a small minority of all employers had at least one skill-shortage vacancy at
the time of ESS 2015 fieldwork (six per cent), for establishments that had them, the impact
could be significant. In total, 94 per cent of establishments that had hard-to-fill vacancies
solely as a result of skill shortages reported that these were having an impact on the
establishment15.
The vast majority of employers that had skill-shortage vacancies (84 per cent) reported that
these led to an increased workload for other staff but only a minority (10 per cent) cited this
as the only impact of skill-shortage vacancies. More commonly, an increased workload for
other staff was paired with other impacts.
Other impacts of skill-shortage vacancies are shown in Figure 2.6. These included impacts
relating to a direct financial impact on the establishment, such as a loss of business or
orders to competitors and increased operating costs (42 per cent each). Impacts that would
likely affect an establishment’s ability to innovate were also reported by employers,
including: delays to developing new products or services (40 per cent), difficulties
introducing new working practices (35 per cent) and difficulties introducing technological
change (23 per cent).
There were notable differences in the impacts experienced depending on the size of
establishment. A greater proportion of small establishments with fewer than five employees
reported that skill-shortage vacancies have impacted them financially by causing a loss of
business or orders to competitors compared with large establishments with 100 or more
employees (54 per cent and 22 per cent, respectively). Conversely, large establishments
with 100+ employees were more likely than small establishments with fewer than five
employees to have experienced increased operating costs (58 per cent and 38 per cent,
respectively). In relation to impacts on the ability to innovate, small establishments with
fewer than five employees were more likely than large establishments with 100+
employees to have delayed the development of new products or services as a result of
skill-shortage vacancies (46 per cent and 31 per cent, respectively).
15 The survey did not measure the impact of skill-shortage vacancies on employers specifically (i.e. it did not ask employers with skill-shortage vacancies what the impacts of these were on the establishment, only the impact of hard-to-fill vacancies as a whole). However, it was possible to isolate the effect of skill deficiencies by exploring the impact of hard-to-fill vacancies in establishments where all the hard-to-fill vacancies were caused by skills-related issues. Given the majority of establishments with hard-to-fill vacancies fell into this group (71 per cent) – in part reflecting that the majority had just a single vacancy that was proving hard-to-fill ‒ this was a suitable sample from which it was possible to gain a robust measurement.

49
Figure 2.6 Impact of skill-shortage vacancies (prompted)
Impacts also varied by sector. Construction employers were more likely to have
experienced financial impacts through losing business or orders to competitors (56 per cent
compared with the overall average of 43 per cent). Whilst base sizes are small, when
looking by size band within Construction, this impact tended to be more keenly felt by
smaller Construction employers with fewer than five employees (see Table A.2.13 in Annex
A).
Table A.2.14 in Annex A provides a breakdown of the impacts by nation, size of
establishment and sector. The impacts of skill-shortage vacancies and the relative
prevalence of each of the impacts has changed very little since 2013 (and 2011).
2.8 Wider recruitment challenges
As discussed earlier, the majority of hard-to-fill vacancies experienced by establishments
were caused, at least in part, by a shortage of skills among applicants. However,
establishments may also face other recruitment challenges and have hard-to-fill vacancies
for non-skills-related reasons (see Figure 2.7 for a list of these ‘other’ reasons).
5%
23%
24%
30%
35%
35%
40%
42%
43%
49%
84%
None
Difficulties introducing technological change
Withdraw from offering certain products / services
Outsource work
Have difficulties meeting quality standards
Have difficulties introducing new working practices
Delay developing new products or services
Experience increased operating costs
Lose business or orders to competitors
Difficulties meeting customer services objectives
Increased workload for other staff
Base: All establishments where all hard-to-fill vacancies are caused by skills related issues (6,469)

50
Overall, 10 per cent of all vacancies ‒ 93,800 vacancies in total ‒ were reported to be hard-
to-fill exclusively for reasons not related to skills. This represents a significant increase from
2013 when seven per cent of all vacancies (43,100 vacancies in total) were reported to be
hard-to-fill for non-skills-related reasons; an increase of 118 per cent in the number of
vacancies.
The increase in these types of hard-to-fill vacancies was most notable among employers
in England (an increase of 134 per cent compared to 2013), whereas the increases in the
other UK countries ranged from 31 per cent in Northern Ireland to 58 per cent in Wales (the
increase in Scotland was 43 per cent).
Figure 2.7 Main non-skills-related causes of having hard-to-fill vacancies (unprompted)
The density of vacancies that were hard-to-fill for non-skills-related reasons was greater
among small establishments than larger establishments. Specifically, 15 per cent of all
vacancies in establishments with fewer than five employees were proving hard-to-fill for
non-skills-related reasons, compared with only five per cent among establishments with
250 or more employees.
Table A.2.17 in Annex A details the density of vacancies that were hard-to-fill for non-skills-
related reasons by country, size of establishment and sector.
9%
10%
11%
13%
13%
18%
20%
Job entails shift work/unsociable hours
Too much competition from other employers
Remote location/poor transport links
Low number of applicants with the requiredattitude, motivation or personality
Poor terms and conditions offered
Low number of applicants generally
Not enough people interested in the type of job
Base: All establishments with hard-to-fill vacancies (23,359)
Note: Other reasons cited by ≤2% of employers with hard-to-fill vacancies are not shown.

51
The density of non-skills-related hard-to-fill vacancies increased across all occupations
compared with 2013, with the exception of Machine Operatives where it remained constant.
The density was greatest among Caring, Leisure and Other Services occupations (where
it doubled from nine per cent in 2013 to 19 per cent in 2015). Table A.2.18 in Annex A
details the density of vacancies that were hard-to-fill for non-skills-related reasons by
occupation.
2.9 Retention difficulties
The issue of retaining existing staff is closely linked to employers’ experiences in the
recruitment market. The impact of hard-to-fill vacancies will be exacerbated if there are
then difficulties holding on to the staff that have been recruited. Similarly, if an employer
has difficulty in retaining staff, this may cause persistent staff shortages if the employer
also has difficulty filling their vacancies. This next section looks at the characteristics of
employers that experienced retention difficulties, the occupations which are most affected,
and the factors underlying retention difficulties. It also explores the extent to which
recruitment difficulties interlink with retention difficulties.
2.9.1 Incidence of retention difficulties
Eight per cent of establishments reported that there were specific jobs in which they had
difficulties retaining staff16.
Proportions differed slightly by country, with establishments in Northern Ireland least likely
to have reported retention difficulties (seven per cent) and establishments in Scotland most
likely to have reported them (10 per cent). In England and Wales the proportion of
establishments with retention difficulties was eight and nine per cent respectively.
Collectively across England, Northern Ireland and Wales the proportion of establishments
with retention difficulties has risen from five per cent in 2011 to eight per cent in 2015. It
should be noted that retention difficulties were last covered by the Employer Skills Survey
in 2011. For that survey, due to differing policy priorities and constraints on the length of
the questionnaire, employers in Scotland were not asked to describe their experience of
retention difficulties. As such, no Scottish or UK-wide data is available for time series
comparisons.
Employers’ experience of retention difficulties rose by size of employer, from five per cent
among establishments with fewer than five employees, to almost three in ten (30 per cent)
among those with 250+ employees.
16 Employers were asked: Are there any particular jobs in which you have difficulties retaining staff? (Add if necessary: retention difficulties are when a high number of staff leave, but not as a result of downsizing or redundancy).

52
By sector, employers within the Hotels and Restaurants sector were most likely to
experience retention difficulties (14 per cent), followed closely by those in Public
Administration (13 per cent), Education and Health and Social Work (both 11 per cent).
Employers in the Financial Services, Wholesale and Retail and Construction sectors were
least likely (each six per cent).
Table A.2.19 in Annex A provides detailed figures of the incidence of establishments with
retention difficulties by size and sector.
Establishments with current vacancies were far more likely to have retention difficulties (25
per cent, compared to four per cent of those without vacancies). This reflects the inter-
relationship between retention difficulties and labour market activity. Establishments that
were struggling to fill their vacancies were particularly likely to experience retention
difficulties (43 per cent of those with hard-to-fill vacancies).
2.9.2 Occupational pattern of retention difficulties
When establishments experience retention difficulties, these tend to be for specific job roles
rather than for all occupations. Establishments experiencing retention difficulties were most
likely to report them among Skilled Trades and Elementary occupations (21 and 19 per
cent respectively; see Figure 2.8). In contrast, very few establishments reported retention
difficulties to be mainly among Managers (two per cent).
Figure 2.8 Occupations in which most difficulty retaining staff
19% Elementary staff
8% Machine Operatives
2% Managers
11% Professionals
10% Associate Professionals
4% Admin. / Clerical staff
21% Skilled Trades occupations
13% Caring, Leisure and Other
9% Sales and Customer Services
Base: All establishments with difficulties retaining staff (4,924)

53
As described earlier in this Chapter, vacancies increased most markedly among Skilled
Trades and Elementary occupations causing more movement of staff between
organisations. Employers were also most likely to have difficulties filling vacancies for
Skilled Trades occupations (53 per cent of all Skilled Trades vacancies were reported to
be hard-to-fill). This suggests the impact of these retention difficulties is likely to be more
acute as these staff are harder to replace. Conversely, vacancies in Elementary
occupations were less likely to be hard-to-fill (26 per cent of Elementary vacancies were
classified by employers as hard-to-fill), suggesting the impact of the retention difficulties
here may be lessened as staff are easier to replace.
The low proportion of employers that reported retention difficulties for Managers (two per
cent) was in line with the relatively low number of vacancies for these roles (just three per
cent of all vacancies were for Managers).
2.9.3 Reasons for retention difficulties
The reasons establishments had difficulties retaining staff are shown in Figure 2.9. Some
of the most common reasons given related to retention difficulties rising from conditions
within the job market, including: a lack of people interested in the type of work (56 per cent),
too much competition from other employers (38 per cent) and lower wages being offered
relative to other organisations (34 per cent). Reasons for retention difficulties also
commonly related to unappealing characteristics of the role, including: long hours (33 per
cent), lack of career progressions (30 per cent), geographic location of the site (26 per cent)
and unattractive conditions of employment (20 per cent).

54
Figure 2.9 Reasons for retention difficulties
As we saw in the previous section, the occupational groups most affected by retention
difficulties were Skilled Trades and Elementary occupations. The data here allow us to
better understand the reasons these roles prove problematic.
• In the case of Skilled Trades occupations, the reasons for retention difficulties most
commonly related to job market conditions, and in particular that there were not
enough people interested in doing the type of work (63 per cent) and that there was
too much competition from other employers (40 per cent).
• Retention difficulties with Elementary staff were also attributed to job market issues,
particularly not enough people being interested in this type of work (67 per cent).
However, reasons for retention difficulties in Elementary roles also centred on
unappealing characteristics of the role: the most common of which was the job
involving long or antisocial hours (43 per cent).
3%
1%
2%
4%
9%
20%
23%
26%
30%
30%
33%
34%
38%
56%
Other
Students come and go
Cost to employer
Nature of work is too difficult/mentally and physically tiring
Difficult to find experienced/skilled staff
Unattractive conditions of employment
Impact of the benefits trap
Geographic location of the site
Staff don't want long term commitment
Lack of career progression
Long/unsocial hours
Wages offered are lower than those offered by other organisations
Too much competition from other employers
Not enough people interested in doing this type of work
Base: All establishments experiencing retention difficulties (Module 2; 4,924)

55
2.10 Conclusions
In line with the picture of a growing UK economy, ESS 2015 provides evidence of strong
labour market activity. There were, however, signs of increasing challenges for
establishments in being able to recruit individuals with the required level of skills,
qualifications or experience. Notably there were increased recruitment challenges related
to skill shortages for employers in Construction and Financial Services; two sectors that
are critical to the UK economy.
The marked increase in skill-shortage vacancies since 2013 may act as a threat to business
growth and hinder productivity if employers are unable to recruit sufficiently skilled labour.
Indeed, the reported impacts of skill-shortage vacancies for employers were numerous,
with many reporting that a shortage of skills has had a direct financial impact on the
establishment, or has impacted their ability to innovate through the introduction of new
products, working practices or technologies.
The types of skills lacking in the labour market included management and leadership skills,
as well as complex analytical skills. These types of skills are important when considering
the productivity of the workforce and the ability of establishments to innovate through the
introduction of new technologies and working practices.
Having considered the external skills challenges that employers face when recruiting, the
next chapter will consider the skills challenges that employers face within their existing
workforce.

56
3 The Internal Skills Challenge
3.1 Chapter Summary
The majority of establishments reported that they had a fully proficient workforce:
86 per cent felt that all their staff were fully proficient at their job. However, around one in
seven employers (14 per cent) experienced skills gaps within their establishment. This
equates to approximately 1.4 million staff who were not fully proficient (five per cent of the
UK workforce).
The proportion of employers with any skills gaps, and the proportion of the workforce
affected, decreased gradually at UK level between the 2011 and 2015 surveys. This varied
by nation, however. The picture in England was relatively static, while the levels of skills
gaps in Scotland and Wales fell between 2013 and 2015, when it aligned with the
experience among employers in England. Northern Ireland employers reported the
greatest levels of proficiency in their staff: the level of skills gaps here dropped considerably
from 2013 such that only one in 11 employers experienced skills gaps within their
establishment, representing 3.3 per cent of all employees.
At an occupational level, skills gaps were more likely to be found in what are traditionally described as unskilled or semi-skilled occupations, with a notable
increase since 2013 in the proportion of Machine Operatives not being fully proficient in
their job role.
Three in five of all skills gaps were deemed to be caused, at least in part, by the fact that
staff were new to the role, while a similar proportion were attributed to employees’ training
being only partially complete. These factors are both predominantly transient: that is to say
one would expect skills gaps resulting from these causes to be eliminated once staff have
settled into their new roles and/or existing training has been completed.
People and personal skills, such as time management and the ability to prioritise tasks, as well as team working, were commonly lacking across a range of occupations
where skills gaps were present. Specialist skills or knowledge needed to perform the role
were also widely considered to be lacking, along with complex analytical skills, especially
among those in high-skilled occupations such as Managers and Professionals.
While the proportion of establishments experiencing skills gaps decreased since 2013, the impact of skills gaps where they did occur increased slightly, and appeared to harm
smaller businesses in particular. An increased workload for other staff was the most
common impact, affecting around half of all establishments with skills gaps.

57
3.2 Introduction
Chapter 2 examined the extent to which establishments encountered difficulties recruiting
and holding on to staff with the skills they need: a challenge that has increased over time.
This chapter explores the related issue of skills gaps within the existing workforce. This
internal challenge arises when employees lack proficiency to fulfil their role. Such skills
gaps can hinder an establishment’s ability to function efficiently, thereby harming its
productivity and profitability.
The chapter covers the incidence, volume, profile and causes of skills gaps, both at an
overall UK and sector level, and by occupation. It then considers the specific skills that
establishments reported their staff to be lacking, the impact that skills gaps had on their
business, and their response to address these issues. It finishes by exploring the
relationship between internal and external skills challenges.
New for ESS 2015 was a revised list of skill descriptors used to better understand the skills
lacking in the workforce (the same approach has been taken for skill-shortage vacancies).
In the 2011 and 2013 surveys a large number of establishments reported that skills gaps
were due, at least in part, to deficiencies in ‘technical, practical or job-specific skills’, without
any further information collected on the nature of the skills that were lacking.
To address this lack of detail ‒ alongside a desire for improved coverage of ‘higher level’
skills that underpin innovative business practices and to harmonise the skill descriptors
used with those of other international skills surveys ‒ the skill descriptors used were revised
for ESS 2015.17 These skill descriptors can be broadly categorised into two: ‘technical and
practical’ skills, which define the content of a job role; and ‘people and personal’ skills,
which define the way in which job roles are delivered.
3.3 The incidence, volume and density of skills gaps
The vast majority of employers (86 per cent) reported that all of their staff were fully
proficient at their job. However, one in seven establishments (14 per cent) considered that
at least some of their staff were not fully proficient (i.e. they reported skills gaps). In total,
1.4m employees across the UK were perceived to be lacking proficiency, equating to 5.0
per cent of the total workforce.
17 Half of employers with skills gaps were assigned to the ‘new’ skill descriptors, whereas the other half were assigned to the ‘old’ skill descriptors used in ESS 2011 and 2013 to facilitate comparisons over time. Time series data on the skills lacking among applicants according to the ‘old’ skill descriptors are shown in Tables A.3.8 and A.3.8a in Appendix A. Further information on the changes to the skill descriptors used is provided in the ESS 2015 Technical Report (https://www.gov.uk/government/publications/ukces-employer-skills-survey-2015-uk-results).

58
The proportion of staff not fully proficient in their job (i.e. the skills gap density) fell from 5.5
per cent in 2011, to 5.2 per cent in 2013 and 5.0 per cent in 2015. This fall occurred
predominantly in the devolved administrations. It was most notable in Northern Ireland
where the density of skills gaps decreased from 5.2 per cent in 2013 to 3.3 per cent in
2015. In England, the skills gap density remained stable between 2013 and 2015, at 5.1
per cent.
Figure 3.1 Incidence and density of skills gaps by country
Larger employers were more likely than smaller employers to experience skills gaps,
reflecting in part that with a larger workforce, it was more probable that at least one
employee would lack full proficiency. Six per cent of establishments with 2-4 employees
experienced skills gaps, rising to 43 per cent of those with 250 or more employees. These
larger employers also experienced a higher skills gap density: 2.6 per cent of the workforce
employed by establishments with fewer than five staff were described as not fully proficient,
rising to 6.7 per cent among those with 250+ staff. While this pattern of increased density
by size of establishment existed in 2013 and 2011, it was more pronounced in 2015.
17%
15%14%
17%
15%14%
13%14%
9%
21%
19%
14%
16% 16%
14%
5.5%5.2% 5.0%
5.6%5.1% 5.1%
4.4%5.2%
3.3%
5.2%5.9%
5.0%4.6%
5.8%4.5%
% of establishments with skills gap
Density (% of all staff with skills gap)
UK England N. Ireland Scotland Wales
Base: All establishments (2015: UK: 91,210; England: 75,129; NI: 4,019; Scotland: 6,035; Wales: 6,027)Note: See Table A.1.3 in Annex A for 2011 and 2013 base sizes
20132011 2015 20132011 2015 20132011 2015 20132011 2015 20132011 2015

59
3.3.1 The sectoral distribution of skills gaps
While the overall UK trend reflected both a lower incidence and a lower density of skills
gaps compared to 2013, this was not reflected across all sectors of the economy.
In a handful of sectors, the skills gap density was actually higher than in 2013. As Figure
3.2 shows, the Manufacturing sector in particular demonstrated this trend: here the skills
gap density rose from 5.9 per cent in 2013 to 7.2 per cent in 2015 (from 138,800 to 173,400
staff respectively).
Conversely, the sector that traditionally experiences the highest density of skills gaps,
Hotels and Restaurants, saw this density decrease from 8.9 per cent in 2013 to 7.2 per
cent in 2015 (from 159,400 to 140,100 staff respectively), equalling the density in the
Manufacturing sector.
The biggest decrease in skills gap density occurred in Financial Services, where the 2015
figure of 3.7 per cent represented a return to 2011 levels, following a spike in skills gaps in
2013.
While skills gap density was highest in the Hotels and Restaurants, and Manufacturing
sectors, the highest number of skills gaps existed among establishments in the Wholesale
and Retail sector (242,200 skills gaps) and the Business Services sector (249,300). This
is to be expected given these sectors accounted for higher proportions of the workforce
than any other.

60
Figure 3.2 Density of skills gaps by sector
There were also distinct sectoral patterns between the nations:
• In England, the skills gap density in some of the largest sectors of the workforce
(such as Wholesale and Retail, and Health and Social Work) were consistent over
time. In contrast, establishments in these sectors in Northern Ireland, Scotland and
Wales experienced a considerable decrease in skills gap densities.
• The drop in the skills gap density among staff in the Financial Services sector was
driven by establishments in England.
The drop in the skills gap density among Hotels and Restaurants staff occurred across all
nations, however.
Tables A.3.1 and A.3.2 in Annex A provide a detailed breakdown of the incidence, number
and density of skills gaps by size of establishment and sector, as well as the skills gap
density by sector within nation.
4.4%
4.0%
8.1%
4.4%
4.7%
3.8%
5.1%
4.4%
5.0%
5.8%
4.8%
5.9%
8.9%
2.9%
3.2%
3.7%
3.8%
3.8%
4.0%
4.9%
4.9%
5.2%
5.4%
6.4%
7.2%
7.2%
Agriculture
Health & Social Work
Financial Services
Arts & Other Services
Construction
Education
Electricity, Gas & Water
Transport & Comms
Business Services
Wholesale & Retail
Public Administration
Manufacturing
Hotels & Restaurants
2015 Skills gapdensity
2013 Skills gapdensity
Number of Skills gaps (2015)
Base: All establishmentsNote: See Table A.1.3 in Annex A for 2013 and 2015 base sizes by sector
140,100
173,400
86,000
242,200
249,300
108,900
13,900
103,700
44,500
47,400
36,400
122,700
11,800

61
3.3.2 The occupational distribution of skills gaps
At an occupational level, skills gaps were more likely to be found in what are traditionally
described as unskilled or semi-skilled occupations. As Table 3.1 shows, around seven per
cent of Sales and Customer Service staff, Machine Operatives18 and those in Elementary
occupations were reported to be lacking full proficiency (compared with five per cent
overall). Collectively these occupations accounted for around a third (34 per cent) of all
employees, but approaching half (47 per cent) of all skills gaps. This was broadly consistent
with the occupational pattern of previous years.
Table 3.1 Number and density of skills gaps by occupation
Number of skills gaps
% of staff reported as having skills gaps (Skills Gap density)
2015 2011 2013 2015
Row percentages Unwtd base 2015
n % % %
UK 91,210 1,380,200 5.5 5.2 5.0
Occupation
Managers 87,590 129,400 3.2 3.0 2.7
Professionals 17,483 102,100 4.2 3.8 3.0
Associate Professionals 13,309 88,300 4.9 5.3 5.3 Administrative and Clerical 53,622 187,000 4.9 4.9 5.4
Skilled Trades 24,025 108,100 5.4 5.5 5.5 Caring, Leisure and Other Services 15,310 119,400 5.4 4.8 4.1
Sales and Customer Service 25,940 228,400 8.3 7.8 6.5
Machine Operatives 14,105 161,700 6.0 5.4 7.0
Elementary occupations 31,970 255,800 7.6 7.3 6.9
Base: All establishments with staff in each occupation.
Percentages are based on all employment, rather than all establishments; figures therefore show the number of skills gaps as a proportion of all employment in each occupation.
Note: The number of employees not fully proficient has been rounded to the nearest 100.
There was a higher skills gap density among Machine Operatives in 2015 (7.0 per cent)
than in 2013 (5.4 per cent). As noted in Chapter 2, it was also this occupation which
experienced the greatest increase in the density of skill-shortage vacancies. There were
clear signs therefore that businesses were suffering from both internal and external skills
challenges with Machine Operatives.
18 These include drivers, food and drink process operatives, and scaffolders, among other occupations.

62
Administrative and Clerical staff were the only other occupation where the skills gap density
increased (from 4.9 per cent in 2013 to 5.4 per cent in 2015). Generally speaking those in
the most highly skilled occupations (Managers and Professionals) were most likely to be
fully proficient in their job (with skills gap densities of 2.7 and 3.0 per cent respectively).
Figure 3.3 illustrates skills gap density by occupation, and pinpoints particularly marked
occupational patterns within sectors. Highlighted in dark red are occupations within a sector
where skills gap density was at least nine per cent (at least four percentage points higher
than the average across all staff).
This highlights that within the Manufacturing and Hotels and Restaurants sectors, where
the skills gap density was highest, a lack of proficiency was particularly acute in the more
labour-intensive occupations. In the Manufacturing sector this would include vehicle or
machine operatives and assemblers, while in the Hotels and Restaurants sector it might
include cleaners, waiters and kitchen assistants.

63
Figure 3.3 Density of skills gaps by occupation within sector
Tables A.3.3 and A.3.4 in Annex A provide detailed breakdowns of skills gap density by
occupation within country and sector respectively.
= Skills Gap density 9% or above= Skills Gap density between 5% and 8%
= Skills Gap density between 1% and 4%
Figures only shown where base size is greater than 50.See Table A.3.3a in Annex A for base sizes.
Skilled Trades occupations
2.9%
3.2%
3.7%
3.7%
3.8%
4.0%
4.9%
4.9%
5.2%
5.4%
6.4%
7.2%
7.2%
Agriculture
Health & Social Work
Financial Services
Arts & Other Services
Construction
Education
Electricity, Gas & Water
Transport & Comms
Business Services
Wholesale & Retail
Public Administration
Manufacturing
Hotels & Restaurants

64
3.4 The causes of skills gaps
Employers identified a variety of factors that led to skills gaps in their establishment. The
main causes of staff not being fully proficient overall are presented in Table 3.2. The figures
show what proportions of skills gaps were caused by the various factors reported by
establishments. Respondents were able to give more than one cause for skills gaps within
each occupation.
As in 2013, transient causes dominated, i.e. one would expect the skills gaps to be resolved
relatively quickly, but the majority of establishments also suggested additional factors that
had led to skills gaps. Three in five skills gaps (60 per cent) were deemed to be caused, at
least in part, by the fact that staff were new to the role, while a similar proportion (56 per
cent) were attributed to employees’ training being only partially complete. Combined, these
transient factors contributed, at least to some extent, to 73 per cent of all skills gaps.
Table 3.2 Main causes of skills gaps (prompted)
2011 2013 2015
Unweighted base 20,820 20,228 18,265 % % %
Staff are new to the role 56 62 60
Their training is currently only partially completed 55 57 56
Staff lack motivation 38 42 34
They have been on training but their performance has not improved sufficiently 35 39 29
The introduction of new working practices 28 32 28
Staff have not received the appropriate training 27 29 26
Unable to recruit staff with the required skills 22 26 26
The introduction of new technology 20 20 20
The development of new products and services 19 21 19
Problems retaining staff 12 18 18
Summary: New to role and/or training incomplete 72 75 73
Base: All establishments with skills gaps; up to two skills gaps followed up.
Percentages shown as a proportion of all skills gaps followed up rather than all establishments with skills gaps. Figures therefore show the proportion of skills gaps in each nation caused by each stated reason.

65
While the hierarchy of causes of skills gaps stayed consistent with 2013, there were some
notable differences. In particular there was a decrease in the proportion of skills gaps
caused by staff lacking motivation (from 42 per cent to 34 per cent in 2015) and those
caused by training not improving performance sufficiently (from 39 per cent to 29 per cent
in 2015).
In sectors with higher skills gap densities – Manufacturing and Hotels and Restaurants –
causes of skills gaps were more likely to be transient than in most other sectors (79 and 82
per cent respectively). Skills gaps in the Hotels and Restaurants sector were also more
likely to be caused by performance not improving following training (38 per cent compared
with 29 per cent overall), and problems retaining staff (29 per cent compared with 18 per
cent overall).
Employers in the Public Administration and Agriculture sectors were least likely to report
that skills gaps were caused by transient factors. Instead key causes of skills gaps in the
Public Administration sector centred around development and innovation in the workplace:
• 57 per cent of skills gaps in this sector were attributed to the introduction of new
working practices.
• 49 per cent of skills gaps were attributed to the introduction of new technology.
• 38 per cent of skills gaps were attributed to the development of new products and
services.
In the Agriculture sector, patterns of causes were less clear cut.
Table A.3.5 in Annex A contains a breakdown of the most common causes of skills gaps
by sector.
The two most common causes of skills gaps (staff being new to the role and training not
being complete) remain the most common causes of skills gaps across all occupations.
Among more labour-intensive occupations, where skills gaps tended to be more prevalent,
a lack of motivation was also perceived to be a key cause of these skills gaps. This was
particularly the case for those in Elementary occupations (50 per cent compared with 19 to
38 per cent across all other occupations). Training not improving staff performance was
also a more common cause of skills gaps among Sales and Customer Service and
Elementary occupations (both 36 per cent) compared with other occupations (21 to 32 per
cent). Table A.3.6 in Annex A provides a breakdown of the factors that caused skills gaps
by occupation.

66
3.5 Skills lacking internally
The skills that employers perceive their staff to be lacking can broadly be categorised into
two: on the one side are the technical and practical skills that define the content of a job
role, and on the other side are the softer ‘people and personal’ skills which can define the
way in which job roles are delivered. These people and personal skills are often less
tangible but can have as great an impact on the efficiency of a workforce19.
Five of the six skills most commonly found to be lacking among existing staff related to
people and personal skills, as Figure 3.4 illustrates. In particular, employers raised issues
around poor time management and prioritisation of tasks (cited in relation to 59 per cent of
skills gaps), demonstrating that staff struggled to cope with the various demands placed on
them. Team working was also widely cited as lacking among existing staff (56 per cent).
Establishments also faced challenges with management and leadership within their
organisation. Combining various specific skills that pertained to these issues (‘managing
or motivating staff’, ‘persuading others’ and ‘setting objectives’), a lack of management and
leadership skills was cited in relation to nearly three-fifths of all skills gaps. A slightly lower
proportion of skills gaps could be attributed to sales and customer skills20.
Specialist or knowledge-based skills that are required for the particular job role of the
employee were mentioned in relation to half of all skills gaps (48 per cent), rendering this
the most common technical and practical skill lacking among existing staff. A similar
proportion of skills gaps related to a lack of operational knowledge: 37 per cent of skills
gaps were attributed to a lack of knowledge of the products and services the establishment
offers and 36 per cent to a lack of knowledge in how the organisation worked. There were
also deficiencies in complex analytical skills: 39 per cent of skills gaps were attributed to a
lack of proficiency in solving complex problems, and 24 per cent were attributed to a lack
of complex numerical or statistical skills.
Improving technologies in the workplace is perceived to be a critical area of change for
businesses over the next few years (UKCES, 2014a). However, a third of all skills gaps (32
per cent) related to a lack of proficiency in adapting to new equipment or materials. A lack
of basic IT skills was cited for a similar proportion of skills gaps (30 per cent), while
advanced IT skills were also commonly lacking (27 per cent), particularly among those in
high-skill or middle-skill roles (such as Professionals and Administrative and Clerical staff).
19 As noted in the introduction to this chapter, a new list of skill descriptors were developed for ESS 2015 in order to better understand the skills lacking among staff. Half of employers with skills gaps were assigned to the ‘new’ skill descriptors, whereas the other half were assigned to the ‘old’ skill descriptors used in ESS 2011 and 2013 to facilitate comparisons over time. Time series data on the skills lacking among applicants according to the ‘old’ skill descriptors are shown in Tables A.3.8 and A.3.8a in Appendix A. Further information on the changes to the skill descriptors used is provided in the ESS 2015 Technical Report (https://www.gov.uk/government/publications/ukces-employer-skills-survey-2015-uk-results). 20 This includes ‘sales skills’ and ‘customer handling skills’.

67
Figure 3.4 Skills lacking among staff with skills gaps
9%
13%
14%
20%
22%
24%
27%
29%
30%
32%
36%
37%
39%
48%
12%
17%
23%
28%
30%
39%
41%
46%
46%
56%
59%
None of the above
Communicating in a foreign language
Manual dexterity
Basic numerical skills
Writing instructions, reports etc.
Complex numerical/statistical skills
Advanced or specialist IT skills
Reading/understanding instructions, reports etc.
Computer literacy / basic IT skills
Adapting to new equipment or materials
Knowledge of how the organisation works
Knowledge of products and services offered
Solving complex problems
Specialist skills or knowledge
None of the above
Making speeches or presentations
Sales skills
Instructing, teaching or training people
Setting objectives for others / planning resources
Persuading or influencing others
Managing or motivating other staff
Managing own feelings / handling those of others
Customer handling skills
Team working
Ability to manage own time and prioritise tasks
46% Complex analytical
50% Operational
50% Sales and customer skills
58% Management and leadership
People and personal skills that need improving:
Technical and practical skills that need improving:
Base: All establishments with skills gaps – up to 2 occupations followed up with the new lists of skill descriptors (9,119)

68
The remainder of this section focusses on the occupational dimension of skills, especially
those occupations where skills gaps were more prevalent. Across all occupations where
skills gaps existed however, the ability to manage time and prioritise tasks was a recurring
issue. It should also be noted that some skills gaps particularly affected specific
occupations in predictable ways (management and leadership skills lacking among
Managers, sales and customer skills lacking among Sales and Customer Services staff).
While Managers were most likely to be fully proficient in their job role, still nine per cent of
all skills gaps were found in this occupation, with managing or motivating other staff the
most common skill that was lacking (68 per cent). Managers were also widely perceived to
be lacking in complex analytical skills (55 per cent for example were deemed to lack
proficiency in solving complex problems). This theme ran through all high-skill
occupations21, as well as among Administrative and Clerical staff. A lack of complex
analytical skills could have serious implications on the ability of staff to respond to
increasingly dynamic workplaces and developments in technology and thus restrict
establishments’ potential for innovation and long-term growth.
Time management and task prioritisation skills were most commonly lacking among
Professional staff22 with skills gaps, and those in Administrative and Clerical roles (68 and
67 per cent respectively), suggesting that these staff in particular struggle with the various
demands of their job role. Professional staff also appeared to be held back by a lack of
specialist or knowledge-based skills required for a specific job role (70 per cent).
There was a relatively high level of skills gaps among Sales and Customer Services staff.
Alongside a lack of customer handling skills (64 per cent) and sales skills (53 per cent),
staff with skills gaps in this occupation were often lacking knowledge on the operational
side of the business. Over half of skills gaps in this occupation were attributed to a lack of
knowledge of products and services their company offered (53 per cent), which could be
of particular concern to employers, given that staff in these occupations tend to be outward
facing representatives.
Staff in labour-intensive roles (i.e. Machine Operatives23 and Elementary staff) were most
likely to be lacking proficiency in their job role. For both occupations, team working was the
predominant skill lacking: 62 per cent of Machine Operatives and 69 per cent of Elementary
staff with skills gaps lacked these skills. For Machine Operatives, reading and
understanding instructions (44 per cent) and adapting to new equipment or materials
(41 per cent) were skills lacking more commonly than in other occupations.
21 This term includes Managers, Professionals and Associate Professionals. 22 This would include teachers, consultants and programmers. 23 This would include drivers, food and drink process operatives, and scaffolders, among other occupations.

69
Table 3.3 shows the three most common skills lacking by occupation and then the three
skills in particular short supply when compared with the UK average.
Table 3.3 Most common skills lacking among staff with skills gaps, by occupation
Occupation Skills Gap
Density Skills most commonly
lacking Three skills in short supply
compared with average
Managers 2.7%
Managing or motivating other staff Setting objectives / planning resources Time management and task prioritisation
Setting objectives / planning resources Managing or motivating other staff Persuading or influencing others
Professionals 3.0%
Specialist skills or knowledge Time management and task prioritisation Team working
Specialist skills or knowledge Advanced or specialist IT skills Instructing, teaching or training people
Associate Professionals 5.3%
Specialist skills or knowledge Time management and task prioritisation Solving complex problems
Advanced or specialist IT skills Setting objectives / planning resources Making speeches or presentations
Administrative / Clerical staff 5.4%
Time management and task prioritisation Customer handling skills Team working
Advanced or specialist IT skills Customer handling skills Complex numerical/statistical skills
Skilled Trades occupations 5.5%
Specialist skills or knowledge Time management and task prioritisation Team working
Specialist skills or knowledge Manual dexterity Adapting to new equipment or materials
Caring, Leisure and Other Services
4.1%
Time management and task prioritisation Specialist skills or knowledge Team working
Writing instructions, reports etc. Specialist skills or knowledge Reading/understanding instructions, reports etc.
Sales and Customer Services
6.5%
Customer handling skills Time management and task prioritisation Knowledge of products and services
Sales skills Customer handling skills Knowledge of products and services
Machine Operatives 7.0%
Team working Time management and task prioritisation Managing own or others' feelings
Reading/understanding instructions, reports etc. Basic numerical skills Adapting to new equipment or materials
Elementary staff 6.9%
Team working Time management and task prioritisation Customer handling skills
Team working Communicating in a foreign language Manual dexterity
Base: All establishments with skills gaps in each occupation – up to two occupations followed up (9,119).
Tables A.3.7a-e in Annex A present the skills lacking in the workforce by occupation, nation
and sector.

70
3.6 The impact of skills gaps
Although fewer establishments in 2015 than in 2011 or 2013 reported skills gaps, a higher
proportion said these had had a negative impact on their organisation’s performance. This
was evident in that:
• In 2015, 66 per cent of employers with skills gaps reported these as having an
impact on their organisation’s performance, up from 63 per cent in 2013 and 61 per
cent in 2011.
• 17 per cent reported that their skills gaps were having a major impact on their
business’ performance, slightly but significantly up from 16 per cent in 2013 and 15
per cent in 2011.
There was little difference between countries in terms of major impacts. However,
establishments in Northern Ireland and Scotland were more likely to cite any impact from
skills gaps (69 and 70 per cent respectively, compared with 65 per cent in England and 64
per cent in Wales).
Establishments more likely to suffer major impacts from skills gaps included:
• Small businesses: 23 per cent of employers with 2-4 staff reported experiencing
major impacts.
• Employers in the Hotels and Restaurants sector of which 21 per cent reported major
impacts on their establishment (n.b. it was this sector which experienced the highest
skills gap density).
Figure 3.5 shows the extent of impact of skills gaps in 2015 and the implications for the
business. Table A.3.9 in Annex A provides a breakdown of extent of impact by size, sector
and country.

71
Figure 3.5 Impacts of skills gaps
As seen in previous years, the most common impact of skills gaps was an increased
workload for other staff: this affected over half of establishments with skills gaps (52 per
cent, rising to 60 per cent among establishments in Public Administration).
Establishments also suffered financial impacts as a result of their internal skills challenge.
The fact that not all of their staff were fully proficient drove up the operating costs of over a
quarter of employers with skills gaps (27 per cent), an issue that was more common in
Agriculture (38 per cent) and Manufacturing (37 per cent). Additionally, 21 per cent lost
business or orders to competitors, a scenario that affected small establishments most of
all (26 per cent among employers with 2-4 staff).
Skills gaps also impacted on establishments’ ability to innovate, signalling more long-term
business implications. These impacts varied according to the size of the establishment.
While a quarter of establishments with skills gaps (24 per cent) had difficulty introducing
new working practices, this was much higher among those with 250+ staff (34 per cent).
Conversely, small establishments were more likely to experience delays in developing new
products or services (23 per cent among those with 2-4 staff compared with 17 per cent
overall).
Table A.3.10 in Annex A provides a breakdown of impacts of skills gaps by size, sector and
country.
52%
27%
25%
24%
21%
17%
11%
34%
Increase workload for other staff
Higher operating costs
Difficulties meeting quality standards
Difficulties introducing new workingpractices
Lose business or orders to competitors
Delay developing new products orservices
Outsource work
No impact
Base: All establishments with skills gaps (18,265)
17%
48%
Whether skills gaps have any impact
Impacts of skills gaps (prompted)
ANY IMPACT
Major impact
Minor impact
66%

72
3.7 Employer response to skills gaps
The vast majority of employers with skills gaps (85 per cent) had taken steps to tackle
them. In addition five per cent reported that they had not taken steps at the time but planned
to do so in future. Just short of one in ten (nine per cent) of establishments had taken no
action and had no plans in place to tackle these issues.
Smaller establishments in particular might need more help responding to their internal skills
challenges. Establishments with 2-4 staff were less likely to experience skills gaps than
larger employers and were also less likely to have responded to them: 75 per cent of small
establishments with skills gaps had taken steps to tackle them compared with 85 per cent
overall. Indeed, there was evidence to suggest that the scale of the skills gaps challenge
proved too much for some of these small businesses: those small businesses that cited
major impacts as a result of skills gaps were even less likely to have taken steps to address
them (68 per cent).
Table A.3.11 in Annex A provides a breakdown of actions taken to tackle skills gaps by
country, size and sector.
As Figure 3.6 illustrates, additional training remained at the forefront of establishments’
approaches to tackling internal skills gaps: nearly seven in ten establishments (68 per cent)
increased their training activity or spend in order to improve the skills levels of their
employees. This was consistent with the findings from 2013.

73
Figure 3.6 Actions taken to overcome skills gaps (prompted)
Another common method that establishments employed to respond to skills gaps was
harnessing the experience of existing staff to improve the performance of others (56 per
cent for example introduced more supervision of staff). Such actions were particularly
common among employers in the Education sector.
Changing structural approaches to work in response to skills gaps was less common: 33
per cent of establishments with skills gaps reallocated work and 27 per cent changed their
working practices.
Finally, only one in five establishments with skills gaps (19 per cent) responded by
increasing recruitment spend and activity. From a time series perspective, this represented
a steady increase over time (11 per cent in 2011; 16 per cent in 2013). This ties in with the
considerable increase in the number of vacancies noted in Chapter 2 and with it a large
rise in the total number of skill-shortage vacancies.
25%
7%
11%
24%
26%
38%
42%
47%
62%
15%
10%
16%
31%
37%
47%
51%
60%
68%
16%
10%
19%
27%
33%
45%
46%
56%
68%
Nothing
Recruiting workers who are non-UK nationals
Increase recruitment activity / spend
Changing work practices
Reallocating work
Implementation of mentoring / buddyingscheme
More staff appraisals / performance reviews
More supervision of staff
Increase training activity / spend or increase /expand trainee programmes
201520132011
Base (2015 / 2013 / 2011): All establishments with skills gaps (18,265 / 20,228 / 20,820)

74
3.8 Skills deficiencies among existing staff and when recruiting staff
We have now explored skills lacking both among potential recruits and within the existing
workforce. It may be the case that establishments experienced substitution between these
two measures of labour market deficiency. Some employers when faced with inadequate
applicants will leave the vacancy unfilled, in which case the issue reveals itself as a skill-
shortage vacancy; other employers may feel it is better to recruit someone who is not
appropriately skilled, in which case the deficiency will reveal itself as a skills gap, albeit
potentially a transient one.
3.8.1 The relationship between skill-shortage vacancies and skills gaps
There appeared to be no sign that the scale of the skills challenge at this collective level
had changed since 2013. Approaching one in five establishments (18 per cent) were
suffering from either form of skills deficiency in 2015, in line with 2013, as Table A.3.12 in
Annex A shows. However, by 2015 these skills challenges had become more external, due
to the density of skill-shortage vacancies increasing, and the density of skills gaps
decreasing (albeit slightly). Figure 3.7 illustrates how the skills challenge evolved over time,
by sector.
Figure 3.7 Changes in number of skill-shortage vacancies and skills gaps over time, by sector
141% 139%
84%70%
59% 58% 56%
37% 33% 29% 26% 24%
-47%
-25%
-57%
15%
-5%
6%
-3%-12%
-30%-15%
25%11%
-13%
25%
% Change in number of SSVs since 2013
% Change in number of Skills Gaps since 2013
Base: All establishments See Table A.1.3 in Annex A for base sizes by sector

75
This serves to illustrate the complex trends occurring across various sectors at this
collective level. For the majority of sectors, and in line with the overall UK story, skills
challenges became more external, with a decrease in the density of skills gaps and an
increase in the density of skill-shortage vacancies.
This was most acute for employers in Financial Services and Construction, where the
number of skill-shortage vacancies more than doubled and the number of skills gaps
decreased by around half and a quarter respectively. However, there were certain sectors
that experienced a different pattern, most notably:
• Manufacturing, where the skill-shortage vacancy density and skills gap density
increased by similar proportions.
• Public Administration, which exhibited the only reversal of the trend towards
external challenges, i.e. fewer skill-shortage vacancies and more skills gaps.
• Transport and Communications, Manufacturing, and Business Services, where the
skill-shortage vacancy density increased, along with an increase of between an
eighth and a quarter of skills gaps.
3.8.2 Skills lacking internally and externally
We can also explore the dynamic between the skills that were perceived to be lacking
among existing staff and potential recruits, although such comparisons are not perfect
owing to the difficulty in observing skills lacking among people external to the business.
In general the issues faced externally and internally followed a similar hierarchy. Looking
at specific people and personal skills, the greatest imbalance between internal and external
challenges related to team working. This contributed to over half of all skills gaps (56 per
cent), compared with only a third of skill-shortage vacancies (33 per cent). This suggests
that employers could do more to assess the collaborative characteristics of candidates prior
to offering employment, as team working was clearly a common issue among existing staff.
Broad management and leadership skills challenges were also much more common among
existing staff (58 per cent of all skills gaps) than potential recruits (46 per cent of skill-
shortage vacancies). Table A.2.11 and A.3.7d contain people and personal skills lacking
externally and internally, split by sector.
Turning to practical and technical skills, the demand for specialist skills or knowledge
seemed greater for those establishments with skill-shortage vacancies: 64 per cent of skill-
shortage vacancies related to these specific job-related skills compared with 48 per cent of
skills gaps. This may be a result of existing staff having had a chance to ‘bed in’ and
develop the specific skills required for their job role, and/or that employers are generally
less likely to hire staff whose skills are not relevant for the available job roles.

76
While basic IT skills and being able to adapt to new equipment were not regarded by many
as skills lacking in potential recruits (22 and 20 per cent respectively), such skills revealed
themselves to be a greater issue among existing staff (30 and 32 per cent). One could posit
a variety of theories to explain these differences, but they do at least illustrate that – in the
context of a rapidly changing technological landscape – employers could do more to ensure
their existing staff are able to adapt and harness new technologies.
There was also plenty of divergence within sector. Manufacturing has been identified as a
sector that struggled with skills challenges, especially internally. Here, existing staff were
much more likely to lack skills in basic IT, reading and understanding instructions or reports
and adapting to new equipment, compared with potential recruits.
Tables A.2.10 and A.3.7c contain the technical skills lacking externally and internally, split
by sector.
Similar patterns, across both sets of skills frameworks, prevailed at the occupational level,
and we have focussed below on key areas of interest identified earlier in this report:
• In Skilled Trades roles, a lack of skills relating to manual dexterity and adapting to
new equipment persisted as common internal and external challenges.
• Among Machine Operatives, there was a clear story of internal skills issues around
an inability to read instructions, adapt to new equipment and basic numeracy, which
were not as apparent among the skills lacking in applicants.
• For Professionals, time management skills were commonly lacking among existing
staff but less frequently identified as skills lacking among applicants. Both internally
and externally however, the specialist skills or knowledge of Professionals was
deemed to be most commonly lacking.
Tables A.2.8, A.2.9, A.3.7a and A.3.7b in Annex A contain people and personal skills
lacking, as well as technical or practical skills lacking, split by occupation.

77
3.9 Conclusions
There are increasing proportions of staff within organisations fully proficient in their job role.
However, to an extent this merely reflects a shift in the balance of the skills landscape,
whereby the challenge is weighted more towards potential recruits who lack the requisite
skills for the job role, than towards internal staff.
Nevertheless, the survey points to particular areas of skills gaps among existing staff which,
unless resolved, may prevent establishments from maximising their potential. Within
people and personal skills, a lack of time management and task prioritisation skills – the
two most common people and personal skills – point to a growing demand on staff to juggle
multiple responsibilities. Such issues could hamper productivity in the workplace.
A lack of complex analytical skills was also apparent in existing staff. Such skills are of
increasing importance as employers make use of more elaborate technologies. Limitations
in this area could prevent companies from engaging in innovative practices that are often
the pre-cursor to growth.
So far this report has focussed on the skills deficiencies that exist both externally and within
an organisation, and how these issues affect business performance. In the next chapter
we explore the skills imbalance that can occur when establishments do not make the most
effective use of the skills and qualifications their employees possess.
78
4 Employer perceptions of under-use of skills and qualifications
4.1 Chapter Summary
Some employers may experience a skills imbalance where they perceive that staff are
being “under-utilised”, that is, the skills and qualifications that these staff hold are above
those required for their current role. Three in ten employers reported that they had at least one employee who fits this description within their establishment (30 per cent),
with two million workers reported to be under-utilised in this way.
There are a number of different reasons given by employers for the under-use of skills. A quarter (26 per cent) of employers that reported under-use of skills said the reason was staff not being interested in taking on a higher level role; 15 per cent reported that
the working hours suited them better. These would seem to indicate a personal choice
being made by the individual because these job roles better suit their needs and
circumstances. However, other reasons given by employers related to what could be
considered to be a shortfall in the volume of jobs available that would use their skills, i.e. a
lack of demand for their skills in the labour market. For example, 11 per cent of employers
reporting under-utilisation said the reason was a lack of jobs in the desired higher level role
and 10 per cent reported that they were gaining experience for a higher level role.
Under-utilisation represents not only a waste of individuals’ talent but also potentially a
missed opportunity for employers to increase performance and productivity, improve job
satisfaction and employee well-being, and stimulate investment, enterprise and innovation.

79
4.2 Introduction
As well as shortages of skills in the available labour market and/or among the existing
workforce, skills imbalance can occur within establishments when the skills and
qualifications held by individuals are not fully deployed in the workplace. We refer to this in
this report as ‘under-utilisation’ (though the phenomenon is sometimes referred to
elsewhere as ‘under-use of skills’, ‘over-skilling’, ‘over-qualification’ and/or ‘under-
employment’).
Within ESS, under-utilisation is said to occur where a member of staff is perceived by their
employer to have both qualifications and skills that are more advanced than required for
their current job role. In 2011 and 2013, incidence was drawn from a single question24, and
under-utilisation was consistently reported by just under half of employers (48 per cent) in
both years.
ESS 2015 has sought to fine-tune how the incidence of ‘under-utilisation’ is measured,
identifying under-utilisation through a sequential two question approach25, with a view to
minimising suspected over-reporting (i.e. cases where staff have either skills or qualifications but not both). Due to this adjusted measure of under-utilisation, no time
series comparisons are presented in this chapter26.
The 2015 survey also added questions to explore the occupational roles in which,
according to employers’ perception, under-utilisation most frequently occurs within an
organisation, and the reasons why employers perceive that it occurs. Examining the
perceived reasons for under-utilisation allows us to identify where there may be inefficiency
within the market as individuals achieve qualifications and develop skills which they (and
the economy) are then unable to exploit (and, therefore, the return on investment of skills
development is constrained).
Supplementing the questions in this way facilitates the identification of potential
opportunities for (some) employers to restructure the jobs that they have on offer, or to
rethink their organisational practices, in order to better utilise the skills that could be
available to them.
24 You said that you have [NUMBER] staff who are fully proficient at their job. Of these, how many would you say have both qualifications and skills that are more advanced than required for their current job role? 25 “How many [of your staff at this establishment] would you say have qualifications that are more advanced than required for their current job role?” followed by “And how many of [them] also have skills that are more advanced than required for their current job role?” 26 The impact of this re-definition on levels of incidence of all under-utilisation can be reviewed in Table A.4.1 in Annex A, which provides a detailed breakdown of incidence of under-utilisation for 2011, 2013 and 2015, by country, size of establishment and sector.
80
4.3 Prevalence of under-utilisation
Across the UK, nearly two in five establishments (39 per cent) reported having employees
with qualifications more advanced than required for their current job role. This reduced to
three in ten (30 per cent) when establishments considered whether these individuals also
had skills more advanced than needed. In volume terms, 2.0 million workers or seven per
cent of the workforce had both under-utilised skills and under-utilised qualifications. There
were some notable patterns of under-utilisation in different parts of the economy:
• Employers in Northern Ireland and England were marginally less likely than those in
Wales and Scotland to report under-utilisation (28 and 30 per cent compared to 34
and 32 per cent, respectively). This presented a similar pattern to that reported in
respect of internal and external skills deficiencies, where the proportions reported
were consistently lowest in Northern Ireland.
• The likelihood of employers reporting under-utilisation among staff increased steadily
through the size bands, from 29 per cent (2-4 employees) to 35 per cent (250+
employees). This was a pattern which reflected that seen with other key skills and
training measures, albeit with a more restricted range of responses.
• Under-utilisation is most common within the Hotels and Restaurants sector (40 per
cent), closely followed by Education (37 per cent), Public Administration (36 per cent),
and Health and Social Work (36 per cent). These sectors also tended to have higher
than average levels of skills deficiencies. The incidence of under-utilisation was
notably lower for Agriculture (20 per cent).
It is possible that this is an underestimate: eight per cent of employers did not know whether
their staff have skills or qualifications more advanced than required for their role, with this
proportion rising to nearly half (46 per cent) among establishments employing 250+
workers. This is perhaps unsurprising, in particular within a larger workforce where it can
be hard for employers to have full knowledge of all of the skills and qualifications that all individuals possess. This is all the more true if individuals have made a choice to restrict
which skills and qualifications they want to bring to their choice of employment.
4.4 Occupations most affected by under-utilisation
Where employers reported that they had any staff whose qualifications and skills were
under-utilised in their current job role, the survey asked them to identify the role in which
this most commonly occurred. Figure 4.1 illustrates the roles in which employers most
commonly reported under-utilisation.

81
Figure 4.1 Occupation most affected by under-utilisation
The stand-out finding is that nearly two in five employers (37 per cent) who reported under-
utilisation said that it was most likely to occur among those occupying managerial roles.
This is somewhat surprising as a finding, in the sense that managers sit at the top of the
occupational hierarchy so one might surmise that there is not a higher level at which people
could put their surplus skills and qualifications to use.
This can be explained to some extent by the fact that this is the most prevalent occupation
across establishments, and there is a natural narrowing of the ladder as it reaches the top,
meaning that the number of people who can continue to climb is limited. Furthermore, as
individuals assume positions of management, they can commonly cease to need to utilise
some of the more technical skills and qualifications that they have previously acquired (e.g.
skills and qualifications that relate to the core service that their organisation provides). If
they, or their employer, perceives these technical or service-related skills and qualifications
to be “more advanced” than needed for their managerial role, then they may report this rise
up the job ladder as reflecting under-utilisation of the full repertoire of their skills. It is also
worth noting that, particularly within smaller establishments, the respondent is likely to be
at management level, and individuals may be more likely to identify their own skills and
qualifications as beyond those needed for their role.
Base: All establishments with under-utilised staff (28,159)
9% Elementary staff
2% Machine Operatives37% Managers
7% Professionals
8% Associate Professionals
14% Admin. / Clerical staff
6% Skilled Trades occupations
7% Caring, Leisure and Other
9% Sales and Customer Services

82
Employers were asked to select the single occupation in which under-utilisation is most common: this means the survey does not establish a full analysis of the occupations in
which under-utilisation occurs and that it is difficult to establish a profile of under-utilisation
which stands up against the survey’s other occupational metrics.
4.5 Reasons for under-utilisation
After employers had identified the occupations in which under-utilisation most commonly
occurred in their establishment, they were then asked why they felt that it occurred among
these staff. As shown in Figure 4.2, the most common cause of under-utilisation, as
perceived by the employer, was a lack of interest among staff to take on a higher level role
with more responsibility; more than a quarter of establishments where under-utilisation
occurred cited this reason (26 per cent) 27.
4.6 Reasons for under-utilisation
After employers had identified the occupations in which under-utilisation most commonly
occurred in their establishment, they were then asked why they felt that it occurred among
these staff. As shown in Figure 4.2, the most common cause of under-utilisation, as
perceived by the employer, was a lack of interest among staff to take on a higher level role
with more responsibility; more than a quarter of establishments where under-utilisation
occurred cited this reason (26 per cent) 28.
27 It is important to bear in mind throughout this section that all reasons provided are from the perspective of the employer. 28 It is important to bear in mind throughout this section that all reasons provided are from the perspective of the employer.

83
Figure 4.2 Reasons for under-utilisation (unprompted)
In similar vein, this was followed by the rationale that working hours were better suited to
the individual in question in the roles that the under-utilised staff were currently occupying
(15 per cent). This opens up the question as to whether – if employers redesigned job roles,
and/or adapted the conditions of employment in other ways – there could be opportunities
for them to better utilise the skills and qualifications that are already available to them within
their organisation.
Similar proportions of employers – around one in ten – felt under-utilisation occurred due
to either a lack of jobs in desired higher level roles or staff needing to gain experience in
their desired industry before progressing to such roles (11 per cent and 10 per cent,
respectively). These factors are arguably closely related, driven (or at least enhanced) by
a demand deficiency for the skills and/or qualifications held by these staff. This may be a
structural issue reflecting an over-supply of suitably skilled people looking for a particular
type of role; or it may be more transient in nature, reflecting a lag between people acquiring
skills and being able to utilise them, or receiving recognition for them (for example, through
promotion).
Key findings of how different types of under-utilisation relate to the different occupations
are shown in Table 4.1 (for full breakdown see Table A.4.2 in Annex A).
5%
10%
1%
3%
4%
4%
4%
7%
7%
8%
10%
11%
15%
26%
Don't know
Not particular reason / it just happened
They have more than one job
Qualifications / skills not relevant to job role
Family-run business
Actively seek staff with quals / skills beyond needs
Competition for higher level roles / struggling to get higher leveljob
Attractive conditions of employment
Temporary role / stop gap
They own the business / are a partner in the business
To gain experience / current role is lower level in same industryas desired higher level role
Lack of jobs in desired higher level role
Working hours suit them better
They are not interested in taking on higher level role
Base: All establishments with under-utilised staff (28,159)

84
Employers perceived a lack of interest from staff in taking on higher roles to be the main
reason for under-utilisation across the majority of occupations, and most prominently in
relation to Caring, Leisure and Other Services staff (33 per cent). Bucking this trend were
Administrative and Clerical staff, and Elementary staff; the former were most commonly
deemed to be occupying roles in which they are under-utilised due to more suitable working
hours (26 per cent), the latter because the role is temporary or a stop gap position (21 per
cent). Sales and Customer Services staff were also more likely to be reported as under-
utilised due to the temporary nature of their current role (20 per cent).

85
Table 4.1 Reasons for under-utilisation by occupation
Occupation Main reasons for under-utilisation (Other) Variations from the average
Managers 1. Not interested in taking on higher level role (27%) 2. They own the business / are a partner (16%) 3. The working hours suit them better (11%)
Professionals 1. Not interested in taking on higher level role (27%) 2. To gain experience / current role is lower level in
same industry as desired higher level role (14%) 3. The working hours suit them better (11%)
They own the business / are a partner (8%): significantly higher proportion than all other occupations bar Managers
Associate Professionals
1. Not interested in taking on higher level role (28%) 2. To gain experience / current role is lower level in
same industry as desired higher level role (13%) 3. Lack of jobs in desired higher level role (11%)
Administrative / Clerical staff
1. The working hours suit them better (26%) 2. Not interested in taking on higher level role (23%) 3. Lack of jobs in desired higher level role (12%)
Family run business most commonly reported for this occupation (6%)
Skilled Trades occupations
1. Not interested in taking on higher level role (28%) 2. The working hours suit them better (10%)
Family run business most commonly reported for this occupation (6%)
Caring, Leisure and Other Services
1. Not interested in taking on higher level role (33%) 2. The working hours suit them better (18%) 3. To gain experience / current role is lower level in
same industry as desired higher level role (18%)
Sales and Customer Services
1. Current role is temporary / stop gap (20%) 2. Not interested in taking on higher level role (20%) 3. Lack of jobs in desired higher level role (19%) 4. The working hours suit them better (19%)
Competition for higher levels roles most commonly reported for this occupation (7%)
Machine Operatives
1. Not interested in taking on higher level role (30%) 2. Lack of jobs in the desired higher level role (15%) 3. The working hours suit them better (14%)
Actively seeking staff with qualifications above those needed for role most commonly reported for this occupation (7%)
Elementary staff
1. Current role is temporary / stop gap (21%) 2. The working hours suit them better (19%) 3. Lack of jobs in desired higher level role (17%) 4. Not interested in taking on higher level role (17%)
They have more than one job most commonly reported for this occupation (3%)
86
4.7 Under-utilisation by country
Staff not being interested in taking on a higher level role with more responsibility was
considered the main reason for under-utilisation across all countries. The likelihood of citing
this rationale was significantly higher in Scotland, however (28 per cent compared to 26
per cent average). Under-utilisation due to the temporary nature of current job roles held
was also more common within Scotland compared to other countries (eight per cent
compared to seven, six and four per cent in England, Wales and Northern Ireland,
respectively).
Employers in Wales were the least likely to state that there was a lack of interest for higher
level roles (22 per cent compared to 26 per cent average), and were comparatively more
likely than all other countries to report under-utilisation due to competition for higher level
roles (five per cent compared to four per cent in other countries). Employers in Wales were
also more likely to comment on the more attractive conditions of employment (nine per
cent) and the family-run nature of businesses (seven per cent).
A lack of jobs in the desired higher level roles was considered a far greater issue and driver
of under-utilisation in Northern Ireland compared to other countries (21 per cent compared
to an average of 11 per cent). If we consider this to represent a demand deficiency (or over-
supply) for more advanced skills and qualifications, this may complement previously
outlined patterns found for key challenges such as skill-shortage vacancies and skills gaps,
where the proportions reported are consistently lowest in Northern Ireland. This is likely to
reflect the more limited employment market in Northern Ireland compared to the rest of the
UK, which restricts the opportunities available to people as they achieve the skills and
qualifications that might elsewhere lead them to move into new job roles.
At the other end of the spectrum, employers in England were significantly less likely than
all others to feel that under-utilisation was driven by a lack of availability among desired
higher level roles (10 per cent).
A full breakdown of perceived reasons for under-utilisation by country can be found in Table
A.4.3 in Annex A.

87
4.8 Under-utilisation by establishment size
In terms of establishment size, a lack of interest in higher level roles was considered to be
the main reason for under-utilisation by all except the largest employers (250+ employees;
18 per cent compared to 26 per cent on average).
These larger establishments were much more likely to see the challenge from the opposite
perspective, that there was a shortage of jobs in desired higher level roles; around a quarter
of employers with 100 or more employees attributed under-use of staff to this. The
likelihood of citing this as a reason for under-use of staff skills and qualifications decreased
steadily through the lower size bands, to just eight per cent for those with 2 to 4 employees.
Relatedly, larger establishments were also more likely to report competition for higher level
roles as a reason for under-utilisation (eight per cent for 100+ establishments compared to
four per cent average).
Taken together, this could indicate that some larger establishments are either unable or
unwilling to move employees up the chain, or to create an environment which allows for
progression for those who warrant it. From an individual perspective, therefore, the solution
is likely to lie in movements between organisations / employers, as opposed to within.
Smaller establishments, particularly those with 2 to 4 employees, were more likely than
others to report under-utilisation as being due to staff being the owners / partners in a
business (13 per cent), and the business being family run (six per cent). This is somewhat
unsurprising, given that micro-organisations are more likely to hold these organisational
characteristics.
A full breakdown of perceived reasons for under-utilisation by establishment size can be
found in Table A.4.4 in Annex A.
88
4.9 Under-utilisation by sector
A lack of interest in higher level roles was the most commonly perceived reason for under-
utilisation across all sectors, although it was most prominent in relation to staff in the Health
and Social Work (35 per cent), Arts, Entertainment, Recreation and Other Services (33 per
cent), Education (30 per cent), and Public Administration sectors (29 per cent). These are
all sectors in which the workforce tends to be more dominated by women29, adding
credence to the notion that it is predominantly women who make a decision to remain into
under-utilised roles due to gender imbalances in the management of family and childcare.
Key reasons and other variations by sector shown in Table 4.2 (a full breakdown is provided
in Table A.4.5 in Annex A).
29 ONS Annual Population Survey (from Nomis 2015) - Females account for 70 per cent of employment within the Public Administration, Education and Health sectors (SIC O-P) and 53 per cent of employment within Other Services (SIC R-U).

89
Table 4.2 Reasons for under-utilisation by sector
Occupation Main reasons for under-utilisation (Other) Variations from the average
Agriculture 1. Not interested in taking on higher level role (26%) 2. Family run business (21%) 3. The working hours suit them better (11%)
Least likely to have a lack of jobs in desired higher level roles (4%)
Manufacturing 1. Not interested in taking on higher level role (22%) 2. The working hours suit them better (13%) 3. Lack of jobs in desired higher level role (12%) 4. They own the business / are a partner (12%)
Electricity, Gas and Water
1. Not interested in taking on higher level role (22%) 2. Lack of jobs in the desired higher level roles
(14%) 3. They own the business / are a partner (12%)
Actively seeking over-qualified and –skilled staff is most common in this sector (10%)
Construction 1. Not interested in taking on higher level role (22%) 2. They own the business / are a partner (17%) 3. The working hours suit them better (12%)
Family run business more commonly reported than average in this sector (7%)
Wholesale and Retail
1. Not interested in taking on higher level role (24%) 2. The working hours suit them better (16%) 3. Lack of jobs in desired higher level role (14%)
Current role is temporary / stop gap more commonly reported than average in this occupation (10%)
Hotels and Restaurants
1. Not interested in taking on higher level role (22%) 2. The working hours suit them better (17%) 3. Current role is temporary / stop gap (17%)
Lack of jobs in desired higher level role more commonly reported than average (14%)
Transport, Storage and Comms
1. Not interested in taking on higher level role (24%) 2. The working hours suit them better (12%) 3. They own the business / are a partner (12%)
Financial Services
1. Not interested in taking on higher level role (21%) 2. The working hours suit them better (14%) 3. To gain experience / current role is lower level in
same industry as desired higher level role (13%)
Business Services
1. Not interested in taking on higher level role (24%) 2. The working hours suit them better (13%) 3. They own the business / are a partner (11%)
Public Administration
1. Not interested in taking on higher level role (29%) 2. The working hours suit them better (20%) 3. Lack of jobs in desired higher level role (20%)
Education 1. Not interested in taking on higher level role (30%) 2. The working hours suit them better (24%) 3. To gain experience / current role is lower level in
same industry as desired higher level role (18%)
Health and Social Work
1. Not interested in taking on higher level role (35%) 2. The working hours suit them better (16%) 3. To gain experience / current role is lower level in
same industry as desired higher level role (13%)
Arts and Other services
1. Not interested in taking on higher level role (33%) 2. The working hours suit them better (17%) 3. To gain experience / current role is lower level in
same industry as desired higher level role (11%)

90
Under-utilisation and other challenges
As shown in Figure 4.3, establishments with under-utilised staff are more likely than those
without to have skills gaps and to experience retention difficulties; they are also slightly
more likely to experience skill-shortage vacancies.
Figure 4.3 Relationships between under-utilisation and other challenges
For skills gaps, the difference is most marked where the perceived reason for under-
utilisation is a lack of jobs in desired higher level roles: employers that cite this reason are
far more likely to have skills gaps (16 per cent compared to 10 per cent who do not have
skills gaps). This highlights a possible inefficiency in the job market; employers that are
experiencing skills gaps could consider re-structuring to create positions were all staff and
skills are fully deployed.
The higher levels of retention difficulties among establishments with under-utilisation could
indicate that staff are leaving organisations where they feel they are not able to fully deploy
their skills.
7%
17%
11%
5%
13%
7%
SSVs Skills gaps Retention difficulties
Establishments with under-utilised staff Establishments without under-utilised staff
Base SSVs and Skills gaps: All establishments (91,210)Base retention difficulties: All establishments in Module 2 (45,818)

91
4.10 Conclusions
This chapter has analysed a set of questions which are new to the Employer Skills Survey
series and which describe a different order of skills challenge: that where employers report
that their employees have skills and qualifications that are in excess of those that they need
to perform in their job role.
Where this sort of misalignment occurs, it may speak to a need for employers to reorganise
how they offer work to their employees, particularly where they are more likely to also
experience skills gaps or staff retention problems.
In the next chapter we look at skills development, and employers’ practices in terms of
funding and arranging training to develop the skills of their workforce.

92
5 Training and workforce development
5.1 Chapter Summary
There was little change in the headline training measures between 2015 and the 2013
survey.
It remained the case that two-thirds of employers (66 per cent) had funded or arranged training or development for their staff over the previous 12 months, with around half
providing any off-the-job training (49 per cent) or on-the-job training (53 per cent). The
proportion of staff being trained in 2015 was also in line with 2013 (63 per cent compared
to 62 per cent) as was the average number of days training per trainee over the period (6.8
days, compared to 6.7 days in 2013). Similarly, the proportion of employers that had
provided any training intended to lead to nationally recognised qualifications remained
unchanged at 31 per cent.
There was, however, an increase in the volume of training, measured in terms of the total number of training days provided in the previous 12 months. This rose to 118m
days in 2015, compared to 113m in 2013 and 115m in 2011.
This increase in the volume of training largely reflected a combination of increased levels
of employment and increased recruitment activity.
While the proportion of the workforce receiving training and the average number of training
days they each received remained unchanged between 2013 and 2015, the size of the
workforce increased, meaning that there was a four per cent increase in the number of employees trained (from 16.8m to 17.4m).
The increase in training days may be related to increased recruitment activity, and a
consequent increase in induction training. The proportion of training employers that
provided any induction training rose considerably (from 58 per cent of employers that
trained in 2013 to 68 per cent in 2015), as did the proportion of training employers for whom
induction or health and safety training accounted for at least half their training (from 27 per
cent to 32 per cent).
Total employer expenditure on training increased by six per cent between 2013 and 2015, from £43.0bn to £45.4bn, more than reversing the decrease recorded between
2013 and 2011 (when the figure stood at £43.8bn). While total expenditure in 2015 was
greater, investment per person trained and per employee remained similar in 2015 to 2013
and 2011.

93
Use of online training or e-learning and of other self-learning was common among
training employers (45 per cent and 38 per cent respectively). These types of training were
also generally increasing, particularly online training and e-learning (39 per cent of those
using this method at all in the last two years reporting an increase over the last 12 months,
compared with 18 per cent using it less).
Close to a half of employers that trained (46 per cent) wanted to provide more training than
they had been able to do, with the main barriers being a lack of time and a lack of funds for
further training. These reasons suggest that for some businesses, there is a ‘ceiling’ to the
value they place on training, beyond which the training does not provide an adequate return
to their investment, or at least is not perceived to.
94
5.2 Introduction
Training staff in the workplace is widely recognised as a key means to improving skills and
productivity thereby maintaining and improving competitiveness and stimulating economic
growth30. In Chapter 3, we saw that increasing training activity was the most common
employer response to attempt to tackle skills gaps among their workforce. This chapter
examines trends in employer training activity since 2011, looking at:
• Which employers funded or arranged training and development for their employees.
• How many and which employees they provided training for.
• The types and amount of training provided.
• Employer expenditure on training31.
• Reasons for not providing training and barriers to providing more training.
Throughout the chapter the training or development provided by employers is discussed in
terms of:
• Off-the-job training or development: training undertaken away from the individual’s
immediate work position, whether on the employer’s premises or elsewhere.
• On-the-job training and development: activities that would be recognised as training
by staff, and not the sort of learning by experience which could take place all the time.
30 For example, the first line of the Government’s The Future of Apprenticeships in England: Implementation Plan (HM Treasury, 2013a) describes Apprenticeship training as ‘central to raising our nation’s skills and delivering strong returns for the economy’. 31 Results for this aspect of the research are derived from the Investment in Training follow-up study with a proportion of the ESS 2015 sample (see the accompanying Technical Report for details of the methodology).

95
5.3 Incidence of training and workforce development
Two-thirds of employers (66 per cent) had arranged or funded any type of training (whether
off- or on-the-job) for any of their staff in the previous 12 months. Similar proportions had
provided off-the-job (49 per cent) as on-the-job training (53 per cent). Just over a third had
provided both (35 per cent of all employers), as Figure 5.1 shows.
Around one in six employers (17 per cent) had provided only on-the-job training in the last
12 months. This was the same level as in 2013, though lower than in 2011 (19 per cent).
Generally, however, the incidence of training changed very little in the 2011 to 2015 period.
Figure 5.1 Training provision over the last 12 months
Employers in Scotland were the most likely to have provided any training in the previous
12 months (71 per cent, compared with a range of 62 to 66 per cent in the other nations).
While they were more likely to have provided either form of training than elsewhere in the
UK, the difference was particularly marked in the delivery of on-the-job training.
Although the pattern of incidence of training by nation had changed little from 2013 and
2011, the proportion of employers in Wales providing any off-the-job training in 2015
increased to half (49 per cent), compared to 47 per cent in 2013 and 2011.
53% 52%49%
58%
49%49% 48% 47%52%
49%
66% 66%62%
71%
63%
UK 2015England
2015NorthernIreland
2015Scotland
2015Wales
Train on-the-job Train off-the-job Train
Base : All establishments (unweighted)
(75,129) (4,019) (6,035) (6,027)(91,210)
17% 17% 15%20%
14%
Train on-the-job only

96
The likelihood of providing training increased with employer size. Among the smallest sites
employing 2-4 staff, half had provided any training (51 per cent). This increased to over
three-quarters (78 per cent) among those with 5 to 24 staff. Provision of any training was
almost universal in larger establishments (93 per cent among those with 25-99 staff and 96
per cent among those with 100 or more employees).
Just over half of employers that trained (54 per cent) arranged a combination of both off-
and on-the-job training in the last 12 months. Small establishments that trained were less
likely to offer both forms of training than larger employers, with around two-fifths among
those with 2-4 staff (42 per cent) doing so, rising to over four-fifths (83 per cent) among
those with 100 or more employees.
As in 2013 and 2011, employers in Education, Public Administration, and Health and Social
Work were the most likely to provide any training (93, 90 and 88 per cent respectively), and
those in Agriculture the least likely (50 per cent). Employers providing training in Wholesale
and Retail and in Hotels and Restaurants were more likely to provide only on-the-job
training (each 36 per cent, compared against 26 per cent among all training employers).
More data on the incidence of training, and how this varied by country, size and sector, and
between 2011 and 2015, can be found in Tables A.5.1 and A.5.2 in Annex A.
5.4 Number of staff trained
Employers had trained around 17.4m staff in the previous 12 months, a four per cent
increase from 2013 (16.8m). This figure was equivalent to nearly two-thirds of the
workforce32 (63 per cent), a similar level to 2013 (62 per cent) but higher than 2011 (55 per
cent).
Table 5.1 shows the number and proportion of staff trained by country and size for 2011,
2013 and 2015.
32 The figure involves an element of over counting in that employers are asked about the number of staff they trained over the last 12 months whether or not they still work at the site. Hence someone who was trained at a site in the last 12 months but who left to join another employer who provided that person with training would be counted twice (if both employers were interviewed for the survey).
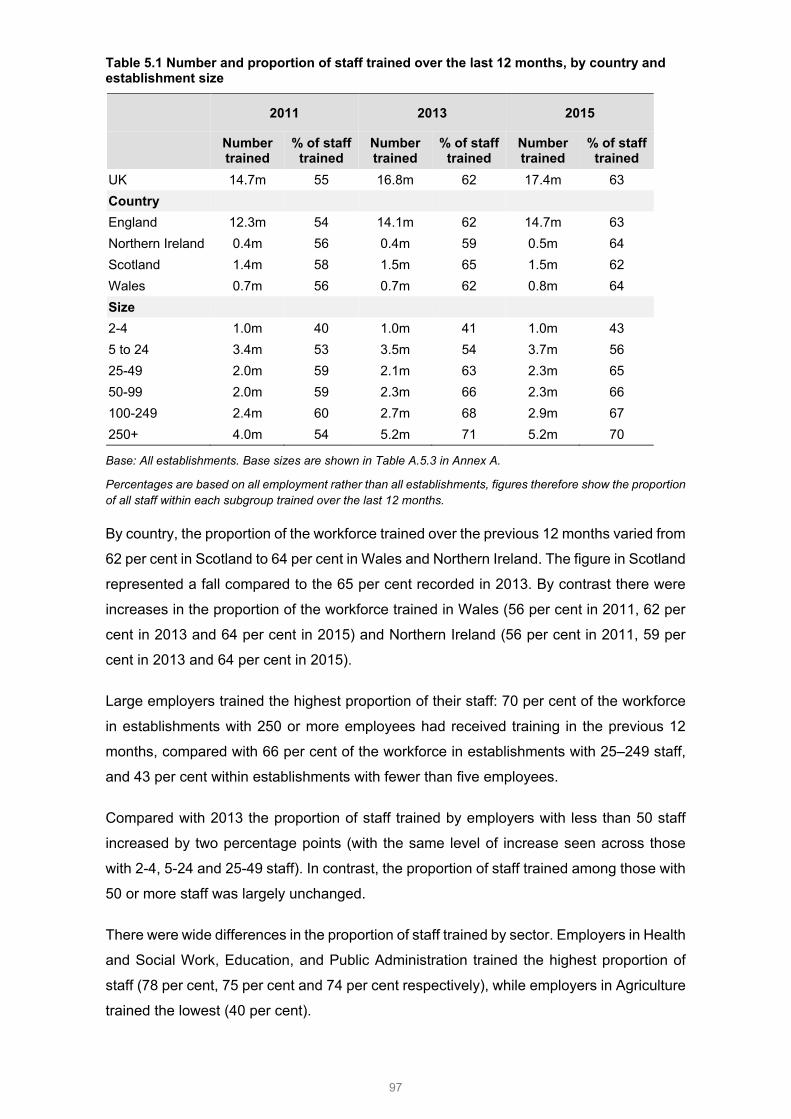
97
Table 5.1 Number and proportion of staff trained over the last 12 months, by country and establishment size
2011 2013 2015
Number trained
% of staff trained
Number trained
% of staff trained
Number trained
% of staff trained
UK 14.7m 55 16.8m 62 17.4m 63 Country England 12.3m 54 14.1m 62 14.7m 63 Northern Ireland 0.4m 56 0.4m 59 0.5m 64 Scotland 1.4m 58 1.5m 65 1.5m 62 Wales 0.7m 56 0.7m 62 0.8m 64 Size 2-4 1.0m 40 1.0m 41 1.0m 43 5 to 24 3.4m 53 3.5m 54 3.7m 56 25-49 2.0m 59 2.1m 63 2.3m 65 50-99 2.0m 59 2.3m 66 2.3m 66 100-249 2.4m 60 2.7m 68 2.9m 67 250+ 4.0m 54 5.2m 71 5.2m 70
Base: All establishments. Base sizes are shown in Table A.5.3 in Annex A.
Percentages are based on all employment rather than all establishments, figures therefore show the proportion of all staff within each subgroup trained over the last 12 months.
By country, the proportion of the workforce trained over the previous 12 months varied from
62 per cent in Scotland to 64 per cent in Wales and Northern Ireland. The figure in Scotland
represented a fall compared to the 65 per cent recorded in 2013. By contrast there were
increases in the proportion of the workforce trained in Wales (56 per cent in 2011, 62 per
cent in 2013 and 64 per cent in 2015) and Northern Ireland (56 per cent in 2011, 59 per
cent in 2013 and 64 per cent in 2015).
Large employers trained the highest proportion of their staff: 70 per cent of the workforce
in establishments with 250 or more employees had received training in the previous 12
months, compared with 66 per cent of the workforce in establishments with 25–249 staff,
and 43 per cent within establishments with fewer than five employees.
Compared with 2013 the proportion of staff trained by employers with less than 50 staff
increased by two percentage points (with the same level of increase seen across those
with 2-4, 5-24 and 25-49 staff). In contrast, the proportion of staff trained among those with
50 or more staff was largely unchanged.
There were wide differences in the proportion of staff trained by sector. Employers in Health
and Social Work, Education, and Public Administration trained the highest proportion of
staff (78 per cent, 75 per cent and 74 per cent respectively), while employers in Agriculture
trained the lowest (40 per cent).

98
The proportion of staff trained within each sector was broadly similar to 2013. The main
differences were a fall in the proportion trained within the Electricity, Gas and Water sector
(from 68 per cent in 2013 to 58 per cent in 2015), and increases in the proportion of the
workforce trained over the previous 12 months in Public Administration (from 67 per cent
to 74 per cent), Construction (from 48 per cent to 53 per cent) and Hotel and Restaurants
(from 59 per cent to 64 per cent).
Results for the number and proportion of staff trained by sector, in 2015, 2013 and 2011,
are provided in Table A.5.4 in Annex A.
By occupation, staff in Caring, Leisure and Other Services roles were the most likely to
have received training (80 per cent), followed by Professionals and Sales and Customer
Services staff (69 and 66 per cent respectively). Managers were least likely to have
received training in the previous 12 months (48 per cent).
Figure 5.2 Proportion of staff trained over the last 12 months by occupation (2011 – 2015)
Percentages are based on all employment rather than all establishments, figures therefore show the proportion of all staff trained in each subgroup.
Note: the figures for the proportion of staff trained have been calculated excluding those respondents unsure of the exact number of people trained and who did not know the number trained by occupation.
47%
65%
59%
47%
56%
73%
57%
48% 49%50%
70%65%
52%
60%
81%
63%
57% 55%
48%
69%
62%
52%
58%
80%
66%
54%56%
0%
10%
20%
30%
40%
50%
60%
70%
80%
90%
100%
Managers Professionals Assoc.Professionals
Admin /clerical
SkilledTrades
Caring,Leisure,Other
services
Sales &Customer
service
Machineoperatives
Elementary
2011 2013 2015
Base : All establishments with staff in each occupation (excluding establishments where the numbers of staff trained is unknown)Note: See Table A.5.5 in Annex A for 2011 and 2013 base sizes
(87,167) (17,182) (13,161) (53,314) (23,798) (15,074) (25,674) (13,954) (31,695)

99
5.5 Training days
The number of days training provided per employee over the previous 12 months varied
widely between employers. One in nine (11 per cent) funded or arranged an average of
one day or less per member of staff trained, while eight per cent provided an average of 20
days or more per member of staff trained.
Overall, across the UK as a whole, each person trained over the previous 12 months
received on average 6.8 days of training, very similar to 2013 (6.7 days) but lower than in
2011 (7.8 days), when a lower number and proportion of staff were trained. The number of
training days per person trained was lowest in Northern Ireland (5.6 days per annum) and
highest in Wales (7.2 days), with England and Scotland close to the UK average (6.8 days
and 6.7 days respectively).
It continued to be the case that larger establishments offered fewer days training per person
trained. The average number of training days per person trained falls from 10.1 amongst
those with fewer than five employees and 8.5 days among those with 5-24 staff, to less
than 5 days amongst those with 250 or more employees.
Table 5.2 summarises results in 2011, 2013 and 2015 on training days by country and size.
Table 5.2 Total training and development days, and days per person trained and per employee by country and establishment size (2011 - 2015)
2011 2013 2015
Total
training days
Days per
person trained
Days per employee
Total training
days
Days per
person trained
Days per employee
Total training
days
Days per
person trained
Days per employee
UK 115m 7.8 4.2 113m 6.7 4.2 118m 6.8 4.2 Country England 97m 7.9 4.3 95m 6.7 4.2 100m 6.8 4.3 Northern Ireland 3m 6.3 3.5 3m 6.3 3.7 3m 5.6 3.6
Scotland 10m 7.3 4.2 10m 6.7 4.3 10m 6.7 4.2 Wales 5m 7.5 4.2 6m 7.7 4.8 5m 7.2 4.6 Size 2-4 10m 10.5 4.2 11m 10.7 4.4 10m 10.1 4.3 5-24 30m 9.0 4.7 29m 8.3 4.5 32m 8.5 4.7 25-49 17m 8.4 4.9 15m 7.3 4.6 17m 7.7 5.0 50-99 16m 8.1 4.8 15m 6.7 4.4 17m 7.5 5.0 100-249 16m 6.6 4.0 17m 6.3 4.3 16m 5.6 3.8 250+ 25m 6.4 3.4 26m 5.0 3.5 25m 4.8 3.4
Base: All establishments that train (though ‘days per employee’ is based upon employment across all establishments). Base sizes are shown in Table A.5.6 in Annex A.

100
In 2015 there was an increase in the total number of training days provided in the UK over
the previous 12 months (118m, up from 113m in 2013). This was largely driven by an
increase in the number of training days reported by employers in England. Table A.5.7 in
Annex A provides detailed findings on the training days provided by country, size and
sector of employer.
Across the whole workforce, the total number of days training provided in the previous 12
months was equivalent to 4.2 days training per employee, the same figure as in 2013 and
2011. The figure was highest for employees in establishments with 25-99 staff (5.0 days
per employee) and lowest for those in establishments with 100 or more employees (3.5
days). Mid-size employers with 25-99 staff appeared to be particularly important for
developing the skills of the UK’s workforce: although they employed 25 per cent of the
workforce, mid-sized employers accounted for 29 per cent of the total training days
provided by employers to staff.
Some of the sector level trends seen in 2013 continued in 2015. The number of days
training provided to each person trained continued to be highest in the Hotels and
Restaurants sector (an average of 10.5 days). This, alongside the aforementioned increase
in the proportion of staff trained in the sector, led to an increase in total training days
provided by the sector from 10 million to 13 million.
In Public Administration, while the proportion of the workforce trained increased (from 61
per cent in 2011 and 67 per cent in 2013 to 74 per cent in 2015), the average number of
days training provided per person trained continued to fall sharply (from 9.9 days in 2011
to 7.7 days in 2013 to 5.2 days in 2015). Coupled with falling employment in the sector this
meant the total number of training days provided in this sector also continued to fall (from
9m in 2011 and 7m in 2013 to 5m in 2015). Conversely, in Health and Social Work the total
number of training days provided continued to increase (18m in 2011, 19m in 2013 and
21m in 2015).
Results by sector for the total number of training and development days, and days per
person trained and per employee for 2015, 2013 and 2011 can be found in Table A.5.8 in
Annex A.

101
5.6 Types of training provided
The most common type of training provided was job-specific, aimed at developing the skills
of a particular occupation or job role (provided by 85 per cent of employers that trained). A
majority of training employers had also funded or arranged health and safety / first aid
training (75 per cent) and basic induction training for new staff (66 per cent). Results are
shown in Figure 5.3.
Figure 5.3 Types of training provided over the last 12 months by employers that train (prompted)
The proportion of training employers delivering each type of training was similar to 2013,
though there were small increases (of two percentage points in each case) in the
proportions providing management training (37 per cent) and supervisory training (36 per
cent).
While asked as a single item in 2013, in 2015 ‘induction training’ was split into ‘basic
induction training’ and ‘more extensive induction training’; therefore, caution should be
used when comparing the results with previous years. However, there was an increase in
any induction training (68 per cent, up from 58 per cent in 2013). Many more employers
had provided basic than more extensive induction training (66 and 37 per cent of training
employers respectively).
36%
37%
37%
49%
66%
75%
85%
Supervisory training
Management training
More extensive induction
Training in new technology
Basic induction
Health and safety / first aid training
Job specific training
Base : All establishments that train (2015: 69,541)
Any induction training:
68%

102
The increase in induction training is likely to reflect the substantial increase in recruitment
activity reported in Chapter 2. Among employers that provided training and had recruited
within the last 12 months, the majority (88 per cent) had provided some form of induction
training, compared with a third (34 per cent) of training employers that had not recruited33.
Induction training and health and safety / first aid training is often undertaken because it is
a legislative requirement (rather than to develop the skills of the workforce). The UK
Employer Skills Survey series has therefore asked employers what proportion of their
training over the previous 12 months involved these types of training.
For a third of employers that trained (32 per cent), induction or health and safety training
accounted for at least half of their training. This was an increase on 2013 (27 per cent) and
2011 (29 per cent). Similarly, the proportion of employers saying all their training in the last
12 months was induction or health and safety training increased (from seven per cent in
2011, to nine per cent in 2013 to 11 per cent in 2015).
Employers in Northern Ireland were more likely than elsewhere in the UK to say induction
or health and safety training accounted for all their training (18 per cent) or at least half of
their training (39 per cent).
By sector, training employers in Hotels and Restaurants and in Construction were the most
likely to say all their training in the last 12 months had been induction or health and safety
training (each 17 per cent).
A detailed breakdown of the proportion of training that was health and safety or induction
in 2015 by country, and at UK level for 2011 and 2013, is provided in Table A.5.9 in Annex
A.
Among employers that trained, larger employers (with 25 or more employees) were more
likely to have provided each of the types of training listed in Figure 5.3 in the previous 12
months, with this particularly the case for basic induction, management and supervisory
training (92, 66 and 62 per cent respectively; among those with fewer than five staff the
comparative figures were 46, 24 and 24 per cent).
Management training was most common among Education employers that trained (58 per
cent), while supervisory training was particularly common among training employers in
Hotels and Restaurants (51 per cent); Agriculture employers that provided training were
the least likely to offer each of these types of training (14 per cent and 16 per cent
respectively).
33 Induction training provided by employers that had not recruited in the previous 12 months may cover induction training for those recruited more than 12 months ago, or for internal transfers or promotions.

103
Over three-fifths of training employers within Transport and Communications (65 per cent)
and Public Administration (61 per cent) had provided training in new technology. Those in
the Hotels and Restaurants sector were least likely to have provided this type of training
(34 per cent).
More details of types of training provided by sector, as well as by country and establishment
size, are provided in Table A.5.10 in Annex A.
5.7 Training to qualifications
In addition to measuring the quantity and specific type of training provided, the survey also
sought to provide other means of assessing its quality, namely by examining the extent to
which training was designed to lead to nationally recognised qualifications.
Just under half of employers that trained over the last 12 months had funded or arranged
any training that was intended to lead to a nationally recognised qualification (47 per cent,
equivalent to 31 per cent of all employers). More than half (57 per cent) of those training to
nationally recognised qualifications had done so to level 3 or above (equivalent to 27 per
cent of establishments that had trained, and 18 per cent of all employers). This mirrors
findings from 2013, as shown in Table 5.3.
Employers reported that 3.5m staff were trained towards a nationally recognised
qualification over the previous 12 months. Again this was broadly similar to the numbers in
2013 (3.6m) and 2011 (3.3m). This means that a fifth (20 per cent) of staff who were trained
in the previous 12 months had received training that was intended to lead to a nationally
recognised qualification, slightly lower than in 2011 (22 per cent) and 2013 (21 per cent).
This was equivalent to 12 per cent of all employees being trained to a nationally recognised
qualification over the previous 12 months.

104
Table 5.3 Training to nationally recognised qualifications over the previous 12 months
2011 2013 2015 2015
All employers: Employers that train:
UK UK UK UK England Northern Ireland Scotland Wales
% % % % % % % % Trained any staff to a qualification 30 31 31 47 47 43 44 54
Trained any to: Level 1
6 6 6 9 8 6 10 12
Level 2 10 11 11 17 18 12 11 20 Level 3 11 12 12 18 18 14 13 20 Level 4 or above 8 10 9 14 14 16 13 18 Number trained to a qualification 3.3m 3.6m 3.5m 3.5m 3.0m 0.1m 0.3m 0.2m
Of staff trained, the % trained to a qualification over the last 12 months
22 21 20 20 20 15 18 21
Of all employees, % trained to a qualification over the last 12 months
12 13 12 12 13 10 11 13
Base: Columns 1-3 ‘All establishments’, columns 4 to 8 ‘Establishments that train’; Base sizes are shown in Tables A.5.3 and A.5.6 in Annex A.
Note: the row ‘number trained to a qualification’ shows how many individuals were undertaking training leading to nationally recognised qualifications in the 12 months prior to interview, not how many staff had achieved these qualifications.
Note also in the final row the base for the number of employees is all employers not just employers that train.
In line with 2013 and 2011, the proportion of employers training to nationally recognised
qualifications was below the UK average in Northern Ireland and Scotland, and above
average in Wales.
In the previous 12 months, 13 per cent of all employees in Wales and 10 per cent of all
employees in Northern Ireland had been trained to a nationally recognised qualification (the
lowest of the four nations). While this proportion was unchanged in Northern Ireland since
2013, the proportion trained to a nationally recognised qualification in Wales in the last 12
months was five percentage points lower.
Table A.5.11 in Annex A details the incidence and extent of provision of training leading to
qualifications by size and sector. This shows that the proportion of employees trained to a
qualification was highest in mid-size establishments with between five and 99 employees,
with a peak in the 25-49 group. While employers with 5-99 staff employed just under half
(49 per cent) of the total UK workforce, they employed more than half (56 per cent) of all
UK workers who were trained to a qualification in the previous 12 months.

105
Employers in sectors that trained the most were also the most likely to have offered training
leading to a qualification: Health and Social Work (65 per cent), Education (65 per cent)
and Public Administration (62 per cent). Health and Social Work employers also offered
training leading to a qualification to a higher proportion of their workforce than in any other
sector (23 per cent). Education employers on the other hand were below the UK average
in terms of the proportion of their workforce offered training leading to a qualification (10
per cent, compared to the UK average of 12 per cent).
5.8 Online / e-learning and other self-learning
The 2013 study reported reduced employer expenditure on training compared with 2011.
This and other findings supported theories, suggested for example in ‘Training in
Recession: The impact of the 2008-2009 recession on training at work’ (Felstead et al.,
2013), that the recession had led to employers ‘training smarter’ with increased emphasis
on in-house training, training employees to train others, reduced use of external providers
and enhanced use of e-learning.
To explore this issue, new questions were added in 2015 asking employers if they had
arranged or funded any training in the last 12 months using either online training or e-
learning, or any other self-learning where the employee does the learning at a time of their
own choosing. They were also asked if their use of these training approaches over the last
12 months had increased or decreased compared with the 12 months before that.
Just under half (45 per cent) of employers that provided training had used online training
or e-learning in the previous 12 months34. Use of this type of training was less common in
Wales (43 per cent) and particularly low in Northern Ireland (34 per cent), as Table 5.4
shows.
Likelihood of providing online training or e-learning increased with size, rising from a third
of training establishments with 2 to 4 employees (35 per cent) to over three-quarters of
establishments with 250 or more employees (78 per cent).
34 This might include training that is completely online, or that had a significant online element

106
Table 5.4 Provision of online training or e-learning over the past 12 months by country and establishment size
Unwtd Base
Used online training in last 12 months
Unwtd Base
Online training increased
Online training decreased
% % % UK 69,541 45 39,695 39 18 Country England 57,422 45 33,257 39 18 Northern Ireland 2,869 34 1,268 38 22 Scotland 4,894 44 2,805 40 17 Wales 4,356 43 2,365 40 19 Size 2-4 10,317 35 4,212 35 22 5 to 24 39,461 47 21,708 40 17 25-49 10,742 61 7,195 43 13 50-99 5,547 62 3,892 41 14 100-249 2,584 70 1,965 42 12 250+ 890 78 723 44 9
Base: All establishments that provided training / all establishments that have provided any online training or e-learning in the last two years
On balance, the use of online training or e-learning appears to have been increasing over
the last two years. Two-fifths (39 per cent) indicated its use had increased in the previous
12 months compared with the 12 months before that, compared with just under one-fifth
(18 per cent) that reported using less online training or e-learning.
The smallest establishments with 2 to 4 employees that had offered online training were
the most likely to say its use had decreased (22 per cent, exactly twice the level found
among those with 100 or more employees).
Use of online or e-learning varied widely by sector, and was particularly high in Financial
Services, Public Administration, Education and Health and Social Work. Employers that
had offered online training within the last two years were most likely to say its recent use
had increased if they worked in Public Administration (44 per cent), Wholesale and Retail
(43 per cent), Manufacturing (42 per cent) and Health and Social Work (42 per cent). Figure
5.4 shows results by sector.

107
Figure 5.4 Use of online training and e-learning, and changes in use, by sector
Nearly two-fifths (38 per cent) of employers that trained in the previous 12 months said they
had provided other self-learning (i.e. besides online or e-learning) where the employee did
the training at a time of their own choosing35.
Provision of self-learning varied little by country as shown in Table 5.5 overleaf.
Larger training employers were more likely to have offered other self-learning: nearly two-
thirds (62 per cent) of those with 100 or more employees had done so, compared with just
under a third (32 per cent) of those with 2 to 4 employees.
35 The questionnaire did not specify whether this time was within or outside of the employee’s contracted work hours
18%
12%
16%
15%
24%
15%
22%
17%
19%
24%
23%
11%
19%
37%
39%
44%
43%
42%
42%
40%
41%
38%
37%
37%
37%
36%
36%
28%
All
Public Admin.
Wholesale and Retail
Health and Social Work
Manufacturing
Hotels and Restaurants
Arts and Other Services
Education
Business Services
Electricity, Gas and Water
Construction
Financial Services
Transport, Storage and Comms
Agriculture
Decrease Increase
Base : All establishments that delivered training in last 12 months; all establishments that delivered online training within the last two yearsNote: See Table A.5.12 in Annex A for base sizes by sector. Chart is ordered by level of increase in descending order.
67%
41%
62%
71%
49%
65%
29%
35%
48%
43%
35%
30%
14%
45%
% offering online training in last 12 months

108
Table 5.5 Provision of other self-learning over the previous 12 months by country and establishment size
Unwtd Base
Used other self-learning in last 12
months Unwtd Base
Other self-learning
increased
Other self-learning
decreased % % %
UK 69,541 38 35,783 29 23 Country England 57,422 39 29,864 30 23 Northern Ireland 2,869 35 1,324 24 27 Scotland 4,894 36 2,449 29 25 Wales 4,356 37 2,146 30 24 Size 2-4 10,317 32 4,127 28 26 5 to 24 39,461 39 19,022 29 23 25-49 10,742 51 6,458 34 20 50-99 5,547 56 3,660 32 19 100-249 2,584 60 1,836 31 19 250+ 890 65 680 29 18
Base: All establishments that provided training / all establishments that have provided any other (non-online training or e-learning) self-learning in the last two years
Following a similar pattern to online training, training employers in Public Administration,
Education, Health and Social Work (each 55 per cent) and Financial Services (54 per cent)
were the most likely to have provided other self-learning for their employees. Employers in
Agriculture were the least likely to have provided other self-learning (20 per cent), and self-
learning was less common among employers that trained in the Manufacturing, Electricity,
Gas and Water, and Construction sectors (24, 27, and 25 per cent respectively).
Among employers that had offered any other self-learning in the past two years, slightly
more (29 per cent) said its use had increased in the last 12 months than said its use had
decreased (23 per cent). Use of other self-learning was most likely to have increased
among employers with 25 staff or more (33 per cent, though still 19 per cent of employers
of this size said its use had decreased).
More than half (57 per cent) of all employers that trained had provided either online training
/ e-learning or other self-learning where the employee did the learning at a time of their
own choosing. Patterns by nation, size and sector mirrored those seen among employers
providing each of the individual training types.
Table A.5.12 in Annex A provides a detailed breakdown of figures on provision of online
training or e-learning and other self-learning by country, size and sector.

109
5.9 Investment in Training
Employer expenditure on training and development over the previous 12 months was
£45.4bn. As well as such elements as fees to external providers and expenditure on
equipment or materials (which comprised a relatively small proportion of overall employer
investment in training), a substantial proportion of this expenditure covered the wages of
staff while being trained, and of staff delivering training. (How total training expenditure
breaks down into the constituent parts is examined in Table 5.7 later in this chapter.)
The 2015 spend of £45.4bn was a six per cent increase on the £43.0bn spend in 2013, and
a four per cent increase on the 2011 figure of £43.8bn36.
Employers’ total investment in training was equivalent to around £2,610 per person trained
and £1,640 per employee. Although a slight increase on 2013, these figures were in line
with 2011 (see Table 5.6). This is due to the fact that, although overall spend in 2015 was
higher than in 2011, the numbers in employment and the number trained also both
increased, as discussed earlier.
36 It is worth noting that here, and throughout this chapter, training expenditure figures for 2011 and 2013 have not been adjusted for inflation. Additionally, In 2015 a new weighting strategy was implemented to further increase the accuracy of the training spend estimates; this new weighting strategy has also been retrospectively applied to both the 2011 and 2013 data files, meaning some of the figures reported here for 2011 and 2013 may differ slightly from the original reports. A full explanation of the new weighting strategy, the rationale behind it, as well as revised figures for training spend by country, are presented in a separate publication.

110
Table 5.6 Total training expenditure and spend per person trained and per employee (2011 to 2015)
2011 2013 2015
Tota
l
Spen
d pe
r pe
rson
trai
ned
Spen
d pe
r em
ploy
ee
Tota
l
Spen
d pe
r pe
rson
trai
ned
Spen
d pe
r em
ploy
ee
Tota
l
Spen
d pe
r pe
rson
trai
ned
Spen
d pe
r em
ploy
ee
£ £ £ £ £ £ £ £ £ UK 43.8bn 3.0k 1.6k 43.0bn 2.6k 1.6k 45.4bn 2.6k 1.6 Size 2-4 5.5bn 5.7k 2.3k 5.6bn 5.7k 2.3k 5.9bn 5.8k 2.5k 5-24 12.0bn 3.6k 1.9k 12.7bn 3.6k 2.0k 14.1bn 3.8k 2.1k 25-49 6.1bn 3.1k 1.8k 6.4bn 3.0k 1.9k 6.3bn 2.8k 1.8k 50-99 5.5bn 2.7k 1.6k 5.5bn 2.5k 1.6k 6.5bn 2.8k 1.9k 100+ 14.7bn 2.3k 1.3k 12.7bn 1.6k 1.1k 12.7bn 1.6k 1.1k Sector Agriculture 1.1bn 7.8k 3.0k 0.4bn 2.7k 1.1k 0.6bn 3.6k 1.4k Manufacturing 3.4bn 3.0k 1.4k 2.6bn 2.2k 1.1k 3.2bn 2.6k 1.3k Electricity, Gas & Water 0.3bn 1.9k 1.0k 0.3bn 1.5k 1.0k 0.7bn 4.0k 2.3k
Construction 2.5bn 3.6k 1.8k 2.4bn 4.1k 2.0k 2.5bn 4.1k 2.2k Wholesale & Retail 5.1bn 2.2k 1.2k 6.5bn 2.6k 1.5k 5.1bn 2.1k 1.1k
Hotels & Restaurants 3.0bn 3.2k 1.7k 2.7bn 2.5k 1.5k 3.3bn 2.7k 1.7k
Transport and Comms 3.1bn 3.3k 1.5k 3.3bn 2.8k 1.5k 3.4bn 2.7k 1.5k
Financial Services 1.5bn 2.4k 1.4k 1.3bn 1.9k 1.3k 1.6bn 2.3k 1.7k Business Services 8.3bn 3.7k 1.9k 8.5bn 3.2k 1.9k 9.8bn 3.4k 2.1k Public Admin. 3.1bn 3.3k 2.0k 2.1bn 2.2k 1.5k 1.9bn 2.0k 1.4k Education 4.9bn 3.0k 1.9k 5.4bn 2.8k 2.1k 4.6bn 2.3k 1.7k Health & Social Work 5.2bn 2.3k 1.5k 5.1bn 1.8k 1.4k 6.1bn 2.1k 1.6k
Arts and other services 2.3bn 3.4k 1.9k 2.3bn 3.0k 1.9k 2.6bn 3.4k 2.1k
Base: Establishments completing the Investment in Training study (UK 2011: 11,027; 2013: 12,522; 2015: 12,614). Base sizes for size and sector can be found in Table A.5.13 in Annex A.
As in 2011 and 2013, training spend per person trained and per employee decreased with
employer size, with smaller employers reporting higher spends. While the smallest
employers with 2 to 4 staff provided approximately twice as many training days per person
trained as those with 100 or more employees (10.1 days per annum compared with 5.1
days), they spent more than three and a half times as much per person trained per annum
(£5,810 per person trained, compared with £1,570 among employers with 100 or more
staff). This pattern is likely to reflect economies of scale for larger employers.

111
As shown in Table 5.6 the increase in total employer training expenditure from 2013 to
2015 was mainly a result of increases in expenditure among those with 5 to 24 staff, and
those with 50-99 staff. In both cases expenditure was also higher than in 2011. Among the
largest employers with 100 or more staff, overall training spend as well as spend per trainee
and per employee remained at 2013 levels, below the levels reported in 2011.
Although overall training expenditure changed little from 2013 to 2015, there were quite
considerable changes within certain sectors. As shown in Table 5.6 there have been quite
large increases in total training expenditure within:
• Electricity, Gas and Water sector (expenditure in 2015 was more than double the
2013 level).
• Agriculture (an increase of 35 per cent).
• Hotels and Restaurants (a 25 per cent increase since 2013).
• Financial Services (a 24 per cent increase).
• Health and Social Work (a 19 per cent increase).
• Business Services (a 15 per cent increase).
Decreases in total training expenditure from 2013 to 2015 occurred within the following
sectors:
• Wholesale and Retail (21 per cent fall, in contrast to the increase between 2011 and
2013).
• Education (16 per cent fall, continuing the trend from 2013).
• Public Administration (nine per cent fall, continuing the trend from 2013).
As shown in Table 5.7, the overall composition of training expenditure remained similar to
2013, with an even split between spend on off-the-job training versus on-the-job training.
The increase in total training expenditure was predominantly the result of higher
expenditure on off-the-job training (from £21.3bn in 2013 to £22.9bn in 2015), and
particularly spend on training management37 (from £6.5bn in 2013 to £7.7bn in 2015). Fees
to external providers for off-the-job training were slightly down, from £2.4bn in 2013 to
£2.2bn.
37 This involves the internal cost of providing, administering or making policy decisions about training off-the-job training.

112
There was also an increase in spend on on-the-job training (from £21.7bn in 2013 to
£22.6bn in 2015), driven entirely by an increase in labour costs of those providing the
training (from £7.7bn in 2013 to £8.7bn in 2015).
Table 5.7 Total training expenditure broken down by individual components (2011 to 2015)
2011 2013 2015 Unweighted Base: 11,027 12,522 12,614
£bn % £bn % £bn % Total training expenditure £43.8bn 100 £43.0bn 100 £45.4bn 100 Off-the-job training: total £21.1bn 48 £21.3bn 50 £22.9bn 50 Off-the-job training: Course-related: total £17.6bn 40 £17.9bn 42 £19.7bn 43
Trainee labour costs £4.7bn 11 £5.2bn 12 £5.4bn 12 Fees to external providers £2.7bn 6 £2.4bn 6 £2.2bn 5 On-site training centre £2.9bn 7 £2.7bn 6 £3.0bn 7 Off-site training centre (in the same company) £0.6bn 1 £0.5bn 1 £0.7bn 2
Training management £6.1bn 14 £6.5bn 15 £7.7bn 17 Non-training centre equipment and materials £0.4bn 1 £0.4bn 1 £0.4bn 1
Travel and subsistence £0.4bn 1 £0.4bn 1 £0.4bn 1 Levies minus grants -£0.3bn -1 -£0.2bn -* £-0.2bn -* Off-the-job training: other (seminars, workshops etc.): total
£3.5bn 8 £3.4bn 8 £3.2bn 7
Trainee labour costs £2.5bn 6 £2.5bn 6 £2.3bn 5 Fees to external providers £1.0bn 2 £0.9bn 2 £0.8bn 2 On-the-job training: Total £22.7bn 52 £21.7bn 50 £22.6bn 50 Trainee labour costs £14.2bn 32 £14.0bn 33 £13.9bn 31 Trainers' labour costs £8.6bn 20 £7.7bn 18 £8.7bn 19 Base: Establishments completing the Investment in Training study
The wages of staff being trained (trainee labour costs) accounted for half (48 per cent) of
all training expenditure (similar to the 50 per cent in 2013 and 49 per cent in 2011). The
wages / salaries of those providing on-the-job training also accounted for around a fifth (19
per cent) of total training expenditure, in line with 2013 (18 per cent). In comparison
relatively little was spent on payments to external training providers (seven per cent of total
investment in training, similar to the eight per cent in both 2013 and 2011).
Table 5.8 summarises results on the breakdown of training expenditure by size and sector
of establishment.

113
Table 5.8: Training expenditure by size and sector, the proportion spent on off-the-job elements, and the breakdown of total training expenditure (both on-the-job and off-the-job) by key elements
Row percentages Unwtd Base
Expenditure on training
% spent on off-the-job
training
Wages of trainees
Wages of
trainers
Fees to external
providers Other
UK 12,614 £45.4bn 50 % 48 19 7 27 Size 2-4 1,963 £5.9bn 60 % 35 19 9 38 5-24 7,661 £14.1bn 52 % 44 19 7 29 25-49 1,779 £6.3bn 50 % 48 19 7 25 50-99 782 £6.5bn 46 % 54 19 5 21 100+ 429 £12.7bn 47 % 54 19 6 22 Sector Agriculture 260 £0.6bn 65 % 46 17 10 27 Manufacturing 972 £3.2bn 48 % 54 18 7 21 Electricity, Gas & Water 168 £0.7bn 64 % 50 8 6 36
Construction 826 £2.5bn 54 % 40 23 10 27 Wholesale & Retail 1,813 £5.1bn 45 % 45 23 7 26 Hotels & Restaurants 1,273 £3.3bn 36 % 55 21 3 20 Transport and Comms 1,135 £3.4bn 47 % 45 23 6 26 Financial Services 344 £1.6bn 40 % 48 27 4 21 Business Services 2,073 £9.8bn 51 % 46 20 10 24
Public Admin 176 £1.9bn 49 % 52 17 6 25 Education 678 £4.6bn 58 % 44 15 5 36 Health & Social Work 1,790 £6.1bn 53 % 54 14 5 27 Arts and Other Services 1,106 £2.6bn 60 % 43 16 5 36
Base: Establishments completing the Investment in Training study.
The column ‘other’ includes such items as expenditure on training centres and on training management.
As the size of establishment increased the proportion of total training expenditure spent on
off-the-job training decreased, while the proportion of spend on the wages/salaries of
people being trained increased.
The proportion of training expenditure spent on off-the-job training also varied widely by
sector, as follows:
• It was higher than average in Agriculture (65 per cent), Electricity, Gas and Water (64
per cent), Arts, Entertainment, Recreation and Other Service activities (60 per cent),
Education (58 per cent), Construction (54 per cent), and Health and Social Work (53
per cent).

114
• It was much lower than average in Hotels and Restaurants (36 per cent), Financial
Services (40 per cent) and Wholesale and Retail (45 per cent).
There was also wide variation by sector in the proportion of total training expenditure
accounted for by the wages/salaries of people being trained. This was highest in Hotels
and Restaurants (55 per cent), Health and Social Work (54 per cent) and Manufacturing
(54 per cent), and lowest in Construction (40 per cent) and Arts, Entertainment, Recreation
and Other Service activities (43 per cent).
The proportion of total training expenditure spent on fees to external training providers
varied relatively little by establishment size and sector, although it accounted for a slightly
larger proportion among smaller employers (see Table 5.8).
Around £0.5bn was spent by employers in the previous 12 months on fees to FE colleges
and HEIs, equivalent to 15 per cent of total fees to external providers. This represents a
slight increase from 2013 in terms of both total expenditure and the proportion of fees to
external providers this accounts for (in 2013 employers spent £0.4bn with FE colleges and
HEIs, equivalent to 13 per cent of total fees to external providers). As in 2013, results
differed relatively little by size. By sector, a higher than average proportion of fees to
external providers was spent on FE colleges and HEIs by employers in Education (19 per
cent), Health and Social Work (19 per cent), Agriculture (18 per cent), and Business
Services (17 per cent).
Details of fees paid to FE colleges or to Universities or other Higher Education institutions
for training is shown in Table A.5.14 in Annex A.

115
5.10 Barriers and limits on training
Approaching half of employers that had trained over the last 12 months would have liked
to provide more training than they did (46 per cent, similar to the 47 per cent in 2013). This
was higher among employers in Scotland and Wales (50 and 49 per cent respectively).
Larger training employers were more likely to have wanted to provide more training than
they were able (58 per cent of those with 100 or more staff, compared with 43 per cent of
those with fewer than five staff). This was the same pattern as in 2013.
As shown in Figure 5.5, the two most common reasons given by training employers for
being unable to deliver their desired amount of training were:
• Not having the funds to do so (52 per cent, higher at 60 per cent among those in
Northern Ireland). This was also the main reason in 2013 though more mentioned it
then (60 per cent).
• Not being able to spare the time for staff to spend more time training (49 per cent,
rising to 54 per cent among those in Scotland).
Figure 5.5 Barriers to providing more training
More data on the proportion of training employers that would have liked to provide more
training over the previous 12 months, and the main barriers preventing them doing so, can
be found in Table A.5.15 in Annex A.
1%
1%
1%
1%
2%
2%
2%
2%
4%
4%
5%
14%
49%
52%
Other
Training not a management priority
Staff turnover
Decisions taken at head office
Lack of knowledge about training opportunities
Lack of provision (e.g. courses full)
Lack of good local training providers
Staff now fully proficient
Staff not keen
Difficulty finding flexible training providers
A lack of appropriate training / qualifications
Hard to find time to organise training
Unable to spare more staff time
Lack of funds for training
Base : All establishments who would have provided more training in the past 12 months if they could UK (2015: 33,281)

116
Some employers chose not to provide any training or development for their staff in the
previous 12 months. Figure 5.6 presents the reasons given by employers for not training
over the previous 12 months.
Figure 5.6 Reasons for not providing training in the previous 12 months
By far the most common reason for employers not providing any training was feeling that
they did not need to because all their staff were fully proficient (68 per cent). This reason
was particularly common amongst small non-training employers (71 per cent of
establishments with fewer than five staff) and employers in the Construction, Agriculture,
Manufacturing, and Electricity, Gas and Water sectors (around three-quarters in each).
Other reasons indicative of low demand (to the extent that training was clearly treated as
a lower priority than more pressing day-to-day issues) included training not being a priority
for the organisation (seven per cent), managers being too busy to organise training (two
per cent), and employees being too busy to attend training (two per cent) or to deliver
training (two per cent).
Financial reasons appeared to be slightly less of a concern in 2015 than in 2013: seven
per cent of non-training employers in 2015 said lack of funds for training was their reason
for not training, down from 10 per cent in 2013. Lack of funds for training was more likely
to be a barrier among non-training employers in the charity and voluntary sector (17 per
cent) and among those in Health and Social Work (16 per cent).
4%
1%
1%
1%
1%
1%
2%
2%
2%
3%
4%
5%
7%
7%
68%
Other
Courses interested in are not available locally
Business not operating long enough
Trained staff will be poached by other employers
External courses are too expensive
Training not needed due to size of establishment
Employees too busy to give training
Employees too busy to undertake training
Managers lack time to organise training
Learn by experience/Learn as you go
Any staff training arranged AND funded elsewhere
No training available in relevant subject area
No money available for training
Training not considered a priority
All staff are fully proficient / no need for training
Base : All establishments that do not provide training UK (2015: 20,719)

117
As in 2013 perceived poor supply of training was infrequently given as the reason for not
training:
• Five per cent of non-training employers said training was not available in the subject
area they wanted.
• One per cent of non-training employers said the courses they were interested in were
not available locally.
There appeared to be a strong link between the skills gaps reported by employers, their
training activity and the reasons for not training. On the one hand, employers that did not
report any skills gaps were less likely to train than those that did (63 per cent compared
with 85 per cent). Moreover, among non-training employers, those with no perceived skills
gaps at the time of the interview were much more likely to say the reason for not training
over the previous 12 months was there being no need as all their staff were fully proficient
(70 per cent compared with 32 per cent of those with skills gaps) and less likely to give a
number of other reasons, in particular a lack of funds for training (seven per cent compared
with 17 per cent among non-training employers that reported having skills gaps).
More data on the reasons for not providing training can be found in Table A.5.16 in
Annex A.
Figure 5.7 summarises the proportion of all employers that would have liked to have
undertaken more training or, in the case of non-training employers, any training, over the
previous 12 months38. It also shows the proportion that were in ‘training equilibrium’, in
other words had no wish to have undertaken more training. Only results from 2015 are
shown – these were all within one percentage point of those found in 2013.
38 Results for non-trainers have been determined from their reasons for not training, rather than a direct question. Those answering that they had not provided any training because training was not considered to be a priority for their establishment, because all their staff were fully proficient or they had no need for training were regarded as being in skills equilibrium and having no perceived need to undertake training. Those not giving any of these reasons were classified as wanting to have undertaken training. Additionally, training employers that answered ‘don’t know’ when asked if they would have liked to train more were classified as not being in training equilibrium.

118
Figure 5.7 Employer interest in undertaking more training over the last 12 months than they were able to provide
Overall just over two-fifths of all employers (42 per cent) would have liked to have
undertaken more training over the previous 12 months than they were able, exactly the
same proportion as in 2013.
The likelihood of not being in ‘training equilibrium’ (i.e. wanting to have undertaken more
training over the previous 12 months) increased with establishment size (from over a third
(36 per cent) among those with 2-4 staff, to around half for those with 5-99 staff, to three-
fifths (62 per cent) among those with 100 or more staff).
5.11 Other development opportunities
It is worth noting that although this chapter has discussed the provision of formal on and
off-the-job training, it is the case that among employers where no formal training had been
provided in the last 12 months, most (68 per cent, equivalent to 23 per cent of all employers)
had provided other development opportunities for their staff covering: supervision to guide
employees through their job role, providing staff with opportunities to spend time learning
through watching others perform their role, or allowing staff to perform tasks that go beyond
their strict job role and providing feedback on how well they had done.
The vast majority (93 per cent) of training employers also provided these wider
development activities alongside formal training.
66% 34%
46% 51% 2% 30% 70%
42% 58%
Train Don’t train
Wanted to trainmore
Do sufficient training
In training equilibriumWanted to undertakemore training
(No desire for more training)
Of non-training employers….Of training employers….
Wanted to train
No training need reported
Among all employers….(Base: 91,210)
(Base: 69,541) (Base: 21,669)
(Base: All establishments, 91,210)
Don’t know*
* Note training employers responding ‘Don’t know’ have been included in the group ‘Wanted to undertake more training’ in the final measure

119
Data on how provision of wider development activities differed by country, sector and size
of employer both in 2015, 2013 and 2011, and the nature of the development activity, is
provided in Table A.5.17 in Annex A.
5.12 Conclusions
Although there were quite significant changes from 2011 to 2013 in how employers
delivered training, between 2013 and 2015 there were very few changes in key training
measures such as the proportion of business providing training, the proportion of
employees trained, and the average number of days training provided. This could represent
a period of consolidation; however, given the more buoyant state of the economy in 2015
than in earlier surveys, and the persistence of skill deficiencies among the workforce, it is
perhaps surprising that employer training had not really increased.
Increased employment has likely meant that the total number of staff receiving training and
the total number of days training provided both increased by four per cent compared with
2013. Similarly, total expenditure on training increased by six per cent compared with 2013
(not adjusted for inflation) and returned to the level seen in 2011. However, spend per
employee remained in line with previous years.
There have been changes in employers’ approaches to training, with responses showing
a high and increasing level of online training and e-learning. This suggests employers are
moving towards training methods that offer increased flexibility and customization,
particularly in light of the fact that job specific training continues to be the most common
type of training offered.
Almost half of training employers would have liked to deliver more training over the last 12
months than they did. The most common barriers to this were ‘internal’ to the establishment
(that is, lack of funds or time, lack of staff need or desire for training, and lack of knowledge
about opportunities) as opposed to ‘external’ barriers (such as a lack of local training
providers or appropriate training).
Policy interventions seek to stimulate employer training activity not as end in itself but
because of its impact on skills, productivity and economic prosperity. How training is
delivered and assessed is one element which contributes to high performance within
workplaces, and in the next chapter we explore High Performance Working, as well as the
product market strategies that employers adopt.

120
6 High performance working practices and product market strategies
6.1 Chapter Summary
High Performance Working (HPW) is defined by UKCES as a general approach to
managing organisations that aims to stimulate more effective employee involvement and
commitment in order to achieve high levels of performance. A minority of employers (12 per cent) adopted 14 or more HPW practices and were thus classified as HPW employers.
Product Market Strategies (PMS) are defined within the survey according to private sector
employers’ responses to a series of questions exploring pricing strategies, approaches to
innovation, and the nature of the product markets that establishments operate in.
Aggregating these responses classified just under half of all private sector establishments as having ‘high’ or ‘very high’ product market strategies.
Businesses that adopt HPW practices and those that pursued “very high product market
strategies” (i.e. those who lead the way within their industry, offer premium products and
services with a high degree of customisation and whose competitive success is not at all
price dependent) tended to be more active in the labour market and had a more frequent experience of skill shortages: however, they also found it easier to fill their
vacancies in the sense that a smaller proportion of their vacancies were hard-to-fill.
HPW employers were also more likely to identify skills gaps in their workforce. This
was both in terms of the proportion of establishments with at least one skills gap and the
proportion of the workforce deemed not fully proficient in their job. These differences were
likely a reflection of HPW employers adopting practices (such as training needs
assessments) that would assist in identifying skills gaps in their workforce.
The experience of skills gaps was similar across establishments, irrespective of their product market strategies. However, skills gaps were more likely to have been
caused by ‘transient’ reasons (such as staff being new to the role and/or their training not
being completed) in establishments with higher product market strategies.
There was a clear relationship between an establishment’s PMS score and their provision of training – those operating at the higher end of the PMS index were more
likely to have trained their staff and to have trained a higher proportion of their staff.
Employers with higher product market strategies were also more likely to have provided
training that led to nationally recognised qualifications and to qualifications that are of a
higher level than those at the lower end.

121
6.2 Introduction
In previous chapters this report has looked at employers’ experiences of skill shortages
and skills gaps, as well as their practices in funding and arranging training. The analysis in
these chapters has largely focussed on how these challenges have affected employers in
different parts of the UK, of different sizes and in different industry sectors.
There are other ways of grouping employers to understand commonalities and differences
between them. In this chapter we use two alternative categorisations derived from a set of
survey questions relating to the planning, organising and performance strategies used by
employers. These categorisations will help us to better understand what might influence
employers’ experiences of skill shortages and skills gaps and what drives them to fund and
arrange training for their employees. These two categorisations are:
• Whether or not the employers are High Performance Working (HPW) employers.
• The Product Market Strategies (PMS) that employers adopt.
6.3 High Performance Working
It is not only important to consider the skills challenges faced by employers and the extent
to which they develop workplace skills, but also to understand the ways in which employers
ensure that skills are harnessed and nurtured in the workplace. If skilled workers are not
managed and organised effectively in the workplace then it is likely that their productivity
and contribution to economic growth will be limited (UKCES, 201539). One way of assessing
the workplace environment is through the measurement of so-called High Performance
Working (HPW) practices. High Performance Working is defined by UKCES as ‘a general
approach to managing organisations that aims to stimulate more effective employee
involvement and commitment in order to achieve high levels of performance’ (Belt and
Giles, 2010).
Consistent with the 2013 survey, ESS 2015 included a series of questions relating to a set
of 21 recognised HPW practices. In line with other analysis of HPW practices undertaken
by UKCES40, it is possible to group the HPW practices into five factors: planning;
organisation; skills; rewards; and autonomy. Table 6.1 details these five factors and the
individual HPW practices that form each group.
39 UKCES (2015). Growth Through People: Evidence and Analysis. UK Commission for Employment and Skills. 40 Brown, D. (2014). High Performance Working: a new segmentation of smaller workplaces. UK Commission for Employment and Skills.

122
Table 6.1 High Performance Working (HPW) practices according to the five factors
Factor name HPW practices
Planning Training plan, annual performance review, training budget, work shadowing, business plan, equal opportunities policy, training needs assessment
Organisation Investors in People (IIP), ISO 9000, trade union consultation, employee consultation, working in teams, process to identify talented individuals
Skills On or off the job training, formal performance review after training
Rewards Bonus scheme, performance related pay, flexible benefits
Autonomy Task variety, task discretion, flexible working.
Figure 6.1 shows the proportion of employers that adopted each individual HPW practice
and the proportion that adopted at least one of the practices according to the five factor
groupings.
Figure 6.1 Employer adoption of High Performance Working (HPW) practices
11%
11%
14%
14%
16%
16%
31%
31%
31%
37%
39%
42%
43%
47%
51%
52%
61%
63%
67%
83%
84%
Creates teams to work on projects
Trade union consultation (non pay related)
Holds ISO9000
Processes to identify talented individuals
Employee consultation
IIP
Flexible benefits
Training budget
Individual performance related pay
Awards performance related bonuses
Flexible working
Training plan
Formally assess performance after training
Task discretion
Training needs assessments
Task variety
Business plan
Annual performance review
On or off job training
Equal opportunity policy
Work shadowing/stretching/supervision
Base: All establishments (Module 1; 45,392)
67% Skills
96% Planning
73% Autonomy
42%Organisation
56% Rewards

123
Overall, 12 per cent of employers adopted 14 out of the 21 HPW practices which – in line
with the approach taken in ESS 2013 – classified these establishments as being High
Performance Working employers (HPW employers). The proportion of employers classified
as being HPW employers was consistent with ESS 2013. The remainder of this section
focusses on this select group of HPW employers.
Previous analysis of HPW employers has shown that small-to-medium sized
establishments (those with 5-99 employees) are of particular interest when considering the
influences of HPW practices (Brown, 2014). When introducing working practices it is
inevitable that employers weigh-up the costs of implementing the practice(s) and the
benefit(s) gained. For the very smallest employers with fewer than five employees, the
formal adoption of HPW practices is more likely to fail the cost-benefit test. In contrast, the
greater human resources management in the largest establishments with 100 or more
employees likely lowers these costs and makes the adoption of HPW practices more of a
cultural norm rather than a conscious decision to adopt them. For employers in the small-
to-medium size band (with 5-99 employees), the implementation of HPW practices is more
likely to be a considered choice. Whilst this chapter looks at differences by each of the
different size bands within HPW and non-HPW employers, where it is of interest it will also
look at differences within the 5-99 size band.
When considering HPW employers it is worth noting that:
• There was a strong link between HPW status and the size of establishment. Only
four per cent of establishments with fewer than five employees adopted 14 or more
of the HPW practices, increasing to 66 per cent of all establishments with 250 or more
employees. The proportion of the workforce employed by HPW establishments,
therefore, was disproportionately large at approximately two-fifths of the workforce.
• HPW employers were disproportionately likely to be part of a wider organisation and,
thus, had access to the associated resources and management structures that this
often provides (70 per cent of all HPW employers were multi-site establishments,
whereas only a third of all employers overall were multi-site).

124
• The sector profile of HPW employers varied considerably. As many as two in five
employers in the Public Administration sector were HPW employers (40 per cent),
and more than a quarter of employers in the Education sector were (28 per cent).
Highlighting the link between HPW employer and size, it should be noted that both
of these sectors were characterised by a higher proportion of large employers than
other sectors. The Health and Social Work and Financial Services sectors also had
a large proportion of employers that were HPW employers (22 and 17 per cent
respectively). Conversely, only two per cent of employers in Agriculture and four per
cent in Construction were HPW employers (two sectors that tended to comprise
small, single-site establishments).
The following subsections of this chapter discuss the differing experiences of HPW and
non-HPW employers in terms of skill shortages, training and skills gaps: Figure 6.2
summarises these findings. Unless otherwise stated, the findings reported in this section
are consistent with findings reported in 2013.
Figure 6.2 Summary of employers’ experiences of skill shortages, skills gaps and training depending on High Performance Working (HPW) classification
HPW employers were more active in the labour market and generally
found it easier to fill their vacancies. Where HPW employers had hard-to-fill vacancies, this was more likely to be caused by skill shortages among
applicants than for non-HPW employers.
40%
16%
27%
34%
72%67%
HPW non-HPW
Incidence of vacanciesHtFVs as % of vacanciesSSVs as % of HtFVs
Recruitment and skill shortages
HPW employers were more likely to have arranged or funded training for
their staff; and to have trained a larger proportion of their staff. This
likely reflected their increased recruitment activity as well as their
increased likelihood to identify skills gaps in their workforce.
98%
62%77%
54%
HPW non-HPW
Incidence oftraining employers
% of workforcetrained
TrainingHPW employers were more likely to
have skills gaps in a greater proportion of their workforce. This
was likely a reflection of HPW employers being more likely to have
systems and practices in place to better allow them to identify skills
gaps.
Skills Gaps
25%
12%5.9%
4.5%
HPW non-HPW
Incidence of skills gaps
% of workforce with skills gaps
Base : All establishments in Module 1by HPW classification (HPW: 8,792; non-HPW: 36,600)

125
6.4 The relationship between HPW and skill shortages
HPW employers were considerably more active in the recruitment market than non-HPW
employers and were (consequently) more likely to have experienced at least one hard-to-
fill vacancy and at least one skill-shortage vacancy (see the furthest left chart of Figure 6.2).
However, in density terms, a smaller proportion of HPW employers’ vacancies were hard-
to-fill (27 per cent compared with 34 per cent in non-HPW employers).
Where HPW employers encountered hard-to-fill vacancies, a greater proportion of these
were caused by skill shortages (72 per cent of hard-to-fill vacancies were caused by skill
shortages in HPW employers compared with 67 per cent in non-HPW employers). This
suggests that HPW employers had a greater demand for skills, qualifications and
experience when recruiting than non-HPW employers.
It is important to consider the effect of size when understanding these differences. As
illustrated in Figure 6.3, the incidence of establishments that had at least one vacancy, at
least one hard-to-fill vacancy and at least one skill-shortage vacancy was generally greater
in HPW employers for each size band compared with their non-HPW counterparts (with a
few isolated exceptions). This was particularly evident in the smallest size band (employers
with fewer than five employees), but also in the group of employers with 5-99 employees
which, as discussed earlier, is a group of employers that are of particular interest when
considering the effects of HPW adoption.

126
Figure 6.3 Incidence and density of vacancies, hard-to-fill vacancies (HtFVs) and skill-shortage vacancies (SSVs) by HPW classification and size
That said, when considering the density of hard-to-fill and skill-shortage vacancies among
HPW and non-HPW employers of different sizes the picture is less clear. The density of
hard-to-fill and of skill-shortage vacancies was higher among HPW employers in the
smallest size band (those with fewer than five employees) than in non-HPW employers of
the same size. That is, HPW employers of this size found it harder to fill their vacancies
than their non-HPW counterparts and were more likely to encounter skill shortages in the
labour market.
This picture did not hold true in other size bands where the densities of hard-to-fill and skill-
shortage vacancies were similar irrespective of HPW status.
Table A.6.1 in Annex A provides a full breakdown of the differences in recruitment activity
between HPW and non-HPW employers, including differences by size.
46%
33%29% 31%
22% 22%
39% 39%
31% 30%28%
19%
73%
66% 68%66%
68%
85%
65% 66% 68% 66%71%
79%
0%
10%
20%
30%
40%
50%
60%
70%
80%
90%
100%Incidence of vacancies Incidence of HtFVs Incidence of SSVs HtFVs as % of vacancies SSVs as % of HtFVs
HPW employers Non-HPW employers
Base: All establishments by HPW classification and size (Module 1)
Base: (4,213)(322) (721)(1,222)(2,004) (310) (20,536)(9,866) (636)(1,664)(3,746) (152)

127
6.5 The relationship between HPW and skills gaps
A greater proportion of HPW employers had skills gaps in their workforce than non-HPW
employers (Figure 6.2). This was both in terms of the proportion of establishments with at
least one skills gap (25 per cent of HPW employers had a skills gap compared with 12 per
cent of non-HPW employers), and the proportion of the workforce deemed not fully
proficient in their job (5.9 per cent among HPW employers, a small but significant difference
to the 4.5 per cent among their non-HPW counterparts).
This difference in the experience of skills gaps was only evident among smaller
establishments (see Figure 6.4). In particular, it was only among employers with fewer than
25 employees where the incidence of skills gaps was greater among HPW employers than
non-HPW employers. Also, it was only among the very smallest establishments with fewer
than five employees where the proportion of the workforce with skills gaps was significantly
higher among HPW employers than among their non-HPW counterparts.
This was different to 2013 when the proportion of the workforce with skills gaps was the
same across both HPW and non-HPW employers (even though a greater proportion of
HPW employers had at least one skills gap in their workforce).
Figure 6.4 Incidence and density of skills gaps by HPW classification and size
11%
22%
30%32%
40%
46%
6%
19%
31%34%
41%
46%
4.5% 4.5% 4.4% 4.6% 5.0%7.4%
2.4%4.3% 4.7% 4.8% 5.2%
6.4%
0%
10%
20%
30%
40%
50%
60%
Incidence of skills gaps % of workforce with skills gaps
HPW employers Non-HPW employers
Base: All establishments by HPW classification and size (Module 1)
(4,213)(322) (721)(1,222)(2,004) (310) (20,536)(9,866) (636)(1,664)(3,746) (152)

128
The greater incidence and density of skills gaps in HPW employers, relative to non-HPW
employers, was not necessarily a negative thing. It should be noted that a number of the
HPW practices (such as the conducting of training needs assessments, annual
performance reviews and formally assessing performance after training) were likely to have
assisted HPW employers in identifying skills gaps in their workforce and, through identifying
such gaps, allowed them to be addressed.
6.6 The relationship between HPW and training
HPW employers were much more likely than non-HPW employers to have arranged or
funded training for their employees over the 12 months prior to the survey (98 per cent had
done so, compared with 62 per cent of non-HPW employers, see Figure 6.2). HPW
employers had also trained a much greater proportion of their workforce over this period
than non-HPW establishments (77 per cent compared with 54 per cent, respectively). This
suggested that HPW employers took a more active role in developing the skills of their
workforce.
Arranging or funding training for staff was one of the 21 HPW practices recognised in the
survey (along with other training related practices, such as having a training plan); it is
therefore not surprising that HPW employers were more likely to have arranged or funded
training for their employees. However, it should also be noted from earlier that HPW
employers were more active in the recruitment market and thus likely had greater need to
train new recruits. Similarly, the previous section on skills gaps suggested that HPW
employers were more likely to identify skills gaps in their workforce and thus identify a need
for training and developing the skills of their workforce.
These training differences between HPW and non-HPW employers were evident across all
size bands. That is to say within each size band the proportion of training employers and
the proportion of staff trained was greater among HPW employers than non-HPW
employers. It was also the case that the tendency to train was greater among HPW
employers in every sector. These training-related data by size and sector in HPW and non-
HPW employers are provided in Table A.6.2 in Annex A.

129
The ESS data not only allow us to assess whether (and how much) training was arranged
or funded by employers, but also provide some insight into the level and quality of training
undertaken (i.e. whether the training was towards nationally recognised qualifications and
the level of qualifications trained to). HPW employers were more likely to have funded or
arranged training towards nationally recognised qualifications and to qualifications that are
of a higher level. Specifically, 63 per cent of HPW employers that had trained their staff
had arranged or funded training towards a nationally recognised qualification over the 12
months prior to the survey (compared with 43 per cent of non-HPW employers).
Furthermore, a greater proportion of HPW employers (25 per cent) had trained their staff
to qualifications at Level 4 and above compared with non-HPW employers (12 per cent).
6.7 Product market strategies
Product market strategies (PMS) describe the ways in which private sector establishments
choose to differentiate and position the products and services they provide within the
markets in which they operate. Employers operating ‘higher’ product market strategies offer
greater opportunity for sustainable business growth and productivity which should, in turn,
place a greater demand on skills. The inter-relationship between PMS and workforce skills
is a theme of policy interest for government as the availability of workforce skills may have
a bearing on the strategies that firms are able to pursue (and on their medium and long-
term success).
Within the survey, private sector employers were asked to rate their establishments on
a five-point scale, compared to other establishments in the same industries, in terms of:
• the extent to which their competitive success depended on price.
• the extent to which the establishment tended to lead the way in their industry in
terms of the development of new products, materials or techniques.
• the extent to which the establishment competed in a ‘premium quality’ product
market as opposed to a ‘standard or basic quality’ product market.
• the extent to which they offered goods or services with a substantial amount of
customisation according to customer requirements.
Figure 6.5 illustrates the overall responses to each of these individual product market
‘position statements’, including the score attributed to each response.

130
The responses to the position statements were very similar to 2013 and 2011. This lack of
change over time was expected given that the ‘position statements’ asked in the survey
were standardised in the sense that employers were asked to compare their products and
services against those provided by others in their industry (i.e. if there had been industry-
wide advancements in product market strategies the individual employers’ positioning
within the industry against their competitors would not necessarily have changed).
That said, there was a small but significant move towards employers having a substantial
level of customisation in their offering and the competitive success of employers’ products
or services being ‘not at all price dependent’ (a two percentage point increase in the
proportion of employers that provided a ‘score’ of five for these two statements).
Figure 6.5 Product Market Strategy positions
10%
6%
20%
14%
6%
5%
13%
12%
23%
24%
25%
38%
22%
26%
17%
16%
31%
34%
19%
15%
1 2 3 4 5
Wholly price dependent
Rarely leads the way
Standard or basic quality
No difference in product/service
offering
Not at all price dependent
Often leads the way
Premium quality
Substantial customisation
Base: All establishments in the private sector (75,639)

131
6.8 Deriving a composite Product Market Index
In order to discern the overall product market strategies of each establishment, the
responses to the four product market ‘position statements’ were aggregated to derive a
composite PMS score. These composite scores were then converted to a fivefold
classification ranging from ‘very low’ to ‘very high’ (see Table 6.2). A ‘very high’ composite
score indicated that the employer tended to lead the way and innovate in its sector, tended
not to compete on price and/or tended to offer a premium and/or highly customised product
or service. Conversely, a ‘very low’ composite score indicated that the employer tended
not to do any of these things.
Table 6.2 Overall composite Product Market Strategy scores
Aggregate PMS score % of private sector UK establishments
% of private sector UK employment
1 to 7 Very low 4 2 8 to 10 Low 13 9 11 to 13 Medium 25 22 14 to 16 High 29 31 17 to 20 Very high 16 22
Base: All establishments in the private sector (75,639).
Note: Figures do not sum to 100 per cent as ‘Don’t know’ responses have been excluded.
6.9 Profiling higher and lower composite PMS score employers
Employers at the ‘very high’ end of the PMS scale tended to be larger on average than
those at the ‘very low’ end. However, as in 2013, it was the case that all of the PMS
classifications (from very low to very high) were dominated by small establishments with
fewer than 25 employees (see Table 6.3). It should therefore be noted that the analyses
presented in the remainder of this chapter, looking at differences by PMS grouping, are –
in effect − predominantly a discussion about smaller establishments regardless of which
PMS grouping they fell into. This means that differences recorded between PMS groupings
are not likely to be driven (solely) by size.

132
Table 6.3 Overall composite Product Market Strategy scores by size
All private sector
Very Low Low Medium High Very
High Unwtd Base: 75,639 2,673 8,771 18,544 22,832 13,385
% % % % % % Size 2-4 53 67 61 54 50 47 5-24 38 29 34 38 40 40 25-49 5 2 3 5 6 7 50-99 2 1 1 2 3 3 100-249 1 * * 1 1 2 250+ 1 * * * 1 1
Base: All establishments in the private sector, by PMS classification.
‘*’ denotes a figure larger than zero but smaller than 0.5.
At the ‘very high’ end of the PMS scale the sectoral distribution was largely in line with the
overall sector profile of private sector establishments (i.e. no single sector was
disproportionately represented in the ‘very high’ PMS grouping). At the lower end of the
PMS groupings, however, employers with a ‘very low’ PMS score were disproportionately
likely to be operating in the Agriculture and Construction sectors (these sectors accounted
for 35 per cent of all ‘very low’ PMS establishments but only 17 per cent of all private sector
establishments).
Table A.6.3 in Annex A provides further detail on the characteristics of employers in each
PMS category in terms of country and sector.
The following subsections of this chapter discuss the experiences of employers according
to their differing positions on the PMS scale. Unless otherwise stated, the findings reported
in this section are consistent with findings reported in 2013.
6.10 Relationship between PMS and skill shortages
As illustrated in Figure 6.6, establishments with a higher PMS score were more active in
the recruitment market. The incidence of establishments with vacancies increased from
11 per cent among those with a ‘very low’ PMS score to 23 per cent among those with a
‘very high’ PMS score. In line with this increase in recruitment activity, employers at the
higher end of the of the PMS index were also more likely to have at least one hard-to-fill
vacancy and at least one skill-shortage vacancy (see Figure 6.6).

133
Figure 6.6 Incidence of vacancies, hard-to-fill vacancies (HtFVs) and skill-shortage vacancies (SSVs), as well as density of HtFVs, by Product Market Strategy classification
It is worth noting, however, that as a proportion of recruiting employers, the likelihood of
encountering a hard-to-fill vacancy and skill-shortage vacancy was actually lower among
employers at the higher end of the PMS index. Of the 11 per cent of ‘very low’ PMS
employers that had at least one vacancy, over half had at least one hard-to-fill vacancy (55
per cent, which equated to six per cent of all ‘very low’ PMS employers). This decreases
the higher the PMS score. Of the 23 per cent of ‘very high’ PMS employers that had at least
one vacancy, around four in ten had at least one hard-to-fill vacancy (39 per cent, which
equated to nine per cent of all ‘very high’ PMS employers). In contrast, this indicates that
employers at the higher end of the PMS index were able to compete more strongly in the
labour market when recruiting. That is, by virtue of their approach and positioning, higher
PMS employers were able to appear more attractive to potential recruits and, thus, found
it easier to successfully fill their vacancies.
However, when considering the density of hard-to-fill vacancies (i.e. the number of hard-
to-fill vacancies as a proportion of all vacancies) there was not a linear trend across the
PMS groupings. Rather, the density of hard-to-fill vacancies remained similar for
establishments with a ‘medium’, ‘high’ and ‘very high’ PMS score (see Figure 6.6).
Nevertheless, the density of hard-to-fill vacancies was significantly higher among
establishments at the lower ends of the PMS index.
11%14%
18%21%
23%
6% 7% 8% 9% 9%
4% 5% 6% 7% 7%
47%
42%
35%37%
34%
0%
10%
20%
30%
40%
50%
60%
Very low PMS Low PMS Medium PMS High PMS Very high PMS
Incidence of vacancies Incidence of HtFVs
Incidence of SSVs HtFVs as % of vacs
Base:
Base: All establishments in the private sector, in each PMS group
(2,673) (8,771) (18,544) (22,832) (13,385)

134
There was no linear trend between PMS and the density of skill-shortage vacancies (i.e.
the number of skill-shortage vacancies as a proportion of all hard-to-fill vacancies).
Table A.6.4 in Annex A provides a full breakdown of the differences in recruitment activity
by PMS classification.
6.11 The relationship between PMS and skills gaps
As detailed in Table 6.4, there was no clear relationship between an establishment’s
product market strategy and the incidence or density of skills gaps.
Table 6.4 Incidence and density of skills gaps by Product Market Strategy
Very low Low Medium High Very
high Unweighted Base 455 1,815 4,164 5,045 2,643
% % % % %
% of establishments with a skills gap 12 13 15 15 14
% of workforce with skills gaps 5 6 6 6 5
There were some differences in the main causes that employers attributed their skills gaps
to between the various PMS groupings. The main causes of staff not being fully proficient
are presented in Table 6.5.
There was a broad trend of an increased proportion of skills gaps that were ascribed to
transient causes (i.e. staff were new to the role and/or their training was not complete) in
establishments with higher product market strategies. Specifically, 19 per cent of skills
gaps in both ‘low’ and ‘very low’ PMS establishments were due to transient causes, rising
to 25 per cent in ‘very high’ PMS establishments. It can take time for new staff to reach full
proficiency and, given these transient causes, one would expect a greater proportion of
skills gaps to be resolved given time in establishments with higher product market
strategies. Indeed, employers with higher product market strategies were less likely to have
attributed skills gaps to staff having not received the appropriate training.
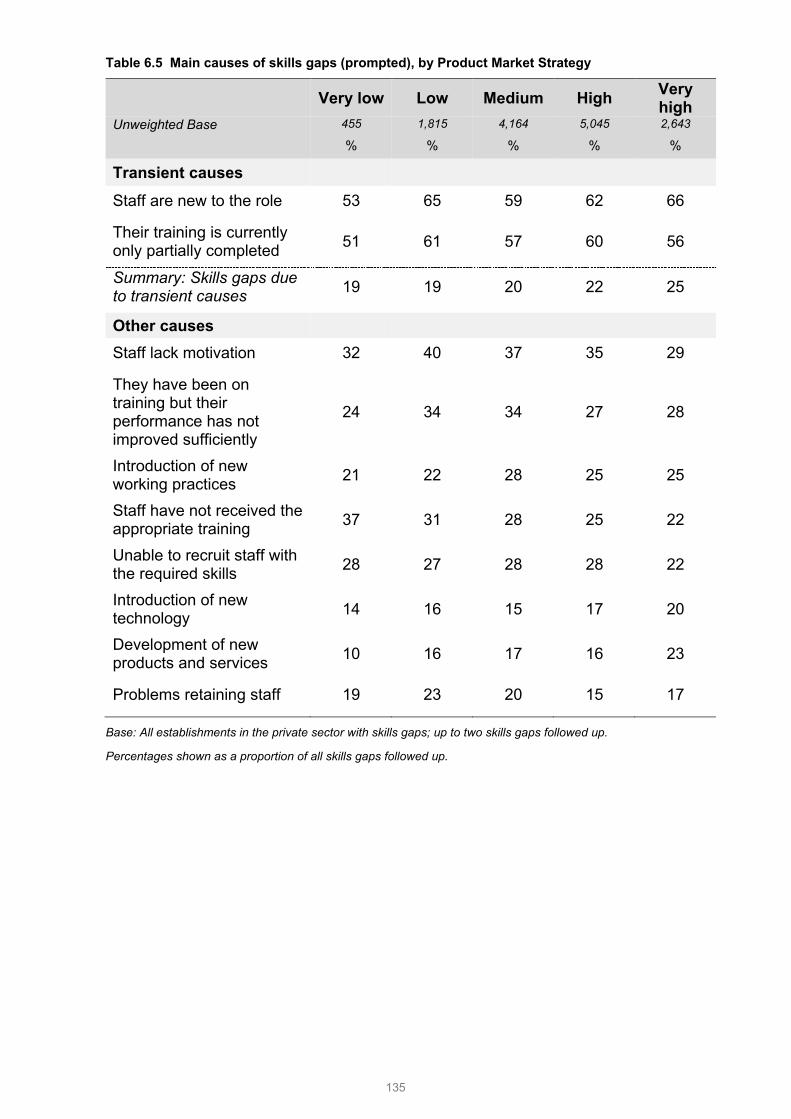
135
Table 6.5 Main causes of skills gaps (prompted), by Product Market Strategy
Very low Low Medium High Very
high Unweighted Base 455 1,815 4,164 5,045 2,643
% % % % %
Transient causes
Staff are new to the role 53 65 59 62 66
Their training is currently only partially completed 51 61 57 60 56
Summary: Skills gaps due to transient causes 19 19 20 22 25
Other causes Staff lack motivation 32 40 37 35 29
They have been on training but their performance has not improved sufficiently
24 34 34 27 28
Introduction of new working practices 21 22 28 25 25
Staff have not received the appropriate training 37 31 28 25 22
Unable to recruit staff with the required skills 28 27 28 28 22
Introduction of new technology 14 16 15 17 20
Development of new products and services 10 16 17 16 23
Problems retaining staff 19 23 20 15 17
Base: All establishments in the private sector with skills gaps; up to two skills gaps followed up.
Percentages shown as a proportion of all skills gaps followed up.

136
6.12 The relationship between PMS and training
As illustrated in Figure 6.7, there was a linear relationship between an establishment’s
product market strategies and their level of training activity over the 12 months prior to the
survey. As the PMS composite score increases, both the incidence of establishments that
had provided training for their staff and the proportion of the workforce trained also
increases.
Figure 6.7 Incidence of training and proportions of the workforce trained by Product Market Strategy classification
As reported in Chapter 5, a strong relationship existed between employer size and training
activity, with the likelihood of training increasing with employer size. We have also seen in
this chapter that employers with higher PMS scores tend to be larger employers. However,
it is not merely size that drives the finding that high PMS employers train more. Indeed, it
was invariably the case that for each size band the employers with a higher PMS score
were more likely to have trained their employees and to have trained a greater proportion
of their staff (see Table A.6.5 in Annex A). Therefore, like for like, employers that operated
with higher product market strategies were more likely to have identified the need for, and
to have invested in, skills development.
46%
57%
63%68%
71%
47% 49%54%
61%64%
Very low PMS Low PMS Medium PMS High PMS Very high PMS
Incidence of training Proportion of staff trained
Base: All private sector establishments in each PMS group
Base: (2,673) (8,771) (18,544) (22,832) (13,385)

137
Looking at the types of training provided, there was a relationship between an employers’
PMS score and the provision of induction training. Around half (52 per cent) of all training
employers with a ‘very low’ PMS score had provided either basic or advanced induction
training, increasing to around three-quarters (72 per cent) of all training employers with a
‘very high’ PMS score. Given the greater level of activity in the recruitment market among
establishments with a higher PMS score, this increased provision of induction training is
perhaps unsurprising and is one reason why employers with higher product market
strategies provide more training overall.
A greater proportion of employers that had trained their staff and operated at the lower end
of the PMS index only provided induction and/or health and safety for their staff (16 per
cent of training employers with a ‘very low’ PMS score and 12 per cent of those with a ‘low’
PMS score). The proportion of training employers that only provided these types of training
was consistent across the ‘medium’, ‘high’ and ‘very high’ PMS groupings at 10 per cent.
Induction training and health and safety training can often be relatively basic and a
legislative requirement, rather than being something that is focussed on the development
of workforce skills. This finding further suggests, therefore, that the training undertaken by
employers with higher product market strategies was more focussed on developing the
skills of their workforce.
Employers with higher PMS scores were also more likely to have funded or arranged
training towards nationally recognised qualifications and to qualifications that are of a
higher level than employers at the lower end of the PMS index. Nearly half (47 per cent) of
all training employers with a ‘very high’ PMS score had arranged or funded training for their
staff to a nationally recognised qualification compared with 43 per cent of employers with
a ‘very low’ PMS score. When considering the level of qualifications trained to, the
proportion of training employers that had trained their staff to qualifications at Level 4 or
above increased with PMS (from seven per cent among establishments with a ‘very low’
PMS score to 16 per cent among those with a ‘very high’ PMS score).

138
6.13 Conclusion
In this final chapter of the report we have considered how the strategies that employers
adopt impact on their experiences of skills challenges.
We have seen that employers that pursue High Performance Working (HPW) practices,
and those who pursue higher product market strategies, were more active in the labour
market and were consequently more likely to experience skill shortages, were more likely
to identify skills gaps and were more likely to be responding to these factors through the
provision of training.
This reflects and confirms that the existence of skill deficiencies is not always a negative
indicator for individual employers or for the economy. The pursuit of ambitious strategies,
which help in driving the UK economy forward in its pursuit of higher productivity levels,
can both point to skills deficiencies (because better practices are in place to identify them)
and create them (because skills development can lag behind innovation in workplace
practice and service delivery). The challenge becomes how to deal with such deficiencies.
Here, it was clear that High Performance employers and those with more advanced
strategies were markedly more likely to fund and arrange training to develop the skills of
their workforce.

139
7 Conclusions
7.1 Introduction
This chapter draws out some important themes and questions raised by the survey overall.
Beginning with an exploration of what the survey tells us about the changes in the economy
and the impact on skill, it goes on to explore what the survey tells us about training
investment, management and leadership skills and the risks of sub-optimal skills for a
productive workforce.
7.2 Tracking developments in the UK economy
The Employer Skills Survey is a vital source of data on skills and the labour market. It offers
a unique insight into the micro decisions that employers make about factors such as
recruitment, training investment and use of skills in the workplace, which underpin the
macro-level trends that drive UK economic growth and productivity levels.
The UK has witnessed job creation at a faster rate than in any other EU country over the
last two years (Eurostat, 2015). Reflecting this growth, successive waves of the UK
Employer Skills Survey have recorded a steep rise in vacancy levels among employers -
from 655,000 vacancies at the time of the survey in 2013 to 927,000 in 2015 – reflecting
high demand for labour.
However, this growth in the economy has been accompanied by stalling productivity levels,
which remain some distance behind our main EU counterparts (UKCES, 2015). Numerous
studies have shown that improving skills and education serves to increase productivity
(Garrett and Campbell, 2010); the deployment of skills in the labour market is therefore of
critical importance to the country’s future prospects and prosperity. Ensuring the right
people with the relevant skills are being employed in the right job roles should help
employers to take advantage of the platform that the current buoyant economy affords.
However, the survey findings indicate that as vacancies have risen, so too has the number
of vacancies that are hard to fill because applicants lack the requisite skills. There are now
nearly a million of these skill-shortage vacancies across the UK.
This survey shows that the overall UK picture hides much interesting variation between the
skills challenges faced by employers in different sectors and the survey allows these
changes to be tracked over time.

140
For example, whilst Manufacturing, Electricity, Gas and Water, Transport and
Communications, Construction and Business Services all report higher than average
density of skill-shortage vacancies, it is the Financial Services and Construction sectors
which have seen a substantial increase in the density of skill-shortage vacancies since
2013, in contrast to most other sectors. What might lie behind this growth and what are the
potential consequences?
The Financial Services sector has undergone extensive upheaval, following the financial
crisis and subsequent recession. Regulatory change in the sector is ongoing and wide
reaching; the demands of the roles in the sector are changing and these are possibly acting
as a deterrent to people entering the sector. There are indications for example that the
proportion of graduates entering this sector has declined gradually since 2006 (HESA,
2015). Skill-shortage vacancies are hampering the ability of businesses in this sector to
innovate, with nearly half stating that an inability to recruit appropriately skilled candidates
has led to difficulties introducing new working practices.
The Construction sector is commonly regarded as underpinning the economy, with its
responsibilities for creating the infrastructure that allows businesses to grow (HM
Government, 2013b). A doubling in the number of skill-shortage vacancies since 2013
therefore presents some cause for concern, especially considering that employment in the
Construction sector has decreased since 2013, from 1.3m to 1.2m staff, and hence one
would expect a ready supply of skilled labour. Skill-shortage vacancies are affecting the
bottom line. Construction sector employers were the most likely to cite a loss of business
or orders to competitors resulting from skill-shortage vacancies, this in turn has implications
for growth potential in the wider economy.
This more granular data at UK, national, local, sectoral and occupation level provides
employers, governments, education institutions and many other bodies with the information
they need to plan, to prioritise and to invest.
7.3 Changing nature of work
UKCES’ wider research has highlighted that the nature of work is evolving at a rapid rate,
with new technology and digitisation rapidly changing the skill requirements of the
workforce. Increasingly, the digitisation of work is placing demands on staff to operate
flexibly and adapt to new technologies. Job roles are becoming more complex and
employers are expecting more from their employees (Störmer et al., 2014).

141
ESS 2015 identifies a number of clear challenges for employers in this respect. It highlights
a lack of complex analytical skills among both applicants and existing staff. These are of
vital importance as technologies become more elaborate, and innovation and adaptation
is increasingly key to organisational growth. In a similar vein, across all job roles, a lack of
basic IT skills characterises between one in five and two in five employees who are not
fully proficient in their job role. A lack of advanced IT skills is similarly associated with skills
gaps for high-skill and middle-skill occupations, such as Managers and Administrative and
Clerical staff, in particular.
Beyond the challenges of technology, the survey also highlights the ongoing challenge of
soft, people and personal skills, in particular time management and task prioritisation skills.
Crucially, the demand for time management and task prioritisation skills is evident across
all occupations, both higher and lower skilled, and implies a link to the growing complexity
of job roles, requiring individuals to juggle multiple strands of work and responsibility. Poor
time management can lead to inefficiencies within organisations, potentially resulting in
increased, poorer quality outputs and loss of work.
7.4 Training investment
We know that around 90 per cent of the current labour force have the potential to be active
in the labour market a decade from now (UKCES, 2014b). Therefore, the economy cannot
rely on initial education alone to ensure people have the continuously changing skills that
are needed: the workplace is a vital location to develop these skills. ESS 2015 provides a
comprehensive view of employer investment in staff training and allows some assessment
of whether that training is sufficient to meet employer’s own needs, or whether there are
‘market failures’ in the supply of and demand for training.
Around two-thirds of businesses provide training for their staff, a similar proportion of
employees are trained and on average those trained receive 6.8 days training per year.
These numbers have changed little since 2013, though the overall number of training days
has increased. As businesses have been recruiting, there is some evidence of an increase
in the proportion of employers that are providing induction training, which may be driving
the increase in the number of days, and an increase in the proportion who have provided
only Health and Safety or induction training (11 per cent, up from nine per cent in 2013).
Arguably, it is probably not this type of training that will best equip individuals with the
technical skills, complex analytical skills or people skills staff need.
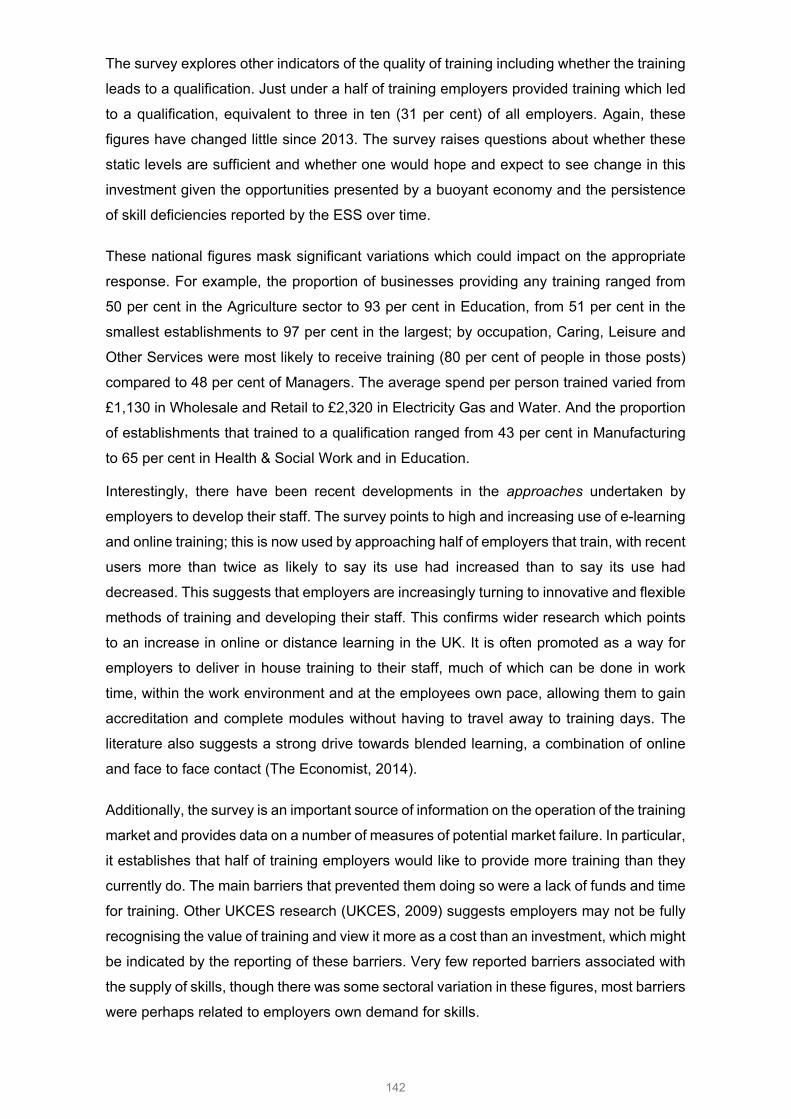
142
The survey explores other indicators of the quality of training including whether the training
leads to a qualification. Just under a half of training employers provided training which led
to a qualification, equivalent to three in ten (31 per cent) of all employers. Again, these
figures have changed little since 2013. The survey raises questions about whether these
static levels are sufficient and whether one would hope and expect to see change in this
investment given the opportunities presented by a buoyant economy and the persistence
of skill deficiencies reported by the ESS over time.
These national figures mask significant variations which could impact on the appropriate
response. For example, the proportion of businesses providing any training ranged from
50 per cent in the Agriculture sector to 93 per cent in Education, from 51 per cent in the
smallest establishments to 97 per cent in the largest; by occupation, Caring, Leisure and
Other Services were most likely to receive training (80 per cent of people in those posts)
compared to 48 per cent of Managers. The average spend per person trained varied from
£1,130 in Wholesale and Retail to £2,320 in Electricity Gas and Water. And the proportion
of establishments that trained to a qualification ranged from 43 per cent in Manufacturing
to 65 per cent in Health & Social Work and in Education.
Interestingly, there have been recent developments in the approaches undertaken by
employers to develop their staff. The survey points to high and increasing use of e-learning
and online training; this is now used by approaching half of employers that train, with recent
users more than twice as likely to say its use had increased than to say its use had
decreased. This suggests that employers are increasingly turning to innovative and flexible
methods of training and developing their staff. This confirms wider research which points
to an increase in online or distance learning in the UK. It is often promoted as a way for
employers to deliver in house training to their staff, much of which can be done in work
time, within the work environment and at the employees own pace, allowing them to gain
accreditation and complete modules without having to travel away to training days. The
literature also suggests a strong drive towards blended learning, a combination of online
and face to face contact (The Economist, 2014).
Additionally, the survey is an important source of information on the operation of the training
market and provides data on a number of measures of potential market failure. In particular,
it establishes that half of training employers would like to provide more training than they
currently do. The main barriers that prevented them doing so were a lack of funds and time
for training. Other UKCES research (UKCES, 2009) suggests employers may not be fully
recognising the value of training and view it more as a cost than an investment, which might
be indicated by the reporting of these barriers. Very few reported barriers associated with
the supply of skills, though there was some sectoral variation in these figures, most barriers
were perhaps related to employers own demand for skills.

143
This demand for skills is derived from the firm’s own business strategy. ESS 2015 illustrates
that businesses with higher product market strategies and who operate with more High
Performance Working practices are more likely to report skill-shortage vacancies,
marginally more likely to identify skills gaps and more likely to be responding to these
factors through the provision of training. These businesses are vital to the well-being of the
economy and if more businesses pursue these strategies, this will increase the demand for
skills. So the survey raises important questions about whether the demand for skills is
adequate to fuel the continuing recovery.
7.5 Leadership and management
A potential determinant of the demand for skills is the knowledge managers have about
training, and potential value to their business (UKCES, 2009). Recent international studies
have revealed large variation in management quality across firms within all countries. What
accounts for the difference between countries is the absence (e.g. US) or presence (e.g.
India; UK) of a long tail of poorly managed firms. Even though the UK’s best firms are often
world leading, the presence of a large number of poorly managed firms means the UK does
not measure up to the likes of the US on management capability (Bloom et al., 2012).
ESS 2015 includes a number of indicators pertinent to understanding leadership and
management skills. Survey findings indicate that just over a third of employers (37 per cent)
were investing in the skills of their Managers through the provision of management training.
The density of skill-shortage vacancies and skills gaps within the Manager occupational
grouping is, and has consistently been shown to be, lower than average, with
commentators (Campbell, 2013) previously suggesting this pointed to a lack of demand for
management skills or the difficulty of ‘self-reporting’ a skills gap by managers of small firms
– the survey respondents. The 2015 survey also shows that businesses do not face
particular difficulties in retaining management talent but it is the occupational grouping
whose skills are most likely to be under-used. This finding raises important questions about
whether these are the right skills for the role and what type of skills are being under-used.
Are they, necessarily, management skills? The survey provides a number of further
indications that improving management practice should be a priority for UK business. For
example, management and leadership type skills (managing and motivating other staff,
setting objectives/planning resources) accounted for over half of all skills gaps (58 per cent)
identified. Indeed, the overall proportion of businesses defined as High Performance
working businesses is low at 12 per cent, suggesting that there is scope for improving the
business practices of a good many UK firms.

144
Good leadership could in particular serve to support growth among small businesses,
where the presence of poor managerial practices is more common. The survey identified
that among businesses with fewer than five staff, only one in eight had arranged
management training in the last 12 months, while these businesses (along with those with
5 to 24 employees) were also less likely to acknowledge skills gaps among Managers.
There is clearly more work to be done to ensure that small businesses have the support
they need improve their managerial practices.
7.6 Skills for a productive workforce
The impacts of skills challenges (both internal and external) are numerous and varied.
While some companies’ short-term financial performance may be impeded, there are also
potential longer-term implications for companies’ productivity levels, and their ability to
grow.
The government’s Productivity Plan identifies innovation as a key step to encourage
productivity (HM Treasury, 2015). But ESS 2015 reports that skill deficiencies impact on a
business’s ability to innovate. Four in ten establishments with skill-shortage vacancies
reported a delay in developing new products or services and 35 per cent reported
difficulties in innovating working practices. These impacts were reported less frequently for
skills gaps (though were still cited by 17 per cent and 24 per cent respectively of
establishments with skills gaps), perhaps reflecting the occupations in which skill-shortage
vacancies and skills gaps are most likely to arise. This is further suggested by the finding
that, the skills that are required to drive forward innovation within businesses often appear
to be lacking: two in five of all skill-shortage vacancies and skills gaps were attributed to
individuals lacking the ability to solve complex problems. Within existing staff, this was
particularly apparent for those in high-skill occupations, such as Managers and
Professionals. Similarly, complex numerical or statistical skills and understanding were
often deemed to be lacking.
To further address the productivity challenge, it is also important for employers to fully
understand and utilise the skills of their workforce. Currently the survey shows that by far
the majority of staff were working in roles that were making use of their skills and
qualifications. However, seven per cent of the workforce were reported as being under-
utilised and this equates to two million people with excess skills and qualifications. Under-
utilisation represents not only a waste of individuals’ talent but also a missed opportunity
for employers to increase performance and productivity, improve job satisfaction and
employee well-being, and stimulate investment, enterprise and innovation (Wright and
Sissons, 2012). Employers should consider whether their businesses are making the very
best use of their workforce and whether there are gains to be made through redeploying
people and/or restructuring jobs.

145
One way that employers can ensure that they nurture and leverage their talent is through
‘high performance working’ (HPW). This survey found that just over one in ten employers
(12 per cent) were operating HPW practices and identified a clear benefit associated with
the adoption of HPW, in that these employers were better able to fill their vacancies.
However, the proportion of employers that implement HPW has not increased since 2013
and there is clearly scope for far more employers to engage with high performance working.
This requires employers to better design jobs that match skills to work, to give employees
the autonomy to manage their own performance and to input into decision-making, as well
as a number of other practices that demonstrate a genuine commitment to unlocking staff
talent.
The survey provides a wealth of data of value to: individuals considering career options;
education institutions to plan provision with employers; employers in understanding their
market, competition and their own potential; government at all levels in understanding
their skills and labour markets. But it also raises important questions about the supply of
skills and perhaps more importantly the demand for skills in the UK. Skills are an important
currency in the global economy. At a micro, firm level, skill deficiencies, the loss of talent,
the under-use of skills and reported barriers to skill development all present important
challenges to businesses and to government. Failure to address these issues might be
damaging to the firm and ultimately to the UK economy.

146
Appendix A: Supplementary Tables
Chapter 1: Introduction
Table A.1.1 Profile of UK establishments and employment, by country, size and sector
Number of establishments
% of establishments
Number of staff % of employment
UK 1,766,838 100 27,755,204 100 Country England 1,488,171 84 23,480,832 85 Northern Ireland 54,518 3 720,932 3 Scotland 142,947 8 2,359,794 9 Wales 81,202 5 1,193,646 4 Size 2-4 907,944 51 2,383,318 9 5-24 668,618 38 6,681,330 24 25-49 101,082 6 3,466,793 12 50-99 50,432 3 3,462,806 12 100-249 26,900 2 4,084,666 15 250+ 11,812 1 7,676,291 28 Sector Agriculture 97,359 6 402,468 1 Manufacturing 100,262 6 2,371,431 9 Electricity, Gas and Water 10,151 1 294,247 1 Construction 158,790 9 1,192,840 4 Wholesale and Retail 371,231 21 4,493,603 16 Hotels and Restaurants 159,893 9 1,961,417 7 Transport and Communications 128,789 7 2,230,968 8
Financial Services 38,259 2 1,004,926 4 Business Services 363,790 21 4,786,345 17 Public Administration 19,814 1 1,356,355 5 Education 58,124 3 2,607,853 9 Health and Social Work 132,505 7 3,790,957 14 Arts and Other Services 127,871 7 1,261,794 5
Source: ONS Inter-Departmental Business Register (IDBR)

147
Table A.1.2 Classification of UK establishments, by country, size and sector
Row percentages
Unwtd Base:
Priv
ate
Sect
or
Third
Sec
tor
Publ
ic S
ecto
r
Sing
le s
ite
Mul
ti-si
te
UK 91,210 % 86 9 5 67 33 Country England 75,129 % 86 9 4 67 33 Northern Ireland 4,019 % 78 14 7 72 28 Scotland 6,035 % 83 10 7 62 38 Wales 6,027 % 84 8 7 67 33 Size 2-4 20,527 % 89 9 2 79 21 5-24 49,584 % 85 9 5 59 41 25-49 11,657 % 76 10 14 43 57 50-99 5,836 % 70 10 20 37 63 100-249 2,689 % 67 12 20 33 67 250+ 917 % 67 9 24 23 77 Sector Agriculture 3,632 % 98 1 * 92 8 Manufacturing 6,998 % 99 * * 74 26 Electricity, Gas and Water 1,041 % 94 3 3 67 33
Construction 7,474 % 100 * * 89 11 Wholesale and Retail 16,126 % 92 7 * 50 50 Hotels and Restaurants 8,920 % 92 6 1 62 38
Transport and Communications 8,936 % 95 3 1 79 21
Financial Services 2,549 % 94 4 1 56 44 Business Services 13,143 % 94 5 2 72 28 Public Administration 947 % 20 10 68 43 57 Education 5,515 % 34 22 43 64 36 Health and Social Work 8,556 % 46 40 14 52 48
Arts and Other Services 7,373 % 62 28 9 69 31
‘*’ denotes a figure larger than zero but smaller than 0.5
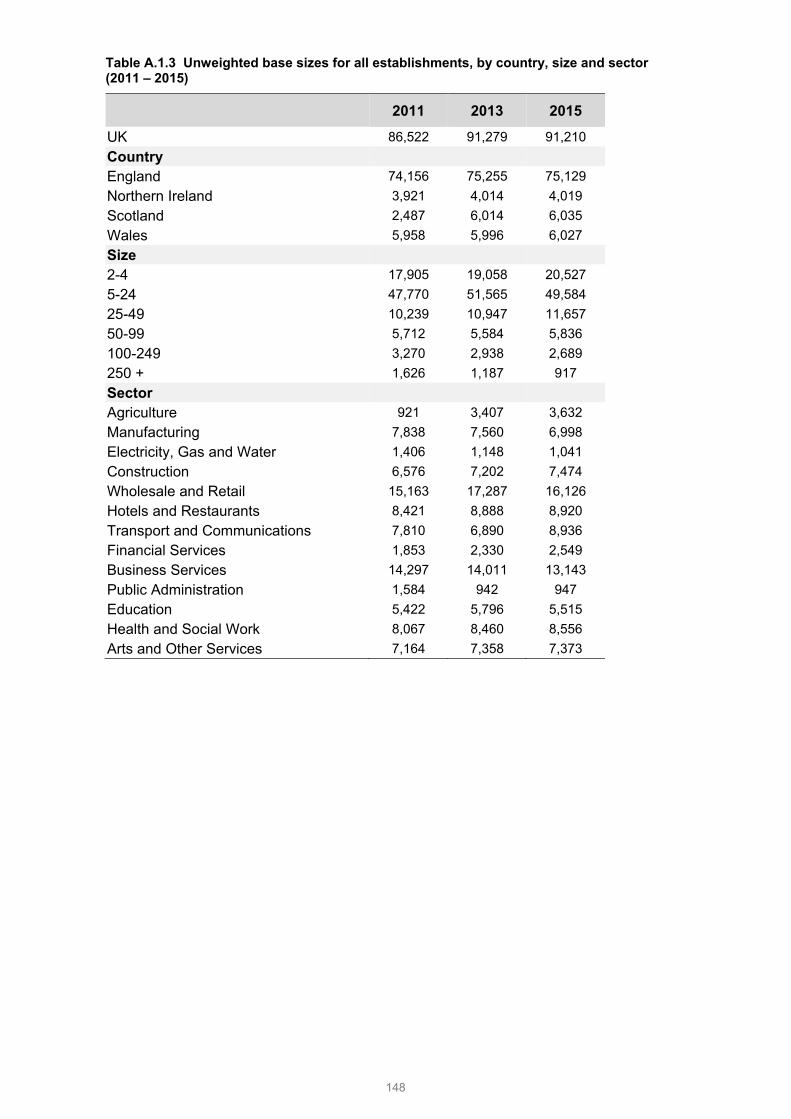
148
Table A.1.3 Unweighted base sizes for all establishments, by country, size and sector (2011 – 2015)
2011 2013 2015 UK 86,522 91,279 91,210 Country England 74,156 75,255 75,129 Northern Ireland 3,921 4,014 4,019 Scotland 2,487 6,014 6,035 Wales 5,958 5,996 6,027 Size 2-4 17,905 19,058 20,527 5-24 47,770 51,565 49,584 25-49 10,239 10,947 11,657 50-99 5,712 5,584 5,836 100-249 3,270 2,938 2,689 250 + 1,626 1,187 917 Sector Agriculture 921 3,407 3,632 Manufacturing 7,838 7,560 6,998 Electricity, Gas and Water 1,406 1,148 1,041 Construction 6,576 7,202 7,474 Wholesale and Retail 15,163 17,287 16,126 Hotels and Restaurants 8,421 8,888 8,920 Transport and Communications 7,810 6,890 8,936 Financial Services 1,853 2,330 2,549 Business Services 14,297 14,011 13,143 Public Administration 1,584 942 947 Education 5,422 5,796 5,515 Health and Social Work 8,067 8,460 8,556 Arts and Other Services 7,164 7,358 7,373

149
Chapter 2: Recruitment and skill-shortage vacancies
Table A.2.1 Incidence, number and density of vacancies by size and sector
% of establishments with a vacancy
(incidence)
Number of
vacancies
Vacancies as a % of
employment (density)
Average (mean)
vacancies per establishment with vacancies
Unwtd Base % Rounded to
nearest 100 %
UK 91,210 19 927,200 3.3 2.6 Country England 75,129 20 797,400 3.4 2.6 Northern Ireland 4,019 13 19,700 2.7 2.5 Scotland 6,035 19 73,600 3.1 2.7 Wales 6,027 17 36,500 3.1 2.6 Size 2-4 20,527 10 137,100 5.8 1.7 5-24 49,584 23 268,500 4.0 1.8 25-49 11,657 42 119,300 3.4 2.7 50-99 5,836 54 112,000 3.2 3.9 100-249 2,689 64 122,600 2.9 6.3 250+ 917 71 167,700 2.3 17.3 Sector Agriculture 3,632 5 9,900 2.5 2.0 Manufacturing 6,998 19 49,400 2.0 2.4 Electricity, Gas and Water 1,041 21 6,000 2.1 2.6 Construction 7,474 12 34,800 3.0 1.9 Wholesale and Retail 16,126 17 129,300 2.9 2.1 Hotels and Restaurants 8,920 26 104,300 5.3 2.5 Transport and Communications 8,936 19 76,800 3.4 2.9
Financial Services 2,549 18 32,100 3.2 3.7 Business Services 13,143 19 197,500 4.1 2.8 Public Administration 947 31 45,800 3.4 6.7 Education 5,515 33 55,600 2.1 2.9 Health and Social Work 8,556 30 121,200 3.2 3.0 Arts and Other Services 7,373 22 64,600 5.1 2.4
Base: All establishments
Percentages in Column 3 are shown as a proportion of all employment.
Number of vacancies rounded to the nearest 100.

150
Table A.2.2 Density of vacancies by size and sector (2013 and 2015)
Base: All establishments
Percentages are shown as a proportion of all employment.
Vacancies as % of employment
2013 2015 Unwtd Base: % Unwtd
Base %
UK 91,279 2.4 91,210 3.3 Size 2-4 19,058 4.4 20,527 5.8 5-24 51,565 2.8 49,584 4.0 25-49 10,947 2.4 11,657 3.4 50-99 5,584 2.3 5,836 3.2 100-249 2,938 2.3 2,689 2.9 250+ 1,187 1.6 917 2.3 Sector Agriculture 3,407 1.4 3,632 2.5 Manufacturing 7,560 1.6 6,998 2.0 Electricity, Gas and Water 1,148 2.1 1,041 2.1 Construction 7,202 1.8 7,474 3.0 Wholesale and Retail 17,287 1.9 16,126 2.9 Hotels and Restaurants 8,888 3.7 8,920 5.3 Transport and Communications 6,890 2.3 8,936 3.4
Financial Services 2,330 2.6 2,549 3.2 Business Services 14,011 3.2 13,143 4.1 Public Administration 942 2.4 947 3.4 Education 5,796 1.8 5,515 2.1 Health and Social Work 8,460 2.4 8,556 3.2 Arts and Other Services 7,358 3.7 7,373 5.1

151
Table A.2.3 Incidence, number and density of vacancies by occupation (2011 - 2015)
% of establishments with vacancies
who have a vacancy in occupation
Number of vacancies
Vacancies as a % of
employment (density)
Unwtd Base: Rounded to nearest 100
UnwtdBase %
2011 17,093 Managers 6 19,300 987 0.4 Professionals 14 81,900 3,025 2.6 Associate Professionals 19 96,500 3,179 5.3 Administrative and Clerical 16 57,300 2,648 1.6 Skilled Trades 14 51,900 2,219 2.8 Caring, Leisure and Other Services 13 70,000 2,556 3.0 Sales and Customer Services 14 79,300 2,275 2.3 Machine Operatives 6 35,600 1,129 1.8 Elementary occupations 15 80,500 2,844 2.0 TOTAL 586,500 2.2 2013 18,959 Managers 6 24,000 1,168 0.5 Professionals 16 97,400 3,594 3.1 Associate Professionals 19 98,500 3,406 6.3 Administrative and Clerical 15 67,100 2,760 2.0 Skilled Trades 13 50,800 2,600 2.7 Caring, Leisure and Other Services 15 100,500 3,232 3.6 Sales and Customer Services 14 76,200 2,578 2.1 Machine Operatives 6 30,100 1,197 1.6 Elementary occupations 15 79,400 3,171 2.1 TOTAL 655,000 2.4 2015 24,306 Managers 5 25,300 1,335 0.5 Professionals 14 130,100 4,047 3.8 Associate Professionals 18 131,100 4,010 7.9 Administrative and Clerical 13 89,400 3,231 2.6 Skilled Trades 16 87,100 3,814 4.5 Caring, Leisure and Other Services 15 135,600 4,309 4.6 Sales and Customer Services 13 97,700 2,971 2.8 Machine Operatives 6 60,700 1,780 2.6 Elementary occupations 17 130,800 4,491 3.5 TOTAL 927,200 3.3 Base: Column 1: all establishments with vacancies; Column 2: all establishments; Column 3: all establishments with vacancies in each occupation.
Column 4 percentages are based on all employment, rather than all establishments; figures therefore show the number of vacancies as a proportion of all employment in each occupation
Note: Vacancies are rounded to the nearest 100. Vacancy total is higher than the sum of vacancies by occupation as only six occupations per establishment were followed up.

152
Table A.2.4 Incidence, number and density of skill-shortage vacancies (SSVs), by country, size and sector
% of establishments
with a skill-shortage vacancy
Number of skill-shortage
vacancies % of vacancies which are SSVs
Unwtd Base: % Rounded to
nearest 100 Unwtd Base: %
UK 91,210 6 209,400 24,306 23 Country England 75,129 6 180,200 20,697 23 Northern Ireland 4,019 3 2,800 713 14 Scotland 6,035 6 17,700 1,619 24 Wales 6,027 6 8,800 1,277 24 Size 2-4 20,527 3 39,400 1,869 29 5-24 49,584 7 68,600 11,864 26 25-49 11,657 11 25,100 4,992 21 50-99 5,836 13 22,400 3,159 20 100-249 2,689 17 23,900 1,759 20 250+ 917 20 30,000 663 18 Sector Agriculture 3,632 2 2,100 207 22 Manufacturing 6,998 8 14,800 1,605 30 Electricity, Gas and Water 1,041 8 2,100 221 35 Construction 7,474 5 12,000 1,173 35 Wholesale and Retail 16,126 4 26,200 3,753 20 Hotels and Restaurants 8,920 7 19,400 3,420 19 Transport and Communications 8,936 7 23,700 1,993 31
Financial Services 2,549 4 6,600 472 21 Business Services 13,143 6 50,600 3,859 26 Public Administration 947 5 3,900 276 9 Education 5,515 8 9,100 2,073 16 Health and Social Work 8,556 7 25,600 3,152 21 Arts and Other Services 7,373 6 13,400 2,102 21
Base: Column 1 and 2: all establishments; Column 3: all establishments with vacancies
Percentages in Column 3 are based on all vacancies, rather than all establishments with vacancies; figures therefore show the proportion of vacancies caused by skill shortages
Notes: The number of skill-shortage vacancies has been rounded to the nearest 100

153
Table A.2.5 Density of skill-shortage vacancies, by country, size and sector (2011 - 2015)
Base: all establishments with vacancies
Percentages are based on all vacancies, rather than all establishments with vacancies; figures therefore show the proportion of vacancies caused by skill shortages
Notes: The number of skill-shortage vacancies has been rounded to the nearest 100
% of vacancies which are SSVs
2011 2013 2015 Unwtd
Base: % Unwtd Base: % Unwtd
Base: %
UK 17,093 16 18,959 22 24,306 23 Country England 14,749 15 15,894 22 20,697 23 Northern Ireland 520 21 550 19 713 14 Scotland 729 15 1,499 25 1,619 24 Wales 1,095 18 1,016 20 1,277 24 Size 2-4 1,389 21 1,403 30 1,869 29 5-24 7,869 17 8,969 26 11,864 26 25-49 2,972 18 3,653 21 4,992 21 50-99 2,241 11 2,435 19 3,159 20 100-249 1,698 14 1,737 19 1,759 20 250+ 924 8 762 15 663 18 Sector Agriculture 87 26 167 28 207 22 Manufacturing 1,460 24 1,369 30 1,605 30 Electricity, Gas and Water 205 13 185 23 221 35 Construction 575 18 706 23 1,173 35 Wholesale and Retail 2,549 14 2,983 18 3,753 20 Hotels and Restaurants 2,078 15 2,447 19 3,420 19 Transport and Communications 1,404 14 1,232 26 1,993 31
Financial Services 331 17 398 10 472 21 Business Services 2,945 17 3,147 28 3,859 26 Public Administration 402 10 283 22 276 9 Education 1,487 10 2,062 12 2,073 16 Health and Social Work 1,992 10 2,375 22 3,152 21 Arts and Other Services 1,578 21 1,605 24 2,102 21

154
Table A.2.6 Density of skill-shortage vacancies by occupation and sector
Man
ager
s
Pr
ofes
sion
als
A
ssoc
iate
Pr
ofes
sion
als
A
dmin
istr
ativ
e /
Cle
rical
sta
ff
Sk
illed
Tra
des
occu
patio
ns
C
arin
g, L
eisu
re
and
Oth
er
Serv
ices
Sale
s an
d C
usto
mer
Se
rvic
es
Mac
hine
O
pera
tives
El
emen
tary
sta
ff
UK 17 32 22 11 43 20 16 32 14
Agriculture ** ** ** ** 32 ** ** 32 14
Manufacturing 28 39 25 12 52 ** 14 23 13
Electricity, Gas and Water ** 67 42 20 46 ** ** 35 11
Construction 23 36 37 11 38 ** 25 47 32
Wholesale and Retail 18 19 32 20 51 ** 14 23 12
Hotels and Restaurants 24 ** 10 14 37 15 6 14 15
Transport and Communications 15 37 24 9 44 6 41 50 7
Financial Services 6 15 41 9 ** ** 14 ** **
Business Services 14 37 23 13 53 19 21 26 9
Public Administration ** 10 3 5 ** 14 ** ** 7
Education 6 18 14 4 14 21 ** ** 12
Health and Social Work 14 38 17 8 11 19 12 29 10
Arts and Other Services 14 20 11 14 42 24 6 52 18
Base: All establishments with vacancies within each occupation by sector
Densities are based on skill-shortage vacancies as a proportion of all vacancies within each occupation by sector, rather than the number of establishments with vacancies.
‘**’ Figure not shown because of a low base (fewer than 25 establishments with vacancies)
Where base between 25 and 49 establishments with vacancies, figures are shown in italics
= density 30% or above
= density between 15% and 29%
= density between 1% and 14%
X
X
X

155
Table A.2.6a Unweighted base sizes for previous table (Table A.2.6)
Man
ager
s
Pr
ofes
sion
als
A
ssoc
iate
Pr
ofes
sion
als
A
dmin
istr
ativ
e /
Cle
rical
sta
ff
Sk
illed
Tra
des
occu
patio
ns
C
arin
g, L
eisu
re a
nd
Oth
er S
ervi
ces
Sale
s an
d C
usto
mer
Ser
vice
s
Mac
hine
O
pera
tives
El
emen
tary
sta
ff
UK 1,335 4,047 4,010 3,231 3,814 4,309 2,971 1,780 4,491
Agriculture ** ** ** ** 40 ** ** 34 102
Manufacturing 114 175 336 206 573 ** 134 407 147
Electricity, Gas and Water ** 27 36 47 41 ** ** 63 42
Construction 73 139 178 145 563 ** 41 125 135
Wholesale and Retail 251 101 362 299 562 ** 2,048 305 441
Hotels and Restaurants 233 ** 73 212 1,044 210 84 119 2,446
Transport and Communications 65 457 490 298 267 30 195 434 135
Financial Services 35 42 153 247 ** ** 78 ** **
Business Services 176 1,066 1,310 812 440 154 218 211 359
Public Administration ** 68 105 92 ** 57 ** ** 32
Education 36 1,031 227 202 46 857 ** ** 196
Health and Social Work 177 793 352 300 118 1,912 40 36 198
Arts and Other Services 134 138 379 363 108 1,048 99 29 254
‘**’ Corresponds with the double asterisks shown in Table A.2.6 (base is fewer than 25 establishments with vacancies)

156
Table A.2.7 Skills lacking among applicants, overall and by country (prompted)
UK
Engl
and
N
orth
ern
Irela
nd
Sc
otla
nd
W
ales
Unweighted Base 3,244 2,750 78 200 216
% % % % % Technical or practical skills Specialist skills or knowledge 64 63 41 72 68 Solving complex problems 39 39 34 31 43 Knowledge of products and services offered 37 37 35 37 40 Knowledge of how the organisation works 31 30 40 35 41 Complex numerical/statistical skills 29 29 33 31 27 Reading/understanding instructions, reports etc. 26 27 20 23 31 Writing instructions, reports etc. 25 25 14 18 35 Basic numerical skills 24 25 31 16 32 Computer literacy / basic IT skills 22 23 21 17 18 Advanced or specialist IT skills 22 23 9 16 15 Adapting to new equipment or materials 20 19 25 19 31 Manual dexterity 15 15 13 16 24 Communicating in a foreign language 15 15 12 16 14 Oral Welsh language skills (Wales only base) 1 n/a n/a n/a 13 Written Welsh language skills (Wales only base) * n/a n/a n/a 12 None of the above 7 7 9 6 8 People and personal skills Ability to manage own time and prioritise tasks 47 46 46 47 57 Customer handling skills 39 38 41 41 47 Team working 33 33 36 36 45 Managing own feelings / handling those of others 32 31 32 39 41 Persuading or influencing others 31 30 33 38 32 Managing or motivating other staff 30 29 40 35 40 Sales skills 25 24 38 28 32 Instructing, teaching or training people 22 21 13 25 27 Setting objectives for others / planning resources 21 21 24 24 27 Making speeches or presentations 16 17 13 15 18 None of the above 25 26 17 15 15
Base: All establishments with skill-shortage vacancies in each occupation – up to two occupations followed up
Percentages are based on all skill-shortage vacancies, rather than all establishments with skill-shortage vacancies; proportions therefore show the percentage of skill-shortage vacancies within each occupation caused by lack of each skill.

157
Table A.2.8 Technical and practical skills lacking among applicants, overall and by occupation (prompted)
Ove
rall
Man
ager
s
Pr
ofes
sion
als
A
ssoc
iate
Pr
ofes
sion
als
A
dmin
istr
ativ
e /
Cle
rical
sta
ff
Sk
illed
Tra
des
occu
patio
ns
C
arin
g, L
eisu
re a
nd
Oth
er S
ervi
ces
Sale
s an
d C
usto
mer
Se
rvic
es
Mac
hine
Ope
rativ
es
El
emen
tary
sta
ff
Unweighted Base 3,244 131 619 474 209 777 459 226 280 315
% % % % % % % % % % Specialist skills or knowledge 64 77 72 73 59 66 63 54 57 58
Solving complex problems 39 52 33 48 42 43 32 45 35 36
Knowledge of products and services offered 37 58 30 41 50 36 33 48 26 45
Knowledge of how the organisation works 31 56 19 33 38 28 36 47 25 44
Complex numerical/statistical skills
29 24 23 36 39 30 24 28 21 30
Reading/understanding instructions, reports etc.
26 23 13 18 40 32 35 31 31 37
Writing instructions, reports etc. 25 16 22 20 33 27 36 26 19 22
Basic numerical skills 24 16 12 17 27 25 31 38 25 38 Computer literacy / basic IT skills 22 23 16 24 31 16 23 27 21 19
Advanced or specialist IT skills 22 21 34 42 36 16 12 12 8 9
Adapting to new equipment or materials 20 19 16 14 19 29 13 24 21 27
Manual dexterity 15 12 6 5 8 33 9 13 19 27 Communicating in a foreign language 15 17 11 14 8 12 21 17 14 23
Oral Welsh language skills (Wales only base)
1 1 * * 2 * 1 * 1 1
Written Welsh language skills (Wales only base)
* 1 * * 2 * 1 * 1 1
None of the above 7 2 7 6 4 6 10 4 6 10
Base: All establishments with skill-shortage vacancies in each occupation – up to two occupations followed up
Percentages are based on all skill-shortage vacancies, rather than all establishments with skill-shortage vacancies; proportions therefore show the percentage of skill-shortage vacancies within each occupation caused by lack of each skill.
Note: Column percentages exceed 100 per cent because of multiple responses; skill-shortage vacancies unable to be coded to an occupational group have been included in the “Overall” figures, though have not been included in the more detailed breakdown.

158
Table A.2.9 People and personal skills lacking among applicants, overall and by occupation (prompted)
Ove
rall
Man
ager
s
Pr
ofes
sion
als
A
ssoc
iate
Pr
ofes
sion
als
A
dmin
istr
ativ
e /
Cle
rical
sta
ff
Sk
illed
Tra
des
occu
patio
ns
C
arin
g, L
eisu
re a
nd
Oth
er S
ervi
ces
Sale
s an
d C
usto
mer
Se
rvic
es
Mac
hine
Ope
rativ
es
El
emen
tary
sta
ff
Unweighted Base 3,244 131 619 474 209 777 459 226 280 315
% % % % % % % % % % Ability to manage own time and prioritise tasks
47 52 31 43 53 48 53 54 40 64
Customer handling skills 39 50 29 35 49 27 44 72 35 54
Team working 33 38 14 25 38 35 46 37 33 51 Managing own feelings / handling those of others
32 39 16 26 35 31 42 42 28 48
Persuading or influencing others 31 48 21 46 30 24 30 52 18 39
Managing or motivating other staff 30 56 27 23 29 30 37 36 21 40
Sales skills 25 30 16 34 30 13 16 60 16 30 Instructing, teaching or training people 22 43 19 22 19 24 25 19 16 27
Setting objectives for others / planning resources
21 50 20 22 19 23 25 22 10 25
Making speeches or presentations 16 25 15 27 16 11 19 17 9 17
None of the above 25 18 34 26 18 28 21 8 35 13
Base: All establishments with skill-shortage vacancies in each occupation – up to two occupations followed up
Percentages are based on all skill-shortage vacancies, rather than all establishments with skill-shortage vacancies; proportions therefore show the percentage of skill-shortage vacancies within each occupation caused by lack of each skill.
Note: Column percentages exceed 100 per cent because of multiple responses; skill-shortage vacancies unable to be coded to an occupational group have been included in the “Overall” figures, though have not been included in the more detailed breakdown.

159
Table A.2.10 Technical or practical skills lacking among applicants, by sector (prompted)
Ove
rall
Agr
icul
ture
M
anuf
actu
ring
El
ectr
icity
, G
as &
Wat
er
C
onst
ruct
ion
W
hole
sale
&
Ret
ail
H
otel
s &
R
esta
uran
ts
Tran
spor
t &
Com
ms
Fina
ncia
l Se
rvic
es
Bus
ines
s Se
rvic
es
Publ
ic A
dmin
.
Educ
atio
n
H
ealth
&
Soci
al W
ork
A
rts
& O
ther
Se
rvic
es
Unweighted Base 3,224 30 282 44 233 413 398 339 43 608 24 230 375 225 % % % % % % % % % % % % % %
Specialist skills or knowledge 64 76 67 43 64 59 61 67 93 63 ** 61 69 54 Solving complex problems 39 60 43 66 48 41 32 51 14 46 ** 17 29 30 Knowledge of products and services 37 51 40 52 42 48 41 40 60 33 ** 24 26 29 Knowledge of how your organisation works 31 58 28 14 32 39 39 29 54 24 ** 24 28 32 More complex numerical or statistical skills 29 43 31 27 31 25 32 30 42 39 ** 13 26 16 Reading and understanding instructions etc. 26 33 27 53 36 22 38 32 16 22 ** 15 27 21 Writing instructions, guidelines etc. 25 31 24 45 35 20 28 32 13 20 ** 17 33 18 Basic numerical skills and understanding 24 51 24 49 33 21 31 29 8 20 ** 12 27 23 Computer literacy / basic IT skills 22 17 15 17 17 23 18 24 29 26 ** 18 25 16 Advanced or specialist IT skills 22 9 22 10 16 18 10 36 60 28 ** 21 16 9 Adapting to new equipment or materials 20 60 25 36 21 24 23 18 11 20 ** 6 15 14 Manual dexterity 15 45 30 14 29 22 19 13 4 11 ** 11 5 11 Communicating in a foreign language 15 16 11 13 15 16 28 12 18 8 ** 9 21 11 Oral Welsh language skills (Wales only base) 1 - * - * 1 1 * * 1 ** 1 * 1 Written Welsh language skills (Wales only base) * - * - * * 1 * * * ** 1 * 2 None of the above 7 9 8 5 10 5 10 4 2 5 ** 10 7 9
Base: All establishments with skill-shortage vacancies – up to two occupations followed up. ‘**’ Figure not shown because of a low base (fewer than 25 establishments with vacancies). Where base between 25 and 49 establishments with vacancies, figures are shown in italics. Percentages are based on all skill-shortage vacancies, rather than all establishments with skill-shortage vacancies; proportions therefore show the percentage of skill-shortage vacancies within each sector caused by lack of each skill.

160
Table A.2.11 People and personal skills lacking among applicants, by sector (prompted)
Ove
rall
Agr
icul
ture
M
anuf
actu
ring
El
ectr
icity
, Gas
&
Wat
er
C
onst
ruct
ion
W
hole
sale
&
Ret
ail
H
otel
s &
R
esta
uran
ts
Tran
spor
t &
Com
ms
Fina
ncia
l Se
rvic
es
Bus
ines
s Se
rvic
es
Publ
ic A
dmin
.
Educ
atio
n
H
ealth
& S
ocia
l W
ork
A
rts
& O
ther
Se
rvic
es
Unweighted Base 3,224 30 282 44 233 413 398 339 43 608 24 230 375 225 % % % % % % % % % % % % % %
Ability to manage own time and prioritise own tasks 47 74 42 54 51 50 58 45 35 46 ** 33 50 42
Customer handling skills 39 17 29 47 36 49 44 50 23 37 ** 21 29 54
Team working 33 36 34 44 33 31 47 34 14 32 ** 29 31 32 Managing their own feelings, or handling the feelings of others 32 21 40 14 32 30 52 29 19 30 ** 28 33 26
Persuading or influencing others 31 19 33 25 31 30 38 37 50 31 ** 21 23 27
Managing or motivating other staff 30 27 31 8 29 29 43 30 9 28 ** 30 35 24
Sales skills 25 20 22 11 18 42 25 26 24 31 ** 7 13 20
Instructing, teaching or training people 22 11 20 12 26 18 31 22 10 20 ** 27 24 18
Setting objectives for others 21 16 19 20 26 20 32 21 2 20 ** 21 29 13
Making speeches or presentations 16 3 15 19 11 13 14 17 42 19 ** 15 18 12
None of the above 25 11 30 25 23 22 18 20 25 28 ** 39 25 21
Base: All establishments with skill-shortage vacancies – up to two occupations followed up. ‘**’ Figure not shown because of a low base (fewer than 25 establishments with vacancies). Where base between 25 and 49 establishments with vacancies, figures are shown in italics. Percentages are based on all skill-shortage vacancies, rather than all establishments with skill-shortage vacancies; proportions therefore show the percentage of skill-shortage vacancies within each sector caused by lack of each skill.

161
Table A.2.12 Skills lacking among applicants, ‘old’ skills descriptor time series comparisons
2011 2013 2015
Unweighted Base 3,955 4,869 3,587 % % %
Technical, practical or job-specific 46 63 66
Planning and organisation 40 41 36
Team working 31 33 30
Customer handling 39 40 36
Problem solving 36 37 33
Oral communication 37 41 34
Written communication 33 38 32
Basic computer literacy / using IT 15 16 18
Strategic Management 28 30 28
Literacy 28 34 28
Advanced IT or software 20 22 22
Numeracy 24 26 24
Foreign language 16 17 15
Oral Welsh language skills (Wales only base) 2 * 1
Written Welsh language skills (Wales only base) 2 1 1
None of the above 8 4 7 Base: All establishments with skill-shortage vacancies in each occupation – up to two occupations followed up. Percentages are based on all skill-shortage vacancies, rather than all establishments with skill-shortage vacancies; proportions therefore show the percentage of skill-shortage vacancies within each sector caused by lack of each skill. ‘*’ denotes a figure greater than zero but smaller than 0.5.

162
Table A.2.12a Skills lacking among applicants, ‘old’ skills descriptor nation comparisons
UK England Northern Ireland Scotland Wales
Unweighted Base 3,587 3,051 94 253 189 % % % % %
Technical, practical or job-specific 66 68 57 57 61
Planning and organisation 36 36 42 29 50
Team working 30 30 44 29 35
Customer handling 36 37 43 30 43
Problem solving 33 32 54 28 40
Oral communication 34 34 34 31 38
Written communication 32 32 34 29 31 Basic computer literacy / using IT 18 18 24 10 29
Strategic Management 28 28 46 21 31
Literacy 28 28 31 28 25
Advanced IT or software 22 23 30 12 22
Numeracy 24 25 29 17 24
Foreign language 15 15 14 15 16 Oral Welsh language skills (Wales base only) 1 n/a n/a n/a 16
Written Welsh language skills (Wales base only) 1 n/a n/a n/a 15
None of the above 7 6 7 12 9 Base: All establishments with skill-shortage vacancies in each occupation – up to two occupations followed up Percentages are based on all skills gaps, rather than all establishments with skills gaps; proportions therefore show the percentage of skills gaps attributed to each skill.

163
Table A.2.13 Proportion of Construction employers that reported a loss of business to competitors as an impact of skill-shortage vacancies, by size
Row percentages Unwtd Base
Lose business or orders to competitors
Size 2-4 87 % 61 5-24 267 % 51 25-49 52 % 46 50-99 31 % 59 100-249 7 % ** 250+ 2 % **
Base: All Construction establishments where hard-to-fill vacancies were caused by skill shortages “**” denotes figure not shown because of a low base (fewer than 25 respondents); Figures in italics show base is below 50 and figures should be treated with caution.

164
Table A.2.14 Most common impacts of skill-shortage vacancies (prompted), by country, size and sector
Prompted impacts
Row percentages Unwtd Base
Any
impa
ct
Incr
ease
wor
kloa
d fo
r ot
her s
taff
Hav
e di
fficu
lties
mee
ting
cust
omer
ser
vice
s ob
ject
ives
Lo
se b
usin
ess
or o
rder
s to
co
mpe
titor
s
Expe
rienc
e in
crea
sed
oper
atin
g co
sts
Del
ay d
evel
opin
g ne
w
prod
ucts
or s
ervi
ces
Hav
e di
fficu
lties
mee
ting
qual
ity s
tand
ards
Hav
e di
fficu
lties
in
trod
ucin
g ne
w w
orki
ng
prac
tices
UK 6,469 % 94 84 49 43 42 40 35 35 Country England 5,495 % 94 84 49 42 42 40 35 34 Northern Ireland 162 % 92 83 43 38 47 34 40 42 Scotland 432 % 95 84 48 45 43 40 37 36 Wales 380 % 97 84 57 49 46 44 36 40 Size 2-4 619 % 95 81 51 54 38 46 35 38 5-24 3,363 % 94 84 49 42 41 40 34 34 25-49 1,202 % 95 88 48 33 46 35 36 31 50-99 707 % 95 86 47 32 53 31 37 33 100-249 413 % 95 85 45 21 56 33 41 32 250+ 165 % 94 89 43 25 60 28 33 43 Sector Agriculture 65 % 98 92 18 25 51 28 33 42 Manufacturing 594 % 95 87 56 44 48 45 30 36 Electricity, Gas & Water 75 % 97 86 53 39 45 32 18 24
Construction 446 % 96 83 52 56 50 44 35 38 Wholesale & Retail 811 % 94 83 53 46 37 34 34 30
Hotels & Restaurants 753 % 93 85 52 41 41 37 45 40
Transport & Comms. 690 % 95 86 53 46 48 52 34 33
Financial Services 106 % 96 88 43 37 30 42 36 47 Business Services 1,232 % 95 83 51 49 39 43 32 32 Public Administration 40 % 94 85 36 24 41 34 35 37
Education 456 % 95 88 37 24 51 39 45 34 Health & Social Work 752 % 93 83 37 22 49 33 33 43
Arts and Other Services 449 % 93 79 49 48 35 43 41 32
Base: All establishments with hard-to-fill vacancies that were all as a result of skill shortages

165
Table A.2.15 Profile of hard-to-fill vacancies, by country, size and sector
Total number of hard-to-fill
vacancies
% of vacancies hard-to-fill
Average number of hard-to-fill
vacancies for those with hard-to-fill vacancies
Average number of hard-to-fill
vacancies for those with vacancies
Unwtd base %
UK 24,306 303,200 33 2.2 0.9
Country England 20,697 262,300 33 2.3 0.9 Northern Ireland 713 4,200 21 1.7 0.6 Scotland 1,619 24,600 34 2.2 0.9 Wales 1,277 12,100 33 2.1 0.9
Size 2-4 1,869 59,700 44 1.6 0.7 5-24 11,864 101,500 38 1.7 0.7 25-49 4,992 36,200 30 2.3 0.8 50-99 3,159 33,500 30 3.5 1.2 100-249 1,759 33,700 28 5.3 1.8 250+ 663 38,600 23 12.2 4.1
Sector Agriculture 207 3,000 30 1.3 0.6 Manufacturing 1,605 17,500 36 1.9 0.9 Electricity, Gas and Water 221 2,300 39 2.6 1.1 Construction 1,173 15,000 43 1.8 0.8 Wholesale and Retail 3,753 38,200 30 1.8 0.6 Hotels and Restaurants 3,420 34,000 33 2.1 0.8 Transport and Communications 1,993 28,200 37 2.5 1.1
Financial Services 472 7,400 23 3.7 1.0 Business Services 3,859 65,300 33 2.3 1.0 Public Administration 276 12,300 27 5.7 1.8 Education 2,073 12,700 23 2.0 0.7
Health and Social Work 3,152 42,900 35 2.8 1.1 Arts and Other Services 2,102 25,400 39 2.4 0.9
Base: All establishments with vacancies
Notes: The number of hard-to-fill vacancies has been rounded to the nearest 100

166
Table A.2.16 Main causes of hard-to-fill vacancies
Country Size Band
UK
Engl
and
Nor
ther
n Ire
land
Sc
otla
nd
Wal
es
2-4
5-24
25-4
9
50-9
9
100-
249
250+
% % % % % % % % % % %
Unweighted Base 9,223 7,857 228 612 526 869 4,733 1,735 1,085 585 216
Low number of applicants with the required skills 37 37 40 38 40 38 36 36 33 42 41
Not enough people interested in doing this type of job 20 20 19 18 24 22 21 20 25 16 15
Low number of applicants generally 18 19 10 13 19 20 18 19 23 16 13
Lack of work experience the company demands 16 16 9 14 19 18 15 14 14 14 16
Poor terms and conditions (e.g. pay) offered for post 13 13 16 15 10 8 12 15 16 19 16
Low number of applicants with the required attitude, motivation or personality
13 13 8 12 16 15 14 14 11 8 10
Lack of qualifications the company demands 12 12 11 15 16 13 11 13 13 10 15
Remote location/poor public transport 11 10 4 19 8 9 10 12 12 10 14
Too much competition from other employers 10 10 14 12 6 10 7 10 14 10 15
Job entails shift work/unsociable hours 9 9 3 10 9 10 11 11 8 9 5
Base: All establishments with hard-to-fill vacancies
Percentages are based on all hard-to-fill vacancies.
Reasons mentioned in more than one per cent of cases shown.

167
Table A.2.17 Number and density of ‘other’ non-skills-related hard-to-fill vacancies by country, size and sector
Number of ‘other’ hard-to-fill vacancies
% of vacancies that are hard-to-fill for ‘other’ non-skills related reasons
Row percentages Unwtd Base Rounded to nearest 100 %
UK 9,223 93,800 10 Country England 7,857 82,200 10 Northern Ireland 228 1,400 7 Scotland 612 6,900 9 Wales 526 3,300 9 Size 2-4 869 20,300 15 5-24 4,733 32,900 12 25-49 1,735 11,100 9 50-99 1,085 11,100 10 100-249 585 9,800 8 250+ 216 8,500 5 Sector Agriculture 98 900 9 Manufacturing 742 2,700 6 Electricity, Gas and Water 86 200 4 Construction 552 3,000 9 Wholesale and Retail 1,154 12,000 9 Hotels and Restaurants 1,288 14,600 14 Transport and Communications 887 4,500 6 Financial Services 133 700 2 Business Services 1,534 14,700 7 Public Administration 78 8,400 18 Education 666 3,600 6 Health and Social Work 1,242 16,300 13 Arts and Other Services 763 12,000 19
Base: Establishments with vacancies.
Percentages are based on all vacancies, rather than all establishments with vacancies; proportions therefore show the percentage of vacancies that are hard-to-fill for non-skills related reasons
‘**’ denotes figure not shown because of a low base (fewer than 25 respondents)

168
Table A.2.18 Density of ‘other’ non-skills-related hard-to-fill vacancies by occupation (2013 and 2015)
% of vacancies in each occupations that are hard-to-fill for ‘other’ non-skills related reasons
2013 2015 Unwtd
Base: % Unwtd Base: %
Managers 1,168 5 1,335 6 Professionals 3,594 5 4,047 8 Associate Professionals 3,406 5 4,010 8 Administrative and Clerical 2,760 3 3,231 5 Skilled Trades 2,600 8 3,814 10 Caring, Leisure and Other Services 3,232 9 4,309 19 Sales and Customer Services 2,578 6 2,971 7 Machine Operatives 1,197 11 1,780 10 Elementary occupations 3,171 10 4,717 12
Base: All establishments
Percentages are shown as a proportion of all employment.

169
Table A.2.19 Incidence of retention difficulties by size and sector (2011 and 2015)*
% of establishments reporting retention issues
Row percentages
2011 (excluding Scotland)
2015 (excluding Scotland)
2015
Unwtd Base % Unwtd Base % Unwtd Base %
Overall 85,069 5 42,787 8 45,818 8 Size 2-4 18,642 4 9,697 5 10,339 5 5-24 46,875 7 23,313 10 24,835 10 25-49 15,136 9 5,451 15 5,907 15 50-99 2,947 12 2,707 18 2,950 19 100-249 1,469 17 1,208 22 1,332 22 250+ 18,642 4 411 30 455 30 Sector Agriculture 850 5 1,590 7 1,853 7 Manufacturing 7,690 5 3,269 8 3,477 9 Electricity, Gas and Water 1,344 4 438 10 514 10
Construction 6,423 3 3,471 7 3,713 6 Wholesale and Retail 15,022 4 7,697 6 8,164 6 Hotels and Restaurants 8,251 10 4,229 15 4,530 14
Transport and Communications 7,660 5 4,213 8 4,501 9
Financial Services 1,790 4 1,162 6 1,268 6 Business Services 14,142 4 6,229 7 6,629 7 Public Administration 1,480 7 402 12 459 13 Education 5,275 5 2,635 11 2,808 11 Health and Social Work 7,953 7 3,908 11 4,189 11
Arts and Other Services 7,189 7 3,499 10 3713 10
Base: 2011 – All establishments in England, NI and Wales; 2015 ‒ All establishments in Module 2.
*Note: retention difficulties were last covered by the Employer Skills Survey in 2011. For that survey, due to differing policy priorities and constraints on the length of the questionnaire, employers in Scotland were not asked to describe their experience of retention difficulties. As such, no Scotland or UK-wide data is available for time series comparisons.

170
Table A.2.20 Incidence of retention difficulties for each occupation by sector
Man
ager
s
Pr
ofes
sion
als
A
ssoc
iate
Pr
ofes
sion
als
A
dmin
istr
ativ
e /
Cle
rical
sta
ff
Sk
illed
Tra
des
occu
patio
ns
C
arin
g, L
eisu
re a
nd
Oth
er S
ervi
ces
Sale
s an
d C
usto
mer
Se
rvic
es
Mac
hine
Ope
rativ
es
El
emen
tary
sta
ff
Unwtd Base
UK 4,924 2 11 10 4 21 13 9 8 20 Agriculture 127 1 - 1 1 12 4 - 9 70
Manufacturing 343 2 6 12 2 40 - 3 25 10 Electricity, Gas and Water 50 1 7 8 3 19 - 10 37 14
Construction 279 2 3 5 4 53 - 3 10 19
Wholesale and Retail 685 6 1 6 1 23 1 38 12 11 Hotels and Restaurants 846 1 * * 1 40 4 2 1 51
Transport and Communications 470 2 13 13 7 15 * 10 32 6
Financial Services 70 6 5 15 33 1 3 27 - 7
Business Services 624 2 19 25 8 15 4 6 5 15
Public Administration 53 2 29 18 8 5 27 3 1 5
Education 353 * 50 9 1 1 20 - * 18 Health and Social Work 572 2 29 4 4 1 53 1 1 6
Arts and Other Services 452 1 3 10 7 7 56 2 2 11
Base: All establishments with difficulties retaining staff (Module 2); ‘*’ denotes a figure greater than zero but smaller than 0.5. ‘-‘ denotes a figure of zero.

171
Chapter 3: The Internal Skills Challenge
Table A.3.1 Incidence, number and density of skills gaps, by size and sector (2011-2015)
2011 2013 2015 %
of e
stab
lishm
ents
with
an
y sk
ills
gaps
Num
ber o
f sta
ff no
t ful
ly
prof
icie
nt (s
kills
gap
s)
% o
f sta
ff re
port
ed a
s ha
ving
ski
lls g
aps
% o
f est
ablis
hmen
ts w
ith
any
skill
s ga
ps
Num
ber o
f sta
ff no
t ful
ly
prof
icie
nt (s
kills
gap
s)
% o
f sta
ff re
port
ed a
s ha
ving
ski
lls g
aps
% o
f est
ablis
hmen
ts w
ith
any
skill
s ga
ps
Num
ber o
f sta
ff no
t ful
ly
prof
icie
nt (s
kills
gap
s)
% o
f sta
ff re
port
ed a
s ha
ving
ski
lls g
aps
Row percentages
UK 17 1,485,500 5.5 15 1,409,900 5.2 14 1,380,200 5.0 Size 2-4 8 85,600 3.6 7 69,900 2.9 6 62,100 2.6 5-24 23 352,800 5.5 21 315,600 4.9 19 287,000 4.3 25-49 35 185,200 5.5 32 169,500 5.1 30 158,000 4.5 50-99 39 186,900 5.5 36 178,100 5.2 33 155,700 4.5 100-249 44 235,800 5.8 44 221,100 5.5 39 216,900 5.1 250 + 47 439,100 6.0 48 455,700 6.2 43 500,400 6.7 Sector Agriculture 11 17,200 4.6 9 16,700 4.4 7 11,800 2.9 Manufacturing 20 146,900 5.9 17 138,800 5.9 19 173,400 7.2 Electricity, Gas and Water 19 15,400 5.6 18 14,400 5.1 14 13,900 4.9
Construction 13 64,900 4.8 11 59,100 4.7 10 44,500 3.8 Wholesale and Retail 19 293,500 6.6 17 254,400 5.8 16 242,200 5.4
Hotels and Restaurants 23 155,600 9.0 21 159,400 8.9 19 140,100 7.2
Transport and Communications 15 99,300 4.6 13 94,500 4.4 12 108,900 4.9
Financial Services 21 46,000 4.4 19 83,800 8.1 16 36,400 3.7 Business Services 13 220,900 5.1 13 224,100 5.0 12 249,300 5.2 Public Administration 23 83,000 5.3 20 69,000 4.8 23 86,000 6.4
Education 22 94,900 3.8 18 97,700 3.8 19 103,700 4.0 Health and Social Work 20 180,200 5.2 19 143,600 4.0 15 122,700 3.2
Arts and Other Services 16 67,800 5.6 14 54,200 4.4 12 47,400 3.8
Note: The number of employees not fully proficient has been rounded to the nearest 100.
Percentages are based on all employment, rather than all establishments; proportions therefore show the percentage of staff with a skills gap. See Table A.1.3 in Annex A for base sizes.

172
Table A.3.2 Density of skills gaps by sector within nation (2013-2015)
England Northern Ireland Scotland Wales
2013 2015 2013 2015 2013 2015 2013 2015
% % % % % % % %
All sectors 5.1 5.0 5.2 3.3 5.9 5.0 5.8 4.5 Agriculture 4.1 3.0 6.6 2.8 5.5 2.6 2.9 2.3
Manufacturing 5.4 6.8 5.9 4.2 7.9 10.5 10.2 8.8 Electricity, Gas and Water 5.4 5.4 4.3 0.8 4.8 2.1 1.8 4.7
Construction 4.8 3.7 4.6 2.8 3.9 4.3 4.6 4.8
Wholesale and Retail 5.7 5.4 6.6 5.7 5.9 5.5 5.2 3.6
Hotels and Restaurants 8.8 7.2 8.0 6.1 9.0 7.2 10.2 6.9 Transport and Communications 4.4 5.0 2.7 2.2 5.8 4.7 3.9 3.7
Financial Services 8.9 3.6 2.3 1.9 1.7 4.3 5.2 4.2
Business Services 5.1 5.2 3.4 2.2 5.0 5.2 4.4 6.3
Public Administration 5.1 7.6 4.2 0.2 4.2 2.1 1.8 1.8
Education 3.6 4.0 1.8 1.3 6.3 5.3 5.3 2.4
Health and Social Work 3.4 3.3 7.2 3.3 6.5 2.7 6.6 3.5
Arts and Other Services 4.4 3.8 4.2 2.9 5.2 3.9 4.0 3.8
Base: All establishments
Densities are based on skills gaps as a proportion of all employment within each occupation by sector, rather than the number of establishments with skills gaps.
Where base between 25 and 49 establishments, figures are shown in italics

173
Table A.3.2a Unweighted base sizes for previous table (Table 3.2)
England Northern Ireland Scotland Wales
2013 2015 2013 2015 2013 2015 2013 2015
All sectors 75,255 75,129 4,014 4,019 6,014 6,035 5,996 6,027 Agriculture 2,263 2,651 133 84 519 492 492 405
Manufacturing 6,389 5,821 327 339 430 411 414 427
Electricity, Gas and Water 935 880 43 29 86 70 84 62
Construction 5,980 6,334 259 246 496 489 467 405
Wholesale and Retail 14,321 13,126 866 859 991 938 1,109 1,203
Hotels and Restaurants 7,314 7,274 385 415 571 582 618 649
Transport and Communications 5,743 7,538 282 289 446 583 419 526
Financial Services 1,886 2,121 112 93 205 227 127 108
Business Services 12,000 11,158 491 507 784 763 736 715
Public Administration 696 721 55 49 124 102 67 75
Education 4,756 4,549 292 267 354 338 394 361
Health and Social Work 6,882 6,963 408 382 568 594 602 617
Arts and Other Services 6,090 5,993 361 460 440 446 467 474

174
Table A.3.3 Proportion of each occupation lacking full proficiency within country
UK England Northern Ireland Scotland Wales
% % % % %
Managers 2.7 2.8 1.2 1.9 2.2
Professionals 3.0 3.0 1.2 3.4 3.0
Associate Professionals 5.3 5.5 2.1 4.6 4.9
Administrative / Clerical staff 5.4 5.6 1.9 4.8 3.5
Skilled Trades occupations 5.5 5.3 4.1 7.4 5.5
Caring, Leisure and Other Services 4.1 4.1 4.6 3.5 5.0
Sales and Customer Services 6.5 6.6 4.6 6.8 5.2
Machine Operatives 7.0 6.8 6.3 8.7 7.4
Elementary staff 6.9 7.1 4.4 6.3 5.8
Base: All establishments with staff in each occupation
Percentages are based on all employment, rather than all establishments; proportions therefore show the percentage of staff with a skills gap.
Where base between 25 and 49 establishments with gaps, figures are shown in italics
Table A.3.3a Unweighted base sizes for previous table (Table A.3.3)
UK England Northern Ireland Scotland Wales
Managers 3,492 2,960 94 237 201
Professionals 1,518 1,281 42 129 66
Associate Professionals 1,473 1,262 28 110 73
Administrative / Clerical staff 4,301 3,627 117 333 224
Skilled Trades occupations 3,142 2,639 66 242 195
Caring, Leisure and Other Services 2,308 1,994 46 133 135
Sales and Customer Services 4,540 3,804 163 292 281
Machine Operatives 1,813 1,499 71 141 102
Elementary staff 4,533 3,791 129 353 260

175
Table A.3.4 Density of skills gaps by occupation and sector
Man
ager
s
Pr
ofes
sion
als
A
ssoc
iate
Pr
ofes
sion
als
A
dmin
istr
ativ
e an
d C
leric
al
Sk
illed
Tra
des
C
arin
g, L
eisu
re
and
Oth
er S
ervi
ces
Sale
s an
d C
usto
mer
Ser
vice
Mac
hine
O
pera
tives
El
emen
tary
oc
cupa
tions
UK 2.7 3.0 5.3 5.4 5.5 4.1 6.5 7.0 6.9
Agriculture 1.1 ** ** ** 4.3 ** ** 4.4 4.7
Manufacturing 4.0 4.4 5.5 4.9 7.1 ** 7.9 10.5 5.8
Electricity, Gas and Water 2.6 ** ** 2.9 4.1 ** ** 6.3 3.2
Construction 1.3 3.5 6.0 3.2 5.6 ** 3.5 5.0 5.6
Wholesale and Retail 2.7 2.6 4.8 4.5 5.6 ** 6.3 5.4 7.0
Hotels and Restaurants 2.9 ** 11.5 5.1 5.9 5.0 8.5 9.7 8.8
Transport and Communications 3.7 3.5 4.6 7.1 6.7 ** 6.4 4.5 4.2
Financial Services 1.9 ** 3.1 5.7 ** ** 5.1 ** **
Business Services 1.9 3.0 6.8 4.6 5.8 13.4 7.8 6.0 10.6
Public Administration 6.8 3.1 6.7 9.9 ** ** ** ** 5.9
Education 2.6 4.0 5.1 4.8 4.0 3.4 6.6 ** 4.5
Health and Social Work 3.3 1.4 2.8 4.8 1.4 3.7 5.1 ** 2.5
Arts and Other Services 1.7 2.0 2.9 4.4 3.9 4.3 3.7 1.9 6.2
Base: All establishments employing each occupation by sector
Densities are based on skills gaps as a proportion of all employment within each occupation by sector, rather than the number of establishments with skills gaps.
‘**’ Figure not shown because of a low base (fewer than 25 establishments employing occupation)
Where base between 25 and 49 establishments with gaps, figures are shown in italics
= density 9% or above
= density between 5% and 8%
= density between 1% and 4%
X
X
X

176
Table A.3.4a Unweighted base sizes for previous table (Table A.3.4)
Man
ager
s
Pr
ofes
sion
als
A
ssoc
iate
Pr
ofes
sion
als
A
dmin
istr
ativ
e /
Cle
rical
sta
ff
Sk
illed
Tra
des
occu
patio
ns
C
arin
g, L
eisu
re a
nd
Oth
er S
ervi
ces
Sale
s an
d C
usto
mer
Ser
vice
s
Mac
hine
O
pera
tives
El
emen
tary
sta
ff
UK 3,492 1,518 1,473 4,301 3,142 2,308 4,540 1,813 4,533
Agriculture 64 ** ** ** 44 ** ** 40 142
Manufacturing 342 95 178 423 557 ** 305 653 286 Electricity, Gas and Water 37 ** ** 44 39 ** ** 51 41
Construction 195 35 67 253 576 ** 74 115 170
Wholesale and Retail 815 62 138 559 445 ** 2,312 355 665
Hotels and Restaurants 601 ** 32 198 513 104 486 64 1856 Transport and Communications 243 185 173 376 298 ** 312 202 152
Financial Services 62 ** 47 223 ** ** 182 ** **
Business Services 432 478 458 960 373 94 530 258 285
Public Administration 46 32 40 114 ** ** ** ** 33
Education 182 367 125 361 67 603 54 ** 332
Health and Social Work 238 157 95 410 72 1,044 51 ** 267
Arts and Other Services 235 59 101 358 137 406 193 35 298
‘**’ Corresponds with the double asterisks shown in Table A.3.4 (base is fewer than 25 establishments)

177
Table A.3.5 Main causes of skills gaps, by sector
Ove
rall
Agr
icul
ture
M
anuf
actu
ring
El
ectr
icity
, Gas
&
Wat
er
C
onst
ruct
ion
W
hole
sale
&
Ret
ail
H
otel
s &
R
esta
uran
ts
Tran
spor
t &
Com
ms
Fina
ncia
l Se
rvic
es
Bus
ines
s Se
rvic
es
Publ
ic A
dmin
.
Educ
atio
n
H
ealth
& S
ocia
l W
ork
A
rts
& O
ther
Se
rvic
es
Unweighted Base 18,265 292 1,697 163 1,132 3,669 2,610 1,345 435 2,601 200 1,211 1,663 1,247
% % % % % % % % % % % % % %
They are new to the role 60 51 65 75 58 63 72 51 71 55 57 52 58 59 Their training is currently only partially completed 56 45 66 73 68 55 64 42 59 53 48 51 56 59
Staff lack motivation 34 34 31 22 23 38 39 38 20 35 17 34 38 32 They have been on training but their performance has not improved sufficiently 29 25 25 24 22 33 38 25 24 23 33 32 37 28
The introduction of new working practices 28 19 26 18 23 24 23 31 19 25 57 39 35 25
They have not received the appropriate training 26 29 30 46 24 27 25 30 17 23 24 23 27 27
Unable to recruit staff with the required skills 26 32 31 26 28 22 33 29 14 24 12 28 29 25
The introduction of new technology 20 20 19 13 16 19 12 24 9 18 49 20 27 20
The development of new products and services 19 10 25 15 17 18 18 26 15 13 38 19 14 15
Problems retaining staff 18 14 14 14 13 15 29 24 17 17 18 12 19 17 Summary: New to role / training not complete (transient factors) 73 63 79 82 79 76 82 63 78 67 62 65 70 77
Base: All establishments with skills gaps – up to two occupations followed up
Percentages are based on all skills gaps, rather than all establishments with skills gaps; proportions therefore show the percentage of skills gaps attributed to each cause.

178
Table A.3.6 Main causes of skills gaps, by occupation
Man
ager
s
Prof
essi
onal
s
Ass
ocia
te
Prof
essi
onal
s
Adm
inis
trat
ive
and
Cle
rical
Skill
ed T
rade
s
Car
ing,
Le
isur
e an
d O
ther
Ser
vice
s
Sale
s an
d C
usto
mer
Se
rvic
es
Mac
hine
O
pera
tives
Elem
enta
ry
occu
patio
ns
% % % % % % % % % Unweighted Base 7,090 6,829 5,280 8,514 7,552 9,904 17,019 9,088 19,904 They are new to the role 45 63 65 56 58 59 70 58 61 Their training is currently only partially completed 41 61 62 55 70 56 55 62 52
Staff lack motivation 33 25 19 23 26 31 38 32 50 They have been on training but their performance has not improved sufficiently 29 22 23 26 21 32 36 24 36
The introduction of new working practices 36 32 32 39 22 35 24 25 21 They have not received the appropriate training 37 25 25 26 29 24 24 26 23
Unable to recruit staff with the required skills 18 31 22 17 33 29 22 28 31
The introduction of new technology 30 24 27 34 22 16 18 17 10 The development of new products and services 27 23 23 20 18 12 22 17 14
Problems retaining staff 12 18 17 11 18 20 20 13 24 Summary: New to role / training not complete (transient factors) 57 76 78 69 81 71 78 73 71
Base: All establishments with skills gaps in each occupation – up to two occupations followed up
Percentages are based on all skills gaps, rather than all establishments with skills gaps; proportions therefore show the percentage of skills gaps attributed to each cause.
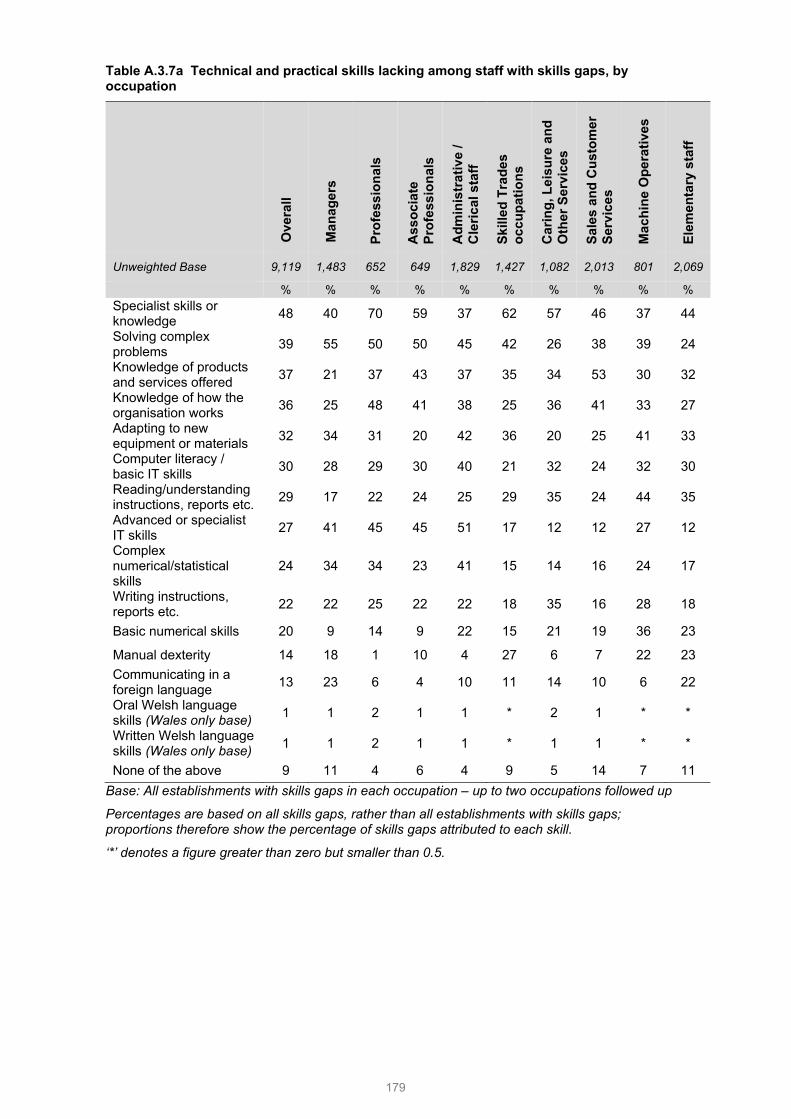
179
Table A.3.7a Technical and practical skills lacking among staff with skills gaps, by occupation
Ove
rall
Man
ager
s
Pr
ofes
sion
als
A
ssoc
iate
Pr
ofes
sion
als
A
dmin
istr
ativ
e /
Cle
rical
sta
ff
Sk
illed
Tra
des
occu
patio
ns
C
arin
g, L
eisu
re a
nd
Oth
er S
ervi
ces
Sale
s an
d C
usto
mer
Se
rvic
es
Mac
hine
Ope
rativ
es
El
emen
tary
sta
ff
Unweighted Base 9,119 1,483 652 649 1,829 1,427 1,082 2,013 801 2,069
% % % % % % % % % % Specialist skills or knowledge 48 40 70 59 37 62 57 46 37 44
Solving complex problems 39 55 50 50 45 42 26 38 39 24
Knowledge of products and services offered 37 21 37 43 37 35 34 53 30 32
Knowledge of how the organisation works 36 25 48 41 38 25 36 41 33 27
Adapting to new equipment or materials 32 34 31 20 42 36 20 25 41 33
Computer literacy / basic IT skills 30 28 29 30 40 21 32 24 32 30
Reading/understanding instructions, reports etc. 29 17 22 24 25 29 35 24 44 35
Advanced or specialist IT skills 27 41 45 45 51 17 12 12 27 12
Complex numerical/statistical skills
24 34 34 23 41 15 14 16 24 17
Writing instructions, reports etc. 22 22 25 22 22 18 35 16 28 18
Basic numerical skills 20 9 14 9 22 15 21 19 36 23
Manual dexterity 14 18 1 10 4 27 6 7 22 23 Communicating in a foreign language 13 23 6 4 10 11 14 10 6 22
Oral Welsh language skills (Wales only base) 1 1 2 1 1 * 2 1 * *
Written Welsh language skills (Wales only base) 1 1 2 1 1 * 1 1 * *
None of the above 9 11 4 6 4 9 5 14 7 11 Base: All establishments with skills gaps in each occupation – up to two occupations followed up
Percentages are based on all skills gaps, rather than all establishments with skills gaps; proportions therefore show the percentage of skills gaps attributed to each skill.
‘*’ denotes a figure greater than zero but smaller than 0.5.

180
Table A.3.7b People and personal skills lacking among staff with skills gaps, by occupation
Ove
rall
Man
ager
s
Pr
ofes
sion
als
A
ssoc
iate
Pr
ofes
sion
als
A
dmin
istr
ativ
e /
Cle
rical
sta
ff
Sk
illed
Tra
des
occu
patio
ns
C
arin
g, L
eisu
re a
nd
Oth
er S
ervi
ces
Sale
s an
d C
usto
mer
Se
rvic
es
Mac
hine
Ope
rativ
es
El
emen
tary
sta
ff
Unweighted Base 9,119 1,483 652 649 1,829 1,427 1,082 2,013 801 2,069
% % % % % % % % % % Ability to manage own time and prioritise tasks
59 57 68 57 67 54 58 58 53 59
Team working 56 53 54 42 56 46 56 48 62 69 Customer handling skills 46 33 51 33 63 26 38 64 26 50
Managing own feelings / handling those of others
46 56 49 34 47 36 47 42 50 47
Managing or motivating other staff 41 68 49 47 31 31 34 33 45 40
Persuading or influencing others 39 58 52 43 35 27 28 41 39 37
Setting objectives for others / planning resources
30 60 36 46 38 20 16 21 33 18
Instructing, teaching or training people 28 42 43 28 20 27 30 22 35 23
Sales skills 23 25 24 21 17 12 11 53 6 23 Making speeches or presentations 17 27 27 31 15 10 13 13 14 12
None of the above 12 8 11 12 9 23 11 14 14 9 Base: All establishments with skills gaps in each occupation – up to two occupations followed up Percentages are based on all skills gaps, rather than all establishments with skills gaps; proportions therefore show the percentage of skills gaps attributed to each skill.
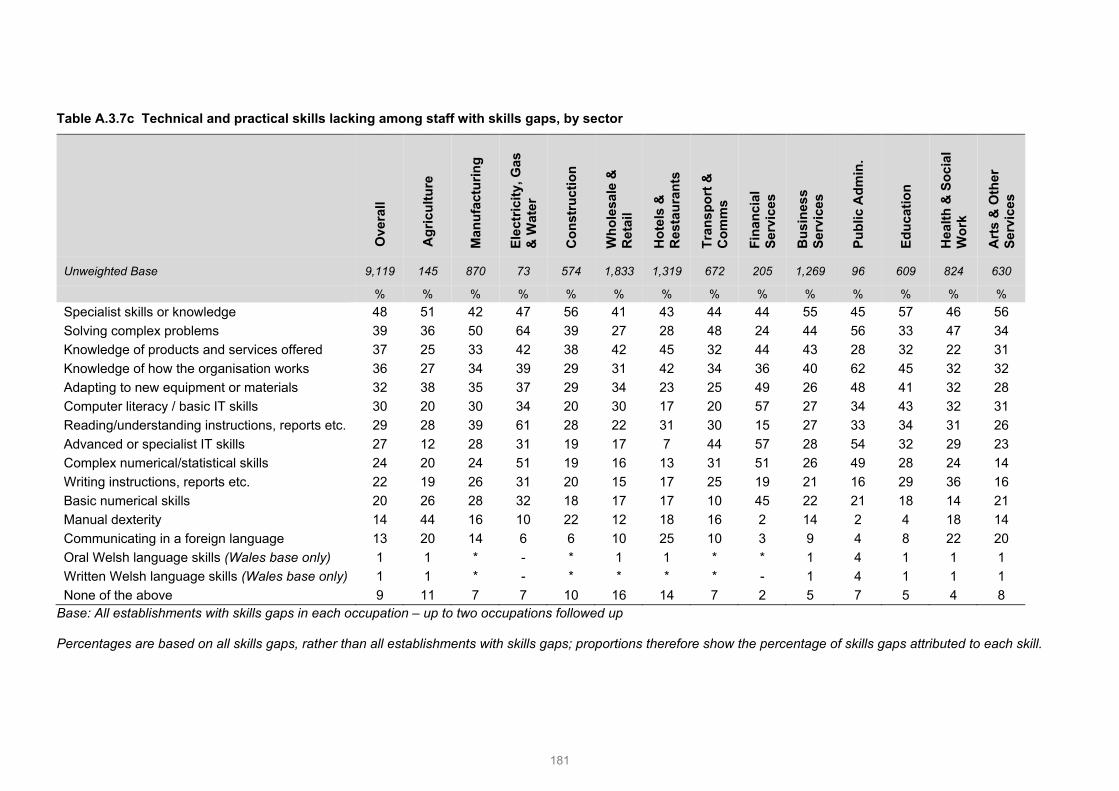
181
Table A.3.7c Technical and practical skills lacking among staff with skills gaps, by sector
Ove
rall
Agr
icul
ture
M
anuf
actu
ring
El
ectr
icity
, Gas
&
Wat
er
C
onst
ruct
ion
W
hole
sale
&
Ret
ail
H
otel
s &
R
esta
uran
ts
Tran
spor
t &
Com
ms
Fina
ncia
l Se
rvic
es
Bus
ines
s Se
rvic
es
Publ
ic A
dmin
.
Educ
atio
n
H
ealth
& S
ocia
l W
ork
A
rts
& O
ther
Se
rvic
es
Unweighted Base 9,119 145 870 73 574 1,833 1,319 672 205 1,269 96 609 824 630
% % % % % % % % % % % % % % Specialist skills or knowledge 48 51 42 47 56 41 43 44 44 55 45 57 46 56 Solving complex problems 39 36 50 64 39 27 28 48 24 44 56 33 47 34 Knowledge of products and services offered 37 25 33 42 38 42 45 32 44 43 28 32 22 31 Knowledge of how the organisation works 36 27 34 39 29 31 42 34 36 40 62 45 32 32 Adapting to new equipment or materials 32 38 35 37 29 34 23 25 49 26 48 41 32 28 Computer literacy / basic IT skills 30 20 30 34 20 30 17 20 57 27 34 43 32 31 Reading/understanding instructions, reports etc. 29 28 39 61 28 22 31 30 15 27 33 34 31 26 Advanced or specialist IT skills 27 12 28 31 19 17 7 44 57 28 54 32 29 23 Complex numerical/statistical skills 24 20 24 51 19 16 13 31 51 26 49 28 24 14 Writing instructions, reports etc. 22 19 26 31 20 15 17 25 19 21 16 29 36 16 Basic numerical skills 20 26 28 32 18 17 17 10 45 22 21 18 14 21 Manual dexterity 14 44 16 10 22 12 18 16 2 14 2 4 18 14 Communicating in a foreign language 13 20 14 6 6 10 25 10 3 9 4 8 22 20 Oral Welsh language skills (Wales base only) 1 1 * - * 1 1 * * 1 4 1 1 1 Written Welsh language skills (Wales base only) 1 1 * - * * * * - 1 4 1 1 1 None of the above 9 11 7 7 10 16 14 7 2 5 7 5 4 8
Base: All establishments with skills gaps in each occupation – up to two occupations followed up Percentages are based on all skills gaps, rather than all establishments with skills gaps; proportions therefore show the percentage of skills gaps attributed to each skill.

182
Table A.3.7d People and personal skills lacking among staff with skills gaps, by occupation
Ove
rall
Agr
icul
ture
M
anuf
actu
ring
El
ectr
icity
, Gas
&
Wat
er
C
onst
ruct
ion
W
hole
sale
&
Ret
ail
H
otel
s &
R
esta
uran
ts
Tran
spor
t &
Com
ms
Fina
ncia
l Se
rvic
es
Bus
ines
s Se
rvic
es
Publ
ic A
dmin
.
Educ
atio
n
H
ealth
& S
ocia
l W
ork
A
rts
& O
ther
Se
rvic
es
Unweighted Base 9,119 145 870 73 574 1,833 1,319 672 205 1,269 96 609 824 630
% % % % % % % % % % % % % % Ability to manage own time and prioritise own tasks 59 48 53 76 53 53 59 60 79 56 64 75 68 50
Team working 56 51 61 52 36 48 62 46 72 48 62 63 64 63
Customer handling skills 46 22 23 67 34 49 67 48 82 42 57 49 33 55 Managing their own feelings, or handling the feelings of others 46 38 51 66 32 35 52 46 57 39 63 47 54 52
Managing or motivating other staff 41 30 46 47 36 34 49 30 18 37 63 45 47 44
Persuading or influencing others 39 22 44 45 31 37 38 30 27 42 63 41 38 44 Setting objectives for others and planning human, financial and other resources 30 21 35 35 22 24 27 31 54 28 49 33 32 21
Instructing, teaching or training people 28 20 41 39 19 20 38 32 11 25 23 40 22 28
Sales skills 23 13 14 27 13 37 41 24 18 24 10 13 9 29
Making speeches or presentations 17 13 22 26 16 8 16 22 14 20 14 20 15 15
None of the above 12 25 15 6 21 15 8 10 5 16 7 5 9 10 Base: All establishments with skills gaps in each occupation – up to two occupations followed up Percentages are based on all skills gaps, rather than all establishments with skills gaps; proportions therefore show the percentage of skills gaps attributed to each skill.
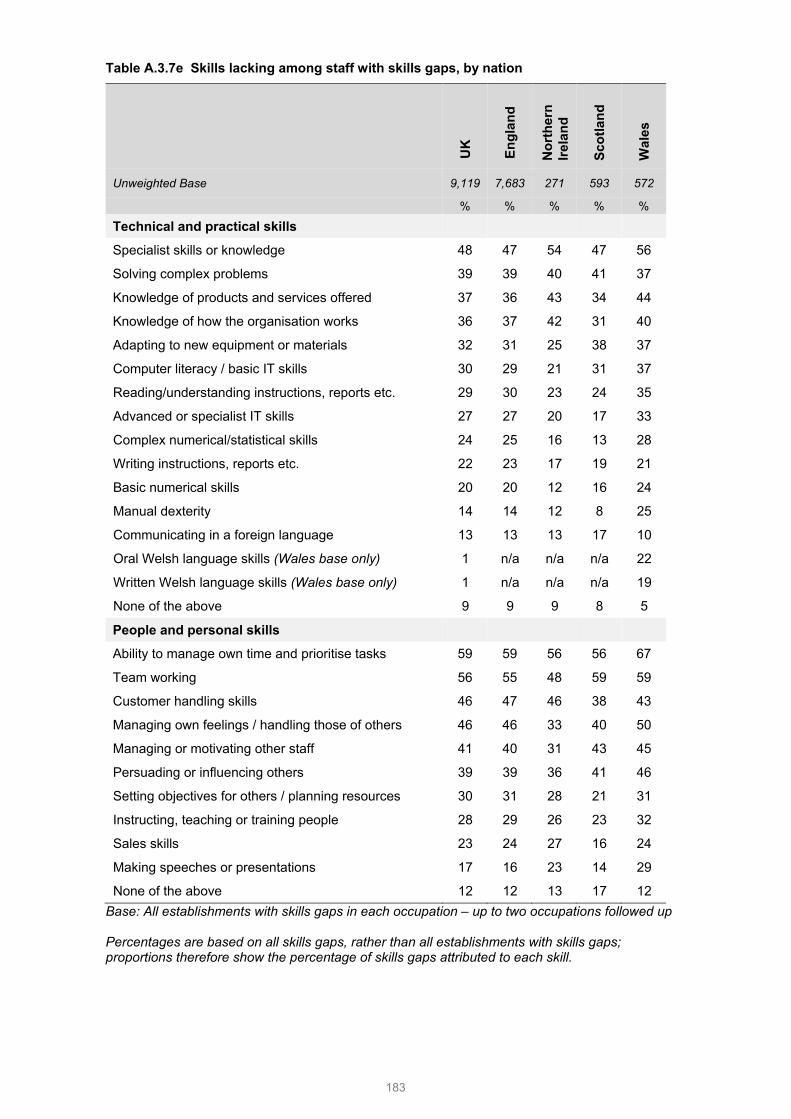
183
Table A.3.7e Skills lacking among staff with skills gaps, by nation
UK
Engl
and
N
orth
ern
Irela
nd
Sc
otla
nd
W
ales
Unweighted Base 9,119 7,683 271 593 572
% % % % %
Technical and practical skills
Specialist skills or knowledge 48 47 54 47 56
Solving complex problems 39 39 40 41 37
Knowledge of products and services offered 37 36 43 34 44
Knowledge of how the organisation works 36 37 42 31 40
Adapting to new equipment or materials 32 31 25 38 37
Computer literacy / basic IT skills 30 29 21 31 37
Reading/understanding instructions, reports etc. 29 30 23 24 35
Advanced or specialist IT skills 27 27 20 17 33
Complex numerical/statistical skills 24 25 16 13 28
Writing instructions, reports etc. 22 23 17 19 21
Basic numerical skills 20 20 12 16 24
Manual dexterity 14 14 12 8 25
Communicating in a foreign language 13 13 13 17 10
Oral Welsh language skills (Wales base only) 1 n/a n/a n/a 22
Written Welsh language skills (Wales base only) 1 n/a n/a n/a 19
None of the above 9 9 9 8 5
People and personal skills
Ability to manage own time and prioritise tasks 59 59 56 56 67
Team working 56 55 48 59 59
Customer handling skills 46 47 46 38 43
Managing own feelings / handling those of others 46 46 33 40 50
Managing or motivating other staff 41 40 31 43 45
Persuading or influencing others 39 39 36 41 46
Setting objectives for others / planning resources 30 31 28 21 31
Instructing, teaching or training people 28 29 26 23 32
Sales skills 23 24 27 16 24
Making speeches or presentations 17 16 23 14 29
None of the above 12 12 13 17 12 Base: All establishments with skills gaps in each occupation – up to two occupations followed up Percentages are based on all skills gaps, rather than all establishments with skills gaps; proportions therefore show the percentage of skills gaps attributed to each skill.

184
Table A.3.8 Skills lacking among staff, ‘old’ skills descriptor time series comparisons
2011 2013 2015
Unweighted Base 20,820 20,228 9,146 % % %
Technical, practical or job-specific 32 58 55
Planning and organisation 46 57 48
Team working 46 54 41
Customer handling 46 50 40
Problem solving 42 49 42
Oral communication 41 47 34
Written communication 34 36 26
Basic computer literacy / using IT 20 26 20
Strategic Management 22 25 21
Literacy 22 25 18
Advanced IT or software 18 23 22
Numeracy 19 23 15
Foreign language 10 12 9
Oral Welsh language skills (Wales base only) * 1 1
Written Welsh language skills (Wales base only) * 1 1
None of the above 3 2 6 Base: All establishments with skills gaps in each occupation – up to two occupations followed up Percentages are based on all skills gaps, rather than all establishments with skills gaps; proportions therefore show the percentage of skills gaps attributed to each skill. ‘*’ denotes a figure greater than zero but smaller than 0.5.

185
Table A.3.8a Skills lacking among staff, ‘old’ skills descriptor nation comparisons
UK England Northern Ireland Scotland Wales
Unweighted Base 9,146 7,726 249 643 528 % % % % %
Technical, practical or job-specific 55 55 54 58 50
Planning and organisation 48 47 34 60 48
Team working 41 39 39 57 48
Customer handling 40 39 37 55 41
Problem solving 42 41 35 45 55
Oral communication 34 34 41 37 26
Written communication 26 26 23 27 34 Basic computer literacy / using IT 20 19 33 28 20
Strategic Management 22 21 26 22 23
Literacy 18 18 26 17 32
Advanced IT or software 21 22 26 25 19
Numeracy 15 14 19 16 33
Foreign language 9 9 20 12 6 Oral Welsh language skills (Wales base only) 1 n/a n/a n/a 16
Written Welsh language skills (Wales base only) 1 n/a n/a n/a 15
None of the above 6 6 7 3 4 Base: All establishments with skills gaps in each occupation – up to two occupations followed up Percentages are based on all skills gaps, rather than all establishments with skills gaps; proportions therefore show the percentage of skills gaps attributed to each skill.

186
Table A.3.9 Extent of impact of skills gaps, by country, size and sector
Row percentages Unwtd Base Major
impact Minor impact No impact
UK 2011 20,820 % 15 46 39 UK 2013 20,228 % 16 48 37 UK 2015 18,265 % 17 48 34 Country England 15,409 % 17 48 35 Northern Ireland 520 % 18 51 31 Scotland 1,236 % 18 52 30 Wales 1,100 % 17 47 36 Size 2-4 1,240 % 23 45 32 5-24 10,084 % 16 48 36 25-49 3,530 % 16 50 35 50-99 1,948 % 14 51 35 100-249 1,064 % 14 58 29 250+ 399 % 17 54 28 Sector Agriculture 292 % 18 47 35 Manufacturing 1,697 % 16 47 37 Electricity, Gas and Water 163 % 10 52 38 Construction 1,132 % 15 42 43 Wholesale and Retail 3,669 % 18 49 33 Hotels and Restaurants 2,610 % 21 50 28 Transport and Communications 1,345 % 20 49 31
Financial Services 435 % 16 48 36 Business Services 2,601 % 19 49 33 Public Administration 200 % 11 60 29 Education 1,211 % 14 49 37 Health and Social Work 1,663 % 14 44 42 Arts and Other Services 1,247 % 16 47 37
Base: All establishments with skills gaps

187
Table A.3.10 Implications of skills gaps (prompted), by country, size and sector
Prompted implications
Row percentages Unwtd Base
Incr
ease
wor
kloa
d fo
r ot
her s
taff
Hav
e hi
gher
ope
ratin
g co
sts
Hav
e di
fficu
lties
m
eetin
g qu
ality
st
anda
rds
Hav
e di
fficu
lties
in
trod
ucin
g ne
w
wor
king
pra
ctic
es
Lose
bus
ines
s or
or
ders
to c
ompe
titor
s
Del
ay d
evel
opin
g ne
w
prod
ucts
or s
ervi
ces
Out
sour
ce w
ork
UK 18,265 % 52 27 25 24 21 17 11 Country England 15,409 % 52 26 25 24 21 17 11 Northern Ireland 520 % 56 32 29 28 21 22 13 Scotland 1,236 % 57 29 29 27 20 15 10 Wales 1,100 % 54 28 27 23 20 19 11 Size 2-4 1,240 % 53 27 25 25 26 23 15 5-24 10,084 % 51 25 24 22 20 16 8 25-49 3,530 % 53 28 26 24 19 14 10 50-99 1,948 % 51 29 29 25 18 14 11 100-249 1,064 % 59 34 33 30 16 16 11 250+ 399 % 60 41 26 34 18 19 16 Sector Agriculture 292 % 52 38 20 22 10 12 18 Manufacturing 1,697 % 50 37 26 23 18 20 13 Electricity, Gas & Water 163 % 50 31 15 21 12 13 10 Construction 1,132 % 42 25 17 19 18 13 13 Wholesale & Retail 3,669 % 54 22 24 23 27 15 7 Hotels & Restaurants 2,610 % 58 35 34 26 26 20 9 Transport & Comms. 1,345 % 56 32 23 24 24 23 16 Financial Services 435 % 49 20 24 18 19 13 7 Business Services 2,601 % 53 28 25 23 23 18 13 Public Administration 200 % 60 15 26 38 8 17 8 Education 1,211 % 51 21 29 27 9 15 10 Health & Social Work 1,663 % 49 19 25 27 10 17 9 Arts and Other Services 1,247 % 48 20 26 26 21 19 9
Base: All establishments with skills gaps

188
Table A.3.11 Actions taken to overcome skills gaps, by country, size and sector
Prompted implications
Row percentages Unwtd Base
Incr
ease
trai
ning
ac
tivity
Mor
e su
perv
isio
n
Mor
e ap
prai
sals
Men
torin
g
Rea
lloca
ting
wor
k
Cha
ngin
g w
orki
ng
prac
tices
In
crea
se
recr
uitm
ent
activ
ity
Rec
ruit
non-
UK
na
tiona
ls
Any
act
ion
UK 18,265 % 68 56 46 45 33 27 19 10 85 Country England 15,409 % 68 56 46 45 33 27 20 10 85 Northern Ireland 520 % 67 49 41 35 30 27 16 12 82 Scotland 1,236 % 67 58 47 45 35 29 17 9 84 Wales 1,100 % 66 58 47 48 35 29 20 8 83 Size 2-4 1,240 % 56 44 31 33 25 20 11 5 75 5-24 10,084 % 68 58 47 45 35 28 19 10 86 25-49 3,530 % 77 62 55 53 38 31 26 15 91 50-99 1,948 % 79 63 59 56 37 32 28 16 92 100-249 1,064 % 80 58 57 58 39 36 31 15 92 250+ 399 % 79 55 53 61 41 38 35 27 90 Sector Agriculture 292 % 49 42 21 23 29 21 9 7 70 Manufacturing 1,697 % 66 50 40 38 32 30 19 13 84 Electricity, Gas & Water 163 % 70 52 41 48 35 23 19 12 86 Construction 1,132 % 60 44 34 39 24 19 14 6 78 Wholesale & Retail 3,669 % 67 56 49 44 33 27 17 9 85 Hotels & Restaurants 2,610 % 70 61 52 47 34 30 29 19 87 Transport & Comms. 1,345 % 68 51 44 42 36 27 21 12 84 Financial Services 435 % 77 64 47 53 38 25 20 6 89 Business Services 2,601 % 69 55 43 44 34 24 20 10 85 Public Administration 200 % 75 64 50 53 42 35 17 5 90 Education 1,211 % 76 65 60 64 43 34 19 7 92 Health & Social Work 1,663 % 74 65 54 53 34 32 20 10 89 Arts and Other Services 1,247 % 65 53 43 41 33 26 16 7 83
Base: All establishments will skills gaps

189
Table A.3.12 Skills gaps and skill-shortage vacancies, by country, size and sector
Row percentages Unwtd Base
% of establishments with any skills
gaps
% of establishments
with a skill-shortage vacancy
% of establishments
with either
UK 2011 86,522 17 3 19 UK 2013 91,279 15 4 18 UK 2015 91,210 14 6 18 Country England 75,129 14 6 18 Northern Ireland 4,019 9 3 12 Scotland 6,035 14 6 17 Wales 6,027 14 6 17 Size 2-4 20,527 6 3 9 5-24 49,584 19 7 23 25-49 11,657 30 11 36 50-99 5,836 33 13 40 100-249 2,689 39 17 47 250 + 917 43 20 52 Sector Agriculture 3,632 7 2 9 Manufacturing 6,998 19 8 24 Electricity, Gas and Water 1,041 14 8 20 Construction 7,474 10 5 13 Wholesale and Retail 16,126 16 4 18 Hotels and Restaurants 8,920 19 7 22 Transport and Communications 8,936 12 7 17 Financial Services 2,549 16 4 19 Business Services 13,143 12 6 16 Public Administration 947 23 5 26 Education 5,515 19 8 24 Health and Social Work 8,556 15 7 20 Arts and Other Services 7,373 12 6 16
Base: All establishments

190
Chapter 4: Employer perceptions of under-use of skills and qualifications
Table A.4.1 Impact of re-defining under-utilisation on incidence, by country size and sector (2011 - 2015)
% of establishments reporting under-utilisation
Row percentages 2011 2013 2015
Unwtd Base Unwtd
Base Unwtd Base
UK 86,522 48 45,644 48 91,210 30 Size 2-4 17,905 47 9,532 47 20,527 29 5-24 47,770 48 25,704 48 49,584 30 25-49 10,239 50 5,545 51 11,657 34 50-99 5,712 50 2,802 51 5,836 35 100-249 3,270 49 1,472 50 2,689 34 250+ 1,626 48 589 48 917 35 Sector Agriculture 921 38 1,725 38 3,632 20 Manufacturing 7,834 41 3,839 39 6,998 24 Electricity, Gas and Water 1,406 42 571 45 1,041 27 Construction 6,576 41 3,623 40 7,474 25 Wholesale and Retail 15,163 51 8,731 50 16,126 32 Hotels and Restaurants 8,421 61 4,359 60 8,920 40 Transport and Communications 7,810 45 3,427 44 8,936 27 Financial Services 1,853 51 1,169 50 2,549 30 Business Services 14,297 45 6,939 44 13,143 26 Public Administration 1,584 53 480 53 947 36 Education 5,422 53 2,907 54 5,515 37 Health and Social Work 8,067 50 4,221 53 8,556 36 Arts and Other Services 7,164 52 3,653 52 7,373 35 Base: 2011 & 2015 - All establishments; 2013 – All establishments in Module 2
Note: Incidence of under-utilisation in 2015 uses a different measure than 2011 and 2013, meaning that these proportions are not directly comparable. This table should be considered in the sense of impact of the new measure on incidence.
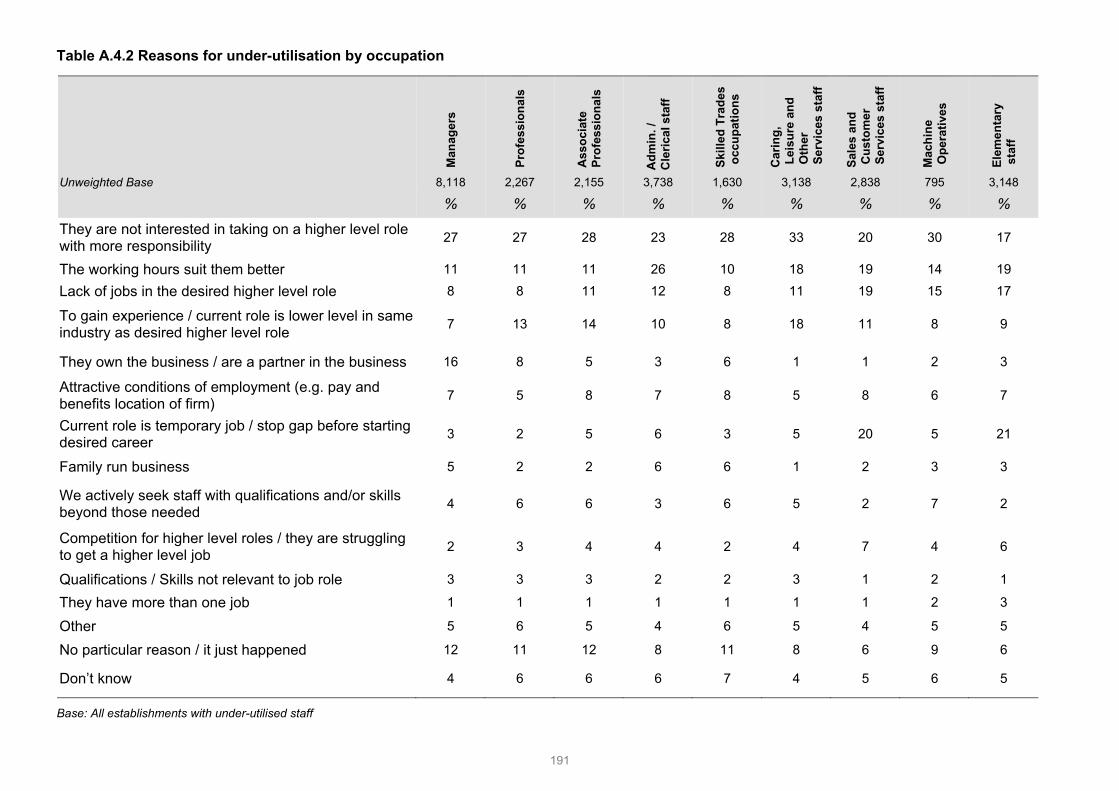
191
Table A.4.2 Reasons for under-utilisation by occupation
Man
ager
s
Prof
essi
onal
s
Ass
ocia
te
Prof
essi
onal
s
Adm
in. /
C
leric
al s
taff
Skill
ed T
rade
s oc
cupa
tions
Car
ing,
Le
isur
e an
d O
ther
Se
rvic
es s
taff
Sale
s an
d C
usto
mer
Se
rvic
es s
taff
Mac
hine
O
pera
tives
Elem
enta
ry
staf
f
Unweighted Base 8,118 2,267 2,155 3,738 1,630 3,138 2,838 795 3,148
% % % % % % % % %
They are not interested in taking on a higher level role with more responsibility 27 27 28 23 28 33 20 30 17
The working hours suit them better 11 11 11 26 10 18 19 14 19 Lack of jobs in the desired higher level role 8 8 11 12 8 11 19 15 17
To gain experience / current role is lower level in same industry as desired higher level role 7 13 14 10 8 18 11 8 9
They own the business / are a partner in the business 16 8 5 3 6 1 1 2 3
Attractive conditions of employment (e.g. pay and benefits location of firm) 7 5 8 7 8 5 8 6 7
Current role is temporary job / stop gap before starting desired career 3 2 5 6 3 5 20 5 21
Family run business 5 2 2 6 6 1 2 3 3
We actively seek staff with qualifications and/or skills beyond those needed 4 6 6 3 6 5 2 7 2
Competition for higher level roles / they are struggling to get a higher level job 2 3 4 4 2 4 7 4 6
Qualifications / Skills not relevant to job role 3 3 3 2 2 3 1 2 1 They have more than one job 1 1 1 1 1 1 1 2 3 Other 5 6 5 4 6 5 4 5 5 No particular reason / it just happened 12 11 12 8 11 8 6 9 6
Don’t know 4 6 6 6 7 4 5 6 5
Base: All establishments with under-utilised staff

192
Table A.4.3 Reasons for under-utilisation by country
2015
UK England Northern Ireland Scotland Wales
Unweighted Base 28,159 22,879 1,223 1,968 2,089
% % % % % They are not interested in taking on a higher level role with more responsibility
26 26 24 28 22
The working hours suit them better 15 15 15 13 14
Lack of jobs in the desired higher level role 11 10 21 13 14
To gain experience / current role is lower level in same industry as desired higher level role
10 10 10 10 9
They own the business / are a partner in the business 8 9 3 6 8
Attractive conditions of employment (e.g. pay and benefits location of firm)
7 7 4 5 9
Current role is temporary job / stop gap before starting desired career 7 7 4 8 6
Family run business 4 4 4 8 7
We actively seek staff with qualifications and/or skills beyond those needed
4 4 2 4 5
Competition for higher level roles / they are struggling to get a higher level job
4 4 4 4 5
Qualifications / Skills not relevant to job role 3 3 1 2 4
They have more than one job 1 1 * 1 1
Other 5 5 7 7 2
No particular reason / it just happened 10 10 14 11 6
Don’t know 5 5 3 5 6
Base: All establishments with under-utilised staff

193
Table A.4.4 Reasons for under-utilisation by establishment size
2 to
4
5 to
24
25 to
49
50 to
99
100
to
249
250+
Unweighted Base 5,859 14,892 4,009 2,120 950 329
% % % % % % They are not interested in taking on a higher level role with more responsibility 25 26 28 28 23 18
The working hours suit them better 14 16 16 16 16 13
Lack of jobs in the desired higher level role 8 13 15 16 25 25
To gain experience / current role is lower level in same industry as desired higher level role
7 11 14 16 18 24
They own the business / are a partner in the business 13 4 1 1 * 0
Attractive conditions of employment (e.g. pay and benefits location of firm) 6 8 8 8 9 7
Current role is temporary job / stop gap before starting desired career 4 9 12 9 11 10
Family run business 6 3 1 * * *
We actively seek staff with qualifications and/or skills beyond those needed 4 4 4 4 5 9
Competition for higher level roles / they are struggling to get a higher level job 2 5 6 7 9 7
Qualifications / Skills not relevant to job role 3 3 2 3 1 3
They have more than one job 1 1 1 1 * 1
Other 5 4 4 6 6 4
No particular reason / it just happened 12 8 7 6 5 5
Don’t know 4 6 6 5 5 4
Base: All establishments with under-utilised staff.

194
Table A.4.5 Reasons for under-utilisation by sector
Agric
ultu
re
Man
ufac
turin
g
Elec
trici
ty,
Gas
and
W
ater
Con
stru
ctio
n
Who
lesa
le
and
Ret
ail
Hot
els
and
Res
taur
ants
Tran
spor
t, St
orag
e an
d C
omm
s
Fina
ncia
l Se
rvic
es
Busi
ness
Se
rvic
es
Publ
ic A
dmin
.
Educ
atio
n
Hea
lth a
nd
Soci
al W
ork
Arts
and
Oth
er
Serv
ices
Unweighted Base 735 1,644 273 1,756 5,200 3,892 2,446 737 3,356 355 2,068 3,024 2,673
% % % % % % % % % % % % %
They are not interested in taking on a higher level role with more responsibility 26 22 23 22 24 22 24 21 24 29 30 35 33 The working hours suit them better 11 13 9 12 16 17 12 14 13 20 24 16 17 Lack of jobs in the desired higher level role 4 12 14 6 14 14 8 11 9 20 10 11 9 To gain experience / current role is lower level in same industry as desired higher level role 6 8 8 8 9 8 8 13 10 13 18 13 11 They own the business / are a partner in the business 10 12 12 17 6 7 12 8 11 1 2 3 6 Attractive conditions of employment (e.g. pay and benefits location of firm) 4 9 7 7 8 7 7 7 7 7 5 8 6 Current role is temporary job / stop gap before starting desired career 2 4 3 2 10 17 3 3 4 3 5 5 6 Family run business 21 4 7 7 4 3 4 3 4 * * 1 2 We actively seek staff with qualifications and/or skills beyond those needed 3 4 10 5 2 2 5 4 6 5 4 5 4 Competition for higher level roles / they are struggling to get a higher level job 1 4 4 1 5 5 3 4 3 4 4 5 4 Qualifications / Skills not relevant to job role 3 3 2 3 2 2 3 4 4 2 3 3 3 They have more than one job 2 1 0 1 1 3 1 1 1 2 * 1 2 Other 3 7 8 4 5 4 5 5 5 6 4 7 5 No particular reason / it just happened 14 10 8 14 9 8 11 11 11 6 7 7 9 Don’t know 2 5 6 5 5 5 6 6 6 7 5 4 4 Base: All establishments with under-utilised staff

195
Chapter 5: Training and workforce development
Table A.5.1 Proportion of employers providing any training (2011 – 2015)
2011 2013 2015 Unwtd
Base Any
Training Unwtd Base
Any Training
Unwtd Base
Any Training
Row percentages % % % UK 86,522 65 91,279 66 91,210 66 Country England 74,156 65 75,255 66 75,129 66 Northern Ireland 3,921 65 4,014 63 4,019 62 Scotland 2,487 73 6,014 70 6,035 71 Wales 5,958 63 5,996 62 6,027 63 Size 2-4 17,905 51 19,058 52 20,527 51 5-24 47,770 77 51,565 77 49,584 78
25-49 10,239 92 10,947 93 11,657 92 50-99 5,712 95 5,584 95 5,836 95 100-249 3,270 96 2,938 97 2,689 96 250+ 1,626 97 1,187 97 917 97 Sector Agriculture 921 52 3,407 50 3,632 50 Manufacturing 7,838 62 7,560 59 6,998 63 Electricity, Gas & Water 1,406 76 1,148 75 1,041 74 Construction 6,576 58 7,202 56 7,474 57 Wholesale & Retail 15,163 60 17,287 61 16,126 60 Hotels & Restaurants 8,421 61 8,888 62 8,920 63 Transport & Comms. 7,810 61 6,890 63 8,936 62 Financial Services 1,853 76 2,330 77 2,549 74 Business Services 14,297 67 14,011 67 13,143 68 Public Administration 1,584 90 942 90 947 90 Education 5,422 91 5,796 92 5,515 93 Health & Social Work 8,067 89 8,460 89 8,556 88 Arts and Other Services 7,164 69 7,358 69 7,373 70 Base: All establishments

196
Table A.5.2 Incidence of off and on-the-job training’ (2011 – 2015)
2011 2013 2015
Unwtd Base
Any off-job
training
Any on-job
training Unwtd Base
Any off-job
training
Any on-job
training Unwtd Base
Any off-job
training
Any on-job
training Row percentages % % % % % %
UK 86,522 47 53 91,279 49 52 91,210 49 53 Country England 74,156 46 52 75,255 48 52 75,129 48 52 Northern Ireland 3,921 48 50 4,014 49 47 4,019 47 49 Scotland 2,487 53 60 6,014 53 57 6,035 52 58 Wales 5,958 47 50 5,996 47 49 6,027 50 49 Size 2-4 17,905 34 38 19,058 36 37 20,527 35 37 5-24 47,770 56 64 51,565 58 63 49,584 58 64 25-49 10,239 75 83 10,947 77 83 11,657 76 83 50-99 5,712 82 87 5,584 83 88 5,836 82 88 100-249 3,270 84 91 2,938 87 92 2,689 85 91 250+ 1,626 87 94 1,187 89 93 917 86 92 Sector Agriculture 921 37 36 3,407 40 30 3,632 41 31 Manufacturing 7,838 43 48 7,560 43 45 6,998 46 50 Electricity, Gas & Water 1,406 60 61 1,148 60 59 1,041 61 58
Construction 6,576 46 38 7,202 45 37 7,474 46 38 Wholesale & Retail 15,163 36 50 17,287 40 50 16,126 39 48 Hotels & Restaurants 8,421 38 50 8,888 39 51 8,920 40 52 Transport & Comms. 7,810 42 48 6,890 46 48 8,936 44 48 Financial Services 1,853 52 67 2,330 54 66 2,549 53 64 Business Services 14,297 50 52 14,011 51 52 13,143 51 53 Public Administration 1,584 73 81 942 73 79 947 74 78
Education 5,422 80 81 5,796 80 82 5,515 82 84 Health & Social Work 8,067 73 78 8,460 75 77 8,556 72 77 Arts and Other Services 7,164 50 56 7,358 52 56 7,373 51 58
Base: All establishments

197
Table A.5.3 Unweighted base sizes for Tables 5.1 and 5.3
2011 2013 2015
UK 86,522 91,279 91,210
Country
England 74,156 75,255 75,129
Northern Ireland 3,921 4,014 4,019
Scotland 2,487 6,014 6,035
Wales 5,958 5,996 6,027
Size
2-4 17,905 19,058 20,527
5 to 24 47,770 51,565 49,584
25-49 9,416 10,123 11,657
50-99 5,416 5,315 5,836
100-249 3,270 2,938 2,689
250+ 1,626 1,187 917
Base: All establishments

198
Table A.5.4 Number employed and trained over the last 12 months by sector, and the proportion of the workforce trained
2011 2013 2015
Row percentages
Unwtd Base
% of staff
trained
% of staff
trained
Number employed
(000s)
Number trained (000s)
% of staff
trained Agriculture 1,871 39 41 402 159 40
Manufacturing 5,055 46 50 2,418 1,248 52
Electricity, Gas & Water 796 55 68 284 166 58
Construction 5,004 49 48 1,169 621 53
Wholesale & Retail 11,470 52 55 4,500 2,473 55
Hotels & Restaurants 6,849 55 59 1,955 1,252 64
Transport & Comms. 5,981 44 56 2,228 1,233 55
Financial Services 1,920 59 67 988 704 71
Business Services 10,623 52 60 4,792 2,878 60
Public Administration 851 61 67 1,346 993 74
Education 5,300 65 76 2,620 1,962 75
Health & Social Work 7,941 66 80 3,791 2,949 78
Arts and Other Services 5,840 55 63 1,262 767 61
Base: Establishments that had funded or arranged training in the previous 12 months.
Note: ‘the percentage of staff trained’ refers to the number of staff trained over the last 12 months (whether or not they still work at the establishment) as a percentage of the number of staff currently employed.

199
Table A.5.5 Unweighted base sizes for Figure 5.2
2011 2013 2015
Occupation
Managers 83,138 87,946 87,590
Professionals 16,360 17,407 17,483
Associate Professionals 13,753 12,577 13,309
Administrative and Clerical 50,780 53,759 53,622
Skilled Trades occupations 20,540 23,644 24,025
Caring, Leisure and Other Services 12,731 14,017 15,310
Sales and Customer Services 26,790 27,417 25,940
Machine Operatives 13,381 14,059 14,105
Elementary staff 30,663 32,192 31,970
Base: All establishments with staff in each occupation (excluding establishments where the numbers of staff if unknown)

200
Table A.5.6 Unweighted base sizes for Tables 5.2 and 5.3
2011 2013 2015
UK 66,439 69,842 69,541
Country
England 56,713 57,787 57,422
Northern Ireland 2,903 2,894 2,869
Scotland 2,170 4,884 4,894
Wales 4,653 4,277 4,356
Size
2-4 9,121 9,580 10,317
5-24 37,758 40,801 39,461
25-49 9,416 10,123 10,742
50-99 5,416 5,315 5,547
100-249 3,150 2,864 2,584
250+ 1,578 1,159 890
Base: Establishments that had funded or arranged training in the previous 12 months.

201
Table A.5.7 Average training days over the last 12 months per person trained
Average days training per person trained
Row percentages
Unwtd Base
1 day or less 2 3-4 5-6 7-10 11+
UK 69,541 % 11 14 19 16 13 18
Country
England 57,422 % 11 14 19 16 13 18
Northern Ireland 2,869 % 11 14 22 18 13 14
Scotland 4,894 % 11 14 20 17 13 17
Wales 4,356 % 11 15 19 18 13 18
Size
2-4 10,317 % 12 13 19 16 14 19
5-24 39,461 % 10 15 19 16 13 18
25-49 10,742 % 10 15 19 17 12 16
50-99 5,547 % 10 16 19 17 12 14
100-249 2,584 % 12 16 20 17 10 11
250+ 890 % 13 13 23 18 9 7
Sector
Agriculture 1,871 % 16 22 25 14 9 9
Manufacturing 5,055 % 12 17 19 15 11 17
Electricity, Gas & Water 796 % 11 13 21 21 13 13
Construction 5,044 % 11 16 20 17 12 18
Wholesale & Retail 1,170 % 13 14 18 15 12 20
Hotels & Restaurants 6,849 % 15 14 16 13 12 21
Transport & Comms. 5,981 % 11 14 17 18 14 18
Financial Services 1,920 % 7 11 16 19 16 24
Business Services 10,623 % 10 14 21 17 14 16
Public Administration 851 % 6 15 22 23 11 13
Education 5,300 % 9 15 22 21 13 11
Health & Social Work 7,941 % 7 12 20 17 17 17
Arts and Other Services 5,840 % 12 14 20 15 12 19
Base: Establishments that had funded or arranged training in the previous 12 months.

202
Table A.5.8 Total training and development days, and days per person trained and per employee by sector 2011 to 2015
2011 2013 2015
Unwtd Base
Total training
days
Days per
person trained
Days per employee
Unwtd Base
Total training
days
Days per
person trained
Days per employee
Unwtd Base
Total training
days
Days per
person trained
Days per employee
UK 66,439 115m 7.8 4.2 69,842 113m 6.7 4.2 69,541 118m 6.8 4.2 Sector Agriculture 548 1.0m 7.2 2.8 1,710 0.9m 5.7 2.4 1,871 0.9m 5.4 2.1 Manufacturing 5,450 8.9m 7.7 3.6 5,231 6.3m 5.3 2.7 5,055 7.6m 6.1 3.1 Electricity, Gas & Water 1,070 1.3m 8.6 4.7 878 1.7m 9.0 6.0 796 0.9m 5.3 3.1 Construction 4,399 4.6m 6.9 3.4 4,777 3.7m 6.2 3.0 5,044 4.1m 6.7 3.5 Wholesale & Retail 11,001 20.0m 8.7 4.5 12,425 19.3m 7.9 4.4 11,470 19.0m 7.7 4.2 Hotels & Restaurants 6,185 10.7m 11.4 6.2 6,761 9.6m 9.1 5.3 6,849 13.2m 10.5 6.8 Transport & Comms. 5,430 6.1m 6.5 2.9 4,939 6.8m 5.8 3.2 5,981 6.7m 5.4 3.0 Financial Services 1,460 4.1m 6.6 3.9 1,824 3.4m 4.9 3.3 1,920 3.8m 5.4 3.8 Business Services 11,268 15.2m 6.7 3.5 11,127 19.2m 7.1 4.3 10,623 18.2m 6.3 3.8 Public Administration 1,444 9.4m 9.9 6.0 861 7.4m 7.7 5.2 851 5.1m 5.2 3.8 Education 5,117 9.0m 5.5 3.6 5,568 9.6m 4.9 3.8 5,300 10.8m 5.5 4.1 Health & Social Work 7,484 18.2m 7.9 5.2 7,935 19.0m 6.6 5.3 7,941 21.1m 7.2 5.6 Arts and Other Services 5,583 6.0m 8.9 4.9 5,806 5.9m 7.7 4.8 5,840 6.4m 8.4 5.1 Base: Establishments that had funded or arranged training in the previous 12 months.
‘Days per employee’ is based upon employment across all establishments.
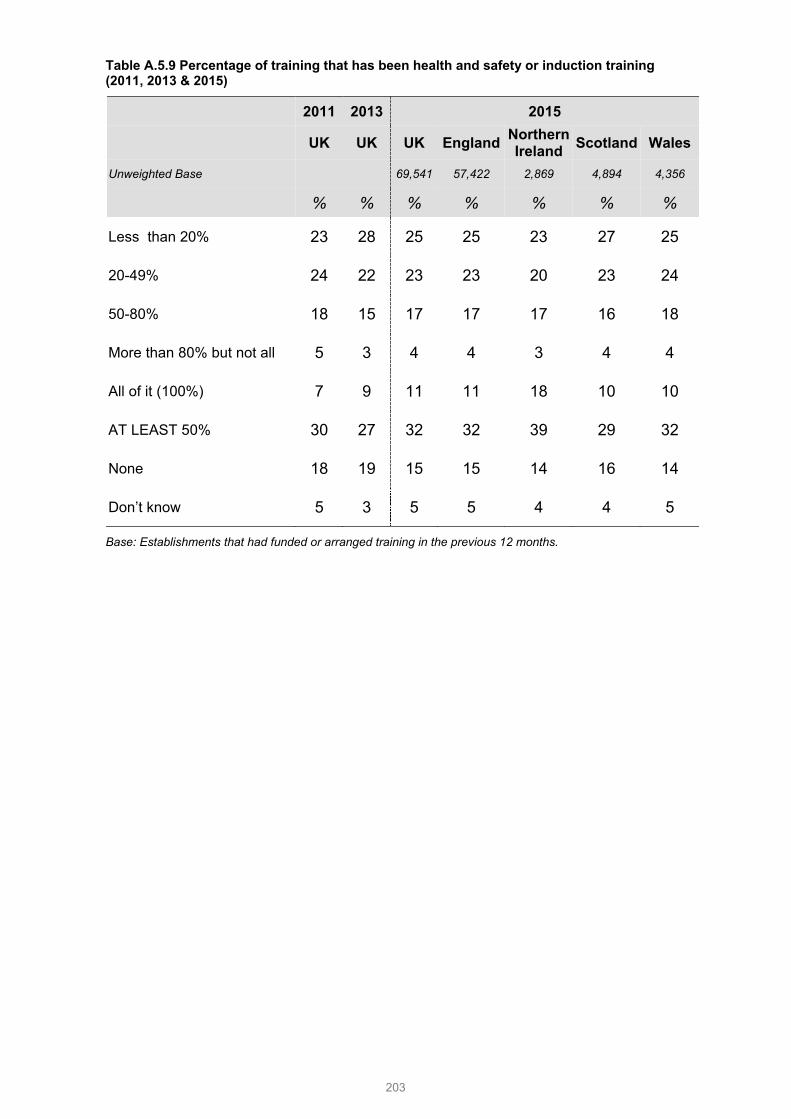
203
Table A.5.9 Percentage of training that has been health and safety or induction training (2011, 2013 & 2015)
2011 2013 2015
UK UK UK England Northern Ireland Scotland Wales
Unweighted Base 69,541 57,422 2,869 4,894 4,356
% % % % % % %
Less than 20% 23 28 25 25 23 27 25
20-49% 24 22 23 23 20 23 24
50-80% 18 15 17 17 17 16 18
More than 80% but not all 5 3 4 4 3 4 4
All of it (100%) 7 9 11 11 18 10 10
AT LEAST 50% 30 27 32 32 39 29 32
None 18 19 15 15 14 16 14
Don’t know 5 3 5 5 4 4 5
Base: Establishments that had funded or arranged training in the previous 12 months.

204
Table A.5.10 Types of training provided over the last 12 months (prompted)
Row percentages Unwtd Base
Job
spec
ific
Hea
lth &
Saf
ety
New
tech
nolo
gy
Bas
ic In
duct
ion
Exte
nsiv
e in
duct
ion
Man
agem
ent
UK 2011 66,439 % 85 75 47 47 n/a 35 UK 2013 69,842 % 85 74 48 48 n/a 35 UK 2015 69,541 % 85 75 49 66 37 37 Country England 57,422 % 86 75 49 66 37 37 Northern Ireland 2,869 % 82 78 50 61 33 35 Scotland 4,894 % 86 74 49 66 36 34 Wales 4,356 % 86 77 51 66 37 37 Size 2-4 10,317 % 81 62 47 46 23 24 5-24 39,461 % 87 80 48 74 41 39 25-49 10,742 % 92 93 55 90 54 60 50-99 5,547 % 94 95 61 93 59 66 100-249 2,584 % 96 96 71 96 64 76 250+ 890 % 96 96 79 96 69 88 Sector Agriculture 1,871 % 80 68 43 32 13 14 Manufacturing 5,055 % 84 79 48 69 35 28 Electricity, Gas & Water 796 % 88 86 44 69 40 35 Construction 5,044 % 77 81 36 55 25 25 Wholesale & Retail 11,470 % 85 76 52 70 40 41 Hotels & Restaurants 6,849 % 85 85 34 79 46 47 Transport & Comms. 5,981 % 85 60 65 58 30 28 Financial Services 1,920 % 92 61 57 62 37 43 Business Services 10,623 % 87 64 57 60 32 32 Public Administration 851 % 91 84 61 75 44 56 Education 5,300 % 93 89 59 79 46 58 Health & Social Work 7,941 % 89 89 41 77 50 47 Arts and Other Services 5,840 % 85 76 46 67 36 32 Base: Establishments that had funded or arranged training in the previous 12 months.
n/a: Extensive induction was a new code added into the 2015 survey

205
Table A.5.11 Training to nationally recognised qualifications in the last 12 months among employers that train
Row percentages
Unwtd Base
Any staff trained to a qualification
Number trained to a qualification
% of those trained to a qualification
% of all employees trained to a qualification
UK 69,541 47 3.5m 20 12 Size 2-4 10,317 36 0.3m 26 11
5-24 39,461 49 0.9m 25 14
25-49 10,742 63 0.5m 23 15
50-99 5,547 69 0.5m 20 13
100-249 2,584 73 0.5m 17 12
250+ 890 80 0.8m 15 10 Sector Agriculture 1,871 44 * 29 11
Manufacturing 5,055 43 0.2m 16 8 Electricity, Gas & Water 796 55 * 22 13
Construction 5,044 53 0.2m 31 17
Wholesale & Retail 11,470 38 0.3m 13 7
Hotels & Restaurants 6,849 51 0.2m 19 12
Transport & Comms. 5,981 39 0.3m 24 13
Financial Services 1,920 47 0.1m 18 13
Business Services 10,623 41 0.5m 17 10
Public Administration 851 62 0.2m 17 13
Education 5,300 65 0.3m 14 10
Health & Social Work 7,941 65 0.9m 29 23
Arts and Other Services 5,840 50 0.2m 29 17
Base: Establishments that had funded or arranged training in the previous 12 months.
Note the final column shows the proportion of all employees in that size band or sector that were trained to a qualification (not the proportion of employees within establishments that train).
Note: * refers to a figure of less than £50,000

206
Table A.5.12 Whether establishment has funded or arranged online training or e-learning, or other self-learning, over the past 12 months
Online training Other self-learning
Row percentages Unwtd Base
% fu
ndin
g or
ar
rang
ing
onlin
e
% fu
ndin
g or
ar
rang
ing
othe
r
% fu
ndin
g or
ar
rang
ing
eith
er
Unwtd Base
% re
porti
ng
incr
ease
% re
porti
ng
decr
ease
Unwtd Base
% re
porti
ng
incr
ease
% re
porti
ng
decr
ease
UK 69,541 45 38 57 39,695 39 18 35,783 29 23 Country England 57,422 45 39 57 33,257 39 18 29,864 30 23 Northern Ireland 2,869 34 35 48 1,268 38 22 1,324 24 27 Scotland 4,894 44 36 55 2,805 40 17 2,449 29 25 Wales 4,356 43 37 56 2,365 40 19 2,146 30 24 Size
2-4 10,317 35 32 48 4,212 35 22 4,127 28 26
5-24 39,461 47 39 58 21,708 40 17 19,022 29 23
25-49 10,742 61 51 72 7,195 43 13 6,458 34 20
50-99 5,547 62 56 74 3,892 41 14 3,660 32 19
100-249 2,584 70 60 81 1,965 42 12 1,836 31 19
250+ 890 78 65 87 723 44 9 680 29 18
Sector
Agriculture 1,871 14 20 28 413 28 37 559 16 36
Manufacturing 5,055 29 24 40 1,913 42 24 1,772 29 30 Electricity, Gas & Water 796 35 27 46 337 37 24 287 27 29
Construction 5,044 30 25 42 2,021 37 23 1,700 28 28
Wholesale & Retail 11,470 41 34 52 6,240 43 16 5,254 31 24
Hotels & Restaurants 6,849 49 39 61 4,396 40 15 3,798 31 24
Transport & Comms. 5,981 43 42 58 2,923 36 19 2,765 30 21
Financial Services 1,920 71 54 80 1,501 36 11 1,218 31 18
Business Services 10,623 48 40 60 6,288 37 19 5,683 28 22
Public Administration 851 67 55 79 615 44 12 521 33 19
Education 5,300 65 55 7 4,103 38 17 3,649 31 21
Health & Social Work 7,941 62 55 75 5,924 42 15 5,623 31 21
Arts and Other Services 5,840 35 36 51 3,021 41 22 2,954 28 25 Base: Columns 1-3: Establishments that had funded or arranged training in the previous 12 months; columns 4-5: Establishments providing online training or e-learning in the last two years; columns 6-7: establishments providing other self-learning in the last two years

207
Table A.5.13 Total training expenditure and training spend per person trained and per employee by sector (2011 - 2015)
2011 2013 2015
Unwtd Base
Total Spend per trainee
Spend per employee
Unwtd Base Total Spend per
trainee Spend per employee
Unwtd Base Total
Spend per trainee Spend per
employee
UK 11,027 £43.8bn £2,974 £1,620 12,522 £43.0bn £2,560 £1,600 12,614 £45.4bn £2,610 £1,640 Size 2-4 1,774 £5.5bn £5,700 £2,290 2,317 £5.6bn £5,650 £2,320 1,963 £5.9bn £5,810 £2,470 5-24 6,542 £12.0bn £3,570 £1,880 6,953 £12.7bn £3,630 £1,970 7,661 £14.1bn £3,750 £2,100 25-49 1,452 £6.1bn £3,100 £1,810 1,722 £6.4bn £3,080 £1,930 1,779 £6.3bn £2,810 £1,820 50-99 708 £5.5bn £2,740 £1,616 928 £5.5bn £2,460 £1,610 782 £6.5bn £2,820 £1,860 100+ 551 £14.7bn £2,290 £1,290 602 £12.7bn £1,600 £1,120 429 £12.7bn £1,560 £1,080 Sector Agriculture 87 £1.1bn £7,780 £3,030 297 £0.4bn £2,680 £1,110 260 £0.6bn £3,590 £1,420 Manufacturing 816 £3.4bn £2,960 £1,370 867 £2.6bn £2,200 £1,110 972 £3.2bn £2,570 £1,320 Electricity, Gas & Water 137 £0.3bn £1,860 £1,020 163 £0.3bn £1,490 £1,010 168 £0.7bn £3,960 £2,320 Construction 655 £2.5bn £3,629 £1,790 893 £2.4bn £4,050 £1,960 826 £2.5bn £4,090 £2,170 Wholesale & Retail 1,815 £5.1bn £2,220 £1,150 1,945 £6.5bn £2,630 £1,460 1,813 £5.1bn £2,050 £1,130 Hotels & Restaurants 1,055 £3.0bn £3,185 £1,740 1,091 £2.7bn £2,510 £1,460 1,273 £3.3bn £2,670 £1,710 Transport & Comms. 862 £3.1bn £3,320 £1,460 954 £3.3bn £2,770 £1,540 1,135 £3.4bn £2,720 £1,500 Financial Services 220 £1.5bn £2,410 £1,430 369 £1.3bn £1,880 £1,270 344 £1.6bn £2,320 £1,650 Business Services 2.036 £8.3bn £3,680 £1,900 2,337 £8.5bn £3,170 £1,910 2,073 £9.8bn £3,420 £2,060 Public Administration 231 £3.1bn £3,330 £2,010 213 £2.1bn £2,220 £1,490 176 £1.9bn £1,960 £1,450 Education 558 £4.9bn £2,980 £1,930 621 £5.4bn £2,770 £2,100 678 £4.6bn £2,320 £1,740 Health & Social Work 1,515 £5.2bn £2,270 £1,500 1,540 £5.1bn £1,790 £1,420 1,790 £6.1bn £2,070 £1,610 Arts & Other Services 1,011 £2.3bn £3,412 £1,880 1,232 £2.3bn £3,010 £1,890 1,106 £2.6bn £3,410 £2,070
Base: Establishments completing the Investment in Training study. Note: figures for spend per person trained and per employee have been rounded to the nearest £10.

208
Table A.5.14 Training expenditure spent on Further Education colleges, Universities or other Higher Education institutions, and the proportion of the total fees to external providers that this represents
Row percentages Unwtd Base
Total fees to external
providers Total fees to
FE/HE providers
% of fees to external
providers paid to FE/HE providers
UK 12,614 £3.0bn £453m % 15 Size 2 to 4 1,963 £0.5bn £73m % 15 5 to 24 7,661 £1.0bn £143m % 14 25 to 49 1,779 £0.4bn £61m % 14 50 to 99 782 £0.3bn £35m % 10 100+ 429 £0.7bn £141m % 19 Sector Agriculture 260 £0.1bn £10m % 18 Manufacturing 972 £0.2bn £34m % 16 Electricity, Gas & Water 168 £0.04bn £2m % 5
Construction 826 £0.3bn £37m % 14 Wholesale & Retail 1,813 £0.3bn £39m % 11 Hotels & Restaurants 1,273 £0.1bn £8m % 7 Transport & Comms. 1,135 £0.2bn £20m % 10 Financial Services 344 £0.1bn £8m % 11 Business Services 2,073 £0.9bn £158m % 17 Public Administration 176 £0.1bn £11m % 10 Education 678 £0.2bn £45m % 19 Health & Social Work 1,790 £0.3bn £61m % 19 Arts and Other Services 1,106 £0.1bn £20m % 15
Base: Establishments completing the Investment in Training study.
First column rounded to the nearest £0.01bn; second column to the nearest £1m

209
Table A.5.15 Whether training employers would have liked to provide more training, and if so the main barriers (prompted)
% w
ould
hav
e lik
ed to
pro
vide
m
ore
trai
ning
Main barriers among those wanting to provide more training
Row percentages Unwtd Base
Unwtd Base
Lack
of f
unds
/ tra
inin
g ex
pens
ive
Can
’t sp
are
time
for
empl
oyee
s to
be
trai
ning
Har
d to
find
the
time
to
orga
nise
trai
ning
La
ck a
ppro
pria
te tr
aini
ng /
qual
ifica
tions
in th
e su
bjec
ts
we
need
D
iffic
ulty
find
ing
prov
ider
to
deliv
er w
here
and
whe
n w
e w
ant
UK 69,541 46 33,281 % 52 49 14 5 4 Country England 57,422 46 27,152 % 51 49 14 5 4 Northern Ireland 2,869 47 1,406 % 60 44 14 5 5 Scotland 4,894 50 2,513 % 53 54 12 4 6 Wales 4,356 49 2,210 % 52 47 16 6 7 Size 2-4 10,317 43 4,382 % 53 47 14 5 4 5-24 39,461 48 18,801 % 49 51 14 5 4 25-49 10,742 49 5,281 % 52 51 15 4 4 50-99 5,547 50 2,798 % 55 52 14 3 3 100-249 2,584 57 1,486 % 61 48 14 3 3 250+ 890 59 533 % 65 51 14 3 5 Sector Agriculture 1,871 34 659 % 43 49 14 11 9 Manufacturing 5,055 45 2,321 % 50 51 14 6 4 Electricity, Gas & Water 796 40 328 % 55 48 13 3 5 Construction 5,044 40 2,076 % 52 49 14 5 4 Wholesale & Retail 11,470 46 5,514 % 39 52 16 4 4 Hotels & Restaurants 6,849 51 3,599 % 46 44 15 3 3 Transport & Comms. 5,981 48 2,774 % 53 51 15 5 4 Financial Services 1,920 39 736 % 34 60 15 3 3 Business Services 10,623 43 4,650 % 54 52 15 4 3 Public Administration 851 50 422 % 63 49 13 5 5 Education 5,300 53 2,850 % 71 48 9 4 4 Health & Social Work 7,941 52 4,201 % 61 46 12 5 5 Arts and Other Services 5,840 53 3,151 % 64 43 12 4 4
Base: Column 1: Establishments that had funded or arranged any training in the previous 12 months; Columns 2-6 Establishments that would have liked to provide more training

210
Table A.5.16 Reasons for not funding or arranging training over the last 12 months (unprompted)
2011 2013 2015
UK UK UK England Northern Ireland Scotland Wales
Unweighted Base 19,363 20,704 20,719 16,899 1,119 1,070 1,631
% % % % % % % All our staff are fully proficient / no need for training 64 69 68 68 64 67 66
No money available for training 11 10 7 7 10 6 9
Training is not a priority for the establishment 9 7 7 7 10 6 9
No training available in relevant subject area 7 5 5 5 4 4 6
Managers have lacked the time to organise training 3 3 2 2 2 3 3
Employees are too busy to undertake training 2 2 2 2 2 3 3
Employees are too busy to give training 1 2 2 2 2 1 2
External courses are too expensive 2 2 1 1 1 1 1
Learn by experience/as you go 3 2 3 3 2 2 3
Business not operating long enough/New business 1 1 1 1 1 1 1
Small firm/training not needed due to size of establishment 1 1 1 1 1 1 2
Trained staff will be poached by other employers 1 1 1 1 2 1 1
Courses interested in not available 1 1 1 1 1 1 1
No new staff (only train new staff) * 1 * * * * 1
No particular reason 5 5 6 5 8 9 3
Base: Establishments that had not funded or arranged training or development in the previous 12 months.
Note: responses are only shown if given by one per cent or more of respondents in 2015
‘*’ denotes a figure larger than zero but smaller than 0.5

211
Table A.5.17 Incidence of wider development activities
2015
Row percentages
2015
Unw
td B
ase
2013
Unw
td B
ase
2011
Unw
td B
ase
Supe
rvis
ion
guid
ing
empl
oyee
s th
roug
h th
eir
job
role
Opp
ortu
nitie
s fo
r sta
ff to
w
atch
oth
ers
carr
y ou
t th
eir r
oles
Allo
wed
to p
erfo
rm ta
sks
beyo
nd th
eir j
ob ro
les
Any
wid
er d
evel
opm
ent
activ
ities
201
5
Any
wid
er d
evel
opm
ent
activ
ities
201
3 A
ny w
ider
dev
elop
men
t ac
tiviti
es 2
011
UK 91,210 91,279 86,522 % 74 70 66 84 85 82 Country England 75,129 75,255 74,156 % 74 70 67 84 85 82 Northern Ireland 4,019 4,014 3,921 % 75 69 64 85 81 83 Scotland 6,035 6,014 2,487 % 75 71 65 85 86 84 Wales 6,027 5,996 5,958 % 70 67 62 81 81 79 Size 2-4 20,527 19,058 17,905 % 62 57 57 75 76 73
5-24 49,584 51,565 47,770 % 85 81 74 93 93 91
25-49 11,657 10,947 19,239 % 93 90 80 98 98 96 50-99 5,836 5,584 5,712 % 94 91 79 98 98 97 100-249 2,689 2,938 3,270 % 95 92 83 99 99 98 250+ 917 1,187 1,626 % 95 91 85 99 99 99 Sector Agriculture 3,632 3,407 921 % 51 50 42 65 66 69 Manufacturing 6,998 7,560 7,838 % 73 69 65 83 81 79 Electricity, Gas & Water 1,041 1,148 1,406 % 76 67 63 85 86 85 Construction 7,474 7,202 6,576 % 65 58 54 76 74 72 Wholesale & Retail 16,126 17,287 15,163 % 75 73 68 85 87 83 Hotels & Restaurants 8,920 8,888 8,421 % 81 75 70 89 88 85 Transport & Comms. 8,936 6,890 7,810 % 66 65 65 81 82 80 Financial Services 2,549 2,330 1,853 % 79 74 70 88 91 90 Business Services 13,143 14,011 14,297 % 72 67 68 84 84 81 Public Administration 947 942 1,584 % 88 82 74 94 96 95 Education 5,515 5,796 5,422 % 87 89 79 96 96 94 Health & Social Work 8,556 8,460 8,067 % 90 82 75 95 95 94 Arts and Other Services 7,373 7,358 7,164 % 78 74 69 89 88 86
Base: All establishments

212
Chapter 6: High Performance Working practices and product market strategies
Table A.6.1 Summary of recruitment activity, experience of hard-to-fill vacancies (HtfVs) and skill-shortage vacancies (SSVs) by HPW classification and size
Have vacancies Have HtFVs Have SSVs HtFVs / vacs SSVs / vacs SSVs / HtFVs
Row percentages Unwtd Base % % % % % %
HPW employers 2-4 322 25 14 11 46 33 73 5-24 4,213 33 12 8 33 22 66 25-49 2,004 46 15 11 29 20 68 50-99 1,222 57 19 14 31 20 66 100-249 721 65 20 15 22 15 68 250+ 310 69 28 23 22 19 85 5-99 7,439 39 13 10 31 21 66 Non-HPW Employers 2-4 9,866 9 4 3 39 25 65 5-24 20,536 21 8 6 39 26 66 25-49 3,746 39 14 11 31 21 68 50-99 1,664 48 17 12 30 20 66 100-249 636 61 22 17 28 20 71 250+ 152 72 22 18 19 15 79 5-99 25,946 24 9 7 36 24 67
Base: All establishments by HPW classification and size.
‘HtFVs / vacs’ is shown as all hard-to-fill vacancies as a proportion of all private sector vacancies; ‘‘SSVs / vacs’ is shown as all skill-shortage vacancies as a proportion of all private sector vacancies; ‘SSVs / HtFVs’ is shown as all skill-shortage vacancies as a proportion of all hard-to-fill private sector vacancies

213
Table A.6.2 Training activity among HPW employers and non-HPW employers by size band and sector
Row percentages Unwtd Base
Any training Proportion of staff trained
% % Size HPW employers 2-4 322 96 89 5-24 4,213 98 78 25-49 2,004 98 75 50-99 1,222 99 76 100-249 721 99 75 250+ 310 99 78 5-99 7,439 98 76 Non-HPW employers 2-4 9,866 50 42 5-24 20,536 75 51 25-49 3,746 89 60 50-99 1,664 93 59 100-249 636 93 57 250+ 152 93 56 5-99 25,946 77 55 Sector HPW employers Agriculture 42 100 61 Manufacturing 474 98 66 Electricity, Gas and Water 87 97 73 Construction 295 99 74 Wholesale and Retail 1,702 96 71 Hotels and Restaurants 1,118 97 83 Transport and Communications 437 99 68 Financial Services 223 97 86 Business Services 1,424 98 74 Public Administration 182 98 82 Education 887 100 80 Health and Social Work 1,255 99 88 Arts and Other Services 666 97 73
Non-HPW employers Agriculture 1,737 50 39 Manufacturing 3,047 61 41 Electricity, Gas and Water 440 71 48 Construction 3,466 54 45 Wholesale and Retail 6,260 55 46 Hotels and Restaurants 3,272 60 55 Transport and Communications 3,998 59 49 Financial Services 1,058 70 60 Business Services 5,090 64 49 Public Administration 306 84 53 Education 1,820 92 70 Health and Social Work 3,112 86 77 Arts and Other Services 2,994 68 58
Base: All establishments in Module 1 by HPW classification.

214
Table A.6.3 Profile of private sector employers in each Product Market Strategy classification by country and sector
Very Low Low Medium High Very High
Unweighted Base 2,673 8,771 18,544 22,832 13,385
% % % % % Country England 80 83 85 85 87 Northern Ireland 5 4 3 3 2 Scotland 9 8 7 8 7 Wales 6 5 5 4 4 Sector Agriculture 19 11 6 3 2 Manufacturing 5 6 6 8 8 Electricity, Gas and Water 1 1 1 1 1 Construction 15 13 11 9 7 Wholesale and Retail 20 24 23 23 22 Hotels and Restaurants 10 11 10 10 9 Transport and Communications 6 7 8 9 9
Financial Services 2 2 3 2 2 Business Services 17 19 23 24 25 Public Administration * * * * * Education * 1 1 1 2 Health and Social Work 1 2 3 4 6 Arts and Other Services 3 4 5 5 7
Base: All private sector establishments in each PMS classification by country and sector.
‘*’ denotes a figure greater than zero but smaller than 0.5.
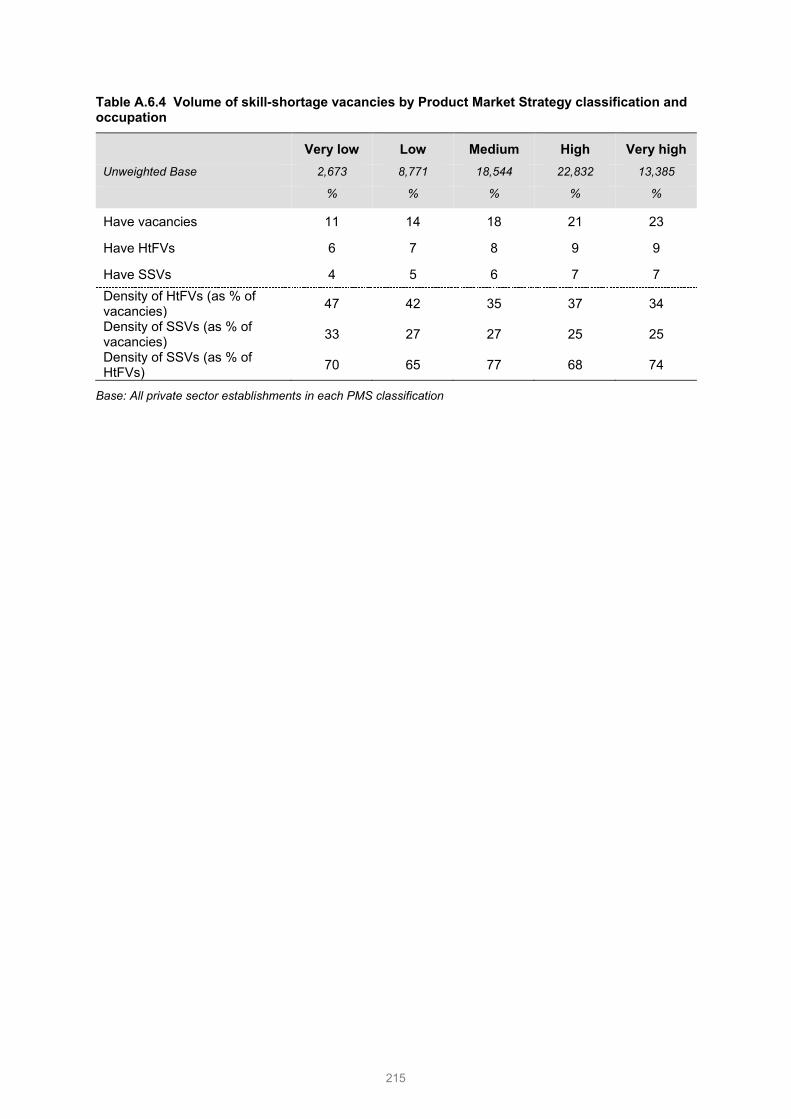
215
Table A.6.4 Volume of skill-shortage vacancies by Product Market Strategy classification and occupation
Very low Low Medium High Very high Unweighted Base 2,673 8,771 18,544 22,832 13,385
% % % % %
Have vacancies 11 14 18 21 23
Have HtFVs 6 7 8 9 9
Have SSVs 4 5 6 7 7 Density of HtFVs (as % of vacancies) 47 42 35 37 34
Density of SSVs (as % of vacancies) 33 27 27 25 25
Density of SSVs (as % of HtFVs) 70 65 77 68 74
Base: All private sector establishments in each PMS classification

216
Table A.6.5 Training provision over the last 12 months by Product Market Strategy and size
Row percentages Unwtd Base
Any training Proportion of staff trained
% % Very low PMS 2-4 1,110 35 38 5-24 1,313 65 41 25-49 162 88 48 50-99 62 92 49 100-249 18 ** ** 250+ 8 ** ** Low PMS 2-4 2,862 46 35 5-24 4,749 73 47 25-49 751 90 56 50-99 279 94 57 100-249 98 97 51 250+ 32 100 59 Medium PMS 2-4 4,660 49 39 5-24 10,543 76 51 25-49 2,006 91 59 50-99 893 94 59 100-249 330 94 63 250+ 112 96 56 High PMS 2-4 4,809 53 43 5-24 12,965 79 56 25-49 2,894 93 63 50-99 1,342 96 64 100-249 648 96 63 250+ 174 97 69 Very high PMS 2-4 2,454 57 50 5-24 7,413 80 59 25-49 1,960 93 65 50-99 919 96 65 100-249 480 95 66 250+ 159 99 70
Base: All private sector establishments in each PMS classification by size.
‘Proportion of staff trained’ is shown as a proportion of all private sector employment
‘**’ denotes figure not shown because of a low base (fewer than 25 respondents); Figures in italics denote base size smaller than 50: figures should be treated with caution

217
Appendix B: National Time Series Tables The UK Commission’s Employer Skills Survey 2011, 2013 and 2015 was designed in such a
way as to preserve key time series measures from the surveys carried out previously by the
individual nations where possible.
The eligible employer population and weighting strategy in the 2013 survey was different to
that used in 2011; therefore, the 2011 data has been reweighted to give comparable time
series data. The 2015 survey follows the same strategy as that applied in 2013.
For the constituent nations of the UK, the degree to which we can track time series prior to
2011 depends on the approach the nation took to their predecessor skills survey.
England: England carried out the National Employer Skills Survey (NESS) biennially from
2005, and annually from 2001 prior to this. The population used in NESS matches that used
in ESS 2013 (2+ employment), therefore we can make some comparisons over a longer time
period. It should be noted that the weighting strategy of the NESS surveys was based on SSC
sectors rather than the 14 broad SIC sectors used in 2011 and 2013, therefore some caution
needs to be exercised when making comparisons with data prior to 2011.
Northern Ireland: The Northern Ireland Skills Monitoring Survey (NISMS) was conducted in
2005 and 2008 on a 1+employee population. This does not match the population used in ESS
2013, therefore no time series comparisons can be drawn prior to 2011.
Scotland: The Scottish Employer Skills Survey (SESS) ran annually from 2006 to 2010. The
surveys were conducted using a 1+employee population which does not match the population
used in ESS 2013, therefore no time series comparisons can be drawn prior to 2011.
Wales: Future Skills Wales (FSW) was conducted in 2005 on a 2+ employment population.
This gives some scope to make comparisons with this point in time, however it should be
noted that the weighting strategy employed in 2005 used different sector and size band
definitions to those used in 2011, 2013 and 2015, therefore some caution needs to be
exercised when making comparisons with the 2005 data.

218
England Time Series: Key Figures
NES
S 03
NES
S 05
NES
S 07
NES
S 09
ESS
2011
ESS
2013
ESS
2015
Vacancies and skill-shortage vacancies
% of establishments with any vacancies 17% 17% 18% 12% 14% 15% 20%
% of establishments with any hard-to-fill vacancies 8% 7% 7% 3% 5% 5% 8%
% with SSVs n/a 5% 5% 3% 3% 4% 6%
% of all vacancies which are SSVs n/a 25% 21% 16% 15% 22% 23%
Number of vacancies 679,000 573,900 619,700 385,700 501,200 559,600 797,400
Number of hard-to-fill vacancies 271,000 203,600 183,500 85,400 107,100 160,000 262,300 Number of skill-shortage vacancies 135,000 143,100 130,000 63,100 76,900 124,800 180,200
Skills gaps
% of establishments with any staff not fully proficient 22% 16% 15% 19% 17% 15% 14%
Number of skills gaps 2.4m 1.26m 1.36m 1.70m 1.28m 1.17m 1.18m
Number of staff not fully proficient as a % of employment 11% 6% 6% 7% 6% 5% 5%
Training
% of establishments training staff over the last 12 months 59% 65% 67% 68% 65% 66% 66%
% of establishments providing off-the-job training in the last 12 months
n/a 46% 46% 51% 47% 48% 48%
% of workforce trained 53% 61% 63% 56% 54% 62% 63%
Total number of training days n/a n/a n/a 109m 97m 95m 100m
**Eurostat data used for calculating total training spend was subject to an adjustment in 2013, therefore no data is available prior to 2011 that is directly comparable with 2011 and 2013 data.

219
Northern Ireland Time Series: Key Figures
ESS
2011
ESS
2013
ESS
2015
Vacancies and skill-shortage vacancies
% of establishments with any vacancies 10% 10% 13%
% of establishments with any hard-to-fill vacancies 3% 3% 4%
% with SSVs 2% 3% 3%
% of all vacancies which are SSVs 21% 19% 14%
Number of vacancies 18,400 15,200 19,700
Number of hard-to-fill vacancies 5,000 4,000 4,200
Number of skill-shortage vacancies 3,900 2,900 2,800
Skills gaps
% of establishments with any staff not fully proficient 13% 14% 9%
Number of skills gaps 34,100 37,700 24,000
Number of staff not fully proficient as a % of employment 4% 5% 3%
Training
% of establishments training staff over the last 12 months 65% 63% 62%
% of establishments providing off-the-job training in the last 12 months 48% 49% 47%
% of workforce trained 56% 59% 64%
Total number of training days 2.71m 2.69m 2.60m

220
Scotland Time Series: Key Figures
ESS
2011
ESS
2013
ESS
2015
Vacancies and skill-shortage vacancies
% of establishments with any vacancies 14% 15% 19%
% of establishments with any hard-to-fill vacancies 4% 6% 8%
% with SSVs 3% 4% 6%
% of all vacancies which are SSVs 15% 25% 24%
Number of vacancies 44,500 54,500 73,600
Number of hard-to-fill vacancies 9,100 18,200 24,600
Number of skill-shortage vacancies 6,700 13,400 17,700
Skills gaps
% of establishments with any staff not fully proficient 21% 19% 14%
Number of skills gaps 121,000 135,100 117,700
Number of staff not fully proficient as a % of employment 5% 6% 5%
Training
% of establishments training staff over the last 12 months 73% 70% 71%
% of establishments providing off-the-job training in the last 12 months 53% 53% 52%
% of workforce trained 58% 65% 62%
Total number of training days 9.8m 10.0m 9.86m

221
Wales Time Series: Key Figures
FSW
05
ESS
2011
ESS
2013
ESS
2015
Vacancies and skill-shortage vacancies
% of establishments with any vacancies 21% 12% 14% 17%
% of establishments with any hard-to-fill vacancies 10% 4% 5% 7%
% with SSVs 4% 3% 4% 6%
% of all vacancies which are SSVs 14% 18% 20% 24%
Number of vacancies 37,900 22,500 25,700 36,500
Number of hard-to-fill vacancies 13,200 6,600 7,200 12,100
Number of skill-shortage vacancies 5,400 4,000 5,100 8,800
Skills gaps
% of establishments with any staff not fully proficient 18% 16% 16% 14%
Number of skills gaps 63,800 53,900 67,400 53,800
Number of staff not fully proficient as a % of employment 6% 5% 6% 5%
Training
% of establishments training staff over the last 12 months n/a 63% 62% 63%
% of establishments providing off-the-job training in the last 12 months n/a 47% 47% 49%
% of workforce trained n/a 56% 62% 64%
Total number of training days n/a 4.93m 5.56m 5.40m n/a: question not asked or not asked in a comparable manner in previous years’ surveys

222
Appendix C: Industry coding During the sampling and weighting process, each establishment was allocated to one of 15
sectors, based on their Standard Industrial Classification (SIC). SIC 2007 was used to classify
establishments using the following method. Using the four-digit Standard Industrial
Classification (SIC) supplied for each record from the Experian database, a description of
business activity was read out to each respondent. If they agreed that this description matched
the main activity undertaken at the establishment, then the SIC on Experian’s database was
assumed to be correct. If however, the respondent felt the description did not correspond to
their main business activity at the site (which about a quarter reported), a verbatim response
was collected to find out what they do (see question A7 on the survey; questionnaire shown
in the accompanying Technical Report). At the analysis stage this was coded to a four-digit
SIC which was then used as the basis for allocation into sector. For the purposes of reporting,
Mining & Quarrying were merged with Manufacturing to create ‘Manufacturing’, while
Transport and storage and Information and Communications were merged to create
‘Transport, storage and communications’. The final sector, which in previous iterations of the
survey has been classified as ‘Other Community, Social and Personal Services’, has been
renamed to ‘Arts, Entertainment, Recreation and Other Service activities’, in line with ONS
guidance.
The table below shows the 15 sectors and their corresponding SIC 2007 definitions.
Sector SIC 2007
1. Agriculture
A - Agriculture, forestry and fishing (01-03)
Including farming, hunting and other related service activities, forestry and logging, fishing and aquaculture
2. Mining & Quarrying B - Mining and quarrying (05-09)
Including mining of coal, metals, sand/stone/clay, and extraction of crude petroleum and natural gas
3. Manufacturing C - Manufacturing (10-33)

223
Sector SIC 2007
Including manufacture of food and beverage, textiles, chemicals and chemical products, basic pharmaceutical products, other mineral products, manufacture of metals and metal products, machinery, computer and electronic products and equipment, motor vehicles and other transport equipment, furniture, and repair and installation of machinery and equipment
4. Electricity, Gas and Water D - Electricity, gas, steam and air conditioning supply (35)
E - Water supply, sewerage, waste management and remediation activities (36-39)
Including electric power generation, transmission and distribution, manufacture of gas and distribution of gaseous fuels, steam and air conditioning supply, water collection, treatment and supply, sewerage and waste collection, treatment and disposal activities and materials recovery
5. Construction
F - Construction (41-43)
Including the construction of buildings, civil engineering (constructing roads, railways and other utility projects), demolition, and specialised activities such as electrical installation, roofing and scaffold erection
6. Wholesale and Retail
G - Wholesale and retail trade; repair of motor vehicles and motor cycles (45-47)
Including sale, maintenance and repair of motor vehicles, parts and accessories, non-vehicle wholesale (for example agriculture, food, household goods), and the retail trade of all products whether in stores, stalls, markets, mail order or online
7. Transport and Storage
H - Transportation and storage (49-53)
Including land, water and air transport (passenger and freight), warehousing and support activities for transportation, postal and courier activities
8. Hotels and Restaurants I - Accommodation and food service activities (55-56)

224
Sector SIC 2007
Including hotels, campsites, youth hostels, holiday centres, villages and other short stay accommodation, restaurants and takeaways, event catering and licensed clubs, pubs and bars
9. Information and Communications
J - Information and communication (58-63)
Including publishing (books, journals, newspapers etc. and software/computer games), television, film and music production, broadcasting, telecommunications, computer programming and consultancy, information service activities (e.g. data processing and hosting)
10. Financial Services
K - Financial and insurance activities (64-66)
Including banks and building societies, activities of holding companies, trusts, funds and similar financial entities, credit granting, pensions, insurance and reinsurance
11. Business Services
L - Real estate activities (68)
M - Professional, scientific and technical activities (69-75)
N - Administrative and support service activities (77-82)
Including the buying, selling and renting of real estate, legal activities, accounting, bookkeeping and auditing, management consultancy, architectural and engineering activities, scientific research and development, advertising and market research, specialist design, photographic activities, translation and interpretation, veterinary activities, renting and leasing of tangible goods (motors, household, machinery), employment agencies, travel agencies and tour operations, security and investigation activities, office administration and business support
12. Public Administration O - Public administration and defence; compulsory social security (84)

225
Sector SIC 2007
Including administration of the State and economic and social policy of the community, provision of services to the community as a whole such as defence activities, foreign affairs, justice and judicial activities, fire service and compulsory social security activities
13. Education
P - Education (85)
Including pre-primary, primary, secondary and higher education, other education (such as sports, driving schools, cultural education), educational support activities
14. Health and Social Work Q - Human health and social work activities (86-88)
Including Hospitals, medical and dental practices, residential care, social work activities
15. Arts, Entertainment, Recreation and Other Service activities
R - Arts, entertainment and recreation (90-93)
S - Other service activities (94-96)
Including performing arts, libraries and museums, gambling and betting, sports facilities, amusement and recreation activities, activities of membership organisations (religious, political, trade union, professional), personal services (hairdressing, beauty, textile cleaning, well-being activities, funeral activities)
NOT COVERED IN SURVEY
T - Activities of households as employers; undifferentiated goods and services producing activities of households for own use (97-98)
U - Activities of extraterritorial organisations and bodies (99)
Including households as employers of domestic personnel, private households producing goods for own use

226
Appendix D: Occupational Coding The occupational data collected in the survey were collected both pre-coded and verbatim.
The former included the occupational breakdown of employment (question D5 to D8) where
respondents were asked how many of their workforce fell into each of the nine major (one-
digit) Standard Occupation Classification (SOC) 2010 categories (Managers, Directors and
Senior Officials through to Elementary occupations). However, on vacancy measures (for
example the occupations in which vacancies exist – question C2) this information was
collected verbatim. This was then coded at the analysis stage, where possible to a four-digit
level SOC, if not three, two- or one-digit level.
Examples of what might fall into each occupational band are as follows:
Occupational group
Primary sectors (Agriculture, manufacturing, construction etc.)
Service sectors (retail, business, finance, transport etc.)
Public sector (Public Admin, Health, Education etc.)
Managers, Directors and Senior Officials
Site managers, Department Heads, Shift Managers (not supervisors)
Directors, Managers / Branch/site managers, shift managers (not supervisors
Police inspectors and above, department heads, Head teachers, Senior Officials
Professionals
Professional engineers, software and IT professionals, accountants, chemists, scientific researchers
Solicitors, lawyers, accountants, IT professionals, economists, architects, actuaries
Doctors, nurses, midwives, teachers, social workers, librarians
Associate Professionals
Science and engineering technicians, lab technicians, IT technicians, accounting technicians
Insurance underwriters, finance/investment analysts and advisers, writers/journalists, buyers, estate agents
Junior police/fire/prison officers, therapists, paramedics, community workers, H&S officers, housing officers
Administrative staff
Secretaries, receptionists, PAs, telephonists, bookkeepers
Secretaries, receptionists, PAs, communication operators, market research interviewers, clerks
Secretaries, receptionists, PAs, local government officers and assistants, office assistants, library and database assistants
Skilled Trades Farmers, electricians, machine setters / tool makers, carpenters, plasterers
Motor mechanics, printers, TV engineers, butchers
Chefs
Caring, Leisure and Other Service Occupations
Care assistants, nursery nurses
Travel agents, travel assistants, hairdressers, housekeepers
Care assistants, home carers, nursery nurses, ambulance staff, pest control, dental nurses, caretakers
Sales and customer service occupations
Customer facing roles: sales staff and call centre agents
Sales assistants and retail cashiers, telesales, call centre agents
Customer care operations
Process, plant and machine operatives
Routine operatives, drivers, machine operators, sorters and assemblers
HGV, van, fork-lift, bus and taxi drivers
Drivers, vehicle inspectors
Elementary occupations
Labourers, packers, goods handling and storage staff
Bar staff, shelf fillers, catering assistants, waiters/waitresses, cleaners
Labourers, cleaners, road sweepers, traffic wardens, security guards

227
Appendix E: Sampling Error and Statistical Confidence Sampling errors for the survey results overall and for key sub-groups are presented in the
table below. Figures have been based on a survey result of 50 per cent (the ‘worst’ case in
terms of statistical reliability), and have used a 95 per cent confidence level. Where the table
indicates that a survey result based on all respondents has a sampling error of +/- 0.32 per
cent, this should be interpreted as follows: ‘for a question asked of all respondents where the
survey result is 50 per cent, we are 95 per cent confident that the true figure lies within the
range 49.68 per cent to 50.32 per cent’.
As a note, the calculation of sampling error has taken into account the finite population
correction factor to account for cases where we are measuring a significant portion of the
population universe (i.e. even if two sample sizes are the same, the sampling error will be
lower if in one case a far higher proportion of the population was covered).
These confidence intervals are based on the assumption of a normal distribution of responses.
Sampling error (at the confidence 95 per cent level) associated with findings of 50 per cent
Population Number of interviews
(Maximum) Sampling
Error Overall 1,766,838 91,210 +/-0.32
By country
England 1,488,171 75,129 +/-0.36
Northern Ireland 54,518 4,019 +/-1.55
Scotland 142,947 6,035 +/-1.26
Wales 81,202 6,027 +/-1.26
By size of establishment
2-4 907,944 20,527 +/-0.68
5-24 668,618 49,584 +/-0.44
25-49 101,082 11,657 +/-0.91
50-99 50,432 5,836 +/-1.28
100-249 26,900 2,689 +/-1.89
250+ 11,812 917 +/-3.24
By sector
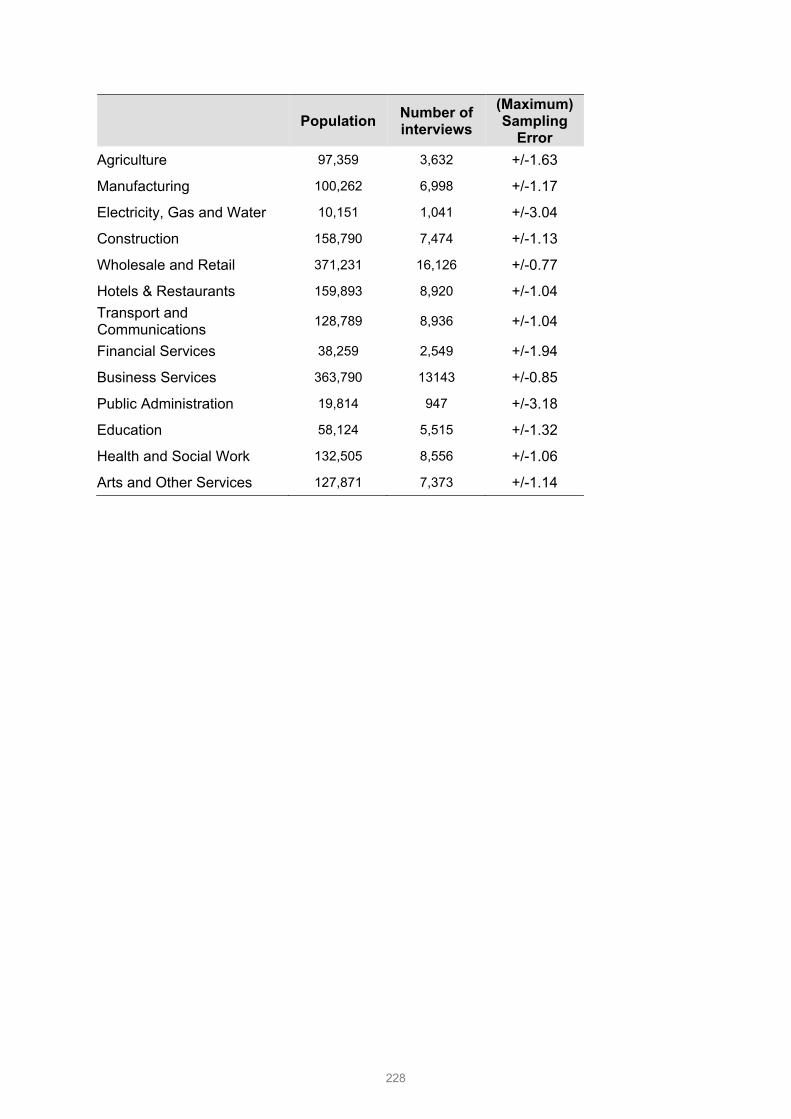
228
Population Number of interviews
(Maximum) Sampling
Error Agriculture 97,359 3,632 +/-1.63
Manufacturing 100,262 6,998 +/-1.17
Electricity, Gas and Water 10,151 1,041 +/-3.04
Construction 158,790 7,474 +/-1.13
Wholesale and Retail 371,231 16,126 +/-0.77
Hotels & Restaurants 159,893 8,920 +/-1.04 Transport and Communications 128,789 8,936 +/-1.04
Financial Services 38,259 2,549 +/-1.94
Business Services 363,790 13143 +/-0.85
Public Administration 19,814 947 +/-3.18
Education 58,124 5,515 +/-1.32
Health and Social Work 132,505 8,556 +/-1.06
Arts and Other Services 127,871 7,373 +/-1.14

229
Appendix F: Weighted base sizes
Number of employers… UK England NI Scotland Wales
Overall 1,766,868 1,488,201 54,518 142,947 81,202
Chapter 2: Employers’ experience of skill shortages
With a vacancy 341,549 293,439 7,256 27,079 13,775
With a hard-to-fill vacancy 134,861 115,653 2,426 11,004 5,777
With a skill-shortage vacancy 100,223 85,525 1,803 8,284 4,612
Chapter 3: Retention difficulties With any jobs in which have difficulties retaining staff 149,680 124,013 3,878 14,442 7,347
Chapter 4: The Internal Skills Challenge
With at least one skills gap 246,330 210,820 5,098 19,315 11,097
Chapter 5: Under-utilisation With at least one employee with more qualifications and skills than job role requires
529,470 440,463 15,499 46,305 27,203
Chapter 6: Employer Investment in Training and Skills
Providing any training 1,163,955 976,742 33,769 101,981 51,463
On-the-job training only 305,494 258,210 7,962 28,001 11,321
Off-the-job training only 233,759 195,488 7,111 19,761 11,400 Both on- and off-the-job training 624,702 523,044 18,697 54,219 28,742
Providing no training for staff 602,913 511,459 20,749 40,966 29,739
Providing training towards nationally recognised qualifications
546,682 459,058 14,687 45,326 27,611
Chapter 7: HPW and PMS
14 out of 21 HPW practices 215,392 184,466 4,961 16,665 9,299
Very high / high / medium PMS 1,064,335 909,047 29,486 80,570 45,232
Very high / high PMS 689,724 591,534 17,589 53,028 27,573
Very low / low PMS 254,443 209,738 9,754 20,576 14,374
Base: All establishments

230
Appendix G: Unweighted base sizes Establishments with…
Overall Vacancies Hard-to-fill vacancies
Skill-shortage vacancies
Skills gaps
Estab’s that train
UK 91,210 24,306 9,223 6,831 18,265 69,541 Country England 75,129 20,697 7,857 5,801 15,409 57,422 Northern Ireland 4,019 713 228 172 520 2,869 Scotland 6,035 1,619 612 453 1,236 4,894 Wales 6,027 1,277 526 405 1,100 4,356 Size 2-4 20,527 1,869 869 645 1,240 10,317 5-24 49,584 11,864 4,733 3,517 10,084 39,461 25-99 17,493 8,151 2,820 2,044 5,478 16,289 100-249 2,689 1,759 585 446 1,064 2,584 250+ 917 663 216 179 399 890 Sector Agriculture 3,632 207 98 67 292 1,871 Mining and Quarrying 171 23 7 4 23 140 Manufacturing 6,827 1,582 735 618 1,674 4,915 Electricity, Gas and Water 1,041 221 86 76 163 796 Construction 7,474 1,173 552 461 1,132 5,044 Wholesale and Retail 16,126 3,753 1,154 850 3,669 11,470 Hotels and Restaurants 8,920 3,420 1,288 844 2,610 6,849 Transport and Communications 8,936 1,993 887 711 1,345 5,981 Financial Services 2,549 472 133 106 435 1,920 Business Services 13,143 3,859 1,534 1,285 2,601 10,623 Public Administration 947 276 78 44 200 851 Education 5,515 2,073 666 486 1,211 5,300 Health and Social Work 8,556 3,152 1,242 793 1,663 7,941 Arts and Other Services 7,373 2,102 763 486 1,247 5,840 Occupation Managers 87,590 23,762 8,961 6,655 17,829 67,471 Professionals 17,483 6,830 2,599 2,050 4,112 15,752 Associate Professionals 13,309 5,248 1,896 1,566 3,597 11,709 Administrative/ Clerical staff 53,622 16,277 6,196 4,743 11,874 43,913 Skilled Trades occupations 24,025 7,677 3,396 2,651 6,303 19,318 Caring, Leisure and Other Services 15,310 6,123 2,380 1,560 3,348 14,252
Sales and Customer Services 25,940 8,343 2,797 2,189 7,002 20,725 Machine Operatives 14,105 4,095 1,793 1,434 3,690 11,282 Elementary staff 31,970 10,938 4,186 3,005 8,409 26,499

231
Appendix H: A Note on Proficiency and Skills Gaps To ascertain the number of staff with skills gaps, respondents were asked, for each major
(one-digit SOC 2010) occupation where they employed staff, how many of those they
employed were fully proficient. If respondents asked for clarification, then a proficient
employee was described as ‘someone who is able to do their job to the required level’.
‘Proficient employee’, however, is clearly a subjective and relative term to the extent that:
• different managers in an organisation may have different views on whether an individual
member of staff is able to do the job to the required level. Indeed, they may have different
views on what the required level is that the organisation is looking for within an
occupational category.
• an employee could be regarded as fully proficient but if the requirements of the job change
(for example, some new machinery or technology is introduced) then they could be
regarded as not being able to do their job to the required level, despite the fact that their
skills were unchanged.
• the same is true if a person were to be promoted to a more demanding position – the
company might go from having no skills gaps to saying that this newly promoted member
of staff was not fully proficient in the new job, despite having the same proficiency as
before.
• different companies may be more demanding and ‘critical’ of their staff than others: an
individual considered fully proficient by one company might be seen as having a skills gap
if performing the same role to the same standard in another company.
A final point to note is that the survey categorises all staff as either fully proficient or not: it
takes no account of the range that can clearly exist between those who are very nearly
proficient and those who significantly lack the skills that employers require. While from a policy
perspective, therefore, there is clearly interest in raising the skill levels of the workforce, survey
data can only identify changes year on year in the proportion of staff reported as fully proficient,
not cases where skills levels have been raised but where staff still remain below full
proficiency.

232
Appendix I: Technical Appendix A full Technical Report accompanies this document and can be downloaded from the UKCES
website or obtained by contacting UKCES directly. This appendix provides brief details on the
key areas of sampling, fieldwork and analysis.
The survey comprised two facets:
• Wave 1: the main skills survey, covering business strategy, retention, recruitment, skills
gaps and high performance working;
• Wave 2: covering the financial investment establishments make in training their staff.
Employer Skills Survey: Wave 1
Sampling
The sample design was based on a three-dimensional grid, crossing size band (defined by
employment) by 15 broad SIC-based sectors (see Appendix C for definitions) within region (9
English GOR regions, Northern Ireland, Scotland and Wales). Quotas were set on this basis,
proportioned to give a robust base size in each subgroup of the overall sample. To ensure
coverage at a local level, quota targets were also set for each Local Authority (LA) grouped
according to the Local Education Authority (LEA) definitions41 in proportion to the population
that each LEA accounted for in each GOR.
91,210 interviews were carried out in total:
Country Number of interviews
England 75,129
Northern Ireland 4,019
Scotland 6,035
Wales 6,027
41 Targets were set LA grouped to 151 LEAs (the Cornwall and Isles of Scilly LEAs were combined due to the limited business population in Isles of Scilly).

233
Fieldwork
A total of 91,210 interviews were conducted by telephone using computer-assisted telephone
interviewing (CATI) technology. Fieldwork across the regions was undertaken by three
research agencies, as follows:
Agency Regions
BMG East of England
North West
South West
Northern Ireland
IFF Research London
South East
Yorkshire and the Humber
Wales
Large multisites*
Ipsos MORI East Midlands
North East
West Midlands
Scotland
Interviews were conducted with the most senior person at the site with responsibility for
recruitment, human resources and workplace skills.
Fieldwork took place from March to July 2015.

234
Response rate
The overall response rate for the survey was 42 per cent, calculated as a proportion of all
completed contacts. A detailed breakdown of survey outcomes in shown below:
Outcome Number of contacts
% of all sample
% of complete contacts
Total sample 742,599 100 Ineligible establishments (e.g. just 1 working proprietor at site) 44,640 6
‘Live’ / not available during fieldwork / Out of quota 391,591 53
Unobtainable / invalid numbers 90,095 12 Total complete contacts 216,273 29 100 Achieved interviews 91,210 12 42 Respondent refusal 116,678 16 54 Quits during interview 8,386 1 4
Questionnaire design
Following a review of the 2011 and 2013 ESS questionnaires by UKCES and their partners,
and given the need for time series comparisons, the questionnaire used for ESS 2015 did not
require substantial redevelopment. Nevertheless, an extensive questionnaire review took
place at the outset of the research process with a particular emphasis on:
1. Developing the list of skills used in the survey to better understand the skills lacking in the
workforce and among applicants;
2. Considering the introduction of an online resource to assist employers in accurately
categorising their workforce into the nine occupational classifications used in the survey;
3. Reviewing the core under-utilisation measure, and inclusion of a set of questions to
understand the causes and implications of skills under-utilisation;
4. Developing new training questions to capture provision of online, e-learning and other self-
learning training, and how use of these training methods has changed over time.
Another key change from the 2013 survey was the inclusion of retention questions, in place of
those relating to upskilling. The 2011 survey included a question relating to retention, and this
module of questions was originally intended to rotate in alternate surveys with the upskilling
questions which appeared in the 2013 survey.

235
A full list of the changes between the questionnaires used in the 2013 and 2015 Employer
Skills Surveys, along with the reasons for these alterations, can be found in Appendix C in the
full Technical Report42.
The rationale for the changes to the skill descriptors is detailed below.
Changes to Skills descriptors
During the Autumn of 2014 UKCES commissioned the National Institute of Economic and
Social Research (NIESR) to undertake a review of the skill descriptors used in the 2011 and
2013 Employer Skills Surveys. A total of 13 skill descriptors were used in 2011 and 2013
concerning the skills lacking among applicants (question C13).
The NIESR review was undertaken amid concern that the existing information collected has
not been sufficiently detailed to allow for the formulation of specific, actionable responses to
address the skill issues identified in the survey. Another reason was that the survey could
improve its coverage of the higher-level skills that underpin innovative business practices. In
addition, the review sought to assess whether there were opportunities to harmonise the skill
descriptors used with those of other international studies.
Some key international surveys (e.g. SES43, PIAAC44, and CEEDEFOP45) were taken into
consideration during the review, to provide useful pointers as to how the list of descriptors in
ESS might usefully be expanded. Taking the strengths of these surveys into consideration
(and the perceived weaknesses of the ESS skills 2011 and 2013 skill descriptors), the NIESR
review recommended transitioning to an expanded list of 21 skill descriptors split across two
broad themes:
• skills relating to using information, equipment and materials; and
• skills relating to dealing with people.
42 https://www.gov.uk/government/publications/ukces-employer-skills-survey-2015-uk-results 43 Skills and Employment Surveys (SES) 44 OECD’s Programme for the International Assessment of Adult Competencies (PIAAC) 45 CEDEFOP Employer Survey on Skill Needs

236
Following cognitive testing and piloting46 to develop the wording and phrasing of the skills so
that they would be understood by employers, a list of 24 items47 was used for the main survey
(see the table below).
Using information, equipment and materials
Dealing with people
• Computer literacy / basic IT skills • Instructing, teaching or training people
• Advanced or specialist IT skills • Sales skills
• Solving complex problems requiring a solution specific to the situation • Customer handling skills
• Reading and understanding instructions, guidelines, manuals or reports
• Persuading or influencing others
• Writing instructions, guidelines, manuals or reports • Team working
• Basic numerical skills and understanding • Managing or motivating other staff
• More complex numerical or statistical skills and understanding • Ability to manage own time and
prioritise own tasks
• Communicating in a foreign language • Setting objectives for others and
planning human, financial and other resources
• Manual dexterity – for example, to mend, repair, assemble, construct or adjust things
• Managing their own feelings, or handling the feelings of others
• Adapting to new equipment or materials • Making speeches or presentations
• Knowledge of products and services offered by your organisation and organisations like yours
• Knowledge of how your organisation works
• Specialist skills or knowledge needed to perform the role
46 Twenty cognitive interviews and 100 pilot interviews were undertaken. Further details of the cognitive testing and piloting of the survey are provided later in the report. 47 There were 26 pre-coded options for workplaces located in Wales, as two items were added on Welsh language skills under the ‘using information, equipment and materials’ list.

237
It was agreed to treat ESS 2015 as a transitional year for the implementation of this expanded
list of skill descriptors. That is to say that once an employer’s answers identified them as
having at least one skill-shortage vacancy and/or at least one internal skills gap they would be
randomly assigned to be asked either the ‘old’ list of skill descriptors used in 2013 or the ‘new’
list of skill descriptors. This approach was taken in order to allow for time series analyses
against 2013, whilst allowing for a full transition to the new list of skill descriptors in the next
iteration of the survey.
Weighting / Grossing up
Data for the survey was weighted and grossed up to population estimates of establishments
and to the population of employees, as derived from the 2014 Inter-Departmental Business
Register (IDBR).
The grossing-up procedure on which this report has been based was undertaken at a regional
level; within each region grossing up took place on a broad 15 sector and seven size band
interlocking grid (i.e. 105 cells for each geographic region). In instances where no interviews
had been completed in a cell but the IDBR indicated establishments existed, and in instances
where a low number of interviews were conducted in relation to the population of that cell,
cells were merged primarily within size band (i.e. across industries) but where necessary
across size band as well.
Employer Skills Survey: Investment in Training follow-up
A separate Investment in Training study was conducted by IFF Research to provide detailed
estimates of employer expenditure on training. The approach replicated that of previous Cost
of Training studies in England and Northern Ireland.
Sampling
At the end of the UK ESS Wave 1 questionnaire those respondents who had arranged or
funded training for their staff in the previous 12 months were asked if they would be willing to
take part in a follow up study on training expenditure. Those agreeing to participate formed
the sample for this follow-up survey.
Quotas were set on the basis of training type by size within region. Due to limited sample a
census approach was taken in the devolved administrations.

238
Fieldwork
Employers who had indicated agreement to take part were called by an IFF interviewer to
confirm participation and contact details. They were then sent a datasheet via email or fax
containing the questions that were to be asked in the full interview (a copy of which can be
seen below). Sending this datasheet in advance allowed the respondent time to collect the
relevant information and increase the accuracy of responses. A few days after sending, an
interviewer called back to conduct the full interview.
In total, information on training expenditure was collected from 13,197 establishments, though
583 were rejected because of incompleteness (a large number of ‘don’t know’); hence analysis
is based on data from 12,614 establishments.
Fieldwork was undertaken by IFF Research from 1st May to 26th August 2015.
Weighting/grossing up
In order to weight the Investment in Training study, population figures were calculated from
weighted UK ESS Wave 1 data which had in turn been weighted using the IDBR figures used
for the main survey analysis. Data was weighted on the basis of interlocking grids on size by
sector by the type of training they carried out, with a regional rim weight.
Data modelling
In order to weight the Investment in Training study, population figures were calculated using
the core ESS 2015 survey data (which had in turn been weighted using the IDBR figures used
for the main survey analysis). Data were weighted on the basis of interlocking grids on seven
size bands by 14 SIC sectors (as in the core survey, but with Mining and Quarrying merged
with Manufacturing), by the type of training they carried out (on-the-job only, off-the-job only,
or both).
A regional RIM weight was then applied using targets based on the proportion training in the
English GOR regions, Northern Ireland, Scotland and Wales. An additional step was also
undertaken in 2015: an adjustment was applied to each weight to ensure that the profile of
size band within country was correct. This was in order to ensure establishment size was
accurately represented at a country as well as a UK level, increasing the accuracy of the spend
figure within countries48.
48 A technical paper with a more detailed description of the Investment in Training weighting approach is available on the UKCES website.

239
Only establishment-based weights were created for the Investment in Training survey, as all
data in the survey are establishment orientated.
Questionnaire design
Given the need to closely replicate the Investment in Training studies undertaken in the UK in
2011 and 2013, and previously in England in 2005, 2007 and 2009, and also in Northern
Ireland in 2008, the datasheet was largely unchanged compared to that used for these
previous surveys.
The only change made to the telephone questionnaire was the addition of one new question,
Q25, to estimate the amount spent by establishments on online training or e-learning, including
the costs incurred purchasing or developing online or e-learning. This question was asked of
those who identified in the core ESS 2015 interview that they had arranged or funded training
for staff in the last 12 months which involved online training or e-learning. Q25 was not added
to the datasheet due to the more straightforward nature of the information required, and to
avoid alteration of the components of the investment in training survey.

240
Appendix J: Bibliography Belt, V., and Giles, L. (2009) High Performance Working: A Synthesis of Key Literature.
UKCES Evidence Report 4. UK Commission for Employment and Skills, Wath-upon-Dearne.
Bloom, N., Genakos, C., Sadun, R. and Van Reenen, J. (2012) Management practices across
firms and countries: Working Paper 17850. National Bureau of Economic Research,
Cambridge, MA.
Brown, D. (2014). High Performance Working: a new segmentation of smaller workplaces. UK
Commission for Employment and Skills, Wath-upon-Dearne.
Campbell, M. (2013) Management Matters: Key Findings from the UKCES Surveys: Briefing
Paper UK Commission for Employment and Skills, Wath-upon-Dearne.
Davies, B., Gore, K., Shury, J. and Vivian, D. (2012) UK Employer Skills Survey 2011, UKCES
Evidence Report 45. UK Commission for Employment and Skills, London.
Eurostat (2015) EU Employment rate by sex, age group 20-64. Available at:
http://ec.europa.eu/eurostat/tgm/table.do?tab=table&plugin=1&language=en&pcode=t2020_
10.
Felstead, A., Green, F. and Jewson, N. (2013) Training in Recession: The impact of the 2008-
2009 recession on training at work, UKCES Evidence Report 72. UK Commission for
Employment and Skills, London.
Garrett, R., and Campbell, M. (2010) The Value of Skills: An Evidence Review, UKCES
Evidence Report 22. UK Commission for Employment and Skills, London.
Higher Education Statistics Agency (2015) Destinations of Leavers from Higher Education
Statistics. Available at: https://www.hesa.ac.uk/stats-dlhe.
HM Government (2013a) The Future of Apprenticeships in England: Implementation Plan.
Business, Innovation and Skills, London.
HM Government (2013b) Industrial strategy for construction – government and industry in
partnership: Construction 2025. Business, Innovation and Skills, London.
HM Treasury (2015) Fixing the foundations: Creating a more prosperous nation. London.
Inter Departmental Business Register (March 2012, March 2014). ONS.

241
Labour Force Survey, UK, 2013-2015. ONS.
NOMIS (2015). UK labour market statistics. ONS.
ONS (2014). International Comparisons of Productivity – First Estimates, 2013. ONS.
Available: http://www.ons.gov.uk/ons/rel/icp/international-comparisons-of-productivity/2013---
first-estimates/stb-icp1014.html
Shury, J., Winterbotham, M., Davies, B. and Oldfield, K. (2010) National Employer Skills
Survey for England 2009: Key findings report. UKCES Evidence Report 23. UK Commission
for Employment and Skills, London.
Shury, J., Vivian, D., Spreadbury, K., Skone James, A. and Tweddle, M. (2014) UK Employer
Perspectives Survey 2014. UKCES Evidence report 88. UK Commission for Employment and
Skills, London.
Störmer, E., Patscha, C., Prendergast, J., Daheim, C. and Rhisiart, M. (2014) The Future of
Work: Jobs and Skills in 2030. UKCES Evidence report 84. UK Commission for Employment
and Skills, Wath-upon-Dearne.
The Economist (2014) The digital degree (June 24th 2014). The Economist Newspaper
Limited, London. Available: http://www.economist.com/news/briefing/21605899-staid-higher-
education-business-about-experience-welcome-earthquake-digital
Tyler, G. (2015). Financial Services: contribution to the UK economy. House of Commons
Library.
UKCES (2009) Review of Collective Measures: Final Report, UKCES Evidence Report 10. UK
Commission for Employment and Skills, Wath-upon-Dearne.
UKCES (2014a) Careers of the Future: Background Report, UKCES Evidence Report 89. UK
Commission for Employment and Skills, Wath-upon-Dearne.
UKCES (2014b) Growth Through People. UK Commission for Employment and Skills,
London.
UKCES (2015). Growth Through People: Evidence and Analysis. UK Commission for
Employment and Skills, London.
Winterbotham, M., Vivian, D., Shury, J. and Davies, B. (2014) UK Employer Skills Survey
2013, UKCES Evidence Report 81. UK Commission for Employment and Skills, London.

242
Winters, G. (2014) Understanding Skills and Performance Challenges in the Logistics Sector.
UKCES Evidence report 88. UK Commission for Employment and Skills, Wath-upon-Dearne.
Wright, J. and Sissons, P. (2012) The Skills Dilemma: Skills Under-Utilisation and Low-Wage
Work. The Work Foundation, London.

This document is available at www.gov.uk/ukces
ISBN 978-1-908418-72-2 © UKCES 1st Ed/01/16
Evidence Reports present detailed findings of the research produced by the UK Commission for Employment and Skills. The reports contribute to the accumulation of knowledge and intelligence on skills and employment issues through the review of existing evidence or through primary research. UKCES Renaissance House Adwick Park Wath-upon-Dearne Rotherham S63 5NB T +44 (0)1709 774 800 F +44 (0)1709 774 801
UKCES Sanctuary Buildings Great Smith St. Westminster London SW1P 3BT T +44 (0)20 7227 7800