Employer skills survey 2017 · Chapter conclusions 122 6. High Performance Working 124 Chapter...
227
Employer skills survey 2017 Research report August 2018 Mark Winterbotham, David Vivian, Genna Kik, Jessica Huntley Hewitt, Mark Tweddle, Christabel Downing, Dominic Thomson, Naomi Morrice and Sam Stroud IFF Research
Transcript of Employer skills survey 2017 · Chapter conclusions 122 6. High Performance Working 124 Chapter...

Employer skills survey 2017 Research report
August 2018
Mark Winterbotham, David Vivian, Genna Kik, Jessica Huntley Hewitt, Mark Tweddle, Christabel Downing, Dominic Thomson, Naomi Morrice and Sam Stroud
IFF Research

2
Acknowledgements The UK Employer Skills Survey 2017 is one of the largest business surveys in the world and many individuals and organisations have been involved in its design and execution.
We would like to thank the 87,430 employers who spared time to take part in the survey.
The project was supported a steering group established to guide the direction of the project. Members of this group were: Thomas Byrne, Department for the Economy Northern Ireland, James Carey, Welsh Government, Joanne Corke, Welsh Government, Stuart King, Scottish Government, Ramona Franklyn, Department for Education (DfE), and Oliver Shaw, DfE.
Thanks are also due to Ipsos MORI and BMG Research, our partners in carrying out the fieldwork.
Particular thanks are reserved for the project manager of the survey at DfE, Oliver Shaw, and Ramona Franklyn, DfE, who supported the preparation of this report.
Mark Winterbotham
Director, IFF Research Ltd.

3
Contents List of figures 7
List of tables 10
Key findings across the ESS series (2011 – 2017) 11
Executive Summary 12
Introduction 12
Recruitment and skill-shortage vacancies 12
Skills gaps in the workplace 14
Training and workforce development 16
High performance working 17
1. Introduction and methodology 18
Background to the Employer Skills Survey 18
Methodological overview 19
Sampling 20
Structure of this report 22
Reporting conventions 23
2. Firmographics 25
The nature of UK establishments: understanding the survey population 25
Distribution of establishments and employment over time 27
Trading with the EU and employment of EU nationals 30
Employment of EU nationals 31
3. Recruitment and skill-shortage vacancies 33
Chapter summary 33
Introduction 34
Vacancies 35
Skill-shortage vacancies 37
Prevalence of skill-shortage vacancies 38
Skills lacking in the available labour market 46

4
The impact of skill-shortage vacancies 51
Wider recruitment challenges 52
Employer response to hard-to-fill vacancies 55
Recruitment of EU nationals to overcome hard-to-fill vacancies 57
Chapter conclusions 59
4. The Internal Skills Challenge 61
Chapter Summary 61
Introduction 62
Incidence, volume and density of skills gaps 63
Sectoral distribution of skills gaps 67
Occupational distribution of skills gaps 69
Density of skills gaps by occupation within sector 70
Causes of skills gaps 72
Transient causes 72
Non-transient causes 74
Positive transformational causes 74
Skills lacking internally 75
Technical and practical skills 75
People and personal skills 77
Skills lacking by occupation 78
Impact of skills gaps 80
Extent of impact 80
The specific impacts of skills gaps 81
Employer response to skills gaps 82
Actions taken to overcome skills gaps 83
Recruitment of EU nationals in response to skills gaps 85
Upskilling 86
The prevalence of upskilling needs 86
Occupations most affected by the need for upskilling 88

5
Reasons for a need for upskilling 89
Upskilling: skills that need improving 91
Technical and practical skills 91
People and personal skills 93
Under-use of skills 94
The prevalence of under-use of skills 94
Chapter conclusions 96
5. Training and workforce development 98
Chapter summary 98
Introduction 98
Incidence of training and workforce development 100
Number of staff trained 101
Training days 104
Types of training provided 106
Training to qualifications 108
Online / e-learning and other self-learning 110
Investment in training 112
Barriers and limits on training 118
Other development opportunities 122
Chapter conclusions 122
6. High Performance Working 124
Chapter Summary 124
Introduction 125
High Performance Working 125
Clusters of adoption 130
The relationship between HPW and skills shortages 132
The relationship between HPW and skills gaps 134
Impact of and responses to skills gaps 137
HPW and skills utilisation 141

6
The relationship between HPW and training 141
Increasing the take-up of HPW 142
Chapter conclusions 144
7. Conclusions 145
Appendix A: Supplementary tables 151
Appendix B: National time series tables 215
Appendix C: Industry coding 220
Appendix D: Occupational Coding 222
Appendix E: Sampling error and statistical confidence 223
Appendix F: Weighted base sizes 225
Appendix G: References 226

7
List of figures Figure 2.1 Size and sector profile of UK establishments ................................................. 26
Figure 2.2 Proportion of employers selling to or serving the EU ...................................... 31
Figure 2.3 Employment of EU nationals .......................................................................... 32
Figure 3.1 Incidence and density of vacancies, by country .............................................. 36
Figure 3.2 Incidence and density of skill-shortage vacancies (SSVs), by country ........... 39
Figure 3.3 Local Education Authorities in England with the highest and lowest densities of skill-shortage vacancies ................................................................................................... 40
Figure 3.4 Number and density of skill-shortage vacancies (SSVs), by sector ................ 41
Figure 3.5 Density and number of skill-shortage vacancies (SSVs), by occupation ........ 43
Figure 3.6 Skills lacking among applicants to establishments with skill-shortage vacancies (prompted) ...................................................................................................... 49
Figure 3.7 Types of skills lacking across occupations with the highest density of skill-shortage vacancies (SSVs) .............................................................................................. 50
Figure 3.8 Impact of skill-shortage vacancies (prompted)................................................ 52
Figure 3.9 Main non-skills-related causes of having hard-to-fill vacancies (unprompted) 53
Figure 3.10 Actions taken by employers to overcome hard-to-fill vacancies (unprompted) ......................................................................................................................................... 56
Figure 3.11 Recruitment of non-UK nationals to overcome hard-to-fill vacancies ............ 58
Figure 3.12 Proportion of employers with hard-to-fill vacancies trying to fill these by recruiting EU nationals, by nation, sector and size .......................................................... 59
Figure 4.1 Incidence and density of gaps over time by country ....................................... 64
Figure 4.2 Local Education Authorities in England with the highest and lowest densities of skills gaps ........................................................................................................................ 66
Figure 4.3 Density of skills gaps by sector ....................................................................... 68
Figure 4.4 Number and density of skills gaps by occupation ........................................... 69
Figure 4.5 Main causes of skills gaps (prompted) ............................................................ 73
8
Figure 4.6 Skills lacking among staff with skills gaps ....................................................... 76
Figure 4.7 Skills lacking in sectors with highest density of skills gaps ............................. 78
Figure 4.8 Skills lacking in occupations with highest density of skills gaps ...................... 79
Figure 4.9 Impacts of skills gaps by establishment size .................................................. 80
Figure 4.10 Impacts of skills gaps (prompted) ................................................................. 82
Figure 4.11 Actions taken to overcome skills gaps (prompted) ........................................ 84
Figure 4.12 Proportion of employers with skill gaps responding to these by trying to recruit non-UK nationals .................................................................................................. 85
Figure 4.13 Proportion of employers with skills gaps responding to these by recruiting EU nationals, by nation, sector and size ................................................................................ 86
Figure 4.14 Need for upskilling, by country, size and sector ............................................ 88
Figure 4.15 Single occupation most affected by a need for upskilling ............................. 89
Figure 4.16 Reasons for a need for upskilling (prompted) ............................................... 90
Figure 4.17 Skills that need developing among staff requiring upskilling (prompted) ...... 92
Figure 4.18 Skills that need developing among occupations most in need of upskilling .. 94
Figure 4.19 Incidence and density of staff who are both over-qualified and over-skilled by country ............................................................................................................................. 95
Figure 5.1 Training provision 2011 - 2017 ..................................................................... 100
Figure 5.2 Proportion of staff trained by sector, 2013 - 2017 ......................................... 103
Figure 5.3 Proportion of staff trained over the last 12 months by occupation (2013 - 2017) ....................................................................................................................................... 104
Figure 5.4 Training days per trainee by sector, 2013 - 2017 .......................................... 106
Figure 5.5 Types of training provided over the last 12 months by employers that train (prompted) ..................................................................................................................... 107
Figure 5.6 Use of online training or e-learning, by sector (2015 - 2017) ........................ 111
Figure 5.7 Reasons for not providing more training (spontaneous) ............................... 119

9
Figure 5.8 Reasons for not providing training in the previous 12 months (spontaneous) ....................................................................................................................................... 120
Figure 5.9 Employer interest in undertaking more training over the last 12 months than they were able to provide ............................................................................................... 121
Figure 6.1 Proportion of employers adopting each HPW practice ................................. 127
Figure 6.2 Number of HPW practices adopted by proportion of employers ................... 129
Figure 6.3 HPW employers by sector ............................................................................ 130
Figure 6.4 HPW and skills shortages ............................................................................. 133
Figure 6.5 Density of vacancies by HPW status and size band ..................................... 134
Figure 6.6 HPW and skills gaps ..................................................................................... 135
Figure 6.7 Employers reporting skills gaps, by sector and HPW status ......................... 136
Figure 6.8 Incidence and density of skills gaps, by size and HPW status ...................... 137
Figure 6.9 Impact of skills gaps by HPW status ............................................................. 139
Figure 6.10 Responses to skills gaps by HPW status .................................................... 140
Figure 6.11 HPW, HPW Cusp and non-HPW employers by size ................................... 143
Figure 6.12 HPW, HPW Cusp and non-HPW employers by sector ............................... 144

10
List of tables Table 1.1 Survey response rates 22
Table 1.2 Broad occupational groups 24
Table 2.1 UK establishment and employment populations over time 28
Table 2.2 UK establishment and employment populations over time, by size and sector 29
Table 3.1 Density of skill-shortage vacancies by occupation within sector 45
Table 4.1 Density of skills gaps by occupation within sector (percentage of staff not fully proficient) 71
Table 4.2 Reasons for a need for upskilling, by nation (prompted) 91
Table 5.1 Number and proportion of staff trained over the last 12 months, by country and establishment size 102
Table 5.2 Total training and development days, and days per person trained and per employee by country and establishment size (2011 - 2017) 105
Table 5.3 Training to nationally recognised qualifications over the previous 12 months 109
Table 5.4 Total training expenditure and spend per person trained and per employee (2011 to 2017), in 2017 prices 113
Table 5.5 Total training expenditure broken down by individual components (2011 to 2017) 116
Table 5.6 Training expenditure by size and sector, the proportion spent on off-the-job elements, and the breakdown of total training expenditure (both on-the-job and off-the-job) by key elements 117
Table 6.1 High Performance Working practices by factor grouping 126
Table 6.2 HPW ‘factor group’ take-up by sector (% of employers) 132
Table 6.3 Impact of skills gaps by sector and HPW status (% of employers) 138
Table 6.4 Impact of skills gaps in public and private sectors (% of employers) 138
Table 6.5 Responses to skills gaps by HPW status (% of employers) 141

11
Key findings across the ESS series (2011 – 2017)
Vacancies, skill-shortage vacancies and skills gaps rounded to the nearest 1,000. †Training spend data has been adjusted for inflation and are at 2017 prices.
2011 2013 2015 2017
Vacancies and skill-shortage vacancies (SSVs)
% of establishments with any vacancies 14% 15% 19% 20%
% of establishments with any hard-to-fill vacancies 4% 5% 8% 8%
% of establishments with SSVs 3% 4% 6% 6%
% of all vacancies that are SSVs 16% 22% 23% 22%
Number of vacancies 587,000 655,000 927,000 1,007,000
Number of skill-shortage vacancies 91,000 146,000 209,000 226,000
Skills gaps
% of establishments with any staff not fully proficient 17% 15% 14% 13%
Number of skills gaps 1,485,000 1,410,000 1,380,000 1,267,000
Number of staff not fully proficient as a % of employment 6% 5% 5% 4%
Training
% of establishments training staff over the last 12 months 65% 66% 66% 66%
% of establishments providing off-the-job training in the last 12 months 47% 49% 49% 48%
% of workforce trained 55% 62% 63% 62%
Total days training 115m 113m 118m 114m
Training days per employee 4.2 4.2 4.2 4.0
Total training expenditure† £43.8bn £41.1bn £43.6bn £44.2bn
Training expenditure per employee† £1,600 £1,500 £1,600 £1,500

12
Executive Summary
Introduction The UK Employer Skills Survey (ESS) is one of the largest business surveys in the world, with the data in this report based on survey responses from over 87,000 employers. This research provides a comprehensive source of intelligence on the skills challenges that UK employers face both within their existing workforces and when recruiting, the levels and nature of investment in training and development, and the relationship between skills challenges, training activity and business strategy.
The 2017 survey is the fourth in a series conducted biennially since 2011 (with nation-specific skills surveys pre-dating this). The ESS series therefore provides rich labour market intelligence from the period when the UK economy was emerging from the recession of the late 2000s, to more recent years when the UK has experienced relatively sustained economic growth and high levels of job creation.
The latest survey was carried out between May and October 2017. Employers with at least two people on the payroll were in scope, and interviews were conducted at an establishment level with the most senior person at the site with responsibility for human resources and workplace skills.
Recruitment and skill-shortage vacancies Levels of recruitment activity provide an indication of growth and change in the labour market and wider economy. Recruitment activity has continued to grow since 2015, with one in five UK employers (20%) having any vacancies at the time of fieldwork (a one percentage point increase from 2015), with these employers reporting a total of just over one million vacancies (1,007,000), a 9% increase on the figure in 2015.
Growth in recruitment activity was evident across most of the UK; most notably in Northern Ireland which had the largest proportional increase compared with 2015 in the number of vacancies reported (an 18% increase). The exception was in Wales where the number of vacancies was unchanged from two years ago.
When employers have vacancies, potential employees are either able and willing to meet employer requirements, or they are not. In line with previous years, a third of vacancies in the UK (33%) were considered hard to fill. When employers struggle to fill vacancies, this is often due to a lack of the required skills, qualifications or experience among applicants. Collectively these are known as ‘skill-shortage vacancies’. Although relatively few employers experienced them at the time of the survey (6%, the same proportion as in 2015), these employers reported a range of impacts resulting from them, including:

13
increased workloads for other staff; loss of business or orders to competitors; delays developing new products or services; and difficulties introducing new working practices.
There has been an 8% increase in the number of skill-shortage vacancies compared with 2015: from 209,000 to 226,000. This increase in the number of skill-shortage vacancies was similar to the proportional increase in vacancies, meaning the density of skill-shortage vacancies (i.e. the proportion of vacancies that were hard to fill because of reported skill shortages) has remained stable since 2013 at 22%.
There was variation by country. In England and Scotland the prevalence of skill-shortage vacancies was very similar to 2015 and largely mirrored the UK picture. In Wales there has been a three percentage point increase in the density of skill-shortage vacancies (from 24% to 27%), and in Northern Ireland the density of skill-shortage vacancies increased from 14% in 2015 to 21% in 2017 (a return to the level reported in 2011).
Reported skill shortages when recruiting were particularly prevalent in certain sectors. They were most numerous in the Business Services sector (just under 52,000 at the time of the survey), though as a proportion of all vacancies in the sector, the density of such vacancies was highest in Construction where over a third of vacancies (36%) were considered skill-shortage vacancies (a similar level to 2015).
By occupation, employers were most likely to have experienced skills-related difficulties when recruiting for Skilled Trades positions (such as chefs, electricians, and vehicle technicians). Around two in every five Skilled Trades vacancies were proving hard to fill for skills related reasons (42%). This occupation has had the highest density of skill-shortage vacancies in all previous iterations of the ESS series.
The skills that employers found to be lacking among applicants ranged across both technical and practical skills, and people and personal skills. On the technical side, employers reported a lack of digital skills, skills related to operational aspects of the role, and a lack of complex analytical skills. The main people and personal skills lacking predominantly related to self-management skills, management and leadership, and sales and customer handling skills.
The skills lacking among applicants vary quite substantially depending on the role. For instance, the skills disproportionately reported to be lacking among applicants for Skilled Trades positions included manual dexterity and the ability to adapt to new equipment or materials. Whereas the skills disproportionately lacking for Professionals included advanced IT skills and complex analytical skills.
The majority of hard-to-fill vacancies (67%) are caused, at least in part, by a lack of skills, qualifications and experience among applicants. However, vacancies can also prove hard to fill for other reasons. Such reasons principally include a lack of applicants for the role (something which may be skills related if applicants do not apply because the

14
advertised role has high and clearly stated requirements), or specific issues related to the job role (e.g. unattractive terms and conditions or unsociable hours) or the employer (e.g. remote location or poor transport links).
Overall there were around 110,000 vacancies that employers were finding hard-to-fill exclusively for reasons unrelated to applicants’ skill levels (11% of all vacancies). This represents an 18% increase on the number of these vacancies reported in 2015, far higher than the increase in the overall number of vacancies (9%), suggesting a growing general (non-skills-related) recruitment challenge in the economy.
By sector the proportion of vacancies proving hard to fill exclusively for non-skills-related reasons was highest in Health and Social Work (19%, up from 13% in 2015). In this sector the density of skill-shortage vacancies has remained fairly static in recent years, indicating that difficulties filling vacancies in this sector are increasingly due to non-skills-related reasons.
Among employers who had vacancies that were proving hard to fill, one in three (34%) had attempted to recruit EU nationals to try to help overcome recruitment difficulties. This was a particularly common way of trying to fill hard-to-fill vacancies in the Hotels and Restaurants sector (53%).
Skills gaps in the workplace Alongside skill shortages that may be experienced when recruiting, employers may also experience skills gaps in their existing workforce. This internal skills challenge arises when employees lack proficiency to fulfil their role. Such skills gaps, where persistent, may hinder an employer’s ability to function to its full potential in terms of productivity and profitability.
Although most employers in the UK considered their existing workforce to be fully proficient, 13% reported skills gaps in their workforce and approximately 1.27 million staff lacking full proficiency in their role (equivalent to 4.4% of the total UK workforce). This continues a trend of a steady decline over the course of the ESS series both in the proportion of employers reporting skills gaps (from 17% in 2011), and in the proportion of the workforce considered to lack proficiency (from 5.5% in 2011).
There is some variation in this trend by nation. Whilst the density of skills gaps (i.e. the proportion of the workforce lacking full proficiency) has decreased over time in England, it has remained largely unchanged since 2015 in Scotland and Wales (a skills gap density of 5.0% and 4.7% respectively). In Northern Ireland the proportion of the workforce with skills gaps has increased slightly since 2015 (from 3.3% to 3.8%), though is still below the levels reported in 2011 and 2013.

15
The overall decrease in skills gap density at a UK level was broadly reflected across most sectors of the economy. Hotels and Restaurants (6.7%) and Manufacturing (5.8%) were again the two sectors with the highest proportions of their workforce lacking full proficiency, albeit at lower levels than in 2015. The largest decrease in the density of skills gaps was in the Public Administration sector (from 6.4% in 2015 to 3.9% in 2017). Two sectors which saw an increase in the density of skills gaps were Financial Services (from 3.7% in 2015 to 5.0% in 2017), and Primary Sector and Utilities (from 3.8% to 4.7%).
At an occupational level, skills gaps continued to be more prevalent in what might be described as ‘labour intensive’ roles (i.e. Elementary occupations and Machine Operatives) and ‘service intensive’ occupations (i.e. Caring, Leisure and Other Services staff and Sales and Customer Service staff).
Transient factors, such as staff being new to the role or training only being partially complete, were a contributing cause of most skills gaps (76%): one would expect these skills gaps to be resolved over time. While the proportion of skills gaps caused at least partly by transient factors has increased slightly since 2015 (73%), the proportion that were exclusively attributed to transient causes remained unchanged at 22%.
Other causes of skills gaps included staff lacking motivation (a contributing factor for 32% of all skills gaps), staff performance not improving following training (31%), and staff not receiving appropriate training (25%). Skills gaps may also be a by-product of organisational innovation, such as the introduction of new working practices, new technology, and new products or services. However, the proportion of skills gaps attributed to these factors has declined since 2015 (34% in 2017 compared with 37% in 2015).
Two-thirds of employers with skills gaps (66%) reported that lack of proficiency among their staff was impacting the performance of their organisation, mainly through increased workloads for other staff, followed by higher operating costs and difficulties meeting quality standards.
Most employers with skills gaps (85%) had taken steps to try to improve the proficiency of their staff, most commonly through increased training activity. A further 5% of employers with skills gaps had not yet acted in response to skills gaps but planned to do so in the future. One in seven employers with skills gaps (14%) had looked to recruit EU nationals in response to their internal skills challenge; this was most common in the Hotels and Restaurants sector (27%).
As was the case in 2015, the most common skill lacking among staff was time-management and prioritisation of tasks, contributing to nearly three-fifths of all skills gaps (59%). Other causes of skills gaps included deficiencies in sales and customer skills, and a lack of knowledge of an organisation’s products, services and processes (both 49%).

16
Reported deficiencies in complex analytical skills (43%) and digital skills (35%) were less prevalent than in 2015. Specifically, the proportion of skills gaps caused by a lack of proficiency in advanced or specialist IT skills fell from over a quarter in 2015 (27%) to less than a fifth in 2017 (19%). Deficiencies in digital skills disproportionately affected Administrative and Clerical staff (58%) as well as those the Public Administration sector (50%).
Alongside looking at existing skills deficiencies in the workforce, ESS reports on employers’ expected need to upskill their staff over the coming year. Around six in ten UK employers (63%) anticipated that their skills requirements will change over the next 12 months, thus requiring staff to acquire new skills. The proportion of employers identifying a need for upskilling was higher in 2013 (72%). Around one in eight UK employers (13%) anticipated a need for at least some of their staff to acquire new skills or knowledge over the next 12 months as a result of the UK’s decision to leave the EU.
ESS also provides an assessment of staff being underutilised; that is having both qualifications and skills at a higher level than is needed for their current role. Over a third of employers (35%) reported that they had underutilised employees (a five percentage point increase from 2015), with 2.5 million workers underutilised in this way (8.7% of the workforce, up from 7.1% in 2015). The prevalence of staff underutilisation was highest in the Hotels and Restaurants sector where 16% of the workforce were described by their employer as having qualifications and skills at a higher level than is needed for their role.
Training and workforce development Training for staff is an important means through which employers can help tackle skill shortages − either those faced through an inability to recruit sufficiently skilled labour, or those that are present in the existing workforce – as well as to generally develop workforce skills to increase productivity and expertise.
In line with the two previous ESS surveys in 2013 and 2015, two-thirds of employers in the UK (66%) had provided training for their staff over the past 12 months, with either off-the-job training or on-the-job training provided by around half of all employers in each case (48% and 53% respectively). The proportion of staff trained over the past 12 months also remained consistent with previous years at 62%, though reflecting the increased levels of employment, the number of employees trained increased from 17.4 million in 2015 to 17.9 million in 2017.
There are indications that the quantity and type of training may not be being maintained. For instance, whilst the number of staff trained has increased, the total number of training days provided has decreased, hence the average number of days training per trainee has decreased from 6.8 days in 2015 to 6.4 days in 2017.

17
In real terms (i.e. adjusted for inflation), overall training expenditure has increased by 1% since 2015, from £43.6bn to £44.2bn. However, this training expenditure is equivalent to £2,470 per person trained per annum, and £1,530 per employee (including staff not trained at all): decreases of 1% and 2%, respectively compared with 2015.
There was also a decrease in the number of staff being trained to nationally recognised qualifications, from 3.5 million in 2015 (20% of those being trained) to 3.3 million in 2017 (18% of all those being trained).
An evident shift since 2015 in how employers provide training for their staff comes from the increased use of online training and e-learning. Around half (51%) of all employers providing training had made use of online training or e-learning for at least some of their training; up from 45% in 2015. Increased use of online training and e-learning was evident across the UK nations and all sectors of the economy.
High performance working To complement the main analyses presented throughout this report – which predominantly focus on differences by employers’ size, sector and geography – the ESS series provides a measure of how businesses operate and organise their work to identify ‘high performance working’ practices. High performance working (HPW) is a general approach to managing organisations that aims to stimulate more effective employee involvement and commitment in order to achieve high levels of performance.
Overall, 9% of employers are regarded as HPW employers; that is, they adopt at least 14 of the 21 HPW practices covered in ESS. This compares to 8% in 2015.
HPW employers tend to be more active in the recruitment market. They are more likely to report having a vacancy, having a hard-to-fill vacancy, and having a skills shortage vacancy. This is the case across all size bands (up to employers with 250 employees), and not just a function of larger employers being more likely to be HPW. However, HPW employers generally find it easier to fill their vacancies (i.e. the proportion of vacancies reported to be hard-to-fill, including for skills related reasons, is lower among HPW employers).
There is a clear relationship between an establishment’s working practices and their provision of training. HPW employers were much more likely to have provided training for their staff than non-HPW employers. They were also more likely to have provided training that led to nationally recognised qualifications and to qualifications that are of a higher level. These patterns hold true across size bands.

18
1. Introduction and methodology
Background to the Employer Skills Survey The Employer Skills Survey (ESS) provides a comprehensive source of intelligence on: the skills challenges that UK employers report both within their existing workforces and when recruiting; the levels and nature of investment in training and development; and the relationship between skills challenges, training activity and business strategy.
The 2017 survey is the fourth in a series conducted biennially since 2011.1 The period since the last ESS in 2015 has been marked by continued economic growth,2 and high levels of job creation, with the employment rate of 75.1% among the highest since records began (ONS Labour Market Bulletin, 2017).
Despite these indicators of relative economic health, the UK’s long-standing productivity gap relative to international competitors remains pronounced and has been exacerbated by weak productivity growth since the financial crisis (Taylor, M., 2017). Moreover, when compared to other nations, the UK’s current performance and future prospects in terms of workforce skills, as measured by qualifications, are mixed, with relative strength in terms of higher level qualifications accompanied by relative weakness at both intermediate and low levels (Campbell, M., 2016).
Accurate and detailed labour market information remains key to informing policy designed to address these issues, especially amid a period of change as the UK leaves the European Union and the tendency towards reduced net migration continues (ONS Migration Statistics Bulletin, 2017), as well as increasing levels of automation and use of artificial intelligence.
Based on survey responses from over 87,000 employers across the UK, ESS 2017 enables assessment of how skills deficiencies are impacting business and organisational performance at both UK and a more local level. It measures the prevalence, character and impact of skills challenges, and details the nature and extent of employer investment in skills and training. It provides a substantial body of evidence that can be used by a wide range of organisations and audiences.
1 The 2011, 2013 and 2015 editions of the survey were commissioned by the UK Commission for Employment and Skills (UKCES). Responsibility for the ESS series transferred to the Department for Education following the closure of UKCES in 2016. The government has conducted employer surveys on skills and training since 1990, starting with the Skill Needs in Britain surveys. See Appendix B for more details on related predecessor surveys. 2 3.7% growth in UK gross domestic product (GDP) between 2015 Q2 and 2017 Q2. Source: ONS Quarterly National Accounts time series dataset (QNA).

19
The evidence presented in this report represents an initial overview of the survey’s findings, in which we:
• Present findings across the UK, including time series analysis comparing the results to those seen in 2011, 2013 and 2015;
• Compare experiences and behaviours between employers across the countries of the UK;
• Analyse differences in the overall picture by such variables as workplace size and sector, and where feasible by occupation;
• Examine the interrelationship between the key ESS measures - skills gaps, skill shortages and workforce development activity.
As well as written commentary, the appendices to this report include data tables detailing key survey measures.
Full sets of data tables breaking down findings by nation, size, sector, and other classifications (such as whether in the public or private sector, and whether part of an organisation with multiple site), have also been published alongside this report on the gov.uk website.
Methodological overview ESS 2017 has a very similar methodology to the previous ESS studies in terms of questionnaire design, sampling, data collection, data reduction and weighting, to preserve the ability to compare data over time.
The survey was carried out in two parts: a core survey of UK establishments and a follow-up survey looking at the investment employers had made in providing training to employees in the previous 12 months (the “Investment in Training Survey”). Both surveys were conducted by telephone.
This section briefly summarises the key features of the methodology adopted across both surveys. Further detail can be found in the separate technical report which has been published alongside this report on the gov.uk website.

20
Sampling
The population covered by the survey comprised UK employers at the establishment level (rather than at an organisational level)3 with at least two staff on the payroll. Sole traders with a single person on the payroll were excluded.
The survey encompassed establishments across the whole of the UK, covering all sectors of the economy (the commercial, public and charitable spheres). The profile of this population was established through Office for National Statistics (ONS) data from the March 2016 Inter-Departmental Business Register (IDBR), the most up to date business population figures available at the time of the survey.
The sample of establishments was primarily sourced from the commercial data supplier, Market Location. This was supplemented by records supplied directly through the IDBR to improve coverage of establishments in specific sectors and parts of sectors that are underrepresented in Market Location’s database.
Quotas for the main survey were set by size within sector separately for Scotland, Wales, Northern Ireland and nine English regions. In addition to geography, sector and size of establishments, the Investment in Training follow-up survey also ensured robust coverage by the nature of the training provided (whether establishments provided on-the-job training only, off-the-job training only, or both). All the establishments interviewed for the Investment in Training Survey had been interviewed as part of the core survey and had given their permission to be contacted for this follow-up research.
Questionnaire
Following a review of the 2011, 2013 and 2015 ESS questionnaires by DfE and its partners, the questionnaire for ESS 2017 did not require substantial redevelopment. There was, however, an overall aim to reduce the average interview length from 23 to 21 minutes, alongside introducing new questions and answer codes to explore areas of interest relating to the UK’s decision to leave the European Union (EU).
The EU-related questions included: (a) questions to determine the proportion of establishments which serve or sell to the EU; (b) a question to determine how many staff are from EU member states and are not UK citizens; and (c) two new questions to determine the extent to which employers with hard-to-fill vacancies and/or skills gaps have tried to recruit EU nationals to help overcome these difficulties.
3 i.e. multiple sites (or premises) of a larger organisation were in scope for the research and were thus counted separately for sampling purposes. This was in recognition of the influence that local labour markets have on skill issues and the fact that skills issues are felt most acutely at the site level.

21
Another change of note was the full transition to the ‘new’ list of skills descriptors partially introduced in ESS 2015.4 This means that time series data on skills lacking among applicants, or among the existing workforce, goes back only to 2015.
Upskilling and retention questions are rotated in alternate surveys, with the upskilling module being included in ESS 2017.
As in 2013 and 2015, a modular questionnaire design was used whereby certain sections (such as questions on upskilling and high performance working practices) were only asked of half of the respondents selected at random. The report makes clear which questions this applies to.
The questionnaire administered for the previous UK Investment in Training Survey in 2015 was used again in 2017.
Copies of the questionnaires used for both surveys are published alongside this report on the gov.uk website.
Fieldwork
Fieldwork for the core survey was undertaken between May and October 2017, and involved 87,430 interviews.5 Fieldwork was conducted by three research agencies (IFF Research, BMG Research and Ipsos MORI).
Fieldwork for the follow-up Investment in Training Survey was undertaken by IFF Research between June and October 2017 and involved 12,488 interviews with establishments that had taken part in the core survey.
An overall response rate of 43% was achieved for the core survey. Table 1.1 shows response rates by country.
For the Investment in Training follow-up, respondents were already engaged with the survey so predictably a much higher response rate (62%) was achieved.
4 In ESS 2015, half of employers with skill-shortage vacancies and/or skills gaps were randomly assigned to the ‘new’ list of skills descriptors, with the other half assigned to the ‘old’ skills descriptors used in ESS 2013 and 2011. 5 Tables A.1.1 to A.1.5 in Appendix A provide full breakdowns on the number of interviews achieved (i.e. unweighted base sizes) by country, size and sector.

22
Table 1.1 Survey response rates6
Weighting
Findings from the core survey have been weighted and grossed up to accurately represent the total population of UK establishments with at least two people on the payroll. This has been done on a size, sector and geographic basis. Separate weights have been generated which allow findings to be presented (a) based on the number of workplaces reporting a particular experience, and (b) based on the number of employees and/or job roles affected by different challenges. The weighting approach has retained consistency with previous iterations of the survey and allows for time series comparisons across the ESS series.
Findings from the Investment in Training survey have been weighted and grossed up to reflect the population of training establishments. These population figures were generated from the weighted findings of the core survey. Refinements to modelling of training data were introduced for the current survey, and also applied retrospectively to 2011, 2013 and 2015 data. This means that training spend for previous years may differ to those published in previous reports.
Structure of this report This report has been structured into four key sections followed by a conclusions chapter.
• Chapter 2: Firmographics
This chapter provides context to the main findings by describing some of the key firmographic characteristics of the UK employer and employment populations, as well
6 A full breakdown of response rates (including the number of records called, number of refusals etc.) is included in the accompanying technical report.
UK England Northern Ireland Scotland Wales
Core survey
Interviews 87,430 71,527 3,973 6,017 5,913
Response rate 43% 42% 49% 54% 47%
Investment in Training follow up
Interviews 12,488 8,882 864 1,409 1,333
Response rate 62% 62% 64% 65% 62%

23
as data from some of the new EU-related questions concerning whether employers sell to (or serve the populations of) the EU, as well as their employment of EU nationals.
• Chapter 3: Recruitment and skill-shortage vacancies
This chapter discusses recruitment activity and difficulties in filling vacancies due to skill-shortages. The chapter examines the proportion of establishments with current vacancies and skill-shortage vacancies, the volume and density of such vacancies, the skills lacking in the available labour market, the impact of skill-shortage vacancies on employers, and wider recruitment challenges.
• Chapter 4: The internal skills challenge
This chapter looks at the extent and nature of skills gaps within the workforce and how these affect different occupations, the causes and impact of these skills gaps, and the way employers respond to them. The chapter then explores the under-use of skills and qualifications, and the prevalence, occupational breakdown, and skills subject to upskilling needs.
• Chapter 5: Training and workforce development
Chapter 5 explores in detail employers’ training and development activities for their employees, including the types of training provided, employers’ expenditure on training, and barriers to providing (more) training.
• Chapter 6: High performance working practices
This chapter explores how employers manage, develop, engage with and incentivise their staff, and seeks to assess the prevalence of High Performance Working (HPW) practices, including how they relate to skills shortages, skills gaps, and training.
• Chapter 7: Conclusions
The final chapter summarises the key themes emerging from the survey and considers their implications.
Reporting conventions The terms “establishment”, “employer” and “workplace” are used interchangeably throughout this report to avoid excessive repetition.
Throughout the report unweighted base figures are shown on tables and charts to give an indication of the statistical reliability of the figures. These figures are always based on the number of establishments answering a question, as this is the information required to

24
determine statistical reliability. This means, for example, that where percentages are based on “all vacancies” (such as the percentage of all vacancies which are hard to fill) the base figure quoted is the unweighted number of establishments with vacancies.
Usually survey data on occupations are discussed at one-digit standard occupational classification (SOC) level. However, on occasion to aid analysis, the report discusses occupations at a broader classification of high-skill, middle-skill, service-intensive and labour-intensive roles, as shown in Table 1.2.
Table 1.2 Broad occupational groups
In tables, “zero” is denoted as a dash (“-“); and an asterisk is used (“*”) if the figure is larger than zero but less than 0.5%.
Throughout the report, figures with a base size of fewer than 30 establishments are not reported (a double asterisk, “**”, is displayed instead), and figures with a base size of 30 to 49 are italicised and should be treated with caution.
The scale and scope of data collected in ESS 2017 means that it is a valuable research resource supporting detailed and complex statistical analysis of the inter-relationships between employer characteristics, and their practices and experiences. The findings presented in this report reflect a descriptive exploration of the data. All differences referred to in the text are statistically significant at the 95% level of confidence. Further statistical information can be found in Appendix E.
Specific occupation Broad occupational group
• Managers • Professionals • Associate Professionals
High-skill
• Administrative and Clerical • Skilled Trades
Middle-skill
• Caring, Leisure and Other Services • Sales and Customer Service
Service-intensive
• Machine Operatives • Elementary Occupations
Labour-intensive

25
2. Firmographics In order to provide context to the main findings presented throughout the rest of the report, this chapter firstly describes some of the key characteristics of the UK employer and employment populations using Office for National Statistics (ONS) data. This chapter then reports on some of the new EU-related questions added to the survey concerning whether employers sell to (or serve the populations of) the EU, as well as their employment of EU nationals. Data from these questions are presented here to provide further context and background on the nature of UK establishments.
The nature of UK establishments: understanding the survey population Figure 2.1 summarises key information on the profile of establishments and employment across the UK, based on ONS data. This shows that while the smallest establishments with fewer than five employees account for over half (54%) of all establishments, they account for just 9% of all employment. In contrast, the largest establishments with 100 or more employees make up just 2% of all establishments, but account for 42% of all employment.

26
Figure 2.1 Size and sector profile of UK establishments
54%
21%
15%
5% 9%
9%
15%
12%
12%
42%
100+50 to 9925 to 4910 to 245 to 92 to 4
Size
Sector
6% 5%
9%
20%
9%
3%4%
2%
22%
1%3%
7% 8%
3%
8%
4%
16%
7%
4% 4% 3%
18%
4%
9%
13%
5%
Prim
ary
Sect
oran
d U
tiliti
es
Man
ufac
turin
g
Con
stru
ctio
n
Who
lesa
le a
ndR
etai
l
Hot
els
and
Res
taur
ants
Tran
spor
t and
Stor
age
Info
rmat
ion
and
Com
mun
icat
ions
Fina
ncia
lSe
rvic
es
Busi
ness
Serv
ices
Publ
icAd
min
istra
tion
Educ
atio
n
Hea
lth a
nd S
ocia
lW
ork
Arts
and
Oth
erSe
rvic
es
EstablishmentsEmployment
Source: ONS Inter-Departmental Business Register (IDBR), March 2016
% of all establishments and % of all employment
% of all establishments and % of all employment
Establishments Employment

27
The largest sectors are Business Services7 and Wholesale and Retail which account for 22% and 20% of all establishments, respectively. Between them, establishments in these two sectors employ just over a third of the UK workforce (34%). Figure 2.1 illustrates that the distribution of establishments across sectors is different to the distribution of employment. These variances primarily reflect the differing size profile of establishments within sectors. For instance, the Construction sector accounts for 9% of all establishments but employs only 4% of the workforce. This reflects the fact that the majority of Construction employers (71%) are small establishments with fewer than five employees. Conversely, the Public Administration, Education, and Health and Social Work sectors account for a larger share of total employment than of establishments.
Table A.2.1 in Appendix A shows the size profile of each sector. Table A.2.2 in Appendix A shows the profile of UK establishments according to whether they are private, public or third sector, as well as the proportion that are single site establishments or part of a larger organisation with multiple sites.
Distribution of establishments and employment over time
Where possible the report presents time series data across the iterations of the ESS series (2011 to 2017). It is therefore useful to understand the changes in the establishment and employment populations as context for changes in survey data over time.
Table 2.1 details the UK establishment and employment populations that each survey was grossed up to. This shows that at a UK level the establishment population has increased between each iteration of the survey, with the largest increase occurring between 2015 and 2017. Since 2013, the employment population has increased between each iteration of the ESS series.
7 Business Services includes ‘real estate activities’, ‘professional, scientific and technical activities’, and ‘administrative and support service activities. See Appendix C for more detail.

28
Table 2.1 UK establishment and employment populations over time
2011 2013 2015 2017 Establishment population (UK) 1,742,000 1,744,000 1,767,000 1,895,000
% change in establishments - 0% 1% 7%
Employment population (UK) 26,990,000 26,959,000 27,755,000 28,861,000
% change in employment - 0% 3% 4% Source: ONS Inter-Departmental Business Register
The percentage changes shown are relative to the previous iteration
To help understand the most recent population changes, Table 2.2 details the size and sector populations in 2015 and 2017. This shows growth in all size bands, but largest increases in the smallest establishments with 2-4 employees.

29
Table 2.2 UK establishment and employment populations over time, by size and sector
Establishment Employment
2015 2017 % change 2015 2017 % change
2 to 4 908,000 1,017,000 +12% 2,383,000 2,645,000 +11% 5 to 9 394,000 399,000 +1% 2,572,000 2,608,000 +1% 10 to 24 275,000 284,000 +3% 4,109,000 4,236,000 +3% 25 to 49 101,000 104,000 +3% 3,467,000 3,573,000 +3% 50 to 99 50,400 51,900 +3% 3,463,000 3,560,000 +3% 100-249 26,900 27,800 +3% 4,085,000 4,203,000 +3%
250+ 11,800 12,100 +3% 7,676,000 8,035,000 +5%
Primary Sector and Utilities
109,000 111,000 +2% 697,000 785,000 +13%
Manufacturing 99,000 101,000 +2% 2,371,000 2,357,000 -1% Construction 159,000 173,000 +9% 1,193,000 1,250,000 +5%
Wholesale and Retail
371,000 377,000 +2% 4,494,000 4,572,000 +2%
Hotels and Restaurants
160,000 175,000 +9% 1,961,000 2,138,000 +9%
Transport and Storage
52,000 57,000 +10% 1,221,000 1,286,000 +5%
Information and Communications
77,000 85,000 +10% 1,010,000 1,050,000 +4%
Financial Services
38,000 40,000 +4% 1,005,000 1,000,000 0%
Business Services
364,000 421,000 +16% 4,786,000 5,307,000 +11%
Public Administration
20,000 18,000 -9% 1,356,000 1,290,000 -5%
Education 58,000 59,000 +1% 2,608,000 2,593,000 -1%
Health and Social Work
132,000 135,000 +2% 3,791,000 3,878,000 +2%
Arts and Other Services
128,000 145,000 +14% 1,262,000 1,356,000 +7%
Source: ONS Inter-Departmental Business Register

30
By sector there has been marked growth of between 9% and 16% from 2015 to 2017 in the number of establishments operating in the Construction, Hotels and Restaurants, Transport and Storage, Information and Communications, Business Services, and Arts and Other Services sectors. These sectors, along with Primary Sector & Utilities, have also seen the largest increases in employment.
Only the Public Administration sector has seen a decrease in the number of establishments between 2015 and 2017 (a decrease of 9%). Employment in this sector has also decreased (by 5%). Employment also fell between 2015 and 2017 in Manufacturing, Financial Services, and Education.
Trading with the EU and employment of EU nationals
As mentioned earlier in the methodology section, a number of EU-related questions were introduced to ESS 2017. Included among these were questions on whether employers sell to (or serve the populations of) the EU, as well as their employment of EU nationals. Data from these questions are presented here to provide further context and background on the nature of UK establishments.
Selling to the EU
One in four employers (25%) reported that they sell products to, or serve the populations of, the EU (outside the UK). Nine per cent of all employers described the EU as their primary market. Among employers based in London, more than a third (35%) reported that they sell to or serve the EU (13% reporting it as their primary market). Northern Ireland, which shares a land border with the Republic of Ireland (an EU member state), had a higher than average proportion of employers reporting that they sell to the EU (32%), though the proportion reporting it to be their primary market was in line with the UK average.
As shown in Figure 2.2, nearly half of employers in the Manufacturing and Information and Communications sectors sell to or serve the population of the EU (48 and 46% respectively), and as many as a sixth of the former (16%) and a fifth of the latter (20%) have the EU as their primary market. Construction employers were the most likely to serve a UK-only market (92%).
The larger the establishment the more likely they are to trade with the EU, rising from around a fifth of those with 2-24 staff, to a third of those with 25-249 staff, to approaching half (45%) of the largest establishments with 250 or more employees. Among the largest establishments around one in six (17%) describe the EU as their primary market.

31
Figure 2.2 Proportion of employers selling to or serving the EU
Employment of EU nationals One in five employers (19%) employed at least one member of staff from an EU (non-UK) member state. Survey results suggest 9% of the UK workforce in establishments with two or more staff were non-UK EU nationals.8 This proportion was higher in England (10%, rising to 20% in London) than in Scotland (7%), Northern Ireland (6%) or Wales (4%).
As shown in Figure 2.3, the proportion of sectors employing any EU nationals varied widely, and was highest in the Hotels and Restaurants sector (33%), followed by Health and Social Work (25%) and Education (23%). In comparison just 8% of Construction employers had any EU nationals on their payroll.9
8 This is similar to data published by the Office for National Statistics (ONS) which reported that that 7% of the UK labour market are EU nationals. Source: ONS (2016) International immigration and the labour market, UK: 2016. 9 It should be noted for context that the survey focused on full-time and part-time employees on the payroll. Contractor and agency staff were not in scope for the survey and not included in employers’ answers when asked how many EU nationals they employ.
Base: All establishments in Module 2 (43,437)
17%
14%
12%
10%
8%
8%
250+
100 to 249
50 to 99
25 to 49
5 to 24
2 to 4 23%
26%
30%
33%
34%
45%2%
2%
4%
4%
7%
3%
5%
8%
11%
12%
11%
20%
16%
9%
Construction
Health & social work
Education
Primary & Utilities
Hotels & restaurants
Public admin.
Arts & Other Services
Financial Services
Wholesale & Retail
Transport & Storage
Business Services
Information & Comms
Manufacturing
UK
48%
46%
30%
30%
30%
21%
20%
20%
17%
16%
14%
12%
9%
25%
Primarily At all
25%
19%
22%
32%
9%
7%
8%
7%
X% EU is primarymarket
Proportion of establishments
selling to / serving the EU
Produced by IFF Research

32
The proportion of the workforce that were (non-UK) EU nationals was highest among employers in the Hotels and Restaurants sector (19%) and was above one in ten within Primary and Utilities (18%), Information and Communications (13%) and Manufacturing and Business Services (each 11%). While employers in Education were more likely than average to employ any EU nationals, EU nationals comprise a small proportion of the total workforce in the sector (3%, the lowest of all sectors along with Public Administration).
Figure 2.3 Employment of EU nationals
The proportion of all employees who are from EU member states increases with the size of the establishment (from 6% of those with fewer than five employees to 15% among those with more than 250 employees).
8%
9%
14%
15%
15%
18%
19%
19%
19%
21%
23%
25%
33%
19%
4%
18%
6%
3%
7%
7%
9%
11%
13%
11%
3%
8%
19%
9%
Construction
Primary & Utilities
Arts & Other Services
Public admin.
Financial Services
Wholesale & Retail
Transport & Storage
Business Services
Information & Comms
Manufacturing
Education
Health & Social Work
Hotels & Restaurants
UK
80%
68%
57%
45%
24%
10%
15%
10%
8%
8%
7%
6%
250+
100 to 249
50 to 99
25 to 49
5 to 24
2 to 4
Proportion of workforce who are EU nationalsProportion of establishments employing at least one EU national
Base: All establishments in Module 2 (43,437)Figures for the proportion of the workforce that are EU nationals is based on those that were
able to provide a figure for the number of EU nationals they employ (42,042)
21%
10%
21%
15%
10%
7%
6%
4%
X% Proportion of workforce
who are EU nationals
Proportion of establishments employing EU
nationals
Produced by IFF Research

33
3. Recruitment and skill-shortage vacancies Chapter summary One in five UK employers (20%) had at least one vacancy at the time of ESS 2017 fieldwork (summer 2017), and just over one million vacancies were reported, a 9% increase on the number in 2015. Levels of recruitment activity have increased compared to 2015 in England, Scotland and, most notably, Northern Ireland. In Wales recruitment activity was broadly unchanged.
In this report, vacancies that employers find hard-to-fill due to applicants lacking relevant skills, qualifications or experience are termed ‘skill-shortage vacancies’. Whilst the proportion of employers with skill-shortage vacancies was unchanged from 2015 at 6%, in volume terms the number of such vacancies has increased by 8%, from 209,000 to 226,000 (similar to the increase in overall vacancy numbers).
Skill-shortage vacancies accounted for 22% of all vacancies in the UK (in line with the 23% density reported in 2015). By nation, the density of skill-shortage vacancies has notably increased in Northern Ireland (up from 14% in 2015 to 21%) and Wales (up from 24% to 27%) but remained unchanged in England and Scotland.
Skill shortages were particularly prevalent in certain sectors. In Construction, over a third of all vacancies were reported to be hard to fill for skills-related reasons. The density of skill-shortage vacancies has increased since 2015 in Primary Sector and Utilities, Arts and Other Services, Education, and Public Administration.
Skilled Trades roles continue to have the highest density of skill-shortage vacancies (more than two in every five Skilled Trades vacancies were skill-shortage vacancies). Around a third of vacancies for both Professionals and Machine Operatives were hard-to-fill due to a lack of skills. The density of skill-shortage vacancies has increased since 2015 for Caring, Leisure and Other Services occupations, as well as Administrative and Clerical positions.
The skills lacking among applicants covered both technical and practical skills as well as people and personal skills. On the technical side, employers reported a lack of digital skills, skills related to operational aspects of the role, and a lack of complex analytical skills. The main people and personal skills found lacking predominantly related to self-management skills, management and leadership, and sales and customer handling skills.
Employers with skill-shortage vacancies reported a range of resulting impacts, including increased workloads for other staff, loss of business to competitors, and delays developing new products or services. Actions taken by employers to overcome skill-shortages primarily focussed on altering their recruitment methods, including increased recruitment spend.

34
Introduction Recruitment activity is an indicator of growth and change in the labour market and wider economy. For instance, the previous Employer Skills Survey in 2015 reported a substantial increase in recruitment activity across the UK compared to 2013, coinciding with 5% growth in gross domestic product (GDP) during this period.10
When employers have vacancies it can either be a positive indicator of growth, or present challenges if they are recruiting to replace the loss of key personnel or plug gaps in the workforce due to high levels of staff turnover. If employers are unable to recruit individuals with the skills, qualifications or experience they require, it is likely to impact on their ability to fulfil existing work and to grow. In the UK government’s ‘Industrial Strategy: Building a Britain fit for the future’ it is recognised that people, and the skills they have, are a key driver of productivity. In light of the UK’s weak productivity growth over the past decade11, insight into the challenges that employers report when accessing the labour market is a valuable step in identifying where the labour market is not supplying employers with the skills it needs.
ESS 2017 provides a detailed understanding of the level and nature of employer demand for new staff and the ability of the labour market to meet this demand. This sets the context for then exploring imbalances and mismatches in the labour market that result from a lack of skills. The key measures used in this chapter are as follows:
Following a brief analysis of vacancies, this chapter focusses on skill-shortage vacancies. The chapter examines the incidence, volume and profile of skill-shortage vacancies, the
10 ONS Quarterly National Accounts time series dataset (QNA), 2013 Q2 to 2015 Q2. 11 ONS Labour productivity statistical bulletin (January 2018).
Vacancies Hard-to-fill vacancies
Incidence
Density
Skills-shortage vacancies
The proportion of establishments
reporting at least one vacancy
Vacancies as a proportion of all
employment
The proportion of establishments
reporting at least one hard-to-fill vacancy
Hard-to-fill vacancies as a proportion of all
vacancies
The proportion of establishments
reporting at least one skill-shortage
vacancy
Skill-shortage vacancies as a proportion of all
vacancies

35
specific skills that employers have found to be lacking, the impact that skill-shortage vacancies have, and the actions taken to help overcome these impacts. It then closes with a brief discussion of the extent of wider recruitment challenges that employers face.
Vacancies One in five UK establishments (20%) had at least one current vacancy at the time of the survey;12 a one percentage point increase from 2015. In volume terms there were just over one million vacancies (1,007,000); equivalent to 3.5% of all employment. This represents a 9% increase on the 927,000 vacancies reported in 2015 (equivalent to 3.3% of total employment).13
As shown in Figure 3.1, the proportion of establishments with at least one vacancy was broadly unchanged since 2015 in England, Scotland and Wales. In Northern Ireland there was a three percentage point increase in the incidence of establishments with vacancies.
In volume terms, the largest proportional increase in number of vacancies was in Northern Ireland; from 19,700 in 2015 to 23,200 (an 18% increase). There was a 9% increase since 2015 in the number of vacancies in England (from 797,000 to 873,000)14, and a 3% increase in Scotland (from 73,600 to 75,400). In contrast, the number of vacancies in Wales was unchanged at 36,400.
12 May to October 2017. 13 This increase broadly aligns with the change in recruitment activity recorded by Vacancy Survey, which is owned by the Office for National Statistics (ONS). Using the same fieldwork periods as the ESS, the ONS statistics show an increase of 7% between 2015 and 2017. The overall vacancy time series for the ESS tracks the Vacancy Survey trend very closely. 14 An increase in the number of vacancies was evident in all England regions, with the exception of London (a 4% decrease) and North East (a 1% decrease).

36
Figure 3.1 Incidence and density of vacancies, by country
There was considerable variation in the extent and pattern of recruitment activity by size of establishment. Whilst the proportion of establishments reporting vacancies increased with size, the density of vacancies (i.e. vacancies as a proportion of employment) was larger among the smaller establishments.
By sector, the proportion of employers with vacancies ranged from 8% in Primary Sector and Utilities to 35% in Public Administration. It was only in the Public Administration sector where there was more than a two percentage point change in the proportion of establishments reporting vacancies between 2015 and 2017 (an increase from 31% to 35%).
The sectors with the highest density of vacancies were: Hotels and Restaurants (vacancies as a proportion of employment in this sector stood at 5.7%), Information and Communications (4.4%), Arts and Other Services (4.1%), and Business Services (3.9%). These sectors had the highest vacancy densities in 2015. The sector with the largest increase in vacancy density was Health and Social Work (from 3.2% in 2015 to 3.8% in 2017), indicating increased recruitment activity in this sector.
14% 15
%
19%
20%14
% 15%
20%
20%
10%
10%
13%
16%
14% 15
%
19%
20%
12%
14%
17%
17%
2.2%2.4%3.3% 3.5%
2.2%2.5%3.4% 3.6%
2.4%2.1%
2.7% 3.1%1.9%
2.4%3.1% 3.1%
1.9% 2.2%3.1% 3.0%
UK England N. Ireland Scotland Wales
Base: All establishments (2017: UK: 87,430; England: 71,527; NI: 3,973; Scotland: 6,017; Wales: 5,913)
2013 2015 % of establishments with vacancies2011 2017
Density (vacancies as a % of employment)
Produced by IFF Research

37
Tables A.3.1 in Appendix A provides a detailed breakdown of recruitment activity by country, size and sector.
The survey also identifies the occupational groups where vacancies exist.15 The density of vacancies by occupation were largely unchanged from 2015 and, as has been the case in all previous version of the ESS series, the occupation with the highest density of vacancies was Associate Professionals (at 7.4%).
Table A.3.2 in Appendix A provides a detailed breakdown of recruitment activity by occupation.
Skill-shortage vacancies When employers have vacancies, potential employees are either willing and able to meet employer requirements (the most common scenario16) or they are not. Where employers struggle to fill vacancies, this may be due to a lack of skills, qualifications or experience amongst applicants. Collectively these are known as ‘skill-shortage vacancies’, and are identified in the survey as follows:
During the survey, employers were first asked if their vacancies were proving hard to fill, then asked to give their reasons for not being able to fill vacancies spontaneously (i.e. without being presented with a list of possible reasons). Any employers not reporting skills-related issues were then prompted on whether any of their hard-to-fill vacancies were proving hard-to-fill due to a lack of skills, experience or qualifications among applicants. These spontaneous and prompted responses combine to give a total number of skill-shortage vacancies.
This identification strategy may fail sometimes. A hard-to-fill vacancy that receives no applicants would not be classed as a non-skill-related vacancy but could be the result of a skill shortage. This is particularly the case where the job description has high and clearly stated requirements. For instance, a role which requires a PhD in Computer Science may receive no applicants if there are no available workers with this qualification in the area. Equally, a reported skill-shortage vacancy – i.e. one which attracts applicants but none with the right skills – may be caused by relative unattractiveness of the role to a pool of potential applicants who do possess the right skills. Aspects of the role which influence would-be applicants, such as pay or working conditions, may not be recognised by the employer and therefore may not be represented in this survey.
15 See Appendix D for definitions and example types of job roles included under the occupational groupings. 16 A third of vacancies across the UK were considered hard-to-fill (33%).

38
However, given these are latent factors that cannot be measured directly through employer reports, the ‘skill-shortage vacancy’ terminology is a reasonable proxy. Additionally, it is likely that ‘skill-shortage vacancies’ (identified through the process outlined above) are more closely linked to skill supply issues than vacancies reported to be hard-to-fill for other reasons.
The rest of this section explores these skill-shortage vacancies in more detail.
Prevalence of skill-shortage vacancies
The incidence of establishments with skill-shortage vacancies was unchanged from 2015 at 6%. In volume terms, however, there has been an 8% increase in the number of skill-shortage vacancies since 2015: from 209,000 to 226,000.
The increase in the number of skill-shortage vacancies was in line with the increase in vacancies, hence the density of skill-shortage vacancies (i.e. the proportion of vacancies where skill shortages were reported), at 22% was in line with the 2015 figure (23%). This is perhaps surprising given tightening in the labour market,17 which historically is known to contribute to the density of skill-shortage vacancies (Hogarth and Wilson, 2001).
As shown in Figure 3.2, the prevalence of skill-shortage vacancies in England, Scotland and Wales is similar to 2015 (though in Wales there has been an increase in the density of skill-shortage vacancies, from 24% to 27%).
The picture in Northern Ireland has changed more substantially. The proportion of establishments in Northern Ireland with skill-shortage vacancies has increased from 3% to 5% and the density of skill-shortage vacancies has increased to 21%, a return to the level reported in 2011. It had previously been the case that employers in Northern Ireland found vacancies ‘easier to fill’ than the rest of the UK.18 However, in 2017 the proportion of vacancies in Northern Ireland reported as being hard to fill (31%) was only slightly lower than the UK average of 33%.
17 Less freely available labour – i.e. continued falls to unemployment (ONS UK Labour Market: January 2018) and signs of reducing net migration (ONS Migration Statistics Quarterly Report: November 2017) 18 In 2015, 21% of all vacancies in Northern Ireland were reported as being hard-to-fill compared with the UK average of 33%.

39
Figure 3.2 Incidence and density of skill-shortage vacancies (SSVs), by country
In the UK government’s ‘Industrial Strategy: Building a Britain fit for the future’, it is acknowledged that meaningful partnership between local government and local enterprise is necessary to link skills provision with economic need. A key solution to building these partnerships is the introduction of Skills Advisory Panels, who will assess current and future supply and demand of skills to form a clear understanding of skills requirements in the local area.
ESS 2017 allows analysis of skills issues in the labour market at a local level. Figure 3.3 shows the Local Education Authorities (LEAs) in England with the highest and lowest proportions of vacancies that are hard to fill due to a shortage of skills.
For example, although the Yorkshire and the Humber region as a whole had a lower-than-average density of skill-shortage vacancies (19% compared with 22% UK-wide), a large variation can be seen at a local level between the nearby urban centres of Leeds (4.7%) and Bradford (31.5%). Detailed local level data is published alongside this report on the gov.uk website.
3%
4%
6%
6%
3%
4%
6%
6%
2% 3% 3%
5%
3%
4%
6%
6%
3%
4%
6%
6%
16%
22%23%
22%
15%
22%23%
22%
21%
18%
14%
21%
15%
25%24%
24%
18%
20%
24%
27%
UK England N. Ireland Scotland Wales
Base: All establishments (2017: UK: 87,430; England: 71,527; NI: 3,973; Scotland: 6,017; Wales: 5,913)
2013 2015 % of establishments with skill-shortage vacancies (SSVs)2011 2017
Density (SSVs as a % of vacancies)
Produced by IFF Research

40
Figure 3.3 Local Education Authorities in England with the highest and lowest densities of skill-shortage vacancies19
Returning to UK-wide analysis, the density of skill-shortage vacancies was greater among small establishments than large establishments. Almost a third of vacancies (31%) in establishments with fewer than five employees were proving hard-to-fill due to difficulties in finding applicants with appropriate skills, qualifications or experience. This compares with fewer than a fifth (16%) among establishments with 250 or more employees. That is to say that a vacancy was almost twice as likely to be hard to fill
19 Regional data sets for England, Northern Ireland, Scotland and Wales is available on the gov.uk website. (Note that LEAs with a base size of fewer than 100 establishments with vacancies have been excluded from Figure 3.2)

41
because of reported skill shortages in the smallest establishments compared to the largest.
As shown in Figure 3.4, the experience of skill-shortage vacancies varied by sector. Reflecting the relative size of the sector, skill-shortage vacancies were most numerous in the Business Services sector. However, as a proportion of all vacancies in the sector, the density of skill-shortage vacancies was highest in Construction where almost two in every five vacancies were proving hard to fill due to difficulties in finding applicants with appropriate skills, qualifications or experience.
Figure 3.4 Number and density of skill-shortage vacancies (SSVs), by sector
The sectoral pattern of skill-shortage vacancies was broadly unchanged from 2015 (i.e. the hierarchy of sectors in Figure 3.4, which is ranked from high to low density, is similar to 2015). There were, however, some notable changes in the density of skill-shortage vacancies within sectors, with this having increased in:
• Primary Sector and Utilities (from 26% to 33%)
• Arts and Other Services (from 21% to 25%)
• Education (from 16% to 22%)
22%
19%
10%
18%
12%
22%
28%
24%
27%
30%
25%
24%
23%
9%
19%
21%
20%
16%
21%
26%
21%
26%
30%
37%
26%
35%
14%
17%
18%
18%
22%
22%
24%
25%
25%
29%
29%
33%
36%
Public Administration
Hotels & Restaurants
Financial Services
Wholesale & Retail
Education
Health & Social Work
Business Services
Arts & Other Services
Information & Comms
Manufacturing
Transport & Storage
Primary Sector & Utilities
Construction
2017 SSV density2015 SSV density2013 SSV density
Base: All establishments with vacancies (see Table A.3.4 in Appendix A for base sizes)
Number of SSVs (2017)
14,000
6,000
11,000
17,000
11,000
14,000
52,000
32,000
11,000
26,000
6,000
21,000
6,000
Produced by IFF Research

42
• Public Administration (9% to 14%).20
The sector with the most noticeable decrease in skill-shortage vacancy density was Transport and Storage (from 37% to 29%). This was driven by a decreased density of skill-shortage vacancies among Transport and Storage employers with fewer than five employees (from 61% in 2015 to 32% in 2017).
Tables A.3.3 and A.3.4 in Appendix A provide a detailed breakdown of skill-shortage vacancies by country, size of establishment and sector.
By occupation, employers were most likely to have experienced skills-related difficulties when recruiting for Skilled Trades positions. Around two in every five vacancies for such roles were proving hard to fill for skills related reasons (a skill-shortage vacancy density of 42%). This occupation has had the highest density of skill-shortage vacancies in all previous iterations of the ESS series. The specific job roles that account for the largest proportion of all Skilled Trades skill-shortage vacancies include:
• Chefs (17% of all skill-shortage vacancies for Skilled Trades)
• Vehicle technicians, mechanics and electricians (13%)
• Metal working production and maintenance fitters (13%)
• Metal machining setters and setter-operators (5%)
• Electricians and electrical fitters (5%).
As illustrated in Figure 3.5, density of skill-shortage vacancies by occupation was broadly the same as 2015, with the greatest challenges faced recruiting Professionals and Machine Operatives (alongside Skilled Trades).
20 Whilst the data for Public Administration sector are based on a robust number of establishments with vacancies, it should be noted that the number of establishments with skill-shortage vacancies is relatively small (73). When base sizes are relatively small the volumetric (and density) measures are particularly volatile to being influenced by a few establishments with a large number of vacancies/skill-shortage vacancies. Caution should therefore be taken when interpreting these data.

43
Figure 3.5 Density and number of skill-shortage vacancies (SSVs), by occupation
Density of skill-shortage vacancies by occupation within sector
The previous section looked at the density of skill-shortage vacancies by sector and occupation separately. Exploring the density of skill-shortage vacancies by occupations within sectors provides a more detailed picture of where employers struggle to recruit the skills they need.
Though care should be taken to not over-extrapolate because of the relatively small base sizes in places, Table 3.1 details the skill-shortage vacancy density by occupation within sector.
There were several pockets of occupations within sectors where the density of skill-shortage vacancies was particularly high relative to the average (i.e. those where the density was 30-39% and, in particular, those where the density was ≥40%).
17%
32%
22%
11%
43%
20% 16%
32%
19%
30%23%
15%
42%
24%
15%
31%
14%
0%
5%
10%
15%
20%
25%
30%
35%
40%
45%
Man
ager
s
Prof
essi
onal
s
Asso
ciat
e Pr
ofs.
Adm
in /
cler
ical
Skille
d tra
des
Car
ing
/ lei
sure
serv
ices Sa
les
Mac
hine
Ope
rativ
es
Elem
enta
ry
SSVs
as %
of a
ll va
canc
ies
in e
ach
occu
patio
n
2013 2015 2017 Avg. density (2017)
Base: All establishments with vacancies in each type of occupation (see Table A.3.2 in Appendix A for base sizes)
6,000 39,000 34,000 12,000 42,000 30,000 19,000 20,000 21,000No. of SSVs
Produced by IFF Research

44
Many of these pockets of skill shortages have proved to be persistent over time. The much higher than average density of skill-shortage vacancies for Skilled Trades has been evident in a number of sectors across the ESS series.21
Skill-shortage vacancies have also been persistently high for Machine Operatives in Construction, Primary Sector and Utilities, and the Transport and Storage sector, and for Professional occupations in Manufacturing, Construction, Information and Communications, Business Services, and Health and Social Work.
21 A similar picture was reported in 1999 (Employers Skill Survey 1999: Statistical Report) and has been evident in subsequent Employer Skills Surveys.

45
Table 3.1 Density of skill-shortage vacancies by occupation within sector
UK
Skille
d tra
des
occu
patio
ns
Mac
hine
ope
rativ
es
Prof
essi
onal
s
Car
ing,
leis
ure
and
othe
r ser
vice
s
Asso
ciat
e pr
ofes
sion
als
Man
ager
s
Adm
inis
trativ
e/ c
leric
al s
taff
Sale
s an
d cu
stom
er s
ervi
ces
staf
f
Elem
enta
ry s
taff
Those where density was 40% and over
Those where density was 30% and over (but less than 40%)
Those where density was 22% and over
Those where density was less than 22%
UK 22 42 31 30 24 23 19 15 15 14
Construction 36 44 34 41 ** 26 24 17 22 33
Primary Sector & Utilities 33 39 47 36 33 32 23 13 ** 32
Transport & Storage 29 55 38 17 ** 13 14 13 24 13
Manufacturing 29 40 25 38 ** 24 21 19 31 14
Arts & Other Services 25 34 ** 25 35 21 14 8 20 26
Information & Communications 25 29 ** 42 ** 26 30 16 10 8
Business Services 24 52 45 30 15 25 27 23 16 12
Education 22 30 ** 25 28 18 10 8 ** 11
Health & social work 22 14 4 33 22 15 12 7 38 11
Wholesale & Retail 18 47 19 23 ** 25 19 13 13 14
Financial Services 18 ** ** 3 ** 35 2 10 32 **
Hotels & Restaurants 17 39 9 ** 24 20 22 12 19 12
Public admin. 14 28 ** 22 2 14 18 6 ** **
Base: establishments with vacancies within each occupation, by sector (see Table A.3.5a in Appendix A). ** denotes a figure not shown because of a low base size (fewer than 30 establishments with vacancies). Figures in italics denotes a base size between 30 and 49 establishments with vacancies. See Table A.3.5 in Appendix A for the number of skill-shortage vacancies by occupation within sector. Appendix D provides additional detail on the types of job roles by sector groupings.

46
There were several emerging pockets of skill-shortage vacancies, including:
• Associate Professionals in Primary Sector and Utilities (including job roles such as ‘Inspectors of standards and regulations’ and ‘Business sales executives’).
• Skilled Trades in Primary Sector and Utilities (‘Farmers’ and ‘Agricultural and fishing trades’), and Education (‘Chefs’ and ‘Cooks’ in education settings).
• Caring, Leisure and Other Services occupations in the Arts and Other Services sector (including ‘Hairdressers and barbers’ and ‘Beauticians’).
• Sales and Customer Services occupations in Financial Services, Manufacturing, and Health and Social Work sector.
• Machine Operatives in Primary Sector and Utilities (‘Scaffolders, stagers and riggers’ and ‘Agricultural machinery drivers’).
• Elementary staff in Primary Sector and Utilities (such as ‘Farm workers’).
There are a small number of occupations within sectors where the density of skill-shortage vacancies has fallen compared to 2015, most notably: Associate Professionals within Wholesale and Retail (from 32% to 25%) and Construction (from 37% to 26%), and Sales and Customer Services within Information and Communications (from 47% to 10%).
Skills lacking in the available labour market
The Employer Skills Survey provides insight into the particular skills that employers have found to be lacking among applicants.
Employers with skill-shortage vacancies were read a list of skills and asked, for each occupation in which they reported skill-shortage vacancies22, which skills were lacking. The specific skills that employers perceive to be lacking among applicants can be broadly grouped into two categories:
• Technical and practical skills – these are the specific skills required to perform the specific functions of a job role.
• People and personal skills – these are the ‘softer’, less tangible skills required to manage oneself and interact with others in the workplace.
22 Up to a maximum of two occupations chosen at random.

47
The skills lacking across these two categories of skills are shown in Figure 3.6. The data in this figure are based on the total number of skill-shortage vacancies, as opposed to establishments with skill-shortage vacancies.23
Technical and practical skills
Considering first technical and practical skills, the most prevalent reported skill shortage was a lack of specialist skills or knowledge needed to perform the role. This was mentioned as being, at least in part, the cause of almost two-thirds of skill-shortage vacancies (65%), a slight increase from 2015.
Among the other technical and practical skills lacking, it is possible to group some of the skills. For instance, a lack of ‘complex analytical skills’ were cited as a cause of just under half (49%) of all skill-shortage vacancies. Within this grouping, the most prevalent was a lack of complex problem solving skills (41%). The proportion of skill-shortage vacancies attributed to a lack of complex numerical/statistical skills has decreased since 2015, from 29% to 27%. A lack of complex analytical skills was most prevalent among Business Services (57% of all skill-shortage vacancies in the sector), Construction (54%) and Information and Communication (53%).
Almost half (45%) of all skill-shortage vacancies were attributed, at least in part, to a lack of ‘operational skills’ including knowledge of products and services offered and/or knowledge of how the organisation works. Shortages of operational skills were most prevalent among employers in Wholesale and Retail (56% of all skill-shortage vacancies in the sector) and Hotels and Restaurants (54%).
A third (33%) of all skill-shortage vacancies were attributed, at least in part, to a lack of ‘digital skills’. This includes both basic computer literacy (23%) and/or more advanced or specialist IT skills (21%). A lack of digital skills was most acute for the Information and Communications sector (60% of all skill-shortage vacancies in the sector).
Among employers in Wales, 17% of all skill-shortage vacancies were attributed at least in part to a lack of written Welsh language skills (up from 12% in 2015) and 16% to a lack of oral Welsh language skills (up from 13% in 2015).
People and personal skills
People and personal skills can be less tangible than technical and practical skills, but they can have a big impact on the ability of a potential employee to adapt to the workplace and be an effective member of staff.
23 Employers could cite more than one skill lacking among applicants for each of their skill-shortage vacancies, thus the percentages sum to greater than 100%.

48
As was the case in 2015, the most common skill of this type lacking in the labour market was the ability to manage ones’ own time and task prioritisation (51% of all skill-shortage vacancies were attributed to this). Combining this with the ability to manage one’s own feelings and handle the feelings of others − which was cited as a skill lacking for 37% of all skill-shortage vacancies – around six in ten skill-shortage vacancies (59%) were at least partly caused by a lack of ‘self-management skills’. A lack of self-management skills was particularly prevalent for employers in the following sectors: Hotels and Restaurants (75% of all skill-shortage vacancies in the sector), Arts and Other Services (67%), and Financial Services (61%).
Skills related to ‘management and leadership’ were commonly reported to be lacking, including: managing or motivating other staff (35%), persuading and influencing others (33%), and setting objectives and/or planning resources (25%). A lack of management and leadership skills were most prevalent for employers in Hotels and Restaurants (62%) and Financial Services (61%).
Another grouping of skills that were commonly lacking were ‘sales and customer skills’, cited as a cause for 45% of all skill-shortage vacancies. This grouping includes customer handling skills (39%) and sales skills (27%). A lack of sales and customer skills were particularly prevalent in Financial Services (71%), Arts and Other Services (58%) and Wholesale and Retail (54%).

49
Figure 3.6 Skills lacking among applicants to establishments with skill-shortage vacancies (prompted)
15%
15%
20%
25%
24%
26%
22%
22%
29%
39%
31%
37%
64%
16%
17%
22%
28%
30%
33%
23%
21%
27%
41%
32%
38%
65%
2017
2015
Produced by IFF Research
Technical and practical skills
Specialist skills or knowledge
Knowledge of products and services offered
Knowledge of how the organisation works
Solving complex problems
Complex numerical/statistical skills
Advanced or specialist IT skills
Computer literacy / basic IT skills
Reading/understanding instructions, reports etc.
Basic numerical skills
Writing instructions, reports etc.
Adapting to new equipment or materials
Manual dexterity
Communicating in a foreign language
45% Operational
skills
49% Complex Analytical
skills
33% Digitalskills
16%
22%
33%
25%
39%
22%
31%
30%
32%
47%
17%
26%
37%
27%
39%
25%
33%
35%
37%
51%
2017
2015
Base: All establishments with SSVs – up to two occupations followed up (7,229)
People and personal skills
Managing own time and task prioritisation
Managing own feelings / handling those of others
Managing or motivating other staff
Persuading or influencing others
Setting objectives for others / planning resources
Customer handling skills
Sales skills
Team working
Instructing, teaching or training people
Making speeches or presentations
59% Self-
Management skills
50% Management
and Leadership
45% Sales and Customer
skills

50
The types of skills lacking by occupation
As discussed earlier in this chapter, there were particular occupations in which there was a notable challenge for employers to recruit sufficiently skilled labour, namely: Skilled Trades, Machine Operatives, Professionals, and Caring, Leisure and Other Services. The broad skills characteristics lacking among applicants for these occupations, relative to the average across all occupations, is illustrated in Figure 3.7.
For Skilled Trades, the types of skills lacking – when looking at the broad groupings of skills – broadly followed a similar pattern to the overall average, though there was less emphasis on digital skills and sales and customer skills. Outside of the skills shown in Figure 3.7, the skills disproportionately reported to be lacking among applicants for Skilled Trades positions included manual dexterity (34% compared with 17% overall), and the ability to adapt to new equipment or materials (30% compared with 22% overall).
Figure 3.7 Types of skills lacking across occupations with the highest density of skill-shortage vacancies (SSVs)
As shown in Figure 3.7, Machine Operative applicants were less likely to lack skills in all six of the broad skill categorisations. Looking at more specific skills, there was a
ComplexAnalytical
Operational
Digital
Managementand
Leadership
Sales andCustomer
Self-Management
Complexanalytical
Operational
Digital
Managementand
Leadership
Sales andCustomer
Self-Management
ComplexAnalytical
Operational
Digital
Managementand
Leadership
Sales andCustomer
Self-Management
ComplexAnalytical
Operational
Digital
Managementand
Leadership
Sales andCustomer
Self-Management
Carin
g, L
eisu
re a
nd O
ther
Ser
vice
s
Prof
essi
onal
sSk
illed
Tra
des
Mac
hine
Ope
rativ
es
Base: All establishments with SSVs for the given occupations – up to two occupations followed up (All: 7,229, Skilled Trades: 1,627, Machine Operatives: 614, Professionals: 1,391, Caring, Leisure and Other Services: 984)
All occupations
SSVdensity
24%
SSVdensity
42%
SSVdensity
31%
SSVdensity
30%All occupations
All occupations
Produced by IFF Research
All occupations

51
disproportionate lack of basic numerical skills among applicants for Machine Operatives (40% compared with 30% overall).
For Professionals, Figure 3.7 shows that relative to the overall average, there was a disproportionate lack of digital skills (42% compared with 33% overall). More specifically it was the advanced or specialist IT skills which were disproportionately lacking (36% compared with 21% overall).
For Caring, Leisure and Other Services there was a disproportionate lack of self-management skills among applicants (63% compared with 50% overall). Within this category it was the managing of one’s own feelings and handling those of others which was most lacking compared to the average across all occupations (46% compared with 37%).
Tables A.3.6 to A.3.10 in Appendix A provide a full breakdown of the skills lacking in the available labour market, by country, occupation and sector.
The impact of skill-shortage vacancies Although skill-shortage vacancies are reported by a minority of employers (6%), for those that have them the impact can be significant.
Figure 3.8 shows the impacts reported by employers who had difficulty filling their vacancies because of skill shortages.24 Most commonly the impact is felt on others in the workforce through increased workloads (85%).
Other impacts include those which would have a direct financial impact on the establishment, such as a loss of business or orders to competitors and increased operating costs (each 43%). A loss of business to competitors was more commonly reported by smaller establishments, whereas increased operating costs were more common among larger establishments.
Other more medium-term impacts include delays to the development of new products or services (40%) and delays to introducing new working practices (35%).
24 The survey did not measure the impact of skill-shortage vacancies on employers specifically (i.e. it did not ask employers with skill-shortage vacancies what the impacts of these were on the establishment, only the impact of hard-to-fill vacancies as a whole). However, it was possible to isolate the effect of skill deficiencies by exploring the impact of hard-to-fill vacancies in establishments where all the hard-to-fill vacancies were caused, at least in part, by skills-related issues. Given the majority of establishments with hard-to-fill vacancies fell into this group (75%) – in part reflecting that the majority had just a single vacancy that was proving hard-to-fill ‒ this was a suitable sample from which it was possible to gain a robust measurement.

52
The impacts of skill-shortage vacancies, and the relative prevalence of each impact, has changed very little over the course of the ESS series. Tables A.3.11a and A.3.11b in Appendix A provide a breakdown of the impacts by nation, size of establishment and sector.
Figure 3.8 Impact of skill-shortage vacancies (prompted)
Wider recruitment challenges The previous sections of this chapter have focussed on vacancies which are hard-to-fill for skills related reasons.25 Employers may also face other recruitment challenges for reasons unrelated to the skills, qualifications and experience of applicants; such as the nature of the advertised role being unappealing. These ‘other’ causes for hard-to-fill vacancies are shown in Figure 3.9.
25 As a reminder, these types of vacancies – termed skill-shortage vacancies − account for 22% of all vacancies in the UK and 67% of all hard-to-fill vacancies.
5%
23%
25%
31%
34%
35%
40%
43%
43%
48%
85%
None
Difficulties introducing technological change
Withdraw from offering certain products / services
Outsource work
Have difficulties meeting quality standards
Have difficulties introducing new working practices
Delay developing new products or services
Experience increased operating costs
Loss of business or orders to competitors
Difficulties meeting customer services objectives
Increased workload for other staff
Base: All establishments where all hard-to-fill vacancies are caused by skills related issues (6,670)Produced by IFF Research

53
Figure 3.9 Main non-skills-related causes of having hard-to-fill vacancies (unprompted)
Overall there were 110,000 vacancies that were reported to be hard-to-fill exclusively for reasons unrelated to applicants’ skills (11% of all vacancies). This represents an 18% increase on the number of non-skills-related hard-to-fill vacancies reported in 2015 (when 10% of all vacancies were caused by reasons unrelated to skills), and, looking further back, around two-and-a-half times the number of such vacancies reported in 2013 (43,000; 7% of all vacancies in 2013).
This means that although these types of vacancies represent a minority of all hard-to-fill vacancies, their rate of growth over time has been greater than that of skill-shortage vacancies26 and suggests that vacancies which are proving hard to fill for the reasons listed in Figure 3.9 present a growing challenge to employers. As outlined earlier in this
26 The rate of increase in the number non-skills-related hard-to-fill vacancies is greater than the rate of increase in the number of skill-shortage vacancies – the latter increased by 55% between 2013 and 2017.
9%
11%
10%
13%
13%
20%
18%
10%
11%
13%
16%
16%
24%
26%
Job entails shift work / unsociable hours
Remote location / poor transport links
Too much competition from other employers
Low number of applicants with the required attitude,motivation or personality
Poor terms and conditions offered
Not enough people interested in the type of job
Low number of applicants generally
2017
2015
Base: All establishments with hard-to-fill vacancies (2017: 26,125, 2015: 23,359)Produced by IFF Research
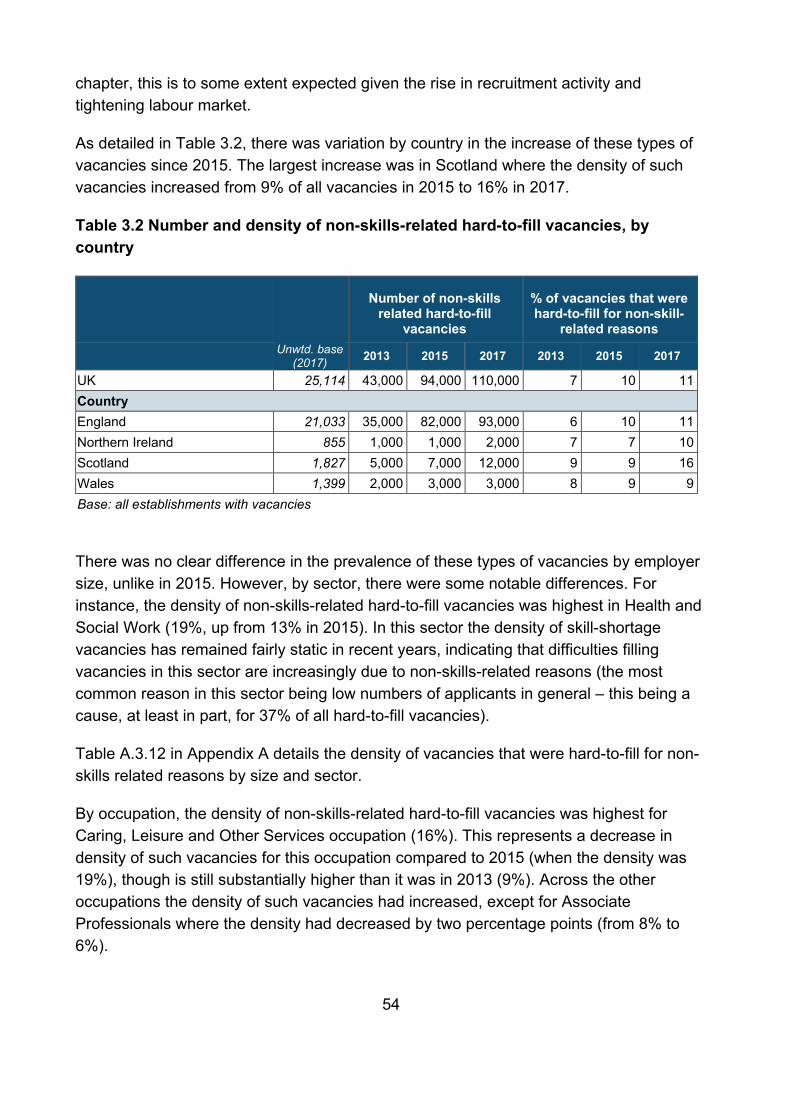
54
chapter, this is to some extent expected given the rise in recruitment activity and tightening labour market.
As detailed in Table 3.2, there was variation by country in the increase of these types of vacancies since 2015. The largest increase was in Scotland where the density of such vacancies increased from 9% of all vacancies in 2015 to 16% in 2017.
Table 3.2 Number and density of non-skills-related hard-to-fill vacancies, by country
There was no clear difference in the prevalence of these types of vacancies by employer size, unlike in 2015. However, by sector, there were some notable differences. For instance, the density of non-skills-related hard-to-fill vacancies was highest in Health and Social Work (19%, up from 13% in 2015). In this sector the density of skill-shortage vacancies has remained fairly static in recent years, indicating that difficulties filling vacancies in this sector are increasingly due to non-skills-related reasons (the most common reason in this sector being low numbers of applicants in general – this being a cause, at least in part, for 37% of all hard-to-fill vacancies).
Table A.3.12 in Appendix A details the density of vacancies that were hard-to-fill for non-skills related reasons by size and sector.
By occupation, the density of non-skills-related hard-to-fill vacancies was highest for Caring, Leisure and Other Services occupation (16%). This represents a decrease in density of such vacancies for this occupation compared to 2015 (when the density was 19%), though is still substantially higher than it was in 2013 (9%). Across the other occupations the density of such vacancies had increased, except for Associate Professionals where the density had decreased by two percentage points (from 8% to 6%).
Number of non-skills
related hard-to-fill vacancies
% of vacancies that were hard-to-fill for non-skill-
related reasons
Unwtd. base (2017) 2013 2015 2017 2013 2015 2017
UK 25,114 43,000 94,000 110,000 7 10 11 Country England 21,033 35,000 82,000 93,000 6 10 11 Northern Ireland 855 1,000 1,000 2,000 7 7 10 Scotland 1,827 5,000 7,000 12,000 9 9 16 Wales 1,399 2,000 3,000 3,000 8 9 9 Base: all establishments with vacancies

55
As illustrated in Figure 3.9 there has been a notable increase in the proportion of vacancies which were hard-to-fill, at least in part, due to low numbers of applicants. This increase has largely been driven by a reported lack of applicants for Professionals and Associate Professionals. In 2017, 39% of all hard-to-fill vacancies for Professionals were at least partially caused by low numbers of applicants (up from 22% in 2015), and 23% of all hard-to-fill vacancies for Associate Professionals were at least partially caused by low numbers of applicants (up from 11% in 2015).
Employer response to hard-to-fill vacancies The vast majority (87%) of establishments that had difficulty filling vacancies had taken action to help overcome these difficulties (compared with 85% in 2015).
As shown in Figure 3.10, the most common actions taken related to altering recruitment methods, either through increased recruitment spend or using new recruitment methods (60% had taken either or both of these actions). Taking recruitment-related action was least common among the very smallest establishments with fewer than five employees (54%, compared with 69% among the largest establishments with 250+ employees). By sector, recruitment-related actions in response to hard-to-fill vacancies were most common among employers in the Public Administration sector (75%), Education (72%), and Health and Social Work (69%). These actions were least common among employers in Construction (52%), Primary Sector and Utilities (53%), and Transport and Storage (53%).

56
Figure 3.10 Actions taken by employers to overcome hard-to-fill vacancies (unprompted)
Redefining existing jobs was the third most common action taken by employers who were having difficulty filling vacancies (14%). Unlike recruitment-related actions, redefining existing jobs was more commonly taken by smaller establishments than larger ones: 15% of employers with fewer than five employees compared with 11% among those with 250 or more employees.
Other actions where there were notable size or sector differences include:
• Expanding trainee programmes was more common among larger employers (16% among those with 250+ employees) than smaller ones (5% among those with fewer than five employees)
• Increasing salaries was also a more common action among larger employers than smaller ones (14% among those with 250+ employees compared with 7% among those with fewer than five employees)
2%
2%
3%
5%
8%
10%
8%
6%
12%
32%
39%
2%
2%
5%
8%
8%
8%
9%
10%
14%
33%
41%
Don't know
Make the job more enticing (recruitment incentivesand enhanced T&Cs etc.)
Recruit non-UK nationals
Increase salaries
Contracting out work
Expand trainee programmes
Increase training of existing staff
Prepared to offer training to less well qualifiedrecruits
Redefine existing jobs
Use new recruitment methods
Increased recruitment spend
2017
2015
Base: All establishments with hard-to-fill vacancies (2017: 9,885, 2015: 9,223)Produced by IFF Research
Any action taken
87% (85% in 2015)
No action taken
11% (13% in 2015)

57
• Bringing in contractors was more common in certain sectors, including Public Administration (16%), Information and Communications (14%), Business Services (12%), and Construction (11%).
Eleven per cent of employers that had hard-to-fill vacancies reported that they had not taken any action in response to facing these recruitment challenges. Not taking action was much more common among small establishments than larger ones (16% of employers with fewer than five employees had not taken any action, compared with only 3% among those with 250+ employees).
There was also variation by sector in the proportion of employers that had not taken action in response to skill-shortage vacancies, with it being most prevalent in Transport and Storage (17%), followed by Wholesale and Retail (16%), Construction (16%), and Primary Sector and Utilities (15%).
Tables A.3.13a and A.3.13b in Appendix A provide a full breakdown on actions taken in response to hard-to-fill vacancies by country, size and sector.
Recruitment of EU nationals to overcome hard-to-fill vacancies
As shown in Figure 3.11, relatively few employers with hard-to-fill vacancies spontaneously reported that they had attempted to recruit non-UK nationals to help overcome their recruitment difficulties. When prompted, however, almost two-fifths (38%) indicated they had sought to recruit non-UK nationals to fill their hard-to-fill vacancies.
For the first time in the ESS series, those who had recruited, or tried to recruit, non-UK nationals to fill hard-to-fill vacancies were asked whether these were from a member state of the European Union, excluding the UK (referred to as ‘EU nationals’ in this report), non-EU nationals or both.27
As shown in Figure 3.11, the vast majority of those seeking to recruit non-UK nationals had been looking to recruit EU nationals (90%, equivalent to 34% of all employers with hard-to-fill vacancies), with this almost evenly split between those that had been looking to recruit EU nationals (46%) and those that had attempted to recruit both EU and non-EU nationals (44%). Few of those seeking to recruit from outside the UK to fill their hard-to-fill vacancies had only been looking for those from outside the EU (6%).
27 The question asked was: ‘When you have recruited, or tried to recruit, workers who are non-UK nationals, were these EU nationals, non-EU nationals, or both?’ The question does not therefore distinguish between recruitment of EU or non-EU nationals that were already living in the UK and those that were not.

58
Figure 3.11 Recruitment of non-UK nationals to overcome hard-to-fill vacancies
Recruitment of EU nationals was a particularly common way of trying to fill hard-to-fill vacancies in the Hotels and Restaurants sector (53%, see Figure 3.12), though it was also above average in Manufacturing, Transport and Storage, Health and Social Work and Information and Communications (in the 38% to 41% range). It was also a common response among employers in London (50%) and employers with more than 25 staff (43%); particularly those with 250 or more employees (47%).
61%Have not recruited or tried to recruit
non-UK nationals to fill hard-to-fill
vacancies
Base for pie: All establishments with hard-to-fill vacancies (9,885)Base for column: All that had recruited or tried to recruit non-UK nationals in response to having
hard-to-fill vacancies (3,989)
38%have
6%
44%
46%EU nationalsonly
Both
Non-EUnationals only
Don't Know
90%of those who tried to recruit non-UK nationals to fill hard-to-fill vacancies looked to recruit EU nationals
Tried to recruit:
Produced by IFF Research

59
Figure 3.12 Proportion of employers with hard-to-fill vacancies trying to fill these by recruiting EU nationals, by nation, sector and size
Chapter conclusions The 2017 Employer Skills Survey provides evidence of high levels of recruitment activity among employers, indicative of a growing economy.
As might be expected, given lower unemployment rates and indications of lower net migration, there are challenges for some employers in filling their vacancies. In line with previous years, a third of all vacancies were reported to be proving hard to fill. Applicants lacking the skills, qualifications or experience required by employers were at least a partial cause for most hard-to-fill vacancies. These so called ‘skill-shortage vacancies’ account for just over one-fifth of all vacancies in the UK and, perhaps contrary to expectations in the context of a tightening labour market, this was consistent with the level reported in 2013 and 2015.
Skill-shortage vacancies have proved to be stubbornly persistent in certain sectors. The Construction sector reported the most acute difficulties in recruiting suitably skilled
Base: All establishments with hard-to-fill vacancies (9,885 overall; see Table A.3.12a-b for base sizes by nation, sector and size)
11%
21%
22%
23%
25%
27%
28%
34%
38%
38%
40%
41%
53%
34%
Financial Services
Public Admin.
Construction
Arts & Other Services
Education
Wholesale & Retail
Primary & Utilities
Business Services
Information & Comms
Health & Social Work
Transport & Storage
Manufacturing
Hotels & Restaurants
UK
47%
42%
44%
41%
33%
29%
250+
100 to 249
50 to 99
25 to 49
5 to 24
2 to 4
34%
29%
36%
39%
Produced by IFF Research

60
labour. Recruitment methods and wider efforts at attracting education leavers may partially explain employer experiences of skill-shortage vacancies. For instance, in the Employer Perspectives Survey 2016, it was reported that reliance on recruitment via word-of-mouth is particularly prevalent within Construction. The same survey also found that relatively few Construction employers conducted work inspiration activities with educational establishments. These may play a part in contributing to this sector’s apparent difficulties in recruiting suitably skilled labour (Shury et al., 2017).
Skill-shortage vacancies have also proven a persistent challenge for certain occupations. In particular, Skilled Trades again had the highest density of skill-shortage vacancies. Recent policy focus, including reforms to technical education in England − alongside the drive in recent years across the UK nations to place apprenticeships at the heart of skills policy – are designed to raise the levels of technical skills available in the economy. These policy initiatives should help to address the reported lack of skills in the labour market for occupations such as Skilled Trades.
Having considered the external skills challenges that employers report when recruiting, the next chapter considers the skills challenges that employers face within their existing workforce.

61
4. The Internal Skills Challenge
Chapter Summary Although the majority of establishments (87%) reported that all of their staff were fully proficient at their jobs, one in seven employers (13%) had at least one member of staff who was not fully proficient – referred to in this chapter as having a skills gap.
The proportion of the workforce perceived to be lacking proficiency has continued to fall across the UK, from 5.5% in 2011 to 4.4% in 2017. However, this UK-wide decrease in skills gap density has largely been driven by changes in England; the proportion of the workforce judged to be not fully proficient has remained static in Scotland and Wales since 2015 and has increased in Northern Ireland.
As in 2015, the highest density of skills gaps was seen in the Hotels and Restaurants and Manufacturing sectors. At an occupational level, Sales and Customer Service staff were most likely to lack full proficiency at their job (7%), especially those working at large establishments with more than 100 employees.
Transient factors, such as being new to the role or training only being partially complete, were a contributing factor to a majority of skills gaps (76%). However, only around a fifth (22%) of all skills gaps could be entirely explained by transient factors. Most employers with skills gaps mentioned at least one additional cause, the most common being a lack of motivation among staff. Some causes of skills gaps represent a positive tendency for employers to invest in future growth, such as the introduction of new technology, new products and services, or new working practices. These ‘positive’ factors contributed to fewer skills gaps than in 2015.
Two-thirds of employers with skills gaps (66%) reported that the skills gap had an impact on the performance of their organisation and one in six (17%) reported a major impact. Small establishments were less likely to cite any impact, but more likely to cite a major impact.
The vast majority of establishments with skills gaps (85%) had taken action in response and a further 5% had plans to do so in the future. The most common response had been to increase training activity or spending. The Primary and Utilities sector was among the most likely to cite major impacts of skills gaps, but the least likely of all sectors to respond in any way (74%).
As in 2015, the most common skill lacking among staff was time-management and prioritisation of tasks, contributing to nearly three-fifths of all skills gaps (59%). Various management and leadership skills were also lacking in just over half of all skills gaps

62
(53%); these include: managing and motivating staff, persuading or influencing others, setting objectives and planning resources. Deficiencies in sales and customer skills (49%) and lack of knowledge of an organisation’s products, services and processes (49%) also contributed to around half of all skills gaps. Deficiencies in complex analytical skills (43%) and digital skills (35%) are less prevalent than in 2015.
Most employers (62%) reported a need for at least some of their staff to acquire new skills or knowledge in the next 12 months. This need for upskilling was more prevalent in Scotland, in the Public Administration sector, and among Managers. One in eight employers (13%) cited a need for upskilling specifically as a result of the UK’s decision to leave the European Union.
In addition to exploring the issues of skills gaps and the need for upskilling, ESS also looks into the skills imbalances arising from staff being under-utilised. One-third of employers (35%) had at least one member of staff with both qualifications and skills more advanced than required for their current job role, an increase from 30% of employers in 2015. UK-wide, 2.5 million workers are under-utilised, representing 9% of the UK workforce - approximately double the proportion with skills gaps. The proportion of staff identified as being under-utilised has increased since 2015 (7%) and is highest in the Hotels and Restaurants sector (16%) and among employers with 2 to 4 staff (20%).
Introduction Despite strong job-creation and historically low levels of unemployment28, the post-recession economic recovery in the UK has been characterised by below-average productivity, compared with other G7 economies.29
Since the UK’s decision to leave the European Union in June 2016, the importance of workplace skills as a driver of productivity growth has seen increased political interest,30 not only in terms of protecting investment in skills development through an uncertain economic climate, but also ensuring that UK businesses remain competitive in a changing global marketplace.
The previous chapter explored the difficulties that UK employers face when recruiting staff with the skills they need. While recruitment activity across the economy has
28 ONS Labour Market Bulletin, 2017 29 ONS International comparisons of UK productivity, first estimates: 2016 (October 2017) 30 Industrial Strategy: Building a Britain fit for the future

63
increased since 2015, the proportion of vacancies that are hard to fill as a result of skill-shortages remains largely unchanged.
A shortage of skills in the labour market can manifest itself not only through recruitment difficulties, but also through the related issue of skills gaps within the existing workforce. Rather than a vacancy remaining unfilled, a job may instead be performed by an employee who lacks full proficiency in that role. Some of these skills gaps may result from healthy innovation or be a natural and temporary condition after recruiting entry-level employees. However, some skill gaps may be the result of ineffective training and skill acquisition, or the result of consistently high levels of employee turnover. Particularly when persistent, a skills gap can hinder an establishment’s ability to function effectively and harm its productivity and profitability.
It is worth bearing in mind that the survey only captures what employers are aware of and report. Arguably, employers that pay little attention to their employees’ skills and the needs of their organisation may be less likely to report skill gaps. Others31 have termed these ‘latent skill gaps’.
The chapter covers the incidence, volume, profile and causes of reported skills gaps, both at an overall UK and sector level, and by occupation. It then considers the specific skills that establishments reported their staff to be lacking, the impact that skills gaps had on employers’ organisations, and their response to address these issues.
In addition to exploring the skills perceived to be lacking among existing staff, the chapter also looks at upskilling – whether employers anticipating that staff will need to acquire new skills over the next 12 months.
Finally, this chapter discusses the related issue of under-use of skills. This sort of skills imbalance occurs when employees have both qualifications and skills more advanced than required for their current job role.
Incidence, volume and density of skills gaps A majority of employers (87%) reported that all of their staff were fully proficient at their job. As shown in Figure 4.1, the number of establishments who reported that at least some of their staff were not fully proficient has continued to fall steadily over time, from 17% in 2011 to 13% in 2017.
31 https://warwick.ac.uk/fac/soc/ier/publications/2001/hogarth_and_wilson_2001_synthesis.pdf

64
Similarly, skills gap density (the proportion of the workforce lacking full proficiency) has also continued to fall. Skills gap density refers to the number of staff perceived to be lacking proficiency, as a proportion of all staff. This proportion has fallen from 5.5% in 2011 to 4.4% in 2017. In total, 1.27 million employees across the UK were felt to be lacking proficiency.
The UK-wide decrease in skills gap density since 2015 has largely been driven by a decrease in skills gaps density in England. While skills gap density in England has fallen from 5.1% in 2015 to 4.3% in 2017, it has remained largely unchanged in Scotland and Wales. In Northern Ireland, skills gap density has increased, though it has remained below the levels found in 2013 and 2011.
Figure 4.1 Incidence and density of gaps over time by country
As discussed in the previous chapter, the UK government announced in its White Paper ‘Industrial Strategy: Building a Britain fit for the future’ the introduction of local Skills Advisory Panels to analyse supply and demand for skills at a local level and work with local industry to ensure that skills provision is optimally linked with where it is needed. ESS 2017 allows analysis of skills issues at a local level and Figure 4.2 shows the Local
17%
15%
14%
13%
17%
15%
14%
13%
13% 14
%
9%
12%
21%
19%
14%
16%
16%
16%
14%
13%
5.5%5.2% 5.0% 4.4%5.6%5.1% 5.1%
4.3% 4.4% 5.2%
3.3% 3.8%5.2%
5.9%5.0% 5.0% 4.6%
5.8%4.5% 4.7%
2013
2011
UK England N. Ireland Scotland Wales
Base: All establishments (2017: UK: 87,430; England: 71,527; NI: 3,973; Scotland: 6,017; Wales: 5,913)
2015
2017
2013
2011
2015
2017
2013
2011
2015
2017
2013
2011
2015
2017
2013
2011
2015
2017
2013 2015 % of establishments with skills gaps2011 2017
Density (number of staff with skills gaps)
Produced by IFF Research

65
Education Authorities (LEAs) in England with the highest and lowest proportion of the workforce who lack full proficiency in their role.
For example, while the proportion of workers in Southampton who lack full proficiency is among the lowest in the country (1.8%), the density of skills gaps in the neighbouring city of Bournemouth is more than four times higher at 8.4%. Detailed local level data has been published alongside this report on the gov.uk website.

66
Figure 4.2 Local Education Authorities in England with the highest and lowest densities of skills gaps32
Returning to UK-wide analysis, the proportion of establishments reporting at least one member of staff lacking full proficiency increases with the size of the establishment to nearly half (43%) of those with more than 250 employees, compared with only 6% of establishments with 2 to 4 employees.
32 Regional data sets for England, Northern Ireland, Scotland and Wales is available on the gov.uk website. (Note that LEAs with a base size of fewer than 100 establishments have been excluded from Figure 4.2)

67
However, in addition to this, the density of skills gaps also tended to be lower among smaller establishments. Establishments with 2 to 4 employees described a smaller proportion of their workforce as not fully proficient (2.5%) than did those with 5 to 24 employees (4.3%) and sites with 25 or more employees (4.7%).
Tables A.4.1a and A.4.1b in Appendix A provide a detailed breakdown of the incidence, number and density of skills gaps by size of establishment and sector. Table A.4.2 in Appendix A provides the density of skills gap by country.
Sectoral distribution of skills gaps
The overall decrease in skills gap density at a UK level is broadly reflected across most sectors of the economy, as shown in Figure 4.3. Hotels and Restaurants (6.7%) and Manufacturing (5.8%) remain the two sectors with the highest proportions of their workforces lacking full proficiency, albeit at lower levels than in 2015. Public Administration saw a particularly large decrease in skills gap density, from 6.4% in 2015 to 3.9% in 2017. That said, Public Administration also saw the largest decrease of all sectors in total employment between 2015 and 2017 (-5%) – it may be the case that this reduction in employment has disproportionately affected staff lacking full proficiency, thus causing a decrease in skills gap density in this sector.
Some sectors saw a rise in the proportion of the workforce lacking full proficiency from 2015 to 2017. In the Primary and Utilities sector, skills gap density increased from 3.8% in 2015 to 4.7% in 2017 and a similar change was seen in the Financial Services sector (3.7% to 5.0%).

68
Figure 4.3 Density of skills gaps by sector
While skills gap density was highest in the Hotels and Restaurants, and Manufacturing sectors, the highest number of skills gaps existed among establishments in the Wholesale and Retail sector (234,100 skills gaps) and the Business Services sector (229,900). Together these two sectors accounted for 37% of all skills gaps, though this is to be expected given these sectors also account for around a third of all employment (34%).
Despite having the lowest skills gap density overall, Northern Ireland saw a particularly high density of skills gaps in the Hotels and Restaurants sector (8.3%). In Scotland, skills gap density was higher than the overall UK level in Manufacturing (7.2% compared with 5.8%) and Wholesale and Retail (6.8% compared with 5.1%). Sectors where skills gap density was highest in Wales included Financial Services (7.7%) and Hotels and Restaurants (7.3%).
4.0%
4.3%
3.2%
6.4%
3.8%
3.8%
5.2%
5.7%
3.8%
3.7%
5.4%
7.2%
7.2%
2.9%
3.2%
3.3%
3.9%
3.9%
4.0%
4.3%
4.4%
4.7%
5.0%
5.1%
5.8%
6.7%
Education
Transport & Storage
Health & social work
Public admin.
Arts & Other Services
Construction
Business Services
Information & Comms
Primary Sector & Utilities
Financial Services
Wholesale & Retail
Manufacturing
Hotels & restaurants
2017 skills gap density
2015 skills gap density
Base: All establishments (see Table A.1.1 in Annex A for base sizes)
Number of skills gaps (2017)
142,700
138,400
234,100
46,800
36,300
45,200
229,900
47,800
52,700
50,400
126,400
42,400
74,300
Produced by IFF Research

69
Occupational distribution of skills gaps
As shown in Figure 4.4, labour-intensive and service-intensive occupations were more likely to experience skills gaps than managerial and professional occupations. This pattern was broadly consistent with previous years.
Figure 4.4 Number and density of skills gaps by occupation
Similar to the trend seen at the overall level, most occupations saw a decrease in the proportion of staff lacking full proficiency from 2015 to 2017. Machine Operatives, the occupation with the highest skills gaps density in 2015, saw a particularly large decrease from 7.0% to 5.2%, though this figure remained high in Scotland (6.7%).
At a national level, skills gap density was higher in Wales for Professionals compared with the UK level (5.0% compared with 2.7%). In Northern Ireland the density of skills gaps among Skilled Trades occupations was higher than the UK average (7.5% compared with 5.7%).
Sales and Customer Service occupations had the highest density of skills gaps, with this increasing from 6.5% in 2015 to 7.0% in 2017. Despite only accounting for 13% of all employment, these occupations accounted for 21% of all skills gaps. Within Sales and
3.0%
3.8%
4.8%
4.9%
5.3%
5.4%
5.5%
7.3%
7.8%
2.7%
3.0%
4.1%
5.4%
5.3%
7.0%
5.5%
6.9%
6.5%
2.0%
2.7%
3.7%
3.8%
4.2%
5.2%
5.7%
6.4%
7.0%
Managers
Professionals
Caring, Leisure and Other Services
Administrative and Clerical
Associate Professionals
Machine Operatives
Skilled Trades
Elementary occupations
Sales and Customer Service
2017
2015
2013
Base: All establishments with staff in each occupation (see Table A.4.4a in Appendix A for 2017 base sizes)
5.9%Labour
Intensive
263,600
250,400
114,600
121,000
83,100
140,100
98,300
98,700
97,600
5.6%Service Intensive
4.4%Middle
Skill
2.7%HighSkill
Number of skills gaps (2017)
Produced by IFF Research

70
Customer service occupations, there was considerable variation in skills gap density by establishment size, increasing from 4.2% in establishments with 2 to 4 employees to 8.4% among those with more than 100 staff.
Density of skills gaps by occupation within sector
There were also some particularly marked occupational patterns within sectors, as shown in Table 4.1.
While skills gap density among Sales and Customer Services occupations was the highest of all occupations, skills gap density was especially high among these staff within the Primary and Utilities (18%), Education (13%) and Financial Services (12%) sectors. These represent newly emerging pockets of high skills gaps density; in 2015, skills gap density among Sales and Customer Services occupations in each of these sectors was below 7%.
Skills gap density was also particularly high among Skilled Trades occupations within the Public Administration sector (10%). While Managers had the lowest skills gap density overall (2.0%), this figure was more than double among Managers in the Manufacturing sector (4.4%).
Tables A.4.3 and A.4.4 in Appendix A provide detailed breakdowns of skills gap density by occupation within country and sector respectively.

71
Table 4.1 Density of skills gaps by occupation within sector (percentage of staff not fully proficient)
UK
Sale
s an
d cu
stom
er s
ervi
ces
staf
f
Elem
enta
ry s
taff
Skille
d tra
des
occu
patio
ns
Mac
hine
ope
rativ
es
Asso
ciat
e pr
ofes
sion
als
Adm
inis
trativ
e/ c
leric
al s
taff
Car
ing,
leis
ure
and
othe
r ser
vice
s
Prof
essi
onal
s
Man
ager
s
Those where density was 10% and over
Those where density was 7% and over (but less than 10%)
Those where density was 4.4% and over (but less than 7%)
Those where density was less than 4.4%
UK 4.4 7.0 6.4 5.7 5.2 4.2 3.8 3.7 2.7 2.0
Hotels & restaurants 6.7 7.5 8.4 6.1 6.2 4.6 4.9 6.4 0.8 2.6
Manufacturing 5.8 7.5 6.0 5.4 7.0 5.3 4.2 ** 4.5 4.4
Wholesale & Retail 5.1 6.1 7.0 5.5 5.7 3.5 3.3 6.5 2.3 2.2
Financial Services 5.0 12.1 5.7 0.7 ** 2.7 4.6 ** 3.8 1.0
Primary Sector & Utilities 4.7 18.2 6.6 4.6 4.7 3.5 3.4 7.4 3.4 1.7
Information & Communications 4.4 9.0 4.4 5.5 4.8 3.8 4.5 ** 4.1 1.3
Business Services 4.3 7.0 6.4 6.6 4.7 6.1 3.9 3.6 2.8 1.6
Construction 4.0 5.4 6.6 6.0 4.3 4.9 3.2 ** 3.2 1.4
Public Administration 3.9 4.3 4.8 10.1 6.9 2.8 3.3 3.2 3.1 3.0
Arts & Other Services 3.9 7.8 5.0 4.9 2.6 3.0 3.6 4.2 2.3 1.8
Health & social work 3.3 6.9 3.4 1.8 1.1 2.7 4.0 3.7 2.4 1.7
Transport & Storage 3.2 5.8 4.2 2.3 3.0 3.2 2.6 12.3 1.4 1.8
Education 2.9 13.2 3.5 5.5 1.3 2.7 3.4 3.1 2.2 1.7 Base: All establishments employing each occupation, by sector (see Table A.4.4 in Appendix A) ** denotes a figure not shown because of a low base size (fewer than 30 establishments) Figures in italics denote a base size between 30 and 49 establishments

72
Causes of skills gaps
Transient causes
The majority of skills gaps were caused, at least in part, by transient factors – factors which would be expected to ease naturally over time.33 The fact that staff were new to the role contributed to nearly two-thirds (63%) of all skills gaps, and a broadly similar proportion of skills gaps (58%) were caused at least in part by the fact that employees’ training was only partially complete. Combined, these transient factors contributed to three-quarters (76%) of all skills gaps, an increase from 2015 (73%).
However, while a majority of skills gaps were at least partly caused by transient factors, only 22% of skills gaps could be entirely explained by factors related to new staff or those who have not completed that one would expect to resolve themselves with time. A majority of employers with skills gaps also suggested additional causes. These factors are presented in Figure 4.5.
33 Of course, consistently high levels of staff turnover would have the effect of a persistent skills gap. 14% of employers who reported a transient cause of skills gaps also said that problems retaining staff were a contributing factor. We stick with the ‘transient’ terminology for brevity’s sake.

73
Figure 4.5 Main causes of skills gaps (prompted)
In some sectors, a smaller proportion of skills gaps were caused entirely by transient factors, suggesting that internal skills deficiencies are more entrenched. For example, in the Transport and Storage sector, only one in eight skills gaps (13%) were caused entirely by transient factors, compared with 22% UK-wide. Causes which were more prevalent in this sector compared with the average across all sectors include:
• Staff having been on training but their performance not improving sufficiently (51% compared with 31% overall)
• Staff lacking motivation (44% compared with 32%)
• Problems retaining staff (31% compared with 21%)
• The development of new products and services (26% compared with 16%), and
• English not being the first language of staff (6% compared with 1%).
21%
20%
18%
32%
29%
26%
39%
42%
57%
62%
19%
20%
18%
28%
26%
26%
29%
34%
56%
60%
16%
19%
21%
24%
25%
28%
30%
32%
57%
63%
The development of new products andservices
The introduction of new technology
Problems retaining staff
The introduction of new working practices
Staff have not received the appropriatetraining
Unable to recruit staff with the required skills
They have been on training but theirperformance has not improved sufficiently
Staff lack motivation
Their training is currently only partiallycompleted
Staff are new to the role
2017
2015
2013
Base (2017 / 2015 / 2013): All establishments with skills gaps; up to two skills gaps followed up. (18,021 / 18,265 / 20,228)Produced by IFF Research
34%Transformational
Factors
76%TransientFactors

74
In the Primary and Utilities sector, around one in six skills gaps (17%) were caused entirely by transient factors. English not being the first language of staff contributed to 8% of skills gaps in this sector – much greater than the average across all sectors (1%).
Other sectors where a lower proportion of skills gaps can be explained solely by transient factors include the Public Administration (18%) and Education (17%) sectors. Within the Public Administration sector, problems retaining staff contributed to a higher than average proportion of skills gaps (26%). Not receiving appropriate training also contributed to more skills gaps within this sector (31% compared with 25% overall). Within the Education sector, new working practices contributed to more than a third (35%) of all skills gaps, higher than the proportion across all sectors (24%).
Non-transient causes34
Staff lacking motivation remains the most common non-transient cause of skills gaps (32%). While this proportion has fallen from 34% in 2015 and 42% in 2013, it remains a significant cause of skills gaps among elementary staff (44%).
As in 2015, issues related to training were also a prominent cause of skills gaps. Staff having been on training but their performance not improving sufficiently contributed to nearly a third of all skills gaps (30%). Staff not receiving appropriate training contributed to one quarter (25%) of skills gaps, an issue that was more prevalent in the public administration and manufacturing sectors (31% and 30% respectively), as well as among managers (39%).
Just over a quarter (28%) of skills gaps were caused at least in part by an inability to recruit staff with the required skills. This factor was especially common in sectors and occupations with particularly high levels of skill-shortage vacancy density such as: the Manufacturing sector (36%), Skilled Trades occupations (35%) and Machine Operatives (38%).
Positive transformational causes
There are some workplace activities which, although a cause of skills gaps in the short-term, represent a positive tendency for employers to invest in future growth. In 2017 34% of skills gaps were caused by these sorts of factors compared with 37% in 2015. The introduction of new working practices contributed to 24% of skills gaps (down from 28%
34 These are less likely to have an obvious, natural end in sight for a given employee. I.e. a lack of motivation might simply be temporary, but we would not expect it to naturally resolve itself in the same way as a new recruit completing their induction.

75
in 2015). A similar downward trend can be seen in the proportion of skills gaps caused by the introduction of new technology (19%, down from 20%), and the development of new products and services (16%, down from 19%).
Tables A.4.5 and A.4.6 in Appendix A provide breakdowns of the most common causes of skills gaps by sector and occupation.
The profile of causes of skills gaps in Wales was somewhat different to the rest of the UK. While more skills gaps are caused at least in part by transient factors (87%), fewer gaps than average can be solely attributed to transient factors (17%). Not having received appropriate training contributed to 38% of skills gaps in Wales, higher than 25% nationwide. Positive transformational causes were also more prevalent among Welsh employers, this includes:
• The introduction of new working practices (contributed to 41% of skills gaps in Wales)
• The introduction of new technology (33%)
• The development of new products and services (28%).
Skills lacking internally This section examines the specific skills that employers perceived to be lacking among their workforces. These can be broadly grouped into two categories:
• Technical and practical skills – these are the specific skills required to perform the specific functions of a job role.
• People and personal skills – these are the ‘softer’, less tangible skills required to manage oneself and interact with others in the workplace.
There has been little change since 2015 in terms of the types of skills that employers most commonly judged to be deficient among their workforce. Figure 4.6 shows a full list of these skills, as well as the proportion of all skills gaps for which each skill was a contributing factor.
Technical and practical skills
A deficiency in specialist skills or knowledge required to perform the job role was a contributing factor to nearly half of all skills gaps (47%), rising to six in ten in the Education and Health and Social Work sectors (58% and 62% respectively).

76
Figure 4.6 Skills lacking among staff with skills gaps
17%
28%
23%
46%
56%
30%
39%
41%
46%
59%
16%
28%
26%
45%
51%
25%
35%
37%
44%
59%
2017
2015
People and personal skills
68% Self-
Management skills
53% Management
and Leadership
49% Sales and Customer
skills
Base: All establishments with skills gaps (18,021)
Ability to manage time and prioritise own tasks
Managing own / others' feelings
Managing or motivating other staff
Persuading or influencing others
Setting objectives for others / planning resources
Team working
Customer handling skills
Sales skills
Instructing, teaching or training people
Making speeches or presentations13%
14%
20%
22%
32%
29%
27%
30%
24%
39%
48%
36%
37%
13%
13%
20%
23%
29%
31%
19%
25%
20%
37%
47%
35%
39%
2017
2015
Produced by IFF Research
Technical and practical skills
49% Operational
skills
43% Complex Analytical
skills
35% Digitalskills
Knowledge of products and services offered
Knowledge of how the organisation works
Specialist skills or knowledge
Solving complex problems
Complex numerical/statistical skills
Computer literacy / basic IT skills
Advanced or specialist IT skills
Reading/understanding instructions, reports etc.
Adapting to new equipment or materials
Writing instructions, reports etc.
Basic numerical skills
Manual dexterity
Communicating in a foreign language

77
A lack of knowledge of a company’s products, services, and internal processes was also common. A need to improve these sorts of operational skills was a contributing factor for half (49%) of all skills gaps and was more prevalent in the Wholesale and Retail (57%) and Hotels and Restaurants (57%) sectors. There is no evidence that a shortage of these operational skills is a result of staff being new to the role or not yet having completed training. Indeed, the proportion of skills gaps caused by deficiencies in operational skills remains unchanged (49%) even when excluding employers whose skills gaps are caused entirely by transient factors.
A lack of proficiency in complex analytical skills contributed to 43% of all skills gaps: this proportion was greater among establishments in the Business Services (51%) and Public Administration (50%) sectors, as well as among establishments in Wales (57%).
Just over a third of all skills gaps (35%) involved a deficiency in digital skills. This includes both basic computer literacy and IT skills (25%) as well as more advanced or specialist IT skills (19%). The proportion of skills gaps that can be at least partly attributed to a lack of proficiency in digital skills was lower than in 2015 but remained persistently high among establishments in the Public Administration (50%) and Education (42%) sectors, as well as among establishments with 2 to 4 employees (40%).
Among employers in Wales, around one in five skills gaps involved a need to improve written Welsh language skills (22%) and oral Welsh language skills (20%).
Tables A.4.7a-e in Appendix A present the skills lacking in the workforce by occupation, nation and sector.
People and personal skills
As in 2015, the most common people or personal skill found to be lacking among staff related to poor time management and prioritisation of tasks, which contributed to 59% of all skills gaps. Indeed, this was also most commonly deemed to be the main skill lacking among staff lacking full proficiency (12% of all skills gaps). Together with the ability to manage one’s own feelings and handle the feelings of others, which contributed to more than four in ten skills gaps (44%), two-thirds of all skills gaps (68%) related to what can broadly be categorised as ‘self-management skills’.
A lack of management and leadership skills contributed to more than half of all skills gaps (53%); this was more common among staff lacking proficiency in the Education (59%) and Health and Social Work (61%) sectors.
As shown in Figure 4.7, two-thirds of skills gaps in the Hotels and Restaurants sector (67%) and three-fifths in the Wholesale and Retail sector (59%) were caused at least in part by a lack of proficiency in sales and customer service skills, above the all-sector average of 49%. Operational skills were also more likely than average to be lacking among staff lacking proficiency in these sectors (57% and 57% respectively).

78
Figure 4.7 Skills lacking in sectors with highest density of skills gaps
In the Manufacturing sector, nearly four in ten skills gaps (39%) could be attributed to deficiencies in instructing, teaching or training others, higher than the overall average of 28%. Staff in this sector were also more likely than average to be lacking specialist skills or knowledge required to perform their role (56% compared with 47% across all sectors). However, deficiencies in specialist skills or knowledge were most acute in the Health and Social work sector, contributing to more than six in ten skills gaps (62%).
Skills lacking by occupation
Figure 4.8 shows the types of skills lacking among the occupational groups with the highest densities of skills gaps. Predictably, deficiencies in sales and customer skills contributed to the greatest proportion of skills gaps among employees in sales and customer service occupations (63%).
ComplexAnalytical
Operational
Digital
Managementand
Leadership
Sales andCustomer
Self-Management
Complexanalytical
Operational
Digital
Managementand
Leadership
Sales andCustomer
Self-Management
ComplexAnalytical
Operational
Digital
Managementand
Leadership
Sales andCustomer
Self-Management
ComplexAnalytical
Operational
Digital
Managementand
Leadership
Sales andCustomer
Self-Management
All s
ecto
rs
Who
lesa
le a
nd R
etai
lHo
tels
and
Res
taur
ants
Man
ufac
turin
g
All sectors
Skills gapdensity4.4%
Skills gapdensity6.7%
Skills gapdensity5.8%
Skills gapdensity5.1%
All sectors
All sectors
Base: All establishments with skills gaps (18,021)Produced by IFF Research

79
Figure 4.8 Skills lacking in occupations with highest density of skills gaps
As with all occupational groups, self-management skills were the most common type of skill lacking among elementary staff (74%). Skills disproportionately identified as lacking among this group also include: reading and understanding instructions (38%), basic numerical skills (27%), communicating in a foreign language35 (21%), and manual dexterity (20%).
Employees in high-skill occupations (managers, professionals and associate professionals) were more likely than average to be deficient in management and leadership skills (66% compared with 53% overall). Complex-analytical skills were more commonly identified as areas needing improvement among high-skill and middle-skill36 occupations (57% and 52% respectively). Digital skills were also more likely to be lacking among staff in high-skill and middle-skill professions (41% and 45% respectively), especially administrative and clerical staff (58%).
35 When interviewing employers in England, Scotland and Northern Ireland, a foreign language was defined as any language that is not English. For employers in Wales, a foreign language was defined as any language other than English or Welsh. 36 Middle-skill occupations include Skilled Trades and Administrative or Clerical staff.
ComplexAnalytical
Operational
Digital
Managementand
Leadership
Sales andCustomer
Self-Management
Complexanalytical
Operational
Digital
Managementand
Leadership
Sales andCustomer
Self-Management
ComplexAnalytical
Operational
Digital
Managementand
Leadership
Sales andCustomer
Self-Management
ComplexAnalytical
Operational
Digital
Managementand
Leadership
Sales andCustomer
Self-Management
All o
ccup
atio
ns
Skill
ed T
rade
sSa
les
& Cu
stom
er S
ervi
ce
Elem
enta
ry O
ccup
atio
ns
Base: All establishments with skills gaps (18,021)
All occupations
Skills gapdensity4.4%
Skills gapdensity7.0%
Skills gapdensity6.4%
Skills gapdensity5.7%
All occupations
All occupations
Produced by IFF Research

80
Impact of skills gaps
Extent of impact
Two-thirds of establishments with skills gaps (66%) reported these as having an impact on their organisation’s performance (17% reporting a ‘major’ impact; see Figure 4.9).While the density of skills gaps in the UK workforce has fallen from 2015 to 2017, of establishments with skills gaps, the proportions reporting an impact on their establishment’s performance were unchanged from 2015.
Larger establishments were more likely to say their skills gaps had an impact on their performance, but small businesses were more likely to report major impacts. There were no significant differences between nations in the proportions of establishments reporting that skills gaps had either a major impact on performance or any impact at all.
By sector, establishments in Hotels and Restaurants, which had the highest density of skills gaps of all sectors, were more likely than average to report major impacts of skills gaps (21%). Furthermore, sectors where skills gaps were less likely to be caused by transient factors were also more likely to consider the impact of skills gaps on their business performance to be ‘major’ (Transport and Storage: 22%, Primary and Utilities: 21%).
Figure 4.9 Impacts of skills gaps by establishment size
Other subgroups more likely to report that their skills gaps had a major impact on the performance of their establishment include:
• Establishments with hard to fill vacancies (28%) or skill-shortage vacancies (29%)
Base: All establishments with skills gaps (18,021)
17%
48%
Major impact
Minor impact
66%
All with skills gaps
Any impact
Produced by IFF Research
12%
17%
14%
17%
17%
20%
65%
56%
53%
50%
48%
43%
250+
100 to 249
50 to 99
25 to 49
5 to 24
2 to 4 63%
65%
67%
67%
73%
77%

81
• Establishments whose skills gaps were caused by non-transient factors (21%).
Table A.4.8 in Appendix A provides a breakdown of the extent of impact of skills gaps by country, size and sector.
The specific impacts of skills gaps
Figure 4.10 shows the specific implications of skills gaps for the businesses who reported them. Results are very similar to 2015, within one percentage point for each impact. The most common impact mentioned was an increased workload for other staff (51%).
It was also common for establishments to report financial challenges as a result of staff not being fully proficient. More than a quarter of establishments with skills gaps (27%) said that their operating costs had been driven up as a result. This was particularly prevalent in the Primary and Utilities sector (39%) and Manufacturing sector (38%). Furthermore, one-fifth of establishments with skills gaps (21%) had lost business or orders to competitors.
As discussed earlier in this chapter, some skills gaps were caused as by-products of innovation and positive transformational working practices. However, some employers with skills gaps also reported that their internal skills challenge hindered their organisation’s ability to innovate and introduce long-term business changes. One quarter of establishments with skills gaps (23%) had difficulty introducing new working practices as a result of skills gaps and one in six (17%) had experienced delays in developing new products or services.
Difficulties meeting quality standards was another common impact, affecting a quarter (24%) of those with skills gaps, rising to over one-third (36%) in the Hotels and Restaurants sector.

82
Figure 4.10 Impacts of skills gaps (prompted)
At a national level, employers in England were less likely to experience higher operating costs as a result of skills gaps than in the Devolved Administrations (26% compared with 31% in Northern Ireland and 30% in Scotland and Wales). Similarly, a smaller proportion of English employers had difficulties introducing new working practices due to these skills gaps than in other nations (22% compared with 26% in Wales and 28% in Scotland and Northern Ireland).
The nature of the impacts felt by establishments with skills gaps also varied by employer. As already discussed, though smaller businesses were less likely to report that skills gaps had any impact at all, they were more likely to consider these to be major impacts. Specifically, a greater proportion of establishments with 2 to 4 employees had lost business orders to competitors (22%) and/or suffered delays in developing new products or services (19%).
Table A.4.9 in Appendix A provides a breakdown of implications of skills gaps by country, size and sector.
Employer response to skills gaps The vast majority of establishments with skills gaps (85%) had taken steps to improve the proficiency or skills of their staff. A further 5% had not taken steps at the time but planned to do so in future. Around one in ten of establishments with skills gaps had taken no action and had
51%
27%
24%
23%
21%
17%
11%
34%
52%
27%
25%
24%
21%
17%
11%
34%
Increase workload for other staff
Higher operating costs
Difficulties meeting quality standards
Difficulties introducing new working practices
Lose business or orders to competitors
Delay developing new products or services
Outsource work
No impact
2017
2015
Base: All establishments with skills gaps (18,021)

83
no plans in place to tackle these issues (9%). All of these proportions are unchanged from 2015.
Among those with skills gaps, the smallest establishments with 2-4 staff were the least willing or able to have taken steps to improve the proficiency of these staff (79%), and as many as 14% had no plans to take any steps in the future.
Public sector and third sector establishments who reported skills gaps were more likely to have responded to these issues (91% and 90% respectively) than establishments in the private sector (85%), with the proportion particularly high within Education and Health and Social Work (93% and 92% respectively).
Among the three sectors noted in the previous section that were more likely than average to report skills gaps having a major impact on their business’ performance, the response to their skills gaps was varied:
• Establishments in the Hotels and Restaurants were among the most likely to have taken steps in response (89%)
• However, the Primary and Utilities sector were the least likely of all sectors (74%) to have taken steps to respond to their skills gaps. Almost one in five establishments with skills gaps in this sector (19%) had no plans to tackle these issues in the future
• Establishments in the Transport and Storage sector were less likely than average to have taken steps to respond to the issue of skills gaps (81%) but were more likely to have plans to tackle these skills deficiencies in the future (9%): the proportion taking no action or with no plans to in this sector was in line with the all-sector average (9%).
Taking action to address skills gaps was more common among employers with solely transient skills gaps (89%), compared with employers whose skills gaps were more persistent (84%).
Actions taken to overcome skills gaps
In terms of the specific actions taken by employers to tackle their skills gaps, two-thirds of establishments (67%) had increased either training activity or spending on training programmes, as shown in Figure 4.11.

84
Figure 4.11 Actions taken to overcome skills gaps (prompted)
As in 2015, it was also common to utilise the expertise of existing staff to improve skills of staff lacking proficiency. Examples of these sort of activities include: more supervision of staff (54%), more staff appraisals or performance reviews (45%), and implementation of a mentoring or buddying scheme (44%). There was a slight increase compared with 2015 in the proportion of employers with skills gaps who responded to these issues by increasing recruitment activity or spending (from 19% in 2015 to 21% in 2017). Although reasonably common, the proportion of employers using more supervision of staff and more staff appraisals/performance reviews to tackle skills gaps were both 6% lower than in 2013.
In addition to being asked about a general increase in recruitment activity or spending, employers were asked specifically whether they had recruited, or tried to recruit, non-UK nationals in order to overcome skills gaps. One-sixth of those with skills gaps (15%) reported that they had. This proportion was greater in the Hotels and Restaurants sector (29%), as well as among establishments with more than 25 staff (22% compared with 7% of those with 2 to 4 staff).
Table A.4.10 in Appendix A provides a breakdown of actions taken to tackle skills gaps by country, size and sector.
15%
16%
31%
37%
47%
51%
60%
68%
16%
19%
27%
33%
45%
46%
56%
68%
16%
21%
27%
35%
44%
45%
54%
67%
Nothing
Increase recruitment activity / spend
Changing work practices
Reallocating work
Implementation of mentoring / buddyingscheme
More staff appraisals / performance reviews
More supervision of staff
Increase training activity / spend or increase /expand trainee programmes
2017
2015
2013
Base (2017 / 2015 / 2013): All establishments with skills gaps (18,021 / 18,265 / 20,228)Produced by IFF Research

85
Recruitment of EU nationals in response to skills gaps
Around one in seven of those with skill gaps (15%) had sought to recruit non-UK nationals (see Figure 4.12). The vast majority of these employers had sought recruits from the EU (92%, equivalent to 14% of all those with skill gaps), whether exclusively from the EU (41%) or also from further afield (50%). Attempting to recruit EU nationals was a particularly common response to skills gaps in the Hotels and Restaurants sector (27%, see Figure 4.13), as well as among employers with more than 25 staff (21%) and employers in London (24%).
Figure 4.12 Proportion of employers with skill gaps responding to these by trying to recruit non-UK nationals
84%Have not recruited or tried to recruit
non-UK nationals in response to skills
gaps
Base for pie: All establishments with skills gaps (18,021)Base for column: All that had recruited or tried to recruit non-UK nationals in response to skills gaps (3,086)
5%
50%
41%Tried to recruitEU nationals
Both
Tried to recruitnon-EU nationals
Don't Know
91%of those who tried to recruit non-UK nationals in response to skills gaps looked to recruit from the EU
15%have, of these…
Produced by IFF Research

86
Figure 4.13 Proportion of employers with skills gaps responding to these by recruiting EU nationals, by nation, sector and size
Upskilling Having considered skills gaps, this chapter now turns to ‘upskilling’ where employers anticipate that staff will need to acquire new skills over the next twelve months.
The questions regarding upskilling are asked in alternate iterations of ESS, therefore the time series comparison commentary in this section of the report relates to 2013 data. The questions are asked on a modular basis, meaning around half of survey participants are asked the upskilling questions covering whether over the next 12 months their employees will need to develop new skills or knowledge for reasons such as the introduction of new working practices or legislation, or (introduced for the 2017 survey) the UK’s decision to leave the EU.
The prevalence of upskilling needs Across the UK, six in ten employers (63%) expect that at least some of their staff will need to acquire new skills or knowledge over the next twelve months. Significantly fewer employers reported a need for upskilling than in 2013 (72%). By nation, employers in Scotland were more likely than average to report a need for upskilling (69%), compared to 62% to 63% in the other nations. The decrease in the proportion reporting the need for upskilling since 2013 had
Base: All establishments with skills gaps (18,021)
5%
6%
7%
7%
9%
11%
11%
12%
13%
15%
16%
16%
27%
14%
Financial Services
Public admin.
Construction
Education
Arts & Other Services
Primary & Utilities
Information & Comms
Wholesale & Retail
Business Services
Health & social work
Transport & Storage
Manufacturing
Hotels & restaurants
UK
21%
23%
22%
20%
13%
7%
250+
100 to 249
50 to 99
25 to 49
5 to 24
2 to 4
14%
11%
14%
14%
Produced by IFF Research

87
occurred across all four nations; in 2013 70% of employers in England, 72% in Northern Ireland, 74% in Scotland and 72% in Wales reported a need for upskilling.
The larger the establishment the more likely they were to anticipate an upskilling need over the next 12 months, rising from 57% of smaller establishments with 2 to 4 employees to 82% of those with at least 250 employees. This follows the same pattern as in 2013, as shown in Figure 4.14.
Figure 4.14 also shows that the proportion reporting a need for upskilling has consistently dropped across all sectors since 2013. Employers in Public Administration remained the most likely to report a need for upskilling and had the smallest decrease to 80% from 84% in 2013. All other sectors saw larger decreases in the proportion reporting an upskilling need since 2013.37
There was no simple relationship between the likelihood of a sector reporting skills gaps and the perceived need for upskilling. Hotels and Restaurants employers had the highest density of skills gaps but were least likely to identify a need for upskilling (54%) and were most likely to overcome skills gaps through means such as recruiting non-UK nationals. Conversely, Public Administration had the lowest density of skills gaps, but these employers were the most likely to identify a need for upskilling (80%), suggesting a difference in attitude to skills needs within this sector in their likelihood to see room for improvement despite proficiency.
Those employers that have skills gaps are more likely than average to report that some of their staff will need to acquire new skills or knowledge over the coming year (77%), although three fifths (61%) of those where all of their staff are fully proficient still anticipate a need for upskilling of staff in the next 12 months, indicating a need for skills development continuing.
37 This data is also provided in Table A.4.11 in Appendix A.

88
Figure 4.14 Need for upskilling, by country, size and sector
Occupations most affected by the need for upskilling
Employers anticipating the need for staff to acquire new skills or knowledge were asked which single occupation would be most affected. As shown in Figure 4.15, 45% of employers employing any Managers anticipate this occupation being the priority, an increase of 13 percentage points since 2013. Four in ten (39%) establishments that employ Caring, Leisure and Other services staff anticipate these staff being the priority (a much smaller increase of two percentage points since 2013). In contrast, there has been a decrease in the proportion reporting that Professionals they employ would be most affected, from 40% in 2013 to 29% in 2017. There were also decreases in those reporting that Associate Professionals (21% compared to 29% in 2013) and Sales occupations (22% compared to 29% in 2013) would be most affected. The results in other occupations remain similar to 2013.
72%In 2013
57% 67
% 74% 78
%
80%
82%
65% 75
% 83% 86% 89%
90%
2 to 4 5 to 24 25 to 49 50 to 99 100 to249
250+2017 2013
Base: All establishments in Module 2 (2017: 43, 437 2013: 45,644)
62%
62%
67%
62%
67%
72%
69%
74%
82%
83%
82%
84%
84%
54%
55%
58%
58%
58%
59%
61%
67%
71%
72%
72%
74%
80%
Hotels & Restaurants
Construction
Primary Sector & Utilities
Manufacturing
Transport & Storage
Arts & Other Services
Wholesale & Retail
Business Services
Information &Communications
Financial Services
Health & Social Work
Education
Public admin.
2017 2013
62%
63%
69%
62%
63%Overall upskilling
need 2017
Produced by IFF Research

89
Figure 4.15 Single occupation most affected by a need for upskilling
Reasons for a need for upskilling
Overall, the reasons explaining the need for upskilling followed a similar hierarchy to 2013, though the proportion of employers mentioning each reason was lower in 2017 than 2013 (see Figure 4.16).
Two-fifths (39%) of employers reported that the need for upskilling was due to new legislative or regulatory requirements, the same proportion mentioned the introduction of new technologies or equipment, whilst one-third (35%) reported both the development of new products and services and the introduction of new working practices as reasons. A quarter (24%) said that increased competitive pressure was a reason.
Around one in eight (13%) said that the UK’s decision to leave the EU was a reason for the need for upskilling, though only 1% said that this was the only reason. The UK’s decision to leave the EU was more likely than the UK average to be mentioned by employers in Northern Ireland (17%), Scotland (17%), and regionally by those in London (16%), as well as by Financial Services and Public Administration employers (both 18%) and Primary Sector and Utilities and Transport and Storage employers (both 16%). Employers who had skills gaps were significantly more likely to report all of these as reasons for needing to upskill.
37% 2013
29% 2013
32% 2013
39% 2013
29% 2013
12% 2013
31% 2013Managers Professionals Associate
ProfessionalsAdmin and Secretarial
Skilled Trades
45% 29% 21% 12% 30%
Caring, Leisure and
Other
Sales and Customer Service
Process, Plant and Machine
Ops
Elementary Occupations
39% 22% 19% 14%
21% 2013
14% 2013
Base: All establishments in Module 2 that identified an occupation in need of upskilling and employ that particular occupation (29.464)Produced by IFF Research

90
Figure 4.16 Reasons for a need for upskilling (prompted)
As detailed in Table 4.2, there were some notable differences in the reasons given for upskilling by nation. Employers in Scotland and Wales were more likely than average to mention new products and services, new working practices, new technologies, and new legislative and regulatory requirements. Additionally, employers in Northern Ireland and Scotland were more likely than average to mention the UK’s decision to leave the EU (both 17%). Employers in Scotland were more likely to mention all of the reasons given for upskilling, roughly three to four percentage points above the UK-wide figure.
Base: All establishments in Module 2 (43,437)
31%
42%
43%
44%
46%
13%
24%
35%
35%
39%
39%
The UK's decision to leave the EU*
Increased competitive pressure
The introduction of new working practices
The development of new products and services
The introduction of new technologies or equipment
New legislative or regulatory requirements
2017
2013
*Code not included in 2013Produced by IFF Research

91
Table 4.2 Reasons for a need for upskilling, by nation (prompted)
2013 2017
UK %
EN %
NI %
SC %
WL %
UK %
EN %
NI %
SC %
WL %
New legislative or regulatory requirements 46 45 47 51 51 39 38 39 42 41
The introduction of new technologies or equipment 44 44 47 46 46 39 38 39 41 42
The development of new products and services 43 43 40 44 45 35 35 32 39 37
The introduction of new working practices 42 42 43 45 45 35 35 36 39 39
Increased competitive pressure 31 31 32 30 31 24 24 25 25 23
The UK’s decision to leave the EU * * * * * 13 13 17 17 11
*Code not included in 2013 Base: All establishments in Module 2 (43,437)
Tables A.4.12 and A.4.13 provide a breakdown on reasons for a need for upskilling, by country, size and sector.
Upskilling: skills that need improving Those employers that identified an occupation most affected by the need for upskilling were asked which skills require developing among their staff. Again, these have been grouped into two categories:
• Technical and practical skills – these are the specific skills required to perform the specific functions of a job role, for example advanced or specialist IT skills.
• People and personal skills – these are the softer, less tangible skills required for self-management, leadership and interaction in the workplace, for example persuading or influencing others.
A summary of these skills is shown in Figure 4.17.
Technical and practical skills
The most common technical and practical skills that employers felt needed developing were knowledge of products and services (48%), specialist skills or knowledge (48%) and adapting to new equipment or materials (43%). When grouping these skills by area; more than half (53%) cited operational skills such as knowledge of how the organisation works, around half (49%) cited digital skills (at advanced and/or basic level) and over two-fifths (44%) mentioned complex analytical skills such as complex numerical or statistical skills.

92
Figure 4.17 Skills that need developing among staff requiring upskilling (prompted)
By sector, Information and Communications employers were significantly more likely than other employers to mention digital skills (67%), as were those in the Education sector (56%).
19%
35%
40%
31%
37%
34%
45%
31%
31%
40%
11%
13%
15%
23%
27%
43%
19%
38%
31%
31%
48%
31%
48%
Produced by IFF Research
Technical and practical skills
53% Operational
skills
44% Complex Analytical
49% Digitalskills
Base: All requiring upskilling, excluding those that did not identify an occupation more affected by the need for upskilling (26,416)
People and personal skills
Knowledge of products and services
Knowledge of how organisation works
Specialist skills or knowledge
Advanced or specialist IT skills
Computer literacy/basic IT skills
Solving complex problems
Complex numerical or statistical skills
Adapting to new equipment / materials
Reading instructions, reports etc
Writing instructions, reports, etc.
Basic numerical skills / understanding
Manual dexterity
Communicating in a foreign language
Managing or motivating other staff
Persuading or influencing others
Setting objectives for others
Time management and prioritisation
Managing own / others' feelings
Customer handling skills
Sales skills
Team working
Instructing teaching or training people
Making speeches or presentations
52% Self-
Management
53% Management
and Leadership
45% Sales and Customer

93
Financial Services employers were more likely than anyone to mention Operational Skills (66%) than average, as were Wholesale and Retail (63%) and Hotels and Restaurants (63%).
People and personal skills
With regard to people and personal skills, the most common upskilling needs in this area were ability to manage own time and prioritise their own tasks (45%), managing or motivating other staff and team working (both 40%).
When specific people skills required are grouped, over half (53%) cited management and leadership skills, a similar proportion (52%) mentioned self-management skills and over two-fifths (45%) had sales and customer upskilling needs.
Employers who reported skills gaps among their workforce were more likely to have upskilling needs across any of these types of skills in the next 12 months; of those with skills gaps:
• 60% cited management and leadership skills compared to 52%
• 64% self-management skills, compared to 50%
• 51% sales and customer skills as upskilling needs, compared to 43%,
Employers in Wholesale and Retail, as well as in Hotels and Restaurants, were more likely than average to mention a need to upskill in Management and Leadership skills (57% and 64% respectively), Sales and Customer skills (54% and 59% respectively) and Self-Management skills (56% and 63% respectively).
In Figure 4.18, the broad groupings of skills that need developing have been broken down by the occupations employers consider most in need of upskilling. This shows the variation in the combination of different skills required in the future by occupation. In particular the chart shows that Managers and Professionals are more likely to need to develop Digital Skills. Sales and Customer Service and Skilled Trades employees are more likely to need to develop Operational Skills, as well as Self-Management Skills.

94
Figure 4.18 Skills that need developing among occupations most in need of upskilling
Under-use of skills The proportion of graduates working in low-skilled jobs has increased over the last decade since the financial crisis.38 In addition to shortages of skills in the labour market, ESS also provides insight into skills imbalances that occur when the skills and qualifications held by employees are not utilised optimally within the labour market. In ESS 2017, under-use of skills was measured by asking employers how many staff, if any, had both qualifications and skills more advanced than required for their current job role. Again, as with skill gaps, it is worth bearing in mind that the survey can only capture what employers are aware of and report.
The prevalence of under-use of skills
Across the UK, just over one-third of all establishments (35%) reported that at least one employee had both qualifications and skills more advanced than required for their current job role. In volume terms, 2.5 million workers, or 8.7% of the workforce, have under-utilised skills.
38 Good Work: The Taylor Review of Modern Working Practices (2017)
ComplexAnalytical
Operational
Digital
Managementand
Leadership
Sales andCustomer
Self-Management
Complexanalytical
Operational
Digital
Managementand
Leadership
Sales andCustomer
Self-Management
ComplexAnalytical
Operational
Digital
Managementand
Leadership
Sales andCustomer
Self-Management
ComplexAnalytical
Operational
Digital
Managementand
Leadership
Sales andCustomer
Self-Management
Man
ager
s
Prof
essi
onal
sSa
les
& Cu
stom
er S
ervi
ce
Skill
ed T
rade
s
Base: All employers identifying a need for upskilling (26,416)
All occupations
Produced by IFF Research

95
That is to say, the under-use of skills affects a considerably larger proportion of employers and of the workforce than skills deficiencies do.
As illustrated in Figure 4.19, incidence and density of under-utilised staff have risen at the UK level since 2015 when three in ten establishments reported skills under-use (30%) and there were 2.0 million workers with both qualifications and skills at a more advanced level than required for their job role (7.1% of the workforce).
Figure 4.19 Incidence and density of staff who are both over-qualified and over-skilled by country
This increase from 2015 to 2017 in the proportion of establishments reporting skills under-use was most dramatic in Northern Ireland (28% to 37%). The proportion of the workforce with under-utilised skills in England (8.5%) was lower than in each of the devolved administrations (9.4% in Northern Ireland, 9.2% in Scotland, and 9.5% in Wales), though in all nations the 2017 figure was higher than 2015.
As in 2015, the proportion of staff under-utilised is considerably higher among establishments with 2 to 4 employees, where 20% of staff are considered both over-skilled and over-qualified. This proportion falls to 11% among establishments with 5 to 24 employees and 6% for those with 25 or more employees. Fewer formal opportunities for career progression in smaller
30%
35%
30%
34%
28%
37%
32%
35% 34%36%
7.1%8.7%
7.0%8.5% 7.8%
9.4%7.9%
9.2%7.5%
9.5%
UK England N. Ireland Scotland Wales
Base: All establishments (2017: UK: 87,430; England: 71,527; NI: 3,973; Scotland: 6,017; Wales: 5,913)
2015
% of establishments reporting skills under-use2017
% of staff reported as being both over-qualified and over-skilled
2017 2015 2017 2015 2017 2015 2017 2015 2017
2015
Produced by IFF Research

96
establishments, as well as the more ‘hands-on’ roles that senior staff often take on in small businesses may contribute to this variation by establishment size.
At a sectoral level, as in 2015, density of skills under-use was greatest in the Hotels and Restaurants (16%) and Arts and Other Services (13%) sectors. These sectors are typically characterised by large numbers of highly-qualified graduates working in roles with lower skills requirements.
Chapter conclusions The proportion of the UK workforce who lack full proficiency in their job role has continued on the downward trend seen since 2011, while the proportion of the workforce who have under-used skills and qualifications has increased.
Skill shortages and imbalances in the labour market can manifest themselves in different ways across different occupations and sectors of the economy. In some areas, such as the Construction sector and among Professional staff, high densities of skill-shortage vacancies in the external labour market are somewhat countered by low proportions of skills gaps among existing staff. Likewise, while internal skills deficiencies are most common in the Hotels and Restaurants sector and among Sales and Customers Service staff, these are areas of the economy where skills-related recruitment difficulties have remained low over time.
That said, internal skills deficiencies in Skilled Trades and among Machine Operatives are above the average of all occupational groups. Externally, these occupations also have the highest densities of skill-shortage vacancies, suggesting that skill-shortage issues are more pervasive across the labour market for these occupations.
Differences between sectors of the economy are also seen in the relationship between skills gaps, skills under-use and anticipated need for future upskilling. The Hotels and Restaurants sector, for instance, has the highest proportion of the workforce lacking skills but also the highest density of skills under-use suggesting the deployment of skills and qualifications of employees in this sector is particularly imbalanced. Despite having a high density of skills gaps, anticipated need for upskilling in this sector is low as recruitment is a more common response to internal skills deficiencies.
Conversely, Public Administration had one of the lowest proportions of employees reported to lack full proficiency in their role, yet employers in this sector were most likely to identify a need for upskilling of staff over the next 12 months. A similar story can be seen at an occupational level when looking at managers – they were least likely of all occupational groups to lack proficiency but the most likely to be identified as needing upskilling in the future.
Small establishments with 2 to 4 employees had the highest density of skills under-use and the lowest density of skills gaps. That said, in cases where small establishments did have internal skills deficiencies, these were often problematic. The smallest employers were most likely to

97
report that skills gaps had major impacts on their organisation’s performance and were least likely to have taken action in response.
Since 2015, there has been a decrease in the proportion of skills gaps caused by non-transient factors, suggesting that internal skills deficiencies are becoming less entrenched. However, within Primary & Utilities and Transport & Storage, both of which have lower-than-average densities of skills gaps, a smaller proportion of skills gaps in these sectors can be explained by transient factors. These sectors were among the most likely to report major impacts on their organisation’s performance and were least likely to have taken action in response. As such, internal skills deficiencies in these sectors may be considered particularly problematic in the medium to long term.
Some causes of skills gaps, such as the introduction of new products, services, technology, or working practices, represent a positive tendency for organisations to be investing in future growth. However, there has been a decrease in the proportion of skills gaps caused by these sorts of positive transformational factors.
So far, this report has discussed skills deficiencies and imbalances within organisations and across the wider labour market. The next chapter looks at the related issue of training and workforce development.

98
5. Training and workforce development
Chapter summary The previous ESS surveys in 2013 and 2015 painted a consistent picture of employer training activity, and on many training measures there has been no or little change in 2017, with the same proportion of employers providing training, and the same proportion of staff trained over the previous 12 months.
Once again, two-thirds (66%) of employers had provided training for their staff over the past 12 months, with either off-the-job training or on-the-job training provided by around half of all employers in each case (48% and 53%).
The proportion of staff trained over the past 12 months remained consistent with previous years (62%), although general increases in employment meant that the number of employees trained rose from 17.4m in 2015 to 17.9m in 2017. The total number of training days decreased from 118m days in 2015 to 114m in 2017. This means that on average each trainee received slightly fewer days training than in 2015 (6.4 days, down from 6.8 days in 2015).
Overall training expenditure has increased in real terms (i.e. taking inflation into account) by 1% since 2015, from £43.6bn to £44.2bn. The 2017 training expenditure is equivalent to £2,470 per person trained per annum, and £1,530 per employee – these figures are a slight decrease from 2015, reflecting the fact that while training expenditure has increased so has the number of staff trained (and the number employed).
There has been a decrease in the proportion of all staff being trained to nationally recognised qualifications in 2017 (11%, down from 12% in 2015), and in the actual number trained to a nationally recognised qualification in the previous 12 months, from 3.5 million in 2015 to 3.2 million in 2017.
The use of online training and e-learning has increased across all countries and sectors, and in 2017 was being used by half of all employers that train (51%, up from 45% in 2015). Annual expenditure on online training and e-learning in the previous 12 months had increased by around two fifths (40%) compared with 2015, though it still accounts for a relatively small proportion of total expenditure (£0.5bn).
Introduction Training for staff is instrumental in allowing employers to tackle skills shortages and skills gaps within their establishment, and to develop their workforce to increase productivity and expertise.
A significant policy change since the previous ESS in 2015 has been the change in apprenticeship funding, with the introduction in April 2017 of the apprenticeship levy, to be paid by all organisations with a wage bill over £3m. In England a new co-funding model for smaller

99
organisations, who will now contribute 10% of the cost of their apprentices’ training. Over time the government intends this change to, among other things, increase the number of apprenticeship starts. The impacts of these reforms on training outside of apprenticeships is also hard to predict, with some anticipating apprenticeship training to substitute other forms of training.
In addition, leaving the EU may require employers to dedicate more to the development and training of staff.
It is against this backdrop that we examine the training landscape in 2017, looking specifically at:
• Which employers funded or arranged training and development for their employees
• How many and which employees they provided training for
• The types and amount of training provided
• Employer expenditure on training39
• Reasons for not providing training and barriers to providing more training
It should be noted that many of the training questions asked in ESS 2017 were with reference to ‘the last 12 months’. Fieldwork for the survey was May to October 2017. Therefore most of the ‘last 12 months’ time period occurred before the reforms mentioned above came into effect.
Throughout the chapter the training or development provided by employers is discussed in terms of:
• Off-the-job training or development: training undertaken away from the individual’s immediate work position, whether on the employer’s premises or elsewhere.
• On-the-job training and development: training undertaken at the individual’s work position, as long as their activities would be recognised as training by staff, rather than the sort of learning by experience which could take place all the time.
39 Results for this aspect of the research are derived from the Investment in Training follow-up study with a proportion of the ESS 2017 sample (see the accompanying Technical Report for details of the methodology).

100
Incidence of training and workforce development Two-thirds (66%) of employers had provided40 training over the last 12 months, with around half providing any off-the-job training (48%) and/or on-the-job training (53%). A third of employers (35%) offered both off- and on-the-job training. Around a fifth (18%) of employers offered only on-the-job training, and a slightly smaller proportion (13%) had provided only off-the-job training.
As shown in the following chart these figures have changed little since 2013.
Figure 5.1 Training provision 2011 - 2017
As in 2015, a higher proportion of employers in Scotland provided training (71%, compared with between 62% and 66% in other nations).
The incidence of training increased with establishment size, with wide variation from half (53%) among sites with fewer than five staff, up to virtually all (96%) of those with 100 or more staff.
40 Employers were asked specifically if they had ‘arranged or funded’ any training or development for trainees at this site.
53% 52% 53% 53%47% 49% 49% 48%
65% 66% 66% 66%
2011 2013 2015 2017
Train on-the-job Train off-the-job Train
19% 17% 17% 18%
2011 2013 2015 2017
Train on-the-job only
Base: All establishments (2011: 87,572; 2013: 91,279; 2015: 91,210; 2017: 87,430)Produced by IFF Research

101
Employers in the Primary Sector and Utilities were the least likely to provide any training (53%). Training was more common among employers in Education (91%), Public Administration (90%) and Health and Social Work (87%), reflecting the fact that these are generally much larger employers. Employers in Wholesale and Retail and Hotels and Restaurants, were more likely to have offered only on-the-job training (21% and 24%, compared with 18% among all employers).
More data on the incidence of training, and how this varied by country, size and sector, and between 2011 and 2017, can be found in Tables A.5.1 and A.5.2 in Appendix A.
Number of staff trained In the previous 12 months, employers had trained 17.9m staff; a 3% increase on the 2015 figure of 17.4m. However, due to a corresponding similar sized increase in the overall size of the workforce (4%), the proportion of staff trained has remained steady at just over three-fifths of the workforce (62%, compared with 63% in 2015 and 62% in 2013).41
The proportion trained has remained consistent in the 2013-2017 period, following a significant increase from 2011 to 2013.
Table 5.1 shows the number and proportion of staff trained UK-wide, and by country and size for 2011 through to 2017.
41 The figure involves an element of over counting in that employers are asked about the number of staff trained over the last 12 months, whether or not they still work at the site. Hence someone who was trained at a site in the last 12 months but who left to join another employer who provided that person with training would be counted twice (if both employers were interviewed for the survey).

102
Table 5.1 Number and proportion of staff trained over the last 12 months, by country and establishment size
2011 2013 2015 2017
Number trained
% of staff trained
Number trained
% of staff trained
Number trained
% of staff trained
Number trained
% of staff trained
UK 14.7m 55 16.8m 62 17.4m 63 17.9m 62
Country
England 12.3m 54 14.1m 62 14.7m 63 15.2m 62
Northern Ireland 0.4m 56 0.4m 59 0.5m 64 0.4m 60
Scotland 1.4m 58 1.5m 65 1.5m 62 1.5m 62
Wales 0.7m 56 0.7m 62 0.8m 64 0.7m 58
Size
2-4 1.0m 40 1.0m 41 1.0m 43 1.1m 42
5 to 24 3.4m 53 3.5m 54 3.7m 56 3.8m 56
25-49 2.0m 59 2.1m 63 2.3m 65 2.3m 64
50-99 2.0m 59 2.3m 66 2.3m 66 2.4m 65
100-249 2.4m 60 2.7m 68 2.9m 67 3.1m 70
250+ 4.0m 54 5.2m 71 5.2m 70 5.2m 67
Base: All establishments. Base sizes are shown in Table A.1.1 in Appendix A.
Percentages are based on all employment rather than all establishments, figures therefore show the proportion of all staff within each subgroup trained over the last 12 months.
Employers in Wales trained the smallest proportion of their staff (58%), while those in England and Scotland trained the largest proportion (62% each). The proportion of staff trained in Wales has fallen since 2015 (when 64% were trained) but is a return to the approximate level seen in 2011 (56%).
As in previous years, the proportion of the workforce receiving training increased with the size of establishment, rising from 42% among those with 2 to 4 employees, to 68% of those with 100 or more staff.
As shown in Figure 5.2, two of the sectors most likely to train also trained higher than average proportions of their staff: Health and Social Work (79%) and Education (76%). Although employers in Public Administration were among the most likely to offer any training, the proportion of their workforce trained (59%) was below average. This represents a substantial drop compared with 2015 (74%), and a return to the level seen in 2011 (61%).
The sectors with the lowest proportions of staff trained were Manufacturing (49%), Construction (50%), Transport and storage (51%), and Primary Sector and Utilities (52%).

103
Figure 5.2 Proportion of staff trained by sector, 2013 - 2017
Data for the number and proportion of staff trained by sector, from 2011 to 2017, are provided in Table A.5.3 in Appendix A.
On an occupational level, as in 2015, Caring, Leisure and Other Services staff were most likely to have received training in the previous 12 months (78%), followed by those in Professional roles (71%). Least likely to have received training were Managers (49%), Machine Operatives (52%) and Administrative Staff (53%).
As shown in Figure 5.3, the proportion of staff trained by occupation has remained very consistent over time, with only a few changes: a fall in the proportion of Machine Operatives receiving training (from 57% in 2013 to down to 52% in 2017), and in the proportion of Sales Staff receiving training, from 66% in 2015 to 62% in 2017 (a return to the proportion seen in 2013). Conversely, the proportion of Elementary Staff receiving training increased from 56% in 2015 to 59% in 2017.
50%
48%
60%
52%
50%
55%
67%
60%
63%
59%
67%
76%
80%
52%
53%
57%
48%
53%
55%
74%
60%
61%
64%
71%
75%
78%
49%
50%
51%
52%
53%
58%
59%
60%
60%
62%
72%
76%
79%
Manufacturing
Construction
Transport & Storage
Primary Sector & Utilities
Information & Comms
Wholesale & Retail
Public Administration
Business Services
Arts & Other Services
Hotels & Restaurants
Financial Services
Education
Health & Social Work
2017 % stafftrained
2015 % stafftrained
2013 % stafftrained
Base: All establishments (see Table A.1.1 in Appendix A for base sizes)
Number of staff trained (2017)
3.1m
2.0m
0.7m
1.3m
0.8m
3.2m
0.8m
2.7m
0.5m
0.4m
0.7m
0.6m
1.2m
Produced by IFF Research

104
Figure 5.3 Proportion of staff trained over the last 12 months by occupation (2013 - 2017)
Training days The total number of training days provided by employers over the last 12 months was 114m, equivalent to 6.4 days per annum per trainee and 4.0 days per employee. The total training days figure represents a decrease from 2015, and the days per trainee and employee are slightly lower (see Table 5.2).
The proportion of employers providing one day of training or less per trainee increased to 14% from 11% in 2015. The proportion providing 20 days or more remained consistent (7%, in line with 8% in 2015).
Training days per trainee were broadly consistent across England (6.4), Scotland (6.5) and Wales (6.2),but was lower in Northern Ireland (5.7) which also had the lowest days per employee (3.5).
This is a similar picture to 2015 except in Wales, which has seen a 20% decrease in total training days and a corresponding reduction in training days per trainee (from 7.2 to 6.2) and per employee (4.6 to 3.6).
66%
56%
49%
71%
62%53%
59%
78%
62%
52%
59%
20%
30%
40%
50%
60%
70%
80%
90%
Managers Professionals AssociateProfs.
Admin Skilled trades Caring /leisure
services
Sales Machine Ops Elementary
Trai
nees
as
% o
f sta
ff em
ploy
ed
2013
2015
2017
Base: All establishments with staff in each occupation (excluding establishments where the numbers of staff trained is unknown; see Table A.5.4 in Appendix A for base sizes)
For simplicity figures are only shown for 2017 and 2015Produced by IFF Research

105
The pattern seen in previous years of the largest establishments offering the fewest days training per trainee continued.
Among all size bands, the number of training days per trainee has fallen or remained in line with 2015, with the largest falls recorded for the smallest establishments with fewer than five employees (from 10.1 days per trainee in 2015 to 8.9 days per trainee in 2017). The trainings days per trainee figures for employers with between 2 and 24 staff are at their lowest level in the 2011 to 2017 period.
Table 5.2 Total training and development days, and days per person trained and per employee by country and establishment size (2011 - 2017)
2011 2013 2015 2017 Training days Training days Training days Training days
Tota
l
per t
rain
ee
per
empl
oyee
Tota
l
per t
rain
ee
per
empl
oyee
Tota
l
per t
rain
ee
per
empl
oyee
Tota
l
Per t
rain
ee
Per
empl
oyee
UK 115m 7.8 4.2 113m 6.7 4.2 118m 6.8 4.2 114m 6.4 4.0 Country England 97m 7.9 4.3 95m 6.7 4.2 100m 6.8 4.3 98m 6.4 4.0 Northern Ireland
3m 6.3 3.5 3m 6.3 3.7 3m 5.6 3.6 3m 5.7 3.5
Scotland 10m 7.3 4.2 10m 6.7 4.3 10m 6.7 4.2 10m 6.5 4.1 Wales 5m 7.5 4.2 6m 7.7 4.8 5m 7.2 4.6 4m 6.2 3.6 Size 2-4 10m 10.5 4.2 11m 10.7 4.4 10m 10.1 4.3 10m 8.9 3.8 5-24 30m 9.0 4.7 29m 8.3 4.5 32m 8.5 4.7 28m 7.5 4.2 25-49 17m 8.4 4.9 15m 7.3 4.6 17m 7.7 5.0 17m 7.4 4.8 50-99 16m 8.1 4.8 15m 6.7 4.4 17m 7.5 5.0 16m 6.9 4.5 100-249 16m 6.6 4.0 17m 6.3 4.3 16m 5.6 3.8 18m 5.8 4.1 250+ 25m 6.4 3.4 26m 5.0 3.5 25m 4.8 3.4 25m 4.7 3.2
Base: All establishments that train (though ‘days per employee’ is based upon employment across all establishments). Base sizes are shown in Table A.5.5 in Appendix A.
In terms of the number of days training per employee, it remains the case that this is highest among mid-sized employers with 25 to 99 staff. The most notable change has been a fall in the days per employee among small employers with 2 to 24 staff.
By sector, Figure 5.4 shows that the highest number of training days per trainee were in Public Administration (9.6 days), Hotels and Restaurants (9.0 days), and Health and Social Work (7.1 days).
From 2011 to 2015, training days per trainee in Public Administration had fallen (from 9.9 days in 2011 to 5.2 in 2015), but in 2017 this trend has reversed, with each person trained in this

106
sector receiving on average 9.6 days of training. This has been driven by an increase in total training days in the sector (5.1m in 2015 to 7.3m in 2017) accompanied by a decrease in the total number trained.
Figure 5.4 Training days per trainee by sector, 2013 - 2017
Data by sector for the total number of training and development days, and days per person trained and per employee from 2011 to 2017 can be found in Tables A.5.6 and A.5.7 in Appendix A.
Types of training provided As in previous ESS iterations, the most common type of training provided was job specific training (84%). Three-quarters (74%) of employers had also provided health and safety or first aid training, and two-thirds (67%) had provided induction training for new staff.
The proportions providing each type of training remained consistent with 2015, in most cases dropping one percentage point, apart from management training, which fell from 37% in 2015 to 35% in 2017.
4.4
7.2
8.2
4.9
4.9
7.1
5.4
6.2
7.9
7.7
6.6
9.1
7.7
5.5
5.3
5.2
5.5
5.4
6.3
6.1
6.7
7.7
8.4
7.2
10.5
5.2
4.4
4.6
4.9
5.0
5.3
5.6
6.3
6.5
6.6
6.7
7.1
9.0
9.6
Transport & Storage
Primary Sector & Utilities
Information & Comms
Education
Financial Services
Business Services
Manufacturing
Construction
Wholesale & Retail
Arts & Other Services
Health & Social Work
Hotels & Restaurants
Public Administration
2017 days pertrainee
2015 days pertrainee
2013 days pertrainee
Base: All establishments providing training (see Table A.5.4 in Appendix A for base sizes)
Total training days (2017)
7.3m
11.9m
21.7m
5.4m
17.7m
4.0m
7.4m
18.2m
3.6m
9.9m
2.7m
1.8m
3.0m
Produced by IFF Research

107
Figure 5.5 Types of training provided over the last 12 months by employers that train (prompted)
Larger employers with 25 or more staff were more likely to have provided each of the types of training listed in Figure 5.5 in the previous 12 months, in particular health and safety or first aid training (93%), job specific training (92%) and basic induction training for new staff (91%).
Training in new technology was substantially more common among employers in Information and Communications (71%, compared with 48% on average), though they were less likely than average to offer each of the other types of training listed in Figure 5.5. Management training was offered by a greater proportion of Education employers (56%, compared with 35% overall), while supervisory training was particularly common in the Hotels and Restaurants sector (53%, compared with 35% overall).
More details of types of training provided by sector, as well as by country and establishment size, are provided in Table A.5.8 in Appendix A.
Induction training and health and safety / first aid training is often undertaken because it is a legislative requirement (rather than to develop the skills of the workforce). The UK Employer Skills Survey series has therefore asked employers what proportion of their training over the previous 12 months involved these types of training.
A third (33%) of training employers said that at least half of all their training was induction or health and safety training, indeed 12% said that all their training in the last 12 months was
Base: All establishments providing training (67,950)
36%
37%
37%
49%
66%
75%
85%
35%
35%
36%
48%
65%
74%
84%
Supervisory training
Management training
More extensive inductiontraining for new staff
Training in new technology
Basic induction trainingnew staff receive when they
start the job
Health and safety/first aidtraining
Job specific training2017
2015
Any induction training:
67% (68% in 2015)
IN 2015
11%
Only provide H&S and/or basic induction training
IN 2017
12%
Produced by IFF Research

108
induction or health and safety (equivalent to 8% of all employers); in both cases these figures represent an increase of one percentage point from 2015, and a continuation of a trend observed since 2011 of induction and health and safety comprising an increasing share of all training provided. Excluding those offering only induction or health and safety training, just under three-fifths (58%) of all employers offered training to develop skills.
Employers that trained in England and Northern Ireland were more likely to say that induction and health and safety comprised all their training (13% and 12% respectively), compared with employers in Scotland and Wales (10% each).
By sector, induction and health and safety comprising all training offered was most common in Hotels and Restaurants (21%) and Construction (18%).
A detailed breakdown of the proportion of training that was health and safety or induction in 2017 by country, and at UK level for 2011 – 2015, is provided in Table A.5.9 in Appendix A.
Training to qualifications In addition to measuring the quantity and type of training provided, the survey also sought to assess the extent to which training was designed to lead to nationally recognised qualifications – a potential proxy for quality of training.
The proportion of training employers offering training intended to lead to a nationally recognised qualification has fallen since 2015, from 47% to 45%. The number of staff on training leading to nationally recognised qualifications in the previous 12 months also fell, from 3.5m in 2015 to 3.2m in 2017. Overall just under a fifth (18%) of all staff who received training in the previous 12 months were trained towards a nationally recognised qualification, down from 20% in 2015 and continuing a downward trend seen since 2011.
The decrease in training to qualifications occurred at levels 1, 2 and 3, while the proportion of training employers using Level 4 qualifications was unchanged.

109
Table 5.3 Training to nationally recognised qualifications over the previous 12 months
All employers: Employers that train: 2011 2013 2015 2017 2017
UK UK UK UK UK England N. Ireland Scotland Wales
% % % % % % % % % Trained any staff to a qualification 30 31 31 30 45 46 44 41 51
Trained any to:
Level 1 6 6 6 5 8 8 9 8 10
Level 2 10 11 11 10 15 15 12 10 18
Level 3 11 12 12 11 17 17 14 11 19
Level 4 or above 8 10 9 9 14 14 15 13 18 Number trained to a qualification 3.3m 3.6m 3.5m 3.2m 3.2m 2.8m 0.1m 0.2m 0.2m
Of staff trained, the % trained to a qualification over the last 12 months
22 21 20 18 18 18 17 15 22
Of all employees, % trained to a qualification over the last 12 months
12 13 12 11 11 11 10 9 13
Base: Columns 1-4 ‘All establishments’, columns 5 to 9 ‘Establishments that train’; Base sizes are shown in Table A.5.5 in Appendix A.
Note: the row ‘number trained to a qualification’ shows how many individuals were undertaking training leading to nationally recognised qualifications in the 12 months prior to interview, not how many staff had achieved these qualifications.
Note also in the final row the base for the number of employees is all employers not just employers that train.
Table A.5.10 in Appendix A details the incidence and extent of provision of training leading to qualifications by size and sector.
As in previous years, employers in Wales that provided training were the most likely to have offered training designed to lead to a nationally recognised qualification (51%) and those in Scotland were the least likely (41%). The proportion of training intended to lead to nationally recognised qualifications has fallen in each of the nations since 2015, apart from Northern Ireland, where the proportion remained in line with 2015, at 44%.
By size, it was more common for larger training employers to offer training intended to lead to a nationally recognised qualification, with the proportion rising from a third (35%) of those with fewer than 5 staff to three-quarters (74%) of those with 250 or more staff. However, a greater proportion of trainees at smaller establishments were trained towards qualifications: around a quarter of trainees at establishments with 2 to 4 employees and 5 to 24 employees received such training (26% and 24% respectively), compared with 11% of trainees at the largest establishments with 250 or more staff.
Among establishments providing training, offering the opportunity to train towards nationally recognised qualifications was most common among employers in Education (66%), Health and

110
Social Work (61%) and Public Administration (56%). Other sectors more likely than average to train towards qualifications were Construction (51%), Financial Services (51%) and Hotels and Restaurants (50%). At the other end of the scale, employers that trained in Information and Communications were least likely to offer training towards nationally recognised qualifications (31%).
By sector, the proportion of employees offered training intended to lead to a nationally recognised qualification was highest in Health and Social Work (21% of all employees) and Construction (17%). Although Education and Public Administration employers were more likely to offer training towards qualifications, the proportion of employees receiving such training was below average (10% and 8% respectively). Employers in Information and Communications trained the lowest proportion of their staff towards a nationally recognised qualification (5%).
Online / e-learning and other self-learning The proportion of employers offering online training or e-learning in the previous 12 months has increased since 2015, rising from 45% of employers that trained to 51% in 2017. The proportion offering this mode of training has increased in each nation, though it remains the case that it is less common in Northern Ireland (offered by 38% of training employers, up from 34% in 2015).
As in 2015, use of online training or e-learning increased with size of establishment, from two-fifths (41%) of those with fewer than 5 staff that trained to four-fifths (80%) of those with 250 or more staff.
As illustrated in Figure 5.6, use of online training or e-learning was highest among employers that trained in Education (75%), Financial Services (73%), Health and Social Work (69%) and Public Administration (68%); it was least common among those in Primary Sector and Utilities (23%).
Although there have been increases in the use of online / e-learning in all sectors since 2015, particularly large increases have taken place in Wholesale and Retail (up 11 percentage points), Education (10 percentage points), Hotels and Restaurants and Construction (each eight percentage points), and Health and Social Work and Arts and Other Services (each up seven percentage points).

111
Figure 5.6 Use of online training or e-learning, by sector (2015 - 2017)
Around two-fifths (42%) of employers that trained offered other self-learning (i.e. besides online or e-learning) where the employee does the learning at a time of their own choosing; this is an increase from 38% in 2015. As with online or e-learning, employers that trained in Northern Ireland were the least likely to offer other self-learning (34%), and employers in England were most likely to do so (43%).
Other self-learning followed the same pattern as online / e-learning in terms of establishment size, with use increasing among training employers from 36% of those with 2 to 4 staff, up to 67% of those with 250 or more staff.
By sector, among employers providing training, other self-learning was most commonly offered by employers in Financial Services (60%), Health and Social Work (59%) and Education (56%). As with online training or e-learning, employers in Primary Sector and Utilities were least likely to have offered their staff other self-learning (24%).
Overall, around two-fifths (62%) of employers that trained had offered either online training / e-learning or other self-learning, up from 57% in 2015.
Table A.5.11 in Appendix A provides a detailed breakdown of figures on provision of online training or e-learning and other self-learning by country, size and sector.
18%
29%
30%
30%
35%
48%
41%
53%
49%
67%
62%
71%
65%
23%
33%
35%
38%
42%
52%
52%
56%
57%
68%
69%
73%
75%
Primary Sector & Utilities
Manufacturing
Transport & Storage
Construction
Arts & Other Services
Business Services
Wholesale & Retail
Information & Comms
Hotels & Restaurants
Public Administration
Health & Social Work
Financial Services
Education
2017
2015
Base: All establishments providing training in each sector (range: Public Admin 1,030 to Business Services: 11,009)Produced by IFF Research

112
Investment in training Employer expenditure on training and development over the previous 12 months was £44.2bn. As well as such elements as fees to external providers and expenditure on equipment or materials (which comprised a relatively small proportion of overall employer investment in training), a substantial proportion of this expenditure covered the wages of staff while being trained, and of staff delivering training. How total training expenditure breaks down into the constituent parts is examined in Table 5.5 later in this chapter.
The 2017 training expenditure of £44.2bn represents a 1% increase in real terms on the 2015 figure of £43.6bn and the 2011 figure of £43.8bn and is around 8% higher than in 2013 (£41.1bn)42. Note, inflation has been taken into account for the figures from earlier years43.
Employers’ total investment in training over the previous 12 months was equivalent to around £2,470 per person trained and £1,530 per employee. These figures have decreased by 1% and 2% respectively since 2015 (see Table 5.4) − reflecting increases in the number of people trained and the number employed in 2017 – though across the ESS series since 2011 the per employee and per trainee training spends have been relatively stable.
42 In 2017 a new strategy for training expenditure was implemented to improve the accuracy of the training spend estimates; this new strategy has also been retrospectively applied to the 2011, 2013 and 2015 data files, meaning some of the figures reported here for previous years differ from the original reports. A full explanation of the new cost calculation strategy, the rationale behind it, are presented in a separate Technical Report. 43 We have adjusted 2015, 2013 and 2011 training expenditure figures to reflect inflation, so that in effect they are presented in ‘2017 prices.’ The adjustments used were an uplift of 3.4% for the original 2015 data collected, 4.97461928934011% for 2013, and 10.7066381156317% for 2011. Source of inflation figures: https://www.ons.gov.uk/economy/inflationandpriceindices/datasets/consumerpriceinflation, Table 20a

113
Table 5.4 Total training expenditure and spend per person trained and per employee (2011 to 2017), in 2017 prices
2011 2013 2015 2017
Tota
l
Per t
rain
ee
Per
empl
oyee
Tota
l
Per t
rain
ee
Per
empl
oyee
Tota
l
Per t
rain
ee
Per
empl
oyee
Tota
l
Per t
rain
ee
Per
empl
oyee
£ £ £ £ £ £ £ £ £ £ £ £
UK 43.8bn 3.0k 1.6k 41.1bn 2.4k 1.5k 43.6bn 2.5k 1.6k 44.2bn 2.5k 1.5k
England 37.2bn 3.0k 1.6k 34.8bn 2.5k 1.5k 37.3bn 2.5k 1.6k 37.5bn 2.5k 1.5k
Northern Ireland 1.2bn 2.9k 1.6k 1.1bn 2.5k 1.5k 0.9bn 2.0k 1.3k 1.0bn 2.3k 1.4k
Scotland 3.8bn 2.8k 1.6k 3.4bn 2.2k 1.5k 3.3bn 2.2k 1.4k 3.7bn 2.4k 1.5k
Wales 1.6bn 2.5k 1.4k 1.9bn 2.6k 1.6k 2.1bn 2.7k 1.7k 2.0bn 2.8k 1.6k Size 2-4 5.6bn 5.9k 2.4k 5.4bn 5.5k 2.3k 5.8bn 5.7k 2.4k 6.3bn 5.6k 2.4k
5-24 12.2bn 3.6k 1.9k 12.3bn 3.5k 1.9k 13.5bn 3.6k 2.0k 13.9bn 3.6k 2.0k
25-49 6.1bn 3.1k 1.8k 6.2bn 2.9k 1.9k 6.1bn 2.7k 1.7k 6.7bn 2.9k 1.9k
50-99 5.5bn 2.7k 1.6k 5.2bn 2.3k 1.5k 6.1bn 2.7k 1.8k 5.3bn 2.3k 1.5k
100+ 14.4bn 2.2k 1.3k 11.9bn 1.5k 1.1k 12.0bn 1.5k 1.0k 12.0bn 1.4k 1.0k Sector Primary Sector & Utilities 1.6bn 5.0k 2.3k 0.8bn 2.2k 1.1k 1.3bn 3.9k 1.9k 1.1bn 2.7k 1.4k
Manufacturing 3.2bn 2.9k 1.3k 2.4bn 2.1k 1.1k 2.9bn 2.3k 1.2k 3.0bn 2.5k 1.2k
Construction 2.4bn 3.6k 1.8k 2.4bn 4.0k 1.9k 2.4bn 3.9k 2.1k 2.7bn 4.5k 2.3k Wholesale & Retail 5.0bn 2.2k 1.1k 6.0bn 2.4k 1.4k 4.8bn 1.9k 1.1k 6.4bn 2.4k 1.4k
Hotels & Restaurants 2.9bn 3.1k 1.7k 2.5bn 2.3k 1.4k 3.1bn 2.5k 1.6k 3.1bn 2.3k 1.4k
Transport & Storage 2.0bn 3.7k 1.6k 1.3bn 1.8k 1.1k 1.4bn 2.0k 1.2k 1.5bn 2.3k 1.2k
Information & Comms 1.1bn 3.0k 1.3k 1.8bn 4.1k 2.1k 1.8bn 3.3k 1.8k 1.4bn 2.6k 1.4k
Financial Services 1.4bn 2.4k 1.4k 1.2bn 1.8k 1.2k 1.5bn 2.2k 1.5k 1.3bn 1.9k 1.3k
Business Services 8.3bn 3.7k 1.9k 8.1bn 3.0k 1.8k 9.4bn 3.3k 2.0k 9.7bn 3.0k 1.8k
Public Admin 3.1bn 3.3k 2.0k 2.0bn 2.1k 1.4k 1.9bn 1.9k 1.4k 2.2bn 2.9k 1.7k
Education 5.0bn 3.0k 2.0k 5.4bn 2.7k 2.1k 4.5bn 2.3k 1.7k 3.8bn 1.9k 1.5k Health & Social Work 5.3bn 2.3k 1.5k 5.1bn 1.8k 1.4k 5.9bn 2.0k 1.5k 5.6bn 1.8k 1.4k
Arts & Other Services 2.3bn 3.5k 1.9k 2.0bn 2.6k 1.6k 2.6bn 3.4k 2.1k 2.4bn 3.0k 1.8k
Base: Establishments completing the Investment in Training study (UK 2011: 11,027; 2013: 12,522; 2015: 12,614; 2017: 12,466). Spends per trainee and employee to the nearest 10. See Table A.5.15 in Appendix A for base sizes.

114
Training spend per person trained was highest in Wales (£2,790) and lowest in Northern Ireland (£2,340); the same pattern applied to spend per employee, though by a smaller margin (£1,610 in Wales compared to £1,410 in Northern Ireland).
As in previous years, training spend per person trained and per employee decreased with employer size. Employers with 2 to 4 staff provided around four more training days per person trained than those with 100 or more employees (8.9 days per annum compared with 5.1 days) and spent four times as much per person trained (£5,650 per person trained, compared with £1,440 among employers with 100 or more staff). This pattern is likely to reflect economies of scale.
Spend per trainee per annum was highest in Construction (£4,510). Although this figure was higher than in previous years (£3,910 in 2015 and £4,000 in 2013), it is in keeping with Construction being among the top two sectors in terms of spend per trainee since 2013. Spend per trainee was lowest in Health & Social Work (£1,820), Financial Services (£1,860) and Education (£1,930).
There were quite considerable changes since 2015 within certain sectors, with large increases in total training expenditure within:
• Wholesale and Retail (an increase of 34%)
• Public Administration (an increase of 18%)
• Construction (an increase of 12%)
• Transport and Storage (an increase of 9%).
The increase in training spend in the Wholesale and Retail sector brings spend per person trained and spend per employee more in line with the all-sector average, and with results seen for this sector in 2013.
Increase in training expenditure within Public Administration is even more marked when looking at spend per employee (an increase of 23% on the 2015 figure). As noted earlier, there was a particularly large increase among Public Administration employers in the number of training days provided per employee since 2015 (from 3.8 days to 5.7 days).
Fairly substantial decreases in total training expenditure from 2015 to 2017 occurred within the following sectors:
• Primary Sector and Utilities (a 20% decrease, in contrast to an increase between 2013 and 2015)
• Information and Communications (a 20% fall)
• Financial Services (a 17% fall, with total training expenditure returning to levels seen in 2011 and 2013)

115
• Education (a 15% fall, continuing the decrease in spend per person trained and spend per employee seen since 2013)
Smaller decreases in total training expenditure since 2015 were seen in Arts & Other Services (an 8% decrease), Health & Social Work (a 5% decrease) and Hotels & Restaurants (a 1% decrease).
Tables A.5.12 and A.5.13 in Appendix A provide a breakdown of training expenditure by country, size and sector.
As shown in Table 5.5, the overall composition of training expenditure remained similar to previous years, with off-the-job training accounting for 55% of overall spend, and on-the-job training for 45%. Nor have there been significant changes in more detailed constituent elements of training spend.
Both on- and off-the-job training expenditure increased by around £0.6bn compared with 2015.
Increased investment in off-the-job training was primarily driven by increased expenditure on the management of training44 (an increase of £0.3bn from 2015 to 2017; these costs had also increased from 2013 to 2015) and fees to external providers (also a £0.4bn increase from 2015 to 2017), while the increase in on-the-job training expenditure was mostly driven by higher expenditure on the wages of those being trained.
44 This involves the internal cost of providing, administering or making policy decisions about off-the-job training

116
Table 5.5 Total training expenditure broken down by individual components (2011 to 2017)
2011 2013 2015 2017
Unweighted Base: 11,027 12,522 12,614 12,466 £ % £ % £ % £ %
Total training expenditure 43.8bn 100 41.1bn 100 43.6bn 100 44.2bn 100 Off-the-job training: total 23.6bn 54 22.5bn 55 23.9bn 55 24.3bn 55 Off-the-job training: Course-related: total
19.8bn 45 19.0bn 46 20.8bn 48 20.8bn 47
Trainee labour costs 4.9bn 11 5.1bn 12 5.3bn 12 5.1bn 12 Fees to external providers 3.0bn 7 2.5bn 6 2.3bn 5 2.5bn 6 On-site training centre 3.8bn 9 3.4bn 8 3.8bn 9 3.5bn 8 Off-site training centre (in the same company)
0.7bn 2 0.5bn 1 0.7bn 2 0.8bn 2
Training management 6.8bn 16 6.9bn 17 8.0bn 18 8.3bn 19 Non-training centre equipment and materials
0.4bn 1 0.4bn 1 0.5bn 1 0.4bn 1
Travel and subsistence 0.5bn 1 0.4bn 1 0.4bn 1 0.4bn 1 Levies minus grants -0.3bn -1 -0.2bn -1 -0.2bn -1 -0.2bn -* Off-the-job training: other (seminars, workshops etc.): total
3.8bn 9 3.4bn 8 3.2bn 7 3.4bn 8
Trainee labour costs 2.6bn 6 2.5bn 6 2.3bn 5 2.4bn 5 Fees to external providers 1.2bn 3 0.9bn 2 0.9bn 2 1.0bn 2 On-the-job training: total 20.2bn 46 18.6bn 45 19.6bn 45 19.9bn 45 Trainee labour costs 12.6bn 29 12.0bn 29 12.1bn 28 12.5bn 28 Trainers' labour costs 7.6bn 17 6.6bn 16 7.5bn 17 7.4bn 17 Base: Establishments completing the Investment in Training study * denotes a figure between -0.5% and 0%
In line with previous years, the wages of staff being trained (trainee labour costs) accounted for nearly half of all training expenditure (45%, compared with 46% in 2011, 48% in 2013 and 45% in 2015). Also in keeping with previous years, the wages / salaries of those providing on-the-job training accounted for around a sixth of total training expenditure (17%). Payments to external training providers accounted for a relatively small proportion of total expenditure (8%).
Table 5.6 summarises the breakdown of training expenditure by size and sector of establishment.

117
Table 5.6 Training expenditure by size and sector, the proportion spent on off-the-job elements, and the breakdown of total training expenditure (both on-the-job and off-the-job) by key elements
Unwtd Base
Expe
nditu
re o
n tr
aini
ng (£
)
% s
pent
on
off-t
he-
job
trai
ning
Wag
es o
f tr
aine
es
Wag
es o
f tr
aine
rs
Fees
to e
xter
nal
prov
ider
s
Oth
er
% % % % UK 12,466 £ 44.2bn % 55 45 17 8 30 Size 2-4 2,090 £ 6.3bn % 63 33 17 10 40 5-24 6,988 £ 13.9bn % 57 41 18 8 33 25-49 1,885 £ 6.7bn % 53 47 16 7 30 50-99 947 £ 5.3bn % 50 52 16 8 24 100+ 556 £ 12.0bn % 51 54 16 8 23 Sector Primary Sector & Utilities 546 £ 1.1bn % 59 40 20 9 31
Manufacturing 807 £ 3.0bn % 53 49 16 9 26 Construction 857 £ 2.7bn % 58 41 19 11 30 Wholesale & Retail 1,670 £ 6.4bn % 50 43 20 7 30 Hotels & Restaurants 1,011 £ 3.1bn % 41 46 24 4 26 Transport & Storage 534 £ 1.5bn % 48 52 15 6 26 Information & Comms 573 £ 1.4bn % 58 38 18 11 33 Financial Services 390 £ 1.3bn % 60 45 16 7 32 Business Services 2,373 £ 9.7bn % 54 43 19 10 28 Public Admin. 256 £ 2.2bn % 50 53 11 7 29 Education 895 £ 3.8bn % 62 50 11 7 32 Health & Social Work 1,478 £ 5.6bn % 63 49 12 7 32 Arts and Other Services 1,076 £ 2.4bn % 61 40 13 7 39 Base: Establishments completing the Investment in Training study As employer size increases, the proportion of total training expenditure spent on off-the-job training decreases, while the proportion spent on the wages / salaries of people being trained increases.
Health and Social Work and Education were the sectors spending the largest proportion of total training expenditure on off-the-job training (63% and 62% respectively), closely followed by Arts & Other Services (61%). As in previous years, Hotels & Restaurants spent by far the lowest proportion on off-the-job training (41%). Transport & Storage, Wholesale & Retail and Public

118
Adminstration were the only other sectors where half of total training expenditure or less was for off-the-job training (48%, 50% and 50% respectively).
For Hotels & Restaurants, the proportion of training investment spent on wages of trainers was much higher than average (24% compared with 17% overall in the UK).
There was also wide variation by sector in the proportion of total training expenditure accounted for by the wages/salaries of people being trained. This was highest for Public Administration and Transport & Storage (53% and 52% respectively), and lowest in Information & Communications (38%) and Primary Sector and Utilities and Arts and Other Services (both 40%).
The proportion of total training expenditure spent on fees to external providers varied relatively little by establishment size, although it accounted for a slightly larger proportion (10%) for the very smallest employers with fewer than five staff (seeTable 5.6). There was slightly more variation by sector, with Construction, Business Services and Information & Communications employers spending around one tenth of their training expenditure on fees to external providers, more than double the proportion among employers in the Hotels & Restaurants sector (4%).
Around £0.5bn was spent by employers in the previous 12 months on fees to FE colleges and Higher Education institutions (HEIs), equivalent to 15% of the total fees paid to external providers. These figures are unchanged from 2015. Details of the fees paid to FE colleges or to Universities or other HEIs for training is shown in Table A.5.14 in Appendix A.
In total, employers in the UK spent £0.5bn on online training or e-learning for staff45 in 2017, equating to 1% of total training expenditure. Expenditure on this type of learning has increased by around two-fifths (40%) from the £0.3bn reported in 2015. This reflects the increased use of this form of training discussed earlier.
Barriers and limits on training Approaching half of employers that trained (45%) would have liked to provide more training than they were able to over the last 12 months (similar to the 46% in 2015). This desire was more common among:
• Employers in Scotland (51%)
• Larger employers (61% of those with 250 or more employees, compared to 40% of those with fewer than 5 employees)
45 ‘Out of pocket’ costs incurred by this establishment in purchasing or developing online or e-training for example paying an external provider or consultancy

119
• Employers in the Education sector (57%), Arts and Other Services (51%) and Health and Social Work (50%). It was least common among employers in Financial Services (35%) and Primary Sector and Utilities (36%).
The two most common reasons for employers being unable to deliver as much training as they would have liked were:
• Not having the funds to do so (51%, in line with the 52% in 2015). This reason was more common among employers in Northern Ireland (58%) and Wales (57%) and establishments with 100 or more staff (also 61%).
• Being unable to spare more staff time for training (50%, in line with the 49% in 2015); this reason was more likely to be mentioned by employers in Scotland (58%).
The full list of reasons given is shown in Figure 5.7.
Figure 5.7 Reasons for not providing more training (spontaneous)
More data on the proportion of training employers that would have liked to provide more training over the previous 12 months, and the main barriers preventing them doing so, can be found in Table A.5.16 in Appendix A.
51%
50%
15%
5%
5%
4%
3%
3%
2%
2%
1%
1%
1%
3%
Lack of funds for training
Unable to spare more staff time
Hard to find time to organise training
A lack of appropriate training / qualifications
Difficulty finding flexible training providers
Staff not keen
Staff now fully proficient
Lack of good local training providers
Lack of knowledge about training opportunities
Lack of provision (e.g. courses full)
Staff turnover
Training not a management priority
Decisions taken at head office
Other
Base: All establishments that would have liked to provide more training (31,832)Produced by IFF Research

120
A third of employers (34%) chose not to provide any training or development for their staff in the previous 12 months. Figure 5.8 presents the reasons given by these employers for not training.
Figure 5.8 Reasons for not providing training in the previous 12 months (spontaneous)
The dominant reason for not providing any training was that all their staff were fully proficient and therefore training was not necessary (67%, similar to 68% in 2015).
Other less common reasons, indicative of training being treated as a lower priority than other issues, included training not being considered a priority (9%), managers lacking the time to organise training (3%), and employees being too busy to undertake training (2%) or deliver training (1%).
A lack of funds was mentioned as an issue by the same proportion of employers as in 2015 (7%); this was more common among employers in Information and Communications (11%), Education (11%) and Health and Social Work (10%), as well as among those in the charity or voluntary sector (14%) and those who are local or central government funded (12%).
Some employers mentioned supply-side factors external to the business, relating to the availability and accessibility of training: 4% mentioned a lack of relevant training, and 1% said that the courses they were interested in were not available locally.
More data on the reasons for not providing training can be found in Table A.5.17 in Appendix A.
67%
9%
7%
4%
3%
3%
2%
2%
2%
1%
1%
1%
1%
1%
1%
6%
All staff are fully proficient / no need for training
Training not considered a priority
No money available for training
No training available in relevant subject area
Any staff training arranged AND funded elsewhere
Managers lack time to organise training
Learn by experience/Learn as you go
Employees too busy to undertake training
Training not needed due to size of establishment
Employees too busy to give training
External courses are too expensive
Trained staff will be poached by other employers
Business not operating long enough
Courses interested in are not available locally
No new staff (only train new staff)
Other
Base: All establishments that did not provide any training (18,293)Produced by IFF Research

121
Figure 5.9 summarises the proportion of all employers that would have liked to have undertaken more training or, in the case of non-training employers, any training, over the previous 12 months.46 It also shows the proportion that were in ‘training equilibrium’ and had no wish to have undertaken more training. The 2017 results are all within one or two percentage points of those found in 2015.
Figure 5.9 Employer interest in undertaking more training over the last 12 months than they were able to provide
Overall around two-fifths (41%) of all employers would like to have undertaken more training over the previous 12 months, similar to the proportions in 2015 and 2013 (42%).
46 Results for non-trainers have been determined from their reasons for not training, rather than a direct question. Those answering that they had not provided any training because training was not considered to be a priority for their establishment, because all their staff were fully proficient or they had no need for training were regarded as being in skills equilibrium and having no perceived need to undertake training. Those not giving any of these reasons were classified as wanting to have undertaken training. Additionally, training employers that answered ‘don’t know’ when asked if they would have liked to train more were classified as not being in training equilibrium.
66% 34%
41% 59%In training equilibriumWanted to undertake
more training
(No desire for more training)
Among all employers….
Don’t know*
Don’t trainTrain
Of training employers….
Wanted to trainmore
Do sufficient training
45% 53% 2%
Wanted to train
No training need reported
Of non-training employers….
30% 70%
ALL EMPLOYERS
Produced by IFF Research

122
Employers in Scotland were more likely than average to have wanted to undertake more training (45%).
The likelihood of not being in ‘training equilibrium’ (i.e. wanting to have undertaken more training over the previous 12 months) increased with establishment size (from 35% among those with 2-4 staff, to 48% for those with 5-99 staff, to 61% among those with 100 or more staff).
Employers in Education (57%), Health and Social Work (53%) and Public Admin (52%) were more likely to have wanted to provide more training over the previous 12 months, while employers in Primary Sector and Utilities and Construction were least likely to have wanted to provide more (30% and 33% respectively).
Other development opportunities Among employers where no formal training had been provided in the last 12 months, most (65%) had provided other development opportunities for their staff. These covered:
• supervision to guide employees through their job role;
• providing staff with opportunities to spend time learning through watching others perform their role; or
• allowing staff to perform tasks that go beyond their strict job role and providing feedback on how well they had done.
This is equivalent to 21% of all employers providing development opportunities but not formal training. Added to the 66% training, this means only 13% provided neither formal training nor wider development opportunities.
The 2017 figures represent a slight fall in training opportunities compared with 2015 results, when 68% of non-training employers (23% of all employers) provided wider development opportunities, and 11% provided neither formal training nor wider development opportunities.
Data on how provision of wider development activities differed by country, sector and size of employer both from 2011 – 2017, and the nature of the development activity, is provided in Tables A.5.18a-b in Appendix A.
Chapter conclusions Despite recent policy changes, the 2017 training landscape has remained largely consistent with previous years. Arguably, it is too soon to see the impact of policies such as the apprenticeship levy and associated funding changes yet, as those only came into force a few months before fieldwork for this survey was carried out.

123
While the proportion of employers training and the proportion of staff being trained remained the same as previous years, there are indications that the total volume, quality, and type of training may not be being maintained.
For example, the proportion of employers where at least half of their training in the last 12 months has been induction or health and safety has continued to increase, while the number of staff being trained to nationally recognised qualifications has fallen compared with 2015. In addition, each employee is also receiving fewer days training on average. This supports findings in other reports that the volume of workforce training is in decline, despite participation levels remaining relatively constant.47
Reductions in the total volume of training is also reflected in training expenditure, with spend per trainee and per employee having also decreased since 2015. The growth of online training and e-learning may be a sign of the future of workplace training and may be driving the reduction in per employee training spend. But there is wide disparity between sectors in the use of these forms of training, with take-up much lower among employers in the Primary Sector, Manufacturing, Transport, Construction and Arts and Other Services.
47 Green, F; Felstead, A; Gallie, D; Inanc, H; Jewson, N; (2016) The Declining Volume of Workers' Training in Britain. British Journal of Industrial Relations, 54 (2) pp. 422-448. Accessed at http://discovery.ucl.ac.uk/1475084/3/Green_1475084_Training_Trends_in_Britain_rev2_final.pdf

124
6. High Performance Working
Chapter Summary High Performance Working (HPW) is a general approach to managing organisations that aims to stimulate more effective employee involvement and commitment in order to achieve high levels of performance.
Overall, 9% of employers are regarded as HPW employers; that is, they adopt at least 14 of the 21 HPW practices covered in ESS (9% England, 8% each in Scotland and Wales, and 6% in Northern Ireland). This compares to 8% in 2015.48
The proportion of HPW employers varies by employer size band, sector, ownership and whether the employer is single- or multi-site. Larger and multi-site employers are more likely to be HPW, as are employers in the education, health, public administration and financial services sectors.
Employers that adopt HPW practices are more likely to report having a vacancy, having a hard-to-fill vacancy, and having a skills shortage vacancy. This is the case across all size bands (up to employers with 250 employees), and not just a function of larger employers being more likely to be HPW. However, they report that a lower proportion of their vacancies are hard-to-fill.
HPW employers and non-HPW employers report the same proportion of their workforce as having skills gaps (5%).
HPW employers are more likely than average to report that skills gaps have an impact on their businesses (this is largely explained by employer size). However, they are not more likely than average to report a major impact and are also more likely to have taken action in response to skills gaps. HPW are also more likely than average to report having a least one member of under-utilised staff. Again, this pattern holds across size bands.
HPW employers are more active in the labour market, are more likely to identify skills issues, and are more likely to take action to improve employee skills (even when controlling for employer size). Wider evidence49 suggests that employers that make better use of skills are likely to be more productive. There is a large group of employers who are relatively close to the HPW threshold of 14 practices and could potentially be encouraged to adopt more practices.
48 There was a change to the ESS questionnaire in 2017, which means the comparable (recalculated) figure for the 2015 survey is 8% 49 See OECD (2017) Better Use of Skills in the Workplace: Why It Matters for Productivity and Local Jobs

125
Introduction Earlier chapters of this report have covered how employers of different sizes and in different sectors have experienced skills issues, and their responses to these (including funding and arranging training). This chapter looks at the extent to which employer behaviour in relation to skills and training can be understood through the types of planning, organising and performance strategies which they use. In particular, it looks at the differences between High Performance Working (HPW) and non-High Performance Working employers, focusing on vacancies, skills gaps and training responses. It covers differences between employers who adopt different types of HPW practices. It also examines skills issues for those employers who adopt between 10 and 13 HPW practices (‘Cusp’ employers), as well as for private sector, public sector, and single-site employers. It shows that HPW employers, while experiencing more vacancies, have fewer challenges in filling these; and that their understanding of their skills needs informs how they perceived and respond to skills challenges.
High Performance Working High Performance Working is ‘a general approach to managing organisations that aims to stimulate more effective employee involvement and commitment in order to achieve high levels of performance’ (Belt and Giles, 2010).
As with previous surveys, ESS 2017 included a series of questions on a set of 21 recognised HPW practices, ranging from having a business plan to providing employees with task discretion and autonomy.
The 21 HPW practices can be grouped into five ‘factors’: planning; organisation; skills; rewards; and autonomy. While the practices are distinct, they can build on and reinforce each other. Table 6.1 details the full list of practices covered in the survey.

126
Table 6.1 High Performance Working practices by factor grouping
Factor grouping Practices
Planning Training plan Annual performance review Training budget Work shadowing Business plan Equal opportunities policy Training needs assessment
Organisation Investors in People (IIP) ISO 9000 Trade union consultation Employee consultation Creates teams to work on projects Process to identify talented individuals
Skills On or off the job training Formal performance review after training
Rewards Bonus scheme Performance related pay Flexible benefits
Autonomy Task variety Task discretion Flexible working
High Performance Working practices work as a ‘bundle’. Rather than adopting each practice in isolation, employers may adopt several in order to maximise their impact. For example, employers may write a training plan and identify a training budget (both ‘planning’ practices) so that they can plan ahead and ensure their employees have the skills needed to do their jobs. Employers may also deliberately adopt practices from different factor groupings to support particular business strategies: for example, following employee consultation (an ‘organisation’ practice), they may implement a bonus scheme (a ‘reward’ practice) and flexible working (an ‘autonomy’ practice).
Figure 6.1 shows the proportion of employers adopting each individual practice as well as the proportion of employers that are HPW employers. The most commonly adopted individual practices are: having an equal opportunities policy (82% of employers); providing on- or off-the-job training (67% of employers); and holding annual performance reviews (66%).These are all practices which fall into the ‘planning’ group of practices. The most commonly-adopted practices are from a range of factor groups. However, the least commonly-adopted practices are all from the ‘organisation’ group (trade union consultation and creating teams to work on projects are both adopted by 11% of employers).

127
Figure 6.1 Proportion of employers adopting each HPW practice
There are differences by sector in terms of the most and least commonly adopted HPW practices. For the five most commonly adopted individual practices, these are relatively minor (for example, for Transport and Storage, having a training plan is in the group of five most commonly-adopted practices). However, in Wholesale and Retail, awarding performance related bonuses is one of the most-commonly adopted practices (used by 49% of sector employers compared 38% overall; see Table A.6.1 in Appendix A).
The most notable differences in the least-commonly adopted practices by sector are for Public Administration, Education and Health and Social Work, which are much less likely to award performance related bonuses (17%, 18% and 22% of sector employers respectively, compared to 38% of all employers). Employers in Education are also less likely than average to offer flexible working (25% compared to an average of 40%). Finally, 25% of Public Administration and 23% of Health and Social Work employers offer individual performance related pay, compared to 32% of all employers. This is likely to reflect the relatively high proportion of public sector employment in these sectors, with set pay scales and limited scope for additional financial compensation.
11%11%
15%15%15%15%
21%32%
36%37%38%40%
43%47%48%
51%52%
57%66%67%
82%
Creates teams to work on projects
Trade union consultation
IIP
Holds ISO9000
Employee consultation / trade union
Processes to identify high potential or talented individuals
Work shadowing/stretching/supervision
Individual performance related pay
Flexible benefits
Training budget
Awards performance related bonuses
Flexible working
Formally assess performance after training
Task discretion
Training plan
Training needs assessment
Task variety
Business plan
Annual performance review
On or off job training
Equal opportunity policy
Base: All establishments in module 1 (43,993)
g
Planning
94%
Organisation43%
Autonomy 73%
Rewards59%
Skills 67%
9% of employers are HPW
Produced by IFF Research

128
Overall, 9% of UK employers are regarded as HPW employers; that is, they adopt at least 14 of the 21 practices covered in ESS.50 There was a slight change to the ESS questionnaire in 2017 which meant that only those employers who did not provide training were asked if they offered opportunities for work shadowing. If this approach is applied to the 2015 data, the proportion of employers who were HPW in 2015 was 8%.
Establishment size and HPW status are strongly linked, with larger establishments more likely to be HPW. For example, while just 2% of all establishments have 100 or more employees, 11% of HPW establishments do; and while 75% of establishments employ fewer than 10 people, only 31% of HPW establishments are in this size band (see Table A.6.2 in Appendix A).
Similarly, multi-site establishments are more likely to be HPW than single-site establishments. While overall, 33% of establishments are part of a multi-site employer, 69% of HPW establishments are multi-site (see Table A.6.3 in Appendix A). This is likely to reflect the fact that small establishments may be part of a much larger chain, and so adopt practices determined by a central management and HR team.
Figure 6.2 shows the proportion of employers adopting different numbers of HPW practices. There is a fairly large group of employers (27% of the total) that have adopted between 10 and 13 HPW practices (HPW ‘cusp’ employers). Although they are not defined as HPW employers, they are relatively close to the threshold and could potentially be ‘nudged’ into adopting more practices.
50 By country the proportion of employers regarded as HPW employers is 9% in England, 8% each in Scotland and Wales, and 6% in Northern Ireland.

129
Figure 6.2 Number of HPW practices adopted by proportion of employers
HPW adoption varies widely by sector (see Figure 6.3). While 25% of employers in Public Administration and 18% of employers in Education are HPW, this falls to 3% of employers in both Construction and Primary Sector and Utilities. To some extent this may be explained by differences in ownership structures (private or public sector) and establishment size: public sector employers are more likely to be HPW than private sector ones, and larger employers are more likely to be HPW than smaller ones. However, 12% of establishments in Financial Services (where private sector employers are over-represented) are HPW, so the relationship is not necessarily a simple one.
1
2
4
6
7
9
8
9 9 9
8
7
6
5
4
2
1 1
<1 <1 0
1 2 3 4 5 6 7 8 9 10 11 12 13 14 15 16 17 18 19 20 21
Prop
ortio
n of
em
ploy
ers
(%)
Number of practices adopted
Not HPW 'Cusp' group HPW
Base: All establishments in Module 1 (43,993)Produced by IFF Research

130
Figure 6.3 HPW employers by sector
Analysis of HPW in private sector employers only shows a similar picture to that for all employers (this is unsurprising, as private sector employers make up 87% of the total). Analysis of single-site employers only and of public sector employers only show slightly more differences from the picture for all employers when it comes to skills issues. These differences will be discussed in the remainder of this chapter where relevant.
Clusters of adoption There are clusters of relatively high levels of adoption of individual HPW practices in sectors which have relatively high proportions of private sector establishments and small employers. For example, while the proportion of HPW employers in Information and Communications is relatively low at 5%, employers in the sector are more likely than average to have adopted each of the ‘autonomy’ practices: almost two-thirds of employers in Information and Communications use task variety (63% compared to 52% across all sectors); 63% task discretion (compared to 47%); and 56% flexible working (compared to 40%).
Financial Services has a relatively high proportion of HPW employers (12%), even though the proportion of private sector employers is higher than average (95% compared to 87% overall). The extent to which individual HPW practices are adopted by employers in Financial Services
3%
3%
5%
6%
7%
8%
8%
9%
9%
11%
12%
15%
18%
25%
Primary Sector & Utilities
Construction
Information & Communications
Arts & Other Services
Manufacturing
Transport & Storage
Business Services
Average
Wholesale & Retail
Hotels & Restaurants
Financial Services
Health & Social Work
Education
Public Admin.
Base: All establishments in Module 1 (43,993)Produced by IFF Research

131
also differs considerably from the economy-wide picture. Financial Services employers are much more likely to hold annual performance reviews (85% compared to 66% overall); provide training (82% compared to 67%); have a business plan (78% compared to 57%); and to formally assess performance after training (55% compared to 43%). Financial Services employers are also much more likely than average to award performance related bonuses (50% compared to 38% overall); offer flexible benefits (49% compared to 36%); and award individual performance related pay (43% compared to 32%).
The next section looks at variation in the groups of practices adopted by sector.
Employers with at least one HPW practice from a factor group are defined as belonging to that group. Almost all (94%) of employers adopt at least one planning practice, but just 43% adopt at least one organisation practice (see Table 6.2). There is wide variation by sector: in Primary Sector and Utilities, 38% of employers adopt at least one rewards practice, compared to 72% in Financial Services; and 24% adopt at least one organisation practice, compared to 75% in Education. This in part reflects lower overall take up of HPW practices in some sectors, such as Primary Sector and Utilities. However, some sectors have relatively high levels of adoption of HPW practices from one group, but low from another (for example, Information and Communications has high levels of adoption of autonomy practices but low levels of adoption of organisation practices). This suggests that sector culture and employee expectations may play a role in which practices are adopted: if a large proportion of employers in a sector offer performance-based pay, employees and potential recruits may come to expect it as a sector norm.

132
Table 6.2 HPW ‘factor group’ take-up by sector (% of employers)
Planning Autonomy Skills Rewards Organisation
All employers 94 73 67 59 43
Primary Sector & Utilities 87 78 53 38 24
Manufacturing 94 67 63 60 48
Construction 87 73 59 49 28
Wholesale & Retail 95 67 62 65 46
Hotels & Restaurants 96 69 66 55 45
Transport & Storage 96 64 64 56 47
Information & Communications 93 85 62 68 30
Financial Services 98 73 82 72 43
Business Services 95 77 68 66 39
Public Admin. 99 82 91 59 73
Education 100 73 92 61 75
Health & Social Work 100 75 89 54 67
Arts & Other Services 95 75 69 52 38
Base: All establishments in Module 1 (43,993) Shaded cells are those where the % of employers are +/- 10 percentage points from the group average.
The next section considers the relationship between HPW and skills shortages, across all employers and for sub-groups.
The relationship between HPW and skills shortages HPW employers are much more likely than non-HPW employers to report that they had at least one vacancy (41% compared to 18%; see Figure 6.4). This pattern holds across all size bands up to employers with 250 employees (for example, 48% of HPW employers with 25-49 employees report at least one vacancy, compared to 43% of non-HPW employers in the same size band) (see Table 6.3). Employers in the Cusp group fall between these two figures, with 29% reporting at least one vacancy (see Table A.6.4 in Appendix A).

133
Figure 6.4 HPW and skills shortages
Table 6.3 Incidence of vacancies by HPW status and size band
HPW employers 2-4 5-24 25-49 50-99 100-249 250+
Incidence of vacancies 30% 33% 48% 57% 71% 73%
Incidence of HtFVs 15% 11% 15% 17% 22% 25%
Incidence of SSVs 11% 8% 11% 13% 19% 19%
Non-HPW employers 2-4 5-24 25-49 50-99 100-249 250+
Incidence of vacancies 10% 23% 43% 54% 66% 76%
Incidence of HtFVs 5% 9% 17% 20% 23% 26%
Incidence of SSVs 4% 7% 12% 14% 17% 19%
Base: All establishments in Module 1 (43,993)
HPW employers are also more likely to report that they had at least one vacancy that is hard-to-fill (14% compared to 7%), although this pattern varies by size: HPW employers with 25 or more members of staff are less likely than non-HPW employers to report hard to fill vacancies. However, as in 2015, HPW employers’ vacancies are less likely to be hard-to-fill (HtF) than non-HPW employers (26% of vacancies compared to 37%). This pattern holds across size bands
41%
26%
16%18%
37%
25%
20%
33%
22%
Incidence of vacancies HTFVs as % of vacancies SSVs as % of vacancies
HPW
Non-HPW
All employers
Produced by IFF Research Base: All establishments in Module 1 (43,993)

134
(except for 50-99; see). This may reflect that HPW employers are savvier in their approaches to recruitment or have stronger employer brands.
HPW employers are more likely to report skills shortage vacancies (11% compared to 5%), although this pattern is only evident among the smallest employers with fewer than five employees. They also report a lower density of skills shortage vacancies (16% compared to 25% of all vacancies); and this pattern holds true in almost every size band (see Table A.6.5 in Appendix A). This may be because HPW employers are more aware of any mismatches between the skills available and those needed by their business.
Figure 6.5 Density of vacancies by HPW status and size band
The next section of the report considers skills gaps, and how they vary between groups of employers.
The relationship between HPW and skills gaps HPW employers are much more likely than non-HPW employers to report skills gaps (22% compared to 13%) (see Figure 6.6). This is largely explained by HPW employers with 250 or more employees being more likely than non-HPW employers in the same size band to report skills gaps (48% compared to 42%). However, in contrast to 2015, the proportion of employees deemed not to be fully proficient in their role is the same across both groups, at 5% (whereas in
Base: All establishments in Module 1 (43,993)Produced by IFF Research
37%
33%
26%
30%
15%
27%
49%
39%36%
29%27%
34%
25%23%
17%
21%
12%11%
36%
26%
22%
19% 18%
21%
2-4 5-24 25-49 50-99 100-249 250+ 2-4 5-24 25-49 50-99 100-249 250+
HPW employers Non-HPW employers
HtfV as % of all vacancies SSVs as % of all vacancies

135
2015 a smaller proportion of the workforce in non-HPW employers were reported as not being fully proficient).
Figure 6.6 HPW and skills gaps
The proportion of HPW Cusp employers reporting skills gaps is 17%, between the proportions for HPW and all non-HPW employers (see Table A.6.4 in Appendix A).
The proportion of employers reporting skills gaps also varies by sector within the HPW and non-HPW groups (Figure 6.7). While in every sector (except for Arts and Other Services) HPW employers are more likely to report at least one employee with a skills gap than non-HPW employers, the percentage point difference ranges from fifteen percentage points for Hotels and Restaurants to one percentage point for Arts and Other Services.
22%
5%
13%
5%
Incidence of skills gaps % of workforce with skills gaps
HPW non-HPW
Base: All establishments in Module 1 (43,993)Produced by IFF Research

136
Figure 6.7 Employers reporting skills gaps, by sector and HPW status
The proportion of employers reporting skills gaps varies by size. Larger employers are more likely to report skills gaps than smaller ones (as they have more employees). However, the proportion of staff reported as having skills gaps is relatively similar across all size bands (4% or 5%), except for the smallest employers where it is 2%. This picture holds true regardless of HPW classification (see Figure 6.8).
33%
28%
28%
26%
26%
23%
22%
22%
21%
19%
17%
15%
14%
11%
18%
17%
15%
16%
14%
18%
13%
9%
10%
9%
10%
13%
13%
12%
Hotels and restaurants
Public admin
Financial services
Education
Wholesale and Retail
Manufacturing
All
Primary Sector & Utilities
Construction
Information & Communications
Business services
Health and social work
Transport & Storage
Arts and Other Services
Non-HPW
HPW
Base: All establishments in Module 1 (43,993)Produced by IFF Research

137
Figure 6.8 Incidence and density of skills gaps, by size and HPW status
Impact of and responses to skills gaps Of employers with skill gaps, HPW employers are more likely than average to report that skills gaps have an impact on their businesses (72% compared to 66% of all employers). However, they are not more likely than average to report that skills gaps have a major impact on their business (17% of employers for both groups).
The proportion of employers reporting that skills gaps had an impact on their business varies by sector (and, within that, by HPW status; see Table 6.3). The only two sectors where HPW employers are more likely than non-HPW employers to report that skills gaps had an impact on their business are Financial Services (62% compared to 66%), and Arts and Other Services (61% compared to 66%). HPW employers in Information and Communications are most likely to say skills gaps had a major impact on their business (30% did so).
5%
20%
29%31% 31%
48%
6%
19%
31%34%
36%
42%
2.1%
4.5% 4.5% 4.1% 4.2% 5.1%
2.5%4.3% 5.0% 5.0% 5.4% 5.4%
2-4 5-24 25-49 50-99 100-249 250+ 2-4 5-24 25-49 50-99 100-249 250+HPW Non-HPW
Incidence of skills gap % of workforce with skills gap
Base: All establishments in Module 1 (43,993)Produced by IFF Research

138
Table 6.3 Impact of skills gaps by sector and HPW status (% of employers)
HPW Not HPW
Major impact
Minor impact
Any impact
Major impact
Minor impact
Any impact
Primary Sector and Utilities 18 52 70 21 47 68 Manufacturing 12 65 77 19 51 70 Construction 18 45 63 16 39 55 Wholesale and Retail 19 49 69 16 52 67 Hotels and Restaurants 21 53 74 23 52 74 Transport and Storage 16 51 67 18 48 66 Information and Communications
30 47 77 20 45 65
Financial Services 9 53 62 17 48 66 Business Services 15 64 79 17 48 64 Public Admin. 9 64 73 23 41 64 Education 13 51 64 11 53 64 Health and Social Work 16 58 74 14 44 58 Arts and Other Services 17 44 61 13 53 66
Base: all establishments in Module 1 with skills gaps (18,021)
HPW public sector employers are more likely than HPW private sector employers to report skills gap impacts (77% compared to 71%; see Table 6.4). However, HPW private sector employers are more likely to report major skills gaps impacts (18% compared to 13% of HPW public sector employers). The next section looks at the types of impact skills gaps have.
Table 6.4 Impact of skills gaps in public and private sectors (% of employers)
Private sector Public sector
HPW not HPW HPW not HPW
Major skills gap impact 18 18 13 14
Minor skills gap impact 54 48 64 50
Any skills gap impact 71 66 77 64 Base: all establishments in Module 1 with skills gaps (18,021)
The most commonly-reported impacts of skills gaps across all employers are to increase workload for other staff (reported by 56% of HPW employers and 51% of non-HPW employers), and higher operating costs (reported by 30% and 27% respectively; see Figure 6.9). The ranking of different types of impact is identical across the three groups (all employers, HPW employers, and non-HPW employers). However, a higher proportion of HPW employers than non-HPW employers report each type of impact (except for delays in developing new products and services, reported by 16% of HPW and 17% of non-HPW employers).

139
Figure 6.9 Impact of skills gaps by HPW status
The majority of employers across all groups report that they had taken steps to improve the proficiency of staff with skills gaps. The proportion ranges from 94% of HPW employers to 85% of non-HPW employers. Across all size bands, HPW employers are more likely to have taken steps in response to skills gaps than non HPW employers.
36%
56%
30%
26%
25%
22%
16%
14%
40%
51%
27%
25%
23%
21%
17%
10%
41%
51%
27%
24%
23%
21%
17%
11%
No particular problems / None of theabove
Increase workload for other staff
Have higher operating costs
Have difficulties meeting qualitystandards
Have difficulties introducing newworking practices
Lose business or orders to competitors
Delay developing new products orservices
Outsource work
All employers
Non HPW
HPW
Base: All establishments in Module 1 with skills gaps (18,021)Produced by IFF Research

140
Figure 6.10 Responses to skills gaps by HPW status
In general, HPW and non-HPW employers employ similar responses to skills gaps (see Table 6.5). For both groups, the most likely response is to increase training activity or spend, or increase or expand trainee programmes (81% of HPW employers and 66% of non-HPW employers). HPW employers are more likely to use each of the individual responses than non-HPW employers. The largest differences in percentage point terms are for implementing mentoring/buddying schemes (66% compared to 42%) and holding more staff appraisal or performance reviews (65% compared to 43%).
85%
94%
85%
5%
2%
6%
9%
3%
9%
1% 1%
All employers HPW Non HPWYes No - but have plans to No Don't know
Base: All establishments in Module 1 with skills gaps (18,021)Produced by IFF Research

141
Table 6.5 Responses to skills gaps by HPW status (% of employers)
All employers HPW Not HPW
Increase training activity / spend or increase/expand trainee programmes 67 81 66
More supervision of staff 54 65 55
More staff appraisals / performance reviews 45 65 43
Implementation of mentoring / buddying scheme 44 66 42
Reallocating work 35 46 35
Changing working practices 27 36 26
Increase recruitment activity / spend 21 33 19
Recruiting workers who are non-UK nationals 10 17 9
Other 2 2 2
Base: all establishments in Module 1 with skills gaps (18,021)
HPW and skills utilisation While 35% of all employers report having at least one member of underutilised staff (those that have both qualifications and skills that are more advanced than required for their current job role), this rises to 44% for HPW employers (and is 34% for non-HPW employers). The pattern is consistent across size bands, suggesting the differences are not a function of employer size.
Table 6.7: Proportion of employers reporting at least one member of under-utilised staff
2-4 5-24 25-49 50-99 100-249 250+
HPW employers 44% 44% 45% 45% 41% 41%
Non-HPW employers 34% 33% 36% 34% 34% 33%
Base: All establishments in Module 1 (43,993)
The relationship between HPW and training There is a clear relationship between HPW status and training, as well as training to formal qualifications. HPW establishments are much more likely to have funded or arranged training for staff over the past 12 months (96% of HPW establishments did so, compared to 64% of non-HPW establishments). This pattern holds true across all size bands (see Table A.6.6 in

142
Appendix A), suggesting that the difference is not wholly due to employer size (although the differences are proportionately larger for the smallest employers).
Training is a HPW practice, so this pattern is perhaps unsurprising. However, HPW employers are also more likely to train to qualifications (63% of those HPW employers providing training, compared to 43% of those non-HPW employers providing training). This pattern holds for all employers except the largest (those with 250 or more employees). HPW employers are more likely to train employees to Level 3 or 4 (43% of those providing training, compared to 24% of non-HPW employers providing training), and again this pattern is evident across all size bands. The proportion of employees in scope for training also differs: HPW establishments train 73% of employees, compared to 58% of employees for non-HPW establishments (although the percentage point difference is largest for very small employers and falls with each increase in size band).
In addition, HPW employers are more likely to have recruited in the 12 months prior to the survey (the difference is driven largely by HPW employers in the smaller sizebands, with fewer than 25 employees, being more likely to have recruited). As staff being new in role is one of the main reasons for requiring training, this may explain some of the difference in training behaviour between the two groups of employers.
Increasing the take-up of HPW Wider evidence suggests that HPW employers help employers make better use of workforce skills, with benefits for individuals, employers and the wider economy. Individuals are more likely to feel engaged with their work if they have the opportunity to deploy their skills, and it they feel that their voice is listened to (including through employee or trade union consultation). Better use of skills and more effective work organisation is linked to better workplace relations and higher productivity. The OECD calculate that small productivity improvements in individual businesses could result in macro-level productivity increases of between 3% and 10%.51
The group of HPW Cusp employers are those that have adopted between 10 and 13 HPW practices (see Figure 6.2 earlier in the chapter). They are a potential target audience for raising the take-up of HPW practices, and encouraging employers to think about their skills needs and responses in a more strategic way.
As shown in Figure 6.11, the proportion of non-HPW employers that are part of the Cusp group tends to increase with size. However, the proportion of employers in the Cusp group that have 250 or more employees is 41%, compared to 44% for those with between 100 and 249
51 OECD/ILO (2017), Better Use of Skills in the Workplace: Why It Matters for Productivity and Local Jobs, OECD Publishing, Paris. http://dx.doi.org/10.1787/9789264281394-en

143
employees. This may reflect the fact that half (50%) of employers in the former group are HPW, so there is less room to expand take-up of HPW in this group. The size band with the highest proportion of HPW cusp employers is those employers with 50-99 employees. Increasing the take-up of HPW practices in this group could support medium-sized employers to plan ahead for meeting skills needs, and become more responsive to the skills challenges they face.
Figure 6.11 HPW, HPW Cusp and non-HPW employers by size
The proportion of employers in the HPW Cusp group ranges from 43% in Public Administration to 12% in Primary Sector and Utilities (see Figure 6.12). Sectors with mid-low levels of HPW employers but reasonably large proportions of HPW Cusp employers include Wholesale and Retail, and Hotels and Restaurants. These might be appropriate target sectors in which to promote HPW practices.
Employers could be encouraged in the first instance to adopt those practices which are free or relatively low-cost to implement, yet provide them with a better understanding of their skills needs and workforce; as well as those which enable employees to provide their views as well as suggestions for improving the business. Such practices include developing a training plan; carrying out a training needs assessment; and setting up mechanisms for employee consultation. Employers could also be encouraged to explore a range of approaches to training and skills development, including training on-the-job, workshops led by more experienced staff, and action learning groups.
3%
11%
26%
30%
41%
50%
9%
18%
34%
45%
47%
44%
41%
27%
79%
56%
29%
23%
15%
9%
65%
2-4
5-24
25-49
50-99
100-249
250+
All employers
HPW HPW cusp Not HPW (excl. cusp group)
Base: All establishments in Module 1 (43,993)Produced by IFF Research

144
Figure 6.12 HPW, HPW Cusp and non-HPW employers by sector
Chapter conclusions The adoption of HPW working practices varies by sector and employer size, and HPW and non-HPW employers have different experiences of vacancies, skills gaps and training responses. However, while differences in employer size patterns between HPW and non-HPW employers explain much of the differences around skills gaps, and some of the differences around training behaviour, they do not fully explain them.
HPW employers are also more likely to take action (including mentoring and changing working practices) than non-HPW employers, across all employer size bands. It is likely, therefore, that they are better at recognising factors that limit their productivity or the quality of service they provide; and are better employers in terms of equipping staff with the skills they need to do their jobs well.
Promoting HPW could be a means to improving UK productivity, particularly within small- and medium-sized businesses. One approach could be to target this promotion at those businesses which are currently within the HPW ‘Cusp’ group. They are fairly close to being HPW employers and as adopters of several HPW practices already, might be receptive to implementing additional ones in order to benefit their businesses.
25%
18%
15%
12%
8%
9%
11%
6%
8%
5%
7%
3%
3%
9%
43%
48%
44%
38%
28%
27%
25%
27%
23%
24%
22%
16%
12%
27%
33%
34%
41%
50%
64%
64%
64%
67%
70%
71%
71%
81%
86%
65%
Public admin.
Education
Health & Social Work
Financial Services
Business Services
Wholesale & Retail
Hotels & Restaurants
Arts & Other Services
Transport & Storage
Information & Communications
Manufacturing
Construction
Primary Sector & Utilities
Total
HPW HPW cusp Not HPW (excl. cusp group)
Base: All establishments in Module 1 (43,993)Produced by IFF Research

145
7. Conclusions The 2017 Employer Skills Survey (ESS) is the fourth in the biennial series conducted since 2011 and continues to provide a comprehensive source of intelligence on the skills challenges that UK employers face both within their existing workforces and when recruiting.
Since the last ESS we have continued to see economic growth and job creation. The overall employment rate (75.1%) is close to record levels, and unemployment at its lowest rate since the 1970’s. This employment growth has been the main driver behind GDP growth in recent years, with gains in economic growth from improved productivity lagging far behind.
The UK continues to have a long-standing productivity gap relative to international competitors - this gap pre-dates the 2008 recession, and indeed has widened further. If productivity gains can be unlocked, and workers produce more for the same number of hours, the whole UK will benefit from increased growth, rising wages and lower prices. The drivers of productivity are many and varied but improving UK skills has been identified as a key priority for unlocking the UK’s future potential.52
Although wider economic indicators currently point towards a healthy economy, employers are operating in an uncertain environment with the UK’s withdrawal from the European Union on the horizon. The arrangements for trade and availability of labour from the EU are not yet clear.
The latest ESS report provides an important body of evidence at this key juncture. Through assessing skills challenges and understanding how they are impacting on business at the UK level, locally and sectorally, the survey allows a consideration of how prepared UK employers are for the years ahead.
We identify four skills challenges that could constrain the UK from realising its full economic potential over the coming years:
52 https://www.gov.uk/government/publications/autumn-budget-2017-documents/autumn-budget-2017#economy-and-public-finances

146
Skills challenge 1: finding the right workers Employers’ access to the right workers for their vacancies is important for economic growth. However, recruitment will naturally become more difficult as the economy grows and employment rates increase. Whether employers have vacancies because they are growing, or because they are replacing the loss of personnel, when employers fail to recruit it is likely to impact on their ability to both satisfy existing work as well as grow. Where employers reported in the survey that they cannot find workers with the right skills, they cite increased workloads for other staff, a loss of business to competitors, and delays in the development of new products and services.
Unsurprisingly given the economic backdrop, the level of recruitment activity reported by employers has increased since 2015 by 9%, with one in five employers (20%) having vacancies at the time of fieldwork. So are employers struggling to find the right workers?
The recruitment challenges reported by employers remain broadly the same. In line with previous years, a third of vacancies (33%) were hard to fill. Skills shortage-vacancies, where applicants are lacking the skills, qualifications, or experience required by employers, increased in volume by 8%, but this broadly mirrored the increase in vacancies. As a result - and perhaps contrary to expectations in the current context given lower unemployment rates and indications
Finding the right workers
Optimising and improving existing skills
Expanding employee training
Improving workplace practices to drive performance

147
of lower net migration53 − the density of skill-shortage vacancies remained unchanged from 2015. Overall 22% of vacancies were hard to fill because applicants lacked the right skills.
Underneath the headline UK picture, wide variations in skills shortage vacancies exist by sector, occupation and locality. For example, whilst employers in Birmingham reported struggling to fill 32.7% of their vacancies dues to skills shortages, only 4.7% of vacancies in Leeds were skills shortage vacancies. These differences highlight the need for locally targeted solutions and an understanding of local skills requirements, which is the aim of the new local Skills Advisory Panels announced in the UK government’s ‘Industrial Strategy: Building a Britain fit for the future’.
Further, little improvement has been made in the sectors and occupations that have proved to have persistent concentrations of skills shortages over time. Construction for example continues to report acute recruitment issues, with 36% of vacancies proving hard to fill due to a lack of available skills. Similarly, Skilled Trades occupations continue to have the highest density of skills shortage vacancies. We know however from the 2016 UK Employer Perspectives Survey that the pipeline of talent into businesses and entry routes into employment could be improved, employers are limiting the number and range of recruitment channels they use, with word of mouth still dominating.
Recent policy reforms, including the technical education reforms in England, apprenticeship policy across the nations, and the new national retraining fund in England focusing on Construction should help to address these shortages. However, in the context of uncertainty over future labour supply from the EU, and overall training levels remaining static over recent years (see below), questions remain over whether skills shortage vacancies will act as a brake on growth and productivity. Employers therefore have an important role to play, both in terms of ensuring their jobs remain competitive (e.g. through pay, and conditions etc.) as well as developing a pipeline of talent through improved recruitment practices, training, apprenticeships, and offering work experience and placements.
Skills challenge 2: optimising and improving existing skills A deficiency of skills in the labour market can appear not only through recruitment challenges, but also through skills gaps within the existing workforce. A job may be filled by an employee who lacks all the skills required. This can be for a range of reasons - some persistent and problematic, others more temporary or associated with healthy business change and innovation.
Regardless of the causes of skill gaps, they can have a major impact, particularly where persistent, including: increasing workloads for existing staff, higher operating costs, difficulties
53 ONS Migration Statistics Bulletin, 2017.

148
meeting quality standards, introducing new working practices, and a loss of business to competitors.
The overall picture for 2017 is one of skills gaps continuing to fall among existing employees. While on the one hand this may be viewed as a positive trend with fewer employees operating below the proficiency required, some skills gaps result in employers pursuing more ambitious business strategies. As in previous years, the majority of skills gaps continue to be transient (e.g. training has been started but not completed), however there has been a fall in other factors. In particular, there have been falls in the proportion of skills gaps caused by more transformational factors such as introducing new products and services, introducing new technology, and introducing new working practices.
Alongside this downward trend in skills gaps, the proportion of employers reporting under-use of their employees’ skills and qualifications has risen. Coupled with this, employers’ projected upskilling requirements are reducing. Employers were asked whether they anticipated their staff would need to acquire new skills over the next 12 months. Overall, the proportion of employers anticipating they would need to upskill their staff fell 10 percentage points from 72% in 2013 to 62% in 2017.
It may be that employers are finding it more difficult to anticipate their upskilling requirements in the current context of uncertainty, or more broadly that fewer businesses are planning changes for the future. Rising levels of under-utilisation among employees also suggests there is latent potential among a pool of skilled labour that could perhaps be drawn upon by employers in the future.
While the proportion of vacancies proving difficult to fill due to skills shortages is currently no worse than two years ago, the survey found rising hard-to-fill vacancies for non-related skills reasons. Employers may find they need to look increasingly to upskilling and optimising the skills of the staff they have, rather than relying on recruitment if they are to be fit for the future.
Skills challenge 3: expanding employee training Key challenges have been identified around tackling skills shortages and skills gaps, as well as the need for more employers who are ambitious and will better optimise the skills of their staff. Training for staff is crucial in enabling employers to address these issues, allowing them to develop their workforce and to increase productivity. Employer-provided training will also take on new significance if there is less recruitment of EU nationals.
This backdrop points to the need for employers to step-up employee training, and a range of recent policy initiatives have been introduced to support employers to meet this challenge. A significant policy change has been the introduction of the apprenticeship levy. The government intends this change to increase apprenticeship starts. But some anticipate a risk that it will

149
substitute apprenticeships for other forms of training and skill development.54 Another key policy is the announcement in the Industrial Strategy of a new national retraining scheme in England, which will aim to “drive up adult learning and retraining”.
It is however too soon to see the impact of these new policies on the training landscape and the relationship to employers’ skills challenges. So what are current employers doing in relation to training?
Overall, the training landscape remains largely consistent with previous years and follows the story seen in the previous two iterations of ESS, the same proportion of employers provide training for their staff (66%), and the proportion of staff trained remains unchanged (62%). However, there are indications that the volume and quality of training may not be being maintained.
Each staff member trained is receiving fewer days training on average compared to 2015, falling from 6.8 to 6.4 days on average. There has also been a fall in both the proportion of staff being trained to a national recognised qualification (45%, down from 47% in 2015), and the number of employees being trained to a nationally recognised qualification (3.2 million, down from 3.5 million). At the same time, the proportion of employers where all or at least half of training is induction or health and safety has increased again, and the use of online training and e-learning has increased across all countries and sectors, now being offered by half of all employers (51%, up from 45% in 2015). In real terms (i.e. adjusted for inflation), there has been a fall in investment in training per employee, from £1,570 in 2015 to £1,530 in 2017.
At a superficial level, it is positive that the proportion of employers training, and the proportion of employees being trained, has held steady rather than declining during a time of peak employment growth. But it is concerning that the volume of training and training spend per employee has reduced. With some persistent pockets of reported skills shortage, employers’ aspirations to upskill their staff falling, and measures of training quantity (and potentially quality) abating, important questions remain over whether the UK’s employers are ready to raise their game and improve productivity through tackling existing skills challenges.
Skills challenge 4: improving work place practices to drive performance The final skills challenge facing UK’s employers is improving the work place practices deployed by employers. In particular, promoting High Performance Working Practices (HPWPs) could be used as a means to improving UK productivity, particularly within small- and medium-sized businesses. High Performance Working is ‘a general approach to managing organisations that
54 https://www.gov.uk/government/uploads/system/uploads/attachment_data/file/562445/The_apprenticeship_levy_how_will_employers_respond.pdf

150
aims to stimulate more effective employee involvement and commitment in order to achieve high levels of performance’ (Belt and Giles, 2010).
This year’s survey identifies that, as with many other indicators on the survey, the proportion of employers adopting HPWPs appears to have stagnated over time. HPW employers (those who adopt at least 14 of 21 practices) are more likely to be active in the labour market through recruitment. They are more likely to experience vacancies, hard- to-fill vacancies and skills shortage vacancies than non-HPW employers. These differences are apparently across all size bands, and so are not just a function of difference employer size profiles. However, a lower proportion of their HPW employers’ vacancies are hard-to-fill, perhaps because they understand the skills available to them when recruiting and are also more willing to provide training.
HPW employers are more likely to train staff, more likely to train to qualifications, and more likely to train to higher levels than non-HPW employers. This pattern holds true across all size bands, suggesting that the difference is not wholly due to employer size (although the differences are proportionately larger for the smallest employers). They are also more likely to take action (including mentoring and changing working practices) than non-HPW employers. It is likely, therefore, that they are better at recognising factors that limit their productivity or the quality of service they provide; and are better employers in terms of equipping staff with the skills they need to do their jobs well.
One approach could be to consider how to support or nudge businesses who are on the cusp of being HPW employers to further raise their game and adopt additional workplace practices that would benefit their businesses. These employers may be more receptive to altering their workplace practices than the large proportion of employers who deploy few or no HPWPs.

151
Appendix A: Supplementary tables
Chapter 1: Introduction Table A.1.1 Unweighted base sizes (i.e. number of completed interviews) for all establishments, by country, size and sector (2011 – 2017)
Source: Employer Skills Survey (2017)
2011 2013 2015 2017 UK 86,522 91,279 91,210 87,430 Country England 74,156 75,255 75,129 71,527 Northern Ireland 3,921 4,014 4,019 3,973 Scotland 2,487 6,014 6,035 6,017 Wales 5,958 5,996 6,027 5,913 Size 2 to 4 17,905 19,058 20,527 17,132 5 to 24 47,770 51,565 49,584 46,936 25 to 49 10,239 10,947 11,657 12,526 50 to 99 5,712 5,584 5,836 6,456 100-249 3,270 2,938 2,689 3,302 250+ 1,626 1,187 917 1,078 Sector Primary Sector & Utilities 2,512 4,693 4,844 4,905 Manufacturing 7,653 7,422 6,827 6,578 Construction 6,656 7,202 7,474 6,846 Wholesale & Retail 15,163 17,287 16,126 14,514 Hotels & Restaurants 8,421 8,888 8,920 8,478 Transport & Storage 4,685 4,182 4,680 4,075 Information & Communications 3,125 2,708 4,256 3,976 Financial Services 1,853 2,330 2,549 2,678 Business Services 14,297 14,011 13,143 13,713 Public Admin. 1,584 942 947 1,162 Education 5,422 5,796 5,515 5,525 Health & Social Work 8,067 8,460 8,556 7,952 Arts & Other Services 7,164 7,358 7,373 7,028

152
Table A.1.2 Unweighted base sizes (i.e. number of completed interviews) for English establishments, by region, size and sector
Source: Employer Skills Survey (2017)
2011 2013 2015 2017 England 74,156 75,255 75,129 71,527 Size 2 to 4 15,457 14,875 16,346 13,371 5 to 24 41,136 42,696 41,013 38,447 25 to 49 8,760 9,259 9,860 10,571 50 to 99 4,790 4,699 4,882 5,461 100-249 2,691 2,463 2,263 2,757 250+ 1,322 990 765 920 Sector Primary Sector & Utilities 1,987 3,285 3,649 3,761 Manufacturing 6,667 6,302 5,703 5,498 Construction 5,485 5,980 6,334 5,622 Wholesale & Retail 13,060 14,321 13,126 11,841 Hotels & Restaurants 7,202 7,314 7,274 6,917 Transport & Storage 4,041 3,419 3,797 3,317 Information & Communications 2,820 2,324 3,741 3,436 Financial Services 1,452 1,886 2,121 2,195 Business Services 12,656 12,000 11,158 15,582 Public Admin. 1,214 696 721 859 Education 4,582 4,756 4,549 4,516 Health & Social Work 6,872 6,882 6,963 6,315 Arts & Other Services 6,118 6,090 5,993 5,668

153
Table A.1.3 Unweighted base sizes (i.e. number of completed interviews) for Northern Irish establishments, by size and sector
Source: Employer Skills Survey (2017)
2011 2013 2015 2017 Northern Ireland 4,004 4,014 4,019 3,937 Size 2 to 4 989 1,227 1,168 1,097 5 to 24 2,265 2,189 2,236 2,182 25 to 49 327 307 321 368 50 to 99 185 167 191 220 100-249 105 83 72 88 250+ 50 41 31 18 Sector Primary Sector & Utilities 101 193 122 188 Manufacturing 343 310 330 252 Construction 364 259 246 319 Wholesale & Retail 724 866 859 782 Hotels & Restaurants 334 385 415 384 Transport & Storage 195 184 201 155 Information & Communications 95 98 88 117 Financial Services 137 112 93 122 Business Services 509 491 507 499 Public Admin. 105 55 49 54 Education 285 292 267 255 Health & Social Work 417 408 382 461 Arts & Other Services 312 361 460 385
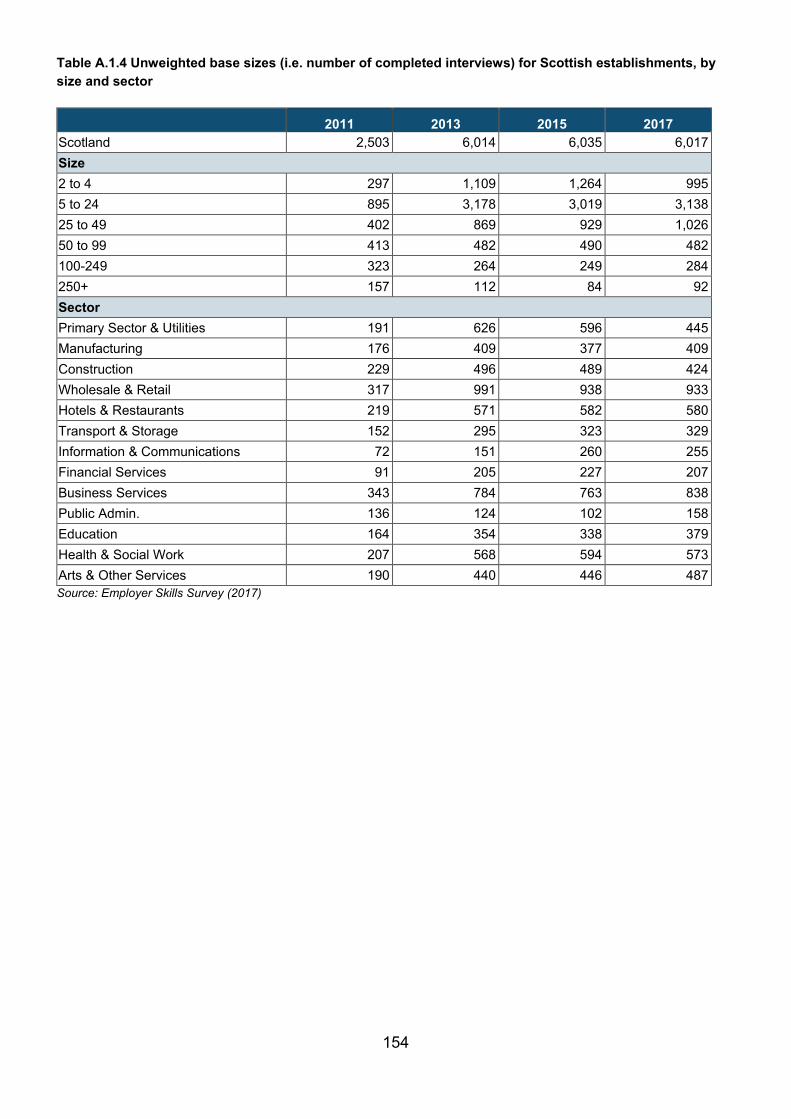
154
Table A.1.4 Unweighted base sizes (i.e. number of completed interviews) for Scottish establishments, by size and sector
Source: Employer Skills Survey (2017)
2011 2013 2015 2017 Scotland 2,503 6,014 6,035 6,017 Size 2 to 4 297 1,109 1,264 995 5 to 24 895 3,178 3,019 3,138 25 to 49 402 869 929 1,026 50 to 99 413 482 490 482 100-249 323 264 249 284 250+ 157 112 84 92 Sector Primary Sector & Utilities 191 626 596 445 Manufacturing 176 409 377 409 Construction 229 496 489 424 Wholesale & Retail 317 991 938 933 Hotels & Restaurants 219 571 582 580 Transport & Storage 152 295 323 329 Information & Communications 72 151 260 255 Financial Services 91 205 227 207 Business Services 343 784 763 838 Public Admin. 136 124 102 158 Education 164 354 338 379 Health & Social Work 207 568 594 573 Arts & Other Services 190 440 446 487

155
Table A.1.5 Unweighted base sizes (i.e. number of completed interviews) for Welsh establishments, by size and sector
Source: Employer Skills Survey (2017)
2011 2013 2015 2017 Wales 5,958 5,996 6,027 5,913 Size 2 to 4 1,162 1,847 1,749 1,669 5 to 24 3,474 3,229 3,316 3,169 25 to 49 750 512 547 561 50 to 99 324 236 273 293 100-249 151 128 105 173 250+ 97 44 37 48 Sector Primary Sector & Utilities 233 589 477 511 Manufacturing 467 401 417 419 Construction 498 467 405 481 Wholesale & Retail 1,062 1,109 1,203 958 Hotels & Restaurants 666 618 649 597 Transport & Storage 297 284 359 274 Information & Communications 138 135 167 168 Financial Services 173 127 108 154 Business Services 789 736 715 794 Public Admin. 129 67 75 91 Education 391 394 361 375 Health & Social Work 571 602 617 603 Arts & Other Services 544 467 474 488
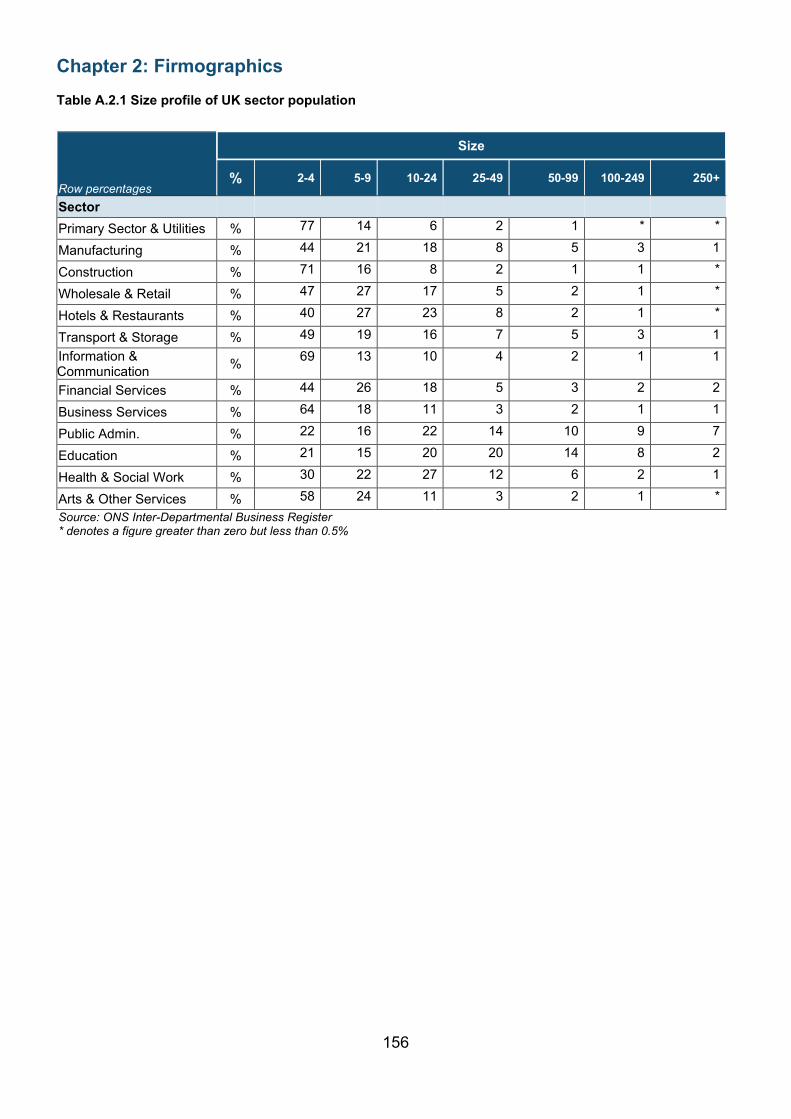
156
Chapter 2: Firmographics Table A.2.1 Size profile of UK sector population
Row percentages
Size
% 2-4 5-9 10-24 25-49 50-99 100-249 250+
Sector Primary Sector & Utilities % 77 14 6 2 1 * *
Manufacturing % 44 21 18 8 5 3 1
Construction % 71 16 8 2 1 1 *
Wholesale & Retail % 47 27 17 5 2 1 *
Hotels & Restaurants % 40 27 23 8 2 1 *
Transport & Storage % 49 19 16 7 5 3 1 Information & Communication % 69 13 10 4 2 1 1
Financial Services % 44 26 18 5 3 2 2
Business Services % 64 18 11 3 2 1 1
Public Admin. % 22 16 22 14 10 9 7
Education % 21 15 20 20 14 8 2
Health & Social Work % 30 22 27 12 6 2 1
Arts & Other Services % 58 24 11 3 2 1 * Source: ONS Inter-Departmental Business Register * denotes a figure greater than zero but less than 0.5%

157
Table A.2.2 Classification of UK establishments, by country, size and sector
‘*’ denotes a figure larger than zero but smaller than 0.5 Source: Employer Skills Survey (2017)
Row percentages Unwtd. Base:
Priv
ate
sect
or
Third
sec
tor
Publ
ic s
ecto
r
Sing
le s
ite
Mul
ti-si
te
UK 87,430 % 87 9 4 67 33 Country England 71,527 % 88 8 3 67 33 Northern Ireland 3,973 % 82 12 7 72 28 Scotland 6,017 % 82 12 6 60 40 Wales 5,913 % 86 7 6 68 32 Size 2 to 4 17,132 % 90 8 1 78 22 5 to 24 46,936 % 86 9 4 58 42 24 to 49 12,526 % 78 10 12 44 56 50 to 99 6,456 % 70 10 19 41 59 100 to 249 3,302 % 68 12 19 34 66 250+ 1,078 % 68 11 21 32 68 Sector Primary Sector & Utilities 4,905 % 98 1 1 88 12 Manufacturing 6,578 % 99 1 * 79 21 Construction 6,846 % 99 * * 90 10 Wholesale & Retail 14,514 % 96 4 * 49 51 Hotels & Restaurants 8,478 % 92 7 1 60 40 Transport & Storage 4,075 % 96 2 2 67 33 Information & Communications 3,976 % 97 2 * 85 15 Financial Services 2,678 % 95 4 1 66 34 Business Services 13,713 % 95 4 1 72 28 Public Admin. 1,162 % 9 4 86 44 56 Education 5,525 % 36 24 40 64 36 Health & Social Work 7,952 % 40 46 13 44 56 Arts & Other Services 7,028 % 66 28 6 70 30

158
Chapter 3: Recruitment and SSVs
Table A.3.1 Incidence, number and density of vacancies for all establishments, by country, size and sector
Base: all establishments
Densities are based on skills gaps as a proportion of all employment within each occupation by sector, rather than the number of establishments with skills gaps.
% of establishments
with at least one vacancy
(incidence)
Number of vacancies
(rounded to nearest 1,000)
Vacancies as a % of
employment (density)
Average (mean)
vacancies per establishment
with vacancies
Unwtd. base % %
UK 87,430 20 1,007,000 3.5 2.7 Country England 71,527 20 873,000 3.6 2.7 Northern Ireland 3,973 16 23,000 3.1 2.6 Scotland 6,017 20 75,000 3.1 2.5 Wales 5,913 17 36,000 3.0 2.4 Size 2 to 4 17,132 11 153,000 5.8 1.6 5 to 24 46,936 24 281,000 4.1 1.8 25 to 49 12,526 44 127,000 3.5 2.7 50 to 99 6,456 55 125,000 3.5 4.0 100-249 3,302 67 137,000 3.1 6.6 250+ 1,078 75 185,000 2.4 18.1 Sector Primary Sector & Utilities 4,905 8 18,000 2.3 1.9 Manufacturing 6,578 20 58,000 2.4 2.8 Construction 6,846 13 39,000 3.2 1.9 Wholesale & Retail 14,514 19 143,000 3.1 2.1 Hotels & Restaurants 8,478 27 122,000 5.7 2.7 Transport & Storage 4,075 20 38,000 2.9 3.2 Information & Communications 3,976 17 45,000 4.4 3.0 Financial Services 2,678 19 32,000 3.4 3.1 Business Services 13,713 18 212,000 3.9 2.8 Public Admin. 1,162 35 45,000 3.5 6.8 Education 5,525 31 52,000 2.0 2.6 Health & Social Work 7,952 30 148,000 3.8 3.5 Arts & Other Services 7,028 21 55,000 4.1 1.9

159
Table A.3.2 Incidence, number and density of vacancies by occupation (2015-2017)
Base: Column 1: all establishments with vacancies; Column 2: all establishments; Column 3: all establishments with vacancies in each occupation.
Column 4 percentages are based on all employment, rather than all establishments; figures therefore show the number of vacancies as a proportion of all employment in each occupation
% of establishments with vacancies
who have a vacancy in occupation
Number of vacancies
Vacancies as a % of employment
(density)
Unwtd. base Rounded to
nearest 1,000
Unwtd. base %
2015 24,306 Managers 5 25,000 3,492 0.5 Professionals 14 130,000 1,518 3.8 Associate professionals 18 131,000 1,473 7.9 Administrative / clerical staff 13 89,000 4,301 2.6 Skilled trades occupations 16 87,000 3,142 4.5 Caring, leisure and other services 15 136,000 2,308 4.6
Sales and customer services 13 98,000 4,540 2.8 Machine operatives 6 61,000 1,813 2.6 Elementary staff 17 131,000 4,533 3.5 2017 25,114 Managers 5 30,000 3,437 0.6 Professionals 14 131,000 1,838 3.6 Associate professionals 19 148,000 1,592 7.4 Administrative / clerical staff 14 80,000 4,297 2.2 Skilled trades occupations 16 98,000 3,006 4.9 Caring, leisure and other services 14 126,000 2,138 4.7
Sales and customer services 15 125,000 4,458 3.3 Machine operatives 7 64,000 1,895 2.7 Elementary staff 17 154,000 4,530 3.9

160
Table A.3.3 Incidence, number and density of skills-shortage vacancies (SSVs) by country, size and sector
Base: Column 1 and 2: all establishments; Column 3: all establishments with vacancies
Percentages in Column 3 are based on all vacancies, rather than all establishments with vacancies; figures therefore show the proportion of vacancies caused by skill shortages
% of establishments
with a skill-shortage vacancy
Number of skill-shortage
vacancies % of vacancies which
are SSVs
Unwtd. base % Rounded to
nearest 1,000
Unwtd. base %
UK 87,430 6 226,000 25,111 23 Country England 71,527 6 194,000 21,033 22 Northern Ireland 3,973 5 5,000 855 21 Scotland 6,017 6 18,000 1,827 24 Wales 5,913 6 10,000 1,399 27 Size 2 to 4 17,132 4 48,000 1,589 31 5 to 24 46,936 7 74,000 11,506 27 25 to 49 12,526 11 28,000 5,507 22 50 to 99 6,456 14 25,000 3,483 20 100-249 3,302 18 23,000 2,204 17 250+ 1,078 20 29,000 825 16 Sector Primary Sector & Utilities 4,905 3 6,000 591 33 Manufacturing 6,578 9 17,000 1,810 29 Construction 6,846 5 14,000 1,292 36 Wholesale & Retail 14,514 4 26,000 3,869 18 Hotels & Restaurants 8,478 7 21,000 3,366 17 Transport & Storage 4,075 6 11,000 973 30 Information & Communications 3,976 6 11,000 993 25
Financial Services 2,678 5 6,000 539 18 Business Services 13,713 6 52,000 3,911 24 Public Admin. 1,162 7 6,000 360 14 Education 5,525 9 11,000 2,156 22 Health & Social Work 7,952 7 32,000 3,353 22 Arts & Other Services 7,028 7 14,000 1,901 25

161
Table A.3.4 Density of skill-shortage vacancies, by country, size and sector (2011 - 2017)
Base: all establishments with vacancies.
Percentages are based on all vacancies, rather than all establishments with vacancies; figures therefore show the proportion of vacancies caused by skill shortages.
Notes: The number of skill-shortage vacancies has been rounded to the nearest 100.
% of vacancies which are SSVs 2011 2013 2015 2017 Unwtd. Unwtd. Unwtd. Unwtd. base % base % base % base %
UK 17,093 16 18,959 22 24,306 23 25,114 22 Country England 14,749 15 15,894 22 20,697 23 21,033 22 Northern Ireland 520 21 550 19 713 14 855 21 Scotland 729 15 1,499 25 1,619 24 1,827 24 Wales 1,095 18 1,016 20 1,277 24 1,399 27 Size 2-4 1,389 21 1,403 30 1,869 29 1,589 31 5-24 7,869 17 8,969 26 11,864 26 11,506 27 25-49 2,972 18 3,653 21 4,992 21 5,507 22 50-99 2,241 11 2,435 19 3,159 20 3,483 20 100-249 1,698 14 1,737 19 1,759 20 2,204 17 250+ 924 8 762 15 663 18 825 16 All sectors Primary Sector & Utilities 2,512 21 374 24 451 26 591 33 Manufacturing 1,460 24 1,347 30 1582 30 1,810 29 Construction 575 18 706 23 1173 35 1,292 36 Wholesale & Retail 2,549 14 2,983 18 3753 20 3,869 18 Hotels & Restaurants 2,078 15 2,447 19 3420 19 3,366 17 Transport & Storage 4,685 12 565 25 981 37 973 29 Information & Communications 3,125 15 667 27 1012 27 993 25 Financial Services 331 17 398 10 472 21 539 18 Business Services 2,945 17 3,147 28 3859 26 3,911 24 Public Admin. 402 10 283 22 276 9 360 14 Education 1,487 10 2,062 12 2073 16 2,156 22 Health & Social Work 1,992 10 2,375 22 3152 21 3,353 22 Arts & Other Services 1,578 21 1,605 24 2102 21 1,901 25

162
Table A.3.5 Number of skill-shortage vacancies by occupation within sector (corresponds with Table 3.1 in main report)
Base: all establishments with vacancies for each occupation within sector ** denotes a base size of fewer than 30 establishments
Skill
ed T
rade
s
Mac
hine
Ope
rativ
es
Prof
essi
onal
s
Car
ing,
Lei
sure
and
O
ther
Ser
vice
s
Ass
ocia
te
Prof
essi
onal
s
Man
ager
s
Adm
inis
trat
ive
and
Cle
rical
Sale
s an
d C
usto
mer
Se
rvic
e
Elem
enta
ry
Occ
upat
ions
% % % % % % % % %
UK 41500 19600 39500 30400 33800 5600 11600 18800 21400
Sector
Construction 8200 1500 1100 ** 700 400 600 300 1100
Primary Sector & Utilities 600 2000 200 400 400 100 100 ** 1800
Transport & Storage 1000 7900 300 ** 200 100 400 400 800
Manufacturing 6500 2900 2300 ** 1900 400 700 900 600
Arts & Other Services 900 ** 700 7000 1800 300 600 800 1700
Information & Communications 500 ** 4800 ** 3900 200 300 900 100
Business Services 7100 2800 13300 1100 12400 1700 5800 2500 3300
Education 200 ** 3900 4800 1300 <100 300 ** 300
Health & Social Work 200 <100 10800 15900 2300 300 500 1100 400
Wholesale & Retail 7300 1500 500 300 2500 1100 700 9900 1700
Financial Services ** ** 100 ** 3600 100 700 1100 **
Hotels & Restaurants 7700 400 ** 800 300 800 500 800 9300
Public Admin. 1300 ** 1300 <100 2400 100 400 ** **

163
Table A.3.5a Unweighted base sizes for Table 3.1 in main report
** denotes a base size of fewer than 30 establishments
Skill
ed T
rade
s
Mac
hine
Ope
rativ
es
Prof
essi
onal
s
Car
ing,
Lei
sure
and
O
ther
Ser
vice
s
Ass
ocia
te
Prof
essi
onal
s
Man
ager
s
Adm
inis
trat
ive
and
Cle
rical
Sale
s an
d C
usto
mer
Se
rvic
e
Elem
enta
ry
Occ
upat
ions
% % % % % % % % %
UK 3,919 1,995 4,261 4,225 4,584 1,426 3,591 3,372 4,864
Sector
Construction 672 150 142 ** 184 74 187 46 131
Primary Sector & Utilities 85 142 39 51 57 38 69 ** 203
Transport & Storage 63 485 43 ** 79 38 186 101 184
Manufacturing 607 435 277 ** 440 116 224 166 191
Arts & Other Services 131 ** 161 713 435 145 393 105 302
Information & Communications 76 ** 414 ** 415 33 128 122 32
Business Services 432 196 1,186 184 1,333 211 818 253 305
Education 53 ** 915 998 264 45 275 ** 246
Health & Social Work 107 41 811 2,025 490 161 339 72 261
Wholesale & Retail 551 329 119 ** 400 253 320 2,225 494
Financial Services ** ** 47 ** 249 38 255 70 **
Hotels & Restaurants 1,108 143 ** 177 90 242 246 161 2,485
Public Admin. 32 ** 89 32 148 32 151 ** **

164
Table A.3.6 Skills lacking among applicants, overall and by country (prompted)
Base: All establishments with skill-shortage vacancies in each occupation – up to two occupations followed up Percentages are based on all skill-shortage vacancies, rather than all establishments with skill-shortage vacancies; proportions therefore show the percentage of skill-shortage vacancies within each occupation caused by lack of each skill.
UK
Engl
and
Nor
ther
n Ire
land
Scot
land
Wal
es
Unweighted base 7,229 5,975 251 552 451 % % % % % Technical and practical skills Specialist skills or knowledge needed to perform the role 65 65 69 59 66 Solving complex problems requiring a solution specific to the situation 41 41 40 34 45 Knowledge of products and services offered by your organisation 38 38 38 39 45 Knowledge of how your organisation works 32 32 34 33 41 Computer literacy / basic IT skills 23 23 20 20 29 Reading and understanding instructions, guidelines, manuals or reports 33 33 32 26 38 Adapting to new equipment or materials 22 22 23 22 32 Writing instructions, guidelines, manuals or reports 28 27 30 26 34 More complex numerical or statistical skills and understanding 27 27 36 22 31 Advanced or specialist IT skills 21 21 24 16 27 Basic numerical skills and understanding 30 30 30 24 38 Communicating in a foreign language 16 16 18 19 16 Manual dexterity 17 16 30 18 29 Written Welsh language skills 1 - - - 17 Oral Welsh language skills 1 - - - 16 None of the above 9 8 10 12 5 People and personal skills Ability to manage own time and prioritise own tasks 51 51 46 46 56 Team working 37 36 40 38 49 Customer handling skills 39 39 38 40 38 Managing their own feelings, or handling the feelings of others 37 37 28 42 41 Managing or motivating other staff 35 35 33 37 35 Persuading or influencing others 33 34 24 33 32 Instructing, teaching or training people 26 26 22 23 28 Sales skills 27 27 22 28 28 Setting objectives for others & planning human, financial & other resources 25 25 25 24 25 Making speeches or presentations 17 16 16 21 21 None of the above 21 20 26 30 21

165
Table A.3.7 Technical and practical skills lacking among applicants, overall and by occupation (prompted)
Ove
rall
Man
ager
s
Prof
essi
onal
s
Ass
ocia
te
Prof
essi
onal
s
Adm
inis
trat
ive
and
Cle
rical
Skill
ed T
rade
s
Car
ing,
Lei
sure
and
O
ther
Ser
vice
s
Sale
s an
d C
usto
mer
Se
rvic
e
Mac
hine
Ope
rativ
es
Elem
enta
ry
Occ
upat
ions
Unweighted base 7,229 299 1,391 1,152 463 1,627 984 550 614 777
% % % % % % % % % % Specialist skills or knowledge needed to perform the role 65 66 74 71 59 71 60 49 55 52
Knowledge of products and services offered by your organisation and organisations like yours
38 41 36 42 40 37 31 55 25 41
Solving complex problems requiring a solution specific to the situation
41 57 43 39 51 43 33 47 27 36
Knowledge of how your organisation works 32 38 32 34 31 28 31 40 23 39
Reading and understanding instructions, guidelines, manuals or reports
33 32 20 24 48 31 35 37 39 50
Adapting to new equipment or materials 22 27 18 16 17 30 16 24 22 36
Computer literacy / basic IT skills 24 28 22 19 33 20 23 31 17 22
Writing instructions, guidelines, manuals or reports 28 30 22 25 31 26 34 27 27 33
Basic numerical skills and understanding 30 28 17 24 27 30 33 42 40 36
More complex numerical or statistical skills and understanding
27 42 32 30 30 26 19 27 15 27
Advanced or specialist IT skills 21 27 36 28 24 15 11 19 11 11 Communicating in a foreign language 16 19 17 12 12 12 20 11 22 24
Manual dexterity 17 14 11 9 5 34 10 12 24 23
Written Welsh language skills 1 1 1 * * * 1 * 1 1
Oral Welsh language skills 1 1 1 * * * 1 * 1 1
None of the above 9 8 7 8 4 10 10 6 14 6 Base: All establishments with skill-shortage vacancies in each occupation – up to two occupations followed up
Percentages are based on all skill-shortage vacancies, rather than all establishments with skill-shortage vacancies; proportions therefore show the percentage of skill-shortage vacancies within each occupation caused by lack of each skill. ‘*’ denotes a figure greater than zero but less than 0.5%.
Note: Column percentages exceed 100 per cent because of multiple responses; skill-shortage vacancies unable to be coded to an occupational group have been included in the “Overall” figures, though have not been included in the more detailed breakdown.

166
Table A.3.8 People and personal skills lacking among applicants, overall and by occupation (prompted)
Ove
rall
Man
ager
s
Prof
essi
onal
s
Ass
ocia
te
Prof
essi
onal
s
Adm
inis
trat
ive
and
Cle
rical
Skill
ed T
rade
s
Car
ing,
Lei
sure
and
O
ther
Ser
vice
s
Sale
s an
d C
usto
mer
Se
rvic
e
Mac
hine
Ope
rativ
es
Elem
enta
ry
Occ
upat
ions
Unweighted base 7,229 299 1,391 1,152 463 1,627 984 550 614 777
% % % % % % % % % % Ability to manage own time and prioritise own tasks 51 41 39 49 45 49 53 63 41 72
Team working 37 41 30 27 31 36 48 39 35 54
Customer handling skills 39 43 25 42 56 29 40 59 39 49 Managing their own feelings, or handling the feelings of others
37 35 29 36 44 32 46 47 30 44
Managing or motivating other staff 35 52 36 31 26 32 39 35 22 48
Persuading or influencing others 33 49 36 44 45 21 30 40 17 36
Instructing, teaching or training people 26 45 28 22 18 24 25 22 22 34
Sales skills 27 40 14 40 42 19 18 61 9 34 Setting objectives for others and planning human, financial and other resources
25 46 24 28 34 23 24 23 11 27
Making speeches or presentations 17 25 18 24 13 14 15 20 9 16
None of the above 21 13 28 17 15 27 22 9 24 10 Base: All establishments with skill-shortage vacancies in each occupation – up to two occupations followed up
Percentages are based on all skill-shortage vacancies, rather than all establishments with skill-shortage vacancies; proportions therefore show the percentage of skill-shortage vacancies within each occupation caused by lack of each skill.
Note: Column percentages exceed 100 per cent because of multiple responses; skill-shortage vacancies unable to be coded to an occupational group have been included in the “Overall” figures, though have not been included in the more detailed breakdown.

167
Table A.3.9 Technical or practical skills lacking among applicants, by sector (prompted)
Base: All establishments with skill-shortage vacancies – up to two occupations followed up.
‘*’ denotes a figure greater than zero but less than 0.5%.
Percentages are based on all skill-shortage vacancies, rather than all establishments with skill-shortage vacancies; proportions therefore show the percentage of skill-shortage vacancies within each sector caused by lack of each skill.
Ove
rall
Prim
ary
Sect
or &
U
tiliti
es
Man
ufac
turin
g
Con
stru
ctio
n
Who
lesa
le &
Ret
ail
Hot
els
& R
esta
uran
ts
Tran
spor
t & S
tora
ge
Info
rmat
ion
&
Com
mun
icat
ions
Fina
ncia
l Ser
vice
s
Bus
ines
s Se
rvic
es
Publ
ic A
dmin
.
Educ
atio
n
Hea
lth &
Soc
ial W
ork
Art
s &
Oth
er
Serv
ices
Unweighted base 7,229 384 1,495 1,001 1,660 1,691 949 788 287 2,900 305 1,281 3,048 929 % % % % % % % % % % % % % % Specialist skills or knowledge 65 77 73 69 59 59 53 73 77 70 49 67 60 66 Solving complex problems 41 32 44 48 41 38 30 46 41 49 24 33 35 35 Knowledge of products & services offered 38 32 40 40 48 45 20 36 43 40 19 29 36 40 Knowledge of how organisation works 32 34 29 30 34 44 20 20 33 32 25 29 36 39 Computer literacy / basic IT skills 23 16 19 18 25 18 18 19 11 21 25 25 34 26 Reading/understanding instructions, reports etc. 33 43 31 34 35 38 38 21 14 31 37 25 34 34 Adapting to new equipment or materials 22 32 29 28 26 26 15 18 5 22 14 15 20 28 Writing instructions, reports, etc 28 14 25 29 25 30 33 20 14 26 45 26 35 26 Complex numerical or statistical skills 27 15 33 31 28 26 11 23 19 33 13 24 27 21 Advanced or specialist IT skills 21 10 22 17 18 9 8 57 14 28 18 22 19 13 Basic numerical skills 30 38 28 31 35 34 39 13 40 24 25 22 36 26 Communicating in a foreign language 16 28 16 7 12 30 20 13 3 13 7 14 25 15 Manual dexterity 17 26 33 33 24 20 16 4 2 13 6 7 14 13 Written Welsh language skills 1 * * 2 * 1 * * * * 1 1 2 1 Oral Welsh language skills 1 * * 2 * 1 * * * * 1 1 2 * None of the above 9 7 8 7 8 9 8 4 6 8 24 11 10 9

168
Table A.3.10 People and personal skills lacking among applicants, by sector (prompted)
Base: All establishments with skill-shortage vacancies – up to two occupations followed up.
‘*’ denotes a figure greater than zero but less than 0.5%.
Percentages are based on all skill-shortage vacancies, rather than all establishments with skill-shortage vacancies; proportions therefore show the percentage of skill-shortage vacancies within each sector caused by lack of each skill.
Ove
rall
Prim
ary
Sect
or &
U
tiliti
es
Man
ufac
turin
g
Con
stru
ctio
n
Who
lesa
le &
Ret
ail
Hot
els
& R
esta
uran
ts
Tran
spor
t & S
tora
ge
Info
rmat
ion
&
Com
mun
icat
ions
Fina
ncia
l Ser
vice
s
Bus
ines
s Se
rvic
es
Publ
ic A
dmin
.
Educ
atio
n
Hea
lth &
Soc
ial W
ork
Art
s &
Oth
er
Serv
ices
Unweighted base 7,229 384 1,495 1,001 1,660 1,691 949 788 287 2,900 305 1,281 3,048 929 % % % % % % % % % % % % % % Ability to manage own time and prioritise own tasks 51 47 45 56 53 67 43 46 27 49 44 50 47 59 Team working 37 37 36 41 38 51 33 29 19 32 18 38 40 49 Customer handling skills 39 20 25 41 51 48 51 35 52 42 15 29 30 50 Managing own feelings, or handling feelings of others 37 31 31 31 33 51 34 23 44 36 30 38 46 41 Managing or motivating other staff 35 33 31 36 30 50 19 34 13 35 16 37 41 42 Persuading or influencing others 33 22 25 22 36 37 17 31 53 38 30 29 36 35 Instructing, teaching or training people 26 41 18 24 23 35 15 25 6 24 21 33 31 27 Sales skills 27 11 21 21 38 37 12 31 64 37 * 10 8 45 Setting objectives for others and planning resources 25 19 27 22 22 35 10 30 10 27 20 25 23 28 Making speeches or presentations 17 9 13 16 16 18 7 25 11 19 20 24 17 16 None of the above 21 14 30 24 21 10 26 22 12 21 34 24 23 17

169
Table A.3.11a Most common impacts of skill-shortage vacancies (prompted), by country and size
Base: All establishments with hard-to-fill vacancies that were all as a result of skill shortages
Unwtd. base
Any
Impa
ct
Incr
ease
wor
kloa
d fo
r oth
er s
taff
Hav
e di
fficu
lties
m
eetin
g cu
stom
er
serv
ices
obj
ectiv
es
Lose
bus
ines
s or
or
ders
to
com
petit
ors
Expe
rienc
e in
crea
sed
oper
atin
g co
sts
Del
ay d
evel
opin
g ne
w p
rodu
cts
or
serv
ices
Hav
e di
fficu
lties
in
trod
ucin
g ne
w
wor
king
pra
ctic
es
Hav
e di
fficu
lties
m
eetin
g qu
ality
st
anda
rds
Out
sour
ce w
ork
With
draw
from
of
ferin
g ce
rtain
pr
oduc
ts o
r ser
vice
s al
toge
ther
Hav
e di
fficu
lties
in
trod
ucin
g te
chno
logi
cal
chan
ge
UK 6,670 % 94 85 48 43 43 40 35 34 31 25 23 Country
England 5,503 % 94 84 48 43 42 39 34 34 31 25 22
Northern Ireland 234 % 96 89 54 44 47 51 47 40 32 26 30
Scotland 505 % 97 89 50 39 45 44 35 36 32 24 25
Wales 428 % 94 85 51 47 48 41 36 32 28 26 26 Size
2 to 4 571 % 95 84 45 50 40 42 34 31 32 30 25
5 to 24 3,314 % 94 85 51 43 42 40 36 35 29 25 22
25 to 49 1,278 % 93 85 49 36 45 36 35 40 31 21 20
50 to 99 796 % 94 83 48 29 50 37 32 35 31 17 20
100-249 514 % 95 87 49 26 52 34 31 38 37 15 22
250+ 197 % 96 88 54 27 60 43 43 38 31 16 32

170
Table A.3.11b Most common impacts of skill-shortage vacancies (prompted), by sector
Base: All establishments with hard-to-fill vacancies that were all as a result of skill shortages
Unwtd. base
Any
Impa
ct
Incr
ease
wor
kloa
d fo
r oth
er s
taff
Hav
e di
fficu
lties
m
eetin
g cu
stom
er
serv
ices
obj
ectiv
es
Lose
bus
ines
s or
or
ders
to
com
petit
ors
Expe
rienc
e in
crea
sed
oper
atin
g co
sts
Del
ay d
evel
opin
g ne
w p
rodu
cts
or
serv
ices
Hav
e di
fficu
lties
in
trod
ucin
g ne
w
wor
king
pra
ctic
es
Hav
e di
fficu
lties
m
eetin
g qu
ality
st
anda
rds
Out
sour
ce w
ork
With
draw
from
of
ferin
g ce
rtain
pr
oduc
ts o
r ser
vice
s al
toge
ther
Hav
e di
fficu
lties
in
trod
ucin
g te
chno
logi
cal
chan
ge
UK 6,670 % 94 85 48 43 43 40 35 34 31 25 23 Sector
Primary Sector & Utilities 200 % 96 89 37 32 52 32 42 34 40 20 26
Manufacturing 673 % 95 83 51 47 49 43 32 34 35 28 30
Construction 478 % 96 87 47 53 40 38 31 31 41 27 20
Wholesale & Retail 810 % 95 87 56 48 40 36 31 33 23 21 23
Hotels & Restaurants 712 % 91 84 52 41 46 39 40 45 22 26 16
Transport & Storage 284 % 95 74 52 49 60 33 34 35 53 35 21 Information & Communications 335 % 96 78 41 46 34 67 29 31 31 19 31
Financial Services 160 % 94 90 41 30 37 42 35 32 21 12 19
Business Services 1,247 % 95 88 49 47 41 42 34 31 35 26 26
Public Admin. 70 % 91 87 52 3 47 35 37 38 26 20 18
Education 541 % 94 83 30 25 44 33 30 35 32 25 16
Health & Social Work 716 % 93 85 44 24 51 38 40 38 30 23 21
Arts & Other Services 444 % 93 78 48 48 36 40 40 32 18 29 20

171
Table A.3.12 Profile of hard-to-fill vacancies, by country, size and sector
Unweighted base
Total number of hard-to-fill vacancies (rounded to
nearest 1,000)
% of vacancies hard-to-fill
Average number of hard-to-fill vacancies for those with hard-
to-fill vacancies
Average number of hard-to-fill vacancies for those
with vacancies
UK 25,114 337,000 33 2.2 0.9 Country England 21,033 287,000 33 2.2 0.9 Northern Ireland 855 7,000 31 2.1 0.8 Scotland 1,827 30,000 39 2.3 1.0 Wales 1,399 13,000 36 2.0 0.9 Size 2 to 4 1,589 63,000 41 1.3 0.6 5 to 24 11,506 108,000 38 1.7 0.7 25 to 49 5,507 44,000 35 2.6 1.0 50 to 99 3,483 38,000 30 3.8 1.3 100-249 2,204 33,000 24 2.1 1.8 250+ 825 52,000 28 17.4 5.8 Sector Primary Sector & Utilities 591 8,000 45 1.7 0.9 Manufacturing 1810 22,000 38 2.1 1.1 Construction 1292 19,000 49 1.6 0.9 Wholesale & Retail 3869 38,000 26 1.7 0.5 Hotels & Restaurants 3366 40,000 33 2.0 0.8 Transport & Storage 973 17,000 44 3.3 1.5 Information & Communications 993 17,000 39 2.9 1.2 Financial Services 539 6,000 20 2.6 0.9 Business Services 3911 63,000 30 2.0 0.8 Public Admin. 360 11,000 25 6.3 1.8 Education 2156 15,000 28 2.3 0.8 Health & Social Work 3353 60,000 40 3.9 1.5 Arts & Other Services 1901 20,000 37 1.5 0.7 Base: All establishments with vacancies.

172
Table A.3.13a Actions taken to overcome difficulties finding candidates to fill hard-to-fill vacancies (unprompted), by country and size
Base: All establishments with hard-to-fill vacancies
Unwtd. base
Any
Act
ion
Incr
easi
ng
adve
rtis
ing
/ re
crui
tmen
t spe
nd
Usi
ng N
EW
recr
uitm
ent m
etho
ds
or c
hann
els
Red
efin
ing
exis
ting
jobs
Bei
ng p
repa
red
to o
ffer
trai
ning
to le
ss w
ell
qual
ified
recr
uits
Incr
easi
ng th
e tr
aini
ng
give
n to
you
r exi
stin
g w
orkf
orce
Incr
easi
ng /
expa
ndin
g tr
aine
e pr
ogra
mm
es
Brin
ging
in c
ontr
acto
rs
to d
o th
e w
ork,
or
cont
ract
ing
it ou
t
Incr
easi
ng s
alar
ies
Rec
ruiti
ng w
orke
rs
who
are
non
-UK
na
tiona
ls
Mak
ing
the
job
mor
e at
trac
tive
e.g.
re
crui
tmen
t inc
entiv
es
enha
nced
T&
Cs
wor
king
hou
rs
UK 9,885 % 87 41 33 14 10 9 8 8 8 5 2 Country
England 8,232 % 88 42 33 14 10 9 8 8 8 6 2
Northern Ireland 336 % 85 36 32 18 9 8 10 7 8 7 4
Scotland 735 % 86 40 32 13 8 12 9 12 5 3 3
Wales 582 % 84 36 33 17 7 7 8 8 6 3 2 Size
2 to 4 763 % 82 37 28 15 9 8 5 9 7 6 1
5 to 24 4,790 % 88 43 33 15 10 8 9 6 7 4 2
25 to 49 2,044 % 91 44 38 13 11 13 12 9 10 7 3
50 to 99 1,226 % 94 45 43 12 10 11 13 10 10 6 4
100-249 773 % 95 43 43 13 12 13 12 10 12 6 4
250+ 289 % 95 42 45 11 11 11 16 10 14 7 5

173
Table A.3.13b Actions taken to overcome difficulties finding candidates to fill hard-to-fill vacancies (unprompted), by sector
Base: All establishments with hard-to-fill vacancies
- denotes a figure of zero.
Unwtd. base
Any
Act
ion
Incr
easi
ng
adve
rtis
ing
/ re
crui
tmen
t spe
nd
Usi
ng N
EW
recr
uitm
ent m
etho
ds
or c
hann
els
Red
efin
ing
exis
ting
jobs
Bei
ng p
repa
red
to o
ffer
trai
ning
to le
ss w
ell
qual
ified
recr
uits
Incr
easi
ng th
e tr
aini
ng
give
n to
you
r exi
stin
g w
orkf
orce
Incr
easi
ng /
expa
ndin
g tr
aine
e pr
ogra
mm
es
Brin
ging
in c
ontr
acto
rs
to d
o th
e w
ork,
or
cont
ract
ing
it ou
t
Incr
easi
ng s
alar
ies
Rec
ruiti
ng w
orke
rs
who
are
non
-UK
na
tiona
ls
Mak
ing
the
job
mor
e at
trac
tive
e.g.
re
crui
tmen
t inc
entiv
es
enha
nced
T&
Cs
wor
king
hou
rs
UK 9,885 % 87 41 33 14 10 9 8 8 8 5 2 Sector
Primary Sector & Utilities 284 % 84 34 30 15 11 8 8 11 7 4 2
Manufacturing 859 % 86 37 32 12 11 12 11 6 8 4 2
Construction 643 % 83 34 29 11 9 9 8 11 7 2 1
Wholesale & Retail 1,201 % 82 40 28 14 7 7 7 5 6 2 2
Hotels & Restaurants 1,387 % 91 46 32 17 8 11 7 4 9 8 3
Transport & Storage 436 % 82 39 27 14 9 10 8 9 9 6 4 Information & Communications 401 % 93 37 39 12 13 10 14 14 10 8 2
Financial Services 193 % 92 45 49 15 10 13 11 4 9 2 2
Business Services 1,576 % 87 37 38 15 14 9 9 12 8 8 2
Public Admin. 104 % 98 50 37 15 12 8 8 16 12 - 5
Education 738 % 94 53 42 12 8 8 9 9 9 3 5
Health & Social Work 1,357 % 90 50 39 13 8 8 7 8 8 5 4
Arts & Other Services 706 % 87 45 25 17 9 10 10 2 6 3 1

174
Chapter 4: Internal Skills Challenges Table A.4.1a Incidence, number and density of skills gaps, by size (2011-2017)
Percentages are based on all employment, rather than all establishments; proportions therefore show the percentage of staff reported as having skills gaps See Table A.1.1 in Appendix A for base sizes.
2011 2013 2015 2017
% o
f est
ablis
hmen
t with
an
y sk
ills
gaps
Num
ber o
f sta
ff no
t ful
ly
prof
icie
nt (s
kills
gap
s)
% o
f sta
ff re
port
ed a
s ha
ving
ski
lls g
aps
% o
f est
ablis
hmen
t with
an
y sk
ills
gaps
Num
ber o
f sta
ff no
t ful
ly
prof
icie
nt (s
kills
gap
s)
% o
f sta
ff re
port
ed a
s ha
ving
ski
lls g
aps
% o
f est
ablis
hmen
t with
an
y sk
ills
gaps
Num
ber o
f sta
ff no
t ful
ly
prof
icie
nt (s
kills
gap
s)
% o
f sta
ff re
port
ed a
s ha
ving
ski
lls g
aps
% o
f est
ablis
hmen
t with
an
y sk
ills
gaps
Num
ber o
f sta
ff no
t ful
ly
prof
icie
nt (s
kills
gap
s)
% o
f sta
ff re
port
ed a
s ha
ving
ski
lls g
aps
UK 17 1,485,471 5.5 15 1,409,887 5.2 14 1,380,237 5.0 13 1,267,469 4.4
Size
2 to 4 8 85,621 3.6 7 69,864 2.9 6 62,138 2.6 6 64,647 2.5
5 to 24 23 352,759 5.5 21 315,589 4.9 19 287,005 4.3 19 291,704 4.3
25 to 49 35 185,218 5.5 32 169,537 5.1 30 157,992 4.5 30 168,992 4.7
50 to 99 39 186,942 5.5 36 178,076 5.2 33 155,736 4.5 32 159,730 4.4
100-249 44 235,846 5.8 44 221,092 5.5 39 216,932 5.1 34 209,048 4.7
250+ 47 439,085 6.0 48 455,729 6.2 43 500,434 6.7 43 373,348 4.8

175
Table A.4.1b Incidence, number and density of skills gaps, by sector (2011-2017)
Percentages are based on all employment, rather than all establishments; proportions therefore show the percentage of staff reported as having a skills gap. See Table A.1.1 in Appendix A for base sizes.
2011 2013 2015 2017
% o
f est
ablis
hmen
t w
ith a
ny s
kills
gap
s
Num
ber o
f sta
ff no
t fu
lly p
rofic
ient
(s
kills
gap
s)
% o
f sta
ff re
port
ed
as h
avin
g sk
ills
gaps
% o
f est
ablis
hmen
t w
ith a
ny s
kills
gap
s
Num
ber o
f sta
ff no
t fu
lly p
rofic
ient
(s
kills
gap
s)
% o
f sta
ff re
port
ed
as h
avin
g sk
ills
gaps
% o
f est
ablis
hmen
t w
ith a
ny s
kills
gap
s
Num
ber o
f sta
ff no
t fu
lly p
rofic
ient
(s
kills
gap
s)
% o
f sta
ff re
port
ed
as h
avin
g sk
ills
gaps
% o
f est
ablis
hmen
t w
ith a
ny s
kills
gap
s
Num
ber o
f sta
ff no
t fu
lly p
rofic
ient
(s
kills
gap
s)
% o
f sta
ff re
port
ed
as h
avin
g sk
ills
gaps
Sector
Primary Sector & Utilities 12 34,335 4.9 10 35,196 4.9 8 26,918 3.8 9 36,325 4.7
Manufacturing 21 145,062 6.0 18 134,768 5.8 19 172,189 7.2 18 138,418 5.8
Construction 13 64,864 4.8 11 59,123 4.7 10 44,545 3.8 10 47,813 4.0
Wholesale & Retail 19 293,469 6.6 17 254,400 5.8 16 242,154 5.4 15 234,074 5.1
Hotels & Restaurants 23 155,575 9.0 21 159,427 8.9 19 140,138 7.2 19 142,713 6.7
Transport & Storage 16 55,485 4.4 13 41,289 3.3 15 51,997 4.3 13 42,380 3.2
Information & Communications 15 43,823 5.1 13 53,200 6.1 10 56,938 5.7 10 45,194 4.4
Financial Services 21 46,015 4.4 19 83,847 8.1 16 36,372 3.7 15 46,828 5.0
Business Services 13 220,949 5.1 13 224,065 5.0 12 249,255 5.2 11 229,910 4.3
Public Admin. 23 83,016 5.3 20 68,988 4.8 23 85,979 6.4 20 50,413 3.9
Education 22 94,924 3.8 18 97,708 3.8 19 103,656 4.0 18 74,262 2.9
Health & Social Work 20 180,179 5.2 19 143,632 4.0 15 122,688 3.2 13 126,444 3.3
Arts & Other Services 16 67,775 5.6 14 54,244 4.4 12 47,406 3.8 12 52,697 3.9

176
Table A.4.2 Density of skills gaps by sector within nation (2015-2017)
Base: All establishments Densities are based on skills gaps as a proportion of all employment within each occupation by sector, rather than the number of establishments with skills gaps. Where base between 30 and 49 establishments, figures are shown in italics.
Table A.4.2a Unweighted base sizes for previous table (Table A.4.2)
England Northern Ireland Scotland Wales 2015 2017 2015 2017 2015 2017 2015 2017 % % % % % % % % All sectors 5.0 4.3 3.3 3.8 5.0 5.0 4.5 4.7 Sector Primary Sector & Utilities 4.1 4.9 2.2 3.0 2.2 5.1 3.2 1.9 Manufacturing 6.8 5.6 4.2 5.1 10.9 7.2 8.9 5.9 Construction 3.7 3.8 2.8 4.8 4.3 5.0 4.8 4.4 Wholesale & Retail 5.4 4.9 5.7 5.4 5.5 6.8 3.6 5.6 Hotels & Restaurants 7.2 6.6 6.1 8.3 7.2 6.8 6.9 7.3 Transport & Storage 4.3 3.3 3.1 3.3 4.4 2.7 4.3 1.9 Information & Communications 5.8 4.7 0.1 1.7 5.2 2.3 2.7 2.5 Financial Services 3.6 4.9 1.9 3.2 4.3 3.6 4.2 7.7 Business Services 5.2 4.2 2.2 4.0 5.2 5.2 6.3 3.2 Public Admin. 7.6 4.0 0.2 0.6 2.1 4.9 1.8 2.3 Education 4.0 2.8 1.3 3.8 5.3 3.5 2.4 3.2 Health & Social Work 3.3 3.2 3.3 1.1 2.7 3.2 3.5 5.7 Arts & Other Services 3.8 3.9 2.9 2.1 3.9 4.6 3.8 4.9
England Northern Ireland Scotland Wales 2015 2017 2015 2017 2015 2017 2015 2017 UK 75,129 71,527 4,019 3,937 6,035 6,017 6,027 5,913 Sector Primary Sector & Utilities 3,649 3,761 122 188 596 445 477 511 Manufacturing 5,703 5,498 330 252 377 409 417 419 Construction 6,334 5,622 246 319 489 424 405 481 Wholesale & Retail 13,126 11,841 859 782 938 933 1,203 958 Hotels & Restaurants 7,274 6,917 415 384 582 580 649 597 Transport & Storage 3,797 3,317 201 155 323 329 359 274 Information & Communications 3,741 3,436 88 117 260 255 167 168 Financial Services 2,121 2,195 93 122 227 207 108 154 Business Services 11,158 11,582 507 499 763 838 715 794 Public Admin. 721 859 49 54 102 158 75 91 Education 4,549 4,516 267 255 338 379 361 375 Health & Social Work 6,963 6,315 382 461 594 573 617 603 Arts & Other Services 5,993 5,668 460 385 446 487 474 488

177
Table A.4.3 Proportion of each occupation lacking full proficiency within country
Base: All establishments employing each type of occupation (see Table A.4.3a for base sizes) Percentages are based on all employment, rather than all establishments; proportions therefore show the percentage of staff reported as having a skills gap.
Table A.4.3a Unweighted base sizes for previous table (Table A.4.3)
UK England Northern Ireland Scotland Wales
% % % % %
Managers 2.0 2.0 1.7 2.6 1.6
Professionals 2.7 2.6 2.4 3.3 5.0
Associate professionals 4.2 4.0 4.4 5.0 5.5
Administrative / clerical staff 3.8 3.7 2.5 4.3 4.2
Skilled trades occupations 5.7 5.5 7.5 6.2 6.9
Caring, leisure and other services 3.7 3.7 1.6 4.2 3.0
Sales and customer services 7.0 7.0 6.5 7.0 6.7
Machine operatives 5.2 5.1 4.4 6.7 5.1
Elementary staff 6.4 6.4 5.9 6.8 6.2
UK England Northern Ireland Scotland Wales
% % % % %
Managers 83,848 68,786 3,693 5,743 5,626
Professionals 19,574 16,216 848 1,401 1,109
Associate professionals 15,147 12,588 603 1,160 796
Administrative / clerical staff 54,285 44,687 2,439 3,869 3,290
Skilled trades occupations 22,628 18,361 916 1,823 1,528
Caring, leisure and other services 14,042 11,463 665 957 957
Sales and customer services 25,465 21,059 1,133 1,744 1,529
Machine operatives 14,797 11,984 647 1,178 988
Elementary staff 30,744 24,988 1,307 2,459 1,990

178
Table A.4.4 Unweighted base sizes for Table 4.1 in main report
‘**’ Corresponds with the asterisks shown in Table 4.1 (base in fewer than 30 establishments)
Man
ager
s
Prof
essi
onal
s
Ass
ocia
te
Prof
essi
onal
s
Adm
inis
trat
ive
and
Cle
rical
Skill
ed T
rade
s
Car
ing,
Lei
sure
and
O
ther
Ser
vice
s
Sale
s an
d C
usto
mer
Se
rvic
e
Mac
hine
Ope
rativ
es
Elem
enta
ry
Occ
upat
ions
UK 83,484 19,574 15,147 54,285 22,628 14,042 25,465 14,797 30,744
Sector
Primary Sector & Utilities 4,425 265 295 2,151 1,077 238 390 1,244 1,849
Manufacturing 6,444 1,289 1,647 5,058 3,047 40 2,223 3,554 2,376
Construction 6,606 868 877 5,058 3,836 26** 823 1,260 1,700
Wholesale & Retail 14,029 1,573 1,646 7,008 3,008 134 10,467 3,482 4,292
Hotels & Restaurants 8,133 220 311 2,154 3,533 505 2,140 386 6,986
Transport & Storage 3,840 316 354 2,603 548 58 1,148 1,789 1,050
Information & Communications 3,829 1,618 1,337 2,402 770 31 1,389 156 291
Financial Services 2,566 510 584 2,126 51 9** 771 11** 117
Business Services 13,253 5,050 4,076 10,595 2,022 578 3,386 1,543 2,258
Public Admin. 1,088 343 342 996 241 153 146 125 376
Education 5,386 3,814 1,213 4,508 1,404 4,466 325 218 3,519
Health & Social Work 7,759 2,765 1,205 5,541 1,879 5,385 633 457 3,546
Arts & Other Services 6,490 943 1,260 4,085 1,212 2,419 1,624 572 2,384

179
Table A.4.5 Main causes of skills gaps, by sector
Base: All establishments with skills gaps – up to two occupations followed up
Percentages are based on all skills gaps, rather than all establishments with skills gaps; proportions therefore show the percentage of skills gaps attributed to each cause.
Ove
rall
Prim
ary
Sect
or &
U
tiliti
es
Man
ufac
turin
g
Con
stru
ctio
n
Who
lesa
le &
Ret
ail
Hot
els
&
Res
taur
ants
Tran
spor
t &
Stor
age
Info
rmat
ion
&
Com
mun
icat
ions
Fina
ncia
l Ser
vice
s
Bus
ines
s Se
rvic
es
Publ
ic A
dmin
.
Educ
atio
n
Hea
lth &
Soc
ial
Wor
k
Art
s &
Oth
er
Serv
ices
Unweighted base 18,021 633 1,650 1,208 3,502 2,462 620 622 479 2,613 218 1,290 1,505 1219
% % % % % % % % % % % % % %
They are new to the role 63 45 68 57 64 66 66 50 65 64 64 56 68 54
Their training is currently only partially completed 57 36 72 63 56 57 49 43 50 59 68 50 63 49
Staff lack motivation 32 27 28 23 35 35 44 17 18 30 34 33 38 25 They have been on training but their performance has not improved sufficiently
30 23 24 20 34 33 51 14 22 36 29 31 29 22
Unable to recruit staff with the required skills 28 28 36 27 24 32 30 19 13 30 18 30 31 22
They have not received the appropriate training 25 27 30 27 26 24 24 22 16 24 31 24 28 24
The introduction of new working practices 24 18 27 21 24 24 27 14 21 22 25 35 30 21
Problems retaining staff 21 18 20 15 18 26 31 9 8 24 26 20 28 17 The introduction of new technology 19 14 21 14 20 12 25 12 16 20 23 21 23 15
The development of new products and services 16 6 20 11 16 15 25 11 10 18 7 15 14 15

180
Table A.4.6 Main causes of skills gaps, by occupation
Base: All establishments with skills gaps in each occupation – up to two occupations followed up
Percentages are based on all skills gaps, rather than all establishments with skills gaps; proportions therefore show the percentage of skills gaps attributed to each cause.
Man
ager
s
Prof
essi
onal
s
Ass
ocia
te
Prof
essi
onal
s
Adm
inis
trat
ive
and
Cle
rical
Skill
ed T
rade
s
Car
ing,
Lei
sure
and
O
ther
Ser
vice
s
Sale
s an
d C
usto
mer
Se
rvic
e
Mac
hine
Ope
rativ
es
Elem
enta
ry
Occ
upat
ions
Unweighted base 2,977 1,579 1,334 3,721 2,726 1,982 3,987 1,674 3,996
% % % % % % % % %
They are new to the role 51 65 66 65 61 67 59 69 64 Their training is currently only partially completed 48 66 65 55 67 63 49 63 57
Staff lack motivation 30 26 21 28 25 37 28 31 44 They have been on training but their performance has not improved sufficiently
25 23 36 28 22 29 28 36 39
Unable to recruit staff with the required skills 27 29 19 21 35 33 20 38 32
They have not received the appropriate training 39 27 19 26 30 24 20 28 24
The introduction of new working practices 28 32 22 27 24 23 19 26 25
Problems retaining staff 18 20 17 16 22 29 18 25 26 The introduction of new technology 23 25 15 25 19 13 14 26 17
The development of new products and services 18 20 13 13 16 11 15 21 15
Summary: New to the role / training not complete (transient factors)
65 82 80 76 83 82 69 80 76

181
Table A.4.7a Technical and practical skills lacking among staff with skills gaps, by occupation
Ove
rall
Man
ager
s
Prof
essi
onal
s
Ass
ocia
te
Prof
essi
onal
s
Adm
inis
trat
ive
and
Cle
rical
Skill
ed T
rade
s
Car
ing,
Lei
sure
and
O
ther
Ser
vice
s
Sale
s an
d C
usto
mer
Se
rvic
e
Mac
hine
Ope
rativ
es
Elem
enta
ry
Occ
upat
ions
Unweighted base 18,021 2,977 1,579 1,334 3,721 2,726 1,982 3,987 1,674 3,997
% % % % % % % % % % Specialist skills or knowledge needed to perform the role 47 47 62 63 43 63 65 35 46 39
Knowledge of products and services offered by your organisation and organisations like yours
39 29 32 34 47 41 30 45 36 41
Solving complex problems requiring a solution specific to the situation
37 46 52 45 42 43 38 28 32 30
Knowledge of how your organisation works 35 31 31 35 42 28 41 33 35 40
Reading and understanding instructions, guidelines, manuals or reports
31 19 22 28 33 29 40 22 46 38
Adapting to new equipment or materials 29 21 20 21 27 38 29 22 48 32
Computer literacy / basic IT skills 25 30 18 20 39 21 32 21 29 22
Writing instructions, guidelines, manuals or reports 23 28 29 25 27 23 35 12 28 22
Basic numerical skills and understanding 21 11 8 20 19 20 22 16 35 27
More complex numerical or statistical skills and understanding
20 26 24 32 31 18 15 13 21 18
Advanced or specialist IT skills 19 26 33 28 36 17 13 14 17 11
Communicating in a foreign language 13 10 6 8 9 16 16 8 21 21
Manual dexterity 13 6 7 4 5 28 6 6 30 20
Written Welsh language skills 1 1 5 * 1 2 1 1 * *
Oral Welsh language skills 1 1 6 * 1 * 1 1 * *
None of the above 10 14 11 8 7 9 7 10 7 13 Base: All establishments with skills gaps in each occupation – up to two occupations followed up
Percentages are based on all skills gaps, rather than all establishments with skills gaps; proportions therefore show the percentage of skills gaps attributed to each cause.
‘*’ denotes a figure greater than zero but smaller than 0.5.

182
Table A.4.7b People and personal skills lacking among staff with skills gaps, by occupation
Ove
rall
Man
ager
s
Prof
essi
onal
s
Ass
ocia
te
Prof
essi
onal
s
Adm
inis
trat
ive
and
Cle
rical
Skill
ed T
rade
s
Car
ing,
Lei
sure
and
O
ther
Ser
vice
s
Sale
s an
d C
usto
mer
Se
rvic
e
Mac
hine
Ope
rativ
es
Elem
enta
ry
Occ
upat
ions
Unweighted base 18,021 2,977 1,579 1,334 3,721 2,726 1,982 3,987 1,674 3,997
% % % % % % % % % % Ability to manage own time and prioritise own tasks 59 57 60 67 61 55 68 49 56 66
Team working 51 47 47 49 46 50 58 39 58 62
Customer handling skills 45 32 36 50 54 37 45 55 23 51 Managing their own feelings, or handling the feelings of others
44 56 43 47 38 35 61 37 42 46
Managing or motivating other staff 37 67 45 37 30 39 38 29 35 36
Persuading or influencing others 35 50 45 42 30 29 34 36 29 31
Instructing, teaching or training people 28 48 38 28 25 29 27 20 34 23
Sales skills 26 25 14 29 21 16 10 47 9 26 Setting objectives for others and planning human, financial and other resources
25 56 37 27 23 26 23 19 21 20
Making speeches or presentations 16 30 30 31 15 17 13 12 13 9
None of the above 12 11 18 8 12 19 11 8 13 11 Base: All establishments with skills gaps in each occupation – up to two occupations followed up
Percentages are based on all skills gaps, rather than all establishments with skills gaps; proportions therefore show the percentage of skills gaps attributed to each cause.

183
Table A.4.7c Technical and practical skills lacking among staff with skills gaps, by sector
Base: All establishments with skills gaps – up to two occupations followed up
Percentages are based on all skills gaps, rather than all establishments with skills gaps; proportions therefore show the percentage of skills gaps attributed to each cause.
‘*’ denotes a figure greater than zero but smaller than 0.5.
Ove
rall
Prim
ary
Sect
or &
U
tiliti
es
Man
ufac
turin
g
Con
stru
ctio
n
Who
lesa
le &
Ret
ail
Hot
els
& R
esta
uran
ts
Tran
spor
t & S
tora
ge
Info
rmat
ion
&
Com
mun
icat
ions
Fina
ncia
l Ser
vice
s
Bus
ines
s Se
rvic
es
Publ
ic A
dmin
.
Educ
atio
n
Hea
lth &
Soc
ial W
ork
Art
s &
Oth
er
Serv
ices
Unweighted base 18,021 633 1,650 1,208 3,502 2,462 620 622 479 2,613 218 1,290 1,505 1,219 % % % % % % % % % % % % % %
Specialist skills or knowledge 47 48 56 54 39 40 43 46 35 50 44 58 62 42 Solving complex problems 37 30 41 42 33 33 26 25 33 43 38 35 43 31 Knowledge of products & services offered 39 26 41 38 49 47 34 26 41 38 24 28 31 37 Knowledge of how organisation works 35 24 36 30 38 41 37 18 26 32 42 36 41 35 Computer literacy / basic IT skills 25 20 27 25 28 17 37 9 17 24 32 31 31 23 Reading/understanding instructions, reports etc. 31 32 37 30 28 30 43 13 22 32 34 29 39 23 Adapting to new equipment or materials 29 31 41 33 28 29 42 16 11 24 32 25 30 27 Writing instructions, reports, etc 23 24 25 25 17 19 30 12 16 27 25 26 36 16 Complex numerical or statistical skills 20 20 27 21 17 16 16 12 22 26 22 25 17 15 Advanced or specialist IT skills 19 18 23 18 15 8 14 36 20 25 31 23 20 16 Basic numerical skills 21 16 25 20 21 25 33 6 17 20 25 20 14 16 Communicating in a foreign language 13 24 18 5 10 18 25 5 3 14 15 9 14 9 Manual dexterity 13 23 26 24 12 14 24 4 1 8 16 6 7 13 Written Welsh language skills (Wales base only) 1 1 * * 1 1 * * 0 * * 4 5 1 Oral Welsh language skills (Wales base only) 1 * * * 1 1 * * 0 * 1 1 5 1 None of the above 10 8 6 11 12 14 8 22 4 8 3 8 7 11

184
Table A.4.7d People and personal skills lacking among staff with skills gaps, by sector
Base: All establishments with skills gaps – up to two occupations followed up
Percentages are based on all skills gaps, rather than all establishments with skills gaps; proportions therefore show the percentage of skills gaps attributed to each cause.
Ove
rall
Prim
ary
Sect
or &
U
tiliti
es
Man
ufac
turin
g
Con
stru
ctio
n
Who
lesa
le &
Ret
ail
Hot
els
& R
esta
uran
ts
Tran
spor
t & S
tora
ge
Info
rmat
ion
&
Com
mun
icat
ions
Fina
ncia
l Ser
vice
s
Bus
ines
s Se
rvic
es
Publ
ic A
dmin
.
Educ
atio
n
Hea
lth &
Soc
ial W
ork
Art
s &
Oth
er
Serv
ices
Unweighted base 18,021 633 1,650 1,208 3,502 2,462 620 622 479 2,613 218 1,290 1,505 1,219 % % % % % % % % % % % % % % Ability to manage own time and prioritise own tasks 59 54 54 61 59 64 61 38 50 62 55 58 68 54 Team working 51 49 54 42 50 55 59 33 33 52 47 53 60 41 Customer handling skills 45 22 24 37 53 62 43 36 39 48 45 32 45 47 Managing own feelings, or handling feelings of others 44 32 44 35 43 45 55 20 26 43 35 52 63 38 Managing or motivating other staff 37 33 41 34 36 43 38 27 21 37 27 43 42 33 Persuading or influencing others 35 23 38 29 37 36 38 30 30 35 27 36 41 30 Instructing, teaching or training people 28 23 39 24 26 31 32 13 15 25 24 37 29 28 Sales skills 26 11 19 15 41 42 20 30 29 24 4 8 8 27 Setting objectives for others and planning resources 25 23 29 26 23 24 26 19 14 28 18 30 29 24 Making speeches or presentations 16 7 18 11 13 13 22 16 12 20 18 20 20 14 None of the above 12 15 16 20 11 10 10 20 7 11 11 10 11 12

185
Table A.4.7e Skills lacking among staff with skills gaps, by nation
Base: All establishments with skills gaps – up to two occupations followed up
Percentages are based on all skills gaps, rather than all establishments with skills gaps; proportions therefore show the percentage of skills gaps attributed to each cause.
UK
Engl
and
Nor
ther
n Ire
land
Scot
land
Wal
es
Unweighted base 18,021 14,806 657 1,502 1,056 % % % % % Technical and practical skills Specialist skills or knowledge needed to perform the role 47 47 51 48 57 Solving complex problems requiring a solution specific to the situation 37 36 34 40 48 Knowledge of products and services offered by your organisation 39 38 47 44 48 Knowledge of how your organisation works 35 34 37 41 42 Computer literacy / basic IT skills 25 25 27 24 29 Reading and understanding instructions, guidelines, manuals or reports 31 31 21 29 39 Adapting to new equipment or materials 29 28 30 32 33 Writing instructions, guidelines, manuals or reports 23 22 26 24 33 More complex numerical or statistical skills and understanding 20 20 18 19 26 Advanced or specialist IT skills 19 19 20 21 20 Basic numerical skills and understanding 21 21 21 16 24 Communicating in a foreign language 13 14 13 14 6 Manual dexterity 13 12 17 18 15 Written Welsh language skills 1 - - - 22 Oral Welsh language skills 1 - - - 20 None of the above 10 10 10 10 9 People and personal skills Ability to manage own time and prioritise own tasks 59 58 62 63 66 Team working 51 49 56 59 61 Customer handling skills 45 45 49 45 47 Managing their own feelings, or handling the feelings of others 44 42 48 49 56 Managing or motivating other staff 37 37 41 35 48 Persuading or influencing others 35 34 41 38 44 Instructing, teaching or training people 28 27 28 30 40 Sales skills 26 26 35 24 23 Setting objectives for others & planning human, financial & other resources 25 25 25 25 35
Making speeches or presentations 16 16 16 14 26 None of the above 12 12 13 10 10

186
Table A.4.8 Extent of impact of skills gaps, by year, country, size and sector
Base: All establishments with skills gaps
Unweighted base Major impact Minor impact No impact
UK 2011 20,820 % 15 46 39 UK 2013 20,228 % 16 48 37 UK 2015 18,265 % 17 48 34 UK 2017 18,021 % 17 48 34 Country England 14,806 % 17 48 35 Northern Ireland 657 % 19 50 31 Scotland 1,502 % 19 49 32 Wales 1,056 % 16 51 32 Size 2 to 4 998 % 20 43 37 5 to 24 9,570 % 17 48 35 25 to 49 3,781 % 17 50 33 50 to 99 2,048 % 14 53 33 100-249 1,163 % 17 56 27 250+ 461 % 12 65 23 Sector Primary Sector & Utilities 633 % 21 42 37 Manufacturing 1,650 % 17 48 35 Construction 1,208 % 14 42 44 Wholesale & Retail 3,502 % 17 51 32 Hotels & Restaurants 2,462 % 21 51 28 Transport & Storage 620 % 22 44 34 Information & Communications 622 % 20 47 33 Financial Services 479 % 14 46 39 Business Services 2,613 % 18 49 33 Public Admin. 218 % 15 54 31 Education 1,290 % 11 49 40 Health & Social Work 1,505 % 15 46 39 Arts & Other Services 1,219 % 16 46 39

187
Table A.4.9 Implications of skills gaps (prompted), by country, size and sector
Base: All establishments with skills gaps
Unwtd. base
Incr
ease
wor
kloa
d fo
r oth
er s
taff
Hav
e hi
gher
op
erat
ing
cost
s
Hav
e di
fficu
lties
m
eetin
g qu
ality
st
anda
rds
Hav
e di
fficu
lties
in
trod
ucin
g ne
w
wor
king
pra
ctic
es
Lose
bus
ines
s or
or
ders
to
com
petit
ors
Del
ay d
evel
opin
g ne
w p
rodu
cts
or
serv
ices
Out
sour
ce w
ork
UK 18,021 % 51 27 24 23 21 17 11
Country
England 14,806 % 50 26 24 22 21 16 11
Northern Ireland 657 % 55 31 27 28 24 19 12
Scotland 1,502 % 53 30 25 28 20 18 9
Wales 1,056 % 54 30 23 26 22 19 12
Size
2 to 4 998 % 45 24 18 19 22 19 12
5 to 24 9,570 % 52 26 25 23 22 16 9
25 to 49 3,781 % 54 31 28 25 19 16 11
50 to 99 2,048 % 54 30 27 26 15 14 12
100-249 1,163 % 59 34 30 26 19 15 13
250+ 461 % 59 34 28 30 18 16 16
Sector
Primary Sector & Utilities 633 % 48 39 19 24 12 14 16
Manufacturing 1,650 % 51 38 26 22 20 23 14
Construction 1,208 % 42 27 16 15 18 13 12
Wholesale & Retail 3,502 % 54 23 22 23 26 14 7
Hotels & Restaurants 2,462 % 58 36 36 26 28 17 11
Transport & Storage 620 % 51 30 27 26 26 17 10 Information & Communications 622 % 48 27 21 22 22 28 15
Financial Services 479 % 49 23 23 16 13 12 9
Business Services 2,613 % 51 26 22 22 22 19 12
Public Admin. 218 % 54 19 23 27 4 12 9
Education 1,290 % 51 21 26 27 9 12 10
Health & Social Work 1,505 % 45 20 24 28 8 14 10
Arts & Other Services 1,219 % 46 22 24 22 19 17 8

188
Table A.4.10 Actions taken to overcome skills gaps, by country, size and sector
Base: All establishments with skills gaps
Unwtd. base
Incr
ease
trai
ning
ac
tivity
Mor
e su
perv
isio
n of
st
aff
Mor
e st
aff a
ppra
isal
s
Impl
emen
tatio
n of
m
ento
ring
sche
me
Rea
lloca
ting
wor
k
Cha
ngin
g w
orki
ng
prac
tices
Incr
ease
recr
uitm
ent
activ
ity /
spen
d
Any
act
ion
UK 18,021 % 67 54 45 44 35 27 21 83
Country
England 14,806 % 66 54 45 43 34 27 21 83
Northern Ireland 657 % 65 58 48 43 41 29 21 82
Scotland 1,502 % 70 56 44 47 37 31 17 84
Wales 1,056 % 70 60 48 47 39 31 23 85
Size
2 to 4 998 % 57 45 31 32 29 21 13 75
5 to 24 9,570 % 67 56 46 44 35 27 20 84
25 to 49 3,781 % 75 60 55 53 39 33 28 89
50 to 99 2,048 % 76 61 58 55 38 33 30 90
100-249 1,163 % 78 60 57 58 43 34 35 91
250+ 461 % 76 50 49 61 41 37 35 87
Sector
Primary Sector & Utilities 633 % 53 44 26 27 27 21 15 72
Manufacturing 1,650 % 66 50 37 40 33 25 23 82
Construction 1,208 % 56 45 30 35 27 18 15 75
Wholesale & Retail 3,502 % 64 54 48 44 35 26 18 83
Hotels & Restaurants 2,462 % 72 62 55 47 38 33 31 87
Transport & Storage 620 % 60 49 40 38 34 23 21 79 Information & Communications 622 % 63 46 37 41 32 27 17 77
Financial Services 479 % 75 61 44 55 42 25 21 85
Business Services 2,613 % 68 52 42 42 36 26 20 83
Public Admin. 218 % 73 49 41 45 40 30 19 88
Education 1,290 % 75 67 60 63 43 38 19 91
Health & Social Work 1,505 % 76 66 55 56 38 34 25 90
Arts & Other Services 1,219 % 67 53 46 39 32 30 16 83
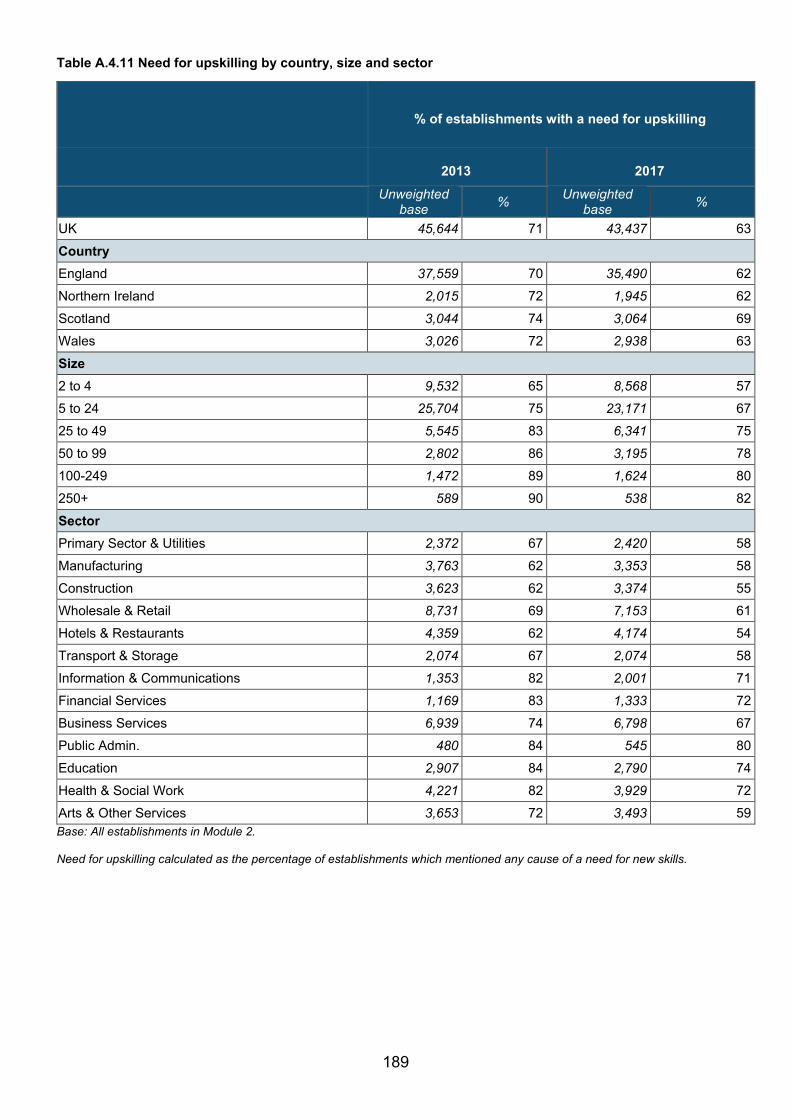
189
Table A.4.11 Need for upskilling by country, size and sector
Base: All establishments in Module 2. Need for upskilling calculated as the percentage of establishments which mentioned any cause of a need for new skills.
% of establishments with a need for upskilling
2013 2017
Unweighted base % Unweighted
base %
UK 45,644 71 43,437 63 Country England 37,559 70 35,490 62 Northern Ireland 2,015 72 1,945 62 Scotland 3,044 74 3,064 69 Wales 3,026 72 2,938 63 Size 2 to 4 9,532 65 8,568 57 5 to 24 25,704 75 23,171 67 25 to 49 5,545 83 6,341 75 50 to 99 2,802 86 3,195 78 100-249 1,472 89 1,624 80 250+ 589 90 538 82 Sector Primary Sector & Utilities 2,372 67 2,420 58 Manufacturing 3,763 62 3,353 58 Construction 3,623 62 3,374 55 Wholesale & Retail 8,731 69 7,153 61 Hotels & Restaurants 4,359 62 4,174 54 Transport & Storage 2,074 67 2,074 58 Information & Communications 1,353 82 2,001 71 Financial Services 1,169 83 1,333 72 Business Services 6,939 74 6,798 67 Public Admin. 480 84 545 80 Education 2,907 84 2,790 74 Health & Social Work 4,221 82 3,929 72 Arts & Other Services 3,653 72 3,493 59

190
Table A.4.12 Reasons for expected need for upskilling by country and size
Base: All establishments in Module 2 (base sizes are the same as displayed in Table A.3.12).
‘*’ denotes a figure greater than zero but smaller than 0.5; ‘-‘ denotes that the reason was not asked in 2013.
The development
of new products and
services
The introduction of new working
practices
The introduction of
new technologies or equipment
New legislative or regulatory requirements
Increased competitive
pressure
The UK’s decision to
leave the EU General
training / CPD
Expected general
business growth
Expected financial or economic pressures
2013 2017 2013 2017 2013 2017 2013 2017 2013 2017 2013 2017 2013 2017 2013 2017 2013 2017
UK 43 35 42 35 44 39 46 39 31 24 - 13 - 1 - * - *
Country
England 43 35 42 35 44 38 45 38 31 24 - 13 - 1 - * - *
Northern Ireland 40 32 43 36 47 39 47 39 32 25 - 17 - 2 - * - *
Scotland 44 39 45 39 46 41 51 42 30 25 - 17 - 2 - * - 1
Wales 45 37 45 39 46 42 51 41 31 23 - 11 - 1 - * - *
Size
2 to 4 38 31 35 29 40 35 41 34 27 21 - 12 - 1 - * - *
5 to 24 47 39 47 40 45 40 48 41 34 26 - 13 - 2 - * - 1
25 to 49 52 44 58 49 54 50 58 49 37 30 - 16 - 2 - * - 1
50 to 99 55 46 63 51 62 55 63 53 42 32 - 17 - 2 - * - 1
100-249 56 49 64 54 67 58 65 56 47 34 - 21 - 2 - * - 1
250+ 66 54 71 60 71 66 69 60 52 39 - 27 - 2 - * - *

191
Table A.4.13 Reasons for expected need for upskilling by sector
Base: All establishments in Module 2 (base sizes are the same as displayed in Table A.3.12). ‘*’ denotes a figure greater than zero but smaller than 0.5; ‘-‘ denotes that the reason was not asked in 2013
The
development of new products and services
The introduction of new working
practices
The introduction of
new technologies or
equipment
New legislative or regulatory requirements
Increased competitive
pressure
The UK’s decision to
leave the EU General
training / CPD
Expected general
business growth
Expected financial or economic pressures
2013 2017 2013 2017 2013 2017 2013 2017 2013 2017 2013 2017 2013 2017 2013 2017 2013 2017
Sector Primary Sector & Utilities 27 21 34 29 48 37 47 37 21 18 - 16 - 1 - * - *
Manufacturing 40 34 33 29 41 37 35 30 27 24 - 12 - 1 - * - *
Construction 34 28 38 32 38 34 43 36 24 17 - 7 - 1 - * - * Wholesale & Retail 48 41 43 34 45 40 38 32 35 28 - 13 - 1 - * - *
Hotels & Restaurants 39 32 41 34 31 28 40 32 30 24 - 14 - 1 - * - *
Transport & Storage 39 29 37 33 46 35 45 35 28 24 - 16 - 2 - * - *
Information & Communications 67 49 34 29 72 57 36 30 42 30 - 14 - 1 - * - *
Financial Services 61 45 52 40 48 37 68 60 39 24 - 18 - 2 - * - * Business Services 42 36 39 35 45 41 51 45 33 25 - 16 - 1 - * - *
Public Admin. 47 33 63 56 53 53 67 62 27 14 - 18 - 2 - * - 1
Education 40 36 59 48 52 42 65 55 27 24 - 13 - 3 - * - 1 Health & Social Work 45 35 59 49 42 39 61 54 32 23 - 12 - 3 - * - 1
Arts & Other Services 47 35 44 34 45 35 40 31 29 20 - 10 - 2 - 1 - *

192
Chapter 5: Training and workforce development Table A.5.1 Proportion of employers providing any training (2011-2017), by country, size and sector
Base: All establishments
2011 2013 2015 2017
Unwtd. base
Any training
Unwtd. base
Any training
Unwtd. base
Any training
Unwtd. base
Any training
% % % % UK 86,522 65 91,279 66 91,210 66 87,430 66
Country England 74,156 65 75,255 66 75,129 66 71,527 66
Northern Ireland 3,921 65 4,014 63 4,019 62 3,973 63
Scotland 2,487 73 6,014 70 6,035 71 6,017 71
Wales 5,958 63 5,996 62 6,027 63 5,913 62
Size 2 to 4 17,905 51 19,058 52 20,527 51 17,132 53
5 to 24 47,770 77 51,565 77 49,584 78 46,936 78
25 to 49 10,239 92 10,947 93 11,657 92 12,526 92
50 to 99 5,712 95 5,584 95 5,836 95 6,456 95
100-249 3,270 96 2,938 97 2,689 96 3,302 96
250+ 1,626 97 1,187 97 917 97 1,078 96
Sector Primary Sector & Utilities 2,512 54 4,693 52 4,844 52 4,905 53
Manufacturing 7,653 61 7,422 59 6,827 63 6,578 62
Construction 6,576 58 7,202 56 7,474 57 6,846 59
Wholesale & Retail 15,163 60 17,287 61 16,126 60 14,514 61
Hotels & Restaurants 8,421 61 8,888 62 8,920 63 8,478 64
Transport & Storage 4,685 58 4,182 61 4,680 63 4,075 61
Information & Communications 3,125 67 2,708 66 4,256 60 3,976 60
Financial Services 1,853 76 2,330 77 2,549 74 2,678 78
Business Services 14,297 67 14,011 67 13,143 68 13,713 68
Public Admin. 1,584 90 942 90 947 90 1,162 90
Education 5,422 91 5,796 92 5,515 93 5,525 91
Health & Social Work 8,067 89 8,460 89 8,556 88 7,952 87
Arts & Other Services 7,164 69 7,358 69 7,373 70 7,028 68

193
Table A.5.2 Proportion of employers providing any training (2011-2017)
2011 2013 2015 2017
Any off-
job training
Any on-job
training
Any off-job
training
Any on-job
training
Any off-job
training
Any on-job
training
Any off-job
training
Any on-job
training
% % % % % % % % UK 47 53 49 52 49 53 48 53
Country England 46 52 48 52 48 52 48 53
Northern Ireland 48 50 49 47 47 49 47 48
Scotland 53 60 53 57 52 58 51 58
Wales 47 50 47 48 49 49 47 48
Size 2 to 4 34 38 36 37 35 37 36 40
5 to 24 56 64 58 63 58 64 57 64
25 to 49 75 83 77 83 76 83 76 83
50 to 99 82 87 83 88 82 88 81 87
100-249 84 91 87 92 85 91 85 91
250+ 87 94 89 93 86 92 87 92
Sector Primary Sector & Utilities 40 39 43 33 43 34 42 36
Manufacturing 43 48 43 45 46 50 45 50
Construction 46 38 45 37 46 38 47 40
Wholesale & Retail 36 50 40 50 39 48 39 50
Hotels & Restaurants 38 50 39 51 40 52 40 54
Transport & Storage 39 44 44 44 47 49 42 48
Information & Communications 47 54 48 53 42 48 41 48
Financial Services 52 67 54 66 53 64 58 66
Business Services 50 52 51 52 51 53 50 54
Public Admin. 73 81 73 79 74 78 75 77
Education 80 81 80 82 82 84 79 82
Health & Social Work 73 78 75 77 72 77 70 75
Arts & Other Services 50 56 52 56 51 58 49 57 Base: All establishments (base sizes are the same as displayed in Table A.5.1)

194
Table A.5.3 Number employed and trained over the last 12 months by sector, and the proportion of the workforce trained
2011 2013 2015 2017
% of staff trained
% of staff trained
% of staff trained
Unwtd. base
Number employed
(000s)
Number trained (000s)
% of staff trained
Primary Sector & Utilities 46 52 48 2,961 778 402 52
Manufacturing 46 50 52 4,839 2,405 1,168 49
Construction 49 48 53 5,035 1,209 605 50
Wholesale & Retail 52 55 55 10,753 4,574 2,674 58
Hotels & Restaurants 55 59 64 6,493 2,135 1,331 62
Transport & Storage 43 60 57 2,753 1,318 675 51 Information & Communications 44 50 53 2,782 1,018 540 53
Financial Services 59 67 71 2,170 943 678 72
Business Services 52 60 60 11,009 5,364 3,238 60
Public Admin. 61 67 74 1,030 1,290 757 59
Education 65 76 75 5,308 2,593 1,974 76
Health & Social Work 66 80 78 7,369 3,889 3,066 79
Arts & Other Services 55 63 61 5,448 1,345 802 60 Base: Establishments that had funded or arranged training in the previous 12 months.
Note: ‘% of staff trained’ refers to the number of staff trained over the last 12 months (whether or not they still work at the establishment) as a percentage of the number of staff currently employed.

195
Table A.5.4 Unweighted base sizes for Figure 5.3 in main report
2013 2015 2017 Occupation Managers 87,946 87,590 83,848 Professionals 17,407 17,483 19,574 Associate professionals 12,577 13,309 15,147 Administrative / clerical staff 53,759 53,622 54,285 Skilled trades occupations 23,644 24,025 22,628 Caring, leisure and other services 14,017 15,310 14,042 Sales and customer services 27,417 25,940 25,465 Machine operatives 14,059 14,105 14,797 Elementary staff 32,192 31,970 30,744 Base: All establishments with staff in each occupation (excluding establishments where the number of staff are unknown)

196
Table A.5.5 Unweighted base sizes for Tables 5.2 and 5.3 in main report
2011 2013 2015 2017 UK 66,439 69,842 69,541 67,950 Country England 56,713 57,787 57,422 55,775 Northern Ireland 2,903 2,894 2,869 2,893 Scotland 2,170 4,884 4,894 4,999 Wales 4,653 4,277 4,356 4,283 Size 2 to 4 9,121 9,580 10,317 8,798 5 to 24 37,758 40,801 39,461 37,207 25 to 49 9,416 10,123 10,742 11,577 50 to 99 5,416 5,315 5,547 6,145 100-249 3,150 2,864 2,584 3,181 250+ 1,578 1,159 890 1,042 Base: Establishments that had funded or arranged training in the previous 12 months

197
Table A.5.6 Average training days over the last 12 months per person trained
Average days training per person trained
Unwtd. base 1 day
or less 2 3-4 5-6 7-10 11+
UK 67,950 % 14 16 20 16 12 15 Country England 55,775 % 14 16 20 15 12 15 Northern Ireland 2,893 % 14 16 25 18 11 10 Scotland 4,999 % 13 16 21 16 11 16 Wales 4,283 % 14 16 19 18 11 15 Size 2 to 4 8,798 % 15 15 20 17 12 16 5 to 24 37,207 % 14 16 20 15 12 15 25 to 49 11,577 % 13 17 19 15 11 15 50 to 99 6,145 % 15 16 19 15 10 13 100-249 3,181 % 15 17 18 15 8 12 250+ 1,042 % 15 18 19 13 9 9 Sector Primary Sector & Utilities 2,961 % 17 22 23 14 8 9 Manufacturing 4,839 % 16 18 19 14 9 15 Construction 5,035 % 14 16 21 16 11 16 Wholesale & Retail 10,753 % 16 16 19 14 12 16 Hotels & Restaurants 6,493 % 18 14 18 11 11 19 Transport & Storage 2,753 % 21 19 19 13 9 12 Information & Communications 2,782 % 12 16 17 17 14 16 Financial Services 2,170 % 9 14 17 19 15 18 Business Services 11,009 % 13 15 20 18 12 15 Public Admin. 1,030 % 12 19 21 15 9 15 Education 5,308 % 11 17 23 22 11 9 Health & Social Work 7,369 % 9 13 21 17 14 16 Arts & Other Services 5,448 % 15 16 20 15 11 16 Base: Establishments that had funded or arranged training in the previous 12 months.

198
Table A.5.7 Total training and development days, and days per person trained, and per employee, by sector (2011 – 2017)
Base: Establishments that had funded or arranged training in the previous 12 months
2011 2013 2015 2017
Unw
td. b
ase
Tota
l tra
inin
g da
ys
Day
s pe
r pe
rson
trai
ned
Day
s pe
r em
ploy
ee
Unw
td. b
ase
Tota
l tra
inin
g da
ys
Day
s pe
r pe
rson
trai
ned
Day
s pe
r em
ploy
ee
Unw
td. b
ase
Tota
l tra
inin
g da
ys
Day
s pe
r pe
rson
trai
ned
Day
s pe
r em
ploy
ee
Unw
td. b
ase
Tota
l tra
inin
g da
ys
Day
s pe
r pe
rson
trai
ned
Day
s pe
r em
ploy
ee
UK 66,439 115m 7.8 4.2 69,842 113m 6.7 4.2 69,541 118m 6.8 4.2 67,950 114m 6.4 4.0 Sector Primary Sector & Utilities 1,760 2.4m 7.5 3.5 2,691 2.7m 7.2 3.8 2,807 1.8m 5.3 2.5 2,961 1.8m 4.6 2.4
Manufacturing 5,308 8.9m 7.7 3.6 5,128 6.2m 5.4 2.7 4,915 7.5m 6.1 3.2 4,839 7.4m 6.3 3.1
Construction 4,399 4.6m 6.9 3.4 4,777 3.7m 6.2 3.0 5,044 4.1m 6.7 3.5 5,035 4.0m 6.5 3.3
Wholesale & Retail 11,001 20.0m 8.7 4.5 12,425 19.4m 7.9 4.4 11,470 19.0m 7.7 4.2 10,753 17.7m 6.6 3.9 Hotels & Restaurants 6,185 10.7m 11.4 6.2 6,761 9.6m 9.1 5.3 6,849 13.2m 10.5 6.8 6,493 11.9m 9.0 5.6
Transport & Storage 3,085 3.5m 6.3 2.7 2,895 3.3m 4.4 2.6 3,103 3.8m 5.5 3.1 2,753 3.0m 4.4 2.3
Information & Communications 2,345 2.7m 6.9 3.1 2,044 3.6m 8.2 4.1 2,878 2.8m 5.2 2.8 2,782 2.7m 4.9 2.6
Financial Services 1,460 4.1m 6.6 3.9 1,824 3.4m 4.9 3.3 1,920 3.8m 5.4 3.8 2,170 3.6m 5.3 3.8
Business Services 11,268 15.2m 6.7 3.5 11,127 19.2m 7.1 4.3 10,623 18.2m 6.3 3.8 11,009 18.2m 5.6 3.4
Public Admin. 1,444 9.4m 9.9 6.0 861 7.4m 7.7 5.2 851 5.1m 5.2 3.8 1,030 7.3m 9.6 5.7
Education 5,117 9.0m 5.5 3.6 5,568 9.6m 4.9 3.8 5,300 10.8m 5.5 4.1 5,308 9.9m 5.0 3.8 Health & Social Work 7,484 18.2m 7.9 5.2 7,935 19.0m 6.6 5.3 7,941 21.1m 7.2 5.6 7,369 21.7m 7.1 5.6
Arts & Other Services 5,583 6.0m 8.9 4.9 5,806 5.9m 7.7 4.8 5,840 6.4m 8.4 5.1 5,448 5.4m 6.7 4.0

199
Table A.5.8 Types of training provided over the last 12 months (prompted)
Base: Establishments that had funded or arranged training in the previous 12 months.
n/a: since the 2015 survey induction training has been split between ‘basic’ and ‘extensive’ induction training, hence data from 2013 and 2011 is not comparable.
Unwtd. base
Job
spec
ific
Hea
lth &
Saf
ety
Bas
ic in
duct
ion*
New
tech
nolo
gy
Exte
nsiv
e in
duct
ion*
Man
agem
ent
UK 2011 66,439 % 85 75 n/a 47 n/a 35 UK 2013 69,842 % 85 74 n/a 48 n/a 35 UK 2015 69,541 % 85 75 66 49 37 37 UK 2017 67,950 % 84 74 65 48 36 35 Country England 55,775 % 83 74 65 47 36 35 Northern Ireland 2,893 % 84 76 63 48 34 34 Scotland 4,999 % 86 74 63 50 34 34 Wales 4,283 % 86 74 66 48 38 36 Size 2 to 4 8,798 % 79 61 47 46 24 22 5 to 24 37,207 % 85 80 74 46 40 38 25 to 49 11,577 % 91 92 89 53 54 58 50 to 99 6,145 % 93 95 93 60 58 66 100-249 3,181 % 94 96 94 70 65 76 250+ 1,042 % 95 96 96 76 67 88 Sector Primary Sector & Utilities 2,961 % 81 72 43 41 21 18 Manufacturing 4,839 % 82 80 67 50 35 28 Construction 5,035 % 76 80 54 36 24 22 Wholesale & Retail 10,753 % 85 78 70 51 39 41 Hotels & Restaurants 6,493 % 83 85 80 34 47 48 Transport & Storage 2,753 % 84 73 66 42 35 32 Information & Communications 2,782 % 79 49 54 71 27 24 Financial Services 2,170 % 89 58 58 56 36 36 Business Services 11,009 % 84 59 57 53 31 29 Public Admin. 1,030 % 92 77 72 56 41 50 Education 5,308 % 91 91 79 51 47 56 Health & Social Work 7,369 % 88 88 78 42 49 48 Arts & Other Services 5,448 % 83 75 63 43 34 29

200
Table A.5.9 Percentage of training that has been health and safety or induction training (2011 – 2017)
Base: Establishments that had funded or arranged training in the previous 12 months
2011 2013 2015 2017
UK UK UK UK England Northern Ireland Scotland Wales
Unweighted base 67,950 55,775 2,893 4,999 4,283
% % % % % % % % Less than 20% 23 28 25 24 24 23 27 25 20-49% 24 22 23 21 21 23 23 21 50-80% 18 15 17 17 17 18 16 19 More than 80% but not all 5 3 4 4 4 4 3 4 All of it (100%) 7 9 11 12 13 12 10 10 None 18 19 15 16 17 16 17 16 Don’t know 5 3 5 5 5 5 4 5

201
Table A.5.10 Training to nationally recognised qualifications in the last 12 months among employers that train
Base: Establishments that had funded or arranged training in the previous 12 months.
Note: the final column shows the proportion of all employees in that size band or sector that were trained to a qualification (not the proportion of employees within establishments that train).
Note: ‘*’ refers to a figure of less than 50,000.
Unwtd. base
Any staff trained to a qualification
Number trained to a qualification
% of all trainees
trained to a qualification
% of all employees trained to a qualification
% % %
UK 67,950 45 3.2m 18 11 Size 2 to 4 8,798 35 0.3m 26 11 5 to 24 37,207 49 0.9m 24 14 25 to 49 11,577 62 0.5m 22 14 50 to 99 6,145 68 0.4m 19 12 100-249 3,181 72 0.5m 16 11 250+ 1,042 74 0.6m 11 8 Sector Primary Sector & Utilities 2,961 46 0.1m 25 13 Manufacturing 4,839 43 0.2m 18 9 Construction 5,035 51 0.2m 33 17 Wholesale & Retail 10,753 38 0.3m 12 7 Hotels & Restaurants 6,493 50 0.2m 18 11 Transport & Storage 2,753 39 0.1m 20 10 Information & Communications 2,782 31 * 9 5 Financial Services 2,170 51 0.1m 14 10 Business Services 11,009 39 0.5m 16 10 Public Admin. 1,030 56 0.1m 14 8 Education 5,308 66 0.3m 13 10 Health & Social Work 7,369 61 0.8m 26 21 Arts & Other Services 5,448 46 0.2m 23 14

202
Table A.5.11 Whether establishment has funded or arranged online training or e-learning, or other self-learning, over the past 12 months
Base: Establishments that had funded or arranged training in the previous 12 months.
2015 2017
Unwtd. base
% fu
ndin
g or
ar
rang
ing
onlin
e
% fu
ndin
g or
ar
rang
ing
othe
r
% fu
ndin
g or
ar
rang
ing
eith
er
Unwtd. base
% fu
ndin
g or
ar
rang
ing
onlin
e
% fu
ndin
g or
ar
rang
ing
othe
r
% fu
ndin
g or
ar
rang
ing
eith
er
UK 69,541 45 38 57 67,950 51 42 62
Country England 57,422 45 39 57 55,775 52 43 63
Northern Ireland 2,869 34 35 48 2,893 38 34 50
Scotland 4,894 44 36 55 4,999 51 41 61
Wales 4,356 43 37 56 4,283 50 41 62
Size 2 to 4 10,317 35 32 48 8,798 41 36 53
5 to 24 39,461 47 39 58 37,207 55 43 65
25 to 49 10,742 61 51 72 11,577 67 53 76
50 to 99 5,547 62 56 74 6,145 71 58 80
100-249 2,584 70 60 81 3,181 75 61 84
250+ 890 78 65 87 1,042 80 67 88
Sector Primary Sector & Utilities 2,807 18 22 31 2,961 23 24 35
Manufacturing 4,915 29 24 39 4,839 33 30 46
Construction 5,044 30 25 42 5,035 38 29 49
Wholesale & Retail 11,470 41 34 52 10,753 52 40 62
Hotels & Restaurants 6,849 49 39 61 6,493 57 43 65
Transport & Storage 3,103 30 29 42 2,753 35 28 45
Information & Communications 2,878 53 51 69 2,782 56 52 70
Financial Services 1,920 71 54 80 2,170 73 60 84
Business Services 10,623 48 40 60 11,009 52 44 64
Public Admin. 851 67 55 79 1,030 68 53 75
Education 5,300 65 55 76 5,308 75 56 82
Health & Social Work 7,941 62 55 75 7,369 69 59 79
Arts & Other Services 5,840 35 36 51 5,448 42 37 55

203
Table A.5.12 Total training expenditure and training spend per person trained and per employee by country and size (2011 - 2017), in 2017 prices
2011 2013 2015 2017
Total Per trainee Per employee Total Per trainee
Per employee
Total Per trainee Per employee Total Per trainee Per
employee £ £ £ £ £ £ £ £ £ £ £ £
UK 43.8bn 2,970 1,620 41.1bn 2,450 1,520 43.6bn 2,500 1,570 44.2bn 2,470 1,530 Country England 37.2bn 3,020 1,640 34.8bn 2,460 1,530 37.3bn 2,540 1,590 37.5bn 2,460 1,530 Northern Ireland
1.2bn 2,870 1,600 1.1bn 2,540 1,490 0.9bn 2,000 1,280 1.0bn 2,340 1,410
Scotland 3.8bn 2,770 1,600 3.4bn 2,250 1,450 3.3bn 2,220 1,390 3.7bn 2,420 1,510 Wales 1.6bn 2,480 1,390 1.9bn 2,580 1,600 2.1bn 2,710 1,730 2.0bn 2,790 1,610 Size 2-4 5.6bn 5,860 2,350 5.4bn 5,500 2,260 5.8bn 5,740 2,440 6.3bn 5,650 2,390 5-24 12.2bn 3,620 1,900 12.3bn 3,520 1,910 13.5bn 3,610 2,030 13.9bn 3,640 2,020 25-49 6.1bn 3,100 1,810 6.2bn 2,950 1,850 6.1bn 2,690 1,740 6.7bn 2,910 1,870 50-99 5.5bn 2,720 1,600 5.2bn 2,310 1,520 6.1bn 2,670 1,760 5.3bn 2,260 1,470 100+ 14.4bn 2,250 1,270 11.9bn 1,500 1,050 12.0bn 1,480 1,020 12.0bn 1,440 990 Base: Establishments completing the Investment in Training study. Note: figures for spend per person trained and per employee have been rounded to the nearest £10

204
Table A.5.13 Total training expenditure and training spend per person trained and per employee by sector (2011 - 2017), in 2017 prices
2011 2013 2015 2017
Total Per trainee
Per employee Total Per trainee
Per employee
Total Per trainee Per employee Total Per trainee Per
employee £ £ £ £ £ £ £ £ £ £ £ £ UK 43.8bn 2,970 1,620 41.1bn 2,450 1,520 43.6bn 2,500 1,570 44.2bn 2,470 1,53 Sector Primary Sector &
Utilities 1.6bn 4,980 2,280 0.8bn 2,190 1,150 1.3bn 3,930 1,870 1.1bn 2,670 1,38
Manufacturing 3.2bn 2,860 1,320 2.4bn 2,110 1,060 2.9bn 2,340 1,210 3.0bn 2,550 1,24 Construction 2.4bn 3,610 1,780 2.4bn 4,010 1,940 2.4bn 3,910 2,080 2.7bn 4,510 2,25 Wholesale & Retail 5.0bn 2,170 1,130 6.0bn 2,450 1,360 4.8bn 1,950 1,070 6.4bn 2,410 1,41 Hotels & Restaurants 2.9bn 3,080 1,680 2.5bn 2,310 1,370 3.1bn 2,480 1,590 3.1bn 2,310 1,44 Transport & Storage 2.0bn 3,650 1,580 1.3bn 1,770 1,050 1.4bn 2,030 1,160 1.5bn 2,290 1,17 Information & Comms 1.1bn 2,970 1,320 1.8bn 4,100 2,070 1.8bn 3,300 1,770 1.4bn 2,650 1,40 Financial Services 1.4bn 2,360 1,390 1.2bn 1,770 1,190 1.5bn 2,160 1,540 1.3bn 1,860 1,34 Business Services 8.3bn 3,700 1,910 8.1bn 2,990 1,810 9.4bn 3,270 1,960 9.7bn 2,990 1,80 Public Administration 3.1bn 3,290 1,990 2.0bn 2,110 1,420 1.9bn 1,910 1,410 2.2bn 2,940 1,73 Education 5.0bn 3,030 1,960 5.4bn 2,740 2,090 4.5bn 2,290 1,720 3.8bn 1,930 1,47 Health & Social Work 5.3bn 2,290 1,520 5.1bn 1,770 1,410 5.9bn 1,990 1,550 5.6bn 1,820 1,43 Arts & Other Services 2.3bn 3,500 1,930 2.0bn 2,620 1,640 2.6bn 3,380 2,050 2.4bn 2,970 1,77 Base: Establishments completing the Investment in Training study. Note: figures for spend per person trained and per employee have been rounded to the nearest £10.

205
Table A.5.14 Training expenditure spent on Further Education colleges, Universities or other Higher Education institutions, and the proportion of the total fees to external providers that this represents (in 2017 prices)
Base: Establishments completing the Investment in Training study.
Row percentages Unwtd Base
Total fees to external providers
Total fees to FE/HE
providers
% of fees to external providers paid to FE/HE
providers UK 12,466 £3.5bn £536m % 15 Country England 8,872 £3.1bn £463m % 15 Northern Ireland 859 £0.1bn £9m % 13 Scotland 1,407 £0.3bn £42m % 16 Wales 1,328 £0.1bn £22m % 18 Size 2 to 4 2,090 £0.6bn £110m % 18 5 to 24 6,988 £1.1bn £170m % 16 25 to 49 1,885 £0.5bn £61m % 12 50 to 99 947 £0.4bn £54m % 13 100+ 556 £0.9bn £141m % 15 Sector Primary Sector & Utilities 546 £0.1bn £17m % 17 Manufacturing 807 £0.3bn £40m % 15 Construction 857 £0.3bn £51m % 17 Wholesale & Retail 1,670 £0.5bn £75m % 17 Hotels & Restaurants 1,011 £0.1bn £18m % 14 Transport & Storage 534 £0.1bn £10m % 11 Information & Communications 573 £0.2bn £15m % 10 Financial Services 390 £0.1bn £13m % 14 Business Services 2,373 £0.9bn £173m % 18 Public Admin. 256 £0.2bn £21m % 13 Education 895 £0.3bn £42m % 15 Health & Social Work 1,478 £0.4bn £48m % 12 Arts & Other Services 1,076 £0.2bn £15m % 9

206
Table A.5.15 Unweighted base sizes for all establishments training, by country, size and sector (2011 – 2017)
Base: Establishments completing the Investment in Training study.
2011 2013 2015 2017 UK 11,027 12,522 12,614 12,466 Country England 74,156 75,255 75,129 8,872 Northern Ireland 3,921 4,014 4,019 859 Scotland 2,487 6,014 6,035 1,407 Wales 5,958 5,996 6,027 1,328 Size 2 to 4 1,774 2,317 1,963 2,090 5 to 24 6,542 6,953 7,661 6,988 25 to 49 1,452 1,722 1,779 1,885 50 to 99 708 928 782 947 100+ 551 602 429 556 Sector Primary Sector & Utilities 253 480 463 546 Manufacturing 816 882 937 807 Construction 655 906 826 857 Wholesale & Retail 1,815 1,971 1,813 1,670 Hotels & Restaurants 1,055 1,092 1,273 1,011 Transport & Storage 482 541 556 534 Information & Communications 380 414 579 573 Financial Services 220 369 344 390 Business Services 2,036 2,341 2,073 2,373 Public Admin. 231 211 176 256 Education 558 630 678 895 Health & Social Work 1,515 1,572 1,790 1,478 Arts & Other Services 1,011 1,113 1,106 1,076

207
Table A.5.16 Whether training employers would have liked to provide more training, and if so the main barriers (prompted)
Base: Column 1: Establishments that had funded or arranged any training in the previous 12 months; Columns 2-6: Establishments that would have liked to provide more training.
Main barriers among those wanting to provide more training
Unwtd. base
% w
ould
hav
e lik
ed to
pr
ovid
e m
ore
trai
ning
Unwtd. base
Lack
of f
unds
/ tr
aini
ng
expe
nsiv
e
Can
’t sp
are
time
for
empl
oyee
s to
be
trai
ning
Har
d to
find
the
time
to
orga
nise
trai
ning
Lack
app
ropr
iate
trai
ning
/ q
ualif
icat
ions
in th
e su
bjec
t are
as w
e ne
ed
Diff
icul
ty fi
ndin
g pr
ovid
ers
to d
eliv
er
whe
re a
nd w
hen
we
wan
t
UK 67,950 45 31,525 % 51 50 15 5 5
Country England 55,775 44 25,481 % 51 49 15 5 4
Northern Ireland 2,893 47 1,422 % 58 51 16 4 6
Scotland 4,999 51 2,598 % 50 58 12 5 8
Wales 4,283 46 2,024 % 57 51 14 6 7
Size 2 to 4 8,798 40 3,477 % 52 49 15 5 5
5 to 24 37,207 46 16,787 % 49 51 14 5 4
25 to 49 11,577 50 5,782 % 54 50 14 4 4
50 to 99 6,145 51 3,112 % 56 51 14 4 3
100-249 3,181 54 1,735 % 59 53 12 3 3
250+ 1,042 61 632 % 67 50 11 2 3
Sector Primary Sector & Utilities 2,961 36 1,122 % 50 52 12 8 8
Manufacturing 4,839 40 2,084 % 50 53 14 7 5
Construction 5,035 39 1,994 % 54 52 12 4 5
Wholesale & Retail 10,753 47 4,983 % 39 54 16 4 4
Hotels & Restaurants 6,493 49 3,386 % 45 42 15 4 3
Transport & Storage 2,753 42 1,157 % 49 48 17 4 4
Information & Communications 2,782 45 1,318 % 55 51 19 5 3
Financial Services 2,170 35 757 % 36 58 18 4 4
Business Services 11,009 40 4,494 % 51 53 17 4 4
Public Admin. 1,030 48 478 % 56 50 14 6 8
Education 5,308 57 3,135 % 74 47 9 4 5
Health & Social Work 7,369 50 3,759 % 61 48 11 6 8
Arts & Other Services 5,448 51 2,858 % 62 43 15 6 4

208
Table A.5.17 Reasons for not funding or arranging training over the last 12 months (unprompted)
Base: Establishments that had not funded or arranged training or development in the previous 12 months.
Note: Responses are only shown if given by one per cent or more of respondents in 2015.
‘*’ denotes a figure larger than zero but smaller than 0.5
2011 2013 2015 2017
UK UK UK UK England Northern Ireland Scotland Wales
Unweighted base 19,363 20,704 20,719 18,293 14,731 1,041 956 1,565
% % % % % % % % All our staff are fully proficient / no need for training 64 69 68 67 66 71 70 70
No money available for training 11 10 7 7 7 7 6 8
Training is not a priority for the establishment 9 7 7 9 9 6 9 7
No training available in relevant subject area 7 5 5 4 4 5 3 3
Managers have lacked the time to organise training 3 3 2 3 3 2 3 3
Employees are too busy to undertake training 2 2 2 2 2 2 1 3
Employees are too busy to give training 1 2 2 1 1 1 2 2
External courses are too expensive 2 2 1 1 1 1 2 2
Learn by experience / as you go 3 2 3 2 2 3 2 4
Business not operating long enough / new business 1 1 1 1 1 * 1 1
Small firm / training not needed due to size of establishment 1 1 1 2 2 1 1 2
Trained staff will be poached by other employers 1 1 1 1 1 1 1 1
Courses interested in not available 1 1 1 1 1 * 1 2
No new staff (only train new staff) * 1 * 1 1 * * *
No particular reason 5 5 6 6 6 5 6 3

209
Table A.5.18a Incidence of wider development activities among non-trainers, by country and sizeband
Base: Establishments that had not funded or arranged training or development in the previous 12 months. ** denotes a figure not shown due to a low base size of fewer than 30 establishments Note: In previous years, the incidence of wider development activities among was asked of all establishments –this year, the question was only asked of non-training establishments. In order to maintain comparability, figures from previous years have been adjusted to reflect the responses on non-trainers only.
2011 2013 2015 2017
2011
Unw
td. b
ase
2013
Unw
td. b
ase
2015
Unw
td. b
ase
2017
Unw
td. b
ase
Any
wid
er
deve
lopm
ent a
ctiv
ities
Any
wid
er
deve
lopm
ent a
ctiv
ities
Any
wid
er
deve
lopm
ent a
ctiv
ities
Any
wid
er
deve
lopm
ent a
ctiv
ities
Sup
ervi
sion
gui
ding
em
ploy
ee th
roug
h th
eir
job
role
Opp
ortu
nitie
s fo
r sta
ff to
w
atch
oth
ers
carry
out
th
eir r
oles
Allo
wed
to p
erfo
rm ta
sks
beyo
nd th
eir j
ob ro
les
UK 20,083 21,437 21,669 18,293 % 66 68 68 65 52 49 48
Country
England 17,443 17,468 17,707 14,731 % 66 69 69 66 53 49 48
Northern Ireland 1,018 1,120 1,150 1,041 % 69 65 71 61 49 46 45
Scotland 317 1,130 1,141 956 % 65 66 67 65 52 46 45
Wales 1,305 1,719 1,671 1,565 % 59 61 64 60 49 46 44
Size
2 to 4 8,784 9,478 10,210 8,181 % 60 63 62 60 46 42 43
5 to 24 10,012 10,764 10,123 9,034 % 81 83 84 82 71 68 61
25 to 49 823 824 915 774 % 86 89 93 90 84 78 68
50 to 99 296 269 289 210 % 90 90 92 88 79 76 66
100-249 120 74 105 74 % 92 91 95 89 82 78 61
250+ 48 28 27 20 % 95 ** ** ** ** ** **

210
Table A.5.18b Incidence of wider development activities among non-trainers, by sector
Base: Establishments that had not funded or arranged training or development in the previous 12 months.
Note: In previous years, the incidence of wider development activities among was asked of all establishments –this year, the question was only asked of non-training establishments. In order to maintain comparability, figures from previous years have been adjusted to reflect the responses on non-trainers only.
2011 2013 2015 2017
2011
Unw
td. b
ase
2013
Unw
td. b
ase
2015
Unw
td. b
ase
2017
Unw
td. b
ase
Any
wid
er
deve
lopm
ent
activ
ities
Any
wid
er
deve
lopm
ent
activ
ities
Any
wid
er
deve
lopm
ent
activ
ities
Any
wid
er
deve
lopm
ent
activ
ities
Sup
ervi
sion
gui
ding
em
ploy
ee th
roug
h th
eir j
ob ro
le
Opp
ortu
nitie
s fo
r sta
ff to
wat
ch o
ther
s ca
rry
out t
heir
role
s
Allo
wed
to p
erfo
rm
task
s be
yond
thei
r job
ro
les
UK 20,083 21,437 21,669 18,293 % 66 68 68 65 52 49 48 Sector Primary Sector & Utilities 752 2002 2037 1,905 % 54 53 50 51 39 37 33 Manufacturing 2,345 2294 1912 1,664 % 63 66 67 62 47 45 46 Construction 2,177 2425 2430 1,741 % 57 59 62 56 45 39 34 Wholesale & Retail 4,162 4862 4656 3,535 % 69 74 72 69 56 53 52 Hotels & Restaurants 2,236 2127 2071 1,830 % 71 75 78 74 64 58 54 Transport & Storage 1,600 1287 1577 1,261 % 62 68 67 61 50 44 39 Information & Communications 780 664 1378 1,122 % 68 70 65 66 47 46 54 Financial Services 393 506 629 487 % 76 75 71 69 58 48 50 Business Services 3,029 2884 2520 2,490 % 65 68 68 66 51 48 50 Public Admin. 140 81 96 116 % 75 87 80 80 66 67 59 Education 305 228 215 169 % 70 77 82 71 57 59 60 Health & Social Work 583 525 615 474 % 77 82 81 85 77 65 66 Arts & Other Services 1,581 1552 1533 1,499 % 70 73 74 67 52 49 47

211
Chapter 6: High Performance Working practices and product market strategies Table A.6.1 Adoption of practices by sector
Base: All establishments in Module 1. Note: Table displays all HPW practices adopted by 30% or more of establishments in Module 1.
14+
out o
f 21
HPW
pr
actic
es
Equa
l op
port
unity
po
licy
On
or o
ff jo
b tr
aini
ng
Ann
ual
perf
orm
ance
re
view
Bus
ines
s pl
an
Task
var
iety
Trai
ning
ne
eds
asse
ssm
ent
Trai
ning
pla
n
Task
di
scre
tion
Form
ally
as
sess
pe
rfor
man
ce
afte
r tra
inin
g
Flex
ible
w
orki
ng
Aw
ards
pe
rfor
man
ce
rela
ted
bonu
ses
Trai
ning
bu
dget
Flex
ible
be
nefit
s
Indi
vidu
al
perf
orm
ance
re
late
d pa
y
Unwtd. base % % % % % % % % % % % % % % %
UK 53,993 9 82 67 66 57 52 51 48 47 43 40 38 37 36 32 Sector Primary Sector & Utilities 2,842 3 62 53 34 48 63 34 30 53 28 47 21 21 22 17
Manufacturing 7,147 7 80 63 60 55 47 47 40 44 37 34 40 30 33 30 Construction 5,304 3 74 59 45 34 54 42 35 50 32 36 32 24 26 25 Wholesale & Retail 36,205 9 84 62 67 56 47 48 49 41 42 33 49 32 41 34 Hotels & Restaurants 18,824 11 82 66 65 53 39 51 54 36 49 50 40 34 31 30 Transport & Storage 4,142 8 83 64 62 51 41 48 48 41 40 34 37 34 32 28 Information & Communications 4,582 5 77 62 63 59 63 39 33 63 31 56 46 31 41 41
Financial Services 4,621 12 87 82 85 78 48 66 66 45 55 40 50 46 49 43 Business Services 34,437 8 84 68 69 60 55 49 46 51 40 43 46 38 41 41 Public Admin. 4,716 25 95 91 92 77 57 79 72 41 65 48 17 78 48 25 Education 10,845 18 97 92 94 78 56 81 74 43 75 25 18 72 42 37 Health & Social Work 20,832 15 97 89 92 76 55 78 78 46 71 38 22 62 40 23 Arts & Other Services 8,140 6 85 69 68 57 54 52 48 50 45 43 28 40 32 26

212
Table A.6.2 HPW status by size
Base: All establishments in Module 1. Note: ‘*’ denotes a figure greater than zero but smaller than 0.5.
Table A.6.3 HPW status by multi- or single-site
Base: All establishments in Module 1. Note: ‘*’ denotes a figure greater than zero but smaller than 0.5. Table shows row percentages.
Table A.6.4 Characteristics of CUSP employers
Base: All establishments in Module 1.
HPW: Yes HPW: No
Unwtd. base 6,476 37,517 % % 2 to 4 17 57 5 to 24 46 36 25 to 49 16 4 50 to 99 10 2 100-249 7 1 250+ 4 *
Unwtd. base Single site
Multi-site (head office)
Multi-site (not head
office)
Multi-site (don’t
know if head
office)
All multi-site
HPW - Yes 6,476 % 31 12 57 * 69
HPW - No 37,517 % 70 8 22 * 30
HPW CUSP Not HPW (excluding CUSP group)
Characteristics of employers Unwtd. base 6,476 14,754 22,763 % % % Employers with vacancies 41 29 13 Employers with HtF vacancies
(base: employers with vacancies)
34 37 41
Employers with skills gaps 22 17 11 Impact of skills gaps Unwtd. base 1,691 3,642 3,861 % % % Major 17 17 17 Minor 54 50 48 None 28 33 35

213
Table A.6.5 Summary of recruitment activity, experience of hard-to-fill vacancies (HtfVs) and skill-shortage vacancies (SSVs) by HPW classification and size
Base: All establishments in Module 1. ‘HtFVs / vacs’ is shown as all hard-to-fill vacancies as a proportion of all private sector vacancies; ‘‘SSVs / vacs’ is shown as all skill-shortage vacancies as a proportion of all private sector vacancies; ‘SSVs / HtFVs’ is shown as all skill-shortage vacancies as a proportion of all hard-to-fill private sector vacancies.
Have vacancies Have HtFVs Have SSVs HtFVs as % of vacancies
SSVs as % of vacancies
SSVs as % of HtFVs
Unweighted base % % % % % % HPW Employers 2-4 195 30 15 11 37 25 69 5-24 2789 33 11 8 33 23 71 25-49 1571 48 15 11 26 17 68 50-99 966 57 17 13 30 21 70 100-249 680 71 22 19 15 12 79 250+ 275 73 25 19 27 11 40 5-99 5326 39 12 9 30 21 70 Non-HPW Employers 2-4 8,369 10 5 4 49 36 73 5-24 20,976 23 9 7 39 26 67 25-49 4,614 43 17 12 36 22 61 50-99 2,295 54 20 14 29 19 63 100-249 998 66 23 17 27 18 65 250+ 265 76 26 19 34 21 61 5-99 27,885 27 11 8 36 24 65

214
Table A.6.6 Training activity among HPW employers and non-HPW employers by size and sector
Any training Proportion of staff trained Unwtd. base % % Size HPW Employers 2 to 4 195 93 93 5 to 24 2,789 97 79 25 to 49 1,571 97 75 50 to 99 966 98 74 100-249 680 98 76 250+ 275 98 69 5-99 5,326 97 76 Non-HPW Employers 2 to 4 8,369 53 42 5 to 24 20,976 76 54 25 to 49 4,614 91 61 50 to 99 2,295 94 63 100-249 998 94 68 250+ 265 94 64 5-99 27,885 79 58 Sector HPW Employers Primary Sector & Utilities 116 99 82 Manufacturing 345 98 59 Construction 232 99 72 Wholesale & Retail 1,336 95 80 Hotels & Restaurants 834 96 83 Transport & Storage 192 94 59 Information & Communications 187 93 67 Financial Services 159 98 83 Business Services 1,039 96 71 Public Admin. 127 96 60 Education 685 99 77 Health & Social Work 838 99 80 Arts & Other Services 386 92 75 Non-HPW Employers Primary Sector & Utilities 2,369 52 48 Manufacturing 2,880 60 43 Construction 3,240 58 47 Wholesale & Retail 6,025 58 51 Hotels & Restaurants 3,470 63 56 Transport & Storage 1,809 61 52 Information & Communications 1,788 61 50 Financial Services 1,186 80 69 Business Services 5,876 65 59 Public Admin. 490 89 53 Education 2,050 90 74 Health & Social Work 3,185 87 76 Arts & Other Services 3,149 68 59 Base: All establishments in Module 1

215
Appendix B: National time series tables The UK-wise ESS series was designed in such a way as to, where possible, preserve key time series measures from the surveys carried out previously by the individual nations.
For the constituent nations of the UK, the degree to which we can track time series prior to 2011 depends on the approach the nation took to their predecessor skills survey.
England: England carried out the National Employer Skills Survey (NESS) biennially from 2005, and annually from 2001 prior to this. The population used in NESS matches that used from ESS 2013 onwards (2+ employment), therefore it is possible to make some comparisons over a longer time period. It should be noted that the weighting strategy of the NESS surveys was based on Sector Skills Council (SSC) defined sectors rather than the SIC sector groupings used in the ESS series, therefore some caution needs to be exercised when making sector comparisons with data prior to 2011.
Northern Ireland: The Northern Ireland Skills Monitoring Survey (NISMS) was conducted in 2005 and 2008 on a 1+ employee population. This does not match the population used in from ESS 2013 onwards, therefore no time series comparisons can be drawn prior to 2011.
Scotland: The Scottish Employer Skills Survey (SESS) ran annually from 2006 to 2010. The surveys were conducted using a 1+ employee population which does not match the population used from ESS 2013 onwards, therefore no time series comparisons can be drawn prior to 2011.
Wales: Future Skills Wales (FSW) was conducted in 2005 on a 2+ employment population. This gives some scope to make comparisons with this point in time, however it should be noted that the weighting strategy employed in 2005 used different sector and size band definitions to those used in the ESS series, therefore some caution needs to be exercised when making comparisons with the 2005 data.
The tables below provide time series for key figures in the ESS survey, alongside those in the earlier legacy surveys, where appropriate.

216
England Time Series: Key Figures
NES
S 03
NES
S 05
NES
S 07
NES
S 09
ESS
2011
ESS
2013
ESS
2015
ESS
2017
Vacancies and skill-shortage vacancies (SSVs)
% of establishments with any vacancies 17% 17% 18% 12% 14% 15% 20% 20%
% of establishments with any hard-to-fill vacancies 8% 7% 7% 3% 5% 5% 8% 8%
% with SSVs n/a 5% 5% 3% 3% 4% 6% 6%
% of all vacancies which are SSVs n/a 25% 21% 16% 15% 22% 23% 22%
Number of vacancies 679,000 574,000 620,000 386,000 501,000 560,000 797,000 873,000 Number of hard-to-fill vacancies 271,000 204,000 184,000 85,000 107,000 160,000 262,000 287,000
Number of skill-shortage vacancies 135,000 143,000 130,000 63,000 77,000 125,000 180,000 194,000
Skills gaps
% of establishments with any staff not fully proficient
22% 16% 15% 19% 17% 15% 14% 13%
Number of skills gaps 2.4m 1.26m 1.36m 1.70m 1.28m 1.17m 1.18m 1.06m
Number of staff not fully proficient as a % of employment
11% 6% 6% 7% 6% 5% 5% 4%
Training
% of establishments training staff over the last 12 months
59% 65% 67% 68% 65% 66% 66% 66%
% of establishments providing off-the-job training in the last 12 months
n/a 46% 46% 51% 47% 48% 48% 48%
% of workforce trained 53% 61% 63% 56% 54% 62% 63% 62% Total number of training days n/a n/a n/a 109m 97m 95m 100m 98m

217
Northern Ireland Time Series: Key Figures
ESS
2011
ESS
2013
ESS
2015
ESS
2017
Vacancies and skill-shortage vacancies (SSVs)
% of establishments with any vacancies 10% 10% 13% 16%
% of establishments with any hard-to-fill vacancies 3% 3% 4% 6%
% with SSVs 2% 3% 3% 5%
% of all vacancies which are SSVs 21% 19% 14% 21%
Number of vacancies 18,000 15,000 20,000 23,000 Number of hard-to-fill vacancies 5,000 4,000 4,000 7,000
Number of skill-shortage vacancies 4,000 3,000 3,000 5,000
Skills gaps
% of establishments with any staff not fully proficient 13% 14% 9% 12%
Number of skills gaps 34,000 38,000 24,000 28,000
Number of staff not fully proficient as a % of employment 4% 5% 3% 4%
Training
% of establishments training staff over the last 12 months 65% 63% 62% 63%
% of establishments providing off-the-job training in the last 12 months 48% 49% 47% 47%
% of workforce trained 56% 59% 64% 60%
Total number of training days 2.7m 2.7m 2.6m 2.6m

218
Scotland Time Series: Key Figures
ESS
2011
ESS
2013
ESS
2015
ESS
2017
Vacancies and skill-shortage vacancies (SSVs)
% of establishments with any vacancies 14% 15% 19% 20%
% of establishments with any hard-to-fill vacancies 4% 6% 8% 8%
% with SSVs 3% 4% 6% 6%
% of all vacancies which are SSVs 15% 25% 24% 24%
Number of vacancies 45,000 55,000 74,000 75,000 Number of hard-to-fill vacancies 9,000 18,000 25,000 30,000
Number of skill-shortage vacancies 7,000 13,000 18,000 18,000
Skills gaps
% of establishments with any staff not fully proficient 21% 19% 14% 16%
Number of skills gaps 121,000 135,000 118,000 122,000
Number of staff not fully proficient as a % of employment 5% 6% 5% 5%
Training
% of establishments training staff over the last 12 months 73% 70% 71% 71%
% of establishments providing off-the-job training in the last 12 months 53% 53% 52% 51%
% of workforce trained 58% 65% 62% 62%
Total number of training days 9.8m 10.0m 9.9m 10.0m

219
Wales Time Series: Key Figures
FSW
05
ESS
2011
ESS
2013
ESS
2015
ESS
2017
Vacancies and skill-shortage vacancies (SSVs)
% of establishments with any vacancies 21% 12% 14% 17% 17%
% of establishments with any hard-to-fill vacancies 10% 4% 5% 7% 8%
% with SSVs 4% 3% 4% 6% 6%
% of all vacancies which are SSVs 14% 18% 20% 24% 27%
Number of vacancies 38,000 23,000 26,000 37,000 36,000 Number of hard-to-fill vacancies 13,000 7,000 7,000 12,000 13,000
Number of skill-shortage vacancies 5,000 4,000 5,000 9,000 10,000
Skills gaps
% of establishments with any staff not fully proficient 18% 16% 16% 14% 13%
Number of skills gaps 64,000 54,000 67,000 54,000 57,000
Number of staff not fully proficient as a % of employment 6% 5% 6% 5% 5%
Training
% of establishments training staff over the last 12 months n/a 63% 62% 63% 62%
% of establishments providing off-the-job training in the last 12 months n/a 47% 47% 49% 47%
% of workforce trained n/a 56% 62% 64% 58%
Total number of training days n/a 4.9m 5.6m 5.4m 4.4m

220
Appendix C: Industry coding Each establishment was allocated to one of 13 sectors, based on their Standard Industrial Classification (SIC). SIC 2007 was used to classify establishments using the following method. Using the four-digit Standard Industrial Classification (SIC) supplied for each record from the Market Location database, a description of business activity was read out to each respondent. If they agreed that this description matched the main activity undertaken at the establishment, then the SIC on Market Location’s database was assumed to be correct. If, however, the respondent felt the description did not correspond to their main business activity at the site (around a fifth of cases), a verbatim response was collected to find out what they do. At the analysis stage this was coded to a four-digit SIC which was then used as the basis for allocation into sector.
The table below shows the 13 sectors and their corresponding SIC 2007 definitions.55
Sector SIC 2007
Primary Sector and Utilities
A - Agriculture, forestry and fishing (01-03) Including farming, hunting and other related service activities, forestry and logging, fishing and aquaculture B - Mining and quarrying (05-09) Including mining of coal, metals, sand/stone/clay, and extraction of crude petroleum and natural gas D - Electricity, gas, steam and air conditioning supply (35) E - Water supply, sewerage, waste management and remediation activities (36-39) Including electric power generation, transmission and distribution, manufacture of gas and distribution of gaseous fuels, steam and air conditioning supply, water collection, treatment and supply, sewerage and waste collection
Manufacturing
C - Manufacturing (10-33) Including manufacture of food and beverage, textiles, chemicals and chemical products, basic pharmaceutical products, other mineral products, manufacture of metals and metal products, machinery, computer and electronic products and equipment, motor vehicles and other transport equipment, furniture, and repair and installation of machinery and equipment
Construction F - Construction (41-43) Including the construction of buildings, civil engineering (constructing roads, railways and other utility projects), demolition, and specialised activities such as electrical installation, roofing and scaffold erection
Wholesale and Retail
G - Wholesale and retail trade; repair of motor vehicles and motor cycles (45-47) Including sale, maintenance and repair of motor vehicles, parts and accessories, non-vehicle wholesale (for example agriculture, food, household goods), and the retail trade of all products whether in stores, stalls, markets, mail order or online
55 UK Standard Industrial Classification of Economic Activities 2007 (SIC 2007) https://www.gov.uk/government/publications/standard-industrial-classification-of-economic-activities-sic

221
Sector SIC 2007 Hotels and Restaurants
I - Accommodation and food service activities (55-56) Including hotels, campsites, youth hostels, holiday centres, villages and other short stay accommodation, restaurants and takeaways, event catering and licensed clubs, pubs and bars
Transport and Storage
H - Transport and storage (49-53) Including land, water and air transport (passenger and freight), warehousing and support activities for transportation, postal and courier activities,
Information and Communications
J - Information and communication (58-63) Including publishing (books, journals, newspapers etc. and software/computer games), television, film and music production, broadcasting, telecommunications, computer programming and consultancy, information service activities (e.g. data processing and hosting)
Financial Services K - Financial and insurance activities (64-66) Including banks and building societies, activities of holding companies, trusts, funds and similar financial entities, credit granting, pensions, insurance and reinsurance
Business services
L - Real estate activities (68) M - Professional, scientific and technical activities (69-75)
N - Administrative and support service activities (77-82) Including the buying, selling and renting of real estate, legal activities, accounting, bookkeeping and auditing, management consultancy, architectural and engineering activities, scientific research and development, advertising and market research, specialist design, photographic activities, translation and interpretation, veterinary activities, renting and leasing of tangible goods (motors, household, machinery), employment agencies, travel agencies and tour operations, security and investigation activities, office administration and business support
Public Administration
O - Public administration and defence; compulsory social security (84) Including administration of the State and economic and social policy of the community, provision of services to the community such as defence activities, foreign affairs, justice and judicial activities, fire service and compulsory social security activities
Education P - Education (85) Including pre-primary, primary, secondary and higher education, other education (such as sports, driving schools, cultural education), educational support activities
Health and Social Work
Q - Human health and social work activities (86-88) Including Hospitals, medical and dental practices, residential care, social work activities
Arts, entertainment, recreation and other service activities
R - Arts, entertainment and recreation (90-93)
S - Other service activities (94-96) Including performing arts, libraries and museums, gambling and betting, sports facilities, amusement and recreation activities, activities of membership organisations (religious, political, trade union, professional), personal services (hairdressing, beauty, textile cleaning, well-being activities, funeral activities)
NOT COVERED IN SURVEY
T - Activities of households as employers; undifferentiated goods and services producing activities of households for own use (97-98)
U - Activities of extraterritorial organisations and bodies (99) Including households as employers of domestic personnel, private households producing goods for own use

222
Appendix D: Occupational Coding The occupational data collected in the survey were collected both pre-coded and verbatim. The
former included the occupational breakdown of employment (question D5A to D8) where
respondents were asked how many of their workforce fell into each of the nine major (one-digit)
Standard Occupation Classification (SOC) 2010 categories (Managers, Directors and Senior
Officials through to Elementary occupations). However, on vacancy measures (for example the
occupations in which vacancies exist – question C7) this information was collected verbatim.
This was then coded at the analysis stage, where possible to a four-digit level SOC, if not three,
two- or one-digit level.
Examples of what might fall into each occupational band are as follows:
Occupational group Primary sectors (Primary
Sector & Utilities, Manufacturing, Construction
Service sectors (Retail, Business, Finance,
Transport, etc.)
Public sector (Public Admin, Health, Education,
etc.)
Managers, Directors and Senior Officials
Site managers, Department Heads, Shift Managers (not
supervisors)
Directors, Managers / Branch/site managers, shift managers (not supervisors
Police inspectors and above, department heads, Head teachers, Senior Officials
Professionals
Professional engineers, software and IT
professionals, accountants, chemists, scientific
researchers
Solicitors, lawyers, accountants, IT
professionals, economists, architects, actuaries
Doctors, nurses, midwives, teachers, social workers,
librarians
Associate Professionals
Science and engineering technicians, lab technicians, IT technicians, accounting
technicians
Insurance underwriters, finance/investment analysts
and advisers, writers/journalists, buyers,
estate agents
Junior police/fire/prison officers, therapists,
paramedics, community workers, H&S officers,
housing officers
Administrative staff Secretaries, receptionists,
PAs, telephonists, bookkeepers
Secretaries, receptionists, PAs, communication
operators, market research interviewers, clerks
Secretaries, receptionists, PAs, local government
officers and assistants, office assistants, library and database assistants
Skilled Trades
Farmers, electricians, machine setters / tool makers, carpenters,
plasterers
Motor mechanics, printers, TV engineers, butchers Chefs
Caring, Leisure and Other Service Occupations
Care assistants, nursery nurses
Travel agents, travel assistants, hairdressers,
housekeepers
Care assistants, home carers, nursery nurses, ambulance staff, pest control, dental nurses,
caretakers
Sales and customer service occupations
Customer facing roles: sales staff and call centre agents
Sales assistants and retail cashiers, telesales, call
centre agents Customer care operations
Process, plant and machine operatives
Routine operatives, drivers, machine operators, sorters
and assemblers
HGV, van, fork-lift, bus and taxi drivers Drivers, vehicle inspectors
Elementary occupations
Labourers, packers, goods handling and storage staff
Bar staff, shelf fillers, catering assistants,
waiters/waitresses, cleaners
Labourers, cleaners, road sweepers, traffic wardens,
security guards

223
Appendix E: Sampling error and statistical confidence Sampling errors for the survey results overall and for key sub-groups are presented in Table E.1. Figures have been based on a survey result of 50% (the ‘worst’ case in terms of statistical reliability) and have used a 95% confidence level. Where the table indicates that a survey result based on all respondents has a sampling error of ±0.32%, this should be interpreted as follows: ‘for a question asked of all respondents where the survey result is 50%, we are 95% confident that the true figure lies within the range 49.64% to 50.36%’.
As a note, the calculation of sampling error has taken into account the finite population correction factor to account for cases where we are measuring a significant portion of the population universe (i.e. even if two sample sizes are the same, the sampling error will be lower if in one case a far higher proportion of the population was covered).
These confidence intervals are based on the assumptions of probability random sampling and a normal distribution of responses.
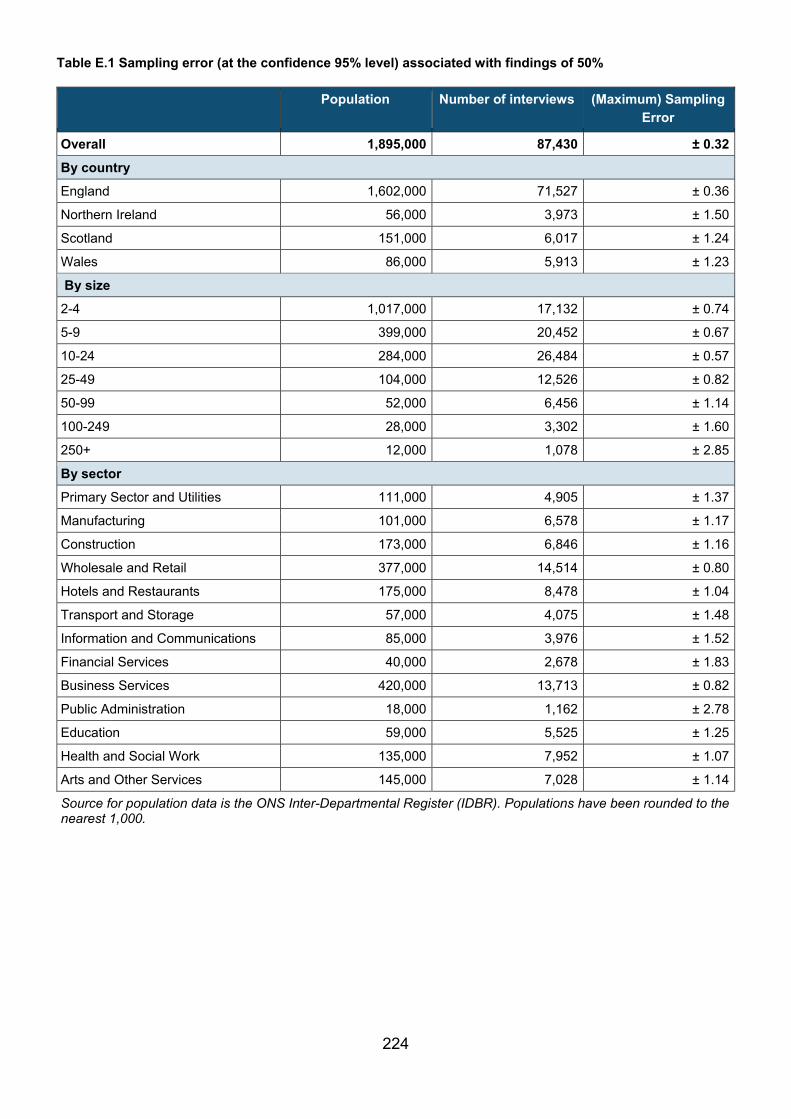
224
Table E.1 Sampling error (at the confidence 95% level) associated with findings of 50%
Population Number of interviews (Maximum) Sampling Error
Overall 1,895,000 87,430 ± 0.32 By country England 1,602,000 71,527 ± 0.36
Northern Ireland 56,000 3,973 ± 1.50
Scotland 151,000 6,017 ± 1.24
Wales 86,000 5,913 ± 1.23
By size 2-4 1,017,000 17,132 ± 0.74
5-9 399,000 20,452 ± 0.67
10-24 284,000 26,484 ± 0.57
25-49 104,000 12,526 ± 0.82
50-99 52,000 6,456 ± 1.14
100-249 28,000 3,302 ± 1.60
250+ 12,000 1,078 ± 2.85
By sector Primary Sector and Utilities 111,000 4,905 ± 1.37
Manufacturing 101,000 6,578 ± 1.17
Construction 173,000 6,846 ± 1.16
Wholesale and Retail 377,000 14,514 ± 0.80
Hotels and Restaurants 175,000 8,478 ± 1.04
Transport and Storage 57,000 4,075 ± 1.48
Information and Communications 85,000 3,976 ± 1.52
Financial Services 40,000 2,678 ± 1.83
Business Services 420,000 13,713 ± 0.82
Public Administration 18,000 1,162 ± 2.78
Education 59,000 5,525 ± 1.25
Health and Social Work 135,000 7,952 ± 1.07
Arts and Other Services 145,000 7,028 ± 1.14
Source for population data is the ONS Inter-Departmental Register (IDBR). Populations have been rounded to the nearest 1,000.

225
Appendix F: Weighted base sizes
Base: All establishments
UK England NI Scotland Wales Overall 1,895,140 1,602,193 55,979 150,502 86,466 Chapter 2: Recruitment and skill-shortage vacancies With a vacancy 374,706 320,596 8,816 30,261 15,032 With a hard-to-fill vacancy 150,872 128,243 3,383 12,628 6,618 With a skill-shortage vacancy 112,585 95,249 2,522 9,634 5,179 Chapter 3: The Internal Skills Challenge With at least one skills gap 249,501 208,086 6,532 23,887 10,995 With at least one employee with more qualifications and skills than job role requires
656,675 552,077 20,653 52,965 30,979
Chapter 4: Training and Workforce Development Providing any training 1,250,563 1,055,933 35,150 106,169 53,311 Any on-the-job training 1,009,537 854,012 26,654 87,549 41,322 Any off-the-job training 910,012 766,301 26,285 77,038 40,389 Both on- and off-the-job training 668,987 564,380 17,789 58,419 28,400
Providing no training for staff 644,577 546,260 20,829 44,333 33,155 Providing training towards a nationally recognised qualification 567,712 481,013 15,507 44,031 27,160
Chapter 5: High Performance Working 14 out of 21 HPW practices 162,637 141,038 3,313 11,843 6,443

226
Appendix G: References Campbell, M. (2016) The UK’s Skills Mix: Current Trends and Future Needs. Government Office for Science.
HM Government (2017) Industrial Strategy: Building a Britain Fit for the Future. Department for Business, Energy and Industrial Strategy.
Hogarth, T. and Wilson, R. (2001) Skills Matter: A Synthesis of Research on the Extent, Causes, and Implications of Skill Deficiencies. Institute of Employment Research.
Office for National Statistics (2017) UK Labour Market: October 2017 Statistical Bulletin.
Office for National Statistics (2017) Migration Statistics Quarterly Report: August 2017 Statistical Bulletin.
Shury, J. et al. (2017) Employer Perspectives Survey 2016. Department for Education.
Taylor, M. (2017) Good Work: The Taylor Review of Modern Working Practices.

227
© IFF Research 2018
Reference: DFE-RR693
ISBN: 978-1-78105-928-9
The views expressed in this report are the authors’ and do not necessarily reflect those of the Department for Education.
The views expressed in this report are the authors’ and do not necessarily reflect those of the Department for Education.
Any enquiries regarding this publication should be sent to us at:
[email protected] or www.education.gov.uk/contactus
This document is available for download at www.gov.uk/government/publications