Employer Health Benefits 2007 Annual Survey - Report · Employer Health Benefits 2007 Annual...
187
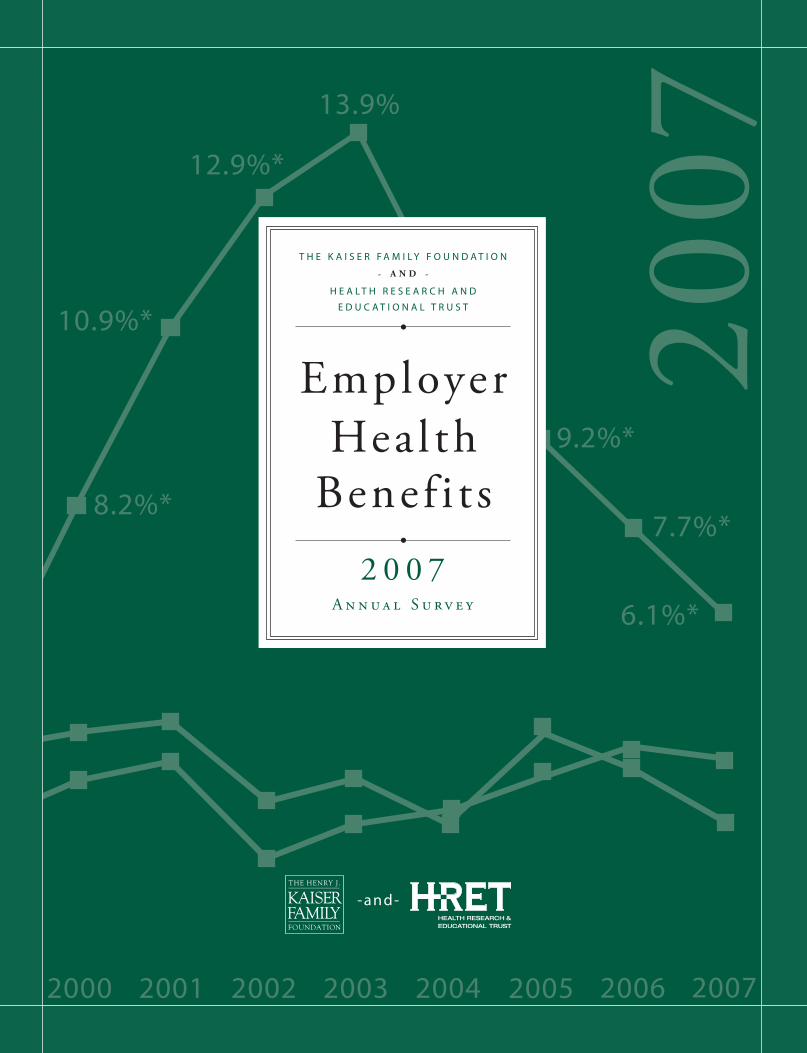
12.9%* 8.2%* 9.2%* 7.7%* 6.1%* 10.9%* 13.9% 2001 2000 2002 2003 2004 2005 2006 2007 2007 -and- THE KAISER FAMILY FOUNDATION - AND - HEALTH RESEARCH AND EDUCATIONAL TRUST 2007 Annual Survey Employer Health Benefits
Transcript of Employer Health Benefits 2007 Annual Survey - Report · Employer Health Benefits 2007 Annual...
0%
2%
4%
6%
8%
10%
2%
4%
6%
8%
10%
12%
14%
16%
18%
1993 19941988 1989 1990 1991 1992 1995 1996
5.3%*
8.5%
12.0%
18.0%
14.0%
12.9%*
8.2%*
11.2%
9.2%*
7.7%*
6.1%*
0.8%
10.9%*
13.9%
19991997 1998 20012000 2002 2003 2004 2005 2006 2007
2007
Individual copies of this publication (#7672) are available on the Kaiser Family Foundation’s website at www.kff.org.
Multiple copies may be obtained from HRET by calling 1-800-242-2626 (order #097516).
September 2007
Employer H
ealth Benefits 20
07
An
nu
Al
Su
Rv
Ey
T
HE
KA
ISE
R F
AM
Ily F
ou
nd
AT
Ion
-An
d- H
EA
lTH
RE
SE
AR
cH
An
d E
du
cA
TIo
nA
l T
Ru
ST
- and-
The Henry J. Kaiser Family Foundation
Headquarters
2400 Sand Hill RoadMenlo Park, cA 94025
Phone 650-854-9400 Fax 650-854-4800
Washington offices and
Barbara Jordan conference center
1330 G Street, nW
Washington, dc 20005
Phone 202-347-5270 Fax 202-347-5274
www.kff.org
Health Research and Education Trust
chicago office
1 north Franklin Street chicago, Il 60606
Phone 312-422-2600 Fax 312-422-4568
Washington office
325 7th Street, nW
Washington, dc 20004
Phone 202-626-2276 Fax 202-626-2689
www.hret.org
-and-
T H E K A I S E R F A M I l y F o u n d A T I o n
- A N D -
H E A l T H R E S E A R c H A n d
E d u c A T I o n A l T R u S T
2 0 0 7A n n u a l S u r v e y
EmployerHeal th
Benef i t s

The Kaiser Family Foundation is a nonprofit, private operating foundation dedicated to providing information and analysis on health care issues to policymakers, the media, the health care community and the general public. The Foundation is not associated with Kaiser Permanente or Kaiser Industries.
Health Research and Educational Trust (HRET) is a private, not-for-profit organization involved in research, education, and demonstration programs addressing health management and policy issues. Founded in 1944, HRET, an affiliate of the American Hospital Association, collaborates with health care, government, academic, business, and community organizations across the United States to conduct research and disseminate findings that help shape the future of health care.
The National Opinion Research Center (NORC), headquartered at The University of Chicago, conducts high quality social science research in economics, demographics, education and child development, health, substance abuse, mental health, justice, and survey quality both in the U.S. and internationally. NORC supports the research needs of government in the U.S. and abroad, international donor agencies, foundations, academic researchers, and private organizations. Researchers at NORC work on the survey under subcontract with HRET.
Copyright © 2007 Henry J. Kaiser Family Foundation, Menlo Park, California, and Health Research and Educational Trust, Chicago, Illinois. All rights reserved.
Printed in the United States of America.
ISBN 978-0-87258-839-4
American Hospital Association/Health Research and Educational Trust Catalog Number 097517
Primary Authors:
KAISER FAMILYFOUNDATIONGary ClaxtonBianca DiJulioBenjamin FinderEric Becker
HEALTH RESEARCH AND EDUCATIONAL TRUST
Samantha Hawkins
NATIONAL OpINION RESEARCH CENTERJeremy pickreign
Heidi Whitmore
Jon Gabel

-and-
t h e k a i s e r f a m i l y f o u n d a t i o n - A N D -
h e a l t h r e s e a r C h a n d e d u C a t i o n a l t r u s t
Employer Health
Benefits
2 0 0 7A n n u a l S u r v e y


iii
t h e k a i s e r fa m i ly f o u n d at i o n - a n d - h e a lt h r e s e a r C h a n d e d u C at i o n a l t r u s t
T A b l e o f C o N T e N T s
l i s T o f e x h i b i T s v
s u m m A ry o f f i N D i N g s 1
s u r v e y D e s i g N A N D m e T h o D s 9
s e C T i o N 1
Cost of Health Insurance 17
s e C T i o N 2
Health Benefits Offer Rates 33
s e C T i o N 3
Employee Coverage, Eligibility, and Participation 47
s e C T i o N 4
Types of Plans Offered 57
s e C T i o N 5
Market Shares of Health Plans 63
s e C T i o N 6
Worker and Employer Contributions for Premiums 67
s e C T i o N 7
Employee Cost Sharing 87
s e C T i o N 8
High-Deductible Health Plans with Savings Option 117
s e C T i o N 9
Prescription Drug Benefits 133
s e C T i o N 10
Plan Funding 145
s e C T i o N 11
Retiree Health Benefits 153
s e C T i o N 12
Employer Opinions and Practices 159


v
t h e k a i s e r fa m i ly f o u n d at i o n - a n d - h e a lt h r e s e a r C h a n d e d u C at i o n a l t r u s t
exhibit m.1 14Selected Characteristics of Firms in the Survey Sample, 2007
exhibit m.2 15Distribution of Employers, Workers, and Workers Covered by Health Benefits, by Firm Size, 2007
exhibit m.3 16States by Region, 2007
Co s T o f h e A lT h i N s u r A N C e
exhibit 1.1 19Average Percentage Increase in Health Insurance Premiums Compared to Other Indicators, 1988–2007
exhibit 1.2 20Average Percentage Increase in Health Insurance Premiums Compared to Other Indicators, 1988–2007
exhibit 1.3 21Average Percentage Increase in Health Insurance Premiums, by Plan Type, 1999–2007
exhibit 1.4 21Average Percentage Increase in Health Insurance Premiums, by Firm Size, 2007
exhibit 1.5 22Distribution of Average Percentage Increase in Health Insurance Premiums, by Firm Size, 2007
exhibit 1.6 23Average Percentage Increase in Health Insurance Premiums, by Firm Size and Plan Type, 2007
exhibit 1.7 24Average Percentage Increase in Health Insurance Premiums, by Plan Type, 2007
exhibit 1.8 25Average Percentage Increase in Health Insurance Premiums, by Funding Arrangement and Plan Type, 2007
exhibit 1.9 26Average Percentage Increase in Health Insurance Premiums by Funding Arrangement, 1999–2007
exhibit 1.10 27Average Percentage Increase in Health Insurance Premiums, by Firm Size, Region, and Industry, 1999–2007
exhibit 1.11 28Average Monthly Premiums for Covered Workers, Single and Family Coverage, by Plan Type, 2007
exhibit 1.12 28Average Monthly and Annual Premiums for Covered Workers, by Plan Type and Firm Size, 2007
exhibit 1.13 29Average Monthly and Annual Premiums for Covered Workers, by Plan Type and Region, 2007
exhibit 1.14 30Average Monthly and Annual Premiums for Covered Workers, by Plan Type and Industry, 2007
exhibit 1.15 32Distribution of Single and Family Average Monthly Premiums for Covered Workers, 2001–2007
h e A lT h b e N e f i T s o f f e r r AT e s
exhibit 2.1 36Percentage of Firms Offering Health Benefits, 1999–2007
exhibit 2.2 36Percentage of Firms Offering Health Benefits, by Firm Size, 1999–2007
exhibit 2.3 37Percentage of Firms Offering Health Benefits, by Firm Size, Region, and Industry, 2007
exhibit 2.4 38Percentage of Firms Offering Health Benefits, by Firm Characteristics, 2007
exhibit 2.5 38Among Firms Offering Health Benefits, Percentage That Offer Health Benefits to Part-Time Workers, by Firm Size, 1999–2007
exhibit 2.6 39Among Firms Offering Health Benefits, Percentage That Offer Health Benefits to Temporary Workers, by Firm Size, 1999–2007
l i s T o f e x h i b i T s

t h e k a i s e r fa m i ly f o u n d at i o n - a n d - h e a lt h r e s e a r C h a n d e d u C at i o n a l t r u s t
vi
exhibit 2.7 40Among Firms Offering Health Benefits, Percentage of Employers Offering Health Benefits to Domestic Partners, by Firm Size, Region, and Industry, 2007
exhibit 2.8 41Among Small Firms (3–199 Workers) Not Offering Health Benefits, Reasons for Not Offering, 2007
exhibit 2.9 41Among Small Firms (3–199 Workers) Not Offering Health Benefits, Percentage That Offered Insurance Within the Last Five Years or Shopped for Insurance Within the Past Year, 2007
exhibit 2.10 42Among Small Firms (3–199 Workers) Not Offering Health Benefits, Employer Beliefs About Employees’ Preferences for Higher Wages or Health Insurance Benefits, 2003–2007
exhibit 2.11 43Among Small Firms (3–199 Workers) Not Offering Health Benefits, Distribution of Firms by the Amount They Believe the Total Cost of Health Insurance for One Employee Would Cost per Employee per Month if They Offered the Benefit, 2005–2007
exhibit 2.12 44Among Small Firms (3–199 Workers) Not Offering Benefits, Distribution of Firms by the Amount They Believe They Could Afford to Pay for Health Insurance Coverage for an Employee with Single Coverage, 2003–2007
exhibit 2.13 45Among Small Firms (3–199 Workers) Not Offering Health Benefits, Distribution of Firms by the Amounts They Believe Their Employees Could Afford to Pay for Individual Health Insurance Coverage, 2003–2007
e m p loye e Co v e r Ag e, e l i g i b i l i T y, A N D pA r T i C i pAT i o N
exhibit 3.1 50Percentage of All Workers Covered by Their Employers’ Health Benefits, in Firms Both Offering and Not Offering Health Benefits, by Firm Size, 1999–2007
exhibit 3.2 51Eligibility, Take-Up Rate, and Coverage in Firms Offering Health Benefits, by Firm Size, Region, and Industry, 2007
exhibit 3.3 52Among Workers in Firms Offering Health Benefits, Percentage of Workers Eligible for Health Benefits Offered by Their Firm, by Firm Characteristics, 2007
exhibit 3.4 52Among Workers in Firms Offering Health Benefits, Percentage of Workers That Take Up Health Benefits Offered by Their Firm, by Firm Characteristics, 2007
exhibit 3.5 53Among Workers in Firms Offering Health Benefits, Percentage of Workers Covered by Health Benefits Offered by Their Firm, by Firm Characteristics, 2007
exhibit 3.6 54Eligibility, Take-Up Rate, and Coverage for Workers in Firms Offering Health Benefits, by Firm Size, 1999–2007
exhibit 3.7 55Percentage of Covered Workers in Firms with a Waiting Period for Coverage and Average Waiting Period in Months, by Firm Size, Region, and Industry, 2007
exhibit 3.8 56Distribution of Covered Workers with the Following Waiting Periods, 2007
T yp e s o f p l A N s o f f e r e D
exhibit 4.1 59Among Firms Offering Health Benefits, Percentage That Offer One, Two, or Three or More Plan Types, by Firm Size, 2007
exhibit 4.2 60Among Firms Offering Health Benefits, Percentage of Covered Workers in Firms Offering One, Two, or Three or More Plan Types, by Firm Size, 2007
exhibit 4.3 61Among Firms Offering Health Benefits, Percentage That Offer the Following Plan Types, by Firm Size, 2007
exhibit 4.4 61Among Firms Offering Health Benefits, Percentage of Covered Workers in Firms Offering the Following Plan Types, by Firm Size, 2007

vii
t h e k a i s e r fa m i ly f o u n d at i o n - a n d - h e a lt h r e s e a r C h a n d e d u C at i o n a l t r u s t
m A r k e T s h A r e s o f h e A lT h p l A N s
exhibit 5.1 65Distribution of Health Plan Enrollment for Covered Workers, by Plan Type, 1988–2007
exhibit 5.2 66Health Plan Enrollment, by Firm Size, Region, and Industry, 2007
W o r k e r A N D e m p loye r Co N T r i b u T i o N s f o r p r e m i u m s
exhibit 6.1 70Average Percentage of Premium Paid by Covered Workers for Single and Family Coverage, 1999–2007
exhibit 6.2 70Average Monthly Worker Premium Contributions Paid by Covered Workers for Single and Family Coverage, 1999–2007
exhibit 6.3 71Average Annual Firm and Worker Premium Contributions and Total Premiums for Covered Workers for Single and Family Coverage, by Plan Type, 2007
exhibit 6.4 72Average Annual Firm and Worker Premium Contributions and Total Premiums for Covered Workers for Single Coverage, by Plan Type and Firm Size, 2007
exhibit 6.5 73Average Annual Firm and Worker Premium Contributions and Total Premiums for Covered Workers for Family Coverage, by Plan Type and Firm Size, 2007
exhibit 6.6 74Average Monthly and Annual Worker Premium Contributions Paid by Covered Workers for Single and Family Coverage, by Plan Type and Firm Size, 2007
exhibit 6.7 75Average Monthly and Annual Worker Premium Contributions Paid by Covered Workers for Single and Family Coverage, by Plan Type and Region, 2007
exhibit 6.8 76Average Monthly Worker Premium Contributions Paid by Covered Workers for Single and Family Coverage, by Plan Type, 1999–2007
exhibit 6.9 77Distribution of Percentage of Premium Paid by Covered Workers for Single and Family Coverage, 2001–2007
exhibit 6.10 78Distribution of Percentage of Premium Paid by Covered Workers for Single Coverage, by Firm Size, 2001–2007
exhibit 6.11 79Distribution of Percentage of Premium Paid by Covered Workers for Family Coverage, by Firm Size, 2001–2007
exhibit 6.12 80Average Percentage of Premiums Paid by Covered Workers for Single Coverage, by Firm Characteristics, 2007
exhibit 6.13 80Average Percentage of Premiums Paid by Covered Workers for Family Coverage, by Firm Characteristics, 2007
exhibit 6.14 81Average Percentage of Premium Paid by Covered Workers for Single and Family Coverage, by Plan Type and Firm Size, 2007
exhibit 6.15 82Average Percentage of Premium Paid by Covered Workers for Single and Family Coverage, by Plan Type, 1999–2007
exhibit 6.16 83Average Percentage of Premium Paid by Covered Workers for Single and Family Coverage, by Plan Type and Region, 2007
exhibit 6.17 84Average Percentage of Premium Paid by Covered Workers, by Plan Type and Industry, 2007
exhibit 6.18 86Percentage of Covered Workers in Firms That Vary Worker Premium Contributions by Wage or Participation in Wellness Program, by Firm Size and Region, 2007
e m p loye e Co s T s h A r i N g
exhibit 7.1 92Percentage of Covered Workers With No General Annual Health Plan Deductible for Single and Family Coverage, by Plan Type and Firm Size, 2007
t h e k a i s e r fa m i ly f o u n d at i o n - a n d - h e a lt h r e s e a r C h a n d e d u C at i o n a l t r u s t
viii
exhibit 7.2 93Among Covered Workers with No General Annual Health Plan Deductible for Single and Family Coverage, Percentage Who Have the Following Types of Cost Sharing, by Plan Type, 2007
exhibit 7.3 94Among Covered Workers with a General Annual Health Plan Deductible for Single Coverage, Average Deductible, by Plan Type and Firm Size, 2007
exhibit 7.4 95Among Covered Workers with a General Annual Health Plan Deductible for Single Coverage, Average Deductible, by Plan Type and Region, 2007
exhibit 7.5 96Among Covered Workers with a General Annual Health Plan Deductible for Single Coverage, Average Deductible, by Plan Type, 2006–2007
exhibit 7.6 97Among Covered Workers With a General Annual Health Plan Deductible for Single PPO Coverage, Distribution of Deductibles, 2000–2007
exhibit 7.7 97Among Covered Workers With a General Annual Health Plan Deductible for Single POS Coverage, Distribution of Deductibles, 2000–2007
exhibit 7.8 98Distribution of Type of Deductible for Family Coverage, by Plan Type and Firm Size, 2007
exhibit 7.9 99Among Covered Workers with a General Annual Health Plan Deductible, Average Deductibles for Family Coverage, by Deductible Type, Plan Type, and Firm Size, 2007
exhibit 7.10 100Among Covered Workers with a General Annual Health Plan Deductible for Family Coverage, Average Aggregate Deductible, by Plan Type, 2006–2007
exhibit 7.11 101Among Covered Workers With a General Annual Health Plan Deductible for Family Coverage, Distribution of Deductibles for PPO and POS Plans, by Deductible Type, 2007
exhibit 7.12 102Among Covered Workers With a Separate per Person General Annual Health Plan Deductible for Family Coverage, Distribution of Maximum Number of Family Members Required to Meet the Deductible for PPO and POS Plans, 2007
exhibit 7.13 102Among Covered Workers with a General Annual Health Plan Deductible, Percentage with Coverage for the Following Services Without Having to First Meet the Deductible, by Plan Type, 2007
exhibit 7.14 103Percentage of Covered Workers with a Separate Hospital Deductible and Average Separate Hospital Deductibles, by Plan Type, 2007
exhibit 7.15 104Distribution of Covered Workers With the Following Types of Cost Sharing in Addition to Any Plan Deductible, by Plan Type, 2007
exhibit 7.16 105Among Covered Workers With Separate Cost Sharing for Each Hospital Admission or Each Outpatient Surgery in Addition to Any Plan Deductible, Average Cost Sharing, by Plan Type, 2007
exhibit 7.17 106In Addition to Any Plan Deductible, Percentage of Covered Workers with Emergency Room Cost Sharing, by Plan Type, 2007
exhibit 7.18 106In Addition to Any Plan Deductible, Percentage of Covered Workers With the Following Types of Cost Sharing for Physician Office Visits, by Plan Type, 2007
exhibit 7.19 107Among Workers with Copayments for In-Network or Out-of-Network Office Visits, Average Copayments, by Plan Type, 2007
exhibit 7.20 107Among Workers with Coinsurance for In-Network or Out-of-Network Office Visits, Average Coinsurance, by Plan Type, 2007
exhibit 7.21 108Among Covered Workers With Copayments for A Physician Office Visit with a Primary Care Physician, Distribution of Copayments, by Plan Type, 2004–2007

ix
t h e k a i s e r fa m i ly f o u n d at i o n - a n d - h e a lt h r e s e a r C h a n d e d u C at i o n a l t r u s t
exhibit 7.22 109Among Covered Workers With Copayments for A Physician Office Visit with a Specialty Care Physician, Distribution of Copayments, by Plan Type, 2006–2007
exhibit 7.23 110Among Covered Workers in HMOs With a Copayment for a Physician Office Visit, Percentage with Various Copayments, 1999–2007
exhibit 7.24 110Among Covered Workers With Coinsurance for Physician Office Visits, Distribution of Average Coinsurance Rates, by Plan Type, 2007
exhibit 7.25 111Percentage of Covered Workers With “No Limit” for Annual Out-of-Pocket Maximum for Single and Family Coverage, by Plan Type, 2007
exhibit 7.26 111Among Covered Workers with an Annual Out-of Pocket-Maximum, Percentage Whose Spending for Various Services Does Not Count Towards the Out-of-Pocket Limit, 2007
exhibit 7.27 112Among Covered Workers with an Out-of-Pocket Maximum for Single Coverage, Distribution of Out-of-Pocket Maximums, by Plan Type, 2007
exhibit 7.28 113Distribution of Type of Out-of-Pocket Maximum for Covered Workers with Family Coverage, by Plan Type and Firm Size, 2007
exhibit 7.29 114Among Covered Workers with an Aggregate Out-of-Pocket Maximum for Family Coverage, Distribution of Out-of-Pocket Maximums, by Plan Type, 2007
exhibit 7.30 115Among Covered Workers with a Separate per Person Out-of-Pocket Maximum for Family Coverage, Distribution of Out-of-Pocket Maximums, by Plan Type, 2007
exhibit 7.31 116Among Covered Workers with a Separate per Person Out-of-Pocket Maximum for Family Coverage, Distribution of Maximum Number of Family Members Required to Meet the Maximum, by Plan Type, 2007
h i g h - D e D u C T i b l e h e A lT h p l A N s W i T h s Av i N g s o p T i o N
exhibit 8.1 123Among Firms Offering Health Benefits, Percentage That Offer an HDHP/HRA and/or an HSA-Qualified HDHP, 2005-2007
exhibit 8.2 123Among Firms Offering Health Benefits, Percentage That Offer an HDHP/SO, by Firm Size, 2007
exhibit 8.3 124Among Firms Offering Health Benefits, Percentage That Offer an HDHP/SO, by Firm Size, 2006–2007
exhibit 8.4 124HDHP/HRA and HSA-Qualified HDHP Features, 2007
exhibit 8.5 125Average Annual Premiums and Contributions to Spending Accounts For Covered Workers, HDHP/HRAs, HSA-Qualified HDHPs and All Other Non-HDHP/SO Plans, 2007
exhibit 8.6 126Distribution of Covered Workers with the Following General Annual Deductible Amounts for Single Coverage, HSA-Qualified HDHPs and HDHP/HRAs, 2007
exhibit 8.7 126Among Covered Workers, Distribution of Type of General Annual Deductible for Family Coverage, HDHP/HRAs and HSA-Qualified HDHPs, 2007
exhibit 8.8 127Distribution of Covered Workers with the Following Aggregate Family Deductible Amounts, HDHP/HRAs and HSA-Qualified HDHPs, 2007
exhibit 8.9 127Percentage of Covered Workers with Benefits Paid for by the Plan Without Having to First Meet the Deductible, HDHP/HRAs and HSA-Qualified HDHPs, by Benefit Type, 2007
exhibit 8.10 128Percentage of Covered Workers in Partially or Completely Self-Funded HDHP/HRAs and HSA-Qualified HDHPs, 2007
exhibit 8.11 128Distribution of Covered Workers with the Following Annual Employer Contributions to their HRA or HSA, for Single Coverage, 2007
t h e k a i s e r fa m i ly f o u n d at i o n - a n d - h e a lt h r e s e a r C h a n d e d u C at i o n a l t r u s t
x
exhibit 8.12 129Distribution of Covered Workers with the Following Annual Employer Contributions to their HRA or HSA, for Family Coverage, 2007
exhibit 8.13 130Distribution of Covered Workers in HDHP/HRAs and HSA-Qualified HDHPs With the Following Types of Cost Sharing in Addition to General Annual Deductible, 2007
exhibit 8.14 131Among Firms Not Currently Offering an HDHP/HRA, Percentage That Say They Are “Very Likely” or “Somewhat Likely” to Offer an HDHP/HRA in the Next Year, 2005–2007
exhibit 8.15 132Among Firms Not Currently Offering an HSA-Qualified HDHP, Percentage That Say They Are “Very Likely” or “Somewhat Likely” to Offer an HSA-Qualified HDHP in the Next Year, 2005–2007
p r e s C r i p T i o N D r u g b e N e f i T s
exhibit 9.1 136Distribution of Covered Workers Facing Different Cost-Sharing Formulas for Prescription Drug Benefits, 2000–2007
exhibit 9.2 137Distribution of Covered Workers Facing Different Cost-Sharing Formulas for Prescription Drug Benefits, by Plan Type, 2007
exhibit 9.3 138Among Workers with Three or Four-Tier Cost Sharing, Distribution of Covered Workers with the Following Types of Cost Sharing for Prescription Drugs, by Drug and Plan Type, 2007
exhibit 9.4 139Among Covered Workers with Three or Four-Tier Prescription Drug Cost Sharing, Average Copayments, 2000–2007
exhibit 9.5 139Among Covered Workers with Three or Four-Tier Prescription Drug Cost Sharing, Average Coinsurance, 2000–2007
exhibit 9.6 140Among Those with Two-Tier Cost Sharing for Prescription Drugs, Distribution of Covered Workers with the Following Types of Cost Sharing for Prescription Drugs, by Drug and Plan Type, 2007
exhibit 9.7 141Among Covered Workers with Two-Tier Prescription Drug Cost Sharing, Average Copayments, 2000–2007
exhibit 9.8 141Among Covered Workers with Two-Tier Prescription Drug Cost Sharing, Average Coinsurance, 2000–2007
exhibit 9.9 142Among Workers with Same Cost Sharing Regardless of Type of Drug, Distribution of Covered Workers with the Following Types of Cost Sharing for Prescription Drugs, by Plan Type, 2007
exhibit 9.10 142Among Covered Workers with Same Cost Sharing Regardless of Type of Drug, Average Copayments, 2000–2007
exhibit 9.11 143Among Covered Workers with Same Cost Sharing Regardless of Type of Drug, Average Coinsurance, 2000–2007
exhibit 9.12 143 Percentage of Covered Workers with Drug Coverage Who Face a Separate Drug Deductible, by Plan Type, 2005–2007
exhibit 9.13 144Percentage of Covered Workers with Drug Coverage with a Separate Annual Out-of-Pocket Limit that Applies to Prescription Drugs, by Plan Type, 2007
p l A N f u N D i N g
exhibit 10.1 147Percentage of Covered Workers in Partially or Completely Self-Funded Plans, by Firm Size, 1999–2007
exhibit 10.2 147Percentage of Covered Workers in Partially or Completely Self-Funded Plans, by Plan Type, 1999–2007
exhibit 10.3 148Percentage of Covered Workers in Partially or Completely Self-Funded Plans, by Firm Size, Region, and Industry, 2007
exhibit 10.4 149Percentage of Covered Workers in Partially or Completely Self-Funded Plans, by Plan Type and Firm Size, 2007
exhibit 10.5 149Percentage of Covered Workers in Partially or Completely Self-Funded Conventional Plans, by Firm Size, 1999–2007
exhibit 10.6 150Percentage of Covered Workers in Partially or Completely Self-Funded HMO Plans, by Firm Size, 1999–2007

xi
t h e k a i s e r fa m i ly f o u n d at i o n - a n d - h e a lt h r e s e a r C h a n d e d u C at i o n a l t r u s t
exhibit 10.7 150Percentage of Covered Workers in Partially or Completely Self-Funded PPO Plans, by Firm Size, 1999–2007
exhibit 10.8 151Percentage of Covered Workers in Partially or Completely Self-Funded POS Plans, by Firm Size, 1999–2007
exhibit 10.9 151Percentage of Covered Workers in Partially or Completely Self-Funded HDHP/SOs, by Firm Size, 2006–2007
r e T i r e e h e A lT h b e N e f i T s
exhibit 11.1 155Among Firms Offering Health Benefits to Active Workers, Percentage of All Large Firms (200 or More Workers) Offering Retiree Health Benefits, 1988–2007
exhibit 11.2 156Among Firms that Offer Health Benefits to Active Workers, Percentage of Firms Offering Retiree Health Benefits, by Firm Size, Region, and Industry, 2007
exhibit 11.3 157Among Firms that Offer Health Benefits to Active Workers, Percentage of All Large Firms (200 or More Workers) Offering Retiree Health Benefits, by Firm Characteristics, 2007
exhibit 11.4 157Among All Large Firms (200 or More Workers) Offering Health Benefits to Active Workers and Offering Retiree Coverage, Percentage Offering Health Benefits to Early and Medicare-Age Retirees, 1999–2007
exhibit 11.5 158Among All Large Firms (200 or More Workers) Offering Health Benefits to Active Workers and Offering Retiree Coverage, Percentage Offering Retiree Benefits to Early and Medicare-Age Retirees, by Firm Size, Region, and Industry, 2007
e m p loye r o p i N i o N s A N D p r AC T i C e s
exhibit 12.1 163Among All Firms Both Offering and Not Offering Health Benefits, Distribution of Firms’ Opinions on the Effectiveness of the Following Strategies to Contain Health Insurance Costs, 2007
exhibit 12.2 164Among Firms Offering Health Benefits, Distribution of Firms Reporting the Likelihood of Making the Following Changes in the Next Year, by Firm Size, 2007
exhibit 12.3 165Among All Firms Both Offering and Not Offering Health Benefits, Distribution of Firms Reporting the Contribution of the Following Factors to Increases in Health Insurance Premiums, by Firm Size, 2007
exhibit 12.4 166Percentage of Firms with the Following Utilization Management Provisions in their Largest Health Plan, By Size, Region, and Industry, 2007
exhibit 12.5 167Among Firms Offering Health Benefits, Percentage of Firms With Specific Plan Offerings and Features, By Firm Size, 2007
exhibit 12.6 168Percentage of Firms That Shopped For A New Plan or Health Insurance Carrier in the Past Year, by Firm Size, 2007
exhibit 12.7 168Among Firms That Shopped for a New Plan or Insurance Carrier, Percentage Reporting That They Changed Insurance Carrier and/or Health Plan Type in the Past Year, by Firm Size, 2007
exhibit 12.8 169Among Firms Offering Health Benefits, Percentage of Firms Offering Flexible Spending Accounts and Pre-Tax Premium Payments, By Firm Size, 2007
exhibit 12.9 170Distribution of Covered Workers by a One-Year Change in Level of Health Benefits, Other Than Cost Sharing, 2007
exhibit 12.10 171Distribution of Covered Workers by Maximum Lifetime Benefit Payable to an Employee with Single Coverage, by Plan Type and Firm Size, 2007
exhibit 12.11 172Distribution of Covered Workers by Maximum Lifetime Benefit Payable to an Employee with Single Coverage, by Plan Type, 2004–2007

T h e K a i s e r Fa m i ly F o u n d aT i o n - a n d - h e a lT h r e s e a r c h a n d e d u c aT i o n a l T r u s T
1
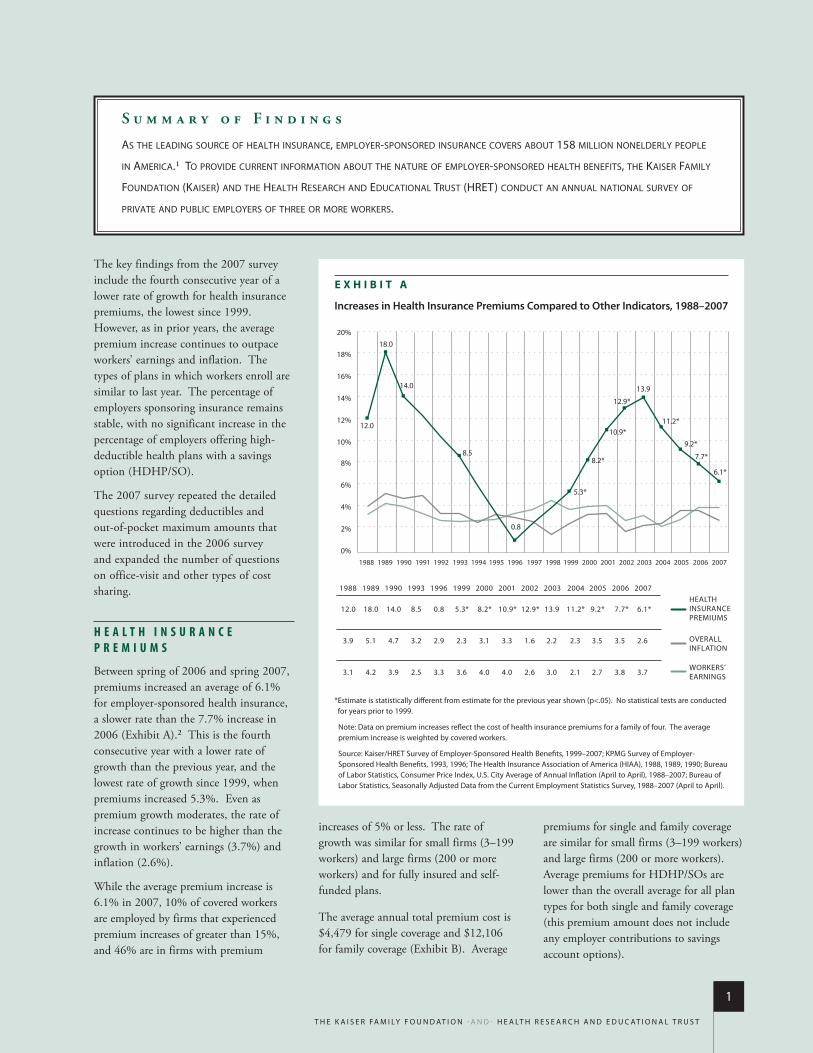
The key findings from the 2007 survey include the fourth consecutive year of a lower rate of growth for health insurance premiums, the lowest since 1999. However, as in prior years, the average premium increase continues to outpace workers’ earnings and inflation. The types of plans in which workers enroll are similar to last year. The percentage of employers sponsoring insurance remains stable, with no significant increase in the percentage of employers offering high-deductible health plans with a savings option (HDHP/SO).
The 2007 survey repeated the detailed questions regarding deductibles and out-of-pocket maximum amounts that were introduced in the 2006 survey and expanded the number of questions on office-visit and other types of cost sharing.
H E A L T H I N S U R A N C E P R E M I U M S
Between spring of 2006 and spring 2007, premiums increased an average of 6.1% for employer-sponsored health insurance, a slower rate than the 7.7% increase in 2006 (Exhibit A).2 This is the fourth consecutive year with a lower rate of growth than the previous year, and the lowest rate of growth since 1999, when premiums increased 5.3%. Even as premium growth moderates, the rate of increase continues to be higher than the growth in workers’ earnings (3.7%) and inflation (2.6%).
While the average premium increase is 6.1% in 2007, 10% of covered workers are employed by firms that experienced premium increases of greater than 15%, and 46% are in firms with premium
increases of 5% or less. The rate of growth was similar for small firms (3–199 workers) and large firms (200 or more workers) and for fully insured and self-funded plans.
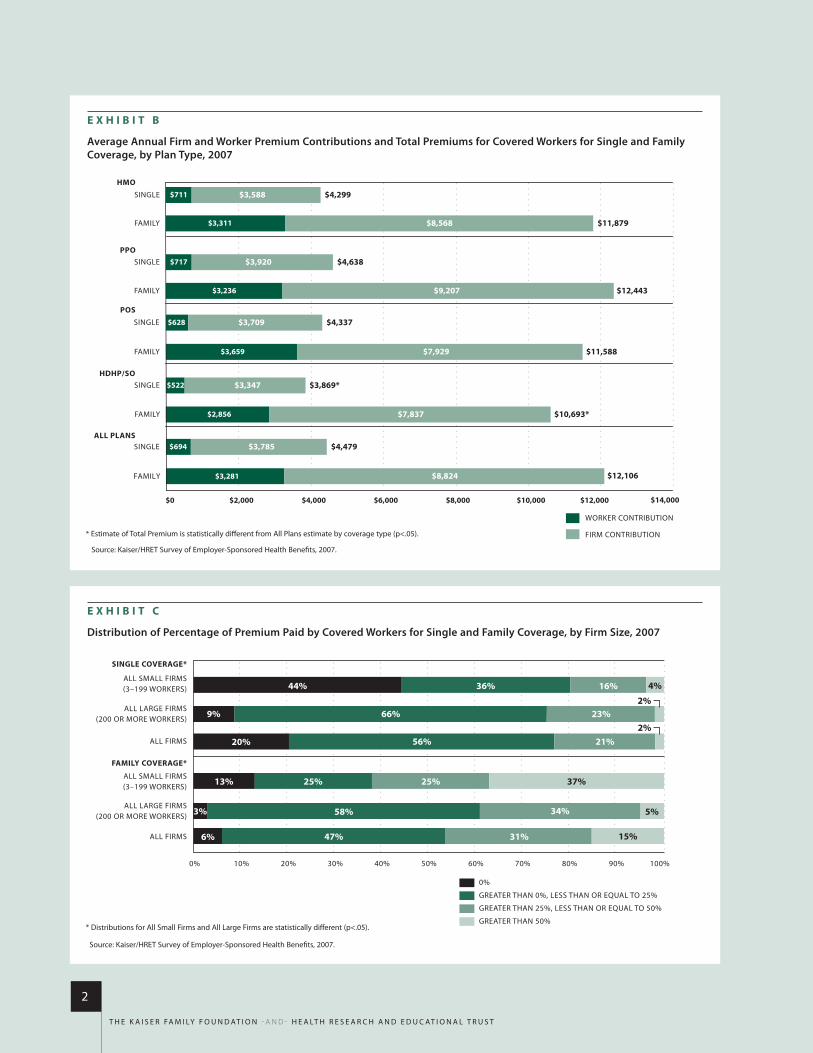
The average annual total premium cost is $4,479 for single coverage and $12,106 for family coverage (Exhibit B). Average
premiums for single and family coverage are similar for small firms (3–199 workers) and large firms (200 or more workers). Average premiums for HDHP/SOs are lower than the overall average for all plan types for both single and family coverage (this premium amount does not include any employer contributions to savings account options).
S u m m a r y o f F i n d i n g s
As the leAding source of heAlth insurAnce, employer-sponsored insurAnce covers About 158 million nonelderly people
in AmericA.1 to provide current informAtion About the nAture of employer-sponsored heAlth benefits, the KAiser fAmily
foundAtion (KAiser) And the heAlth reseArch And educAtionAl trust (hret) conduct An AnnuAl nAtionAl survey of
privAte And public employers of three or more worKers.
0%
2%
4%
6%
8%
10%
12%
14%
16%
18%
20%
1988 1989 1990 1991 1992 1993 1994 1995 1996 1997 1998 1999 2000 2001 2002 2003 2004 2005 2006 2007
12.0
18.0
14.0
8.5
0.8
5.3*
8.2*
10.9*
12.9*
13.9
1988
12.0
3.9
3.1
1989
18.0
5.1
4.2
1990
14.0
4.7
3.9
1993
8.5
3.2
2.5
1996
0.8
2.9
3.3
1999
5.3*
2.3
3.6
2000
8.2*
3.1
4.0
2001
10.9*
3.3
4.0
2002
12.9*
1.6
2.6
2003
13.9
2.2
3.0
2004
11.2*
2.3
2.1
11.2*
2005
9.2*
3.5
2.7
9.2*
7.7*
6.1*
2006
7.7*
3.5
3.8
2007
6.1*
2.6
3.7
HEALTH INSURANCEPREMIUMS
WORKERS’ EARNINGS
OVERALL INFLATION
* estimate is statistically different from estimate for the previous year shown (p<.05). no statistical tests are conducted for years prior to 1999.
note: data on premium increases reflect the cost of health insurance premiums for a family of four. The average premium increase is weighted by covered workers.
source: Kaiser/hreT survey of employer-sponsored health Benefits, 1999–2007; KPmG survey of employer-sponsored health Benefits, 1993, 1996; The health insurance association of america (hiaa), 1988, 1989, 1990; Bureau of labor statistics, consumer Price index, u.s. city average of annual inflation (april to april), 1988–2007; Bureau of labor statistics, seasonally adjusted data from the current employment statistics survey, 1988–2007 (april to april).
E x h i b i t A
Increases in Health Insurance Premiums Compared to Other Indicators, 1988–2007
2
T h e K a i s e r Fa m i ly F o u n d aT i o n - a n d - h e a lT h r e s e a r c h a n d e d u c aT i o n a l T r u s T
E x h i b i t b
Average Annual Firm and Worker Premium Contributions and Total Premiums for Covered Workers for Single and Family Coverage, by Plan Type, 2007
$694 $3,785
$717
$711 $3,588 $4,299SINGLE
HMO
FAMILY
ALL PLANS
HDHP/SO
SINGLE
FAMILY
PPOSINGLE
FAMILY
POS
SINGLE
SINGLE
FAMILY
FAMILY
$628
$3,659
$3,709
$7,929
$3,920
$3,311 $11,879
$12,443
$11,588
$10,693*
$12,106
$3,869*
$0 $2,000 $4,000 $6,000 $8,000 $10,000 $12,000 $14,000
WORKER CONTRIBUTION
FIRM CONTRIBUTION
$3,281 $8,824
$8,568
$3,236
$4,638
$4,337
$9,207
$522
$2,856
$3,347
$7,837
$4,479
* estimate of Total Premium is statistically different from all Plans estimate by coverage type (p<.05).
source: Kaiser/hreT survey of employer-sponsored health Benefits, 2007.
E x h i b i t C
Distribution of Percentage of Premium Paid by Covered Workers for Single and Family Coverage, by Firm Size, 2007
0%
GREATER THAN 0%, LESS THAN OR EQUAL TO 25%
GREATER THAN 25%, LESS THAN OR EQUAL TO 50%
GREATER THAN 50%
0% 10% 20% 30% 40% 50% 60% 70% 80% 90% 100%
44%
9%
20%
3%
36%
66%
56%
58%
16%
23%
21%
34%
31%
37%
15%6%
13%
47%
25% 25%
5%
2%
4%
2%
SINGLE COVERAGE*
FAMILY COVERAGE*
ALL SMALL FIRMS(3–199 WORKERS)
ALL LARGE FIRMS(200 OR MORE WORKERS)
ALL FIRMS
ALL SMALL FIRMS(3–199 WORKERS)
ALL LARGE FIRMS(200 OR MORE WORKERS)
ALL FIRMS
* distributions for all small Firms and all large Firms are statistically different (p<.05).
source: Kaiser/hreT survey of employer-sponsored health Benefits, 2007.
T h e K a i s e r Fa m i ly F o u n d aT i o n - a n d - h e a lT h r e s e a r c h a n d e d u c aT i o n a l T r u s T
3
About 80% of workers with single coverage and 94% of workers with family coverage contribute to the total premium for their coverage. The average annual worker contributions for single and family coverage are $694 and $3,281, respectively, and are significantly higher than the amounts reported in 2006. For single coverage, workers in small firms (3–199 workers) contribute less on average than workers in large firms (200 or more workers) ($561 vs. $759).
This trend reverses for family coverage, where workers in small firms contribute significantly more than workers in large firms ($4,236 vs. $2,831). While the dollar amounts are increasing, the share of the premium paid by covered workers remains stable. In 2007, the average percentage of the premium paid by covered workers is 16% for single coverage and 28% for family coverage, similar to the percentages reported for the last several years. However, for single coverage, over one-fifth of workers pay greater than 25% of the total premium while another fifth pay no contribution. For family coverage, 47% pay greater than 25% of the total premium and only 6% have no contribution (Exhibit C).
The majority (57%) of covered workers are enrolled in preferred provider organizations
(PPOs). Health maintenance organizations (HMOs) cover 21%, followed by point-of-service (POS) plans (13%), HDHP/SOs (5%), and conventional plans (3%).
E M P L O Y E E C O S T S H A R I N G
In addition to their premium contributions, most covered workers face additional payments when they use health care services. In PPOs, 71% of covered workers with single coverage have a general annual deductible that they pay before coverage for most services begins. Almost half (48%) of workers in POS plans and about 18% of workers in HMOs face a general annual deductible for single coverage. Many workers with no deductible have other forms of cost sharing for office visits or other services.
The average general annual deductibles (for workers with a deductible) for single coverage are $461 for workers in PPOs, $401 for workers in HMOs, $621 for workers in POS plans, and $1,729 for workers in HDHP/SOs (who by definition have high deductibles). Like last year, workers in small firms (3–199 workers) face higher deductibles than workers in large firms (200 or more workers) for PPOs, POS plans, and HDHP/SOs.3 However, some plans cover certain services before the deductible
is met. For example, 66% of covered workers with a general annual deductible enrolled in PPOs, the most common plan type, do not have to meet the deductible before preventive care is covered.
In addition to any general plan deductible, over 95% of covered workers face cost sharing when admitted to the hospital or when they have outpatient surgery. Cost sharing may include a separate hospital deductible, copayment, coinsurance, or a per diem charge. About 12% of workers in PPOs, 15% of workers in HMOs, and 23% of workers in POS plans have a separate hospital deductible. The average hospital deductibles are similar across plan types ($334 for PPOs, $323 for HMOs, and $340 for POS plans). Forty-three percent of covered workers have coinsurance for hospital admissions in addition to any deductible with an average coinsurance rate of 17%. A smaller percentage of workers (20%) have a copayment, which averages $208.
Most workers face some form of cost sharing when visiting the emergency room, for urgent care, or for an advanced diagnostic test. For example, 86% of covered workers have cost sharing for urgent care visits. Similarly, almost all covered workers (93%) have cost sharing
E x h i b i t D
Percentage of Firms Offering Health Benefits, by Firm Size, 1999–2007*
FIRM SIZE 1999 2000 2001 2002 2003 2004 2005 2006 2007
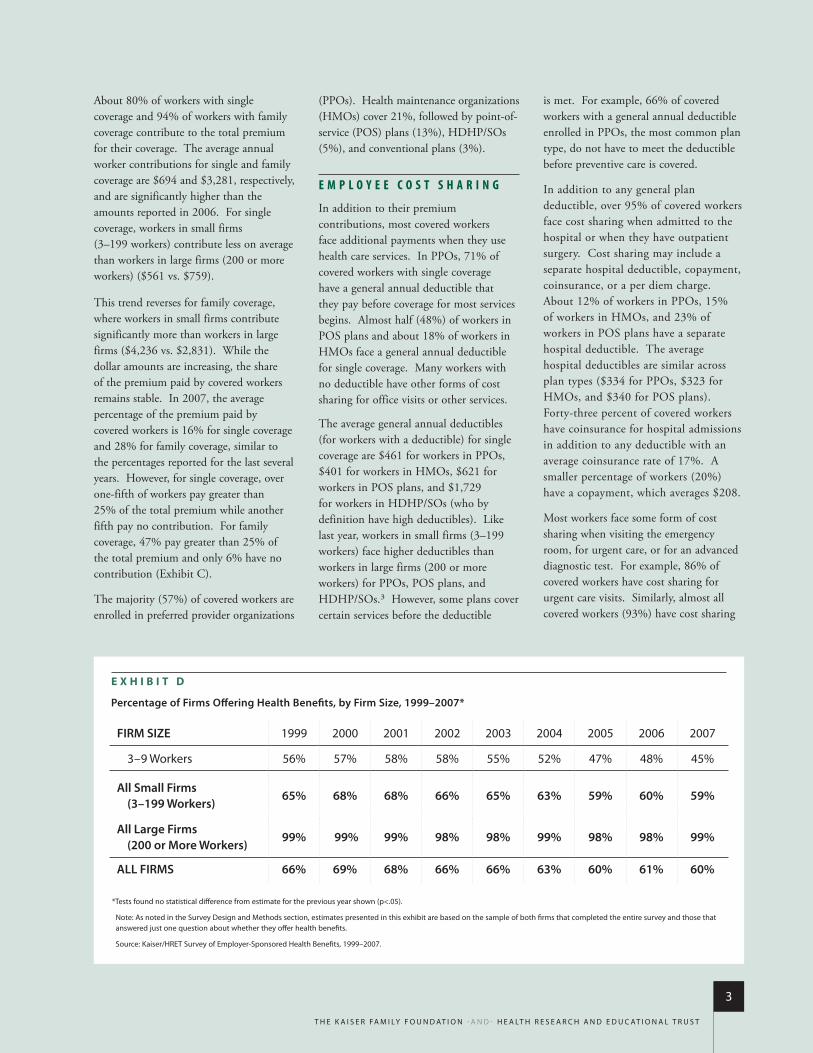
3–9 Workers 56% 57% 58% 58% 55% 52% 47% 48% 45%
All Small Firms (3–199 Workers)
65% 68% 68% 66% 65% 63% 59% 60% 59%
All Large Firms (200 or More Workers)
99% 99% 99% 98% 98% 99% 98% 98% 99%
ALL FIRMS 66% 69% 68% 66% 66% 63% 60% 61% 60%
*Tests found no statistical difference from estimate for the previous year shown (p<.05).
note: as noted in the survey design and methods section, estimates presented in this exhibit are based on the sample of both firms that completed the entire survey and those that answered just one question about whether they offer health benefits.
source: Kaiser/hreT survey of employer-sponsored health Benefits, 1999–2007.

4
T h e K a i s e r Fa m i ly F o u n d aT i o n - a n d - h e a lT h r e s e a r c h a n d e d u c aT i o n a l T r u s T
for emergency room visits, but 79% of workers with emergency room cost sharing are in plans where the cost sharing is waived if the individual is admitted to the hospital.
The majority of workers have copayments or coinsurance for physician office visits. Among the 79% of workers with copayments for in-network office visits, 75% have a copayment of $15, $20, or $25 per visit with a primary care physician. Workers in HDHP/SOs are more likely to have coinsurance than workers with other plan types and are also more likely to have no cost sharing once the deductible has been met. Workers that see out-of-network physicians are more likely to pay coinsurance (80%) rather than copayments (9%).
As with physician office visits, most covered workers face copayments or coinsurance for prescription drugs. About three in four covered workers are in plans with three or four-tier cost-sharing arrangements, and most face copayments rather than coinsurance for the first three tiers. For workers in plans with a fourth tier, the percentages of covered workers facing copayments and coinsurance are roughly comparable. Among workers with three or four-tier
plans, the average copayments are $11 for generic drugs, $25 for preferred drugs, and $43 for nonpreferred drugs. The average copayment for fourth-tier drugs is $71 and the average coinsurance is 36%.4 Covered workers in HDHP/SOs are less likely to be in plans with three or four-tier cost sharing. In contrast, they are more likely to be in plans where there is no cost sharing after the deductible is met and in plans where the payment is the same regardless of the type of drug, where they are also more likely to face coinsurance than workers in HMOs or PPOs.5
Most covered workers are in a plan that partially or totally limits the cost sharing that a worker must pay under their health plan in a year, generally referred to as an out-of-pocket maximum. Seventy-one percent of workers with single or family coverage have an out-of-pocket maximum, down from 79% (for single coverage and 78% for family coverage in 2006). However, it should be noted that some workers with no out-of-pocket limit may have low cost sharing.6 Out-of-pocket limits vary considerably; for example, among covered workers in plans that have an out-of-pocket limit for single coverage, 22% are in plans
with an annual out-of-pocket maximum of $3,000 or more, while 28% are in plans with out-of-pocket maximum of less than $1,500. For family coverage, 24% of workers are in plans with an out-of-pocket maximum of $6,000 or more and 10% are in plans with a limit of less than $2,000.7 However, not all spending counts towards the out-of-pocket limit. For example, among workers in PPOs, 73% are in plans that do not count office-visit copayments and 32% are in plans that do not count spending for the general annual deductible when determining if an enrollee has reached his or her out-of-pocket maximum.
A V A I L A B I L I T Y O F E M P L O Y E R -S P O N S O R E D C O V E R A G E
Sixty percent of employers offer health benefits in 2007, similar to the 61% offer rate reported in 2006 but lower than the 69% offer rate in 2000. The drop in the overall offer rate is driven by the declining percentage of small firms (3–199 workers) that offer coverage. Among firms with 3 to 9 workers, the offer rate has dropped from 57% in 2000 to 45% in 2007. Over this same time period, the offer rate has remained stable for firms with 200 or more workers at 98% or 99% (Exhibit D).
2% 2% 4%1%
7%3%
7%10%
6%*
0%
10%
20%
30%
40%
50%
HDHP/HRA HSA-Quali�ed HDHP Either HDHP/HRA or HSA-Quali�ed HDHP‡
200520062007
E x h i b i t E
Among Firms Offering Health Benefits, Percentage That Offer an HDHP/HRA and/or an HSA-Qualified HDHP, 2005–2007
* estimate is statistically different from estimate for the previous year shown (p<.05).
‡ The 2007 estimate includes 0.2% of all firms offering health benefits that offer both an hdhP/hra and an hsa-qualified hdhP. The comparable percentages for 2005 and 2006 are 0.3% and 0.4%, respectively.
source: Kaiser/hreT survey of employer-sponsored health Benefits, 2005–2007.

T h e K a i s e r Fa m i ly F o u n d aT i o n - a n d - h e a lT h r e s e a r c h a n d e d u c aT i o n a l T r u s T
5
The percentage of firms offering coverage increases as the size of the firm increases. As previously mentioned, the smallest firms (3–9 workers) remain least likely to offer health benefits at 45%. Among firms with 10 to 24 workers, the percentage jumps to 76%, and among firms with 25 to 49 workers it increases to 83%. Over 95% of firms with 50 or more employees offer health insurance.
As we have seen in past years, the offer rate is higher for firms with at least some union workers (99%) compared to firms with no union workers (57%). Firms with a lower proportion of lower-wage workers (less than 35% of workers earn $21,000 or less annually) are also more likely to offer benefits compared to firms with a higher proportion of lower-wage employees (35% or more earn $21,000 or less annually) (67% vs. 36%).
Even in firms that offer coverage, not all workers are covered. Some workers are not eligible to enroll as a result of waiting periods or minimum work-hour rules, and others choose not to enroll, perhaps because they must pay a share of the premium or can get coverage through a spouse. Among firms that offer coverage, an average of 79% of workers are eligible for the health benefits offered by their
employer. Of those eligible, 82% take up coverage, resulting in 65% of workers in firms offering health benefits having coverage through their employer. Among both firms that offer and do not offer health benefits, 59% of workers are covered by health plans offered by their employer.
This year, the survey asked employers that offer health insurance if they offer health benefits to domestic partners. Thirty-seven percent offer health benefits to same-sex domestic partners and 47% of firms offer health benefits to opposite-sex domestic partners. These percentages are considerably higher than those we reported in 2004 (14% for same-sex domestic partners and 12% for opposite-sex domestic partners), but a change in the way the question was asked may account for some or all of the difference.8
H I G H - D E D U C T I B L E H E A L T H P L A N S W I T H S A V I N G S O P T I O N
Last year was the first year information on high-deductible health plans with a savings option (HDHP/SO) was collected as a separate plan type. HDHP/SOs include (1) health plans with a deductible of at least $1,000 for single coverage and
$2,000 for family coverage offered with an Health Reimbursement Arrangement (HRA), referred to as “HDHP/HRAs,” and (2) high-deductible health plans that meet the federal legal requirements to permit an enrollee to establish and contribute to a Health Savings Account (HSA), referred to as “HSA-qualified HDHPs.”
Ten percent of firms offering health benefits offer an HDHP/SO in 2007, but the difference from the 7% reported in 2006 is not statistically significant. Firms with 1,000 or more workers are more likely to offer HDHP/SOs (18%) than firms with 3 to 999 workers (10%). Among firms offering health benefits, 3% offer an HDHP/HRA and 7% offer an HSA-qualified HDHP; neither estimate is a significant increase from the percentages reported in 2006 (Exhibit E). About 3.8 million (5%) covered workers are enrolled in HDHP/SOs, with about 1.9 million (3%) covered workers enrolled in each type of HDHP/SO (Exhibit F).
Annual deductibles for single coverage for HDHP/HRAs and HSA-qualified HDHPs average $1,556 and $1,923, respectively. However, these deductibles vary considerably; for example, 24% of workers enrolled in an HSA-qualified HDHP
E x h i b i t F
Number of Covered Workers Enrolled in HDHP/SOs, 2006–2007*
1.3 1.4
2.7
1.9 1.9
3.8
0.0
1.0
2.0
3.0
4.0
5.0
6.0
7.0
8.0
9.0
10.0
HDHP/HRA
MIL
LIO
NS
OF
WO
RKER
S
HSA-Quali�ed HDHP HDHP/SO
20062007*Tests found no statistical differences from estimate for the previous year shown (p<.05).
source: Kaiser/hreT survey of employer-sponsored health Benefits, 2006–2007.

6
T h e K a i s e r Fa m i ly F o u n d aT i o n - a n d - h e a lT h r e s e a r c h a n d e d u c aT i o n a l T r u s T
for single coverage have a deductible between $1,100 and $1,499, while 54% have a deductible of $2,000 or more. The average aggregate annual deductible for family coverage for HDHP/HRAs is $3,342 and $3,883 for HSA-qualified HDHPs. Some HDHP/SOs cover preventive services before the deductible is met; 88% of workers in HDHP/HRAs and 86% of workers in HSA-qualified HDHPs have preventive benefits covered before having to meet the deductible.
Average total premiums for HDHP/SOs are lower than the average premium for workers in plans that are not HDHP/SOs for both single and family coverage (Exhibit G). The average worker premium contribution for HDHP/SO coverage is lower than the average worker premium contribution for single coverage for workers not in HDHP/SOs.
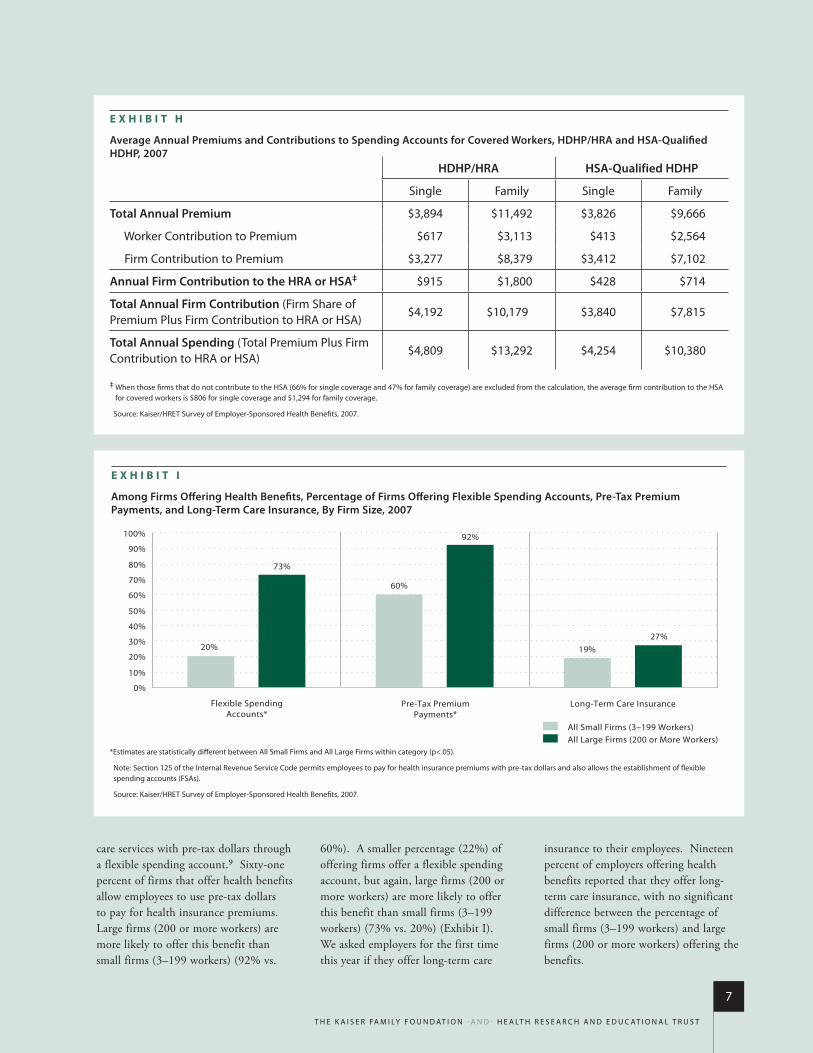
The distinguishing aspect of these high deductible plans is the savings feature available to employees. Workers enrolled in an HDHP/HRA receive an average annual contribution from their
employer of $915 for single coverage and $1,800 for family coverage (Exhibit H). The average contributions to HSAs are $428 for single coverage and $714 for family coverage. However, among firms offering an HSA-qualified HDHP, about two-thirds of firms do not make a contribution to the HSA for single coverage (covering 47% of workers in these plans) and 47% of firms do not make a contribution to the HSA for family coverage (covering 45% of workers with these plans). If workers with no employer contribution to their HSA are excluded from the calculation the average annual employer HSA contributions are $806 and $1,294 for single and family coverage, respectively.
R E T I R E E C O V E R A G E
The percentage of large firms (200 or more workers) offering retiree health benefits in 2007 is 33%, similar to the 2006 offer rate of 35%. Among large firms (200 or more workers) that offer retiree health benefits, 92% offer health
benefits to early retirees and 71% offer health benefits to Medicare-age retirees. These percentages are similar to the percentages reported in 2006.
U T I L I Z A T I O N M A N A G E M E N T
The survey periodically asks about the utilization management provisions of the firm’s plan with the largest enrollment. In 2007, about two-thirds of firms report that their health plan with the largest enrollment requires pre-admission certification for inpatient hospital care. About 55% report that the plan requires pre-admission certification for outpatient surgery, and 48% state that the plan includes case management for large claims.
O T H E R B E N E F I T S
Section 125 of the Internal Revenue Service Code permits employers to establish programs that allow employees to make contributions towards the cost of health insurance and to pay for health
E x h i b i t G
Average Annual Premiums, Worker and Firm Contributions for Covered Workers in HDHP/SOs and All Other Non-HDHP/SO Plans, 2007
* estimate for all other non-hdhP/so Plans is statistically different from estimate for hdhP/sos (p<.05).
na: not applicable.‡ in order to compare spending for hdhP/sos to all other plans that are not hdhP/sos, we created composite variables excluding hdhP/so data.
source: Kaiser/hreT survey of employer-sponsored health Benefits, 2007.
All Other Non- HDHP/SO Plans‡ HDHP/SO
single Family single Family
Worker contribution to Premium $704* $3,304 $522* $2,856
Firm contribution to Premium $3,810* $8,879* $3,347* $7,837*
Total Annual Premium $4,514* $12,183* $3,869* $10,693*
Annual Firm Contribution to the HRA or HSA
na na $682 $1,298
Total Annual Spending (Total Premium Plus Firm contribution to hra or hsa)
$4,514 $12,183 $4,550 $11,991
T h e K a i s e r Fa m i ly F o u n d aT i o n - a n d - h e a lT h r e s e a r c h a n d e d u c aT i o n a l T r u s T
7
E x h i b i t h
Average Annual Premiums and Contributions to Spending Accounts for Covered Workers, HDHP/HRA and HSA-Qualified HDHP, 2007
‡ When those firms that do not contribute to the hsa (66% for single coverage and 47% for family coverage) are excluded from the calculation, the average firm contribution to the hsa for covered workers is $806 for single coverage and $1,294 for family coverage.
source: Kaiser/hreT survey of employer-sponsored health Benefits, 2007.
HDHP/HRA HSA-Qualified HDHP
single Family single Family
Total Annual Premium $3,894 $11,492 $3,826 $9,666
Worker contribution to Premium $617 $3,113 $413 $2,564
Firm contribution to Premium $3,277 $8,379 $3,412 $7,102
Annual Firm Contribution to the HRA or HSA‡ $915 $1,800 $428 $714
Total Annual Firm Contribution (Firm share of Premium Plus Firm contribution to hra or hsa)
$4,192 $10,179 $3,840 $7,815
Total Annual Spending (Total Premium Plus Firm contribution to hra or hsa)
$4,809 $13,292 $4,254 $10,380
E x h i b i t i
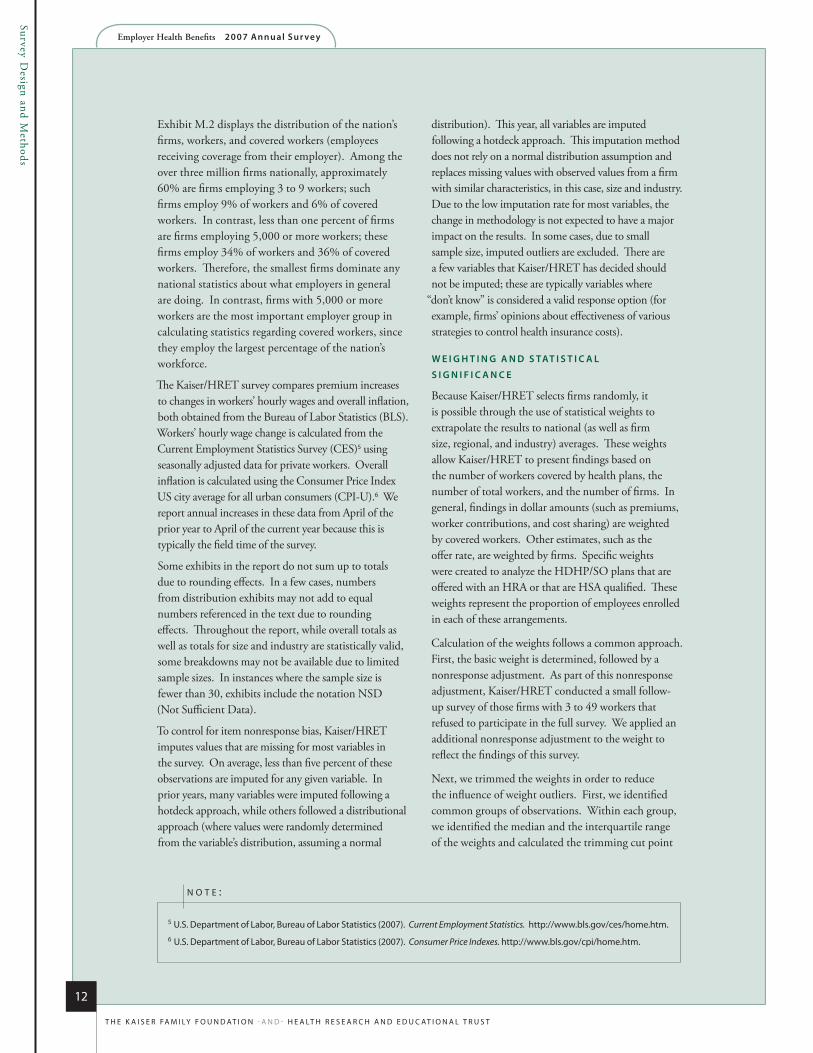
Among Firms Offering Health Benefits, Percentage of Firms Offering Flexible Spending Accounts, Pre-Tax Premium Payments, and Long-Term Care Insurance, By Firm Size, 2007
20%
60%
19%
73%
92%
27%
0%
10%
20%
30%
40%
50%
60%
70%
80%
90%
100%
Flexible SpendingAccounts*
Pre-Tax PremiumPayments*
Long-Term Care Insurance
All Small Firms (3–199 Workers)All Large Firms (200 or More Workers)
*estimates are statistically different between all small Firms and all large Firms within category (p<.05).
note: section 125 of the internal revenue service code permits employees to pay for health insurance premiums with pre-tax dollars and also allows the establishment of flexible spending accounts (Fsas).
source: Kaiser/hreT survey of employer-sponsored health Benefits, 2007.
care services with pre-tax dollars through a flexible spending account.9 Sixty-one percent of firms that offer health benefits allow employees to use pre-tax dollars to pay for health insurance premiums. Large firms (200 or more workers) are more likely to offer this benefit than small firms (3–199 workers) (92% vs.
60%). A smaller percentage (22%) of offering firms offer a flexible spending account, but again, large firms (200 or more workers) are more likely to offer this benefit than small firms (3–199 workers) (73% vs. 20%) (Exhibit I). We asked employers for the first time this year if they offer long-term care
insurance to their employees. Nineteen percent of employers offering health benefits reported that they offer long-term care insurance, with no significant difference between the percentage of small firms (3–199 workers) and large firms (200 or more workers) offering the benefits.

8
T h e K a i s e r Fa m i ly F o u n d aT i o n - a n d - h e a lT h r e s e a r c h a n d e d u c aT i o n a l T r u s T
O U T L O O K F O R T H E F U T U R E
Each year we ask employers what changes they plan to make to their health plans in the next year. Among those that offer benefits, large percentages of firms report that in the next year they are very or somewhat likely to increase the amount workers contribute to premiums (45%), increase deductible amounts (37%), increase office visit cost sharing (42%), or increase the amount that employees have to pay for prescription drugs (41%). Although firms report planning to increase the amount employees have to pay when they have insurance, few firms report they are somewhat or very likely to drop coverage (3%) or limit eligibility (5%) in the next year. And even though the HDHP/SO offer rate or enrollment did not increase significantly from 2006, one-fifth of firms report being somewhat
likely (18%) or very likely (2%) to offer an HSA-qualified HDHP in the next year, and almost one-quarter report being somewhat likely (21%) or very likely (3%) to offer an HDHP/HRA in the next year.
The employer-sponsored health benefits market did not experience large changes in 2007. Employers and employees benefited from the continued moderation in the rate of premium increases, a welcome relief from the much higher growth rates earlier in the decade. History suggests that premium trends are cyclical,10 and after four years of downward premium trends, it is unclear how much longer this relative lull in premium growth will continue before pressures on health insurers to improve profitability will push premium trends on an upward path. While widespread adoption of HDHP/SOs
could help maintain lower premium growth with firms moving to less expensive packages and higher cost sharing reducing service use, enrollment to date in these plans remains low.
Unfortunately, the recent moderation in premium trends has not reversed the erosion in the percentage of employers offering health benefits that occurred between 2000 and 2005. During that period, the percentage of employers offering coverage fell from 69% to 60%. While the offer rate seems to have stabilized with lower premium increases and a reasonably strong economy—it is essentially unchanged over the last three years—it is unclear what conditions would be necessary for the employer offer rate to move back toward the higher levels that we saw at the beginning of the decade.
1 Kaiser Family Foundation, Kaiser commission on medicaid and the uninsured, Health Insurance Coverage in America, 2005 Data Update, may 2007. available at www.kff.org/uninsured/upload/2005dataupdate.pdf.
2data on premium increases reflect the cost of health insurance for a family of four. 3 For hmo coverage, there is insufficient data to report the result. 4 For the first time this year, we present cost sharing for prescription drugs by tier level. For example, average copayments are presented separately for those that report three or four-tier cost
sharing, two-tier cost sharing, or the same cost sharing regardless of type of drug. see the introduction to section 9 for more information available at http://www.kff.org/insurance/7672/sections/ehbs07-sec9-1.cfm
5 For Pos plans, there is insufficient data for the percentage of workers with coinsurance to make the comparison. 6 among those with no out-of-pocket limit for single coverage, 88% have a deductible of less than $500, 16% face coinsurance for hospital admissions, and 22% face coinsurance for an outpatient
surgery episode. 7 data presented is for workers with a family aggregate out-of-pocket maximum where the limit applies to spending by any covered person in the family. 8 The 2004 survey asked firms whether nontraditional partners were eligible for health benefits and, if so, whether their definition included same-sex couples or opposite-sex couples or both. in
2007, the survey asked whether firms offered coverage to nonmarried same-sex or opposite-sex couples or both. 9 section 125 of the internal revenue service code permits employees to pay for health insurance premiums with pre-tax dollars. section 125 also allows the establishment of flexible spending
accounts (Fsas). an Fsa allows employees to set aside funds on a pre-tax basis to pay for medical expenses not covered by health insurance. Typically employees decide at the beginning of the year how much to set aside in an Fsa, and their employer deducts that amount of the employee’s paycheck over the year. Funds set aside in an Fsa must be used by the end of the year or are forfeited by the employee. Fsas are different from hras and hsas.
10 Joy m. Grossman and Paul B. Ginsburg, “as the health insurance underwriting cycle Turns: What next?” Health Affairs, 23, no. 6 (2004): 91. alice rosenblatt, “The underwriting cycle: The rule of six,” Health Affairs, 23, no. 6 (2004): 103.

78%$12,1
06
$4,4
79
Employer Health Benefits2 0 0 7 A n n u A l S u r v e y
Survey Design
and Methods
6.1%

Employer Health Benefits 2 0 0 7 An n u a l S u r vey
10
T h e K A i S e r FA m i ly F o u n d AT i o n - A n d - h e A lT h r e S e A r c h A n d e d u c AT i o n A l T r u S T
Survey Design and M
ethods
S u r v e y D e S i g n a n D M e t h o D S
The Kaiser Family FoundaTion and The healTh research and educaTional TrusT (Kaiser/hreT )
conducT This annual survey oF employer-sponsored healTh beneFiTs. For many years The inTernaTional
consulTing and accounTing Firm Kpmg consulTing, inc. (now bearing poinT) supporTed The sTudy.
in 1998, Kpmg divesTed iTselF oF iTs compensaTion and beneFiTs pracTice, and parT oF ThaT divesTiTure
included donaTing The annual survey oF healTh beneFiTs To hreT. hreT, a nonproFiT research
organizaTion, is an aFFiliaTe oF The american hospiTal associaTion. The Kaiser Family FoundaTion
designs, analyzes, and conducTs This survey in parTnership wiTh hreT, and also pays For The cosT
oF The survey. hreT subconTracTs wiTh researchers aT naTional opinion research cenTer (norc)
aT The universiTy oF chicago, who worK wiTh FoundaTion and hreT researchers in conducTing The
sTudy. Kaiser/hreT reTained naTional research llc (nr), a washingTon, d.c.-based survey research
Firm, To conducT Telephone inTerviews wiTh human resource and beneFiTs managers using The
Kaiser/hreT survey insTrumenT. From January To may 2007 nr compleTed inTerviews wiTh 1,997 Firms.
As in past years, Kaiser/HRET asked each participating company as many as 400 questions about its largest health maintenance organization (HMO), preferred provider organization (PPO), point-of-service (POS) plan, and high-deductible health plan with a savings option (HDHP/SO).1 We continue to ask firms whether or not they offer a conventional health plan and, if so, how much their premium for conventional coverage increased in the last year. However, we do not ask respondents additional questions about the attributes of the conventional plans they offer. Because we have limited information about conventional health plans, we must make adjustments in calculating all plan averages or distributions. In cases where a firm offers only conventional health plans, no information from that respondent is included in all plan averages. The exception is for the rate of premium growth and whether or not the plan is self-funded, for which we have information. If a firm offers a conventional health plan and at least one other plan type, for
1 hdhP/So includes high-deductible health plans offered with either a health reimbursement Arrangement (hrA) or a health Savings Account (hSA). Although hrAs can be offered along with a health plan that is not an hdhP, the survey collected information only on hrAs that are offered along with hdhPs. For specific definitions of hdhPs, hrAs, and hSAs, see the introduction to Section 8.
2 hdhP/So premium estimates do not include contributions made by the employer to health Savings Accounts or health reimbursement Arrangements.
n o T e :
categorical variables we assign the values from the health plan with the largest enrollment (other than the conventional plan) to the workers in the conventional plan. In the case of continuous variables, covered workers in conventional plans are assigned the weighted average value of the other plan types in the firm.
Last year Kaiser/HRET began asking employers if they had a health plan that was an exclusive provider organization (EPO),—this question is asked again this year. We treat EPOs and HMOs together as one plan type and report the information under the banner of
“HMO;” if an employer sponsors both an HMO and an EPO, they are asked about the attributes of the plan with the larger enrollment.
As in past years, this year’s survey included questions on the cost of health insurance, offer rates, coverage, eligibility, enrollment patterns, premiums,2 employee cost sharing, covered benefits, prescription drug benefits, retiree health benefits, utilization

Employer Health Benefits 2 0 0 7 An n u a l S u r vey
11
T h e K A i S e r FA m i ly F o u n d AT i o n - A n d - h e A lT h r e S e A r c h A n d e d u c AT i o n A l T r u S T
Survey Design and M
ethods
management, and employer opinions. Throughout this report, we use the term “in-network” to refer to services received from a preferred provider and “out-of-network” to refer to services received from a non-preferred provider. Family coverage is defined as health coverage for a family of four.
Each year, the survey asks two different questions regarding family premiums. One asks each firm, for each plan type it has, the percentage increase or decrease in premiums in the past year. The responses are used to estimate the average annual premium increase (for example, 6.1% for 2007). The other question asks for the premium dollar amount for each plan type the firm offers, and the responses to this question are used to estimate average annual premiums (for example, $12,106 for family coverage in 2007). The percentage increases in premiums from year to year and cumulative percentage increases are calculated from the estimated average annual percentage premium increases (i.e., reflecting responses to the first question). We use these estimates because respondents change from year to year, and the plan with the largest enrollment may have changed or the firm may not have offered the plan type in the prior year. As a result, the two measures are not necessarily consistent. Calculating the percentage increase from the average premiums also results in larger standard errors than the standard errors associated with the percentage increase calculated from the percentage increase question.
Each year, the survey asks firms for the percentage of their employees that earn less than a specified amount. This year, we changed the income threshold from $20,000 per year, as it has been the last several years, to $21,000 per year. This threshold is based on the 25th percentile of workers’ earnings as reported by the Bureau of Labor Statistics using data from the National Compensation Survey (2005), the most current data available at the time of the survey design. The threshold is then adjusted to account for the change in workers’ earnings from 2005 to 2006.
R e S p o n S e R At e
Kaiser/HRET drew its sample from a Survey Sampling Incorporated list (based on an original Dun and
Bradstreet list) of the nation’s private and public employers with three or more workers. To increase precision, Kaiser/HRET stratified the sample by industry and the number of workers in the firm. Kaiser/HRET attempted to repeat interviews with prior years’ survey respondents (with at least ten employees) who also participated in 2005, 2006, or both. As a result, 1,481 firms in this year’s total sample of 1,997 firms participated in either the 2005, 2006, or both surveys.3 The overall response rate is 49%.
The vast majority of questions are asked only of firms that offer health benefits. A total of 1,839 responding firms indicated that they offered health benefits. The overall response rate of firms that offer health benefits is 50%.
From previous years’ experience, we have learned that firms that decline to participate in the study are less likely to offer health benefits. Therefore, we asked one question to all firms in the study with which we made phone contact where the firm declined to participate. The question was, “Does your company offer or contribute to a health insurance program as a benefit to your employees?” A total of 3,078 firms responded to this question (including 1,997 who responded to the full survey and 1,081 who responded to this one question). Their responses are included in our estimates of the percentage of firms offering health benefits.4 The response rate for this question is 75%.
F i R m S i z e A n d i n d u S t R y d e F i n i t i o n S ,
R o u n d i n g , A n d i m p u tAt i o n
Throughout the report, exhibits categorize data by size of firm, region, and industry. Firm size definitions are as follows: All Small, 3 to 199 workers; and All Large, 200 or more workers. Occasionally, firm size categories will be broken into smaller groups. The All Small group may be categorized by: 3 to 24 workers, and 25 to 199 workers; or 3 to 9 workers, 10 to 24 workers, 25 to 49 workers, and 50 to 199 workers. The All Large group may be categorized by: 200 to 999 workers, 1,000 to 4,999 workers, and 5,000 or more workers. Exhibit M.1 shows detailed characteristics of the survey sample. Exhibit M.3 identifies which states are in each region.
3 in total, 238 firms participated in 2005 and 2007, 374 firms participated in 2006 and 2007, and 869 firms participated in 2005, 2006, and 2007.
4 estimates presented in exhibits 2.1 and 2.2 are based on the sample of both firms that completed the entire survey and those that answered just one question about whether they offer health benefits.
n o T e :
Employer Health Benefits 2 0 0 7 An n u a l S u r vey
12
T h e K A i S e r FA m i ly F o u n d AT i o n - A n d - h e A lT h r e S e A r c h A n d e d u c AT i o n A l T r u S T
Survey Design and M
ethods
Exhibit M.2 displays the distribution of the nation’s firms, workers, and covered workers (employees receiving coverage from their employer). Among the over three million firms nationally, approximately 60% are firms employing 3 to 9 workers; such firms employ 9% of workers and 6% of covered workers. In contrast, less than one percent of firms are firms employing 5,000 or more workers; these firms employ 34% of workers and 36% of covered workers. Therefore, the smallest firms dominate any national statistics about what employers in general are doing. In contrast, firms with 5,000 or more workers are the most important employer group in calculating statistics regarding covered workers, since they employ the largest percentage of the nation’s workforce.
The Kaiser/HRET survey compares premium increases to changes in workers’ hourly wages and overall inflation, both obtained from the Bureau of Labor Statistics (BLS). Workers’ hourly wage change is calculated from the Current Employment Statistics Survey (CES)5 using seasonally adjusted data for private workers. Overall inflation is calculated using the Consumer Price Index US city average for all urban consumers (CPI-U).6 We report annual increases in these data from April of the prior year to April of the current year because this is typically the field time of the survey.
Some exhibits in the report do not sum up to totals due to rounding effects. In a few cases, numbers from distribution exhibits may not add to equal numbers referenced in the text due to rounding effects. Throughout the report, while overall totals as well as totals for size and industry are statistically valid, some breakdowns may not be available due to limited sample sizes. In instances where the sample size is fewer than 30, exhibits include the notation NSD (Not Sufficient Data).
To control for item nonresponse bias, Kaiser/HRET imputes values that are missing for most variables in the survey. On average, less than five percent of these observations are imputed for any given variable. In prior years, many variables were imputed following a hotdeck approach, while others followed a distributional approach (where values were randomly determined from the variable’s distribution, assuming a normal
distribution). This year, all variables are imputed following a hotdeck approach. This imputation method does not rely on a normal distribution assumption and replaces missing values with observed values from a firm with similar characteristics, in this case, size and industry. Due to the low imputation rate for most variables, the change in methodology is not expected to have a major impact on the results. In some cases, due to small sample size, imputed outliers are excluded. There are a few variables that Kaiser/HRET has decided should not be imputed; these are typically variables where
“don’t know” is considered a valid response option (for example, firms’ opinions about effectiveness of various strategies to control health insurance costs).
W e i g h t i n g A n d S tAt i S t i c A l
S i g n i F i c A n c e
Because Kaiser/HRET selects firms randomly, it is possible through the use of statistical weights to extrapolate the results to national (as well as firm size, regional, and industry) averages. These weights allow Kaiser/HRET to present findings based on the number of workers covered by health plans, the number of total workers, and the number of firms. In general, findings in dollar amounts (such as premiums, worker contributions, and cost sharing) are weighted by covered workers. Other estimates, such as the offer rate, are weighted by firms. Specific weights were created to analyze the HDHP/SO plans that are offered with an HRA or that are HSA qualified. These weights represent the proportion of employees enrolled in each of these arrangements.
Calculation of the weights follows a common approach. First, the basic weight is determined, followed by a nonresponse adjustment. As part of this nonresponse adjustment, Kaiser/HRET conducted a small follow-up survey of those firms with 3 to 49 workers that refused to participate in the full survey. We applied an additional nonresponse adjustment to the weight to reflect the findings of this survey.
Next, we trimmed the weights in order to reduce the influence of weight outliers. First, we identified common groups of observations. Within each group, we identified the median and the interquartile range of the weights and calculated the trimming cut point
5 u.S. department of labor, Bureau of labor Statistics (2007). Current Employment Statistics. http://www.bls.gov/ces/home.htm. 6 u.S. department of labor, Bureau of labor Statistics (2007). Consumer Price Indexes. http://www.bls.gov/cpi/home.htm.
n o T e :
Employer Health Benefits 2 0 0 7 An n u a l S u r vey
13
T h e K A i S e r FA m i ly F o u n d AT i o n - A n d - h e A lT h r e S e A r c h A n d e d u c AT i o n A l T r u S T
Survey Design and M
ethods
as the median plus six times the interquartile range (M + [6 * IQR]). Weight values larger than this cut point are trimmed to the cut point. In all instances, less than one percent of the weight values were trimmed.
Finally, we applied a post-stratification adjustment. We used the U.S. Census Bureau’s 2004 Statistics of U.S. Businesses as the basis for the stratification and the post-stratification adjustment for firms in the private sector, and we used the 2002 Census of Governments as the basis for post-stratification for public sector firms.
The survey contains a few questions on employee cost sharing that are asked only of firms that indicate in a previous question that they have a certain cost-sharing provision. For example, the copayment amount for prescription drugs is asked only of those that report they have copayments for prescription drugs. Because the composite variables are reflective of only those plans with the provision, separate weights for the relevant variables were created in order to account for the fact that not all covered workers have such provisions.
The data are analyzed with SUDAAN,7 which computes appropriate standard error estimates by controlling for the complex design of the survey. All statistical tests are performed at the .05 level unless otherwise noted. For figures with multiple years, statistical tests are conducted for each year against the previous year shown, unless otherwise noted. No statistical tests are conducted for years prior to 1999.
Statistical tests for a given subgroup (firms with 25–49 workers, for instance) are tested against all other firm sizes not included in that subgroup (all firm sizes NOT including firms with 25–49 workers in this example). Tests are done similarly for region and industry; for example, Northeast is compared to all firms NOT in the Northeast (an aggregate of firms in the Midwest, South, and West). However, statistical tests for estimates compared across plan types (for example, average premiums in PPOs) are tested against the “All Plans” estimate. In some cases, we also test plan specific estimates against similar
estimates for other plan types (for example, single and family premiums for HDHP/SOs against single and family premiums in HMO, PPO, and POS plans); these are noted specifically in the text. The two types of statistical tests performed are the t-test and the Pearson Chi-square test.
The small number of observations for some variables, particularly variables specific to plans with Health Savings Accounts or Health Reimbursement Arrangements, resulted in large variability around the point estimates. These observations sometimes carry large weights, primarily for small firms. The reader should be cautioned that these influential weights may result in large movements in point estimates; however, often these movements are not statistically significant.
h i S t o R i c A l d AtA
Data in this report focus primarily on findings from surveys jointly authored by the Kaiser Family Foundation and the Health Research and Educational Trust, which have been conducted since 1999. Prior to 1999, the survey was conducted by the Health Insurance Association of America (HIAA) and KPMG using a similar survey instrument, but data is not available for all the intervening years. Following the survey’s introduction in 1987, the HIAA conducted the survey through 1990, but some data are not available for analysis. KPMG conducted the survey from 1991–1998. However, in 1991, 1992, 1994, and 1997, only larger firms were sampled. In 1993, 1995, 1996, and 1998, KPMG interviewed both large and small firms.
This report uses data from the 1993, 1996, and 1998 KPMG Surveys of Employer-Sponsored Health Benefits and the 1999–2007 Kaiser/HRET Survey of Employer-Sponsored Health Benefits. For a longer-term perspective, we also use the 1988 survey of the nation’s employers conducted by the HIAA, on which the KPMG and Kaiser/HRET surveys are based. Many questions in the HIAA, the KPMG, and Kaiser/HRET surveys are identical. The survey designs among the three surveys are also similar.
7 research Triangle institute (2005). SudAAn Software for the Statistical Analysis of correlated data, release 9.0.1, research Triangle Park, nc: research Triangle institute.
n o T e :

Survey Design and M
ethods
Employer Health Benefits 2 0 0 7 An n u a l S u r vey
14
T h e K A i S e r FA m i ly F o u n d AT i o n - A n d - h e A lT h r e S e A r c h A n d e d u c AT i o n A l T r u S T
Source: Kaiser/hreT Survey of employer-Sponsored health Benefits, 2007.
s o u r c e :
e x h i B i T m .1
Selec ted charac ter ist ics of Fi rms in the Sur vey Sample, 2007
Sample Sample distribution percentage of total Size After Weighting for Weighted Sample
FiRm Size
3–9 Workers 113 2,008,130 60%10–24 Workers 219 782,281 2325–49 Workers 158 278,794 850–199 Workers 279 207,484 6200–999 Workers 453 58,523 21,000–4,999 Workers 454 16,625 <15,000 or more Workers 321 8,114 <1
All FiRm SizeS 1,997 3,359,951 100%
Region
northeast 403 666,911 20%midwest 578 790,240 24South 655 1,139,353 34West 361 763,447 23
All RegionS 1,997 3,359,951 100%
induStRy
Agriculture/mining/construction 107 405,838 12%manufacturing 260 214,692 6Transportation/communications/utilities 93 127,602 4Wholesale 110 199,304 6retail 140 442,618 13Finance 142 231,270 7Service 743 1,488,230 44State/local Government 223 48,475 1health care 179 201,922 6
All induStRieS 1,997 3,359,951 100%
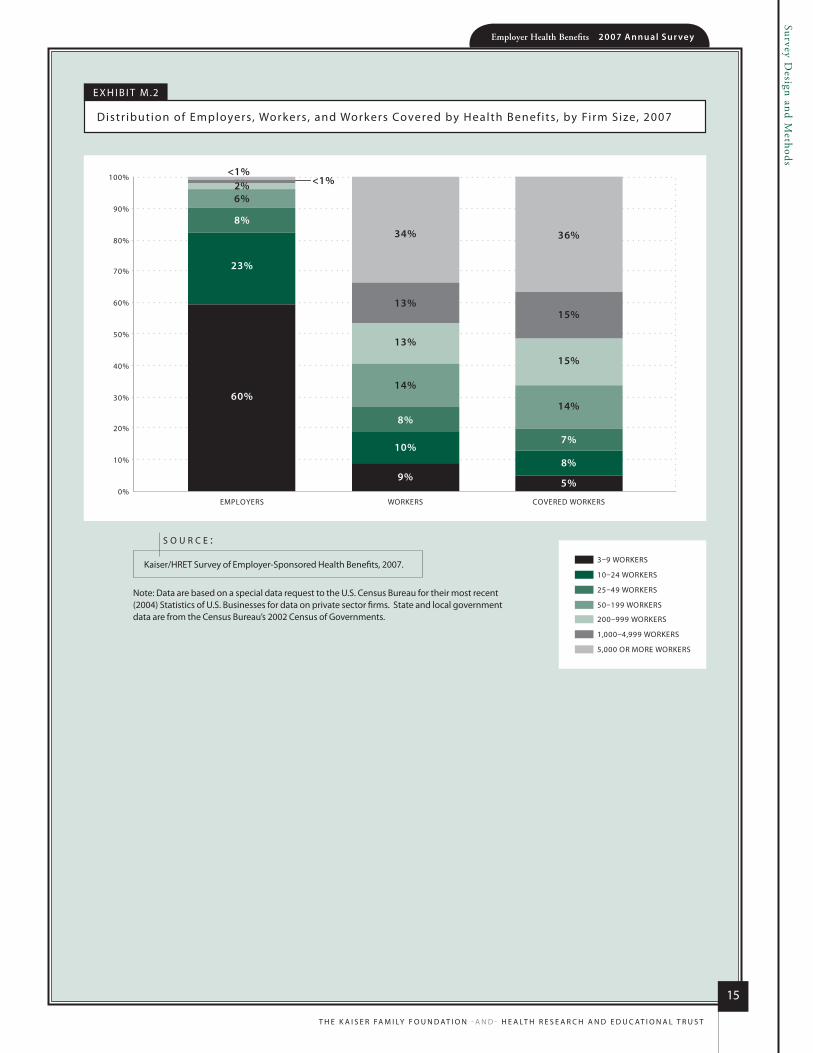
Survey Design and M
ethodsEmployer Health Benefits 2 0 0 7 An n u a l S u r vey
15
T h e K A i S e r FA m i ly F o u n d AT i o n - A n d - h e A lT h r e S e A r c h A n d e d u c AT i o n A l T r u S T
e x h i B i T m .2
distr ibution of employers, Workers, and Workers covered by health Benef its, by Firm Size, 2007
0%
10%
20%
30%
40%
50%
60%
70%
80%
90%
100%
EMPLOYERS WORKERS COVERED WORKERS
3–9 WORKERS
10–24 WORKERS
25–49 WORKERS
50–199 WORKERS
200–999 WORKERS
1,000–4,999 WORKERS
5,000 OR MORE WORKERS
2%
60%
9% 5%
8%
23%
8%
10%7%
8%
<1%<1%
6%2%
34%
13%
13%
14%
36%
15%
15%
14%
note: data are based on a special data request to the u.S. census Bureau for their most recent (2004) Statistics of u.S. Businesses for data on private sector firms. State and local government data are from the census Bureau’s 2002 census of Governments.
Kaiser/hreT Survey of employer-Sponsored health Benefits, 2007.
s o u r c e :

Survey Design and M
ethods
Employer Health Benefits 2 0 0 7 An n u a l S u r vey
16
T h e K A i S e r FA m i ly F o u n d AT i o n - A n d - h e A lT h r e S e A r c h A n d e d u c AT i o n A l T r u S T
e x h i B i T m .3
States by region, 2007
u.S. department of commerce, economics and Statistics Administration, u.S. census Bureau. Available at http://www.census.gov/geo/www/us_regdiv.pdf.
s o u r c e :
northeast midwest South West
connecticut illinois Alabama Alaska
maine indiana Arkansas Arizona
massachusetts iowa delaware california
new hampshire Kansas district of columbia colorado
new Jersey michigan Florida hawaii
new york minnesota Georgia idaho
Pennsylvania missouri Kentucky montana
rhode island nebraska louisiana nevada
vermont north dakota maryland new mexico
ohio mississippi oregon
South dakota north carolina utah
Wisconsin oklahoma Washington
South carolina Wyoming
Tennessee
Texas
virginia
West virginia

78%$12,1
06
$4,4
79
Employer Health Benefits2 0 0 7 A n n u A l S u r v e y
s ect ion
Cost of Health
Insurance
1
6.1%
section
on
eC
ost of Health Insurance
1
Employer Health Benefits 2 0 0 7 An n u a l S u r vey
18
T h e K A i S e r FA m i ly F o u n d AT i o n - A n d - h e A lT h r e S e A r c h A n d e d u c AT i o n A l T r u S T
C o s t o f H e a l t H I n s u r a n C e
Premiums for family coverage increased 6.1% in 2007. While Premiums continue to rise, this is the fourth
consecutive year that Premium increases Were less than they Were in the Previous year.1 the average
Premium increase in 2007 is the loWest since 1999.
While loWer than in recent years, the 6.1% increase in the cost of coverage exceeds the overall rate of
inflation by about three and a half Percentage Points and the increase in Workers’ earnings by almost
tWo and a half Percentage Points. since 2001, the cost of health insurance has increased by 78%.
the average cost of family coverage is $12,106 a year.
P r e m i u m i n c r e A S e S
�The cost of health insurance rose 6.1% in 2007, which is lower than the 7.7% increase for 2006 but still much higher than the overall rate of inflation (2.6%) or the increase in workers’ earnings (3.7%) (Exhibit 1.1).
�Small firms (3–199 workers) and large firms (200 or more workers) reported a comparable rate of increase (5.5% vs. 6.4%) (Exhibit 1.4).
�There is variation in premium increases across workers and firms: 10% of covered workers work in firms that experienced premium increases of greater than 15%, while 46% of covered workers work in firms that experienced premium increases less than or equal to 5% (Exhibit 1.5).
�The average premium increase for HMOs (8.3%) is statistically greater than the overall average premium increase for all plan types (Exhibit 1.7). The average premium increases for conventional plans, PPOs, POS plans, and HDHP/SOs are not statistically different from the average premium increase.
�Premium equivalents in self-funded plans rose at a similar rate as premiums in fully insured plans (6.0% vs. 6.2%) (Exhibit 1.8).
1 data on premium increases reflect the cost of health insurance premiums for a family of four. The average premium increase is weighted by covered workers.
n o t e :
P r e m i u m c o S t S f o r S i n g l e A n d fA m i ly
c o v e r A g e
�The average cost of premiums for single coverage in 2007 is $373 per month or $4,479 per year. This figure includes both the worker and employer contribution. The average cost of premiums for family coverage is $1,009 per month or $12,106 per year (Exhibit 1.12).
�Covered workers in PPO plans, the plan type with the highest enrollment, have higher average premiums than covered workers in HMOs and HDHP/SOs for both single and family coverage. Covered workers in HDHP/SOs have lower average premiums than workers in HMOs, PPOs, and POS plans for single coverage and PPOs and HMOs for family coverage.
�Premiums for covered workers in small firms (3–199 workers) are similar to those for workers in large firms (200 or more workers) for both single and family coverage (Exhibit 1.12).
�Similar to premium increases, there is also a great deal of variation in premiums across workers and firms: 7% of covered workers work in firms that have single premiums of $250 or less per month, while 28% have single premiums greater than $400 per month (Exhibit 1.15).
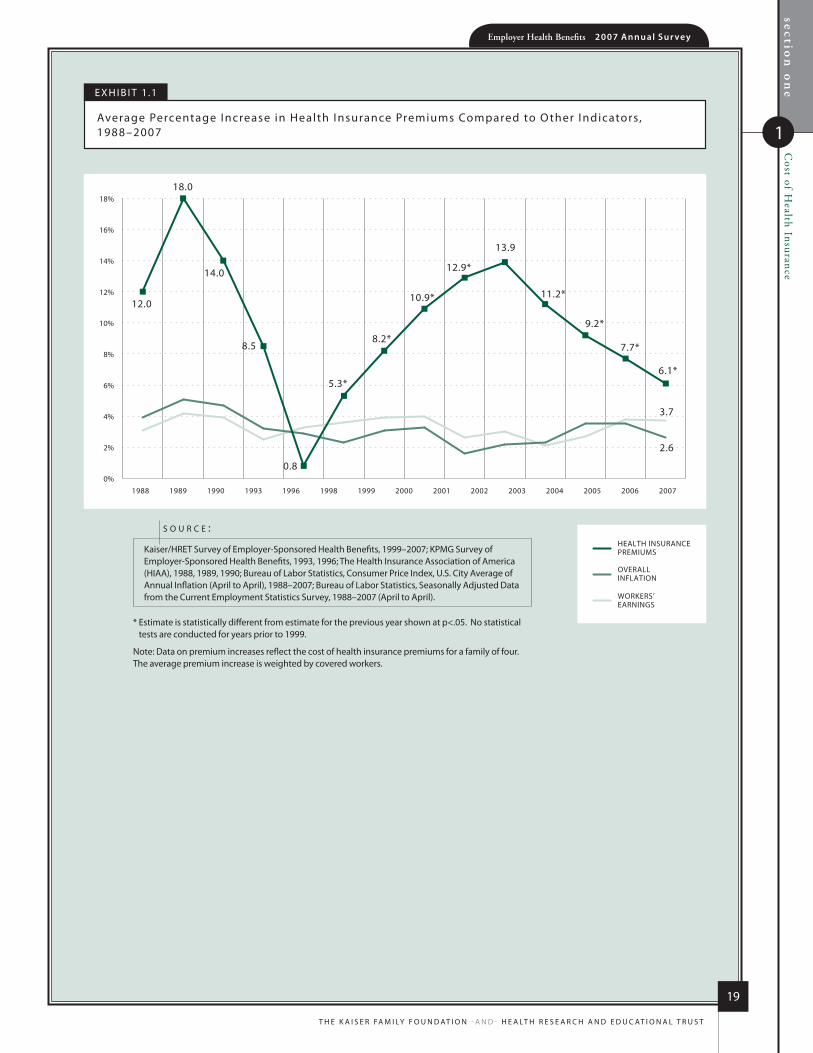
section
on
e
1
Cost of H
ealth InsuranceEmployer Health Benefits 2 0 0 7 An n u a l S u r vey
19
T h e K A i S e r FA m i ly F o u n d AT i o n - A n d - h e A lT h r e S e A r c h A n d e d u c AT i o n A l T r u S T
e x h i b i T 1 .1
Average Percentage increase in health insurance Premiums compared to o ther indicators, 1988–2007
* estimate is statistically different from estimate for the previous year shown at p<.05. no statistical tests are conducted for years prior to 1999.
note: data on premium increases reflect the cost of health insurance premiums for a family of four. The average premium increase is weighted by covered workers.
Kaiser/hreT Survey of employer-Sponsored health benefits, 1999–2007; KPmG Survey of employer-Sponsored health benefits, 1993, 1996; The health insurance Association of America (hiAA), 1988, 1989, 1990; bureau of labor Statistics, consumer Price index, u.S. city Average of Annual inflation (April to April), 1988–2007; bureau of labor Statistics, Seasonally Adjusted data from the current employment Statistics Survey, 1988–2007 (April to April).
s o u r c e :HEALTH INSURANCEPREMIUMS
WORKERS’EARNINGS
OVERALLINFLATION
1988 1989 1990 1993 1996 1998 1999 2000 2001 2002 2003 2004 2005 2006 20070%
2%
4%
6%
8%
10%
12%
14%
16%
18%
12.0
18.0
14.0
8.5
0.8
5.3*
8.2*
10.9*
13.9
12.9*
11.2*
9.2*
6.1*
3.7
2.6
7.7*
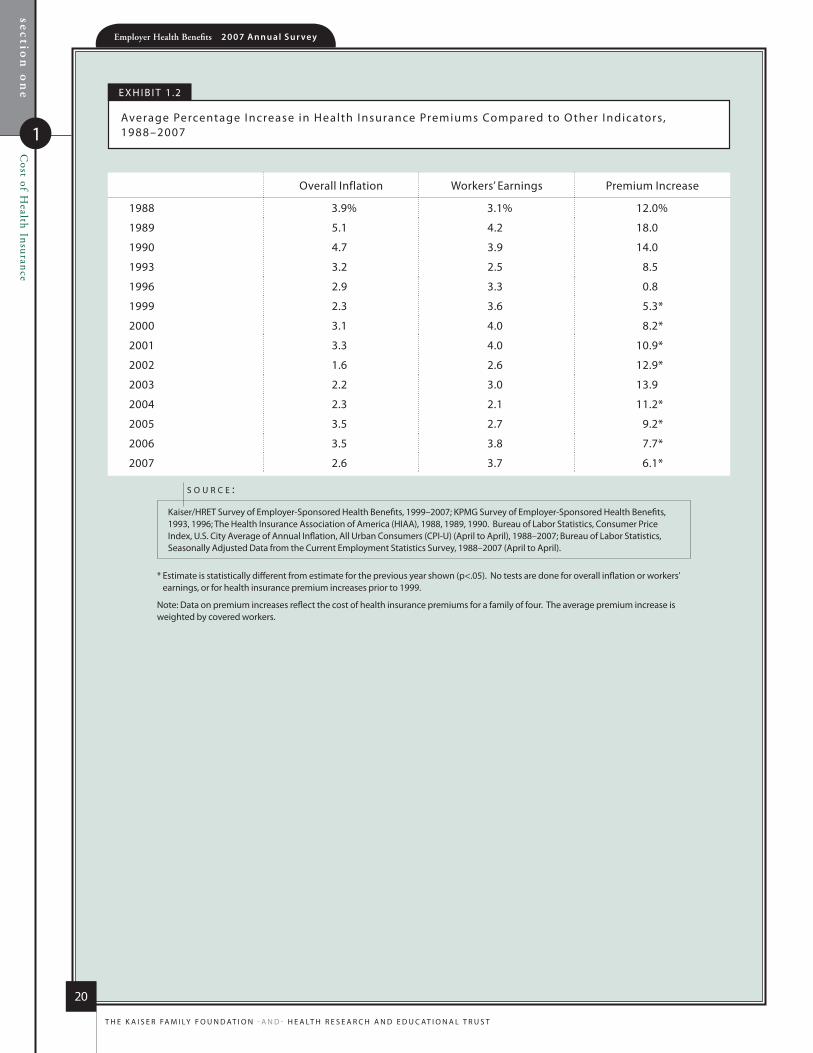
section
on
eC
ost of Health Insurance
1
Employer Health Benefits 2 0 0 7 An n u a l S u r vey
20
T h e K A i S e r FA m i ly F o u n d AT i o n - A n d - h e A lT h r e S e A r c h A n d e d u c AT i o n A l T r u S T
overall inflation Workers’ earnings Premium increase
1988 3.9% 3.1% 12.0%
1989 5.1 4.2 18.0
1990 4.7 3.9 14.0
1993 3.2 2.5 8.5
1996 2.9 3.3 0.8
1999 2.3 3.6 5.3*
2000 3.1 4.0 8.2*
2001 3.3 4.0 10.9*
2002 1.6 2.6 12.9*
2003 2.2 3.0 13.9
2004 2.3 2.1 11.2*
2005 3.5 2.7 9.2*
2006 3.5 3.8 7.7*
2007 2.6 3.7 6.1*
e x h i b i T 1 .2
Average Percentage increase in health insurance Premiums compared to o ther indicators, 1988–2007
* estimate is statistically different from estimate for the previous year shown (p<.05). no tests are done for overall inflation or workers’ earnings, or for health insurance premium increases prior to 1999.
note: data on premium increases reflect the cost of health insurance premiums for a family of four. The average premium increase is weighted by covered workers.
Kaiser/hreT Survey of employer-Sponsored health benefits, 1999–2007; KPmG Survey of employer-Sponsored health benefits, 1993, 1996; The health insurance Association of America (hiAA), 1988, 1989, 1990. bureau of labor Statistics, consumer Price index, u.S. city Average of Annual inflation, All urban consumers (cPi-u) (April to April), 1988–2007; bureau of labor Statistics, Seasonally Adjusted data from the current employment Statistics Survey, 1988–2007 (April to April).
s o u r c e :

section
on
e
1
Cost of H
ealth InsuranceEmployer Health Benefits 2 0 0 7 An n u a l S u r vey
21
T h e K A i S e r FA m i ly F o u n d AT i o n - A n d - h e A lT h r e S e A r c h A n d e d u c AT i o n A l T r u S T
e x h i b i T 1 .3
Average Percentage increase in health insurance Premiums, by Plan Type, 1999–2007
* estimate is statistically different by plan type from estimate for the previous year shown (p<.05).
^ information was not obtained for hdhP/So plans prior to 2006.
note: data on premium increases reflect the cost of health insurance premiums for a family of four. The average premium increase is weighted by covered workers.
Kaiser/hreT Survey of employer-Sponsored health benefits, 1999–2007.
s o u r c e :
1999 2000 2001 2002 2003 2004 2005 2006 2007
conventional 6.0% 9.5%* 11.3% 13.8%* 14.3% 11.1% 5.0%* 8.4% 7.3%
hmo 5.6 7.6* 10.4 13.5* 15.2 12.0* 9.4* 8.6 8.3
PPo 5.4 8.5* 11.6 12.7* 13.7 10.9* 9.4* 7.3* 5.3*
PoS 4.6 7.8* 9.9 12.2* 13.2 11.3 9.1 8.4 5.7*
hdhP/So ^ ^ ^ ^ ^ ^ ^ 4.8 6.3
All PlAnS 5.3%* 8.2%* 10.9%* 12.9%* 13.9% 11.2%* 9.2%* 7.7%* 6.1%*
e x h i b i T 1 .4
Average Percentage increase in health insurance Premiums, by Firm Size, 2007
* estimate is statistically different from estimate for all firms not in the indicated size category (p<.05).
note: data on premium increases reflect the cost of health insurance premiums for a family of four. The average premium increase is weighted by covered workers.
Kaiser/hreT Survey of employer-Sponsored health benefits, 2007.
s o u r c e :
0% 1% 2% 3% 4% 5% 6% 7% 8%
5,000 OR MORE WORKERS
1,000−4,999 WORKERS
200−999 WORKERS
50−199 WORKERS
25−49 WORKERS
3−24 WORKERS
ALL SMALL FIRMS (3−199 WORKERS)
ALL LARGE FIRMS (200 OR MORE WORKERS)
ALL FIRMS 6.1%
6.4%
5.5%
6.4%
6.2%
6.6%
3.9%*
6.7%
6.8%

section
on
eC
ost of Health Insurance
1
Employer Health Benefits 2 0 0 7 An n u a l S u r vey
22
T h e K A i S e r FA m i ly F o u n d AT i o n - A n d - h e A lT h r e S e A r c h A n d e d u c AT i o n A l T r u S T
e x h i b i T 1 .5
distr ibution of Average Percentage increase in health insurance Premiums, by Firm Size, 2007
LESS THAN OR EQUAL TO 5%
GREATER THAN 5%, LESS THAN OR EQUAL TO 10%
GREATER THAN 10%, LESS THAN OR EQUAL TO 15%
GREATER THAN 15%, LESS THAN OR EQUAL TO 20%
GREATER THAN 20%
0% 10% 20% 30% 40% 50% 60% 70% 80% 90% 100%
ALL LARGE FIRMS(200 OR MORE
WORKERS)*
ALL SMALL FIRMS(3−199 WORKERS)*
ALL FIRMS
25% 12%
36% 11%
33% 11%
9% 4%
5% 3%
7% 4%
49%
44%
46%
Kaiser/hreT Survey of employer-Sponsored health benefits, 2007.
s o u r c e :
* distributions for All Small Firms and All large Firms are statistically different (p<.05).
note: data on premium increases reflect the cost of health insurance premiums for a family of four. The average premium increase is weighted by covered workers.
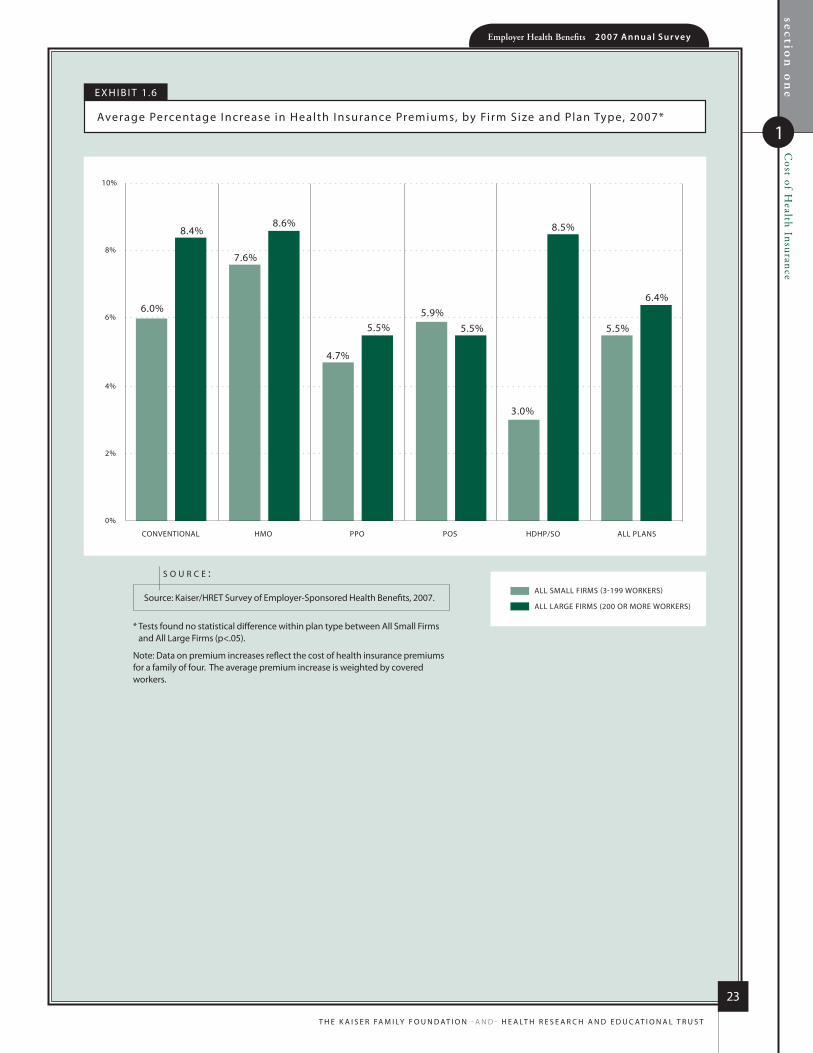
section
on
e
1
Cost of H
ealth InsuranceEmployer Health Benefits 2 0 0 7 An n u a l S u r vey
23
T h e K A i S e r FA m i ly F o u n d AT i o n - A n d - h e A lT h r e S e A r c h A n d e d u c AT i o n A l T r u S T
e x h i b i T 1 .6
Average Percentage increase in health insurance Premiums, by Firm Size and Plan Type, 2007*
ALL SMALL FIRMS (3-199 WORKERS)
ALL LARGE FIRMS (200 OR MORE WORKERS)
0%
2%
4%
6%
8%
10%
HMOCONVENTIONAL PPO POS HDHP/SO ALL PLANS
6.0%
8.4%
7.6%
8.6%
4.7%
5.5%5.9%
5.5%
3.0%
8.5%
6.4%
5.5%
* Tests found no statistical difference within plan type between All Small Firms and All large Firms (p<.05).
note: data on premium increases reflect the cost of health insurance premiums for a family of four. The average premium increase is weighted by covered workers.
Source: Kaiser/hreT Survey of employer-Sponsored health benefits, 2007.
s o u r c e :

section
on
eC
ost of Health Insurance
1
Employer Health Benefits 2 0 0 7 An n u a l S u r vey
24
T h e K A i S e r FA m i ly F o u n d AT i o n - A n d - h e A lT h r e S e A r c h A n d e d u c AT i o n A l T r u S T
e x h i b i T 1 .7
Average Percentage increase in health insurance Premiums, by Plan Type, 2007
*estimate is statistically different from All Plans estimate (p<.05).
note: data on premium increases reflect the cost of health insurance premiums for a family of four. The average premium increase is weighted by covered workers.
Source: Kaiser/hreT Survey of employer-Sponsored health benefits, 2007.
s o u r c e :
0%
2%
4%
6%
8%
10%
HMO*CONVENTIONAL PPO POS HDHP/SO ALL PLANS
7.3%
8.3%
5.3%5.7%
6.3%6.1%

section
on
e
1
Cost of H
ealth InsuranceEmployer Health Benefits 2 0 0 7 An n u a l S u r vey
25
T h e K A i S e r FA m i ly F o u n d AT i o n - A n d - h e A lT h r e S e A r c h A n d e d u c AT i o n A l T r u S T
e x h i b i T 1 .8
Average Percentage increase in health insurance Premiums, by Funding Arrangement and Plan Type, 2007*
FULLY INSURED
SELF-FUNDED
0%
2%
4%
6%
8%
10%
HMOCONVENTIONAL PPO POS HDHP/SO ALL PLANS
6.9%
7.5%
8.3% 8.4%
5.3% 5.3%
6.1%
5.0%4.6%
8.0%
6.0%6.2%
* Tests found no statistical difference within plan type between Fully insured and Self-Funded plans (p<.05).
note: data on premium increases reflect the cost of health insurance premiums for a family of four. The average premium increase is weighted by covered workers. For definitions of Self-Funded and Fully insured Plans, see the introduction to Section 10.
Kaiser/hreT Survey of employer-Sponsored health benefits, 2007.
s o u r c e :

section
on
eC
ost of Health Insurance
1
Employer Health Benefits 2 0 0 7 An n u a l S u r vey
26
T h e K A i S e r FA m i ly F o u n d AT i o n - A n d - h e A lT h r e S e A r c h A n d e d u c AT i o n A l T r u S T
e x h i b i T 1 .9
Average Percentage increase in health insurance Premiums by Funding Arrangement, 1999–2007
0%
2%
4%
6%
8%
10%
12%
14%
16%
18%
1999 2000 2001 2002 2003 2004 2005 2006 2007
6.1
9.7*
12.4*
13.5
15.6*
11.4*
9.3*8.7
6.2*
4.5
6.7*
9.3*
12.4
11.1
12.3*
9.1*
6.06.8*
FULLY INSURED
SELF-FUNDED
* estimate is statistically different from estimate for the previous year shown (p<.05).
note: data on premium increases reflect the cost of health insurance premiums for a family of four. The average premium increase is weighted by covered workers. For definitions of Self-Funded and Fully insured Plans, see the introduction to Section 10. due to a change in the survey questionnaire, funding status was not asked of firms with conventional plans in 2006. Therefore, conventional plan funding status is not included in this figure for 2006.
Kaiser/hreT Survey of employer-Sponsored health benefits, 1999–2007.
s o u r c e :
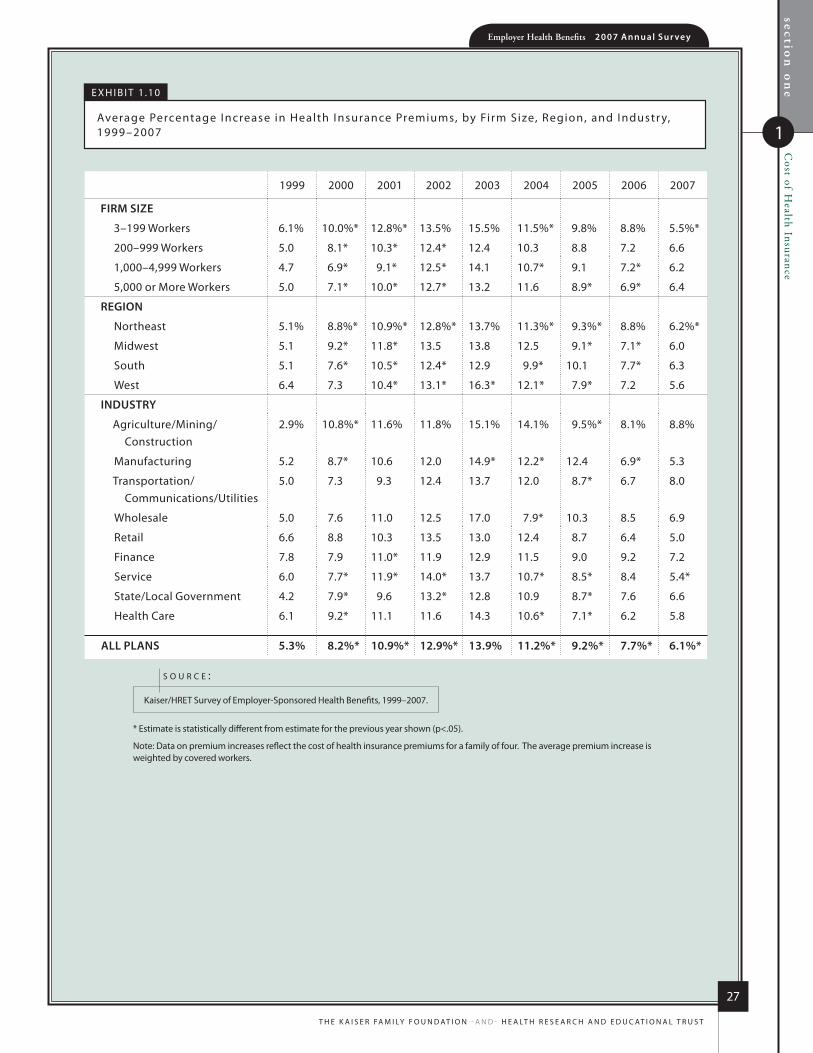
section
on
e
1
Cost of H
ealth InsuranceEmployer Health Benefits 2 0 0 7 An n u a l S u r vey
27
T h e K A i S e r FA m i ly F o u n d AT i o n - A n d - h e A lT h r e S e A r c h A n d e d u c AT i o n A l T r u S T
e x h i b i T 1 .10
Average Percentage increase in health insurance Premiums, by Firm Size, region, and industr y, 1999–2007
* estimate is statistically different from estimate for the previous year shown (p<.05).
note: data on premium increases reflect the cost of health insurance premiums for a family of four. The average premium increase is weighted by covered workers.
Kaiser/hreT Survey of employer-Sponsored health benefits, 1999–2007.
s o u r c e :
1999 2000 2001 2002 2003 2004 2005 2006 2007
firm SiZe
3–199 Workers 6.1% 10.0%* 12.8%* 13.5% 15.5% 11.5%* 9.8% 8.8% 5.5%*
200–999 Workers 5.0 8.1* 10.3* 12.4* 12.4 10.3 8.8 7.2 6.6
1,000–4,999 Workers 4.7 6.9* 9.1* 12.5* 14.1 10.7* 9.1 7.2* 6.2
5,000 or more Workers 5.0 7.1* 10.0* 12.7* 13.2 11.6 8.9* 6.9* 6.4
region
northeast 5.1% 8.8%* 10.9%* 12.8%* 13.7% 11.3%* 9.3%* 8.8% 6.2%*
midwest 5.1 9.2* 11.8* 13.5 13.8 12.5 9.1* 7.1* 6.0
South 5.1 7.6* 10.5* 12.4* 12.9 9.9* 10.1 7.7* 6.3
West 6.4 7.3 10.4* 13.1* 16.3* 12.1* 7.9* 7.2 5.6
induStry
Agriculture/mining/construction
2.9% 10.8%* 11.6% 11.8% 15.1% 14.1% 9.5%* 8.1% 8.8%
manufacturing 5.2 8.7* 10.6 12.0 14.9* 12.2* 12.4 6.9* 5.3
Transportation/communications/utilities
5.0 7.3 9.3 12.4 13.7 12.0 8.7* 6.7 8.0
Wholesale 5.0 7.6 11.0 12.5 17.0 7.9* 10.3 8.5 6.9
retail 6.6 8.8 10.3 13.5 13.0 12.4 8.7 6.4 5.0
Finance 7.8 7.9 11.0* 11.9 12.9 11.5 9.0 9.2 7.2
Service 6.0 7.7* 11.9* 14.0* 13.7 10.7* 8.5* 8.4 5.4*
State/local Government 4.2 7.9* 9.6 13.2* 12.8 10.9 8.7* 7.6 6.6
health care 6.1 9.2* 11.1 11.6 14.3 10.6* 7.1* 6.2 5.8
All PlAnS 5.3% 8.2%* 10.9%* 12.9%* 13.9% 11.2%* 9.2%* 7.7%* 6.1%*

section
on
eC
ost of Health Insurance
1
Employer Health Benefits 2 0 0 7 An n u a l S u r vey
28
T h e K A i S e r FA m i ly F o u n d AT i o n - A n d - h e A lT h r e S e A r c h A n d e d u c AT i o n A l T r u S T
* estimate is statistically different from All Plans estimate (p<.05).
Kaiser/hreT Survey of employer-Sponsored health benefits, 2007.
s o u r c e :
e x h i b i T 1 .11
Average monthly Premiums for covered Workers, S ingle and Family coverage, by Plan Type, 2007
hmo PPo PoS hdhP/So All PlAnS
Single coverage $358 $386 $361 $322* $373
Family coverage $990 $1,037 $966 $891* $1,009
e x h i b i T 1 .12
Average monthly and Annual Premiums for covered Workers, by Plan Type and Firm Size, 2007*
* Tests found no statistical difference within plan type between estimates for All Small Firms and All large Firms (p<.05).
Kaiser/hreT Survey of employer-Sponsored health benefits, 2007.
s o u r c e :
monthly Annual
Single Coverage Family Coverage Single Coverage Family Coverage
Hmo
All Small Firms (3–199 Workers) $355 $955 $4,255 $11,459
All large Firms (200 or more Workers) 360 1,005 4,320 12,059
All firm SiZeS $358 $990 $4,299 $11,879
PPo
All Small Firms (3–199 Workers) $407 $1,018 $4,881 $12,219
All large Firms (200 or more Workers) 379 1,044 4,546 12,525
All firm SiZeS $386 $1,037 $4,638 $12,443
PoS
All Small Firms (3–199 Workers) $363 $989 $4,358 $11,871
All large Firms (200 or more Workers) 359 936 4,310 11,237
All firm SiZeS $361 $966 $4,337 $11,588
HdHP/So
All Small Firms (3–199 Workers) $323 $843 $3,881 $10,116
All large Firms (200 or more Workers) 321 931 3,856 11,176
All firm SiZeS $322 $891 $3,869 $10,693
All PlAnS
All Small Firms (3–199 Workers) $379 $986 $4,553 $11,835
All large Firms (200 or more Workers) 370 1,019 4,442 12,233
All firm SiZeS $373 $1,009 $4,479 $12,106

section
on
e
1
Cost of H
ealth InsuranceEmployer Health Benefits 2 0 0 7 An n u a l S u r vey
29
T h e K A i S e r FA m i ly F o u n d AT i o n - A n d - h e A lT h r e S e A r c h A n d e d u c AT i o n A l T r u S T
e x h i b i T 1 .13
Average monthly and Annual Premiums for covered Workers, by Plan Type and region, 2007
* estimate is statistically different within plan type from estimate for all firms not in the indicated region (p<.05).
Kaiser/hreT Survey of employer-Sponsored health benefits, 2007.
s o u r c e :
monthly Annual
Single Coverage Family Coverage Single Coverage Family Coverage
Hmo
northeast $368 $1,006 $4,416 $12,069
midwest 379 1,022 4,543 12,261
South 341 980 4,087 11,766
West 357 969 4,284 11,628
All regionS $358 $990 $4,299 $11,879
PPo
northeast $383 $1,074 $4,590 $12,884
midwest 381 1,034 4,567 12,410
South 364 1,002* 4,370 12,027*
West 450 1,075 5,403 12,900
All regionS $386 $1,037 $4,638 $12,443
PoS
northeast $381 $1,043 $4,570 $12,521
midwest 399 1,024 4,789 12,289
South 339 947 4,069 11,359
West 347 901 4,166 10,818
All regionS $361 $966 $4,337 $11,588
HdHP/So
northeast $308 $892 $3,691 $10,698
midwest 284* 839 3,414* 10,065
South 351 885 4,212 10,614
West 340 964 4,077 11,567
All regionS $322 $891 $3,869 $10,693
All PlAnS
northeast $375 $1,045* $4,504 $12,544*
midwest 376 1,018 4,511 12,222
South 356* 985 4,275* 11,818
West 395 1,002 4,742 12,030
All regionS $373 $1,009 $4,479 $12,106
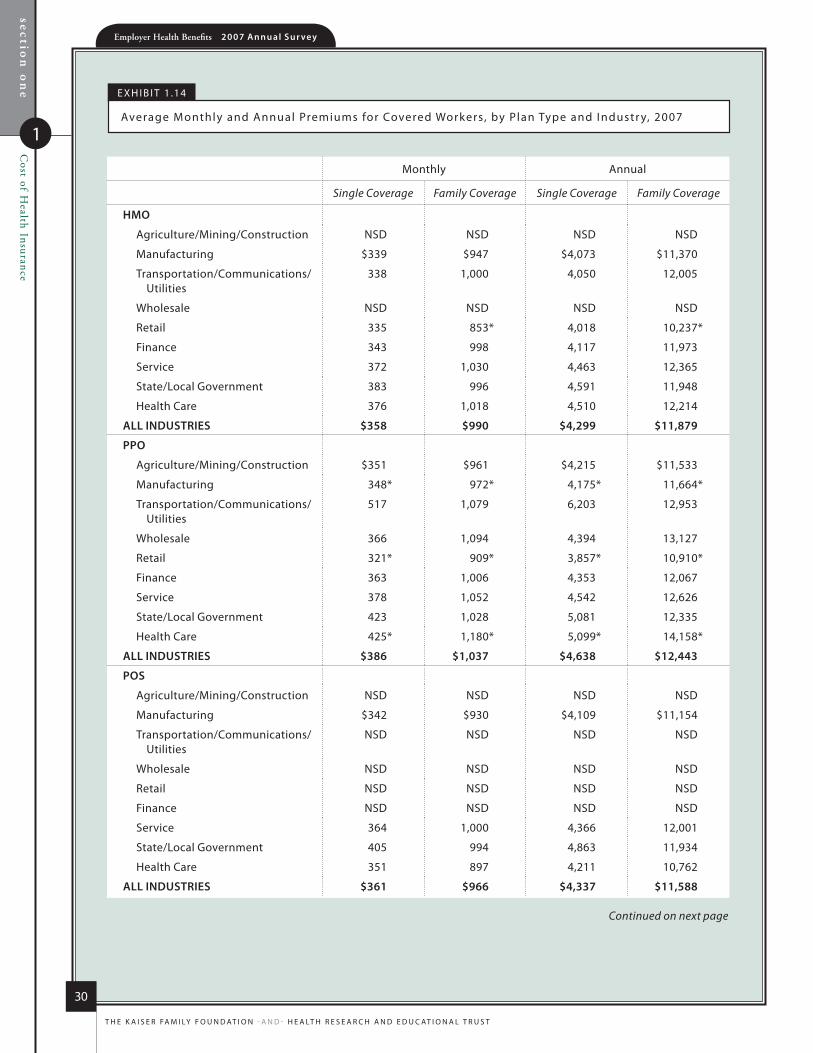
section
on
eC
ost of Health Insurance
1
Employer Health Benefits 2 0 0 7 An n u a l S u r vey
30
T h e K A i S e r FA m i ly F o u n d AT i o n - A n d - h e A lT h r e S e A r c h A n d e d u c AT i o n A l T r u S T
e x h i b i T 1 .14
Average monthly and Annual Premiums for covered Workers, by Plan Type and industr y, 2007
monthly Annual
Single Coverage Family Coverage Single Coverage Family Coverage
Hmo
Agriculture/mining/construction nSd nSd nSd nSd
manufacturing $339 $947 $4,073 $11,370
Transportation/communications/ utilities
338 1,000 4,050 12,005
Wholesale nSd nSd nSd nSd
retail 335 853* 4,018 10,237*
Finance 343 998 4,117 11,973
Service 372 1,030 4,463 12,365
State/local Government 383 996 4,591 11,948
health care 376 1,018 4,510 12,214
All induStrieS $358 $990 $4,299 $11,879
PPo
Agriculture/mining/construction $351 $961 $4,215 $11,533
manufacturing 348* 972* 4,175* 11,664*
Transportation/communications/ utilities
517 1,079 6,203 12,953
Wholesale 366 1,094 4,394 13,127
retail 321* 909* 3,857* 10,910*
Finance 363 1,006 4,353 12,067
Service 378 1,052 4,542 12,626
State/local Government 423 1,028 5,081 12,335
health care 425* 1,180* 5,099* 14,158*
All induStrieS $386 $1,037 $4,638 $12,443
PoS
Agriculture/mining/construction nSd nSd nSd nSd
manufacturing $342 $930 $4,109 $11,154
Transportation/communications/ utilities
nSd nSd nSd nSd
Wholesale nSd nSd nSd nSd
retail nSd nSd nSd nSd
Finance nSd nSd nSd nSd
Service 364 1,000 4,366 12,001
State/local Government 405 994 4,863 11,934
health care 351 897 4,211 10,762
All induStrieS $361 $966 $4,337 $11,588
Continued on next page

section
on
e
1
Cost of H
ealth InsuranceEmployer Health Benefits 2 0 0 7 An n u a l S u r vey
31
T h e K A i S e r FA m i ly F o u n d AT i o n - A n d - h e A lT h r e S e A r c h A n d e d u c AT i o n A l T r u S T
* estimate is statistically different within plan type from estimate for all firms not in the indicated industry (p<.05).
nSd: not Sufficient data.
Kaiser/hreT Survey of employer-Sponsored health benefits, 2007.
s o u r c e :
monthly Annual
Single Coverage Family Coverage Single Coverage Family Coverage
HdHP/So
Agriculture/mining/construction nSd nSd nSd nSd
manufacturing $277* $767* $3,325* $9,199*
Transportation/communications/ utilities
nSd nSd nSd nSd
Wholesale nSd nSd nSd nSd
retail nSd nSd nSd nSd
Finance 316 905 3,797 10,857
Service 357 897 4,286 10,768
State/local Government nSd nSd nSd nSd
health care nSd nSd nSd nSd
All induStrieS $322 $891 $3,869 $10,693
All PlAnS
Agriculture/mining/construction $338* $946 $4,060* $11,350
manufacturing 341* 950* 4,094* 11,401*
Transportation/communications/ utilities
442 1,053 5,307 12,638
Wholesale 352 1,015 4,225 12,181
retail 341* 904* 4,093* 10,853*
Finance 356 999 4,270 11,987
Service 374 1,032 4,485 12,389
State/local Government 406* 1,011 4,877* 12,138
health care 401* 1,103* 4,817* 13,232*
All induStrieS $373 $1,009 $4,479 $12,106
e x h i b i T 1 .14
Average monthly and Annual Premiums for covered Workers, by Plan Type and industr y, 2007
Continued from previous page
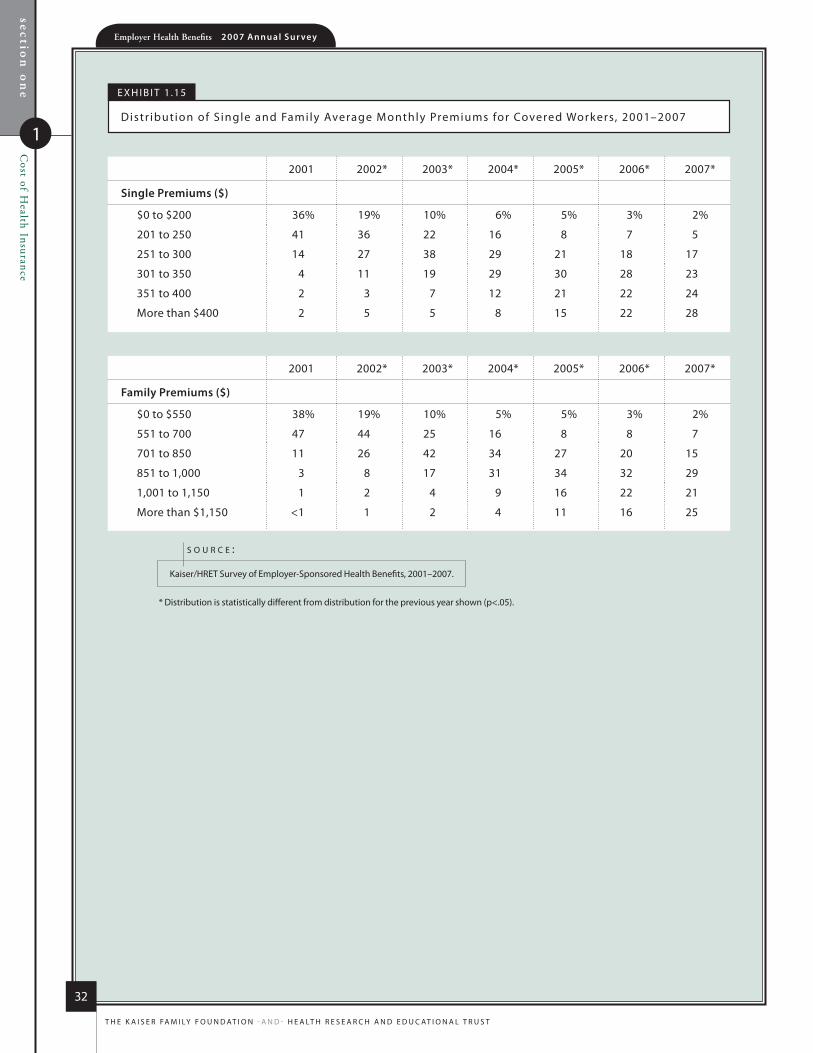
section
on
eC
ost of Health Insurance
1
Employer Health Benefits 2 0 0 7 An n u a l S u r vey
32
T h e K A i S e r FA m i ly F o u n d AT i o n - A n d - h e A lT h r e S e A r c h A n d e d u c AT i o n A l T r u S T
e x h i b i T 1 .15
distr ibution of S ingle and Family Average monthly Premiums for covered Workers, 2001–2007
* distribution is statistically different from distribution for the previous year shown (p<.05).
Kaiser/hreT Survey of employer-Sponsored health benefits, 2001–2007.
s o u r c e :
2001 2002* 2003* 2004* 2005* 2006* 2007*
Single Premiums ($)
$0 to $200 36% 19% 10% 6% 5% 3% 2%
201 to 250 41 36 22 16 8 7 5
251 to 300 14 27 38 29 21 18 17
301 to 350 4 11 19 29 30 28 23
351 to 400 2 3 7 12 21 22 24
more than $400 2 5 5 8 15 22 28
2001 2002* 2003* 2004* 2005* 2006* 2007*
family Premiums ($)
$0 to $550 38% 19% 10% 5% 5% 3% 2%
551 to 700 47 44 25 16 8 8 7
701 to 850 11 26 42 34 27 20 15
851 to 1,000 3 8 17 31 34 32 29
1,001 to 1,150 1 2 4 9 16 22 21
more than $1,150 <1 1 2 4 11 16 25

78%$12,1
06
$4,4
79
Employer Health Benefits2 0 0 7 A n n u A l S u r v e y
s ect ion
Health Benefits
Offer Rates
2
6.1%

Employer Health Benefits 2 0 0 7 An n u a l S u r vey
sec
tion
two
Health B
enefits Offer R
ates
2
34
T h e K A i S e r FA m i ly F o u n d AT i o n - A n d - h e A lT h r e S e A r c h A n d e d u c AT i o n A l T r u S T
H e a l t H B e n e f i t s O f f e r r a t e s
The percenTage of firms offering healTh benefiTs in 2007 is noT significanTly differenT from The percenTage
in 2006. nearly all large firms (200 or more workers) offer healTh benefiTs while small firms (3–199
workers) are significanTly less likely To do so.
since 2000, The percenTage of firms offering healTh benefiTs has dropped by nine percenTage poinTs.
while The year-To-year changes have noT been sTaTisTically significanT, The cumulaTive effecT has been a
large and sTaTisTically significanT change over This seven-year period. This change is driven largely by a
decrease in The percenTage of small firms (3–199 workers) offering coverage.
�In 2007, 60% of firms offer health benefits, similar to the 61% reported in 2006, but down from 69% in 2000 (Exhibit 2.1). Small firms (3–199 workers) make up about 97% of employers in America, and this decline in the overall offer rate has been driven largely by a drop in the percentage of small firms that offer coverage.
Ninety-nine percent of large firms (200 or more workers) offer health benefits in 2007, statistically unchanged from 2006 (Exhibit 2.2). In contrast, only 59% of small firms (3–199 workers) offer health benefits in 2007. This is similar to the offer rate among all small firms in 2006, but represents a drop in the offer rate for small firms from 68% in 2000. For large firms (200 or more workers), the offer rate has not dropped below 98% over the same time period.
�The likelihood that a firm offers health benefits to its workers varies considerably with the firm’s characteristics, such as firm size, the proportion of lower-wage workers, the proportion of part-time workers in the firm, and whether workers are unionized.
The smallest firms are least likely to offer health insurance. Only 45% of firms with 3 to 9 workers offer coverage, compared with 76% of firms with 10 to 24 workers, and 83% of firms with 25 to 49 workers (Exhibit 2.3). Over 95% of firms with 50 or more employees offer health insurance coverage.
Firms with fewer lower-wage workers (where less than 35% of workers earn $21,000 or less annually) are significantly more likely to offer health insurance than firms with many lower-wage workers (where 35% or more of workers earn $21,000 or less annually). Sixty-seven percent of firms with fewer lower-wage employees offer health benefits, compared with 36% of firms with a higher proportion of lower-wage workers (Exhibit 2.4).
Firms with fewer part-time workers (where less than 35% of employees work part-time) are also significantly more likely to offer coverage to their workers than firms with many part-time workers. Among firms with fewer part-time workers, 71% offer health insurance, compared to 30% of firms with a higher percentage of part-time workers (Exhibit 2.4).
Firms that employ at least some union workers are much more likely than firms without union workers to offer health benefits to their employees. Ninety-nine percent of firms with union workers offer health benefits, whereas 57% of firms that do not have union employees offer health coverage (Exhibit 2.4).
Firms with a relatively small share of younger workers (less than 35% are age 26 or younger) are significantly more likely to offer health benefits than firms with a higher percentage of younger workers (63% vs. 35%) (Exhibit 2.4).
Employer Health Benefits 2 0 0 7 An n u a l S u r veyse
ctio
n tw
oH
ealth Benefits O
ffer Rates
2
35
T h e K A i S e r FA m i ly F o u n d AT i o n - A n d - h e A lT h r e S e A r c h A n d e d u c AT i o n A l T r u S T
�Among firms offering health benefits, relatively few offer benefits to their part-time and temporary workers, and a somewhat higher percentage offer them to unmarried same-sex or opposite-sex domestic partners.
In 2007, 24% of all firms that offer health benefits offer them to part-time workers. Firms with 200 or more workers are more likely to offer health benefits to part-time employees than firms with 3 to 199 workers (43% vs. 23%) (Exhibit 2.5).
A very small percentage (2%) of firms offering health benefits offer them to temporary workers (Exhibit 2.6).
Over one-third (37%) of firms offering health benefits offer them to unmarried same-sex domestic partners (Exhibit 2.7), and 47% offer them to unmarried opposite-sex domestic partners. Small firms (3–199 workers) are significantly more likely than large firms (200 or more workers) to offer health benefits to opposite-sex domestic partners, at 47% versus 28%.
F i r m S N o t o F F e r i N g H e A lt H B e N e F i t S
�The survey asks firms that do not offer health benefits about their reasons for not offering, if they have offered or shopped for health insurance in the recent past, and if they think employees prefer higher wages or benefits. Because less than one percent of large firms (200 or more workers) report not offering health benefits, we present the following information in terms of employers with 3 to 199 workers, 59% of whom offer health benefits.
�Despite a slowing of health insurance cost growth in recent years, the cost of health insurance remains the main reason cited by firms for not offering health benefits.
Among firms not offering health benefits, 72% cite high premiums as a “very important” reason for not doing so. Other factors frequently cited by firms as “very important” reasons for not offering coverage include: firm is too small (61%) and employees are covered elsewhere (40%) (Exhibit 2.8).
�Many non-offering firms have either offered health benefits in the past five years, or shopped for coverage recently.
Twenty-three percent of non-offering firms have offered health benefits in the past five years, while 39% have shopped for coverage in the past twelve months. The likelihood of shopping increases from 38% of firms with between 3 and 24 workers, to 72% of firms with 25 to 199 workers (Exhibit 2.9).
�Over two-thirds of non-offering firms (71%) believe that employees would rather get an additional $2 per hour in the form of higher wages (approximately the cost of health insurance per worker), as opposed to health insurance (Exhibit 2.10).
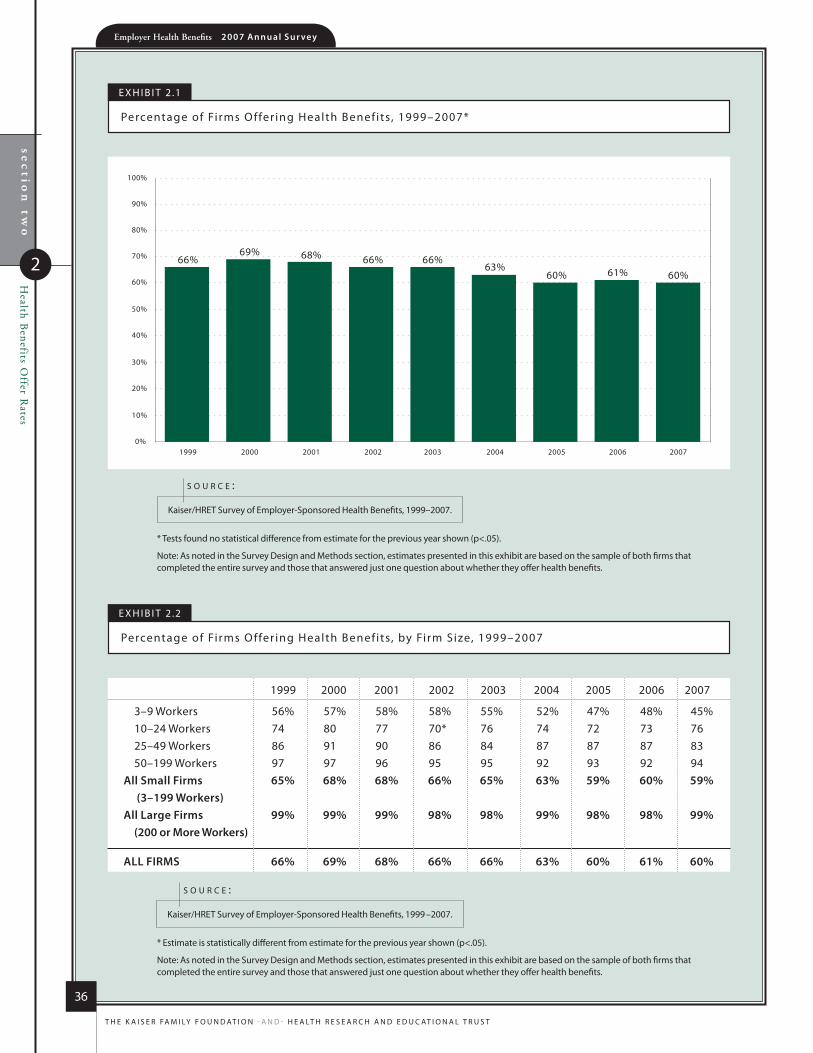
Employer Health Benefits 2 0 0 7 An n u a l S u r vey
36
T h e K A i S e r FA m i ly F o u n d AT i o n - A n d - h e A lT h r e S e A r c h A n d e d u c AT i o n A l T r u S T
sec
tion
two
Health B
enefits Offer R
ates
2
e x h i b i T 2 .1
Percentage of Fi rms o ffer ing health benef its, 1999–2007*
* Tests found no statistical difference from estimate for the previous year shown (p<.05).
note: As noted in the Survey design and methods section, estimates presented in this exhibit are based on the sample of both firms that completed the entire survey and those that answered just one question about whether they offer health benefits.
Kaiser/hreT Survey of employer-Sponsored health benefits, 1999–2007.
s o u r c e :
* estimate is statistically different from estimate for the previous year shown (p<.05).
note: As noted in the Survey design and methods section, estimates presented in this exhibit are based on the sample of both firms that completed the entire survey and those that answered just one question about whether they offer health benefits.
Kaiser/hreT Survey of employer-Sponsored health benefits, 1999 –2007.
s o u r c e :
0%
10%
20%
30%
40%
50%
60%
70%
80%
90%
100%
1999 2000 2001 2002 2003 2004 2005 2006 2007
66%69% 68% 66% 66%
63%60% 61% 60%
e x h i b i T 2 .2
Percentage of Fi rms o ffer ing health benef its, by Firm Size, 1999–2007
1999 2000 2001 2002 2003 2004 2005 2006 2007
3–9 Workers 56% 57% 58% 58% 55% 52% 47% 48% 45%10–24 Workers 74 80 77 70* 76 74 72 73 7625–49 Workers 86 91 90 86 84 87 87 87 8350–199 Workers 97 97 96 95 95 92 93 92 94
All Small Firms 65% 68% 68% 66% 65% 63% 59% 60% 59% (3–199 Workers)
All large Firms 99% 99% 99% 98% 98% 99% 98% 98% 99% (200 or more Workers)
All FirmS 66% 69% 68% 66% 66% 63% 60% 61% 60%
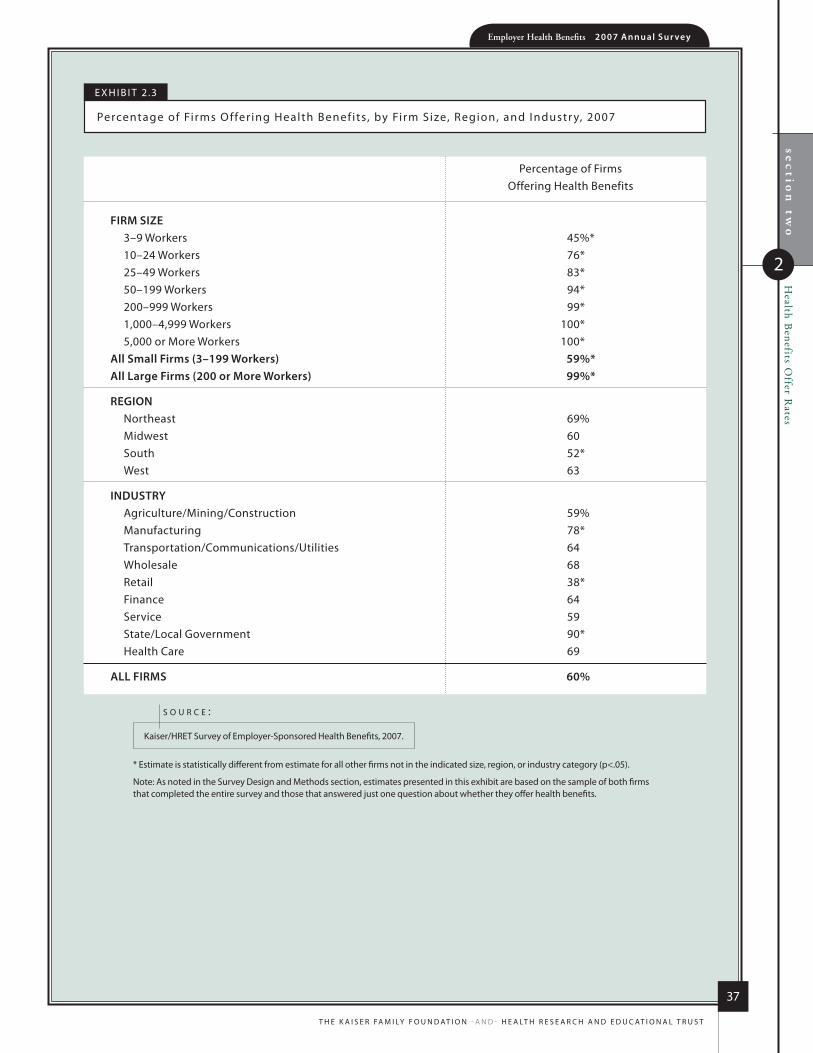
sec
tion
two
Health B
enefits Offer R
atesEmployer Health Benefits 2 0 0 7 An n u a l S u r vey
37
T h e K A i S e r FA m i ly F o u n d AT i o n - A n d - h e A lT h r e S e A r c h A n d e d u c AT i o n A l T r u S T
2
e x h i b i T 2 .3
Percentage of Fi rms o ffer ing health benef its, by Firm Size, region, and industr y, 2007
* estimate is statistically different from estimate for all other firms not in the indicated size, region, or industry category (p<.05).
note: As noted in the Survey design and methods section, estimates presented in this exhibit are based on the sample of both firms that completed the entire survey and those that answered just one question about whether they offer health benefits.
Kaiser/hreT Survey of employer-Sponsored health benefits, 2007.
s o u r c e :
Percentage of Firms offering health benefits
Firm SiZe 3–9 Workers 45%*10–24 Workers 76*25–49 Workers 83*50–199 Workers 94*200–999 Workers 99*1,000–4,999 Workers 100*5,000 or more Workers 100*
All Small Firms (3–199 Workers) 59%*All large Firms (200 or more Workers) 99%*
regioN northeast 69%midwest 60South 52*West 63
iNDUStrY Agriculture/mining/construction 59%manufacturing 78*Transportation/communications/utilities 64Wholesale 68retail 38*Finance 64Service 59State/local Government 90*health care 69
All FirmS 60%
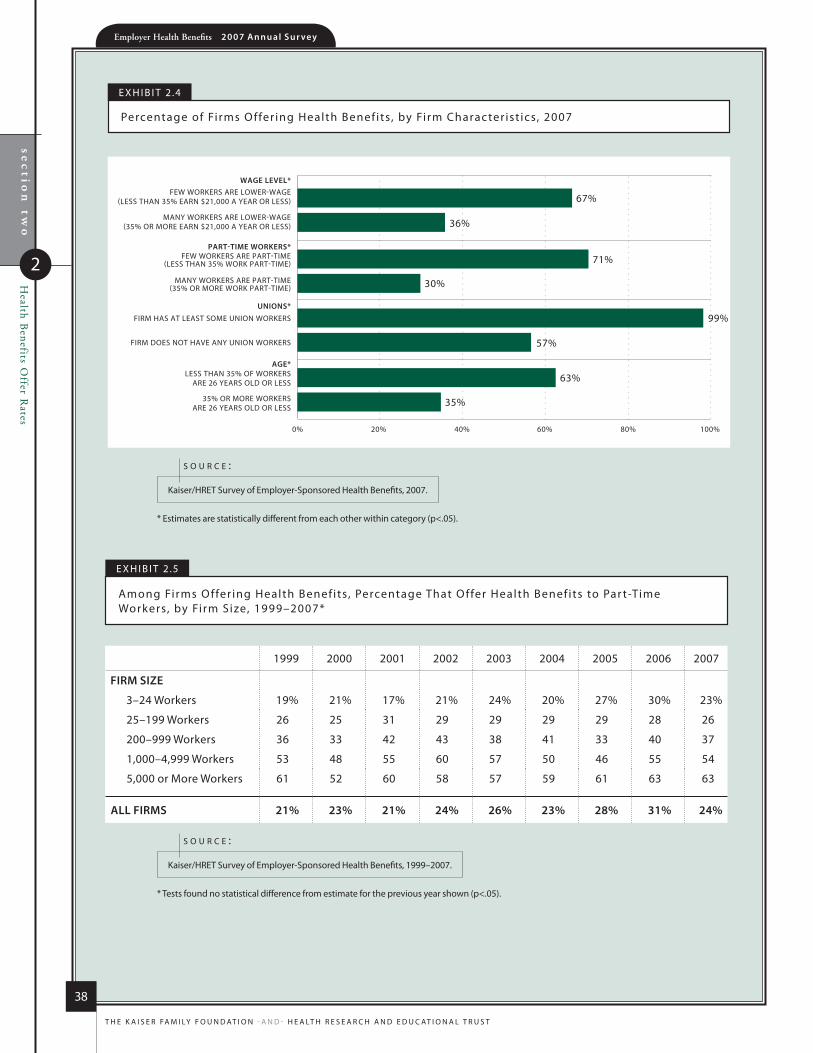
Employer Health Benefits 2 0 0 7 An n u a l S u r vey
38
T h e K A i S e r FA m i ly F o u n d AT i o n - A n d - h e A lT h r e S e A r c h A n d e d u c AT i o n A l T r u S T
sec
tion
two
Health B
enefits Offer R
ates
2
e x h i b i T 2 .5
Among Firms o ffer ing health benef its, Percentage That o ffer health benef its to Par t-Time Workers, by Firm Size, 1999–2007*
* Tests found no statistical difference from estimate for the previous year shown (p<.05).
Kaiser/hreT Survey of employer-Sponsored health benefits, 1999–2007.
s o u r c e :
0% 20% 40% 60% 80% 100%
FIRM DOES NOT HAVE ANY UNION WORKERS
FIRM HAS AT LEAST SOME UNION WORKERS
57%
63%
35%
99%
30%
71%
36%
67%FEW WORKERS ARE LOWER-WAGE
(LESS THAN 35% EARN $21,000 A YEAR OR LESS)
MANY WORKERS ARE LOWER-WAGE(35% OR MORE EARN $21,000 A YEAR OR LESS)
FEW WORKERS ARE PART-TIME(LESS THAN 35% WORK PART-TIME)
MANY WORKERS ARE PART-TIME(35% OR MORE WORK PART-TIME)
WAGE LEVEL*
PART-TIME WORKERS*
UNIONS*
35% OR MORE WORKERSARE 26 YEARS OLD OR LESS
LESS THAN 35% OF WORKERSARE 26 YEARS OLD OR LESS
AGE*
e x h i b i T 2 .4
Percentage of Fi rms o ffer ing health benef its, by Firm charac ter ist ics, 2007
* estimates are statistically different from each other within category (p<.05).
Kaiser/hreT Survey of employer-Sponsored health benefits, 2007.
s o u r c e :
1999 2000 2001 2002 2003 2004 2005 2006 2007
Firm SiZe
3–24 Workers 19% 21% 17% 21% 24% 20% 27% 30% 23%
25–199 Workers 26 25 31 29 29 29 29 28 26
200–999 Workers 36 33 42 43 38 41 33 40 37
1,000–4,999 Workers 53 48 55 60 57 50 46 55 54
5,000 or more Workers 61 52 60 58 57 59 61 63 63
All FirmS 21% 23% 21% 24% 26% 23% 28% 31% 24%
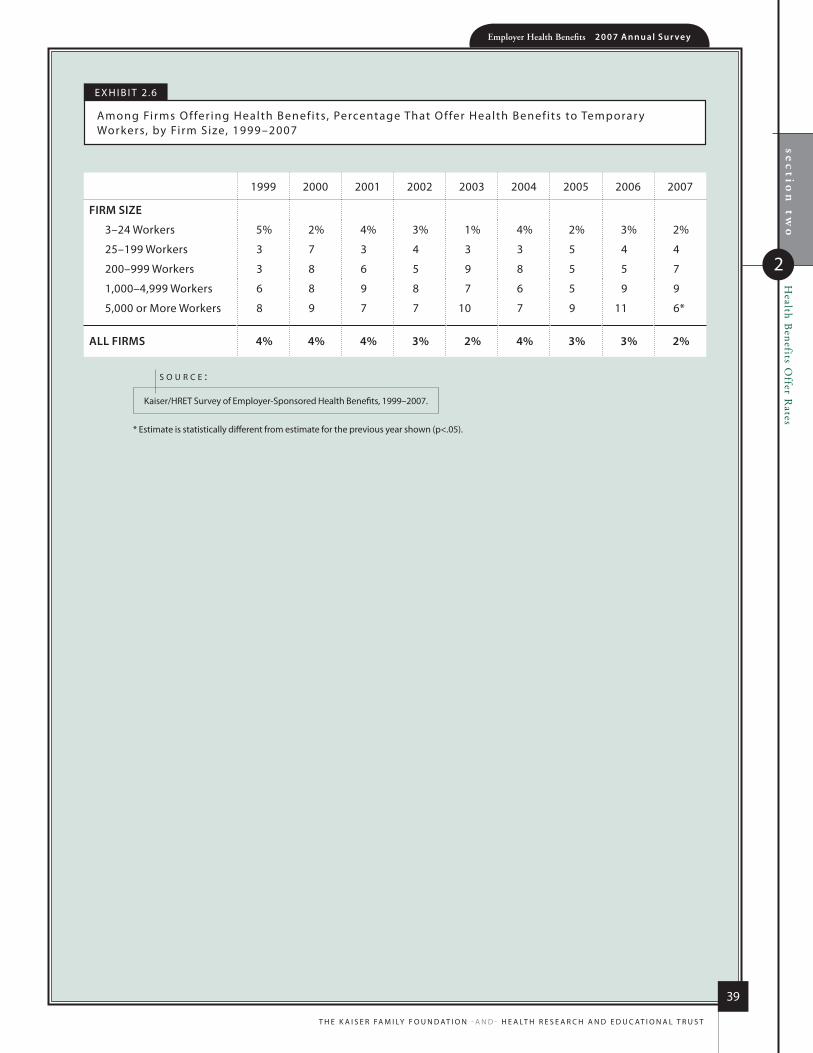
sec
tion
two
Health B
enefits Offer R
atesEmployer Health Benefits 2 0 0 7 An n u a l S u r vey
39
T h e K A i S e r FA m i ly F o u n d AT i o n - A n d - h e A lT h r e S e A r c h A n d e d u c AT i o n A l T r u S T
2
e x h i b i T 2 .6
Among Firms o ffer ing health benef its, Percentage That o ffer health benef its to Temporar y Workers, by Firm Size, 1999–2007
* estimate is statistically different from estimate for the previous year shown (p<.05).
Kaiser/hreT Survey of employer-Sponsored health benefits, 1999–2007.
s o u r c e :
1999 2000 2001 2002 2003 2004 2005 2006 2007
Firm SiZe
3–24 Workers 5% 2% 4% 3% 1% 4% 2% 3% 2%
25–199 Workers 3 7 3 4 3 3 5 4 4
200–999 Workers 3 8 6 5 9 8 5 5 7
1,000–4,999 Workers 6 8 9 8 7 6 5 9 9
5,000 or more Workers 8 9 7 7 10 7 9 11 6*
All FirmS 4% 4% 4% 3% 2% 4% 3% 3% 2%

Employer Health Benefits 2 0 0 7 An n u a l S u r vey
40
T h e K A i S e r FA m i ly F o u n d AT i o n - A n d - h e A lT h r e S e A r c h A n d e d u c AT i o n A l T r u S T
sec
tion
two
Health B
enefits Offer R
ates
2
e x h i b i T 2 .7
Among Firms o ffer ing health benef its, Percentage of employers o ffer ing health benef its to domestic Par tners, by Firm Size, region, and industr y, 2007
* estimate is statistically different from estimate for all firms not in the indicated size, region, or industry category (p<.05).
Kaiser/hreT Survey of employer-Sponsored health benefits, 2007.
s o u r c e :
Firm SiZe3–24 Workers 52%* 40%25–49 Workers 33* 2750–199 Workers 32* 28200–999 Workers 27* 291,000–4,999 Workers 31* 345,000 or more Workers 29* 42
All Small Firms (3–199 Workers) 47%* 37%All large Firms (200 or more Workers) 28%* 31%
regioNnortheast 56% 49%midwest 44 18*South 31* 33West 61 48
iNDUStrYAgriculture/mining/construction 24%* 7%*manufacturing 49 26Transportation/communications/utilities 71 63Wholesale 63 62retail 52 43Finance 49 50Service 44 35State/local Government 35 28health care 57 42
All FirmS 47% 37%
offer to unmarried opposite-Sex
domestic Partners
offer to unmarried Same-Sex
domestic Partners
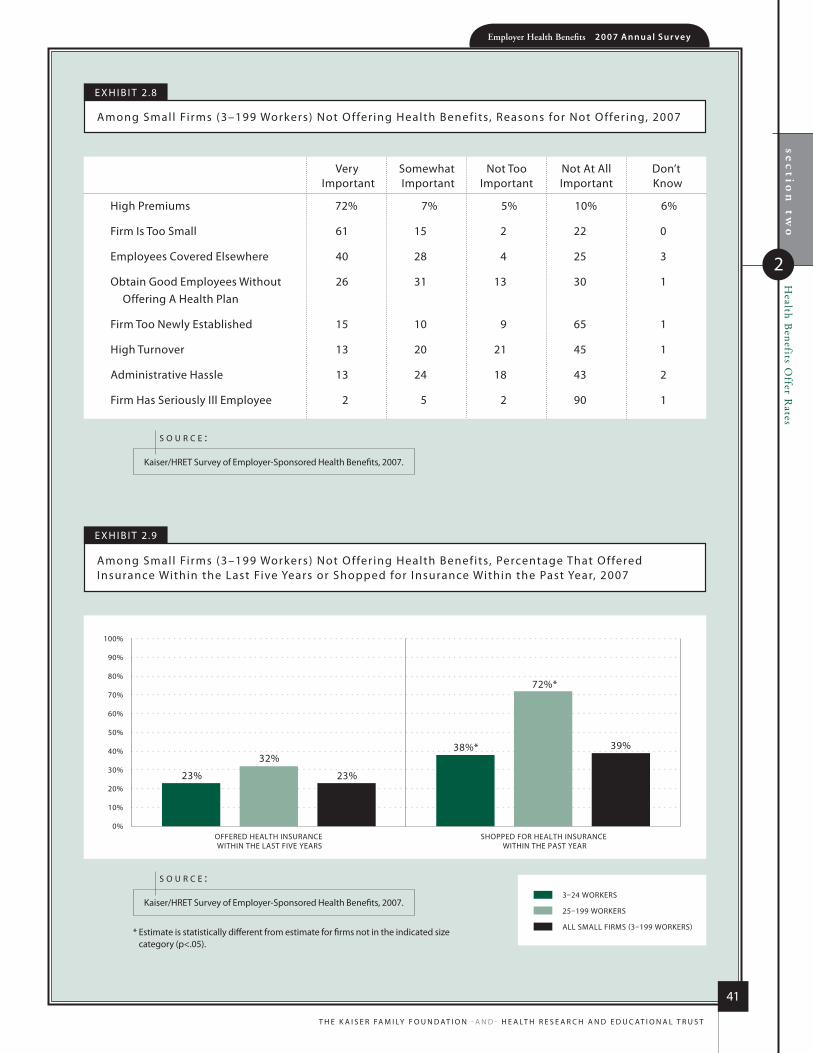
sec
tion
two
Health B
enefits Offer R
atesEmployer Health Benefits 2 0 0 7 An n u a l S u r vey
41
T h e K A i S e r FA m i ly F o u n d AT i o n - A n d - h e A lT h r e S e A r c h A n d e d u c AT i o n A l T r u S T
2
e x h i b i T 2 .8
Among Smal l Fi rms (3–199 Workers) not o ffer ing health benef its, reasons for not o ffer ing, 2007
Kaiser/hreT Survey of employer-Sponsored health benefits, 2007.
s o u r c e :
very Somewhat not Too not At All don’t important important important important Know
high Premiums 72% 7% 5% 10% 6%
Firm is Too Small 61 15 2 22 0
employees covered elsewhere 40 28 4 25 3
obtain Good employees Without 26 31 13 30 1 offering A health Plan
Firm Too newly established 15 10 9 65 1
high Turnover 13 20 21 45 1
Administrative hassle 13 24 18 43 2
Firm has Seriously ill employee 2 5 2 90 1
e x h i b i T 2 .9
Among Smal l Fi rms (3–199 Workers) not o ffer ing health benef its, Percentage That o ffered insurance Within the last Five years or Shopped for insurance Within the Past year, 2007
3–24 WORKERS
25–199 WORKERS
ALL SMALL FIRMS (3–199 WORKERS)
23%
32%39%
23%
38%*
72%*
OFFERED HEALTH INSURANCE WITHIN THE LAST FIVE YEARS
SHOPPED FOR HEALTH INSURANCE WITHIN THE PAST YEAR
0%
10%
20%
30%
40%
50%
60%
70%
80%
90%
100%
* estimate is statistically different from estimate for firms not in the indicated size category (p<.05).
Kaiser/hreT Survey of employer-Sponsored health benefits, 2007.
s o u r c e :
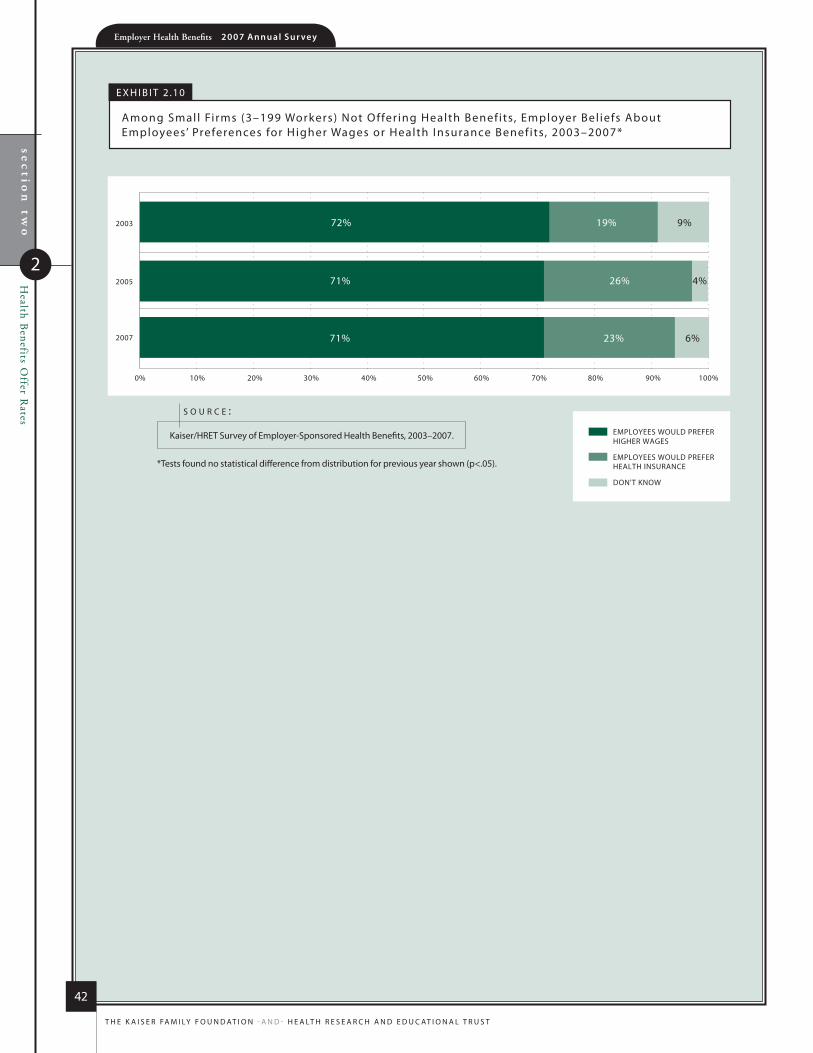
Employer Health Benefits 2 0 0 7 An n u a l S u r vey
42
T h e K A i S e r FA m i ly F o u n d AT i o n - A n d - h e A lT h r e S e A r c h A n d e d u c AT i o n A l T r u S T
sec
tion
two
Health B
enefits Offer R
ates
2
e x h i b i T 2 .10
Among Smal l Fi rms (3–199 Workers) not o ffer ing health benef its, employer bel iefs About employees’ Preferences for h igher Wages or health insurance benef its, 2003–2007*
0% 10% 20% 30% 40% 50% 60% 70% 80% 90% 100%
EMPLOYEES WOULD PREFER HIGHER WAGES
EMPLOYEES WOULD PREFER HEALTH INSURANCE
DON'T KNOW
26%
2007
2005
2003
71%
72% 19%
71% 23%
4%
9%
6%
* Tests found no statistical difference from distribution for previous year shown (p<.05).
Kaiser/hreT Survey of employer-Sponsored health benefits, 2003–2007.
s o u r c e :

sec
tion
two
Health B
enefits Offer R
atesEmployer Health Benefits 2 0 0 7 An n u a l S u r vey
43
T h e K a i s e r Fa m i ly F o u n d aT i o n - a n d - h e a lT h r e s e a r c h a n d e d u c aT i o n a l T r u s T
2
e x h i b i T 2 .11
among smal l Fi rms (3–199 Workers) not o ffer ing health benef its, distr ibution of Fi rms by the amount They bel ieve the Total cost of health insurance for one employee Would cost per employee per month i f They o ffered the benef it , 2005–2007*
0% 10% 20% 30% 40% 50% 60% 70% 80% 90% 100%
2007
2005 8% 27% 23% 15% 22% 5%
7% 24% 18% 21% 20% 9%
LESS THAN $100 PER MONTH
$100–$199 PER MONTH
$200–$299 PER MONTH
$300–$399 PER MONTH
$400 OR MORE PER MONTH
DON’T KNOW
* Tests found no statistical difference from distribution for previous year shown (p<.05).
Kaiser/hreT survey of employer-sponsored health benefits, 2005–2007.
s o u r c e :
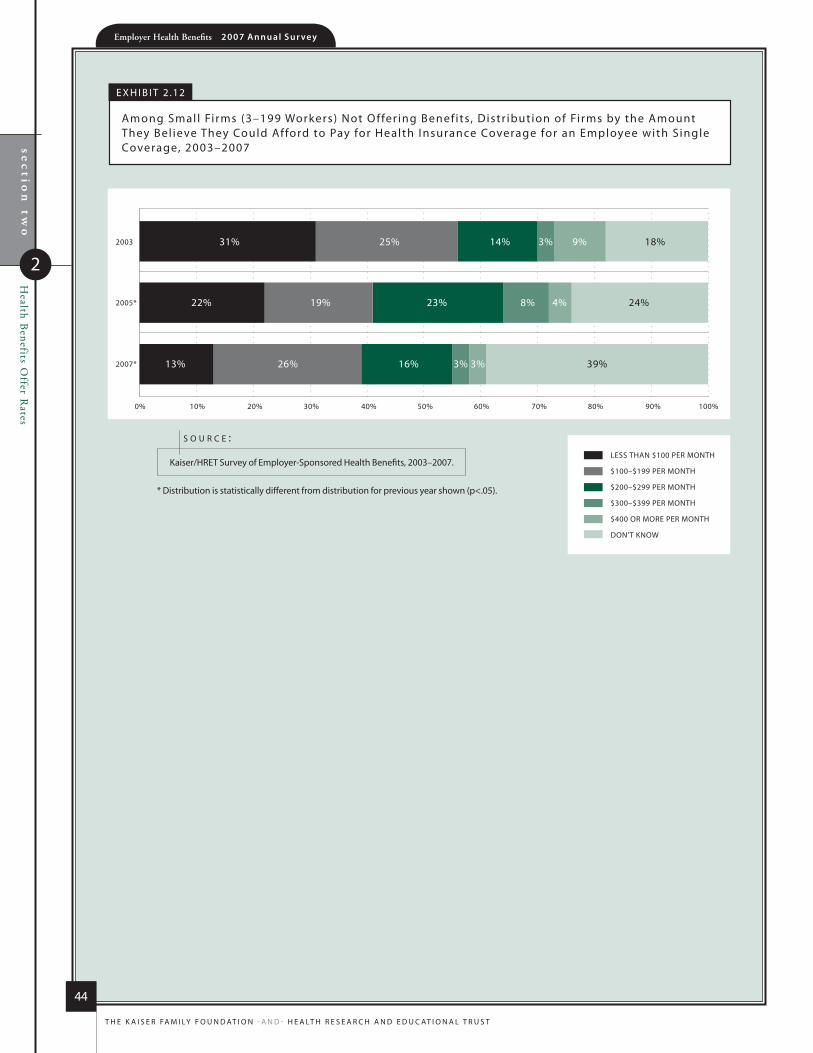
Employer Health Benefits 2 0 0 7 An n u a l S u r vey
44
T h e K A i S e r FA m i ly F o u n d AT i o n - A n d - h e A lT h r e S e A r c h A n d e d u c AT i o n A l T r u S T
sec
tion
two
Health B
enefits Offer R
ates
2
e x h i b i T 2 .12
Among Smal l Fi rms (3–199 Workers) not o ffer ing benef its, distr ibution of Fi rms by the Amount They bel ieve They could Afford to Pay for health insurance coverage for an employee with Single coverage, 2003–2007
0% 10% 20% 30% 40% 50% 60% 70% 80% 90% 100%
22% 19% 23% 8% 4%
31% 25% 14% 3% 9%
13% 26% 16% 3% 3%
24%
18%
39%
LESS THAN $100 PER MONTH
$100–$199 PER MONTH
$200–$299 PER MONTH
$300–$399 PER MONTH
$400 OR MORE PER MONTH
DON’T KNOW
2007*
2005*
2003
* distribution is statistically different from distribution for previous year shown (p<.05).
Kaiser/hreT Survey of employer-Sponsored health benefits, 2003–2007.
s o u r c e :

sec
tion
two
Health B
enefits Offer R
atesEmployer Health Benefits 2 0 0 7 An n u a l S u r vey
45
T h e K A i S e r FA m i ly F o u n d AT i o n - A n d - h e A lT h r e S e A r c h A n d e d u c AT i o n A l T r u S T
2
0% 10% 20% 30% 40% 50% 60% 70% 80% 90% 100%
2007*
2005
2003
17%
16%
36% 16%27% 1% 3%
38% 27% 17% 1%
38% 7%22% 4%
<1%
28%
LESS THAN $100 PER MONTH
$100–$199 PER MONTH
$200–$299 PER MONTH
$300–$399 PER MONTH
$400 OR MORE PER MONTH
DON'T KNOW
e x h i b i T 2 .13
Among Smal l Fi rms (3–199 Workers) not o ffer ing health benef its, distr ibution of Fi rms by the Amounts They bel ieve Their employees could Afford to Pay for individual health insurance coverage, 2003–2007
* distribution is statistically different from distribution for previous year shown (p<.05).
Kaiser/hreT Survey of employer-Sponsored health benefits, 2003–2007.
s o u r c e :

78%$12,1
06
$4,4
79
Employer Health Benefits2 0 0 7 A n n u A l S u r v e y
s ect ion
Employee Coverage,
Eligibility, and Participation
3
6.1%
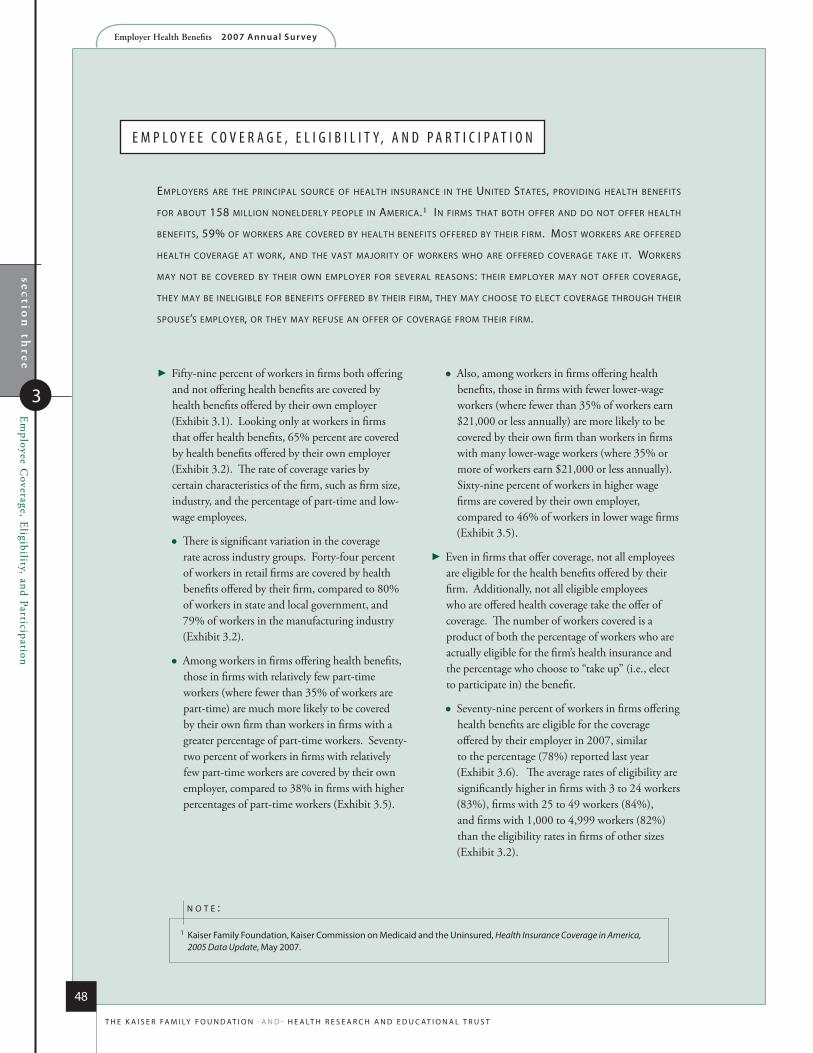
Employer Health Benefits 2 0 0 7 An n u a l S u r vey
section
three
Em
ployee Coverage, E
ligibility, and Participation
3
48
T h e K A i S e r FA m i ly F o u n d AT i o n - A n d - h e A lT h r e S e A r c h A n d e d u c AT i o n A l T r u S T
E m p l o y E E C o v E r a g E , E l i g i b i l i t y , a n d p a r t i C i p a t i o n
EmployErs arE thE principal sourcE of hEalth insurancE in thE unitEd statEs, providing hEalth bEnEfits
for about 158 million nonEldErly pEoplE in amErica.1 in firms that both offEr and do not offEr hEalth
bEnEfits, 59% of workErs arE covErEd by hEalth bEnEfits offErEd by thEir firm. most workErs arE offErEd
hEalth covEragE at work, and thE vast majority of workErs who arE offErEd covEragE takE it. workErs
may not bE covErEd by thEir own EmployEr for sEvEral rEasons: thEir EmployEr may not offEr covEragE,
thEy may bE inEligiblE for bEnEfits offErEd by thEir firm, thEy may choosE to ElEct covEragE through thEir
spousE’s EmployEr, or thEy may rEfusE an offEr of covEragE from thEir firm.
�Fifty-nine percent of workers in firms both offering and not offering health benefits are covered by health benefits offered by their own employer (Exhibit 3.1). Looking only at workers in firms that offer health benefits, 65% percent are covered by health benefits offered by their own employer (Exhibit 3.2). The rate of coverage varies by certain characteristics of the firm, such as firm size, industry, and the percentage of part-time and low-wage employees.
There is significant variation in the coverage rate across industry groups. Forty-four percent of workers in retail firms are covered by health benefits offered by their firm, compared to 80% of workers in state and local government, and 79% of workers in the manufacturing industry (Exhibit 3.2).
Among workers in firms offering health benefits, those in firms with relatively few part-time workers (where fewer than 35% of workers are part-time) are much more likely to be covered by their own firm than workers in firms with a greater percentage of part-time workers. Seventy-two percent of workers in firms with relatively few part-time workers are covered by their own employer, compared to 38% in firms with higher percentages of part-time workers (Exhibit 3.5).
Also, among workers in firms offering health benefits, those in firms with fewer lower-wage workers (where fewer than 35% of workers earn $21,000 or less annually) are more likely to be covered by their own firm than workers in firms with many lower-wage workers (where 35% or more of workers earn $21,000 or less annually). Sixty-nine percent of workers in higher wage firms are covered by their own employer, compared to 46% of workers in lower wage firms (Exhibit 3.5).
�Even in firms that offer coverage, not all employees are eligible for the health benefits offered by their firm. Additionally, not all eligible employees who are offered health coverage take the offer of coverage. The number of workers covered is a product of both the percentage of workers who are actually eligible for the firm’s health insurance and the percentage who choose to “take up” (i.e., elect to participate in) the benefit.
Seventy-nine percent of workers in firms offering health benefits are eligible for the coverage offered by their employer in 2007, similar to the percentage (78%) reported last year (Exhibit 3.6). The average rates of eligibility are significantly higher in firms with 3 to 24 workers (83%), firms with 25 to 49 workers (84%), and firms with 1,000 to 4,999 workers (82%) than the eligibility rates in firms of other sizes (Exhibit 3.2).
1 Kaiser Family Foundation, Kaiser commission on medicaid and the uninsured, Health Insurance Coverage in America, 2005 Data Update, may 2007.
n o t E :

Employer Health Benefits 2 0 0 7 An n u a l S u r veysectio
n th
ree
3
Em
ployee Coverage, E
ligibility, and Participation
49
T h e K A i S e r FA m i ly F o u n d AT i o n - A n d - h e A lT h r e S e A r c h A n d e d u c AT i o n A l T r u S T
Employees who are offered coverage through their employer generally elect to take the offer. Eighty-two percent of eligible workers take up coverage when it is offered to them, the same percentage as last year (Exhibit 3.6).
The likelihood of a worker accepting a firm’s offer of coverage varies by firm wage level. Eligible employees in firms with a lower proportion of lower-wage workers (firms where fewer than 35% of workers earn $21,000 or less annually) are more likely to take up coverage (85%) than eligible employees in firms with a higher proportion of lower-wage workers (where 35% or more of workers earn $21,000 or less annually) (70%) (Exhibit 3.4).
�Seventy-five percent of covered workers face a waiting period before coverage is available. Covered workers in the Northeast are less likely (64%) and covered workers in the West are more likely (85%) than workers in other regions to face a waiting period before coverage becomes effective. Covered workers in retail firms are much more likely (94%) than workers in other industries to face a waiting period. The average waiting period among covered workers who face a waiting period is 2.2 months (Exhibit 3.7).

Employer Health Benefits 2 0 0 7 An n u a l S u r vey
50
T h e K A i S e r FA m i ly F o u n d AT i o n - A n d - h e A lT h r e S e A r c h A n d e d u c AT i o n A l T r u S T
section
three
Em
ployee Coverage, E
ligibility, and Participation
3
e x h i b i T 3 .1
Percentage of Al l Workers covered by Their employers’ health benef its, in Firms both o ffer ing and not o ffer ing health benef its, by Firm Size, 1999–2007*
* Tests found no statistical difference from estimate for the previous year shown (p<.05).
Kaiser/hreT Survey of employer-Sponsored health benefits, 1999–2007.
s o u r c E :
1999 2000 2001 2002 2003 2004 2005 2006 2007
FIRM SIZE
3–24 Workers 50% 50% 49% 45% 44% 43% 41% 45% 42%
25–49 Workers 56 63 62 57 59 56 55 55 51
50–199 Workers 61 62 67 64 61 56 59 62 59
200–999 Workers 69 69 71 69 68 69 65 66 65
1,000–4,999 Workers 68 68 69 70 69 68 69 68 69
5,000 or more Workers 64 66 69 68 68 67 66 60 63
All Small Firms (3–199 Workers)
55% 57% 58% 54% 53% 50% 50% 53% 50%
All Large Firms (200 or More Workers)
66% 67% 69% 69% 68% 68% 66% 63% 65%
ALL FIRMS 62% 63% 65% 63% 62% 61% 60% 59% 59%
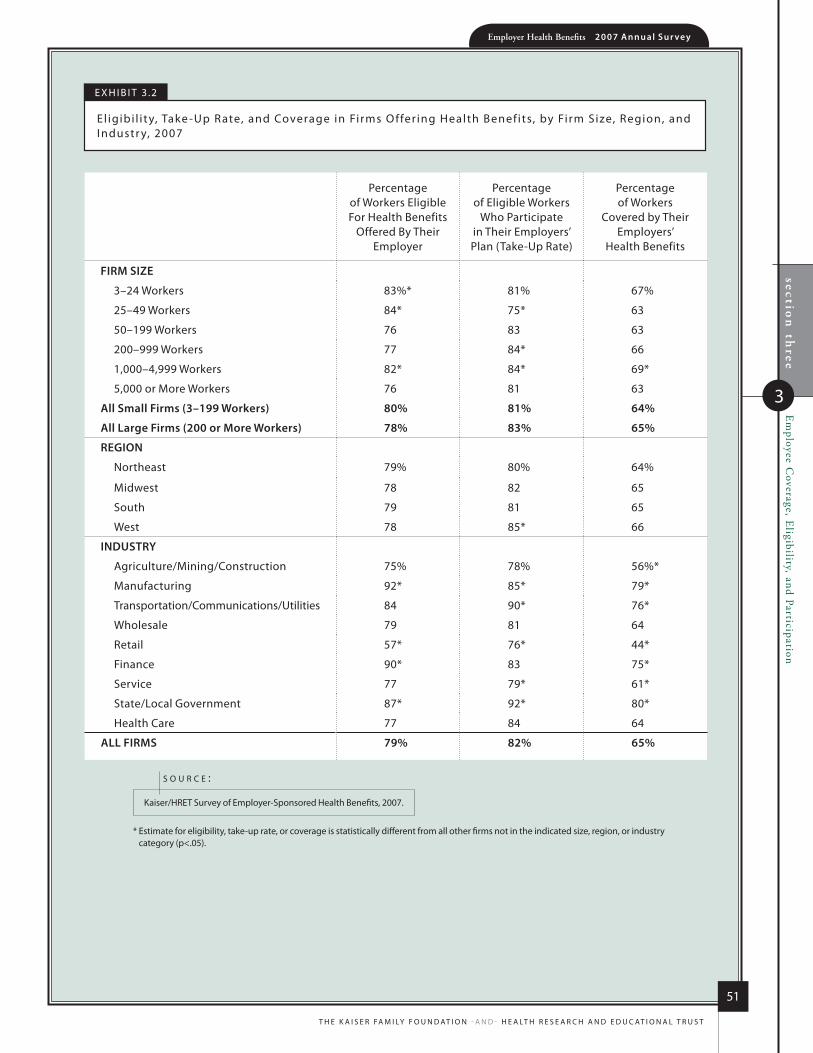
Employer Health Benefits 2 0 0 7 An n u a l S u r vey
51
T h e K A i S e r FA m i ly F o u n d AT i o n - A n d - h e A lT h r e S e A r c h A n d e d u c AT i o n A l T r u S T
section
three
Em
ployee Coverage, E
ligibility, and Participation
3
e x h i b i T 3 .2
el igibi l i ty, Take -up r ate, and coverage in Firms o ffer ing health benef its, by Firm Size, region, and industr y, 2007
* estimate for eligibility, take-up rate, or coverage is statistically different from all other firms not in the indicated size, region, or industry category (p<.05).
Kaiser/hreT Survey of employer-Sponsored health benefits, 2007.
s o u r c E :
Percentage of Workers eligible For health benefits
offered by Their employer
Percentage of eligible Workers
Who Participate in Their employers’ Plan (Take-up rate)
Percentage of Workers
covered by Their employers’
health benefits
FIRM SIZE
3–24 Workers 83%* 81% 67%
25–49 Workers 84* 75* 63
50–199 Workers 76 83 63
200–999 Workers 77 84* 66
1,000–4,999 Workers 82* 84* 69*
5,000 or more Workers 76 81 63
All Small Firms (3–199 Workers) 80% 81% 64%
All Large Firms (200 or More Workers) 78% 83% 65%
REGION
northeast 79% 80% 64%
midwest 78 82 65
South 79 81 65
West 78 85* 66
INDUSTRY
Agriculture/mining/construction 75% 78% 56%*
manufacturing 92* 85* 79*
Transportation/communications/utilities 84 90* 76*
Wholesale 79 81 64
retail 57* 76* 44*
Finance 90* 83 75*
Service 77 79* 61*
State/local Government 87* 92* 80*
health care 77 84 64
ALL FIRMS 79% 82% 65%

Employer Health Benefits 2 0 0 7 An n u a l S u r vey
52
T h e K A i S e r FA m i ly F o u n d AT i o n - A n d - h e A lT h r e S e A r c h A n d e d u c AT i o n A l T r u S T
section
three
Em
ployee Coverage, E
ligibility, and Participation
3
e x h i b i T 3 .3
Among Workers in Firms offering health benefits, Percentage of Workers eligible for health benefits offered by Their Firm, by Firm characteristics, 2007
0% 20% 40% 60% 80% 100%
FIRM DOES NOT HAVE ANY UNION WORKERS
FIRM HAS AT LEAST SOME UNION WORKERS
79%
82%
60%
79%
51%
86%
67%
81%FEW WORKERS ARE LOWER-WAGE(LESS THAN 35% EARN $21,000 A YEAR OR LESS)
MANY WORKERS ARE LOWER-WAGE(35% OR MORE EARN $21,000 A YEAR OR LESS)
FEW WORKERS ARE PART-TIME(LESS THAN 35% WORK PART-TIME)
MANY WORKERS ARE PART-TIME(35% OR MORE WORK PART-TIME)
WAGE LEVEL*
PART-TIME WORKERS*
UNIONS
35% OR MORE WORKERS ARE 26 YEARS OLDOR LESS
LESS THAN 35% OF WORKERS ARE 26 YEARSOLD OR LESS
AGE*
e x h i b i T 3 .4
Among Workers in Firms o ffer ing health benef its, Percentage of Workers That Take up health benef its o ffered by Their Fi rm, by Firm charac ter ist ics, 2007
0% 20% 40% 60% 80% 100%
FIRM DOES NOT HAVE ANY UNION WORKERS
FIRM HAS AT LEAST SOME UNION WORKERS
80%
83%
74%
86%
75%
84%
70%
85%FEW WORKERS ARE LOWER-WAGE(LESS THAN 35% EARN $21,000 A YEAR OR LESS)
MANY WORKERS ARE LOWER-WAGE(35% OR MORE EARN $21,000 A YEAR OR LESS)
FEW WORKERS ARE PART-TIME(LESS THAN 35% WORK PART-TIME)
MANY WORKERS ARE PART-TIME(35% OR MORE WORK PART-TIME)
WAGE LEVEL*
PART-TIME WORKERS*
UNIONS*
35% OR MORE WORKERS ARE 26 YEARS OLDOR LESS
LESS THAN 35% OF WORKERS ARE 26 YEARSOLD OR LESS
AGE*
* estimates are statistically different from each other within category (p<.05).
Kaiser/hreT Survey of employer-Sponsored health benefits, 2007.
s o u r c E :
* estimates are statistically different from each other within category (p<.05).
Kaiser/hreT Survey of employer-Sponsored health benefits, 2007.
s o u r c E :

Employer Health Benefits 2 0 0 7 An n u a l S u r vey
53
T h e K A i S e r FA m i ly F o u n d AT i o n - A n d - h e A lT h r e S e A r c h A n d e d u c AT i o n A l T r u S T
section
three
Em
ployee Coverage, E
ligibility, and Participation
3
e x h i b i T 3 .5
Among Workers in Firms o ffer ing health benef its, Percentage of Workers covered by health benef its o ffered by Their Fi rm, by Firm charac ter ist ics, 2007
0% 20% 40% 60% 80% 100%
FIRM DOES NOT HAVE ANY UNION WORKERS
FIRM HAS AT LEAST SOME UNION WORKERS
63%
69%
44%
68%
38%
72%
46%
69%FEW WORKERS ARE LOWER-WAGE(LESS THAN 35% EARN $21,000 A YEAR OR LESS)
MANY WORKERS ARE LOWER-WAGE(35% OR MORE EARN $21,000 A YEAR OR LESS)
FEW WORKERS ARE PART-TIME(LESS THAN 35% WORK PART-TIME)
MANY WORKERS ARE PART-TIME(35% OR MORE WORK PART-TIME)
WAGE LEVEL*
PART-TIME WORKERS*
UNIONS*
35% OR MORE WORKERS ARE 26 YEARS OLDOR LESS
LESS THAN 35% OF WORKERS ARE 26 YEARSOLD OR LESS
AGE*
* estimates are statistically different from each other within category (p<.05).
Kaiser/hreT Survey of employer-Sponsored health benefits, 2007.
s o u r c E :
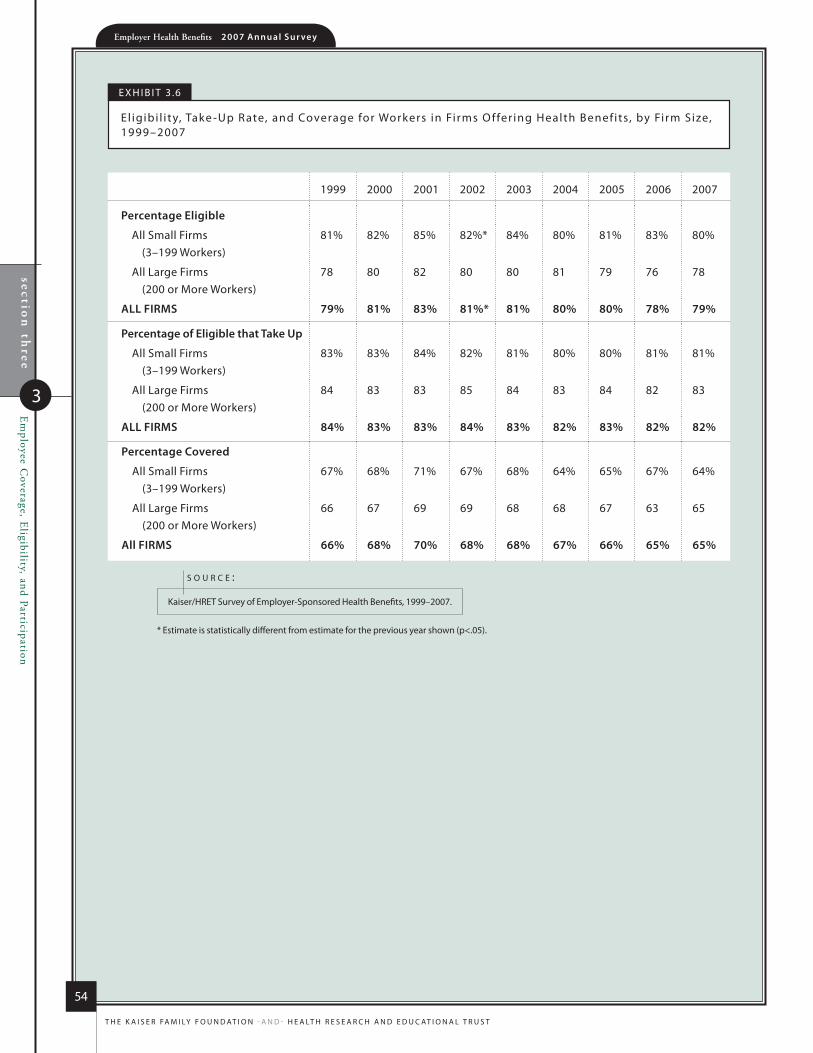
Employer Health Benefits 2 0 0 7 An n u a l S u r vey
54
T h e K A i S e r FA m i ly F o u n d AT i o n - A n d - h e A lT h r e S e A r c h A n d e d u c AT i o n A l T r u S T
section
three
Em
ployee Coverage, E
ligibility, and Participation
3
e x h i b i T 3 .6
el igibi l i ty, Take -up r ate, and coverage for Workers in Firms o ffer ing health benef its, by Firm Size, 1999–2007
* estimate is statistically different from estimate for the previous year shown (p<.05).
Kaiser/hreT Survey of employer-Sponsored health benefits, 1999–2007.
s o u r c E :
1999 2000 2001 2002 2003 2004 2005 2006 2007
Percentage Eligible
All Small Firms (3–199 Workers)
81% 82% 85% 82%* 84% 80% 81% 83% 80%
All large Firms (200 or more Workers)
78 80 82 80 80 81 79 76 78
ALL FIRMS 79% 81% 83% 81%* 81% 80% 80% 78% 79%
Percentage of Eligible that Take Up
All Small Firms (3–199 Workers)
83% 83% 84% 82% 81% 80% 80% 81% 81%
All large Firms (200 or more Workers)
84 83 83 85 84 83 84 82 83
ALL FIRMS 84% 83% 83% 84% 83% 82% 83% 82% 82%
Percentage Covered
All Small Firms (3–199 Workers)
67% 68% 71% 67% 68% 64% 65% 67% 64%
All large Firms (200 or more Workers)
66 67 69 69 68 68 67 63 65
All FIRMS 66% 68% 70% 68% 68% 67% 66% 65% 65%

Employer Health Benefits 2 0 0 7 An n u a l S u r vey
55
T h e K A i S e r FA m i ly F o u n d AT i o n - A n d - h e A lT h r e S e A r c h A n d e d u c AT i o n A l T r u S T
section
three
Em
ployee Coverage, E
ligibility, and Participation
3
e x h i b i T 3 .7
Percentage of covered Workers in Firms with a Wait ing Per iod for coverage and Average Wait ing Per iod in months, by Firm Size, region, and industr y, 2007
* estimate is statistically different from estimate for all other firms not in the indicated size, region, or industry category (p<.05).
Kaiser/hreT Survey of employer-Sponsored health benefits, 2007.
s o u r c E :
Percentage Among covered Workers of covered Workers with a Waiting Period, in Firms With Waiting Period Average Waiting Period (months)
FIRM SIZEAll Small Firms (3–199 Workers) 78% 2.6*All large Firms (200 or more Workers) 73 2.0*
REGIONnortheast 64%* 2.3midwest 71 2.0*South 77 2.2West 85* 2.4*
INDUSTRYAgriculture/mining/construction 79% 2.8*manufacturing 73 2.4Transportation/communications/utilities 76 1.9Wholesale 82 2.5retail 94* 3.0*Finance 70 2.0Service 70 2.1State/local Government 68 2.0health care 81 1.8*
ALL FIRMS 75% 2.2
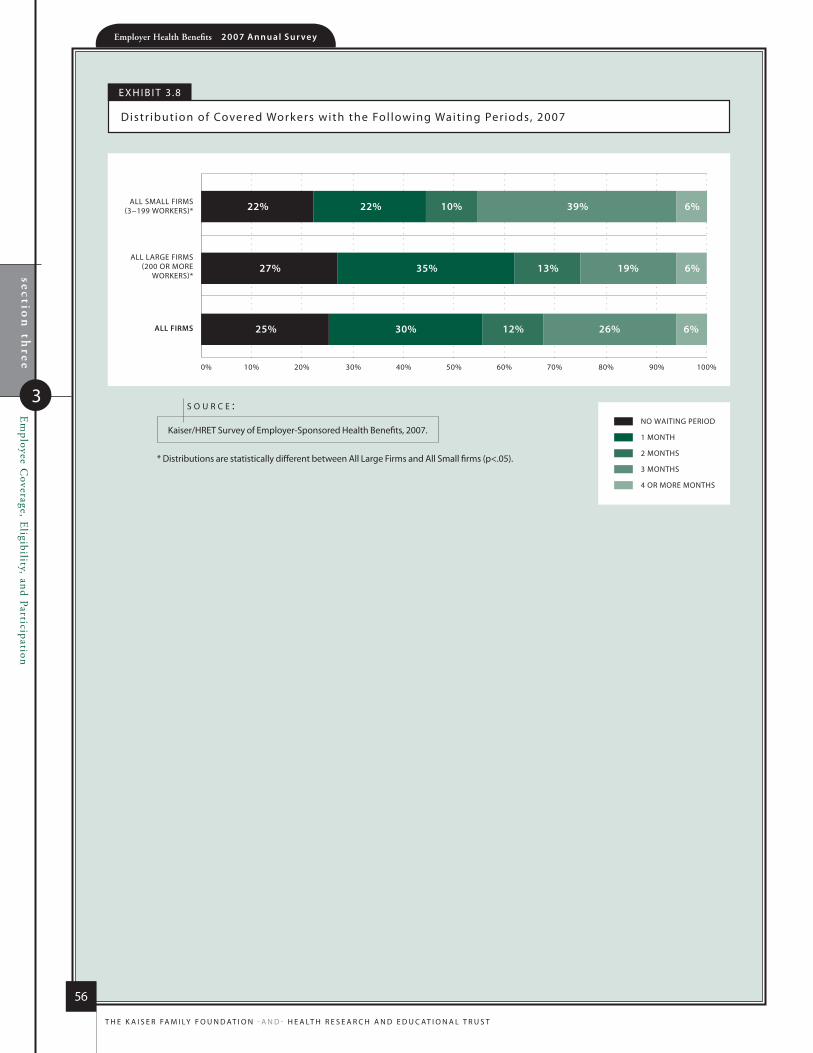
Employer Health Benefits 2 0 0 7 An n u a l S u r vey
56
T h e K A i S e r FA m i ly F o u n d AT i o n - A n d - h e A lT h r e S e A r c h A n d e d u c AT i o n A l T r u S T
section
three
Em
ployee Coverage, E
ligibility, and Participation
3
e x h i b i T 3 .8
distr ibution of covered Workers with the Fol lowing Wait ing Per iods, 2007
NO WAITING PERIOD
1 MONTH
2 MONTHS
3 MONTHS
4 OR MORE MONTHS
0% 10% 20% 30% 40% 50% 60% 70% 80% 90% 100%
ALL LARGE FIRMS(200 OR MORE
WORKERS)*
ALL SMALL FIRMS(3−199 WORKERS)*
ALL FIRMS
6%
6%
6%
22% 10% 39%
35% 13% 19%
30% 12% 26%
22%
27%
25%
* distributions are statistically different between All large Firms and All Small firms (p<.05).
Kaiser/hreT Survey of employer-Sponsored health benefits, 2007.
s o u r c E :

78%$12,1
06
$4,4
79
Employer Health Benefits2 0 0 7 A n n u A l S u r v e y
s ect ion
Types of Plans
Offered
4
6.1%
Employer Health Benefits 2 0 0 7 An n u a l S u r vey
sec
tion
fou
rTypes of Plans O
ffered
4
58
T h e K A i S e r FA m i ly F o u n d AT i o n - A n d - h e A lT h r e S e A r c h A n d e d u c AT i o n A l T r u S T
T y p e s o f p l a n s o f f e r e d
Most firMs that offer health benefits offer only one type of health plan (87%). larger firMs are More
likely to offer More than one type of health plan. eMployers are Most likely to offer their workers a
ppo or pos plan and are least likely to offer a conventional plan or an hdhp/so.
�Eighty-seven percent of firms offer only one health plan type. Of the 13% of firms that offer more than one plan type, large firms (200 or more workers) are more likely to offer more than one plan type than small firms (3–199 workers): 44% of large firms compared with 11% of small firms (Exhibit 4.1).
�Almost one-half (49%) of covered workers are employed in a firm that offers more than one health plan type (See Text Box). Sixty-four percent of covered workers in large firms (200 or more workers) are employed by a firm that offers more than one plan type; the comparable percentage for covered workers employed in small firms (3–199 workers) is 21% (Exhibit 4.2).
�In firms offering health benefits, about four in five (79%) covered workers work in a firm that offers one or more PPOs, 42% work in firms that offer one or more HMOs, 21% work in firms that offer one or more POS plans, 18% work in firms that offer one or more HDHP/SOs, and 10% work in firms that offer one or more conventional plans (Exhibit 4.4).
The survey asks firms how many plans of each given type they offer. However, we do not know if each plan type is offered to all covered workers at the firm. For example, some workers might be offered one type of plan at one location, while workers at another location are offered a different type of plan.

sec
tion
fou
rTypes of Plans O
fferedEmployer Health Benefits 2 0 0 7 An n u a l S u r vey
59
T h e K A i S e r FA m i ly F o u n d AT i o n - A n d - h e A lT h r e S e A r c h A n d e d u c AT i o n A l T r u S T
4
e x h i b i T 4 .1
Among Firms o ffer ing health benef its, Percentage That o ffer one, Two, or Three or more Plan Types, by Firm Size, 2007 ‡
200–999WORKERS*
ALL SMALL FIRMS(3–199 WORKERS)*
1,000–4,999WORKERS*
5,000 OR MOREWORKERS*
ALL LARGE FIRMS(200 OR MORE WORKERS)*
ALL FIRMS
0%
10%
20%
30%
40%
50%
60%
70%
80%
90%
100%
ONE PLAN TYPE
TWO PLAN TYPES
THREE OR MORE PLAN TYPES
89%
10%
61%
32%
7%
47%
40%
14%
33%
44%
23%
56%
34%
10%
87%
11%
1% 1%
* distribution is statistically different from distribution for all other firms not in the indicated size category (p<.05).
‡ Although firms may offer more than one of each plan type, the survey asks how many are offered among the following types: conventional, hmo, PPo, PoS, and hdhP/So.
note: The survey asks firms how many plans of each given type they offer. however, we do not know if each plan type is offered to all covered workers at the firm. For example, some workers might be offered one type of plan at one location, while at another location they are offered a different type of plan.
Kaiser/hreT Survey of employer-Sponsored health benefits, 2007.
s o u r c e :

Employer Health Benefits 2 0 0 7 An n u a l S u r vey
60
T h e K A i S e r FA m i ly F o u n d AT i o n - A n d - h e A lT h r e S e A r c h A n d e d u c AT i o n A l T r u S T
sec
tion
fou
rTypes of Plans O
ffered
4
e x h i b i T 4 .2
Among Firms o ffer ing health benef its, Percentage of covered Workers in Firms o ffer ing one, Two, or Three or more Plan Types, by Firm Size, 2007 ‡
200–999WORKERS*
ALL SMALL FIRMS(3–199 WORKERS)*
1,000–4,999WORKERS*
5,000 OR MOREWORKERS*
ALL LARGE FIRMS(200 OR MORE WORKERS)*
ALL FIRMS
0%
10%
20%
30%
40%
50%
60%
70%
80%
90%
100%
ONE PLAN TYPE
TWO PLAN TYPES
THREE OR MORE PLAN TYPES
79%
17%
4%
59%
34%
7%
42%
41%
17%
24%
43%
32%
36%
40%
23%
51%
33%
17%
* distribution is statistically different from distribution for all other firms not in the indicated size category (p<.05).
‡ Although firms may offer more than one of each plan type, the survey asks how many are offered among the following types: conventional, hmo, PPo, PoS, and hdhP/So.
note: The survey asks firms how many plans of each given type they offer. however, we do not know if each plan type is offered to all covered workers at the firm. For example, some workers might be offered one type of plan at one location, while at another location they are offered a different type of plan.
Kaiser/hreT Survey of employer-Sponsored health benefits, 2007.
s o u r c e :

sec
tion
fou
rTypes of Plans O
fferedEmployer Health Benefits 2 0 0 7 An n u a l S u r vey
61
T h e K A i S e r FA m i ly F o u n d AT i o n - A n d - h e A lT h r e S e A r c h A n d e d u c AT i o n A l T r u S T
4
conventional hmo PPo PoS hdhP/So
200–999 Workers 4%* 31%* 82% 20% 13%*1,000–4,999 Workers 10 42 89* 16 205,000 or more Workers 15* 65* 95* 18 25*
All Small Firms (3–199 Workers) 7% 24%* 55%* 27%* 12%*All Large Firms (200 or More Workers) 11% 52%* 91%* 18%* 21%*
ALL FIRMS 10% 42% 79% 21% 18%
conventional hmo PPo PoS hdhP/So
200–999 Workers 6% 28% 79%* 22%* 13%1,000–4,999 Workers 8 38* 87* 18* 17*5,000 or more Workers 12 55* 92* 13* 22*
All Small Firms (3–199 Workers) 10% 23%* 37%* 33%* 10%All Large Firms (200 or More Workers) 7% 33%* 82%* 20%* 14%
ALL FIRMS 9% 23% 39% 33% 10%
e x h i b i T 4 .3
Among Firms o ffer ing health benef its, Percentage That o ffer the Fol lowing Plan Types, by Firm Size, 2007
e x h i b i T 4 .4
Among Firms o ffer ing health benef its, Percentage of covered Workers in Firms o ffer ing the Fol lowing Plan Types, by Firm Size, 2007
* estimate is statistically different within plan type from estimate for all other firms not in the indicated size category (p<.05).
note: The survey asks firms how many plans of each given type they offer. however, we do not know if each plan type is offered to all covered workers at the firm. For example, some workers might be offered one type of plan at one location, while workers at another location are offered a different type of plan.
Kaiser/hreT Survey of employer-Sponsored health benefits, 2007.
s o u r c e :

78%$12,1
06
$4,4
79
Employer Health Benefits2 0 0 7 A n n u A l S u r v e y
s ect ion
Market Shares of
Health Plans
5
6.1%

Employer Health Benefits 2 0 0 7 An n u a l S u r vey
Market Shares of H
ealth Plansse
ctio
n fiv
e
5
64
T h e K A i S e r FA m i ly F o u n d AT i o n - A n d - h e A lT h r e S e A r c h A n d e d u c AT i o n A l T r u S T
M a r k e t S h a r e S o f h e a l t h P l a n S
EnrollmEnt rEmains highEst in PPos, with ovEr half of covErEd workErs EnrollEd in this Plan tyPE. thE
ProPortion of EmPloyEEs EnrollEd in Each Plan tyPE rEmains similar to thE lEvEls rEPortEd in 2006.
�PPOs lead enrollment, covering 57% of covered workers. About one-fifth of covered employees are enrolled in HMO plans (21%), followed by POS plans (13%), HDHP/SOs (5%), and conventional plans (3%) (Exhibit 5.1).
HMO enrollment continues to be significantly higher (29%) in the West than in all other regions. In contrast, a lower percentage of covered workers are enrolled in HMO plans in the Midwest (15%). A higher percentage of covered workers are enrolled in PPO plans in the Midwest (66%), and fewer are enrolled in the West (43%). For POS plans, enrollment is lowest in the Midwest, at 10% (Exhibit 5.2).
HMO enrollment is higher among workers in state/local government (33%) than among workers in other industries (Exhibit 5.2).

Market Shares of H
ealth PlansEmployer Health Benefits 2 0 0 7 An n u a l S u r vey
65
T h e K A i S e r FA m i ly F o u n d AT i o n - A n d - h e A lT h r e S e A r c h A n d e d u c AT i o n A l T r u S T
sec
tion
five
5
e x h i b i T 5 .1
distr ibution of health Plan enrol lment for covered Workers, by Plan Type, 1988–2007
CONVENTIONAL
HMO
PPO
POS
HDHP/SO
0% 10% 20% 30% 40% 50% 60% 70% 80% 90% 100%
1988
1993
1996
1999
2000*
2001*
2002*
2003
2004
2005*
2006
2007
31% 28% 14%
73%
46%
27%
10%
8%
7%
4%
5% 24% 54% 17%
5% 25% 55% 15%
3% 21% 61% 15%
3% 20% 60% 13% 4%
3% 21% 57% 13% 5%
27% 52% 18%
24% 46% 23%
29% 42% 21%
28% 39% 24%
21% 26% 7%
16% 11%
* distribution is statistically different from the previous year shown (p<.05). no statistical tests were conducted for years prior to 1999. no statistical tests are conducted between 2005 and 2006 due to the addition of hdhP/So as a new plan type in 2006.
note: information was not obtained for PoS plans in 1988. A portion of the change in plan type enrollment for 2005 is likely attributable to incorporating more recent census bureau estimates of the number of state and local government workers and removing federal workers from the weights. See the Survey design and methods Section from the 2005 Kaiser/hreT Survey of employer-Sponsored health benefits for additional information.
Kaiser/hreT Survey of employer-Sponsored health benefits, 1999–2007; KPmG Survey of employer-Sponsored health benefits, 1993, 1996; The health insurance Association of America (hiAA), 1988.
s o u r c E :
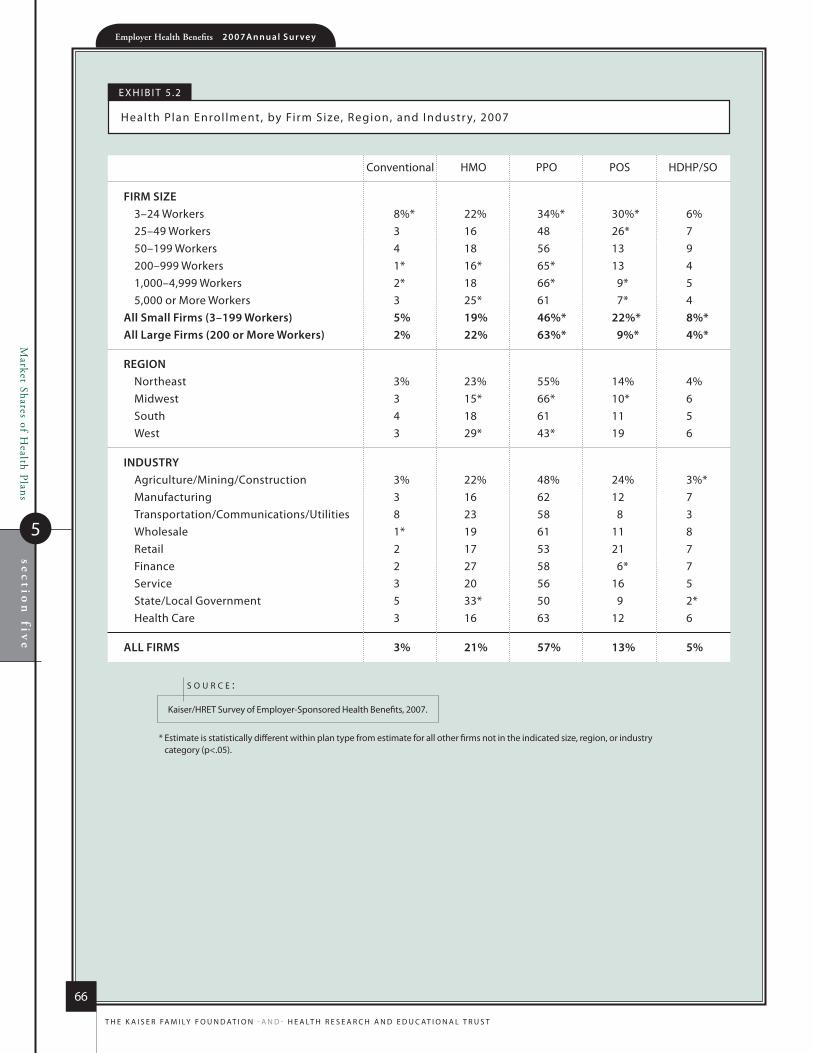
Market Shares of H
ealth Plans
Employer Health Benefits 2 0 0 7 An n u a l S u r vey
66
T h e K A i S e r FA m i ly F o u n d AT i o n - A n d - h e A lT h r e S e A r c h A n d e d u c AT i o n A l T r u S T
sec
tion
five
5
conventional hmo PPo PoS hdhP/So
FIRM SIZE3–24 Workers 8%* 22% 34%* 30%* 6%25–49 Workers 3 16 48 26* 750–199 Workers 4 18 56 13 9200–999 Workers 1* 16* 65* 13 41,000–4,999 Workers 2* 18 66* 9* 55,000 or more Workers 3 25* 61 7* 4
All Small Firms (3–199 Workers) 5% 19% 46%* 22%* 8%*All Large Firms (200 or More Workers) 2% 22% 63%* 9%* 4%*
REGIONnortheast 3% 23% 55% 14% 4%midwest 3 15* 66* 10* 6South 4 18 61 11 5West 3 29* 43* 19 6
INDUSTRYAgriculture/mining/construction 3% 22% 48% 24% 3%*manufacturing 3 16 62 12 7Transportation/communications/utilities 8 23 58 8 3Wholesale 1* 19 61 11 8retail 2 17 53 21 7Finance 2 27 58 6* 7Service 3 20 56 16 5State/local Government 5 33* 50 9 2*health care 3 16 63 12 6
ALL FIRMS 3% 21% 57% 13% 5%
e x h i b i T 5 .2
health Plan enrol lment, by Firm Size, region, and industr y, 2007
* estimate is statistically different within plan type from estimate for all other firms not in the indicated size, region, or industry category (p<.05).
Kaiser/hreT Survey of employer-Sponsored health benefits, 2007.
s o u r c E :
78%$12,1
06
$4,4
79
Employer Health Benefits2 0 0 7 A n n u A l S u r v e y
s ect ion
Worker and Employer
Contributions for Premiums
6
6.1%

Worker and E
mployer C
ontributions for Premium
sse
ctio
n six
6
Employer Health Benefits 2 0 0 7 An n u a l S u r vey
68
T h e K A i S e r FA m i ly F o u n d AT i o n - A n d - h e A lT h r e S e A r c h A n d e d u c AT i o n A l T r u S T
W o r k e r a n d e m p l o y e r C o n t r i b u t i o n s f o r p r e m i u m s
The percenTage of The premium paid by workers wiTh healTh insurance remains similar To The percenTages
reporTed in 2006 for boTh single and family coverage.1 in Terms of dollar amounTs, The average worker
conTribuTion increased for boTh single and family coverage from 2006 To 2007.
In 2007, covered workers on average contribute 16% of the premium for single coverage and 28% of the premium for family coverage (Exhibit 6.1). These percentages have remained stable over the last several years.
�The average monthly worker contribution increased for both single and family coverage in 2007.
On average, workers with single coverage contribute $58 and workers with family coverage contribute $273 towards their health insurance premiums; the amounts are higher than the $52 and $248 reported in 2006 (Exhibit 6.2).
Annually, the average worker contribution is $694 for single coverage and $3,281 for family coverage (Exhibit 6.3). For single coverage, workers in small firms (3–199 workers) contribute an annual amount of $561, which is significantly less than the $759 contributed by workers in large firms (200 or more workers) (Exhibit 6.4). In contrast, workers with family coverage in small firms contribute significantly more than workers with family coverage in large firms, at $4,236 and $2,831, respectively (Exhibit 6.5).
Workers enrolled in HDHP/SOs for single coverage contribute a lower amount annually ($522) than the overall average worker contribution. The difference between the average contribution for those enrolled in HDHP/SOs for family coverage and the overall average family contribution is not statistically different (Exhibit 6.6).
�The majority of covered workers are employed by a firm that contributes at least half of the premium.
About three in four workers contribute more than 0% but less than or equal to 50% of their premiums for both single and family coverage (77% and 78%, respectively). Two percent of workers with single coverage and 15% of workers with family coverage contribute more than 50% of their premiums (Exhibit 6.9).
Twenty percent of workers with single coverage and 6% of workers with family coverage work for a firm that pays 100% of the premium (Exhibit 6.9).
Like last year, covered workers in small firms (3–199 workers) are more likely to work for a firm that pays 100% of the premium than workers in large firms (200 or more workers). In small firms, 44% of covered workers have an employer that pays the full premium for single coverage, compared to 9% of covered workers in large firms (Exhibit 6.10). For family coverage, 13% percent of covered workers in small firms have an employer that pays the full premium for family coverage, compared to 3% of covered workers in large firms (Exhibit 6.11).
For those workers who are responsible for a portion of the premium, covered workers in small firms (3–199 workers) are more likely to have to pay more than 50% of the premium than workers in large firms (200 or more workers). For single coverage, 4% of workers in small firms contribute more than 50% of the premium, compared to 2% in large firms (Exhibit 6.10).
1 estimates for premiums, worker contribution to premiums, and employer contribution to premiums presented in Section 6 do not include contributions made by the employer to health Savings Accounts or health reimbursement Arrangements. See Section 8 for estimates of employer contributions to hSAs and hrAs.
n o T e :

sec
tion
sixW
orker and Em
ployer Contributions for Prem
iums
6
Employer Health Benefits 2 0 0 7 An n u a l S u r vey
69
T h e K A i S e r FA m i ly F o u n d AT i o n - A n d - h e A lT h r e S e A r c h A n d e d u c AT i o n A l T r u S T
The disparity is greater for family coverage with 37% of workers in small firms contributing more than 50% of the premium, compared to 5% in large firms (Exhibit 6.11).
�The percentage of the premium paid by covered workers varies by several firm characteristics.
For family coverage, workers in firms with a higher proportion of lower-wage workers (where 35% or more earn $21,000 or less annually) contribute a greater percentage of the premium than those in firms with a lower proportion of lower-wage workers (where fewer than 35% earn $21,000 or less annually) (34% vs. 27%) (Exhibit 6.13).
For the first time, the survey asked each firm about the proportion of younger employees. In firms with less than 35% of employees age 26 or less, workers contribute 16% for single coverage and 27% for family coverage, compared to workers in firms with 35% or more employees age 26 or less who contribute 22% for single coverage and 35% for family coverage (Exhibit 6.12 and Exhibit 6.13).
�Some workers are employed by firms that vary premium contributions by workers’ wages or participation in wellness programs.
Ten percent of covered workers are in firms that vary worker premium contributions by wage level, the same percentage as in 2005 when the question was last asked. Workers in large firms (200 or more workers) are more likely to be employed by a firm that varies contributions by wage than workers in small firms (3–199 workers) (14% vs. 2%). Workers in the Northeast are more likely (18%) to have their firm vary contributions by wage than workers in other regions; workers in the West are less likely (5%), compared to workers in other regions (Exhibit 6.18).
Six percent of covered workers are employed by a firm that varies worker premium contribution levels by participation in a wellness program, up from the 3% reported in 2005. Covered workers in large firms (200 or more workers) are more likely than workers in small firms (3–199 workers) to work for an employer that varies employee contributions for participation in wellness programs (9% vs. 1%) (Exhibit 6.18).
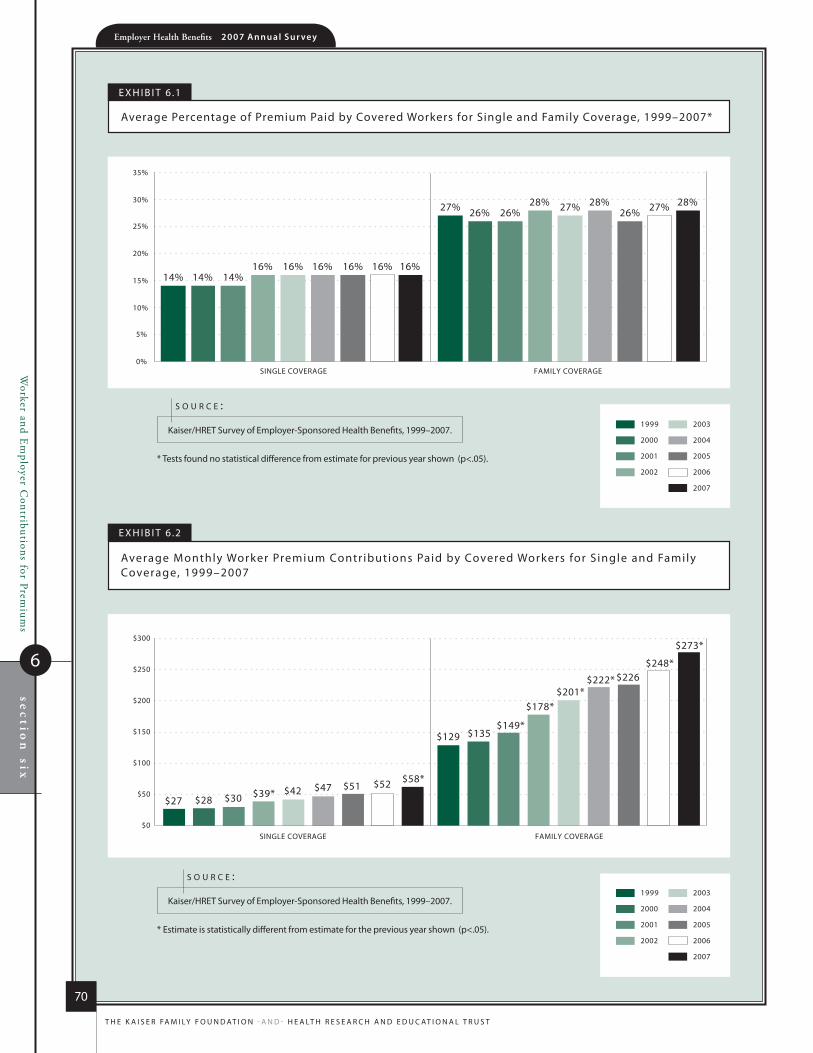
Worker and E
mployer C
ontributions for Premium
sse
ctio
n six
6
Employer Health Benefits 2 0 0 7 An n u a l S u r vey
70
T h e K A i S e r FA m i ly F o u n d AT i o n - A n d - h e A lT h r e S e A r c h A n d e d u c AT i o n A l T r u S T
e x h i b i T 6 .1
Average Percentage of Premium Paid by covered Workers for Single and Family coverage, 1999–2007*
2003
2004
2005
2006
2007
1999
2000
2001
2002
0%
5%
10%
15%
20%
25%
30%
35%
14% 14% 14%16% 16% 16% 16% 16% 16%
27% 26% 26%28% 27% 28% 28%
26% 27%
SINGLE COVERAGE FAMILY COVERAGE
e x h i b i T 6 .2
Average monthly Worker Premium contr ibutions Paid by covered Workers for S ingle and Family coverage, 1999–2007
SINGLE COVERAGE FAMILY COVERAGE
$27 $30$42
$129$149*
$201*
$47
$222*
$51
$226
$28
$135
$248*
$273*
$178*
$52 $58*$39*
$0
$50
$100
$150
$200
$250
$300
2003
2004
2005
2006
2007
1999
2000
2001
2002
* Tests found no statistical difference from estimate for previous year shown (p<.05).
Kaiser/hreT Survey of employer-Sponsored health benefits, 1999–2007.
s o u r c e :
* estimate is statistically different from estimate for the previous year shown (p<.05).
Kaiser/hreT Survey of employer-Sponsored health benefits, 1999–2007.
s o u r c e :

sec
tion
sixW
orker and Em
ployer Contributions for Prem
iums
6
Employer Health Benefits 2 0 0 7 An n u a l S u r vey
71
T h e K A i S e r FA m i ly F o u n d AT i o n - A n d - h e A lT h r e S e A r c h A n d e d u c AT i o n A l T r u S T
e x h i b i T 6 .3
Average Annual Fi rm and Worker Premium contr ibutions and Total Premiums for covered Workers for S ingle and Family coverage, by Plan Type, 2007
WORKER CONTRIBUTION
FIRM CONTRIBUTION
$0 $2,000 $4,000 $6,000 $8,000 $10,000 $12,000 $14,000
FAMILY
SINGLE
FAMILY
SINGLE
FAMILY
SINGLE
FAMILY
SINGLE
FAMILY
SINGLE
HMO
PPO
POS
HDHP/SO
ALL PLANS
$711 $3,588
$3,311 $8,568
$717 $3,920
$3,236 $9,207
$628 $3,709
$3,659 $7,929
$522
$3,347
$2,856 $7,837
$694 $3,785
$3,281 $8,824
$4,299
$11,879
$4,638
$12,443
$4,337
$11,588
$3,869*
$10,693*
$4,479
$12,106
* estimate of Total Premium is statistically different from All Plans estimate by coverage type (p<.05).
Kaiser/hreT Survey of employer-Sponsored health benefits, 2007.
s o u r c e :

Worker and E
mployer C
ontributions for Premium
sse
ctio
n six
6
Employer Health Benefits 2 0 0 7 An n u a l S u r vey
72
T h e K A i S e r FA m i ly F o u n d AT i o n - A n d - h e A lT h r e S e A r c h A n d e d u c AT i o n A l T r u S T
e x h i b i T 6 .4
Average Annual Firm and Worker Premium contributions and Total Premiums for covered Workers for Single coverage, by Plan Type and Firm Size, 2007
Worker contribution employer contribution Total Premium
HMO
All Small Firms (3–199 Workers) $697 $3,559 $4,255All large Firms (200 or more Workers) $718 $3,602 $4,320
PPO
All Small Firms (3–199 Workers) $520* $4,361 $4,881All large Firms (200 or more Workers) $792* $3,755 $4,546
POS
All Small Firms (3–199 Workers) $583 $3,775 $4,358All large Firms (200 or more Workers) $685 $3,624 $4,310
HDHP/SO
All Small Firms (3–199 Workers) $388* $3,493 $3,881All large Firms (200 or more Workers) $652* $3,204 $3,856
ALL PLANS
All Small Firms (3–199 Workers) $561* $3,992 $4,553All large Firms (200 or more Workers) $759* $3,683 $4,442
* estimates are statistically different within plan type between All Small Firms and All large Firms (p<.05).
Kaiser/hreT Survey of employer-Sponsored health benefits, 2007.
s o u r c e :

sec
tion
sixW
orker and Em
ployer Contributions for Prem
iums
6
Employer Health Benefits 2 0 0 7 An n u a l S u r vey
73
T h e K A i S e r FA m i ly F o u n d AT i o n - A n d - h e A lT h r e S e A r c h A n d e d u c AT i o n A l T r u S T
e x h i b i T 6 .5
Average Annual Firm and Worker Premium contributions and Total Premiums for covered Workers for Family coverage, by Plan Type and Firm Size, 2007
Worker contribution employer contribution Total Premium
HMO
All Small Firms (3–199 Workers) $4,433* $7,026* $11,459All large Firms (200 or more Workers) $2,830* $9,228* $12,059
PPO
All Small Firms (3–199 Workers) $4,233* $7,986* $12,219All large Firms (200 or more Workers) $2,869* $9,656* $12,525
POS
All Small Firms (3–199 Workers) $4,413* $7,458 $11,871All large Firms (200 or more Workers) $2,725* $8,512 $11,237
HDHP/SO
All Small Firms (3–199 Workers) $3,280 $6,836* $10,116All large Firms (200 or more Workers) $2,501 $8,675* $11,176
ALL PLANS
All Small Firms (3–199 Workers) $4,236* $7,599* $11,835All large Firms (200 or more Workers) $2,831* $9,402* $12,233
* estimates are statistically different within plan type between All Small Firms and All large Firms (p<.05).
Kaiser/hreT Survey of employer-Sponsored health benefits, 2007.
s o u r c e :

Worker and E
mployer C
ontributions for Premium
sse
ctio
n six
6
Employer Health Benefits 2 0 0 7 An n u a l S u r vey
74
T h e K A i S e r FA m i ly F o u n d AT i o n - A n d - h e A lT h r e S e A r c h A n d e d u c AT i o n A l T r u S T
e x h i b i T 6 .6
Average monthly and Annual Worker Premium contr ibutions Paid by covered Workers for S ingle and Family coverage, by Plan Type and Firm Size, 2007
* estimates are statistically different within plan type between All Small Firms and All large Firms (p<.05).
Kaiser/hreT Survey of employer-Sponsored health benefits, 2007.
s o u r c e :
monthly Annual
Single coverage Family coverage Single coverage Family coverage
HMO
All Small Firms (3–199 Workers) $58 $369* $697 $4,433*All large Firms (200 or more Workers) 60 236* 718 2,830*
ALL FIRM SIZES $59 $276 $711 $3,311
PPO
All Small Firms (3–199 Workers) $43* $353* $520* $4,233*All large Firms (200 or more Workers) 66* 239* 792* 2,869*ALL FIRM SIZES $60 $270 $717 $3,236
POS
All Small Firms (3–199 Workers) $49 $368* $583 $4,413*All large Firms (200 or more Workers) 57 227* 685 2,725*
ALL FIRM SIZES $52 $305 $628 $3,659
HDHP/SO
All Small Firms (3–199 Workers) $32* $273 $388* $3,280All large Firms (200 or more Workers) 54* 208 652* 2,501
ALL FIRM SIZES $43 $238 $522 $2,856
ALL PLANS
All Small Firms (3–199 Workers) $47* $353* $561* $4,236*All large Firms (200 or more Workers) 63* 236* 759* 2,831*
ALL FIRM SIZES $58 $273 $694 $3,281
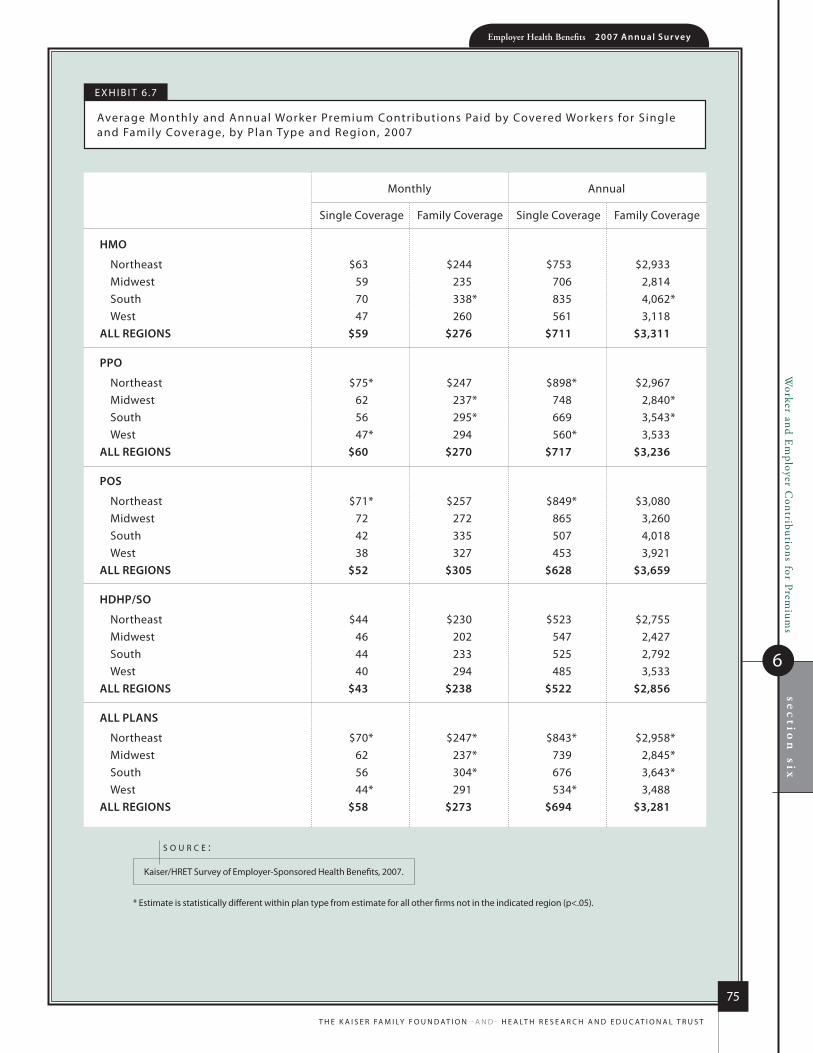
sec
tion
sixW
orker and Em
ployer Contributions for Prem
iums
6
Employer Health Benefits 2 0 0 7 An n u a l S u r vey
75
T h e K A i S e r FA m i ly F o u n d AT i o n - A n d - h e A lT h r e S e A r c h A n d e d u c AT i o n A l T r u S T
e x h i b i T 6 .7
Average monthly and Annual Worker Premium contr ibutions Paid by covered Workers for S ingle and Family coverage, by Plan Type and region, 2007
monthly Annual
Single coverage Family coverage Single coverage Family coverage
HMO
northeast $63 $244 $753 $2,933midwest 59 235 706 2,814South 70 338* 835 4,062*West 47 260 561 3,118
ALL REGIONS $59 $276 $711 $3,311
PPO
northeast $75* $247 $898* $2,967midwest 62 237* 748 2,840*South 56 295* 669 3,543*West 47* 294 560* 3,533
ALL REGIONS $60 $270 $717 $3,236
POS
northeast $71* $257 $849* $3,080midwest 72 272 865 3,260South 42 335 507 4,018West 38 327 453 3,921
ALL REGIONS $52 $305 $628 $3,659
HDHP/SO
northeast $44 $230 $523 $2,755midwest 46 202 547 2,427South 44 233 525 2,792West 40 294 485 3,533
ALL REGIONS $43 $238 $522 $2,856
ALL PLANS
northeast $70* $247* $843* $2,958*midwest 62 237* 739 2,845*South 56 304* 676 3,643*West 44* 291 534* 3,488
ALL REGIONS $58 $273 $694 $3,281
* estimate is statistically different within plan type from estimate for all other firms not in the indicated region (p<.05).
Kaiser/hreT Survey of employer-Sponsored health benefits, 2007.
s o u r c e :

Worker and E
mployer C
ontributions for Premium
sse
ctio
n six
6
Employer Health Benefits 2 0 0 7 An n u a l S u r vey
76
T h e K A i S e r FA m i ly F o u n d AT i o n - A n d - h e A lT h r e S e A r c h A n d e d u c AT i o n A l T r u S T
e x h i b i T 6 .8
Average monthly Worker Premium contr ibutions Paid by covered Workers for S ingle and Family coverage, by Plan Type, 1999–2007
* estimate is statistically different from estimate for the previous year shown (p<.05).
^ information was not obtained for hdhP/Sos prior to 2006.
Kaiser/hreT Survey of employer-Sponsored health benefits, 1999–2007.
s o u r c e :
1999 2000 2001 2002 2003 2004 2005 2006 2007
Single Coverage
hmo $28 $26 $32 $38 $42 $46 $47 $49 $59
PPo 27 29 29 39* 44 48 50 53 60*
PoS 27 28 29 40* 41 45 61* 53 52
hdhP/So ^ ^ ^ ^ ^ ^ ^ 47 43
ALL PLANS $27 $28 $30 $39* $42 $47 $51 $52 $58*
Family Coverage
hmo $124 $131 $150 $164 $179 $223* $217 $257* $276
PPo 128 141 153 188* 210* 224 220 243* 270*
PoS 141 136 143 180* 206 218 271* 269 305
hdhP/So ^ ^ ^ ^ ^ ^ ^ 187 238
ALL PLANS $129 $135 $149* $178* $201* $222* $226 $248* $273*

sec
tion
sixW
orker and Em
ployer Contributions for Prem
iums
6
Employer Health Benefits 2 0 0 7 An n u a l S u r vey
77
T h e K A i S e r FA m i ly F o u n d AT i o n - A n d - h e A lT h r e S e A r c h A n d e d u c AT i o n A l T r u S T
0% 10% 20% 30% 40% 50% 60% 70% 80% 90% 100%
0%
GREATER THAN 0% LESS THAN OR EQUAL TO 25%
GREATER THAN 25% LESS THAN OR EQUAL TO 50%
GREATER THAN 50%
SINGLE COVERAGE
FAMILY COVERAGE
2001
2003*
2001
2003*
2005
2005*
2002*
2004*
2002*
2004*
2006
2007
2006
2007*
32% 50% 15% 3%
24% 57% 17% 3%
14% 44% 27% 15%
8% 47% 31% 14%
21% 57% 19% 3%
9% 46% 32% 13%
24% 58% 13% 5%
21% 56% 21% 2%
9% 46% 29% 16%
7% 44% 36% 13%
23% 56% 18% 2%
20% 56% 21% 2%
9% 42% 37% 12%
6% 47% 31% 15%
e x h i b i T 6 .9
distr ibution of Percentage of Premium Paid by covered Workers for S ingle and Family coverage, 2001–2007
* distribution is statistically different within coverage type from distribution for the previous year shown (p<.05).
Kaiser/hreT Survey of employer-Sponsored health benefits, 2001−2007.
s o u r c e :

Worker and E
mployer C
ontributions for Premium
sse
ctio
n six
6
Employer Health Benefits 2 0 0 7 An n u a l S u r vey
78
T h e K A i S e r FA m i ly F o u n d AT i o n - A n d - h e A lT h r e S e A r c h A n d e d u c AT i o n A l T r u S T
0% 10% 20% 30% 40% 50% 60% 70% 80% 90% 100%
ALL SMALL FIRMS(3–199 WORKERS)
ALL LARGE FIRMS(200 OR MORE WORKERS)
2001
2003
2001
2003*
2005
2005
2002*
2004
2002*
2004*
2006
2007
2006
2007*
57% 25% 13% 5%
45% 35% 14% 6%
19% 63% 16% 2%
14% 67% 18% 1%
41% 36% 18% 6%
12% 67% 20% 1%
45% 35% 13% 8%
42% 35% 17% 5%
14% 69% 14% 4%
11% 65% 23% 1%
43% 38% 14% 4%
44% 36% 16% 4%
13% 66% 20% 1%
9% 66% 23% 2%
0%
GREATER THAN 0% LESS THAN OR EQUAL TO 25%
GREATER THAN 25% LESS THAN OR EQUAL TO 50%
GREATER THAN 50%
e x h i b i T 6 .10
distr ibution of Percentage of Premium Paid by covered Workers for S ingle coverage, by Firm Size, 2001–2007
* distribution is statistically different within size category from distribution for the previous year shown (p<.05).
Kaiser/hreT Survey of employer-Sponsored health benefits, 2001–2007.
s o u r c e :

sec
tion
sixW
orker and Em
ployer Contributions for Prem
iums
6
Employer Health Benefits 2 0 0 7 An n u a l S u r vey
79
T h e K A i S e r FA m i ly F o u n d AT i o n - A n d - h e A lT h r e S e A r c h A n d e d u c AT i o n A l T r u S T
e x h i b i T 6 .11
distr ibution of Percentage of Premium Paid by covered Workers for Family coverage, by Firm Size, 2001–2007
0% 10% 20% 30% 40% 50% 60% 70% 80% 90% 100%
ALL SMALL FIRMS(3–199 WORKERS)
ALL LARGE FIRMS(200 OR MORE WORKERS)
2001
2003
2001
2003*
2005*
2005
2002*
2004*
2002
2004
2006
2007*
2006*
2007*
27% 18% 25% 30%
15% 28% 26% 31%
7% 57% 28% 8%
4% 57% 33% 6%
18% 22% 37% 23%
5% 57% 30% 7%
18% 23% 28% 31%
15% 17% 39% 28%
5% 57% 29% 9%
4% 56% 34% 6%
17% 20% 38% 24%
13% 25% 25% 37%
5% 54% 36% 5%
3% 58% 34% 5%
0%
GREATER THAN 0% LESS THAN OR EQUAL TO 25%
GREATER THAN 25% LESS THAN OR EQUAL TO 50%
GREATER THAN 50%* distribution is statistically different within size category from distribution for the
previous year shown (p<.05).
Kaiser/hreT Survey of employer-Sponsored health benefits, 2001–2007.
s o u r c e :

Worker and E
mployer C
ontributions for Premium
sse
ctio
n six
6
Employer Health Benefits 2 0 0 7 An n u a l S u r vey
80
T h e K A i S e r FA m i ly F o u n d AT i o n - A n d - h e A lT h r e S e A r c h A n d e d u c AT i o n A l T r u S T
e x h i b i T 6 .12
Average Percentage of Premiums Paid by covered Workers for S ingle coverage, by Firm charac ter ist ics, 2007
0% 5% 10% 15% 20% 25%
FIRM DOES NOT HAVE ANY UNION WORKERS
FIRM HAS AT LEAST SOME UNION WORKERS
17%
16%
22%
15%
17%
15%
16%
18%
FEW WORKERS ARE LOWER-WAGE(LESS THAN 35% EARN $21,000 A YEAR OR LESS)
MANY WORKERS ARE LOWER-WAGE(35% OR MORE EARN $21,000 A YEAR OR LESS)
SELF−FUNDED
FULLY INSURED
WAGE LEVEL
PLAN FUNDING*
UNIONS
35% OR MORE WORKERSARE 26 YEARS OLD OR LESS
LESS THAN 35% OFWORKERS ARE 26 YEARS OLD OR LESS
AGE*
* estimates are statistically different from each other within category (p<.05).
note: For definitions of Self-Funded and Fully insured Plans, see the introduction to Section 10.
Kaiser/hreT Survey of employer-Sponsored health benefits, 2007.
s o u r c e :
e x h i b i T 6 .13
Average Percentage of Premiums Paid by covered Workers for Family coverage, by Firm charac ter ist ics, 2007
0% 5% 10% 15% 25%20% 35%30% 40%
FIRM DOES NOT HAVE ANY UNION WORKERS
FIRM HAS AT LEAST SOME UNION WORKERS
32%
27%
35%
21%
34%
23%
34%
27%FEW WORKERS ARE LOWER-WAGE(LESS THAN 35% EARN $21,000 A YEAR OR LESS)
MANY WORKERS ARE LOWER-WAGE(35% OR MORE EARN $21,000 A YEAR OR LESS)
SELF−FUNDED
FULLY INSURED
WAGE LEVEL*
PLAN FUNDING*
UNIONS*
35% OR MORE WORKERSARE 26 YEARS OLD OR LESS
LESS THAN 35% OFWORKERS ARE 26 YEARS OLD OR LESS
AGE*
* estimates are statistically different from each other within category (p<.05).
note: For definitions of Self-Funded and Fully insured Plans, see the introduction to Section 10.
Kaiser/hreT Survey of employer-Sponsored health benefits, 2007.
s o u r c e :
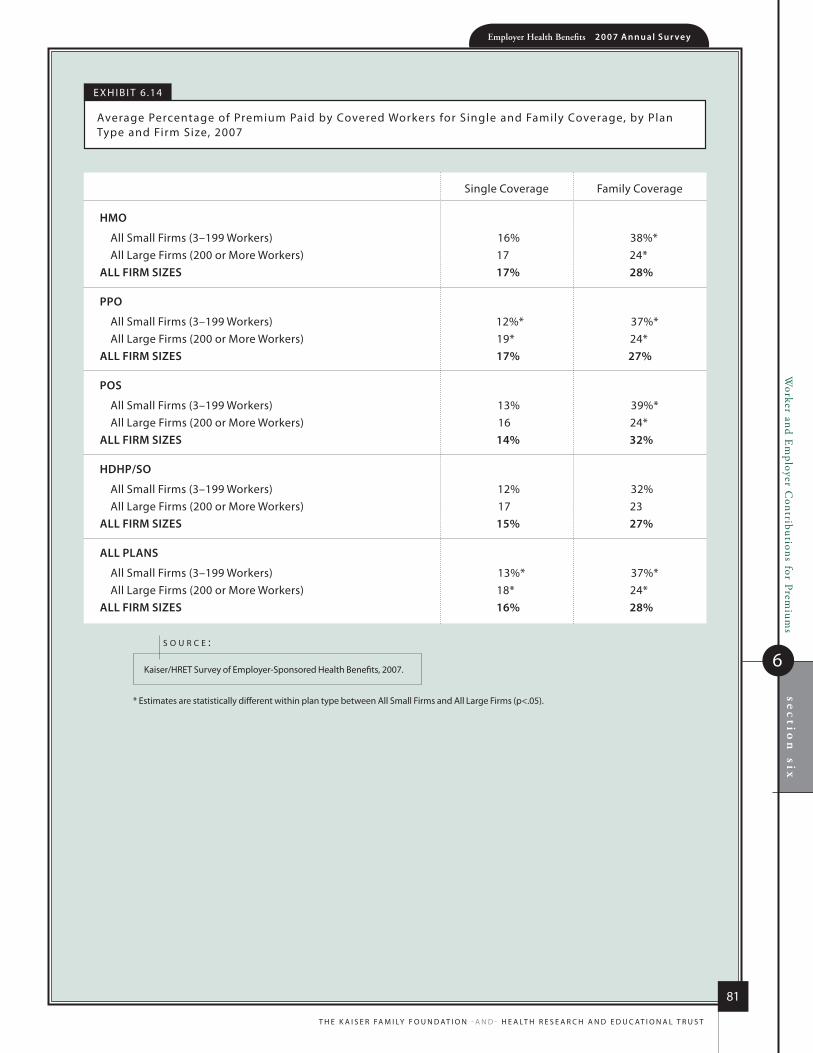
sec
tion
sixW
orker and Em
ployer Contributions for Prem
iums
6
Employer Health Benefits 2 0 0 7 An n u a l S u r vey
81
T h e K A i S e r FA m i ly F o u n d AT i o n - A n d - h e A lT h r e S e A r c h A n d e d u c AT i o n A l T r u S T
e x h i b i T 6 .14
Average Percentage of Premium Paid by covered Workers for Single and Family coverage, by Plan Type and Firm Size, 2007
* estimates are statistically different within plan type between All Small Firms and All large Firms (p<.05).
Kaiser/hreT Survey of employer-Sponsored health benefits, 2007.
s o u r c e :
Single coverage Family coverage
HMO
All Small Firms (3–199 Workers) 16% 38%*All large Firms (200 or more Workers) 17 24*
ALL FIRM SIZES 17% 28%
PPO
All Small Firms (3–199 Workers) 12%* 37%*All large Firms (200 or more Workers) 19* 24*
ALL FIRM SIZES 17% 27%
POS
All Small Firms (3–199 Workers) 13% 39%*All large Firms (200 or more Workers) 16 24*
ALL FIRM SIZES 14% 32%
HDHP/SO
All Small Firms (3–199 Workers) 12% 32%All large Firms (200 or more Workers) 17 23
ALL FIRM SIZES 15% 27%
ALL PLANS
All Small Firms (3–199 Workers) 13%* 37%*All large Firms (200 or more Workers) 18* 24*
ALL FIRM SIZES 16% 28%
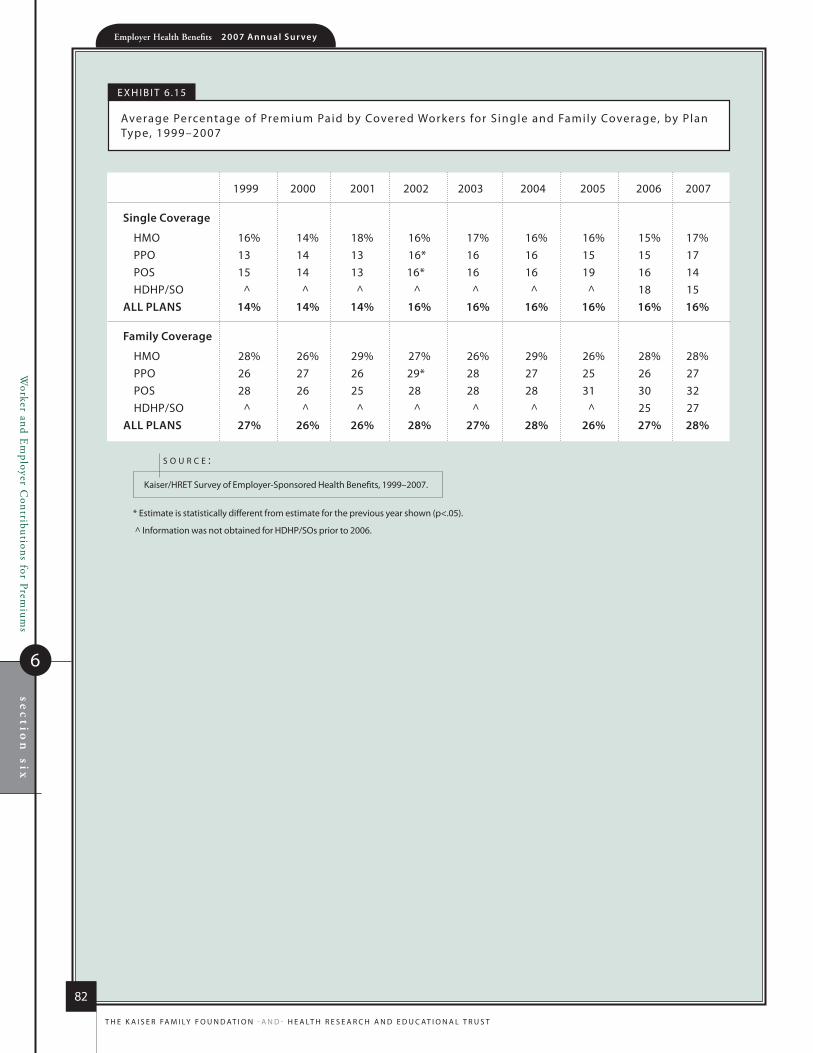
Worker and E
mployer C
ontributions for Premium
sse
ctio
n six
6
Employer Health Benefits 2 0 0 7 An n u a l S u r vey
82
T h e K A i S e r FA m i ly F o u n d AT i o n - A n d - h e A lT h r e S e A r c h A n d e d u c AT i o n A l T r u S T
e x h i b i T 6 .15
Average Percentage of Premium Paid by covered Workers for S ingle and Family coverage, by Plan Type, 1999–2007
* estimate is statistically different from estimate for the previous year shown (p<.05).
^ information was not obtained for hdhP/Sos prior to 2006.
Kaiser/hreT Survey of employer-Sponsored health benefits, 1999–2007.
s o u r c e :
1999 2000 2001 2002 2003 2004 2005 2006 2007
Single Coverage
hmo 16% 14% 18% 16% 17% 16% 16% 15% 17%PPo 13 14 13 16* 16 16 15 15 17PoS 15 14 13 16* 16 16 19 16 14hdhP/So ^ ^ ^ ^ ^ ^ ^ 18 15
ALL PLANS 14% 14% 14% 16% 16% 16% 16% 16% 16%
Family Coverage
hmo 28% 26% 29% 27% 26% 29% 26% 28% 28%PPo 26 27 26 29* 28 27 25 26 27PoS 28 26 25 28 28 28 31 30 32hdhP/So ^ ^ ^ ^ ^ ^ ^ 25 27
ALL PLANS 27% 26% 26% 28% 27% 28% 26% 27% 28%

sec
tion
sixW
orker and Em
ployer Contributions for Prem
iums
6
Employer Health Benefits 2 0 0 7 An n u a l S u r vey
83
T h e K A i S e r FA m i ly F o u n d AT i o n - A n d - h e A lT h r e S e A r c h A n d e d u c AT i o n A l T r u S T
e x h i b i T 6 .16
Average Percentage of Premium Paid by covered Workers for S ingle and Family coverage, by Plan Type and region, 2007
* estimate is statistically different within plan type from estimate for all other firms not in the indicated region (p<.05).
Kaiser/hreT Survey of employer-Sponsored health benefits, 2007.
s o u r c e :
Single coverage Family coverage
HMO
northeast 18% 24%midwest 16 23South 20 34*West 13* 27
ALL REGIONS 17% 28%
PPO
northeast 21%* 23%*midwest 17 24*South 16 31*West 13* 30
ALL REGIONS 17% 27%
POS
northeast 18% 25%*midwest 16 28South 13 36West 12 36
ALL REGIONS 14% 32%
HDHP/SO
northeast 13% 26%midwest 18 26South 15 28West 13 30
ALL REGIONS 15% 27%
ALL PLANS
northeast 19%* 24%*midwest 17 24*South 17 32*West 12* 30
ALL REGIONS 16% 28%

Worker and E
mployer C
ontributions for Premium
sse
ctio
n six
6
Employer Health Benefits 2 0 0 7 An n u a l S u r vey
84
T h e K A i S e r FA m i ly F o u n d AT i o n - A n d - h e A lT h r e S e A r c h A n d e d u c AT i o n A l T r u S T
e x h i b i T 6 .17
Average Percentage of Premium Paid by covered Workers, by Plan Type and industr y, 2007
Single coverage Family coverage
HMO
Agriculture/mining/construction nSd nSdmanufacturing 16% 24%Transportation/communications/utilities 12* 19*Wholesale nSd nSdretail 15 30Finance 19 34Service 16 29State/local Government 14 22health care 15 24
ALL INDUSTRIES 17% 28%
PPO
Agriculture/mining/construction 16% 32%manufacturing 19 25Transportation/communications/utilities 13 17*Wholesale 23* 29retail 23* 33*Finance 17 31Service 17 30*State/local Government 13 22health care 12* 27
ALL INDUSTRIES 17% 27%
POS
Agriculture/mining/construction nSd nSdmanufacturing 16% 32%Transportation/communications/utilities nSd nSdWholesale nSd nSdretail nSd nSdFinance nSd nSdService 14 34State/local Government 9 24*health care 13 27
ALL INDUSTRIES 14% 32%
Continued on next page

sec
tion
sixW
orker and Em
ployer Contributions for Prem
iums
6
Employer Health Benefits 2 0 0 7 An n u a l S u r vey
85
T h e K A i S e r FA m i ly F o u n d AT i o n - A n d - h e A lT h r e S e A r c h A n d e d u c AT i o n A l T r u S T
e x h i b i T 6 .17
Average Percentage of Premium Paid by covered Workers, by Plan Type and industr y, 2007
Single coverage Family coverage
HDHP/SO
Agriculture/mining/construction nSd nSdmanufacturing 18% 29%Transportation/communications/utilities nSd nSdWholesale nSd nSdretail nSd nSdFinance 20 28Service 9* 16*State/local Government nSd nSdhealth care nSd nSd
ALL INDUSTRIES 15% 27%
ALL PLANS
Agriculture/mining/construction 17% 36%manufacturing 18 25*Transportation/communications/utilities 15 19*Wholesale 23* 32retail 20* 32*Finance 17 32*Service 16 30State/local Government 13 22*health care 12* 26
ALL INDUSTRIES 16% 28%
Continued from previous page
* estimate is statistically different within plan type from estimate for all other firms not in the indicated industry (p<.05).
nSd: not Sufficient data.
Kaiser/hreT Survey of employer-Sponsored health benefits, 2007.
s o u r c e :

Worker and E
mployer C
ontributions for Premium
sse
ctio
n six
6
Employer Health Benefits 2 0 0 7 An n u a l S u r vey
86
T h e K A i S e r FA m i ly F o u n d AT i o n - A n d - h e A lT h r e S e A r c h A n d e d u c AT i o n A l T r u S T
e x h i b i T 6 .18
Percentage of covered Workers in Firms That var y Worker Premium contr ibutions by Wage or Par t ic ipat ion in Wel lness Program, by Firm Size and region, 2007
* estimate is statistically different from estimate for all firms not in the indicated size or region category (p<.05).
Kaiser/hreT Survey of employer-Sponsored health benefits, 2007.
s o u r c e :
Percentage Percentage of covered Workers of covered Workers in Firms That vary Worker in Firms That vary Worker Premium contributions by contributions by Participation in Wage level Wellness Program
FIRM SIZE200–999 Workers 10% 7%1,000–4,999 Workers 15* 95,000 or more Workers 16* 10*
All Small Firms (3–199 Workers) 2%* 1%*All Large Firms (200 or More Workers) 14%* 9%*
REGIONnortheast 18%* 9%midwest 8 7South 10 5West 5* 5
ALL FIRMS 10% 6%

78%$12,1
06
$4,4
79
Employer Health Benefits2 0 0 7 A n n u A l S u r v e y
s ect ion
Employee Cost Sharing
7
6.1%
Em
ployee Cost Sharing
7sectio
n seven
Employer Health Benefits 2 0 0 7 An n u a l S u r vey
88
T h e K A i S e r FA m i ly F o u n d AT i o n - A n d - h e A lT h r e S e A r c h A n d e d u c AT i o n A l T r u S T
E m p l o y E E C o s t s h a r i n g
In addItIon to any premIum contrIbutIon responsIbIlItIes, workers face a varIety of dIfferent types of
cost sharIng. the types of cost sharIng a worker may be responsIble for Include deductIbles, copayments
(fIxed dollar amounts), and/or coInsurance (a percentage of the charge for servIces). generally, the
type and amount of cost sharIng often depends on the type of plan In whIch the worker Is enrolled and
the type of servIce receIved.
thIs year we revIsIted the topIcs of separate deductIbles for hospItal admIssIons and out-of-network
offIce vIsIt cost sharIng. we also added new questIons to gauge the prevalence of dIfferent types of
cost sharIng for a varIety of servIces such as emergency room vIsIts. as In 2006, we contInue to collect
a varIety of InformatIon on general annual plan deductIbles and out-of-pocket maxImum amounts.
because of changes to the InformatIon collected last year, In many cases, data are not comparable to
data presented prIor to 2006. where approprIate, notes are Included In the text and In the exhIbIts In thIs
sectIon to alert readers of comparabIlIty Issues.
P l A n D e D u c t i b l e S
�Many covered workers are enrolled in plans with no general annual deductible;1 however, the likelihood of not having a deductible varies by plan type.
Eighty-two percent of workers with single coverage in HMOs do not have a general annual deductible, compared to 52% of workers in POS plans and 29% of workers in PPO plans. The percentages are similar for those enrolled in family coverage (Exhibit 7.1). From 2006 to 2007, the percentage of covered workers without a deductible decreased for POS single coverage and HMO and POS family coverage.
Even when covered workers do not have a general annual plan deductible, the majority face other forms of cost sharing. For example, among workers with no general annual deductible who have single coverage, 68% of workers in HMOs, and 77% of workers in PPOs and POS plans have per-episode cost sharing for outpatient surgery (Exhibit 7.2).
1 health plan deductibles for PPo, PoS, and hdhP/So plans are for in-network services.2 There is insufficient data to report the average hmo deductible for workers in small firms.
n o t e :
�In 2007, the general annual deductible levels remain similar to the values reported in 2006 and vary by plan type and size.
Among covered workers with a general annual deductible, the average annual deductible amounts for single coverage are $461 for PPOs, $401 for HMOs, $621 for POS plans, and $1,729 for HDHP/SOs (Exhibit 7.3). These amounts are not statistically different from the amounts reported in 2006 (Exhibit 7.5). For PPOs, POS plans, and HDHP/SOs, covered workers in plans sponsored by small firms (3–199 workers) generally have higher average deductibles for single coverage than covered workers employed in large firms (200 or more workers) (Exhibit 7.3).2
For family coverage, the majority of workers with general annual deductibles have an aggregate deductible, meaning all covered expenses from family members count toward meeting the deductible amount. Looking exclusively at workers with a deductible, the percentage of covered workers with an aggregate general annual deductible ranges from 66% for POS plans to 89% for HDHP/SO plans (Exhibit 7.8).
Em
ployee Cost Sharing
7
section
sevenEmployer Health Benefits 2 0 0 7 An n u a l S u r vey
89
T h e K A i S e r FA m i ly F o u n d AT i o n - A n d - h e A lT h r e S e A r c h A n d e d u c AT i o n A l T r u S T
For covered workers with an aggregate family general annual deductible, the average annual amounts are $759 for HMOs, $1,040 for PPOs, $1,359 for POS plans, and $3,596 for HDHP/SOs (Exhibit 7.9). These amounts are also similar to the amounts reported in 2006 for aggregate family deductibles (Exhibit 7.10).
The other type of family deductible, a separate per-person deductible, requires each family member to meet a separate per-person deductible amount before the plan covers expenses for that member. Most plans with separate per person family deductibles consider the deductible met if a prescribed number of family members reach their separate deductible amounts.
For covered workers in health plans that have separate per-person deductible amounts for family coverage, the average plan deductible amounts are $492 in PPOs and $592 in POS plans (Exhibit 7.9).3 Generally, there is a limit to the number of family members required to meet the separate deductible amounts; this year the average is three (Exhibit 7.12).
�Not all covered workers with a deductible must meet the deductible before certain services are covered.
Among covered workers in HMOs and PPOs with general plan deductibles, over two-thirds are enrolled in plans where the general plan deductible does not have to be met before prescription drugs are covered (77% and 69%, respectively). Eighty percent of workers in HMOs with a general annual deductible do not have to meet the deductible before preventive care is covered (Exhibit 7.13).
c o S t S h A r i n g f o r P h y S i c i A n o f f i c e V i S i t S
�This year, the survey asked about primary care and specialty care office-visit cost sharing for both in-network and out-of-network providers.4
�For in-network office visits, the majority of covered workers face office-visit cost sharing in addition to any general annual deductible. For in-network visits, the most common form of cost sharing is copayments. In contrast, the most common form of cost sharing for out-of-network visits is coinsurance.5
In addition to any deductible the plan may have, 79% of covered workers have a copayment when they visit an in-network physician, while only 12% have coinsurance. Workers in HMOs, PPOs, and POS plans are much more likely to have a copayment than workers enrolled in HDHP/SOs, where only 19% of covered workers have a copayment (Exhibit 7.18).
Among covered workers with a copayment for in-network office visits, the average copayment is $19 for primary care and $24 for specialty physicians (Exhibit 7.19). Fifty-nine percent of covered workers with copayments for a primary care in-network office visit have a copayment of $15 or $20 per visit (Exhibit 7.21). For specialty care, 43% of covered workers with an in-network office visit copayment have a copayment of $20 or $25 per visit (Exhibit 7.22).
3 There is insufficient data to report the average separate annual deductible amounts for hmos and hdhP/Sos. Separate deductible amounts cannot be compared between 2006 and 2007 due to a change in methodology.
4 The survey asks respondents if they have cost sharing for in-network or out-of-network office visits. if the respondent indicates they have a copayment for office visits, we assume they have a copay for both primary and specialty care visits. The survey does not allow for a respondent to have a copayment for primary care visits and coinsurance for specialty care visits. A very small percentage (<0.01%) of respondents that indicated copayments for office visits are missing from the specialty copayment averages because they indicated having coinsurance for specialty visits.
5 For out-of-network office-visit cost sharing, the 2007 survey collected information on copayments and coinsurance but did not collect information on out-of-network deductibles.
n o t e :
Em
ployee Cost Sharing
7sectio
n seven
Employer Health Benefits 2 0 0 7 An n u a l S u r vey
90
T h e K A i S e r FA m i ly F o u n d AT i o n - A n d - h e A lT h r e S e A r c h A n d e d u c AT i o n A l T r u S T
In contrast to cost sharing for in-network office visits, the majority of workers who visit out-of-network providers face coinsurance rather than copayments (80% vs. 9%) (Exhibit 7.18). Among workers with coinsurance for out-of-network office visits, the average coinsurance is 33% (Exhibit 7.20). Thirty-three percent of workers enrolled in PPOs and 30% of workers in HDHP/SOs with coinsurance face coinsurance rates of 30% or 35% for out-of-network physician office visits (Exhibit 7.24).
h o S P i tA l c o S t S h A r i n g
�This year, we collected information on separate hospital deductibles that are in addition to any general annual deductible the plan may have and also on cost-sharing provisions for hospital admissions and outpatient surgery. Workers may face a general annual deductible, a separate hospital deductible, or both when they are admitted to a hospital. Whether or not a worker has a deductible, most workers face additional types of cost sharing when admitted to a hospital, such as a copayment, coinsurance, or a per diem charge.
Over 95% of covered workers face cost sharing in various forms for a hospital admission, such as a separate hospital deductible, copayment, coinsurance, or a per diem charge (charge per day). Twelve percent of workers in PPOs have a separate hospital deductible, compared to 15% in HMOs and 23% in POS plans (Exhibit 7.14). The average hospital deductibles are similar across plan types, ranging from $323 for workers in HMOs to $340 for workers in POS plans (Exhibit 7.14).
In addition to any plan deductible, workers face additional cost sharing for each hospital admission. Coinsurance is more prevalent, with 43% of covered workers having coinsurance only, compared to 20% of covered workers with copayments only (Exhibit 7.15). The average coinsurance for covered workers with coinsurance is 17%. The average copayment is $208 (Exhibit 7.16). Four percent of covered workers face a per diem charge when admitted to the hospital, averaging $228 per day.
�Regardless of any deductible the worker may have, 79% of covered workers have some sort of cost sharing for outpatient surgery. Coinsurance is more common than copayments, with 47% of covered workers facing coinsurance for outpatient surgery and 27% facing copayments (Exhibit 7.15). The average coinsurance is 18%, and the average copayment is $114 (Exhibit 7.16).
o t h e r c o S t S h A r i n g
�This year, we also collected information on cost sharing provisions related to emergency room visits, urgent care visits, and advanced diagnostic tests.
In addition to any deductible the worker may have, most workers face some form of cost sharing when visiting the emergency room, for urgent care, or for an advanced diagnostic procedure. Copayments are most common for emergency room and urgent care visits (62% and 65%, respectively), and coinsurance is most common for advanced diagnostic tests (47%) (Exhibit 7.15).
o u t - o f - P o c k e t M A x i M u M A M o u n t S
�Most covered workers are in a plan that partially or totally limits the cost sharing that a plan enrollee must pay in a year (Exhibit 7.25). These limits are generally referred to as out-of-pocket maximum amounts.
�We continue to ask a variety of questions related to a covered worker’s out-of-pocket maximum liability. Like last year, we asked what types of out-of-pocket expenses plans count when determining whether an enrollee has met the out-of-pocket maximum. Plans may or may not count spending for the general deductible or cost sharing for certain services when determining if an enrollee or family has met their out-of-pocket maximum. When a plan does not count certain types of spending, it effectively increases the amount a worker may pay out-of-pocket under a plan. Like deductibles, some plans have an aggregate out-of-pocket maximum amount that applies to cost sharing for all family members, while others apply a per-family member out-of-pocket maximum that limits the amount of cost sharing that the family must pay on behalf of each family member.
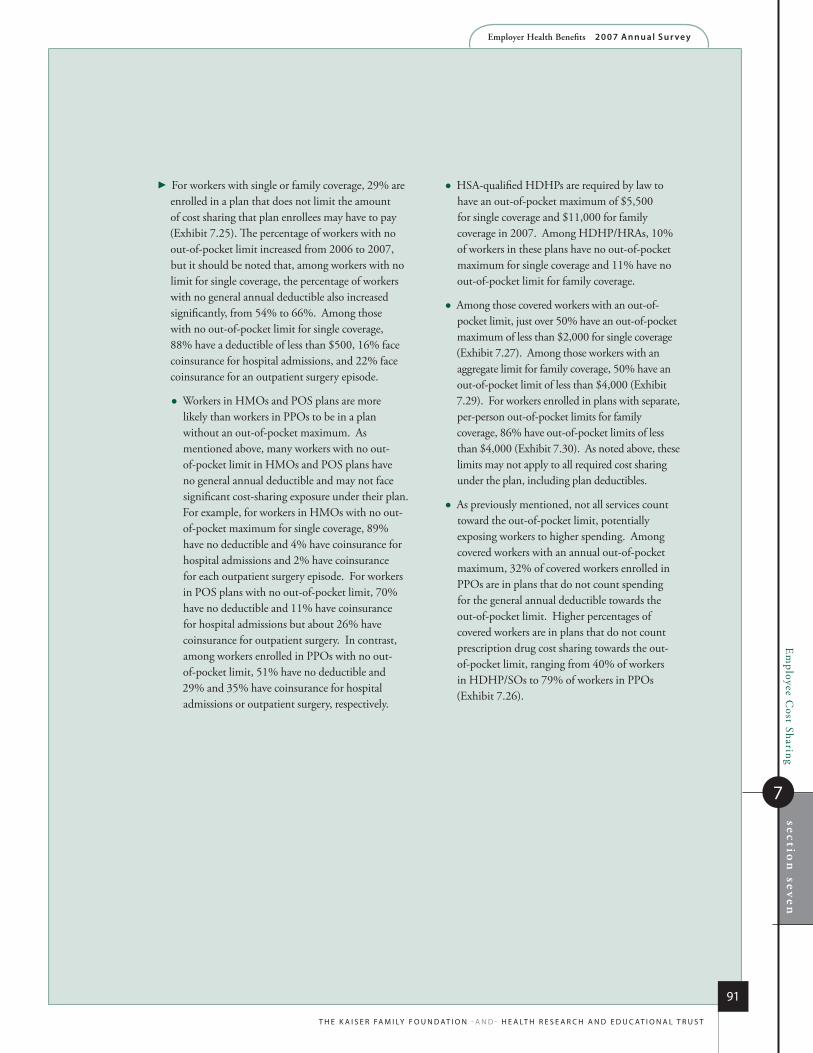
Em
ployee Cost Sharing
7
section
sevenEmployer Health Benefits 2 0 0 7 An n u a l S u r vey
91
T h e K A i S e r FA m i ly F o u n d AT i o n - A n d - h e A lT h r e S e A r c h A n d e d u c AT i o n A l T r u S T
�For workers with single or family coverage, 29% are enrolled in a plan that does not limit the amount of cost sharing that plan enrollees may have to pay (Exhibit 7.25). The percentage of workers with no out-of-pocket limit increased from 2006 to 2007, but it should be noted that, among workers with no limit for single coverage, the percentage of workers with no general annual deductible also increased significantly, from 54% to 66%. Among those with no out-of-pocket limit for single coverage, 88% have a deductible of less than $500, 16% face coinsurance for hospital admissions, and 22% face coinsurance for an outpatient surgery episode.
Workers in HMOs and POS plans are more likely than workers in PPOs to be in a plan without an out-of-pocket maximum. As mentioned above, many workers with no out-of-pocket limit in HMOs and POS plans have no general annual deductible and may not face significant cost-sharing exposure under their plan. For example, for workers in HMOs with no out-of-pocket maximum for single coverage, 89% have no deductible and 4% have coinsurance for hospital admissions and 2% have coinsurance for each outpatient surgery episode. For workers in POS plans with no out-of-pocket limit, 70% have no deductible and 11% have coinsurance for hospital admissions but about 26% have coinsurance for outpatient surgery. In contrast, among workers enrolled in PPOs with no out-of-pocket limit, 51% have no deductible and 29% and 35% have coinsurance for hospital admissions or outpatient surgery, respectively.
HSA-qualified HDHPs are required by law to have an out-of-pocket maximum of $5,500 for single coverage and $11,000 for family coverage in 2007. Among HDHP/HRAs, 10% of workers in these plans have no out-of-pocket maximum for single coverage and 11% have no out-of-pocket limit for family coverage.
Among those covered workers with an out-of-pocket limit, just over 50% have an out-of-pocket maximum of less than $2,000 for single coverage (Exhibit 7.27). Among those workers with an aggregate limit for family coverage, 50% have an out-of-pocket limit of less than $4,000 (Exhibit 7.29). For workers enrolled in plans with separate, per-person out-of-pocket limits for family coverage, 86% have out-of-pocket limits of less than $4,000 (Exhibit 7.30). As noted above, these limits may not apply to all required cost sharing under the plan, including plan deductibles.
As previously mentioned, not all services count toward the out-of-pocket limit, potentially exposing workers to higher spending. Among covered workers with an annual out-of-pocket maximum, 32% of covered workers enrolled in PPOs are in plans that do not count spending for the general annual deductible towards the out-of-pocket limit. Higher percentages of covered workers are in plans that do not count prescription drug cost sharing towards the out-of-pocket limit, ranging from 40% of workers in HDHP/SOs to 79% of workers in PPOs (Exhibit 7.26).

Em
ployee Cost Sharing
7sectio
n seven
Employer Health Benefits 2 0 0 7 An n u a l S u r vey
92
T h e K A i S e r FA m i ly F o u n d AT i o n - A n d - h e A lT h r e S e A r c h A n d e d u c AT i o n A l T r u S T
e x h i b i T 7 .1
Percentage of covered Workers With no General Annual health Plan deduc tible for S ingle and Family coverage, by Plan Type and Firm Size, 2007
Single coverage Family coverage
hMo
200–999 Workers 91%* 89%1,000–4,999 Workers 80 805,000 or more Workers 78 76All Small firms (3–199 Workers) 86% 84%All large firms (200 or More Workers) 80% 79%
All firM SiZeS 82% 81%
PPo
200–999 Workers 33% 33%1,000–4,999 Workers 29 295,000 or more Workers 28 28All Small firms (3–199 Workers) 28% 25%All large firms (200 or More Workers) 29% 29%
All firM SiZeS 29% 28%
PoS
200–999 Workers 62% 62%1,000–4,999 Workers 60 575,000 or more Workers 55 54All Small firms (3–199 Workers) 47% 46%All large firms (200 or More Workers) 59% 57%
All firM SiZeS 52% 51%
* estimate is statistically different within plan type from estimate for all other firms not in the indicated size category (p<.05).
note: hdhP/Sos are not shown because all covered workers in these plans face a minimum deductible. in hdhP/hrA plans, as defined by the survey, the minimum deductible is $1,000 for single coverage and $2,000 for family coverage. in hSA-qualified hdhPs, the legal minimum deductible for 2007 is $1,100 for single coverage and $2,200 for family coverage.
Kaiser/hreT Survey of employer-Sponsored health benefits, 2007.
s o u r c e :

Em
ployee Cost Sharing
7
section
sevenEmployer Health Benefits 2 0 0 7 An n u a l S u r vey
93
T h e K A i S e r FA m i ly F o u n d AT i o n - A n d - h e A lT h r e S e A r c h A n d e d u c AT i o n A l T r u S T
e x h i b i T 7 .2
Among covered Workers with no General Annual health Plan deduc tible for S ingle and Family coverage, Percentage Who have the Fol lowing Types of cost Shar ing, by Plan Type, 2007 ‡
Single coverage Family coverage
Separate cost Sharing for each hospital Admission
hmo 56% 56%PPo 68 68PoS 72 71
Separate cost Sharing for each outpatient Surgery episode
hmo 68% 68%PPo 77 76PoS 77 76
Separate cost Sharing for an emergency room Visit
hmo 95% 95%PPo 96 96PoS 97 97
Separate cost Sharing for an urgent care Visit
hmo 90% 90%PPo 91 92PoS 91 90
Separate cost Sharing for an Advanced Diagnostic test
hmo 53% 53%PPo 64 64PoS 68 67
‡ Separate cost sharing for each hospital admission includes the following types: copayment only, coinsurance only, both copayment and coinsurance, either a copayment or coinsurance (whichever is greater), and a charge per day (per diem). cost sharing for each outpatient surgery episode, emergency room visit, urgent care visit, and advanced diagnostic test includes the following types: copayment only, coinsurance only, both copayment and coinsurance, and either a copayment or coinsurance, whichever is greater.
note: hdhP/Sos are not shown because all covered workers in these plans face a deductible. in hdhP/hrA plans, as defined by the survey, the minimum deductible is $1,000 for single coverage and $2,000 for family coverage. in hSA-qualified hdhPs, the legal minimum deductible for 2007 is $1,100 for single coverage and $2,200 for family coverage.
Kaiser/hreT Survey of employer-Sponsored health benefits, 2007.
s o u r c e :
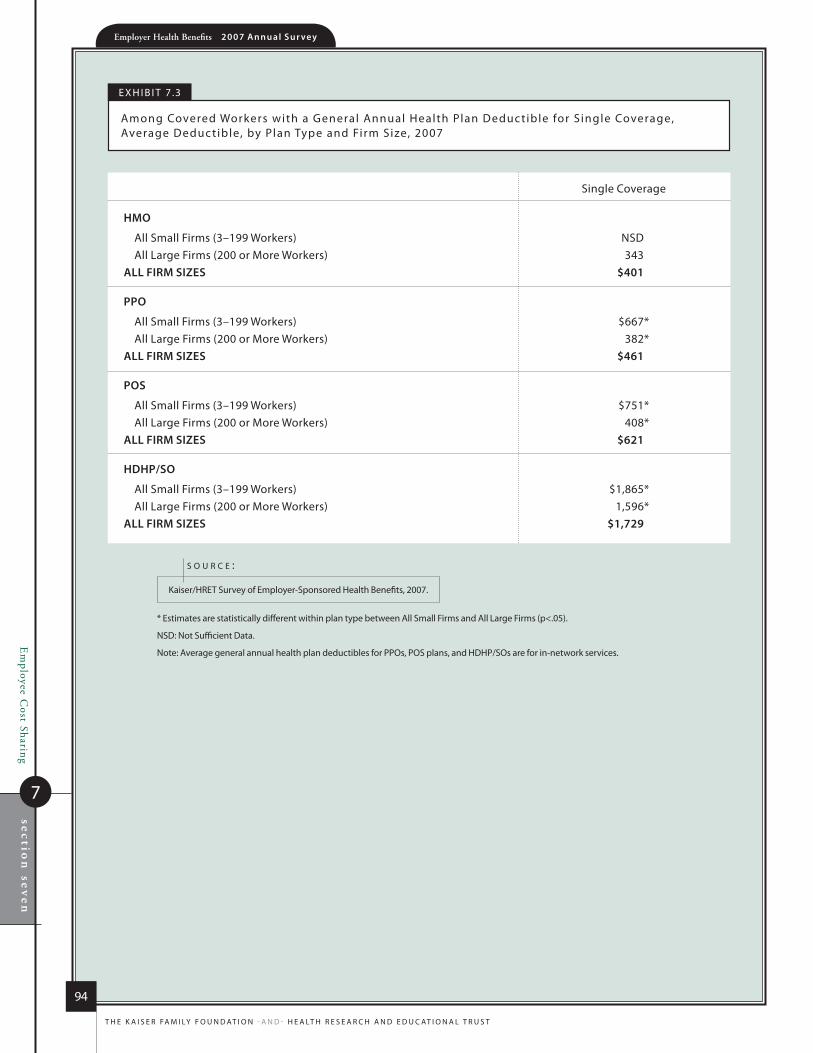
Em
ployee Cost Sharing
7sectio
n seven
Employer Health Benefits 2 0 0 7 An n u a l S u r vey
94
T h e K A i S e r FA m i ly F o u n d AT i o n - A n d - h e A lT h r e S e A r c h A n d e d u c AT i o n A l T r u S T
e x h i b i T 7 .3
Among covered Workers with a General Annual health Plan deduc tible for S ingle coverage, Average deduc tible, by Plan Type and Firm Size, 2007
Single coverage
hMo
All Small Firms (3–199 Workers) nSdAll large Firms (200 or more Workers) 343
All firM SiZeS $401
PPo
All Small Firms (3–199 Workers) $667*All large Firms (200 or more Workers) 382*
All firM SiZeS $461
PoS
All Small Firms (3–199 Workers) $751*All large Firms (200 or more Workers) 408*
All firM SiZeS $621
hDhP/So
All Small Firms (3–199 Workers) $1,865*All large Firms (200 or more Workers) 1,596*
All firM SiZeS $1,729
* estimates are statistically different within plan type between All Small Firms and All large Firms (p<.05).
nSd: not Sufficient data.
note: Average general annual health plan deductibles for PPos, PoS plans, and hdhP/Sos are for in-network services.
Kaiser/hreT Survey of employer-Sponsored health benefits, 2007.
s o u r c e :
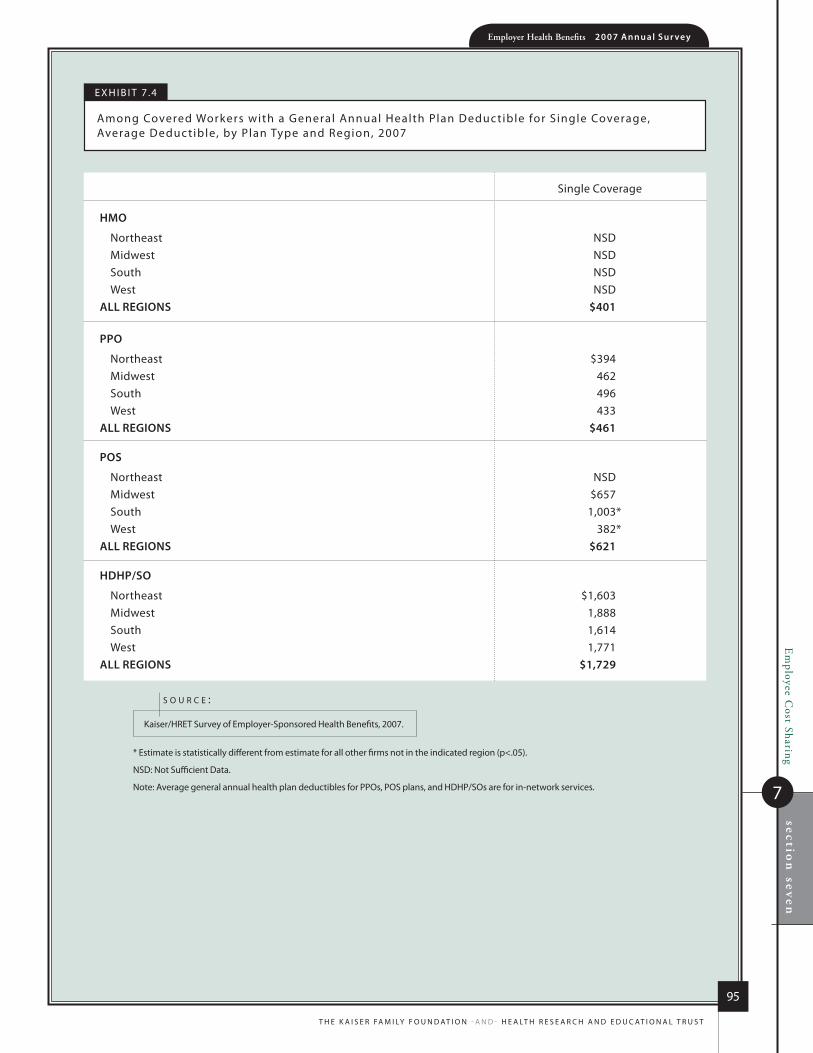
Em
ployee Cost Sharing
7
section
sevenEmployer Health Benefits 2 0 0 7 An n u a l S u r vey
95
T h e K A i S e r FA m i ly F o u n d AT i o n - A n d - h e A lT h r e S e A r c h A n d e d u c AT i o n A l T r u S T
e x h i b i T 7 .4
Among covered Workers with a General Annual health Plan deduc tible for S ingle coverage, Average deduc tible, by Plan Type and region, 2007
Single coverage
hMo
northeast nSdmidwest nSdSouth nSdWest nSd
All regionS $401
PPo
northeast $394midwest 462South 496West 433
All regionS $461
PoS
northeast nSdmidwest $657South 1,003*West 382*
All regionS $621
hDhP/So
northeast $1,603midwest 1,888South 1,614West 1,771
All regionS $1,729
* estimate is statistically different from estimate for all other firms not in the indicated region (p<.05).
nSd: not Sufficient data.
note: Average general annual health plan deductibles for PPos, PoS plans, and hdhP/Sos are for in-network services.
Kaiser/hreT Survey of employer-Sponsored health benefits, 2007.
s o u r c e :
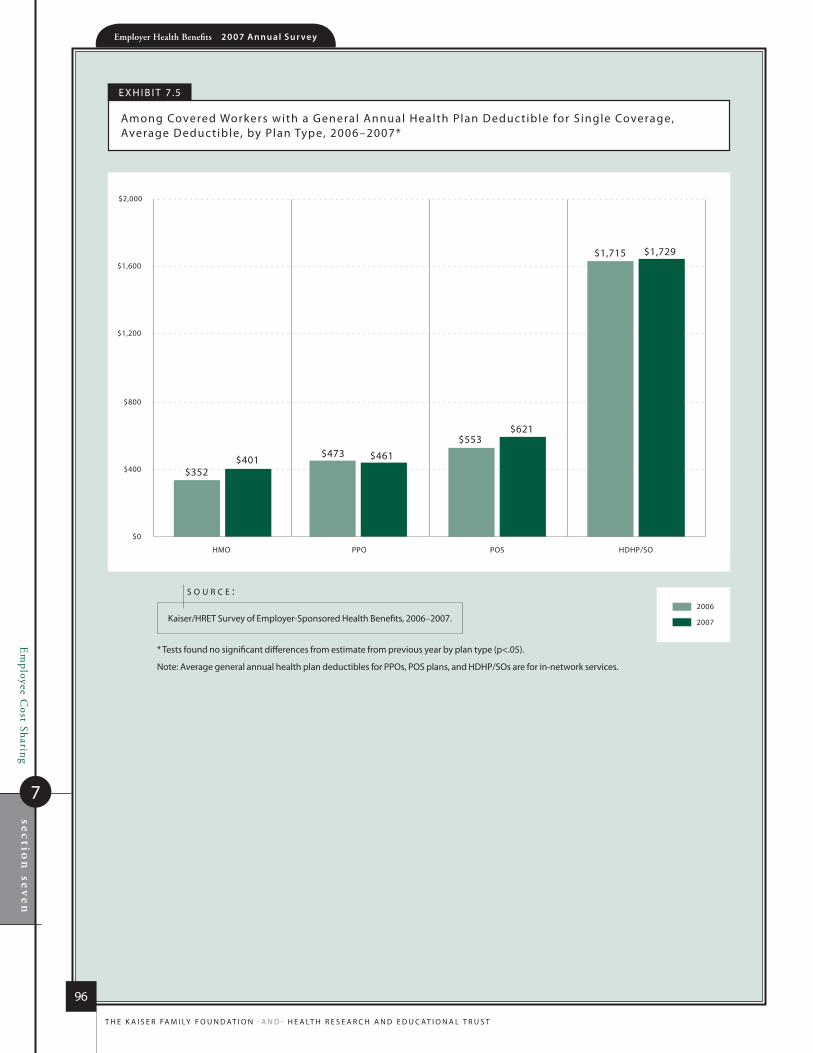
Em
ployee Cost Sharing
7sectio
n seven
Employer Health Benefits 2 0 0 7 An n u a l S u r vey
96
T h e K A i S e r FA m i ly F o u n d AT i o n - A n d - h e A lT h r e S e A r c h A n d e d u c AT i o n A l T r u S T
2006
2007
$0
$400
$800
$1,200
$1,600
$2,000
HMO PPO POS HDHP/SO
$352$401
$473 $461
$553$621
$1,715 $1,729
e x h i b i T 7 .5
Among covered Workers with a General Annual health Plan deduc tible for S ingle coverage, Average deduc tible, by Plan Type, 2006–2007*
* Tests found no significant differences from estimate from previous year by plan type (p<.05).
note: Average general annual health plan deductibles for PPos, PoS plans, and hdhP/Sos are for in-network services.
Kaiser/hreT Survey of employer-Sponsored health benefits, 2006–2007.
s o u r c e :

Em
ployee Cost Sharing
7
section
sevenEmployer Health Benefits 2 0 0 7 An n u a l S u r vey
97
T h e K A i S e r FA m i ly F o u n d AT i o n - A n d - h e A lT h r e S e A r c h A n d e d u c AT i o n A l T r u S T
$1–$499 $500–$999 $1,000–$1,999 $2,000 or more
2000 74% 20% 7% 0%
2001 77 14 7 2
2002* 79 20 1 0
2003* 73 17 10 0
2004* 54 23 10 13
2005* 58 24 17 1
2006* 38 44 16 1
2007* 50 26 19 5
e x h i b i T 7 .6
Among covered Workers With a General Annual health Plan deduc tible for S ingle PPo coverage, distr ibution of deduc tibles, 2000–2007
$1–$499 $500–$999 $1,000–$1,999 $2,000 or more
2000 86% 13% 1% <1%
2001* 80 16 4 <1
2002* 77 16 5 2
2003* 69 20 9 2
2004 71 20 6 2
2005* 67 20 10 3
2006* 62 26 8 4
2007* 64 24 10 2
* distribution is statistically different from distribution for the previous year shown (p<.05).
note: deductibles for PPos are for in-network services.
Kaiser/hreT Survey of employer-Sponsored health benefits, 2000–2007.
s o u r c e :
e x h i b i T 7 .7
Among covered Workers With a General Annual health Plan deduc tible for S ingle PoS coverage, distr ibution of deduc tibles, 2000–2007
* distribution is statistically different from distribution for the previous year shown (p<.05).
note: deductibles for PoS plans are for in-network services.
Kaiser/hreT Survey of employer-Sponsored health benefits, 2000–2007.
s o u r c e :

Em
ployee Cost Sharing
7sectio
n seven
Employer Health Benefits 2 0 0 7 An n u a l S u r vey
98
T h e K A i S e r FA m i ly F o u n d AT i o n - A n d - h e A lT h r e S e A r c h A n d e d u c AT i o n A l T r u S T
e x h i b i T 7 .8
distr ibution of Type of deduc tible for Family coverage, by Plan Type and Firm Size, 2007*
* Tests found no statistical difference within plan type between distributions for All Small Firms and All large Firms (p<.05).
nA: not Applicable. All covered workers in hdhP/Sos face a general annual deductible. in hdhP/hrA plans, as defined by the survey, the minimum deductible is $1,000 for single coverage and $2,000 for family coverage. in hSA-qualified hdhPs, the legal minimum deductible for 2007 is $1,100 for single coverage and $2,200 for family coverage.
note: The survey distinguished between plans that have an aggregate deductible amount in which all family members’ out-of-pocket expenses count toward the deductible and plans that have a separate amount for each family member, typically with a limit on the number of family members required to reach that amount. Among workers with a deductible, 76% of workers in hmos have an aggregate deductible, 71% in PPos have an aggregate deductible, and 66% in PoS plans have an aggregate deductible. Average general annual health plan deductibles for PPos, PoS plans, and hdhP/Sos are for in-network services.
Kaiser/hreT Survey of employer-Sponsored health benefits, 2007.
s o u r c e :
no Aggregate Separate Amount deductible Amount per Person
hMo
All Small Firms (3–199 Workers) 84% 10% 6%All large Firms (200 or more Workers) 79 17 4
All firM SiZeS 81% 15% 5%
PPo
All Small Firms (3–199 Workers) 25% 51% 24%All large Firms (200 or more Workers) 29 51 20
All firM SiZeS 28% 51% 21%
PoS
All Small Firms (3–199 Workers) 46% 31% 23%All large Firms (200 or more Workers) 57 35 8
All firM SiZeS 51% 33% 17%
hDhP/So
All Small Firms (3–199 Workers) nA 96% 4%All large Firms (200 or more Workers) nA 83 17
All firM SiZeS nA 89% 11%

Em
ployee Cost Sharing
7
section
sevenEmployer Health Benefits 2 0 0 7 An n u a l S u r vey
99
T h e K A i S e r FA m i ly F o u n d AT i o n - A n d - h e A lT h r e S e A r c h A n d e d u c AT i o n A l T r u S T
e x h i b i T 7 .9
Among covered Workers with a General Annual health Plan deductible, Average deductibles for Family coverage, by deductible Type, Plan Type, and Firm Size, 2007
* estimates are statistically different within plan type between All Small Firms and All large Firms (p<.05).
nSd: not Sufficient data.
note: deductibles for PPo, PoS, and hdhP/So plans are for in-network services. The survey distinguished between plans that have an aggregate deductible amount in which all family members’ out-of-pocket expenses count toward the deductible and plans that have a separate amount for each family member, typically with a limit on the number of family members required to reach that amount.
Kaiser/hreT Survey of employer-Sponsored health benefits, 2007.
s o u r c e :
Aggregate Amount Separate Amount per Person
hMo
All Small Firms (3–199 Workers) nSd nSdAll large Firms (200 or more Workers) 637 nSd
All firM SiZeS $759 nSD
PPo
All Small Firms (3–199 Workers) $1,419* $788*All large Firms (200 or more Workers) 899* 363*
All firM SiZeS $1,040 $492
PoS
All Small Firms (3–199 Workers) $1,786* $454All large Firms (200 or more Workers) 885* nSd
All firM SiZeS $1,359 $592
hDhP/So
All Small Firms (3–199 Workers) $3,976* nSdAll large Firms (200 or more Workers) 3,231* nSd
All firM SiZeS $3,596 nSD

Em
ployee Cost Sharing
7sectio
n seven
Employer Health Benefits 2 0 0 7 An n u a l S u r vey
100
T h e K A i S e r FA m i ly F o u n d AT i o n - A n d - h e A lT h r e S e A r c h A n d e d u c AT i o n A l T r u S T
e x h i b i T 7 .10
Among covered Workers with a General Annual health Plan deduc tible for Family coverage, Average Aggregate deduc tible, by Plan Type, 2006–2007*
2006
2007
HMO PPO POS HDHP/SO
$751 $759
$1,034 $1,040
$1,227$1,359
$3,511$3,596
0
$500
$1,000
$1,500
$2,000
$2,500
$3,000
$3,500
$4,000
* Tests found no significant differences from estimate from previous year by plan type (p<.05).
note: Separate per person deductibles are not presented or comparable between 2006 and 2007 due to a change in methodology. Average general annual health plan deductibles for PPos, PoS plans, and hdhP/Sos are for in-network services.
Kaiser/hreT Survey of employer-Sponsored health benefits, 2006–2007.
s o u r c e :

Em
ployee Cost Sharing
7
section
sevenEmployer Health Benefits 2 0 0 7 An n u a l S u r vey
101
T h e K A i S e r FA m i ly F o u n d AT i o n - A n d - h e A lT h r e S e A r c h A n d e d u c AT i o n A l T r u S T
e x h i b i T 7 .11
Among covered Workers With a General Annual health Plan deduc tible for Family coverage, distr ibution of deduc tibles for PPo and PoS Plans, by deduc tible Type, 2007
0% 10% 20% 30% 40% 50% 60% 70% 80% 90% 100%
$1–$499
$500–$999
$1,000–$1,999
$2,000 OR MORE
SEPARATE AMOUNTPER PERSON
AGGREGATE AMOUNT
AGGREGATE AMOUNT
SEPARATE AMOUNTPER PERSON
PPO*
POS*
60% 25% 11% 4%
14% 25% 12%49%
15%
32%
61%
13%
22%
29% 25%
2%
* distributions are statistically different within plan type (p< .05).
note: distributions for hmo and hdhP/So plans are not include d because sufficient data were not available. deductibles are for in -network services. The survey distinguished between plans that have an aggregate deductible amount in which all family members’ out-of-pocket expenses count toward the deductible and plans that have a separate amount for each family member, typically with a limit on the number of family members required to reach that a mount. due to a change in methodology, separate deductibles reported in 2007 are not comparable to separate deductibles reported in 2006.
Kaiser/hreT Survey of employer -Sponsored health benefits, 2007.
s o u r c e :

Em
ployee Cost Sharing
7sectio
n seven
Employer Health Benefits 2 0 0 7 An n u a l S u r vey
102
T h e K A i S e r FA m i ly F o u n d AT i o n - A n d - h e A lT h r e S e A r c h A n d e d u c AT i o n A l T r u S T
e x h i b i T 7 .12
Among covered Workers With a Separate per Person General Annual health Plan deduc tible for Family coverage, distr ibution of maximum number of Family members required to meet the deduc tible for PPo and PoS Plans, 2007
0% 10% 20% 30% 40% 50% 60% 70% 80% 90% 100%
POS
PPO
TWO
THREE
FOUR OR MORE (WITH SPECIFIED LIMIT)
NO LIMIT
28% 59% 5% 8%
18% 56% 22%4%
e x h i b i T 7 .13
Among covered Workers with a General Annual health Plan deductible, Percentage with coverage for the Following Services Without having to First meet the deductible, by Plan Type, 2007
note: These questions are asked for single coverage only. We make the assumption that they apply to workers enrolled in family coverage as well. For PPos and PoS plans, we ask about deductibles for in-network services. due to a difference in the structure of the questions, data for hdhP/So are presented in Section 8. For example, firms with hmos, PPos, and PoS plans are asked, “does the general annual deductible have to be met before preventive care is covered?” while firms with hdhP/Sos are asked, “Are there preventive benefits that are paid for by the plan (that is, not through the savings account) before the employee meets the deductible under the plan?”
Kaiser/hreT Survey of employer-Sponsored health benefits, 2007.
s o u r c e :
hmo PPo PoS
Physician office visit 71% 59% 37%
Preventive care 80% 66% 36%
Prescription drugs 77% 69% 45%
note: distributions for hmo and hdhP/So plans are not included because sufficient data were not available. deductibles for PPo and PoS plans are for in-network services. The survey distinguished between plans that have an aggregate deductible amount in which all family members’ out-of-pocket expenses count toward the deductible and plans that have a separate amount for each family member, typically with a limit on the number of family members required to reach that amount.
Kaiser/hreT Survey of employer-Sponsored health benefits, 2007.
s o u r c e :

Em
ployee Cost Sharing
7
section
sevenEmployer Health Benefits 2 0 0 7 An n u a l S u r vey
103
T h e K A i S e r FA m i ly F o u n d AT i o n - A n d - h e A lT h r e S e A r c h A n d e d u c AT i o n A l T r u S T
e x h i b i T 7 .14
Percentage of covered Workers with a Separate hospital deduc tible and Average Separate hospital deduc tibles, by Plan Type, 2007
Percentage Among Workers of covered Workers with a Separate hospital deductible, with a Separate hospital deductible Average Separate hospital deductible
hmo 15% $323
PPo 12% $334
PoS 23% $340
note: Separate hospital deductible questions were not asked of hdhP/Sos.
Kaiser/hreT Survey of employer-Sponsored health benefits, 2007.
s o u r c e :

Em
ployee Cost Sharing
7sectio
n seven
Employer Health Benefits 2 0 0 7 An n u a l S u r vey
104
T h e K A i S e r FA m i ly F o u n d AT i o n - A n d - h e A lT h r e S e A r c h A n d e d u c AT i o n A l T r u S T
e x h i b i T 7 .15
distr ibution of covered Workers With the Fol lowing Types of cost Shar ing in Addit ion to Any Plan deduc tible, by Plan Type, 2007
Kaiser/hreT Survey of employer-Sponsored health benefits, 2007.
s o u r c e
* distribution is statistically different from All Plans distribution (p<.05).
‡ This includes enrollees who are required to pay the higher amount of either the copayment or coinsurance under the plan.
nA: not Applicable. The survey did not offer “charge Per day” (per diem) as a response option for questions about separate cost sharing for each outpatient surgery episode.
copayment coinsurance both copay and charge none only only coinsurance‡ Per day
Separate cost Sharing for each hospital Admissionhmo* 34% 14% 4% 7% 40%PPo* 13 56 9 3 20PoS* 37 23 7 8 24hdhP/So* 3 64 1 2 31
All PlAnS 20% 43% 7% 4% 26%
Separate cost Sharing for each outpatient Surgery
hmo* 53% 13% 4% nA 30%PPo* 17 59 6 nA 17PoS* 39 38 4 nA 18hdhP/So* 2 68 1 nA 29
All PlAnS 27% 47% 5% nA 21%
Separate cost Sharing for emergency room Visit
hmo* 86% 6% 2% nA 6%PPo* 55 24 15 nA 7PoS * 83 10 5 nA 3hdhP/So* 12 57 3 nA 28
All PlAnS 62% 20% 11% nA 7%
Separate cost Sharing for urgent care Visit
hmo * 83% 3% 1% nA 13%PPo* 59 23 6 nA 13PoS* 84 7 2 nA 7hdhP/So* 15 58 0 nA 27
All PlAnS 65% 17% 4% nA 14%
Separate cost Sharing for Advanced Diagnostic test
hmo* 40% 13% 1% nA 45%PPo* 14 60 3 nA 23PoS* 35 36 1 nA 27hdhP/So* 2 62 1 nA 35
All PlAnS 21% 47% 2% nA 30%

Em
ployee Cost Sharing
7
section
sevenEmployer Health Benefits 2 0 0 7 An n u a l S u r vey
105
T h e K A i S e r FA m i ly F o u n d AT i o n - A n d - h e A lT h r e S e A r c h A n d e d u c AT i o n A l T r u S T
e x h i b i T 7 .16
Among covered Workers With Separate cost Shar ing for each hospital Admission or each outpatient Surger y in Addit ion to Any Plan deduc tible, Average cost Shar ing, by Plan Type, 2007
Average copayment Average coinsurance charge Per day
Separate cost Sharing for each hospital Admission
hmo $243* 15%* $209PPo 192 17 187PoS 194 19* nSdhdhP/So nSd 18 nSd
All PlAnS $208 17% $228‡
Separate cost Sharing for each outpatient Surgery
hmo $110 15% nAPPo 119 17 nAPoS 110 19 nAhdhP/So nSd 20 nA
All PlAnS $114‡ 18% nA
Kaiser/hreT Survey of employer-Sponsored health benefits, 2007.
s o u r c e :
* estimate is statistically different from All Plans estimate (p<.05).
‡ The averages for ”All Plans” were calculated without data from hdhP/So plans due to insufficient observations in that plan type.
nSd: not Sufficient data.
nA: not applicable. The survey did not offer “charge Per day” (per diem) as a response option for questions about separate cost sharing for each outpatient surgery episode.
note: All Plans estimates are weighted by workers in firms that reported cost sharing. See the Survey design and methods Section for more information on weighting.

Em
ployee Cost Sharing
7sectio
n seven
Employer Health Benefits 2 0 0 7 An n u a l S u r vey
106
T h e K A i S e r FA m i ly F o u n d AT i o n - A n d - h e A lT h r e S e A r c h A n d e d u c AT i o n A l T r u S T
Percentage of covered Among those with emergency room Workers with emergency room cost Sharing, Percentage of covered cost Sharing Workers with cost Sharing Waived if individual is Admitted to the hospital
hmo 94% 86%PPo 93 74PoS 97* 98*hdhP/So 72* 41*
All PlAnS 93% 79%
e x h i b i T 7 .17
in Addit ion to Any Plan deduc tible, Percentage of covered Workers with emergenc y room cost Shar ing, by Plan Type, 2007
Kaiser/hreT Survey of employer-Sponsored health benefits, 2007.
s o u r c e :
* estimate is statistically different from All Plans estimate (p<.05).
e x h i b i T 7 .18
in Addit ion to Any Plan deduc tible, Percentage of covered Workers With the Fol lowing Types of cost Shar ing for Physic ian o ff ice vis i ts , by Plan Type, 2007
Kaiser/hreT Survey of employer-Sponsored health benefits, 2007.
s o u r c e :
* distribution is statistically different from All Plans distribution (p<.05).
‡ This includes enrollees who are required to pay the higher amount of either the copayment or coinsurance under the plan.
§ For hdhP/Sos, the questions on out-of-network cost sharing are asked only of those that indicated in a previous question that the plan has a preferred provider network.
nA: not applicable. Questions on out-of-network office visit cost sharing are not asked of hmo plans.
copay coinsurance both copay neither only only and coinsurance‡
in-network
hmo* 93% 2% 1% 4%PPo* 77 13 6 3PoS* 90 4 4 2hdhP/So* 19 56 2 23
All PlAnS 79% 12% 5% 4%
out-of-network
hmo nA nA nA nAPPo 8% 78% 8% 6%PoS* 18 71 5 6hdhP/So*§ 9 79 2 11
All PlAnS 9% 80% 6% 5%
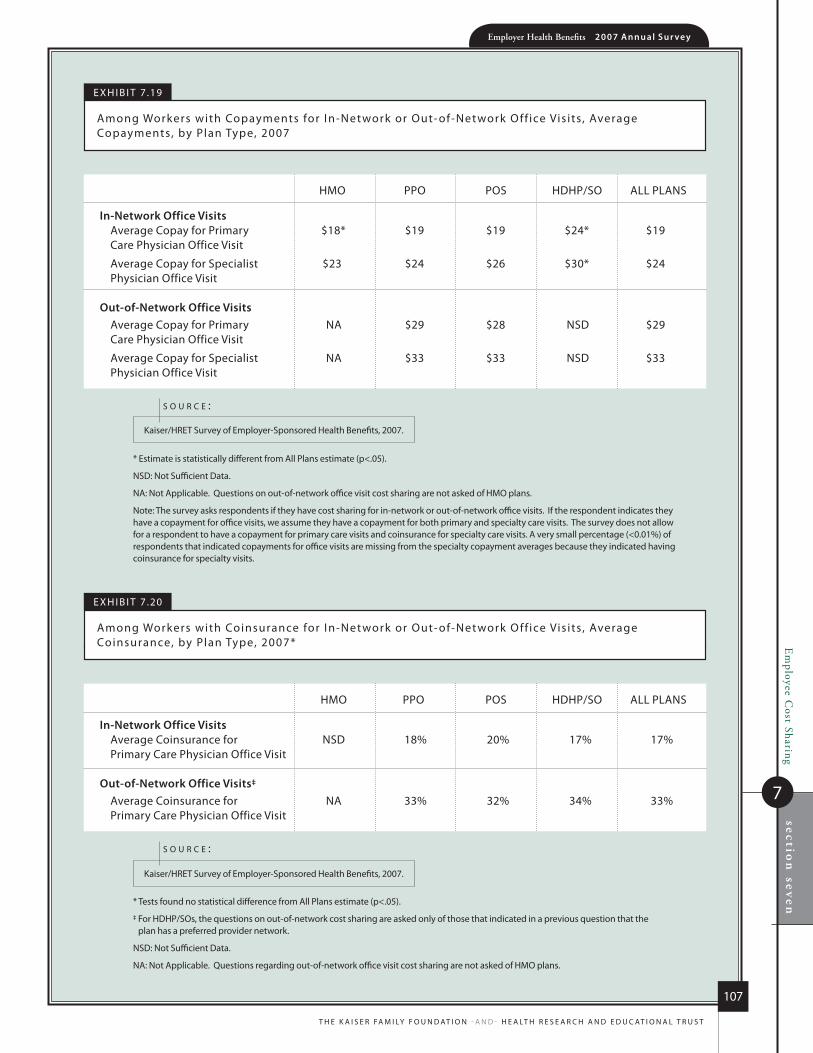
Em
ployee Cost Sharing
7
section
sevenEmployer Health Benefits 2 0 0 7 An n u a l S u r vey
107
T h e K A i S e r FA m i ly F o u n d AT i o n - A n d - h e A lT h r e S e A r c h A n d e d u c AT i o n A l T r u S T
e x h i b i T 7 .19
Among Workers with copayments for in-network or out- of-network o ff ice vis i ts , Average copayments, by Plan Type, 2007
* estimate is statistically different from All Plans estimate (p<.05).
nSd: not Sufficient data.
nA: not Applicable. Questions on out-of-network office visit cost sharing are not asked of hmo plans.
note: The survey asks respondents if they have cost sharing for in-network or out-of-network office visits. if the respondent indicates they have a copayment for office visits, we assume they have a copayment for both primary and specialty care visits. The survey does not allow for a respondent to have a copayment for primary care visits and coinsurance for specialty care visits. A very small percentage (<0.01%) of respondents that indicated copayments for office visits are missing from the specialty copayment averages because they indicated having coinsurance for specialty visits.
Kaiser/hreT Survey of employer-Sponsored health benefits, 2007.
s o u r c e :
hmo PPo PoS hdhP/So All PlAnS
in-network office VisitsAverage copay for Primary $18* $19 $19 $24* $19 care Physician office visit
Average copay for Specialist $23 $24 $26 $30* $24 Physician office visit
out-of-network office VisitsAverage copay for Primary nA $29 $28 nSd $29 care Physician office visit
Average copay for Specialist nA $33 $33 nSd $33 Physician office visit
hmo PPo PoS hdhP/So All PlAnS
in-network office VisitsAverage coinsurance for nSd 18% 20% 17% 17% Primary care Physician office visit
out-of-network office Visits‡
Average coinsurance for nA 33% 32% 34% 33% Primary care Physician office visit
e x h i b i T 7 .20
Among Workers with coinsurance for in-network or out- of-network o ff ice vis i ts , Average coinsurance, by Plan Type, 2007*
* Tests found no statistical difference from All Plans estimate (p<.05).
‡ For hdhP/Sos, the questions on out-of-network cost sharing are asked only of those that indicated in a previous question that the plan has a preferred provider network.
nSd: not Sufficient data.
nA: not Applicable. Questions regarding out-of-network office visit cost sharing are not asked of hmo plans.
Kaiser/hreT Survey of employer-Sponsored health benefits, 2007.
s o u r c e :

Em
ployee Cost Sharing
7sectio
n seven
Employer Health Benefits 2 0 0 7 An n u a l S u r vey
108
T h e K A i S e r FA m i ly F o u n d AT i o n - A n d - h e A lT h r e S e A r c h A n d e d u c AT i o n A l T r u S T
e x h i b i T 7 .21
Among covered Workers With copayments for A Physic ian o ff ice vis i t with a Pr imar y care Physic ian, distr ibution of copayments, by Plan Type, 2004–2007
Kaiser/hreT Survey of employer-Sponsored health benefits, 2004–2007.
s o u r c e :
* distribution is statistically different from distribution for the previous year shown (p<.05).
‡ in 2006, there is insufficient data to report the results. information was not obtained for hdhP/Sos prior to 2006.
note: copayments for PPo, PoS, and hdhP/So plans are for in-network providers. The survey has asked specifically about copayments for primary care physicians since 2005.
$5 Per visit $10 Per visit $15 Per visit $20 Per visit $25 Per visit $30 Per visit other
hMo
2004 3% 28% 40% 22% 3% 3% 1%2005* 5 23 34 27 6 4 12006 3 21 37 25 8 5 22007* 3 20 25 34 13 4 1
PPo
2004 1% 17% 35% 28% 11% 4% 3%2005* <1 16 25 34 15 5 42006 <1 12 25 35 17 7 32007* 2 11 24 35 19 7 2
PoS
2004 3% 17% 34% 36% 8% <1% 1%2005* 2 16 35 30 11 6 12006* 2 22 26 27 16 6 <12007* 2 10 36 25 15 6 5
hDhP/So‡
2007 7% <1% 12% 38% 13% 19% 12%
All PlAnS
2004 1% 19% 37% 27% 9% 3% 3%2005* 2 17 29 32 12 5 32006 2 15 28 32 15 6 32007 2 14 25 34 17 7 2
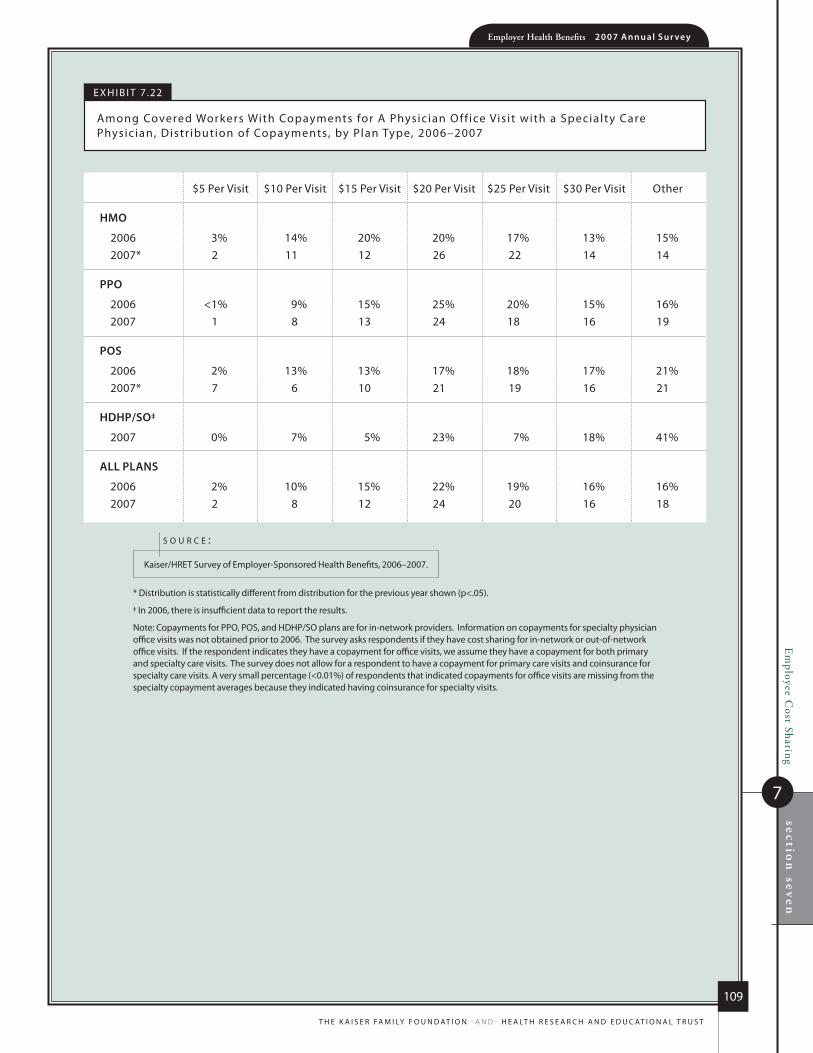
Em
ployee Cost Sharing
7
section
sevenEmployer Health Benefits 2 0 0 7 An n u a l S u r vey
109
T h e K A i S e r FA m i ly F o u n d AT i o n - A n d - h e A lT h r e S e A r c h A n d e d u c AT i o n A l T r u S T
$5 Per visit $10 Per visit $15 Per visit $20 Per visit $25 Per visit $30 Per visit other
hMo
2006 3% 14% 20% 20% 17% 13% 15%2007* 2 11 12 26 22 14 14
PPo
2006 <1% 9% 15% 25% 20% 15% 16%2007 1 8 13 24 18 16 19
PoS
2006 2% 13% 13% 17% 18% 17% 21%2007* 7 6 10 21 19 16 21
hDhP/So‡
2007 0% 7% 5% 23% 7% 18% 41%
All PlAnS
2006 2% 10% 15% 22% 19% 16% 16%2007 2 8 12 24 20 16 18
e x h i b i T 7 .22
Among covered Workers With copayments for A Physic ian o ff ice vis i t with a Specialty care Physic ian, distr ibution of copayments, by Plan Type, 2006–2007
* distribution is statistically different from distribution for the previous year shown (p<.05).
‡ in 2006, there is insufficient data to report the results.
note: copayments for PPo, PoS, and hdhP/So plans are for in-network providers. information on copayments for specialty physician office visits was not obtained prior to 2006. The survey asks respondents if they have cost sharing for in-network or out-of-network office visits. if the respondent indicates they have a copayment for office visits, we assume they have a copayment for both primary and specialty care visits. The survey does not allow for a respondent to have a copayment for primary care visits and coinsurance for specialty care visits. A very small percentage (<0.01%) of respondents that indicated copayments for office visits are missing from the specialty copayment averages because they indicated having coinsurance for specialty visits.
Kaiser/hreT Survey of employer-Sponsored health benefits, 2006–2007.
s o u r c e :

Em
ployee Cost Sharing
7sectio
n seven
Employer Health Benefits 2 0 0 7 An n u a l S u r vey
110
T h e K A i S e r FA m i ly F o u n d AT i o n - A n d - h e A lT h r e S e A r c h A n d e d u c AT i o n A l T r u S T
e x h i b i T 7 .23
Among covered Workers in hmos With a copayment for a Physic ian o ff ice vis i t , Percentage with var ious copayments, 1999–2007
* estimate is statistically different from estimate for the previous year shown (p<.05).
note: in 2005, 2006, and 2007 the survey asked about primary care physicians (if the copayments were different for specialist care). This distinction was not made prior to 2005.
Kaiser/hreT Survey of employer-Sponsored health benefits, 1999–2007.
s o u r c e :
1999 2000 2001 2002 2003 2004 2005 2006 2007
$5 Per visit 23% 22% 15%* 7%* 4% 3% 5% 3% 3%
$10 Per visit 60 54 56 52 35* 28 23 21 20
$15 Per visit 12 16 22* 27 37* 40 34 37 25*
$20 Per visit 1 3 3 11* 12 22* 27 25 34*
other 3 6 4 3 12* 7 11 15 18
e x h i b i T 7 .24
Among covered Workers With coinsurance for Physic ian o ff ice vis i ts , distr ibution of Average coinsurance r ates, by Plan Type, 2007
note: hmo coinsurance rates are not shown because there is not sufficient data as only 2% of covered workers face coinsurance for office visits. For PPos, PoS plans, and hdhP/Sos, the survey asked about coinsurance rates for both in-network and out-of-network providers. however, for hdhP/Sos, the questions regarding out-of-network cost sharing were only asked of those that reported having a preferred provider network. For hmos, the distinction is not applicable.
Kaiser/hreT Survey of employer-Sponsored health benefits, 2007.
s o u r c e :
coinSurAnce rAteS 10% or 15% 20% or 25% 30% or 35% 40% or 45% other
PPo in-network Provider 32% 62% 6% <1% <1%
PPo out-of-network Provider 1 24 33 30 12
PoS in-network Provider 15 74 10 1 0
PoS out-of-network Provider 1 28 41 19 12
hdhP/So in-network Provider 37 59 4 0 <1
hdhP/So out-of-network Provider 2 22 30 33 13

Em
ployee Cost Sharing
7
section
sevenEmployer Health Benefits 2 0 0 7 An n u a l S u r vey
111
T h e K A i S e r FA m i ly F o u n d AT i o n - A n d - h e A lT h r e S e A r c h A n d e d u c AT i o n A l T r u S T
e x h i b i T 7 .25
Percentage of covered Workers With “no limit ” for Annual out- of-Pocket maximum for S ingle and Family coverage, by Plan Type, 2007
* estimate is statistically different from All Plans estimate (p<.05).
nA: not Applicable. hSA-qualified hdhPs are required to have an annual maximum out-of-pocket liability of no more than $5,500 for single coverage and $11,000 for family coverage. hdhP/hrAs have no such requirement, and the percentage of covered workers in hdhP/hrAs with “no limit” for annual out-of-pocket maximum for single and family coverage is 10% and 11%, respectively.
Kaiser/hreT Survey of employer-Sponsored health benefits, 2007.
s o u r c e :
Single coverage Family coverage
hmo 41%* 41%*
PPo 23* 24*
PoS 47* 47*
hdhP/So nA nA
All PlAnS 29% 29%
e x h i b i T 7 .26
Among covered Workers with an Annual out- of Pocket-maximum, Percentage Whose Spending for var ious Ser vices does not count Towards the out- of-Pocket l imit , 2007
‡ Among hdhP/So plans, questions other than “overall plan deductible” were asked only of hdhP/hrAs and not of hSA-qualified hdhPs. hSA-qualified hdhPs are required to apply most cost sharing to the out-of-pocket maximum. When hdhP/hrAs are considered exclusively, among covered workers with an annual out-of-pocket maximum, the percentage whose out-of-pocket maximum does not include certain services is as follows: any additional plan deductibles is 41%, office visit coinsurance is 1%, and prescription drug cost sharing is 41%.
nSd: not Sufficient data.
note: does not include covered workers with “no limit” specified under the plan out-of-pocket maximum. These questions are asked about covered workers with single coverage, and we make the assumption that they apply to workers enrolled in family coverage as well.
Kaiser/hreT Survey of employer-Sponsored health benefits, 2007.
s o u r c e :
hmo PPo PoS hdhP/So‡
General Plan deductible 28% 32% 30% 26%
Any Additional Plan deductibles 29 53 18 42
office visit copayments 45 73 52 nSd
office visit coinsurance nSd 12 nSd 1
Prescription drug cost Sharing 61 79 60 40
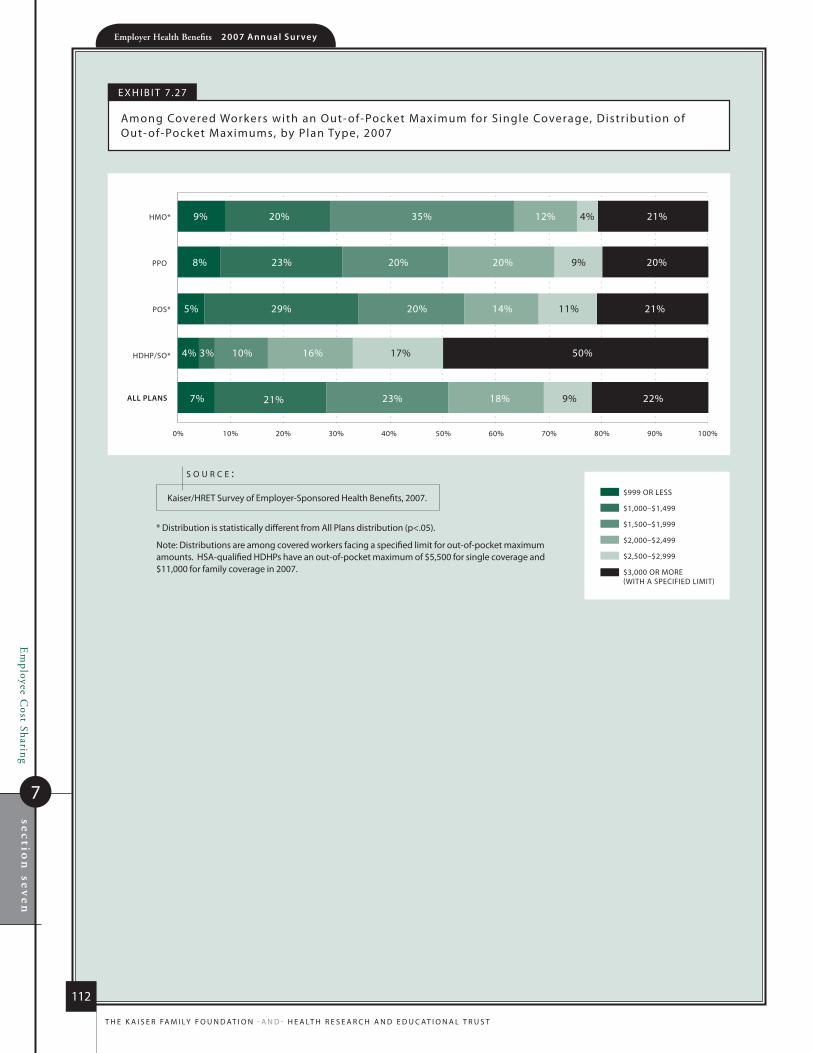
Em
ployee Cost Sharing
7sectio
n seven
Employer Health Benefits 2 0 0 7 An n u a l S u r vey
112
T h e K A i S e r FA m i ly F o u n d AT i o n - A n d - h e A lT h r e S e A r c h A n d e d u c AT i o n A l T r u S T
0% 10% 20% 30% 40% 50% 60% 70% 80% 90% 100%
$999 OR LESS
$1,000–$1,499
$1,500–$1,999
$2,000–$2,499
$2,500–$2,999
$3,000 OR MORE(WITH A SPECIFIED LIMIT)
HDHP/SO*
POS*
PPO
HMO*
ALL PLANS
4%
9%
11%
17%
9%
9% 20% 35% 12%
8% 23% 20% 20%
5% 29% 20% 14%
4% 3% 10% 16%
7% 21% 23% 18%
21%
20%
21%
50%
22%
e x h i b i T 7 .27
Among covered Workers with an out- of-Pocket maximum for S ingle coverage, distr ibution of out- of-Pocket maximums, by Plan Type, 2007
* distribution is statistically different from All Plans distribution (p<.05).
note: distributions are among covered workers facing a specified limit for out-of-pocket maximum amounts. hSA-qualified hdhPs have an out-of-pocket maximum of $5,500 for single coverage and $11,000 for family coverage in 2007.
Kaiser/hreT Survey of employer-Sponsored health benefits, 2007.
s o u r c e :

Em
ployee Cost Sharing
7
section
sevenEmployer Health Benefits 2 0 0 7 An n u a l S u r vey
113
T h e K A i S e r FA m i ly F o u n d AT i o n - A n d - h e A lT h r e S e A r c h A n d e d u c AT i o n A l T r u S T
e x h i b i T 7 .28
distr ibution of Type of out- of-Pocket maximum for covered Workers with Family coverage, by Plan Type and Firm Size, 2007*
* no statistical difference between All Small Firms and All large Firms distributions within plan type (p<.05).
‡ hSA-qualified hdhPs are required to have an annual maximum out-of-pocket liability of no more than $5,500 for single coverage and $11,000 for family coverage in 2007. When they are excluded from the calculation, the distribution of type of out-of-pocket maximum for hdhP/hrAs only is as follows: All Small Firms – not Sufficient data; All large Firms – 9% no limit, 80% Aggregate Amount, and 11% Separate Amount per Person; All Firm Sizes – 11% no limit, 82% Aggregate Amount, and 7% Separate Amount per Person.
note: The survey distinguished between plans that have a family aggregate out-of-pocket maximum that applies to spending by any covered person in the family or a separate per person out-of-pocket maximum that applies to spending by each family member or a limited number of family members. Among workers with an out-of-pocket maximum, 88% of workers in hmos have an aggregate out-of-pocket maximum, 74% in PPos have an aggregate out-of-pocket maximum, 70% in PoS plans have an aggregate out-of-pocket maximum and 77% in All Plans have an aggregate out-of-pocket maximum.
Kaiser/hreT Survey of employer-Sponsored health benefits, 2007.
s o u r c e :
no Aggregate Separate Amount limit Amount per Person
hMo
All Small Firms (3–199 Workers) 39% 58% 4%All large Firms (200 or more Workers) 42 50 8
All firM SiZeS 41% 52% 7%
PPo
All Small Firms (3–199 Workers) 23% 58% 19%All large Firms (200 or more Workers) 24 57 20
All firM SiZeS 24% 57% 20%
PoS
All Small Firms (3–199 Workers) 42% 37% 21%All large Firms (200 or more Workers) 54 36 10
All firM SiZeS 47% 37% 16%
hDhP/So‡
All Small Firms (3–199 Workers) 6% 91% 3%All large Firms (200 or more Workers) 6 83 11
All firM SiZeS 6% 86% 7%
All firMS
All Small Firms (3–199 Workers) 29% 56% 15%All large Firms (200 or more Workers) 29 55 17
All firM SiZeS 29% 55% 16%

Em
ployee Cost Sharing
7sectio
n seven
Employer Health Benefits 2 0 0 7 An n u a l S u r vey
114
T h e K A i S e r FA m i ly F o u n d AT i o n - A n d - h e A lT h r e S e A r c h A n d e d u c AT i o n A l T r u S T
$1,999 OR LESS
$2,000–$2,999
$3,000–$3,999
$4,000–$4,999
$5,000–$5,999
$6,000 OR MORE(WITH A SPECIFIED LIMIT)
POS
PPO
HMO*
ALL PLANS
HDHP/SO*
0% 10% 20% 30% 40% 50% 60% 70% 80% 90% 100%
12% 13% 38% 14% 17%
8% 17% 27% 15% 17%
11% 16% 25% 14%
5% 3% 3% 14% 53%
10% 15% 24% 15%
22%
6%
16%
22%
12%
12%
9%
24%
e x h i b i T 7 .29
Among covered Workers with an Aggregate out- of-Pocket maximum for Family coverage, distr ibution of out- of-Pocket maximums, by Plan Type, 2007
* distribution is statistically different from All Plans distribution (p<.05).
note: distributions are among covered workers facing a specified limit for out-of-pocket maximum amounts. The survey distinguished between plans that have a family aggregate out-of-pocket maximum that applies to spending by any covered person in the family or a separate per person out-of-pocket maximum that applies to spending by each family member or a limited number of family members.
Kaiser/hreT Survey of employer-Sponsored health benefits, 2007.
s o u r c e :

Em
ployee Cost Sharing
7
section
sevenEmployer Health Benefits 2 0 0 7 An n u a l S u r vey
115
T h e K A i S e r FA m i ly F o u n d AT i o n - A n d - h e A lT h r e S e A r c h A n d e d u c AT i o n A l T r u S T
$1,999 OR LESS
$2,000–$2,999
$3,000–$3,999
$4,000–$4,999
$5,000–$5,999
$6,000 OR MORE(WITH A SPECIFIED LIMIT)
POS
PPO
HMO
ALL PLANS
0% 10% 20% 30% 40% 50% 60% 70% 80% 90% 100%
1%
5%
5%
64% 21% 12% 3%
42% 28% 13% 7%
52% 18% 13% 8%
46% 26% 13% 6%
4%
9%
3%
e x h i b i T 7 .30
Among covered Workers with a Separate per Person out- of-Pocket maximum for Family coverage, distr ibution of out- of-Pocket maximums, by Plan Type, 2007*
* Tests found no statistical difference from All Plans distribution (p<.05).
note: distributions are among covered workers facing a specif ied limit for out-of-pocket maximum amounts. The survey distinguished between plans that have a family aggregate out-of-pocket maximum that applies to spending by any covered person in the family or a separate per person out-of-pocket maximum that applies to spending by each family member or a limited number of family members. distribution for out-of-pocket maximum for hdhP/So plans is not shown due to an insufficient number of observations.
Kaiser/hreT Survey of employer-Sponsored health benefits, 2007.
s o u r c e :

Em
ployee Cost Sharing
7sectio
n seven
Employer Health Benefits 2 0 0 7 An n u a l S u r vey
116
T h e K A i S e r FA m i ly F o u n d AT i o n - A n d - h e A lT h r e S e A r c h A n d e d u c AT i o n A l T r u S T
e x h i b i T 7 .31
Among covered Workers with a Separate per Person out- of-Pocket maximum for Family coverage, distr ibution of maximum number of Family members required to meet the maximum, by Plan Type, 2007
0% 10% 20% 30% 40% 50% 60% 70% 80% 90% 100%
TWO
THREE
FOUR OR MORE (WITH A SPECIFIED LIMIT)
NO LIMIT
POS*
PPO
HMO
ALL PLANS
51% 18%31%
38% 48% 1% 14%
27% 68% 3% 2%
37% 49% 1% 13%
* distribution is statistically different from All Plans distribution (p<.05).
note: The distribution for hdhP/Sos is not shown due to an insufficient number of observations. The survey distinguished between plans that have a family aggregate out-of-pocket maximum that applies to spending by any covered person in the family or a separate out-of-pocket maximum that applies to spending by each family member or a limited number of family members.
Kaiser/hreT Survey of employer-Sponsored health benefits, 2007.
s o u r c e :

78%$12,1
06
$4,4
79
Employer Health Benefits2 0 0 7 A n n u A l S u r v e y
s ect ion
High-Deductible Health Plans with Savings
Option
8
6.1%
High-D
eductible Health Plans w
ith Savings Option
8
section
eight
Employer Health Benefits 2 0 0 7 An n u a l S u r vey
118
T h e K A i S e r FA m i ly F o u n d AT i o n - A n d - h e A lT h r e S e A r c h A n d e d u c AT i o n A l T r u S T
H i g H - D e D u c t i b l e H e a l t H P l a n s w i t H s a v i n g s O P t i O n
Changes in law over the past few years have permitted the establishment of new types of savings arrangements
for health Care. the two most Common are health reimbursement arrangements (hras) and health savings
aCCounts (hsas). hras and hsas are both finanCial aCCounts that workers or other individuals Can use to
pay for health Care serviCes. these savings arrangements are often (or, in the Case of hsas, always) paired
with health plans with high deduCtibles. the survey treats high-deduCtible plans that Can be paired with a
savings option as a distinCt plan type—high-deduCtible health plan with savings option (hdhp/so)—even
if the plan would otherwise be Considered a ppo, hmo, pos or Conventional health plan. speCifiCally for
the survey, hdhp/sos are defined as (1) health plans with a deduCtible of at least $1,000 for single Coverage
and $2,000 for family Coverage1 offered with an hra (referred to as hdhp/hras); and (2) high-deduCtible
health plans that meet the federal legal requirements to permit an enrollee to establish and Contribute to an
hsa (referred to as hsa-qualified hdhps).2
ten perCent of firms offering health benefits offer an hdhp/hra, an hsa-qualified hdhp, or both in 2007.
five perCent of Covered workers are in enrolled in hdhp/sos in 2007 (exhibit 5.1). the average premiums for
single Coverage in hdhp/hras and hsa-qualified hdhps, and the average premium for family Coverage in
hsa-qualified hdhps, are lower than the overall average premiums for plans that are not hdhp/sos.
eaCh seCtion of the report inCludes information, where sample size permits, about hdhp/sos as a distinCt
plan type. in this seCtion, information is presented separately for hdhp/hras and hsa-qualified hdhps,
inCluding premiums, worker Contributions to the premiums, firm Contributions to the hras and hsas, and the
distribution of Covered workers with various deduCtibles for single and family Coverage.
1 There is no legal requirement for the minimum deductible in a plan offered with an hrA. The survey defines a high deductible plan as a plan with a deductible of at least $1,000 for single coverage and $2,000 for family coverage. Federal law requires a deductible of at least $1,100 for single coverage and $2,200 for family coverage for hSA-qualified hdhPs in 2007. See the Text Box for more information on hSA-qualified hdhPs and hdhP/hrAs.
2 The definitions of hdhP/Sos do not include other consumer-driven plan options, such as arrangements that combine an hrA with a lower-deductible health plan or arrangements in which an insurer (rather than the employer as in the case of hrAs or the enrollee as in the case of hSAs) establishes an account for each enrollee. other arrangements may be included in future surveys as the market evolves.
n o t e :
PercentAge of firmS offering HDHP/Hr As
AnD HSA-QuAlifieD HDHPs, AnD enrollment
�Ten percent of firms offering health benefits offer an HDHP/HRA, an HSA-qualified HDHP, or both in 2007 (Exhibit 8.1). This is a higher percentage than we reported for 2006 (7%), but the difference is not statistically significant. Among firms offering health benefits, 3% offer an HDHP/HRA and 7% offer an HSA-qualified HDHP (Exhibit 8.1).
Larger firms are more likely to offer an HDHP/HRA, an HSA-qualified HDHP, or both than smaller firms. For example, 18% of firms with 1,000 or more workers offer an HDHP/SO, compared to 10% of firms with 3 to 199 workers, and 13% of firms with 200 to 999 workers (Exhibit 8.2).

High-D
eductible Health Plans w
ith Savings Option
8
section
eight
Employer Health Benefits 2 0 0 7 An n u a l S u r vey
119
T h e K a i s e r Fa m i ly F o u n d aT i o n - a n d - h e a lT h r e s e a r c h a n d e d u c aT i o n a l T r u s T
Between 2006 and 2007, the percentage of firms with 200 to 999 workers offering an HDHP/SO increased from 5% to 13% (Exhibit 8.3).
�Five percent of covered workers are enrolled in HDHP/SOs in 2007, similar to the 4% enrollment reported for 2006 (Exhibit 5.1). Fewer than 3% of covered workers are enrolled in HDHP/HRAs and a similar percentage is enrolled in HSA-qualified HDHPs.
Eight percent of workers in small firms (3–199 workers) are enrolled in HDHP/SOs compared to 4% of workers in large firms (200 or more workers) (Exhibit 5.2).
D e D u c t i b l e l e v e l S A n D O u t - O f - P O c k e t
l i m i t S
�Average general annual deductibles in HDHP/SOs are relatively high (as expected) when compared to the average annual deductibles for health plans generally.
The average general annual deductible for single coverage is $1,556 in HDHP/HRAs and $1,923 in HSA-qualified HDHPs (Exhibit 8.4). However, there is variation around these averages, particularly in the case of HSA-qualified HDHPs, where 24% of covered workers are in a plan with a deductible amount between $1,100 and $1,499, and 54% of covered workers are in a plan with a deductible of $2,000 or more (Exhibit 8.6). Eighty-eight percent of workers enrolled in
Health Reimbursement Arrangements (HRAs) are medical care reimbursement plans established by employers that can be used by employees to pay for health care. HRAs are funded solely by employers. Employers typically commit to make a specified amount of money available in the HRA for premiums and medical expenses incurred by employees or their dependents. HRAs are accounting devices, and employers are not required to expend funds until an employee incurs expenses that would be covered by the HRA. Unspent funds in the HRA usually can be carried over to the next year (sometimes with a limit). Employees cannot take their HRA balances with them if they leave their job, although an employer can choose to make the remaining balance available to former employees to pay for health care.
HRAs often are offered along with a high-deductible health plan (HDHP). In such cases, the employee pays for health care first from his or her HRA and then out-of-pocket until the health plan deductible is met. Sometimes certain preventive services are paid for by the plan before the employee meets the deductible.
Health Savings Accounts (HSAs) are savings accounts created by individuals to pay for health care. An individual may establish an HSA if he or
she is covered by a “qualified health plan” which is a plan with a high deductible (i.e., a deductible of at least $1,100 for single coverage and $2,200 for family coverage in 2007) that also meets other requirements.1 Employers can encourage their employees to create HSAs by offering an HDHP that meets the federal requirements. Employers in some cases also may assist their employees by identifying HSA options, facilitating applications, or negotiating favorable fees from HSA vendors.
Both employers and employees can contribute to an HSA, up to the statutory cap of $2,850 for single coverage and $5,650 for family coverage in 2007. Employee contributions to the HSA are made on a pre-income tax basis, and some employers arrange for their employees to fund their HSAs through payroll deduction. Employers are not required to contribute to HSAs established by their employees, but if they elect to do so, their contributions are not taxable to the employee. Interest and other earnings on amounts in an HSA are not taxable. Withdrawals from the HSA by the account owner to pay for qualified health care expenses are not taxed. The savings account is owned by the individual who creates the account, so employees retain their HSA balances if they leave their job.
1 see u.s. department of the Treasury, 2007 HSA Indexed Amounts, available at http://www.ustreas.gov/offices/public-affairs/hsa/07indexedamounts.shtml.

High-D
eductible Health Plans w
ith Savings Option
8
section
eight
Employer Health Benefits 2 0 0 7 An n u a l S u r vey
120
T h e K A i S e r FA m i ly F o u n d AT i o n - A n d - h e A lT h r e S e A r c h A n d e d u c AT i o n A l T r u S T
HDHP/HRAs and 86% of workers enrolled in HSA-qualified HDHPs are in a plan that does not require the deductible to be met before the plan pays for some preventive services (Exhibit 8.9).
The 2006 survey was modified to collect additional information about family general annual deductible amounts. Since 2006, the survey asks employers whether the family deductible amount is (1) an aggregate amount (i.e., the out-of-pocket expenses of all family members are counted until the deductible is satisfied), or (2) a per-person amount that applies to each family member (typically with a limit on the number of family members that would be required to meet the deductible amount). Due to this change, the amounts reported this year for family deductibles can be compared (by deductible type) to amounts reported in 2006 but not to amounts reported prior to 2006.
Average aggregate deductibles for family coverage are $3,342 for HDHP/HRAs and $3,883 for HSA-qualified HDHPs (Exhibit 8.4). As with deductibles for single coverage, there is substantial variation among covered workers for their family coverage deductibles. Twenty-eight percent of covered workers in HSA-qualified HDHPs have aggregate family deductibles between $2,200 and $2,999, while 33% have family aggregate deductibles of $5,000 or more (Exhibit 8.8).
�HSA-qualified HDHPs are legally required to have a maximum annual out-of-pocket liability (for 2007) of $5,500 for single coverage and $11,000 for family coverage, while HDHP/HRAs have no similar requirement.
The 2006 survey questions on out-of-pocket maximum liability data were revised to collect additional information. As with deductibles, the survey asks employers whether the family out-of-pocket maximum liability is (1) an aggregate amount that applies to spending by any covered person in the family, or (2) a separate per person amount that applies to spending by each family member or a limited number of family members. The survey also asks whether spending by enrollees that counts towards meeting the plan deductible counts towards meeting the plan out-of-pocket
maximum. Because of these changes, the amounts reported this year for family out-of-pocket maximums can be compared to amounts reported in the 2006 survey but cannot be compared to amounts reported for years prior to 2006.
The average out-of-pocket maximum for covered workers in HDHP/HRAs with single coverage is $3,088, which is similar to the $3,090 average out-of-pocket maximum for covered workers in HSA-qualified HDHPs with single coverage (Exhibit 8.4).3 Among covered workers with family coverage whose out-of-pocket maximum is an aggregate amount that applies to spending by any covered person in the family, the average amounts are $6,678 for covered workers in HDHP/HRAs and $6,505 for those in HSA-qualified HDHPs (Exhibit 8.4).
PremiumS
�Average annual premiums for HDHP/HRAs are $3,894 for single coverage and $11,492 for family coverage (Exhibit 8.4). The HDHP/HRA premium amount for covered workers with single coverage is lower than the average single premium for workers in plans that are not HDHP/SOs (Exhibit 8.5).
�Average annual premiums for HSA-qualified HDHPs are $3,826 for single coverage and $9,666 for family coverage (Exhibit 8.4). These premium amounts are lower than the average single and family premiums for plans that are not HDHP/SOs (Exhibit 8.5).
Worker contributionS to PremiumS
�The average annual worker premium contributions for HDHP/HRAs are $617 for single coverage and $3,113 for family coverage (Exhibit 8.4). The differences between these amounts and the average premium contributions for plans that are not HDHP/SOs for single and family coverage are not statistically significant (Exhibit 8.5).
�The average annual worker premium contributions for HSA-qualified HDHPs are $413 for single coverage and $2,564 for family coverage (Exhibit 8.4). These premium contribution amounts are lower than the average single and family contributions paid by workers in plans that are not HDHP/SOs (Exhibit 8.5).
3 The average out-of-pocket maximum for hdhP/hrAs is calculated for plans with an out-of-pocket maximum. About 10% of covered workers in hdhP/hrAs with single coverage and 11% of covered workers in hdhP/hrAs for family coverage are in plans that reported having no limit on out-of-pocket expenses.
n o t e :

High-D
eductible Health Plans w
ith Savings Option
8
section
eight
Employer Health Benefits 2 0 0 7 An n u a l S u r vey
121
T h e K A i S e r FA m i ly F o u n d AT i o n - A n d - h e A lT h r e S e A r c h A n d e d u c AT i o n A l T r u S T
e m P l o y e r c o n t r i b u t i o n S t o P r e m i u m S A n D
S A v i n g S o P t i o n S
�Employers contribute to HDHP/SOs in two ways: through their contributions toward the premium for the health plan and through their contributions (if any in the case of HSAs) to the savings account option (i.e., the HRAs or HSAs themselves).
Looking just at annual employer contributions to the premiums for HDHP/SOs, covered workers in HDHP/HRAs on average have employer contributions of $3,277 towards the premium for single coverage and $8,379 towards the premium for family coverage (Exhibit 8.5). The average amount contributed by employers for single coverage in HDHP/HRAs is lower than average amount contributed by employers for single coverage for health plans that are not HDHP/SOs.
Covered workers in HSA-qualified HDHPs on average have employer contributions of $3,412 towards the premium for single coverage and $7,102 towards the premium for family coverage (Exhibit 8.5). The average amount contributed by employers for family coverage in HSA-qualified HDHPs is lower than average amount contributed by employers for family coverage for health plans that are not HDHP/SOs.
�On average, workers enrolled in an HDHP/HRA receive an annual employer contribution to their HRA of $915 for single coverage and $1,800 for family coverage. Workers enrolled in HSA-qualified HDHPs on average receive an employer contribution to their HSA of $428 for single coverage and $714 for family coverage (Exhibit 8.5). There are important caveats, however, for interpreting these averages.
In looking at employer contributions to HRAs, it is important to note that some HRAs are structured in such a way that employers may not actually spend the whole amount that they make available to their employees’ HRAs.4 Amounts committed to an employees’ HRA that are not used by the employee generally roll over and can be used in future years, but any balance may revert back to the employer if the employee leaves his or her job. Thus, the employer contribution amounts to HRAs that
we capture in the survey may exceed the amount that employers will actually spend.
In looking at employer contributions to HSAs, it is important to note that not all employers make contributions towards HSAs established by their employees. Almost two-thirds (66%) of employers offering single coverage through HSA-qualified HDHPs do not make contributions towards the HSAs that their workers establish (covering 47% of covered workers enrolled in HSA-qualified HDHPs for single coverage). For family coverage in HSA-qualified HDHPs, about 47% of employers offering family coverage through HSA-qualified HDHPs do not make contributions to the HSAs established by their employees (covering about 45% of workers covered by such plans).5 The averages that we show include the large portion of covered workers whose employer contribution to the HSA is zero. When those firms that do not contribute to the HSA are excluded from the calculation, the average employer contribution for covered workers is $806 for single coverage and $1,294 for family coverage.
�Employer contributions to savings account options (i.e., the HRAs and HSAs themselves) for their employees can be added to their health plan premium contributions to calculate total employer contributions toward HDHP/SOs.
For HDHP/HRAs, the average total employer contribution for covered workers is $4,192 for workers with single coverage and $10,179 for workers with family coverage (Exhibit 8.5). The average total employer contribution amount for single and family coverage in HDHP/HRAs is higher than the average amount that employers contribute towards single and family coverage in health plans that are not HDHP/SOs.
For HSA-qualified HDHPs, the average total employer contribution for covered workers is $3,840 for workers with single coverage and $7,815 for workers with family coverage (Exhibit 8.5). The average total employer contribution amount for family coverage in HSA-qualified HDHPs is lower than the average amount that employers contribute towards family coverage in health plans that are not HDHP/SOs.
4 in the survey, we ask firms, “up to what dollar amount does your firm promise to contribute each year to an employee’s hrA?” We refer to the amount that the employer commits to make available to an hrA as a contribution for ease of discussion. As discussed, hrAs are notional accounts, and employers are not required to actually transfer funds until an employee incurs expenses. Thus, employers may not expend the entire amount that they commit to make available to their employees through an hrA.
5 The differences in percentages between single and family coverage occur because some employers report offering single but not family coverage.
n o t e :
High-D
eductible Health Plans w
ith Savings Option
8
section
eight
Employer Health Benefits 2 0 0 7 An n u a l S u r vey
122
T h e K A i S e r FA m i ly F o u n d AT i o n - A n d - h e A lT h r e S e A r c h A n d e d u c AT i o n A l T r u S T
f u t u r e P l A n S
�Firms indicate some interest in offering HDHP/HRAs and HSA-qualified HDHPs in the next year.
Three percent of firms not currently offering an HDHP/HRA report that they are “very likely” to offer an HDHP/HRA in the next year, and another 21% of such firms report that they are “somewhat likely” to do so (Exhibit 8.14). Among firms not currently offering a HSA-qualified HDHP, 2% say that they are “very likely” to do so next year and another 18% say that they are “somewhat likely” to offer such a plan (Exhibit 8.15).
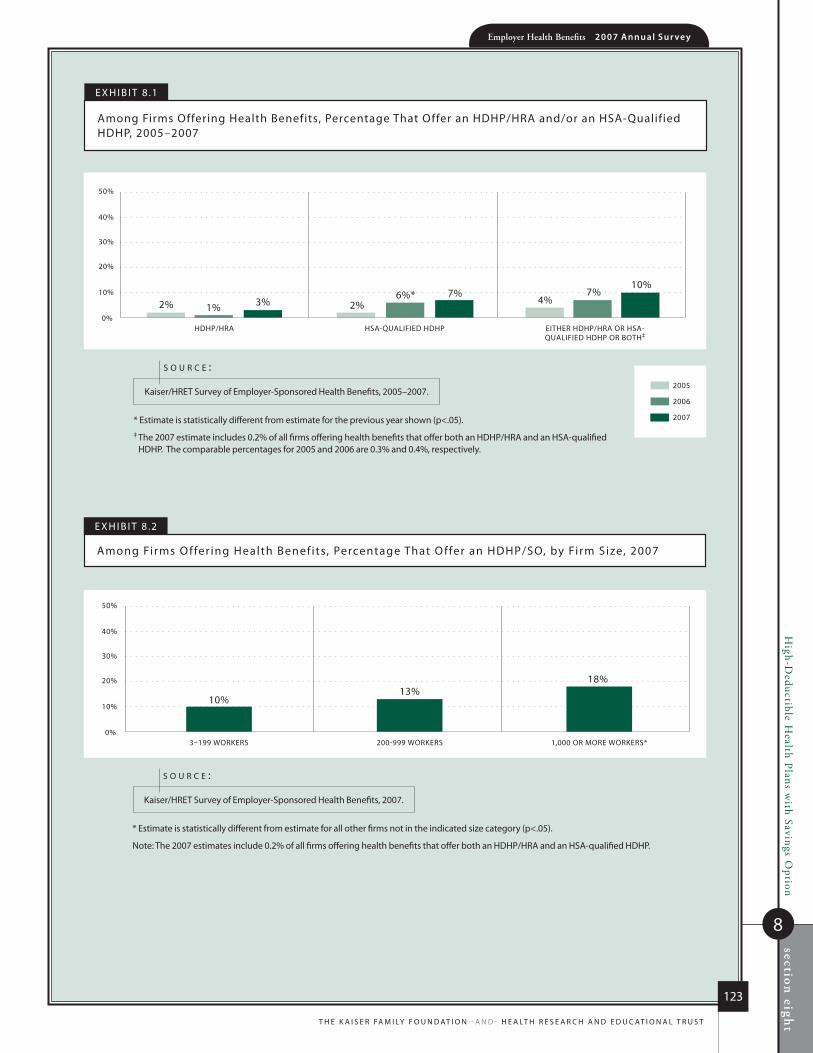
High-D
eductible Health Plans w
ith Savings Option
8
section
eight
Employer Health Benefits 2 0 0 7 An n u a l S u r vey
123
T h e K A i S e r FA m i ly F o u n d AT i o n - A n d - h e A lT h r e S e A r c h A n d e d u c AT i o n A l T r u S T
2005
2006
2007
0%
10%
20%
30%
40%
50%
HDHP/HRA HSA-QUALIFIED HDHP EITHER HDHP/HRA OR HSA-QUALIFIED HDHP OR BOTH‡
2% 1% 3% 2%6%* 7%
4%7%
10%
e x h i B i T 8 .1
Among Firms offering health Benefits, Percentage That offer an hdhP/hrA and/or an hSA-Qualified hdhP, 2005–2007
e x h i B i T 8 .2
Among Firms o ffer ing health Benef its, Percentage That o ffer an hdhP/So, by Firm Size, 2007
0%
10%
20%
30%
40%
50%
3–199 WORKERS 200-999 WORKERS 1,000 OR MORE WORKERS*
10%13%
18%
* estimate is statistically different from estimate for all other firms not in the indicated size category (p<.05).
note: The 2007 estimates include 0.2% of all firms offering health benefits that offer both an hdhP/hrA and an hSA-qualified hdhP.
Kaiser/hreT Survey of employer-Sponsored health Benefits, 2007.
s o u r C e :
* estimate is statistically different from estimate for the previous year shown (p<.05).‡ The 2007 estimate includes 0.2% of all firms offering health benefits that offer both an hdhP/hrA and an hSA-qualified
hdhP. The comparable percentages for 2005 and 2006 are 0.3% and 0.4%, respectively.
Kaiser/hreT Survey of employer-Sponsored health Benefits, 2005–2007.
s o u r C e :

High-D
eductible Health Plans w
ith Savings Option
8
section
eight
Employer Health Benefits 2 0 0 7 An n u a l S u r vey
124
T h e K A i S e r FA m i ly F o u n d AT i o n - A n d - h e A lT h r e S e A r c h A n d e d u c AT i o n A l T r u S T
e x h i B i T 8 .3
Among Firms offering health Benefits, Percentage That offer an hdhP/So, by Firm Size, 2006–2007
HDHP/HrA HSA-Qualified HDHP
Annual Plan Averages for: Single Family Single Family
Premium $3,894 $11,492 $3,826 $9,666
Worker contribution to Premium $617 $3,113 $413 $2,564
deductible‡ $1,556 $3,342 $1,923 $3,883
out-of-Pocket maximum liability‡ $3,088 $6,678 $3,090 $6,505
0%
10%
20%
30%
40%
50%
3–199 WORKERS 200-999 WORKERS 1,000 OR MORE WORKERS
10%7%
13%*
5%
18%17%
2006
2007
e x h i B i T 8 .4
hdhP/hrA and hSA- Qual i f ied hdhP Features, 2007
‡ Ten percent of workers enrolled in hdhP/hrAs have employers that reported no out-of-pocket maximum for single coverage. The similar percentage for family coverage is 11%. These workers are excluded from the hdhP/hrA out-of-pocket maximum liability calculation. The deductible and out-of-pocket maximum averages shown for both hdhP/hrAs and hSA-qualified hdhPs for family coverage are for covered workers whose firms report that they face an aggregate amount. Among covered workers in hdhP/hrAs, 14% are in plans whose family deductible is a separate per person amount. Among covered workers in hdhP/hrA with an out-of-pocket maximum, 8% report that the family amount for out-of-pocket maximum is a separate per person amount. Among covered workers in hSA-qualified hdhPs, the percentages are 8% for deductibles and 8% for out-of-pocket maximum.
note: For definitions of hdhP/hrAs and hSA-qualified hdhPs, see the introduction to Section 8.
Kaiser/hreT Survey of employer-Sponsored health Benefits, 2007.
s o u r C e :
* e stimate is statistically different from estimate for previous year shown (p<.05).
note: The 2007 estimate includes 0.2% of all firms offering health benefits that offer both an hdhP/hrA and an hSA-qualified hdhP. The comparable percentage for 2006 is 0.4%.
Kaiser/hreT Survey of employer-Sponsored health Benefits, 2006–2007.
s o u r C e :

High-D
eductible Health Plans w
ith Savings Option
8
section
eight
Employer Health Benefits 2 0 0 7 An n u a l S u r vey
125
T h e K A i S e r FA m i ly F o u n d AT i o n - A n d - h e A lT h r e S e A r c h A n d e d u c AT i o n A l T r u S T
e x h i B i T 8 .5
Average Annual Premiums and contributions to Spending Accounts For covered Workers, hdhP/hrAs, hSA-Qualified hdhPs and All other non-hdhP/So Plans, 2007
HDHP/HrA HSA-Qualified All other
HDHP non-HDHP/So Plans§
Single Family Single Family Single Family
total Annual Premium $3,894* $11,492 $3,826* $9,666* $4,514 $12,183Worker contribution to Premium $617 $3,113 $413* $2,564* $704 $3,304Firm contribution to Premium $3,277* $8,379 $3,412 $7,102* $3,810 $8,879
Annual firm contribution $915 $1,800 $428 $714 nA nA to the HrA or HSA‡
total Annual firm contribution $4,192* $10,179* $3,840 $7,815* $3,810 $8,879 (Firm Share of Premium Plus Firm contribution to hrA or hSA)
total Annual Spending (Total $4,809 $13,292* $4,254 $10,380* $4,514 $12,183 Premium Plus Firm contribution to hrA or hSA, if Applicable)
* estimate is statistically different from estimate for All other non-hdhP/So Plans (p<.05).
‡ When those firms that do not contribute to the hSA (66% for single coverage and 47% for family coverage) are excluded from the calculation, the average firm contribution to the hSA for covered workers is $806 for single coverage and $1,294 for family coverage. For hdhP/hrAs, we refer to the amount that the employer commits to make available to an hrA as a contribution for ease of discussion. hrAs are notional accounts, and employers are not required to actually transfer funds until an employee incurs expenses. Thus, employers may not expend the entire amount that they commit to make available to their employees through an hrA. As such, the employer contribution amounts to hrAs that we capture in the survey may exceed the amount that employers will actually spend.
§ in order to compare spending for hdhP/Sos to all other plans that are not hdhP/Sos, we created composite variables excluding hdhP/So data.
nA: not Applicable.
note: For definitions of hdhP/hrAs and hSA-qualified hdhPs, see the introduction to Section 8. values shown in the table may not equal the sum of their component parts. The averages presented in the table are aggregated at the firm level and then averaged, which is methodologically more appropriate than adding the averages. This is relevant for Total Annual Premium, Total Annual Firm contribution, and Total Annual Spending.
Kaiser/hreT Survey of employer-Sponsored health Benefits, 2007.
s o u r C e :
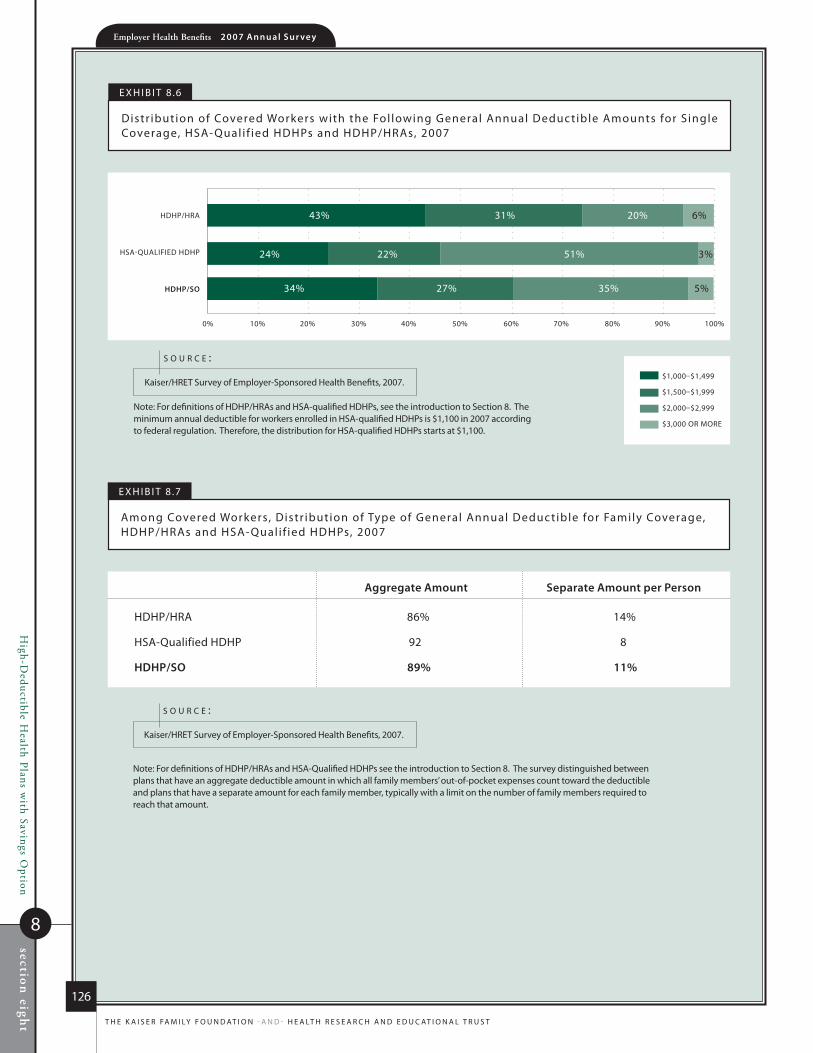
High-D
eductible Health Plans w
ith Savings Option
8
section
eight
Employer Health Benefits 2 0 0 7 An n u a l S u r vey
126
T h e K A i S e r FA m i ly F o u n d AT i o n - A n d - h e A lT h r e S e A r c h A n d e d u c AT i o n A l T r u S T
$1,000–$1,499
$1,500–$1,999
$2,000–$2,999
$3,000 OR MORE
0% 10% 20% 30% 40% 50% 60% 70% 80% 90% 100%
HSA-QUALIFIED HDHP
HDHP/HRA 43%
24%
34%
20%
27%
22% 51%
31%
35%
3%
6%
5%HDHP/SO
e x h i B i T 8 .6
distr ibution of covered Workers with the Fol lowing General Annual deduc tible Amounts for S ingle coverage, hSA- Qual i f ied hdhPs and hdhP/hrAs, 2007
e x h i B i T 8 .7
Among covered Workers, distr ibution of Type of General Annual deduc tible for Family coverage, hdhP/hrAs and hSA- Qual i f ied hdhPs, 2007
note: For definitions of hdhP/hrAs and hSA-Qualified hdhPs see the introduction to Section 8. The survey distinguished between plans that have an aggregate deductible amount in which all family members’ out-of-pocket expenses count toward the deductible and plans that have a separate amount for each family member, typically with a limit on the number of family members required to reach that amount.
Kaiser/hreT Survey of employer-Sponsored health Benefits, 2007.
s o u r C e :
Aggregate Amount Separate Amount per Person
hdhP/hrA 86% 14%
hSA-Qualified hdhP 92 8
HDHP/So 89% 11%
note: For definitions of hdhP/hrAs and hSA-qualified hdhPs, see the introduction to Section 8. The minimum annual deductible for workers enrolled in hSA-qualified hdhPs is $1,100 in 2007 according to federal regulation. Therefore, the distribution for hSA-qualified hdhPs starts at $1,100.
Kaiser/hreT Survey of employer-Sponsored health Benefits, 2007.
s o u r C e :

High-D
eductible Health Plans w
ith Savings Option
8
section
eight
Employer Health Benefits 2 0 0 7 An n u a l S u r vey
127
T h e K A i S e r FA m i ly F o u n d AT i o n - A n d - h e A lT h r e S e A r c h A n d e d u c AT i o n A l T r u S T
$2,000–$2,499
$2,500–$2,999
$3,000–$3,999
$4,000–$4,999
$5,000 OR MORE
0% 10% 20% 30% 40% 50% 60% 70% 80% 90% 100%
HSA-QUALIFIED HDHP
HDHP/HRA 23%
18%
20%
7%45%
9%
10% 14%
7%
15%30%
24% 33%
19%
26%HDHP/SO
e x h i B i T 8 .8
distribution of covered Workers with the Following Aggregate Family deductible Amounts, hdhP/hrAs and hSA-Qualified hdhPs, 2007
note: For definitions of hdhP/hrAs and hSA-qualified hdhPs, see the introduction to Section 8. The survey distinguished between family deductibles that are an aggregate amount in which all family members’ out-of-pocket expenses count toward the deductible and plans that have a separate amount for each family member, typically with a limit on the number of family members required to reach that amount. The minimum annual family deductible for workers enrolled in hSA-qualified hdhP is $2,200 in 2007 according to federal regulation. Therefore, the distribution for hSA-qualified hdhPs starts at $2,200.
Kaiser/hreT Survey of employer-Sponsored health Benefits, 2007.
s o u r C e :
e x h i B i T 8 .9
Percentage of covered Workers with Benef its Paid for by the Plan Without having to First meet the deduc tible, hdhP/hrAs and hSA- Qual i f ied hdhPs, by Benef it Type, 2007
nA: not Applicable. Both hdhP/hrAs and hSA-qualified hdhPs were asked about preventive benefits, but only hdhP/hrAs were asked about prescription drugs. hSA-qualified hdhPs are required by law to apply the plan deductible to nearly all services.
note: These questions are asked for single coverage only. We make the assumption that they apply to workers enrolled in family coverage as well. due to a difference in the structure of the questions, data for hmos, PPos, and PoS plans are presented in Section 7. For example, firms with hmos, PPos, and PoS plans are asked, “does the general annual deductible have to be met before preventive care is covered?” while firms with hdhP/Sos are asked, “Are there preventive benefits that are paid for by the plan (that is, not through the savings account) before the employee meets the deductible under the plan?”
Kaiser/hreT Survey of employer-Sponsored health Benefits, 2007.
s o u r C e :
HDHP/HrA HSA-Qualified HDHP HDHP/So
Preventive Benefits 88% 86% 87%
Prescription drugs 46% nA nA
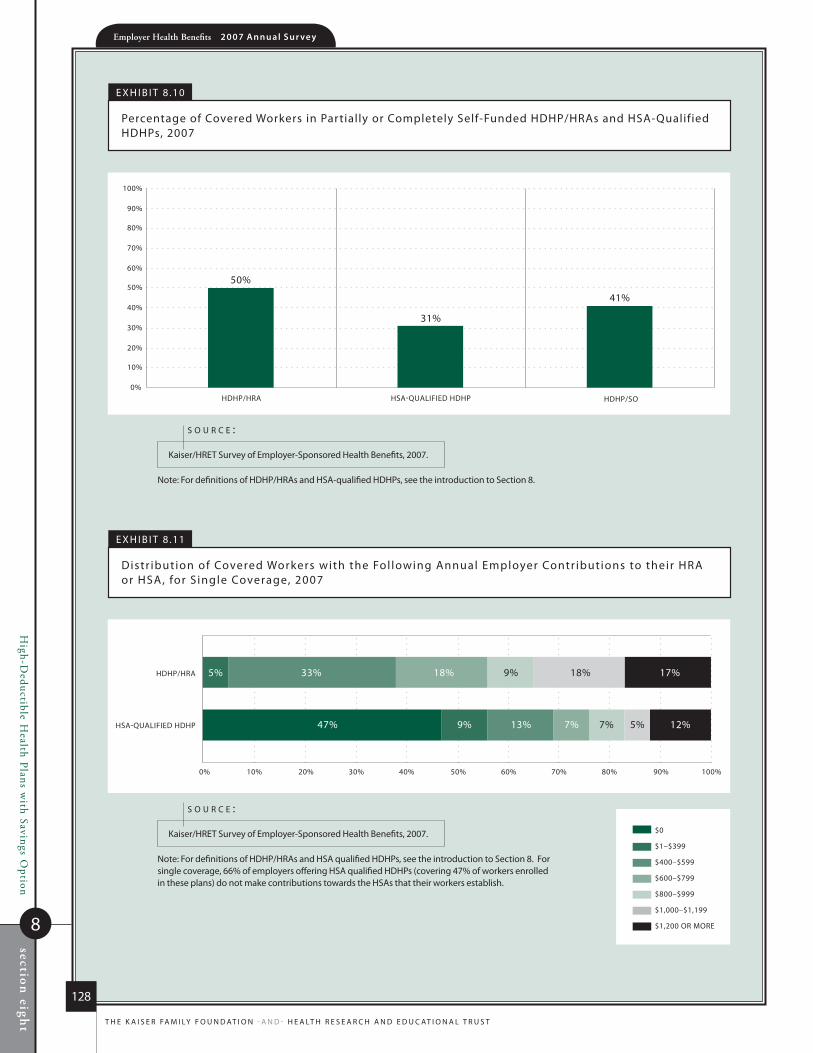
High-D
eductible Health Plans w
ith Savings Option
8
section
eight
Employer Health Benefits 2 0 0 7 An n u a l S u r vey
128
T h e K A i S e r FA m i ly F o u n d AT i o n - A n d - h e A lT h r e S e A r c h A n d e d u c AT i o n A l T r u S T
0%
10%
20%
30%
40%
50%
60%
70%
80%
90%
100%
HDHP/HRA HSA-QUALIFIED HDHP
50%
31%
41%
HDHP/SO
e x h i B i T 8 .10
Percentage of covered Workers in Partially or completely Self-Funded hdhP/hrAs and hSA-Qualified hdhPs, 2007
$0
$1–$399
$400–$599
$600–$799
$800–$999
$1,000–$1,199
$1,200 OR MORE
0% 10% 20% 30% 40% 50% 60% 70% 80% 90% 100%
HSA-QUALIFIED HDHP
HDHP/HRA 17%18%
5%7% 12%
5% 18% 9%33%
47% 13%9% 7%
e x h i B i T 8 .11
distr ibution of covered Workers with the Fol lowing Annual employer contr ibutions to their hrA or hSA, for S ingle coverage, 2007
note: For definitions of hdhP/hrAs and hSA qualified hdhPs, see the introduction to Section 8. For single coverage, 66% of employers offering hSA qualified hdhPs (covering 47% of workers enrolled in these plans) do not make contributions towards the hSAs that their workers establish.
Kaiser/hreT Survey of employer-Sponsored health Benefits, 2007.
s o u r C e :
note: For definitions of hdhP/hrAs and hSA-qualified hdhPs, see the introduction to Section 8.
Kaiser/hreT Survey of employer-Sponsored health Benefits, 2007.
s o u r C e :

High-D
eductible Health Plans w
ith Savings Option
8
section
eight
Employer Health Benefits 2 0 0 7 An n u a l S u r vey
129
T h e K A i S e r FA m i ly F o u n d AT i o n - A n d - h e A lT h r e S e A r c h A n d e d u c AT i o n A l T r u S T
$0
$1–$999
$1,000–$1,499
$1,500–$1,999
$2,000–$2,499
$2,500–$2,999
$3,000 OR MORE
0% 10% 20% 30% 40% 50% 60% 70% 80% 90% 100%
HSA-QUALIFIED HDHP
HDHP/HRA 8% 26% 21%31%
45% 17%27% 3%
12%
2%
5%
2%
1%
e x h i B i T 8 .12
distr ibution of covered Workers with the Fol lowing Annual employer contr ibutions to their hrA or hSA, for Family coverage, 2007
note: For definitions of hdhP/hrAs and hSA qualified hdhPs, see the introduction to Section 8. For family coverage, 47% of employers offering hSA qualified hdhPs (covering 45% of workers enrolled in these plans) do not make contributions towards the hSAs that their workers establish.
Kaiser/hreT Survey of employer-Sponsored health Benefits, 2007.
s o u r C e :
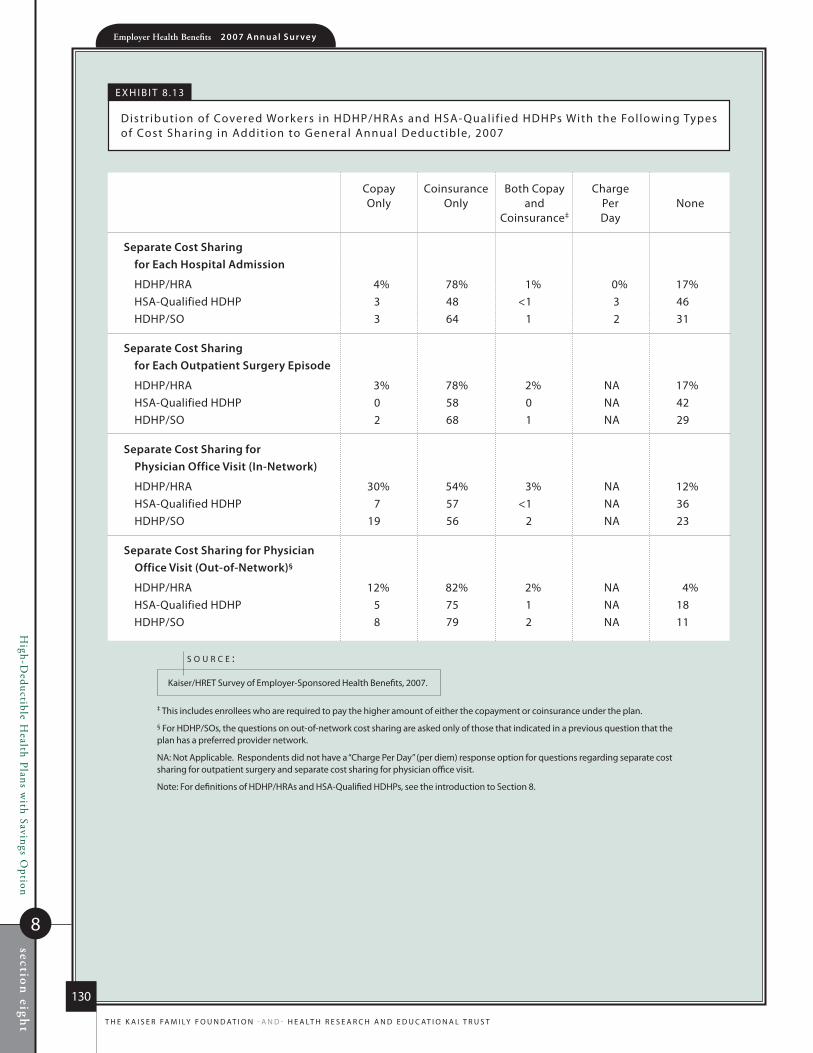
High-D
eductible Health Plans w
ith Savings Option
8
section
eight
Employer Health Benefits 2 0 0 7 An n u a l S u r vey
130
T h e K A i S e r FA m i ly F o u n d AT i o n - A n d - h e A lT h r e S e A r c h A n d e d u c AT i o n A l T r u S T
e x h i B i T 8 .13
distr ibution of covered Workers in hdhP/hrAs and hSA- Qual i f ied hdhPs With the Fol lowing Types of cost Shar ing in Addit ion to General Annual deduc tible, 2007
copay coinsurance Both copay charge only only and Per none coinsurance‡ day
Separate cost Sharing for each Hospital Admission
hdhP/hrA 4% 78% 1% 0% 17%hSA-Qualified hdhP 3 48 <1 3 46hdhP/So 3 64 1 2 31
Separate cost Sharing for each outpatient Surgery episode
hdhP/hrA 3% 78% 2% nA 17%hSA-Qualified hdhP 0 58 0 nA 42hdhP/So 2 68 1 nA 29
Separate cost Sharing for Physician office visit (in-network)
hdhP/hrA 30% 54% 3% nA 12%hSA-Qualified hdhP 7 57 <1 nA 36hdhP/So 19 56 2 nA 23
Separate cost Sharing for Physician office visit (out-of-network)§
hdhP/hrA 12% 82% 2% nA 4%hSA-Qualified hdhP 5 75 1 nA 18hdhP/So 8 79 2 nA 11
‡ This includes enrollees who are required to pay the higher amount of either the copayment or coinsurance under the plan.
§ For hdhP/Sos, the questions on out-of-network cost sharing are asked only of those that indicated in a previous question that the plan has a preferred provider network.
nA: not Applicable. respondents did not have a “charge Per day” (per diem) response option for questions regarding separate cost sharing for outpatient surgery and separate cost sharing for physician office visit.
note: For definitions of hdhP/hrAs and hSA-Qualified hdhPs, see the introduction to Section 8.
Kaiser/hreT Survey of employer-Sponsored health Benefits, 2007.
s o u r C e :

High-D
eductible Health Plans w
ith Savings Option
8
section
eight
Employer Health Benefits 2 0 0 7 An n u a l S u r vey
131
T h e K A i S e r FA m i ly F o u n d AT i o n - A n d - h e A lT h r e S e A r c h A n d e d u c AT i o n A l T r u S T
SOMEWHAT LIKELY
VERY LIKELY
0%
10%
20%
30%
40%
50%
2005 20072006 2005 20072006 2005 20072006 2005 20072006 2005 200720063–199
WORKERS200–999
WORKERS1,000–4,999
WORKERS5,000 OR MORE
WORKERS ALL FIRMS
22% 18% 21%
20%21%
21%
28%16% 21% 21%
21%
20%22% 18%
21%
3%5%
3%6% 7%
3% 5%
10%7% 7%
10%6% 4%
6%3%
e x h i B i T 8 .14
Among Firms not currently o ffer ing an hdhP/hrA, Percentage That Say They Are “ ver y l ikely ” or “Somewhat l ikely ” to o ffer an hdhP/hrA in the nex t year, 2005–2007*
* Tests found no statistical difference from estimates for previous year shown (p<.05).
note: For definitions of hdhP/hrAs and hSA qualified hdhPs, see the introduction to Section 8. in 2007, less than one percent of firms not currently offering an hdhP/hrA reported “don’t Know” to whether they would offer one in the next year. in 2006, 1.4% reported “don’t Know” and in 2005, 2.5% of firms reported “don’t Know.”
Kaiser/hreT Survey of employer-Sponsored health Benefits, 2005–2007.
s o u r C e :

High-D
eductible Health Plans w
ith Savings Option
8
section
eight
Employer Health Benefits 2 0 0 7 An n u a l S u r vey
132
T h e K A i S e r FA m i ly F o u n d AT i o n - A n d - h e A lT h r e S e A r c h A n d e d u c AT i o n A l T r u S T
SOMEWHAT LIKELY
VERY LIKELY
0%
10%
20%
30%
40%
50%
2005 20072006 2005 20072006 2005 20072006 2005 20072006 2005 200720063–199
WORKERS200–999
WORKERS1,000–4,999
WORKERS5,000 OR MORE
WORKERS ALL FIRMS
25%18%
18%
23%23%
23%
32%
23% 22%
25%19%
22%
25%19%
18%
2%4%
1%6% 7%
4%8% 8% 8%
10% 11%8%
2%4%
2%
e x h i B i T 8 .15
Among Firms not currently o ffer ing an hSA- Qual i f ied hdhP, Percentage That Say They Are “ ver y l ikely ” or “Somewhat l ikely ” to o ffer an hSA- Qual i f ied hdhP in the nex t year, 2005–2007*
*Tests found no statistical difference from estimates for previous year shown (p<.05).
note: For definitions of hdhP/hrAs and hSA-qualified hdhPs, see the introduction to Section 8. in 2007, 3% of firms not currently offering an hSA-qualified hdhP reported “don’t Know” to whether they would offer one in the next year. in 2006, 2.8% reported “don’t Know” and in 2005, 2% reported “don’t Know.”
Kaiser/hreT Survey of employer-Sponsored health Benefits, 2005–2007.
s o u r C e :
78%$12,1
06
$4,4
79
Employer Health Benefits2 0 0 7 A n n u A l S u r v e y
s ect ion
Prescription Drug Benefits
9
6.1%
Employer Health Benefits 2 0 0 7 An n u a l S u r vey
section
nin
ePrescription D
rug Benefits
9
134
T h e K A i S e r FA m i ly F o u n d AT i o n - A n d - h e A lT h r e S e A r c h A n d e d u c AT i o n A l T r u S T
P r e s c r i P t i o n D r u g B e n e f i t s
Virtually all coVered workers haVe prescription drug benefits. about three in four coVered workers are
in plans with a three-tier or four-tier cost-sharing arrangement for prescription drugs. the aVerage
copayment amounts in these plans haVe risen steadily oVer the past few years.
this year we changed the way in which we calculate estimates related to prescription drug cost sharing.
in preVious years, the Values reported for those with the same cost sharing regardless of the type of drug
were used in calculating the preferred and nonpreferred drug aVerage copays and coinsurance. similarly,
for those reporting a two-tier cost sharing structure, we applied the second-tier information to the
nonpreferred drug copays and coinsurance. for the first time this year, we present cost sharing for
prescription drugs by tier leVel. for example, aVerage copayments are presented separately for those that
report three or four-tier cost sharing, two-tier cost sharing, or the same cost sharing regardless of type
of drug. we haVe applied the new methods to data from prior years to show the change oVer time.
As in prior years, nearly all (98%) covered workers in employer-sponsored plans have a prescription drug benefit.
A majority of covered workers (91%) in 2007 have some sort of tiered cost-sharing formula for prescription drugs (Exhibit 9.1). Cost-sharing tiers generally are associated with the placement by a health plan of a drug on a formulary or preferred drug list. The formulary or drug list generally classifies drugs as a generic, a preferred brand-name, or a nonpreferred brand-name drug. More recently, a few plans have created a fourth tier of cost sharing, which is used in some cases for lifestyle drugs or expensive biologics.1
Seventy-five percent of covered workers are enrolled in plans with three or four tiers of cost sharing for prescription drugs, a similar percentage to last year (74%) (Exhibit 9.1).
HDHP/SOs have different cost-sharing patterns for prescription drugs than other plan types. Only 45% of covered workers in HDHP/SOs are in a plan with three or four tiers of cost sharing for prescription drugs, compared with 75% of covered workers overall. Twenty-eight percent of
1 See Text Box for descriptions of drug types.
n o t e :
covered workers in HDHP/SOs are in plans that apply the same cost-sharing structure regardless of the type of drug, and an additional 15% are in plans that pay 100% of prescription costs once the plan deductible is met (Exhibit 9.2).
Among workers covered by plans with three or four tiers of cost sharing for prescription drugs, a large majority face copayments rather than coinsurance when they use generic, preferred, and nonpreferred drugs (Exhibit 9.3). The percentages differ slightly across drug types because some plans have copayments for some drug types and coinsurance for other drug types.
For covered workers in plans with three or four tiers of cost sharing for prescription drugs, the average drug copayments for generic ($11), preferred ($25), and nonpreferred ($43) drugs are the same amounts as last year (Exhibit 9.4).
For covered workers in plans with three or four tiers of cost sharing for prescription drugs who face coinsurance rather than copayments, coinsurance levels average 21% for generic drugs, 26% for preferred drugs, and 40% for nonpreferred drugs (Exhibit 9.5).
Employer Health Benefits 2 0 0 7 An n u a l S u r veysectio
n n
ine
9
Prescription Drug B
enefits
135
T h e K A i S e r FA m i ly F o u n d AT i o n - A n d - h e A lT h r e S e A r c h A n d e d u c AT i o n A l T r u S T
Seven percent of covered workers are in a plan that has a fourth tier of cost sharing for prescription drugs (Exhibit 9.1). Some plans use these fourth tiers for lifestyle drugs or specialty drugs such as biologics. For covered workers in plans with four cost-sharing tiers, 42% face a copayment for fourth-tier drugs and 38% face coinsurance (Exhibit 9.3).
The average copayment for fourth-tier drugs is $71 (Exhibit 9.4). The average coinsurance amount for fourth-tier drugs is 36% (Exhibit 9.5).
Sixteen percent of covered workers are in a plan that has two tiers for prescription drug cost sharing (Exhibit 9.1). Of those with two-tier cost sharing, 78% have copayments for the first tier (generic drugs) and 68% have copayments for the second tier (preferred drugs) (Exhibit 9.6). The average copayment for the first tier is $10, while the average copayment for the second tier is $23 (Exhibit 9.7).
Six percent of covered workers are covered by plans in which cost sharing is the same regardless of the type of drug chosen (Exhibit 9.1). Among these covered workers, 55% are in plans that apply copayments and 42% are in plans that apply coinsurance (Exhibit 9.9). These percentages vary by plan type. The vast majority of covered workers in HDHP/SOs with this type of cost sharing face coinsurance rather than copayments (94% vs. 6%) when filling prescriptions.
For those workers with the same cost sharing regardless of the type of drug, the average copayment is $13 (Exhibit 9.10) and the average coinsurance is 22% (Exhibit 9.11).
About 11% of covered workers with drug coverage face a separate drug deductible, in addition to any general annual deductible the plan may have. There were no statistically significant increases or decreases from the levels reported in 2005, the last time the question was asked (Exhibit 9.12).
For the first time this year, the survey asked about a separate out-of-pocket maximum for prescription drugs. A small percentage (8%) of covered workers have a separate annual out-of-pocket maximum that applies to prescription drugs (Exhibit 9.13). The variation between plan types is not statistically significant.
Generic drugs: A drug product that is no longer covered by patent protection and thus may be produced and/or distributed by multiple drug companies.
Preferred drugs: Drugs included on a formulary or preferred drug list; for example, a brand-name drug without a generic substitute.
Nonpreferred drugs: Drugs not included on a formulary or preferred drug list; for example, a brand-name drug with a generic substitute.
Fourth-tier drugs: New types of cost-sharing arrangements that typically build additional layers of higher copayments or coinsurance for specifically identified types of drugs, such as lifestyle drugs or biologics.
Brand-name drugs: Generally, a drug product that is covered by a patent and is thus manufactured and sold exclusively by one firm. Cross-licensing occasionally occurs, allowing an additional firm to market the drug. After the patent expires, multiple firms can produce the drug product, but the brand name or trademark remains with the original manufacturer’s product.
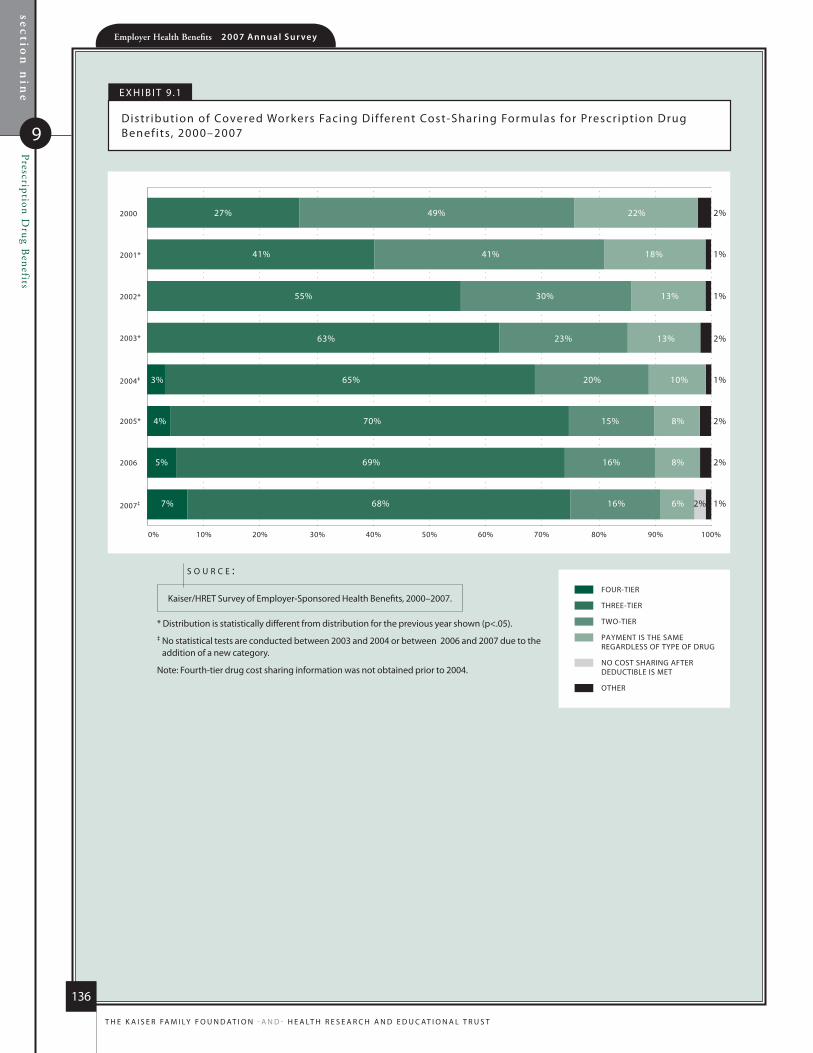
section
nin
ePrescription D
rug Benefits
9
Employer Health Benefits 2 0 0 7 An n u a l S u r vey
136
T h e K A i S e r FA m i ly F o u n d AT i o n - A n d - h e A lT h r e S e A r c h A n d e d u c AT i o n A l T r u S T
FOUR-TIER
THREE-TIER
TWO-TIER
PAYMENT IS THE SAME REGARDLESS OF TYPE OF DRUG
NO COST SHARING AFTER DEDUCTIBLE IS MET
OTHER
0% 10% 20% 30% 40% 50% 60% 70% 80% 90% 100%
2000
2001*
2002*
2003*
2004‡
2005*
2006
2007‡
27%
41%
55%
63%
30%
23%
13%
13%
65%
70%
69%
68%
20%
15%
16%
16%
10%
8%
8%
6%
3%
4%
5%
7%
41% 18%
49% 22%
1%
2%
1%
2%
2%
2% 1%
1%
2%
e x h i B i T 9 .1
distr ibution of covered Workers Facing dif ferent cost-Shar ing Formulas for Prescr ipt ion drug Benef its, 2000–2007
Kaiser/hreT Survey of employer-Sponsored health Benefits, 2000–2007.
s o u r c e :
* distribution is statistically different from distribution for the previous year shown (p<.05). ‡ no statistical tests are conducted between 2003 and 2004 or between 2006 and 2007 due to the
addition of a new category.
note: Fourth-tier drug cost sharing information was not obtained prior to 2004.

section
nin
e
9
Prescription Drug B
enefitsEmployer Health Benefits 2 0 0 7 An n u a l S u r vey
137
T h e K A i S e r FA m i ly F o u n d AT i o n - A n d - h e A lT h r e S e A r c h A n d e d u c AT i o n A l T r u S T
0% 10% 20% 30% 40% 50% 60% 70% 80% 90% 100%
FOUR-TIER
THREE-TIER
TWO-TIER
PAYMENT IS THE SAME REGARDLESS OF TYPE OF DRUG
NO COST SHARING AFTER DEDUCTIBLE IS MET
OTHER
1%
2%
1%
1%
1%
POS*
PPO
HMO*
ALL PLANS
HDHP/SO*
6%
7%
5%
8%
7%
64%
70%
76%
37%
68%
22%
14%
10%
16%
6%
1%
4%
1%
1%
15%
2%
15%
3%
28%
6%
e x h i B i T 9 .2
distr ibution of covered Workers Facing dif ferent cost-Shar ing Formulas for Prescr ipt ion drug Benef its, by Plan Type, 2007
* distribution is statistically different from All Plans distribution (p<.05).
Kaiser/hreT Survey of employer-Sponsored health Benefits, 2007.
s o u r c e :
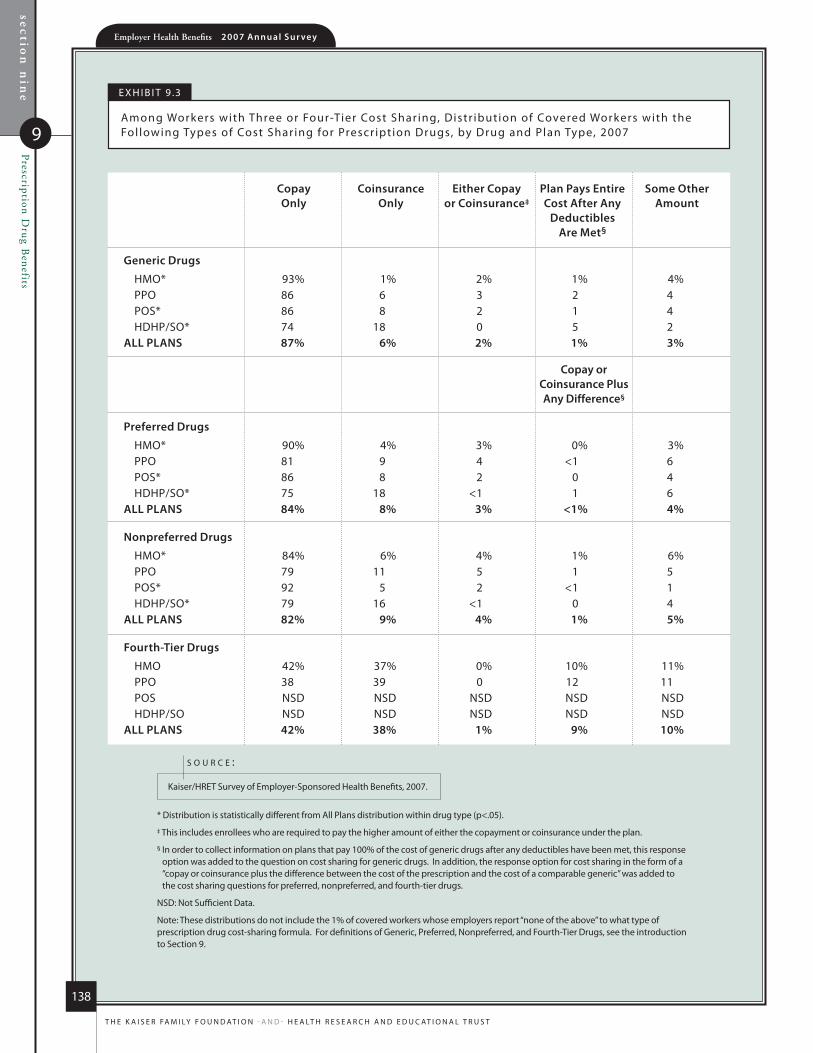
section
nin
ePrescription D
rug Benefits
9
Employer Health Benefits 2 0 0 7 An n u a l S u r vey
138
T h e K A i S e r FA m i ly F o u n d AT i o n - A n d - h e A lT h r e S e A r c h A n d e d u c AT i o n A l T r u S T
e x h i B i T 9 .3
Among Workers with Three or Four-Tier cost Shar ing, distr ibution of covered Workers with the Fol lowing Types of cost Shar ing for Prescr ipt ion drugs, by drug and Plan Type, 2007
Copay Coinsurance Either Copay Plan Pays Entire Some Other Only Only or Coinsurance‡ Cost After Any Amount Deductibles Are Met§
Generic Drugs
hmo* 93% 1% 2% 1% 4%PPo 86 6 3 2 4PoS* 86 8 2 1 4hdhP/So* 74 18 0 5 2
ALL PLANS 87% 6% 2% 1% 3%
Copay or Coinsurance Plus Any Difference§
Preferred Drugs
hmo* 90% 4% 3% 0% 3%PPo 81 9 4 <1 6PoS* 86 8 2 0 4hdhP/So* 75 18 <1 1 6
ALL PLANS 84% 8% 3% <1% 4%
Nonpreferred Drugs
hmo* 84% 6% 4% 1% 6%PPo 79 11 5 1 5PoS* 92 5 2 <1 1hdhP/So* 79 16 <1 0 4
ALL PLANS 82% 9% 4% 1% 5%
Fourth-Tier Drugs
hmo 42% 37% 0% 10% 11%PPo 38 39 0 12 11PoS nSd nSd nSd nSd nSdhdhP/So nSd nSd nSd nSd nSd
ALL PLANS 42% 38% 1% 9% 10%
* distribution is statistically different from All Plans distribution within drug type (p<.05).
‡ This includes enrollees who are required to pay the higher amount of either the copayment or coinsurance under the plan.
§ in order to collect information on plans that pay 100% of the cost of generic drugs after any deductibles have been met, this response option was added to the question on cost sharing for generic drugs. in addition, the response option for cost sharing in the form of a “copay or coinsurance plus the difference between the cost of the prescription and the cost of a comparable generic” was added to the cost sharing questions for preferred, nonpreferred, and fourth-tier drugs.
nSd: not Sufficient data.
note: These distributions do not include the 1% of covered workers whose employers report “none of the above” to what type of prescription drug cost-sharing formula. For definitions of Generic, Preferred, nonpreferred, and Fourth-Tier drugs, see the introduction to Section 9.
Kaiser/hreT Survey of employer-Sponsored health Benefits, 2007.
s o u r c e :

section
nin
e
9
Prescription Drug B
enefitsEmployer Health Benefits 2 0 0 7 An n u a l S u r vey
139
T h e K A i S e r FA m i ly F o u n d AT i o n - A n d - h e A lT h r e S e A r c h A n d e d u c AT i o n A l T r u S T
2004
2005
2006
2007
2000
2001
2002
2003
GENERIC PREFERRED NONPREFERRED FOURTH-TIER$0
$10
$20
$30
$40
$50
$60
$70
$80
$15 $16*$18*$20*$22*$23*$25* $25
$59
^^^^
$74
$59
$71*
$8 $8 $9 $9* $10* $10 $11* $11
$29 $28$32*
$35*$38*$40*
$43* $43
e x h i B i T 9 .4
Among covered Workers with Three or Four-Tier Prescr ipt ion drug cost Shar ing, Average copayments, 2000–2007
* estimate is statistically different from estimate for the previous year shown (p<.05).
^ Fourth-tier drug copayment information was not obtained prior to 2004.
Kaiser/hreT Survey of employer-Sponsored health Benefits, 2000−2007.
s o u r c e :
2004
2005
2006
2007
2000
2001
2002
2003
GENERIC PREFERRED NONPREFERRED FOURTH-TIER0%
10%
20%
30%
40%
50%
23% 24% 23%25%
27% 26% 26%
30%
43%*42%
36%
18% 18% 18% 18% 18% 19% 19%21%
28%
33%
40%
34%*34%
38% 38%40%
^^^^^
e x h i B i T 9 .5
Among covered Workers with Three or Four-Tier Prescription drug cost Sharing, Average coinsurance, 2000–2007
* estimate is statistically different from estimate for the previous year shown (p<.05).
^ Fourth-tier drug copayment information was not obtained prior to 2004. There is insufficient data to report the average coinsurance amount for 2000.
Kaiser/hreT Survey of employer-Sponsored health Benefits, 2000−2007.
s o u r c e :
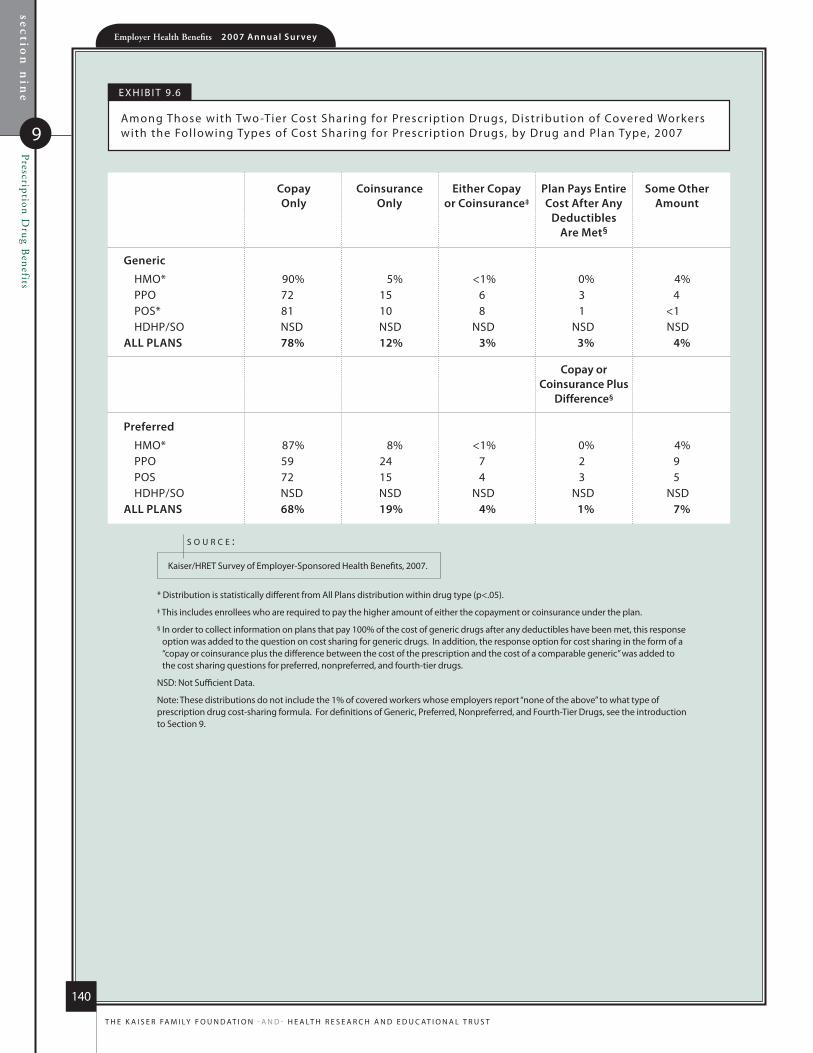
section
nin
ePrescription D
rug Benefits
9
Employer Health Benefits 2 0 0 7 An n u a l S u r vey
140
T h e K A i S e r FA m i ly F o u n d AT i o n - A n d - h e A lT h r e S e A r c h A n d e d u c AT i o n A l T r u S T
e x h i B i T 9 .6
Among Those with Two -Tier cost Shar ing for Prescr ipt ion drugs, distr ibution of covered Workers with the Fol lowing Types of cost Shar ing for Prescr ipt ion drugs, by drug and Plan Type, 2007
* distribution is statistically different from All Plans distribution within drug type (p<.05).
‡ This includes enrollees who are required to pay the higher amount of either the copayment or coinsurance under the plan.
§ in order to collect information on plans that pay 100% of the cost of generic drugs after any deductibles have been met, this response option was added to the question on cost sharing for generic drugs. in addition, the response option for cost sharing in the form of a “copay or coinsurance plus the difference between the cost of the prescription and the cost of a comparable generic” was added to the cost sharing questions for preferred, nonpreferred, and fourth-tier drugs.
nSd: not Sufficient data.
note: These distributions do not include the 1% of covered workers whose employers report “none of the above” to what type of prescription drug cost-sharing formula. For definitions of Generic, Preferred, nonpreferred, and Fourth-Tier drugs, see the introduction to Section 9.
Kaiser/hreT Survey of employer-Sponsored health Benefits, 2007.
s o u r c e :
Copay Coinsurance Either Copay Plan Pays Entire Some Other Only Only or Coinsurance‡ Cost After Any Amount Deductibles Are Met§
Generic
hmo* 90% 5% <1% 0% 4%PPo 72 15 6 3 4PoS* 81 10 8 1 <1hdhP/So nSd nSd nSd nSd nSd
ALL PLANS 78% 12% 3% 3% 4%
Copay or Coinsurance Plus Difference§
Preferred
hmo* 87% 8% <1% 0% 4%PPo 59 24 7 2 9PoS 72 15 4 3 5hdhP/So nSd nSd nSd nSd nSd
ALL PLANS 68% 19% 4% 1% 7%

section
nin
e
9
Prescription Drug B
enefitsEmployer Health Benefits 2 0 0 7 An n u a l S u r vey
141
T h e K A i S e r FA m i ly F o u n d AT i o n - A n d - h e A lT h r e S e A r c h A n d e d u c AT i o n A l T r u S T
2004
2005
2006
2007
2000
2001
2002
2003
19%17%
20% 21%17% 16%
22% 21%
GENERIC PREFERRED0%
10%
20%
30%
40%
50%
28%25% 25%
28%25% 24%
27% 28%
2004
2005
2006
2007
2000
2001
2002
2003
$7 $8* $9* $9 $10 $10 $11 $10
GENERIC PREFERRED$0
$10
$20
$30
$40
$50
$14 $15*$18*
$20*$22* $22 $23 $23
e x h i B i T 9 .7
Among covered Workers with Two -Tier Prescr ipt ion drug cost Shar ing, Average copayments, 2000–2007
* estimate is statistically different from estimate for the previous year shown (p<.05).
Kaiser/hreT Survey of employer-Sponsored health Benefits, 2000–2007.
s o u r c e :
e x h i B i T 9 .8
Among covered Workers with Two -Tier Prescr ipt ion drug cost Shar ing, Average coinsurance, 2000–2007*
* Tests found no statistical differences from estimate for previous year shown (p<.05).
Kaiser/hreT Survey of employer-Sponsored health Benefits, 2000–2007.
s o u r c e :

section
nin
ePrescription D
rug Benefits
9
Employer Health Benefits 2 0 0 7 An n u a l S u r vey
142
T h e K A i S e r FA m i ly F o u n d AT i o n - A n d - h e A lT h r e S e A r c h A n d e d u c AT i o n A l T r u S T
$8 $10* $10 $10
$14*$10*
$13* $13
$0
$10
$20
$30
$40
$50
2000 2001 2002 2003 2004 2005 2006 2007
e x h i B i T 9 .9
Among Workers with Same cost Shar ing regardless of Type of drug, distr ibution of covered Workers with the Fol lowing Types of cost Shar ing for Prescr ipt ion drugs, by Plan Type, 2007
* distribution is statistically different from All Plans distribution within drug type (p<.05).
‡ This includes enrollees who are required to pay the higher amount of either the copayment or coinsurance under the plan.
nSd: not Sufficient data.
note: These distributions do not include the 1% of covered workers whose employers report “none of the above” to what type of prescription drug cost sharing formula. For definitions of Generic, Preferred, nonpreferred, and Fourth-Tier drugs, see the introduction to Section 9. Figure does not include 2% (for All Plans) of workers in firms that responded that cost sharing is the same regardless of drug type and then reported no cost sharing after deductibles are met.
Kaiser/hreT Survey of employer-Sponsored health Benefits, 2007.
s o u r c e :
copay coinsurance either copay Plan Pays entire Some other only only or coinsurance‡ cost After Any Amount deductibles Are met
hmo* 96% 3% 1% 0% 0%
PPo 51 43 3 0 3
PoS nSd nSd nSd nSd nSd
hdhP/So* 6 94 0 0 0
ALL PLANS 55% 42% 1% 0% 2%
e x h i B i T 9 .10
Among covered Workers with Same cost Shar ing regardless of Type of drug, Average copayments, 2000–2007
* estimate is statistically different from estimate for the previous year shown (p<.05).
Kaiser/hreT Survey of employer-Sponsored health Benefits, 2000−2007.
s o u r c e :
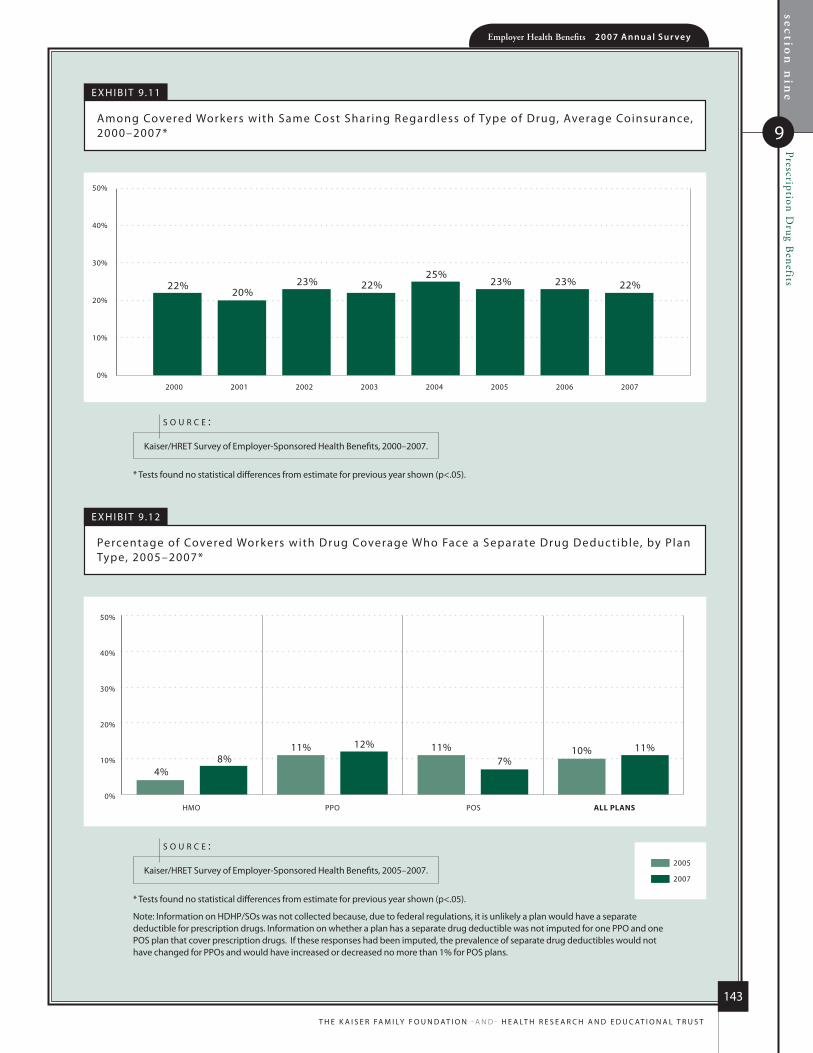
section
nin
e
9
Prescription Drug B
enefitsEmployer Health Benefits 2 0 0 7 An n u a l S u r vey
143
T h e K A i S e r FA m i ly F o u n d AT i o n - A n d - h e A lT h r e S e A r c h A n d e d u c AT i o n A l T r u S T
HMO PPO ALL PLANSPOS
2005
2007
0%
10%
20%
30%
40%
50%
4%8%
11% 12% 11%7%
10% 11%
22%20%
23% 22%25%
23% 23% 22%
0%
10%
20%
30%
40%
50%
2000 2001 2002 2003 2004 2005 2006 2007
e x h i B i T 9 .11
Among covered Workers with Same cost Shar ing regardless of Type of drug, Average coinsurance, 2000–2007*
* Tests found no statistical differences from estimate for previous year shown (p<.05).
Kaiser/hreT Survey of employer-Sponsored health Benefits, 2000–2007.
s o u r c e :
e x h i B i T 9 .12
Percentage of covered Workers with drug coverage Who Face a Separate drug deduc tible, by Plan Type, 2005–2007*
* Tests found no statistical differences from estimate for previous year shown (p<.05).
note: information on hdhP/Sos was not collected because, due to federal regulations, it is unlikely a plan would have a separate deductible for prescription drugs. information on whether a plan has a separate drug deductible was not imputed for one PPo and one PoS plan that cover prescription drugs. if these responses had been imputed, the prevalence of separate drug deductibles would not have changed for PPos and would have increased or decreased no more than 1% for PoS plans.
Kaiser/hreT Survey of employer-Sponsored health Benefits, 2005–2007.
s o u r c e :
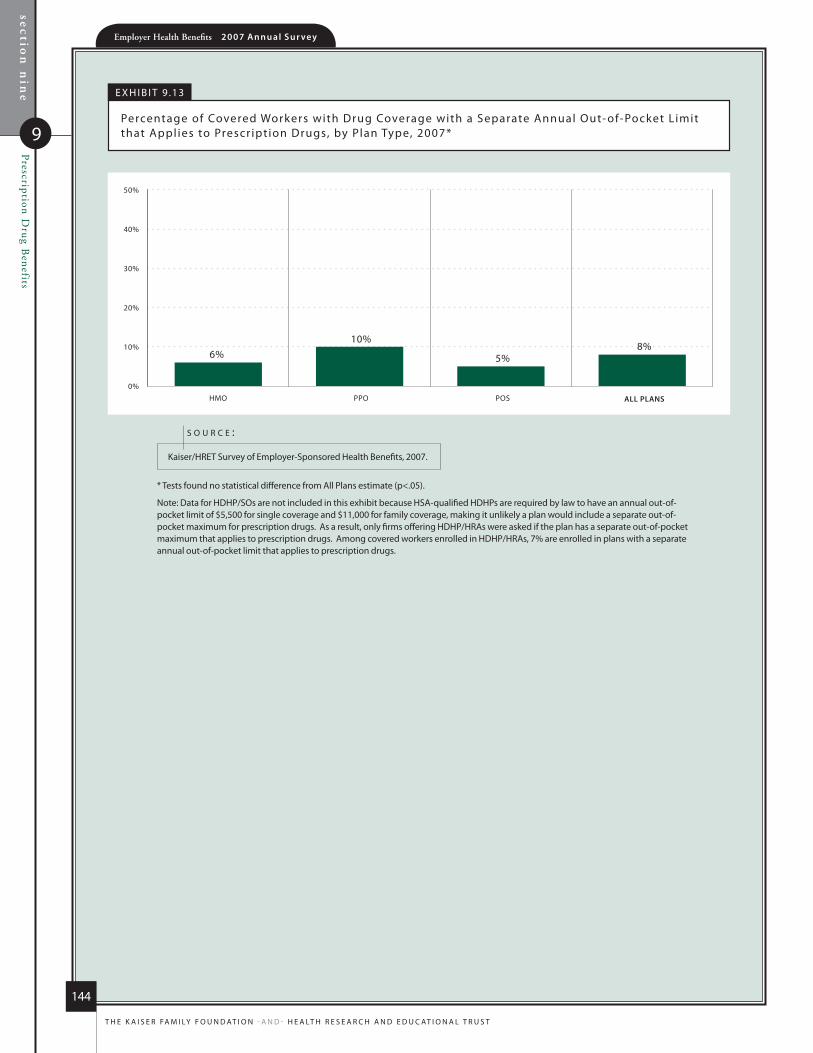
section
nin
ePrescription D
rug Benefits
9
Employer Health Benefits 2 0 0 7 An n u a l S u r vey
144
T h e K A i S e r FA m i ly F o u n d AT i o n - A n d - h e A lT h r e S e A r c h A n d e d u c AT i o n A l T r u S T
HMO PPO POS
6%10%
5%8%
ALL PLANS
0%
10%
20%
30%
40%
50%
e x h i B i T 9 .13
Percentage of covered Workers with drug coverage with a Separate Annual out- of-Pocket l imit that Appl ies to Prescr ipt ion drugs, by Plan Type, 2007*
* Tests found no statistical difference from All Plans estimate (p<.05).
note: data for hdhP/Sos are not included in this exhibit because hSA-qualified hdhPs are required by law to have an annual out-of-pocket limit of $5,500 for single coverage and $11,000 for family coverage, making it unlikely a plan would include a separate out-of-pocket maximum for prescription drugs. As a result, only firms offering hdhP/hrAs were asked if the plan has a separate out-of-pocket maximum that applies to prescription drugs. Among covered workers enrolled in hdhP/hrAs, 7% are enrolled in plans with a separate annual out-of-pocket limit that applies to prescription drugs.
Kaiser/hreT Survey of employer-Sponsored health Benefits, 2007.
s o u r c e :

78%$12,1
06
$4,4
79
Employer Health Benefits2 0 0 7 A n n u A l S u r v e y
s ect ion
Plan Funding
10
6.1%
Employer Health Benefits 2 0 0 7 An n u a l S u r vey
sec
tion
ten
Plan Funding
10
146
T h e K A i S e r FA m i ly F o u n d AT i o n - A n d - h e A lT h r e S e A r c h A n d e d u c AT i o n A l T r u S T
P L A N F U N D I N G
The employee ReTiRemenT income SecuRiTy AcT (eRiSA) of 1974 exempTS Self-funded plAnS fRom STATe
inSuRAnce lAwS, including ReSeR ve RequiRemenTS, mAndATed benefiTS, pRemium TAxeS, And conSumeR
pRoTecTion RegulATionS. oveR hAlf (53%) of lARge fiRmS (200 oR moRe woRkeRS) ARe Self-funded. becAuSe
lARgeR fiRmS hAve moRe employeeS oveR whom To SpReAd The RiSk of coSTly clAimS, Self-funding iS moRe
common And leSS RiSky Among lARgeR fiRmS ThAn Among SmAlleR oneS.
�The number of covered workers that are in a plan that is completely or partially self-funded has remained stable over the last few years. Slightly more than half (55%) of covered workers are in a self-funded plan (Exhibit 10.1).
As expected, covered workers in large firms (200 or more workers) are more likely to be in a self-funded plan than workers in small firms (3–199 workers). Seventy-seven percent of workers in large firms (200 or more workers) are in self-funded plans, compared to 12% of workers in small firms (3 to 199 workers) (Exhibit 10.3). The percentage of covered workers in self-funded plans increases as the number of employees increases. Fifty-three percent of workers in firms with 200 to 999 workers are in self-funded plans, compared to 76% of workers in firms with 1,000 to 4,999 workers, and 86% of workers in firms with 5,000 or more workers. As mentioned, these percentages have changed little over the past several years (Exhibit 10.1).
A higher percentage of workers in PPOs are in a self-funded plan (65%), compared to 41% in HDHP/SOs, 34% in HMOs, and 34% in POS plans (Exhibit 10.2).
Self-Funded Plan: An insurance arrangement in which the employer assumes direct financial responsibility for the costs of enrollees’ medical claims. Employers sponsoring self-funded plans typically contract with a third-party administrator or insurer to provide administrative services for the self-funded plan. In some cases, the employer may buy stop-loss coverage from an insurer to protect the employer against very large claims.
Fully Insured Plan: An insurance arrangement in which the employer contracts with a health plan that assumes financial responsibility for the costs of enrollees’ medical claims.
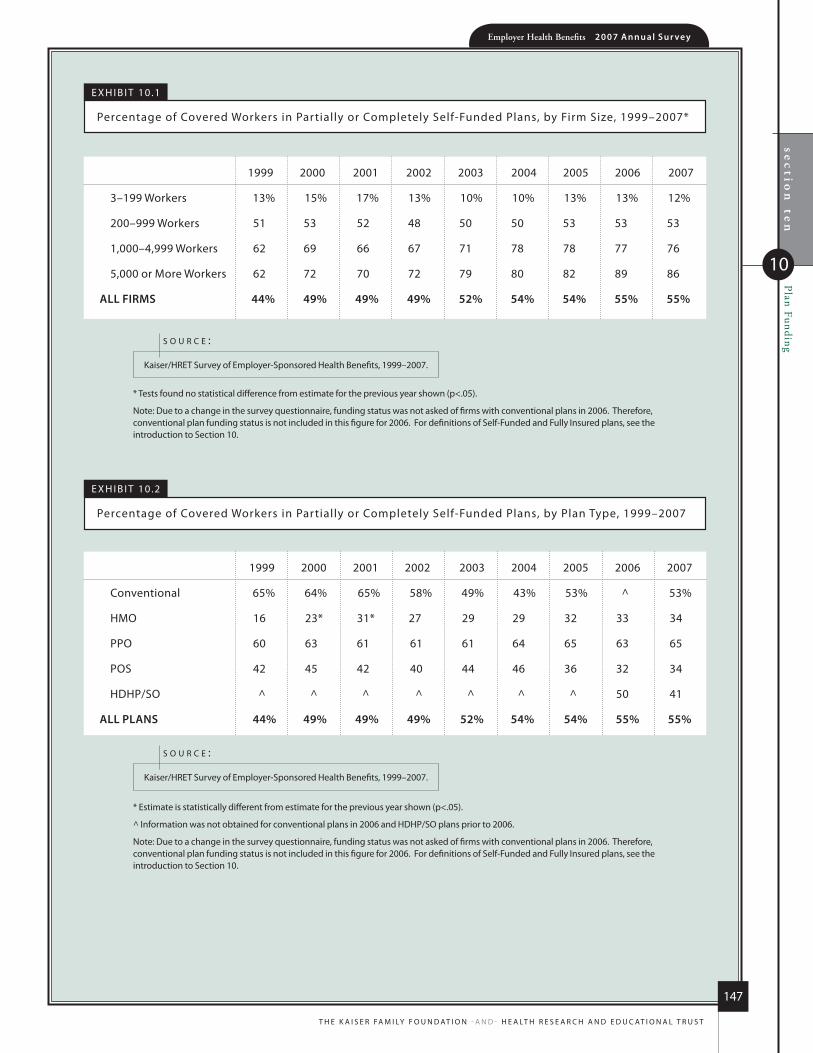
sec
tion
ten
Plan FundingEmployer Health Benefits 2 0 0 7 An n u a l S u r vey
147
T h e K A i S e r FA m i ly F o u n d AT i o n - A n d - h e A lT h r e S e A r c h A n d e d u c AT i o n A l T r u S T
10
e x h i b i T 10.1
Percentage of covered Workers in Partially or completely Self-Funded Plans, by Firm Size, 1999–2007*
* Tests found no statistical difference from estimate for the previous year shown (p<.05).
note: due to a change in the survey questionnaire, funding status was not asked of firms with conventional plans in 2006. Therefore, conventional plan funding status is not included in this figure for 2006. For definitions of Self-Funded and Fully insured plans, see the introduction to Section 10.
Kaiser/hreT Survey of employer-Sponsored health benefits, 1999–2007.
S o u R c e :
1999 2000 2001 2002 2003 2004 2005 2006 2007
3–199 Workers 13% 15% 17% 13% 10% 10% 13% 13% 12%
200–999 Workers 51 53 52 48 50 50 53 53 53
1,000–4,999 Workers 62 69 66 67 71 78 78 77 76
5,000 or more Workers 62 72 70 72 79 80 82 89 86
ALL FIRMS 44% 49% 49% 49% 52% 54% 54% 55% 55%
1999 2000 2001 2002 2003 2004 2005 2006 2007
conventional 65% 64% 65% 58% 49% 43% 53% ^ 53%
hmo 16 23* 31* 27 29 29 32 33 34
PPo 60 63 61 61 61 64 65 63 65
PoS 42 45 42 40 44 46 36 32 34
hdhP/So ^ ^ ^ ^ ^ ^ ^ 50 41
ALL PLANS 44% 49% 49% 49% 52% 54% 54% 55% 55%
e x h i b i T 10.2
Percentage of covered Workers in Partially or completely Self-Funded Plans, by Plan Type, 1999–2007
* estimate is statistically different from estimate for the previous year shown (p<.05).
^ information was not obtained for conventional plans in 2006 and hdhP/So plans prior to 2006.
note: due to a change in the survey questionnaire, funding status was not asked of firms with conventional plans in 2006. Therefore, conventional plan funding status is not included in this figure for 2006. For definitions of Self-Funded and Fully insured plans, see the introduction to Section 10.
Kaiser/hreT Survey of employer-Sponsored health benefits, 1999–2007.
S o u R c e :

Employer Health Benefits 2 0 0 7 An n u a l S u r vey
148
T h e K A i S e r FA m i ly F o u n d AT i o n - A n d - h e A lT h r e S e A r c h A n d e d u c AT i o n A l T r u S T
sec
tion
ten
Plan Funding
10
Self-Funded (employer bears Some or All of Financial risk)
FIRM SIZE
200–999 Workers 53%1,000–4,999 Workers 76*5,000 or more Workers 86*All Small Firms (3–199 Workers) 12%*All Large Firms (200 or More Workers) 77%*
REGION
northeast 51%midwest 63*South 58West 43*
INDUSTRY
Agriculture/mining/construction 35%*manufacturing 71*Transportation/communications/utilities 52Wholesale 48retail 58Finance 46*Service 48*State/local Government 58health care 68*
ALL FIRMS 55%
e x h i b i T 10.3
Percentage of covered Workers in Par t ia l ly or completely Sel f -Funded Plans, by Firm Size, region, and industr y, 2007
* estimate is statistically different from estimate for all other firms not in the indicated size, region, or industry category (p<.05).
note: For definitions of Self-Funded and Fully insured plans, see the introduction to Section 10.
Kaiser/hreT Survey of employer-Sponsored health benefits, 2007.
S o u R c e :
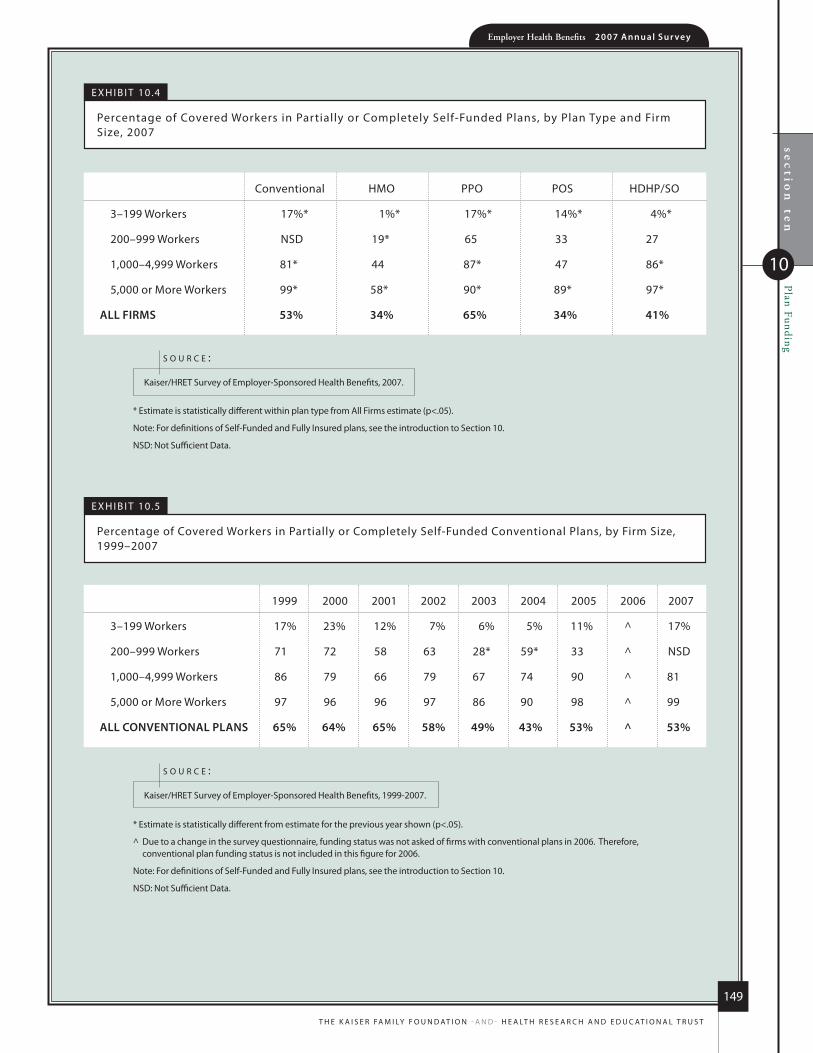
sec
tion
ten
Plan FundingEmployer Health Benefits 2 0 0 7 An n u a l S u r vey
149
T h e K A i S e r FA m i ly F o u n d AT i o n - A n d - h e A lT h r e S e A r c h A n d e d u c AT i o n A l T r u S T
10
e x h i b i T 10.4
Percentage of covered Workers in Partially or completely Self-Funded Plans, by Plan Type and Firm Size, 2007
conventional hmo PPo PoS hdhP/So
3–199 Workers 17%* 1%* 17%* 14%* 4%*
200–999 Workers nSd 19* 65 33 27
1,000–4,999 Workers 81* 44 87* 47 86*
5,000 or more Workers 99* 58* 90* 89* 97*
ALL FIRMS 53% 34% 65% 34% 41%
* estimate is statistically different within plan type from All Firms estimate (p<.05).
note: For definitions of Self-Funded and Fully insured plans, see the introduction to Section 10.
nSd: not Sufficient data.
Kaiser/hreT Survey of employer-Sponsored health benefits, 2007.
S o u R c e :
e x h i b i T 10.5
Percentage of covered Workers in Partially or completely Self-Funded conventional Plans, by Firm Size, 1999–2007
* estimate is statistically different from estimate for the previous year shown (p<.05).
^ due to a change in the survey questionnaire, funding status was not asked of firms with conventional plans in 2006. Therefore, conventional plan funding status is not included in this figure for 2006.
note: For definitions of Self-Funded and Fully insured plans, see the introduction to Section 10.
nSd: not Sufficient data.
Kaiser/hreT Survey of employer-Sponsored health benefits, 1999-2007.
S o u R c e :
1999 2000 2001 2002 2003 2004 2005 2006 2007
3–199 Workers 17% 23% 12% 7% 6% 5% 11% ^ 17%
200–999 Workers 71 72 58 63 28* 59* 33 ^ nSd
1,000–4,999 Workers 86 79 66 79 67 74 90 ^ 81
5,000 or more Workers 97 96 96 97 86 90 98 ^ 99
ALL CONVENTIONAL PLANS 65% 64% 65% 58% 49% 43% 53% ^ 53%

Employer Health Benefits 2 0 0 7 An n u a l S u r vey
150
T h e K A i S e r FA m i ly F o u n d AT i o n - A n d - h e A lT h r e S e A r c h A n d e d u c AT i o n A l T r u S T
sec
tion
ten
Plan Funding
10
e x h i b i T 10.6
Percentage of covered Workers in Partially or completely Self-Funded hmo Plans, by Firm Size, 1999–2007
* estimate is statistically different from estimate for the previous year shown (p<.05).
note: For definitions of Self-Funded and Fully insured plans, see the introduction to Section 10.
Kaiser/hreT Survey of employer-Sponsored health benefits, 1999–2007.
S o u R c e :
e x h i b i T 10.7
Percentage of covered Workers in Partially or completely Self-Funded PPo Plans, by Firm Size, 1999–2007
* estimate is statistically different from estimate for the previous year shown (p<.05).
note: For definitions of Self-Funded and Fully insured plans, see the introduction to Section 10.
Kaiser/hreT Survey of employer-Sponsored health benefits, 1999-2007.
S o u R c e :
1999 2000 2001 2002 2003 2004 2005 2006 2007
3–199 Workers 5% 4% 14% 10% 5% 4% 10% 3% 1%
200–999 Workers 14 13 23 16 21 18 17 29 19
1,000–4,999 Workers 22 27 32 31 37 49 50 54 44
5,000 or more Workers 19 35* 40 38 44 40 44 47 58
ALL HMO PLANS 16% 23%* 31%* 27% 29% 29% 32% 33% 34%
1999 2000 2001 2002 2003 2004 2005 2006 2007
3-199 Workers 19% 23% 23% 15% 13% 13% 18% 19% 17%
200-999 Workers 69 72 66 63 60 63 67 61 65
1,000-4,999 Workers 84 89 87 83 85 88 88 85 87
5,000 or more Workers 87 88 87 93 93 93 95 97 90*
ALL PPO PLANS 60% 63% 61% 61% 61% 64% 65% 63% 65%

sec
tion
ten
Plan FundingEmployer Health Benefits 2 0 0 7 An n u a l S u r vey
151
T h e K A i S e r FA m i ly F o u n d AT i o n - A n d - h e A lT h r e S e A r c h A n d e d u c AT i o n A l T r u S T
10
e x h i b i T 10.8
Percentage of covered Workers in Partially or completely Self-Funded PoS Plans, by Firm Size, 1999–2007
* estimate is statistically different from estimate for the previous year shown (p<.05).
note: For definitions of Self-Funded and Fully insured plans, see the introduction to Section 10.
Kaiser/hreT Survey of employer-Sponsored health benefits, 1999-2007.
S o u R c e :
e x h i b i T 10.9
Percentage of covered Workers in Partially or completely Self-Funded hdhP/Sos, by Firm Size, 2006–2007*
* Tests found no statistical difference for estimate for the previous year shown (p<.05).
note: information on funding status for hdhP/Sos was not collected prior to 2006. For definitions of Self-Funded and Fully insured plans, see the introduction to Section 10.
Kaiser/hreT Survey of employer-Sponsored health benefits, 2006–2007.
S o u R c e :
2006 2007
3–199 Workers 7% 4%
200–999 Workers 57 27
1,000–4,999 Workers 81 86
5,000 or more Workers 100 97
ALL HDHP/SOs 50% 41%
1999 2000 2001 2002 2003 2004 2005 2006 2007
3–199 Workers 10% 10% 10% 10% 8% 9% 9% 6% 14%
200–999 Workers 35 39 40 21* 42* 42 31 36 33
1,000–4,999 Workers 62 71 60 67 73 63 48 62 47
5,000 or more Workers 75 77 76 67 71 77 74 80 89
ALL POS PLANS 42% 45% 42% 40% 44% 46% 36% 32% 34%


78%$12,1
06
$4,4
79
Employer Health Benefits2 0 0 7 A n n u A l S u r v e y
s ect ion
Retiree Health
Benefits
11
6.1%
Employer Health Benefits 2 0 0 7 An n u a l S u r vey
section
elevenR
etiree Health B
enefits
11
154
T h e K A i S e r FA m i ly F o u n d AT i o n - A n d - h e A lT h r e S e A r c h A n d e d u c AT i o n A l T r u S T
R e t i R e e H e a l t H B e n e f i t s
RetiRee health benefits aRe an impoRtant consideRation foR oldeR woRkeRs making decisions about theiR
RetiRement. health benefits foR RetiRees also pRovide an impoRtant supplement to medicaRe foR RetiRees
age 65 and oveR. among fiRms offeRing health benefits to theiR woRkeRs, laRge fiRms (200 oR moRe
woRkeRs) aRe much moRe likely than small fiRms (3–199 woRkeRs) to offeR RetiRee health benefits. afteR
falling dRamatically in the late 1980s and eaRly 1990s, the peRcentage of laRge fiRms (200 oR moRe
woRkeRs) offeRing RetiRee health benefits has Remained Relatively constant.
Thirty-three percent of large firms (200 or more workers) that offer health benefits to their employees offer retiree coverage in 2007, similar to 35% in 2006 but down from 66% in 1988 (Exhibit 11.1).
Retiree benefits vary substantially with firm size, industry, whether workers are unionized, wage level, and many other factors.
Large firms are much more likely to offer retiree benefits than small firms. Among firms that offer health benefits, 33% of large firms (200 or more workers) offer retiree benefits, compared to just 5% of small firms (3–199 workers) (Exhibit 11.2).
Among large firms (200 or more workers) that offer health benefits, state and local governments and firms in the finance industry are more likely than firms in other industries to offer retiree benefits (Exhibit 11.2). In contrast, firms in the retail and wholesale industries are less likely than firms in other industries to offer retiree health benefits.
Large firms (200 or more workers) with union workers are significantly more likely to offer retiree health benefits than large firms without union workers—51% of all large firms with union employees that offer health benefits offer retiree benefits, compared with 24% for all large firms that do not have union employees (Exhibit 11.3).
Large firms (200 or more workers) with fewer lower-wage workers (where less than 35% of workers earn $21,000 a year or less annually) are significantly more likely to offer retiree health benefits than large firms with a greater proportion of lower-wage workers (where 35% or more workers earn $21,000 a year or less)—36% versus 21% (Exhibit 11.3).
Most large firms (200 or more workers) that offer retiree benefits offer them to early retirees under the age of 65 (92%). A lower percentage (71%) of large firms offering retiree benefits offer them to Medicare-age retirees (Exhibit 11.4).

section
elevenR
etiree Health B
enefits
11
Employer Health Benefits 2 0 0 7 An n u a l S u r vey
155
T h e K A i S e r FA m i ly F o u n d AT i o n - A n d - h e A lT h r e S e A r c h A n d e d u c AT i o n A l T r u S T
1988 199519931991 1998 1999 2000 20022001 2003 2007200620052004
66%
46%
36%40% 40% 40%
35% 37% 36% 38% 36% 33% 35% 33%
0%
10%
20%
30%
40%
50%
60%
70%
80%
90%
100%
e x h i b i T 11.1
Among Firms o ffer ing health benef its to Ac t ive Workers, Percentage of Al l large Firms (200 or more Workers) o ffer ing ret iree health benef its, 1988–2007*
* Tests found no statistical difference from estimate for the previous year shown (p<.05). no statistical tests are conducted for years prior to 1999.
Kaiser/hreT Survey of employer-Sponsored health benefits, 1999–2007; KPmG Survey of employer-Sponsored health benefits, 1991, 1993, 1995, 1998; The health insurance Association of America (hiAA), 1988.
s o u R c e :

section
elevenR
etiree Health B
enefits
11
Employer Health Benefits 2 0 0 7 An n u a l S u r vey
156
T h e K A i S e r FA m i ly F o u n d AT i o n - A n d - h e A lT h r e S e A r c h A n d e d u c AT i o n A l T r u S T
All Small Firms All large Firms (3–199 Workers) (200 or more Workers)
FIRM SIZE
3–199 Workers 5% —200–999 Workers — 29%*1,000–4,999 Workers — 41*5,000 or more Workers — 52*
REGION
northeast 6% 33%midwest 5 37South 4 30West 4 34
INDUSTRY
Agriculture/mining/construction 1%* 25%manufacturing 1* 27Transportation/communications/utilities nSd 47Wholesale 1* 14*retail 1* 13*Finance 2 53*Service 7 32State/local Government 34* 80*health care 2 24
ALL FIRMS 5% 33%
e x h i b i T 11.2
Among Firms that o ffer health benef its to Ac t ive Workers, Percentage of Fi rms o ffer ing ret iree health benef its, by Firm Size, region, and industr y, 2007
* estimate is statistically different within Small or large Firm category from estimate for all other firms not in the indicated size, region, or industry category (p<.05).
nSd: not Sufficient data.
Kaiser/hreT Survey of employer-Sponsored health benefits, 2007.
s o u R c e :

section
elevenR
etiree Health B
enefits
11
Employer Health Benefits 2 0 0 7 An n u a l S u r vey
157
T h e K A i S e r FA m i ly F o u n d AT i o n - A n d - h e A lT h r e S e A r c h A n d e d u c AT i o n A l T r u S T
OFFER HEALTH BENEFITS TO EARLY RETIREES OFFER HEALTH BENEFITS TO MEDICARE-AGE RETIREES
0%
10%
20%
30%
40%
50%
60%
70%
80%
90%
100% 93%89%
98%* 96% 93% 96% 94% 94% 92%
76%71% 73% 76% 78% 75%
81%77%
71%
1999 2000 2001 2002 2003 2004 2005 2006 2007 1999 2000 2001 2002 2003 2004 2005 2006 2007
24%
36%
17%
51%
22%
35%
21%
36%
FIRM DOES NOT HAVE ANY UNION WORKERS
FIRM HAS AT LEAST SOME UNION WORKERS
FEW WORKERS ARE LOWER WAGE(LESS THAN 35% EARN $21,000 A YEAR OR LESS)
MANY WORKERS ARE LOWER WAGE(35% OR MORE EARN $21,000 A YEAR OR LESS)
FEW WORKERS ARE PART-TIME(LESS THAN 35% WORK PART-TIME)
MANY WORKERS ARE PART-TIME(35% OR MORE WORK PART-TIME)
WAGE LEVEL*
PART-TIME WORKERS*
UNIONS*
35% OR MORE AGE 26 OR LESS
LESS THAN 35% AGE 26 OR LESS
AGE*
0% 10% 20% 30% 40% 50% 60% 70% 80%
e x h i b i T 11.3
Among Firms that o ffer health benef its to Ac t ive Workers, Percentage of Al l large Firms (200 or more Workers) o ffer ing ret iree health benef its, by Firm charac ter ist ics, 2007
* estimates are statistically different from each other within category (p<.05).
Kaiser/hreT Survey of employer-Sponsored health benefits, 2007.
s o u R c e :
e x h i b i T 11.4
Among All large Firms (200 or more Workers) offering health benefits to Active Workers and offering retiree coverage, Percentage offering health benefits to early and medicare-Age retirees, 1999–2007
*estimate is statistically different from estimate for the previous year shown (p<.05).
early retirees: Workers retiring before age 65.
Kaiser/hreT Survey of employer-Sponsored health benefits, 1999–2007.
s o u R c e :
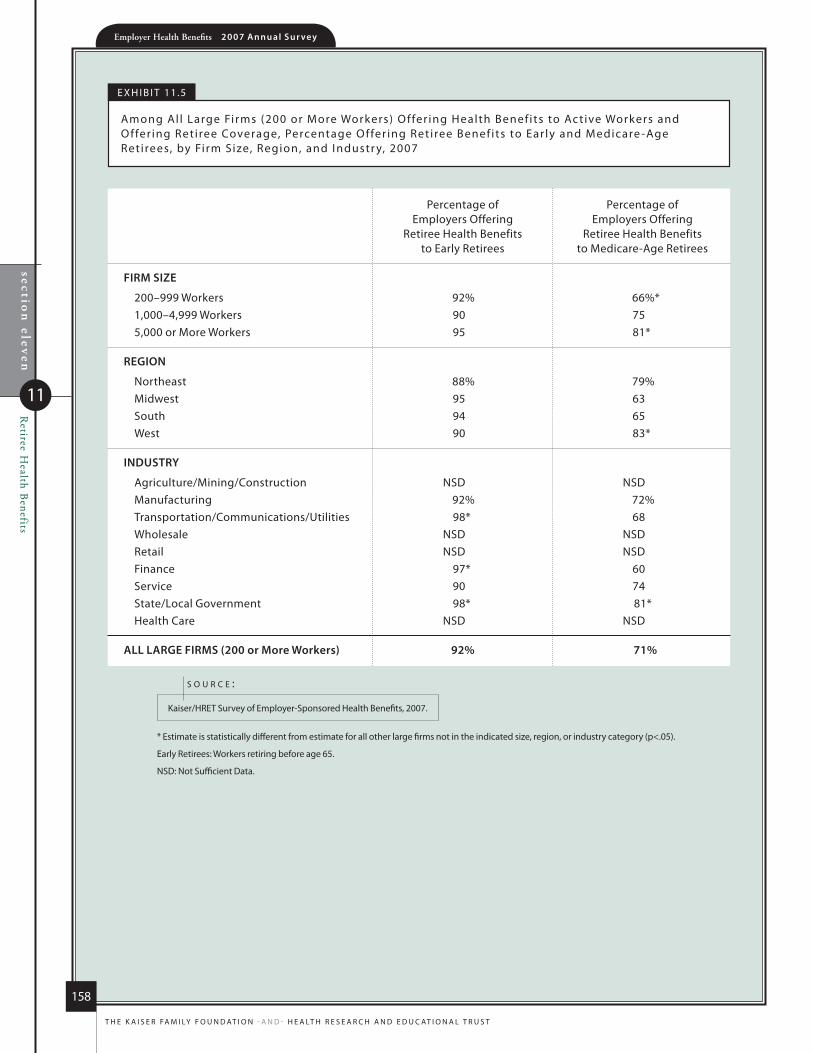
section
elevenR
etiree Health B
enefits
11
Employer Health Benefits 2 0 0 7 An n u a l S u r vey
158
T h e K A i S e r FA m i ly F o u n d AT i o n - A n d - h e A lT h r e S e A r c h A n d e d u c AT i o n A l T r u S T
Percentage of Percentage of employers offering employers offering retiree health benefits retiree health benefits to early retirees to medicare-Age retirees
FIRM SIZE
200–999 Workers 92% 66%*1,000–4,999 Workers 90 755,000 or more Workers 95 81*
REGION
northeast 88% 79%midwest 95 63South 94 65West 90 83*
INDUSTRY
Agriculture/mining/construction nSd nSdmanufacturing 92% 72%Transportation/communications/utilities 98* 68Wholesale nSd nSdretail nSd nSdFinance 97* 60Service 90 74State/local Government 98* 81*health care nSd nSd
ALL LARGE FIRMS (200 or More Workers) 92% 71%
e x h i b i T 11.5
Among Al l large Firms (200 or more Workers) o ffer ing health benef its to Ac t ive Workers and o ffer ing ret iree coverage, Percentage o ffer ing ret iree benef its to ear ly and medicare -Age ret irees, by Firm Size, region, and industr y, 2007
* estimate is statistically different from estimate for all other large firms not in the indicated size, region, or industry category (p<.05).
early retirees: Workers retiring before age 65.
nSd: not Sufficient data.
Kaiser/hreT Survey of employer-Sponsored health benefits, 2007.
s o u R c e :

78%$12,1
06
$4,4
79
Employer Health Benefits2 0 0 7 A n n u A l S u r v e y
s ect ion
Employer Opinions and
Practices
6.1%12

Employer Health Benefits 2 0 0 7 An n u a l S u r vey
section
twelve
Em
ployer Opinions and Practices
12
160
T h e K A i S e r FA m i ly F o u n d AT i o n - A n d - h e A lT h r e S e A r c h A n d e d u c AT i o n A l T r u S T
E m p l o y E r o p i n i o n s a n d p r a c t i c E s
EmployErs play a significant rolE in hEalth insurancE covEragE—providing hEalth bEnEfits to about 158
million nonEldErly pEoplE in amErica1—so thEir attitudEs, knowlEdgE, and ExpEriEncEs arE important
factors in hEalth policy discussions.
this yEar’s survEy askEd EmployErs how thEy viEw diffErEnt approachEs to containing cost incrEasEs and
how thEy plan to changE thEir hEalth bEnEfit plans in thE nEar futurE. EmployErs also wErE askEd
about utilization managEmEnt programs, how much thEy fEEl various factors arE contributing to prEmium
incrEasEs, whEthEr thEy offEr long-tErm carE insurancE, and whEthEr thEy shoppEd for (or switchEd to)
a nEw hEalth plan, among othEr topics.
�All firms, including both those that offer and do not offer health benefits, were asked to rate how effective several different strategies are in reducing the growth of health care costs. In most instances, the percentages rating any of the suggested strategies as “very effective” at controlling costs are relatively low (between 12% and 28%). Larger percentages of firms (between 39% and 53%) report that each of the approaches we asked about were “somewhat effective” at controlling cost growth.
The approach perceived to be most effective by both small and large firms is disease management: 28% of small firms (3–199 workers) and 35% of large firms (200 or more workers) believe it to be “very effective” at controlling costs (Exhibit 12.1).
�Similar percentages of employers report that tighter managed care networks (16%) and consumer-driven health plans (15%) would be “very effective” in reducing the growth of health care costs. However, more firms indicate that consumer-driven health plans would be “somewhat effective” than tighter managed care networks. Small firms (3–199 workers) are more likely than large firms (200 or more workers) to report tighter managed care networks as being “very effective” at controlling costs (16% vs. 4%) (Exhibit 12.1).
�Each year we ask employers whether they expect to change the employee premium contributions, cost sharing, or eligibility for health benefits in the next year.
Thirty-nine percent of large firms (200 or more workers) say that they are “very likely” to increase the amount employees pay for health insurance in the next year, compared to 21% of small firms (3–199 workers) (Exhibit 12.2). An additional 24% of all firms say they are “somewhat likely” to do so.
Relatively small percentages of firms say that they are “very likely” to increase employee cost sharing next year, with 12% saying that they are “very likely” to increase deductibles, 13% saying that they are “very likely” to increase copayments and coinsurance, and 11% saying that they are “very likely” to increase the amount that employees pay for prescription drugs. These responses vary little between small firms (3–199 workers) and large firms (200 or more workers) (Exhibit 12.2).
As observed in previous years, small percentages of employers report that they are likely to restrict eligibility or drop coverage altogether. Less than one percent of firms say that they are “very likely” to restrict eligibility for benefits in the next year. Similarly, about one percent of firms say that they are “very likely” to drop coverage in the next year (Exhibit 12.2).
1 Kaiser Family Foundation, Kaiser commission on medicaid and the uninsured, Health Insurance Coverage in America, 2005 Data Update, may 2006.
n o t E :

section
twelve
Em
ployer Opinions and Practices
12
Employer Health Benefits 2 0 0 7 An n u a l S u r vey
161
T h e K A i S e r FA m i ly F o u n d AT i o n - A n d - h e A lT h r e S e A r c h A n d e d u c AT i o n A l T r u S T
�The factor most often cited by firms as contributing “a lot” to higher health insurance premiums is higher spending for prescription drugs (66%), followed by higher spending for hospital care (60%), an aging population (52%), higher spending for physician services (46%), and higher insurance company profits (45%) (Exhibit 12.3).
Small firms (3–199 workers) are significantly more likely than large firms (200 or more workers) to cite higher insurance company profits, higher spending for hospital care, and higher spending for physician services as contributing “a lot” to higher health insurance premiums (Exhibit 12.3). When those that report “a lot” and “somewhat” are combined, the differences between small and large firms are eliminated, with the exception of those reporting higher insurance company profits.
�About two-thirds (67%) of firms require pre-admission certification for inpatient hospital care in their health plan with the largest enrollment. Fifty-five percent of firms do so for outpatient surgery, and 48% include case management for large claims in their largest health plan. Large firms (200 or more workers) are significantly more likely than small firms (3–199 workers) to require preadmission certification for inpatient hospital care (78% vs. 66%) and case management for large claims in their health plan with the largest enrollment (82% vs. 46%) (Exhibit 12.4).
�Fifteen percent of firms include a high-performance or tiered provider network in the health plan with the largest enrollment. The difference between small firms (3–199 workers) and large firms (200 or more) is not statistically significant (Exhibit 12.5). A high performance network is one that groups providers into the network based on quality, cost, and/or the efficiency of the care they deliver. These networks encourage patients to visit the most efficient doctors by either restricting networks to efficient providers, or by having different copays or coinsurance for providers in different tiers in the network.
�Ten percent of firms offer employees a financial incentive to enroll in a spouse’s health plan. The differences between small (3–199 workers) and large firms (200 or more workers) and between regions are not statistically significant (Exhibit 12.5).
Looked at as a percentage of covered workers, 13% of covered workers are employed by a firm that offers employees a financial incentive to enroll in a spouse’s health plan. Fifteen percent of workers in large firms (200 or more workers) are offered an incentive, compared to 10% of workers in small firms (3–199 workers).
�The majority of firms that offer health insurance (65%) have shopped for a new health plan or insurance carrier in the past year (Exhibit 12.6). Small firms (3–199 workers) were more likely to do so than large firms (200 or more workers), at 66% versus 51%.
Of the firms that shopped, 25% changed insurance carriers in the past year, while 22% changed the type of health plan offered (Exhibit 12.7).
Sixty-nine percent of firms use a broker or consultant to assist in choosing an insurer or health plan. Small firms (3–199 workers) are less likely to do so than are large firms (200 or more workers)—68% versus 82% (Exhibit 12.5).
�Nineteen percent of firms that offer health benefits offer long-term care insurance. The difference between small firms (3–199 workers) and large firms (200 or more workers) is not statistically significant (Exhibit 12.5).
Looked at in terms of the percentage of covered workers, 34% of covered workers are employed by a firm that offers long-term care insurance. Workers in large firms (200 or more workers) are more likely to work for a firm that offers this benefit than workers in small firms (3–199 workers) (43% vs. 19%).

Employer Health Benefits 2 0 0 7 An n u a l S u r vey
section
twelve
Em
ployer Opinions and Practices
12
162
T h e K A i S e r FA m i ly F o u n d AT i o n - A n d - h e A lT h r e S e A r c h A n d e d u c AT i o n A l T r u S T
�Sixty-one percent of firms that offer health benefits allow employees to use pre-tax dollars to pay for health insurance premiums as allowable under Section 125 of the Internal Revenue Service Code. Virtually all large firms (200 or more workers) do so, at 92%, versus 60% of small firms (3–199 workers) (Exhibit 12.8).
The majority of covered workers (88%) are employed by a firm that allows at least some employees to use pre-tax dollars to pay for health insurance premiums. The difference between small and large firms is statistically significant, with 77% of covered workers in small firms (3–199 workers) compared to 94% of workers in large firms (200 or more workers) working for a firm that offers this Section 125 benefit.
�Twenty-two percent of firms that offer health benefits offer a flexible spending account (FSA). A FSA allows employees to set aside funds on a pre-tax basis to pay for medical expenses not covered by health insurance. Typically, employees decide at the beginning of the year how much to set aside in a FSA, and their employer deducts that amount from the employee’s paycheck over the year. Funds set aside in a FSA must be used by the end of the year or are forfeited by the employee. FSAs are different from HRAs and HSAs. Substantial differences exist by firm size: 73% of large firms (200 or more workers) offer FSAs, compared with just 20% of small firms (3–199 workers) (Exhibit 12.8).
About 70% of covered workers are employed by a firm that offers a flexible spending account. Workers in large firms are more than twice as likely to work for a firm that offers a flexible spending account than workers in small firms (87% vs. 38%).
�Eighty-seven percent of covered workers are enrolled in plans where their employer made no changes to their level of health benefits, other than cost sharing, in the past year (Exhibit 12.9). Seven percent are in plans that included more health benefits than last year, and 6% are in plans that included fewer health benefits than last year.
�Over half (55%) of covered workers are in plans with a limit on the amount of benefits a plan will pay for an employee over his or her lifetime. Fifty-four percent of covered workers have a specified limit of one million dollars or more.
The majority of covered workers in HMO (76%) and POS (53%) plans have no lifetime maximum on benefits paid for by the plan, and about one-third of workers in PPOs have no limit (Exhibit 12.10).
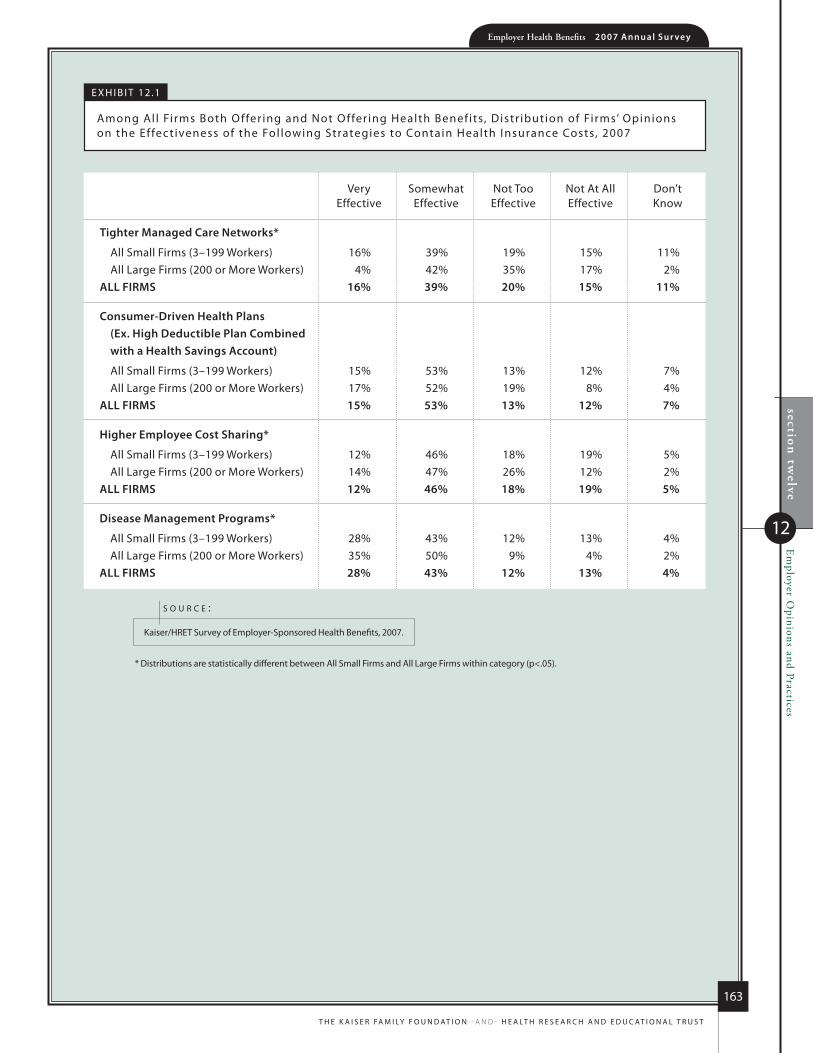
section
twelve
Em
ployer Opinions and Practices
12
Employer Health Benefits 2 0 0 7 An n u a l S u r vey
163
T h e K A i S e r FA m i ly F o u n d AT i o n - A n d - h e A lT h r e S e A r c h A n d e d u c AT i o n A l T r u S T
e x h i b i T 12.1
Among Al l Fi rms both o ffer ing and not o ffer ing health benef its, distr ibution of Fi rms’ opinions on the effec t iveness of the Fol lowing Strategies to contain health insurance costs, 2007
very Somewhat not Too not At All don’t effective effective effective effective Know
Tighter Managed Care Networks*
All Small Firms (3–199 Workers) 16% 39% 19% 15% 11%All large Firms (200 or more Workers) 4% 42% 35% 17% 2%
ALL FIRMS 16% 39% 20% 15% 11%
Consumer-Driven Health Plans (Ex. High Deductible Plan Combined with a Health Savings Account)
All Small Firms (3–199 Workers) 15% 53% 13% 12% 7%All large Firms (200 or more Workers) 17% 52% 19% 8% 4%
ALL FIRMS 15% 53% 13% 12% 7%
Higher Employee Cost Sharing*
All Small Firms (3–199 Workers) 12% 46% 18% 19% 5%All large Firms (200 or more Workers) 14% 47% 26% 12% 2%
ALL FIRMS 12% 46% 18% 19% 5%
Disease Management Programs*
All Small Firms (3–199 Workers) 28% 43% 12% 13% 4%All large Firms (200 or more Workers) 35% 50% 9% 4% 2%
ALL FIRMS 28% 43% 12% 13% 4%
* distributions are statistically different between All Small Firms and All large Firms within category (p<.05).
Kaiser/hreT Survey of employer-Sponsored health benefits, 2007.
s o u r c E :

section
twelve
Em
ployer Opinions and Practices
12
Employer Health Benefits 2 0 0 7 An n u a l S u r vey
164
T h e K A i S e r FA m i ly F o u n d AT i o n - A n d - h e A lT h r e S e A r c h A n d e d u c AT i o n A l T r u S T
e x h i b i T 12.2
Among Firms o ffer ing health benef its, distr ibution of Fi rms repor t ing the likel ihood of mak ing the Fol lowing changes in the nex t year, by Firm Size, 2007
* distributions are statistically different between All Small Firms and All large Firms within category (p<.05).
‡ Among firms not currently offering this type of hdhP/So.
Kaiser/hreT Survey of employer-Sponsored health benefits, 2007.
s o u r c E :
very Somewhat not Too not At All don’t likely likely likely likely Know
Increase the Amount Employees Pay for Health Insurance*All Small Firms (3–199 Workers) 21% 24% 21% 34% <1%All large Firms (200 or more Workers) 39% 34% 17% 10% <1%
ALL FIRMS 21% 24% 21% 33% <1%
Increase the Amount Employees Pay for Prescription DrugsAll Small Firms (3–199 Workers) 11% 30% 30% 26% 2%All large Firms (200 or more Workers) 9% 29% 41% 20% 1%
ALL FIRMS 11% 30% 31% 26% 2%
Increase the Amount Employees Pay for Deductibles*All Small Firms (3–199 Workers) 12% 25% 27% 35% 1%All large Firms (200 or more Workers) 9% 29% 40% 20% 1%
ALL FIRMS 12% 25% 28% 34% 1%
Increase the Amount Employees Pay for Office Visit Copays or Coinsurance*All Small Firms (3–199 Workers) 13% 29% 27% 29% 2%All large Firms (200 or more Workers) 7% 29% 43% 20% 1%
ALL FIRMS 13% 29% 28% 28% 2%
Introduce Tiered Cost Sharing for Doctor Visits or Hospital StaysAll Small Firms (3–199 Workers) 7% 16% 39% 35% 3%All large Firms (200 or more Workers) 3% 16% 41% 39% 1%
ALL FIRMS 7% 16% 39% 35% 3%
Restrict Employees’ Eligibility for CoverageAll Small Firms (3–199 Workers) <1% 4% 29% 64% 3%All large Firms (200 or more Workers) 1% 6% 28% 64% <1%
ALL FIRMS <1% 4% 29% 64% 3%
Drop Coverage Entirely*All Small Firms (3–199 Workers) 1% 2% 16% 81% <1%All large Firms (200 or more Workers) <1% 1% 5% 93% <1%
ALL FIRMS 1% 2% 15% 82% <1%
Offer HDHP/HRA‡
All Small Firms (3–199 Workers) 3% 21% 30% 46% <1%All large Firms (200 or more Workers) 4% 21% 30% 45% 1%
ALL FIRMS 3% 21% 30% 46% <1%
Offer HSA-Qualified HDHP*‡
All Small Firms (3–199 Workers) 1% 18% 32% 45% 3%All large Firms (200 or more Workers) 5% 23% 30% 41% <1%
ALL FIRMS 2% 18% 32% 45% 3%

section
twelve
Em
ployer Opinions and Practices
12
Employer Health Benefits 2 0 0 7 An n u a l S u r vey
165
T h e K A i S e r FA m i ly F o u n d AT i o n - A n d - h e A lT h r e S e A r c h A n d e d u c AT i o n A l T r u S T
e x h i b i T 12.3
Among All Firms both offering and not offering health benefits, distr ibution of Firms repor ting the contribution of the Following Factors to increases in health insurance Premiums, by Firm Size, 2007
* distributions are statistically different between All Small Firms and All large Firms within category (p<.05).
Kaiser/hreT Survey of employer-Sponsored health benefits, 2007.
s o u r c E :
A lot Somewhat not Too not don’t much At All Know
Higher Insurance Company Profits*
All Small Firms (3–199 Workers) 46% 40% 9% 2% 2%All large Firms (200 or more Workers) 21% 54% 20% 4% 1%
ALL FIRMS 45% 41% 9% 3% 2%
Higher Spending for Hospital Care*
All Small Firms (3–199 Workers) 60% 32% 3% 4% 1%All large Firms (200 or more Workers) 48% 46% 4% 1% 1%
ALL FIRMS 60% 32% 3% 4% 1%
Higher Spending for Physician Services*
All Small Firms (3–199 Workers) 46% 42% 7% 5% <1%All large Firms (200 or more Workers) 32% 55% 11% 1% 1%
ALL FIRMS 46% 42% 7% 4% <1%
Higher Spending for Prescription Drugs
All Small Firms (3–199 Workers) 67% 28% 3% 2% <1%All large Firms (200 or more Workers) 65% 29% 4% 1% 1%
ALL FIRMS 66% 28% 3% 2% <1%
Better Medical Technology
All Small Firms (3–199 Workers) 39% 46% 10% 3% 2%All large Firms (200 or more Workers) 39% 50% 9% 2% 1%
ALL FIRMS 39% 46% 10% 3% 2%
An Aging Population
All Small Firms (3–199 Workers) 52% 38% 6% 3% <1%All large Firms (200 or more Workers) 57% 38% 4% 1% <1%
ALL FIRMS 52% 38% 6% 3% <1%
Workers Using More Services Because They Only Pay a Small Share of the Total Cost of Services*
All Small Firms (3–199 Workers) 18% 53% 18% 8% 4%All large Firms (200 or more Workers) 23% 45% 27% 5% <1%
ALL FIRMS 18% 53% 18% 8% 4%
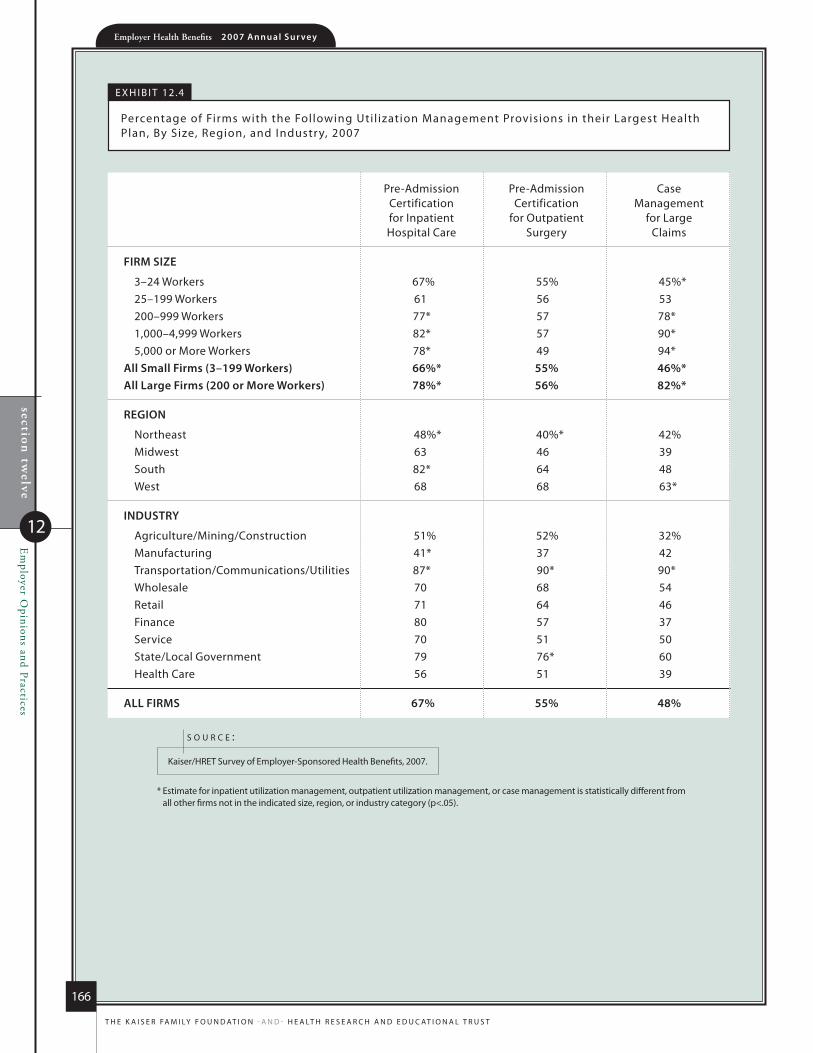
section
twelve
Em
ployer Opinions and Practices
12
Employer Health Benefits 2 0 0 7 An n u a l S u r vey
166
T h e K A i S e r FA m i ly F o u n d AT i o n - A n d - h e A lT h r e S e A r c h A n d e d u c AT i o n A l T r u S T
e x h i b i T 12.4
Percentage of Firms with the Following uti l ization management Provisions in their largest health Plan, by Size, region, and industr y, 2007
Pre-Admission Pre-Admission case certification certification management for inpatient for outpatient for large hospital care Surgery claims
FIRM SIZE
3–24 Workers 67% 55% 45%*25–199 Workers 61 56 53200–999 Workers 77* 57 78*1,000–4,999 Workers 82* 57 90*5,000 or more Workers 78* 49 94*
All Small Firms (3–199 Workers) 66%* 55% 46%*All Large Firms (200 or More Workers) 78%* 56% 82%*
REGION
northeast 48%* 40%* 42%midwest 63 46 39South 82* 64 48West 68 68 63*
INDUSTRY
Agriculture/mining/construction 51% 52% 32%manufacturing 41* 37 42Transportation/communications/utilities 87* 90* 90*Wholesale 70 68 54retail 71 64 46Finance 80 57 37Service 70 51 50State/local Government 79 76* 60health care 56 51 39
ALL FIRMS 67% 55% 48%
* estimate for inpatient utilization management, outpatient utilization management, or case management is statistically different from all other firms not in the indicated size, region, or industry category (p<.05).
Kaiser/hreT Survey of employer-Sponsored health benefits, 2007.
s o u r c E :
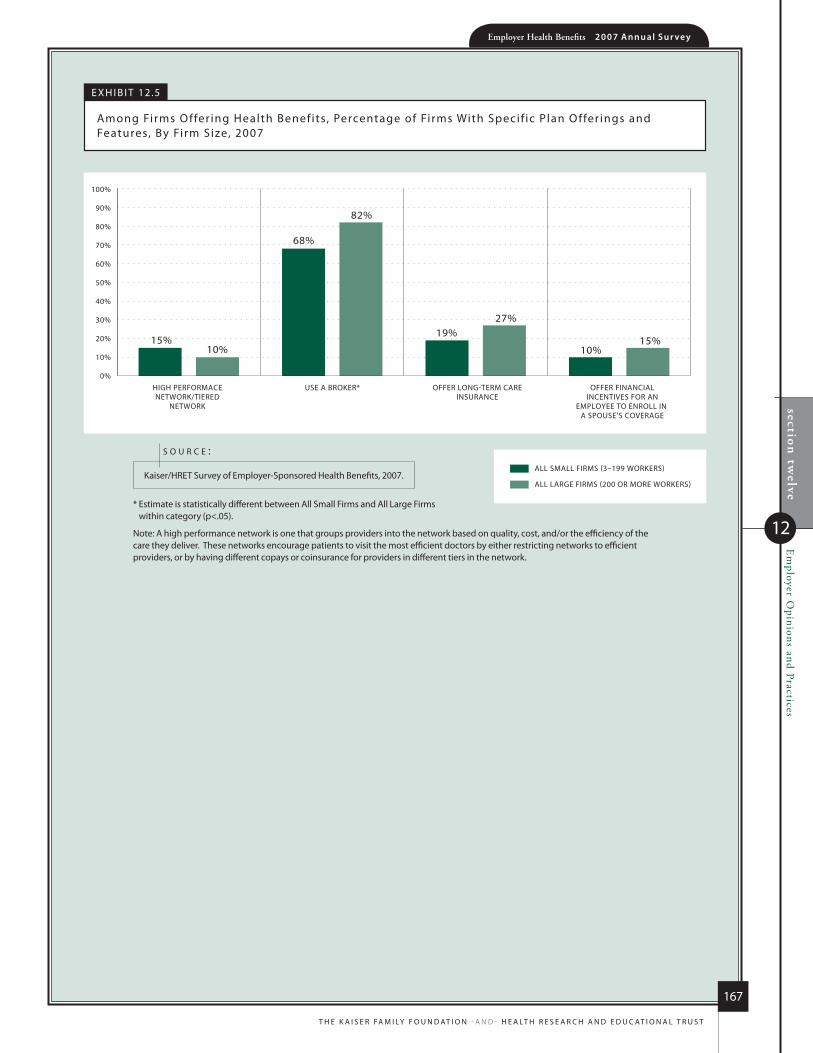
section
twelve
Em
ployer Opinions and Practices
12
Employer Health Benefits 2 0 0 7 An n u a l S u r vey
167
T h e K A i S e r FA m i ly F o u n d AT i o n - A n d - h e A lT h r e S e A r c h A n d e d u c AT i o n A l T r u S T
HIGH PERFORMACENETWORK/TIERED
NETWORK
USE A BROKER* OFFER LONG-TERM CAREINSURANCE
OFFER FINANCIALINCENTIVES FOR AN
EMPLOYEE TO ENROLL IN A SPOUSE’S COVERAGE
15%10%
68%
82%
19%27%
10%15%
0%
10%
20%
30%
40%
50%
60%
70%
80%
90%
100%
ALL SMALL FIRMS (3–199 WORKERS)
ALL LARGE FIRMS (200 OR MORE WORKERS)
e x h i b i T 12.5
Among Firms o ffer ing health benef its, Percentage of Fi rms With Specif ic Plan o ffer ings and Features, by Firm Size, 2007
* estimate is statistically different between All Small Firms and All large Firms within category (p<.05).
note: A high performance network is one that groups providers into the network based on quality, cost, and/or the efficiency of the care they deliver. These networks encourage patients to visit the most efficient doctors by either restricting networks to efficient providers, or by having different copays or coinsurance for providers in different tiers in the network.
Kaiser/hreT Survey of employer-Sponsored health benefits, 2007.
s o u r c E :
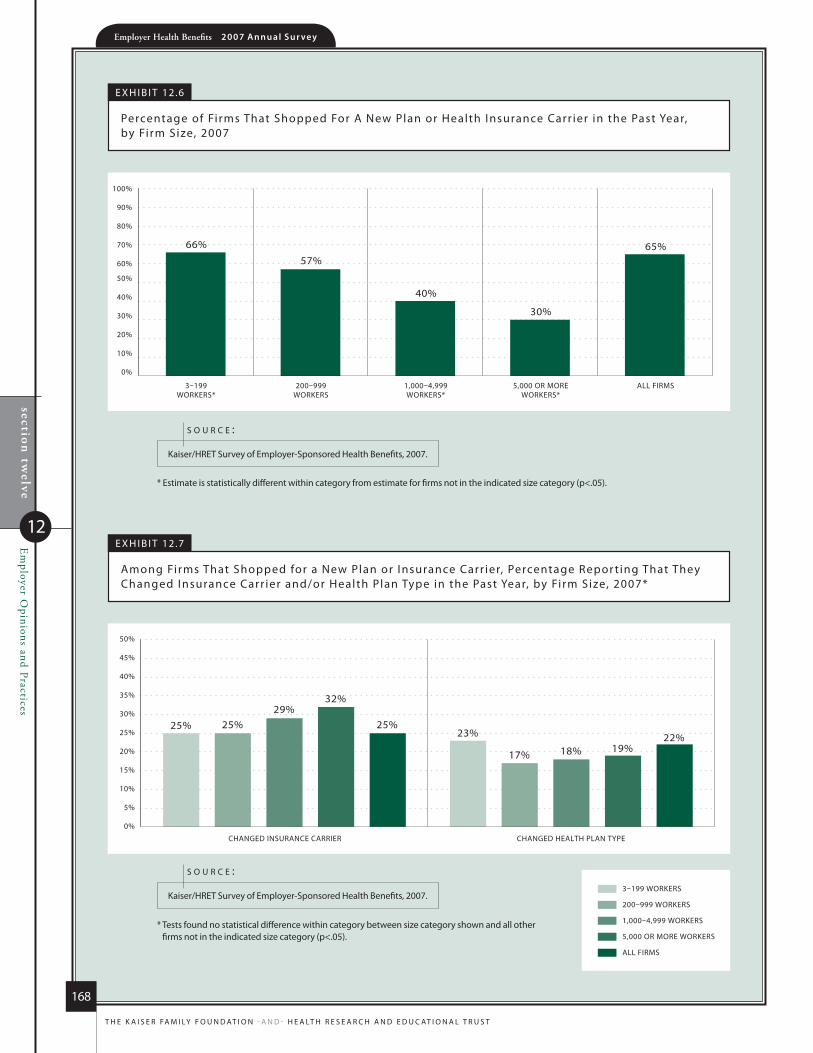
section
twelve
Em
ployer Opinions and Practices
12
Employer Health Benefits 2 0 0 7 An n u a l S u r vey
168
T h e K A i S e r FA m i ly F o u n d AT i o n - A n d - h e A lT h r e S e A r c h A n d e d u c AT i o n A l T r u S T
CHANGED INSURANCE CARRIER CHANGED HEALTH PLAN TYPE
25% 25%29%
32%
25%23%
17% 18% 19%22%
3–199 WORKERS
200–999 WORKERS
1,000–4,999 WORKERS
5,000 OR MORE WORKERS
ALL FIRMS
0%
5%
10%
15%
20%
25%
30%
35%
40%
45%
50%
3–199WORKERS*
ALL FIRMS5,000 OR MOREWORKERS*
1,000–4,999WORKERS*
200–999WORKERS
66% 65%
30%
40%
57%
0%
10%
20%
30%
40%
50%
60%
70%
80%
90%
100%
e x h i b i T 12.6
Percentage of Fi rms That Shopped For A new Plan or health insurance carr ier in the Past year, by Firm Size, 2007
* estimate is statistically different within category from estimate for firms not in the indicated size category (p<.05).
Kaiser/hreT Survey of employer-Sponsored health benefits, 2007.
s o u r c E :
e x h i b i T 12.7
Among Firms That Shopped for a new Plan or insurance carr ier, Percentage repor t ing That They changed insurance carr ier and/or health Plan Type in the Past year, by Firm Size, 2007*
Kaiser/hreT Survey of employer-Sponsored health benefits, 2007.
s o u r c E :
* Tests found no statistical difference within category between size category shown and all other firms not in the indicated size category (p<.05).

section
twelve
Em
ployer Opinions and Practices
12
Employer Health Benefits 2 0 0 7 An n u a l S u r vey
169
T h e K A i S e r FA m i ly F o u n d AT i o n - A n d - h e A lT h r e S e A r c h A n d e d u c AT i o n A l T r u S T
ALL SMALL FIRMS(3–199 WORKERS)
ALL LARGE FIRMS(200 OR MORE
WORKERS)
ALL SMALL FIRMS(3–199 WORKERS)
ALL LARGE FIRMS(200 OR MORE
WORKERS)
20%
73%
60%
92%
0%
10%
20%
30%
40%
50%
60%
70%
80%
90%
100%
FSA* PRE-TAX PREMIUM PAYMENTS*
e x h i b i T 12.8
Among Firms o ffer ing health benef its, Percentage of Fi rms o ffer ing Flexible Spending Accounts and Pre -Tax Premium Payments, by Firm Size, 2007
* estimate is statistically different between All Small Firms and All large Firms within category (p<.05).
note: Section 125 of the internal revenue Service code permits employees to pay for health insurance premiums with pre-tax dollars. Section 125 also allows the establishment of flexible spending accounts (FSAs). An FSA allows employees to set aside funds on a pre-tax basis to pay for medical expenses not covered by health insurance. Typically, employees decide at the beginning of the year how much to set aside in a FSA, and their employer deducts that amount from the employee’s paycheck over the year. Funds set aside in a FSA must be used by the end of the year or are forfeited by the employee. FSAs are different from hrAs and hSAs.
Kaiser/hreT Survey of employer-Sponsored health benefits, 2007.
s o u r c E :

section
twelve
Em
ployer Opinions and Practices
12
Employer Health Benefits 2 0 0 7 An n u a l S u r vey
170
T h e K A i S e r FA m i ly F o u n d AT i o n - A n d - h e A lT h r e S e A r c h A n d e d u c AT i o n A l T r u S T
7%
6%87%
More Than Last Year
Less Than Last Year
Same As Last Year
e x h i b i T 12.9
distr ibution of covered Workers by a one -year change in level of health benef its, o ther Than cost Shar ing, 2007
note: less than 1% of covered workers are in a plan that reported not having the same type of plan the year before.
Kaiser/hreT Survey of employer-Sponsored health benefits, 2007.
s o u r c E :

section
twelve
Em
ployer Opinions and Practices
12
Employer Health Benefits 2 0 0 7 An n u a l S u r vey
171
T h e K A i S e r FA m i ly F o u n d AT i o n - A n d - h e A lT h r e S e A r c h A n d e d u c AT i o n A l T r u S T
e x h i b i T 12.10
distr ibution of covered Workers by maximum lifetime benefit Payable to an employee with Single coverage, by Plan Type and Firm Size, 2007
* distributions are statistically different between All Small Firms and All large Firms (p<.05).
Kaiser/hreT Survey of employer-Sponsored health benefits, 2007.
s o u r c E :
less than $1,000,000 – $2,000,000 no $1,000,000 $1,999,999 or more limit
HMO*
All Small Firms (3-199 Workers) 0% 6% 8% 87%
All large Firms (200 or more Workers) 0 11 18 71
All HMO Plans 0% 9% 15% 76%
PPO
All Small Firms (3-199 Workers) 1% 25% 41% 32%
All large Firms (200 or more Workers) 1 28 37 34
All PPO Plans 1% 27% 38% 33%
POS
All Small Firms (3-199 Workers) 0% 11% 26% 62%
All large Firms (200 or more Workers) 0 30 28 42
All POS Plans 0% 20% 27% 53%
HDHP/SO
All Small Firms (3-199 Workers) 0% 7% 64% 30%
All large Firms (200 or more Workers) 0 18 44 37
All HDHP/SOs 0% 13% 54% 33%
ALL PLANS
All Small Firms (3-199 Workers) 1% 17% 33% 50%
All large Firms (200 or more Workers) 1 24 32 43
ALL FIRMS 1% 22% 32% 45%
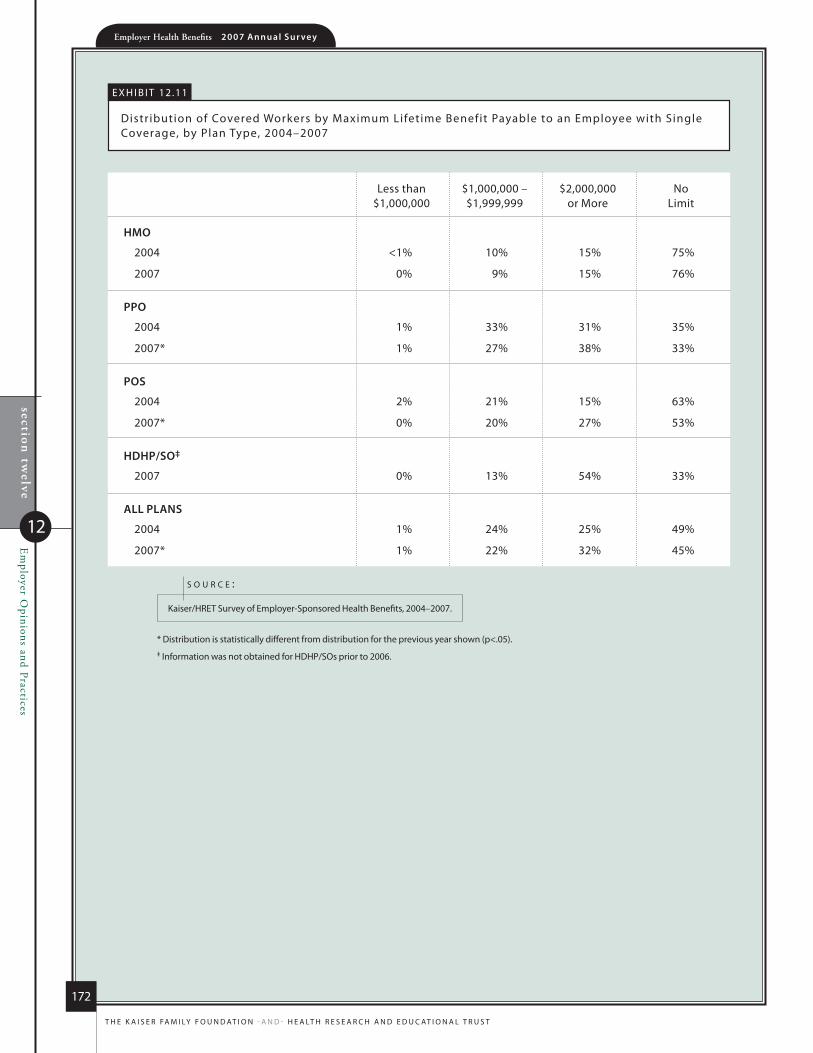
section
twelve
Em
ployer Opinions and Practices
12
Employer Health Benefits 2 0 0 7 An n u a l S u r vey
172
T h e K A i S e r FA m i ly F o u n d AT i o n - A n d - h e A lT h r e S e A r c h A n d e d u c AT i o n A l T r u S T
e x h i b i T 12.11
distr ibution of covered Workers by maximum lifetime benefit Payable to an employee with Single coverage, by Plan Type, 2004–2007
* distribution is statistically different from distribution for the previous year shown (p<.05). ‡ information was not obtained for hdhP/Sos prior to 2006.
Kaiser/hreT Survey of employer-Sponsored health benefits, 2004–2007.
s o u r c E :
less than $1,000,000 – $2,000,000 no $1,000,000 $1,999,999 or more limit
HMO
2004 <1% 10% 15% 75%
2007 0% 9% 15% 76%
PPO
2004 1% 33% 31% 35%
2007* 1% 27% 38% 33%
POS
2004 2% 21% 15% 63%
2007* 0% 20% 27% 53%
HDHP/SO‡
2007 0% 13% 54% 33%
ALL PLANS
2004 1% 24% 25% 49%
2007* 1% 22% 32% 45%

0%
2%
4%
6%
8%
10%
2%
4%
6%
8%
10%
12%
14%
16%
18%
1993 19941988 1989 1990 1991 1992 1995 1996
5.3%*
8.5%
12.0%
18.0%
14.0%
12.9%*
8.2%*
11.2%
9.2%*
7.7%*
6.1%*
0.8%
10.9%*
13.9%
19991997 1998 20012000 2002 2003 2004 2005 2006 2007
2007
Individual copies of this publication (#7672) are available on the Kaiser Family Foundation’s website at www.kff.org.
Multiple copies may be obtained from HRET by calling 1-800-242-2626 (order #097517).
September 2007
Employer H
ealth Benefits 20
07
An
nu
Al
Su
Rv
Ey
T
HE
KA
ISE
R F
AM
Ily F
ou
nd
AT
Ion
-An
d- H
EA
lTH
RE
SE
AR
cH
An
d E
du
cA
TIo
nA
l T
Ru
ST
- and-
The Henry J. Kaiser Family Foundation
Headquarters
2400 Sand Hill RoadMenlo Park, cA 94025
Phone 650-854-9400 Fax 650-854-4800
Washington offices and
Barbara Jordan conference center
1330 G Street, nW
Washington, dc 20005
Phone 202-347-5270 Fax 202-347-5274
www.kff.org
Health Research and Education Trust
chicago office
1 north Franklin Street chicago, Il 60606
Phone 312-422-2600 Fax 312-422-4568
Washington office
325 7th Street, nW
Washington, dc 20004
Phone 202-626-2276 Fax 202-626-2689
www.hret.org
-and-
T H E K A I S E R F A M I l y F o u n d A T I o n
- A N D -
H E A l T H R E S E A R c H A n d
E d u c A T I o n A l T R u S T
2 0 0 7A n n u a l S u r v e y
EmployerHeal th
Benef i t s