Employees’ Retirement System June 30, 2010 Actuarial Valuation … · 2011. 1. 13. · At your...
67
San Diego City Employees’ Retirement System June 30, 2010 Actuarial Valuation for the City of San Diego Produced by Cheiron January 2011
Transcript of Employees’ Retirement System June 30, 2010 Actuarial Valuation … · 2011. 1. 13. · At your...

San Diego City Employees’ Retirement System
June 30, 2010
Actuarial Valuation for the
City of San Diego
Produced by Cheiron
January 2011

Table of Contents Letter of Transmittal ............................................................................................................ i Section I – Board Summary.................................................................................................1 Section II – Assets .............................................................................................................14 Section III – Liabilities ......................................................................................................19 Section IV – Contributions ................................................................................................24 Section V – Accounting Statement Information................................................................27 Appendix A – Membership Information............................................................................32 Appendix B – Actuarial Assumptions and Methods..........................................................45 Appendix C – Summary of Plan Provisions ......................................................................53 Appendix D – Glossary of Terms .....................................................................................62

LETTER OF TRANSMITTAL January 7, 2011 Board of Administration San Diego City Employees’ Retirement System 401 West A Street, Suite 400 San Diego, CA 92101 Dear Members of the Board: At your request, we performed the June 30, 2010 actuarial valuation of the San Diego City Employees’ Retirement System (SDCERS). The valuation results with respect to the City of San Diego (City) are contained in this valuation report. The table below presents the key results of the valuation for the City.
Valuation Date 6/30/2010 6/30/2009Unfunded Actuarial Liability (in millions) 2,145.2$ 2,106.4$ Funding Ratio 67.1% 66.5%City Contribution Rate 42.68% 41.75%
Fiscal Year 2012 2011
Annual Required Contribution (GASB): -if paid at the beginning of the year $ 231.2 million $ 229.1 million -if paid throughout the year $ 240.0 million $ 237.8 million
Table I-1SDCERS - City of San Diego
Unfunded Actuarial Liability (UAL): The City’s UAL has increased by $38.8 million.
This increase was $19.9 million less than expected, as liabilities grew less than expected, contributions paid were greater than expected, and the correction of underpriced purchased service contracts will produce additional savings. The primary cause contributing to an increase is that the actuarial smoothing method continued to phase-in the significant investment loss experienced during the 2009 fiscal year.
Funding Ratio: This is the ratio of the system’s actuarial value of assets to actuarial
liabilities, which increased by 0.6%. Contributions (GASB ARC): City contributions were determined under full compliance
with the Governmental Accounting Standards Board (GASB) Statement Number 25, defining the annual required contribution (ARC) for the City for fiscal year July 1, 2011 through June 30, 2012 (FY 2012). The results of this valuation produced an increase in the City’s ARC of $2.1 million. When measured as a percent of membership payroll, the ARC rose by 0.93%.
i

Board of Administration January 7, 2011 Page ii
More details on Plan experience for the past year and its impact on the June 30, 2010 valuation results can be found in the valuation report. We certify that, to the best of our knowledge, this valuation report is complete and accurate and has been prepared in accordance with generally recognized and accepted actuarial principles and practices which are consistent with the Code of Professional Conduct and applicable actuarial standards set out by the Actuarial Standards Board, including Actuarial Standards of Practice (ASOPs) Nos. 4, 27, 35 and 44. In preparing our report, we relied without audit, on information supplied by SDCERS’ staff. This information includes, but is not limited to, plan provisions, employee data, and financial information. Finally, it is important to note that this valuation was prepared using census data and financial information as of the valuation date, June 30, 2010. Therefore, changes in membership and investment experience following that date are not reflected in this report. The next valuation will reflect all membership and investment experience changes through June 30, 2011. Sincerely, Cheiron Gene Kalwarski, FSA, EA, MAAA Principal Consulting Actuary cc: Bill Hallmark
David Holland Alice Alsberghe

SDCERS-CITY OF SAN DIEGO JUNE 30, 2010 ACTUARIAL VALUATION
SECTION I BOARD SUMMARY
1
The primary purpose of the actuarial valuation is to report, as of the valuation date, on the following: The financial condition of the SDCERS-City of San Diego Defined Benefit Plan, Past and expected trends in the financial condition of SDCERS-City of San Diego, The City’s contribution rates for Fiscal Year 2012, and Information required by the Governmental Accounting Standards Board (GASB). In this Section, we present a summary of the principal valuation results. This summary includes the basis upon which the June 30, 2010 valuation was completed and an examination of the current financial condition of SDCERS-City of San Diego. In addition, we present a review of the key historical trends followed by the projected financial outlook for SDCERS-City of San Diego. A. Valuation Basis The City’s June 30, 2010 valuation results include one difference from the basis used in the June 30, 2009 valuation. This difference is a $50 million reduction in the UAL due to the estimated impact on the City’s unfunded actuarial liability (UAL) from the correction of underpriced purchased service contracts during the 2003 “window” period. The UAL reduction was determined by increasing the actuarial value of assets by $50 million, which in turn directly reduces the UAL by the same amount. The $50 million reduction in the UAL was based on anticipating that approximately 50% of the total potential cost savings to the City (if all contracts were corrected) would be achieved due to (1) assuming some portion of the contracts would not be corrected (e.g., certain retirees), and (2) that there would be anti-selection by members in which correction option they elect. It is important to note that this is an estimate and was not scientifically derived, because the City has not yet made its final decisions as to potential relief that may impact the corrective choices given to each affected group of members. Until the affected members actually select an option for correction, we will not be able to measure the anti-selection impact. However, we do anticipate there will be both increases in assets and reductions in liabilities that result from member selections. At this time, we believe it is reasonable to recognize approximately one-half of this impact as a UAL reduction in this valuation. In addition to determining the potential long-term savings due to the correction described above, there is the issue as to which fiscal year the reduction to the City’s annual required contribution (ARC) should first apply. It is our understanding that the judicial decision on the corrective action took place in June 2010, prior to the Board’s approval in early July 2010, of the final Fiscal Year 2011 City ARC. However, the FY 2011 City ARC of $229.1 million (which was based on the June 30, 2009 actuarial valuation) did not reflect any potential reduction to the UAL. This June 30, 2010 valuation and the resulting FY 2012 City ARC therefore reflect the “overpayment” made in FY 2011. The 2010 valuation adjustment assumes a double

SDCERS-CITY OF SAN DIEGO JUNE 30, 2010 ACTUARIAL VALUATION
SECTION I BOARD SUMMARY
2
amortization payment credit towards the $50 million anticipated savings, for this year only. This results in a reduction in the FY 2012 City ARC of $8.8 million, as opposed to the reduction of $4.4 million that would otherwise have occurred.
All assumptions and methods remain the same as in the June 30, 2009 valuation. More details on the assumptions and methods can be found in Appendix B. Finally, throughout this report there will be references to General-Old Plan, General-2009 Plan, Police-Old Plan and Police-2009 Plan. “Old Plan” refers to General and Police Members hired before July 25, 2009, and “2009 Plan” refers to such members hired on or after July 25, 2009. Details on their plan provisions can be found in Appendix C.

SDCERS-CITY OF SAN DIEGO JUNE 30, 2010 ACTUARIAL VALUATION
SECTION I BOARD SUMMARY
3
B. Current Financial Condition of SDCERS-City of San Diego The following discussion summarizes the key results of the June 30, 2010 valuation and how they compare to the results from the June 30, 2009 valuation. 1. City Membership Table I-2 shows that total membership in SDCERS-City of San Diego increased by 0.6% from 2009 to 2010. The increase was attributable to the growth in inactive membership (terminated vested, disabled, retirees, and beneficiaries), as the active membership count actually declined. Active Member payroll decreased by 1.2%, compared to the assumed payroll inflation of 4%.
Item June 30, 2010 June 30, 2009 % ChangeActive Counts 8,120 8,273 -1.8%
Terminated Vested 2,874 2,827 1.7%Disabled 1,241 1,257 -1.3%Retirees 5,189 4,975 4.3%
Beneficiaries 1,151 1,137 1.2%Total City Members 18,575 18,469 0.6%
Active Member Payroll 530,238,355$ 536,591,287$ -1.2%Average Pay per Active Member 65,300$ 64,861$ 0.7%
SDCERS - City of San Diego - Membership TotalTable I-2

SDCERS-CITY OF SAN DIEGO JUNE 30, 2010 ACTUARIAL VALUATION
SECTION I BOARD SUMMARY
4
2. City Assets and Liabilities Table I-3 presents a comparison between the June 30, 2010 and June 30, 2009 SDCERS-City of San Diego assets, liabilities, unfunded actuarial liability, and funding ratios. The key results shown in Table I-3 indicate that due to the total actuarial liability increase of 3.9% and the actuarial value of assets increase of 5.0%, the funding ratio increased from 66.5% as of June 30, 2009 to 67.1% as of June 30, 2010. SDCERS employs a commonly used actuarial smoothing method on the market value that dampens market volatility, so the actuarial value of assets did not increase as much as the market value (12.1%). The actuarial value of assets includes an adjustment for the anticipated impact from the correction of underpriced purchased service contracts during the 2003 “window” period. Section II-C provides additional information explaining the development of the actuarial value of assets.
Entry Age Normal (EAN) Liabilities June 30, 2010 June 30, 2009 % ChangeActives 2,350,543,474$ 2,353,326,545$ -0.1%
Terminated Vested 264,567,702 255,124,776 3.7%Disabled 414,366,545 408,598,894 1.4%Retirees 3,344,070,643 3,118,227,002 7.2%
Beneficiaries 153,675,387 146,358,891 5.0%Total Actuarial (EAN) Liability 6,527,223,751$ 6,281,636,108$ 3.9%
Market Value Assets 3,900,537,904$ 3,479,357,154$ 12.1%Actuarial Value Assets 4,382,047,254$ 4,175,228,585$ 5.0%
Unfunded Actuarial Liability 2,145,176,496$ 2,106,407,523$ 1.8%
Funding Ratio-Actuarial Value 67.1% 66.5% 0.6%
Table I-3SDCERS - City of San Diego - Assets & Liabilities

SDCERS-CITY OF SAN DIEGO JUNE 30, 2010 ACTUARIAL VALUATION
SECTION I BOARD SUMMARY
5
3. Components of UAL Change between June 30, 2009 and June 30, 2010 The unfunded actuarial liability (UAL) for SDCERS-City of San Diego increased by $38.8 million, from $2,106.4 million to $2,145.2 million. Table I-4 below presents the specific components of the change in the UAL. The key finding in Table I-4 is that investment experience increased the UAL by $141.5 million. Liability experience decreased the UAL by $71.6 million. Contributions in excess of expected and the anticipated purchased service correction also had an impact on the UAL.
1. UAL at June 30, 2009 2,106.4$ 2. Investment experience loss 141.5 3. Purchased service credits paid for during the year * 1.1 4. Liability experience gain (71.6)
5. Contributions paid in excess of expected (40.9) 6. Anticipated reduction in unfunded actuarial liability from PSC correction (50.0) 7. Expected change in UAL 58.7 8. Total change in UAL: sum of 2 through 7 38.8
9. UAL at June 30, 2010: 1 + 8 2,145.2$
Table I-4SDCERS - City of San Diego-Change in UAL
(In Millions)
* Attributable to Members who have entered into a purchased service credit contract after June 30, 2009.
Only Members hired before July 1, 2005 are still eligible to purchase additional “airtime” service credits.

SDCERS-CITY OF SAN DIEGO JUNE 30, 2010 ACTUARIAL VALUATION
SECTION I BOARD SUMMARY
6
4. City Contributions The City’s contribution for FY 2012 measured as a percent of membership payroll increased from 41.75% to 42.68%. In dollars, the required beginning of year contribution increased by $2.1 million, from $229.1 million to $231.2 million. This increase in the ARC was $7 million less than expected, as liabilities grew less than expected, contributions paid were greater than expected, and the correction of underpriced purchased service contracts produced additional savings. The primary cause contributing to an increase was the continued phase-in under the asset smoothing method of the significant investment losses during the 2009 fiscal year. In Section IV we provide more detail on the development of this contribution rate.
EAN Funding Method June 30, 2010 June 30, 2009 % ChangeTotal Normal Cost % Projected to FY 2012* 23.63% 23.28% 0.35%Members Contribution % Projected to FY 2012* 11.97% 12.14% -0.16%Employer Normal Cost % Projected to FY 2012* 11.66% 11.14% 0.51%Employer Unfunded Liability Cost % 31.02% 30.61% 0.41%
Negative Amortization Adjustment Cost % 0.00% 0.00% 0.00%Total Employer Cost % 42.68% 41.75% 0.93%
Annual Required Contribution (GASB):
-if paid at the beginning of the year $ 231.2 million $ 229.1 million 0.94% -if paid throughout the year $ 240.0 million $ 237.8 million 0.94%
The total $231.2 million ARC is made up of the following components:in millions Beginning of Year ARC Component
$ 63.2 Employer Normal Cost91.3 17-year amortization of the outstanding 2007 UAL balance at 6/30/20115.2 28-year amortization of the FY 2008 UAL increase due to assumptions changes 1.3 13-year amortization of the UAL due to the experience loss in FY 2008
76.7 14-year amortization of the UAL due to the experience loss in FY 2009(8.8) 14-year amortization of the UAL due to the PSC correction adjustment in FY 2010
2.4 15-year amortization of the UAL due to the experience loss in FY 20100.0 Amount needed to avoid negative amortization of UAL for FY 2012
$ 231.2 Total FY 2012 beginning of year ARC
Table I-5SDCERS - City of San Diego - Contributions
* These represent projected fiscal year 2012 (2011 for June 30, 2009) payroll-weighted averages of General and Police Members (new Plans for hires on or after July 25, 2009) and Elected, Fire and Lifeguard Members (no change).
Note: The differing amortization periods above for the respective tiers of the UAL were approved by the SDCERS Board effective with the June 30, 2007 valuation.

SDCERS-CITY OF SAN DIEGO JUNE 30, 2010 ACTUARIAL VALUATION
SECTION I BOARD SUMMARY
7
C. Historical Trends for SDCERS-City of San Diego Despite the fact that most of the attention given to the valuation focuses on the most recently computed unfunded actuarial liability (UAL), funding ratio, and the City’s contribution rate, it is important to remember that each valuation is merely a snapshot of the long-term progress of a pension fund. It is more important to judge a current year’s valuation result relative to historical trends, and trends expected into the future. In the chart below, we present the historical trends of the market value and smoothed assets compared to actuarial liabilities and SDCERS-City of San Diego funding ratios since 2000.
SDCERS-City of San Diego Assets and Liabilities 2000-2010
Funding Ratio 97.3% 89.9% 77.3% 67.2% 65.8% 68.2% 79.9% 78.8% 78.1% 66.5% 67.1%UAL (billions) 0.07$ 0.28$ 0.72$ 1.16$ 1.37$ 1.39$ 1.00$ 1.18$ 1.30$ 2.11$ 2.15$ *
$0.0
$1.0
$2.0
$3.0
$4.0
$5.0
$6.0
$7.0
2000 2001 2002 2003 2004 2005 2006 2007 2008 2009 2010
Bill
ions
Actuarial Liability Assets-Smoothed Assets at Market Value
*The UAL for 2007 and after is calculated using the Entry Age Normal method; 2006 and prior years are calculated using the Projected Unit Credit method.
The chart indicates that from 2000 to 2004, the funding ratio declined significantly with the low of 65.8% in 2004. From 2004 to 2008, the ratio improved significantly, primarily due to strong investment performance. In 2009, the funding ratio declined significantly due to investment losses.

SDCERS-CITY OF SAN DIEGO JUNE 30, 2010 ACTUARIAL VALUATION
SECTION I BOARD SUMMARY
8
In the chart below, we present the historical trends for the SDCERS-City of San Diego contribution rates since FY 2002, as well as actual contributions made by the City and the actuarially computed GASB ARC since FY 2003.
SDCERS-City of San Diego City and Member Contribution Rates FY 2002-2012
0%
5%
10%
15%
20%
25%
30%
35%
40%
45%
50%
2002 2003 2004 2005 2006 2007 2008 2009 2010 2011 2012
Fiscal Year
Con
trib
uti
on a
s %
of P
ayro
ll
$0
$50
$100
$150
$200
$250
$300
Con
trib
uti
ons
in m
illi
ons
of d
olla
rs
GASB ARC $ City Contributions $Computed Employer Rate % Employee's Rate %
The computed employer contribution rate grew from under 15% in FY 2002 to nearly 30% in FY 2005, and then remained in that range for the next five fiscal years. For FY 2011, the computed employer rate increased to over 40% of payroll, and it increased again slightly for FY 2012. The chart indicates that the Members’ contribution rate has remained relatively stable throughout the fiscal years shown in contrast to the volatility in the employer rates. This chart also compares, beginning in fiscal year 2003, the actual contributions made by the City to the annual required contribution (ARC) based on the Board’s adopted funding practice of Normal Cost plus amortization of the various UAL components, including the requirement beginning in fiscal year 2009 that there be no negative amortization. The chart indicates that the City has been consistently paying more than the ARC since FY 2006. For FY 2010, City contributions were significantly in excess of expected due to the final McGuigan settlement payment.

SDCERS-CITY OF SAN DIEGO JUNE 30, 2010 ACTUARIAL VALUATION
SECTION I BOARD SUMMARY
9
The chart below for SDCERS-City of San Diego presents the pattern of annual gains and losses, broken into the investment and liability components. The chart does not include any changes in SDCERS’ assets and liabilities attributable to changes to actuarial methods, procedures or assumptions.
SDCERS-City of San Diego Historical Gain/(Loss) 2000-2010
($900)
($800)
($700)
($600)
($500)
($400)
($300)
($200)
($100)
$0
$100
$200
$300
2000 2001 2002 2003 2004 2005 2006 2007 2008 2009 2010
Mill
ions
Plan Year Ending
Investment G/(L) Liability G/(L) Net Experience G/(L)
The key insights from this chart are: Investment gains (gold bars) during 2000 were offset by investment losses from 2001
through 2003. From 2004 to 2007, there were additional investment gains, but the investment losses of 2008 through 2010 more than offset those gains.
The investment loss in 2009 was by far the most significant gain or loss during the last ten
years.
From 1999 to 2007 (except for 2006), there was a pattern of liability losses. With the change in actuarial assumptions in 2008 to better reflect the City’s demographic experience, experience for the Plan over the last three years has been close to expected.

SDCERS-CITY OF SAN DIEGO JUNE 30, 2010 ACTUARIAL VALUATION
SECTION I BOARD SUMMARY
10
D. Projected Financial Trends Our analysis of SDCERS-City of San Diego projected financial trends is an important part of this valuation. Our assessment of the implications of the June 30, 2010 valuation results on the future outlook of SDCERS-City of San Diego in terms of benefit security (assets over liabilities) and the City’s expected cost progression is set forth below. In addition, given the concern regarding unfunded liabilities, we also show the City’s expected future pay down of unfunded liabilities. In the charts that follow, we project the SDCERS-City of San Diego assets and liabilities, the pay down of UAL, and the City’s contributions as a percent of payroll on two different bases:
1) Assuming 7.75% returns each and every year, and 2) Assuming returns shown in the table below which begin with rates of return that start at
positive 12% then vary each year thereafter over the projection period, but over the entire period average out to the assumed 7.75%.
Fiscal Year Beg 2010 2011 2012 2013 2014 2015 2016 2017 2018 2019
Return 12.00% 10.63% 7.11% 9.42% 8.45% 3.77% 12.66% 0.63% 13.24% -4.18%
Fiscal Year Beg 2020 2021 2022 2023 2024 2025 2026 2027 2028 2029Return 2.50% 4.94% 11.71% 19.86% 9.33% 9.99% 0.76% 13.05% 12.44% 1.24%
Fiscal Year Beg 2030 2031 2032 2033 2034 2035 2036 2037 2038 2039Return 1.18% 13.12% 6.80% 5.62% 6.46% 21.06% 3.56% 9.06% 3.25% 2.90%

SDCERS-CITY OF SAN DIEGO JUNE 30, 2010 ACTUARIAL VALUATION
SECTION I BOARD SUMMARY
11
Projection Set 1: Assets and Liabilities - City of San Diego The charts below show asset measures (green and gold lines) compared to liabilities (grey bars). The most revealing insight from these two charts is how varying investment returns can dramatically impact SDCERS-City of San Diego funding ratios.
Chart 1: Projection of Assets and Liabilities, 7.75% return each year
$0
$5,000
$10,000
$15,000
$20,000
$25,000
2010 2012 2014 2016 2018 2020 2022 2024 2026 2028 2030 2032 2034 2036 2038 2040
Mill
ion
s
67% 67% 68% 71% 74% 78% 83% 88% 93% 97% 98% 99% 99% 99% 100% 100%
Chart 2: Projection of Assets and Liabilities, varying returns averaging 7.75%
$0
$5,000
$10,000
$15,000
$20,000
$25,000
2010 2012 2014 2016 2018 2020 2022 2024 2026 2028 2030 2032 2034 2036 2038 2040
Mill
ion
s
67% 68% 71% 74% 77% 79% 78% 83% 92% 96% 99% 98% 98% 100% 103% 100%
Actuarial Liability Actuarial Value of Assets Market Value of Assets

SDCERS-CITY OF SAN DIEGO JUNE 30, 2010 ACTUARIAL VALUATION
SECTION I BOARD SUMMARY
12
Projection Set 2: Pay down of the Unfunded Actuarial Liability (UAL) – City of San Diego
Choice of an amortization period is significant when viewing the projected pay down of the UAL, especially when one is assuming level investment returns, as in the chart to the left below. The chart to the right demonstrates that varying returns (which always happen) will have a dramatic impact on the annually computed UAL. Chart 1: 7.75% return each year
$0
$500
$1,000
$1,500
$2,000
$2,500
2010 2013 2016 2019 2022 2025 2028 2031 2034 2037 2040
Mil
lio
ns
UAL in nominal dollars
Chart 2: Varying returns averaging 7.75%
$0
$500
$1,000
$1,500
$2,000
$2,500
2010 2013 2016 2019 2022 2025 2028 2031 2034 2037 2040
Mil
lio
ns
UAL in nominal dollars

SDCERS-CITY OF SAN DIEGO JUNE 30, 2010 ACTUARIAL VALUATION
SECTION I BOARD SUMMARY
13
Projection Set 3: Projected Contribution Rate – City of San Diego
As seen on the chart to the right below, varying returns will also have a significant impact on the actuarially computed City contribution rate.
Chart 1: 7.75% return each year
43.3% 44.3%47.0% 48.6% 49.6% 50.1% 50.4% 50.4%
37.2%
17.5% 15.3% 14.0% 13.2% 12.8% 12.5%11.4%
0%
10%
20%
30%
40%
50%
60%
2010 2012 2014 2016 2018 2020 2022 2024 2026 2028 2030 2032 2034 2036 2038 2040
Chart 2: Varying returns averaging 7.75%
43.3% 43.7% 44.8% 44.9% 45.2% 46.2%51.1%
54.7%
39.0%
19.7%16.5% 17.6% 17.2% 16.6%
8.5% 7.0%
0%
10%
20%
30%
40%
50%
60%
2010 2012 2014 2016 2018 2020 2022 2024 2026 2028 2030 2032 2034 2036 2038 2040

SDCERS-CITY OF SAN DIEGO JUNE 30, 2010 ACTUARIAL VALUATION
SECTION II ASSETS
14
Like other public pension plans, SDCERS uses two different asset measurements that are presented in this section: the market value and the actuarial value of assets. The market value represents, as of the valuation date, the value of the assets if they were liquidated on that date. The actuarial value of assets is a value that smoothes annual investment performance over multiple years to reduce the impact of annual investment volatility on employer contribution rates. The actuarial value of assets is used in determining SDCERS’ contribution rates for the three participating employer plans. Each employer receives a separate actuarial valuation report and cost determination. However, the assets of all employer plans are pooled for investment purposes. The apportionment of the assets among the employer plans directly impacts each employer’s costs. Therefore, in the interest of ensuring transparency, this section discloses information on the total assets of SDCERS-All Employers. In addition, a brief explanation of how those assets are apportioned to the City of San Diego, the San Diego Unified Port District (Port), and the San Diego County Regional Airport Authority (Airport) is included. On the following pages, detailed information is presented on SDCERS-All Employers assets, including:
A. Disclosure of the June 30, 2010 total SDCERS market value of assets, by asset class B. Market value of assets by Plan Sponsor
C. Development of the actuarial value of assets
D. Disclosure of the investment performance for the year

SDCERS-CITY OF SAN DIEGO JUNE 30, 2010 ACTUARIAL VALUATION
SECTION II ASSETS
15
A. Disclosure of Market Value of Assets The market value of assets represents a “snap-shot” value as of June 30, 2010, the last day of the fiscal year, which provides the principal basis for measuring financial performance from one year to the next. Market values, however, can fluctuate widely with swings in the investment markets. Because these fluctuations would cause volatility in employer contributions, an actuarial value of assets is developed. Table II-1 below discloses the market value by asset class of SDCERS – All Employers’ gross assets on June 30, 2010.
Cash $ 404,512,990 US Stocks 1,765,725,670International Stocks 655,440,664Private Equity 37,823,836Bonds 978,974,358Real Estate 360,989,315Receivables 85,028,511Short Term Investments 36,444,032Miscellaneous 1,624,429Accounts Payable (149,321,655)
Market Value of Assets – June 30, 2010 $ 4,177,242,150
Table II-1SDCERS – All Employers
Summary of Reported Market Value of Total Defined Benefit Plan Assets

SDCERS-CITY OF SAN DIEGO JUNE 30, 2010 ACTUARIAL VALUATION
SECTION II ASSETS
16
B. Market Value of Assets by Plan Sponsor As of July 1, 2007, the City, Unified Port District and Airport Authority plans were separated into independent, qualified, single employer governmental defined benefit plans and trusts. The assets of the three separate plans and trusts are pooled in the SDCERS Group Trust, which was established as of July 1, 2007. SDCERS invests and administers the Group Trust as a common investment fund and accounts separately for the proportional interest of each plan and trust that participates in the Group Trust. Cash flow activity for each plan is recorded directly to that plan, with investment activity and other cash flow activity not specific to any one plan being allocated based upon each plan’s respective share of the Group Trust’s total assets, with time-weighted adjustments for the plan-specific cash flows. Table II-2 below discloses the market value of assets by plan.
Market Value Market Value Actuarial Value
Total Net Assets Total Net Assets Total AssetsJune 30, 2009 June 30, 2010 June 30, 2010
City of San Diego $ 3,479,357,154 $ 3,900,537,904 $ 4,382,047,254
Unified Port District 186,565,603 211,908,439 233,788,278
Airport Authority 49,150,920 64,795,807 71,650,892
Total-SDCERS $ 3,715,073,678 $ 4,177,242,150 $ 4,687,486,424
Table II-2Summary of Market and Actuarial Assets for Each Employer Group
as of June 30, 2010

SDCERS-CITY OF SAN DIEGO JUNE 30, 2010 ACTUARIAL VALUATION
SECTION II ASSETS
17
C. Actuarial Value of Assets
To determine on-going funding requirements, most pension funds utilize an actuarial value of assets. Unlike the market value of assets, the actuarial value of assets represents an asset value based on averaging or smoothing year-to-year market value returns for purposes of reducing the resulting volatility on contributions.
The actuarial value of assets is equal to 100% of the expected actuarial value of assets as of June 30, 2010 (assuming 7.75% earnings for the year) plus 25% of the difference between the current actual market value of assets and the expected actuarial value of assets. (See Appendix B, section B-2 for further explanation of the asset valuation method). In no event will the actuarial value of assets ever be less than 80% of the market value of assets nor greater than 120% of the market value of assets.
1. Actuarial Value of Assets at June 30, 2009 $ 4,175,228,585
2. Amount in (1) with interest at 7.75% to June 30, 2010 4,498,808,800
3. Employer and Member contributions for the Plan Year ended 258,278,706 June 30, 2010
4. Disbursements from Trust excluding investment expenses, 286,945,217 June 30, 2009 through June 30, 2010
5. Interest on cash flows to June 30, 2010 at 7.75% per year 5,741,415
6. Expected Actuarial Value of Assets at June 30, 2010= (2) + (3) – (4) + (5) 4,475,883,704
7. Actual Market Value of Assets at June 30, 2010 3,900,537,904
8. Excess of (7) over (6) (575,345,800)
9. Preliminary Actuarial Value of Assets at June 30, 2010 $ 4,332,047,254 = (6) + 25% of (8)
10. Adjustment for Correction of Purchased Service Underpricing 50,000,000
11. 80% Minimum Corridor on the Actuarial Value of Assets 3,120,430,324 = 80% of (7)
12. 120% Maximum Corridor on the Actuarial Value of Assets 4,680,645,485 = 120% of (7)
13. Final Actuarial Value of Assets at June 30, 2010 $ 4,382,047,254 = (9) + (10), but no less than (11) and no more than (12)
Table II-3SDCERS - City of San Diego
Development of Actuarial Value of Assets at June 30, 2010
Expected Value of Assets Method

SDCERS-CITY OF SAN DIEGO JUNE 30, 2010 ACTUARIAL VALUATION
SECTION II ASSETS
18
D. Investment Performance The return on the market value of assets, as reported by SDCERS’ investment consultant Hewitt Ennis Knupp, was 13.4%. The return in FY 2009 was negative 19.2%. On an actuarial (smoothed) value of assets basis, the return for FY 2010 was 4.47%. This return produced for SDCERS-All Employers an overall investment loss of $150.8 million for the year ending June 30, 2010. (Note this reported loss is different than the investment loss of $141.5 million reported on page 5 in this report. The latter is the loss only for the City of San Diego.)

SDCERS-CITY OF SAN DIEGO JUNE 30, 2010 ACTUARIAL VALUATION
SECTION III LIABILITIES
19
In this section, we present detailed information on liabilities for SDCERS-City of San Diego, including: Disclosure of liabilities at June 30, 2009 and June 30, 2010, and Statement of changes in the unfunded actuarial liabilities during the year. A. Disclosure Several types of liabilities are calculated and presented in this report. Each type is distinguished by the purpose for which the figures are ultimately used. Present Value of Future Benefits: Used for measuring all future SDCERS obligations,
represents the amount of money needed today to fully pay off all benefits of SDCERS both earned as of the valuation date and those to be earned in the future by current plan participants, under the current Plan provisions.
Actuarial Liability-Entry Age Normal (EAN): Used for determining employer
contributions and GASB accounting disclosures. This liability is calculated taking the present value of all future benefits and subtracting the present value of future Member contributions and future employer normal costs as determined under the EAN actuarial funding method. It represents the portion of the present value of future benefits attributed to service prior to the valuation date by the Entry Age Normal method.
Present Value of Accrued Benefits: Disclosed in Section V of this report for accounting
statement purposes (FASB 35). This liability represents the present value of future benefits payable to all plan participants if the plan were terminated as of the valuation date, and future accruals and contributions stopped.
Table III-1, on the following page, discloses the first two of these liabilities for the current and prior year valuations. Subtracting the actuarial value of assets from the actuarial liability results in a net surplus or an unfunded actuarial liability (UAL).

SDCERS-CITY OF SAN DIEGO JUNE 30, 2010 ACTUARIAL VALUATION
SECTION III LIABILITIES
20
Table III-1
Item June 30, 2010 June 30, 2009
Present Value of Future BenefitsActives 3,293,424,515$ 3,304,748,013$
Terminated Vested 264,567,702 255,124,776 Disabled 414,366,545 408,598,894 Retirees 3,344,070,643 3,118,227,002
Beneficiaries 153,675,387 146,358,891
Total City 7,470,104,792$ 7,233,057,576$
Actuarial Liability - EANTotal Present Value of Benefits 7,470,104,792$ 7,233,057,576$
Present Value of Future Normal CostsEmployer Portion 463,466,225 458,102,460 Employee Portion 479,414,816 493,319,007
Actuarial Liability - EAN 6,527,223,751$ 6,281,636,108$
Actuarial Value of Assets 4,382,047,254$ 4,175,228,585$ Unfunded EAN Actuarial Liability 2,145,176,496$ 2,106,407,523$
SDCERS - City of San Diego - Total
Table III-2 shows the actuarial liability as of June 30, 2010 for General and Elected Members of SDCERS-City of San Diego.
Item General General
Present Value of Future Benefits Total Old Plan 2009 Plan ElectedActives 1,832,940,642$ 1,818,089,749$ 12,637,670$ 2,213,223$
Terminated Vested 206,967,002 206,403,081 24,912 539,009 Disabled 79,374,143 79,374,143 - - Retirees 1,725,094,038 1,717,186,915 - 7,907,122
Beneficiaries 67,712,856 67,342,562 - 370,293
Total City General & Elected 3,912,088,681$ 3,888,396,451$ 12,662,582$ 11,029,647$
Actuarial Liability - EANActives 1,350,128,563$ 1,349,469,011$ -$ 659,552$
Terminated Vested 206,967,002 206,403,081 24,912 539,009 Disabled 79,374,143 79,374,143 - - Retirees 1,725,094,038 1,717,186,915 - 7,907,122
Beneficiaries 67,712,856 67,342,562 - 370,293
Total City General & Elected 3,429,276,601$ 3,419,775,713$ 24,912$ 9,475,976$
Table III-2SDCERS - City of San Diego - General & Elected as of June 30, 2010

SDCERS-CITY OF SAN DIEGO JUNE 30, 2010 ACTUARIAL VALUATION
SECTION III LIABILITIES
21
Table III-3 shows the actuarial liability as of June 30, 2010 for Safety Members of SDCERS-City of San Diego.
Item Police Police
Present Value of Benefits Total Old Plan 2009 Plan Fire LifeguardActives 1,460,483,873$ 980,942,344$ 17,789,469$ 416,652,434$ 45,099,626$
Terminated Vested 57,600,699 50,400,860 20,625 5,458,560 1,720,654 Disabled 334,992,401 221,838,756 - 103,332,119 9,821,526 Retirees 1,618,976,606 992,411,075 - 599,474,878 27,090,653
Beneficiaries 85,962,531 54,764,203 - 31,040,265 158,064
Total City Safety 3,558,016,111$ 2,300,357,238$ 17,810,094$ 1,155,958,256$ 83,890,523$
Actuarial Liability - EANActives 1,000,414,911$ 685,962,405$ -$ 282,650,329$ 31,802,177$
Terminated Vested 57,600,700 50,400,860 20,625 5,458,560 1,720,654 Disabled 334,992,401 221,838,756 - 103,332,119 9,821,526 Retirees 1,618,976,606 992,411,075 - 599,474,878 27,090,653
Beneficiaries 85,962,531 54,764,203 - 31,040,265 158,064
Total City Safety 3,097,947,150$ 2,005,377,299$ 20,625$ 1,021,956,151$ 70,593,074$
SDCERS - City of San Diego - Safety as of June 30, 2010Table III-3

SDCERS-CITY OF SAN DIEGO JUNE 30, 2010 ACTUARIAL VALUATION
SECTION III LIABILITIES
22
B. Changes in Unfunded Actuarial Liabilities The UAL of any retirement plan is expected to change at each subsequent valuation for a variety of reasons. In each valuation, we report on those elements of change in the UAL that have particular significance or could potentially affect the long-term financial outlook of a retirement plan. Below we present key changes in liabilities since the last valuation.
1. Unfunded Actuarial Liability at June 30, 2009 2,106.4$ 2. Beginning of year unfunded actuarial liability payment (97.1) 3. Interest accrued ((1+2) x 7.75%) 155.7 4. Expected Unfunded Actuarial Liability at June 30, 2010 (1+2+3) 2,165.1 5. Actual Unfunded Liability at June 30, 2010 2,145.2
6. Difference: (4 - 5) 19.9 7. Portion of difference (6) due to actuarial assumption or method changes - 8. Portion of difference (6) due to benefit changes - 9. Portion of difference (6) due to contributions more than expected 40.9 10. Portion of difference (6) due to anticipated impact of PSC correction 50.0 11. Portion of difference (6) due to net experience Gain/(Loss) (71.0)
a) portion of (11) due to investment experience (141.5)$ b) portion of (11) due to liability experience 70.5$
Elements of Liability Gain/(Loss)1. G/(L) due to demographic and payroll experience 71.6 2. G/(L) due to purchased service credit (1.1) 3. Other Gain/(Loss) - 4. Total Estimated Liability Gain/(Loss): sum 1 through 3 70.5$
Table III-4
Development of 2010 Experience Gain/(Loss) SDCERS - City of San Diego(In Millions)

SDCERS-CITY OF SAN DIEGO JUNE 30, 2010 ACTUARIAL VALUATION
SECTION III LIABILITIES
23
Table III-5 shows the history of past experience gains and losses.
Valuation Beginning-of-Year Gain/(Loss)Date Gain/(Loss) Actuarial Liabilities % of Liability
6/30/1992 57,952,320$ 1,006,299,729$ 5.8%6/30/1993 (42,605,778) 1,057,238,917 (4.0)6/30/1994 (6,744,850) 1,220,830,059 (0.6)6/30/1995 (11,370,990) 1,338,279,541 (0.8)
6/30/1996 59,592,960 1,476,710,662 4.0
6/30/1997 38,473,993 1,682,604,532 2.36/30/1998 31,086,010 1,822,432,018 1.76/30/1999 * 29,750,299 1,979,668,038 1.56/30/2000 286,639,160 2,181,547,453 13.16/30/2001 (193,168,984) 2,528,773,900 (7.6)
6/30/2002 (364,815,155) 2,809,537,745 (13.0)6/30/2003 (303,699,305) 3,168,921,175 (9.6)6/30/2004 (58,123,874) 3,532,625,521 (1.6)6/30/2005 36,775,882 3,997,328,084 0.96/30/2006 205,249,486 4,377,092,948 4.7
6/30/2007 35,189,811 4,982,699,455 0.76/30/2008 (49,930,537) 5,597,652,861 (0.9)6/30/2009 (818,906,079) 5,963,549,545 (13.7)6/30/2010 (71,030,037) 6,281,636,108 (1.1)
Table III-5
Experience Gain/(Loss) - Historical SDCERS - City of San Diego *
* Beginning with the June 30, 1999 valuation, experience is City only. The prior years include all employers.

SDCERS-CITY OF SAN DIEGO JUNE 30, 2010 ACTUARIAL VALUATION
SECTION IV CONTRIBUTIONS
24
In the process of evaluating the financial condition of any pension plan, the actuary analyzes the assets and liabilities to determine what level (if any) of contributions is needed to achieve and maintain an appropriate funded status of a plan. Typically, the actuarial process will use an actuarial funding method that attempts to create a pattern of contributions that is both stable and predictable. The actuarial funding methodology employed is the Entry Age Normal (EAN) actuarial funding method. Under EAN, there are two components to the total contribution: the normal cost and an amortization payment on the unfunded actuarial liability. The normal cost rate is determined by taking the value, as of entry age into the plan, of each Member’s projected future benefits. This value is then divided by the value, also at entry age, of each Member’s expected future salary. The normal cost rate is multiplied by current salary to determine each Member’s normal cost. Finally, the normal cost is reduced by the Member contribution to produce the employer normal cost. The difference between the EAN actuarial liability and the actuarial value of assets is the unfunded actuarial liability. The UAL for FY 2012 is to be amortized over several different periods. The fiscal year ending June 30, 2010 experience loss is amortized over 15 years, the June 30, 2010 UAL reduction from the anticipated impact of the PSC correction is amortized over 14 years (with a double credit in FY 2012 only, due to the “overpayment” in FY 2011), the outstanding balance for the fiscal year ending June 30, 2009 experience loss is amortized over 14 years, the outstanding balance of the June 30, 2008 UAL due to assumption changes is amortized over 28 years, the outstanding balance for the fiscal year ending June 30, 2008 experience loss is amortized over 13 years, and the outstanding balance of the June 30, 2007 UAL is amortized over 17 years. Table IV-2 shows the outstanding balance and FY 2012 payment for each of these components. Finally, if necessary, there is an additional UAL cost component to ensure that there is no negative amortization in any year. Table IV-1 on the following page shows how the City’s contribution rate for SDCERS for FY 2012 is developed. The methodology and assumptions used are in full compliance with the parameters set in GASB Statement No. 25 for purposes of determining the annual required contribution (ARC).

SDCERS-CITY OF SAN DIEGO JUNE 30, 2010 ACTUARIAL VALUATION
SECTION IV CONTRIBUTIONS
25
WEIGHTED Non-Safety Safety
TOTAL CITYWeighted
TotalGeneral Old Plan
General 2009 Plan Elected
Weighted Total
Police Old Plan
Police 2009 Plan Fire Lifeguard
1. Total Normal Cost Rate as of June 30, 2010 23.82% 20.12% 20.13% 17.65% 39.33% 29.82% 29.79% 27.56% 29.89% 32.03%2. Member Contribution Rate as of June 30, 2010 12.14% 10.34% 10.40% 8.47% 9.06% 14.95% 14.87% 13.08% 15.36% 15.24%3. Employer Normal Cost Rate as of June 30, 2010 (1-2) 11.68% 9.78% 9.73% 9.18% 30.27% 14.87% 14.92% 14.48% 14.53% 16.79%
4. Actuarial Liability 6,527.2$ 3,429.3$ 3,419.8$ 0.0$ 9.5$ 3,097.9$ 2,005.4$ 0.0$ 1,022.0$ 70.6$ 5. Actuarial Assets 4,382.0$ 2,302.2$ 2,295.9$ 0.0$ 6.4$ 2,079.8$ 1,346.3$ 0.0$ 686.1$ 47.4$
6. Total Unfunded Actuarial Liability (UAL) (4-5)* 2,145.2$ 1,127.0$ 1,123.9$ 0.0$ 3.1$ 1,018.1$ 659.1$ 0.0$ 335.9$ 23.2$
7. Preliminary FY12 UAL amortization* 168.1$ 88.3$ 88.1$ 0.0$ 0.2$ 79.8$ 51.6$ 0.0$ 26.3$ 1.8$
8. Negative Amortization Test for FY12
a. Total UAL on 6/30/10 less FY11 UAL payment 1,977.4$ 1,038.9$ 1,036.0$ 0.0$ 2.9$ 938.5$ 607.5$ 0.0$ 309.6$ 21.4$
b. interest on 8a. To 6/30/11 153.2$ 80.5$ 80.3$ 0.0$ 0.2$ 72.7$ 47.1$ 0.0$ 24.0$ 1.7$
c. preliminary FY12 UAL amortization (line 7) 168.1$ 88.3$ 88.1$ 0.0$ 0.2$ 79.8$ 51.6$ 0.0$ 26.3$ 1.8$
d. Negative interest (8b - 8c, not less than zero) - - - - - - - - - -
9. Total FY12 UAL payment on 7/01/11 (8c + 8d) 168.1$ 88.3$ 88.1$ 0.0$ 0.2$ 79.8$ 51.6$ 0.0$ 26.3$ 1.8$
10. Total FY12 UAL payment throughout year 174.5$ 91.7$ 91.4$ 0.0$ 0.3$ 82.8$ 53.6$ 0.0$ 27.3$ 1.9$
11. Total Expected Payroll for FY12 562.4$ 348.2$ 309.2$ 38.3$ 0.7$ 214.1$ 129.8$ 16.8$ 61.4$ 6.1$
12. FY12 Normal Cost paid throughout the year (3x11) 65.6$ 33.8$ 30.1$ 3.5$ 0.2$ 31.7$ 19.4$ 2.4$ 8.9$ 1.0$
13. FY12 Normal Cost paid at start of year 63.2$ 32.6$ 29.0$ 3.4$ 0.2$ 30.6$ 18.7$ 2.3$ 8.6$ 1.0$
14. Determination of FY12 GASB ARC % a. Employer Normal Cost Rate (12 divided by 11) 11.66% 9.71% 9.73% 9.18% 30.27% 14.83% 14.92% 14.48% 14.53% 16.79% b. UAL Rate (line 10 divided by line 11) 31.02% 26.32% 29.56% 0.00% 37.07% 38.67% 41.31% 0.00% 44.49% 30.70% c. Total employer ARC % (14a + 14b) 42.68% 36.03% 39.29% 9.18% 67.34% 53.50% 56.23% 14.48% 59.02% 47.49%
15. Determination of FY12 GASB ARC dollars a. FY12 ARC if paid throughout year 240.0$ 125.5$ 121.5$ 3.5$ 0.5$ 114.6$ 73.0$ 2.4$ 36.2$ 2.9$ b. FY12 ARC if paid at beginning of year 231.2$ 120.9$ 117.1$ 3.4$ 0.4$ 110.4$ 70.3$ 2.3$ 34.9$ 2.8$
Table IV-1SDCERS - City of San Diego
Development of the City's Contribution as of June 30, 2010, For (FY 2012)(dollars in millions)
* See Table IV-2 for components of these amounts. Note: Numbers may not add due to rounding.
SDCERS-CITY OF SAN DIEGO JUNE 30, 2010 ACTUARIAL VALUATION
SECTION IV CONTRIBUTIONS
26
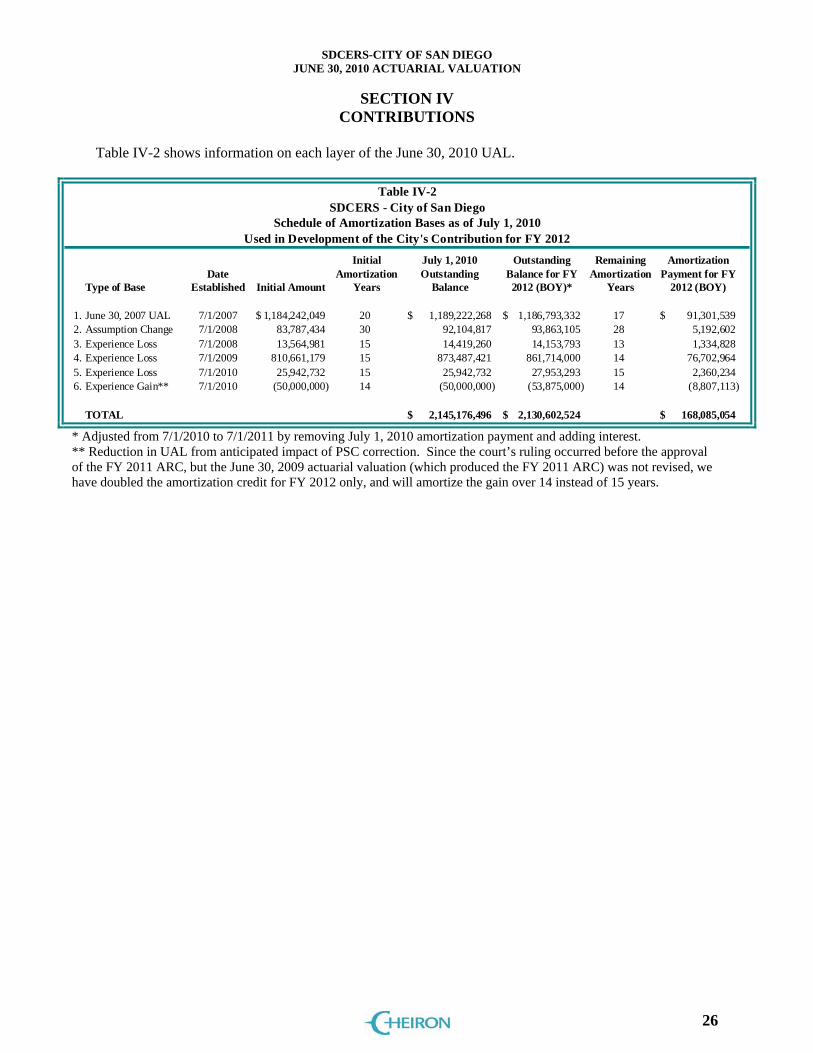
Table IV-2 shows information on each layer of the June 30, 2010 UAL.
1. June 30, 2007 UAL 7/1/2007 1,184,242,049$ 20 1,189,222,268$ 1,186,793,332$ 17 91,301,539$ 2. Assumption Change 7/1/2008 83,787,434 30 92,104,817 93,863,105 28 5,192,6023. Experience Loss 7/1/2008 13,564,981 15 14,419,260 14,153,793 13 1,334,8284. Experience Loss 7/1/2009 810,661,179 15 873,487,421 861,714,000 14 76,702,9645. Experience Loss 7/1/2010 25,942,732 15 25,942,732 27,953,293 15 2,360,2346. Experience Gain** 7/1/2010 (50,000,000) 14 (50,000,000) (53,875,000) 14 (8,807,113)
TOTAL 2,145,176,496$ 2,130,602,524$ 168,085,054$
Table IV-2SDCERS - City of San Diego
Schedule of Amortization Bases as of July 1, 2010Used in Development of the City's Contribution for FY 2012
July 1, 2010 Outstanding
Balance
Remaining Amortization
Years
Amortization Payment for FY
2012 (BOY)
Outstanding Balance for FY 2012 (BOY)*
Date Established Initial Amount
Initial Amortization
YearsType of Base
* Adjusted from 7/1/2010 to 7/1/2011 by removing July 1, 2010 amortization payment and adding interest. ** Reduction in UAL from anticipated impact of PSC correction. Since the court’s ruling occurred before the approval of the FY 2011 ARC, but the June 30, 2009 actuarial valuation (which produced the FY 2011 ARC) was not revised, we have doubled the amortization credit for FY 2012 only, and will amortize the gain over 14 instead of 15 years.

SDCERS-CITY OF SAN DIEGO JUNE 30, 2010 ACTUARIAL VALUATION
SECTION V ACCOUNTING STATEMENT INFORMATION
27
Accounting Standards Codification (ASC) Topic 960 of the Financial Accounting Standards Board (FASB) requires the disclosure of certain information regarding funding status. Statement No. 25 of the Governmental Accounting Standards Board (GASB) establishes standards for disclosure of pension information by public employee retirement systems and governmental employers in notes to financial statements and supplementary information. The ASC Topic 960 disclosure provides a “snap shot” view of how system assets at market value compare to liabilities if contributions stopped and accrued benefit claims had to be satisfied. The GASB No. 25 disclosure compares the actuarial liability computed for funding purposes to the actuarial value of assets to determine a funded ratio (i.e., the EAN liability). Both the present value of accrued benefits (ASC Topic 960) and the actuarial liability (GASB No. 25) are determined assuming that participants continue to terminate employment, retire, etc., in accordance with the actuarial assumptions. Liabilities are discounted at the assumed valuation interest rate of 7.75% per annum. ASC Topic 960 specifies that a comparison of the present value of accrued (accumulated) benefits to the market value of the assets as of the valuation date must be provided. GASB Statement No. 25 requires the actuarial liability be compared with the actuarial value of assets for funding purposes. The relevant amounts as of June 30, 2009 and June 30, 2010 are presented in Table V-1 and Table V-2.

SDCERS-CITY OF SAN DIEGO JUNE 30, 2010 ACTUARIAL VALUATION
SECTION V ACCOUNTING STATEMENT INFORMATION
28
June 30, 2010 June 30, 2009 % Change
1. Present Value of Benefits Accrued and Vested to Datea. Members Currently Receiving Payments 3,912,112,575$ 3,673,184,787$ 6.5%
b. Vested Terminated and Inactive Members 264,567,702 255,124,776 3.7%c. Active Members 1,322,234,044 1,303,988,682 1.4%d. Total PVAB 5,498,914,321$ 5,232,298,245$ 5.1%
2. Assets at Market Value 3,900,537,904 3,479,357,154 12.1%
3. Unfunded Present Value of Accrued Benefits,
But Not Less Than Zero 1,598,376,416$ 1,752,941,091$
4. Ratio of Assets to Value of Benefits (2)/(1)(d) 70.93% 66.50% 4.4%
1. Actuarial Liabilities
a. Members Currently Receiving Payments 3,912,112,575$ 3,673,184,787$ 6.5%
b. Vested Terminated and Inactive Members 264,567,702 255,124,776 3.7%
c. Active Members 2,350,543,474 2,353,326,546 -0.1%
d. Total Actuarial Liability 6,527,223,751$ 6,281,636,108$ 3.9%
2. Actuarial Value of Assets 4,382,047,254$ 4,175,228,585$ 5.0%
3. Unfunded Actuarial Liability 2,145,176,496$ 2,106,407,523$ 1.8%
4. Ratio of Actuarial Value of Assetsto Actuarial Liability (2)/(1)(d) 67.13% 66.47% 0.6%
Table V-1SDCERS - City of San Diego - Total
GASB No. 25 Basis
Item
ASC Topic 960 Basis
Accumulated Benefit Obligation (ASC Topic 960)
Actuarial Present Value of Benefits Accrued and Vested as of June 30, 2009 5,232,298,245$
Increase (Decrease) During Year Attributable to:
Passage of Time 394,383,987 Benefits Paid (286,945,217) Assumption Change - Plan Amendment -
Benefits Accrued, Other Gains/Losses 159,177,306
Net Increase (Decrease) 266,616,076$
Actuarial Present Value of Benefits Accrued and Vested as of June 30, 2010 5,498,914,321$
Table V-2SDCERS - City of San Diego - Total
Item

SDCERS-CITY OF SAN DIEGO JUNE 30, 2010 ACTUARIAL VALUATION
SECTION V ACCOUNTING STATEMENT INFORMATION
29
Tables V-3 through V-5 are exhibits required for the City’s Comprehensive Annual Financial Report (CAFR). The Government Finance Officers Association (GFOA) recommends showing at least 6 years of experience in each of these exhibits. Table V-3 shows the Notes to Required Supplementary Information. Table V-4 presents an analysis of financial experience for the valuation year, and Table V-5 presents the Solvency Test which shows the portion of actuarial liability covered by assets.
The information presented in the required supplementary schedules to the Financial Section of the City'sCAFR was determined as part of the actuarial valuation at the date indicated. Additional information asof the latest actuarial valuation follows.
Valuation date June 30, 2010
Actuarial funding method Entry Age Normal
Amortization method Level percent closed
Equivalent single amortization period 16.579 years 1
Asset valuation method Expected Value Method
Actuarial assumptions:
Investment rate of return 7.75%
Projected salary increases due to inflation 2 4.00%
Cost-of-living adjustments 2.00%
The actuarial assumptions used have been recommended by the actuary and adopted by SDCERS'
Board of Administration based on the most recent review of SDCERS’ experience, completed in 2008.
The rate of employer contributions to SDCERS is composed of the normal cost and an amortization ofthe unfunded actuarial liability. The normal cost is a level percent of payroll cost which, along with theMember contributions, will pay for projected benefits at retirement for the average plan participant. Theactuarial liability is that portion of the present value of projected benefits that will not be paid by futureemployer normal costs or Member contributions. The difference between this liability and the fundsaccumulated as of the same date is the unfunded actuarial liability.
Table V-3SDCERS - City of San Diego
NOTES TO REQUIRED SUPPLEMENTARY INFORMATION
1 17 years for the outstanding balance of the 2007 UAL, 15 years for experience gains and losses, 30 years for changes in
methods and assumptions, 5 years for benefit changes. 2 Additional merit salary increases of 0.50% to 8.00% based on a participant’s years of service, and membership group
are also assumed. These increases are not used in the amortization of SDCERS’ UAL.

SDCERS-CITY OF SAN DIEGO JUNE 30, 2010 ACTUARIAL VALUATION
SECTION V ACCOUNTING STATEMENT INFORMATION
30
Gain (or Loss) for Year ending
June 30, 2010Type of Activity
Investment Income (141,536,346)$
Combined Liability Experience 70,506,309
Gain (or Loss) During Year from Financial Experience (71,030,037)$
Non-Recurring Gain (or Loss) Items (e.g., Contributions) 90,933,819
Composite Gain (or Loss) During Year 19,903,782$
Table V-4SDCERS - City of San Diego
ANALYSIS OF FINANCIAL EXPERIENCE
Gain and Loss in Actuarial Liability During Years Ended June 30Resulting from Differences Between Assumed Experience
and Actual Experience

SDCERS-CITY OF SAN DIEGO JUNE 30, 2010 ACTUARIAL VALUATION
SECTION V ACCOUNTING STATEMENT INFORMATION
31
(A) (B) (C)Remaining
Valuation Active Retirees ActiveDate Member And Members’ Reported
June 30, Contributions Beneficiaries Liabilities Assets 1 (A) (B) (C)
2010 $ 584,296 $ 3,912,113 $ 2,030,816 $ 4,382,047 100% 97.08% 0.00%2009 535,797 3,673,185 2,072,655 4,175,229 100 99.08 0.00
2008 522,966 3,286,668 2,153,916 4,662,346 100 100 39.50
2007 6 482,526 3,101,594 2,013,532 4,413,311 100 100 41.19
2006 4 456,562 2,822,203 1,703,935 3,981,932 100 100 41.27
2005 457,550 2,183,263 1,736,279 2,983,080 100 100 19.71
2004 414,986 5 1,946,660 1,635,681 2,628,680 100 100 16.33
2003 375,000 5 1,741,490 1,416,126 2,375,431 100 100 18.28
2002 353,686 1,440,392 1,374,742 2,448,208 100 100 47.582001 296,851 1,337,799 1,174,888 2,525,646 100 100 75.84
2000 3 276,352 1,170,075 1,082,347 2,459,815 100 100 93.631999 238,278 1,026,395 916,874 2,033,153 100 100 83.82
1998 2 220,415 885,586 873,667 1,852,151 100 100 85.40
Portion of ActuarialLiabilities Coveredby Reported Assets
Table V-5SDCERS - City of San Diego
GASB SOLVENCY TESTActuarial Liabilities For
($ in thousands)
1 Actuarial Value of Assets 2 Reflects revised actuarial and economic assumptions. 3 Reflects non-contingent Corbett benefit increases. 4 Reflects contingent liabilities (Corbett pre-July 1, 2000 and 13th check), DROP reserves, supplemental COLA
reserves, and IRC section 415 limits. 5 Estimated 6 The actuarial liability on June 30, 2007 and after is based on the entry age actuarial funding method. All prior
years are based on the projected unit credit actuarial funding method.

SDCERS-CITY OF SAN DIEGO JUNE 30, 2010 ACTUARIAL VALUATION
APPENDIX A MEMBERSHIP INFORMATION
32
SDCERS - City of San DiegoActive Member Data
June 30, 2010 June 30, 2009 % ChangeTotalCount 8,120 8,273 -1.8%Average Current Age 43.7 43.4 0.6%Average Service 13.1 13.0 1.3%Average Pensionable Earnings 65,300$ 64,861$ 0.7%Annual Pensionable Earnings 530,238,355$ 536,591,286$ -1.2%Average Valuation Compensation1 65,300$ 64,860$ 0.7%Annual Valuation Compensation1 530,233,354$ 536,586,285$ -1.2%Service Without Permissive Service Purchased 11.8 11.6 2.1%Members with Paid Purchased Service 2,191 2,359 -7.1%Members with Any Purchased Service 2,315 2,484 -6.8%Amount of Paid Purchased Service 9,293 10,032 -7.4%Amount of Total Purchased Service 10,674 11,587 -7.9%
GeneralCount 5,694 5,826 -2.3%Average Current Age 45.6 45.2 0.9%Average Service 13.4 13.2 1.5%Average Pensionable Earnings 57,665$ 57,311$ 0.6%Annual Pensionable Earnings 328,346,826$ 333,891,467$ -1.7%Average Valuation Compensation1 57,665$ 57,310$ 0.6%Annual Valuation Compensation1 328,341,825$ 333,886,466$ -1.7%Service Without Permissive Service Purchased 11.9 11.5 3.5%Members with Paid Purchased Service 1,743 1,880 -7.3%Members with Any Purchased Service 1,795 1,932 -7.1%Amount of Paid Purchased Service 8,217 8,877 -7.4%Amount of Total Purchased Service 8,939 9,708 -7.9%
SafetyCount 2,426 2,447 -0.9%Average Current Age 39.3 39.2 0.3%Average Service 12.4 12.4 0.0%Average Pensionable Earnings 83,220$ 82,836$ 0.5%Annual Pensionable Earnings 201,891,529$ 202,699,819$ -0.4%Average Valuation Compensation1 83,220$ 82,836$ 0.5%Annual Valuation Compensation1 201,891,529$ 202,699,819$ -0.4%Service Without Permissive Service Purchased 11.7 11.6 0.9%Members with Paid Purchased Service 448 479 -6.5%Members with Any Purchased Service 520 552 -5.8%Amount of Paid Purchased Service 1,076 1,155 -6.8%Amount of Total Purchased Service 1,735 1,879 -7.7%
Table A-1
1 The definition of valuation compensation differs from the definition of pensionable earnings due to IRS 401(a).

SDCERS-CITY OF SAN DIEGO JUNE 30, 2010 ACTUARIAL VALUATION
APPENDIX A MEMBERSHIP INFORMATION
33
SDCERS - City of San DiegoNon-Active Participant Data
Count Average AgeJune 30, 2010 June 30, 2009 %Change June 30, 2010 June 30, 2009 %Change
TotalRetired 5,189 4,975 4.3% 65.3 65.4 -0.1%Disabled 1,241 1,257 -1.3% 63.4 62.8 0.8%Beneficiaries 1,151 1,137 1.2% 74.5 74.3 0.3%
Payee Total 7,581 7,369 2.9% 66.4 66.3 0.1%
DROP Participants 900 732 23.0% 57.0 56.7 0.4%
Deferred Vested 12,874 2,827 1.7% 44.9 44.4 1.0%
Vested < 10 yrs svc 1,980 1,932 2.5%
GeneralRetired 3,431 3,302 3.9% 67.1 67.2 -0.1%Disabled 424 427 -0.7% 62.2 61.7 0.8%Beneficiaries 700 698 0.3% 76.8 76.7 0.1%
Payee Total 4,555 4,427 2.9% 68.2 68.2 0.0%
DROP Participants 536 448 19.6% 59.3 58.9 0.7%
Deferred Vested 1
2,341 2,297 1.9% 46.1 45.7 0.9%Vested < 10 yrs svc 1,612 1,570 2.7%
SafetyRetired 1,758 1,673 5.1% 61.8 61.8 0.0%Disabled 817 830 -1.6% 63.9 63.4 0.8%Beneficiaries 451 439 2.7% 70.9 70.5 0.6%
Payee Total 3,026 2,942 2.9% 63.7 63.5 0.3%
DROP Participants 364 284 28.2% 53.6 53.3 0.6%
Deferred Vested 1533 530 0.6% 39.6 39.0 1.5%
Vested < 10 yrs svc 368 362 1.7%
Table A-2
1 Includes all Participants having a contribution balance still on account with SDCERS.

SDCERS-CITY OF SAN DIEGO JUNE 30, 2010 ACTUARIAL VALUATION
APPENDIX A MEMBERSHIP INFORMATION
34
SDCERS - City of San DiegoNon-Active Participant Data
Total Annual Benefit Average Annual BenefitJune 30, 2010 June 30, 2009 %Change June 30, 2010 June 30, 2009 %Change
TotalRetired 249,905,055$ 231,698,837$ 7.9% 48,161$ 46,573$ 3.4%Disabled 37,142,983 36,337,577 2.2% 29,930 28,908 3.5%Beneficiaries 16,409,579 15,550,149 5.5% 14,257 13,676 4.2%
Payee Total 303,457,617$ 283,586,563$ 7.0% 40,029$ 38,484$ 4.0%
DROP Participants 50,857,229$ 40,394,966$ 25.9% 56,508$ 55,184$ 2.4%
Deferred Vested 1 112,729,129$ 106,837,122$ 5.5% 39,224$ 37,792$ 3.8%
GeneralRetired 133,118,965$ 123,714,805$ 7.6% 38,799$ 37,467$ 3.6%Disabled 7,158,209 6,931,688 3.3% 16,883 16,233 4.0%Beneficiaries 7,714,413 7,480,099 3.1% 11,021 10,716 2.8%
Payee Total 147,991,586$ 138,126,592$ 7.1% 32,490$ 31,201$ 4.1%
DROP Participants 22,947,550$ 18,889,462$ 21.5% 42,813$ 42,164$ 1.5%
Deferred Vested 1 92,174,962$ 86,608,264$ 6.4% 39,374$ 37,705$ 4.4%
SafetyRetired 116,786,091$ 107,984,032$ 8.2% 66,431$ 64,545$ 2.9%Disabled 29,984,775 29,405,889 2.0% 36,701 35,429 3.6%Beneficiaries 8,695,166 8,070,050 7.7% 19,280 18,383 4.9%
Payee Total 155,466,031$ 145,459,971$ 6.9% 51,377$ 49,443$ 3.9%
DROP Participants 27,909,679$ 21,505,504$ 29.8% 76,675$ 75,724$ 1.3%
Deferred Vested 1 20,554,167$ 20,228,858$ 1.6% 38,563$ 38,168$ 1.0%
Table A-3
1 Includes all Participants having a contribution balance still on account with SDCERS. Annual benefit for deferred vested Participants is the total contribution balance on account as of June 30, 2010.

SDCERS-CITY OF SAN DIEGO JUNE 30, 2010 ACTUARIAL VALUATION
APPENDIX A MEMBERSHIP INFORMATION
35
SDCERS - City of San DiegoDistribution of Active Members (Excludes DROP Participants) as of June 30, 2010
Total CityYears of Service
Age Under 1 1 to 4 5 to 9 10 to 14 15 to 19 20 to 24 25 to 29 30 to 34 35 to 39 40 and up Total
Under 25 56 98 - - - - - - - - 154
25 to 29 92 463 104 2 - - - - - - 661
30 to 34 53 358 346 88 3 - - - - - 848
35 to 39 38 190 349 333 103 6 - - - - 1,019
40 to 44 36 140 276 386 358 221 14 1 - - 1,432
45 to 49 17 110 190 292 395 534 258 26 1 - 1,823
50 to 54 19 79 143 220 249 311 268 116 34 2 1,441
55 to 59 9 60 93 137 130 51 28 9 5 - 522
60 to 64 7 36 34 52 31 10 7 2 2 2 183
65 to 69 1 6 13 2 - - 2 - - - 24
70 and up 1 4 4 1 2 - - - 1 - 13
Total Count 329 1,544 1,552 1,513 1,271 1,133 577 154 43 4 8,120
SDCERS - City of San DiegoDistribution of Active Members (Excludes DROP Participants) as of June 30, 2010
Total CityAverage Salary
Years of Service
Age Under 1 1 to 4 5 to 9 10 to 14 15 to 19 20 to 24 25 to 29 30 to 34 35 to 39 40 and up Total
Under 25 47,358$ 55,618$ -$ -$ -$ -$ -$ -$ -$ -$ 52,615$
25 to 29 52,945 57,936 62,420 67,250 - - - - - - 57,975
30 to 34 54,953 60,389 67,999 70,527 46,849 - - - - - 64,158
35 to 39 51,651 59,861 66,801 73,744 70,156 71,146 - - - - 67,576
40 to 44 49,606 59,063 59,295 67,750 75,745 74,337 65,940 93,213 - - 67,830
45 to 49 49,831 54,510 55,766 63,261 69,916 78,745 81,125 74,865 59,966 - 70,496
50 to 54 50,268 66,582 49,353 58,693 63,059 64,278 67,585 62,539 63,295 58,510 62,119
55 to 59 70,209 69,206 58,311 57,064 63,523 70,335 70,155 67,915 54,363 - 62,677
60 to 64 76,385 56,867 49,569 59,067 61,378 64,510 63,146 39,541 91,187 44,533 58,356
65 to 69 84,198 56,484 60,587 28,298 - - 73,382 - - - 58,921
70 and up 69,999 60,505 30,163 41,267 26,692 - - - 49,462 - 44,368
Avg. Salary 52,605$ 59,309$ 61,448$ 65,711$ 69,250$ 73,369$ 73,690$ 64,834$ 63,154$ 51,522$ 65,300$
Table A-4
Table A-5

SDCERS-CITY OF SAN DIEGO JUNE 30, 2010 ACTUARIAL VALUATION
APPENDIX A MEMBERSHIP INFORMATION
36
SDCERS - City of San DiegoDistribution of Active Members (Excludes DROP Participants) as of June 30, 2010
GeneralYears of Service
Age Under 1 1 to 4 5 to 9 10 to 14 15 to 19 20 to 24 25 to 29 30 to 34 35 to 39 40 and up Total
Under 25 27 35 - - - - - - - - 62
25 to 29 35 227 52 1 - - - - - - 315
30 to 34 31 212 183 49 3 - - - - - 478
35 to 39 32 137 215 171 70 6 - - - - 631
40 to 44 34 119 208 258 193 133 13 - - - 958
45 to 49 16 100 166 236 249 276 145 22 1 - 1,211
50 to 54 18 77 133 198 217 275 252 112 34 2 1,318
55 to 59 9 60 91 134 125 44 27 9 5 - 504
60 to 64 7 36 34 52 30 9 7 2 2 2 181
65 to 69 1 6 12 2 - - 2 - - - 23
70 and up 1 4 4 1 2 - - - 1 - 13
Total Count 211 1,013 1,098 1,102 889 743 446 145 43 4 5,694
SDCERS - City of San DiegoDistribution of Active Members (Excludes DROP Participants) as of June 30, 2010
GeneralAverage Salary
Years of Service
Age Under 1 1 to 4 5 to 9 10 to 14 15 to 19 20 to 24 25 to 29 30 to 34 35 to 39 40 and up Total
Under 25 37,235$ 42,272$ -$ -$ -$ -$ -$ -$ -$ -$ 40,078$
25 to 29 40,900 46,594 45,329 54,642 - - - - - - 45,778
30 to 34 52,181 52,430 55,195 58,199 46,849 - - - - - 54,029
35 to 39 50,742 55,226 57,160 61,326 59,686 71,146 - - - - 57,957
40 to 44 48,718 57,526 51,774 58,587 61,422 61,722 63,113 - - - 57,694
45 to 49 50,290 52,739 52,172 57,632 59,337 63,513 67,113 65,966 59,966 - 59,362
50 to 54 48,512 65,946 46,372 55,913 59,318 60,706 65,897 61,260 63,295 58,510 59,553
55 to 59 70,209 69,206 57,719 56,392 62,652 66,329 69,215 67,915 54,363 - 61,696
60 to 64 76,385 56,867 49,569 59,067 60,581 61,442 63,146 39,541 91,187 44,533 58,020
65 to 69 84,198 56,484 49,682 28,298 - - 73,382 - - - 53,158
70 and up 69,999 60,505 30,163 41,267 26,692 - - - 49,462 - 44,368
Avg. Salary 48,973$ 54,013$ 52,822$ 57,991$ 60,205$ 62,357$ 66,403$ 62,087$ 63,154$ 51,522$ 57,665$
Table A-6
Table A-7

SDCERS-CITY OF SAN DIEGO JUNE 30, 2010 ACTUARIAL VALUATION
APPENDIX A MEMBERSHIP INFORMATION
37
SDCERS - City of San DiegoDistribution of Active Members (Excludes DROP Participants) as of June 30, 2010
SafetyYears of Service
Age Under 1 1 to 4 5 to 9 10 to 14 15 to 19 20 to 24 25 to 29 30 to 34 35 to 39 40 and up Total
Under 25 29 63 - - - - - - - - 92
25 to 29 57 236 52 1 - - - - - - 346
30 to 34 22 146 163 39 - - - - - - 370
35 to 39 6 53 134 162 33 - - - - - 388
40 to 44 2 21 68 128 165 88 1 1 - - 474
45 to 49 1 10 24 56 146 258 113 4 - - 612
50 to 54 1 2 10 22 32 36 16 4 - - 123
55 to 59 - - 2 3 5 7 1 - - - 18
60 to 64 - - - - 1 1 - - - - 2
65 to 69 - - 1 - - - - - - - 1
70 and up - - - - - - - - - - -
Total Count 118 531 454 411 382 390 131 9 - - 2,426
SDCERS - City of San DiegoDistribution of Active Members (Excludes DROP Participants) as of June 30, 2010
SafetyAverage Salary
Years of Service
Age Under 1 1 to 4 5 to 9 10 to 14 15 to 19 20 to 24 25 to 29 30 to 34 35 to 39 40 and up Total
Under 25 56,783$ 63,033$ -$ -$ -$ -$ -$ -$ -$ -$ 61,063$
25 to 29 60,342 68,845 79,510 79,859 - - - - - - 69,079
30 to 34 58,859 71,947 82,373 86,016 - - - - - - 77,245
35 to 39 56,499 71,841 82,271 86,851 92,364 - - - - - 83,218
40 to 44 64,700 67,776 82,300 86,218 92,500 93,401 102,686 93,213 - - 88,318
45 to 49 42,486 72,229 80,625 86,985 87,959 95,040 99,104 123,807 - - 92,528
50 to 54 81,890 91,106 89,004 83,708 88,433 91,565 94,180 98,343 - - 89,611
55 to 59 - - 85,280 87,099 85,298 95,516 95,534 - - - 90,139
60 to 64 - - - - 85,280 92,123 - - - - 88,702
65 to 69 - - 191,454 - - - - - - - 191,454
70 and up - - - - - - - - - - -
Avg. Salary 59,101$ 69,412$ 82,311$ 86,409$ 90,299$ 94,350$ 98,502$ 109,090$ -$ -$ 83,220$
Table A-9
Table A-8

SDCERS-CITY OF SAN DIEGO JUNE 30, 2010 ACTUARIAL VALUATION
APPENDIX A MEMBERSHIP INFORMATION
38
SDCERS - City of San DiegoRetirees (Includes DROP Participants), Disabled, and Beneficiaries Tabulated by Attained Age/Benefit Effective Date
Total CityAge
Plan Year Under 50 50 to 54 55 to 59 60 to 64 65 to 69 70 to 74 75 to 79 80 to 84 85 to 89 90 and up Total
pre-1991 2 19 40 112 104 130 186 238 218 123 1,172 1991 2 6 4 8 4 16 31 30 9 6 116 1992 3 4 3 10 7 21 18 31 8 1 106 1993 10 10 7 11 29 101 52 38 13 3 274 1994 8 13 12 14 9 21 16 14 4 5 116 1995 8 10 12 3 18 28 21 13 3 3 119 1996 10 11 11 9 29 28 29 10 6 5 148 1997 14 8 9 33 100 43 34 11 6 5 263 1998 9 11 5 39 99 60 15 14 9 5 266 1999 15 7 12 66 112 53 19 10 9 3 306 2000 16 9 6 84 86 41 14 12 8 6 282 2001 15 8 38 130 80 52 18 10 8 3 362 2002 9 6 36 104 37 24 12 7 6 3 244 2003 5 6 69 247 107 42 17 8 10 5 516 2004 9 10 77 171 68 31 9 6 10 5 396 2005 10 7 122 229 80 25 7 7 7 6 500 2006 20 95 185 85 43 13 9 11 6 3 470 2007 10 83 209 61 50 18 7 16 12 7 473 2008 10 82 197 76 30 11 11 9 9 3 438 2009 22 170 250 88 34 10 15 10 5 4 608 2010 7 104 187 58 10 3 10 12 12 3 406 Total 214 679 1,491 1,638 1,136 771 550 517 378 207 7,581
Surviving spouses benefit effective date no longer based on participant's original date of retirement.
Average Age at Retirement/Disability 55.7 Average Current Age 66.4 Average Annual Pension 40,029$
Table A-10

SDCERS-CITY OF SAN DIEGO JUNE 30, 2010 ACTUARIAL VALUATION
APPENDIX A MEMBERSHIP INFORMATION
39
SDCERS - City of San DiegoRetirees (Includes DROP Participants), Disabled, and Beneficiaries Tabulated by Attained Age/Benefit Effective Date
GeneralAge
Plan Year Under 50 50 to 54 55 to 59 60 to 64 65 to 69 70 to 74 75 to 79 80 to 84 85 to 89 90 and up Total
pre-1991 1 5 5 25 23 28 75 140 171 93 566 1991 1 1 3 2 - 2 19 30 7 4 69 1992 1 1 1 2 2 11 16 31 8 1 74 1993 5 2 2 1 7 24 35 35 9 2 122 1994 1 4 6 5 3 14 14 13 3 3 66 1995 2 6 5 1 1 19 21 11 3 2 71 1996 4 1 7 3 11 22 24 8 4 3 87 1997 6 4 4 7 20 24 28 11 4 5 113 1998 5 6 3 8 42 52 15 13 7 4 155 1999 4 2 6 5 63 47 18 9 4 3 161 2000 8 6 5 10 63 40 13 10 3 3 161 2001 6 3 14 42 69 50 17 6 8 3 218 2002 3 4 4 47 29 22 12 6 6 3 136 2003 4 3 8 187 95 41 14 6 8 3 369 2004 3 6 12 139 60 26 7 5 6 3 267 2005 5 3 6 196 72 22 6 3 6 5 324 2006 13 12 137 76 42 10 8 7 5 1 311 2007 6 10 174 52 45 15 5 11 6 6 330 2008 4 3 165 72 27 8 9 6 5 2 301 2009 7 13 219 85 28 7 11 8 3 4 385 2010 4 7 171 55 6 1 7 11 6 1 269 Total 93 102 957 1,020 708 485 374 380 282 154 4,555
Surviving spouses benefit effective date no longer based on participant's original date of retirement.
Average Age at Retirement/Disability 58.6 Average Current Age 68.2 Average Annual Pension 32,490$
Table A-11

SDCERS-CITY OF SAN DIEGO JUNE 30, 2010 ACTUARIAL VALUATION
APPENDIX A MEMBERSHIP INFORMATION
40
SDCERS - City of San DiegoRetirees (Includes DROP Participants), Disabled, and Beneficiaries Tabulated by Attained Age/Benefit Effective Date
SafetyAge
Plan Year Under 50 50 to 54 55 to 59 60 to 64 65 to 69 70 to 74 75 to 79 80 to 84 85 to 89 90 and up Total
pre-1991 1 14 35 87 81 102 111 98 47 30 606 1991 1 5 1 6 4 14 12 - 2 2 47 1992 2 3 2 8 5 10 2 - - - 32 1993 5 8 5 10 22 77 17 3 4 1 152 1994 7 9 6 9 6 7 2 1 1 2 50 1995 6 4 7 2 17 9 - 2 - 1 48 1996 6 10 4 6 18 6 5 2 2 2 61 1997 8 4 5 26 80 19 6 - 2 - 150 1998 4 5 2 31 57 8 - 1 2 1 111 1999 11 5 6 61 49 6 1 1 5 - 145 2000 8 3 1 74 23 1 1 2 5 3 121 2001 9 5 24 88 11 2 1 4 - - 144 2002 6 2 32 57 8 2 - 1 - - 108 2003 1 3 61 60 12 1 3 2 2 2 147 2004 6 4 65 32 8 5 2 1 4 2 129 2005 5 4 116 33 8 3 1 4 1 1 176 2006 7 83 48 9 1 3 1 4 1 2 159 2007 4 73 35 9 5 3 2 5 6 1 143 2008 6 79 32 4 3 3 2 3 4 1 137 2009 15 157 31 3 6 3 4 2 2 - 223 2010 3 97 16 3 4 2 3 1 6 2 137 Total 121 577 534 618 428 286 176 137 96 53 3,026
Surviving spouses benefit effective date no longer based on participant's original date of retirement.
Average Age at Retirement/Disability 51.4 Average Current Age 63.7 Average Annual Pension 51,377$
Table A-12

SDCERS-CITY OF SAN DIEGO JUNE 30, 2010 ACTUARIAL VALUATION
APPENDIX A MEMBERSHIP INFORMATION
41
CountAge General Safety TotalUnder 50 93 121 214 50 to 54 102 577 679 55 to 59 957 534 1,491 60 to 64 1,020 618 1,638 65 to 69 708 428 1,136 70 to 74 485 286 771 75 to 79 374 176 550 80 to 84 380 137 517 85 to 89 282 96 378 90 and up 154 53 207 Total 4,555 3,026 7,581
SDCERS - City of San Diego
and Beneficiariesas of June 30, 2010
Distribution of Retirees, Disabilitants,
Table A-13
Chart A-1
Count Distribution
0
200
400
600
800
1000
1200
Under
50
50 to
54
55 to
59
60 to
64
65 to
69
70 to
74
75 to
79
80 to
84
85 to
89
90 an
d up
Cou
nt
General Safety

SDCERS-CITY OF SAN DIEGO JUNE 30, 2010 ACTUARIAL VALUATION
APPENDIX A MEMBERSHIP INFORMATION
42
Annual BenefitAge General Safety Total Under 50 1,621,163$ 3,831,687$ 5,452,851$ 50 to 54 1,456,090 38,092,853 39,548,943 55 to 59 42,522,256 31,283,231 73,805,487 60 to 64 41,514,394 34,130,781 75,645,176 65 to 69 25,182,305 22,696,065 47,878,371 70 to 74 13,700,533 12,778,489 26,479,022 75 to 79 9,475,076 6,606,348 16,081,424 80 to 84 7,620,007 3,279,117 10,899,124 85 to 89 3,545,911 1,796,723 5,342,634 90 and up 1,353,851 970,736 2,324,587 Total 147,991,586$ 155,466,031$ 303,457,617$
SDCERS - City of San Diego
and Beneficiariesas of June 30, 2010
Distribution of Retirees, Disabilitants,
Table A-14
Chart A-2
Benefit Distribution
$0$5
$10$15$20$25$30$35$40$45
Under
50
50 to
54
55 to
59
60 to 6
4
65 to
69
70 to
74
75 to
79
80 to
84
85 to
89
90 an
d up
Ben
efit
in M
illio
ns
General Safety

SDCERS-CITY OF SAN DIEGO JUNE 30, 2010 ACTUARIAL VALUATION
APPENDIX A MEMBERSHIP INFORMATION
43
Data Assumptions and Practices In preparing our data, we relied without audit on information supplied by the SDCERS staff. This information includes, but is not limited to, plan provisions, employee data, and financial information. Our methodology for obtaining the data used for the valuation is based upon the following assumptions and practices: Service for Actives and Inactives was calculated using Benefit Service. An adjusted date of
hire is retroactively calculated from the valuation date. Purchased Service that has been paid for is included in the Benefit Service field. Purchased Service that has been applied for, but not paid as of the valuation date will be assumed to be paid in full, and this service will be reflected in the projected benefit.
Valuation Salary will be the maximum of “Current Annual Pensionable Salary” and
annualized “Average Compensation.” For accounts having duplicate records in the Actives and Inactives by Social Security
Number, the information from the latest payroll date is regarded as most up to date. The other record is treated as out of date and invalid.
For duplicate records (based on SSN and Benefit Type) in the payee file, records having the
same plan and same benefit type but different benefit amounts, we have added those benefit amounts together.
Records on the provided “Member” file are considered to be Active if they have no “Date of
Death,” no “Date of Separation,” do not have a retiree record and they received pay in the last pay period (Last Pay Period = 26) of the current FY.
Records on the “Member” file are considered to be Inactive if they do not have a “Date of
Death,” do not have a retiree record and either have a “Date of Separation” or have a “Last Pay Period” earlier than the last pay period of the current FY.
Records on the “Payee” file are considered in pay status if their benefit is not suspended. Pension Benefit for retirees for each plan was calculated by summing “Monthly Pension,”
“Monthly Annuity,” “COLA Annuity,” “Surviving Spouse Annuity,” and “COLA Pension” and subtracting “Non-COLA Adjustments.” The “Non-COLA Adjustments” field is mainly for Qualified Domestic Relations Order purposes. The “Supplement Amt” field is added as an annual benefit (i.e., 13th check) and the “Corbett Supplemental Payment” is annualized for new retirees in the City only. It is assumed the payment is annual for retirees already in pay status prior to this valuation.
Members retiring since 11/1/2006 and not having a “Supplement Amt” (13th check) will have
their projected “Supplement Amt” (13th check) calculated assuming $30 multiplied by the “Total Service Credit.”

SDCERS-CITY OF SAN DIEGO JUNE 30, 2010 ACTUARIAL VALUATION
APPENDIX A MEMBERSHIP INFORMATION
44
Members may retire and receive benefits from multiple Plan IDs (e.g., a City police officer could have also worked for the Airport Authority); we will value each Member’s blended benefit individually. This will result in the counts being slightly higher than actual counts due to people having more than one benefit payable from multiple plans.
We assume any retiree found in last year’s “Payee” file and not in this year’s file has died
without a beneficiary and should be removed from the valuation data. We assume all deceased retirees with payments continuing to a beneficiary have already been
accounted for in the “Payee” file. We exclude any payee receiving $0.00 from a blended benefit plan. We assume that any active Member found in the inactive data last year has returned to work
and should be valued as active. The VCP filing procedure was used to calculate the present value of Member benefits over
the Internal Revenue Service Code Section 415 Benefit Limits. The employee contribution rates were replaced with the revised rates adopted by the Board
on May 28, 2010 for this valuation.

SDCERS-CITY OF SAN DIEGO JUNE 30, 2010 ACTUARIAL VALUATION
APPENDIX B ACTUARIAL ASSUMPTIONS AND METHODS
45
A. Actuarial Assumptions 1. Investment Return Assumption SDCERS’ assets are assumed to earn 7.75% net of expenses. 2. Inflation Rate An inflation assumption of 4.00% compounded annually is used for projecting the total annual payroll growth for amortization of the UAL. 3. Interest Credited to Member Contributions 7.75%, compounded annually. 4. Salary Increase Rate Inflation component: 4.00% (for the July 1, 2010 “across the board” payroll increases, actual reported payroll increases were used). The additional merit component:
Years of Service at Valuation Date General Safety
0 5.00% 8.00%1 4.00% 7.00%2 3.00% 6.00%3 2.00% 3.50%4 1.00% 2.00%
5+ 0.50% 0.50%
Table B-1

SDCERS-CITY OF SAN DIEGO JUNE 30, 2010 ACTUARIAL VALUATION
APPENDIX B ACTUARIAL ASSUMPTIONS AND METHODS
46
5. Cost-of-Living Increase in Benefits Assumed to be 2% per annum, compounded annually. There is a closed group of Special Safety Officers for whom we assume an annual adjustment equal to inflation (4.00% per year). 6. COL Annuity Benefit For active Members, there is a load on liabilities for retirement allowances to anticipate the impact of the annuitized employee COL Annuity contributions at retirement. The load varies by Plan as follows:
General Elected Police Fire Lifeguard 2.19% 2.5% 3.51% 3.69% 3.58%
7. Member Refunds All or part of the employee contribution rate is subject to potential “offset” by the employer. That “offset” and the related accumulated interest are not to be refunded to employees at termination. However, such offsets are not directly reflected in either the employee contributions or related refund calculations. 8. Rates of Termination
Age General Safety
20 12.78% 5.00%25 8.33 4.0730 5.83 3.5735 4.60 3.0740 3.36 2.6745 2.78 2.3350 2.78 2.3355 2.78 2.3360 2.78 2.33
Table B-2SDCERS - City of San Diego
Rates of Termination at Selected Ages and Service 5+ years*
*Add 1% to every age for each year of service less than 5 years.
20% of terminating employees, with 10+ years of service at termination, are assumed to subsequently work for a reciprocal employer and receive 4.50% pay increases per year.

SDCERS-CITY OF SAN DIEGO JUNE 30, 2010 ACTUARIAL VALUATION
APPENDIX B ACTUARIAL ASSUMPTIONS AND METHODS
47
9. Rates of Disability
Rates of Disability at Selected Ages
Age General Safety20 0.04% 0.40%25 0.06 0.4030 0.07 0.4035 0.11 0.5040 0.15 0.6345 0.23 0.8250 0.35 0.9555 0.53 1.8060 0.68 --
Table B-3SDCERS - City of San Diego
60% of the General disabilities and 80% of the Safety disabilities are assumed to be industrial disability retirements. Non-industrial disability retirement is subject to a 10-year service requirement. 10. Rates of Mortality for Active Lives General Members follow the RP2000 Combined Healthy table (male and female) projected to 2008. Safety Members follow the Male RP2000 projected to 2008, set forward two years.
Rates of Mortality for Active Lives at Selected Ages
General SafetyAge Male Female20 0.03% 0.02% 0.03%25 0.03 0.02 0.0430 0.04 0.02 0.0535 0.07 0.04 0.0940 0.10 0.06 0.1145 0.14 0.10 0.1550 0.18 0.15 0.2355 0.31 0.25 0.4160 0.59 0.49 0.7865 1.14 0.93 1.4570 1.97 1.61 2.42
Table B-4SDCERS - City of San Diego
All active Member deaths are assumed to be duty-related for Safety Members and not duty-related for other Members.

SDCERS-CITY OF SAN DIEGO JUNE 30, 2010 ACTUARIAL VALUATION
APPENDIX B ACTUARIAL ASSUMPTIONS AND METHODS
48
11. Rates of Mortality for Retired Healthy Lives General retired healthy participants use the RP2000 Combined Healthy table (male and female). Safety participants use the RP2000 Combined Healthy table set forward two years (male and female).
Rates of Mortality for Retired Healthy Lives at Selected Ages
Age Male Female Male Female40 0.11% 0.07% 0.12% 0.09%45 0.15 0.11 0.17 0.1350 0.21 0.17 0.27 0.2055 0.36 0.27 0.47 0.3560 0.67 0.51 0.88 0.6765 1.27 0.97 1.61 1.2270 2.22 1.67 2.73 2.0775 3.78 2.81 4.69 3.4180 6.44 4.59 8.05 5.6385 11.08 7.74 13.60 9.6390 18.34 13.17 21.66 15.76
Table B-5
General Safety
SDCERS - City of San Diego
12. Rates of Mortality for Retired Disabled Lives Disabled General participants use Uninsured Pensioner 1994 (UP1994) male only table set forward five years. Disabled Safety participants use Uninsured Pensioner 1994 (UP1994) male only table set forward two years.
Rates of Mortality for Disabled Lives at Selected Ages
Age General Safety20 0.07% 0.06%25 0.09 0.0830 0.09 0.0935 0.12 0.1040 0.17 0.1345 0.28 0.2050 0.48 0.3555 0.86 0.6060 1.56 1.0965 2.55 1.9470 4.00 3.06
Table B-6SDCERS - City of San Diego

SDCERS-CITY OF SAN DIEGO JUNE 30, 2010 ACTUARIAL VALUATION
APPENDIX B ACTUARIAL ASSUMPTIONS AND METHODS
49
13. Rates of Retirement Rates of Retirement for City General and City Safety are shown in the two tables below.
Service10-19 33% 32% 32%
20 41 32 32 21 33 14 14 22 35 18 18 23 37 23 23 24 39 27 27 25 41 32 32 26 42 36 36 27 44 41 41 28 46 45 45 29 48 50 50 30 50 100 100 31 51 100 100 32 53 100 100 33 55 100 100 34 57 100 100
35+ 100 100 100
Table B-7SDCERS - City of San Diego
General Old Plan
Police Old Plan
Fire and Lifeguard
Rates of Retirement by Service
Age50 -- 10%51 -- 10 52 -- 10 53 -- 10 54 -- 20 55 3% 40 56 3 40 57 3 40 58 5 50 59 5 80 60 10 85 61 15 90 62 20 100 63 30 100 64 40 100 65 50 100 66 50 100 67 50 100 68 50 100 69 50 100 70 100 100
Table B-8SDCERS - City of San Diego
Rates of Retirement by Age
General 2009 Plan
Police 2009 Plan
In addition, if a Police-2009 Plan Member has both attained age 55 and completed at least 30 years of service, 100% retirement is assumed. For vested deferred participants, we assume that retirement will occur provided they have at least 10 years of service on the later of attained age or:
General Members: Earlier of age 62 or age 55 and 20+ years of service. Safety Members: Earlier of age 55 or age 50 and 20+ years of service.

SDCERS-CITY OF SAN DIEGO JUNE 30, 2010 ACTUARIAL VALUATION
APPENDIX B ACTUARIAL ASSUMPTIONS AND METHODS
50
Rates of Retirement for Elected Officials are based on age and are shown in the table below.
SDCERS - City of San DiegoRates of Retirement at Selected Ages
Age Elected Officials50 --51 --52 --53 15%54 155 556 357 458 559 660 6061 2562 3763 2364 3465 6866 6967 7468 80
69 90
70 100
Table B-9
For vested deferred Elected Officials, we assume that retirement will occur provided they have at least 4 years of service on the later of attained age or the earlier of age 55 or age 53 and 8+ years of service. If the inactive participant is not vested, the liability is the participant’s contributions with interest. 14. Family Composition Assumptions 80% of men and 50% of women were assumed married at retirement. A female spouse is assumed to be 4 years younger than her male spouse.

SDCERS-CITY OF SAN DIEGO JUNE 30, 2010 ACTUARIAL VALUATION
APPENDIX B ACTUARIAL ASSUMPTIONS AND METHODS
51
15. Member Contributions for Spousal Continuance All active Members contribute towards a 50% survivor continuance. However, Members who are unmarried at retirement may either be refunded that specific part of their contributions, or they may leave such contributions on account and receive an incremental benefit that is the actuarial equivalent of such contributions. 16. Deferred Member Benefit The benefit was estimated based on information provided by SDCERS staff. The data used to value the estimated deferred benefit were date of birth, date of hire, date of termination, and last pay. Based on the data provided, service credit, highest average salary, and deferred retirement age were estimated. The estimates were used to compute the retirement benefit, upon which the liabilities are based. For those participants without sufficient data or service, accumulated participant contribution balances, with interest, were used as the actuarial accrued liability. 17. DROP Account Balances For DROP participants still working, the liability for the account balances in the asset information received from SDCERS staff was adjusted to assume average commencement in 2 ½ years and an interest crediting rate of 2.9%. Thereafter, it was assumed the account balance would be converted to an annuity at an interest rate of 5% over an average period of 10 years. The 10-year period was selected to average among the available DROP payment elections, including a lump sum, life expectancy, and 20 years. Pre-2006 DROP account balances still left on account were valued assuming they would be paid out until age 70 ½, with an interest crediting rate of 2.9%. The remaining account balances were valued without adjustment. 18. Other The contribution requirements and benefit values of a plan are calculated by applying actuarial assumptions to the benefit provisions and Member information, using the actuarial funding methods described in the following section. Actual experience of SDCERS will not coincide exactly with assumed experience, regardless of the choice of the assumptions, the skill of the actuary or the precision of the many calculations made. Each valuation provides a complete recalculation of assumed future experience and takes into account all past differences between assumed and actual experience. The result is a continual series of adjustments to the computed contribution rate. From time to time it becomes appropriate to modify one or more of the assumptions, to reflect experience trends, but not random year-to-year fluctuations. 19. Changes Since Last Valuation The DROP interest crediting rate used to value the liability for account balances was reduced from 3.54% to 2.9% to reflect the Board’s adoption of this rate at its December 2009 meeting.

SDCERS-CITY OF SAN DIEGO JUNE 30, 2010 ACTUARIAL VALUATION
APPENDIX B ACTUARIAL ASSUMPTIONS AND METHODS
52
B. Actuarial Methods 1. Actuarial Funding Method The Entry Age Normal actuarial funding method was used for active employees, whereby the normal cost is computed as the level annual percentage of pay required to fund the retirement benefits between each Member’s date of hire and assumed retirement. The actuarial liability is the difference between the present value of future benefits and the present value of future normal cost. The unfunded actuarial liability is the difference between the actuarial liability and the actuarial value of assets. The unfunded actuarial liability is amortized by annual payments. The payments are determined so that they will be a level percentage of pay, assuming payroll increases 4.00% per year. The UAL is amortized over different closed periods depending on the source of the loss. The entire UAL as of June 30, 2007 is amortized over 20 years. Subsequent gains and losses are amortized over 15 years, changes in assumptions over 30 years, and changes in benefits over 5 years. Finally, if necessary, there is an additional UAL cost component to ensure that there is no negative amortization in any year. 2. Asset Valuation Method For the purposes of determining the City of San Diego’s annual required contribution to SDCERS, we use a smoothed actuarial value of assets. The asset smoothing method dampens the volatility in asset values that could occur because of the fluctuations in market conditions. Use of an asset smoothing method is consistent with the long-term nature of the actuarial valuation process. Assets are assumed to be used exclusively for the provision of retirement benefits and expenses. The actuarial value of assets each year is equal to 100% of the expected actuarial value of assets1 plus 25% of the difference between the current market value of assets and the expected actuarial value of assets. In no event will the actuarial value of assets ever be less than 80% of the market value of assets nor greater than 120% of the market value of assets. 3. Changes Since Last Valuation None. 1 The expected actuarial value of assets is equal to the prior year’s actuarial value of assets increased with actual contributions made, decreased with actual disbursements made, all items (prior assets, contributions and disbursements) further adjusted with expected investment returns for the year.

SDCERS-CITY OF SAN DIEGO JUNE 30, 2010 ACTUARIAL VALUATION
APPENDIX C SUMMARY OF PLAN PROVISIONS
53
1. Membership Requirement Salaried Employees – immediate eligibility upon employment (compulsory) (§ 24.0104). * 2. Monthly Salary Base for Benefits General and Safety Members (not including General-2009 Plan or Police-2009 Plan Members): Highest consecutive 12-month average in any qualified employment with a California governmental jurisdiction (§ 24.0103), subject to a 10% increase for those hired before July 1, 2002, if the General or Safety Member elects such increase in lieu of an increased benefit formula. General-2009 Plan Members: Average of highest three years in any qualified employment with a California governmental jurisdiction (§ 24.0103). Police-2009 Plan Members: Highest consecutive 12-month average in any qualified employment with a California governmental jurisdiction (§ 24.0103). 3. Service Retirement Eligibility General Members: Age 62 with 10 years of service, or age 55 with 20 years of service (§ 141 of City Charter). Safety Members: Age 55 with 10 years of service, or age 50 with 20 years of service (§ 141 of City Charter). Elected Officers: Age 55 with 4 years of service. Reduced retirement with 8 years of service regardless of age (§ 24.1705). Benefit General Members: For General-Old Plan Members, choice of formula in place on June 30, 2000 (Option 1), or formula effective as of July 1, 2000 (Option 2), or formula in effect as of July 1, 2002 (Option 3), with a benefit cap of 90% of Final Average Compensation unless an exception to the 90% cap applies (§ 24.0402). * All “§” references are to the City of San Diego Municipal Code.

SDCERS-CITY OF SAN DIEGO JUNE 30, 2010 ACTUARIAL VALUATION
APPENDIX C SUMMARY OF PLAN PROVISIONS
54
For General-2009 Plan Members, formula shown in Table C-1 (§ 24.0402.1). There is an additional amount equal to the annuitized Member COL Annuity contributions at retirement date. General Member Service Retirement Accrual Factors
General Member Service Retirement Accrual Factors
General - Old Plan
Option 1 Option 2 Option 3
55 2.00% 2.25% 2.50% 1.00%56 2.00% 2.25% 2.50% 1.25%57 2.00% 2.25% 2.50% 1.65%58 2.00% 2.25% 2.50% 1.758%59 2.08% 2.25% 2.50% 1.874%
60 2.16% 2.30% 2.55% 2.00%61 2.24% 2.35% 2.60% 2.12%62 2.31% 2.40% 2.65% 2.24%63 2.39% 2.45% 2.70% 2.36%64 2.47% 2.50% 2.75% 2.46%
65 and up 2.55% 2.55% 2.80% 2.60%
Table C-1SDCERS - City of San Diego
Retirement Age
General - 2009 Plan
Elected Officers: (Formerly designated as legislative) 3.5% (§ 24.1706). A 2% annual reduction factor applies to benefits for Members retiring prior to age 55 (§ 24.1705). There is an additional amount equal to the annuitized Member COL Annuity contributions at retirement date.
Safety Members: For all Fire Members, all Lifeguard Members, and Police-Old Plan Members, choice of formula in place on June 30, 2000 (Option 1), or formula effective as of July 1, 2000 (Option 2), with a benefit cap of 90% of Final Average Compensation unless an exception to the 90% cap applies (§ 24.0403). For Police-2009 Plan Members, formula shown in Table C-2 (§ 24.0403).
There is an additional amount equal to the annuitized Member COL Annuity contributions at retirement date.

SDCERS-CITY OF SAN DIEGO JUNE 30, 2010 ACTUARIAL VALUATION
APPENDIX C SUMMARY OF PLAN PROVISIONS
55
Safety Member Service Retirement Accrual Factors
Safety Member Service Retirement Accrual Factors
Police & Fire Lifeguard SafetyOption 1 Option 1 Option 2
50 2.50% 2.20% 3.00% 2.50%51 2.60% 2.32% 3.00% 2.60%52 2.70% 2.44% 3.00% 2.70%53 2.80% 2.57% 3.00% 2.80%54 2.90% 2.72% 3.00% 2.90%
55 and up 2.99% 2.77% 3.00% 3.00%
Table C-2SDCERS - City of San Diego
Police - 2009 Plan
Retirement Age
All Fire, All Lifeguard, and Police - Old Plan
For vested Members who terminate City employment, different retirement accrual factors may apply depending on which options were available at the time of termination. For Members of the General-2009 and Police-2009 Plans who terminate City employment, the accrual factors are those shown in Tables C-1 and C-2, respectively. For other General and Safety Members, the accrual factors are as shown below: GENERAL:
Table C-3 SDCERS – City of San Diego
For Vested Members who terminated-- --the accrual factors are-- Prior to January 1, 1997 See Pre-1997 Factors on next page January 1, 1997 - June 30, 2000 Option 1 without 10% increase in Final
Average Compensation July 1, 2000 - June 30, 2002 Option 1 with 10% increase in Final Average
Compensation; or Option 2 July 1, 2002 – Present Option 3
SAFETY:
Table C-4 SDCERS – City of San Diego
For Vested Members who terminated-- --the accrual factors are-- Prior to January 1, 1997 See Pre-1997 Factors on next page January 1, 1997 - June 30, 2000 Option 1 without 10% increase in Final
Average Compensation July 1, 2000 – Present Option 1 with 10% increase in Final Average
Compensation; or Option 2

SDCERS-CITY OF SAN DIEGO JUNE 30, 2010 ACTUARIAL VALUATION
APPENDIX C SUMMARY OF PLAN PROVISIONS
56
Pre-1997 Member Service Retirement Accrual FactorsGeneral Safety
Age Police Fire Lifeguard
50 -- 2.50% 2.20% 2.00%51 -- 2.54% 2.32% 2.10%52 -- 2.58% 2.44% 2.22%53 -- 2.62% 2.57% 2.34%54 -- 2.66% 2.72% 2.47%55 1.48% 2.70% 2.77% 2.62%
56 1.55% 2.77% 2.77% 2.62%57 1.63% 2.77% 2.77% 2.62%58 1.72% 2.77% 2.77% 2.62%59 1.81% 2.77% 2.77% 2.62%
60 1.92% 2.77% 2.77% 2.62%61 1.99% 2.77% 2.77% 2.62%62 2.09% 2.77% 2.77% 2.62%63 2.20% 2.77% 2.77% 2.62%64 2.31% 2.77% 2.77% 2.62%
65 and up 2.43% 2.77% 2.77% 2.62%
Table C-5SDCERS - City of San Diego
Maximum Benefit General-Old Plan Members: 90% of Final Average compensation if Option 3 is chosen, unless an exception to the 90% cap applies. General-2009 Plan Members: 80% of Final Average compensation. Safety Members (not including Police-2009 Plan Members): 90% of Final Average Compensation (subject to 10% increase). Police-2009 Plan Members: 90% of Final Average compensation. Elected Officers: None. Unmodified Form of Payment Monthly payments continued for the life of the Member, with 50% continuance to the eligible spouse upon Member’s death. If there is no eligible spouse, the Member may receive either a lump sum payment equal to the accumulated surviving spouse contributions or an actuarially equivalent annuity (§ 24.0601).

SDCERS-CITY OF SAN DIEGO JUNE 30, 2010 ACTUARIAL VALUATION
APPENDIX C SUMMARY OF PLAN PROVISIONS
57
Note: City employees withdrew from Social Security January 1, 1982. We assume that all future benefits for active Members will be determined on a non-integrated basis. Note: Effective July 1, 1991, service credit earned under the 1981 Pension System will be considered equivalent to SDCERS service for the purpose of benefit calculations (i.e., the above formulas will apply to 1981 Pension System service) (§ 24.1102, 24.0210, 24.0310). 4. Non-Industrial Disability Eligibility Ten years of service (Charter §141). Benefit General Members: Greater of 1.5% per year of service, one-third of final compensation*, or the earned service retirement benefit (§24.0502, §24.0505). Safety Members: Greater of 1.8% per year of service, one-third of final compensation*, or the earned service retirement benefit (§24.0502, §24.0504). * Per Board decision, the 10% increase on final average compensation has been removed. 5. Industrial Disability Eligibility No age or service requirement (§24.0501). Benefit General Members: Greater of one-half of final compensation*, or the earned service retirement benefit (§24.0502, §24.0505). Safety Members: Greater of one-half of final compensation*, or the earned service retirement benefit (§24.0502, §24.0503). * Per Board decision, the 10% increase on final average compensation has been removed. Elected Officers: Earned service retirement benefit (§24.1707).

SDCERS-CITY OF SAN DIEGO JUNE 30, 2010 ACTUARIAL VALUATION
APPENDIX C SUMMARY OF PLAN PROVISIONS
58
6. Non-Industrial Death Before Eligible to Retire Refund of employee contributions with interest, plus one month’s salary for each completed year of service, to a maximum of six months salary (§24.0702). 7. Non-Industrial Death After Eligible to Retire for Service 50% of earned benefit payable to surviving eligible spouse, domestic partner, or eligible child (§24.0704). 8. Industrial Death 50% of the final average compensation (subject to 10% increase) preceding death, payable to eligible spouse, domestic partner, or eligible child (§24.0705). 9. Death After Retirement 50% of Member’s unmodified allowance continued to eligible spouse (§24.0601). $2,000 payable in lump sum to the beneficiary or the estate of the retiree. (§24.0710) 10. Withdrawal Benefits (§24.0206, §24.0306) Pre-12/8/76 Hires If contributions left on deposit, entitled to earned benefits, commencing anytime after eligible to retire. Post-12/7/76 Hires Less than ten years of service: Refund of accumulated employee contributions with interest, or may keep deposits in the System and earn additional interest and use service with a reciprocal system to establish eligibility for earned benefits upon concurrent retirement from reciprocal system (§24.0206, 24.0306, 24.1005). Ten or more years of service: If contributions left on deposit, entitled to earned benefits commencing anytime after eligible to retire (§24.0206, 24.0306) 11. Post-retirement Cost-of-Living Benefit General and Safety Members: Based on changes in Consumer Price Index, to a maximum of 2% per year (§24.1505).

SDCERS-CITY OF SAN DIEGO JUNE 30, 2010 ACTUARIAL VALUATION
APPENDIX C SUMMARY OF PLAN PROVISIONS
59
12. COL Annuity Actuarial equivalent of accumulated contributions in cost-of-living annuity account at time of retirement (§24.0103). 13. Member Contributions Member contributions vary by age at time of entrance into SDCERS (§24.0201, §24.0301). While a significant portion of these contributions may be “offset,” such offsets are not directly reflected in either the employee contributions or related refund calculations. These are the rates in effect for the June 30, 2010 valuation.
Employee Contribution RatesFire Lifeguard
Entry Age Old Plan 2009 Plan20 6.74% 3.37% 12.54% 9.97% 12.54% 12.45%21 7.10 3.66 12.77 10.47 12.77 12.6822 7.48 3.96 13.07 10.98 13.07 12.9823 7.88 4.27 13.46 11.51 13.46 13.3024 8.27 4.57 13.85 12.04 13.85 13.6125 8.66 4.88 14.23 12.59 14.23 13.9226 9.03 5.19 14.56 12.97 14.56 14.2027 9.39 5.51 14.88 13.18 14.88 14.4528 9.74 5.82 15.17 13.43 15.17 14.6529 10.07 6.15 15.41 13.71 15.41 14.7830 10.39 6.46 15.80 14.01 15.80 15.1931 10.69 6.79 15.85 14.30 15.85 15.1332 10.98 7.11 15.94 14.61 15.94 15.0833 11.25 7.43 16.06 14.92 16.06 15.0234 11.49 7.76 16.13 15.23 16.13 14.9735 11.77 8.07 16.10 15.45 16.10 14.9136 11.72 8.35 16.56 15.82 16.56 15.3437 11.67 8.59 16.99 16.17 16.99 15.7438 11.64 8.79 17.39 16.52 17.39 16.1139 11.65 9.00 17.76 16.84 17.76 16.4640 11.68 9.21 18.10 17.15 18.10 16.7741 11.69 9.40 18.41 17.43 18.41 17.0642 11.69 9.60 18.68 17.69 18.68 17.3143 11.91 9.83 18.91 17.90 18.91 17.5244 12.14 10.07 19.09 18.07 19.09 17.6845 12.36 10.30 19.19 18.17 19.19 17.7746 12.58 10.54 18.57 17.71 18.57 17.2147 12.78 10.76 18.27 17.60 18.27 16.9248 12.98 10.98 17.93 17.55 17.93 16.6149 13.16 11.19 17.57 17.49 17.57 16.2850 13.31 11.3851 13.44 11.5652 13.53 11.7253 13.29 11.8054 13.02 11.8155 12.70 11.6556 12.43 11.3557 12.21 11.06
Police
Table C-6SDCERS - City of San Diego
Old Plan 2009 PlanAll
MembersAll
Members
General

SDCERS-CITY OF SAN DIEGO JUNE 30, 2010 ACTUARIAL VALUATION
APPENDIX C SUMMARY OF PLAN PROVISIONS
60
The contribution rates were recalculated for the June 30, 2009 valuation based on the Board’s adopted interpretation of the requirement in San Diego City Charter Section 143 for “substantially equal” employer and employee contributions. The employee contribution rates are the sum of four components, three of which are specified in the Municipal Code: a cost-of-living rate (§24.1506(a)), a surviving spouse rate (§24.0601), and a COL Annuity rate (§24.1506(b)). The fourth component is the “substantially equal” rate, which is 50% of the cost of accrued service retirement allowances, payable either immediately or deferred until a later age, when a member leaves employment via termination, disability, or service retirement. Since the cost-of-living rate funds the Member’s portion of the post-retirement cost-of-living benefit, the surviving spouse rate funds the Member’s portion of surviving spouse allowances, and the COL Annuity rate funds the COL Annuity, these benefits are not included in the calculation of the “substantially equal” rate. All benefits not included in the components described above are paid for entirely by the City. The assumptions used to develop the rates were the same as those used in this valuation, except that all mortality tables were blended 50/50 between male and female rates. Elected Officers (General) contribute 9.05% of total salary, regardless of entry age (§24.1704). 14. Internal Revenue Code Limitation Benefits provided by SDCERS’ Trust Fund are subject to the limitations set forth in Section 415 of the Internal Revenue Code in accordance with the “grandfather” election in Section 415(b)(10) of the Code (§24.1004). As of the June 30, 2006 valuation, active participants’ benefit payments were limited by Section 415 of the Internal Revenue Code. As of the June 30, 2007, all benefit payments were limited by Section 415 of the Internal Revenue Code. 15. Deferred Retirement Option Plan Effective April 1, 1997, a deferred retirement option plan (DROP) was created and offered to Members as an alternative method of benefit accrual. Members eligible for service retirement are eligible to participate in DROP (except for Safety Members who elect to accrue benefits under Section 24.0403(g)), but only those hired before July 1, 2005 may enter the program (§24.1402.1). A participant in DROP may leave DROP at any time before the end of his or her designated DROP participation period by voluntarily leaving City employment (§24.1403). The maximum DROP participation period is 60 months (§24.1402).

SDCERS-CITY OF SAN DIEGO JUNE 30, 2010 ACTUARIAL VALUATION
APPENDIX C SUMMARY OF PLAN PROVISIONS
61
A DROP participation account is a nominal account established with the Retirement System, which is credited with the following amounts (§24.1404):
The Member’s monthly service retirement allowance, credited monthly, calculated at the date of DROP entry and increased each year by a cost-of-living adjustment.
The Member’s supplemental 13th check benefit, if applicable, credited annually. 3.05% of base compensation, payable by the City and credited bi-weekly. 3.05% of base compensation, payable by the Member and credited bi-weekly. For a Firefighter’s Local 145 bargaining unit Member, an amount representing their
unused annual leave accrued after July 1, 2002, including annual leave accrued after July 1, 2002, while in DROP, which was not converted to creditable service before the date of DROP entry.
Interest on the above amounts, as determined by the Board. When a Member leaves DROP and City employment, they begin to collect their monthly service retirement allowance, their supplemental 13th check benefit (if applicable), and the amounts credited to their DROP participation account, payable as a single lump sum distribution, as a 240-month annuity with equal payments, or any other form approved by the Board and subject to applicable provisions of the Internal Revenue Code (§24.1407). DROP is not intended to jeopardize the tax-qualified status of the retirement system under the rules and regulations of the Internal Revenue Service. Benefits provided under this division are subject to the limitations of Section 415 of the Internal Revenue Code relating to the amount of benefits that can be paid. 16. Blended Benefit with Participating Agencies Members may retire and receive benefits from multiple Plan IDs (e.g., a City police officer could have also worked for the Airport Authority). 17. Changes Since Last Valuation General and Police Members hired on or after July 25, 2009 participate in new Plans with different benefit structures. Their plan provisions are described in this section. Note: The summary of major plan provisions is designed to outline principal plan benefits. If the SDCERS staff should find the plan summary not in accordance with the actual provisions, the actuary should immediately be alerted so the proper provisions are valued.

SDCERS-CITY OF SAN DIEGO JUNE 30, 2010 ACTUARIAL VALUATION
APPENDIX D
GLOSSARY OF TERMS
62
1. Actuarial Liability The Actuarial Liability is the difference between the present value of all future system benefits and the present value of total future normal costs. This is also referred to by some actuaries as the “accrued liability” or “actuarial accrued liability.” 2. Actuarial Assumptions Estimates of future experience with respect to rates of mortality, disability, turnover, retirement rate or rates of investment income and salary increases. Actuarial assumptions (rates of mortality, disability, turnover and retirement) are generally based on past experience, often modified for projected changes in conditions. Economic assumptions (salary increases and investment income) consist of an underlying rate in an inflation-free environment plus a provision for a long-term average rate of inflation. 3. Accrued Service Service credited under the System which was rendered before the date of the actuarial valuation. 4. Actuarial Equivalent A single amount or series of amounts of equal actuarial value to another single amount or series of amounts, computed on the basis of appropriate actuarial assumptions. 5. Actuarial Funding Method A mathematical budgeting procedure for allocating the dollar amount of the actuarial present value of a retirement system benefit between future normal cost and actuarial accrued liability. Sometimes referred to as the “actuarial funding method.” 6. Actuarial Gain/(Loss) The difference between actual experience and actuarial assumption anticipated experience during the period between two actuarial valuation dates. 7. Actuarial Present Value The amount of funds currently required to provide a payment or series of payments in the future. It is determined by discounting future payments at predetermined rates of interest, and by probabilities of payment. 8. Amortization Paying off an interest-discounted amount with periodic payments of interest and principal—as opposed to paying off with a lump sum payment.

SDCERS-CITY OF SAN DIEGO JUNE 30, 2010 ACTUARIAL VALUATION
APPENDIX D
GLOSSARY OF TERMS
63
9. Annual Required Contribution (ARC) under GASB 25 The Governmental Accounting Standards Board (GASB) Statement No. 25 defines the Plan Sponsor’s “Annual Required Contribution” (ARC) as the employer’s periodic required contributions to a defined benefit plan, calculated in accordance with the parameters outlined in Statement No. 25. The SDCERS-City of San Diego’s computed contribution rate for FY 2012 meets the parameters of GASB 25. 10. Normal Cost The actuarial present value of retirement system benefits allocated to the current year by the actuarial funding method. 11. Set Back/Set Forward Set back is a period of years that a standard published table (i.e., mortality) is referenced backwards in age. For instance, if the set back period is 2 years and the participant’s age is currently 40, then the table value for age 38 is used from the standard published table. It is the opposite for set forward. A system would use set backs or set forwards to compensate for mortality experience in their work force. 12. Unfunded Actuarial Liability (UAL) The difference between actuarial liability and the actuarial value of assets. Most retirement systems have unfunded actuarial liability. They arise each time new benefits are added and each time an actuarial loss is realized. The existence of unfunded actuarial liability is not in itself bad, any more than a mortgage on a house is bad. Unfunded actuarial liability does not represent a debt that is payable today. What is important is the ability to amortize the unfunded actuarial accrued liability, and the trend in its amount (after due allowance for devaluation of the dollar).