EMPLOYEES’ - Milwaukee County,...
30
EMPLOYEES’ RETIREMENT SYSTEM of the County of Milwaukee 2012 Annual Report of the Pension Board as of and for the Years Ended December 31, 2012 and 2011 CITIZEN MEMBERS John M. Maier, J.D., Chairman Dr. Brian Daugherty Dean Muller Dr. Sarah W. Peck Patricia VanKampen RETIREE MEMBER D.A. Leonard EMPLOYEE MEMBERS David Sikorski, Vice Chairman Laurie Braun Norb Gedemer Vera Westphal ERS MANAGER Marian Ninneman 901 North 9th Street, Room 210-C Milwaukee, Wisconsin 53233 Telephone: (414) 278-4207 [email protected]
Transcript of EMPLOYEES’ - Milwaukee County,...

EMPLOYEES’
RETIREMENT SYSTEM
of the
County of Milwaukee
2012
Annual Report
of the Pension Board as of and for the Years Ended
December 31, 2012 and 2011
CITIZEN MEMBERS
John M. Maier, J.D., Chairman
Dr. Brian Daugherty
Dean Muller
Dr. Sarah W. Peck
Patricia VanKampen
RETIREE MEMBER
D.A. Leonard
EMPLOYEE MEMBERS
David Sikorski, Vice Chairman
Laurie Braun
Norb Gedemer
Vera Westphal
ERS MANAGER
Marian Ninneman
901 North 9th Street, Room 210-C
Milwaukee, Wisconsin 53233
Telephone: (414) 278-4207


Table of Contents
Letter from the Pension Board .............................................. Page 1
Report of the Independent Auditors ................................... Page 2 – 3
Management’s Discussion and Analysis ............................... Page 4 – 5
Basic Financial Statements
Plan Financial Statements
Statement of the Plan Net Position ............................. Page 6
Statement of Changes in Plan Net Position ................ Page 7
Notes to the Financial Statements ....................................... Page 8 – 19
Required Supplementary Information
Schedule of Funding Progress .............................................. Page 20
Schedule of Employer and Other Contributions .................. Page 20
Notes to Required Supplementary Information .................. Page 21 – 22
Ten-year Historical Trend ........................................................ Page 23
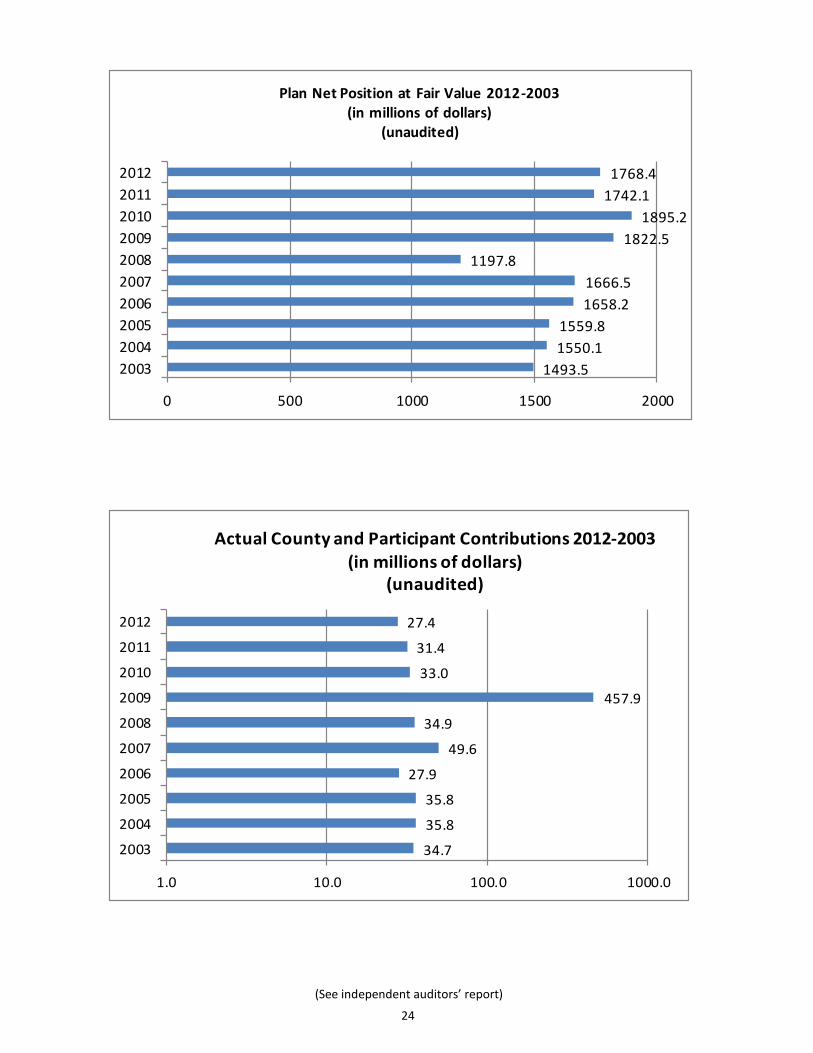
Plan Net Position at Fair Value 2012 – 2003 ........................... Page 24
Actual County and Participant Contributions 2012 – 2003 .... Page 24
Active Membership Statistics ................................................ Page 25
Retirement and Survivors Statistics ........................................ Page 25
List of Consultants ................................................................... Page 26
Employees’ Retirement System of the County of Milwaukee
2012 Annual Report of the Pension Board

EMPLOYEES’ RETIREMENT SYSTEM (ERS)
Milwaukee County Pension Board
John M. Maier, J.D.
Chairperson
David Sikorski
Vice Chairperson
Laurie Braun
Dr. Brian Daugherty
Norb Gedemer
D. A. Leonard
Dean Muller
Dr. Sarah W. Peck Patricia VanKampen
Vera Westphal
Marian Ninneman
ERS Manager
July 26, 2013 Retirement System Members: We are pleased to present the 2012 Annual Report of your Pension Board. The Employees’ Retirement System (“ERS”) experienced a positive investment return for the year of 11.0%. Net plan position held in trust for pension benefits increased $26.3 million. This increase was mainly due to investments gains and a reduction in pension benefit payments. Total net position at the end of the year was $1.768 billion. For further detailed information regarding ERS’ performance, please see the management’s discussion and analysis, the financial statements, and the footnotes that follow. The description of ERS included in this report highlights major plan provisions. County Ordinances, labor agreements, Pension Board Rules, and Governmental Accounting Standards Board pronouncements prevail over the contents of this report. If you have any questions, please call (414) 278-4145. Several options are available to members who retire or otherwise leave County service with respect to their pension benefits. Before terminating employment, you should become fully informed of the various opportunities available to you, so you can make the best choice for your situation. Members considering retirement within the next few years are reminded to watch for announcements from the County for retirement information programs. Please call the ERS office at (414) 278-4207 for further information regarding these programs. If you are interested in meeting with an Administrative Specialist to discuss retirement, please schedule an appointment by calling (414) 278-4207. Each year, Milwaukee County distributes pension statements reflecting balances as of the end of the previous year. Remember to keep your beneficiary designations current by informing the Retirement System office of any changes. Retired members should also notify the ERS office in writing of any changes in residence or address to insure benefit payments and year-end Form 1099-R statements are properly mailed. The Pension Board
1


4
Management is pleased to provide this overview and analysis of the financial activities of the Employees' Retirement System of the County of Milwaukee (“ERS”, or the “Retirement System”) for the year ended December 31, 2012. Readers are encouraged to consider the information presented in conjunction with the Financial Statements.
FINANCIAL HIGHLIGHTS
PLAN NET POSITION Plan net position for ERS increased $26,328 as of 12/31/12 vs. 12/31/11 following a decrease of ($153,060) as of 12/31/11 vs. 12/31/10. Domestic and International Equities, Fixed Income, Long/Short, Real Estate, Infrastructure, and Private Equity experi-enced positive returns in 2012. For the year, the pension fund experienced a positive return of 11.0%. The rate of return on total assets of the pension fund, net of fees, was 11.0%, 0.2%, and 12.1% for the years ended December 31, 2012, 2011, and 2010, respectively. Receivables decreased ($18,510) as of 12/31/12 vs. 12/31/11 due primarily to a decrease in receivables from sales of invest-ments and a lower pension contribution from the County of Milwaukee. Receivables decreased ($4,447) as of 12/31/11 vs. 12/31/10, due primarily to a decrease in receivables from sales of investments. Other assets decreased ($41,416) as of 12/31/12 vs. 12/31/11 and decreased ($57,074) as of 12/31/11 vs. 12/31/10 due largely to changes in securities lending – collateral of ($38,479) and ($57,033), respectively. Liabilities decreased ($37,379) from 2012 to 2011. This decrease was due to the reduction in securities lending – collateral. Liabilities decreased ($58,056) from 2011 to 2010. ERS buys and sells financial futures contracts to improve the performance of the fund. ERS purchases contracts that approxi-mate the amount of cash held by US equity managers and cash used to pay benefits and expenses.
ADDITIONS AND DEDUCTIONS TO PLAN NET POSITION
Total additions increased $170,722 in 2012 vs. 2011 and decreased ($200,645) in 2011 vs. 2010. The 2012 increase was primar-ily the result of an increase in investment income. The 2011 decrease was mainly due to a reduction in investment income. Benefits payments decreased ($8,903) in 2012 and increased $24,796 in 2011. The decrease in 2012 was due to a decrease in lump sum payments of $17.1 million and an increase in monthly benefits of $8.2 million. The increase in 2011 was due to an increase in monthly benefits of $6.3 million and an increase of $18.5 million in lump sum payments. 2012 saw a 44.0% decrease in retirements from 2011. The large decrease was due mainly to the County of Milwaukee eliminat-ing the Medicare part B reimbursement for most new retirees during 2011. As of December 31, 2012, 2011, and 2010, the funding ratio (actuarial value of the assets divided by the actuarial accrued liabil-ity) for the plan was 87.3%, 89.2%, and 92.2%, respectively. The funding ratio gives an indication of how well the liabilities of the pension plan are funded. The higher the funding ratio, the better the plan is funded. The ratio increases due to investment gains and pension contributions, and declines due to investment losses, increases in the plan benefits, large pension payouts, and underpayment of pension annual required contributions.
The Board of Trustees of ERS (“The Board”) has the responsibility for the overall performance of the Retirement System. The Board’s principal means to achieve this goal is by (a) determining an asset allocation policy which is expected to provide the long-term rate of return sufficient to fund benefits while minimizing the risk of loss through diversification, (b) selecting an appropriate number of investment managers to manage the assets within an asset class and monitoring the performance of such investment managers relative to specified benchmarks, and (c) implementing cost containment measures intended to reduce the investment fees and costs associated with investing the Retirement System’s assets. The Board is the fiduciary of the Retirement System and is responsible for carrying out the investment functions solely in the interest of the members and benefit recipients.
OVERVIEW OF THE FINANCIAL STATEMENTS
The discussion and analysis is intended to serve as an introduction to the Retirement System’s financial statements. The financial section is comprised of four components: (1) financial statements, (2) notes to the financial statements, (3) required supplemen-tary information, and (4) other supplementary schedules.
Financial Statements – There are two financial statements presented for the plan. The Statement of Plan Net Position as of Decem-
ber 31, 2012 and 2011 indicates the plan net position available to pay future benefits and gives a snapshot of the financial assets available for pension benefits at a particular point in time. The Statement of Changes in Plan Net Position for the years ended De-cember 31, 2012 and 2011 provides a view of the additions and deductions to the plan for the years presented.
Notes to financial statements – The notes provide additional information that is essential for a full understanding of the data pro-
vided in the financial statements. Required supplementary information – The required supplementary information consists of a Schedule of Funding Progress and a
Schedule of Employer and Other Contributions and related notes concerning the funding status of the plan. These schedules pro-vide historical trend information, that contribute to understanding the changes in the funded status of the plan over time.
(See independent auditors’ report)
Management’s Discussion & Analysis (Unaudited)
(In Thousands of Dollars)

5
Requests for financial information:
The financial report is designed to provide the Board, our membership, taxpayers, investment managers, and creditors with a general overview of ERS’ finances and to demonstrate ERS’ accountability for the funds under its stewardship. Please address any questions about this report or requests for additional financial information to:
Milwaukee County ERS 901 N. 9th Street Room 210C
Milwaukee, WI 53233
(See Independent auditors’ report)
Management’s Discussion & Analysis (Unaudited)
(In Thousands of Dollars)
Other supplementary schedules – The additional schedules (Ten-Year Historical Trend Information, Plan Net Position, Actual County and Participant Contributions, Active Membership Statistics, Retirements and Survivors) are presented for the pur-pose of additional analysis.
COMPARATIVE FINANCIAL STATEMENTS
Retirement System's Plan Net Position 12/31/2012 12/31/2011 12/31/2010 Difference % Change
Assets
Cash and cash equivalents $56,934 $84,108 $63,139 ($6,205) (9.8%)
Receivables 23,842 42,352 46,799 (22,957) (49.1%)Investments, at fair value 1,691,695 1,618,148 1,788,712 (97,017) (5.4%)Other assets 25,573 64,488 121,562 (95,989) (79.0%) Total Assets 1,798,044 1,809,096 2,020,212 (222,168) (11.0%)
Liabilities
Security lending obligations 20,020 58,499 115,532 (95,512) (82.7%)
Other l iabilities 9,589 8,490 9,513 76 0.8%
Total Liabilities 29,609 66,989 125,045 (95,436) (76.3%)
Plan net position held in trust for pension benefits $1,768,435 $1,742,107 $1,895,167 ($126,732) (6.7%)
2012 2011 2010 Difference % Change
Additions
Employer contributions $18,411 $28,276 $32,894 ($14,484) (44.0%)
Member contributions 9,041 3,314 76 8,965 11796.1%
Investment income 182,241 7,381 206,646 (24,405) (11.8%)
Total Additions 209,693 38,971 239,616 (29,924) (12.5%)
Deductions
Benefit payments (178,557) (187,460) (162,664) (15,893) 9.8%
Administrative expenses (4,596) (4,501) (4,186) (410) 9.8%
Withdrawals (212) (70) (139) (73) 52.5%
Total Deductions (183,365) (192,031) (166,989) (16,376) 9.8%
Changes in plan net position available for benefits 26,328 (153,060) 72,627 (46,299) (63.7%)
Plan net position held in trust for pension benefits:
Beginning of year 1,742,107 1,895,167 1,822,540 (80,433) (4.4%)
End of year $1,768,435 $1,742,107 $1,895,167 ($126,732) (6.7%)
Retirement System's Changes in Plan Net Position

6
The accompanying notes are an integral part of these financial statements
EMPLOYEES' RETIREMENT SYSTEM OF THE COUNTY OF MILWAUKEE
STATEMENT OF PLAN NET POSITION
AS OF:
December 31, 2012 December 31, 2011
ASSETS:
CASH AND CASH EQUIVALENTS 56,933,710$ 84,107,639$
RECEIVABLES
Due from sale of investments 1,330,034 8,752,715
Accrued interest and dividends 2,284,805 2,527,511
County of Milwaukee 19,647,505 30,252,388
Miscellaneous receivables 579,386 819,444
TOTAL RECEIVABLES 23,841,729 42,352,058
INVESTMENTS AT FAIR VALUE
Domestic common and preferred stocks 408,643,021 388,657,810
Long/Short hedge funds 181,417,205 174,104,924
Fixed income 445,499,443 472,957,219
International common and preferred stocks 348,646,991 306,112,944
Real estate and REIT's 127,429,416 114,522,432
Infrastructure 130,214,951 134,188,424
Private equity 49,843,970 27,604,723
TOTAL INVESTMENTS 1,691,694,997 1,618,148,476
OTHER ASSETS
Software development costs, net (See Note 2) 5,552,525 5,988,807
Securities lending - collateral (See Note 5) 20,020,522 58,498,948
TOTAL OTHER ASSETS 25,573,047 64,487,755
TOTAL ASSETS 1,798,043,483 1,809,095,928
LIABILITIES
Securities lending - collateral (see Note 5) 20,020,522 58,498,948
Miscellaneous payables 3,689,753 6,707,712
Payable for securities purchased 4,267,276 238,929
Payable to OBRA retirement plan 1,631,303 1,543,452
TOTAL LIABILITIES 29,608,855 66,989,041
PLAN NET POSITION HELD IN TRUST FOR PENSION BENEFITS 1,768,434,628$ 1,742,106,887$
(A schedule of funding progress is presented on page 20)

7
The accompanying notes are an integral part of these financial statements
EMPLOYEES' RETIREMENT SYSTEM OF THE COUNTY OF MILWAUKEE
STATEMENT OF CHANGES IN PLAN NET POSITION
FOR THE YEARS ENDED:
December 31, 2012 December 31, 2011
ADDITIONS:
CONTRIBUTIONS
County of Milwaukee 18,410,496$ 28,275,594$
Plan participants 9,040,652 3,313,807
TOTAL CONTRIBUTIONS 27,451,148 31,589,401
INVESTMENT INCOME
Net appreciation (depreciation) in fair value 155,309,701 (18,672,797)
Interest and dividends 22,147,022 24,069,225
Securities lending income 70,904 222,054
Other income 8,513,437 5,636,028
Total investment income 186,041,063 11,254,510
Less: Securities lending rebates and fees 50,314 (67,730)
Investment expense (3,849,959) (3,805,527)
Net investment income 182,241,418 7,381,253
TOTAL ADDITIONS 209,692,566 38,970,654
DEDUCTIONS:
Benefits paid to retirees & beneficiaries (178,557,030) (187,460,031)
Administrative expenses (4,595,550) (4,500,457)
Withdrawal of membership accounts (212,245) (70,123)
TOTAL DEDUCTIONS (183,364,825) (192,030,610)
NET CHANGE IN PLAN POSITION 26,327,741 (153,059,956)
PLAN NET POSITION HELD IN TRUST FOR PENSION BENEFITS
Beginning of year 1,742,106,887 1,895,166,843
End of year 1,768,434,628$ 1,742,106,887$
8
Notes to the Financial Statements For the Years Ended December 31, 2012 and 2011
(1) Description of Retirement System –
The following brief description of the provisions of the Employees’ Retirement System of the County of Milwaukee (“ERS” or the “Retirement System”) is provided for financial statement purposes only. Members should refer to Section 201.24 of the General Ordinances of Milwaukee County and their respective bargaining agreements for more complete information
The Retirement System is a single-employer defined benefit plan that was created to encourage qualified personnel to enter and remain in the service of the County of Milwaukee (the “County”) by providing for a system of retirement, disability and death benefits to or on behalf of its employees. Under Chapter 201 of the Laws of Wisconsin for 1937, the County was mandated to create the Retirement System as a separate legal entity. The County did so by passing Section 201.24 of the Gen-eral Ordinances of Milwaukee County. The authority to manage and control the Retirement System is vested in the Pension Board of ERS (the “Board”). The Board consists of ten members – three members appointed by the County Executive (subject to confirmation by the County Board of Supervisors), three employee members elected by active employee members, two mem-bers appointed by the County Board chairperson, one employee member appointed by the Milwaukee Deputy Sheriffs’ Associa-tion, and one retiree member elected by retirees.
The Board created two (2) committees to assist in the administration of the Board’s duties. The Investment Committee reviews the investment portfolio on a monthly basis, endorses strategies, and submits investment recommendations to the full Board. The Audit Committee reviews legal issues, Ordinance adherence, and submits recommendations to the full Board re-garding the annual audit and the Annual Report of the Pension Board.
Contributions – The Retirement System had been substantially noncontributory. However, starting in 2011, certain members began mak-
ing mandatory contributions. Most full-time, regularly-appointed employees were required to make contributions in 2012. The employee contributions varied from 4.7% of compensation to 6.59% for 2012. In 2013, the employee contribution percentages will range from 4.4% to 6.59% of compensation. These percentages may change from year to year based on an analysis per-formed by the Retirement System’s actuary.
Employees who terminate County employment and are not eligible for an immediate pension payment may request a refund of all accumulated contributions made, with simple interest at 5% per annum. For employees terminating employment with the County, any refund of accumulated contributions must be requested within sixty (60) days after termination. Any em-ployee receiving this refund will forfeit his or her service credit and no longer be a member of ERS.
Contributions due from the County to the Retirement System consist of amounts sufficient to fund the annual normal cost and interest on and amortization of the unfunded or overfunded actuarial accrued liability less the expected contributions from the participants. A substantial portion of the current year’s contribution is paid to the Retirement System in the following year.
In 2012, the County of Milwaukee started receiving contributions from the State of Wisconsin for members who were transferred from Milwaukee County to the State of Wisconsin for future service. As a result of the agreement between the State and the County, non-vested members of the Retirement System were able to continue to accrue pension benefits with ERS, while they were employed with the State. Once the member is vested, they are transferred to the state retirement plan. The state employees were required to contribute 4.7% of their wages to ERS, and the state contributed the same percentage to the County for 2012.
The County makes contributions to the Retirement System based upon the Annual Required Contribution (“ARC”) and legal requirements, at the discretion of the County Board. An actuary hired by the Pension Board establishes the ARC. Data used in the determination of the ARC is based upon the prior fiscal year’s demographics. The actual contribution made to the pension plan is set during the County’s budget process and may differ from the ARC as a result of changes in plan provisions implemented subsequent to establishment of the ARC and budgetary restraints. During the year, the Retirement System ac-crues those contributions that the County has included in its current year’s budget. The County contribution recorded by the Retirement System was $2,575,955 and $4,781,364 more than the Funding Contribution Amount for 2012 and 2011, respective-ly.
Members - 2012 2011
Retiree and beneficiaries currently receiving benefits................................................. 7,867 7,747
Vested and terminated employees not yet receiving benefits ..................................... 1,196 1,341
Current employees ............................................................................................................... 3,934 3,972
Total participants ................................................................................................................. 12,997 13,060
As of December 31

9
The Actual Funding Contribution is calculated by the Retirement System’s actuary using census data, following plan
guidelines, and compared to current net assets. The object is to calculate a contribution that allows the Retirement System to fulfill its obligations to its members.
Benefits - The normal retirement benefit is a monthly pension for the life of the member beginning at normal retirement age.
The pension amount is determined by the following formula:
Multiplier x Creditable Service x Final Average Salary
For most members, the normal retirement age is either 60 or 64 depending on ERS enrollment date and collective bargaining agreement. A few labor agreements also require a minimum of 5 years creditable service in addition to the age requirement. For deputy sheriff members, the normal retirement age is 57 or age 55 with 15 years of creditable service. Depending on enrollment date and collective bargaining agreement, some active members are eligible to retire when their age added to their years of creditable service equals 75 (the “Rule of 75”). The multiplier is determined by Ordinance, col-lective bargaining agreements, and ERS enrollment date. At this time, the multiplier percentage can be 1.5%, 1.6%, 2% or 2.5%. A member’s three or five consecutive years of highest earnings are used to calculate their final average salary as defined by the Ordinance and labor agreement. Annually after retirement, the monthly benefit is increased by 2% of the benefit paid for the first full month of retirement subject to IRS limits. By Ordinance, the maximum benefit (excluding post-retirement increases) payable to a member cannot exceed the sum of 80% of the member’s final average monthly salary.
For some members, depending on enrollment date and collective bargaining agreement, the member may elect to receive a backdrop benefit. This benefit permits an employee to receive a lump-sum payment plus a monthly pension benefit upon retirement. The lump-sum payment is the total of the monthly pension amounts, adjusted for post retirement increases that a member would be entitled to from a prior date (“backdrop date”) to the date that the member terminates employment plus compounded interest. The backdrop date must be at least one calendar year prior to the termination date and the member must have been eligible to retire as of that date. The member will be entitled to a post retirement increase based on the backdrop date once the member terminates employment.
In 2012, the County Board passed an ordinance limiting the amount of backdrop benefit for most eligible employees who choose a backdrop date after April 1, 2013. If the member chooses a backdrop date after April 1, 2013, then the monthly drop benefit is calculated using the member’s final average salary, service credit, and applicable multipliers as of April 1, 2013. This plan change does not apply to Elected Officials, Skilled Trades, Machinists, Federated Nurses, and Fire-fighters.
A member who meets the requirements for an accidental or ordinary disability retirement benefit is entitled to an amount computed in the same manner as a normal pension but not less than 60% of the member’s final average salary for accidental disability (75% for a represented deputy sheriff). A total of 15 years of creditable service is required to apply for ordinary disability.
Most members are immediately vested upon attaining age 60 or 64. A vested member is eligible for a deferred pen-sion beginning as of the member’s normal retirement date.
A member who is 55 years of age and has 15 years of credited service may elect to receive early reduced retirement benefits. The member would be entitled to a benefit equal to the normal retirement benefit with a lifetime reduction of 5% for each year prior to the normal retirement date.
Upon the death of a member (generally after 1 year of service and depending on collective bargaining agreements), a spouse with a dependent child as defined by Ordinance will receive 40% of the deceased member’s salary, reduced by Social Security benefits payable to the spouse. An additional 10% of salary, reduced by Social Security benefits, is paid for each dependent child. Generally, the total benefit, including Social Security benefits, cannot exceed 90% of the prior salary level of the member. At age 60, the spouse will receive 50% of the normal retirement benefit based on the member’s projected service to age 60. If there is no spouse or child, the death benefit payable to a designated beneficiary is equal to 50% of the deceased member’s final average salary, but not to exceed $2,000.
A member who becomes eligible for normal retirement, but continues to work may elect a Protective Survivorship Option (“PSO”) designating a person to receive a pension (100% or 50% option) in the event of their death while in active service. The PSO election must be filed in writing on an approved form. In the absence of an election, a surviving spouse will be paid a 100% survivorship pension.
10
Currently, members may choose among several benefit payment options when retiring. The available pension options are:
-Maximum Option
Benefit payable for the member’s lifetime and ceases upon member’s death.
-Option 1 – Membership Account Refund
This option is an actuarially reduced benefit that ceases upon member’s death. This option guarantees that the mem-ber will receive the total Membership Account balance as of the retirement date. The Membership Account balance is reduced monthly by an actuarially determined amount. Any balance remaining upon the member’s death will be paid to the member’s beneficiary.
-Option 2 – 50%
This option is an actuarially reduced pension benefit that is payable over the life of the member. Upon the member’s death, 50% of the pension benefit is payable over the life of a named beneficiary, if living;
-Option 3 – 100%
This option is an actuarially reduced pension benefit that is payable over the life of the member. Upon the member’s death, 100% of the pension benefit is payable over the life of a named beneficiary, if living;
-Option 4 – 25%
This option is an actuarially reduced pension benefit that is payable over the life of the member. Upon the member’s death, 25% of the pension benefit is payable over the life of a named beneficiary, if living;
-Option 5 - 75%
This option is an actuarially reduced pension benefit that is payable over the life of the member. Upon the member’s death, 75% of the pension benefit is payable over the life of a named beneficiary, if living;
-Option 6 - 10 Year Certain
This option is an actuarially reduced pension benefit payable over the member’s life but is guaranteed for a period of 10 years. In the event the member should die within 10 years after the retirement date, the benefit continues to the named beneficiary for the balance of the 10 years.
-Option 7 - Board Discretion
This option is at the Pension Board’s discretion and is a payment of a benefit in a form other than those set forth above. The payment in other form must be the actuarial equivalent of the benefit otherwise payable. A member re-questing this option is responsible for all expenses incurred in the application for and calculation of the benefit.
Benefits of $178.6 million and $187.5 million were paid in 2012 and 2011, respectively, including periodic pension pay-ments of $156.9 million and $148.7 million, respectively, and backdrop lump sum pension payments of $21.7 million and $38.8 million in 2012 and 2011, respectively.
(2) Summary of Significant Accounting Policies
GASB Statement No. 50 The Retirement System follows the provisions of Governmental Accounting Standards Board (“GASB”) 50. GASB 50 re-
quires that information about the funded status of the pension plan as of the most recent actuarial valuation be disclosed in notes to the financial statements. Additionally, GASB 50 requires disclosure of information about actuarial methods and as-sumptions used in valuations on which reported information about the ARC and the funded status and progress are based. The required schedules of funding progress immediately following the notes to the financial statements present multiyear trend information about whether the actuarial value of the plan assets is increasing or decreasing over time relative to the actuarial accrued liability for benefits.
Basis of Accounting – The accompanying financial statements are prepared using the accrual basis of accounting. Employee and employer
contributions are recognized as revenues in the period in which employee services are performed and expenses are recorded when the corresponding liabilities are incurred. Benefits payments to members are recognized in the period in which the pay-ment was due to the member.

11
Investments – Investments, primarily stocks, bonds, certain government loans and mortgage-backed certificates, are stated at quoted fair
value. Temporary cash investments are valued at cost, which approximates fair value. Investments in venture capital partner-ships, real estate, long/short hedge and infrastructure are valued at estimated fair value, as provided by the Retirement System’s investment managers. Investment transactions are recorded on the trade date. Realized gains and losses are computed based on the average cost method. Unrealized gains and losses in the fair value of investments represent the net change in the fair value of the investments held during the period.
A summary of investments at cost is as follows:
Valuation of International Securities – Securities and other assets and liabilities denominated in foreign currencies are translated into U.S. dollar amounts on
the date of valuation. Purchases and sales of securities and income items denominated in foreign currencies are translated into U.S. dollar amounts on the respective dates of such transactions.
Software Development Costs – Capitalized software development costs represent direct costs related to the development and implementation of soft-
ware programs utilized in the Retirement System. The amounts are being amortized over ten years using the straight-line method. Amortization expense is included in Administrative Expenses in the accompanying Statement of Changes in Plan Net Position.
2012 2011
Fixed income ........................................................................ 402,014,596$ 430,833,718$
Domestic common and preferred stocks ....................... 325,997,725 337,378,429
International common and preferred stocks ................ 330,485,161 384,780,428
Long/Short hedge funds ..................................................... 168,928,375 172,331,502
Infrastructure ...................................................................... 106,272,807 117,296,786
Real estate and REIT's ........................................................ 107,788,941 100,538,400
Private equity ...................................................................... 50,130,065 29,220,641
Cash & cash equivalents ................................................... 56,933,710 84,107,638
Total investments at cost ......................................... 1,548,551,381$ 1,656,487,542$
As of December 31,
Expenses – Administrative expenses incurred by the County related to the Retirement System are payable by the Retirement System
to the County. Such expenses totaled $1,187,236 and $1,548,921 in 2012 and 2011, respectively.
Use of Estimates – The preparation of financial statements in conformity with accounting principles generally accepted in the United States of
America requires management to make estimates and assumptions that affect the reported amounts of assets and liabilities and disclosure of contingent assets and liabilities at the date of the financial statements and the reported amounts of revenues and expenses during the reporting period. Actual results could differ from those estimates.
2012 2011
Software development costs
Beginning balance ............................................................. 7,853$ 7,174$
Acquisitions ....................................................................... 358 679
Ending Balance .................................................................. 8,211$ 7,853$
Accumulated amortization
Beginning balance ............................................................. 1,864$ 1,145$
Amortization expense........................................................ 795 719
Ending Balance .................................................................. 2,659$ 1,864$
Software development costs, net ............................ 5,552$ 5,989$
As of December 31,
(in thousands of dollars)

12
Reclassification – Certain 2011 amounts have been reclassified to conform to classifications adopted in 2012.
New Accounting Standards – In June 2011, the Government Accounting Standards Board issued Statement No. 63 - “Financial Reporting of Deferred
Outflows of Resources, Deferred Inflows of Resources, and Net Position.” This statement provides financial reporting guidance for deferred outflows of resources and deferred inflows of resources. Previous financial reporting standards did not included guidance for these elements, which are distinct from assets and liabilities. The Retirement System implemented this standard effective on January 1, 2012.
In June 2012, the GASB approved GASB Statement No. 67 (“GASB 67”), “Financial Reporting for Pension Plans”, which revises existing guidance for the financial reports of most pension plans.
GASB 67 replaces the requirements of GASB Statement No. 25, “Financial Reporting for Defined Benefit Pension Plans and Note Disclosures for Defined Contribution Plans”, and GASB Statement No. 50, “Pension Disclosures”, as they relate to pension plans that are administered through trusts or similar arrangements meeting certain criteria. GASB 67 builds upon the existing framework for financial reports of defined benefit pension plans, which includes a statement of fiduciary net position (the amount held in a trust for paying retirement benefits) and a statement of changes in fiduciary net position. GASB 67 en-hances note disclosures and required supplementary information for both defined benefit and defined contribution pension plans. GASB 67 also requires the presentation of new information about annual money-weighted rates of return in the notes to the financial statements and in 10-year required supplementary information schedules. The provisions in GASB 67 are effec-tive for financial reporting for periods beginning after June 15, 2013. The Board has not yet determined the impact that GASB 67 will have on the financial statements.
(3) Income Taxes –
Management has submitted to the Internal Revenue Service, as part of a Voluntary Compliance Program, any compliance issues that have been discovered through a self-administered review where the provisions contained in the Internal Revenue Code, the County Pension Ordinances or Pension Rules differ from actual practice. Management is waiting for a response from the Internal Revenue Service regarding what action will be required to bring the pension system into compliance in all of its practices in order to maintain its tax-qualified status.
(4) Contributions Required and Contributions Made –
The Retirement System’s funding policy provides for periodic County contributions at actuarially determined rates that, expressed as percentages of annual covered payroll, are sufficient to accumulate sufficient assets to pay benefits when due. Payroll contribution rates are determined using the Aggregate Entry Age Normal method of funding. The Retirement System also uses the level percentage of payroll method to amortize the unfunded liability over a 30 year period. The significant actu-arial assumptions used to compute the contribution requirements are the same as those used to compute the pension benefit obligation.
County contributions totaling $18,410,496 and $28,275,594 were recorded in 2012 and 2011, respectively. The 2012 and 2011 contributions were $2,575,955 and $4,781,364 above the Funding Contribution Amount (“FCA”), respectively. The County contributions do not include contributions made by the members. Member contributions were $9,040,652 for the year ended December 31, 2012 and $3,313,807 for the year ended December 31, 2011. This large increase was caused by changes in Coun-ty Ordinances and State Statutes. By the end of 2012, most County employees were required to make pension contributions for the full year. See the Schedule of Employer and Other Contributions in the Required Supplementary Information.
The 2012 and 2011 contributions reflected in the accompanying statements were actuarially determined as of January 1, 2011 and 2010. These amounts were included in the County’s 2012 and 2011 budgets. The Retirement System’s financial state-ments as of December 31, 2012 and 2011 reflected the unpaid portion of the 2013 and 2012 contributions as a contribution receivable.
Significant actuarial assumptions used include (a) a rate of return on the investment of present and future assets of 8.0%, compounded annually in 2012 and 2011, (b) projected payroll growth increases averaging 3.5% per year compounded annually in 2012 and 2011, attributed to inflation, seniority and merit, and (c) post-retirement benefit increases of 2.0% per year for both 2012 and 2011.
(5) Deposit and Investment Risk Disclosure –
As provided by state legislative act and County Ordinance, the Board has exclusive control and management responsibil-ity of the Retirement System's funds and full power to invest the funds. In exercising its fiduciary responsibility, the Board is governed by the “prudent person” rule in establishing investment policy. The "prudent person" rule, requires the exercise of that degree of judgment, skill and care under the circumstances then prevailing which persons of prudence, discretion and in-telligence exercise in the management of their own affairs, not in regard to speculation, but in regard to permanent disposition of their funds, considering the probable income as well as the probable safety of the principal. The Board has adopted a State-ment of Investment Policy to formally document investment objectives and responsibilities. This policy establishes guidelines for permissible investments of the Retirement System. The Retirement System's investments are subject to various risks. Among them are credit risk, concentration of credit risk, custodial credit risk, interest rate risk, and foreign currency risk. Each of these risks is discussed in more detail below.

13
Concentration of Credit Risk –
Concentration of credit risk is a risk of loss that may be attributed to the magnitude of the Retirement System’s invest-ment in a single issuer, generally investments in any one issuer that represents five (5) percent or more of total investments. Investments issued or explicitly guaranteed by the U.S. Government and investments in mutual funds, external investment pools, and other pooled investments are excluded from this definition. The Retirement System has no investments in one issuer other than U.S. Government securities and mutual funds that exceed five (5) percent of the total investments.
Credit Risk –
Credit risk is the risk that an issuer or other counterparty to an investment will not fulfill its obligations. The credit risk of a debt instrument is measured by nationally recognized statistical rating agencies such as Moody’s Investors Services (“Moody’s”), Standard and Poor’s (“S & P”) and Fitch Ratings (“Fitch’s”). With the exception of the Mellon Capital Management Aggregate Bond portfolio, bonds purchased and owned in each portfolio must have a minimum quality rating of “Baa3” (Moody’s) or “BBB-“(S & P or Fitch’s). The average quality of each portfolio must be “A” or better. The fixed income securities for the Mellon Capital Management Aggregate Bond portfolio should have a minimum quality rating of “A”, with the exception of 15% of the portfolio which may have a minimum quality rating of “BBB”. Of the $17.0 million not rated by Moody’s as of December 31, 2012, $14.1 million is rated by S & P as investment grade (“BBB-“ or higher). Moody’s quality rating of “BAA3” or above is considered invest-ment grade. As of December 31, 2012, $2.6 million was not rated by S & P or Moody’s. Of the $15.8 million not rated by Moody’s as of December 31, 2011, $15.0 million was rated by S & P as investment grade. $0.8 million was also not rated by S & P as of December 31, 2011. The credit quality ratings of investments in fixed income securities by Moody’s as of December 31, 2012, and 2011, are as follows: (amounts are in thousands of dollars)
12/31/2012 12/31/2011
Moody's Quality Ratings Fair Value Fair Value
AAA $143,959 $14,175
AA1 1,161 1,849
AA2 5,049 6,179
AA3 5,571 5,629
A1 9,390 10,520
A2 11,619 10,489
A3 12,335 11,445
BAA1 13,321 11,355
BAA2 13,841 9,446
BAA3 5,172 4,418
BA1 527 526
BA2 1,427 993
BA3 654 388
B1 1,212 796
B2 - 155
B3 504 703
CAA1 128 -
CAA2 311 224
CAA3 193 193
CA 532 511
NR 17,022 15,821
Total Credit Risk Fixed Income Securities $243,928 $105,815
U.S. Government and Agencies 86,928 208,904
Units of Participation (Not Rated) 114,643 158,238
Total Investment in Fixed Income $445,499 $472,957

14
Custodial Credit Risk – Deposits and Investments Custodial credit risk is the risk that, in the event a financial institution or counterparty fails, the Retirement System will not
be able to recover the value of its deposits, investments or securities. Investment securities are exposed to custodial credit risk if the securities are uninsured, are not registered in the Retirement System’s name and are held by the counterparty.
No formal policy exists on custodial risk. However, substantially all assets of the Retirement System are held in its name. The Retirement System did not own any repurchase agreements as of December 31, 2012 or December 31, 2011.
As of December 31, 2012 and 2011, all deposits with banks are fully insured by the Federal Depository Insurance Corpora-tion or the State Deposit Guarantee Fund.
The following table presents the Retirement System’s total cash, deposits and cash equivalents as of December 31, 2012 and 2011: (amounts are in thousands of dollars)
The difference between the carrying value and bank balances are due to outstanding checks and deposits not yet pro-cessed by the bank.
Foreign Currency Risk – Foreign currency risk is the risk that changes in currency exchange rates will adversely affect the fair value of an invest-
ment or deposit.
This footnote is a required disclosure when the Retirement System directly owns investments denominated in a foreign currency. As of December 31, 2012, and 2011, the Retirement System directly owned less than $2,000 and $1,000 in invest-ments denominated in foreign currencies, respectively.
Interest Rate Risk – Interest rate risk is the risk that changes in interest rates will adversely affect the fair market value of an investment.
Duration is a measure of an investment's sensitivity to changes in interest rates. The higher the duration, the greater the changes in fair value when interest rates change. The Option-Adjusted Duration for a security is the percentage price sensitivity to interest rates changes of 100 basis points (or 1.0%), as of December 31, 2012 and 2011. For example, an Option-Adjusted Duration of 5.20 means that the price of the security should fall approximately 5.20% for a 1.0% rise in the level of interest rates. Conversely, the price of a security should rise approximately 5.20% for a 1.0% fall in the level of interest rates. Interest rate changes will affect securities with negative durations in the opposite direction. The Option-Adjusted Duration method of measuring duration takes into effect the embedded options on cash flows.
The Retirement System does not have a formal investment policy that limits investment maturities as a means of manag-ing exposure to losses arising from increasing interest rates with the exception of the cash equivalent portfolio. The invest-ment policy limits the duration of individual securities held in the cash equivalent portfolio to 2.5 years. In addition, the dura-tion of the entire cash equivalent portfolio should be between 1 and 2 years.
As of December 31, 2012 and 2011, the Retirement System had the following Option-Adjusted Durations for the fixed income investments: (amounts are in thousands of dollars)
12/31/12 12/31/11
Carrying Bank Carrying Bank
Value Balance Value Balance
Cash held by various investment managers.. $55,239 $55,237 $81,712 $81,712
Deposits with banks............................................ 1,695 2,433 2,396 3,967 Total Deposits.............................................. $56,934 $57,670 $84,108 $85,679
Schedule of Cash and Cash Equivalent Investments

15
Fixed Income Sector Fair Value* Option Adjusted Duration Fair Value* Option Adjusted Duration
ABS-Car Loan 4,903$ 1.28 2,709$ 0.41
ABS-Equipment 553 0.46 1,039 1.28
ABS-Home Equity 2,016 0.12 1,944 0.33
Aerospace & Defense 187 5.18 247 4.41
Agency for Int'l. Devel. Backed Debt 955 4.62 921 5.58
Automobiles & Components 222 6.22 187 4.49
Banking & Finance 24,691 4.14 21,365 4.35
BSDT Reserve Deposit Accts. 1,490 0.08 802 0.08
Canadian Government Bonds 597 3.21 105 2.94
Capital Goods 77 7.46 257 3.06
Chemicals 1,524 7.82 1,592 5.56
CMO - Conduit 12,565 2.62 10,253 2.81
CMO-U.S. Agencies 10,041 3.66 7,659 2.25
Collateralized Mortgage Oblig. - 0.00 1,508 1.53
Commercial Services & Supp. - 0.00 109 5.03
Commingled Fds Cash Equiv. 49,233 0.08 75,721 0.08
FHLMC Multiclass 35,637 1.89 38,708 1.26
FHLMC Pools 9,448 2.20 10,149 1.97
FNMA Pools 27,038 3.08 27,938 2.66
FNMA REMIC 39,587 2.28 39,293 1.92
Food Beverage & Tobacco 1,114 5.86 742 6.67
Food Products 1,474 5.97 1,568 5.78
GNMA Multi Family Pools 1,888 2.03 2,684 1.65
GNMA Single Family Pools 856 1.30 1,166 1.25
Health Care 683 11.21 337 8.09
Household Products 109 4.00 13 5.54
Industrial 533 5.74 438 5.28
Insurance 1,760 5.28 1,319 4.32
MBS PO - Principal Only (US Agencies) 259 18.42 - 0.00
Materials 39 3.36 72 4.21
Mining 896 4.88 302 6.39
News/Media 2,912 6.83 2,252 7.27
Non-US Corporate Bonds - 0.00 3,665 4.96
Non-US Corporate P.P. - 0.00 1,513 3.26
Non-US Government Bonds 172 17.84 95 13.41
Oil & Gas 4,458 6.90 2,277 6.98
Other Corporate Bonds 363 3.71 108 6.95
Other Government Obligations - 0.00 658 7.96
Private Placements - ABS 1,383 0.47 301 0.20
Private Placements - MBS 2,914 2.88 864 0.05
Pvt Placements-More than 1 yr 10,977 4.61 7,802 4.05
Retail 1,127 10.48 1,103 10.03
Supranational Issues 196 2.84 189 3.66
Taxable Municipals 942 17.06 710 14.50
Technology 2,632 5.87 2,670 6.15
Transportation 2,071 7.35 1,782 7.82
Treasury Bills - Less Than 1 Yr 2,694 0.41 5,178 0.49
U.S. Agencies 9,818 6.27 4,911 5.20
U.S. Governments 48,921 5.92 75,428 6.58
U.S. Governments Interest Only 27,929 6.91 - 0.00
Utility-Electric 5,614 6.77 5,157 6.09
Utility-Gas 801 6.89 638 6.80
Utility-Other 257 4.22 250 4.90
Utility-Telephone 4,249 7.64 3,249 7.97
Whole Loan - CMO 16,544 0.70 20,975 0.47
Whole Loan - Re-securitization 863 0.04 462 0.02
Yankee Bonds 1,776 6.69 1,367 6.21
Other* 118,929 159,907
Total 498,917$ 554,658$
12/31/1112/31/12
* For 2012, this represents $114,643 units of participation, $1,763 in FNMA Pools, $1,602 in FHLMC Multiclass, $728 in Private
Placements, and $193 in Whole Loans. For 2011, this represents $158,238 in units of participation, $56 in ABS - Home Equity, $712 in
FHLMC Multiclass, $592 in Utility - Telephone, and $309 in Whole Loan CMO.

16
Securities Lending – Section 201.24 (9.1) of the General Ordinances of Milwaukee County and Board policies permit ERS to lend its securities
to broker-dealers and other entities with a simultaneous agreement to return the collateral for the same securities in the fu-ture. ERS participates in such a securities lending program through its custodian, the Bank of New York Mellon, acting as ERS’s securities lending agent. ERS requires collateral from the borrower in the form of cash or securities. Collateral for domestic issues is set at 102% of the fair value of the securities loaned at the time of the initial transaction. If the value falls to 100% of the fair value of the securities loaned, additional collateral is obtained to reestablish collateral at 102% of the fair value of se-curities loaned. Collateral for international securities is maintained at a level of 105% of the fair value of securities loaned at all times. The securities lending program guidelines attempt to preserve capital while earning a moderate rate of return. Earnings from securities lending, after all fees are paid, are split on a percentage basis with the custodian. For 2012 and 2011, the net investment income realized from security lending was $121,217 and $154,234 respectively.
ERS also invested in several commingled funds managed by Mellon Capital Management that participated in securities lending programs. The earnings and losses attributable to the commingled funds’ securities lending programs are combined with the commingled funds’ performance and are not reported separately in ERS’s financial statements.
Securities loaned and the collateral held were as follows: (amounts are in thousands of dollars)
The collateral received from securities lending transactions are recorded as assets at quoted fair value of the financial statement date. The Retirement System records an identical amount as a liability, representing the obligation of the Retire-ment System to return the collateral at the time the borrower of the Retirement System’s securities return those securities.
The collateral received from securities lending transactions includes cash of $20,021 and $58,499, and U.S. Treasury secu-rities, Domestic stocks, and REIT’s of $35,590 and $7,993 for the years ended December 31, 2012 and 2011, respectively. Under the terms of the securities lending agreement, the Retirement System has the right to sell or pledge the cash collateral. The non-cash collateral in the amounts of $35,590 and $7,993 for the years ended December 31, 2012 and 2011, respectively, is controlled by the custodian and, correspondingly, not reflected in the Statement of Plan Net Position.
At year-end, the Retirement System has no credit risk exposure to borrowers because the amounts the Retirement Sys-tem owes the borrowers exceed the amounts the borrowers owe the Retirement System. The contract with the Retirement System's custodian requires it to indemnify the Retirement System if a borrower fails to return the securities (and if the collat-eral is inadequate to replace the securities lent) or fails to pay the Retirement System for income distributions by the securities’ issuers while the securities are on loan.
(6) Financial Instruments with Off-Balance Sheet Risks –
A currency forward is a contractual agreement between two parties to pay or receive amounts of foreign currency at a future date in exchange for another currency at an agreed-upon exchange rate. Forward commitments are entered into with the foreign exchange department of a bank located in a major money market. These transactions are entered into in order to hedge risks from exposure to foreign currency rate fluctuations. Recognition of realized gain or loss depends on whether the
As of December 31
Securities Securities
Securities Lent for Cash Collateral Lent Collateral Lent Collateral
Fixed income 8,582$ 8,783$ 10,538$ 10,740$
Domestic stocks 11,127 11,238 46,233 47,759
Subtotal 19,709 20,021 56,771 58,499
Securities Lent for Securities Collateral
Fixed income 32,233 32,938 7,828 7,993
Domestic stocks 2,646 2,652 - -
Subtotal 34,879 35,590 7,828 7,993
Grand Total 54,588$ 55,611$ 64,599$ 66,492$
Percent Collateral to Securities Loaned 101.87% 102.93%
2012 2011

17
currency exchange rate has moved favorably or unfavorably to the contract holder upon termination of the contract. Prior to termination of the contract, the Retirement System records the amount receivable or payable at fair value, with the unrealized gain or loss reported as a component of net appreciation in fair value. All contracts are short-term in duration and mature within 90 days.
The Retirement System did not hold any financial instruments with off-balance sheet risk as of December 31, 2012 and De-cember 31, 2011.
ERS invests in financial futures contracts in order to improve the performance of the fund. The Retirement System purchas-es contracts that approximate the amount of cash held by US equity investment managers and cash used to pay benefits and ex-penses. Financial futures contracts are agreements to buy or sell a specified amount at a specified delivery or maturity date for an agreed upon price.
The market values of the futures contracts vary from the original contract price. A gain or loss is recognized and paid to or received from the clearinghouse. Financial futures represent an off balance sheet obligation, as there are no balance sheet assets or liabilities associated with those contracts. The cash or securities to meet these obligations are held in the investment portfolio. All contracts are short-term in duration and mature within 90 days.
ERS is subject to credit risk in the event of non-performance by counter parties to financial futures and forward contracts. ERS generally only enters into transactions with credit-worthy institutions. The Retirement System is exposed to market risk, the risk that future changes in market conditions may make an instrument less valuable. Exposure to market risk is managed in ac-cordance with risk limits set by ERS management and by buying or selling futures or forward contracts. The cash or securities to meet these obligations are held in the investment portfolio.
The futures contracts held by the Retirement System are as follows: (amounts are in thousands of dollars)
(7) Commitments and Contingencies –
The Retirement System is involved in litigation and certain other disputes arising during the normal course of operations. Management does not believe the settlement of such matters will have a material impact on the Retirement System’s financial statements.
(8) OBRA 1990 Retirement System of the County of Milwaukee –
The County established the OBRA 1990 Retirement System of the County of Milwaukee (“OBRA”) to cover seasonal and certain temporary employees who are not enrolled in the Retirement System. Assets of the OBRA system are commingled for investment purposes with the assets of the Retirement System. The assets of the Retirement System are legally available to pay benefits of either the ERS or OBRA and all assets have been commingled. The Retirement System and OBRA are considered a sin-gle plan for financial reporting purposes.
2012 2011 2012 2011
Cash Used to Pay Benefits
US Equity Managers and Expenses
Cash Held Cash Held 17,750$ 65,486$
US Equity Investment Managers 14,131$ 13,545$
Futures Purchased
Barclays AGG (Fixed Income) 7,813 26,437
Futures Purchased S&P 500 (US Equity) 6,745 25,115
S&P 500(US Equity) 14,343 13,278 MSCI EAFE (International Equity) 3,160 11,909
Futures Above\(Below) Cash 212 (267) TotalFutures Purchased 17,718 63,461
Futures Above\(Below) Cash (32) (2,025)
Market Value 68$ 226$ Market Value 14 778
Total Market Value 82$ 1,004$
As of December 31 As of December 31

18
Changes in plan net position available for benefits for OBRA for the years ended December 31, 2012 and 2011, were as follows:
Net assets identified for OBRA benefits as of December 31, 2012 and 2011, were as follows:
As of December 31, 2012 and 2011, respectively, there were 3,280 and 3,502 participants with vested benefits in OBRA. The actuarial accrued liability of OBRA at December 31, 2012 and 2011, was $2,868,585 and $2,444,436, respectively, leaving net assets available less than the actuarial accrued liability of ($1,206,978) and ($1,208,911), respectively. These amounts are not reflected in the required supplementary information tables that follow the notes to the financial statements.
(9) Funded Status and Actuarial Information
The Retirement System engages an independent actuarial firm to perform an annual actuarial valuation. The funded status of the Retirement System as of January 1, 2013, the most recent actuarial valuation date, is as follows: (dollar amounts in thousands)
The schedule of funding progress, presented as required supplementary information (RSI) immediately following the notes to the financial statements, presents multiyear trend information about whether the actuarial values of the plan assets are increasing or decreasing over time relative to the AALs for benefits.
Statement of Plan Net Position
Assets 2012 2011
Cash ................................................................................................ 682$ 60,700$
Assets held by Retirement System............................................. 1,631,303 1,482,752
Other Assets .................................................................................. 29,621 28,648
Total assets .............................................................................. 1,661,606 1,572,100
Liabilities
Taxes Payable ............................................................................... - 40,521
Total liabilities ......................................................................... - 40,521
Net position held in trust for pension benefits................ 1,661,606$ 1,531,579$
(Unaudited)
Statement of Change in Plan Net Position
2012 2011
Contributions from the County ................................................. 880,000$ 2,022,000$
Investment income (loss) ........................................................... 150,023 (56,201)
Investment and administrative expenses ............................... (504,825) (691,775)
Benefits paid ................................................................................. (395,170) (1,144,670)
Net increase in net position available for benefits................ 130,028$ 129,354$
(Unaudited)
Actuarial
Accrued UAAL as a
Actuarial Liability Unfunded Percentage
Value of (AAL) - AAL Funded Covered of Covered
Assets Entry Age (UAAL) Ratio Payroll Payroll
(a) (b) (b - a) (a/b) ( c ) ((b - a)/c)
$1,768,435 $2,025,319 $256,884 87.3% $189,132 135.8%

19
Actuarial valuations involve estimates of the value of reported amounts and assumptions about the probability of events far into the future. Actuarially determined amounts are subject to continual revision as actual results are compared to past expectations and new estimates about the future. The projection of benefits for financial reporting purposes does not explicitly incorporate the potential effects of legal or contractual funding limitations. These calculations reflect long-term perspectives and use techniques that are designed to reduce short-term volatility.
(10) Subsequent Events
The Retirement System has evaluated subsequent events occurring through July 26, 2013, the date the financial state-ments were available to be issued for events requiring recording or disclosure in the Retirement System’s financial state-ments. Management feels that no material events occurred that would require disclosure.
Following is a listing of the actuarial method and significant assumptions used to determine the Annual Required Contribution (ARC) for the current year:
Valuation date 1/1/2013 Actuarial cost method Aggregate Entry Age Normal Asset valuation method 10-year smoothed market Amortization methods:
Contribution variance Level dollar, closed Administrative expenses Level dollar, closed All other unfunded liability Level percent of payroll, closed
Remaining amortization periods: Contribution variance 5 years Administrative expenses 10 years All other unfunded liability 30 years
Actuarial Assumptions: Investment rate of return 8.00% Projected salary increases 3.50% Post-retirement benefit increases 2%, simple

20
Analysis of the dollar amounts of plan net position, actuarial accrued liability, and unfunded (overfunded) actuarial ac-crued liability in isolation can be misleading. Expressing plan net position as a percentage of the actuarial accrued liability pro-vides one indication of the Retirement System’s funding status on a going-concern basis. Analysis of this percentage over time indicates whether the Retirement System is becoming financially stronger or weaker. Generally, the greater this percentage, the stronger the Retirement System. Trends in the unfunded actuarial accrued liability and annual covered payroll are both af-fected by inflation. Expressing the unfunded actuarial accrued liability as a percentage of annual covered payroll approximately adjusts for the effects of inflation and aids the analysis of the Retirement System’s progress in accumulating sufficient assets to pay benefits when due. Generally speaking, the smaller this percentage, (or the larger the percentage if negative), the stronger the Retirement System.
(See independent auditors’ report)
Actuarial UAAL as a
Actuarial accrued (Overfunded) percentage
Actuarial value of liabililty- Funded Unfunded Covered of covered
valuation assets AAL Ratio AAL - (UAAL) Payroll payroll
date (a) (b) (a/b) (b-a) ( c ) ((b-a)/c)
12/31/2012 1,768,435$ 2,025,319$ 87.3% 256,884$ 189,132$ 135.8%
12/31/2011 1,836,543 2,059,554 89.2% 223,011 190,748 116.9%
12/31/2010 1,929,428 2,091,927 92.2% 162,499 221,647 73.3%
12/31/2009 1,956,444 2,097,332 93.3% 140,888 237,040 59.4%
12/31/2008 * 1,968,518 2,057,377 95.7% 88,859 233,820 38.0%
12/31/2007 1,627,288 2,024,923 80.4% 397,635 227,364 174.9%
*Includes the anticipated impact from the $397.8 mill ion in pension obligation bonds that was actually received by
the plan during plan year 2009.
Required Supplementary Information
Schedule of Funding Progress
(in thousands of dollars)
Fiscal Employees County Annual Required Percentage
Year Contribution Contribution Contribution (ARC) Contributed
2012 $9,040,652 $18,410,496 $28,406,232 96.6%
2011 3,313,807 28,275,594 29,621,216 106.3%
2010 75,584 32,893,562 29,529,322 106.0%
2009 131,766 457,789,154 30,355,535 1,508.1%*
2008 140,209 34,840,886 53,063,610 65.7%
2007 344,782 49,291,072 52,395,263 94.1%
*Actual contribution includes $397.8 million in pension obligation bonds and $29.0 million from a lawsuit settlement.
Schedule of Employer and Other Contributions for the Year Ended December 31,

21
Notes to Required Supplementary Information
(1) Description –
The historical trend information is presented as required supplementary information. This information is intended to help users assess the Retirement System’s funding status on a going-concern basis, assess progress made in accumulating assets to pay benefits when due, and make comparisons with other public employee retirement systems.
(2) Actuarial Assumptions and Methods –
The information presented in the required supplementary schedules was determined as part of the actuarial valuations as
of January 1, 2013, for the plan year ending December 31, 2012. The actuarial valuations consider the changes effective January
1, 2013. Additional information as of the latest actuarial valuation follows:
Valuation date 1/1/2013 Actuarial Cost Method Aggregate Entry Age Normal Amortization Method Level percent of payroll, closed Asset Valuation Method 10 year smoothing of difference between total expected return
versus actual return Actuarial Assumptions:
Post retirement benefit increase (COLA) 2% of original pension benefits Investment rate of return* 8.0% Projected payroll growth* 3.5% Mortality Sex-distinct UP—1994 Mortality Table with projection scale AA
to 2012 then fully generational thereafter using Scale AA (70% of the rates application to healthy pensioners)
RP 2000 Disabled Mortality Table (for disabled pensioners) *includes inflation at 3.0%
(3) Significant Factors Affecting Trends in Actuarial Information –
The changes regarding the increases in the Annual Compensation limit and the Annual benefit limit for years 2009-2013
are subject to the passage of the Ordinance Amendments by the County Board.
2013 Changes in Plan Provisions or Actuarial Assumptions since Prior Year –
Effective with backdrop dates on or after April 1, 2013, the monthly drop benefit shall be based on the salary, service, and multipliers as of April 1, 2013, except for Elected Officials, Building and Trades, Machinists, Federated Nurses, and Firefighters.
The asset method used by the actuary was changed from a five-year moving market average to a ten-year moving mar-ket, with the actuarial value set to market as of 1/1/13.
The disability assumption used for represented employees was changed to 50% Ordinary and 50% Accidental. The disa-bility assumption for non-represented employees was changed to 100% Ordinary and 0% Accidental.
The individual salary increase for general employees was changed to an average of 3.3% per annum, for elected offi-cials the individual salary increase was changed to 3.0% per annum and for deputy sheriffs the individual salary in-crease was changed to 4.3% per annum.
2012 Changes in Plan Provisions or Actuarial Assumptions since Prior Year –
During 2012, the retirement age for Building and Trades and Nurses members for new hires was increased from 60 to 64.
During 2012, the multiplier was reduced from 2.0% to 1.6% for Building and Trades, and Nurses.
During 2011, the retirement age for DC 48 members for new hires was increased from 60 to 64.
During 2011, the multiplier was reduced from 2.0% to 1.6% for DC 48 members.
(See independent auditors’ report)

22
Increased annual compensation limit to $250,000.
Increased annual benefit limit to $200,000.
2011 Changes in Plan Provisions or Actuarial Assumptions since Prior Year -
During 2010, the multiplier was reduced from 2.0% to 1.6% for Elected Officials, Attorneys, Machinists, and TEAMCO
members.
During 2010, the retirement age for attorneys, Machinists and TEAMCO members for new hires was increased from 60
to 64.
2010 Changes in Plan Provisions or Actuarial Assumptions since Prior Year -
Multiplier was reduced from 2.0% to 1.6% for non-represented employees, except Elected Officials and Deputy Sheriffs.
Retirement age for non-represented new hires was increased from 60 to 64.
2009 Changes in Plan Provisions or Actuarial Assumptions since Prior Year -
Increased annual compensation limit to $245,000.
Increased annual benefit limit to $195,000.
(See independent auditors’ report)

23
Fiscal Participant County Investment
Year Contributions(1a) Contributions (1b) Income (Loss)(2) Total
2012 $9,040,652 $18,410,496 $186,091,377 $213,542,525
2011 3,313,807 28,275,594 11,186,780 42,776,181
2010 75,584 32,893,562 210,905,464 243,874,610
2009 131,766 457,789,154 319,997,171 777,918,091
2008 140,209 34,840,886 (352,108,625) (317,127,530)
2007 344,782 49,291,072 106,442,068 156,077,922
2006 545,258 27,435,154 207,804,929 235,785,341
2005 360,283 35,415,185 128,528,748 164,304,216
2004 711,322 35,143,178 188,633,703 224,488,203
2003 704,758 33,980,592 292,669,096 327,354,446
Investment and
Fiscal Administrative
Year Benefits(3) Expenses (4) Withdrawals Total
2012 $178,557,030 $8,445,509 $212,245 $187,214,784
2011 187,460,030 8,305,984 70,123 195,836,137
2010 162,664,454 8,445,062 138,136 171,247,652
2009 145,306,937 7,846,655 38,583 153,192,175
2008 144,160,665 7,385,443 23,557 151,569,665
2007 139,990,962 7,715,976 56,626 147,763,564
2006 130,730,539 6,622,923 13,571 137,367,033
2005 148,307,335 6,294,816 36,963 154,639,114
2004 161,368,700 6,302,951 154,522 167,826,173
2003 111,109,514 5,662,380 12,999 116,784,893
FOOTNOTES ARE IN THOUSANDS OF DOLLARS
(1a) Participant contributions are ca lculated by the actuary and are a percentage of the
employees ' pens ionable compensation.
(1b) County contributions are set during the County's budget process and are made at the
discretion of the County Board.
(2) Includes interest and dividends , net appreciation (depreciation) of fa i r va lue, net securi ty
lending income and other income.
(3) Included in the benefi ts for 2012, 2011, 2010, 2009, 2008, 2007, 2006, 2005, 2004, and 2003 are
back drop lump-sum payments of $ 21.7, $38.8, $20.3, $8.7, $11.2, $10.5, $5.5, $25.7, $55.1, and
$11.0 mi l l ion, respectively.
(4) The increase in investment and adminis trative expenses of $2,783 during the past ten years
was due to increases in the fol lowing expenses :
- outs ide consultants of $609, with most of this increase occurring in 2008 and 2009;
- outs ide lega l fees of $487, due to buyback/buyin i ssues , RFP preparation, tax
issues , and various other lega l matters ;
- sa laries and wages of $550 due primari ly to the increase in benefi ts and
increase in s taff;
- temporary help of $60 due to unfi l led pos i tions and temporary projects ;
- computer system expenses of $1,186. The plan s tarted us ing i ts new computer
system as of 1/1/09. Amortization of $795 and hosting expenses of $295 caused
most of this increase
REVENUES BY SOURCE AND EXPENSES BY TYPE
TEN-YEAR HISTORICAL TREND INFORMATION
(UNAUDITED)
Revenues by Source
Expenses by Type
(See independent auditors’ report)
24
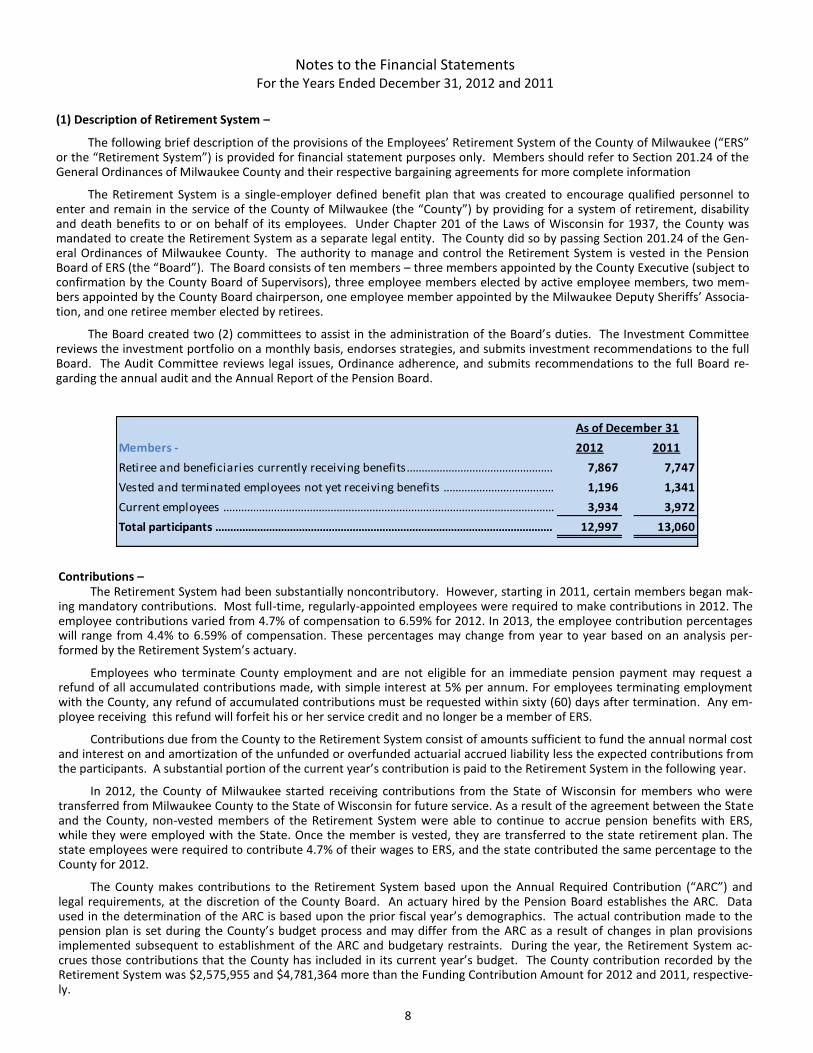
1493.5
1550.1
1559.8
1658.2
1666.5
1197.8
1822.5
1895.2
1742.1
1768.4
0 500 1000 1500 2000
2003
2004
2005
2006
2007
2008
2009
2010
2011
2012
Plan Net Position at Fair Value 2012-2003 (in millions of dollars)
(unaudited)
34.7
35.8
35.8
27.9
49.6
34.9
457.9
33.0
31.4
27.4
1.0 10.0 100.0 1000.0
2003
2004
2005
2006
2007
2008
2009
2010
2011
2012
Actual County and Participant Contributions 2012-2003
(in millions of dollars) (unaudited)
(See independent auditors’ report)

25
Survivors
&
Maximum
Pension Refund 100% 75% 50% 25% 10-yr. Other
Benefic-
iaries Total
3,125 398 1,345 228 1,089 418 180 50 914 7,747
Changes During the Year:
38 - - - - 7 3 - - 48
207 - 66 13 27 18 14 - 19 364
(159) - (28) - (39) - - (1) (65) (292)
3,211 398 1,383 241 1,077 443 197 49 868 7,867
*Adjustments as a result of reclassifications made to beginning balances by the actuary
Pensioner deaths...........
December 31, 2012....................
Option
Retirements Granted
RETIREMENTS AND SURVIVORS STATISTICS (unaudited)
January 1, 2012..........................
Adjustments (actuary)*..
Retirements...................
2012 2011
5,313* 5,941
355 473
0 0
(287) (512)
(254) (557)
(6) (14)
0 0
9 (18)
5,130* 5,313
* The total includes vested inactive members of 1,341 and 1,196 as of
beginning of the year and end of the year, respectively.
Rehires......................................................................
Nonvested terminations........................................
ACTIVE MEMBERSHIP STATISTICS
(unaudited)
Members as of January 1..................................................
Changes During the Year:
New enrollments.....................................................
Retirements..............................................................
Deaths in active service........................................
New deferred beneficiaries..................................
Data adjustments...................................................
Members as of December 31............................................
(See independent auditors’ report)

26
CONSULTANTS
as of December 31, 2012
Legal Advisors U.S. Equity Investment Managers
Milwaukee County AQR Capital Management, LLC
Corporation Counsel Greenwich, Connecticut
Kimberly Walker
Artisan Partners
Reinhart, Boerner, Van Deuren S.C. Milwaukee, Wisconsin
Steven D. Huff, Secretary of the Pension Board
Milwaukee, Wisconsin Fiduciary Management Associates, LLC
Chicago, Illinois
Actuary
Buck Consultants Robeco Investment Management
Chicago, Illinois (formerly Boston Partners Asset Management)
Boston, Massachusetts
Disbursing Agent
County Treasurer Mellon Capital Management
Pittsburgh, Pennsylvania
Custodian/Securities Agent
BNY Mellon Asset Servicing Fixed-Income Investment Managers
Pittsburgh, Pennsylvania JP Morgan Investment Management
Columbus, Ohio
Medical Board
Columbia St. Mary's Mellon Capital Management
Milwaukee, Wisconsin Pittsburgh, Pennsylvania
Investment Consultant International Investment Managers
Marquette Associates, Inc. Barings Asset Management, Inc.
Chicago, Illinois Boston, Massachusetts
Cash Equitization Manager Grantham, Mayo, Van Otterloo & Co.
BNY Mellon BETA Management Boston, Massachusetts
San Francisco, California
Northern Trust Investments
Private Equity Managers Chicago, Illinois
Adams Street Partners
Chicago, Illinois Real Estate Investment Managers
American Realty Advisors
Progress Investment Management Company Glendale, California
San Francisco, California
Morgan Stanley Real Estate
Siguler Guff & Company, LLC New York, New York
New York, New York
UBS Realty Investors, LLC
Long/Short Managers Hartford, Connecticut
ABS Investment Management
Greenwich, Connecticut Infrastructure Managers
IFM Investment Advisor
K2 Advisors New York, New York
Stamford, Connecticut
JP Morgan Investment Management
New York, New York

27
THIS PAGE IS INTENTIONALLY BLANK