EMPLOYEE FACTORS AND PERCEIVED SERVICE QUALITY...
56
EMPLOYEE FACTORS AND PERCEIVED SERVICE QUALITY IN THE HOTEL INDUSTRY IN NAIROBI, KENYA BY NJOROGE WINFRED WANJIKU A research project report submitted in partial fulfillment of the requirements for the award of degree of Master of Business Administration of the University of Nairobi. 2013
Transcript of EMPLOYEE FACTORS AND PERCEIVED SERVICE QUALITY...
EMPLOYEE FACTORS AND PERCEIVED SERVICE QUALITY
IN THE HOTEL INDUSTRY IN NAIROBI, KENYA
BY
NJOROGE WINFRED WANJIKU
A research project report submitted in partial fulfillment of the
requirements for the award of degree of Master of Business
Administration of the University of Nairobi.
2013
ii
DECLARATION
I hereby declare that this research project is my own work and effort, and that it has not
been submitted anywhere for any award.
Signature: _______________________ Date: ______________
NAME: NJOROGE WINFRED WANJIKU
Registration No: D61/76122/2012
This research project has been submitted for examination with my approval as the
University Supervisor.
SUPERVISOR:
Signature: _______________________ Date: ______________
NAME: DR. OKWIRI, OWINO A.
Department of Management Science
School of Business
iii
DEDICATION
This project is dedicated to all the people committed to providing quality services in the
services sector in Kenya.
iv
ACKNOWLEDGEMENTS
In a vast undertaking of this nature, it is not possible to acknowledge the contribution of
all. However, the temptation to acknowledge the role of the following is irresistible.
First, is to the Almighty God for seeing me through the completion of this project.
Special tribute goes to Dr. Okwiri, Owino A of Department of Management Science,
University of Nairobi, for his tireless efforts in guiding, supervising and correcting this
work throughout the entire project.
I wish to convey sincere gratitude to all key informants and other respondents who gave
me permission and spared time to participate in the study
Special thanks to my fellow students, relatives and friends who assisted me in one way or
the other to make this work a success.
I am deeply grateful to my dear husband Michael Kangara Gakumo for your support,
prayers, flexibility, understanding and inspiration to me while working on this project.
To my little boy Austin for the play time you sacrificed to allow mum some time to
study.
May God bless you all.
v
TABLE OF CONTENTS
DECLARATION............................................................................................................... ii
DEDICATION.................................................................................................................. iii
ACKNOWLEDGEMENTS ............................................................................................ iv
TABLE OF CONTENTS ................................................................................................. v
LIST OF TABLES .......................................................................................................... vii
ABSTRACT .................................................................................................................... viii
CHAPTER ONE: INTRODUCTION ............................................................................. 1
1.1 Background of the Study ........................................................................................... 1
1.1.1 Perceived Service Quality ............................................................................................... 1
1.1.2 Employees Factors in Service Quality ............................................................................ 3
1.1.3 The Hotel Sector in Kenya .............................................................................................. 4
1.2 Statement of the Problem .......................................................................................... 5
1.3 Research Objectives .................................................................................................. 7
1.4 Value of the Study ..................................................................................................... 7
CHAPTER TWO: LITERATURE REVIEW ................................................................ 9
2.1 Introduction ............................................................................................................... 9
2.2 Employee Factors in Service Quality. ....................................................................... 9
2.3 Employee Factors and Perceived Service Quality .................................................. 11
2.4 Summary and Conceptual Framework. ................................................................... 13
CHAPTER THREE: RESEARCH METHODOLOGY ............................................. 14
3.1 Introduction ............................................................................................................. 14
3.2 Research Design ...................................................................................................... 14
3.3 Target Population .................................................................................................... 15
3.4 Sample Design and Sample Size ............................................................................. 15
3.5 Data Collection ........................................................................................................ 15
3.6 Data Analysis .......................................................................................................... 16
CHAPTER FOUR: RESULTS, DATA ANALYSIS AND DISCUSSION ................ 18
4.1 Introduction ............................................................................................................. 18
4.2 Results ..................................................................................................................... 18
4.3 Analysis and Findings ............................................................................................. 30
vi
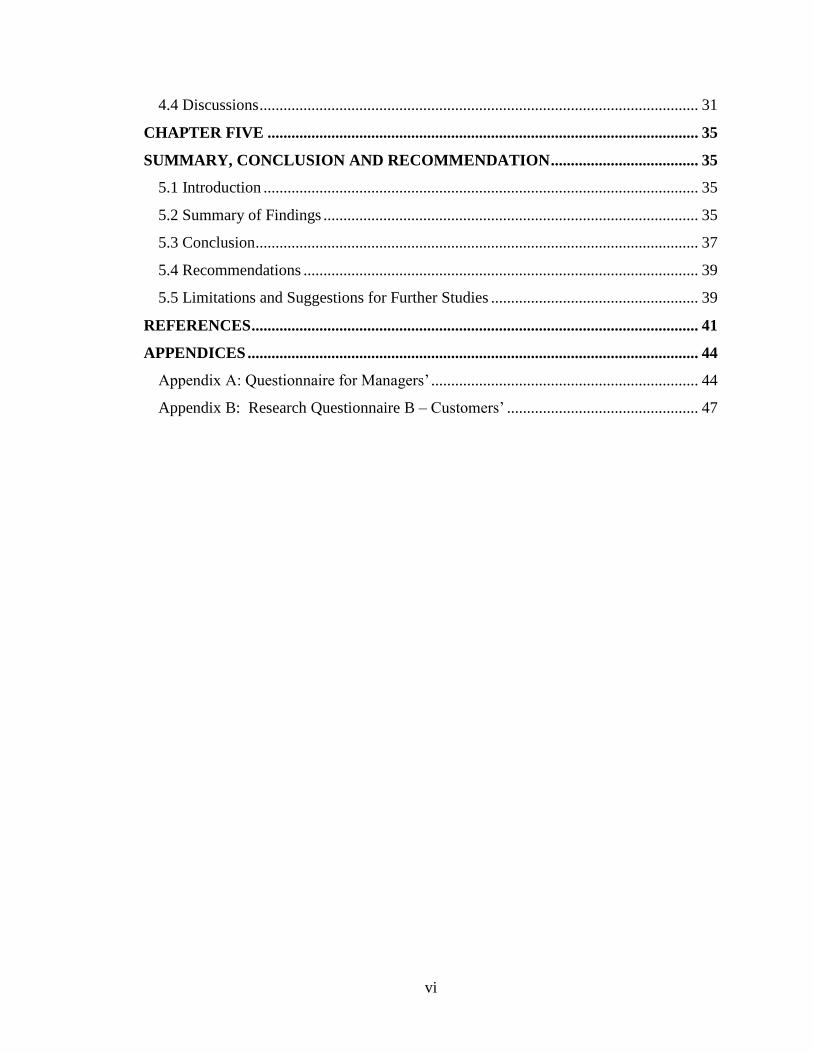
4.4 Discussions .............................................................................................................. 31
CHAPTER FIVE ............................................................................................................ 35
SUMMARY, CONCLUSION AND RECOMMENDATION ..................................... 35
5.1 Introduction ............................................................................................................. 35
5.2 Summary of Findings .............................................................................................. 35
5.3 Conclusion ............................................................................................................... 37
5.4 Recommendations ................................................................................................... 39
5.5 Limitations and Suggestions for Further Studies .................................................... 39
REFERENCES ................................................................................................................ 41
APPENDICES ................................................................................................................. 44
Appendix A: Questionnaire for Managers‘ ................................................................... 44
Appendix B: Research Questionnaire B – Customers‘ ................................................ 47
vii
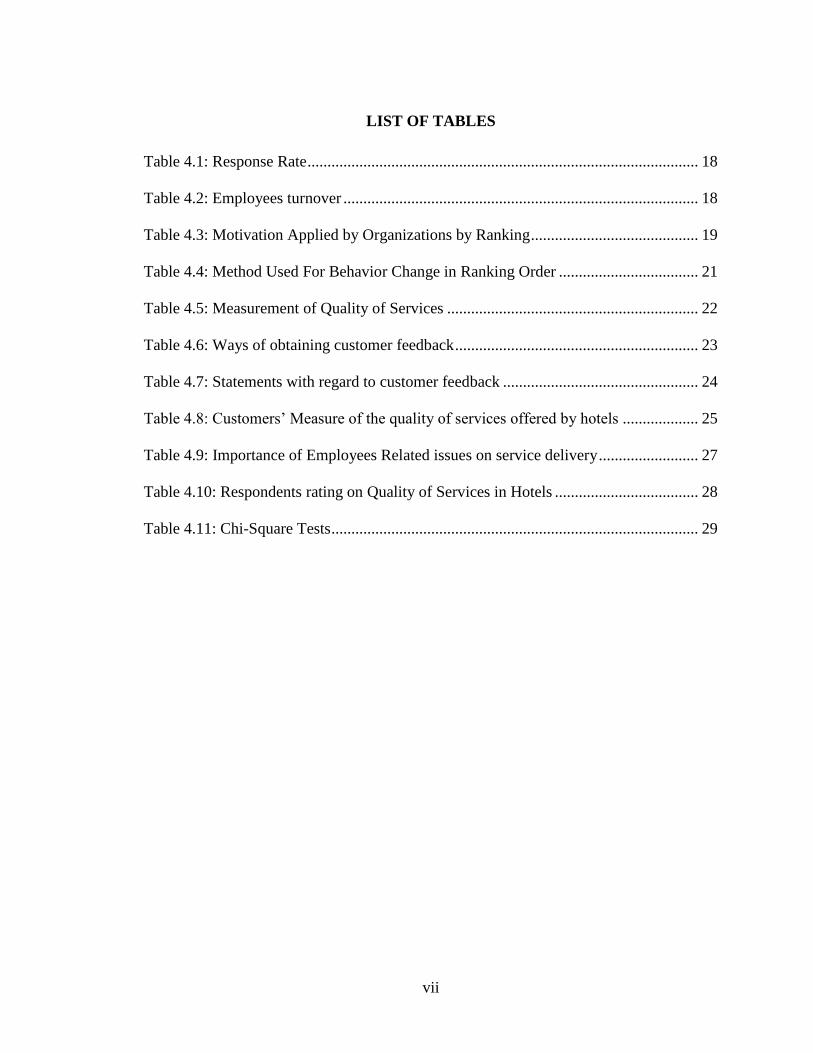
LIST OF TABLES
Table 4.1: Response Rate .................................................................................................. 18
Table 4.2: Employees turnover ......................................................................................... 18
Table 4.3: Motivation Applied by Organizations by Ranking .......................................... 19
Table 4.4: Method Used For Behavior Change in Ranking Order ................................... 21
Table 4.5: Measurement of Quality of Services ............................................................... 22
Table 4.6: Ways of obtaining customer feedback ............................................................. 23
Table 4.7: Statements with regard to customer feedback ................................................. 24
Table 4.8: Customers‘ Measure of the quality of services offered by hotels ................... 25
Table 4.9: Importance of Employees Related issues on service delivery ......................... 27
Table 4.10: Respondents rating on Quality of Services in Hotels .................................... 28
Table 4.11: Chi-Square Tests ............................................................................................ 29
viii
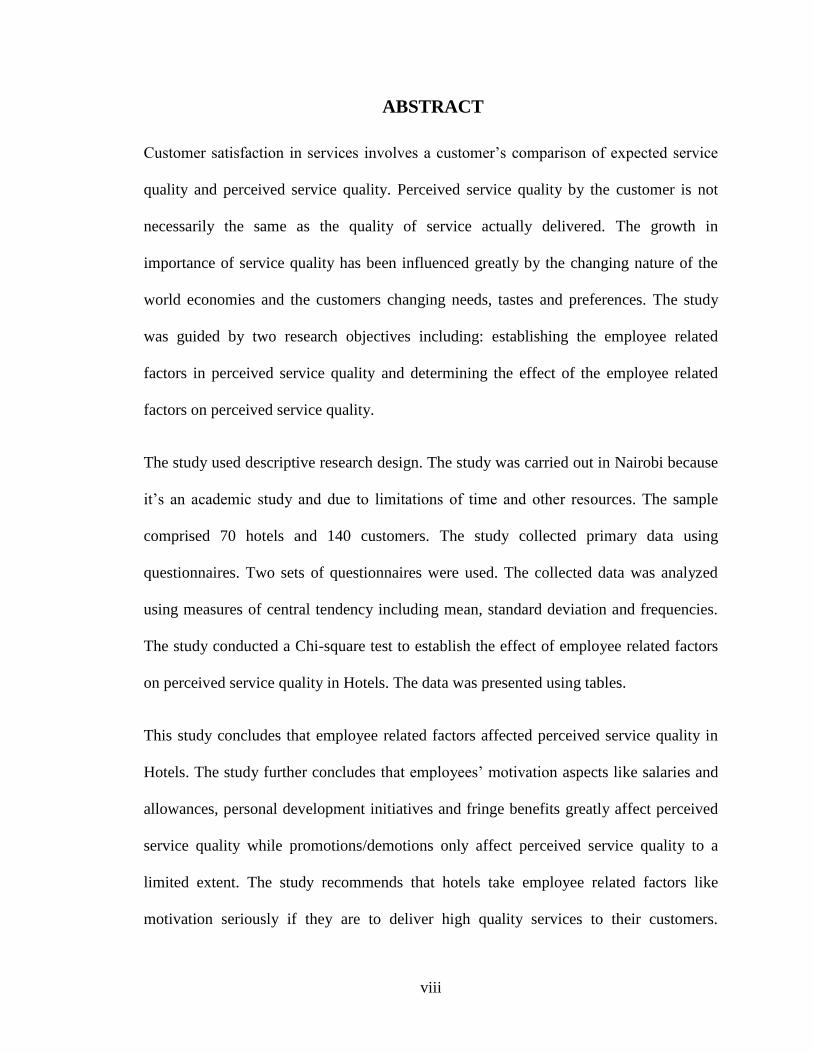
ABSTRACT
Customer satisfaction in services involves a customer‘s comparison of expected service
quality and perceived service quality. Perceived service quality by the customer is not
necessarily the same as the quality of service actually delivered. The growth in
importance of service quality has been influenced greatly by the changing nature of the
world economies and the customers changing needs, tastes and preferences. The study
was guided by two research objectives including: establishing the employee related
factors in perceived service quality and determining the effect of the employee related
factors on perceived service quality.
The study used descriptive research design. The study was carried out in Nairobi because
it‘s an academic study and due to limitations of time and other resources. The sample
comprised 70 hotels and 140 customers. The study collected primary data using
questionnaires. Two sets of questionnaires were used. The collected data was analyzed
using measures of central tendency including mean, standard deviation and frequencies.
The study conducted a Chi-square test to establish the effect of employee related factors
on perceived service quality in Hotels. The data was presented using tables.
This study concludes that employee related factors affected perceived service quality in
Hotels. The study further concludes that employees‘ motivation aspects like salaries and
allowances, personal development initiatives and fringe benefits greatly affect perceived
service quality while promotions/demotions only affect perceived service quality to a
limited extent. The study recommends that hotels take employee related factors like
motivation seriously if they are to deliver high quality services to their customers.
1
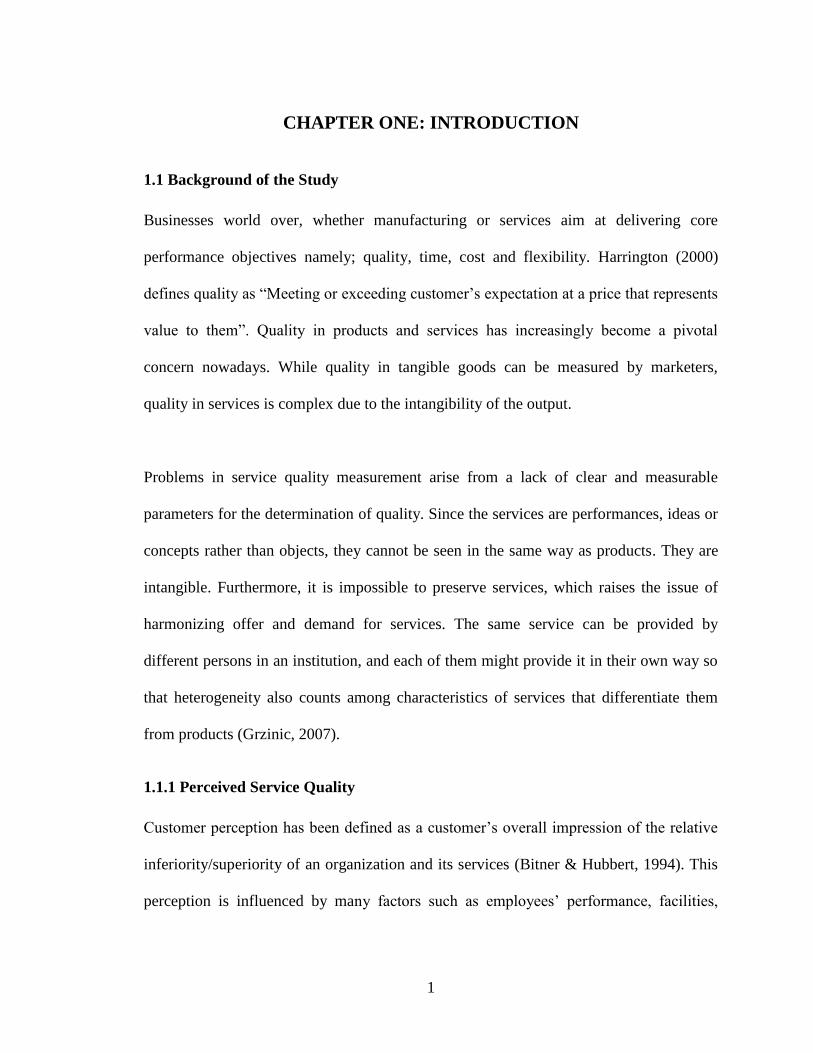
CHAPTER ONE: INTRODUCTION
1.1 Background of the Study
Businesses world over, whether manufacturing or services aim at delivering core
performance objectives namely; quality, time, cost and flexibility. Harrington (2000)
defines quality as ―Meeting or exceeding customer‘s expectation at a price that represents
value to them‖. Quality in products and services has increasingly become a pivotal
concern nowadays. While quality in tangible goods can be measured by marketers,
quality in services is complex due to the intangibility of the output.
Problems in service quality measurement arise from a lack of clear and measurable
parameters for the determination of quality. Since the services are performances, ideas or
concepts rather than objects, they cannot be seen in the same way as products. They are
intangible. Furthermore, it is impossible to preserve services, which raises the issue of
harmonizing offer and demand for services. The same service can be provided by
different persons in an institution, and each of them might provide it in their own way so
that heterogeneity also counts among characteristics of services that differentiate them
from products (Grzinic, 2007).
1.1.1 Perceived Service Quality
Customer perception has been defined as a customer‘s overall impression of the relative
inferiority/superiority of an organization and its services (Bitner & Hubbert, 1994). This
perception is influenced by many factors such as employees‘ performance, facilities,
2
price of products and quality of service offered among other factors (Gagliano &
Hathcote, 1994; Naylor & Frank, 2000; Shaw & Haynes, 2004).
Perceived service quality by the customer is not necessarily the same as the quality of
service actually delivered. Quality of service delivered is an internal quality concept
measured by comparing what is delivered with the standards set by the organization. It is
also not the same as customer satisfaction but customer satisfaction can be derived from
perceived service quality. Expectations are influenced by word of mouth, market
communications, customer needs and customer learning (Gronroos 1988). Customer
satisfaction involves a customer‘s comparison of expected service quality and perceived
service quality (Swanson and Paris, 2003).
Customer retention and loyalty are significantly influenced by perceived service quality
(Boshoff and Gray, 2004). Through this, profitability improves and perceived service
quality rises (Irving and Dickson, 2004). Sohail (2003) has suggested that growth of an
organization can be achieved through perceived service quality. Perez et al. (2007)
observed that service quality has become a critical factor in enabling firms to achieve a
differential advantage over their competitors and thus, it makes a significant contribution
to profitability and productivity.
Parasuraman et al (1988) identified two major payoffs of quality; Quality creates true
customers and that it leads to efficiencies, and, excellent service pays off because it
creates true customers who are like annuities who keep pumping revenues into an
organization. Quality improvements lead to operational efficiencies beyond those
associated with scale economies. This is because; quality improvements lower defects,
3
service errors and customer complaints. Customer satisfaction depends on the quality of
service customers‘ receive and how well this matches their expectations. In their studies,
Demirel, Yoldas and Divanoglu (2009) found a positive and significant relationship
between customers‘ perception of service quality and their willingness to recommend the
company. But perception factor influences both perceived service quality and the quality
of services delivered. The gap model (Parasuraman et al, 1985) suggests that consumers‘
quality perceptions are influenced by a series of four distinct gaps occurring in
organizations. These are the gap between consumer expectation and management
perception, gap between management perception and service quality specification, gap
between service quality specification and service delivery, and, gap between service
delivery and external communication. All these have a summative effect that lead to the
fifth gap, the gap between expected service and perceived service. These gaps relate to
the employee factors within the organization.
1.1.2 Employees Factors in Service Quality
A customer has his expectations through word of mouth, personal needs and previous use
of the service. When the management does not correctly perceive what the customer
wants or needs and when the management or service provider might correctly perceive
what the customer wants, but may not set a performance standard, there‘s a gap in
specifications. There may be a gap between service quality specification and service
delivery that may arise due to poor training, lack of capacity or unwillingness to meet the
set service standard. (Parasuraman et al, 1985)
Employees‘ factor is also significant in the three elements of service quality as defined in
the Gronroos model. The model describes three aspects against which quality is evaluated
4
by the customer: technical, functional and image aspects of service quality. The technical
aspect is evaluated in terms of what the customer receives after interacting with the
service provider. This would be the service provider‘s employee. Functional quality is
seen in the actions of the employee towards delivering the service as there is high
customer contact and hence a possibility to influence customer‘s perceived service
quality of the service. The actions of the employee could be in terms of the approach,
marketing activities, the ability of the employee to listen to the customer and to give
feedback or advice to the customer etc. Functional quality is evaluated on the basis of
how the service was delivered and may compensate for temporary problems with
technical quality. The interaction of both the functional and the technical aspects of
service quality form an image on the customer about the organization (Gronroos, 1988).
This employee influence is targeted in this context of the Hotel industry in Kenya.
1.1.3 The Hotel Sector in Kenya
As economies grow, they tend to be service oriented. A report compiled by the World
Bank and the Export Promotion Council indicates that Kenya is becoming a service
driven economy. Globally, the service sector accounts for 20 per cent of the economy,
while the industry in Kenya currently stands at 62 per cent of GDP, with a corresponding
over 68 per cent of employment creation with major sectors like transport,
communication, tourism and financial services taking the lead. According to Kenya
National bureau of statistics second quarter 2012/2013 GDP release, services account
surplus increased by 11.6% mainly due to increased foreign exchange receipts from
tourism, transportation, communication and financial services.
5
The hotels play a central role in the country‘s tourism industry, yet the Coast lacks five-
star hotels. Only a few in Nairobi have the coveted rating. Internationally, the
classification of hotels and restaurants creates uniformity in the industry providing
common elements in every class of hotel and restaurant that their clients should expect.
The hotel business is regulated by two Acts of parliament namely: Hotels and restaurants
Act (Cap 494) and the tourist Licensing Act (Cap 381). This is done through Hotels and
restaurants Authority with an aim of imposing a levy for training persons to be employed
in hotels and restaurants. http://www.tourism.go.ke/ministry.nsf/2013/
An attempt to classify hotels in 2011 using the East African community guidelines failed
amid claims of bribery and in-fighting between government officials and hoteliers. The
classification was intended to rank hotels according to the quality of services offered and
their standards — ranging from one star to five stars. The most recent classification was
carried out in 2003, and hoteliers feel that Kenya‘s standing as a tourist destination is
reduced. According to Ms Marianne Jordan, the Kenya Tourism Development
Corporation managing director, the standards of tourist hotels have dropped, and thus
adversely influencing the type of tourists that are coming to Kenya.
http://www.tourism.go.ke/ministry.nsf/2013/
Key issues in the Hotel industry are: cultural factors affecting employee behavior,
competition from different tourism destinations and changed customer demands and
satisfaction.
1.2 Statement of the Problem
The Gap model of service quality explains the relationship between managers‘ perception
and actions by employees. Managers may perceive the needs of the customer differently.
6
Translation of perceptions into service quality specifications by the managers will lead to
actions by the employees that affect the perceived quality of service by the consumer.
This may come about due to poor external communication to the consumer, lack of
relevant customer service training, low motivation and low job satisfaction (Parasuraman
et al, 1985). Taylor (2002) suggests that customers yearn for that personal touch and
humane encounters with the employees during service.
A perception survey of African banks by KPMG (2013) showed that customers
overwhelmingly viewed staff friendliness as the most important factor influencing their
satisfaction with their bank. Most customers were dissatisfied with staff‘s knowledge of
banking products and the speed of addressing customer complaints
(http://www.kpmg.com/2013/africabanking).
A study carried out by Kattara, et al (2008) concluded that employees' behaviors greatly
affect overall customer satisfaction regardless of customers' gender, nationality, and
purpose of visit, number of visits and length of stay. A research carried out by Gounaris
& Boukis (2013) found that employee job satisfaction influences a customer's perception
of quality, customer satisfaction and repeat visits.
The Hotel industry is faced with similar employee related challenges including low
motivation, lack of reliability, empathy and assurance and low responsiveness to
customer requests (Hanzaee and Mirvaisi, 2011). However, many hotels may not be able
to achieve quality due to competition in the industry and failure to address all employee
related issues like job satisfaction, skills/ training, employee‘s behavior and attitudes and
low motivation of employees affecting proper customer communication and hence
satisfaction (Kimungu & Maringa, 2010).
7
Managers in the hotel businesses have to focus on delivering quality to customers in a
cost effective manner to ensure they remain competitive. How the quality delivered is
perceived by customers is influenced by the employees and their attitudes and actions.
Research on service perception by customers has mainly focused on employee‘s views.
This study sought customers and managers views on the question: what impact did
employees have on perceived service quality?
1.3 Research Objectives
To answer the questions, the study was to achieve the following objectives:
1. To establish the employee related factors in perceived service quality
2. To determine the effect of the employee related factors on perceived service quality.
1.4 Value of the Study
The research sought to establish the role that employees play in ensuring improved
perceived service quality and hence customer satisfaction and consequent retention. The
study is of benefit the academia, the managers and business owners in the vibrant sector.
The study came up with a solution for employers in the hotel industry as pertains to
customer satisfaction feedback that is employee related and advises them how to deal
with the employee aspect of service quality to ensure sustainable perceived service
quality, customer satisfaction and hence customer retention. It also provides answers as to
why there‘s high turnover in the sector and what employers can do to safeguard quality
while at the same time coming up with competitive ways of retaining their highly
skilled/valued human resource.
8
The information from the study enables understanding of customer perception of service
quality. The study forms a basis for research on other sub-sectors of the services sector in
Kenya which can be replicated in other geographical regions. The study also contributes
refreshing insights useful for relationship marketing.
This study provides valuable insight to managers regarding the customer service skills to
equip their employees within their ongoing effort to improve customer communication,
satisfaction and hence retention. Hence, the result of this research can be utilized as a
foundation to build service strategy.
9
CHAPTER TWO: LITERATURE REVIEW
2.1 Introduction
This chapter reviewed studies related to what has been researched or written by others. It
first covered employee related factors in service quality, and then reviewed literature on
the effect of the employee related factors on perceived service quality. It then gave a
review summary and conceptual framework for the study.
2.2 Employee Factors in Service Quality.
A study by Sharma et al, (2011) on Chinese and Indian Insurance Industry emphasized
the importance of the employee in providing services. The research found that customers
continue to value person-to-person contact in both the countries. Despite the changing
environment, customers still assess service quality primarily in terms of the personal
support they receive from employees and the benefits they get from such long-term
relationships. These benefits include first-rate service, personal recognition and friendly
interactions, and a sense of confidence and trust.
A perception survey of African banks by KPMG (2013) showed that customers showed
staff friendliness as the most important factor influencing their satisfaction with their
bank. Three in ten customers said they were very satisfied with their bank staff‘s
knowledge of banking products and only ten percent indicated that they were extremely
satisfied that their complaints were being promptly addressed.
A study by Wanjau et al (2012) in the Kenyan health sector revealed that low employee‘s
capacity affects delivery of service quality to patients in public health sector affecting
health service quality perceptions, patient satisfaction and loyalty. The study tied
10
successful recruitment and retention of staff to empowerment of staff and recommended
that staff be treated as full partners in the hospital operation and given opportunities for
advancement.
A study by Kamau and Waudo (2012) found that there is a relationship between the skills
expected by the hospitality industry employers‘ and the set hotels‘ quality standards.
Skills with significant relationship like customer care, multi-skills, communication and
understanding the level of service were expected in any hotel irrespective of its
classification. The study found a notable difference between managers and employees‘
expectation. The biggest difference in the expectations seen was that many employees
think that the industry expects them to be competent in communication skills, specific
technical skills, computer, good work habits, customer service and self-discipline.
These findings are consistent with those of Kimungu & Maringa (2010) that employee
factors affect service quality. Kimungu & Maringa study however focuses on employee
turnover and how it relates to customer satisfaction in services and competitiveness of an
establishment. The study revealed that low job satisfaction, unfavorable working
conditions, and slow career advancement were major factors influencing employee
turnover which interfered with internalization of standards by the employees resulting to
lower quality of service and reduced customer satisfaction thus making an establishment
less competitive. The respondents indicated that most customers normally preferred being
served by the same person every time they visited an establishment. The behavior and
attitude of both management and employees were found to play a role in employee
turnover. The study found out that many managers in the Kenyan hotel industry viewed
an employee‘s experience as having worth when reflecting a diversity of other past
11
employers and this influenced employees‘ behavior and attitudes into changing jobs
frequently in order to gain the much needed ―experience‖. According to the study, lack of
proper orientation and training made it difficult for new recruits to internalize
establishment‘s service standards which are key foundation for quality service.
A study by Kuria et al (2011) agrees with Kimungu & Maringa (2010) that to achieve
quality service, establishments need a relatively stable labour force to allow
internalization of service standards. The study recommended hotels should initiate
employee retention programmes as human capital is the most valuable asset in all
organizations and review the employees‘ welfare conditions such as introducing flexible
work hours to the employees in order to balance individual work and personal life among
other incentives. The two studies concluded that high levels of employee turnover will
negatively impact the quality of service and the desired competitiveness of an
establishment.
2.3 Employee Factors and Perceived Service Quality
Mukherjee & Malhotra (2006) examined the effects of role clarity on employee perceived
service quality in call centers of a major commercial bank. Their study revealed that role
clarity plays a critical role in explaining employee perceptions of service quality. Further,
the research findings indicate that feedback, participation and team support significantly
influence role clarity, which in turn influences job satisfaction and organizational
commitment. The key antecedents of role clarity considered here were feedback,
autonomy, participation, supervisory consideration, and team support; while key
consequences were organizational commitment, job satisfaction and service quality. An
12
internal marketing approach was adopted and all variables were measured from the
frontline employee's perspective.
Hanzaee and Mirvaisi, (2011) in their study on customer satisfaction in the Iran hotel
industry concluded that, all dimensions of customer image and service quality perception
have significant relationships with customer satisfaction. The study showed higher t-
values hence a stronger relationship between functional and both image and service
perception (12/36 & 8/13) than technical and both image and service quality perception
(10/80 & 4/58). The employee related functional aspects in the study included reliability,
empathy, responsiveness and assurance.
A study by Kimani, Kagira, & Kendi, (2011) on business students‘ perception of service
quality appears to support Gronroos (1988) to the extent that students consider technical
quality in the education they get and functional quality in the administrative and student
support they receive from the employees of the universities and this influences their
image of the institution. The study ranked administrative aspect which is concerned with
such elements as keeping accurate records, providing prompt service, courtesy, providing
individualized attention, showing sincere interest to students, proper communication and
having good knowledge of systems and procedures as the most important determinant of
perceived service quality. The study was limited because it measured only business
students‘ perceptions and left out all the other students taking other degree programmes
hence limiting generalization of the findings across the universities.
13
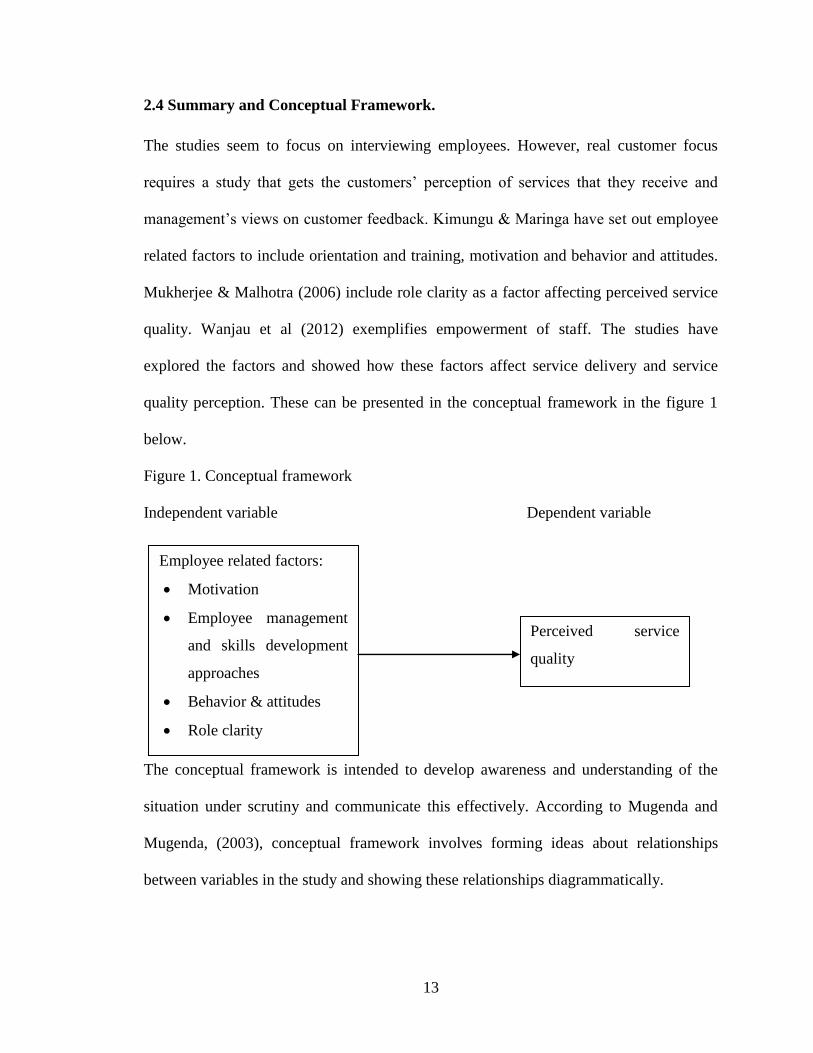
2.4 Summary and Conceptual Framework.
The studies seem to focus on interviewing employees. However, real customer focus
requires a study that gets the customers‘ perception of services that they receive and
management‘s views on customer feedback. Kimungu & Maringa have set out employee
related factors to include orientation and training, motivation and behavior and attitudes.
Mukherjee & Malhotra (2006) include role clarity as a factor affecting perceived service
quality. Wanjau et al (2012) exemplifies empowerment of staff. The studies have
explored the factors and showed how these factors affect service delivery and service
quality perception. These can be presented in the conceptual framework in the figure 1
below.
Figure 1. Conceptual framework
Independent variable Dependent variable
The conceptual framework is intended to develop awareness and understanding of the
situation under scrutiny and communicate this effectively. According to Mugenda and
Mugenda, (2003), conceptual framework involves forming ideas about relationships
between variables in the study and showing these relationships diagrammatically.
Employee related factors:
Motivation
Employee management
and skills development
approaches
Behavior & attitudes
Role clarity
Perceived service
quality
14
CHAPTER THREE: RESEARCH METHODOLOGY
3.1 Introduction
This chapter outlines the procedure that was followed in carrying out the study. It
describes and explains the research process that was used to collect and analyze data.
The chapter is thus structured into research design, target population, sample size and
sampling techniques, data collection, data analysis and presentation.
3.2 Research Design
In this study descriptive research was used. According to Mugenda and Mugenda (2003),
a descriptive research determines and reports the way things are and attempts to describe
things as possible behavior, attitudes, values and characteristics. The design attempts to
describe or define a subject, often by creating a profile of a group of problems, people or
events through collection of data and tabulation of the frequencies on research variables
or their interaction (Cooper and Schindler, 2006). It is a statistical, cross-sectional study
in the sector to allow for generalization of the findings across sectors.
The method was appropriate for the study because it assisted the researcher to produce
statistical information on the effect of employees on perceived service quality in the hotel
businesses. It took the form of a correlation study to show the extent of the relationship
between employee factors and perceived service quality in hotel businesses and allowed
for prudent judgmental comparison of the variables involved. The study assumed
controlled influence of other variables that affect service quality including information
technology.
15
3.3 Target Population
The study population consisted of 453 hotel businesses in Nairobi as captured in the
official yellow pages (August 2013) and customers that visit those hotels. The study was
carried out in Nairobi because it‘s an academic study and due to limitations of time and
other resources. This was also because Nairobi is cosmopolitan.
The study was restricted to hotels employing more than 20 employees because such
businesses were likely to have proper organizational structures and professionalism in
their operations because of the issues involved.
3.4 Sample Design and Sample Size
For this study 70 hotels formed the sample size based on information obtained from the
official yellow pages (August, 2013) and 140 customers, two customers from each
selected hotel. A sample size of between 10 to 30% is sufficient to represent a population
(Mugenda & Mugenda 2003). Simple random sampling technique was used to select the
hotels to be sampled. The method involved arrangement of all the hotels in an excel sheet
in an alphabetical order then numbering them. The study then selected every fourth hotel
in an increasing manner. Convenient sampling was used to select the customers in the
hotels that formed the sample.
3.5 Data Collection
Primary data was collected and used in the study using questionnaires administered to the
managers responsible for operations in the hotels and two customers in the selected
hotels. Kothari C.R, (2004) states that a questionnaire consists of a number of questions
printed and typed in a definite order on a form or set of forms. There were hence two
16
different questionnaires. Section one focused on employee related factors and quality
while section two focused on employee related factors in quality perception. The
questionnaire included both open and close ended questions. The close-ended questions
provided more structured responses while open -ended questions were used to test the
rating of various dimensions.
For actual services delivered, data was collected relating to the managers‘ perception of
their relative performance against given quality measures as compared to other firms. As
for the perceived service quality, data was collected from the managers on the extent of
repeat business, positive comments and reports and customer feedback data. Customers
also gave their perception of the kind of services they received and their views on what
they expected from such hotels. For employee role, data was collected based on the
variables in the reviewed literature.
The researcher personally administered the questionnaires and collected the filled in
questionnaire before leaving each of the selected respondents. The questionnaire were
pretested using some population elements to ensure that it was easily understood and to
check if there were any obvious problems with the length, sequencing of questions or
sensitive items in it.
3.6 Data Analysis
Data was analyzed using both qualitative and quantitative methods. Qualitative data was
analyzed manually by first summarizing the information gathered, followed by
categorization and coding into emerging themes and presenting in a narrative form. The
17
results were presented in terms of percentages, frequencies and in figures and tables and a
brief explanation of each given. Likert scale will be used for the data.
Quantitative data was organized, coded, and standardized then descriptive statistics was
used to analyze aided by statistical package for social scientists (SPSS), Robson, (2002).
Descriptive analysis was carried out to provide simple summaries about the sample and
the measures e.g. the distribution, the central tendency and the dispersion. Tables were
used to present the data. Inferential statistics were then used to establish the effects of
employee factors on perceived service quality and to make inferences from the data. A
hypothesis testing was done using chi-square test which was used to establish the effects
of employee factors on perceived service quality and to make inferences from the data.
The hypothesis tested by the study included:
Null: Employee related factors have no effect on perceived service quality in Hotels.
Alternate: Employees related factors have effect on perceived service quality in Hotels.
On extracting the chi-square statistics, the researcher looked at the significance value.
The study was tested at 95% confidence level and 5% significant level. If the significance
value obtained was less than the critical value ( ) set, then the null hypothesis was
rejected otherwise it was accepted.
18
CHAPTER FOUR: RESULTS, DATA ANALYSIS AND DISCUSSION
4.1 Introduction
This chapter presents results, data analysis and finding of the study as set out in the
research methodology.
4.2 Results
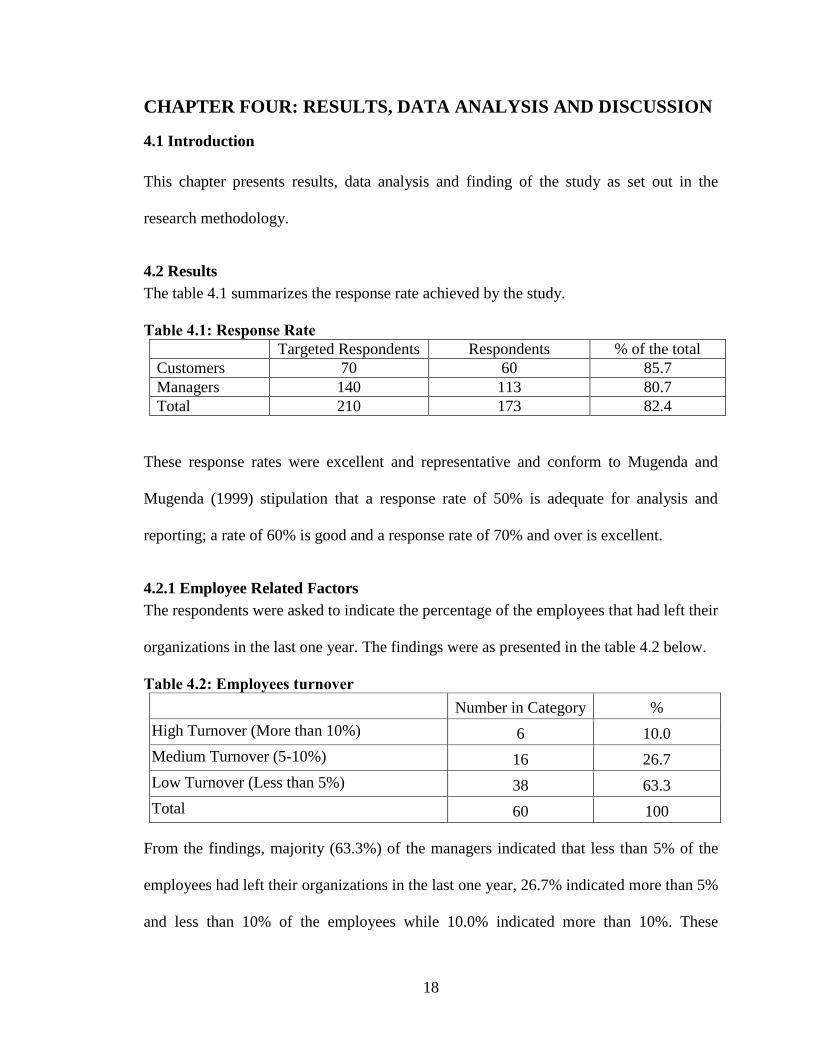
The table 4.1 summarizes the response rate achieved by the study.
Table 4.1: Response Rate
Targeted Respondents Respondents % of the total
Customers 70 60 85.7
Managers 140 113 80.7
Total 210 173 82.4
These response rates were excellent and representative and conform to Mugenda and
Mugenda (1999) stipulation that a response rate of 50% is adequate for analysis and
reporting; a rate of 60% is good and a response rate of 70% and over is excellent.
4.2.1 Employee Related Factors
The respondents were asked to indicate the percentage of the employees that had left their
organizations in the last one year. The findings were as presented in the table 4.2 below.
Table 4.2: Employees turnover
Number in Category %
High Turnover (More than 10%) 6 10.0
Medium Turnover (5-10%) 16 26.7
Low Turnover (Less than 5%) 38 63.3
Total 60 100
From the findings, majority (63.3%) of the managers indicated that less than 5% of the
employees had left their organizations in the last one year, 26.7% indicated more than 5%
and less than 10% of the employees while 10.0% indicated more than 10%. These
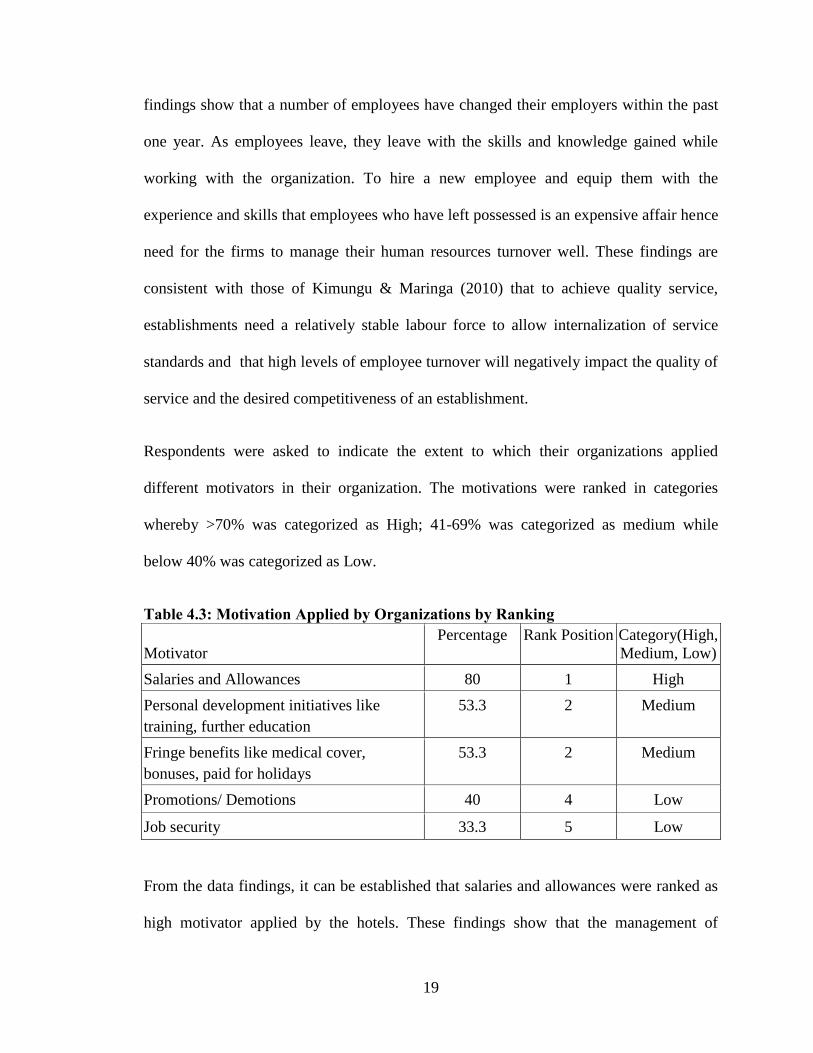
19
findings show that a number of employees have changed their employers within the past
one year. As employees leave, they leave with the skills and knowledge gained while
working with the organization. To hire a new employee and equip them with the
experience and skills that employees who have left possessed is an expensive affair hence
need for the firms to manage their human resources turnover well. These findings are
consistent with those of Kimungu & Maringa (2010) that to achieve quality service,
establishments need a relatively stable labour force to allow internalization of service
standards and that high levels of employee turnover will negatively impact the quality of
service and the desired competitiveness of an establishment.
Respondents were asked to indicate the extent to which their organizations applied
different motivators in their organization. The motivations were ranked in categories
whereby >70% was categorized as High; 41-69% was categorized as medium while
below 40% was categorized as Low.
Table 4.3: Motivation Applied by Organizations by Ranking
Motivator
Percentage Rank Position Category(High,
Medium, Low)
Salaries and Allowances 80 1 High
Personal development initiatives like
training, further education
53.3 2 Medium
Fringe benefits like medical cover,
bonuses, paid for holidays
53.3 2 Medium
Promotions/ Demotions 40 4 Low
Job security 33.3 5 Low
From the data findings, it can be established that salaries and allowances were ranked as
high motivator applied by the hotels. These findings show that the management of
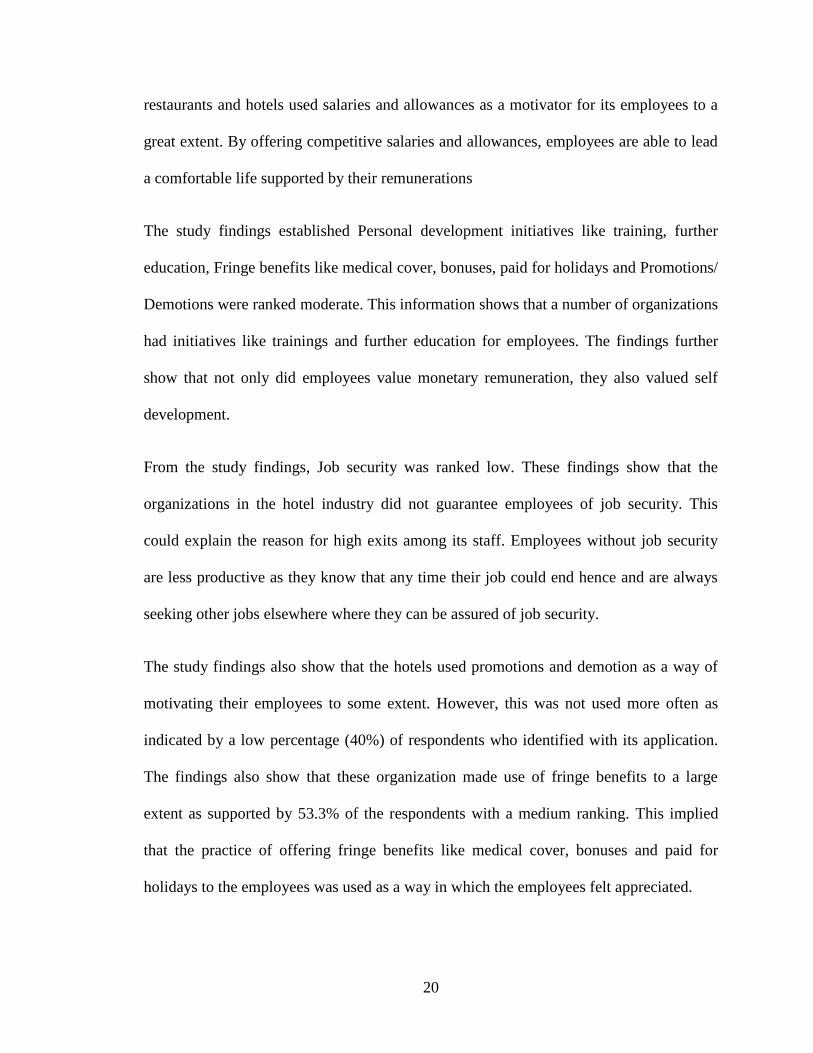
20
restaurants and hotels used salaries and allowances as a motivator for its employees to a
great extent. By offering competitive salaries and allowances, employees are able to lead
a comfortable life supported by their remunerations
The study findings established Personal development initiatives like training, further
education, Fringe benefits like medical cover, bonuses, paid for holidays and Promotions/
Demotions were ranked moderate. This information shows that a number of organizations
had initiatives like trainings and further education for employees. The findings further
show that not only did employees value monetary remuneration, they also valued self
development.
From the study findings, Job security was ranked low. These findings show that the
organizations in the hotel industry did not guarantee employees of job security. This
could explain the reason for high exits among its staff. Employees without job security
are less productive as they know that any time their job could end hence and are always
seeking other jobs elsewhere where they can be assured of job security.
The study findings also show that the hotels used promotions and demotion as a way of
motivating their employees to some extent. However, this was not used more often as
indicated by a low percentage (40%) of respondents who identified with its application.
The findings also show that these organization made use of fringe benefits to a large
extent as supported by 53.3% of the respondents with a medium ranking. This implied
that the practice of offering fringe benefits like medical cover, bonuses and paid for
holidays to the employees was used as a way in which the employees felt appreciated.
21
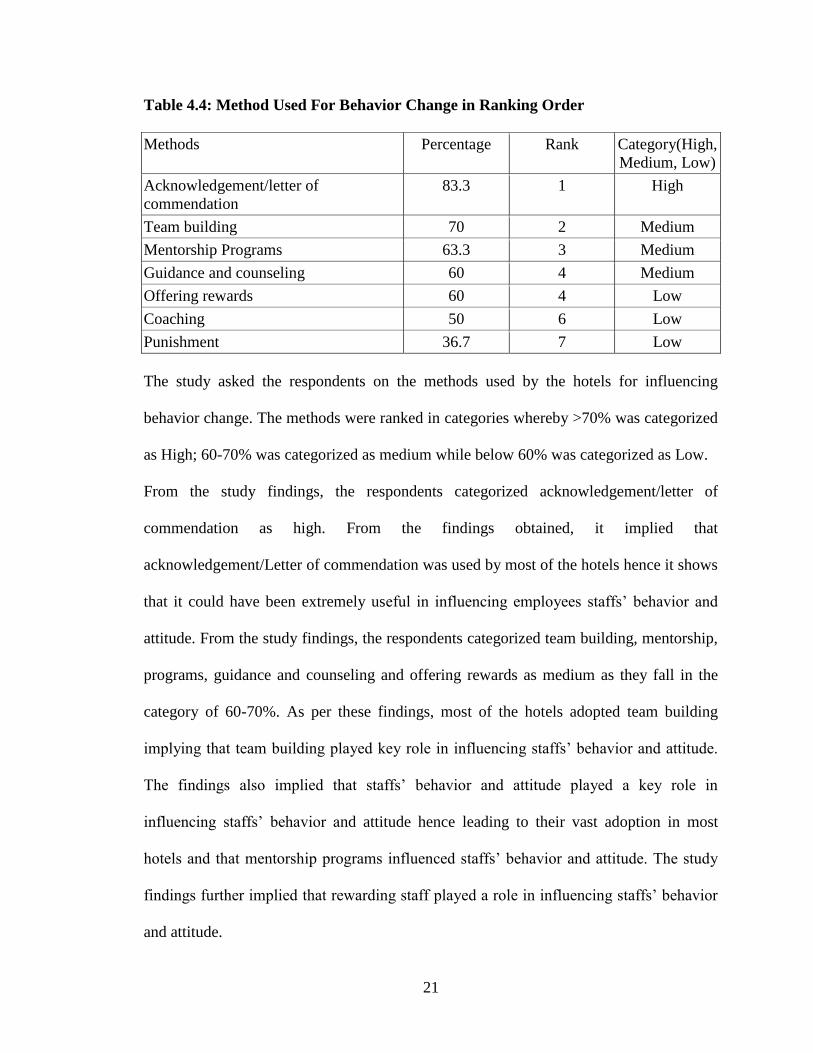
Table 4.4: Method Used For Behavior Change in Ranking Order
Methods Percentage Rank Category(High,
Medium, Low)
Acknowledgement/letter of
commendation
83.3 1 High
Team building 70 2 Medium
Mentorship Programs 63.3 3 Medium
Guidance and counseling 60 4 Medium
Offering rewards 60 4 Low
Coaching 50 6 Low
Punishment 36.7 7 Low
The study asked the respondents on the methods used by the hotels for influencing
behavior change. The methods were ranked in categories whereby >70% was categorized
as High; 60-70% was categorized as medium while below 60% was categorized as Low.
From the study findings, the respondents categorized acknowledgement/letter of
commendation as high. From the findings obtained, it implied that
acknowledgement/Letter of commendation was used by most of the hotels hence it shows
that it could have been extremely useful in influencing employees staffs‘ behavior and
attitude. From the study findings, the respondents categorized team building, mentorship,
programs, guidance and counseling and offering rewards as medium as they fall in the
category of 60-70%. As per these findings, most of the hotels adopted team building
implying that team building played key role in influencing staffs‘ behavior and attitude.
The findings also implied that staffs‘ behavior and attitude played a key role in
influencing staffs‘ behavior and attitude hence leading to their vast adoption in most
hotels and that mentorship programs influenced staffs‘ behavior and attitude. The study
findings further implied that rewarding staff played a role in influencing staffs‘ behavior
and attitude.
22
From the study findings, the respondents categorized Punishment and Coaching as low as
they were in the category of below 60%. This implied that punishment was not adopted in
most of the hotels as a way of influencing their staffs‘ behavior and attitude. Kattara, et al
(2008) emphasized the effect of employees' behavior on overall customer satisfaction
regardless of customers' gender, nationality, and purpose of visit, number of visits and
length of stay. This study shows the hotel industry recognizes this and that most hotels
employ several ways of influencing employee behavior including team building, issuing
letters of commendation, coaching, mentorship programs and offering rewards among
others.
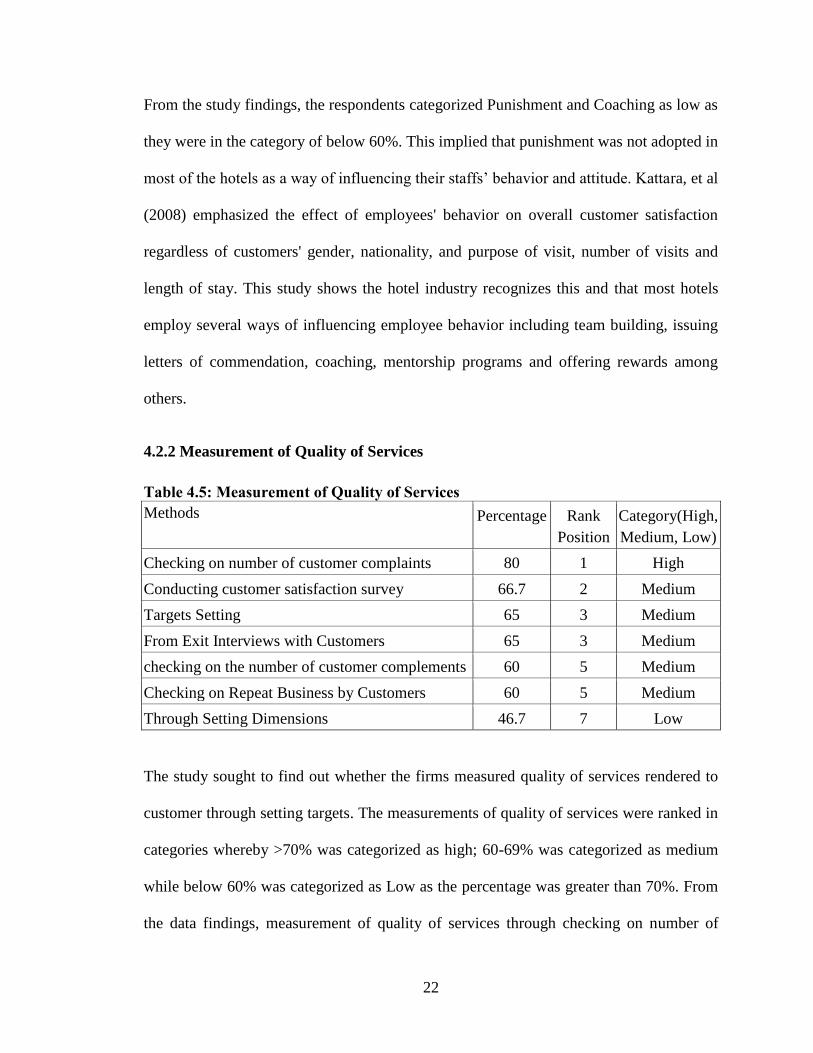
4.2.2 Measurement of Quality of Services
Table 4.5: Measurement of Quality of Services
Methods Percentage Rank
Position
Category(High,
Medium, Low)
Checking on number of customer complaints 80 1 High
Conducting customer satisfaction survey 66.7 2 Medium
Targets Setting 65 3 Medium
From Exit Interviews with Customers 65 3 Medium
checking on the number of customer complements 60 5 Medium
Checking on Repeat Business by Customers 60 5 Medium
Through Setting Dimensions 46.7 7 Low
The study sought to find out whether the firms measured quality of services rendered to
customer through setting targets. The measurements of quality of services were ranked in
categories whereby >70% was categorized as high; 60-69% was categorized as medium
while below 60% was categorized as Low as the percentage was greater than 70%. From
the data findings, measurement of quality of services through checking on number of
23
customer complaints was categorized as high. Measurement of quality of services
through conducting customer satisfaction survey, targets setting, from exit interviews
with customers, checking on the number of customer complements and checking on
repeat business by customers were categorized as medium by the respondents while
measurement of quality of services through Setting dimensions was categorized as low
by the respondents.
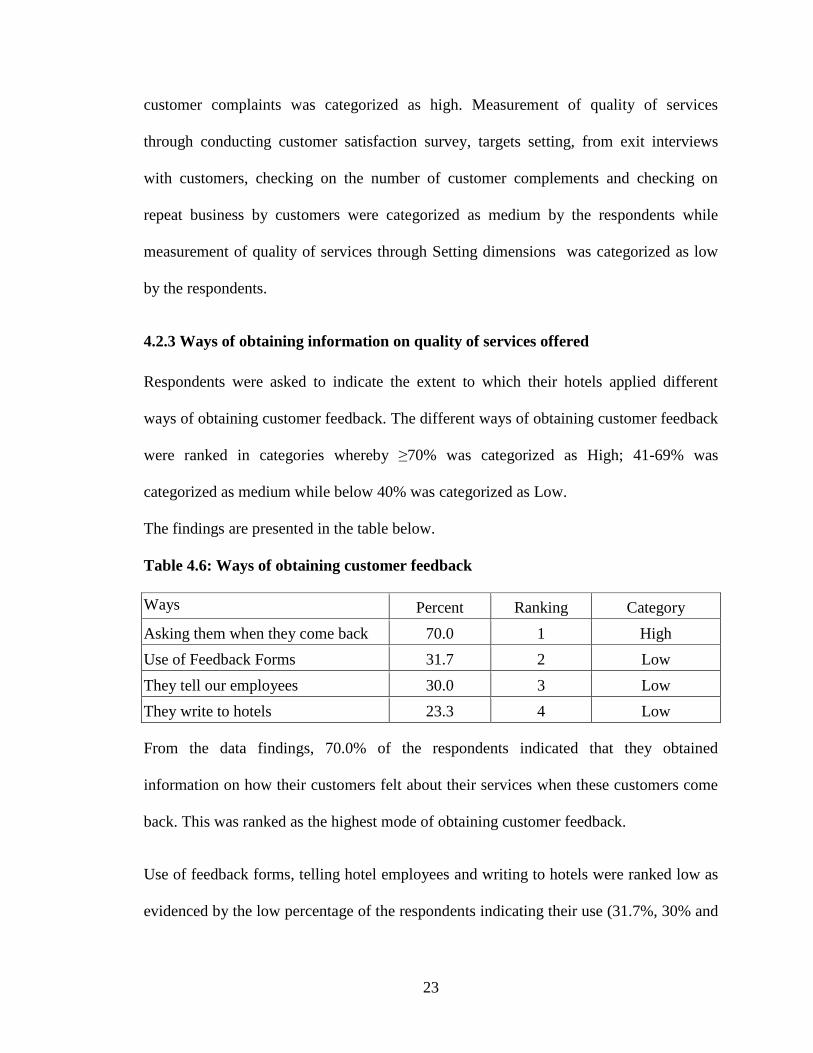
4.2.3 Ways of obtaining information on quality of services offered
Respondents were asked to indicate the extent to which their hotels applied different
ways of obtaining customer feedback. The different ways of obtaining customer feedback
were ranked in categories whereby ≥70% was categorized as High; 41-69% was
categorized as medium while below 40% was categorized as Low.
The findings are presented in the table below.
Table 4.6: Ways of obtaining customer feedback
Ways Percent Ranking Category
Asking them when they come back 70.0 1 High
Use of Feedback Forms 31.7 2 Low
They tell our employees 30.0 3 Low
They write to hotels 23.3 4 Low
From the data findings, 70.0% of the respondents indicated that they obtained
information on how their customers felt about their services when these customers come
back. This was ranked as the highest mode of obtaining customer feedback.
Use of feedback forms, telling hotel employees and writing to hotels were ranked low as
evidenced by the low percentage of the respondents indicating their use (31.7%, 30% and
24
23.3% respectively). These findings show that most of the hotels did not collect customer
feedback using these means.
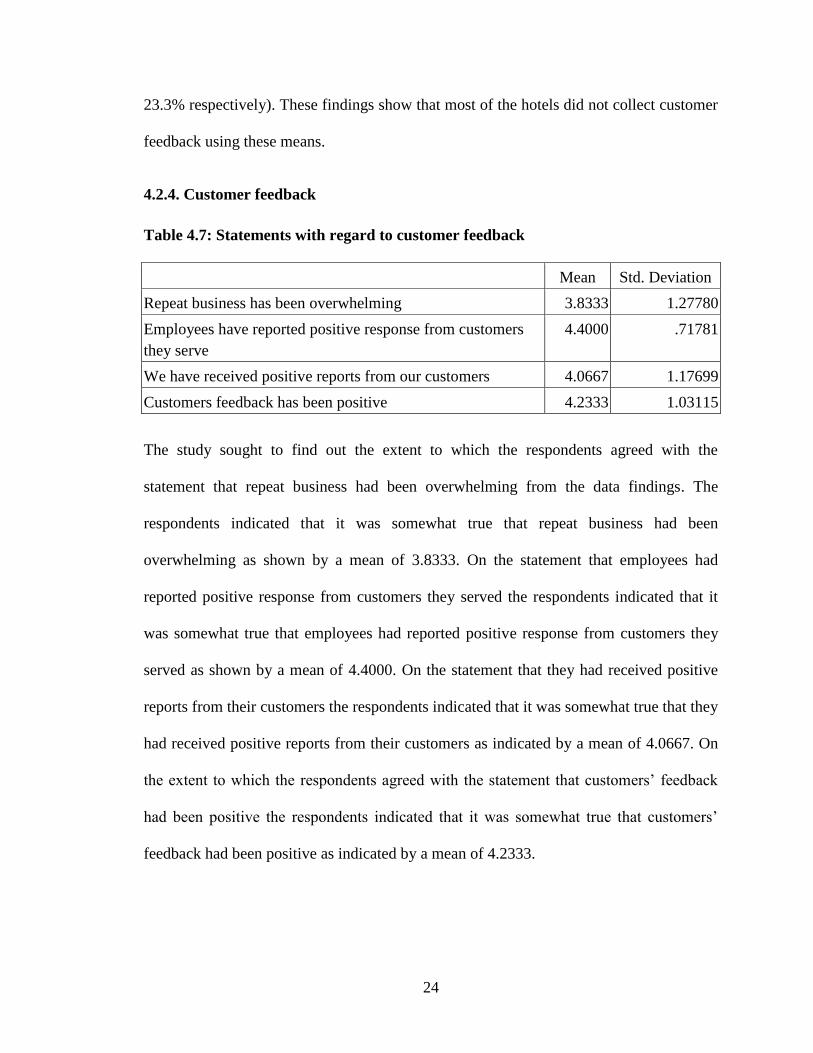
4.2.4. Customer feedback
Table 4.7: Statements with regard to customer feedback
Mean Std. Deviation
Repeat business has been overwhelming 3.8333 1.27780
Employees have reported positive response from customers
they serve
4.4000 .71781
We have received positive reports from our customers 4.0667 1.17699
Customers feedback has been positive 4.2333 1.03115
The study sought to find out the extent to which the respondents agreed with the
statement that repeat business had been overwhelming from the data findings. The
respondents indicated that it was somewhat true that repeat business had been
overwhelming as shown by a mean of 3.8333. On the statement that employees had
reported positive response from customers they served the respondents indicated that it
was somewhat true that employees had reported positive response from customers they
served as shown by a mean of 4.4000. On the statement that they had received positive
reports from their customers the respondents indicated that it was somewhat true that they
had received positive reports from their customers as indicated by a mean of 4.0667. On
the extent to which the respondents agreed with the statement that customers‘ feedback
had been positive the respondents indicated that it was somewhat true that customers‘
feedback had been positive as indicated by a mean of 4.2333.
25
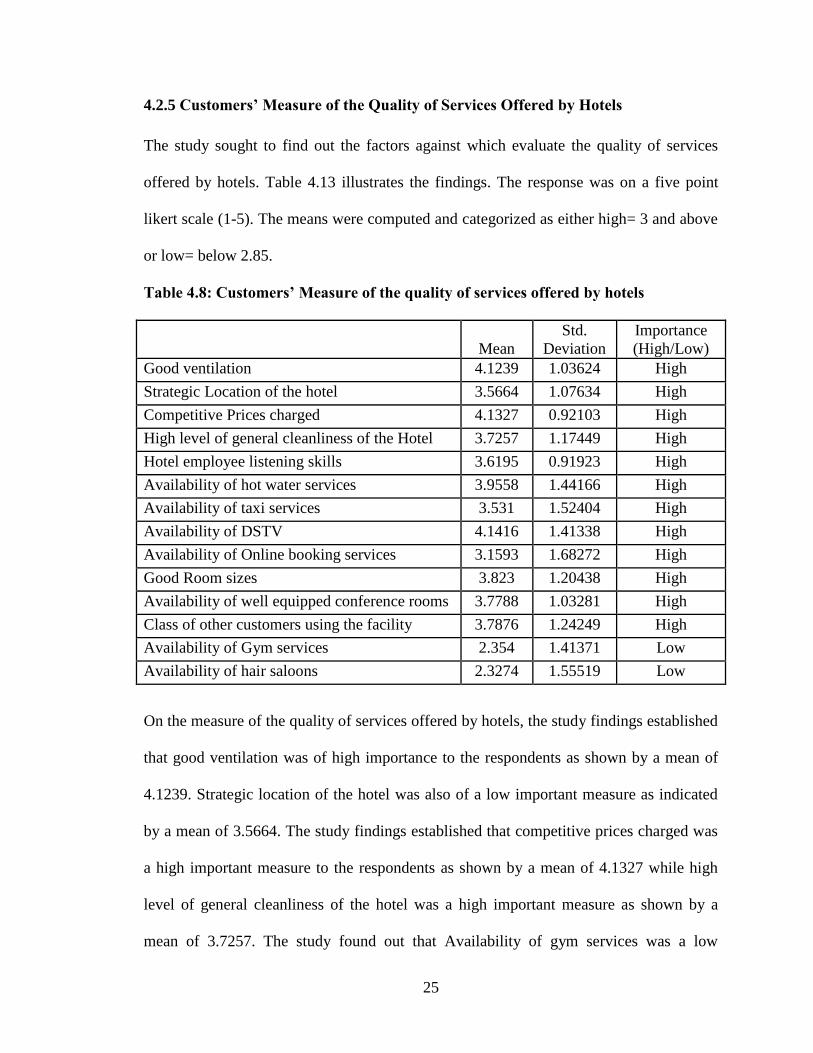
4.2.5 Customers’ Measure of the Quality of Services Offered by Hotels
The study sought to find out the factors against which evaluate the quality of services
offered by hotels. Table 4.13 illustrates the findings. The response was on a five point
likert scale (1-5). The means were computed and categorized as either high= 3 and above
or low= below 2.85.
Table 4.8: Customers’ Measure of the quality of services offered by hotels
Mean
Std.
Deviation
Importance
(High/Low)
Good ventilation 4.1239 1.03624 High
Strategic Location of the hotel 3.5664 1.07634 High
Competitive Prices charged 4.1327 0.92103 High
High level of general cleanliness of the Hotel 3.7257 1.17449 High
Hotel employee listening skills 3.6195 0.91923 High
Availability of hot water services 3.9558 1.44166 High
Availability of taxi services 3.531 1.52404 High
Availability of DSTV 4.1416 1.41338 High
Availability of Online booking services 3.1593 1.68272 High
Good Room sizes 3.823 1.20438 High
Availability of well equipped conference rooms 3.7788 1.03281 High
Class of other customers using the facility 3.7876 1.24249 High
Availability of Gym services 2.354 1.41371 Low
Availability of hair saloons 2.3274 1.55519 Low
On the measure of the quality of services offered by hotels, the study findings established
that good ventilation was of high importance to the respondents as shown by a mean of
4.1239. Strategic location of the hotel was also of a low important measure as indicated
by a mean of 3.5664. The study findings established that competitive prices charged was
a high important measure to the respondents as shown by a mean of 4.1327 while high
level of general cleanliness of the hotel was a high important measure as shown by a
mean of 3.7257. The study found out that Availability of gym services was a low
26
important feature as shown by a mean of 2.3540 while hotel employee listening skills
was also a low important measure as indicated by a mean of 3.6195. The study findings
established that availability of hair saloons was a low important measure in determining
the quality of services offered by hotels. This was indicated by a mean of 2.3274.
Availability of hot water services was a high important measure to the respondents as
shown by a mean of 3.9558 while availability of taxi services was a low important
measure as indicated by a mean of 3.5310. The findings of the study established that
availability of DSTV was a high important measure as shown by a mean of 4.1416 while
availability of online booking services was a low important measure to the respondents as
indicated by a mean of 3.1593. The study found that good room sizes was a high
important measure to the respondents as well as the availability of well equipped
conference rooms as indicated by means of 3.8230 and 3.7788 respectively. The study
also established that class of other customers using the facility was an important measure
as indicated by a mean of 3.7876.
4.2.6 Service Quality Rating
4.2.6.1 Importance of Employee Related Issues on Service delivery
The study sought to establish the respondents‘ views on the importance of several
employee related issues on service quality. The employee factors were categorized as of
high importance and of Low importance. If the difference between the mean and the
standard deviation was more than three, the factor was categorized as high otherwise it
was categorized as low. Table below illustrates the findings.
27
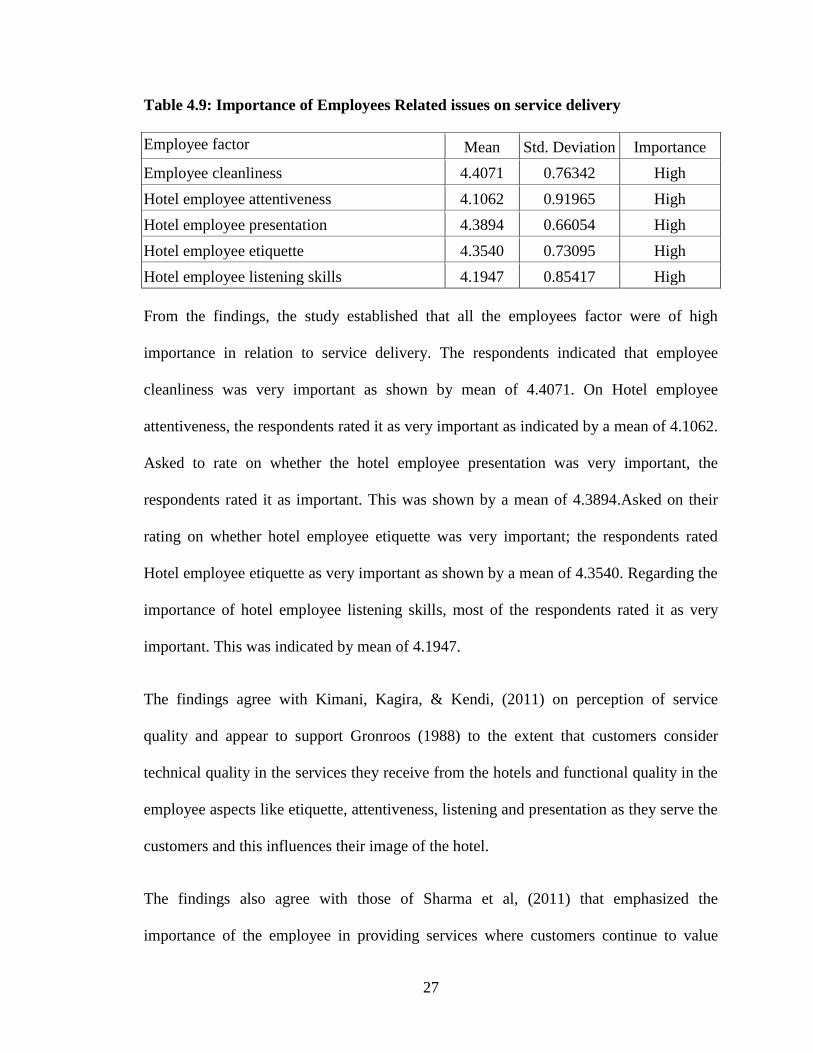
Table 4.9: Importance of Employees Related issues on service delivery
Employee factor Mean Std. Deviation Importance
Employee cleanliness 4.4071 0.76342 High
Hotel employee attentiveness 4.1062 0.91965 High
Hotel employee presentation 4.3894 0.66054 High
Hotel employee etiquette 4.3540 0.73095 High
Hotel employee listening skills 4.1947 0.85417 High
From the findings, the study established that all the employees factor were of high
importance in relation to service delivery. The respondents indicated that employee
cleanliness was very important as shown by mean of 4.4071. On Hotel employee
attentiveness, the respondents rated it as very important as indicated by a mean of 4.1062.
Asked to rate on whether the hotel employee presentation was very important, the
respondents rated it as important. This was shown by a mean of 4.3894.Asked on their
rating on whether hotel employee etiquette was very important; the respondents rated
Hotel employee etiquette as very important as shown by a mean of 4.3540. Regarding the
importance of hotel employee listening skills, most of the respondents rated it as very
important. This was indicated by mean of 4.1947.
The findings agree with Kimani, Kagira, & Kendi, (2011) on perception of service
quality and appear to support Gronroos (1988) to the extent that customers consider
technical quality in the services they receive from the hotels and functional quality in the
employee aspects like etiquette, attentiveness, listening and presentation as they serve the
customers and this influences their image of the hotel.
The findings also agree with those of Sharma et al, (2011) that emphasized the
importance of the employee in providing services where customers continue to value
28
person-to-person contact in service delivery in hotels in Nairobi. Customers access
service quality primarily in terms of the personal support they receive from employees
and the benefits they get from such relationships. These benefits include personal
recognition and friendly interactions, and a sense of confidence and trust. This is seen in
the high importance the respondents placed on employee etiquette, listening and
attentiveness in service delivery.
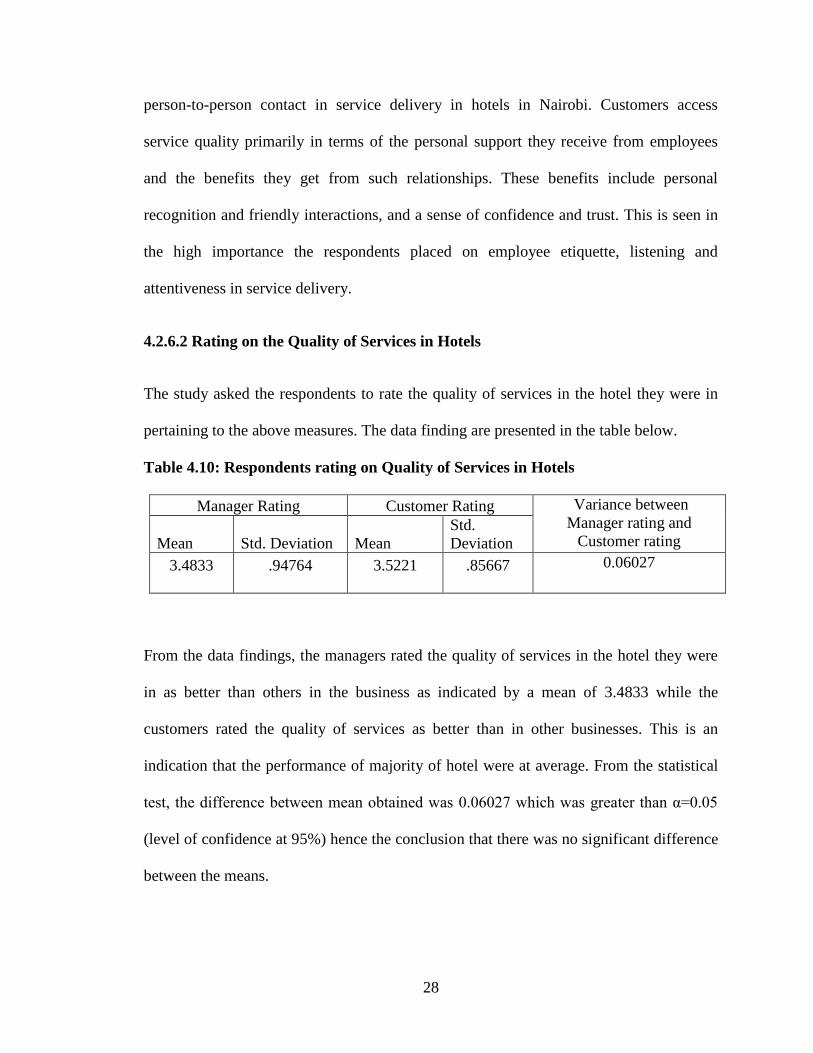
4.2.6.2 Rating on the Quality of Services in Hotels
The study asked the respondents to rate the quality of services in the hotel they were in
pertaining to the above measures. The data finding are presented in the table below.
Table 4.10: Respondents rating on Quality of Services in Hotels
Manager Rating Customer Rating Variance between
Manager rating and
Customer rating Mean Std. Deviation Mean
Std.
Deviation
3.4833 .94764 3.5221 .85667 0.06027
From the data findings, the managers rated the quality of services in the hotel they were
in as better than others in the business as indicated by a mean of 3.4833 while the
customers rated the quality of services as better than in other businesses. This is an
indication that the performance of majority of hotel were at average. From the statistical
test, the difference between mean obtained was 0.06027 which was greater than α=0.05
(level of confidence at 95%) hence the conclusion that there was no significant difference
between the means.
29
4.2.7 Hypothesis Testing
In order to establish whether employee related factors had effects on perceived service
quality; the study conducted a hypothesis testing. The hypothesis was formulated as
follows.
Null: Employee related factors have no effect on perceived service quality in Hotels.
Alternate: Employees related factors have effect on perceived service quality in Hotels.
The null hypotheses imply that the variable- employees related factors and perceived
service quality are independent of each other. The researcher wanted to find out whether
there was any notable relationship between employees related factors and perceived
service quality in hotels. The table below shows the results obtained from the Chi-square
test.
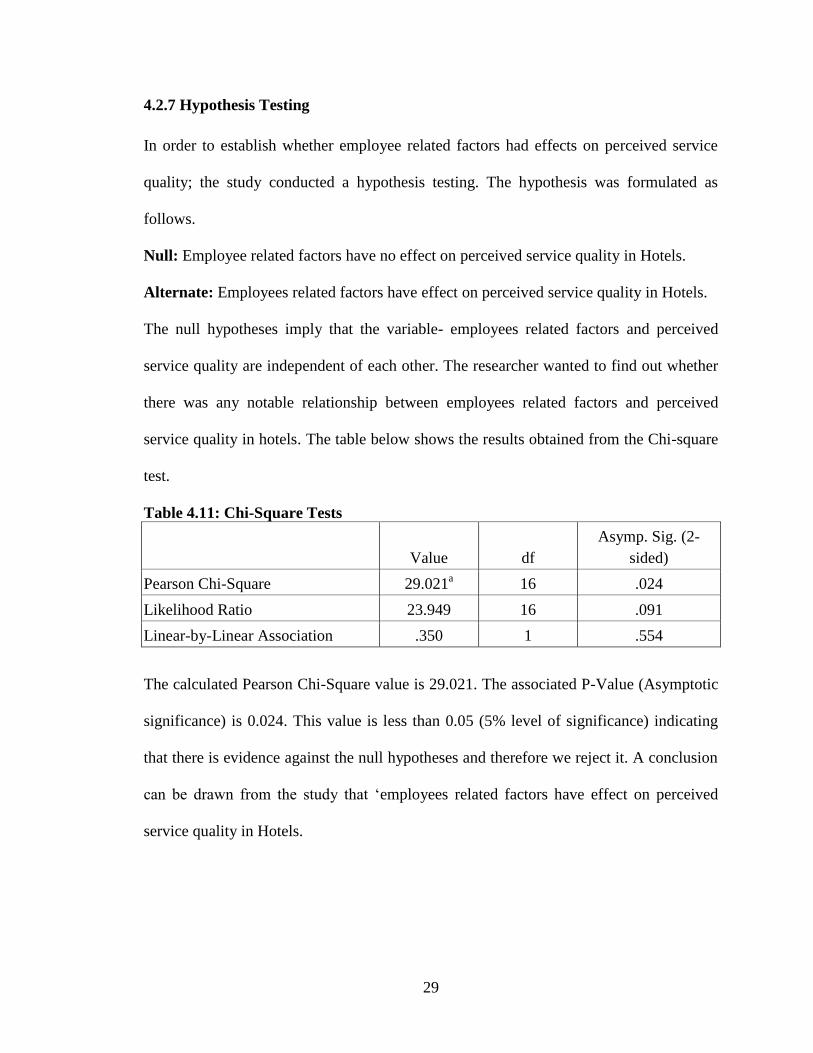
Table 4.11: Chi-Square Tests
Value df
Asymp. Sig. (2-
sided)
Pearson Chi-Square 29.021a 16 .024
Likelihood Ratio 23.949 16 .091
Linear-by-Linear Association .350 1 .554
The calculated Pearson Chi-Square value is 29.021. The associated P-Value (Asymptotic
significance) is 0.024. This value is less than 0.05 (5% level of significance) indicating
that there is evidence against the null hypotheses and therefore we reject it. A conclusion
can be drawn from the study that ‗employees related factors have effect on perceived
service quality in Hotels.
30
4.3 Analysis and Findings
The study findings established that that less than 5% of the employees had left their
organizations in the last one year as indicated by 63.3% of the managers with 26.7%
indicated more than 5% and less than 10% of the employees had left their organizations.
The study findings established that salaries and allowances were ranked as high motivator
applied by the organizations, personal development initiatives like training, further
education, Fringe benefits like medical cover, bonuses, paid for holidays and Promotions/
Demotions was ranked moderate while Job security was ranked low. The study findings
also show that the hotels used promotions and demotion as a way of motivating their
employees to some extent.
The study findings established that, the respondents categorized acknowledgement/letter
of commendation as high, team building, mentorship, programs, guidance and counseling
and offering rewards as medium as they fall in the category of 60-70% while punishment
and Coaching was categorized as low as they were in the category of below 60%.
With regard to perceived service quality, the study findings further established that
measurement of quality of services through checking on number of customer complaints
was categorized as high. measurement of quality of services through conducting customer
satisfaction survey, targets setting, from exit interviews with customers, checking on the
number of customer complements and checking on repeat business by customers were
categorized as medium by the respondents while measurement of quality of services
through Setting dimensions was categorized as low by the respondents.
31
The study found no significant difference between quality perception of managers and
those of customers as there was no significant difference between their mean ratings.
From the statistical test, the mean calculated was 0.06027 which was greater than α=0.05
(level of confidence at 95%) hence the conclusion that there was no significant difference
between the means. This implies that the perception of the managers and the customers
on the quality of services in the hotels was the same hence we accept the null hypothesis
that there is no significant difference between quality perception of managers and that of
customers.
4.4 Discussions
From the findings the study established that employee related factors are an important
element of perceived service quality in the hotels. Employee motivation plays an
important role in the kind of services delivered to customers. In addition, the study
establishes that role clarity, feedback participation, competitive pay, clear career path for
staffs, transparency in promotion, experience checking while recruiting employees,
salaries and allowances, personal development initiatives and fringe benefits contribute
positively to perceived service quality. Highly motivated employees feel part of an
establishment; stay longer in the organization and work towards better service delivery
and prosperity of their organizations. Kimungu & Maringa (2010) noted that to achieve
quality service, establishments need a relatively stable labour force to allow
internalization of service standards and that high levels of employee turnover will
negatively impact the quality of service and the desired competitiveness of an
establishment.
32
On orientation and training, the study found out that there were a clear career path in their
hotels for staff, employee appraisals were transparent in their hotels, promotions were
done transparently, experience in the hotel industry was considered when conducting
recruitment of new staff and that there was a clear reporting structure in their hotels. The
study further establishes that majority of hotels conduct orientations before deploying
staff and that regular skills check and training for their staff are performed by hotels.
However most of the hotels did not conduct employee workshops and seminars. The
study findings appear to support Wanjau et al (2012) who found that low employee‘s
capacity affects delivery of service quality to customers thus affecting service quality
perceptions, customer satisfaction and loyalty and tied successful recruitment and
retention of staff to empowerment of staff and recommended that staff be treated as full
partners in operation and given opportunities for advancement.
The study found out that employee behavior and attitudes in most hotels are influenced
through team buildings and guidance and counseling. Majority of hotels also used
mentorship programs, offering rewards and acknowledgement to influence staff behavior
and attitude. Punishment however was not seen as effective in influencing employee
behavior and attitude. Kattara, et al (2008) emphasized the effect of employees' behavior
on overall customer satisfaction regardless of customers' gender, nationality, and purpose
of visit, number of visits and length of stay. This study shows the hotel industry
recognizes this and that most hotels employ several ways of influencing employee
behavior including team building, issuing letters of commendation, coaching, mentorship
programs and offering rewards among others. In order to ensure that staff are well
behaved and have positive attitudes, it is important that the management listens to them
33
and involves them in strategy formulation so as to reduce resistance during strategy
implementation.
The study further found out that hotel employee cleanliness, attentiveness, presentation,
etiquette and listening skills are very important with regard to customer satisfaction
rating. Good ventilation, competitive prices charged and availability of DSTV and hot
water services are used by customers to measure the quality of services offered by hotels.
The findings agree with those of Sharma et al, (2011) that emphasized the importance of
the employee in providing services where customers continue to value person-to-person
contact in service delivery in hotels in Nairobi. Customers access service quality
primarily in terms of the personal support they receive from employees and the benefits
they get from such relationships. These benefits include personal recognition and friendly
interactions, and a sense of confidence and trust. This is seen in the high importance the
respondents placed on employee etiquette, listening and attentiveness in service delivery.
The study also found out that strategic location of the hotel, high level of general
cleanliness of the hotel, availability of taxi services, good room sizes, availability of well
equipped conference rooms and class of other customers using the facility are also among
the measures considered by customers in determining quality of services offered. This
encompasses the service environment which affects perceived service quality.
The study also found out that clear job descriptions and specifications, performing role
plays and clear organizational structure that defines working and reporting relationships
enable hotel managers to assign roles. Clear job descriptions ensure that every staff is
aware of their roles hence eliminates chances of conflicts hence smooth running of
34
operations in the hotels. Mukherjee & Malhotra (2006) noted that role clarity plays a
critical role in explaining employee perceptions of service quality and indicated that
feedback, participation and team support significantly influence role clarity, which in turn
influences job satisfaction and organizational commitment. They had suggested use of an
internal marketing approach using the frontline employee's perspective but this is
applicable to all employees in the hotel industry. Further, from the study findings, there is
no significant difference between quality perception of managers and customers in the
hotel industry. This implies that the perception of the managers and the customers on the
quality of services in the hotels was the same and thus employee related factors affect
quality of service delivered in the hotels.
35
CHAPTER FIVE
SUMMARY, CONCLUSION AND RECOMMENDATION
5.1 Introduction
This study sought to establish the employee related factors in perceived service quality
and to determine the effect of the employee related factors on perceived service quality.
The findings, discussions, conclusion and recommendations are presented below.
5.2 Summary of Findings
The study findings established that less than 5% of the employees left their organizations
in the last one year as indicated by 63.3% of the respondents. Regarding motivators
applied by hotels, the study found out that salaries and allowances was categorized as
highest in enhancing employees‘ motivation with a rating of 80%. Personal development
initiatives like training, further education, fringe benefits like medical cover, bonuses,
paid for holidays and promotions/ demotions were categorized by respondents as medium
with percentages ranging between 41% and 69% while job security was categorized as
low with 33%.
On methods of influencing behavior the study findings showed that the respondents
categorized acknowledgement/letter of commendation as highly used at 83.3%, team
building, mentorship, programs, guidance and counseling and offering rewards as
medium ranging between 60 and 70% while punishment and coaching were categorized
as low as they fell below 60%.
36
On measurement of quality of services, the study findings showed that checking on
number of customer complaints was categorized as highly used by majority of the
respondents at 80%. Measurement of quality of services through conducting customer
satisfaction survey, targets setting, from exit interviews with customers, checking on the
number of customer complements and checking on repeat business by customers were
categorized as medium by the respondents at between 60-69% while measurement of
quality of services through setting dimensions was categorized as low by the
respondents. The study findings revealed that it was extremely true that repeat business
had been overwhelming, and that employees had reported positive response and reports
from customers they served. The findings further established that customers gave
feedback on services offered during a repeat visit. Use of feedback forms, telling
employees and writing to hotels were not commonly used to give feedback on quality of
service delivered. The study findings showed that hotels recorded positive customer
feedback.
On employee related issues, the study found that employee cleanliness was important as
shown by mean of 4.4071. The study findings further established that hotel employee
attentiveness, hotel employee presentation, hotel employee etiquette, and hotel employee
listening skills were very important with regard to customers rating as indicated by mean
of between 4-1 and 4.39. On the measure of the quality of services offered by hotels, the
study findings established that the measures that were considered very important by
customers include; well ventilation, competitive prices charged, availability of DSTV and
hot water services as indicated by means between 3.56 and 4.15. The study findings
further established that strategic location of the hotel, high level of general cleanliness of
37
the hotel, hotel employee listening skills, Availability of taxi services, good room sizes,
availability of well equipped conference rooms, and class of other customers using the
facility were very important considerations with their means ranging between 3.53 and
3.83. The study however established that availability of online booking services, Gym
services and hair saloons were less important as indicated by means of below 3.5. The
study findings established that majority of the respondents rated the quality of services in
the hotel they were in as better than others in the business as indicated by mean of 41.6%
while 44.2% of the respondents indicated that they gave feedback to the hotel on quality
of services through talking to the management.
The study found no significant difference between quality perception of managers and
those of customers. In addition, the study established that employees related factors had
an effect on perceived service quality in Hotels.
5.3 Conclusion
The employee related factors in perceived service quality in the studied hotels include
motivation, behaviour and attitudes, orientation and training and etiquette. The study
found out that majority of hotels conduct orientations before deploying staff and that
regular skills check and training for their staff are performed by hotels. However most of
the hotels did not conduct employee workshops and seminars. This study concludes that
salaries and allowances, personal development initiatives and fringe benefits greatly
enhance employees‘ motivation thereby positively affecting perceived service quality
while promotions/demotions affect perceived service quality only to a limited extent.
Staffs‘ behavior and attitudes in the hotels are influenced through team buildings,
38
guidance and counseling, mentorship programs and offering rewards and
acknowledgement. In order to ensure that staff are well behaved and have positive
attitudes, it is important that the management listens to them and involves them in
strategy formulation so as to reduce resistance during strategy implementation. The study
further concludes that hotel employee cleanliness, attentiveness, presentation, etiquette
and listening skills are very important with regard to customer satisfaction rating. The
study also concludes that high level of general cleanliness of the hotel is a measure
considered by customers in determining quality of services offered.
From the findings the study established that employee related factors are an important
element of perceived service quality in the hotels. Employee motivation plays an
important role in the kind of services delivered to customers. In addition, the study
concludes that role clarity, feedback participation, competitive pay, clear career path for
staffs, transparency in promotion, experience checking while recruiting employees,
salaries and allowances, personal development initiatives and Fringe benefits contribute
positively to perceived service quality. The study further concludes that the employees
related factors have effect on perceived service quality in Hotels.
The study further concludes that there is no significant difference between quality
perception of managers and customers in the hotel industry. This was based on the high
p-value obtained by comparing managers mean and customers‘ mean. This implies that
the perception of the managers and the customers on the quality of services in the hotels
was the same hence we accept the null hypothesis that there is no significant difference
between quality perception of managers and that of customers. The study also concludes
that employee related factors effect perceived service quality in Hotels.

39
5.4 Recommendations
The study established that employee factors play an important role in determining
perceived service quality for customers. Based on this, the study recommends that hotels
take employee related factors seriously if they are to deliver high quality services to their
customers.
The study further established that good remuneration, and clear job descriptions increased
employee performance. In addition, it reduced conflicts and motivated employees to
work hard for the satisfaction of the customer. This study therefore recommends that
hotels keep their staff motivated, have clear job descriptions, and remunerate them
competitively to keep their customers satisfied.
The study findings established that employees were moving out of the organizations in
search of better pay and generally better working environment. This study therefore
recommends that the management of the businesses should establish the reasons for
employees leaving their organizations and therefore come up with measures to stop this
trend.
5.5 Limitations and Suggestions for Further Studies
The study faced financial limitation where the researcher had limited funds to facilitate
comprehensive data collection and analysis. However, the researcher utilised the only
available funds to interview one manager per hotel. The study recommends interviewing
more than one manager per hotel in future to get divergent views.
Secondly the study was also faced with time constraint. The study also faced limitation in
terms of respondents‘ resistance to provide data fearing that the information requested
40
would be misused to outperform them. The researcher however carried with her an
introduction letter from the University of Nairobi to assure them that the data requested
would be used for academic purposes only.
The study could be limited by the biases of managers because of not wanting to report
negative information about their hotel hence the findings may not be very objective. The
study was also limited by the methods in that the study only used questionnaires and did
not engage in physical observation process to ascertain the situation as is.
This study concentrated on the employee factors and perceived service quality in the
hotel industry. However, employee factors make important element of any organization
as all processes are done using people. In order to allow for generalization of findings to
other industries, this study recommends that another study be conducted targeting all
sectors in Kenya. This will allow generalization of findings to the whole sector.
The study further recommends that further research be done in other counties like
Mombasa where there are beach hotels. This study further suggests that future study be
conducted on tour firms. Kenya is a country that relies heavily on tourism. As tourists
come, there are several factors that determine their experience while in the Country. This
will allow for improvement of services delivered to tourists in our hospitality industry
hence boost our Kenyan economy.
41
REFERENCES
Baum, T. (1996). Unskilled work and the hospitality industry: Myth or reality?
International Journal of hospitality Management. Vol 15 (3), 207-209.
Gagliano, K. B., & Hathcote, J. (1994). Customer expectations and perceptions of
service quality in Retail apparel Specialty Stores. Journal of Service
marketing. Vol 8. No. 1. pp. 60-69.
Gounaris S, & Boukis A, (2013). The roles of employee job satisfaction in
strengthening customer repurchase intentions, Journal of Services Marketing,
Vol. 27 Iss: 4, pp.322 – 333
Gray, B. & Boshoff, C. (2004). The Relationship between Service Quality, Customer
Satisfaction and Buying Intentions in the Private Hospital Industry. South
African, Journal of Business Management, Vol.35 (4), pp. 27-37.
Gržinić, J, (2007). Concepts of service quality measurement in hotel industry, Journal
of Tourism and hospitality management, Pg. 81-98
Gro¨nroos, C. (1990). Service Management and Marketing, Lexington Books,
Lexington, MA.
Gro¨nroos, C. (2001). The perceived service quality concept – a mistake? Managing
Service Quality, Vol. 11 No. 3, pp. 150-2.
Hanzaee K, Mirvaisi N., (2011). Implementing Gronroos Service Quality Model: The
Role of Image and Service Quality Perception on Customer Satisfaction in the
Iran Hotel Industry. Journal of Basic and Applied Scientific Research, PG 10-
20.
Hjalager, A. & Andersen,S.(2001). Tourism employment: contingent work or
professional career? Employee Relations. Vol 23 (2), pp115-129.
http://www.kpmg.com/2013/africabanking, accessed in August 2013
http://www.tourism.go.ke/ministry.nsf/2013/pages, accessed in August 2013
Hartline M.D & Jones K. C. (1996), Journal of Business Research, Vol. 35, Iss: 3,
Pgs.207-215
Irving, P. & Dickson, D. (2004). Empathy: towards a conceptual framework for
health professionals. International Journal of Health Care Quality Assurance,
Vol. 17 Nos. 4/5, pp. 212-20.
42
Kamau S. W & Waudo J. (2012). Hospitality industry employer‘s expectation of
employees‘ competences in Nairobi Hotels. Journal of Hospitality
Management and Tourism Vol. 3(4), pp. 55-63
Kimani, S. W., Kagira, E. K. & Kendi, L. (2011). Comparative analysis of business
students‘ perceptions of service quality offered in Kenyan Universities.
International Journal of Business Administration, Vol. 2(1), Pg 98-112.
Kimani, S. W., Kagira, E. K. & Kendi, L. (2012). Shoppers Perception of Retail
Service Quality: Supermarkets versus Small Convenience Shops (Dukas) In
Kenya. Journal of Management and Strategy Vol. 3, No. 1; 56 ISSN 1923-
3965 E-ISSN 1923-3973
Kimungu, S. I. & Maringa, P. M. (2010), An Assessment of the Impact of Employee
Turnover on Customer Service and Competitiveness of an Establishment,
International Research Symposium in Service Management 1694-0938
Kuria S., Wanderi, P & Ondigi A (2011). Factors Influencing Labour Turnover in
three and five star-rated Hotels in Nairobi, Kenya, International Journal of
Humanities and Social Science vol. 1 no. 20;
Mukherjee A. & Malhotra, N (2006). Does role clarity explain employee-perceived
service quality? A study of antecedents and consequences in call centers,
International Journal of Service Industry Management, Vol. 17 Iss: 5, pp.444
– 473
Mugenda, O and Mugenda, A. (2003).Research Methods, Quantitative and
Qualitative Approaches .Nairobi: Acts Press.
Naylor, G.. & Frank, K. E. (2000). The impacts of retail sales force responsiveness on
consumers‘ perception of Value. Journal of Service Marketing. Vol 14. No. 4.
pp. 310-322.
Parasuraman, A., Zeithaml, V.A. and Berry, L.L. (1985). A conceptual model of
service quality and its implications for future research, Journal of Marketing,
49, Fall, 41-50.
Parasuraman, A., Zeithaml, V.A. and Berry, L.L. (1988). Communication and control
processes in the delivery of service quality, Journal of Marketing, 52(2):35-
48.
43
Parasuraman, A., Zeithaml, V.A. and Berry, L.L. (1994). Reassessment of
expectations as a comparison standard in measuring service quality:
implications for further research, Journal of Marketing, 58(1):111-24.
Rust R. T, Zahorik A. J. & Keiningham T. L. (1995). Return on Quality (ROQ):
Making Service Quality Financially Accountable. Journal of Marketing, Vol
59. Pg 58–70
Rust R.T, Danaher, P.J. & Sajeev. (2000).Using Service Quality Data for Competitive
Marketing Decisions. International Journal of services Industry Management.
Vol.11 No.5 pp. 438-469.
Rust, R. T. & Tuck S C (2006). „Marketing models of service and relationships
Marketing. Journal of Social Science, Vol. 25,(6), pp. 560–580.
Sharma K R, Goel K R & Pradesh, G U (2011). Service Quality Assessment in
Insurance Sector: A Comparative Study between Indian and Chinese
Customers. Research Journal of Finance and Accounting ISSN 2222-1697
(Paper) ISSN 2222-2847 Vol 2, No 5
Schoenbaum, K. S. Davis, S. C. Collins, K. Tenney, D. L. Hughes, & A. J. Audet,
(2002). Room for Improvement: Patients Report on the Quality of Their
Health Care, The Commonwealth Fund. Vol. 45, pp. 300-40.
Shaw, D., & Haynes, B. (2004). An Evaluation of consumer Perception of FM service
delivery. Journal of Facilities.Vol.22. No. 7/8. pp.170-177.
Taylor, S. (2002). People and Organization Employee Resourcing. Prentice-Hall,
Sidney; Australia.
Wanjau K N, Muiruri B. W. & Ayodo E. (2012). Factors Affecting Provision of
Service Quality in the Public Health Sector: A Case of Kenyatta National
Hospital, International Journal of Humanities and Social Science Vol. 2 No.
13; July
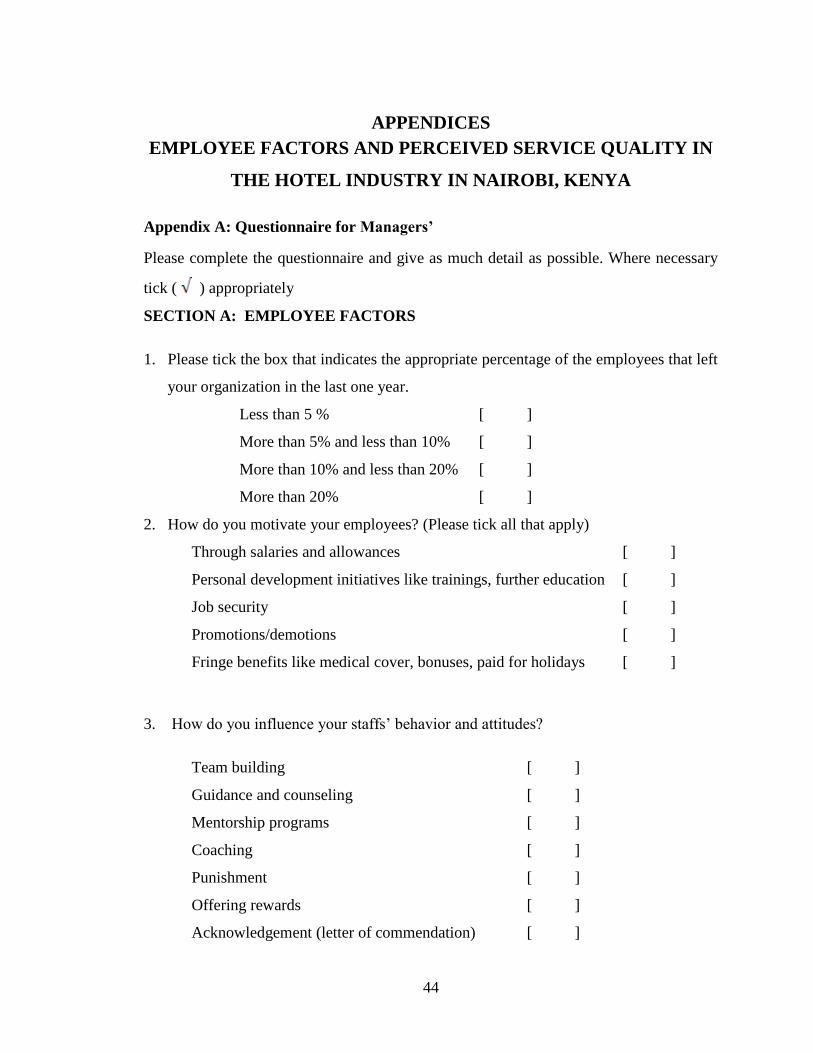
44
APPENDICES
EMPLOYEE FACTORS AND PERCEIVED SERVICE QUALITY IN
THE HOTEL INDUSTRY IN NAIROBI, KENYA
Appendix A: Questionnaire for Managers’
Please complete the questionnaire and give as much detail as possible. Where necessary
tick ( ) appropriately
SECTION A: EMPLOYEE FACTORS
1. Please tick the box that indicates the appropriate percentage of the employees that left
your organization in the last one year.
Less than 5 % [ ]
More than 5% and less than 10% [ ]
More than 10% and less than 20% [ ]
More than 20% [ ]
2. How do you motivate your employees? (Please tick all that apply)
Through salaries and allowances [ ]
Personal development initiatives like trainings, further education [ ]
Job security [ ]
Promotions/demotions [ ]
Fringe benefits like medical cover, bonuses, paid for holidays [ ]
3. How do you influence your staffs‘ behavior and attitudes?
Team building [ ]
Guidance and counseling [ ]
Mentorship programs [ ]
Coaching [ ]
Punishment [ ]
Offering rewards [ ]
Acknowledgement (letter of commendation) [ ]
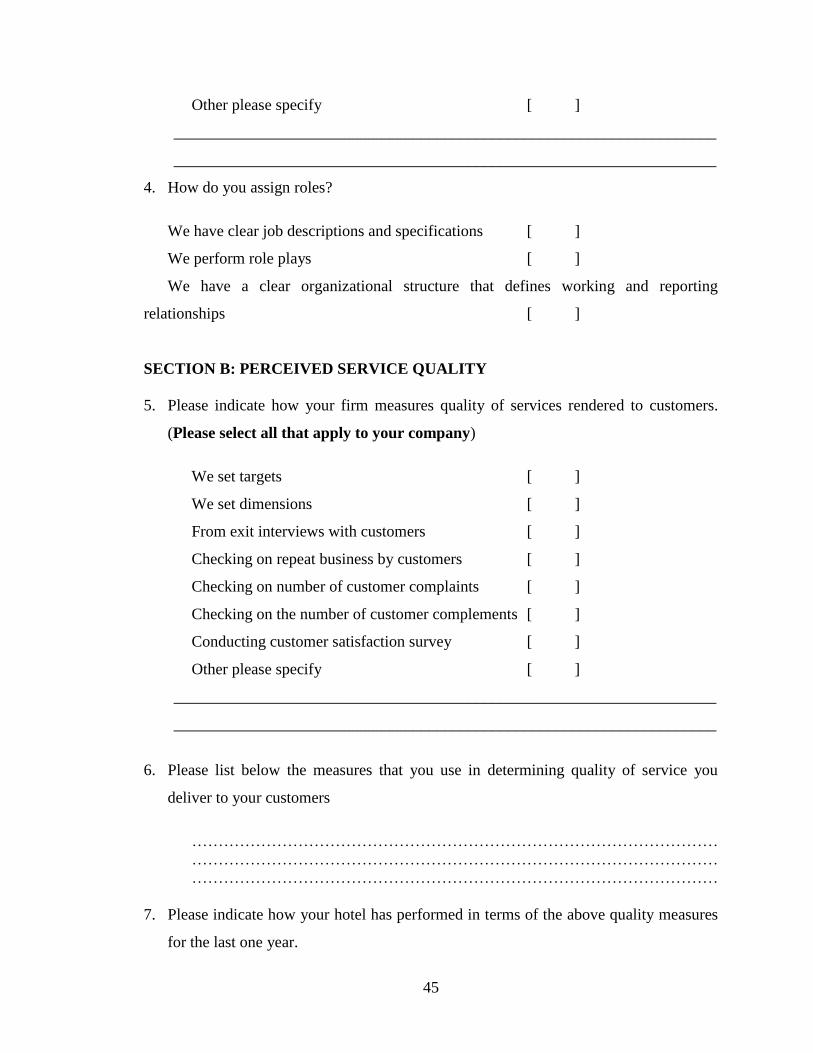
45
Other please specify [ ]
____________________________________________________________________
____________________________________________________________________
4. How do you assign roles?
We have clear job descriptions and specifications [ ]
We perform role plays [ ]
We have a clear organizational structure that defines working and reporting
relationships [ ]
SECTION B: PERCEIVED SERVICE QUALITY
5. Please indicate how your firm measures quality of services rendered to customers.
(Please select all that apply to your company)
We set targets [ ]
We set dimensions [ ]
From exit interviews with customers [ ]
Checking on repeat business by customers [ ]
Checking on number of customer complaints [ ]
Checking on the number of customer complements [ ]
Conducting customer satisfaction survey [ ]
Other please specify [ ]
____________________________________________________________________
____________________________________________________________________
6. Please list below the measures that you use in determining quality of service you
deliver to your customers
………………………………………………………………………………………
………………………………………………………………………………………
………………………………………………………………………………………
7. Please indicate how your hotel has performed in terms of the above quality measures
for the last one year.
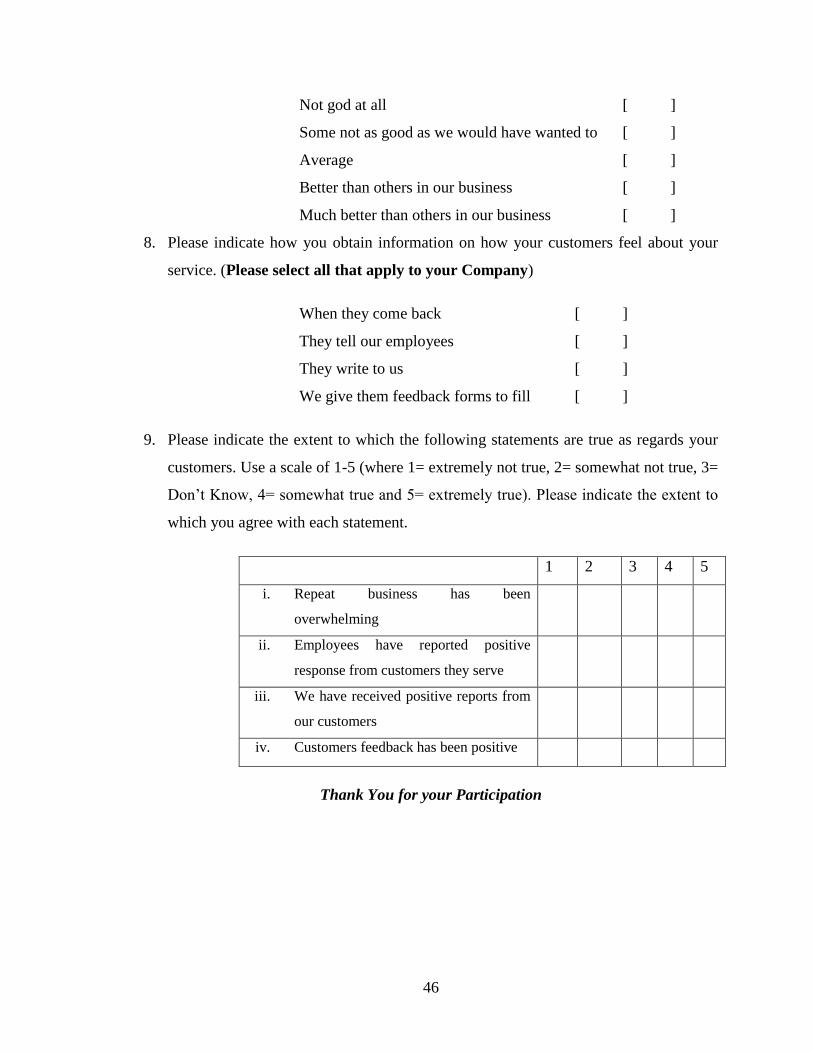
46
Not god at all [ ]
Some not as good as we would have wanted to [ ]
Average [ ]
Better than others in our business [ ]
Much better than others in our business [ ]
8. Please indicate how you obtain information on how your customers feel about your
service. (Please select all that apply to your Company)
When they come back [ ]
They tell our employees [ ]
They write to us [ ]
We give them feedback forms to fill [ ]
9. Please indicate the extent to which the following statements are true as regards your
customers. Use a scale of 1-5 (where 1= extremely not true, 2= somewhat not true, 3=
Don‘t Know, 4= somewhat true and 5= extremely true). Please indicate the extent to
which you agree with each statement.
1 2 3 4 5
i. Repeat business has been
overwhelming
ii. Employees have reported positive
response from customers they serve
iii. We have received positive reports from
our customers
iv. Customers feedback has been positive
Thank You for your Participation
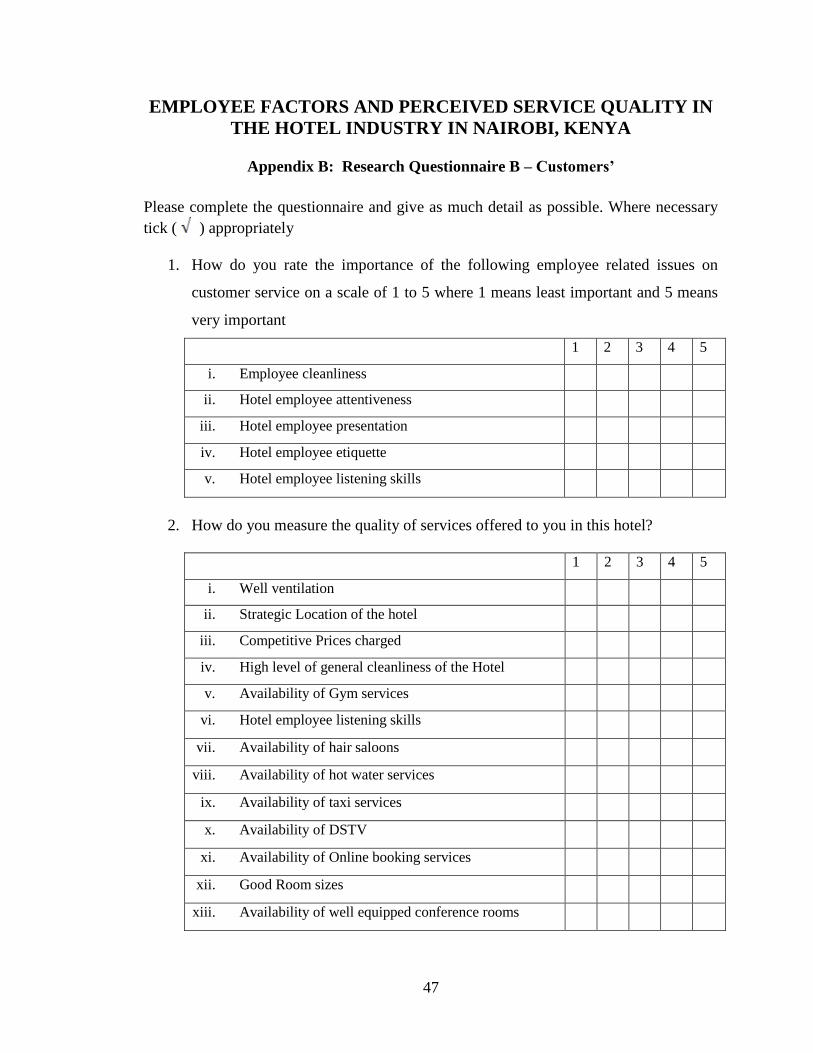
47
EMPLOYEE FACTORS AND PERCEIVED SERVICE QUALITY IN
THE HOTEL INDUSTRY IN NAIROBI, KENYA
Appendix B: Research Questionnaire B – Customers’
Please complete the questionnaire and give as much detail as possible. Where necessary
tick ( ) appropriately
1. How do you rate the importance of the following employee related issues on
customer service on a scale of 1 to 5 where 1 means least important and 5 means
very important
1 2 3 4 5
i. Employee cleanliness
ii. Hotel employee attentiveness
iii. Hotel employee presentation
iv. Hotel employee etiquette
v. Hotel employee listening skills
2. How do you measure the quality of services offered to you in this hotel?
1 2 3 4 5
i. Well ventilation
ii. Strategic Location of the hotel
iii. Competitive Prices charged
iv. High level of general cleanliness of the Hotel
v. Availability of Gym services
vi. Hotel employee listening skills
vii. Availability of hair saloons
viii. Availability of hot water services
ix. Availability of taxi services
x. Availability of DSTV
xi. Availability of Online booking services
xii. Good Room sizes
xiii. Availability of well equipped conference rooms
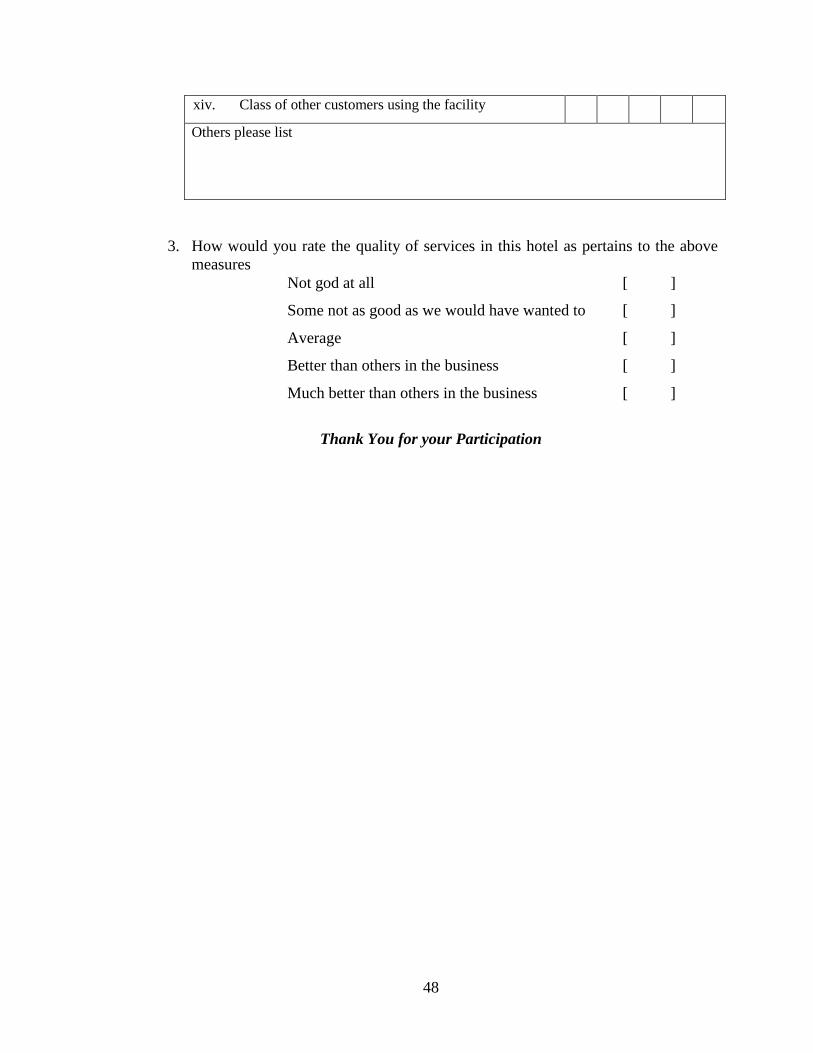
48
xiv. Class of other customers using the facility
Others please list
3. How would you rate the quality of services in this hotel as pertains to the above
measures
Not god at all [ ]
Some not as good as we would have wanted to [ ]
Average [ ]
Better than others in the business [ ]
Much better than others in the business [ ]
Thank You for your Participation