& EMPLOYEE ENGAGEMENT -...
12
By John Davies VP Senior Analyst, GreenBiz The State of The Art & EMPLOYEE ENGAGEMENT SUSTAINABILITY September 2014
Transcript of & EMPLOYEE ENGAGEMENT -...
By John DaviesVP Senior Analyst, GreenBiz
The State of The Art& EMPLOYEE ENGAGEMENTSUSTAINABILITY
September 2014
2
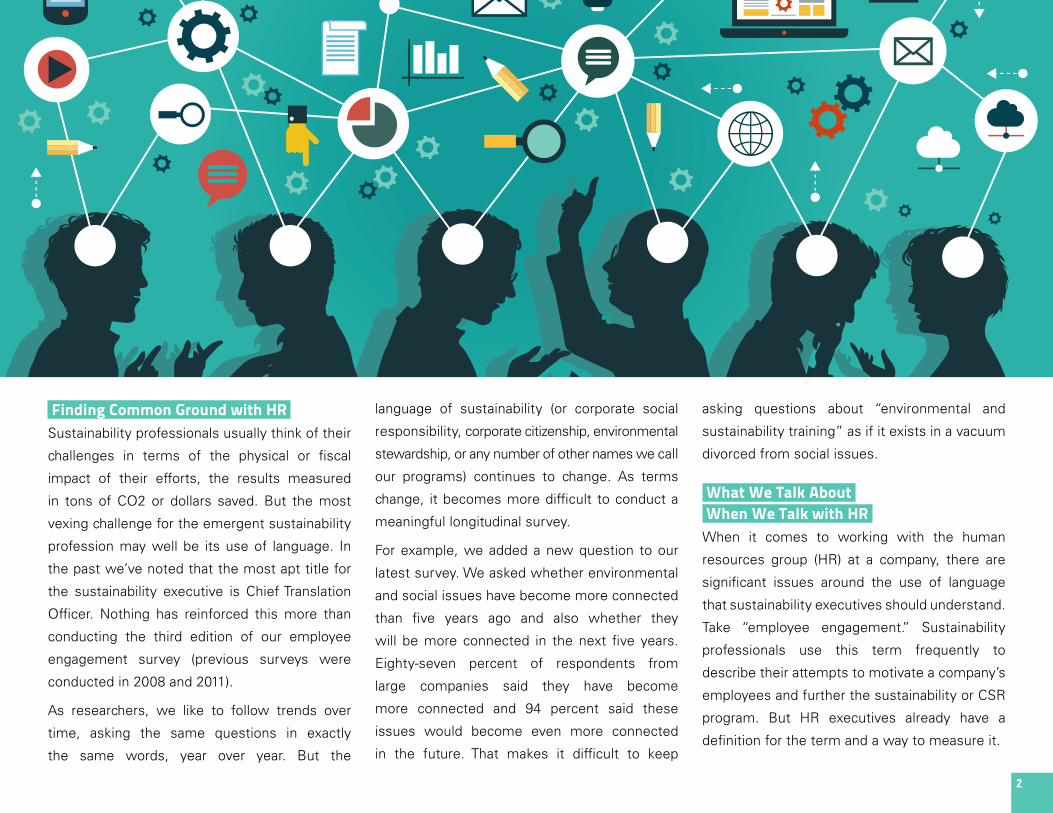
Finding Common Ground with HR Sustainability professionals usually think of their
challenges in terms of the physical or fiscal
impact of their efforts, the results measured
in tons of CO2 or dollars saved. But the most
vexing challenge for the emergent sustainability
profession may well be its use of language. In
the past we’ve noted that the most apt title for
the sustainability executive is Chief Translation
Officer. Nothing has reinforced this more than
conducting the third edition of our employee
engagement survey (previous surveys were
conducted in 2008 and 2011).
As researchers, we like to follow trends over
time, asking the same questions in exactly
the same words, year over year. But the
language of sustainability (or corporate social
responsibility, corporate citizenship, environmental
stewardship, or any number of other names we call
our programs) continues to change. As terms
change, it becomes more difficult to conduct a
meaningful longitudinal survey.
For example, we added a new question to our
latest survey. We asked whether environmental
and social issues have become more connected
than five years ago and also whether they
will be more connected in the next five years.
Eighty-seven percent of respondents from
large companies said they have become
more connected and 94 percent said these
issues would become even more connected
in the future. That makes it difficult to keep
asking questions about “environmental and
sustainability training” as if it exists in a vacuum
divorced from social issues.
What We Talk About When We Talk with HR When it comes to working with the human
resources group (HR) at a company, there are
significant issues around the use of language
that sustainability executives should understand.
Take “employee engagement.” Sustainability
professionals use this term frequently to
describe their attempts to motivate a company’s
employees and further the sustainability or CSR
program. But HR executives already have a
definition for the term and a way to measure it.
3
saw in our recent research was how those who
viewed their programs as “advanced” placed
much more emphasis on activities such as
“harnessing sustainability as a foundation for
innovation, new products, and new markets” than
those who identified as “beginners” (63 percent
to 37 percent respectively). A slightly smaller
but still significant gap exists when it comes to
providing job-specific sustainability information
(45 percent to 28 percent respectively).
As sustainability programs evolve and companies
make greater commitments, they will need to
shift from general education to more formalized
training, and the HR team are best suited to
support those efforts.
Partnering with HR One of the more disconcerting results from our
survey is the lack of involvement of the HR group
in a large majority of corporate sustainability
efforts. When we asked which department was
primarily responsible for employee sustainability
education, only 1 percent of large and mid-
CSR professional who noted that he ran into
resistance when he met with HR to talk about
how to improve employee engagement efforts
at the firm. After several frustrating encounters,
he changed the conversation to talk about how
they could increase the participation numbers
in the company’s sustainability programs.
Reframing the language and understanding how
HR used certain terms broke down the barriers
that had prevented them from working together
effectively. When the conversation comes
around to engaging employees, they now talk
about “participation rates.”
From Education to Training Another potential language gap happens when
sustainability and HR professionals discuss how
to enlist employees in furthering the sustainability
mission. In our research, almost three-fourths
of respondents (73 percent) indicate that their
company is educating employees across the
organization about its corporate sustainability
goals. And yet, in a recent study by The
Conference Board, only 5 percent of the S&P
500 have instituted employee CSR training.
This disconnect offers another opportunity to
sit down with HR — in this case, to discuss the
differences between “education” and “training,”
and where the company should focus its efforts.
Education tends to refer to broader and more
general learning activities whereas training is
more skills based. One of the differences we
HR sees engagement as the employee’s
willingness to apply discretionary effort toward
meeting the company’s goals, to do more than
merely meet job requirements and customer
needs. It is typically measured via an index
approach using employee answers to survey
questions, such as whether an employee would
recommend the company as a great place
to work or how proud they are to work at the
company.
Many who work in the sustainability profession
measure engagement by employee activity in
extracurricular programs, with the hope that
this participation has an effect, either causal
or correlative, on the larger measurement of
employee engagement. We interviewed one
“According to The Conference Board, only 5% of the S&P 500 do employee CSR training.”
4
sized companies said that HR was leading the
efforts. The same percentage held when we
asked which department championed corporate
sustainability education efforts.
Failing to partner with HR for sustainability
education and training or to increase
participation in other aspects of a well-rounded
sustainability program is a missed opportunity.
Finding a common language to discuss how to
fix this is imperative. Wharton finance professor
Alex Edmans evaluated the stock performance
of organizations named to Fortune’s “Best
Companies to Work For.” He determined that
companies making the list from 1984 to 2009
outperformed peers by 2 to 3 percent per year.
Other research by the Corporate Executive Board
found that employees most committed to their
organizations put in 57 percent more effort on
the job — and are 87 percent less likely to resign
— than employees who consider themselves
disengaged.
Sustainability is only one of many topics identified
by HR professionals as important for employee
attraction and retention. It sits lower on the
list than compensation, healthcare, and other
benefits. That means it’s up to the sustainability
professional to work with HR on their terms
and let them help measure participation in the
company’s sustainability program and connect the
dots to improving overall employee engagement.
Employee Engagement Survey Results The GreenBiz Group Employee Engagement survey, conducted in March 2014, examines aspects
of corporate environmental and sustainability education initiatives at companies at varying stages
of program development. This survey builds on the GreenBiz Group and National Environmental
Education Foundation (NEEF) 2008 and 2011 survey findings featured in “The Engaged Organization”
and “Toward Engagement 2.0” and provides a quantitative understanding of the evolution of employee
engagement.
What’s New and Interesting Since the Last Survey
• “Sustainability” remains the established phrase to describe a company’s environmental sustainability initiatives. “Greening” for many years was the second-most-used term but is now almost the least used to describe these initiatives.
• Social and environmental activities converge. As companies begin to address more complex supply-chain issues, those surveyed see environmental and social issues becoming more connected.
• Has sustainability knowledge become less important or have we “arrived”? In large companies, those surveyed see less of an increase in the value placed on a job candidate’s sustainability knowledge than in years past, while mid-sized and small companies still see this as increasing.
• Organizations with “advanced” programs are focused on operationalizing their initiatives. Greening the supply chain and harnessing sustainability as a foundation for innovation, new products, and new markets are seen as competitive differentiators.
• Education methods focus on personal interaction. In 2008, consultants and online training modules led the way. This year, more organizations are focusing on green teams and employee networks.
• The biggest hurdles cited by beginners are the key factors for an advanced program’s success. Beginners cited executive commitment, education, and communications as the biggest hurdles to moving their sustainability programs forward, while those with more advanced programs cited those very same factors as key to their success.
5
Participant Overview The GreenBiz Employee Engagement survey
participants were recruited from the GreenBiz
Group’s GreenBuzz mailing list, which has a
broad audience. Participants represent a diverse
range of industry sectors. There were 1,334 sur-
vey respondents, with approximately 34 percent
from small companies (fewer than 99 employ-
ees), 40 percent from medium-size companies
(100 to 9,999 employees) and 26 percent from
large companies (more than 10,000 employees).
The results represent a purposeful sample of
those interested in business and environmental
issues. Respondents were a mix of mainstream,
environmentally progressive large companies
and smaller, self-identified “green” companies.
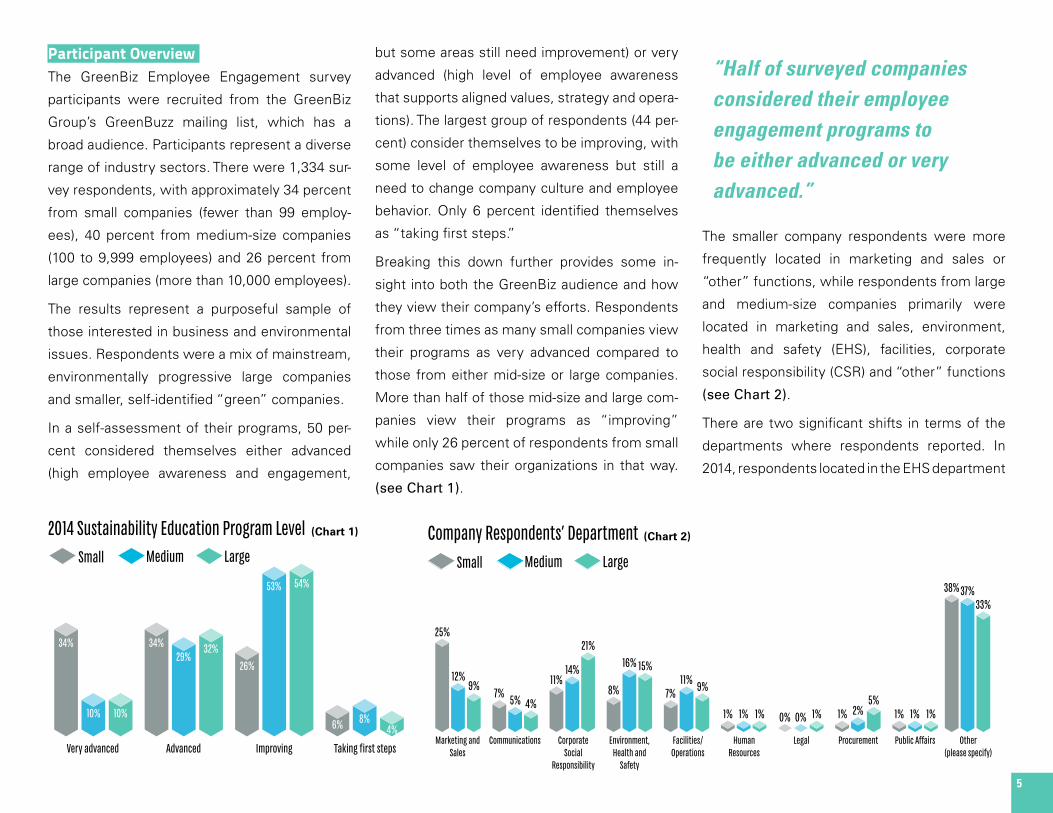
In a self-assessment of their programs, 50 per-
cent considered themselves either advanced
(high employee awareness and engagement,
but some areas still need improvement) or very
advanced (high level of employee awareness
that supports aligned values, strategy and opera-
tions). The largest group of respondents (44 per-
cent) consider themselves to be improving, with
some level of employee awareness but still a
need to change company culture and employee
behavior. Only 6 percent identified themselves
as “taking first steps.”
Breaking this down further provides some in-
sight into both the GreenBiz audience and how
they view their company’s efforts. Respondents
from three times as many small companies view
their programs as very advanced compared to
those from either mid-size or large companies.
More than half of those mid-size and large com-
panies view their programs as “improving”
while only 26 percent of respondents from small
companies saw their organizations in that way.
(see Chart 1).
2014 Sustainability Education Program Level
340
=
100 =
100 =
340
=
290
=
320
=
260
=
530
=
540
=
60 = 80 =
40 =
Very advanced Advanced Improving Taking fi rst steps
34%
10% 10%
34%29%
32%26%
53% 54%
6% 8%4%
Small Medium Large
The smaller company respondents were more
frequently located in marketing and sales or
“other” functions, while respondents from large
and medium-size companies primarily were
located in marketing and sales, environment,
health and safety (EHS), facilities, corporate
social responsibility (CSR) and “other” functions
(see Chart 2).
There are two significant shifts in terms of the
departments where respondents reported. In
2014, respondents located in the EHS department
Company Respondents’ Department
500
=
240
=
180 =
140 =
100 =
80 =
220
=
280
=
420
=
160 =
320
=
300
=
140 =
220
=
180 =
20 = 20 = 20 = 00 = 00= 20 = 20 = 40 = 100 =
20 = 20 = 20 = 760
=
740
=
660
=
Marketing and Sales
Communications Corporate Social
Responsibility
Environment, Health and
Safety
Facilities/Operations
Human Resources
Legal Procurement Public Affairs Other (please specify)
25%
12%9%
7% 5% 4%
11%14%
21%
8%
16% 15%
7%11% 9%
1% 1% 1% 0% 0% 1% 1% 2%5%
1% 1% 1%
38%37%33%
Small Medium Large
(Chart 1) (Chart 2)2014 Sustainability Education Program LevelSmall Medium Large
Company Respondents’ Department
“Half of surveyed companies considered their employee engagement programs to be either advanced or very advanced.”
Small Medium Large
6
Company Respondents’ Title
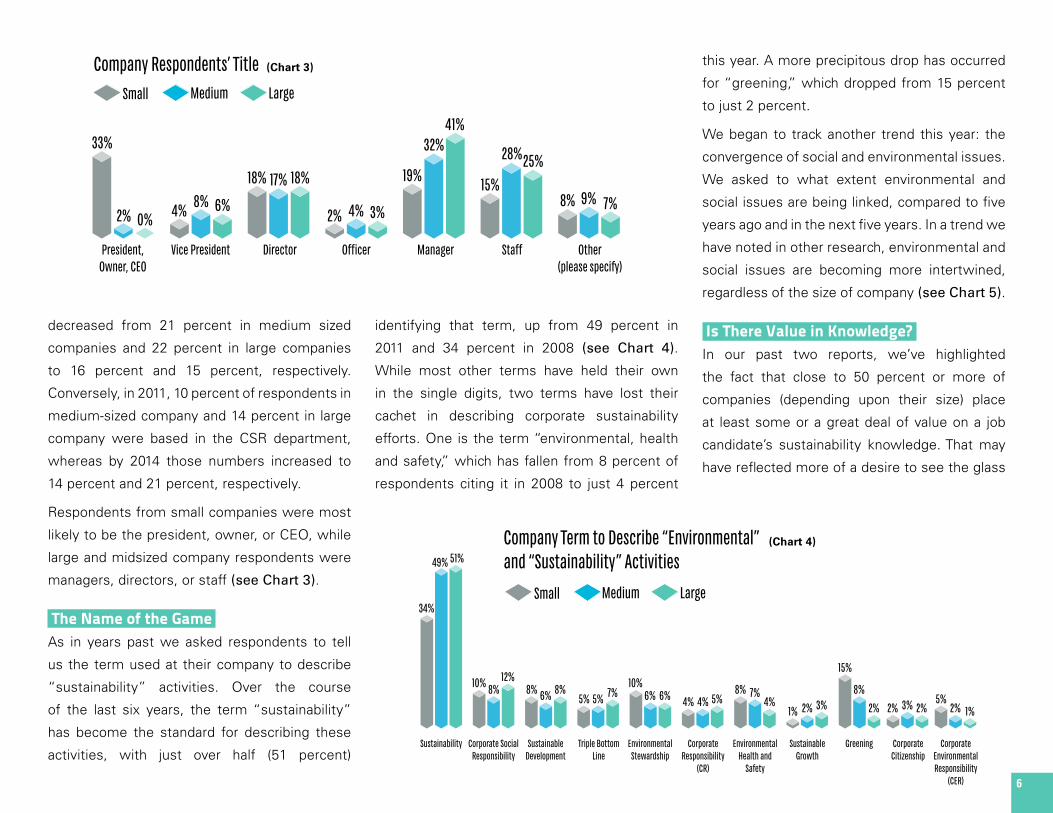
decreased from 21 percent in medium sized
companies and 22 percent in large companies
to 16 percent and 15 percent, respectively.
Conversely, in 2011, 10 percent of respondents in
medium-sized company and 14 percent in large
company were based in the CSR department,
whereas by 2014 those numbers increased to
14 percent and 21 percent, respectively.
Respondents from small companies were most
likely to be the president, owner, or CEO, while
large and midsized company respondents were
managers, directors, or staff (see Chart 3).
The Name of the Game As in years past we asked respondents to tell
us the term used at their company to describe
“sustainability” activities. Over the course
of the last six years, the term “sustainability”
has become the standard for describing these
activities, with just over half (51 percent)
Company Respondents’ Title
330
=
20 = 00= 40 = 80 =
60 = 180 =
170 =
180 =
20 = 40 = 30 = 190 =
320
=
410
=
150 =
280
=
250
=
80 =
90 =
70 =
President, Owner, CEO
Vice President Director Offi cer Manager Staff Other (please specify)
33%
2% 0% 4% 8% 6%
18% 17% 18%
2% 4% 3%
19%
32%41%
15%
28%25%
8% 9% 7%
Small Medium Largeidentifying that term, up from 49 percent in
2011 and 34 percent in 2008 (see Chart 4).
While most other terms have held their own
in the single digits, two terms have lost their
cachet in describing corporate sustainability
efforts. One is the term “environmental, health
and safety,” which has fallen from 8 percent of
respondents citing it in 2008 to just 4 percent
this year. A more precipitous drop has occurred
for “greening,” which dropped from 15 percent
to just 2 percent.
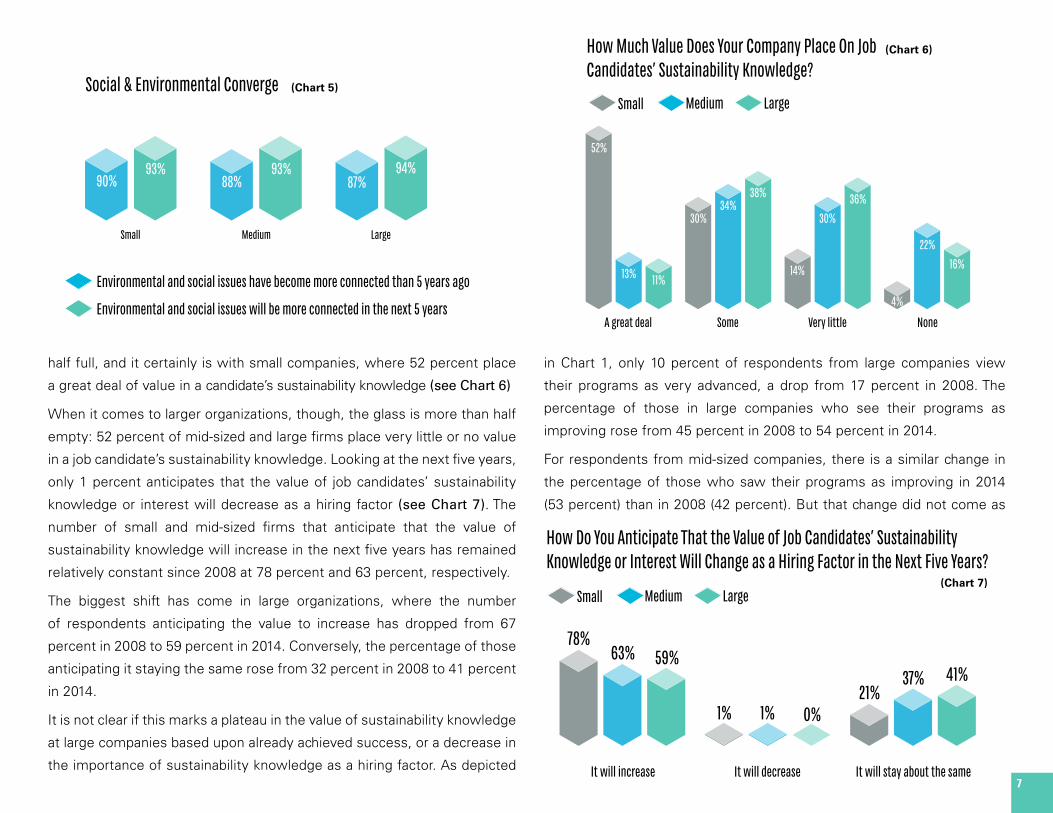
We began to track another trend this year: the
convergence of social and environmental issues.
We asked to what extent environmental and
social issues are being linked, compared to five
years ago and in the next five years. In a trend we
have noted in other research, environmental and
social issues are becoming more intertwined,
regardless of the size of company (see Chart 5).
Is There Value in Knowledge? In our past two reports, we’ve highlighted
the fact that close to 50 percent or more of
companies (depending upon their size) place
at least some or a great deal of value on a job
candidate’s sustainability knowledge. That may
have reflected more of a desire to see the glass
Company term to describe “environmental” and “sustainability” activities
680
=
980
=
1,00
=200
=160
=240
=160
=120
=160
=100
=100
=140
=200
=120
=120
=80
=80
=100
=160
=140
=80
=20 = 40 = 60 = 300
=160
=40 = 40 = 60 = 40 = 100
=40 = 20 =
Sustainability Corporate Social Responsibility
Sustainable Development
Triple BottomLine
EnvironmentalStewardship
CorporateResponsibility
(CR)
Environmental Health and
Safety
Sustainable Growth
Greening CorporateEnvironmentalResponsibility
(CER)
34%
49% 51%
10% 8%12%
8% 6% 8%5% 6%
10%
4% 5%4%8% 7%
4%1% 2% 3%
15%
8%
2% 2% 3% 2%5%
2% 1%
CorporateCitizenship
5% 7% 6%
Small Medium Large
(Chart 3)
(Chart 4)Company Term to Describe “Environmental” and “Sustainability” Activities
Small Medium Large
Small Medium Large
7
Social & Environmental Converge90
=113
=88
=113
=87
=114
=
Small Medium Large
90%93%
87%88%94%93%
Environmental and social issues have become more connected than 5 years ago
Environmental and social issues will be more connected in the next 5 years
How much value does your company place on jobcandidates’ sustainability knowledge?
520
=
130 =
110 =
300
=
340
=
380
=
140 =
300
=
360
=
40 = 220
=
160 =
A great deal Some Very little None
52%
13% 11%
30%34%
38%
14%
30%36%
4%
22%16%
Small Medium Largehalf full, and it certainly is with small companies, where 52 percent place
a great deal of value in a candidate’s sustainability knowledge (see Chart 6)
When it comes to larger organizations, though, the glass is more than half
empty: 52 percent of mid-sized and large firms place very little or no value
in a job candidate’s sustainability knowledge. Looking at the next five years,
only 1 percent anticipates that the value of job candidates’ sustainability
knowledge or interest will decrease as a hiring factor (see Chart 7). The
number of small and mid-sized firms that anticipate that the value of
sustainability knowledge will increase in the next five years has remained
relatively constant since 2008 at 78 percent and 63 percent, respectively.
The biggest shift has come in large organizations, where the number
of respondents anticipating the value to increase has dropped from 67
percent in 2008 to 59 percent in 2014. Conversely, the percentage of those
anticipating it staying the same rose from 32 percent in 2008 to 41 percent
in 2014.
It is not clear if this marks a plateau in the value of sustainability knowledge
at large companies based upon already achieved success, or a decrease in
the importance of sustainability knowledge as a hiring factor. As depicted
(Chart 5)
(Chart 6)
in Chart 1, only 10 percent of respondents from large companies view
their programs as very advanced, a drop from 17 percent in 2008. The
percentage of those in large companies who see their programs as
improving rose from 45 percent in 2008 to 54 percent in 2014.
For respondents from mid-sized companies, there is a similar change in
the percentage of those who saw their programs as improving in 2014
(53 percent) than in 2008 (42 percent). But that change did not come as
How do you anticipate that the value of job candidates’ sustainability knowledge or interest will change as a hiring
factor in the next fi ve years?156
=126
=118
=2= 2= 0= 42 = 74
=82
=
78%63% 59%
1% 0%21%
37%
It will increase It will decrease It will stay about the same
Small Medium Large
41%
1%
(Chart 7)
Social & Environmental Converge
Environmental and social issues have become more connected than 5 years ago
Environmental and social issues will be more connected in the next 5 years
How Much Value Does Your Company Place On JobCandidates’ Sustainability Knowledge?
How Do You Anticipate That the Value of Job Candidates’ Sustainability Knowledge or Interest Will Change as a Hiring Factor in the Next Five Years?
Small Medium Large
Small Medium Large
the result of any change in those viewing themselves as very advanced
and in some ways benefitted from a decrease in those taking first steps
from 13 percent in 2008 to 8 percent in 2014.
Anecdotally, we are often asked by both students and professionals
how to get a job in corporate sustainability. Our answer is that
candidates should scour a prospective employer’s web site and read
the sustainability report (if there is one) to determine whether and how
much the company values sustainability. The applicant may not get that
“sustainability” job, but at least he or she will know that they’re dealing
with a company that shares their values. They may also find out what
parts of the company are most engaged in the sustainability agenda
and find jobs there that connect to their passion.
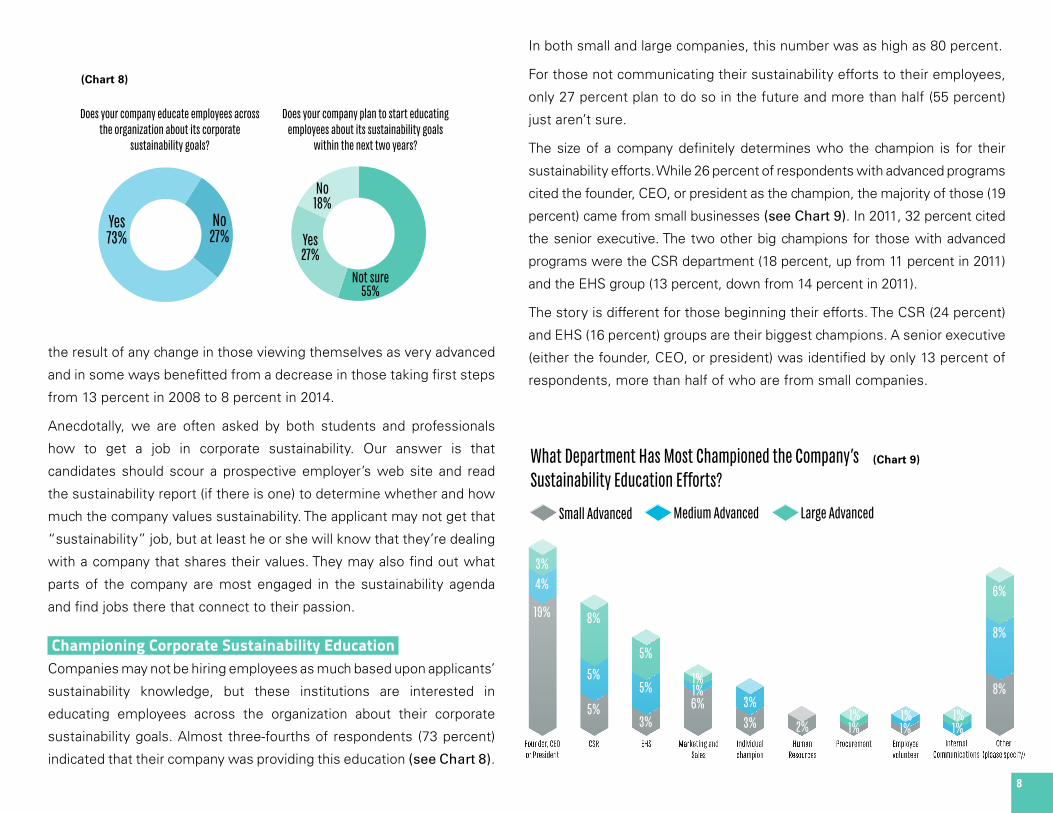
Championing Corporate Sustainability Education Companies may not be hiring employees as much based upon applicants’
sustainability knowledge, but these institutions are interested in
educating employees across the organization about their corporate
sustainability goals. Almost three-fourths of respondents (73 percent)
indicated that their company was providing this education (see Chart 8).
8
� �� � No27%
Yes73% � �� �� �
Does your company educate employees across the organization about its corporate
sustainability goals?
Does your company plan to start educating employees about its sustainability goals
within the next two years?
No18%
Yes27%
Not sure55%
In both small and large companies, this number was as high as 80 percent.
For those not communicating their sustainability efforts to their employees,
only 27 percent plan to do so in the future and more than half (55 percent)
just aren’t sure.
The size of a company definitely determines who the champion is for their
sustainability efforts. While 26 percent of respondents with advanced programs
cited the founder, CEO, or president as the champion, the majority of those (19
percent) came from small businesses (see Chart 9). In 2011, 32 percent cited
the senior executive. The two other big champions for those with advanced
programs were the CSR department (18 percent, up from 11 percent in 2011)
and the EHS group (13 percent, down from 14 percent in 2011).
The story is different for those beginning their efforts. The CSR (24 percent)
and EHS (16 percent) groups are their biggest champions. A senior executive
(either the founder, CEO, or president) was identified by only 13 percent of
respondents, more than half of who are from small companies.
What department has most championed the company’s sustainability education efforts?
Small Advanced Medium Advanced Large Advanced
380
+80
+60 =100
+100 +160
=60 +100
+100 =
120 +20 +20
=60 +60
=40 = 20 +00+20 = 20 +20 = 00+ 20 +20 = 160
+160
+120 =
Founder, CEO or President
CSR EHS Marketing and Sales
Individual champion
Human Resources
Procurement Employee volunteer
Internal Communications
Other (please specify)
3%4%
19% 8%
5%
5%
5%
5%
3%6%1%1%
3%3%
2%1%1%
1%1%
1%1%
6%
8%
8%
(Chart 8)
(Chart 9)What Department Has Most Championed the Company’s Sustainability Education Efforts?
Small Advanced Medium Advanced Large Advanced
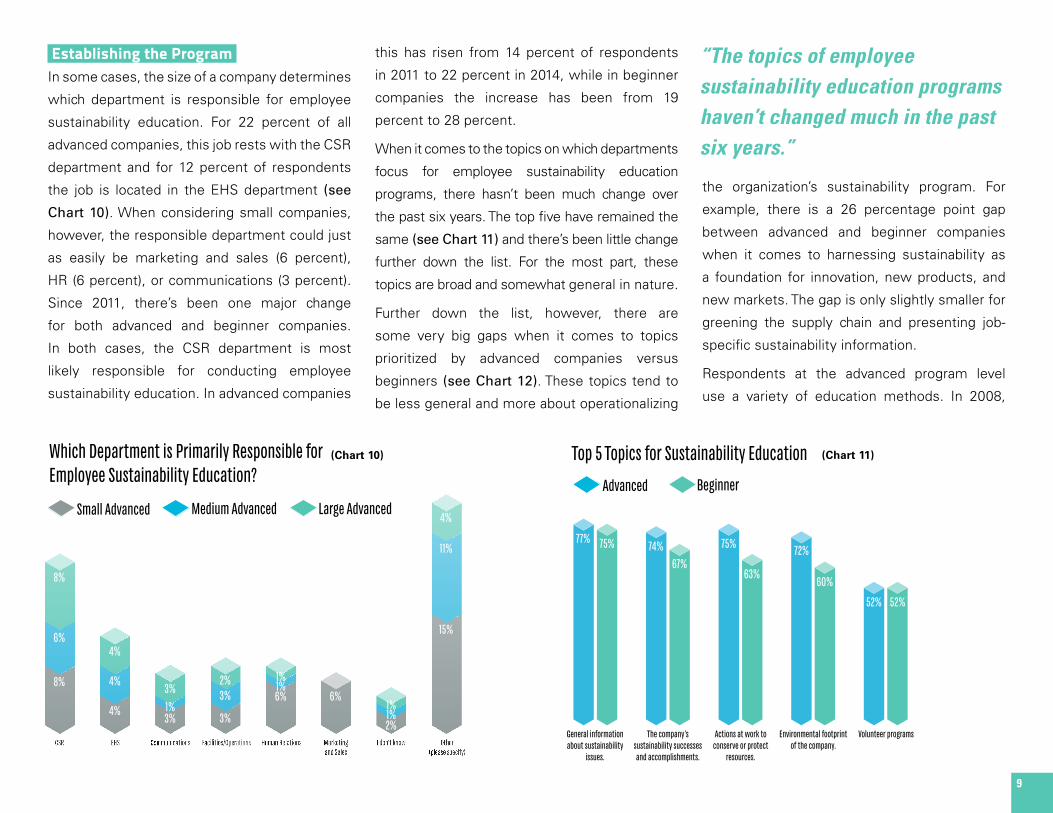
Establishing the Program In some cases, the size of a company determines
which department is responsible for employee
sustainability education. For 22 percent of all
advanced companies, this job rests with the CSR
department and for 12 percent of respondents
the job is located in the EHS department (see
Chart 10). When considering small companies,
however, the responsible department could just
as easily be marketing and sales (6 percent),
HR (6 percent), or communications (3 percent).
Since 2011, there’s been one major change
for both advanced and beginner companies.
In both cases, the CSR department is most
likely responsible for conducting employee
sustainability education. In advanced companies
this has risen from 14 percent of respondents
in 2011 to 22 percent in 2014, while in beginner
companies the increase has been from 19
percent to 28 percent.
When it comes to the topics on which departments
focus for employee sustainability education
programs, there hasn’t been much change over
the past six years. The top five have remained the
same (see Chart 11) and there’s been little change
further down the list. For the most part, these
topics are broad and somewhat general in nature.
Further down the list, however, there are
some very big gaps when it comes to topics
prioritized by advanced companies versus
beginners (see Chart 12). These topics tend to
be less general and more about operationalizing
9
Which department is primarily responsible for employee sustainability education?
Small Advanced Medium Advanced Large Advanced
160 +120
+160
=80
+80 +80
=60 +20
+60 =
60 +60 +40
=120
+20 +20 =
120 =
40 +20 +20 =
300
+220
+80 =
CSR EHS Communications Facilities/Operations Human Relations Marketing and Sales
I don’t know Other (please specify)
8%
5%
6%
8%
4%
4%
4%3%1%3%
2%3%
3%
1%1%6% 6%
1%1%2%
4%
11%
15%
(Chart 10)
Top 5 Topics for Sustainability Education
Advanced Beginner
770
=
750
=
740
=
670
=
750
=
630
=
720
=
600
=
520
=
520
=
General information about sustainability
issues.
The company’s sustainability successes and accomplishments.
Actions at work to conserve or protect
resources.
Environmental footprint of the company.
Volunteer programs
77% 75% 74%67%
75%
63%
72%
60%
52% 52%
(Chart 11)Which Department is Primarily Responsible for Employee Sustainability Education?
Small Advanced Medium Advanced Large Advanced
Top 5 Topics for Sustainability Education
Advanced Beginner
the organization’s sustainability program. For
example, there is a 26 percentage point gap
between advanced and beginner companies
when it comes to harnessing sustainability as
a foundation for innovation, new products, and
new markets. The gap is only slightly smaller for
greening the supply chain and presenting job-
specific sustainability information.
Respondents at the advanced program level
use a variety of education methods. In 2008,
“The topics of employee sustainability education programs haven’t changed much in the past six years.”
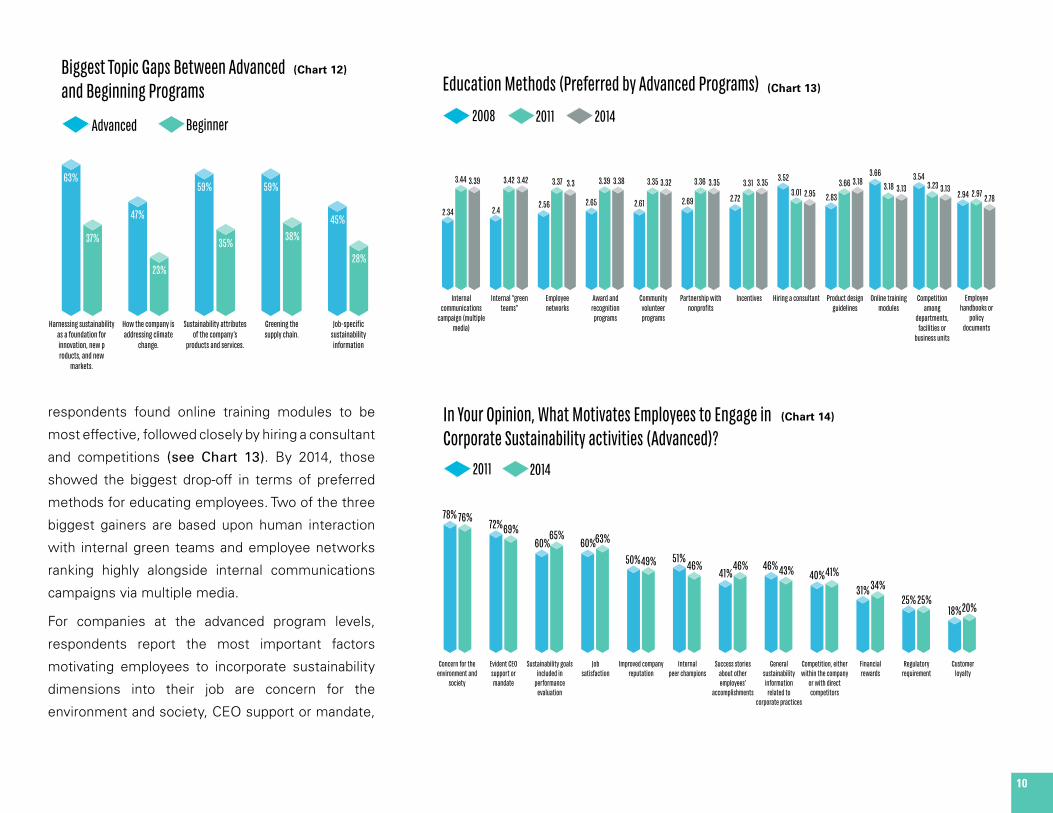
respondents found online training modules to be
most effective, followed closely by hiring a consultant
and competitions (see Chart 13). By 2014, those
showed the biggest drop-off in terms of preferred
methods for educating employees. Two of the three
biggest gainers are based upon human interaction
with internal green teams and employee networks
ranking highly alongside internal communications
campaigns via multiple media.
For companies at the advanced program levels,
respondents report the most important factors
motivating employees to incorporate sustainability
dimensions into their job are concern for the
environment and society, CEO support or mandate,
10
Biggest Topic Gaps Between Advancedand Beginning Programs
Advanced Beginner
630
=
370
=
470
=
230
=
590
=
350
=
590
=
380
=
450
=
280
=
Harnessing sustainability as a foundation for innovation, new products, and new
markets.
How the company is addressing climate
change.
Sustainability attributes of the company’s
products and services.
Greening the supply chain.
Job-specifi c sustainability information
63%
37%
47%
23%
59%
35%
59%
38%45%
28%
(Chart 12)
Education Methods (preferred by advanced programs)
468
=
688
=
678
=
480
=
684
=
684
=
512
=
674
=
660
=
530
=
678
=
676
=
522
=
670
=
664
=
538
=
672
=
670
=
554
=
662
=
670
=
704
=
602
=
590
=
566
=
664
=
674
=
732
=
636
=
626
=
708
=
646
=
626
=
588
=
594
=
556
=
Internal communications
campaign (multiple media)
2.34
20142008 2011
3.44 3.39
2.4
3.42 3.42
2.56
3.37 3.3
2.65
3.39 3.38
2.61
3.35 3.32
2.69
3.36 3.35
2.72
3.31 3.35 3.52
3.01 2.95 2.83
3.66 3.183.66
3.18 3.133.54
3.23 3.132.94 2.97 2.78
Internal “green teams”
Employee networks
Award and recognition
programs
Communityvolunteerprograms
Partnership withnonprofi ts
Incentives Hiring a consultant Product designguidelines
Online training modules
Competition among
departments,facilities or
business units
Employee handbooks or
policydocuments
(Chart 13)
In your opinion, what motivates employees to engage in corporate sustainability activities (advanced)?
2011 2014
780
=
760
=
720
=
690
=
600
=
650
=
600
=
630
=
500
=
490
=
510
=
460
=
410
=
460
=
460
=
430
=
400
=
410
=
310
=
340
=
250
=
250
=
180 =
200 =
Concern for the environment and
society
78% 76% 72%69%60%
65%60%63%
50%49% 51%46%
41%46% 46%43% 40%41%
31%34%25% 25%
18%20%
Evident CEOsupport ormandate
Sustainability goalsincluded in
performanceevaluation
Job satisfaction
Improved company reputation
Internalpeer champions
Success storiesabout otheremployees’
accomplishments
Generalsustainabilityinformation
related tocorporate practices
Competition, either within the company
or with directcompetitors
Financialrewards
Regulatory requirement
Customerloyalty
(Chart 14)
Biggest Topic Gaps Between Advancedand Beginning Programs
Advanced Beginner 20142008 2011
Education Methods (Preferred by Advanced Programs)
In Your Opinion, What Motivates Employees to Engage in Corporate Sustainability activities (Advanced)?
2011 2014
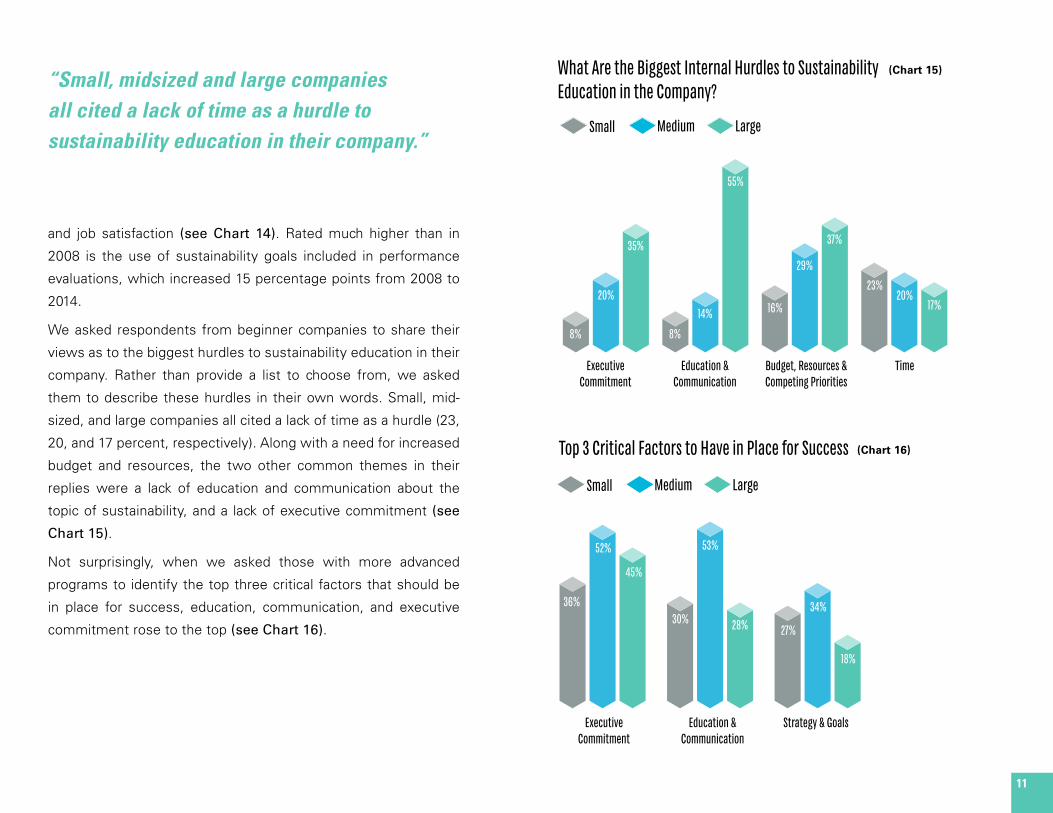
and job satisfaction (see Chart 14). Rated much higher than in
2008 is the use of sustainability goals included in performance
evaluations, which increased 15 percentage points from 2008 to
2014.
We asked respondents from beginner companies to share their
views as to the biggest hurdles to sustainability education in their
company. Rather than provide a list to choose from, we asked
them to describe these hurdles in their own words. Small, mid-
sized, and large companies all cited a lack of time as a hurdle (23,
20, and 17 percent, respectively). Along with a need for increased
budget and resources, the two other common themes in their
replies were a lack of education and communication about the
topic of sustainability, and a lack of executive commitment (see
Chart 15).
Not surprisingly, when we asked those with more advanced
programs to identify the top three critical factors that should be
in place for success, education, communication, and executive
commitment rose to the top (see Chart 16).
11
What are the biggest internal hurdles to sustainability education in the company?
80 =
200 =
350
=
80 =
140 =
550
=
160 =
290
=
370
=
230
=
200 =
170 =
Executive Commitment
8%
20%
35%
14%
55%
16%
29%
37%
23%20%
17%
Small Medium Large
8%
Education & Communication
Budget, Resources &Competing Priorities
Time
Top 3 Critical Factors to have in place for success
360
=
520
=
450
=
300
=
530
=
280
=
270
=
340
=
180 =
Executive Commitment
36%
52%
45%
53%
28% 27%
34%
18%
Small Medium Large
30%
Education & Communication
Strategy & Goals
(Chart 15)
(Chart 16)
What Are the Biggest Internal Hurdles to Sustainability Education in the Company?
Small Medium Large
Small Medium Large
Top 3 Critical Factors to Have in Place for Success
“Small, midsized and large companies all cited a lack of time as a hurdle to sustainability education in their company.”
12
ACKNOWLEDGMENTGreenBiz Group would like to thank the National Environmental Education Foundation (NEEF) and PriceWaterhouseCoopers (PwC)
for their support of this year’s Sustainability & Employee Engagement report.
We would also like to thank the more than 5,600 members of the GreenBiz Intelligence Panel who take time out of their busy days
to respond to our surveys. The GreenBiz Intelligence Panel consists of executives and thought leaders in the area of corporate
environmental strategy and performance. Panel members participate in brief monthly surveys, providing their expertise and
perspective on corporate initiatives, laws and regulations, and scientific advances that are shaping the sustainability agenda.
© 2014 GreenBiz Group Inc. (www.greenbiz.com). May be reproduced for noncommercial purposes only, provided credit is given to GreenBiz Group Inc. and includes this copyright notice.