Presented By ZNETCONNECT Domain – Yesterday, Today & Tomorrow.

EMPLOYED BY TOMORROW
LASSILA & TIKANOJA PLCFinancial review 2019

Corporate Governance Statement 2019
3
Remuneration Statement 2019 15
Key figures 36
Calculation of the key figures 38
Consolidated income statement 40
Consolidated statement of comprehensive income
40
Consolidated statement of financial position
41
Consolidated statement of cash flows
42
Consolidated statement of changes in equity
43
Notes to the consolidated financial statements
44
Income statement of the parent company 31.12.2019
97
The auditor's note 113
Auditor’s report 114
Corporate Governance Statement 2019
Corporate Governance 2
Remuneration Statement 2019 Key figures
Key figures
Report by the Board of Directors
Financial statements
Financial statements
Report by the Board of Directors
3 15
39 19
36 18
35
39
Contents
Report by the Board of Directors (inc. Statement of non-financial information)
19
Lassila & Tikanoja | Financial review 2019 1
REPORT BY THE BOARD OF DIRECTORS KEY FIGURES FINANCIAL STATEMENTSCORPORATE GOVERNANCE
CORPORATE GOVERNANCE3 Corporate Governance Statement 2019
15 Remuneration Statement 2019
Lassila & Tikanoja | Financial review 2019 2
Lassila & Tikanoja plc (“L&T” or “the company”) is a public limited liability company that is registered in Finland and listed on Nasdaq Helsinki Oy. In its decision-making and administration, Lassila & Tikanoja complies with the Finnish Companies Act, other regulations governing listed companies, Articles of Association of Lassila & Tikanoja plc, charter of L&T’s Board of Directors and its committees and the rules and guidelines of Nasdaq Helsinki Ltd.
Corporate Governance Statement 2019L&T complies with the Finnish Corporate Governance Code approved by the Securities Market Association valid at any given time. This statement was prepared in accordance with the Finnish Corporate Governance Code that entered into force on 1 January 2016 (“Corporate Governance Code”). The company has also published a separate Remuneration Statement in accordance with the Corporate Governance Code. The full Corporate Governance Code is available at www.cgfinland.fi. L&T has not deviated from the recommendations of the Code.
This separate statement has been published in connection with the Report of the Board of Directors. This statement has been reviewed by the Audit Committee
Corporate Governance Statement 2019
of L&T’s Board of Directors and approved by the Board. The company’s auditor has verified that the statement has been issued and that the descriptions of the main features of the internal control and risk management systems relating to the financial reporting process included in the statement are consistent with the descriptions included in the financial statements.
Descriptions concerning corporate governanceGeneral Meeting of ShareholdersThe Annual General Meeting is the supreme decision-making body of L&T. The Annual General Meeting decides on the matters stipulated in the Companies Act, such as the acceptance of the financial statements and proposed dividend, the release from liability of members of the Board of Directors and the President and CEO, the election of the members of the Board of Directors and the auditors, and the compensation paid to them. The Annual General Meeting is held by the end of April as determined by the Board of Directors.
Each share of Lassila & Tikanoja plc entitles the holder to one vote.
The notice to the meeting and other Annual General Meeting documents, including the Board of Directors’ proposals to the Annual General Meeting are disclosed to the shareholders at the latest three weeks before the
meeting at the company’s head office and website on www.lt.fi/en/investors/corporate-governance/general-meeting. The notice to the meeting is also disclosed in a stock exchange release.
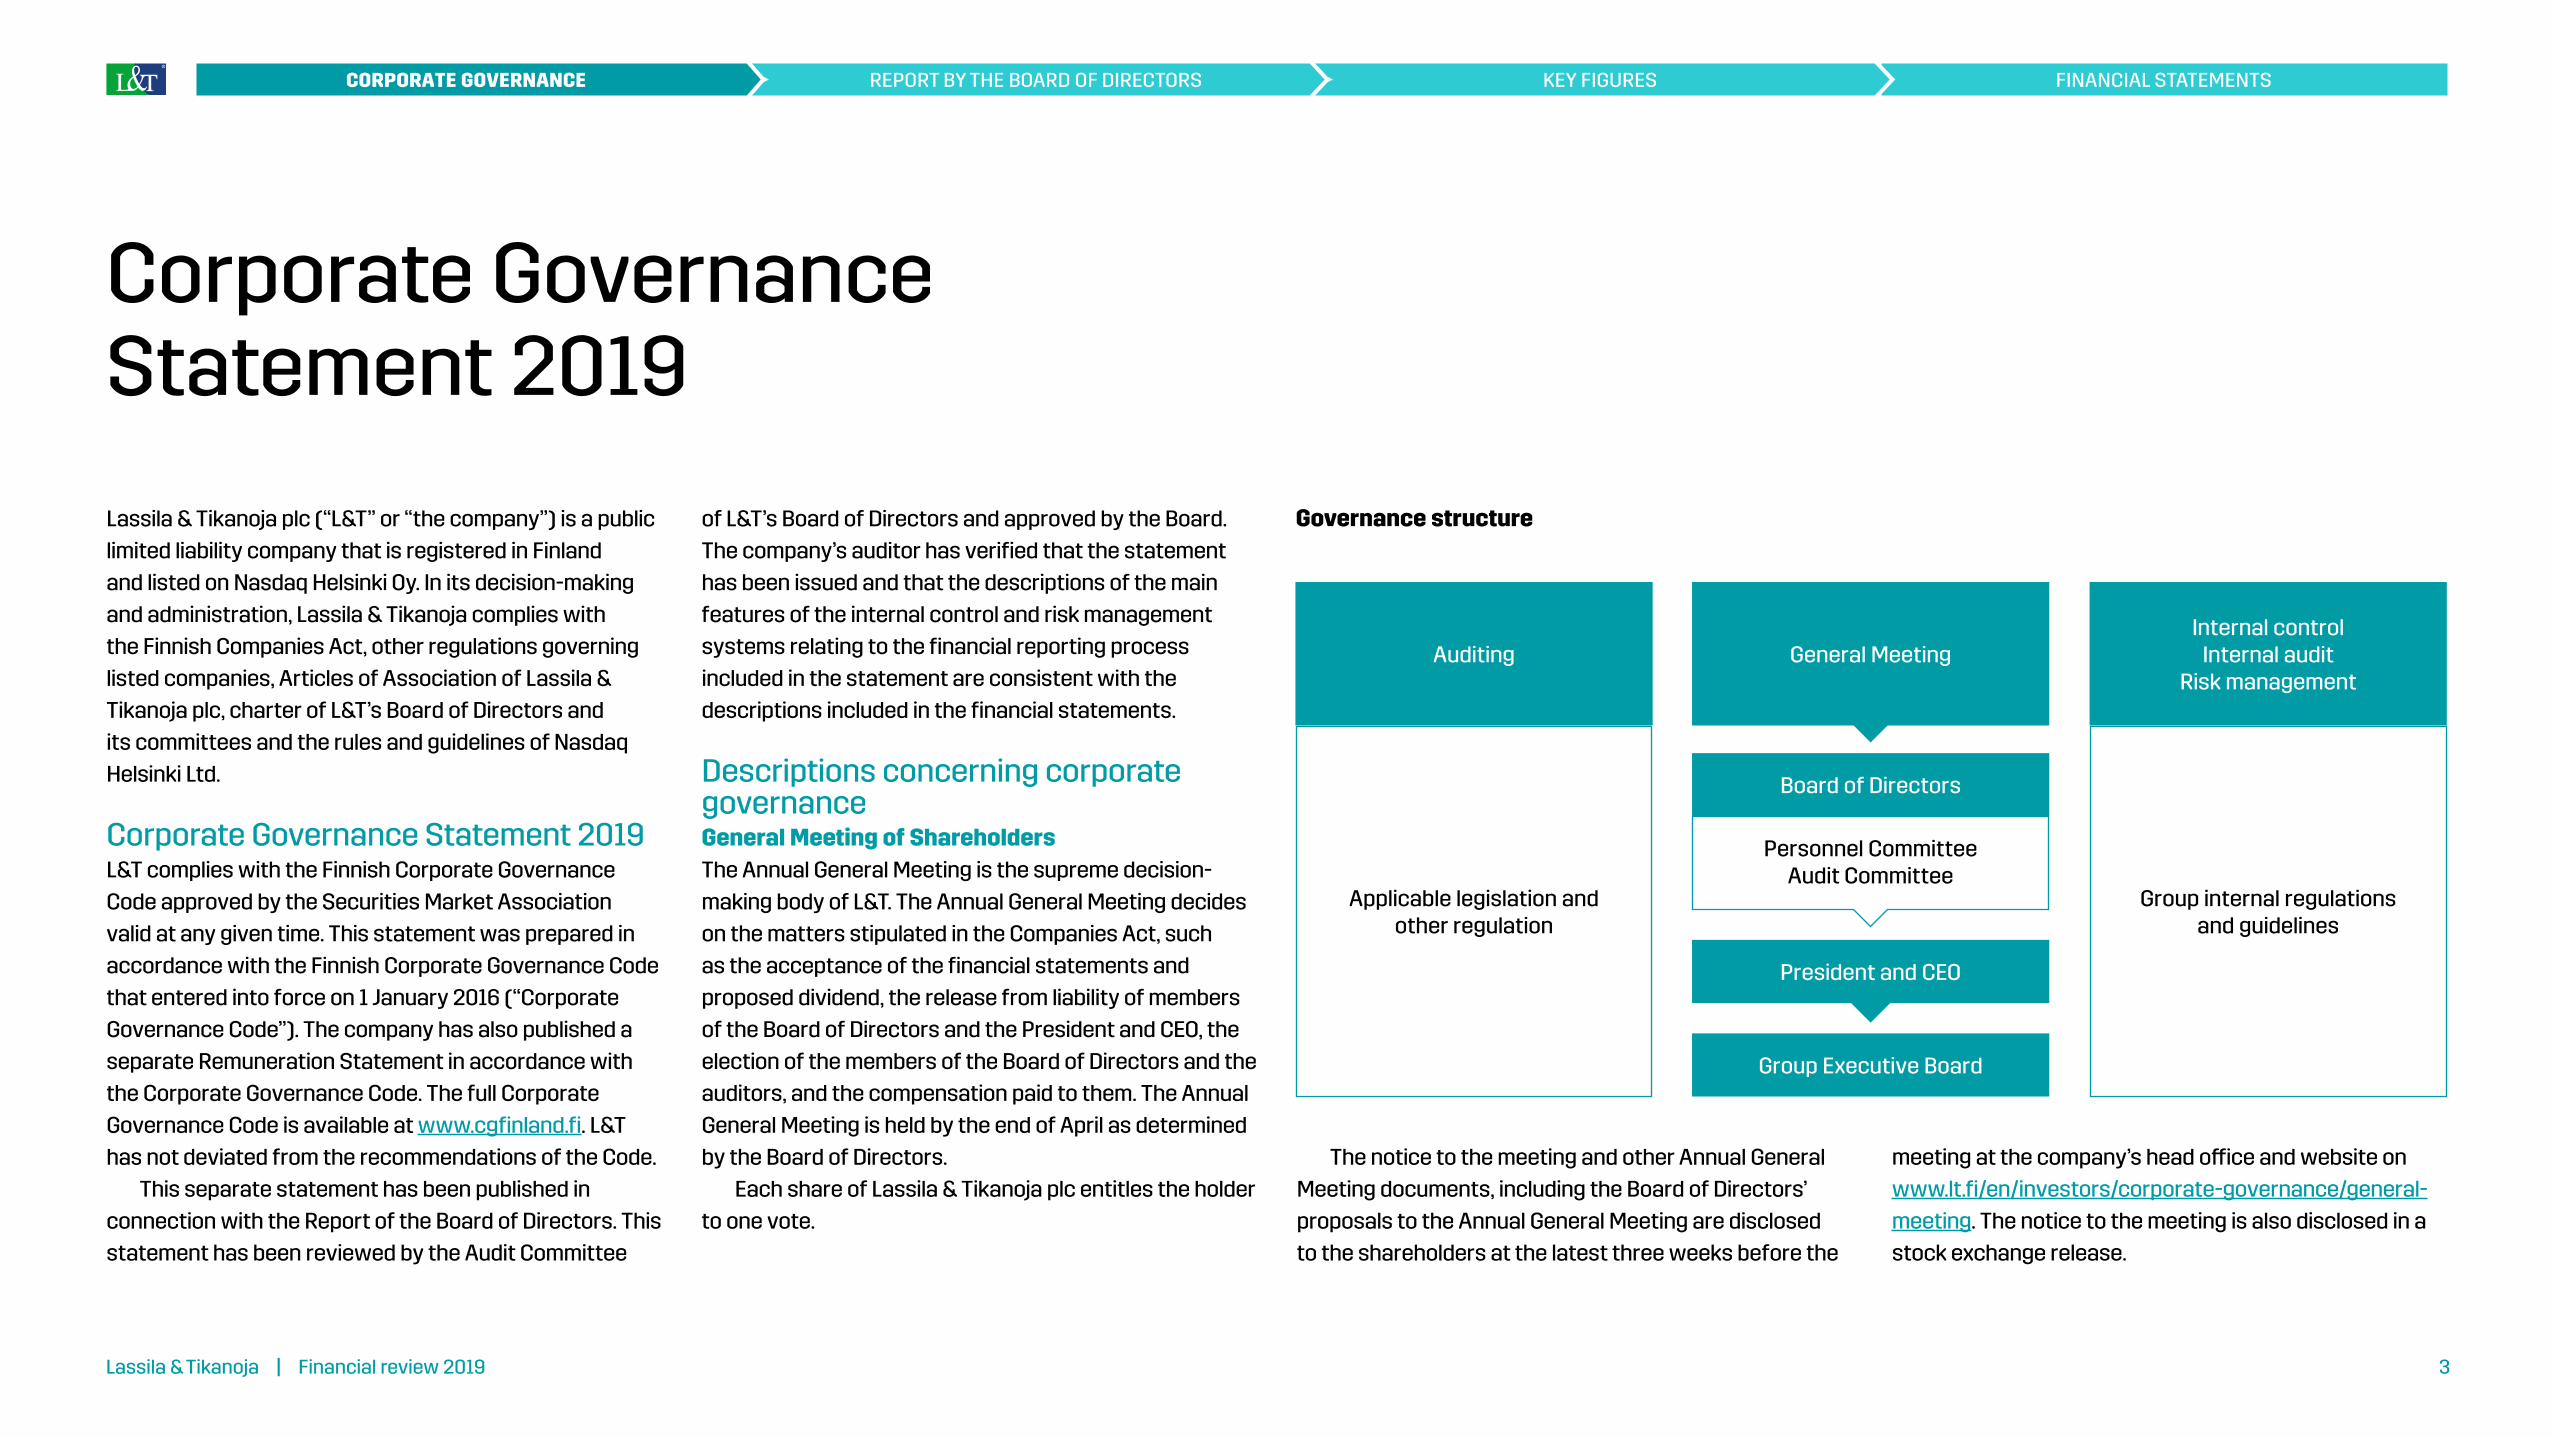
Applicable legislation and other regulation
Personnel CommitteeAudit Committee
Group internal regulations and guidelines
Auditing General MeetingInternal control
Internal auditRisk management
Board of Directors
President and CEO
Group Executive Board
Governance structure
Lassila & Tikanoja | Financial review 2019 3
REPORT BY THE BOARD OF DIRECTORS KEY FIGURES FINANCIAL STATEMENTSCORPORATE GOVERNANCE
Chairman Heikki Bergholmborn 1956Independent of the company and major shareholdersBoard member since 2008Board Committees: Chairman of the Personnel CommitteeEducation: M.Sc. (Eng.)Key work experience: Suominen Corporation Oyj: President and CEO (2002–2006); the former Lassila & Tikanoja Group: President and CEO (1998–2001), Vice President (1997–1998), President of business units (1986–1997), Lassila & Tikanoja Oy: CFO (1985–1986); Industrialisation Fund of Finland Ltd: Researcher and development manager (1980–1985)Current key board memberships: Lakan Betoni Oy (1986–, COB); MB Funds (2002–); Finnish Foundation for Cardiovascular Research (2013–) Past key board memberships: Componenta (2003–2012); Forchem Oy (2007–2013); Kemira Oyj (2004–2007); Maillefer International Oy (2010–2014); Pohjola-Yhtymä Oyj (2003–2005); Solidium Oy (2013–2016); Sponda Oyj (1998–2004); and Suominen Corporation (2006–2011)
Vice Chairman Sakari Lassilaborn 1955Independent of the company and major shareholdersBoard member since 2011Board committees: Chairman of the Audit CommitteeEducation: M.Sc. (Econ.)Key work experience: Indcrea Oy: Managing Director (2008–2018); Cupori Group Oy: member of the Management Board (2008–2014), Managing Director of Cupori AB (2012–2014); Carnegie Investment Bank AB, Finland Branch: executive positions (2002–2005); Alfred Berg Finland Oyj: executive positions within investment banking (1994–2002); Citibank Oy: head of corporate bank (1991–1994); Union Bank of Finland: supervisory and executive positions (1983–1991)Current key board memberships: Evald and Hilda Nissi Foundation, Vice Chairman of the Board (member 1987–); Aplagon Oy, Chairman of the Board (2009–)
Teemu Kangas-Kärkiborn 1966Independent of the company and major shareholdersBoard member since 2016Board committees: Member of the Audit CommitteePrimary occupation: CFO of Nokian Tyres OyjEducation: M.Sc. (Econ.)Key work experience: Fiskars Oyj, Chief Operating Officer and Deputy to the CEO (2018–2017), Interim President (2017), Chief Operating Officer and Chief Financial Officer, deputy to the CEO (2014–2017), President, Home Business Area (2012–2014), Chief Financial Officer (2008–2012); Alma Media Corporation, Chief Financial Officer (2003–2008); Kesko Group, Corporate Controller (2002–2003), Corporate Business Controller (2000–2001); Suomen Nestlé Oy, Finance Director (1999–2000); Smith & Nephew Oy, Financial Manager (1996–1998); Unilever Oy & Gmbh, Marketing Controller & Internal Auditor (1992–1996)
The members of the Board of Directors, President and CEO, principal auditor and prospective directors attend the General Meeting, unless there are well-founded reasons for their absence.
The minutes of the General Meeting will be available on the company’s website within two weeks of the General Meeting. The resolutions by the General Meeting will be published in a stock exchange release immediately after the meeting.
Board of DirectorsComposition and election of the Board of DirectorsIn accordance with the Articles of Association, the Board of Directors of Lassila & Tikanoja plc comprises a minimum of three members and a maximum of seven. The members of the Board of Directors are elected by the General Meeting. The practice applied in the preparation of the proposal concerning the composition of the Board of Directors is to have major shareholders prepare proposals concerning the Board, including a proposal for the number of Board members, their remuneration and, if necessary, Board members to the General Meeting. The term of each member of the Board of Directors expires at the end of the next Annual General Meeting of Shareholders following his/her election. The Board elects a Chairman and a Vice Chairman from among its members.
Board membersThe following six members were elected to the Board of Directors by the Annual General Meeting of 2019.
Lassila & Tikanoja | Financial review 2019 4
REPORT BY THE BOARD OF DIRECTORS KEY FIGURES FINANCIAL STATEMENTSCORPORATE GOVERNANCE
Corporate governance statement
Laura Laresborn 1966Independent of the company and major shareholdersBoard member since 2014Board committees: Member of the Personnel CommitteePrimary occupation: Managing Director of Ablers OyEducation: Ph.D. (Tech.)Key work experience: Woimistamo Oy: Managing Director (2012–2018); Kalevala Koru Oy & Lapponia Jewelry Oy: Managing Director (2007–2012); UPM Kymmene Corporation: Director of Wood Products Division, Director of Business Development & Human Resources (2004–2006).Current key board memberships: Ablers Oy (2018–)Past key board memberships: Lappeenranta University of Technology (2009–2017); Woikoski Oy (2012–2016)
Miikka Maijalaborn 1967Independent of the company and major shareholdersBoard member since 2010Board Committees: Member of the Personnel CommitteePrimary occupation: CEO of Clinius LtdEducation: M.Sc. (Eng.)Key work experience: GE Healthcare Finland Oy: Business Segment Manager 2004–2006); Instrumentarium Corporation (now GE Healthcare Finland Oy): Director, Business Development (2000–2004);Instrumentarium Corporation: supervisory and executive positions within sales, marketing and financial management (1992–2000)Current key board memberships: Healthtech Finland (2008–)
Laura Tarkkaborn 1970Independent of the company and major shareholdersBoard member since 2017Board committees: Member of the Audit CommitteePrimary occupation: CEO of Kämp Group/Kämp Collection HotelsEducation: M.Sc. (Eng.)Key work experience: Diacor Terveyspalvelut Oy: CFO and deputy CEO (2013–2014); Fazer Group: Director (2007–2012); Icecapital Securities Ltd: investment banker (2001–2007); Mandatum Stockbrokers Ltd: investment banker (1997–2001)Current key board memberships: Docrates Oy (2016–), Caruna Oy (2019–); The Finnish Fair Corporation, Member of the Supervisory Board (2019–)
Diversity of the Board of DirectorsThe company considers diversity essential to achieving the company’s strategic targets. Diversity is also viewed from several perspectives when planning the composition of the Board of Directors.
In the election of Board members, the aim is to ensure that the Board of Directors as a whole supports the company’s business and its development. It is important from the point of view of the effective operation of the Board of Directors that the Board of Directors is sufficiently diverse and comprised of an adequate number of members, and that the members have diverse expertise and their experience supplements one another’s.
In assessing the composition of the Board of Directors, it is, for example, considered whether the professional and educational background and gender and age distribution of the Board is adequately diverse and whether is suitably represents decision-making ability, skills and experience to be able to meet the requirements set by the company’s business operations and strategic targets. The company’s aim is that both genders are represented in the Board of Directors.
The principles regarding the diversity of the Board of Directors are taken into consideration in the successor planning of Board members. Both genders have been represented in the Board of Directors for a long time. In 2019, two of the six Board members were female, so the less represented gender accounts for 33 per cent of the Board of Directors.
Lassila & Tikanoja | Financial review 2019 5
REPORT BY THE BOARD OF DIRECTORS KEY FIGURES FINANCIAL STATEMENTSCORPORATE GOVERNANCE
Corporate governance statement

Independence of the members of the highest governance bodyNone of the members of the Board of Directors are in an employment relationship with the company. The Board of Directors has assessed that all of its members are independent of the company. In the assessment, it was taken into consideration that Heikki Bergholm has been a member of the Board of Directors for more than 10 years consecutively. The Board of Directors has not identified any reasons why Heikki Bergholm should not be considered independent of the company. All of the members of the Board of Directors are also independent of the company’s major shareholders.
Shares in the company held by the Board members and any corporations over which they exercise control have been taken into account in terms of shareholding. Board members do not hold shares in any group companies other than Lassila & Tikanoja plc.
Information about the Board members’ remuneration is disclosed in the Remuneration Statement published in connection with the Report of the Board of Directors and is available at www.lt.fi/annualreport2019.
Board members’ shareholding 31 December 2019
Heikki Bergholm 831,116Sakari Lassila 17,152Teemu Kangas-Kärki 2,738Laura Lares 4,061Miikka Maijala 75,248Laura Tarkka 2,089Total 932,404
Duties of the Board of DirectorsThe Board of Directors is responsible for the management of the company, the proper arrangement of the company’s operations, and the proper arrangement and supervision of the company’s accounting and financial management. The Board of Directors decides upon matters that are of major importance, in view of the scope and size of the operations of the company. The Board of Directors is also responsible for the duties specified in the Companies Act and the Articles of Association, and in other regulations.
The Board of Directors has drawn up a written charter for its work. The charter was updated in 2019 and it governs the Board’s work in addition to the company’s Articles of Association and Finnish laws and regulations.
Duties of the Board of Directors:• being responsible for the development of
shareholder value• confirming the company’s goals• deciding on the corporate strategy and confirming
divisional strategies• deciding on the Group structure and organisation• ensuring the operation of the management system• handling and adopting interim reports, consolidated
financial statements and annual reports• confirming the Group’s operating plan, budget and
investment plan• deciding on strategically or financially significant
investments, corporate acquisitions, disposals or other arrangements as well as financing arrangements and contingent liabilities
• drawing up the dividend policy• confirming treasury, investment, disclosure, risk
management and insurance policies as well as the principles of internal control
• approving the sustainability programme• nominating and dismissing the President and CEO
and monitoring and evaluating his work• deciding on the nomination, remuneration and
other financial benefits of the President and CEO’s immediate subordinates
The evaluation of the performance and working methods of the Board is conducted annually as an internal self-evaluation.
Meetings of the Board of DirectorsBoard meetings are held at the company’s head office in Helsinki, other locations of the group or other places decided on by the Board of Directors. If necessary, the Board of Directors may also hold meetings by telephone or electronically and make decisions without convening.
The Board of Directors convenes as often as its tasks require. It confirms its annual, regular meetings. Meetings held annually prior to the publication of the financial statements and each interim report as well as strategy, budget and other meetings confirmed in the annual programme of the Board are considered regular meetings. In addition to regular meetings, the Board can hold extraordinary meetings.
The company’s President and CEO and CFO usually participate in Board meetings. Where necessary, such as in conjunction with discussing the strategy or budget, the meetings are also attended by other members of Lassila & Tikanoja plc’s Group Executive Board. The company’s General Counsel acts as the secretary of the Board of Directors.
Minutes are prepared of Board meetings, subject to the signature of members of the Board of Directors participating in the meeting as well as the President and CEO of the company and secretary to the Board. These minutes are kept at the company’s headquarters.
The President and CEO is responsible for ensuring that the Board is provided with sufficient information for assessing the operations and financial situation of the company.
He also supervises and reports to the Board on the implementation of the Board’s decisions.
Activities of the Board of Directors in 2019The Board of Directors had 15 meetings in 2019, two of which were held remotely. The average attendance rate of the members at the meetings was 98.9 per cent.
Key themes in Board work included strategy and directing and supporting its implementation, monitoring strategic projects, developing the business portfolio and directing risk management.
Lassila & Tikanoja | Financial review 2019 6
REPORT BY THE BOARD OF DIRECTORS KEY FIGURES FINANCIAL STATEMENTSCORPORATE GOVERNANCE
Corporate governance statement

Committees of the Board of DirectorsThe Board has an Audit Committee and a Personnel Committee, both of which consist of three (3) Board members. After the end of the Annual General Meeting, the Board of Directors elects chairmen and members of the Committees from among its number for a term of one year at a time. The committee members must have the expertise and experience required by the duties of the committee. The Board of Directors confirms the charters of the committees annually. The committees have no independent decision-making authority; the Board of Directors makes the decisions based on the preparation work by the committees. The chairman of the committee reports on the work of the committee at the Board meeting following the committee meeting. Minutes of the committees’ meetings are provided to the Board members for information.
Audit CommitteeIn its first meeting after the Annual General Meeting of 14 March 2019, the Board of Directors appointed Sakari Lassila (Chairman), Teemu Kangas-Kärki and Laura Tarkka as members of the Audit Committee. All of the members of the Audit Committee are independent of the company and its major shareholders.
The Audit Committee will convene at least four times a year. The duties of the Audit Committee pursuant to the charter include:
• monitoring the financial position and financing of the Group
• monitoring the reporting process of financial statements
• supervising the financial reporting process• monitoring the efficiency of the company’s internal
control, internal audit and risk management systems• reviewing the operating principles of the
company’s internal control• reviewing the plans and reports of the company’s
internal audit• reviewing the company’s corporate governance
statement• reviewing the statement of non-financial
information• monitoring related-party transactions• reviewing the corporate sustainability programme• monitoring the statutory audit of the financial
statements and consolidated financial statements• evaluating the independence of the auditing
company• evaluating the provision of non-audit services to
the company by the auditing firm• preparing the proposal and/or recommendation
concerning the auditor of the company• maintaining contact with the company’s auditor
and reviewing the reports prepared for the committee by the auditor
• assessment of compliance with laws and provisions.
The Audit Committee met five times in 2019. The attend ance rate of the members at the meetings was 100 per cent.
Personnel CommitteeIn its first meeting after the Annual General Meeting of 14 March 2019, the Board of Directors appointed Heikki Bergholm (Chairman), Miikka Maijala and Laura Lares as members of the Personnel Committee. All of the members of the Personnel Committee are independent of the company and its major shareholders.
The Personnel Committee convenes at least twice a year. The duties of the Personnel Committee pursuant to the charter include:
• handling, evaluating and making statements on the salary structure of the Group management and personnel as well as remuneration and incentive schemes
• monitoring the functionality of the remuneration systems to ensure that the management’s incentive schemes promote the achievement of the company's targets and are based on personal performance
• handling and preparing other questions related to management and personnel remuneration and drafting statements to the Board regarding them
• handling and preparing executive appointment issues for consideration by the Board of Directors.
• reviewing and preparing the personnel-related matters of the sustainability programme
• reviewing the Remuneration Statement
The Personnel Committee met four times in 2019. The attendance rate of the members at the meetings was 100 per cent.
Meeting attendance of Board members in 2019
Board of Directors Audit Committee Personnel Committee
Heikki Bergholm 15/15 4/4Sakari Lassila 15/15 5/5Teemu Kangas-Kärki 14/15 5/5Laura Lares 15/15 4/4Miikka Maijala 15/15 4/4Laura Tarkka 15/15 5/5
Lassila & Tikanoja | Financial review 2019 7
REPORT BY THE BOARD OF DIRECTORS KEY FIGURES FINANCIAL STATEMENTSCORPORATE GOVERNANCE
Corporate governance statement
President and CEOLassila & Tikanoja plc’s President and CEO is appointed by the Board of Directors. The President and CEO is responsible for day-to-day operations in keeping with the instructions of the Board of Directors. He is also responsible for the strategy process.
M.Sc. (Econ.) Eero Hautaniemi has served as the President and CEO since 1 January 2019. The more detailed personal and shareholding information of the President and CEO is disclosed below in connection with the personal and shareholding information of the members of the Group Executive Board.
Group Executive BoardThe Group Executive Board assists the President and CEO in the management of the company. The Group Executive Board has no authority based on legislation or the Articles of Association. The Group Executive Board is comprised of the President and CEO as the chairman and Group executives confirmed by the Board of Directors. The members of the Group Executive Board report to the President and CEO. The Group Executive Board convenes at least once a month.
On the date of this statement, the Group Executive Board was comprised of the following persons:
Eero Hautaniemi born 1965President and CEOMember of the Group Executive Board since: 1 January 2019 Education: M.Sc. (Econ.)Key work experience: Oriola Oyj: President and CEO (2006–2017); GE Healthcare Finland Oy: President (2004–2005); GE Healthcare IT: General Manager, Oximetry, Supplies and Accessories business area (2003–2004); Instrumentarium Corporation: specialist and executive positions (1990–2003)Current key Board memberships: Posti Group Corporation (2017–)Past key Board memberships: Lassila & Tikanoja Plc (2007–2017); Nurminen Logistics Plc (2009–2012)
Valtteri Palin born 1973CFO Member of the Group Executive Board since: 1 August 2019Education: M.Sc. (Econ.)Key work experience: Lassila & Tikanoja Oyj, CFO, responsible for controller operations (2019); SRV Yhtiöt Oyj, CFO (2008–2019); SRV Toimitilat Oy, business controller (2005–2008); Skanska Oy, Finance Manager, business controller and controller (1998–2005)
Tuomas Mäkipeskas. 1978born 1978Vice President, Facility Services FinlandMember of the Group Executive Board since: 14 February 2012Education: M.Sc. (Econ.)Key work experience: Lassila & Tikanoja plc: CFO (2017–2019), Development Director (2012–2017), Vice President, Renewable Energy Sources (2015–2017); Deloitte: Management Consultant, Strategy & Operations (2005–2012); Fiskars Corporation: Project Manager (2004–2005); Rieter Automotive Management AG: Market Analyst (2003)
Corporate governance statement
Lassila & Tikanoja | Financial review 2019 8
REPORT BY THE BOARD OF DIRECTORS KEY FIGURES FINANCIAL STATEMENTSCORPORATE GOVERNANCE

Petri Salermoborn 1970Vice President, Environmental ServicesMember of the Group Executive Board since: 1 January 2013Education: QBA, EMBA (2020)Key work experience: Lassila & Tikanoja plc: Business Director, Environmental Services (2009–2012), Sales Director, Environmental Services (2003–2009), Sales Manager, Environmental Services (2001–2003);Europress Oy: Sales Director (1998–2001), managerial positions in sales (1995–1998)
Erik Sundström born 1957Vice President, Facility Services SwedenMember of the Group Executive Board since: 26 February 2019Education: Contract law and management studiesKey work experience: Lassila & Tikanoja plc; Lassila & Tikanoja Service AB: President and CEO (2019–), Lassila & Tikanoja FM AB: President and CEO (2017–); Veolia FM AB, President and CEO (2017); Veolia Sverige AB, COO (2012–2017); Dalkia Energy and Building Services AB, President and CEO (2007–2012), Vice President (2004–2007), COO (2001–2004), Regional Director (1998–2001); Locum Drift AB, Business Manager (1995–1998); Locum AB, Regional Director (1992–1994
Antti Tervoborn 1978Vice President, Industrial Services Member of the Group Executive Board since: 14 February 2012Education: M.Sc. (Econ.)Key work experience: Lassila & Tikanoja plc: Chief Officer responsible for procurement and supply chain (2012–2014); Siemens, North West Europe: Head of Commodity Management (2009–2012), Project Manager, Procurement and Supply Chain Management (2008–2009); Siemens Oy Finland and Baltics: Director, Procurement (2005–2009), Procurement Manager (2003–2005), Supply Chain Consultant (2001–2003)
Lassila & Tikanoja | Financial review 2019 9
REPORT BY THE BOARD OF DIRECTORS KEY FIGURES FINANCIAL STATEMENTSCORPORATE GOVERNANCE
Corporate governance statement
Sirpa Huopalainenborn 1965General CounselMember of the Group Executive Board since: 26 February 2019Education: OTK, Master of Laws (Aus.)Key work experience: Lassila & Tikanoja Oyj, General Counsel (2012–); Atria Oyj, General Counsel (2007–2012); Metso Automation Oy, Legal Counsel (2004–2007); Metso Corporation, Legal Counsel (1999–2004); Rauma Oyj, Legal Counsel (1996–1999)
Jorma Mikkonenborn 1963Director, Corporate Relations and SustainabilityMember of the Group Executive Board since: 1 June 2015Education: Master of LawsKey work experience: Lassila & Tikanoja plc: Division Manager, Environmental Services (2009–2012), Division Manager, Industrial Services (2000–2009); Säkkiväline Oy: Administrative Director (1999–2000), Corporate Lawyer (1992–1999); Helsingin Suomalainen Säästöpankki: Corporate Lawyer (1991–1992)
Hilppa Rautpalo born 1974HR DirectorMember of the Group Executive Board since: 1 January 2020Education: Master of Laws (trained at the bench)Key work experience: Arctia Ltd, SVP, Legal Affairs and HR (2018–2019); Unisport-Saltex Oy, General Counsel, Group HR Director (2017–2018); Ekokem Oyj, SVP, Legal Affairs and HR (2013–2017); Amer Sports Oyj, Senior Legal Counsel (2007–2009); Metsä Group, Group Legal Counsel (2000–2007)
Lassila & Tikanoja | Financial review 2019 10
REPORT BY THE BOARD OF DIRECTORS KEY FIGURES FINANCIAL STATEMENTSCORPORATE GOVERNANCE
Corporate governance statement
Juha Jaatinenborn 1965Interim CFOMember of the Group Executive Board since: 26 February 2019Education: M.Sc. (Econ.)Key work experience: Evac Group, CFO (2016–2018); Okmetic Oyj, CFO, responsible for Finance, IT and Communication (2010–2016); Nokia Markets, Senior Business Controller (2008–2010); Nokia Multimedia, Director, Finance and Control (2004–2007); Nokia Mobile Phones, Business Controller, Entertainment business Unit, Development Manager, Financial Reporting System Specialist (1997–2003); ICL Data Controller (1995–1997)
Kirsi Materoborn 1968HR DirectorMember of the Group Executive Board since: 1 January 2012Education: M.Sc. (Econ.)Key work experience: Atria Oyj: Group Vice President, Human Resources (2010–2011); Pfizer Oy: HR Director (2007–2010); Nokia Mobile Phones: Senior Business HR Manager (2004–2007); Nokia Mobile Phones and Nokia Networks: Business HR Manager and Competence Development Manager (1998–2003); Adulta Oy: Programme Manager (1996–1998); Shell Oil Products: Product Manager (1994–1995)
Tutu Wegelius-Lehtonenborn 1970Vice President, Facility ServicesMember of the Group Executive Board since: 16 February 2015Education: Lic. Tech.Key work experience: Lassila & Tikanoja plc: Chief Procurement Officer (2015–2016); Hartwall Oy: Operations and Supply Chain Director (2014); Rexel Finland Oy: Director of Marketing and Business Development (2011–2014); YIT: managerial positions in procurement and logistics (2004–2008) and in YIT’s Building Services and Building and Industrial Services divisions (2009–2011); Ensto: Director, Production and Logistics (1998–2004)Membership on other Boards: The Real Estate Employers (Kiinteistötyönantajat ry), Member of the Board (2017–2019)
In 2019, members of the Group Executive Board also included Tutu Wegelius-Lehtonen (membership ended on 25 February 2019), Kirsi Matero (membership ended on 13 May 2019) and Juha Jaatinen (membership ended on 31 July 2019). Their information has been presented as per the situation on the date of termination of membership.
Lassila & Tikanoja | Financial review 2019 11
REPORT BY THE BOARD OF DIRECTORS KEY FIGURES FINANCIAL STATEMENTSCORPORATE GOVERNANCE
Corporate governance statement

Group Executive Board members’ shareholding 31 December 2019
31 December 2019
Eero Hautaniemi 20,403Valtteri Palin 0Tuomas Mäkipeska 7,948Petri Salermo 14,929Erik Sundström 0Antti Tervo 8,094Sirpa Huopalainen 5,419Jorma Mikkonen 5,782Hilppa Rautpalo* 0Total 62,575
* Member of Group Executive Board from 1 January 2020
Shares in the company held by the Group Executive Board members and any corporations over which they exercise control have been taken into account in terms of shareholding. Group Executive Board members do not hold shares in any group companies other than Lassila & Tikanoja plc.
Information about the remuneration paid to the President and CEO and the Group Executive Board is disclosed in the Remuneration Statement published in connection with the Report of the Board of Directors and is available at www.lt.fi/annualreport2019.
The Group’s financial reportingThe financial reporting principles represent an essential element of L&T's Integrated Management System. The financial information of the Group and its divisions are reported and analysed internally within the Group monthly and disclosed as interim reports, half-yearly reports and financial statements release on a quarterly basis. The Group’s and its divisions’ budgets and long-term financial plans are updated annually.
The Group’s financial reporting process includes both financial accounting and management accounting. The internal control and risk management processes and procedures pertaining to the financial reporting process are explained in more detail below. Their purpose is to ensure that the information disclosed in the financial reports published by the company is essentially correct.
Audit CommitteeThe Board of Directors’ Audit Committee supervises and monitors the efficiency of L&T’s financial reporting process and internal control systems. The Audit Committee has reviewed L&T’s internal control policy and the Board of Directors has approved it.
The Audit Committee meets at least four times a year before the publication of interim reports and the financial statements release. In its meetings, the Audit Committee reviews the financial information presented by the Chief
Financial Officer, as well as interim and half-yearly reports and financial statements releases. The auditor is also invited to attend the meetings. The Audit Committee is presented in more detail in the Committees section.
L&T’s financial reporting processL&T conducts a significant proportion of its business in Finland. Functions related to accounting, accounts payable and receivable, payments and financing in the financial reporting process in Finland are centralised. Organisation of these functions into different teams allows the separation of various finance-related tasks. To support the consistent process in Finland, L&T also runs a centralised accounting system and common operational practices.
L&T’s foreign subsidiaries each have independent financial management departments operating in compliance with the accounting principles and reporting instructions issued by the Group’s financial management. L&T’s domestic business segments and foreign subsidiaries submit a monthly reporting package to the Group according to the Group's instructions. Controllers supervise the financial reports of domestic business segments and foreign subsidiaries.
L&T’s Group financial management is responsible for preparing and updating the Group accounting policies and instructions, and for preparing reporting schedules. The financial management department consolidates subsidiaries’ financial statements into consolidated financial statements, which include notes to the financial statements, and prepares interim and half-yearly reports and financial statement releases and the annual financial statements. Public financial reporting is realised
with the same principles and it is subject to the same control methods as monthly internal financial reporting. The Audit Committee reviews the interim report, half-yearly report and financial statements and proposes its recommendation on their processing to the Board of Directors. The Board of Directors approves the interim report, half-yearly report, financial statements release and financial statements prior to their publication.
Internal controlInternal control is a material part of the Group’s administration and management. The purpose of internal control is to ensure the reliability of the Group’s financial reporting, efficiency and profitability of operations and compliance with legislation and other regulations. Tools of internal control include policies and principles, guidelines, manual and IT system-based automatic controls, follow-up reports and inspections or audits.
The company’s Board of Directors has ratified L&T’s internal control policy. The Board of Directors and the President and CEO are responsible for the organisation of internal control. The Audit Committee of the Board of Directors monitors the efficiency and performance of internal control and correctness of financial reporting.
The financial development of the company is monitored monthly by an operational reporting system covering the whole Group. In addition to actual data, the system provides budgets, forecasts and investment reports. L&T's operations and financial reports are monitored and compared against budgets and forecasts at different organisational levels. Group management, divisional management and area management as well as business unit management analyse the results and any
Descriptions of internal control procedures and main features of risk management system
Lassila & Tikanoja | Financial review 2019 12
REPORT BY THE BOARD OF DIRECTORS KEY FIGURES FINANCIAL STATEMENTSCORPORATE GOVERNANCE
Corporate governance statement
nonconformities. Those responsible for finances at the divisions also analyse the financial reports and prepare reports for management use. Their duties also include supervision of the accuracy of financial reports and analysis of results.
Risk managementL&T has a defined risk management process that includes a review of financial, strategic, operational and damage-related risks.
Key risk management principlesRisk management at L&T aims to identify significant risk factors, prepare for them and manage them in an optimal way so that the company’s strategic and financial objectives are achieved. Comprehensive risk management endeavours to manage the Group’s risk as a whole and not just individual risk factors.
ResponsibilitiesThe principles of L&T’s risk management are approved by the company’s Board of Directors. The Board monitors the implementation of risk management and assesses the efficiency of the methods employed. The President and CEO is responsible for the organisation and implementation of risk management. Risk management at L&T Group is controlled by the risk management and insurance policy confirmed by L&T’s Board of Directors. The policy specifies the objectives and principles, organisation and responsibilities and procedures of the
Group’s risk management. The Group’s financing policy confirmed by L&T’s Board of Directors is followed in the management of financial risks. The principles for insurance risk management are specified in the Risk Management and Insurance Policy.
Identification, assessment and reporting of risksRisks are surveyed regularly and systematically at both division and company level and in central functions considered to be critical. The significance of risks is assessed by a risk matrix. Measures for managing and minimising the identified risks are prepared and responsibility for these measures is allocated to specified individuals or units. The most significant risks identified and the preparations for them are regularly reported to the President and CEO and the Board of Directors.
Other information disclosed in the CG statement
Internal auditInternal audit enhances the realisation of the monitor-ing responsibility of L&T’s Board of Directors. It is the task of L&T’s internal audit to support the company and its senior management in the achievement of strategic and financial goals by providing a systematic approach to assessing and developing the effectiveness of the organisation’s internal control, risk management and governance systems and performance, efficiency and
appropriateness of business processes. The internal audit function provides recommendations for the development of the above-mentioned systems and processes.
The internal audit focuses primarily on proactive measures by participating in development projects and supporting the businesses in the identification of risks related to their planned operating models and the specification of risk management measures. The internal audit has no operational responsibility for projects and it does not participate in decision-making. In its operations, the internal audit complies with generally accepted international professional standards concerning internal audit and ethical principles, as well as the internal audit operating guidelines confirmed by L&T’s Board of Directors.
The internal audit operates under the supervision of the Audit Committee of L&T’s Board of Directors and the company’s President and CEO and reports its observations and recommendations to the Audit Committee, President and CEO, management of each audited division and the auditor. Internal audit may purchase external outsourced services for carrying out audit tasks requiring additional resourcing or special expertise as necessary.
The Board’s Audit Committee confirms the annual plan of internal audit, in which items to be audited are selected based on the Group’s strategic objectives, estimated risks and focal areas specified by the Board of Director and the President and CEO. The audit plan is amended based on risks as necessary.
Related-party transactionsIn accordance with the Corporate Governance Code, the company evaluates and monitors transactions between the company and its related parties and aims to ensure that any conflicts of interest are taken into consideration in decision-making. If the related-party transactions are material to the company and deviate from the company’s ordinary business operations or are made in deviation from ordinary market terms, the company must report the decision-making procedure concerning such related-party transactions.
L&T’s related-party transactions are described in Note 5.4 to the financial statements. L&T did not carry out any business transactions with related parties that were material to the company, deviated from its normal business operations or were not made on market or market equivalent terms in 2019.
Insider guidelinesThe company complies with the Market Abuse Regulation (596/2014, “MAR”) and the Securities Market Act and related regulations and guidelines issued by the European Securities Markets Authority, the Finnish Financial Supervisory Authority and Nasdaq Helsinki Ltd. Moreover, the Board of L&T’s has also verified insider guidelines to supplement the Guidelines for Insiders issued by Nasdaq Helsinki Ltd. Certain key aspects of the insider guidelines are described below. The insider guidelines clearly specify certain practices and decision-making procedures for ensuring that the
Lassila & Tikanoja | Financial review 2019 13
REPORT BY THE BOARD OF DIRECTORS KEY FIGURES FINANCIAL STATEMENTSCORPORATE GOVERNANCE
Corporate governance statement
company’s insider management has been arranged in a consistent and reliable way. The General Counsel is responsible for insider issues in the company.
As a result of MAR, L&T has not had a public insider list since 3 July 2016. L&T also no longer maintains a permanent company-specific insider register. Instead, the company’s employees and service providers with access to certain insider information are recorded in project-specific lists of insiders. Service providers may keep a list of insiders concerning their own employees if so decided by the company in an individual case.
If a person holds inside information, trading in the company’s securities is always prohibited. In addition, certain trading restrictions apply to certain managers and employees of the company also when said parties hold no inside information. L&T has specified the Board of Directors and the President and CEO as executives as referred to in the Market Abuse Regulation. Said persons may not trade in L&T’s financial instruments on their own account or for the account of a third party for a closed period of 30 days preceding the publication of the company’s interim reports, half-year report and financial statements release, including the date of publication. The closed period preceding result announcements and the restriction of trading during the closed period also apply to the persons who participate in the preparation of interim reports and the financial statements release, or who otherwise have regular access to L&T’s undisclosed financial information.
These managers, i.e. Board members and the President and CEO, and the persons closely associated
with them are required to notify L&T and the Finnish Financial Supervisory Authority of all transactions involving financial instruments issued by L&T or related to L&T. Transactions by managers and the persons closely associated with them are published as stock exchange releases via the company website.
AuditorL&T has one auditor that must be a firm of auditors approved by the Finland Chamber of Commerce. The auditor is elected by the Annual General Meeting. KPMG Oy Ab, Authorised Public Accountants, was elected by the Annual General Meeting of 2019 as the company’s auditor, with Leenakaisa Winberg, Authorised Public Accountant, as the principal auditor.
The auditors and the Board agree on the audit plan annually and discuss the audit’s findings.
In 2019, the fees paid for the Group’s statutory auditing to KPMG group totalled EUR 216,000 (168,000). The fees paid to the auditing company and companies belonging to the same group for non-audit services totalled EUR 62,000 (30,000). Such other services were mainly related to consulting in accounting, taxation and financial reporting.
Lassila & Tikanoja | Financial review 2019 14
REPORT BY THE BOARD OF DIRECTORS KEY FIGURES FINANCIAL STATEMENTSCORPORATE GOVERNANCE
Corporate governance statement

This remuneration statement was prepared in accordance with the Securities Market Association’s Finnish Corporate Governance Code for Finnish listed companies that entered into force on 1 January 2016. This remuneration statement includes descriptions of the decision-making concerning the remuneration of the company’s Board of Directors, CEO and other members of the Group Executive Board, key remuneration principles and a remuneration report. The Personnel Committee of the Board of Directors has reviewed this statement. This and other information disclosed in accordance with the Corporate Governance Code are available on the website of Lassila & Tikanoja plc (“L&T” or “the company”) at www.lt.fi/en/investors/corporate-governance.
Board of DirectorsDecision-making on remunerationThe Annual General Meeting annually determines the emoluments payable to the members of the Board of Directors for Board and committee work. The major shareholders prepare the proposals concerning the remuneration of the Board of Directors.
Key remuneration principlesIn accordance with the resolution of the Annual General Meeting on 14 March 2019, it was decided to pay the Chairman EUR 60,000, the Vice Chairman EUR 40,000 and each member EUR 30,000 per year as of the 2019
Annual General Meeting. The fees are paid so that 40 per cent of the annual fee is in Lassila & Tikanoja's shares held by the company or, if this is not feasible, shares acquired from the markets, and 60 per cent in cash. Shares are to be issued to Board members and, where necessary, acquired directly from the markets on behalf of Board members within the next 14 trading days, free from restrictions on trading, from the Annual General Meeting. In addition, meeting fees are paid to the members of the Board of Directors as follows: EUR 1,000 to the Chairman, EUR 700 to the Vice Chairman and EUR 500 to each member for each meeting. Meeting fees are also paid to the Chairmen and members of committees established by the Board of Directors: EUR 700 to the Chairman of a committee and EUR 500 to each member for each meeting.
None of the members of the Board of the Directors is employed by the company or company belonging to the same group of companies with the company or acts as the company’s advisor, and thereby they receive no salary, pension benefits, other financial benefits as sociated with employment or service, or other emol-uments or fees not associated with Board work from the company. The members of the Board are not included in the company’s share-based incentive schemes and they do not have any pension contracts with the company.
Remuneration-related authorisationsThe Annual General Meeting decided on 14 March 2019 in accordance with the proposal of the Board of Directors to authorise the Board of Directors to decide on a share issue and issuance of option rights or other special rights conferring entitlement to shares, referred to in Chapter 10, Section 1 of the Finnish Limited Liability Companies Act, as follows:
The maximum number of shares issued under the authorisation is 2,000,000 shares, corresponding to approximately 5.2% of the total number of shares. The Board of Directors decides on all terms and conditions of the share issue and issuance of special rights conferring entitlement to shares, and it has the right to waive the pre-emptive right of shareholders (directed issue). The authorisation is effective for 18 months.
In 2019, the company’s Board of Directors decided to transfer a total of 11,233 company shares under the authorisation as part of the company’s share-based incentive programme and 5,903 shares as part of the remuneration of the members of the Board of Directors (directed issue).
CEO and Group Executive BoardDecision-making on remunerationThe Board of Directors annually decides on the emoluments and financial benefits payable to the CEO and other members of the Group Executive Board. Before
decision-making by the Board of Directors, the matter is prepared by the Personnel Committee of the Board.
Key remuneration principlesThe remuneration of the President and CEO and the other members of the Group Executive Board consists of a fixed monthly salary and benefits and a separate annually decided short-term incentive. In addition, the CEO and other members of the Group Executive Board are covered by the share-based incentive programme functioning as a long-term incentive scheme.
Short-term incentive programmeThe short-term incentives of the CEO and other members of the Group Executive Board are based on the performance of the Group and division. The short-term incentives paid to the division directors are based on the operating profit of the Group and division. The short-term incentives of the CEO and other members of the Executive Board are based on the operating profit of the Group. The bonus equals a maximum of 3–6 months’ salary, at maximum, depending on the responsibilities of the recipient.
The objectives of the short-term incentives are set and their realisation assessed annually. Any incentives are usually paid in February of the year following the earnings period typically spanning a calendar year. The precondition for payment is that the person is employed by the company at the time.
Remuneration Statement 2019
Lassila & Tikanoja | Financial review 2019 15
REPORT BY THE BOARD OF DIRECTORS KEY FIGURES FINANCIAL STATEMENTSCORPORATE GOVERNANCE

Share-based incentive programmesThe share-based incentive programme is the long-term incentive scheme for the CEO and other members of the Group Executive Board. The company’s Board of Directors decides on the share-based incentive programme to form a part of the incentive and commitment scheme for the company’s key personnel. The earnings period of the programme is the calendar year. The Board of Directors decides on the earnings criteria, target group and maximum share-based incentives on the proposal of the Personnel Committee. The final numbers of shares issued based on meeting the earnings criteria are decided by the Board of Directors at the beginning of the year following the earnings period. Rewards will be paid in February of the calendar year following the earnings period. The rewards will be paid partly as shares and partly in cash. The maximum share-based payment may equal 6–12 months’ salary depending on the responsibilities of the member of the Group Executive Board.
The precondition for payment is that the person be employed by the company at the time. Any shares earned
through the incentive programme must be held for a mi-nimum period of two years following the payment (com-mitment period). After that, the members of the Group Executive Board are still required to hold company shares with a value equal to their gross salary for six months and the other programme participants with a value equal to their gross salary for three months as long as they are employed by the company. If a programme participant resigns during the commitment period at their own ini-tiative, they are obligated to return the received shares without compensation.
The share-based incentive programmes with years 2019 and 2018 as the earnings periods are described below:
• The share-based incentive programme 2019 began in 2018. The rewards were based on the Group’s EVA result and they were paid in 2019.
• The share-based incentive programme 2020 began in 2019. The rewards were based on the Group’s EVA result and they will be paid in 2020.
Other key terms and conditionsA written service contract has been drawn up for the President and CEO. According to the contract, the period of notice is six months should the company terminate the contract, and six months should the President and CEO terminate the contract. In the event that the company terminates the contract, the President and CEO will be paid compensation amounting to twelve (12) months’ salary.
Separate emoluments are not paid to the President and CEO and other members of the Group Executive Board for the memberships of Boards of Directors of the subsidiaries.
The President and CEO and other members of the Group Executive Board are not covered by any supple-mentary pension scheme.
Remuneration reportThis remuneration report is included in Lassila & Tikanoja plc’s (“L&T” or “the Company”) remuneration statement published in connection with the Report by the Board of Directors. The remuneration report describes the
emoluments and other financial benefits paid to members of the Board of Directors, CEO and other Group Executive Board members during the financial year 2019.
Board of Directors and its CommitteesThe Annual General Meeting held on 14 March 2019 resolved on the remuneration of the Board of Directors as follows:
• Chairman of the Board EUR 60,000• Vice Chairman of the Board EUR 40,000• members EUR 30,000
In addition, meeting fees were paid to the members of the Board of Directors as follows: EUR 1,000 to the Chairman, EUR 700 to the Vice Chairman and EUR 500 to each member for each meeting. Meeting fees were also paid to the Chairmen and members of committees established by the Board of Directors: EUR 700 to the Chairman of a committee and EUR 500 to each member for each meeting.
Information about remuneration paid to those who were members of the Board of Directors during the finan-cial years 2019 and 2018 is presented in the table below.
Remuneration paid to the members of the Board of Directors (EUR*) 2019 2018
Annual fee* Meeting fees Total Annual fee Meeting fees Total
Heikki Bergholm 60,000 15,800 75,800 60,000 15,800 75,800Sakari Lassila 40,000 12,600 52,600 40,000 13,300 53,300Teemu Kangas-Kärki 30,000 8,500 38,500 30,000 9,500 39,500Laura Lares 30,000 8,500 38,500 30,000 8,500 38,500Miikka Maijala 30,000 8,500 38,500 30,000 8,500 38,500Laura Tarkka 30,000 9,000 39,000 30,000 9,000 39,000
* 40% of the annual fee is paid in Lassila & Tikanoja’s shares held by the company or, if this is not feasible, shares acquired from the markets.
Lassila & Tikanoja | Financial review 2019 16
REPORT BY THE BOARD OF DIRECTORS KEY FIGURES FINANCIAL STATEMENTSCORPORATE GOVERNANCE
Remuneration statement

President and CEOEero Hautaniemi took up his post as the President and CEO on 1 January 2019. In 2019, the fixed annual salary of President and CEO Eero Hautaniemi including benefits was EUR 420,000. Based on 2018, no short-term incentives or share rewards were paid to Eero Hautaniemi. The President and CEO’s wages and fees for 2019 thus totalled EUR 420,000.
Pekka Ojanpää served as the company’s President and CEO until 23 November 2018. The 6,947 shares given to him based on the share-based incentive programme in 2016 and 2017 were returned to the company according to the terms and conditions of the programme.
Other Executive Board membersOther Group Executive Board members were paid fixed annual salary and fringe benefits together of EUR 1,160,210 in 2019 (2018: EUR 1,024,028) and short-term incentives based on performance in 2018 totalling EUR 150,242 (2018: EUR 95,634). In 2019, the members of the Executive Board received a total of 11,233 shares as rewards for 2018 (2018: 1,581 shares), the value of which was EUR 171,192 (2018: EUR 26,736) and monetary compensation relating to the taxes for the share rewards, amounting to EUR 171,192 (2018: EUR 26,736), or
a total of EUR 342,384 (2018: EUR 53,472). The wages and fees paid to other members of the Group Executive Board thus totalled EUR 1,652,836 (2018: EUR 1,173,134).
In 2019, EUR 3,800 arising from the pension agreement of Jari Sarjo, who served as the President and CEO until 13 June 2011, was recognised in the income statement.
Lassila & Tikanoja | Financial review 2019 17
REPORT BY THE BOARD OF DIRECTORS KEY FIGURES FINANCIAL STATEMENTSCORPORATE GOVERNANCE
Remuneration statement

REPORT BY THE BOARD OF DIRECTORS19 Report by the Board of Directors (inc. Statement of
non-financial information)
Lassila & Tikanoja | Financial review 2019 18
StrategyL&T’s strategy was updated in autumn 2019, at which time the company also set new targets for the strategy period 2019–2024. The new strategy coincides with a period of time in which we must find solutions to major societal challenges related to combating climate change and the adequacy of virgin natural resources.
These social challenges open up new business operations for solutions of the circular economy. L&T wants to play an active role in the resolution of these challenges together with its customers. In practice, this means keeping the materials and properties of customers in profitable use for as long as possible and improving the efficiency of the use of raw materials and energy in co-operation with the customer.
The circular economy is about understanding and preserving value. L&T’s strategy is to create more value with the circular economy for the customers, personnel and society in a broader sense. Achieving this also means growth in value for our shareholders.
Increasing value with the circular economy L&T is a service company that is putting the circular economy into practice. All the business operations of the company build future sustainable growth for the circular economy and are based on the opportunities created by it.
• The mission of Environmental Services is to keep our customers’ materials in circulation as efficiently as possible and with the highest possible degree of processing and to replace fossil raw materials with renewable ones.
• The mission of our Industrial Services is to continuously look for ways to effectively utilise the side streams of industry and society according to the principles of the circular economy.
• The Facility Services, both in Finland and Sweden, improve the value of customers’ properties and aim for the continuous improvement of energy efficiency supporting the logics of the circular economy.
By investing in the sustainable solutions of the circular economy, L&T is pursuing an increasing value for all its key stakeholders.
• The value for our customers can be seen in, for example, an improved recycling rate, more efficient energy consumption or improved property user satisfaction. The company continuously develops its services according to its customers’ needs and regularly measures its success. L&T’s goal is an excellent and continuously improving customer experience.
• The value for our personnel can be seen in that
our personnel enjoy their work and go home in good health after a working day. L&T offers meaningful work as well as opportunities for career paths and competence development. This is how the company pursues a better personnel experience and an increase in the Employee Net Promoter Score.
• The value for society consists of L&T’s work which mitigates climate change and preserves natural resources. The company replaces virgin raw materials with secondary raw materials and fossil fuels with renewable raw materials. The objective of this is to continuously grow the carbon handprint of the company’s actions, the company’s positive effect on the climate. L&T assumes its social responsibility by, for example, also offering jobs to those who are struggling to find employment.
• The value for shareholders consists of L&T’s desire to grow by means of seeking profitable growth exceeding the market growth rate from business operations promoting sustainable development.
Progress made in the implementation of strategy in 2019Structural reforms were implemented in 2019 with the purpose of promoting the execution of the selected strategy and strengthening the market position in the
company’s core businesses. The company streamlined its business portfolio by divesting its renovation and damage repair services businesses and integrating the technical services business into the Facility Services division.
The focus in 2019 was on improving the company’s profitability, the customer experience and the employee experience. New service solutions were developed in all business operations to promote the circular economy and to ensure future growth.
Environmental Services introduced new solutions to promote the recycling of materials, such as the modern waste plastic processing technology which was taken into use in Merikarvia in the autumn. The new facility allows the cleaning and granulation of hard and un clean plastic fractions for use as raw materials in the plastics industry. We also started the Muovimuuvi campaign aimed at bringing one million Finns access to separate collection of plastic and to increase the separate collection of plastic from Finnish companies. We offered our customers new circular economy services to facilitate the service and management of their environmental targets. We also developed completely new circular economy solutions in co-operation with our customers.
Report by the Board of Directors
Lassila & Tikanoja | Financial review 2019 19
KEY FIGURES FINANCIAL STATEMENTSREPORT BY THE BOARD OF DIRECTORSCORPORATE GOVERNANCE
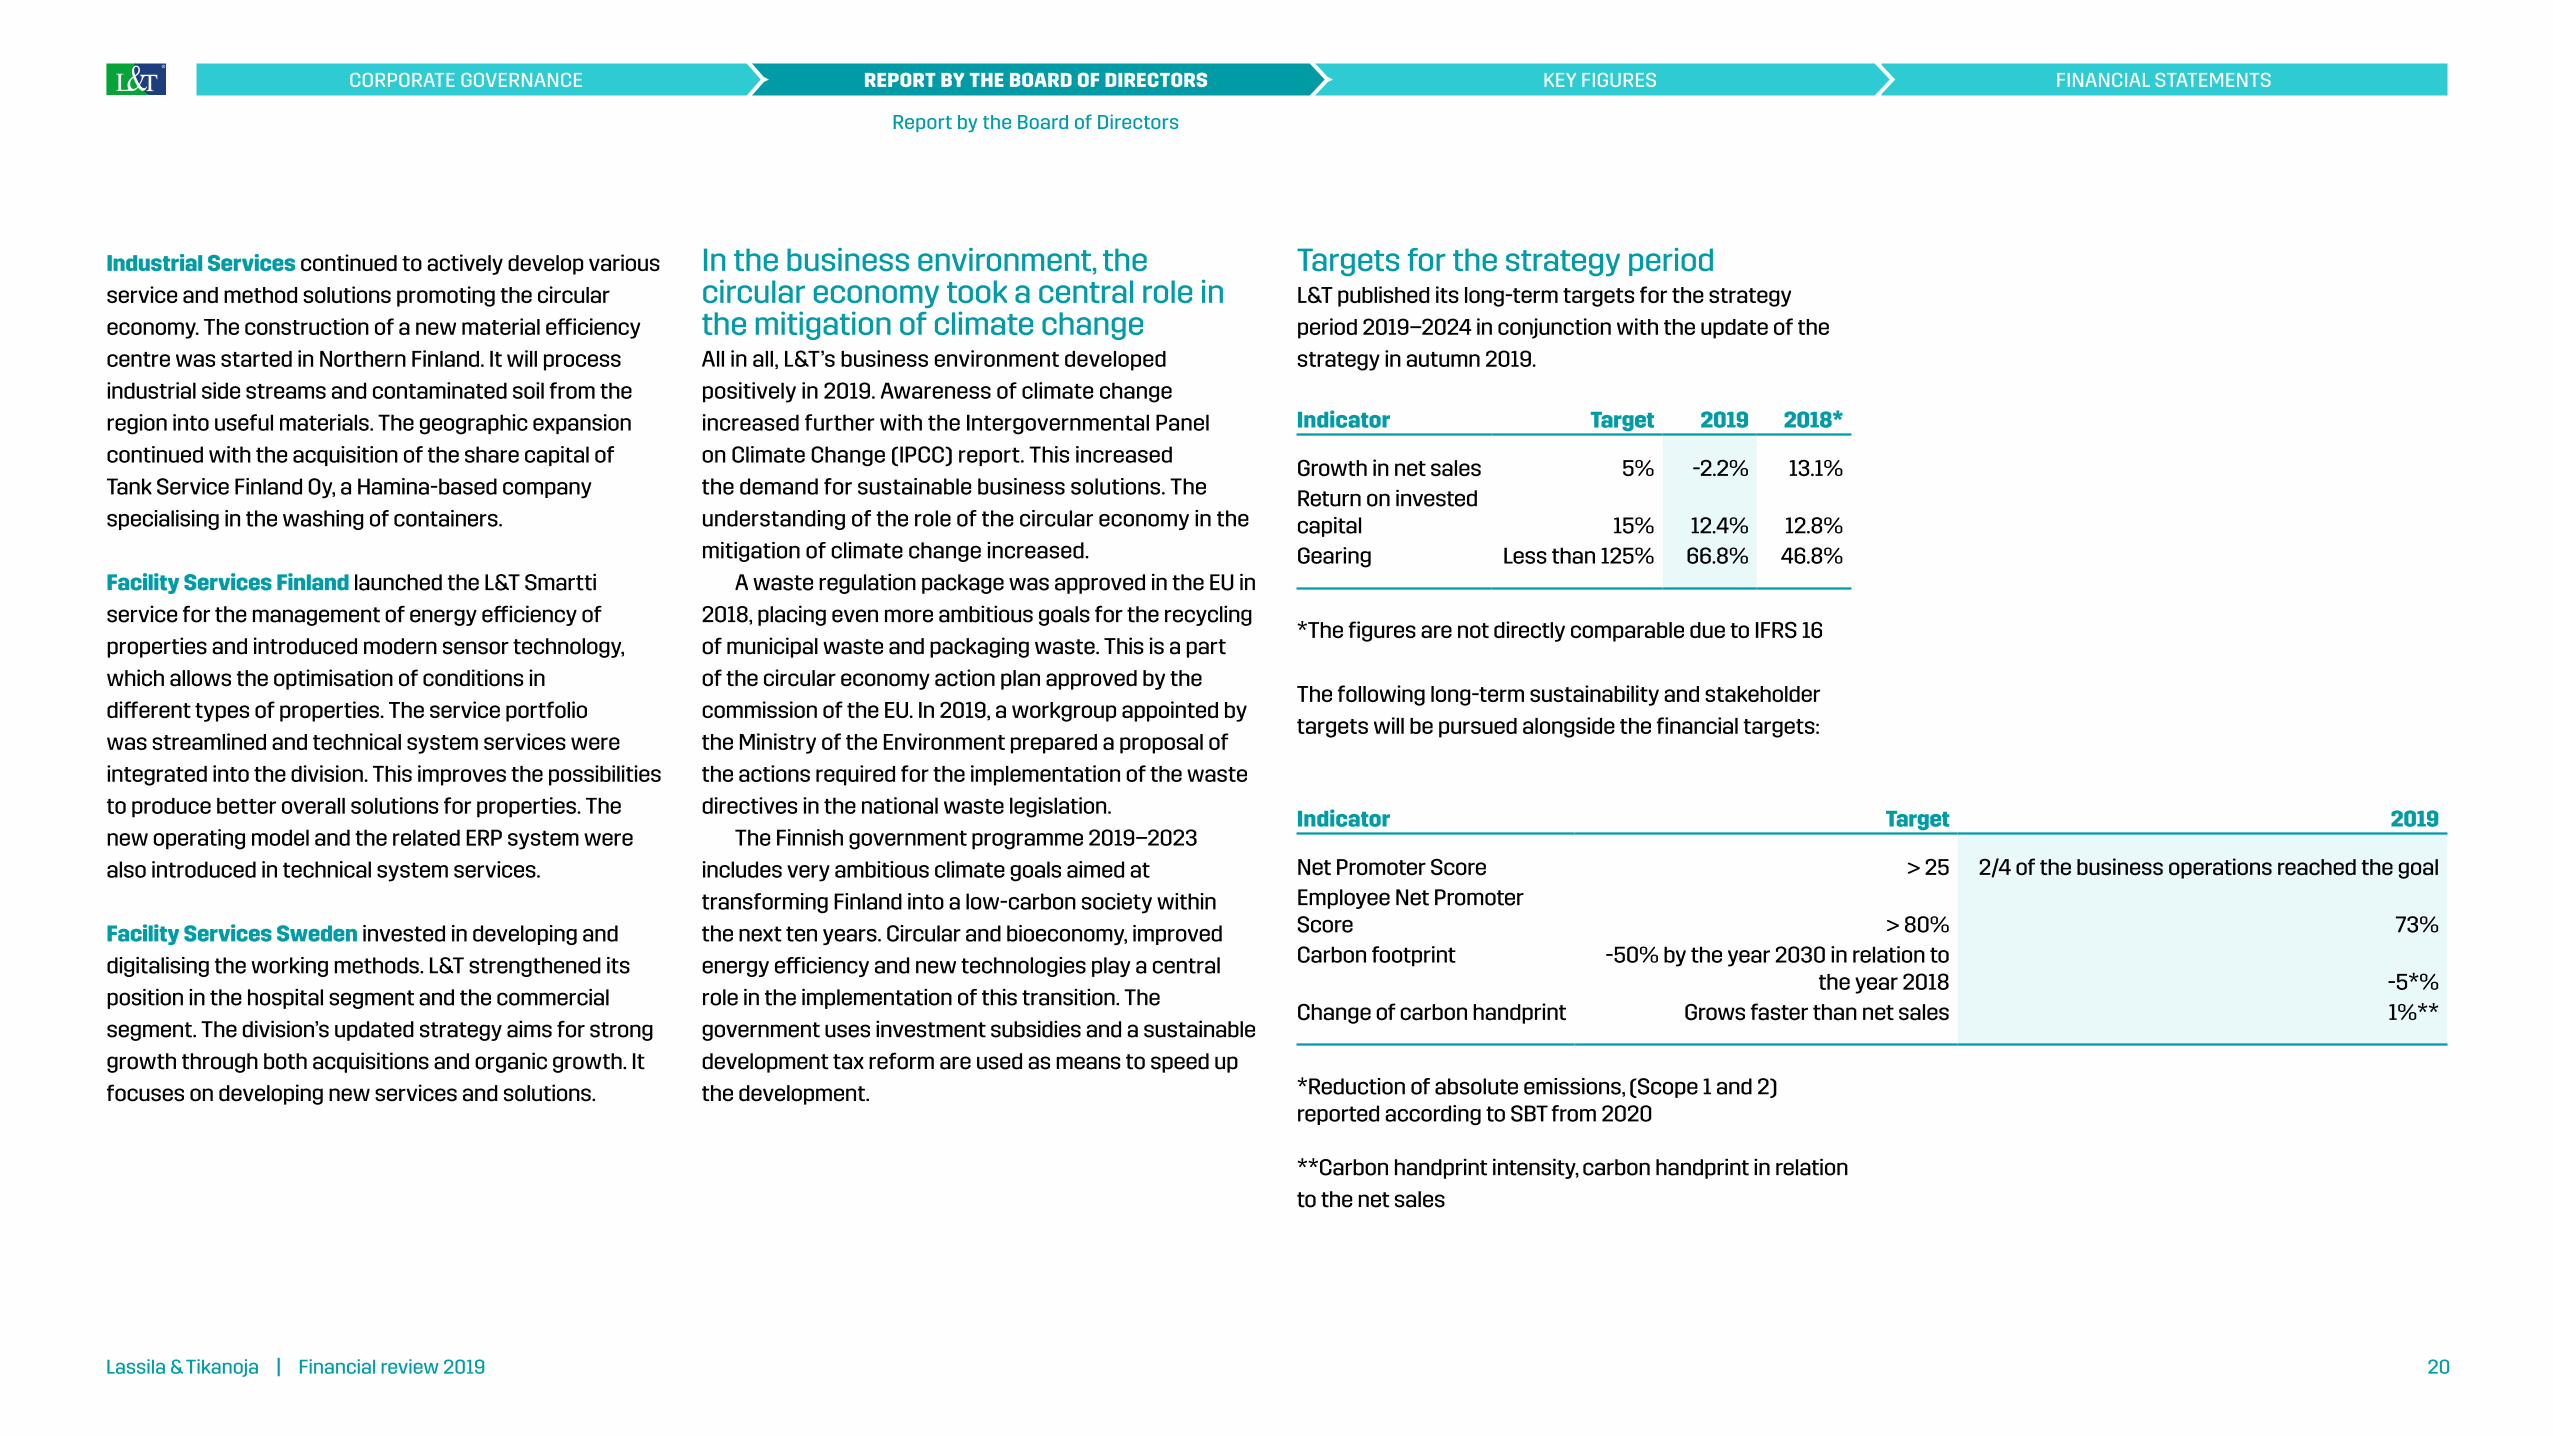
Industrial Services continued to actively develop various service and method solutions promoting the circular economy. The construction of a new material efficiency centre was started in Northern Finland. It will process industrial side streams and contaminated soil from the region into useful materials. The geographic expansion continued with the acquisition of the share capital of Tank Service Finland Oy, a Hamina-based company specialising in the washing of containers.
Facility Services Finland launched the L&T Smartti service for the management of energy efficiency of properties and introduced modern sensor technology, which allows the optimisation of conditions in different types of properties. The service portfolio was streamlined and technical system services were integrated into the division. This improves the possibilities to produce better overall solutions for properties. The new operating model and the related ERP system were also introduced in technical system services.
Facility Services Sweden invested in developing and digitalising the working methods. L&T strengthened its position in the hospital segment and the commercial segment. The division’s updated strategy aims for strong growth through both acquisitions and organic growth. It focuses on developing new services and solutions.
In the business environment, the circular economy took a central role in the mitigation of climate change All in all, L&T’s business environment developed positively in 2019. Awareness of climate change increased further with the Intergovernmental Panel on Climate Change (IPCC) report. This increased the demand for sustainable business solutions. The understanding of the role of the circular economy in the mitigation of climate change increased.
A waste regulation package was approved in the EU in 2018, placing even more ambitious goals for the recycling of municipal waste and packaging waste. This is a part of the circular economy action plan approved by the commission of the EU. In 2019, a workgroup appointed by the Ministry of the Environment prepared a proposal of the actions required for the implementation of the waste directives in the national waste legislation.
The Finnish government programme 2019–2023 includes very ambitious climate goals aimed at transforming Finland into a low-carbon society within the next ten years. Circular and bioeconomy, improved energy efficiency and new technologies play a central role in the implementation of this transition. The government uses investment subsidies and a sustainable development tax reform are used as means to speed up the development.
Targets for the strategy periodL&T published its long-term targets for the strategy period 2019–2024 in conjunction with the update of the strategy in autumn 2019.
Indicator Target 2019 2018*
Growth in net sales 5% -2.2% 13.1%Return on invested capital 15% 12.4% 12.8% Gearing Less than 125% 66.8% 46.8%
*The figures are not directly comparable due to IFRS 16
The following long-term sustainability and stakeholder targets will be pursued alongside the financial targets:
Indicator Target 2019
Net Promoter Score > 25 2/4 of the business operations reached the goalEmployee Net Promoter Score > 80% 73%Carbon footprint -50% by the year 2030 in relation to
the year 2018 -5*%Change of carbon handprint Grows faster than net sales 1%**
*Reduction of absolute emissions, (Scope 1 and 2) reported according to SBT from 2020
**Carbon handprint intensity, carbon handprint in relation to the net sales
Lassila & Tikanoja | Financial review 2019 20
KEY FIGURES FINANCIAL STATEMENTSREPORT BY THE BOARD OF DIRECTORSCORPORATE GOVERNANCE
Report by the Board of Directors

Group net sales and financial performanceNet sales for the financial year 2019 decreased by 2.2 per cent to EUR 784.3 million (802.2). Operating profit was EUR 45.0 million (47.6), representing 5.7 per cent (5.9) of net sales. Earnings per share were EUR 0.90 (0.89).
A capital gain of EUR 7.0 million was recognised on the divestment of the shares in L&T Korjausrakentaminen Oy. Taking the other impacts of the divestment into account, the transaction had an effect of EUR 4.5 million on operating profit for the financial year.
Income statement by quarter
MEUR 10–12/2019 7–9/2019 4–6/2019 1–3/2019 10–12/2018
Net salesEnvironmental services 79.8 75.0 76.8 79.6 80.3Industrial Services 26.0 27.7 26.2 19.0 25.2Facility Services Finland 59.4 59.0 61.3 69.5 66.4Facility Services Sweden 35.8 30.5 33.4 32.1 36.6Interdivision net sales -2.0 -1.7 -1.6 -1.4 -2.1Total 198.9 190.5 196.2 198.8 206.5
Operating profitEnvironmental services 8.2 11.2 8.8 4.6 8.3Industrial Services 1.9 4.4 3.3 0.3 2.6Facility Services Finland -1.3 2.8 -2.0 -3.5 0.0Facility Services Sweden 0.9 1.4 0.8 0.7 1.6Group administration and other -0.8 -1.2 5.9 -1.4 -0.9Total 8.9 18.5 16.8 0.7 11.7
Lassila & Tikanoja | Financial review 2019 21
KEY FIGURES FINANCIAL STATEMENTSREPORT BY THE BOARD OF DIRECTORSCORPORATE GOVERNANCE
Report by the Board of Directors

Income statement by quarter
MEUR 10–12/2019 7–9/2019 4–6/2019 1–3/2019 10–12/2018
EBITDAEnvironmental services 14.6 17.6 15.0 10.8 13.4Industrial Services 4.3 6.6 5.6 2.6 4.6Facility Services Finland 1.8 6.1 1.4 0.1 3.0Facility Services Sweden 2.3 2.7 2.2 2.2 2.2Group administration and other -0.5 -0.9 6.2 -1.2 -0.9Total 22.4 32.1 30.5 14.4 22.4
Operating marginEnvironmental services 10.3 14.9 11.4 5.8 10.4Industrial Services 7.3 15.9 12.7 1.8 10.4Facility Services Finland -2.3 4.7 -3.2 -5.1 0.0Facility Services Sweden 2.6 4.5 2.4 2.1 4.3Total 4.5 9.7 8.6 0.4 5.7
EBITDA %Environmental services 18.3 23.4 19.6 13.5 16.7Industrial Services 16.6 23.9 21.5 13.5 18.3Facility Services Finland 3.0 10.4 2.2 0.2 4.5Facility Services Sweden 6.3 8.9 6.7 6.7 6.1Total 11.3 16.9 15.5 7.2 10.8
Financial income and expenses, net -0.7 -0.9 -1.0 -0.4 -1.0
Share of the result of associated companies
0.0 0.0 0.0 0.0 0.0
Profit before tax 8.2 17.6 15.8 0.4 10.6
Net sales of international operations by country
MEUR 2019 2018*
Sweden 132.4 134.4Russia 10.4 8.9
Lassila & Tikanoja | Financial review 2019 22
KEY FIGURES FINANCIAL STATEMENTSREPORT BY THE BOARD OF DIRECTORSCORPORATE GOVERNANCE
Report by the Board of Directors

Division reviewsEnvironmental ServicesThe Environmental Services division’s net sales for 2019 amounted to EUR 311.2 million (309.4). Operating profit grew by 3.8 per cent to EUR 32.8 million (31.6).
Demand remained good particularly in the retail and industrial segments. Labour and subcontracting costs were increased by a shortage of drivers and the challenging weather conditions during the first quarter. Nevertheless, operating profit increased due to the enhanced efficiency of operations and the improved result of the renewable energy sources business.
Industrial ServicesThe Industrial Services division’s net sales amounted to EUR 98.9 million (96.5). Operating profit was EUR 9.9 million (10.0).
The demand for services was strong almost throughout the year. In the latter part of the year, industrial demand was affected by the increased uncertainty in the world economy as well as industrial action. The slowing down of the construction sector was compensated by the increased project business and new customer accounts in industrial sites. The division’s profitability remained at a good level.
Facility Services FinlandThe Facility Services Finland division’s net sales for the full year totalled EUR 249.1 million (269.6). The decline in net sales was due to the divestment of L&T Korjausrakentaminen Oy. Operating profit was EUR -4.1 million (5.2) excluding the effect of the divestment of L&T Korjausrakentaminen Oy.
The substantial year-on-year decline in operating profit was mainly due to costs related to the implementation of a new operating model in the technical services business, the contract portfolio of the property maintenance business being lower than in the comparison period as well as costs associated with the efficiency improvement and restructuring programme implemented in the fourth quarter.
Facility Services SwedenThe Facility Services Sweden division’s net sales for 2019 amounted to EUR 131.8 million (134.0). Operating profit was EUR 3.8 million (4.2). Measured in SEK, net sales increased by 1.1 per cent.
The demand for technical services increased in Sweden, but sales growth was slowed by problems related to the availability of labour. Facility Services Sweden implemented organisational reforms and a cost savings programme in the fourth quarter. Measured in SEK, the operating profit of the technical services business in Sweden was on par with the comparison period, while the operating profit of the cleaning business declined year-on-year.
Net sales by division MEUR 2019 2018 Muutos %
Environmental services 311.2 309.4 0.6%Industrial Services 98.9 96.5 2.4%Facility Services Finland 249.1 269.6 -7.6%Facility Services Sweden 131.8 134.0 -1.7%Eliminations -6.7 -7.3Total 784.3 802.2 -2.2%
Operating profit by division
MEUR 2019 % 2018 % Muutos %
Environmental services 32.8 10.5% 31.6 10.2% 3.8%Industrial Services 9.9 10.1% 10.0 10.4% -0.9%Facility Services Finland -4.1 -1.6% 5.2 1.9% -177.9%Facility Services Sweden 3.8 2.9% 4.2 3.1% -10.1%Group administration and other 2.5 -3.5Total 45.0 5.7% 47.6 5.9% -5.5%
Lassila & Tikanoja | Financial review 2019 23
KEY FIGURES FINANCIAL STATEMENTSREPORT BY THE BOARD OF DIRECTORSCORPORATE GOVERNANCE
Report by the Board of Directors

Financing and capital expenditureIn 2019, cash flow from operating activities amounted to EUR 94.5 million (90.1). A total of EUR 14.2 million in working capital was released (EUR 9.9 million released).
Interest-bearing liabilities on the balance sheet were increased by approximately EUR 53.8 million by the entry into force of IFRS 16 at the beginning of 2019. This had a negative effect on the gearing rate as well as the equity ratio. The Group issued a separate release on the effects of the transition on 25 April 2019.
At the end of the year, interest-bearing liabilities amounted to EUR 177.4 million (152.2). Net interest-bearing liabilities totalled EUR 135.6 million (97.8). Net interest-bearing liabilities increased by EUR 37.8 million year-on-year due to the entry into force of IFRS 16. Loans totalling EUR 3.9 million matured in 2019. In August 2019, the Group made an early repayment of a loan of EUR 25 million that was originally set to mature in 2020. The average interest rate on long-term loans excluding IFRS 16 liabilities, with interest rate hedging, was 1.3 per cent (1.2).
Net financial expenses in 2019 amounted to EUR -3.0 million (-4.5). The entry into force of IFRS 16 increased financial expenses, while exchange rate fluctuations reduced them. Net financial expenses were 0.4 per cent (0.6) of net sales.
The equity ratio was 35.6 per cent (38.1) and the gearing rate was 66.8 per cent (46.8). Liquid assets at the end of the year amounted to EUR 41.8 million (54.3). The equity ratio was negatively affected by the entry into force of IFRS 16 at the beginning of 2019.
Key figures for financing
2019 2018
Interest-bearing liabilities, EUR million
177.4 152.2
Net interest-bearing liabilities, EUR million
135.6 97.8
Net finance costs, EUR million -3.0 -4.5Net finance costs, % of net sales
0.4 0.6
Net finance costs, % of operating profit
6.7 9.4
Equity ratio, % 35.6 38.1Gearing, % 66.8 46.8Cash flow from operating activities, EUR million
94.5 90.1
Change in working capital in the cash flow statement, EUR million
14.2 9.9
Invested capital
MEUR 2019 2018
Non-current assets 400.7 355.0Inventories and receivables 141.1 152.0Liquid assets 41.8 54.3Deferred tax liability -29.2 -29.3Trade and other payables -165.3 -162.4Provisions -7.1 -6.6Other non-interest-bearing liabilities
-1.6 -1.9
Invested capital 380.5 361.1
Capital expenditure by balance sheet item
MEUR 2019 2018
Real estate/Properties 5.1 1.2 Machinery, equipment and other property, plant and equipment
37.0 31.0
Goodwill and other intangible rights arising from business acquisitions
0.5 0.3
Other intangible assets 3.5 5.2 Other non-current assets 0.0 0.0 L&T total 46.1 37.8
Capital expenditure by division
MEUR 2019 2018
Environmental services 28.2 20.7 Industrial Services 12.3 8.4 Facility Services Finland 4.7 7.6 Facility Services Sweden 0.8 1.1 Group administration and other 0.2 0.0 L&T total 46.1 37.8
Loans, liabilities and contingent liabilities to related partiesRelated-party transactions are accounted for in Note 5.4 Related-party transactions.
Changes in Group structure L&T sold the entire share capital of L&T Korjausrakentaminen Oy to Recover Nordic Group.
Lassila & Tikanoja | Financial review 2019 24
KEY FIGURES FINANCIAL STATEMENTSREPORT BY THE BOARD OF DIRECTORSCORPORATE GOVERNANCE
Report by the Board of Directors

Members of the Group Executive Board 31 December 2019
• Eero Hautaniemi, President and CEO• Valtteri Palin, CFO• Tuomas Mäkipeska, Vice President, Facility
Services Finland• Petri Salermo, Vice President, Environmental
Services• Erik Sundström, Vice President, Facility Services
Sweden• Antti Tervo, Vice President, Industrial Services• Sirpa Huopalainen, General Counsel• Jorma Mikkonen, Director, Corporate Relations and
Sustainability
Master of Laws (trained at the bench) Hilppa Rautpalo (born 1974) was appointed as the Director of Human Resources and as a member of the Group Executive Board at L&T. She took up her post on 1 January 2020 and reports to President and CEO Eero Hautaniemi.
Personnel
Employees by country at year end
Full-time and part-time, total 2019 2018
Suomi 6,479 6,871Ruotsi 1,355 1,422Venäjä 373 307Yhteensä 8,207 8,600
In 2019, the average number of employees converted into full-time equivalents was 7,308 (7,566). At the end of the period, L&T’s had 8,207 (8,600) full-time and part-time employees. Of these, 6,479 (6,871) worked in Finland and 1,728 (1,729) in other countries.
Resolutions by the Annual General MeetingThe Annual General Meeting, which was held on 14 March 2019, adopted the financial statements and consolidated financial statements for 2018 and released the members of the Board of Directors as well as the President and CEO from liability.
The Annual General Meeting resolved that a dividend of EUR 0.92 per share, totalling EUR 35.3 million, be paid on the basis of the balance sheet adopted for the financial year 2018. It was decided that the dividend be paid on 25 March 2019.
The Annual General Meeting confirmed the number of members of the Board of Directors as six. Heikki Bergholm, Teemu Kangas-Kärki, Laura Lares, Sakari Lassila, Miikka Maijala and Laura Tarkka were re-elected to the Board until the end of the following Annual General Meeting.
KPMG Oy Ab, Authorised Public Accountants, was elected auditor. KPMG Oy Ab named Leenakaisa Winberg, Authorised Public Accountant, as its principal auditor.
The Annual General Meeting resolved to amend Articles 6, 13, 4 and 12 of the company’s Articles of Association. Following the amendment, Article 6 reads as follows: ”An Authorised Public Accountants Organisation shall be elected as the Company’s auditor. The auditor shall designate an Authorised Public Accountant having principal responsibility. The term of the auditor shall be the financial year of the Company and the duties of the auditor expire at the end of the first Annual General Meeting of Shareholders following the election.” At the same time, Article 13, Point 9, concerning matters to be
handled by the Annual General Meeting, was amended to correspond to the new wording of Article 6. Furthermore, Article 4 of the Articles of Association was amended so that the following provision concerning the upper age limit of the members of the Board of Directors was removed: “No person who is 70 years of age or older can be elected to the Board of Directors”, and Article 12 was amended so that the following provision concerning voting limitation was removed: “At the General Meeting of Shareholders, no shareholder may cast more than one fifth (1/5) of the total number of votes represented at the General Meeting of Shareholders.”
The resolutions of the Annual General Meeting were announced in more detail in a stock exchange release on 14 March 2019.
Lassila & Tikanoja | Financial review 2019 25
KEY FIGURES FINANCIAL STATEMENTSREPORT BY THE BOARD OF DIRECTORSCORPORATE GOVERNANCE
Report by the Board of Directors

The most significant impacts of L&T’s operations become concrete in the sustainability benefits created for our customers. This guides us to continuously seek better results in the utilisation of customer materials, reduction of emissions and energy consumption as well as utilisation of new, environmentally sustainable methods and the development of services promoting the circular economy.
Due to the nature and extent of L&T’s operations, the company has a significant impact on controlling climate change in its divisions: Environmental Services, Industrial Services and Facility Services. The goal is, therefore, to increase the carbon handprint of operations, i.e. the positive climate impacts, while also reducing the company’s own carbon footprint by, for instance, reducing the emissions caused by heavy vehicles.
L&T currently has 8,200 employees in Finland, Sweden, and Russia. L&T is a major employer and service company, and it carries its social responsibility by taking care of the well-being and the ability to work of our
personnel. The company believes that good employee experience is strongly correlated with good customer experience. Furthermore, L&T wants to promote fair treatment in the society in cooperation with its customers through employment, and does this by, for example, providing work for people who are struggling to find employment.
Through its services, L&T is a prominent participant in the day-to-day workings of society, which is the company makes no compromises when it comes to the regulatory compliance and sustainability of its operations. L&T takes care of its responsibilities in terms of the environment and as an employer and minimises the environmental impacts of its operations. The company also requires that its suppliers operate in accordance with its sustainability principles. L&T is committed to support the UN sustainable development goals and the Global Compact initiative and its principles pertaining to human rights, labour, the environment and anti-corruption.
Sustainability reportingThe company reports on the progress of the sustainability programme in its sustainability report, which is published annually as part of our Annual Report. The sustainability report of 2019 has been compiled in accordance with the core level of the GRI (Global Reporting Initiative) Standards reporting instructions. Its key indicators related to environmental sustainability and responsibility for personnel are certified by a third party. The company also reported the climate impacts of its operations for the first time in 2019 according to the Task Force on Climate-related Financial Disclosures (TCFD) recommendations.
For more information about L&T’s sustainability report, see www.lt.fi/annualreport2019.
Our sustainability efforts are guided by our sustainability programmeL&T’s sustainability is guided by the sustainability programme. The programme considers the material aspects of the company’s sustainability and sets measurable targets where applicable. The focal points of our sustainability programme are determined based on the impacts of the company’s operations, the expectations of the central stakeholders and the strategic priorities. Additionally, the particular nature of the business operations and operating environment of a service business in the environmental sector as well as the UN Sustainable Development Goals and Global Compact objectives have been taken into account.
The most significant sustainability goals, i.e. the company’s climate impacts and the Employee Net Promoter Score, were added to the L&T’s long-term strategic goals in the strategy update of 2019. They were given an even more central role in the company’s sustainability programme as well.
Statement of non-financial informationSustainability is an integral aspect of Lassila & Tikanoja’s strategy, business operations and day-to-day work. The company believes that when we act sustainably and create value for our various stakeholders, the value created for our shareholders will also increase.
Lassila & Tikanoja | Financial review 2019 26
KEY FIGURES FINANCIAL STATEMENTSREPORT BY THE BOARD OF DIRECTORSCORPORATE GOVERNANCE
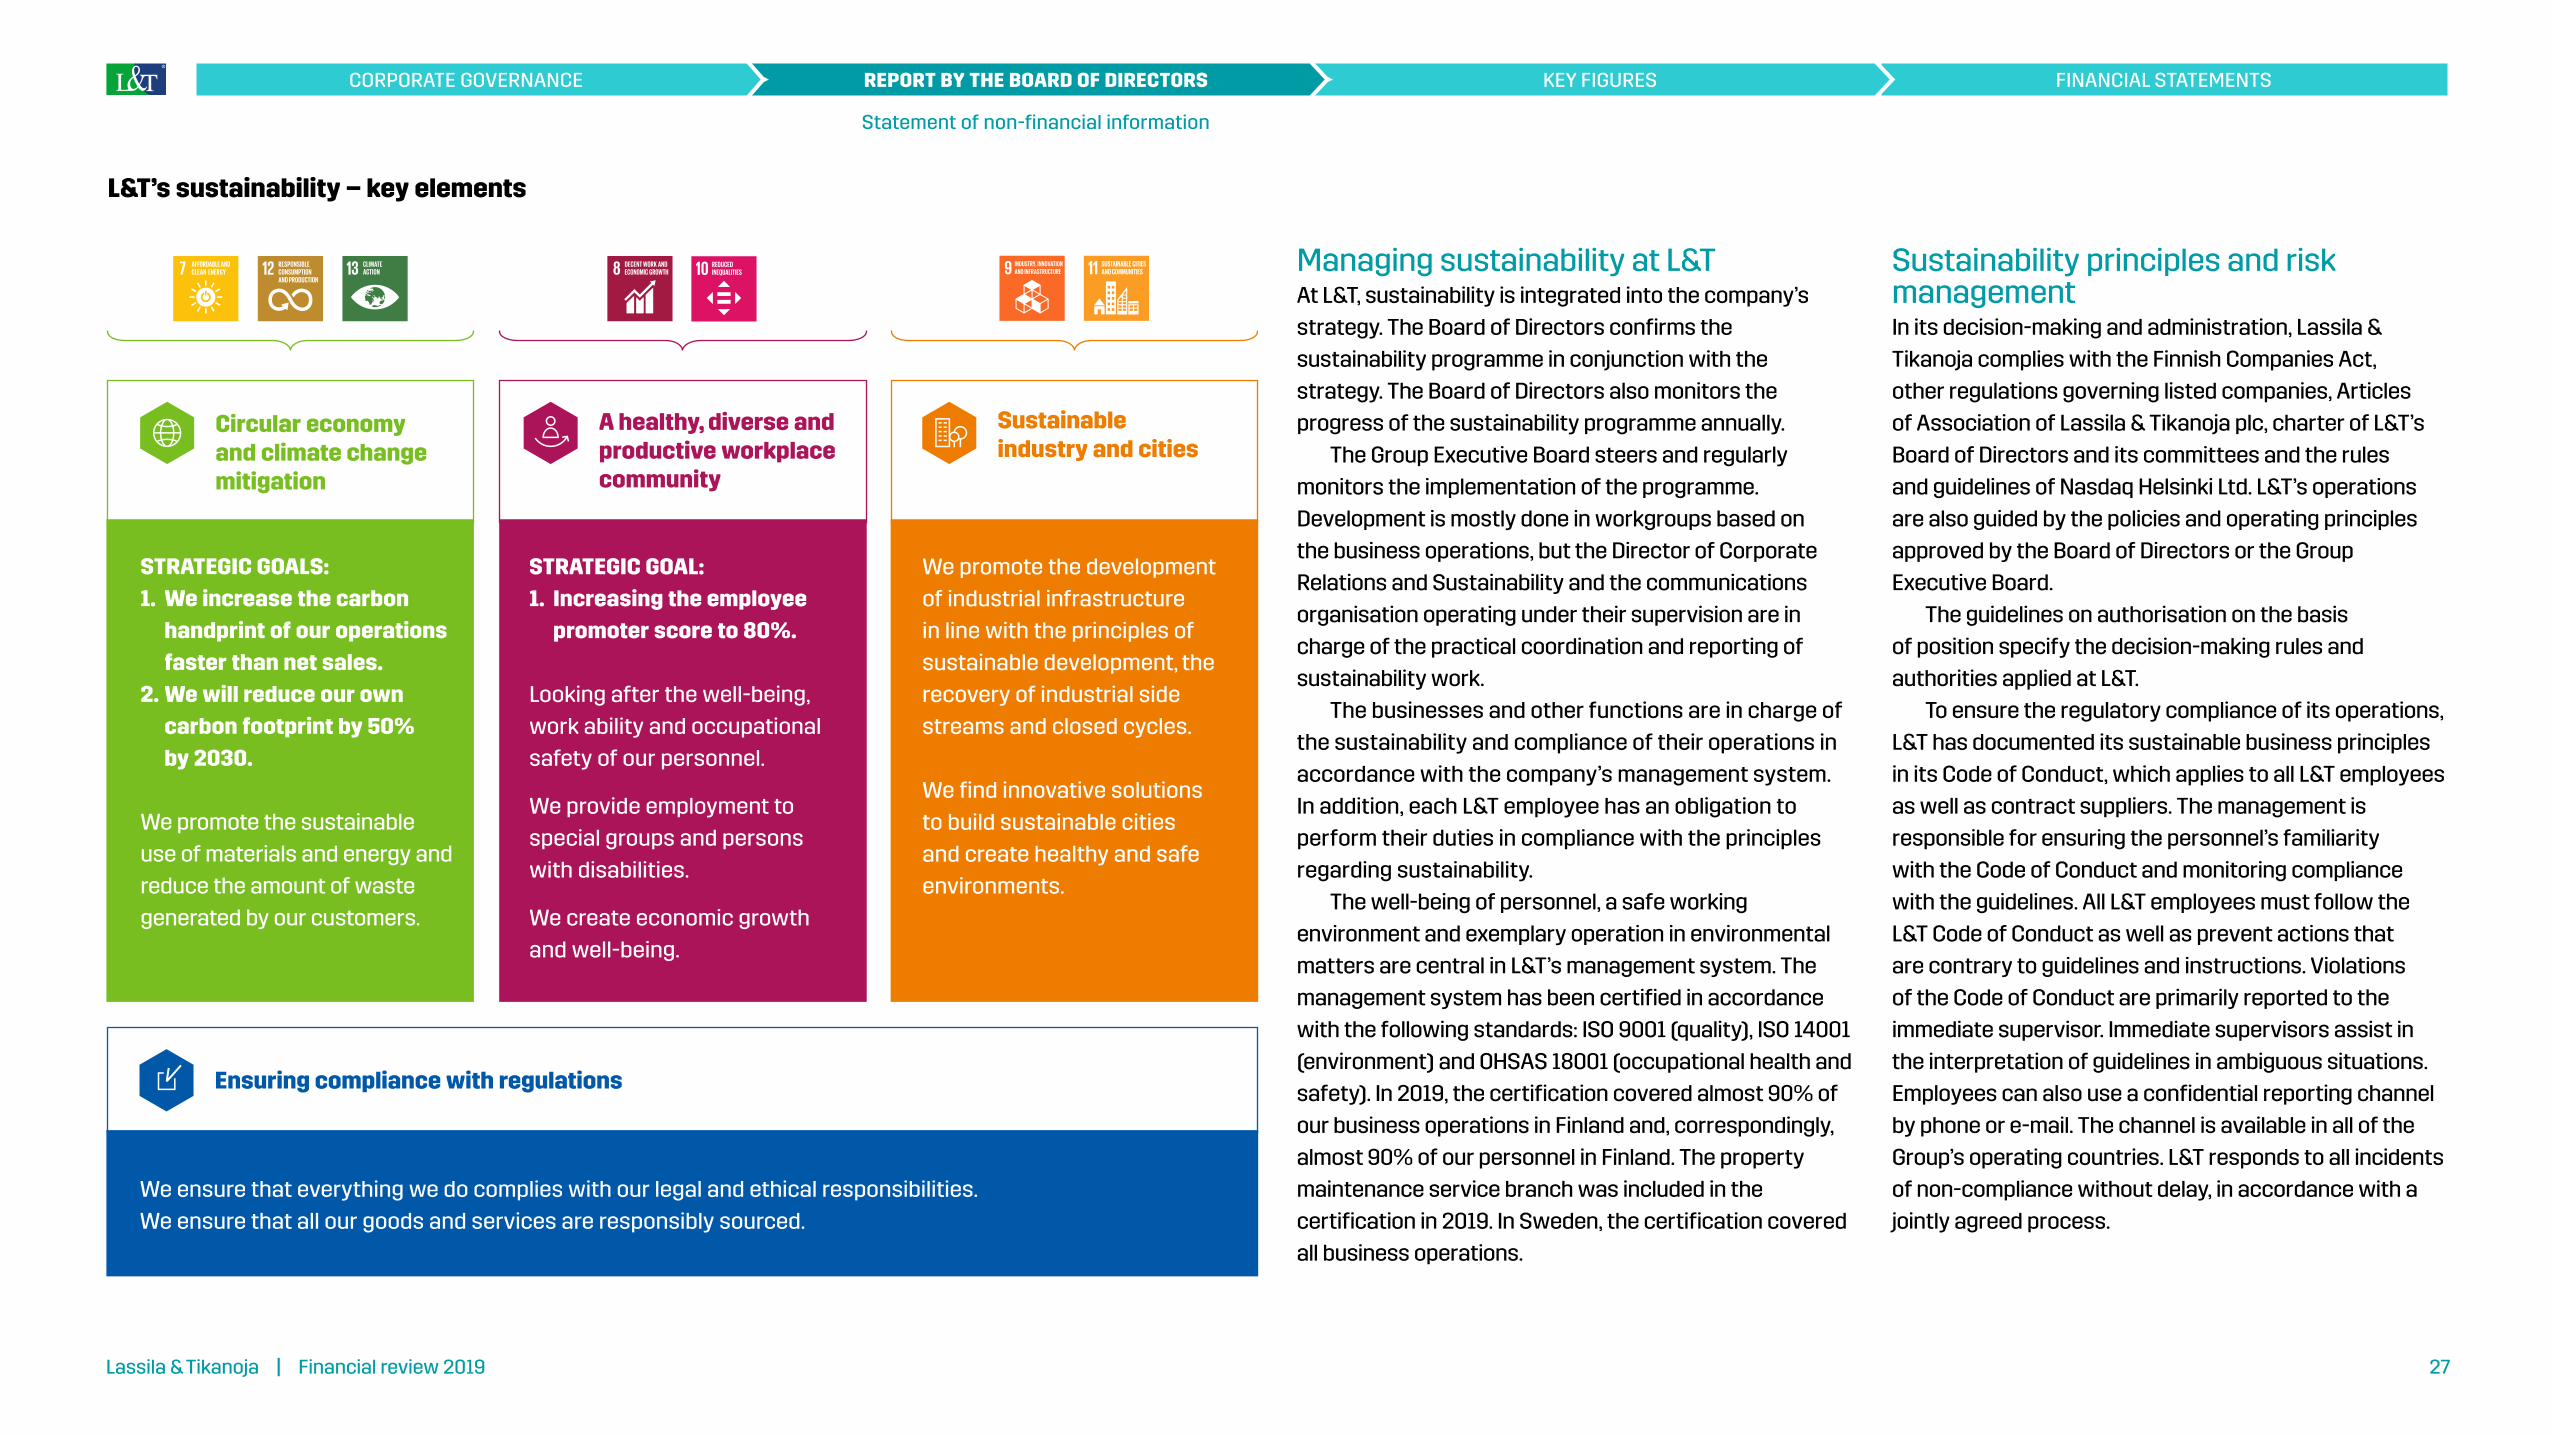
Managing sustainability at L&TAt L&T, sustainability is integrated into the company’s strategy. The Board of Directors confirms the sustainability programme in conjunction with the strategy. The Board of Directors also monitors the progress of the sustainability programme annually.
The Group Executive Board steers and regularly monitors the implementation of the programme. Development is mostly done in workgroups based on the business operations, but the Director of Corporate Relations and Sustainability and the communications organisation operating under their supervision are in charge of the practical coordination and reporting of sustainability work.
The businesses and other functions are in charge of the sustainability and compliance of their operations in accordance with the company’s management system. In addition, each L&T employee has an obligation to perform their duties in compliance with the principles regarding sustainability.
The well-being of personnel, a safe working environment and exemplary operation in environmental matters are central in L&T’s management system. The management system has been certified in accordance with the following standards: ISO 9001 (quality), ISO 14001 (environment) and OHSAS 18001 (occupational health and safety). In 2019, the certification covered almost 90% of our business operations in Finland and, correspondingly, almost 90% of our personnel in Finland. The property maintenance service branch was included in the certification in 2019. In Sweden, the certification covered all business operations.
Sustainability principles and risk managementIn its decision-making and administration, Lassila & Tikanoja complies with the Finnish Companies Act, other regulations governing listed companies, Articles of Association of Lassila & Tikanoja plc, charter of L&T’s Board of Directors and its committees and the rules and guidelines of Nasdaq Helsinki Ltd. L&T’s operations are also guided by the policies and operating principles approved by the Board of Directors or the Group Executive Board.
The guidelines on authorisation on the basis of position specify the decision-making rules and authorities applied at L&T.
To ensure the regulatory compliance of its operations, L&T has documented its sustainable business principles in its Code of Conduct, which applies to all L&T employees as well as contract suppliers. The management is responsible for ensuring the personnel’s familiarity with the Code of Conduct and monitoring compliance with the guidelines. All L&T employees must follow the L&T Code of Conduct as well as prevent actions that are contrary to guidelines and instructions. Violations of the Code of Conduct are primarily reported to the immediate supervisor. Immediate supervisors assist in the interpretation of guidelines in ambiguous situations. Employees can also use a confidential reporting channel by phone or e-mail. The channel is available in all of the Group’s operating countries. L&T responds to all incidents of non-compliance without delay, in accordance with a jointly agreed process.
Circular economy and climate change mitigation
A healthy, diverse and productive workplace community
Sustainable industry and cities
Ensuring compliance with regulations
STRATEGIC GOALS: 1. We increase the carbon
handprint of our operations faster than net sales.
2. We will reduce our own carbon footprint by 50% by 2030.
We promote the sustainable use of materials and energy and reduce the amount of waste generated by our customers.
STRATEGIC GOAL: 1. Increasing the employee
promoter score to 80%. Looking after the well-being, work ability and occupational safety of our personnel.
We provide employment to special groups and persons with disabilities.
We create economic growth and well-being.
We promote the development of industrial infrastructure in line with the principles of sustainable development, the recovery of industrial side streams and closed cycles.
We find innovative solutions to build sustainable cities and create healthy and safe environments.
We ensure that everything we do complies with our legal and ethical responsibilities.We ensure that all our goods and services are responsibly sourced.
L&T’s sustainability – key elements
Lassila & Tikanoja | Financial review 2019 27
KEY FIGURES FINANCIAL STATEMENTSREPORT BY THE BOARD OF DIRECTORSCORPORATE GOVERNANCE
Statement of non-financial information

All new L&T employees studied the Code of Conduct as part of their induction training programme in 2019. The Code of Conduct was introduced to all employees in Sweden. In Finland, we created a customised online course of the Code for employees and started introducing it in the autumn with our property maintenance and Environmental Services staff. The goal is to have all employees take the online course in 2020.
Managing sustainability-related risks is part of the Group’s comprehensive risk management. The risk management process is described in the Corporate Governance Statement and the key risks are explained under Risks and risk management.
SustainabilityL&T puts sustainability into practice particularly through the services it produces for customers. The primary goal is always to direct materials collected from customers towards reuse or recycling, guided by the order of priority as stipulated by law and the circular economy approach.
The company seeks to constantly increase the carbon handprint of its operations. This comes to stand when its customers replace primary raw materials with secondary raw materials or replace fossil fuels with bio and solid recovered fuels (SRF) or succeed to reduce, with the help of L&T’s service, the amount of waste generated in their operations. While the carbon handprint of L&T’s operations increases, the carbon footprint of its customers decreases. The company thereby supports its customers in reaching their environmental goals.
In addition to increasing its carbon handprint, L&T pursues to reduce the environmental impacts of its own operations. The most significant direct environmental impacts of L&T’s operations are the emissions generated by collection and transport services. The company is actively working to reduce them by means of, for instance, developing an economic driving style and improving the efficiency of routes. A further objective is that no environmental offences or serious incidents of environmental damage should result from the Group’s own operations.
L&T’s environmental policy specifies the environmental aspects and principles that the Group observes in both its own operations as well as in the services it produces for customers. The Group’s operations are founded on an uncompromising compliance with environmental legislation and standards as well as on the principle of continuous improvement in accordance with the ISO 14001 certified environmental management system.
Professional waste treatment operations are subject to environmental permits and regulatory compliance. In 2019, L&T had 67 (70) environmental permits that determined how the Group managed and monitored environmental matters. Facilities subject to environmental permits have contingency plans and rescue plans that determine how they are prepared for significant environmental incidents. Environmental issues are also covered in regularly conducted internal audits.
L&T requires the responsible management of environmental issues of its partners and suppliers. This requirement is factored into the procurement process e.g. in the form of self-assessments. Waste is only handed over to operators that are authorised to receive or process it. Acquisitions are subject to detailed due diligence processes.
The most significant environmental risks involved in L&T’s operations are related to the fleet, waste storage and processing as well as chemical safety. These risks and their management are described in more detail under Risks and risk management.
Goals and resultsL&T’s strategic goal is to increase the carbon handprint of its operations faster than the net sales. L&T’s carbon handprint, or the emission reductions created by its operations, remained at the previous year’s level and totalled about 1.2 million (1.2) CO2 equivalent tonnes in 2019.
Furthermore, the company has set a goal of halving the emissions caused by its operations by 2030 compared to 2018. In 2019, L&T’s own operations generated 45.3 thousand CO2 equivalent tonnes of absolute emissions (47.8).
In 2019, L&T again achieved excellent results in the international CDP climate disclosure report. With a Leadership-level grade A-, the second best, the company was ranked among the world’s top companies
in the CDP Climate assessment. We will report our emission reduction development according to Science Based-targets from 2020 onwards.
To reduce the environmental impact of the materials collected from customers and to promote the circular economy, L&T continuously strives to find new solutions to recover materials at the highest possible refining rate and in accordance with the order of priority in waste management.
In 2019, the reuse and recycling rate of waste collected from the company’s customers rose to 54.8 per cent (54.2). Over 400,000 tonnes of materials were delivered to reuse and recycling. The report covers municipal waste collected from corporate customers, hazardous waste, industrial waste and construction waste both in Finland and in Russia.
No major environmental damage incidents occurred in the company’s operations in 2019.
Social responsibility: employees and human rightsAs a major employer and service enterprise, the focus of L&T’s social sustainability is on the Group’s employees. The material aspects of L&T’s responsibility for its employees include increasing job satisfaction, strengthening the work ability of L&T personnel and promoting occupational safety. The company also wants to work actively for the promotion of employment of special groups, such as immigrants and persons with reduced work ability.
Lassila & Tikanoja | Financial review 2019 28
KEY FIGURES FINANCIAL STATEMENTSREPORT BY THE BOARD OF DIRECTORSCORPORATE GOVERNANCE
Statement of non-financial information
The company does not tolerate any kind of discrimination, harassment, bullying, racism or inappropriate treatment or the use of child labour, any form of forced labour or any other practices in violation with basic human rights in its own operations or as part of its supply chain.
L&T observes the UN Declaration of Human Rights and workers’ rights as defined by the International Labour Organisation (ILO). L&T is committed to supporting the UN Global Compact initiative and its principles pertaining to human rights and labour.
National legislation, agreements and other obligations are applied in employment relationships. L&T respects the employees’ freedom to unionise. L&T monitors its personnel’s compliance with collective agreements, environmental legislation, labour law, occupational safety legislation and regulations pertaining to financial management. The Group is also compliant with the applicable legislation governing contractors’ obligations and liability, and requires the same of its suppliers.
The operations are guided by the Group’s personnel policy, the OHSAS 18001 certified management system and the principles governing occupational safety manage-ment and sustainable business (Code of Conduct).
The most significant personnel risks in L&T’s operations are related to the availability of competent and motivated employees, the potential weakening of job satisfaction and the potential increase of costs related to disabilities and accidents. Risks related to human rights have been assessed as part of the risk
management process. However, as L&T mainly operates in Finland and Sweden with local partners, no significant risks related to human rights have been identified in the Group’s operations. These risks and their management are described in more detail under Risks and risk management in this document.
Goals and resultsL&T’s has set a goal of increasing the Employee Net Promoter Score to 80%. Employee satisfaction was measured twice in 2019 using the renewed Fiilinki measurement (Pulsen in Sweden). According to the latest measurement, Employee Net Promoter Score was 73% (72) in 10/2019. Employee Net Promoter Score improved in Finland and especially in Sweden where the improvement was significant.
As part of work ability management, L&T’s objectives are to reduce sickness-related absences to 4.5% and raise the average retirement age to 65 years on the long run. In 2019, the sickness-related absence rate was 5.0% (5.0) in Finland, 5.2 (5.1) in Sweden and 2.4 (2.7) in Russia. In order to change the development of sickness-related absences to a decrease, the focused implementation of the action plan for promoting health will continue in 2020. The average retirement age (including retirement on old-age pension and disability pension) was 63.1 years (63.2) in Finland and 63.2 (63.2) with no change from the previous year.
In occupational safety, L&T pursues continuous improvement with an ultimate goal of zero accidents. In
2019, the overall accident frequency was in line with the target and improved from the previous year, 23 (25) in the whole company. LTA, which measures accidents leading to lost time, was also unchanged at 14 (14), which does not meet our target. In what follows, the company will focus even more carefully on including all L&T employees in safety work.
There were no fatal accidents or cases of occupational illnesses at L&T in 2019. There were no grievances related to human rights or incidents of discrimination at L&T either.
Anti-corruption and briberyL&T’s procurement processes are transparent and procurement decisions are based on competitive supply contracts. Procurement is guided by the Group’s procurement principles and the more detailed procurement guidelines. Mandates and the limits for decision-making in terms of procurement are defined in the company’s guidelines on authorisation on the basis of position.
In case of potential conflicts of interests in procurement processes, the persons concerned are disqualified from the decision-making. Supplier co-operation must not involve any bribery or the kind of hospitality or exchange of gifts that could influence procurement decisions.
L&T is committed to supporting the UN Global Compact initiative and its anti-corruption principles. The prevention of corruption and bribery is based
on national legislation and agreements. Internally, operations are guided by L&T’s sustainable business principles (Code of Conduct), which include anti-bribery and corruption guidelines related to, among other things, accepting and offering gifts and hospitality as well as the avoidance of conflicts of interest. The company also adheres to a separately defined permit procedure to ensure that all customer events are appropriate and that all sponsorships and supporting marketing operations are transparent.
L&T mainly operates with local partners in Finland and Sweden, which improves transparency with respect to its partners’ sustainability. Operations with significant suppliers are managed through regular supplier co-operation and monitored according to separately agreed performance indicators. Contract suppliers are required to comply with L&T’s Code of Conduct. We ensure the sustainability of our suppliers’ operating methods through self-assessment surveys, supplier audits, analyses of suppliers’ financial circumstances or other appropriate means. Our primary assurance measures are targeted at our most significant suppliers.
There were no incidents of bribery or corruption at L&T in 2019.
Research and developmentResearch expenditure is recognised as an expense during the period in which it is incurred. Development expenditure is capitalised when the company can demonstrate the technical feasibility and commercial
Lassila & Tikanoja | Financial review 2019 29
KEY FIGURES FINANCIAL STATEMENTSREPORT BY THE BOARD OF DIRECTORSCORPORATE GOVERNANCE
Statement of non-financial information

potential of the product under development and when the acquisition cost can be reliably determined. Other development expenditure is recognised as an expense.
The company’s current capitalised development expenditure is mainly related to software and system projects. Development expenditure of EUR 3.2 million (4.6) on software projects was capitalised in the balance sheet. Costs of software projects are capitalised starting from the time when the projects move out of the research phase into the development phase and the outcome of the project is an itemisable intangible asset.
For the most part, the goal of product development recognised as an expense in the income statement is to give L&T’s service offering a competitive edge and thereby to help the company achieve its growth targets.
Risk managementL&T has a defined risk management process that includes a review of financial, strategic, operational and damage-related risks.
Key risk management principlesRisk management at L&T aims to identify significant risk factors, prepare for them and manage them in an optimal way so that the company’s strategic and financial objectives are achieved. Comprehensive risk management endeavours to manage the Group’s risk as a whole and not just individual risk factors. The risk management process also aims to assess the opportunities associated with risks.
ResponsibilitiesThe principles of L&T’s risk management are approved by the company’s Board of Directors. The Board monitors the implementation of risk management and assesses the efficiency of the methods employed. The President and CEO is responsible for the organisation and implementation of risk management. Risk management at L&T Group is controlled by the risk management policy confirmed by L&T’s Board of Directors. The policy specifies the objectives and principles, organisation and responsibilities and procedures of the Group’s risk management. The Group’s financing policy confirmed by L&T’s Board of Directors is followed in the management of financial risks. The principles for insurance risk management are specified in the Insurance Policy.
Identification, assessment and reporting of risksRisks are surveyed regularly and systematically at both division and company level and in central functions considered to be critical. The significance of risks is assessed by a risk matrix. Measures for managing and minimising the identified risks are prepared and responsibility for these measures is allocated to specified individuals or units. The most significant risks identified and the preparations for them are regularly reported to the President and CEO and the Board of Directors.
Risk analysisThe section Strategic and operative risks describes the most important strategic, operational and damage-related risks of L&T’s business which, if realised, can endanger or prevent the achievement of business objectives. Financial risks and their management are described in the consolidated financial statements in Note 4.1 Financial risk management.
Strategic and operative risksSustainabilityAs an environmental services company and a major employer, operating responsibly is essential for the company’s reputation and stakeholder trust. The company continuously monitors changes and trends affecting its business environment in relation to, for example, climate targets, human rights and supply chain sustainability, with the aim of identifying the related risks and opportunities.
In 2019, the potential human rights risks associated with L&T’s operations were reviewed as part of the risk management process. To manage climate risks, the company has made a commitment to set Science-Based Targets within year 2020. The company is also active in taking practical measures to directly reduce its environmental impacts. This includes fleet replacements and monitoring the driving style index. Risks related to personnel and responsibility for personnel are described in more detail in the Personnel section.
ICT systemsIf realised, risks associated with information and communications systems and their implementation can affect L&T’s operations and customer service. The risks are minimised by engaging in systematic efforts to develop the systems environment and ensure the reliability of the ICT environment. These efforts include identifying which systems are critical to operations and defining the allocation of responsibilities between the system vendors and L&T. The introduction of new systems and operating models related to them are planned carefully, learning from previous experience, so that the implementation would not disturb L&T’s operations. The risks related to ICT systems are also managed by developing the system architecture and making long-term investments aimed at eliminating the repair backlog and increasing competitiveness.
Markets and renewalChanges in markets and the market environment, such as municipalisation and market changes pertaining to recycled raw materials as well as the market price development of emission rights, secondary raw materials and oil products may have an unfavourable effect on the Group’s business operations and business growth and lead to lower profitability. L&T is not dependent on single large customers, which, together with L&T’s extensive service offering, helps reduce market-related risks. As a means of standing out from its competitors
Lassila & Tikanoja | Financial review 2019 30
KEY FIGURES FINANCIAL STATEMENTSREPORT BY THE BOARD OF DIRECTORSCORPORATE GOVERNANCE
Report by the Board of Directors

and creating value-adding elements other than price, L&T is continuously developing and launching new service products. L&T’s strategies are systematically implemented with a long-term perspective. They take into account potential changes in the industry as well as the need for renewal and the necessary related measures to ensure profitability. At the same time, L&T actively monitors the market situation and legislative developments and strives to proactively influence them.
AcquisitionsL&T seeks growth both organically and through acquisitions. The success of acquisitions affects the achievement of the company’s growth and profitability targets. Failures in acquisitions may impact the company’s competitiveness and profitability and may change the company’s risk profile. Risk related to acquisitions is managed through contracts of sale, strategic and financial analysis of acquisition targets, comprehensive audits of due diligence and particularly by carrying out an efficient integration programme after the realisation of a deal.
PersonnelChallenges related to the availability of workforce are a significant risk related to employees. Any reduction of personnel satisfaction may also become a strategic risk for the company because L&T’s competitive advantage is largely based on the work of skilled and motivated
personnel. These risks are managed by investing on employee experience, recruitment and employer image.
Improving the employee experience is the whole company’s strategic goal. The company influences it by developing job orientation and supervisor work and by promoting job rotation and promotion opportunities. The company actively works with various schools to ensure the availability of workforce. It also strives to promote work- based immigration and the employment of special groups.
An increase in sickness rates and the personnel’s disability and accident pension costs may materially affect L&T’s competitiveness and profitability. The company invests actively on the occupational safety and the maintenance of the ability work of its employees. It aims to minimise sickness-related absences and disability pensions as well as minimise their related costs. L&T regularly conducts job-specific and site-specific risk assessments and workplace surveys, and supports the work ability and well-being of employees through activities that promote work ability. L&T has its own sickness fund that supports L&T’s work ability management and complements occupational health care. The company also uses the Suitable Work model that supports the rehabilitation and employment of people at risk of disability pension.
Damage-related risksTo cover for unexpected damage risks, L&T has continuous insurance coverage in all of the operating countries, including policies for injuries, property damage, business interruption, third-party liability, environmental damage and transport damage.
A fire at a recycling plant may result in a momentary or extended interruption of the plant’s operations. However, the significance of the risk is reduced by the fact that individual plants or production lines have no substantial impact on L&T’s overall profitability. In addition to taking out insurance, L&T strives to minimise the risks of fire damage by using contingency planning, developing first-hand fire extinguishing preparedness and training personnel to prepare for emergencies.
Risk of environmental damageL&T’s business includes the collection and transport of hazardous waste as well as processing at the company’s own plants. Incorrect handling of hazardous waste or damage to equipment may result in harmful substances being released into the environment. L&T may become liable for damages due to this. In addition to taking out insurance, L&T manages environmental damage risks through systematic environmental surveys of its plants, preventive equipment maintenance plans, audits and the long-term training of personnel.
GovernanceThe Corporate Governance Statement for the financial year 2019 is provided as a separate report.
Shares and shareholdersShare capital and number of sharesThere were no changes in Lassila & Tikanoja’s share capital and number of shares in 2019. The registered share capital of the company is EUR 19,399,437. The number of shares is 38,798,874. The average number of shares excluding the shares held by the company was 38,354,267. Each share carries one vote. The Articles of Association do not set an upper limit on the share capital and number of shares. A share has neither a nominal value nor a book equivalent value.
The company’s shares are included in the book-entry system of securities maintained by Euroclear Finland Ltd. Euroclear Finland maintains the company’s official list of shareholders.
ShareholdersLassila & Tikanoja plc had 15,524 (13,207) registered shareholders at the end of 2019. Nominee-registered holdings accounted for 12.0% (19.5) of the total number of shares.
Lassila & Tikanoja | Financial review 2019 31
KEY FIGURES FINANCIAL STATEMENTSREPORT BY THE BOARD OF DIRECTORSCORPORATE GOVERNANCE
Report by the Board of Directors

Holdings of the Board of Directors and President and CEOThe members of the Board, the President and CEO, and organisations under their control held a total of 952,807 shares in the company on 31 December 2019. They represent 2.5 per cent of the number of shares and votes.
Trading in shares in 2019The company’s shares are quoted on the mid-cap list of Nasdaq Helsinki Oy in the Industrials sector. The trading code is LAT1V and the ISIN code is FI0009010854.
The volume of trading on Nasdaq Helsinki in 2019, excluding the shares held by the company in Lassila & Tikanoja plc, was 8,172,082 shares, which is 21.3% (13.0) of the average number of outstanding shares. The value of trading was EUR 122.3 million (83.8). The highest share price was EUR 16.40 and the lowest EUR 12.92. The closing price was EUR 15.74.
At the end of the review period, the market capitalisation excluding the shares held by the company was EUR 599.6 million (574.6).
Own sharesAt the end of the period, the company held 704,408 of its own shares, representing 1.8% of all shares and votes.
Authorisations for the Board of DirectorsThe Annual General Meeting held on 14 March 2019 authorised Lassila & Tikanoja plc’s Board of Directors to make decisions on the repurchase of the company’s own shares using the company’s unrestricted equity. In addition, the Annual General Meeting authorised the Board of Directors to decide on a share issue and the issuance of special rights entitling their holders to shares.
The Board of Directors is authorised to purchase a maximum of 2,000,000 company shares (5.2% of the total number of shares). The repurchase authorisation is effective for 18 months.
The Board of Directors is authorised to decide on the issuance of new shares or shares possibly held by the company through a share issue and/or issuance of option rights or other special rights entitling to shares, referred to in Chapter 10, Section 1 of the Finnish Companies Act, so that under the authorisation a maximum of 2,000,000 shares (5.2% of the total number of shares) may be issued and/or conveyed. The authorisation is effective for 18 months.
Breakdown of shareholding by sector on 31 December 2019
Number of shareholders Percentage
Number of shares
Percentage of shares and votes
Non-financial corporations and housing corporations 787 5.1% 3,133,377 8.1%Financial and insurance corporations 60 0.4% 7,648,205 28.9%General Government 19 0.1% 4,373,517 11.3%Households 14,331 92.3% 13,199,490 34.0%Non-profit institutions serving households 279 1.8% 5,616,330 14.5%Foreign shareholders 50 0.3% 138,993 3.1%Of which nominee-registered 11 4,648,434 12.0%Shares not transferred to the book-entry securities system 40,528 0.1%Own shares 1 704,408 1.8%Total 15,525 38,798,874 100.0%
Breakdown of shareholding by size of holding on 31 December 2019
Number of sharesNumber of
Shareholders PercentageNumber of
sharesPercentage of
shares and votes
1–1,000 13,733 88.5% 3,301,119 8.5%1,001–5,000 1,372 8.8% 2,927,270 7.5%5,001–10,000 185 1.2% 1,320,812 3.4%10,001–100,000 193 1.2% 5,437,843 14.0%100,001–500,000 24 0.2% 4,774,664 12.3%over 500,000 18 0.1% 20,996,638 54.1%Shares registered in a nominee’s name 11 4,648,434 12.0%Shares not transferred to the book-entry securities system 40,528 0.1%Own shares 1 704,408 1.8%Total 15,525 100.0% 38,798,874 100.0%
Lassila & Tikanoja | Financial review 2019 32
KEY FIGURES FINANCIAL STATEMENTSREPORT BY THE BOARD OF DIRECTORSCORPORATE GOVERNANCE
Report by the Board of Directors

Major shareholders on 31 December 2019, excluding shares registered in a nominee’s name
Shareholder Number of shares Percentage of shares and votes
1 Mandatum Life Insurance Company Limited 2,963,934 7.62 Evald and Hilda Nissi Foundation 2,413,584 6.23 Nordea investment funds 1,725,752 4.54 Maijala Juhani 1,529,994 3.95 Elo Mutual Pension Insurance Company 1,425,375 3.76 Åbo Akademi University Foundation 1,066,282 2.87 Ilmarinen Mutual Pension Insurance
Company 1,024,836 2.68 Bergholm Heikki 831,116 2.19 Maijala Mikko 720,000 1.910 Lassila & Tikanoja plc 704,408 1.811 Varma Mutual Pension Insurance Company 629,791 1.612 OP Suomi investment fund 607,851 1.613 Kristiina Turjanmaa 529,200 1.414 The State Pension Fund 512,000 1.315 Veritas Pension Insurance 420,000 1.116 Oy Chemec Ab 356,320 0.917 Maijala Eeva 345,000 0.918 Kaleva Mutual Insurance Company 324,900 0.819 Church Pension Fund 281,604 0.720 Fondita investment funds 270,000 0.7
Total 18,681,947 48.2
Profit distribution Dividend policyThe amount of dividend is tied to the results for the financial year. Profits not considered necessary for ensuring the healthy development of the company are distributed to shareholders.
In 2019, the Group’s earnings per share were EUR 0.90 (0.89) and cash flow from operating activities per share amounted to EUR 2.46 (2.35). The Board of Directors proposed a dividend of EUR 0.92 per share to the Annual General Meeting to be held on 12 March 2020. A dividend of EUR 0.92 per share was paid for the financial year 2018.
Near-term uncertaintiesChallenges related to the availability of labour may increase production costs and slow down the growth of net sales.
A decline in the volume of the construction industry and a slowing down of investment growth may have an unfavourable effect on the Group’s operations and business growth and lead to lower profitability. In addition, market price development for emission rights, secondary raw materials or oil products may have a negative impact on the company’s business environment.Temporary additional costs arising from establishing the operating model related to the new ERP system may weigh down on the company’s result.
Outlook for the year 2020Net sales in 2020 are expected to be on par with 2019 and operating profit is expected to increase compared to 2019 (EUR 40.5 million). The effect of the divestment of L&T Korjausrakentaminen Oy, EUR 4.5 million, has been deducted from the operating profit for the comparison period, which was EUR 45.0 million.
Events after the balance sheet dateThe company management is not aware of any events of material importance that might have affected the preparation of the financial statements.
Lassila & Tikanoja | Financial review 2019 33
KEY FIGURES FINANCIAL STATEMENTSREPORT BY THE BOARD OF DIRECTORSCORPORATE GOVERNANCE
Report by the Board of Directors

Lassila & Tikanoja | Financial review 2019 34
KEY FIGURES FINANCIAL STATEMENTSREPORT BY THE BOARD OF DIRECTORSCORPORATE GOVERNANCE

KEY FIGURES36 Key figures
38 Calculation of the key figures
Lassila & Tikanoja | Financial review 2019 35
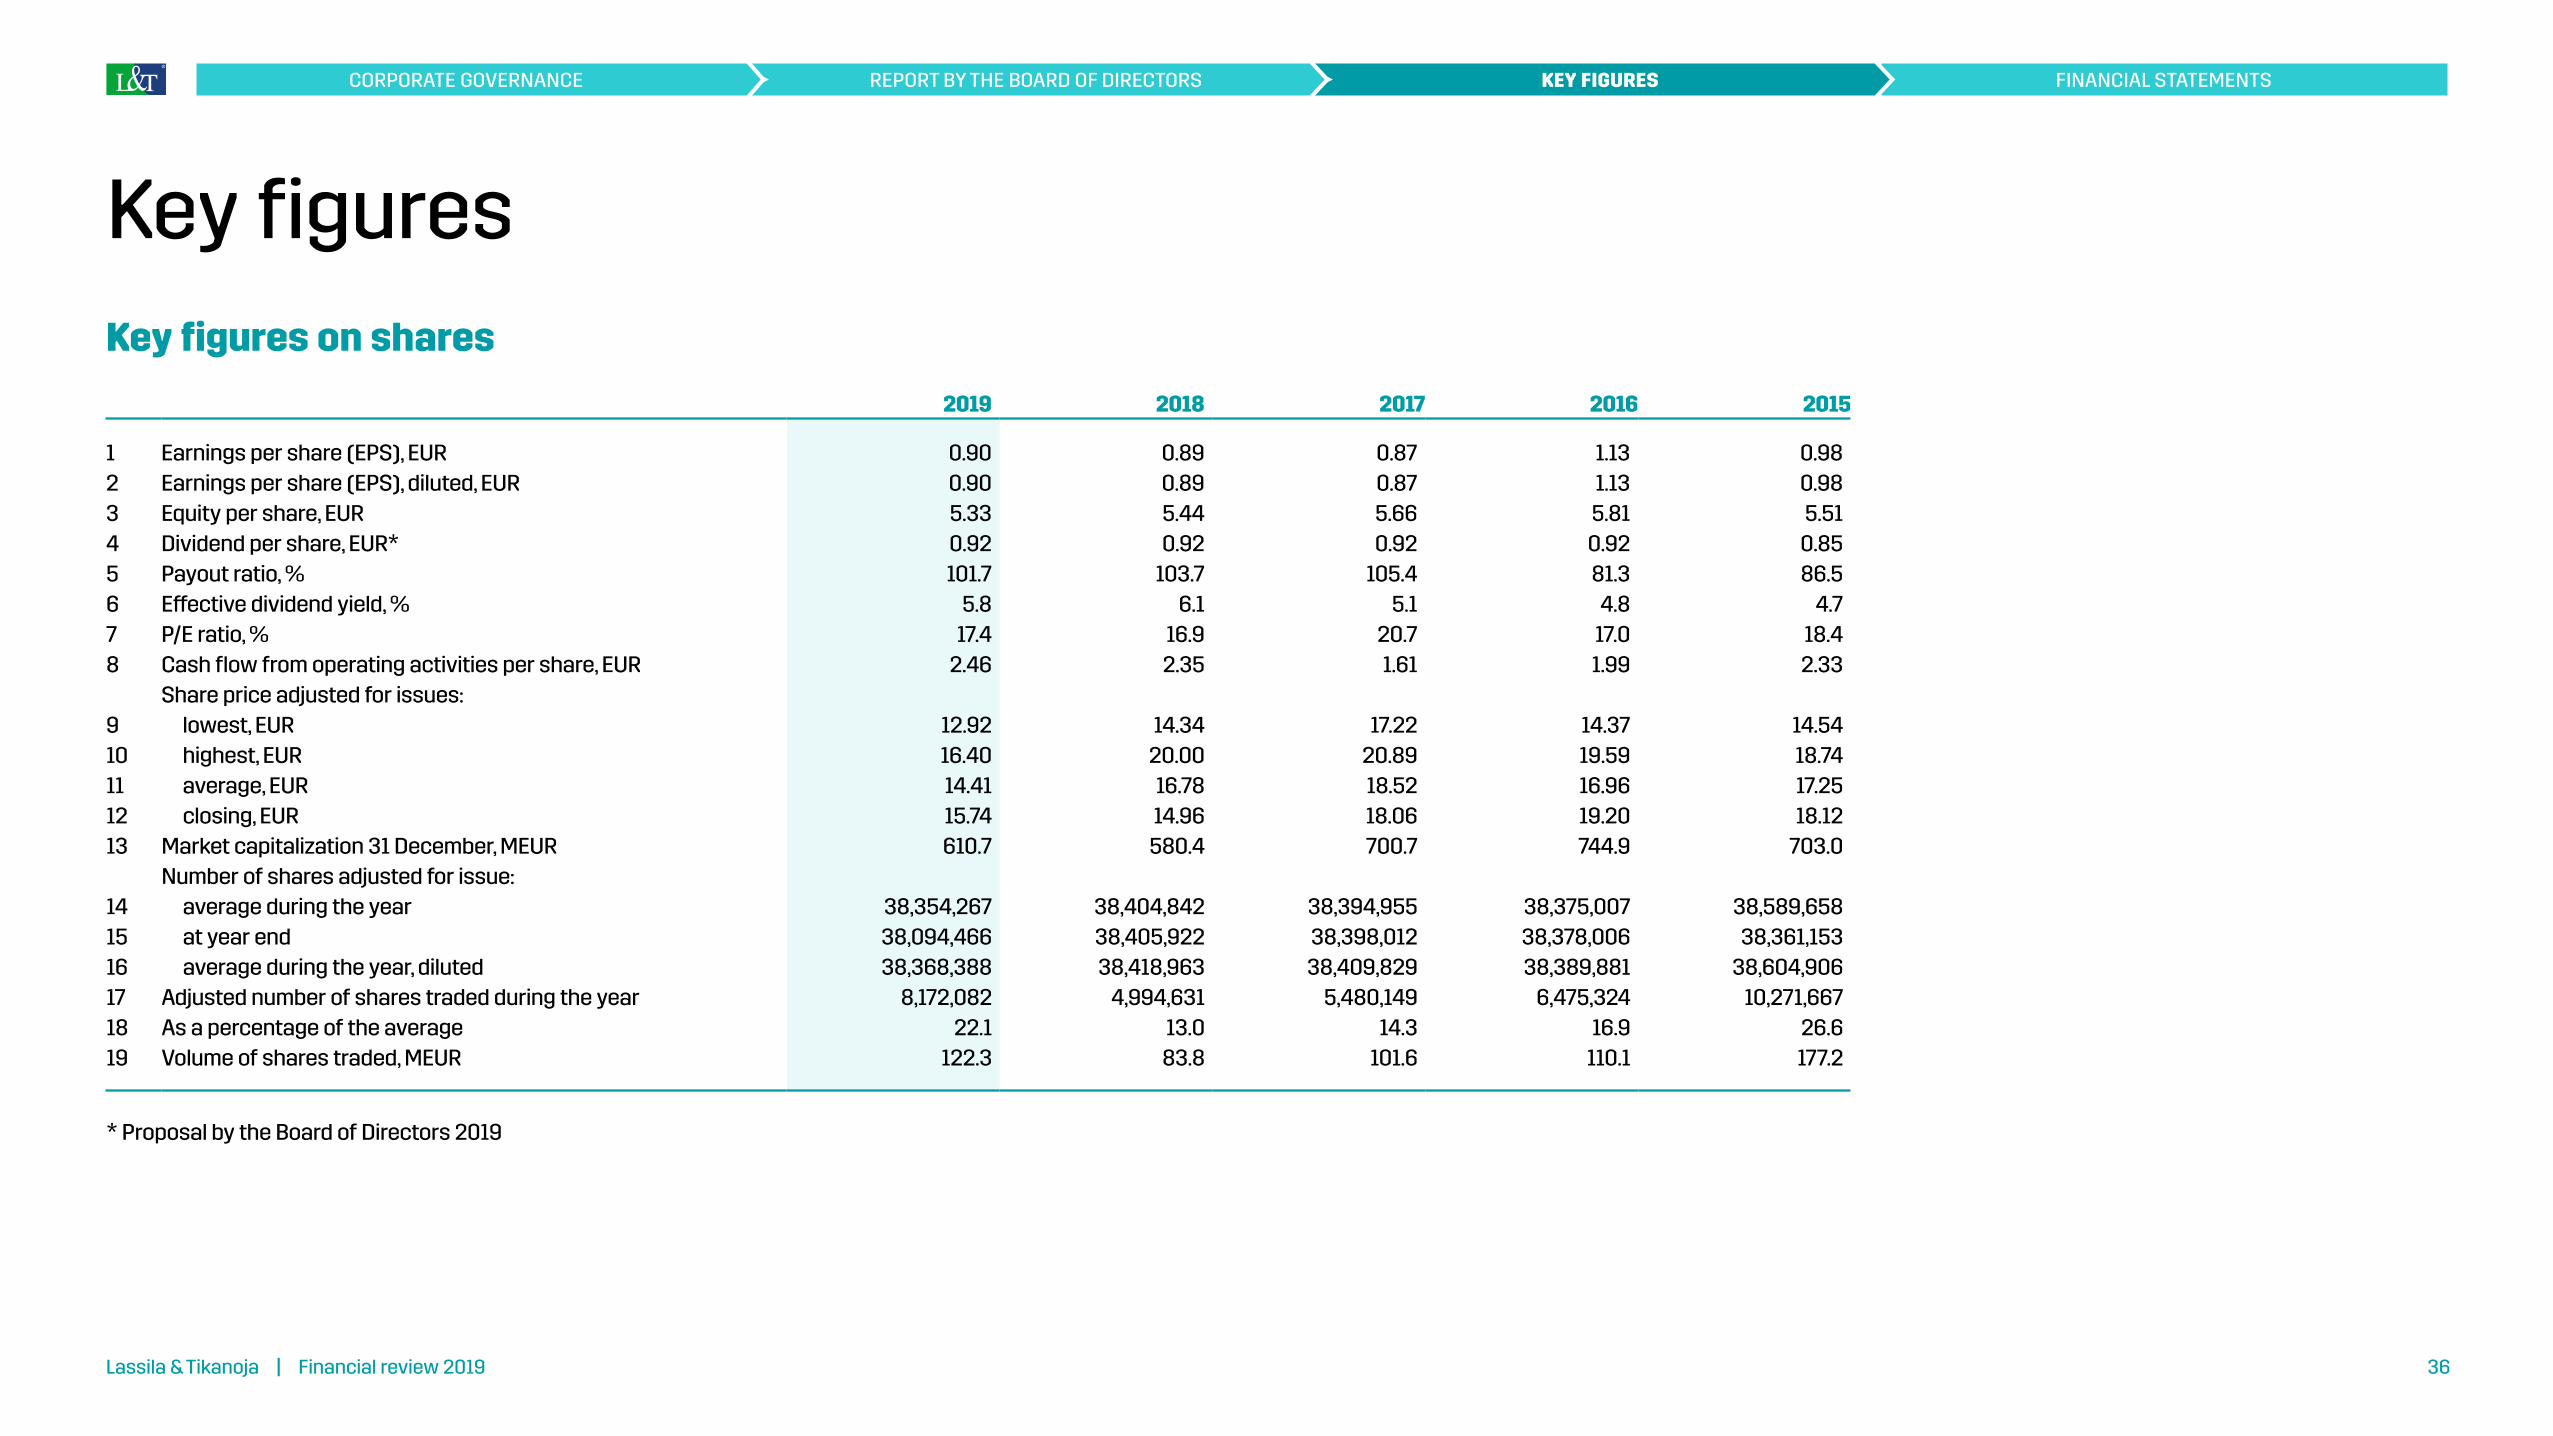
Key figures on shares
2019 2018 2017 2016 2015
1 Earnings per share (EPS), EUR 0.90 0.89 0.87 1.13 0.982 Earnings per share (EPS), diluted, EUR 0.90 0.89 0.87 1.13 0.983 Equity per share, EUR 5.33 5.44 5.66 5.81 5.514 Dividend per share, EUR* 0.92 0.92 0.92 0.92 0.855 Payout ratio, % 101.7 103.7 105.4 81.3 86.56 Effective dividend yield, % 5.8 6.1 5.1 4.8 4.77 P/E ratio, % 17.4 16.9 20.7 17.0 18.48 Cash flow from operating activities per share, EUR 2.46 2.35 1.61 1.99 2.33
Share price adjusted for issues:9 lowest, EUR 12.92 14.34 17.22 14.37 14.5410 highest, EUR 16.40 20.00 20.89 19.59 18.7411 average, EUR 14.41 16.78 18.52 16.96 17.2512 closing, EUR 15.74 14.96 18.06 19.20 18.1213 Market capitalization 31 December, MEUR 610.7 580.4 700.7 744.9 703.0
Number of shares adjusted for issue:14 average during the year 38,354,267 38,404,842 38,394,955 38,375,007 38,589,65815 at year end 38,094,466 38,405,922 38,398,012 38,378,006 38,361,15316 average during the year, diluted 38,368,388 38,418,963 38,409,829 38,389,881 38,604,90617 Adjusted number of shares traded during the year 8,172,082 4,994,631 5,480,149 6,475,324 10,271,66718 As a percentage of the average 22.1 13.0 14.3 16.9 26.619 Volume of shares traded, MEUR 122.3 83.8 101.6 110.1 177.2
* Proposal by the Board of Directors 2019
Key figures
Lassila & Tikanoja | Financial review 2019 36
REPORT BY THE BOARD OF DIRECTORS KEY FIGURES FINANCIAL STATEMENTSCORPORATE GOVERNANCE
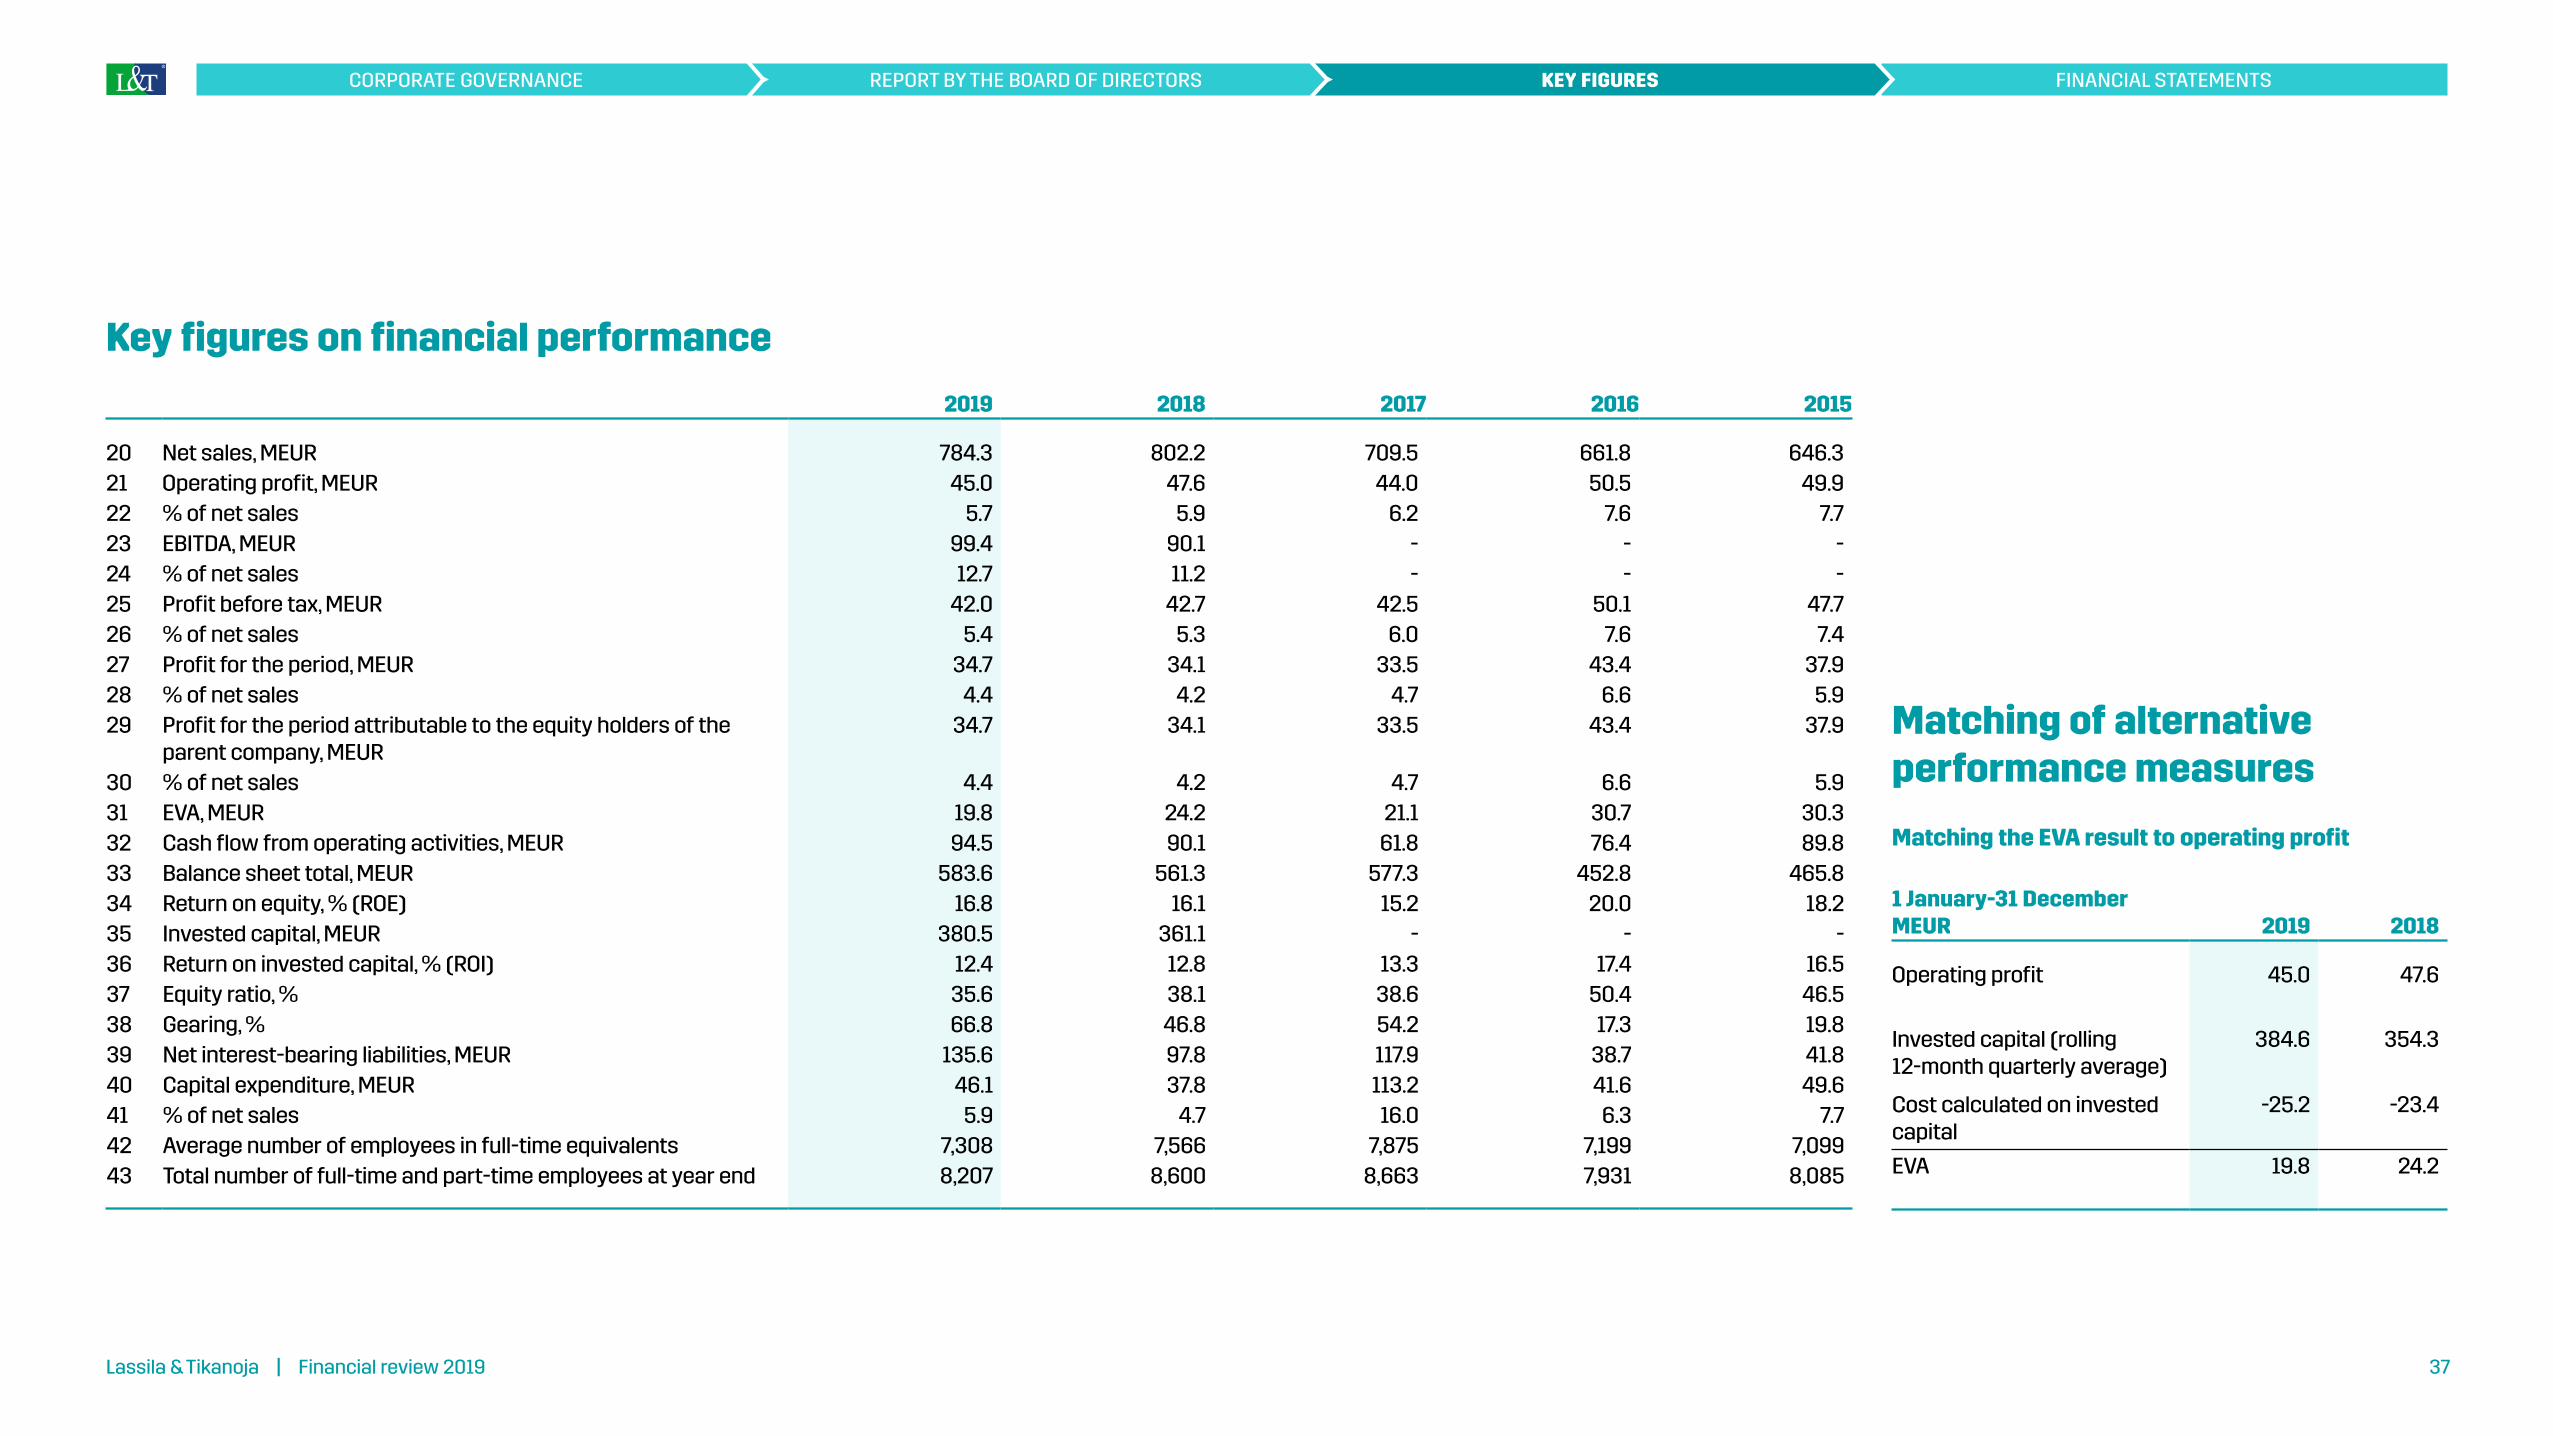
Key figures on financial performance
2019 2018 2017 2016 2015
20 Net sales, MEUR 784.3 802.2 709.5 661.8 646.321 Operating profit, MEUR 45.0 47.6 44.0 50.5 49.922 % of net sales 5.7 5.9 6.2 7.6 7.723 EBITDA, MEUR 99.4 90.1 - - -24 % of net sales 12.7 11.2 - - -25 Profit before tax, MEUR 42.0 42.7 42.5 50.1 47.726 % of net sales 5.4 5.3 6.0 7.6 7.427 Profit for the period, MEUR 34.7 34.1 33.5 43.4 37.928 % of net sales 4.4 4.2 4.7 6.6 5.929 Profit for the period attributable to the equity holders of the
parent company, MEUR34.7 34.1 33.5 43.4 37.9
30 % of net sales 4.4 4.2 4.7 6.6 5.931 EVA, MEUR 19.8 24.2 21.1 30.7 30.332 Cash flow from operating activities, MEUR 94.5 90.1 61.8 76.4 89.833 Balance sheet total, MEUR 583.6 561.3 577.3 452.8 465.834 Return on equity, % (ROE) 16.8 16.1 15.2 20.0 18.235 Invested capital, MEUR 380.5 361.1 - - -36 Return on invested capital, % (ROI) 12.4 12.8 13.3 17.4 16.537 Equity ratio, % 35.6 38.1 38.6 50.4 46.538 Gearing, % 66.8 46.8 54.2 17.3 19.839 Net interest-bearing liabilities, MEUR 135.6 97.8 117.9 38.7 41.840 Capital expenditure, MEUR 46.1 37.8 113.2 41.6 49.641 % of net sales 5.9 4.7 16.0 6.3 7.742 Average number of employees in full-time equivalents 7,308 7,566 7,875 7,199 7,09943 Total number of full-time and part-time employees at year end 8,207 8,600 8,663 7,931 8,085
Matching of alternative performance measures
Matching the EVA result to operating profit
1 January-31 December MEUR 2019 2018
Operating profit 45.0 47.6
Invested capital (rolling 12-month quarterly average)
384.6 354.3
Cost calculated on invested capital
-25.2 -23.4
EVA 19.8 24.2
Lassila & Tikanoja | Financial review 2019 37
REPORT BY THE BOARD OF DIRECTORS KEY FIGURES FINANCIAL STATEMENTSCORPORATE GOVERNANCE

Calculation of the key figures
* The calculations are also applied with capital repayment.
Calculation of the key figures
1 Earnings per share (EPS) =Profit attributable to equity holders of the parent companyAdjusted average basic number of shares
2 Earnings per share (EPS), diluted =Profit attributable to equity holders of the parent companyAdjusted average diluted number of shares
3 Equity per share =Equity attributable to equity holders of the parent company Adjusted basic number of shares at the balance sheet date
4 Dividend per share =Dividend for the financial periodAdjusted basic number of shares at the balance sheet date
5 Payout ratio, % * =Dividend per shareEarnings per share
6 Effective dividend yield, % * =Dividend per shareClosing price of the financial period
7 P/E ratio, % =Closing price of the financial period Earnings per share
8Cash flow from operating activities per share
=Cash flows from operating activities as in the cash flow statementAdjusted average basic number of shares
13 Market capitalization =Basic number of shares at the balance sheet date x closing price of the financial period
Key figures on financial performance
25 EBITDA, MEUR = Operating profit + depreciation + impairment
31 EVA, MEUR =Operating profit - cost calculated on invested capital (average of four quarters) before taxes
The cost of capital invested is calculated using the Group's weighted average cost of capital (WACC).
WACC 2019: 6,55%WACC 2018: 6.60%WACC 2017: 6.69%WACC 2016: 6.56%WACC 2015: 6,51%
34 Return on equity, % (ROE) =Profit for the period Equity (average)
35 Invested capital, MEUR = Equity + Interest-bearing financial liabilities
36 Return on invested capital, % (ROI) =Profit before tax + finance costsEquity + Interest-bearing financial liabilities (average)
37 Equity ratio, % =EquityBalance sheet total - advances received
38 Gearing, % =Net interest-bearing liabilitiesEquity
39 Net interest-bearing liabilities = Interest-bearing liabilities - cash and cash equivalents
x 100
x 100
x 100
x 100
x 100
x 100
Lassila & Tikanoja | Financial review 2019 38
REPORT BY THE BOARD OF DIRECTORS KEY FIGURES FINANCIAL STATEMENTSCORPORATE GOVERNANCE

FINANCIAL STATEMENTS40 Consolidated income statement
40 Consolidated statement of comprehensive income
41 Consolidated statement of financial position
42 Consolidated statement of cash flows
43 Consolidated statement of changes in equity
44 Notes to the consolidated financial statements
97 Financial statements of the parent company
113 Auditor's note
114 Auditor's report
Financial result 47
1.1 Segment reporting 481.2 Revenue from contracts with customers 531.3 Employee benefit expenses 561.4 Other operating income and expenses 571.5 Research and development expenses 571.6 Share-based payment 581.7 Lease expenses 591.8 Financial income and expenses 591.9 Income taxes 601.10 Earnings per share 621.11 Notes to the consolidated statement of cash flows 62
Operational assets and liabilities 63
2.1 Trade and other receivables 642.2 Inventories 652.3 Trade and other current payables 662.4 Other non-current liabilities 662.5 Provisions 672.6 Retirement benefit obligations 68
Intangible and tangible assets 71
3.1 Goodwill and other intangible assets 723.2 Goodwill impairment tests 743.3 Property, plant and equipment 763.4 Right-of-use assets 78
Financial risks and capital structure 79
4.1 Financial risk management 804.2 Financial assets and liabilities by category 844.3 Finance lease receivables 864.4 Cash and cash equivalents 864.5 Equity 874.6 Dividend per share 884.7 Financial liabilities 894.8 Contingent liabilities 904.9 Derivative financial instruments 91
Consolidation and other notes 92
5.1 Consolidation 935.2 Group companies 945.3 Business acquisitions 945.4 Related-party transactions 965.5 Auditing costs 965.6 Disputes and litigation 965.7 Events after the balance sheet date 96
Notes to the consolidated financial statements form an essential part of the financial statements.
Lassila & Tikanoja | Financial review 2019 39
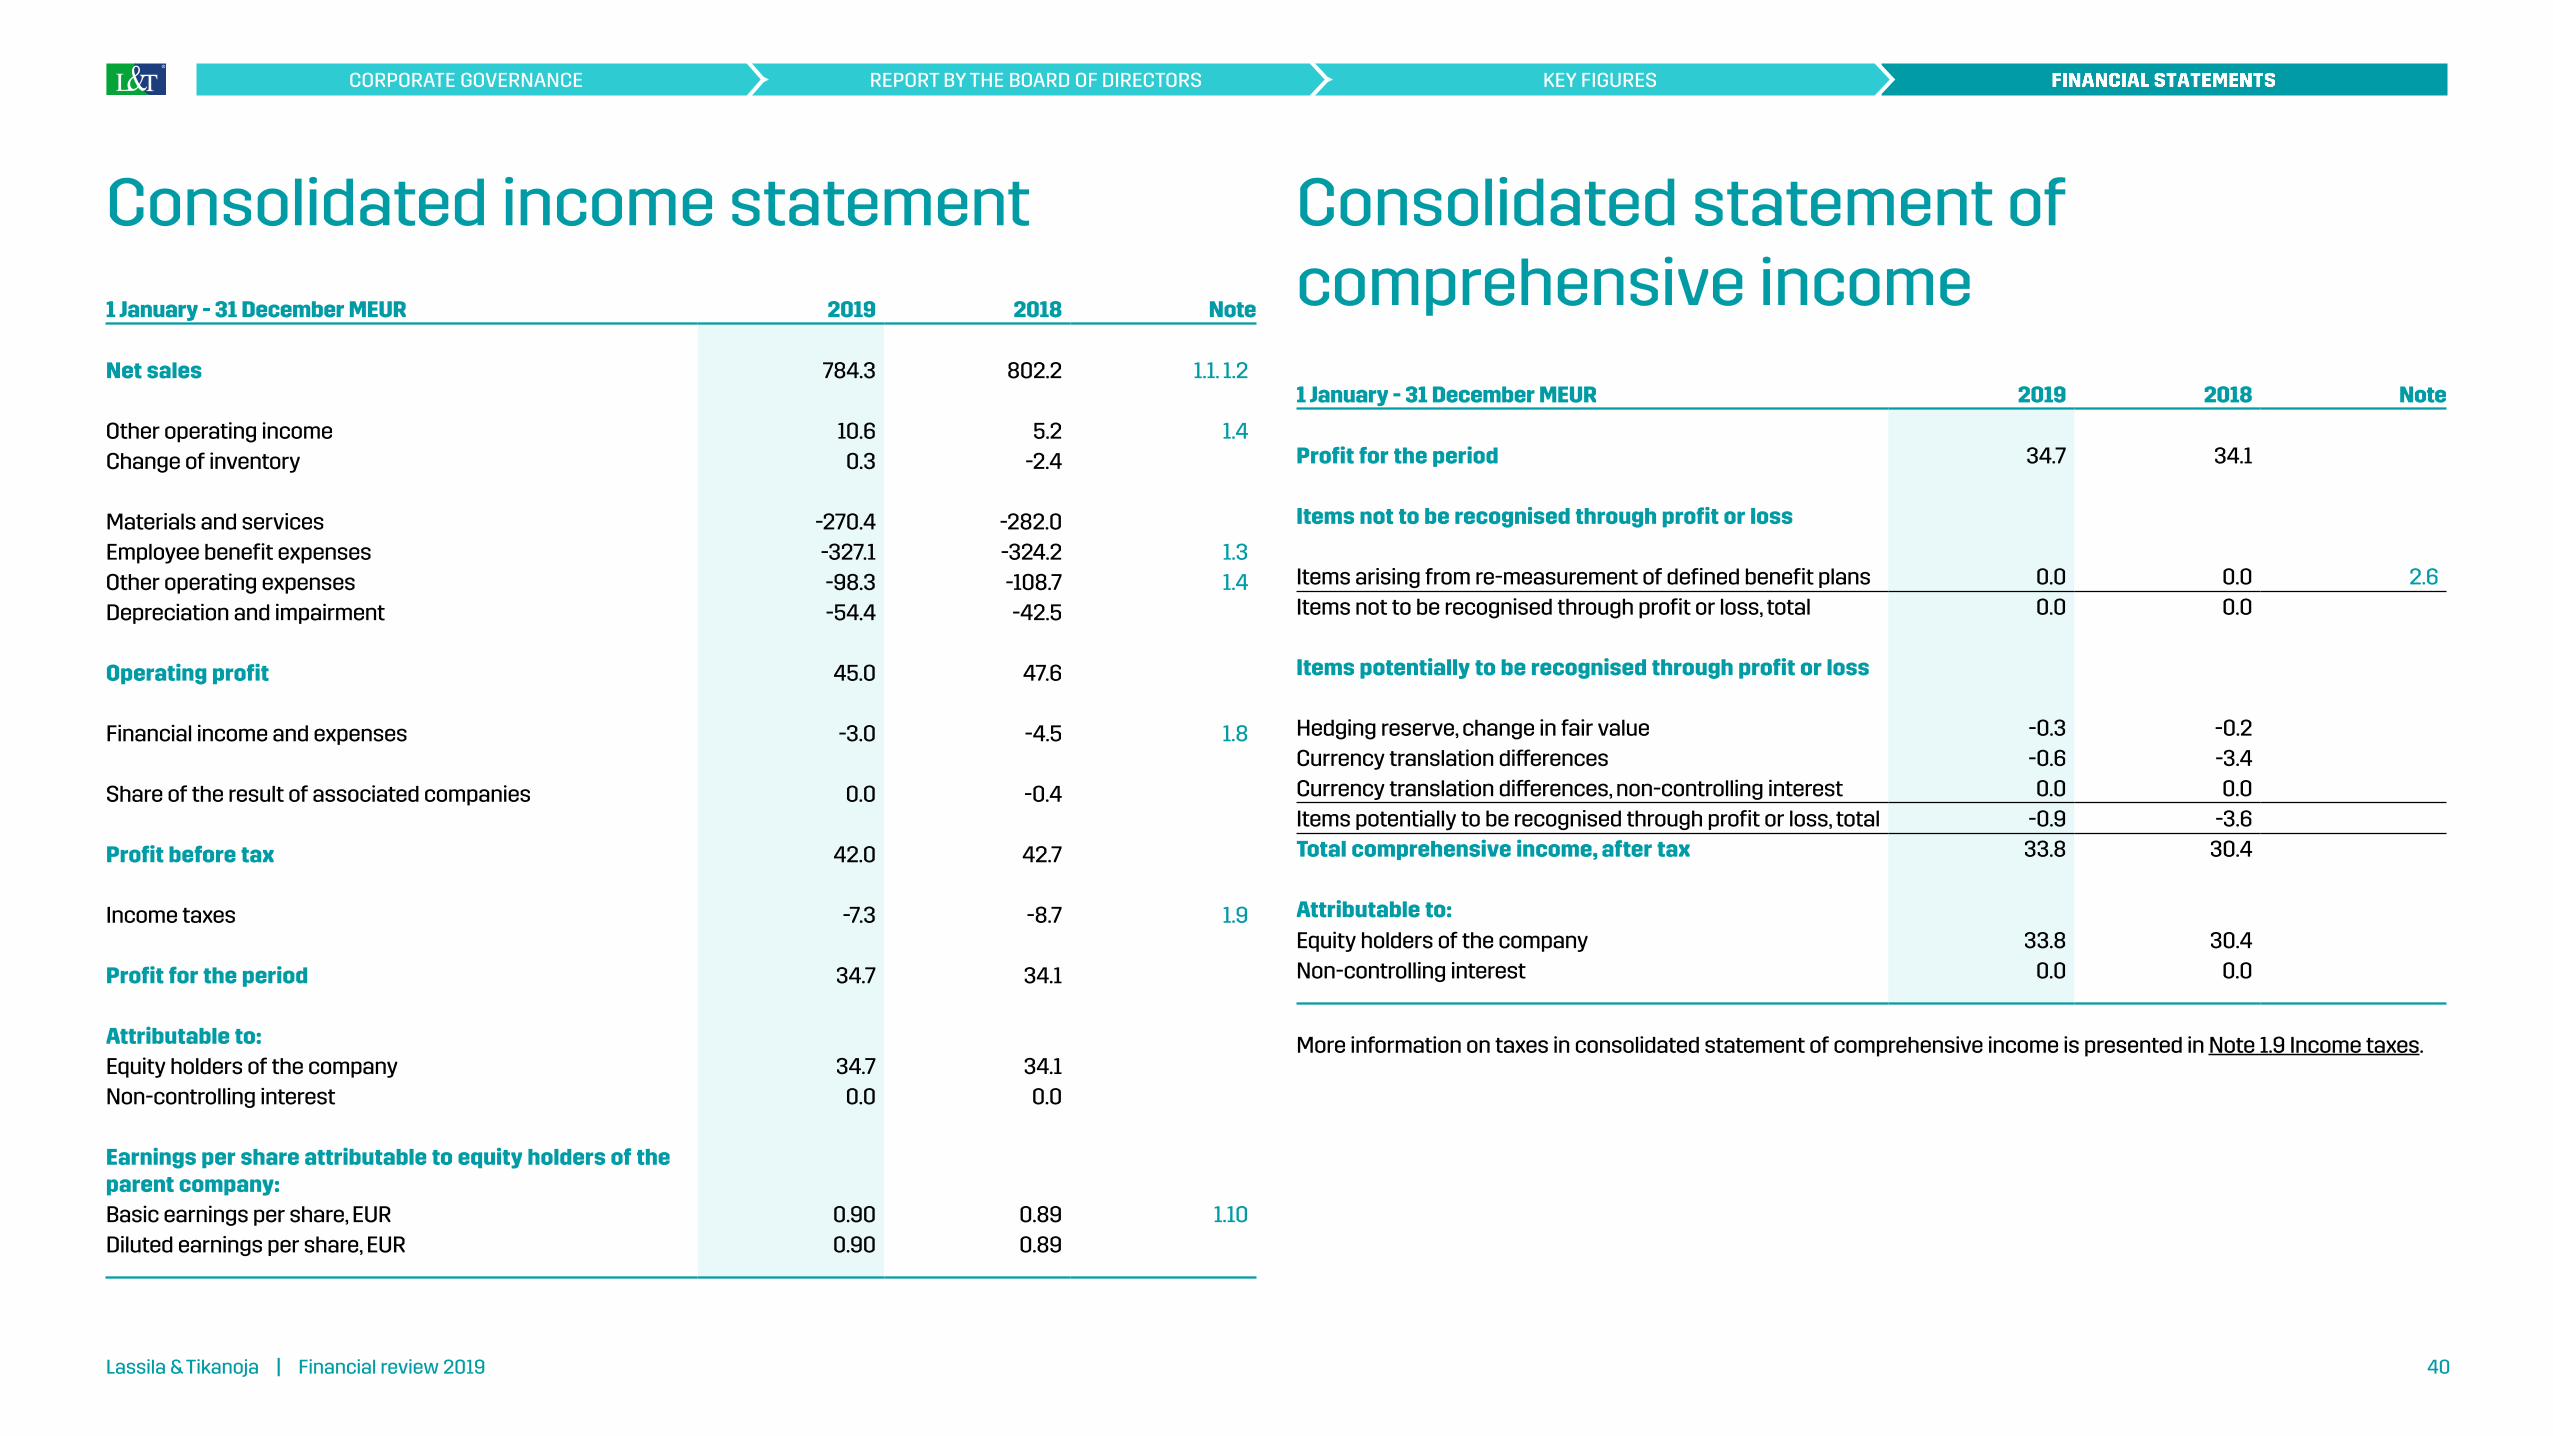
Consolidated income statement1 January - 31 December MEUR 2019 2018 Note
Net sales 784.3 802.2 1.1. 1.2
Other operating income 10.6 5.2 1.4Change of inventory 0.3 -2.4
Materials and services -270.4 -282.0Employee benefit expenses -327.1 -324.2 1.3Other operating expenses -98.3 -108.7 1.4Depreciation and impairment -54.4 -42.5
Operating profit 45.0 47.6
Financial income and expenses -3.0 -4.5 1.8
Share of the result of associated companies 0.0 -0.4
Profit before tax 42.0 42.7
Income taxes -7.3 -8.7 1.9
Profit for the period 34.7 34.1
Attributable to:Equity holders of the company 34.7 34.1Non-controlling interest 0.0 0.0
Earnings per share attributable to equity holders of the parent company:Basic earnings per share, EUR 0.90 0.89 1.10Diluted earnings per share, EUR 0.90 0.89
Consolidated statement of comprehensive income
1 January - 31 December MEUR 2019 2018 Note
Profit for the period 34.7 34.1
Items not to be recognised through profit or loss
Items arising from re-measurement of defined benefit plans 0.0 0.0 2.6Items not to be recognised through profit or loss, total 0.0 0.0
Items potentially to be recognised through profit or loss
Hedging reserve, change in fair value -0.3 -0.2Currency translation differences -0.6 -3.4Currency translation differences, non-controlling interest 0.0 0.0Items potentially to be recognised through profit or loss, total -0.9 -3.6Total comprehensive income, after tax 33.8 30.4
Attributable to:Equity holders of the company 33.8 30.4Non-controlling interest 0.0 0.0
More information on taxes in consolidated statement of comprehensive income is presented in Note 1.9 Income taxes.
Lassila & Tikanoja | Vuosikatsaus 2019 40Lassila & Tikanoja | Financial review 2019 40
KEY FIGURESREPORT BY THE BOARD OF DIRECTORSCORPORATE GOVERNANCE

Consolidated statement of financial position31.12. MEUR 2019 2018 Note
ASSETS
Non-current assets
Intangible assets 3.1Goodwill 151.9 151.5Other intangible assets* 36.2 42.0
188.0 193.5
Tangible assets* 129.5 155.2 3.3Right-of-use assets 77.2 - 3.4
206.7 155.2
Other non-current assets*Finance lease receivables - 0.1 4.3, 4.2Deferred tax assets 4.6 4.4 1.9Other receivables 1.4 1.8 2.1
6.0 6.3
Total non-current assets 400.7 355.0
Current assets
Inventories 21.5 21.0 2.2Trade receivables* 84.2 87.1 2.1, 4.2Contract assets 22.0 31.9 1.2, 2.1, 4.2Other receivables* 13.4 12.0 2.1, 4.2, 4.9Cash and cash equivalents 41.8 54.3 4.2, 4.4
Total current assets 182.9 206.3
Total assets 583.6 561.3
* The balance sheet values for the comparison period have been adjusted due to prior period errors. More information on this is provided in the section Correction of prior period errors under accounting principles
31.12. MEUR 2019 2018 Note
EQUITY AND LIABILITIES
Equity
Equity attributable to equity holders of the parent company 4.5Share capital 19.4 19.4Other reserves -10.4 -9.5Invested unrestricted equity reserve 0.6 0.6Retained earnings* 158.6 164.2Profit for the period 34.7 34.1
202.8 208.8Non-controlling interests 0.2 0.2
Total equity 203.0 208.9
Liabilities
Non-current liabilitiesDeferred tax liabilities 29.2 29.3 1.9Retirement benefit obligations 1.3 1.4 2.6Provisions 5.4 4.6 2.5Financial liabilities 161.6 144.8 4.2, 4.7Other liabilities 0.3 0.5 2.4
197.8 180.6Current liabilities
Financial liabilities 15.8 7.4 4.2, 4.7Trade and other payables 165.3 162.4 2.3, 4.2, 4.9Provisions* 1.7 2.0 2.5
182.8 171.8
Total liabilities 380.6 352.4
Total equity and liabilities 583.6 561.3
Lassila & Tikanoja | Vuosikatsaus 2019 41Lassila & Tikanoja | Financial review 2019 41
KEY FIGURESREPORT BY THE BOARD OF DIRECTORSCORPORATE GOVERNANCE
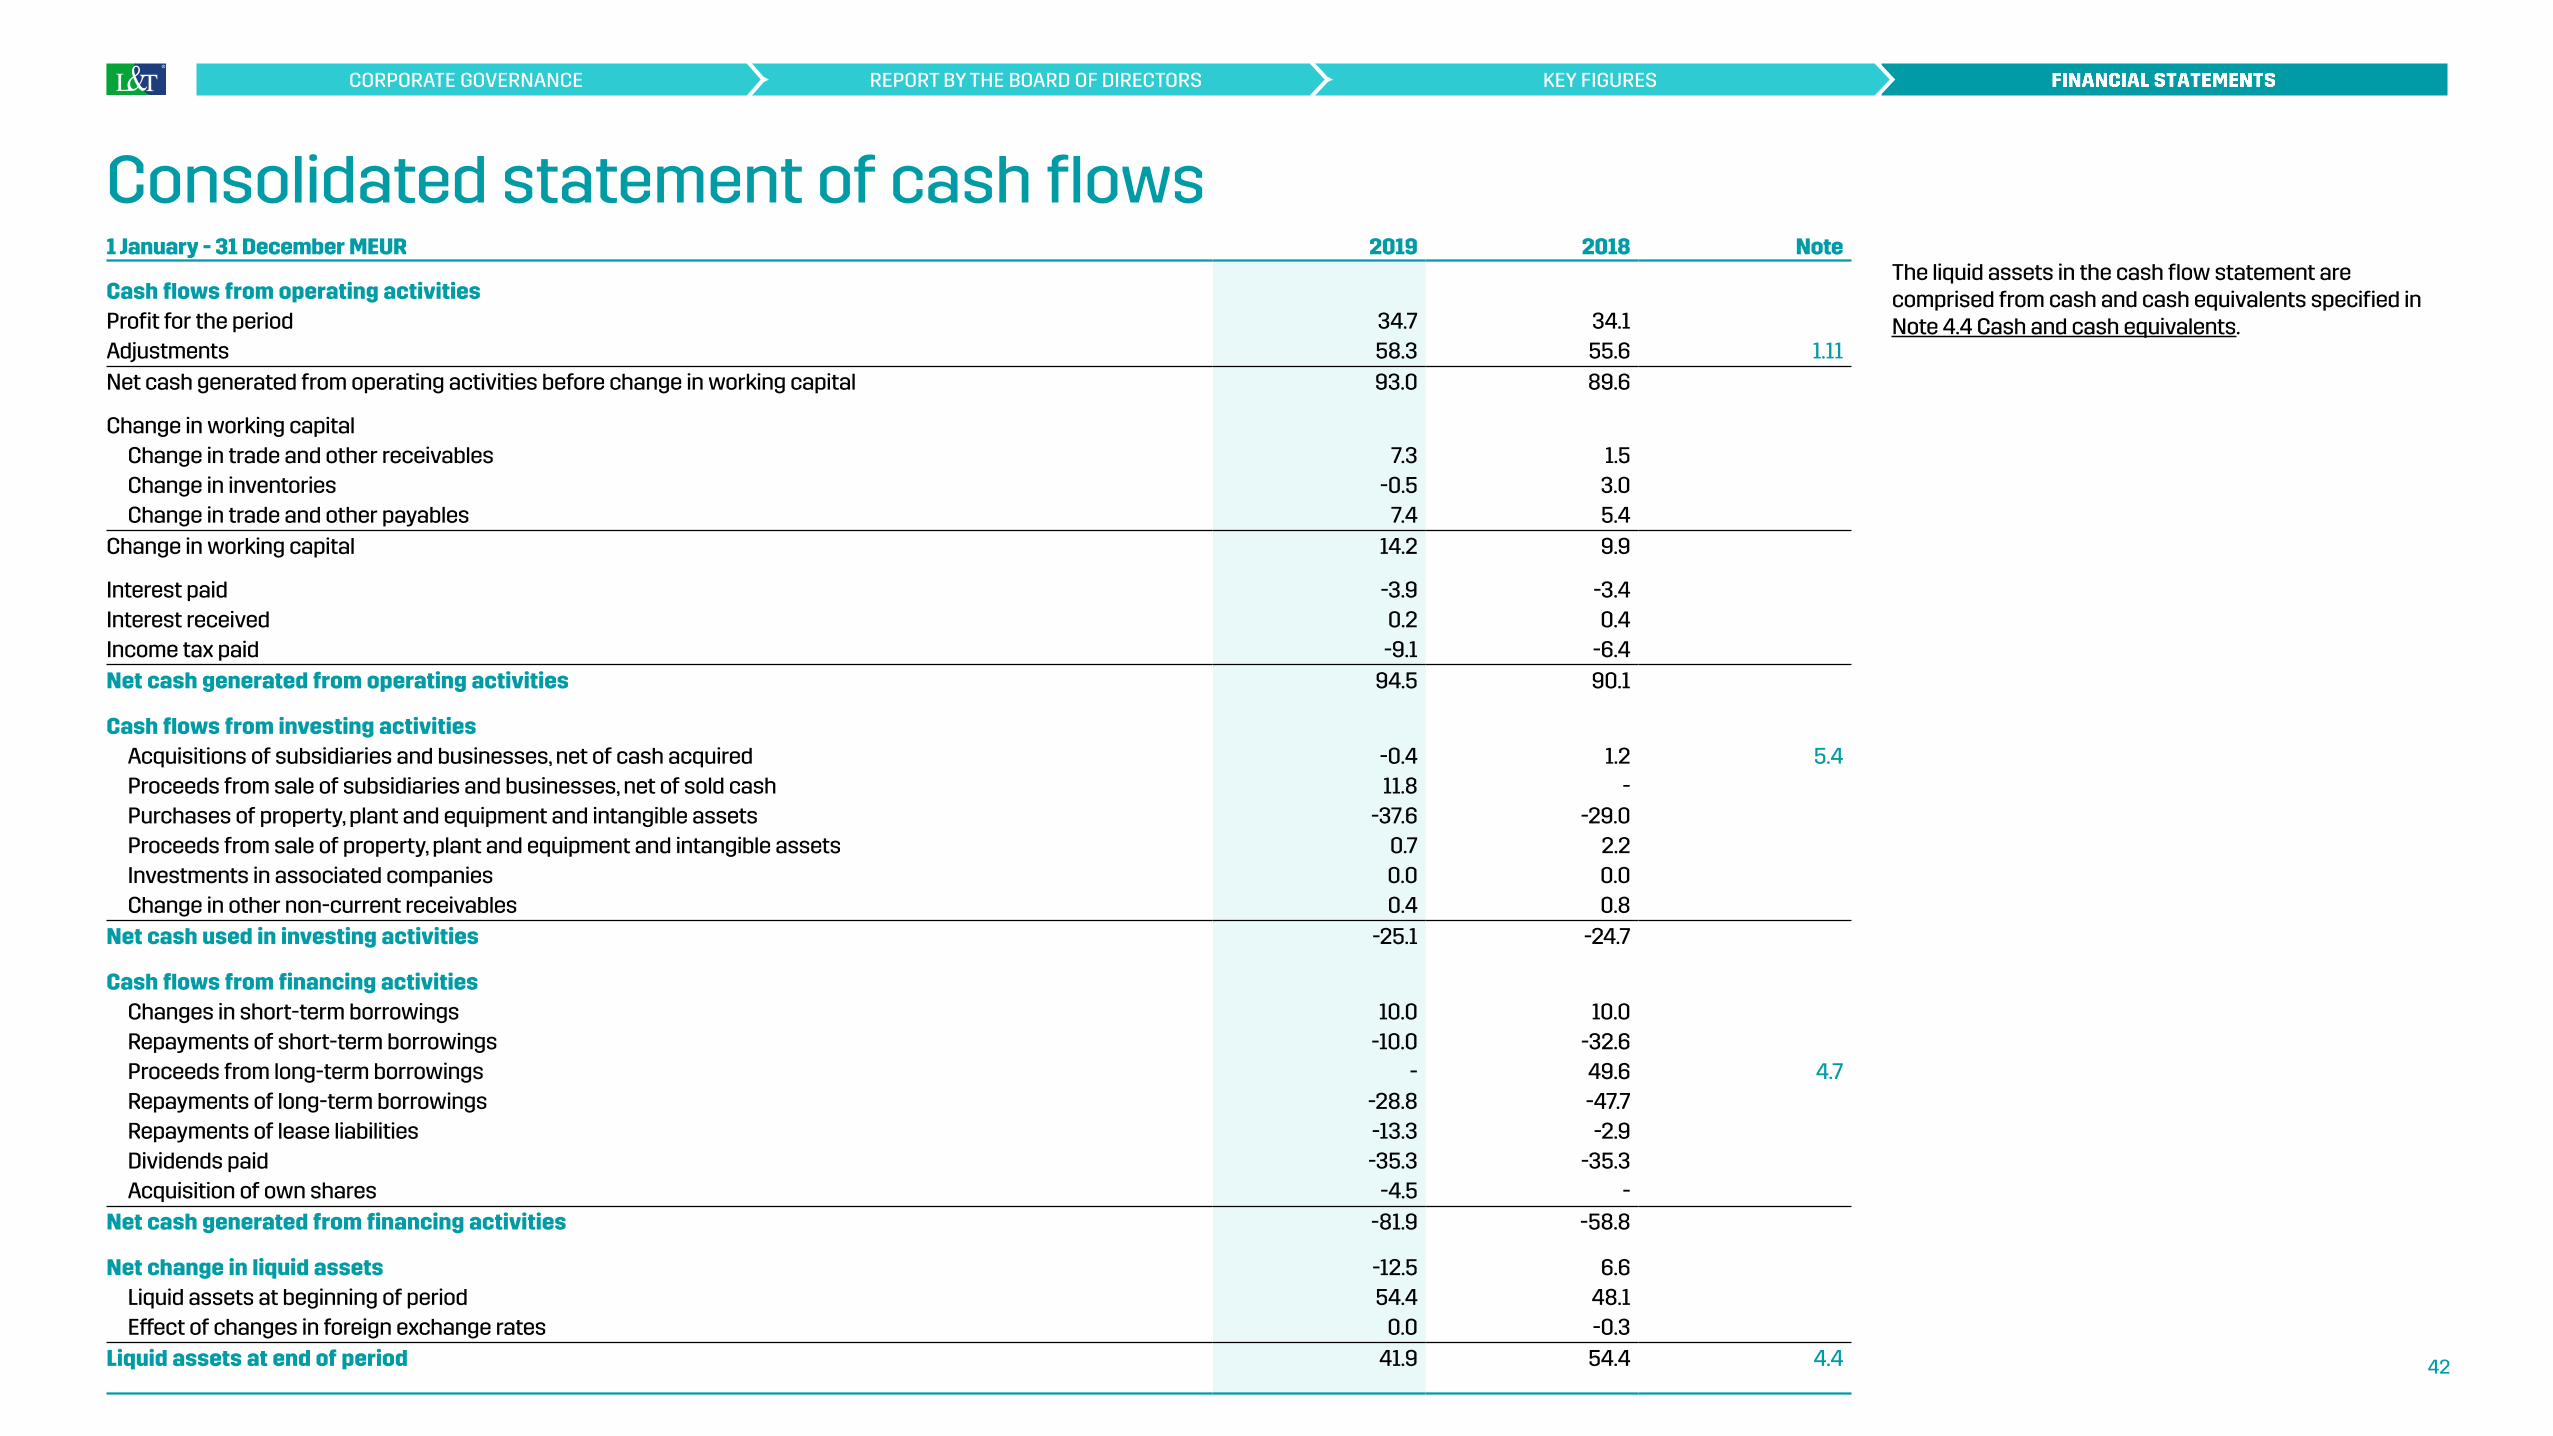
Consolidated statement of cash flowsThe liquid assets in the cash flow statement are comprised from cash and cash equivalents specified in Note 4.4 Cash and cash equivalents.
Lassila & Tikanoja | Vuosikatsaus 2019 42Lassila & Tikanoja | Financial review 2019 42
KEY FIGURESREPORT BY THE BOARD OF DIRECTORSCORPORATE GOVERNANCE
1 January - 31 December MEUR 2019 2018 Note
Cash flows from operating activitiesProfit for the period 34.7 34.1Adjustments 58.3 55.6 1.11Net cash generated from operating activities before change in working capital 93.0 89.6
Change in working capitalChange in trade and other receivables 7.3 1.5Change in inventories -0.5 3.0Change in trade and other payables 7.4 5.4
Change in working capital 14.2 9.9
Interest paid -3.9 -3.4Interest received 0.2 0.4Income tax paid -9.1 -6.4Net cash generated from operating activities 94.5 90.1
Cash flows from investing activitiesAcquisitions of subsidiaries and businesses, net of cash acquired -0.4 1.2 5.4Proceeds from sale of subsidiaries and businesses, net of sold cash 11.8 -Purchases of property, plant and equipment and intangible assets -37.6 -29.0Proceeds from sale of property, plant and equipment and intangible assets 0.7 2.2Investments in associated companies 0.0 0.0Change in other non-current receivables 0.4 0.8
Net cash used in investing activities -25.1 -24.7
Cash flows from financing activitiesChanges in short-term borrowings 10.0 10.0Repayments of short-term borrowings -10.0 -32.6Proceeds from long-term borrowings - 49.6 4.7Repayments of long-term borrowings -28.8 -47.7Repayments of lease liabilities -13.3 -2.9Dividends paid -35.3 -35.3Acquisition of own shares -4.5 -
Net cash generated from financing activities -81.9 -58.8
Net change in liquid assets -12.5 6.6Liquid assets at beginning of period 54.4 48.1Effect of changes in foreign exchange rates 0.0 -0.3
Liquid assets at end of period 41.9 54.4 4.4
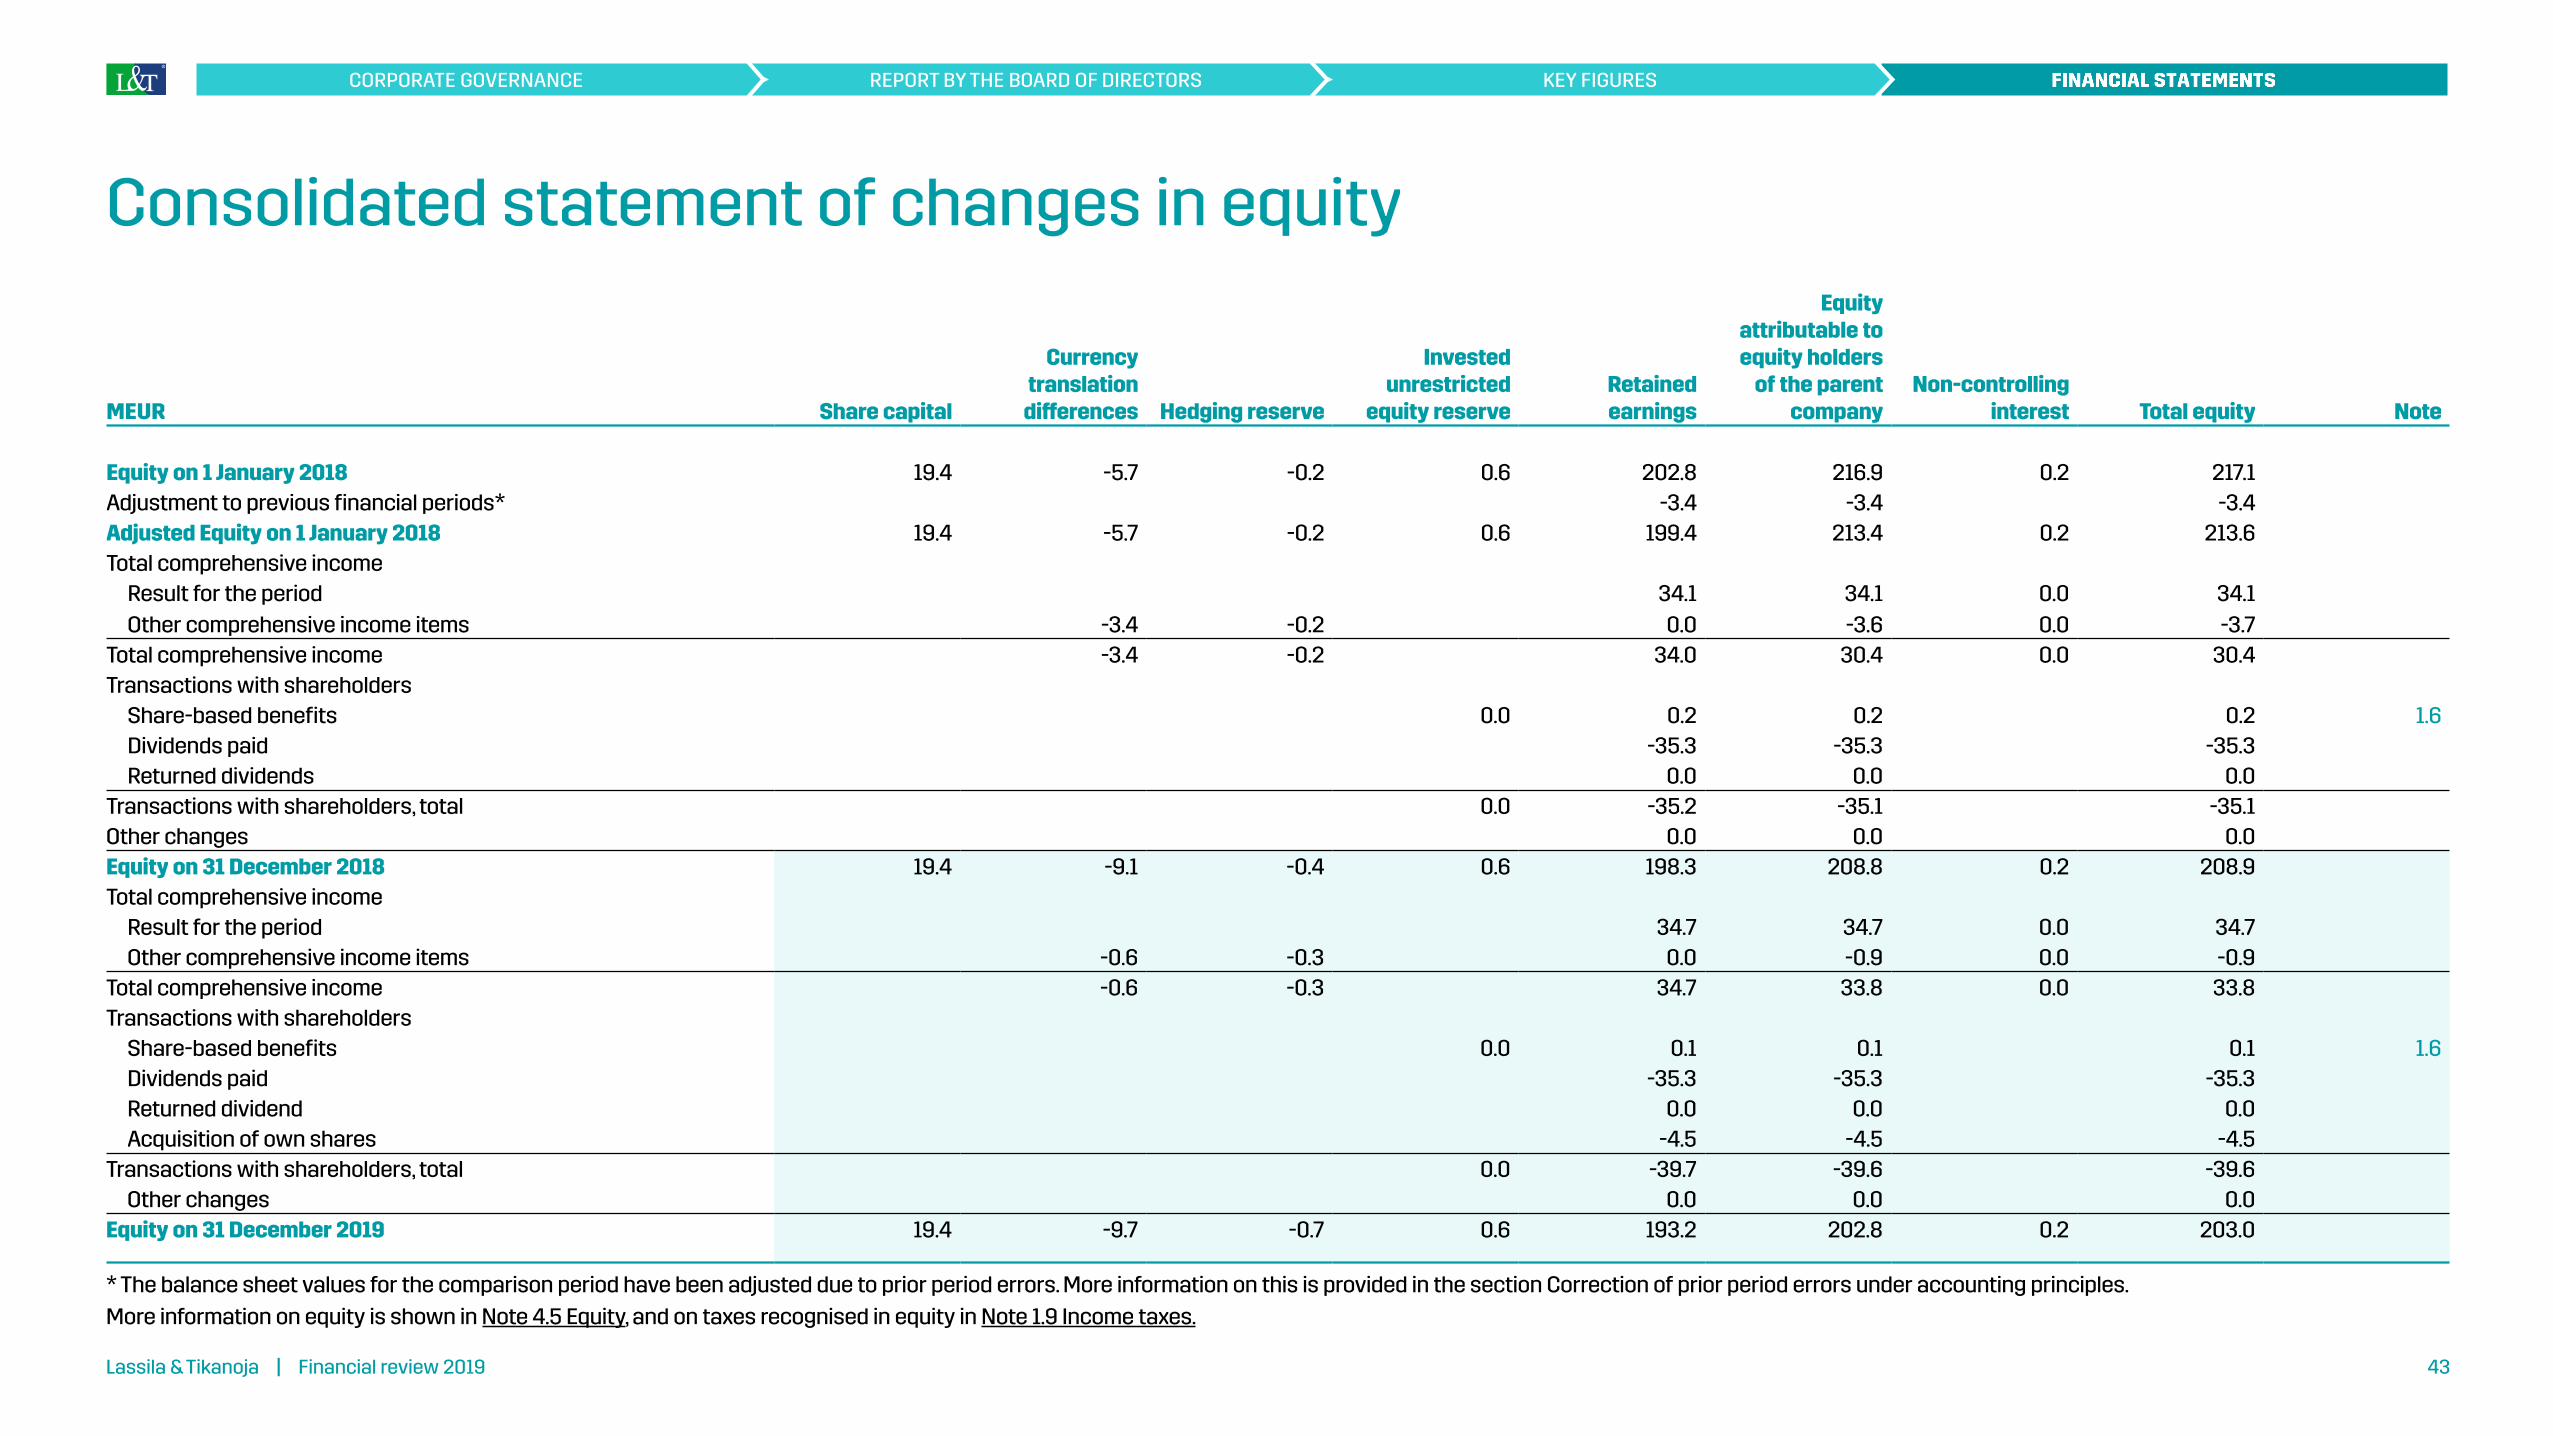
Consolidated statement of changes in equity
MEUR Share capital
Currency translation differences Hedging reserve
Invested unrestricted
equity reserveRetained earnings
Equity attributable to equity holders
of the parent company
Non-controlling interest Total equity Note
Equity on 1 January 2018 19.4 -5.7 -0.2 0.6 202.8 216.9 0.2 217.1Adjustment to previous financial periods* -3.4 -3.4 -3.4Adjusted Equity on 1 January 2018 19.4 -5.7 -0.2 0.6 199.4 213.4 0.2 213.6Total comprehensive income
Result for the period 34.1 34.1 0.0 34.1Other comprehensive income items -3.4 -0.2 0.0 -3.6 0.0 -3.7
Total comprehensive income -3.4 -0.2 34.0 30.4 0.0 30.4Transactions with shareholders
Share-based benefits 0.0 0.2 0.2 0.2 1.6Dividends paid -35.3 -35.3 -35.3Returned dividends 0.0 0.0 0.0
Transactions with shareholders, total 0.0 -35.2 -35.1 -35.1Other changes 0.0 0.0 0.0Equity on 31 December 2018 19.4 -9.1 -0.4 0.6 198.3 208.8 0.2 208.9Total comprehensive income
Result for the period 34.7 34.7 0.0 34.7Other comprehensive income items -0.6 -0.3 0.0 -0.9 0.0 -0.9
Total comprehensive income -0.6 -0.3 34.7 33.8 0.0 33.8Transactions with shareholders
Share-based benefits 0.0 0.1 0.1 0.1 1.6Dividends paid -35.3 -35.3 -35.3Returned dividend 0.0 0.0 0.0Acquisition of own shares -4.5 -4.5 -4.5
Transactions with shareholders, total 0.0 -39.7 -39.6 -39.6Other changes 0.0 0.0 0.0
Equity on 31 December 2019 19.4 -9.7 -0.7 0.6 193.2 202.8 0.2 203.0
* The balance sheet values for the comparison period have been adjusted due to prior period errors. More information on this is provided in the section Correction of prior period errors under accounting principles.More information on equity is shown in Note 4.5 Equity, and on taxes recognised in equity in Note 1.9 Income taxes.
Lassila & Tikanoja | Vuosikatsaus 2019 43Lassila & Tikanoja | Financial review 2019 43
KEY FIGURESREPORT BY THE BOARD OF DIRECTORSCORPORATE GOVERNANCE
General informationThe Lassila & Tikanoja Group specialises in environmental management and property and plant support services. The Group has business operations in Finland, Sweden and Russia.
The Group's parent company is Lassila & Tikanoja plc. Lassila & Tikanoja plc is a Finnish public limited liability company domiciled in Helsinki. The registered address of the Company is Valimotie 27, 00380 Helsinki.
Lassila & Tikanoja plc is listed on the NASDAQ OMX Helsinki.
The consolidated financial statements are available on the company website at www.lt.fi/en or from the parent company’s head office, address Valimotie 27, 00380 Helsinki, Finland.
These consolidated financial statements have been approved for issue by the Board of Directors of Lassila & Tikanoja plc on 28 January 2020. Under the Finnish Limited Liability Companies Act, the shareholders may accept or reject the financial statements at the general meeting of shareholders held after their publication. The meeting also has the power to make a decision to amend the financial statements.
Basis of preparationThe consolidated financial statements have been prepared in accordance with the International Financial Reporting Standards (IFRS), with application of the IFRS and IAS standards as well as IFRIC and SIC interpretations in effect on 31 December 2019. In the Finnish Accounting Act and regulations enacted by virtue of it, International Financial Reporting Standards refer to standards and related interpretations approved for adoption within the EU according to the procedure described in regulation (EC) 1606/2002. The notes to the consolidated financial statements also comply with the Finnish accounting and community legislation supplementing the IFRS regulations.
The financial statements have been prepared under the historical cost convention, with the exception of available-for-sale investments for which a fair value can be determined from market prices, and derivative contracts, which have been measured at fair value. Share-based payments have been recognised at fair value on the grant date.
Figures in these financial statements are presented in millions of euros.
Application of new or amended IFRS standards
New and amended standards adopted in 2019IFRS 16 Leases has been adopted as of 1 January 2019. IFRS 16 defines the principles for the recognition, measurement, presentation and disclosure of leases. The new standard replaces IAS 17 Leases and the related interpretations. The Group adopts the standard using the modified retrospective approach. This means that the cumulative effect resulting from implementation of IFRS 16 is presented in the opening balance as at 1 January 2019, and the comparative figures will not be restated for the period ending 31 December 2018. In transition to IFRS 16, a lease liability is recognised at the present value of the remaining lease payments for leases previously classified as operating leases under IAS 17. The Group measures the right-of-use assets at an amount equal to lease liability, which means that the transition will not have any impact on equity. The impact of the implementation of IFRS 16 on company's lease liabilities and right-of-use assets as at 1 January 2019 was 53.8 million euros. The estimated
Notes to the consolidated financial statements
amount to be recognised as right-of-use assets in accordance with IFRS 16 and the undiscounted lease payments per 31 December 2018 amounting to EUR 39.0 million differ from each other. The difference is mainly derived from the fact that according to IAS 17 the amount of remaining lease payments for ongoing lease contracts is determined based on a lease term measured until the first possible termination date. Under the new standard the lease term for the ongoing lease contracts will be determined based on the management’s estimate when the lease contract will be terminated. In addition, the discount rate and the exemptions related to short-term contracts and low value assets result in differences compared with the previous practice.
Lassila & Tikanoja | Vuosikatsaus 2019 44Lassila & Tikanoja | Financial review 2019 44
4. Financial risk and capital structure
KEY FIGURESREPORT BY THE BOARD OF DIRECTORSCORPORATE GOVERNANCE
5. Consolidation and other notes3. Intangible and tangible assets2. Operational assets and liabilities1. Financial result

MEUR 31 Dec 2019IFRS 16
implementation 1 Jan 2019
ASSETS
Non-current assets
Intangible assets 193.5 193.5Property, plant and equipment 155.2 -23.6 131.6Right-of-use assets - 77.4 77.4Other non-current assets 6.3 6.3
Total non-current assets 355.0 53.8 408.8
Total current assets 206.3 206.3
Total assets 561.3 53.8 615.1
MEUR 31 Dec 2018IFRS 16
implementation 1 Jan 2018
EQUITY AND LIABILITIES
Total equity 208.9 208.9
Liabilities
Non-current liabilities
Financial liabilities 144.8 43.6 188.4
Other liabilities 35.8 35.8
180.6 43.6 224.2
Current liabilities
Financial liabilities 7.4 10.2 17.6
Trade and other payables 162.4 162.4
Provisions 2.0 2.0
171.8 10.2 182.0
Total liabilities 352.4 53.8 406.2
Total equity and liabilities 561.3 53.8 615.1
Bridge calculation of IFRS 16 implementation
Operating lease liabilities 31 Dec 2019
39.0
Short-term leases -0.1
Low value leases -1.2
Finance lease liability IAS 17 23.8
Definition of lease term 21.9
Discount rate effect -5.8
Lease liability 1 Jan 2019 77.6
Since the internal interest rate of lease agreements cannot be determined easily, the incremental borrowing rate has been used as the discount rate. The incremental borrowing rate has been determined based on an interest rate matrix that reflects the effect of maturity on interest for leases with various terms. The components of the interest rate matrix are the reference rate, the margin of the incremental loan and any country and currency-specific risk allowance. The interest rates of the interest rate matrix vary between 1.5 and 12 per cent and impact the amount of lease agreement debt in gearing. The weighted average interest rate used in conjunction with implementation was 2.4 per cent.
IFRS 16 adjusted opening balance sheet
Lassila & Tikanoja | Vuosikatsaus 2019 45Lassila & Tikanoja | Financial review 2019 45
4. Financial risk and capital structure
KEY FIGURESREPORT BY THE BOARD OF DIRECTORSCORPORATE GOVERNANCE
5. Consolidation and other notes3. Intangible and tangible assets2. Operational assets and liabilities1. Financial result
Other new or amended IFRS standards and interpretations applied in the financial periodThe impact from other new and amended standards issued during financial year 2019 are not considered to be material to the Group's financial reporting.
New or amended IFRS standards and interpreta-tions to be applied in future financial periodsThe impact from other new and amended standards issued but not yet effective is not considered to be material to the Group's financial reporting.
Correction of prior period errorsDuring the financial year, the company evaluated its financial management processes and observed certain development areas related to the effectiveness of processes. Corrective measures have been taken with regard to these observations. In connection with this, information pertaining to the valuation of certain balance sheet items was observed that, in the view of the management, should have influenced the valuation of the balance sheet items in question in periods preceding the periods presented in the financial statements. The Group’s management found that, for the items in question, the IAS 8.5 definition of prior period errors is fulfilled and, as a result, the management has decided to present the adjustments related to the valuation of the balance sheet items in question as corrections of errors by restating the starting balances of assets, liabilities and equity for the earliest period presented in the financial statements.
The correction of prior period errors consists of impairment recognised on non-current assets totalling EUR 1.8 million, a provision for uncertain trade receivables and advance payments amounting to EUR 1.2 million and a provision for accident compensation payments amounting to EUR 1.3 million. Furthermore, a deferred tax asset of EUR 0.9 million is recognised in non-current assets in relation to the correction of the errors. The net effect on the starting balance of equity on 1 January 2018 is therefore EUR 3.4 million. The key figures and notes to the consolidated financial statements have been adjusted accordingly for the comparison year 2018.
Critical judgments in applying the Group’s accounting policiesIn drawing up IFRS financial statements, the Group management must make estimates and assumptions concerning the future, the outcome of which may differ from the estimates and assumptions made. The management also employs judgement when making decisions on the selection and application of accounting principles.
Considerations based on discretion apply, in particular, to cases where the applicable IFRS standards provide for alternative methods of recognition, measurement or presentation. The most significant area where management has used the judgement described above relates to the recognition of assets and liabilities for acquired business operations and to fair value measurement.
The preparation of financial statements requires the management to make estimates and assumptions that affect the carrying amounts on the balance sheet date for assets and liabilities and the amounts of revenues and expenses. The estimates and assumptions reflect the management’s best understanding on the closing date, based on previous experience and assumptions about the future that are considered to have the highest probability on the closing date.
Key assumptions regarding the future and key uncertainty factors related to estimates on the closing date that involve a significant risk of causing a material adjustment to the carrying amounts of the Group’s assets and liabilities within the next financial year are described in the following notes:
• 1.2 Revenue from contracts with customers• 2.1 Trade and other receivables• 2.5 Provisions • 3.1 Goodwill and other intangible assets• 3.2 Goodwill impairment tests• 3.3 Property, plant and equipment• 3.4 Right-of-use assets• 4.2 Financial assets and liabilities by category• 5.3 Business acquisitions
Lassila & Tikanoja | Vuosikatsaus 2019 46Lassila & Tikanoja | Financial review 2019 46
4. Financial risk and capital structure
KEY FIGURESREPORT BY THE BOARD OF DIRECTORSCORPORATE GOVERNANCE
5. Consolidation and other notes3. Intangible and tangible assets2. Operational assets and liabilities1. Financial result

Financial result1
784.3Net sales
MEUR
45.0Operating profit
MEUR0.90
Earnings per share (EPS)
EUR7,308
Average number of employees in full-time
equivalents
1.1 Segment reporting 48
1.2 Revenue from contracts with customers 53
1.3 Employee benefit expenses 56
1.4 Other operating income and expenses 57
1.5 Research and development expenses 57
1.6 Share-based payment 58
1.7 Lease expenses 59
1.8 Financial income and expenses 59
1.9 Income taxes 60
1.10 Earnings per share 62
1.11 Notes to the consolidated statement
of cash flows 62
Lassila & Tikanoja | Vuosikatsaus 2019 47Lassila & Tikanoja | Financial review 2019 47
5. Consolidation and other notes4. Financial risk and capital structure3. Intangible and tangible assets2. Operational assets and liabilities1. Financial result
KEY FIGURESREPORT BY THE BOARD OF DIRECTORSCORPORATE GOVERNANCE

The Group's operating segments during the financial yearThe Group has four reportable segments, which are the Group's business divisions.
The Group changed the segment reporting as of 1 January 2019. The new reporting segments in 2019 were Environmental Services, Industrial Services, Facility Services Finland and Facility Services Sweden. With this change, Lassila & Tikanoja aimed to improve utilization of the mutual synergies of the business based on material streams as well as the synergies of the business linked to real estates and the country-specific growth opportunities.
1.1 Segment reporting
Accounting policy
Segment information is reported to the highest operational decision-maker, consistent with internal reporting. The highest operational decision-maker is Lassila & Tikanoja plc’s President and CEO. Transactions between segments are based on market prices.
Segment assets are those operating assets that are employed by a segment in its operating activities and that can be allocated to the segment on a reasonable basis. Segment liabilities are those operating liabilities that result from the operating activities of the segment and can be allocated to the segment on a reasonable basis. Segment assets consist of intangible assets, property, plant and equipment, finance lease receivables, inventories and trade and other receivables excluding accrued receivables from interests and tax receivables. Segment liabilities consist of provisions and retirement benefit obligations and such non-current liabilities as prepayments, accrued liabilities and acquisition price liabilities, and such current liabilities as trade and other payables excluding accrued liabilities related to interests and tax liabilities.
Unallocated assets consist of liquid assets, receivables of interest rate and foreign currency derivatives, accrued interest receivables and other financial income and tax receivables. Unallocated liabilities consist of financial liabilities, liabilities of interest rate and foreign currency derivatives, accrued interest and other financing liabilities and tax liabilities.
In Finland, Technical System Services were included in the current Facility Services segment. For Sweden, the Technical Services business and cleaning business were merged into new reporting segment. The business of Renewable Energy Sources on the other hand was merged with the Environmental Services segment.
Environmental Services division consists of the waste management and recycling business, selling of receptacles and their maintenance business and new circular economy solutions. From the beginning of fiscal year 2019 the business of renewable energy sources (L&T Biowatti) was included in the division. Renewable energy sources provide its customers with wood-based fuels, recycled fuels and wood raw materials. It also provides forest services to forest owners.
Industrial Services division covers solutions for industrial material flows and their utilisation, industrial process cleaning solutions, collection and disposal of hazardous waste and sewer system maintenance and repair solutions.
Facility Services Finland division provides support services and services for cleaning, property maintenance, real estate management as well as repair and renovation services. From the beginning of fiscal year 2019 the division includes also the business of building automation, refrigeration technology and energy management.
Environmental Services 39%
Industrial Services 12%
Facility Services Finland 31%
Facility Services Sweden 17%
Net sales by division
784.3MEUR
Facility Services Sweden division provides support services and services for cleaning and technical services in Sweden.
Group Administration and Other segment includes expenses associated with Group management, as well as costs incurred from operating as a public company, and the assets and liabilities corresponding to this income and expenses. Group administration assets also include available-for-sale investments.
Lassila & Tikanoja | Vuosikatsaus 2019 48Lassila & Tikanoja | Financial review 2019 48
5. Consolidation and other notes4. Financial risk and capital structure3. Intangible and tangible assets2. Operational assets and liabilities1. Financial result
KEY FIGURESREPORT BY THE BOARD OF DIRECTORSCORPORATE GOVERNANCE

Operating profit
Group 1–12/2018
Group 1–12/2019
Industrial Services
Facility Services Sweden
Environmental Services
Facility Services Finland
Other
47.61.2
-0.4
45.0
-0.1
-9.3
6.0
-5.5 %
Net sales
802.2 1.9 2.3
-20.5 -2.2
784.3
-2.2%
Group 1–12/2018
Industrial Services
Facility Services Sweden
Environmental Services
Facility Services Finland
Group 1–12/2019
Lassila & Tikanoja | Vuosikatsaus 2019 49Lassila & Tikanoja | Financial review 2019 49
5. Consolidation and other notes4. Financial risk and capital structure3. Intangible and tangible assets2. Operational assets and liabilities1. Financial result
KEY FIGURESREPORT BY THE BOARD OF DIRECTORSCORPORATE GOVERNANCE
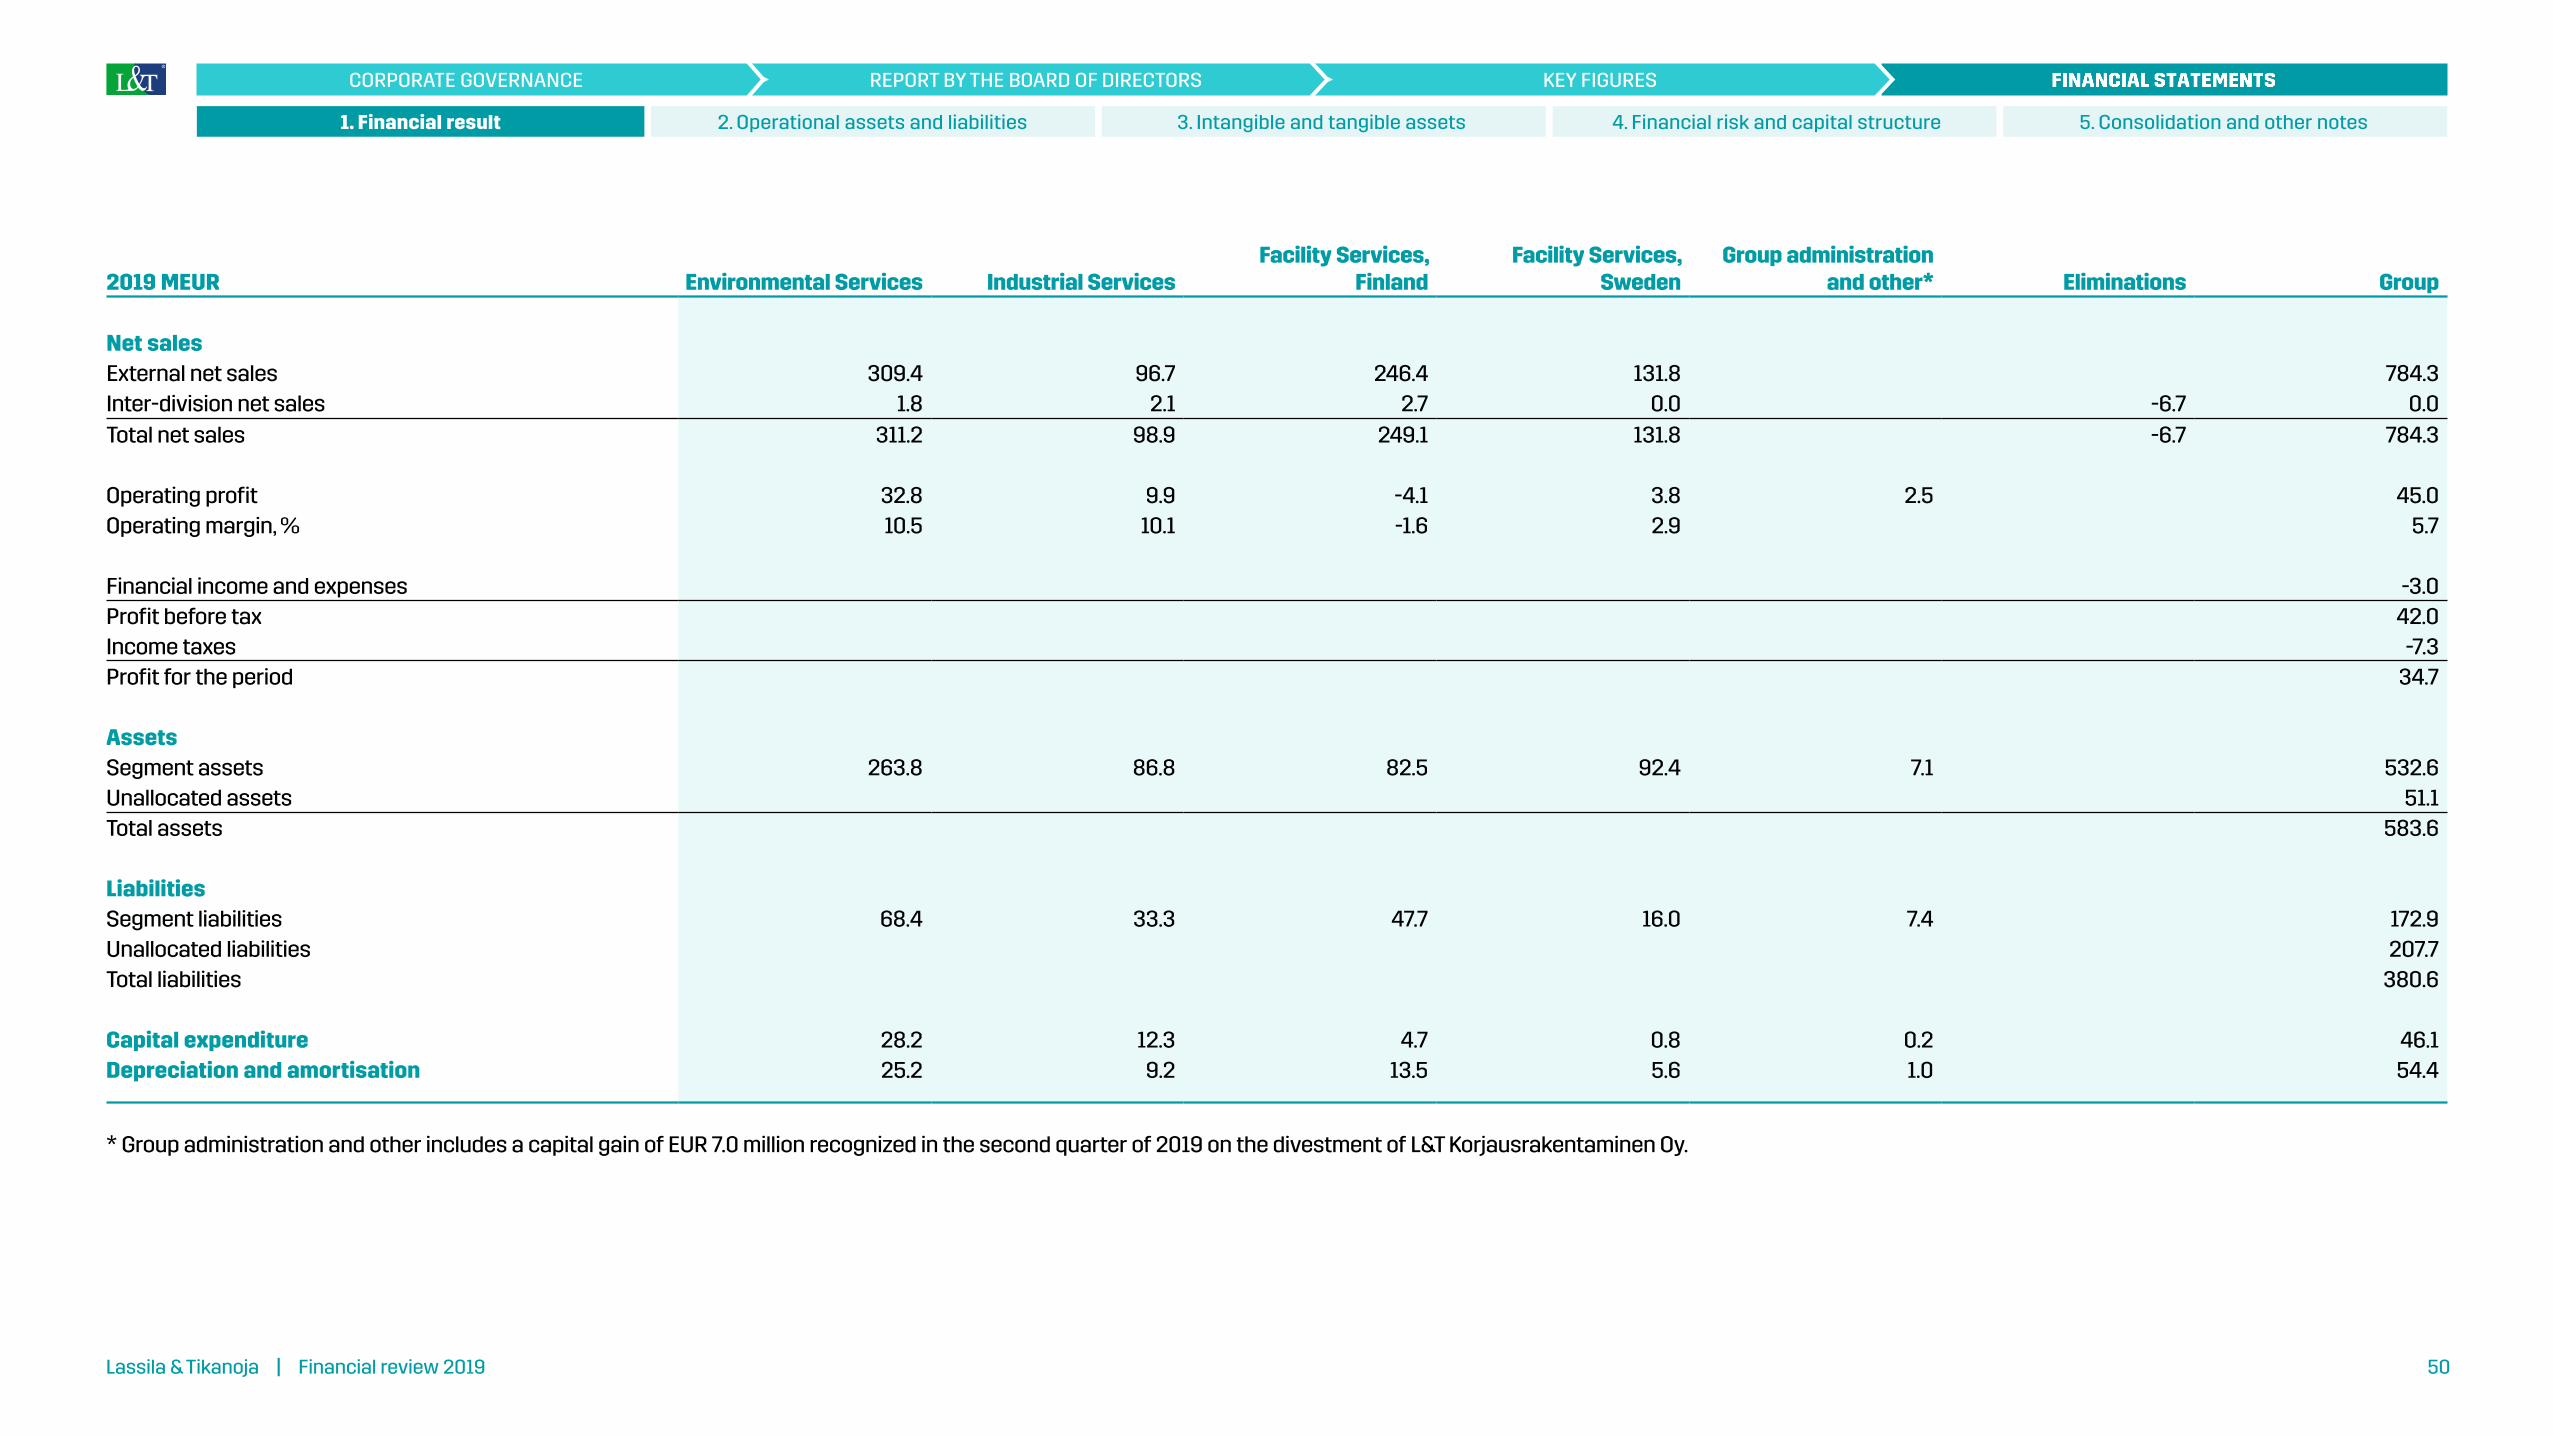
2019 MEUR Environmental Services Industrial ServicesFacility Services,
FinlandFacility Services,
Sweden Group administration
and other* Eliminations Group
Net salesExternal net sales 309.4 96.7 246.4 131.8 784.3Inter-division net sales 1.8 2.1 2.7 0.0 -6.7 0.0Total net sales 311.2 98.9 249.1 131.8 -6.7 784.3
Operating profit 32.8 9.9 -4.1 3.8 2.5 45.0Operating margin, % 10.5 10.1 -1.6 2.9 5.7
Financial income and expenses -3.0Profit before tax 42.0Income taxes -7.3Profit for the period 34.7
AssetsSegment assets 263.8 86.8 82.5 92.4 7.1 532.6Unallocated assets 51.1Total assets 583.6
LiabilitiesSegment liabilities 68.4 33.3 47.7 16.0 7.4 172.9Unallocated liabilities 207.7Total liabilities 380.6
Capital expenditure 28.2 12.3 4.7 0.8 0.2 46.1Depreciation and amortisation 25.2 9.2 13.5 5.6 1.0 54.4
* Group administration and other includes a capital gain of EUR 7.0 million recognized in the second quarter of 2019 on the divestment of L&T Korjausrakentaminen Oy.
Lassila & Tikanoja | Vuosikatsaus 2019 50Lassila & Tikanoja | Financial review 2019 50
5. Consolidation and other notes4. Financial risk and capital structure3. Intangible and tangible assets2. Operational assets and liabilities1. Financial result
KEY FIGURESREPORT BY THE BOARD OF DIRECTORSCORPORATE GOVERNANCE
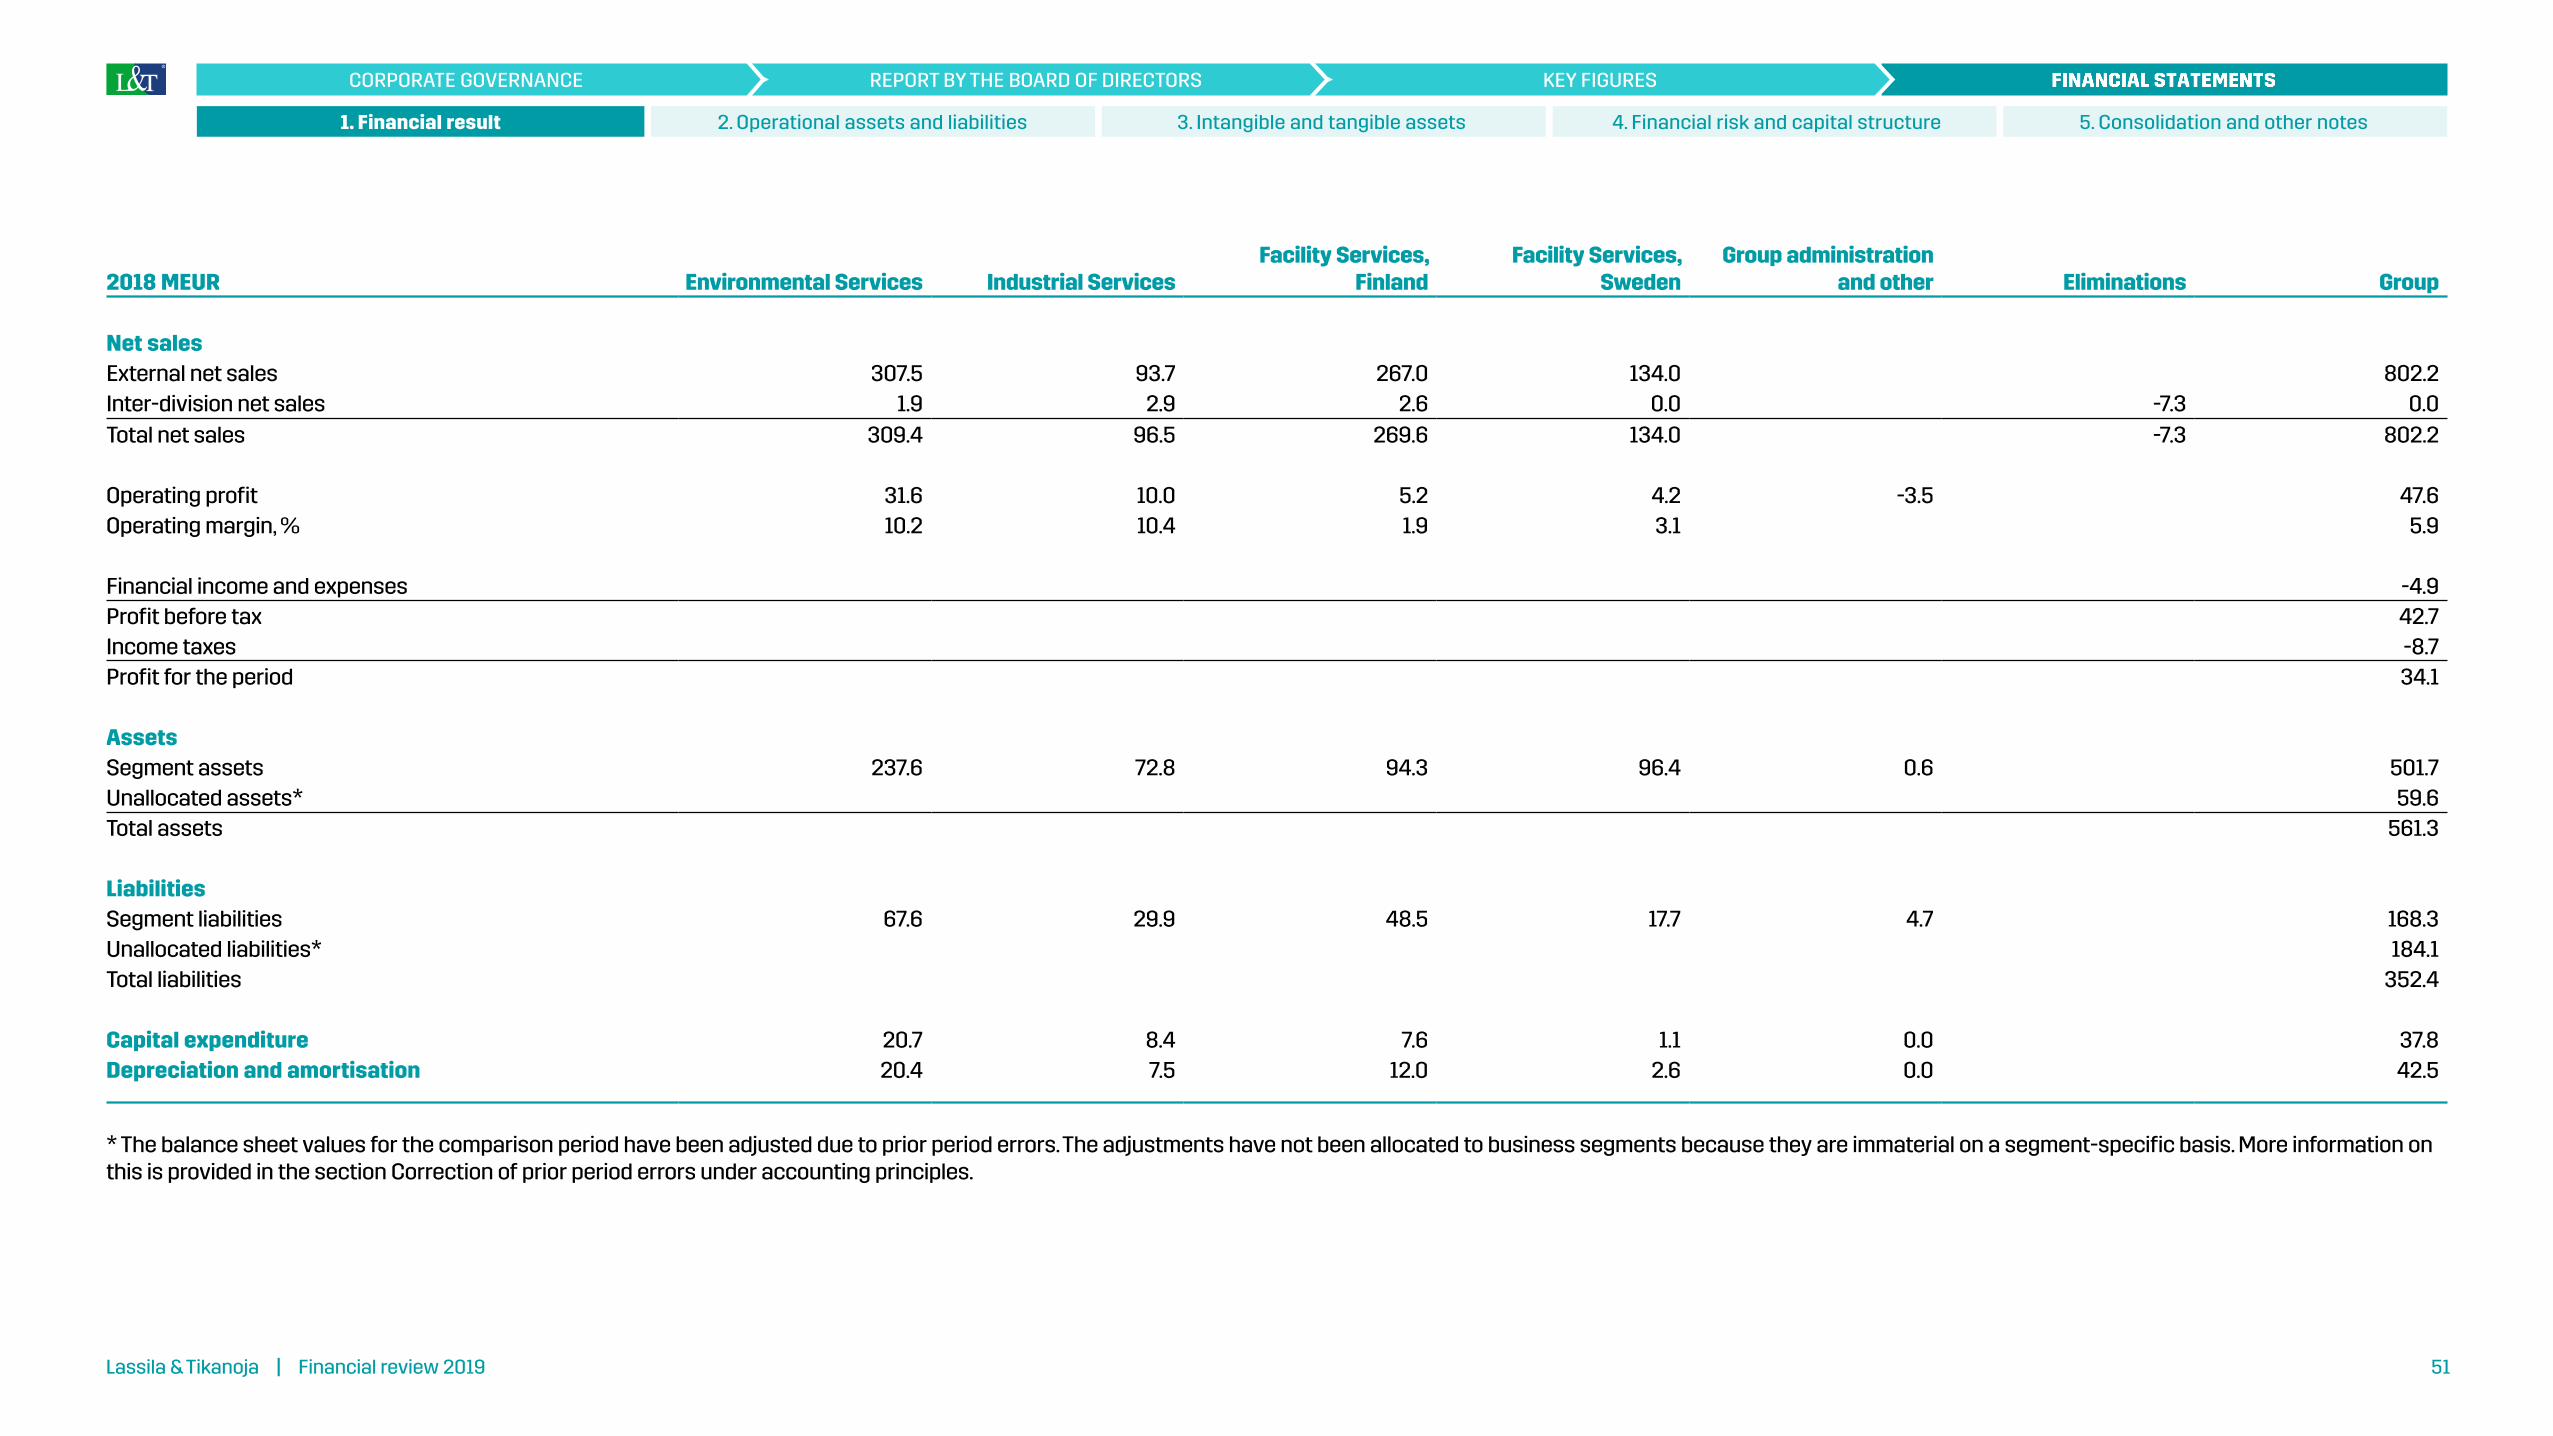
2018 MEUR Environmental Services Industrial ServicesFacility Services,
FinlandFacility Services,
Sweden Group administration
and other Eliminations Group
Net salesExternal net sales 307.5 93.7 267.0 134.0 802.2Inter-division net sales 1.9 2.9 2.6 0.0 -7.3 0.0Total net sales 309.4 96.5 269.6 134.0 -7.3 802.2
Operating profit 31.6 10.0 5.2 4.2 -3.5 47.6Operating margin, % 10.2 10.4 1.9 3.1 5.9
Financial income and expenses -4.9Profit before tax 42.7Income taxes -8.7Profit for the period 34.1
AssetsSegment assets 237.6 72.8 94.3 96.4 0.6 501.7Unallocated assets* 59.6Total assets 561.3
LiabilitiesSegment liabilities 67.6 29.9 48.5 17.7 4.7 168.3Unallocated liabilities* 184.1Total liabilities 352.4
Capital expenditure 20.7 8.4 7.6 1.1 0.0 37.8Depreciation and amortisation 20.4 7.5 12.0 2.6 0.0 42.5
* The balance sheet values for the comparison period have been adjusted due to prior period errors. The adjustments have not been allocated to business segments because they are immaterial on a segment-specific basis. More information on this is provided in the section Correction of prior period errors under accounting principles.
Lassila & Tikanoja | Vuosikatsaus 2019 51Lassila & Tikanoja | Financial review 2019 51
5. Consolidation and other notes4. Financial risk and capital structure3. Intangible and tangible assets2. Operational assets and liabilities1. Financial result
KEY FIGURESREPORT BY THE BOARD OF DIRECTORSCORPORATE GOVERNANCE

Reconciliation of reportable segments' assets to total assets
MEUR 2019 2018
Segment assets for reportable segments 525.4 501.2Other segments' assets 7.1 0.6
532.6 501.7Unallocated assetsLiquid assets 41.8 54.3Tax assets 8.5 6.0Other unallocated assets 0.8 1.4Adjustment to previous financial periods* - -2.1Total 51.1 59.6
Total assets 583.6 561.3
Reconciliation of reportable segments' liabilities to total liabilities
MEUR 2019 2018
Segment liabilities for reportable segments 165.5 163.6Other segments' liabilities 7.4 4.7
172.9 168.3Unallocated liabilitiesLiabilities of interest rate and foreign currency derivatives 178.3 149.8Accrued interest and other financing liabilities* 0.1 4.7Tax liabilities 29.3 29.6Total 207.7 184.1
Total liabilities 380.6 352.4
Geographical segments
MEUR 2019 2018
Net salesFinland 629.4 645.7
137.7 139.6Other countries 17.2 17.0Total 784.3 802.2
AssetsFinland 470.9 444.3Sweden 50.5 48.7Other countries 11.1 8.7Unallocated assets* 51.1 59.6Total 583.6 561.3
Capital expenditureFinland 44.5 36.3Other countries 1.6 1.5Total 46.1 37.8
* The balance sheet values for the comparison period have been adjusted due to prior period errors. The adjustments have not been allocated to business segments because they are immaterial on a segment-specific basis. More information on this is provided in the section Correction of prior period errors under accounting principles.
Accounting policyThe Group operates in Finland, Sweden and Russia. Net sales of geographical areas are reported based on the geographical location of the customer, and assets are reported by their geographical location.
Lassila & Tikanoja | Vuosikatsaus 2019 52Lassila & Tikanoja | Financial review 2019 52
5. Consolidation and other notes4. Financial risk and capital structure3. Intangible and tangible assets2. Operational assets and liabilities1. Financial result
KEY FIGURESREPORT BY THE BOARD OF DIRECTORSCORPORATE GOVERNANCE
1.2 Revenue from contracts with customers
Services businessServices business comprises of long-term service agreements and separately ordered services.
Long-term service agreements include for example waste management and recycling services which is part of Environmental Services as well as cleaning and property maintenance services included in Facility Services. Long-term service agreements include one or more performance obligations depending on the amount of distinct services provided to the customer. A typical characteristic of long-term services is that services are delivered evenly throughout the contract term. With one contract customer can order for example inside cleaning services, outside cleaning and upkeep services and property maintenance services that are distinct performance obligations. Each service is a distinct performance obligation as the customer can benefit from the services on its own and could order the services from different service providers. If a contract contains more than one distinct performance obligation, the transaction price is allocated to each performance obligation based on the stand-alone selling prices
In addition to the long-term service agreements, L&T offers services which are separately ordered as part of Industrial Services and Facility Services. Compared to the long-term service agreements, services that are ordered separately are typically short-term in nature and they are provided either occasionally or on a non-recurring basis.
Revenue from services business is recognised over time, as the customer simultaneously receives
and consumes the benefits provided by the Group performance. Revenue from services that are invoiced with a fixed monthly fee is recognised evenly over the contract term as also the work is performed evenly over the term. Revenue from services that are invoiced based on hourly fees is recognised based on the work performed. The management has identified that there may be seasonal fluctuation especially in the long-term service agreements of Facility Services as the work performed differs between seasons during the year. Management has estimated that the costs for these services incur evenly throughout the period and, thus, revenue is recognised evenly over the period.
Industrial Services receives contaminated soil from customers, for which the performance obligation is the receipt and processing of soil. Measuring progress towards complete satisfaction of the performance obligation is based on the output method. Revenue is recognised based on the amount of processed soil. Customer is invoiced when soil is received and the payment received from the customer is treated as a contract liability.
Project businessProject business includes for example projects for industrial process cleaning and closing of landfills which are part of Industrial Services business and renovation and building technology projects as well as refrigeration and cooling service projects for retailers and energy management projects included in Facility Services.
Accounting policyIFRS 15 defines a five-step model for recognising revenue from contracts with customers. The main objective of the standard is to provide useful information to users of financial statements about the nature, amount, timing and uncertainty of revenue and cash flows arising from a contract with a customers.
Revenue from contracts with customers is recognised when or as the performance obligation is satisfied by transferring a promised good or service to the customer. A good or a service is transferred when the customer obtains control of the good or service. Revenue is recognised based on the transaction price to which L&T expects to be entitled in exchange for transferring the good or service.
The Group acts as a principal in all of its contracts with customers. The Group applies the practical expedient of IFRS 15 and does not disclose the aggregate amount of the transaction price allocated to the performance obligations that are unsatisfied (or partially unsatisfied) at the end of the reporting period. This is because the contract period in the Group's customer contracts for project deliveries, is typically short. However, in long-term service agreements the contract period can be several years. For these contracts the Group applies the practical expedient according to which the Group is entitled to a consideration from the customer that corresponds directly with the value to the customer from Groups performance completed to date. In these contracts the Group recognises revenue for the amount that it is entitled to invoice.
Critical judgments by ManagementThe amount and timing of revenue recognition involves significant management’s judgement especially in the following areas:
• Identification of performance obligations for services business• Timing of revenue recognition in services and project business • Treatment of repurchase agreements relating to compactors and balers in Environmental Services business
including the assessment of the existence of a significant financing component• Measurement of a variable consideration
These judgments have been described in more detail in the description relating to revenue recognition.
Lassila & Tikanoja | Vuosikatsaus 2019 53Lassila & Tikanoja | Financial review 2019 53
5. Consolidation and other notes4. Financial risk and capital structure3. Intangible and tangible assets2. Operational assets and liabilities1. Financial result
KEY FIGURESREPORT BY THE BOARD OF DIRECTORSCORPORATE GOVERNANCE

In project business the customer orders the entire project at once and the project is considered as a single performance obligation. In some cases, a contract can also consist of several different locations and each location creates a distinct performance obligation. If the contract contains more than one distinct performance obligation, the transaction price is allocated to each performance obligation based on the stand-alone selling prices.
Revenue from project business is recognised over time as the projects mainly relate to enhancing an asset that the customer controls. In project business the input method based on costs incurred is used for measuring the progress towards complete satisfaction of the performance obligation. The management has estimated that the costs incurred for a project can be determined reliably. Also, due to the contract structure in project business the management has determined that L&T has an enforceable right to payment for performance completed to date. In project business invoicing is typically made based on a predetermined payment schedule.
Sale of equipment and materialsSale of equipment consists of sale of compactors and balers to customers included in Environmental Services business. Sale of materials consists of sale of wood-based fuels, recycled fuels and delivery of wood raw materials and of sale of recycled raw materials in Environmental Services business. Each equipment or material delivery creates a distinct performance obligation in the sale of equipment and materials. The
equipment delivered by the Group does not involve any additional warranties that would be considered as a distinct performance obligation.
Control of the delivered product is transferred when the physical possession of the product has been trans-ferred to the customer, which typically occurs at delivery.
Environmental Services business delivers wood-based fuels, recycled fuels and wood raw materials to customers. The consideration received from a customer is based on the amount of delivered fuel and the energy level of the fuel or on the amount of the delivered material. In some cases, the final transaction price is determined after the customer has measured the fuel’s energy value or amount of fuel delivered, and, thus, there is uncertainty relating to the amount of final transaction price. Management has estimated that the level of uncertainty related to the transaction price is low and any adjustments to be made to the transaction price when the uncertainty is resolved are not considered to be material.
Lease incomeIn addition to the sale of compactors and balers, customers can also lease the equipment through an external financing company. The agreement made between the Group and the financing company includes a repurchase obligation at the end of the lease period with a predetermined residual value. Due to the repurchase obligation management has determined that all the risks and rewards incidental to ownership of the assets are not transferred substantially to the customer and, thus, the leased equipment is treated as tangible assets. In the beginning of the lease term an
amount corresponding to the lease income and the residual value of the asset received from the financing company is presented as a liability. Lease income is recognised monthly during the lease term. Management has estimated that the amount of payment received from the financing company does not Include a significant financing component. Estimating variable considerationThe contracts with customers may include components of variable considerations, such as bonuses and penalties for delay. Management has determined that the level of uncertainty relating to the variable consideration is typically low. The estimate of the amount of variable considerations is reassessed at the end of each reporting period.
Contract balancesContract assets and trade receivablesA contract asset is the right to consideration in exchange for goods or services that are transferred to a customer. If goods or services are transferred to a customer before the customer pays a consideration, the amount is presented as a contract asset. If the company has an unconditional right to the consideration a trade receivable is presented in the statement of financial position.
Contract assets and trade receivables are assessed for impairment in accordance with IFRS 9. The general payment term for customers is 14 days, but it can vary depending on the specific case.
Contract liabilitiesA contract liability is an obligation to transfer goods or services to a customer for which L&T has received consideration from the customer. If a customer pays consideration before goods or services are transferred to the customer, a contract liability is presented in the statement of financial position when the payment is made by the customer.
Incremental costs of obtaining a contract The company does not have material incremental costs to obtain a contract. The company applies a practical expedient which allows the costs to obtain a contract to be recognised when they occur since amortisation period of these assets would have been one year or less.
Lassila & Tikanoja | Vuosikatsaus 2019 54Lassila & Tikanoja | Financial review 2019 54
5. Consolidation and other notes4. Financial risk and capital structure3. Intangible and tangible assets2. Operational assets and liabilities1. Financial result
KEY FIGURESREPORT BY THE BOARD OF DIRECTORSCORPORATE GOVERNANCE

Disaggregation of revenue
Revenue recognised over timeRevenue recognised
at a point in time Rent
2019 MEURLong-term service
agreementsSeparately ordered
services Project businessSales of equipment
and materials Lease income Total net sales
Environmental Services 212.0 96.8 2.4 311.2Industrial Services 47.0 42.0 6.0 3.8 98.9Facility Services Finland 162.7 68.6 17.8 249.1Facility Services Sweden 48.1 80.1 3.6 131.8Total 469.8 190.7 27.4 100.6 2.4 791.0Interdivision -6.7External net sales 784.3
Revenue recognised over timeRevenue recognised
at a point in time Rent
2018 MEURLong-term service
agreementsSeparately ordered
services Project businessSales of equipment
and materials Lease income Total net sales
Environmental Services 209.0 98.5 2.0 309.4Industrial Services 44.5 41.5 5.4 5.1 96.5Facility Services Finland 168.6 61.5 39.5 269.6Facility Services Sweden 58.7 69.2 6.1 134.0Total 480.8 172.2 51.0 103.6 2.0 809.5Interdivision -7.3External net sales 802.2
Contract balances
MEUR 2019 2018
Trade receivables 84.2 87.1Contract assets 22.0 31.9Contract liabilities 10.1 10.0
As the contracts are generally short-term, contract liabilities are recognised as revenue entirely during the following period. Contract liabilities are included in the balance sheet item Trade and other payables.
Lassila & Tikanoja | Vuosikatsaus 2019 55Lassila & Tikanoja | Financial review 2019 55
5. Consolidation and other notes4. Financial risk and capital structure3. Intangible and tangible assets2. Operational assets and liabilities1. Financial result
KEY FIGURESREPORT BY THE BOARD OF DIRECTORSCORPORATE GOVERNANCE

1.3 Employee benefit expenses
MEUR 2019 2018
Wages and salaries 261.4 259.3Pension costs
Defined contribution plans 56.5 56.4Defined benefit plans 0.0 0.0
Share-based payment 0.2 0.2Other personnel expenses 8.9 8.3Total 327.1 324.2
Details on share-based payment are presented in Note 1.6 Share-based payment. The employee benefits of the top management are presented in Note 5.4 Related-party transactions. Details on the items of defined benefit pension plans in the consolidated statement of financial position are presented in Note 2.6 Retirement benefit obligations.
Average number of employees in full-time equivalents
MEUR 2019 2018
White collar 1,259 1,279Blue collar 6,049 6,287Total 7,308 7,566
Finland 5,946 6,199Sweden 1,020 1,066Russia 342 301Total 7,308 7,566
Lassila & Tikanoja | Vuosikatsaus 2019 56Lassila & Tikanoja | Financial review 2019 56
5. Consolidation and other notes4. Financial risk and capital structure3. Intangible and tangible assets2. Operational assets and liabilities1. Financial result
KEY FIGURESREPORT BY THE BOARD OF DIRECTORSCORPORATE GOVERNANCE

1.4 Other operating income and expenses
MEUR 2019 2018
Other operating incomeGains on sales of property, plant and equipment 1.1 1.3Annual discounts 0.3 1.5Reversals of impairment losses on trade receivables 0.1 0.5Reimbursements and government grants 0.4 0.6Change in commodity derivatives 0.0 0.4Gain on sale of shares 7.5 0.2Other 1.3 0.6Total 10.6 5.2
Other operating expensesICT costs 14.8 13.9Travel costs 11.5 11.6Change in bad debt provision 0.2 0.1Vehicles and machinery 41.8 40.5Rents and real estate costs 3.5 16.7Expert fees 6.7 6.4Voluntary social security costs 6.5 6.1Other 13.3 13.5Total 98.3 108.7
1.5 Research and development expenses
Accounting policyOther operating income and expenses includes income and expenses that are not considered as being directly linked to the group’s business operations. They include, for instance, income and expenses resulting from the sales of assets and business operations, expenses and allowances for credit losses and the corresponding cancellations as well as expenses resulting from the use of vehicles and machines. The items also include the realised and unrealised losses from derivatives used for hedging against commodity risks.
Government grants or other grants relating to actual costs are recognised in the income statement when the group complies with the conditions attached to them and there is reasonable assurance that the grants will be received. They are presented in other operating income. Government grants directly associated with the recruitment of personnel, such as employment grants, apprenticeship grants and the like, are recognised as reductions in personnel expenses.
Grants for acquisition of property, plant and equipment are recognised as deductions of historical cost. The grant is recognised as revenue over the economic life of a depreciable asset, by way of a reduced depreciation charge.
Accounting policyResearch expenditure is recognised as an expense during the period in which it is incurred. The gains from new service concepts can only be verified at such a late stage that the revenue recognition criteria are not considered fulfilled before the service delivery. Computer software development costs recognised as an asset in the statement of financial position are described in more detail in Note 3.1.
EUR 1.9 million (1.8) research and development expenses arising from centralised development projects are included in the income statement.
Lassila & Tikanoja | Vuosikatsaus 2019 57Lassila & Tikanoja | Financial review 2019 57
5. Consolidation and other notes4. Financial risk and capital structure3. Intangible and tangible assets2. Operational assets and liabilities1. Financial result
KEY FIGURESREPORT BY THE BOARD OF DIRECTORSCORPORATE GOVERNANCE

1.6 Share-based payment
Based on the programme a maximum of 31,900 shares of the company can be granted.
Under the programme, a total of 2,584 Lassila & Tikanoja Plc's shares were granted in 2018. The programme covered 10 persons.
Share-based incentive programme 2018Lassila & Tikanoja plc’s Board of Directors decided at a meeting held on 13 December 2017 on a new share-based incentive programme. Potential rewards will be based on the EVA result of Lassila & Tikanoja group.
Based on the programme a maximum of 28,600 shares of the company can be granted.
Under the programme, an estimated total of 11,233 Lassila & Tikanoja Plc's shares will be granted in 2019. The programme covered 8 persons.
Share-based incentive programme 2019Lassila & Tikanoja plc’s Board of Directors decided at a meeting held on 12 December 2018 on a new share-based incentive programme. Potential rewards will be based on the EVA result of Lassila & Tikanoja group.
Based on the programme a maximum of 32,850 shares of the company can be granted. The shares to be paid out as potential rewards will be transferred from the shares held by the company.
Under the programme, an estimated total of 6,127 Lassila & Tikanoja Plc's shares will be granted in 2020. The shares to be paid out as potential rewards will be transferred from the shares held by the company. The programme covers 8 persons.
Share-based incentive programmes 2016, 2017, 2018 and 2019
Share-based incentive programme 2016 2017 2018 2019
Grant date 11.1.2016 13.12.2016 13.12.2017 12.12.2018Start of earnings period 1.1.2016 1.1.2017 1.1.2018 1.1.2019End of earnings period 31.12.2016 31.12.2017 31.12.2018 31.12.2019Average share price at grant date 17.79 18.92 17.72 16.16
Realisation on closing date, shares* 16,110 2,584 11,233 6,127
Obligation to hold shares, years 2 2 2 2Release date of shares 31.03.2019 31.03.2020 31.03.2021 31/03/2022Number of persons included 10 10 8 8
Expenses arising from share-based incentive programme
MEUR 2019 2018Share component 0.1 0.1Cash component 0.1 0.1Total 0.2 0.2
* The realisation of 2019 is an estimation.
Share-based incentive programme 2016Lassila & Tikanoja plc’s Board of Directors decided at a meeting held on 11 January 2016 on a new share-based incentive programme. Potential rewards was based on the EVA result of Lassila & Tikanoja group.
Based on the programme a maximum of 34,200 shares of the company could be granted. The shares paid out as rewards were transferred from the shares held by the company.
Under the programme, a total of 16,110 Lassila & Tikanoja Plc's shares were granted in 2017. The programme covered 10 persons.
Share-based incentive programme 2017Lassila & Tikanoja plc’s Board of Directors decided at a meeting held on 13 December 2016 on a new share-based incentive programme. Potential rewards will be based on the EVA result of Lassila & Tikanoja group.
Accounting policyThe Group has several incentive arrangements for which payments are made either as equity instruments or cash. The benefits granted under the arrangements are measured at fair value on the granting date and recognised as expense evenly over the vesting period. The effect of the arrangement on profit and loss is recognised under employee benefit expenses.
Lassila & Tikanoja | Vuosikatsaus 2019 58Lassila & Tikanoja | Financial review 2019 58
5. Consolidation and other notes4. Financial risk and capital structure3. Intangible and tangible assets2. Operational assets and liabilities1. Financial result
KEY FIGURESREPORT BY THE BOARD OF DIRECTORSCORPORATE GOVERNANCE

1.7 Lease expenses
MEUR 2019 2018
Financial incomeInterest income on loans and other receivables 0.2 0.4Foreign exchange gains 0.7 -Total financial income 0.9 0.4
Financial expensesInterest expenses on borrowings measured at amortised cost 3.4 2.4Other financial expenses 0.5 1.4Losses on foreign exchange - 1.1Total financial expenses 3.9 4.9
Financial income and expenses -3.0 -4.5
1.8 Financial income and expenses
Accounting policyThe Group leases production and office premises including related land areas and vehicles. The Group’s lease agreements are mainly classified as operating leases, for which a lease expense is recognised in the income statement in accordance with IAS 17. IFRS 16 changed the accounting treatment of those lease agreements from 1 January 2019 onwards. In addition, the Group has assets leased under finance lease contracts. These assets have been capitalised in the balance sheet during previous periods and recognition and presentation of these leases will not change in the transition to IFRS 16.
IFRS 16 requires that essentially all leasing contracts shall be recognised in the balance sheet. At the commencement date of the contract, a lessee recognises a lease liability and a corresponding right-of-use asset in the balance sheet. The lease liability is measured at the present value of the remaining lease payments. In the income statement, instead of lease expenses, depreciation on right-of-use assets and interest expense on the lease liability is recognised.
The standard includes two practical exemptions relating to short-term leases for which the lease term is 12 months or less and leases for which the underlying asset is of low value. In addition, contracts relating to certain intangible assets have been excluded from the scope of IFRS 16, and application of IFRS 16 for lease contracts relating to other intangible assets is optional. L&T has decided to apply the practical exemptions for short-term leases and low-value assets and will thus not recognise a right-of-use asset for these leases. Furthermore, IFRS 16 will not be applied to intangible assets. For lessors, the lease accounting requirements remain substantially unchanged as according to IAS 17.
MEUR 2019
Depreciation of right-of-use assets -16.4Interest expense from lease contracts -1.5Costs from short-term lease contracts -0.1Costs from low-value asset lease contracts -1.9Total -19.9
Accounting policyExchange rate gains and losses arising from foreign-currency transactions and the translation of monetary items are recognised in the income statement. Foreign exchange gains and losses on business transactions are included in the respective items above operating profit. Foreign exchange gains and losses on financial assets and liabilities are included in financial income and costs.
Borrowing costs are recognised as expenses in the period in which they arise.Borrowing costs that are directly attributable to the acquisition, construction or production of a qualifying asset shall be included in the acquisition cost of that asset.
Transaction costs directly attributable to borrowing have been included in the historical cost of the liability and recognised as an interest expense during the expected life of the liability applying the effective interest method.
Lassila & Tikanoja | Vuosikatsaus 2019 59Lassila & Tikanoja | Financial review 2019 59
5. Consolidation and other notes4. Financial risk and capital structure3. Intangible and tangible assets2. Operational assets and liabilities1. Financial result
KEY FIGURESREPORT BY THE BOARD OF DIRECTORSCORPORATE GOVERNANCE

1.9 Income taxes
The differences between income tax expense recognised in the income statement and income tax calculated at the statutory tax rate in Finland:
MEUR 2019 2018
Profit before tax 42.0 42.7Income tax at Finnish tax rate 20% -8.4 -8.5Difference between tax rate in Finland and in other countries -0.2 0.0Expenses not deductible for tax purposes -0.2 -0.2Tax exempt income 1.5 0.0Income tax for previous periods 0.0 0.0Unrecognised deferred tax on loss for the period 0.0 -0.1Use of previous years losses 0.0 0.1Other items -0.2 0.1Total -7.3 -8.7
Tax effects of components of other comprehensive income
2019 2018
MEURBefore
tax
Tax expense/
benefit After taxBefore
tax
Tax expense/
benefit After tax
Items arising from re-measurement of defined benefit plans 0.0 0.0 0.0 -0.1 0.0 0.0Hedging reserve, change in fair value -0.4 0.1 -0.3 -0.3 0.1 -0.2Currency translation differences -0.6 0.0 -0.6 -3.4 0.0 -3.4Currency translation differences non-controlling interest 0.0 0.0 0.0 0.0 0.0 0.0Components of other comprehensive income -1.0 0.1 -0.9 -3.7 0.1 -3.7
Income tax in the income statement
MEUR 2019 2018
Income tax for the period -7.4 -5.1Income tax for previous periods 0.0 0.0Change in deferred tax 0.1 -3.6Total -7.3 -8.7
Accounting policyThe Group’s income taxes consist of current tax and deferred tax. Tax expenses are recognised in the income statement, with the exception of items directly recognised in equity or comprehensive result, in which case the tax effect is recognised corresponding item. Current tax is determined for the taxable profit for the period according to prevailing tax rates in each country. Taxes are adjusted by current tax rates for previous periods, if any.
Deferred tax assets and liabilities are recognised for all temporary differences between the tax bases of assets and liabilities and their carrying amounts. Calculation of deferred taxes is based on the tax rates in effect on the closing day. If the rates change, it is based on the new tax rate. No deferred tax is recognised for impairment of goodwill that is not tax-deductible. A deferred tax asset is recognised only to the extent that it is probable that taxable profit will be available against which the deferred tax asset can be utilised.
Temporary differences arise e.g. from goodwill amortisation performed under FAS and depreciation on property, plant and equipment.
Lassila & Tikanoja | Vuosikatsaus 2019 60Lassila & Tikanoja | Financial review 2019 60
5. Consolidation and other notes4. Financial risk and capital structure3. Intangible and tangible assets2. Operational assets and liabilities1. Financial result
KEY FIGURESREPORT BY THE BOARD OF DIRECTORSCORPORATE GOVERNANCE

MEUR 1 Jan 2019
Recognised in income
statementRecognised
in equityOther
changesBusiness
acquisitions 31 Dec 2019
Deferred tax assetsPension benefits 0.2 0.0 0.0 0.2Provisions 1.3 0.0 0.0 0.1 1.4Fair value adjustments 0.1 0.0 0.1 0.2Deferred depreciation 1.2 0.1 0.0 1.3Other tax-deductible temporary differences
3.5 -0.1 0.0 0.0 3.4
Total 6.3 0.0 0.2 0.1 0.0 6.5
Deferred tax liabilitiesDepreciation differences and dissolution losses
-31.2 0.1 0.0 0.0 0.0 -31.1
Finance leasing agreements 0.0 0.0 0.0Share-based benefits 0.1 -0.1 0.0 0.0Other tax-deductible temporary differences
0.0 0.0 0.0 0.0 0.0 0.0
Total -31.2 0.1 0.0 0.0 0.0 -31.1
Net deferred tax liability -24.9 0.1 0.1 0.1 0.0 -24.6
MEUR 1 Jan 2018
Recognised in income
statementRecognised
in equityOther
changesBusiness
acquisitions 31 Dec 2018
Deferred tax assetsPension benefits 0.2 0.0 0.0 0.2Provisions 1.5 -0.1 1.3Fair value adjustments 0.0 0.0 0.1 0.1Deferred depreciation 1.0 0.2 1.2Other tax-deductible temporary differences
6.9 -3.3 0.0 -0.1 0.0 3.5
Total 9.6 -3.3 0.1 -0.1 0.0 6.3
Deferred tax liabilitiesDepreciation differences and dissolution losses
-31.0 0.6 0.0 -0.8 0.0 -31.2
Finance leasing agreements -0.1 0.0 0.0Share-based benefits 0.1 0.0 0.0 0.1Other tax-deductible temporary differences
0.0 0.0 0.0 0.0 0.0 0.0
Total -31.0 0.7 0.0 -0.8 0.0 -31.2
Net deferred tax liability -21.5 -2.6 0.1 -0.9 0.0 -24.9
Deferred taxes in the statement of financial position
MEUR 2019 2018
Deferred tax assets 4.6 4.4Deferred tax liabilities -29.2 -29.3Net deferred tax liabilities -24.6 -24.9
Deferred tax is recognised in the statement of financial position as tax assets and tax liabilities. Deferred tax assets and deferred tax liabilities are set off if both the assets and the liabilities relate to the same taxable entity and if the amount is not significant.
Other tax-deductible temporary differences include a deferred tax asset related to revenue recognition of amortisation on dissolution losses, which amounts to EUR 2.0 million (2.0).
Lassila & Tikanoja | Vuosikatsaus 2019 61Lassila & Tikanoja | Financial review 2019 61
5. Consolidation and other notes4. Financial risk and capital structure3. Intangible and tangible assets2. Operational assets and liabilities1. Financial result
KEY FIGURESREPORT BY THE BOARD OF DIRECTORSCORPORATE GOVERNANCE

1.11 Notes to the consolidated statement of cash flows
MEUR 2019 2018
Adjustments to cash flows from operating activitiesTaxes 7.3 8.7Depreciation, amortisation and impairment 54.4 42.5Finance income and costs 3.0 4.5Gains and losses of sale -7.0 -Provisions 1.8 -1.7Other -1.2 1.6Total 58.3 55.6
1.10 Earnings per share
Accounting policyBasic earnings per share is calculated by dividing the profit for the period attributable to equity holders of the parent company by the adjusted weighted average number of ordinary shares outstanding during the period excluding ordinary shares purchased by the company and held as treasury shares. Diluted earnings per share is calculated by adjusting the weighted average number of ordinary shares outstanding to assume conversion of all dilutive potential ordinary shares.
MEUR 2019 2018
Profit attributable to equity holders of the company 34.7 34.1Adjusted weighted average number of ordinary shares outstanding during the year, million shares
38.4 38.4
Earnings per share, EUR 0.90 0.89
Dilutive effect of the share-based incentive programme, million shares 0.0 0.0Adjusted average number of shares during the period, diluted, million shares
38.4 38.4
Earnings per share, diluted, EUR 0.90 0.89
Lassila & Tikanoja | Vuosikatsaus 2019 62Lassila & Tikanoja | Financial review 2019 62
5. Consolidation and other notes4. Financial risk and capital structure3. Intangible and tangible assets2. Operational assets and liabilities1. Financial result
KEY FIGURESREPORT BY THE BOARD OF DIRECTORSCORPORATE GOVERNANCE

Operational assets and liabilities
2
2.1 Trade and other receivables 64
2.2 Inventories 65
2.3 Trade and other current payables 66
2.4 Other non-current liabilities 66
2.5 Provisions 67
2.6 Retirement benefit obligations 68
Lassila & Tikanoja | Vuosikatsaus 2019 63Lassila & Tikanoja | Financial review 2019 63
2. Operational assets and liabilities1. Financial result
KEY FIGURESREPORT BY THE BOARD OF DIRECTORSCORPORATE GOVERNANCE
5. Consolidation and other notes4. Financial risk and capital structure3. Intangible and tangible assets
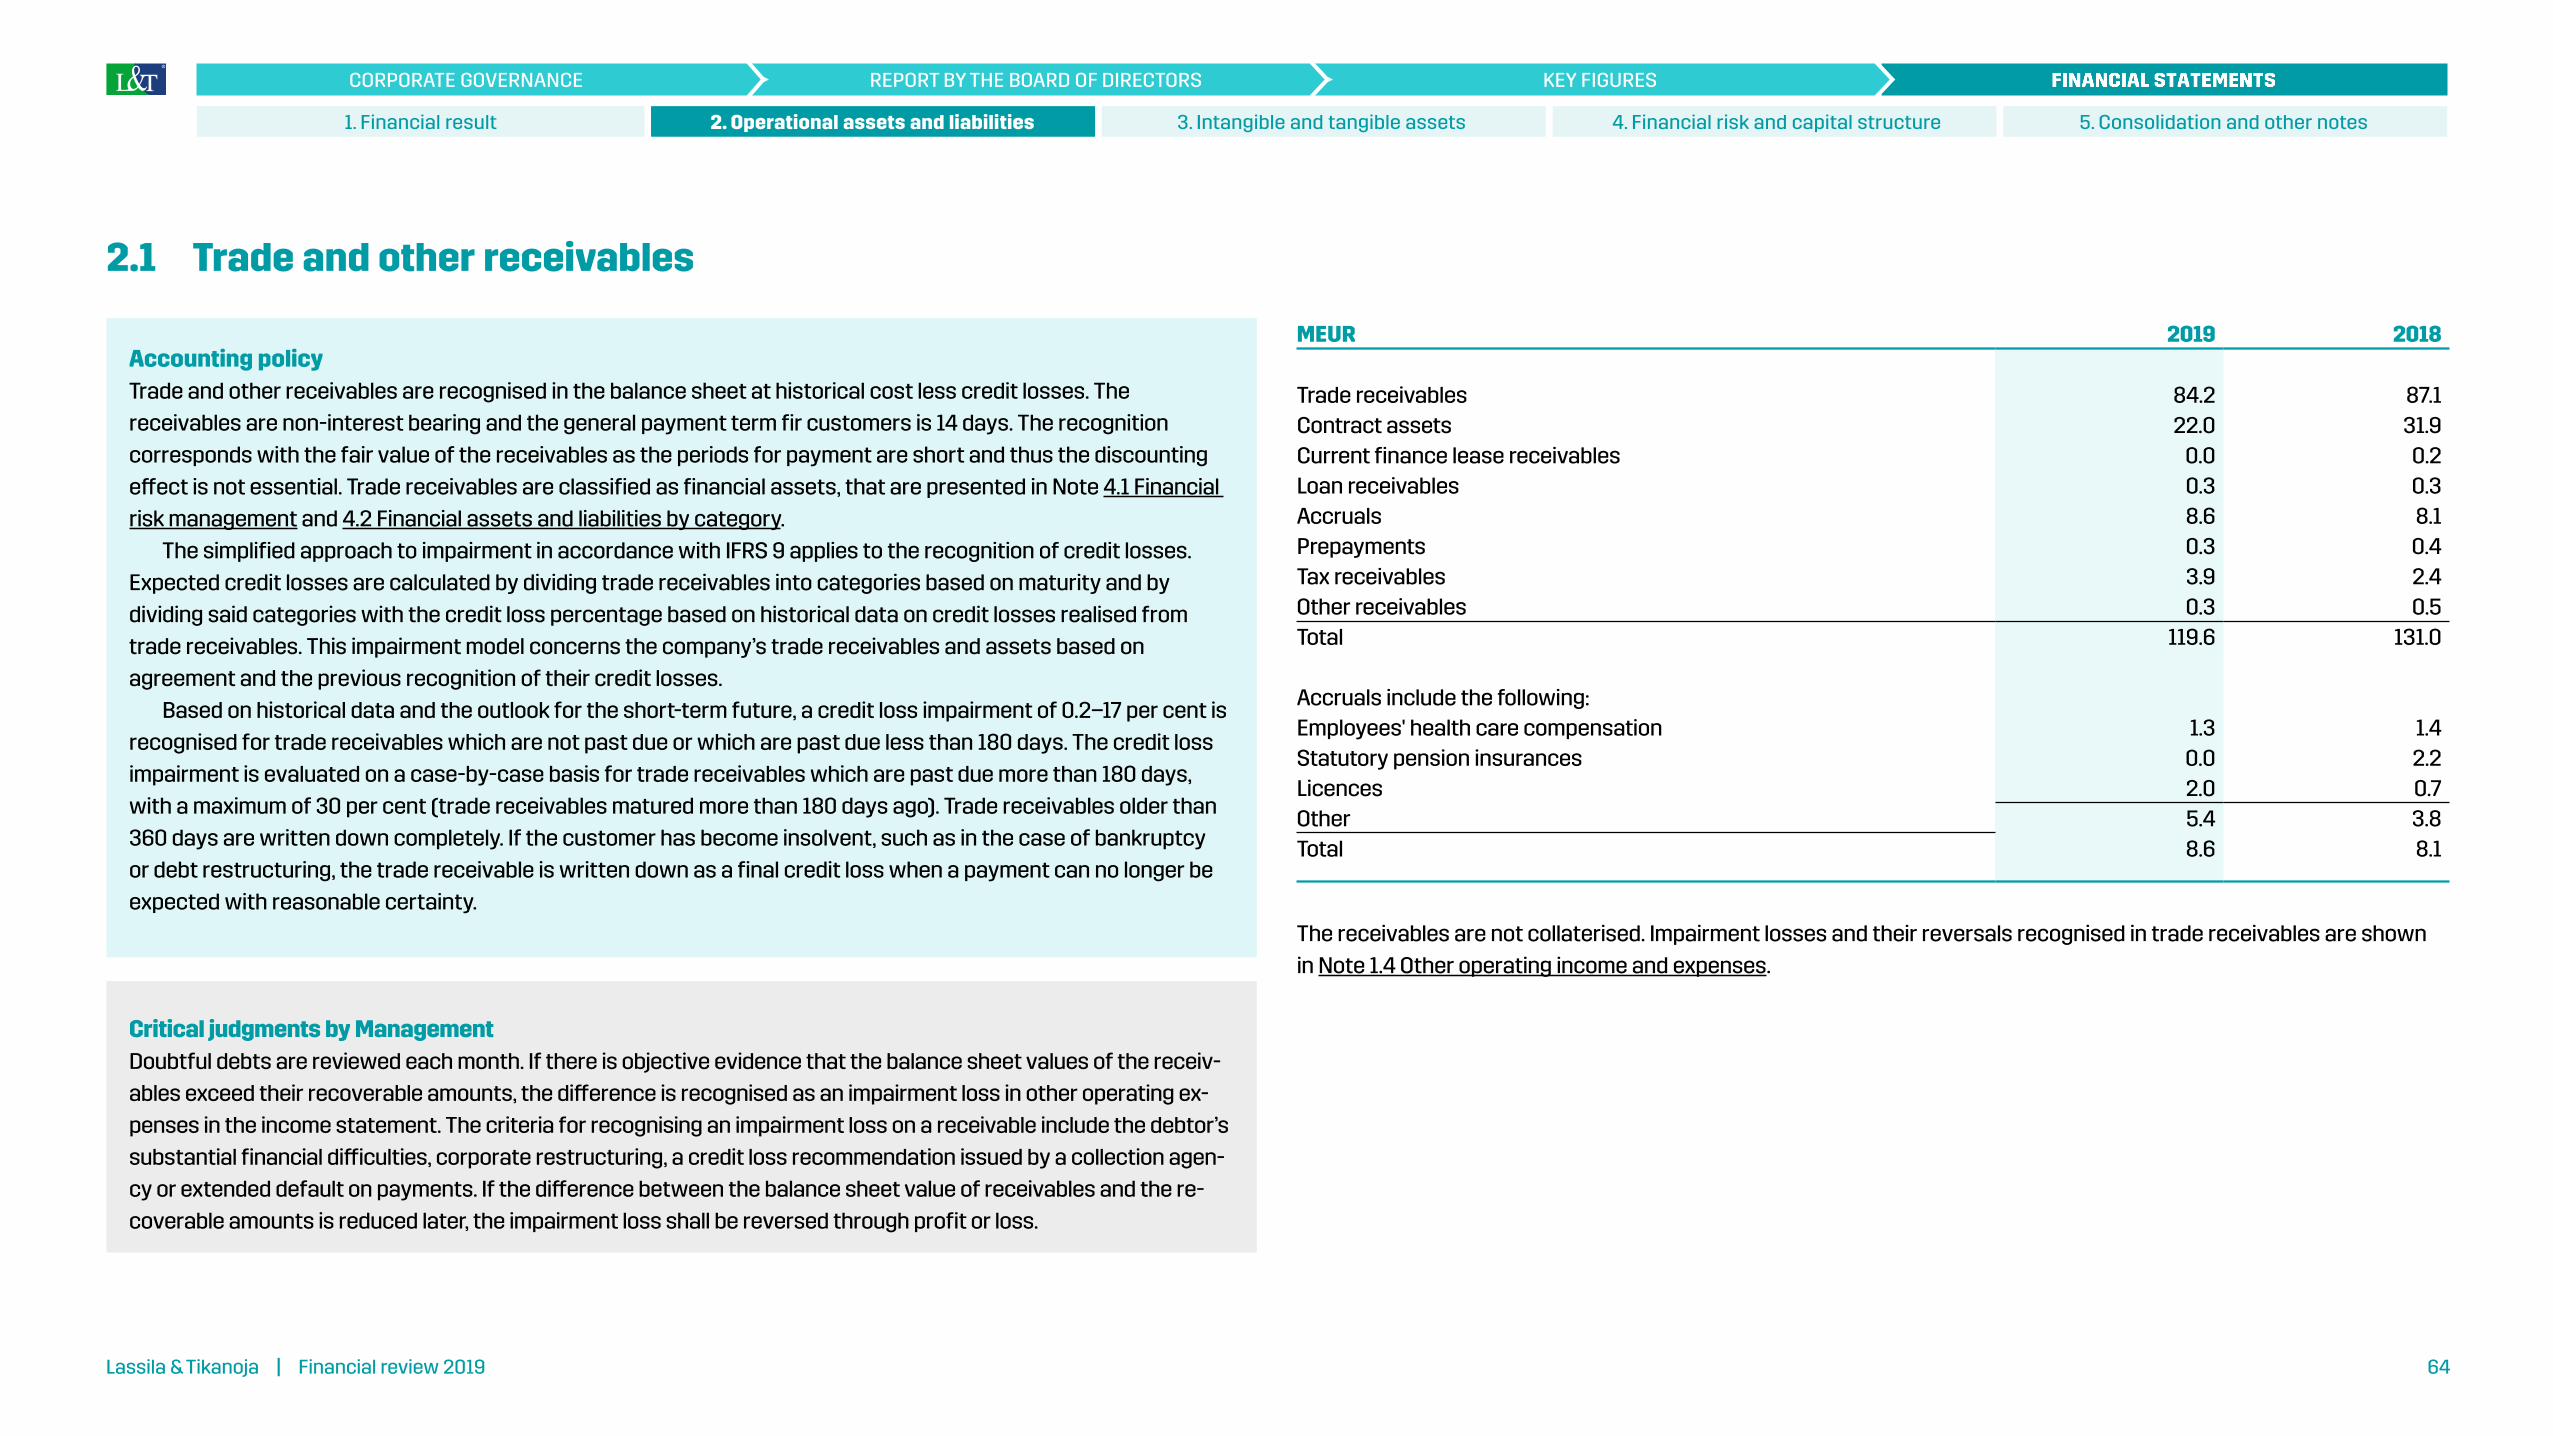
2.1 Trade and other receivables
Critical judgments by ManagementDoubtful debts are reviewed each month. If there is objective evidence that the balance sheet values of the receiv-ables exceed their recoverable amounts, the difference is recognised as an impairment loss in other operating ex-penses in the income statement. The criteria for recognising an impairment loss on a receivable include the debtor’s substantial financial difficulties, corporate restructuring, a credit loss recommendation issued by a collection agen-cy or extended default on payments. If the difference between the balance sheet value of receivables and the re-coverable amounts is reduced later, the impairment loss shall be reversed through profit or loss.
MEUR 2019 2018
Trade receivables 84.2 87.1Contract assets 22.0 31.9Current finance lease receivables 0.0 0.2Loan receivables 0.3 0.3Accruals 8.6 8.1Prepayments 0.3 0.4Tax receivables 3.9 2.4Other receivables 0.3 0.5Total 119.6 131.0
Accruals include the following:Employees' health care compensation 1.3 1.4Statutory pension insurances 0.0 2.2Licences 2.0 0.7Other 5.4 3.8Total 8.6 8.1
The receivables are not collaterised. Impairment losses and their reversals recognised in trade receivables are shown in Note 1.4 Other operating income and expenses.
Accounting policyTrade and other receivables are recognised in the balance sheet at historical cost less credit losses. The receivables are non-interest bearing and the general payment term fir customers is 14 days. The recognition corresponds with the fair value of the receivables as the periods for payment are short and thus the discounting effect is not essential. Trade receivables are classified as financial assets, that are presented in Note 4.1 Financial risk management and 4.2 Financial assets and liabilities by category.
The simplified approach to impairment in accordance with IFRS 9 applies to the recognition of credit losses. Expected credit losses are calculated by dividing trade receivables into categories based on maturity and by dividing said categories with the credit loss percentage based on historical data on credit losses realised from trade receivables. This impairment model concerns the company’s trade receivables and assets based on agreement and the previous recognition of their credit losses.
Based on historical data and the outlook for the short-term future, a credit loss impairment of 0.2–17 per cent is recognised for trade receivables which are not past due or which are past due less than 180 days. The credit loss impairment is evaluated on a case-by-case basis for trade receivables which are past due more than 180 days, with a maximum of 30 per cent (trade receivables matured more than 180 days ago). Trade receivables older than 360 days are written down completely. If the customer has become insolvent, such as in the case of bankruptcy or debt restructuring, the trade receivable is written down as a final credit loss when a payment can no longer be expected with reasonable certainty.
Lassila & Tikanoja | Vuosikatsaus 2019 64Lassila & Tikanoja | Financial review 2019 64
2. Operational assets and liabilities1. Financial result
KEY FIGURESREPORT BY THE BOARD OF DIRECTORSCORPORATE GOVERNANCE
5. Consolidation and other notes4. Financial risk and capital structure3. Intangible and tangible assets

Maturity of trade receivables and credit loss impairments2019 2018
MEURTrade
receivables
of which the credit loss
impairmentTrade
receivables
of which the credit loss
impairment
Trade receivables and contract assets not past due
92.6 0.2 103.5 0.3
Past due 1–90 days 12.0 0.4 15.6 0.3Past due 91–365 days 2.4 0.2 0.7 0.2Past due over 365 days 1.6 1.5 2.0 1.5Total 108.6 2.4 121.8 2.3
Change of expected credit loss
MEUR 2019 2018
Expected credit loss, 1 January 2.3 0.7Change in profit of the period 0.1 1.6Expected credit loss, 31 December 2.4 2.3
Impaired trade receivables have been recognised as expenses in the income statement.
Impairment losses and reversals of impairment losses recognised in previous periods are shown in Note 1.4 Other operating income and expenses.
Financial assets are not collateralised. No impairment was recognised on other financial assets.
2.2 Inventories
Accounting policyInventories are measured at the lower of cost and net realisable value. Net realisable value is the estimated selling price in the ordinary course of business, less the estimated costs of completion and selling expenses. The inventories of L&T Biowatti and Environmental Products in Emvironmental Services are measured using the weighted average cost method. The value of other inventories is determined using the FIFO method.
At its recycling plants, recyclable materials are processed into secondary raw materials for sale. The cost of the inventories of these materials comprises raw materials, direct labour costs, other direct costs of manufacturing and a proportion of variable and fixed production overheads based on normal operating capacity.
MEUR 2019 2018
Raw materials and consumables 15.2 14.6Finished goods 2.7 2.8Other inventories 3.6 3.6Total 21.5 21.0
The acquisition cost recognised as cost of inventories was EUR 29.4 million (32.3), which includes a change in inventories of EUR 0.3 million (-2.4).
EUR 1.1 million (1.6) of the value of inventories was recognised as an expense, and a write-down of the carrying value to the net realisable value was made respectively. The expense is included in Materials and services in the income statement.
Lassila & Tikanoja | Vuosikatsaus 2019 65Lassila & Tikanoja | Financial review 2019 65
2. Operational assets and liabilities1. Financial result
KEY FIGURESREPORT BY THE BOARD OF DIRECTORSCORPORATE GOVERNANCE
5. Consolidation and other notes4. Financial risk and capital structure3. Intangible and tangible assets

Accounting policyTrade and other current non-interest-bearing payables are recognised in the balance sheet at historical cost which corresponds with their fair value, as the discounted effect is not essential considering the maturity of the payables. Trade payables are classified as financial liabilities that are presented in Note 4.1 Financial risk management and 4.2 Financial assets and liabilities by category.
2.3 Trade and other current payables 2.4 Other non-current liabilities
MEUR 2019 2018
Advances received 0.3 0.3Other liabilities 0.0 0.2Total 0.3 0.5
MEUR 2019 2018
Advances received 12.4 13.2Trade payables 59.1 62.8Derivative liabilities 0.9 0.5Current tax liabilities 0.1 0.3Other liabilities 21.7 23.0Accrued expenses and deferred income 71.1 62.7Total 165.3 162.4
Accrued expenses and deferred incomeLiabilities related to personnel expenses 56.5 48.6Other accrued expenses 14.6 14.1Total 71.1 62.7
The fair values of trade payables and other current payables equal their book values.
Lassila & Tikanoja | Vuosikatsaus 2019 66Lassila & Tikanoja | Financial review 2019 66
2. Operational assets and liabilities1. Financial result
KEY FIGURESREPORT BY THE BOARD OF DIRECTORSCORPORATE GOVERNANCE
5. Consolidation and other notes4. Financial risk and capital structure3. Intangible and tangible assets
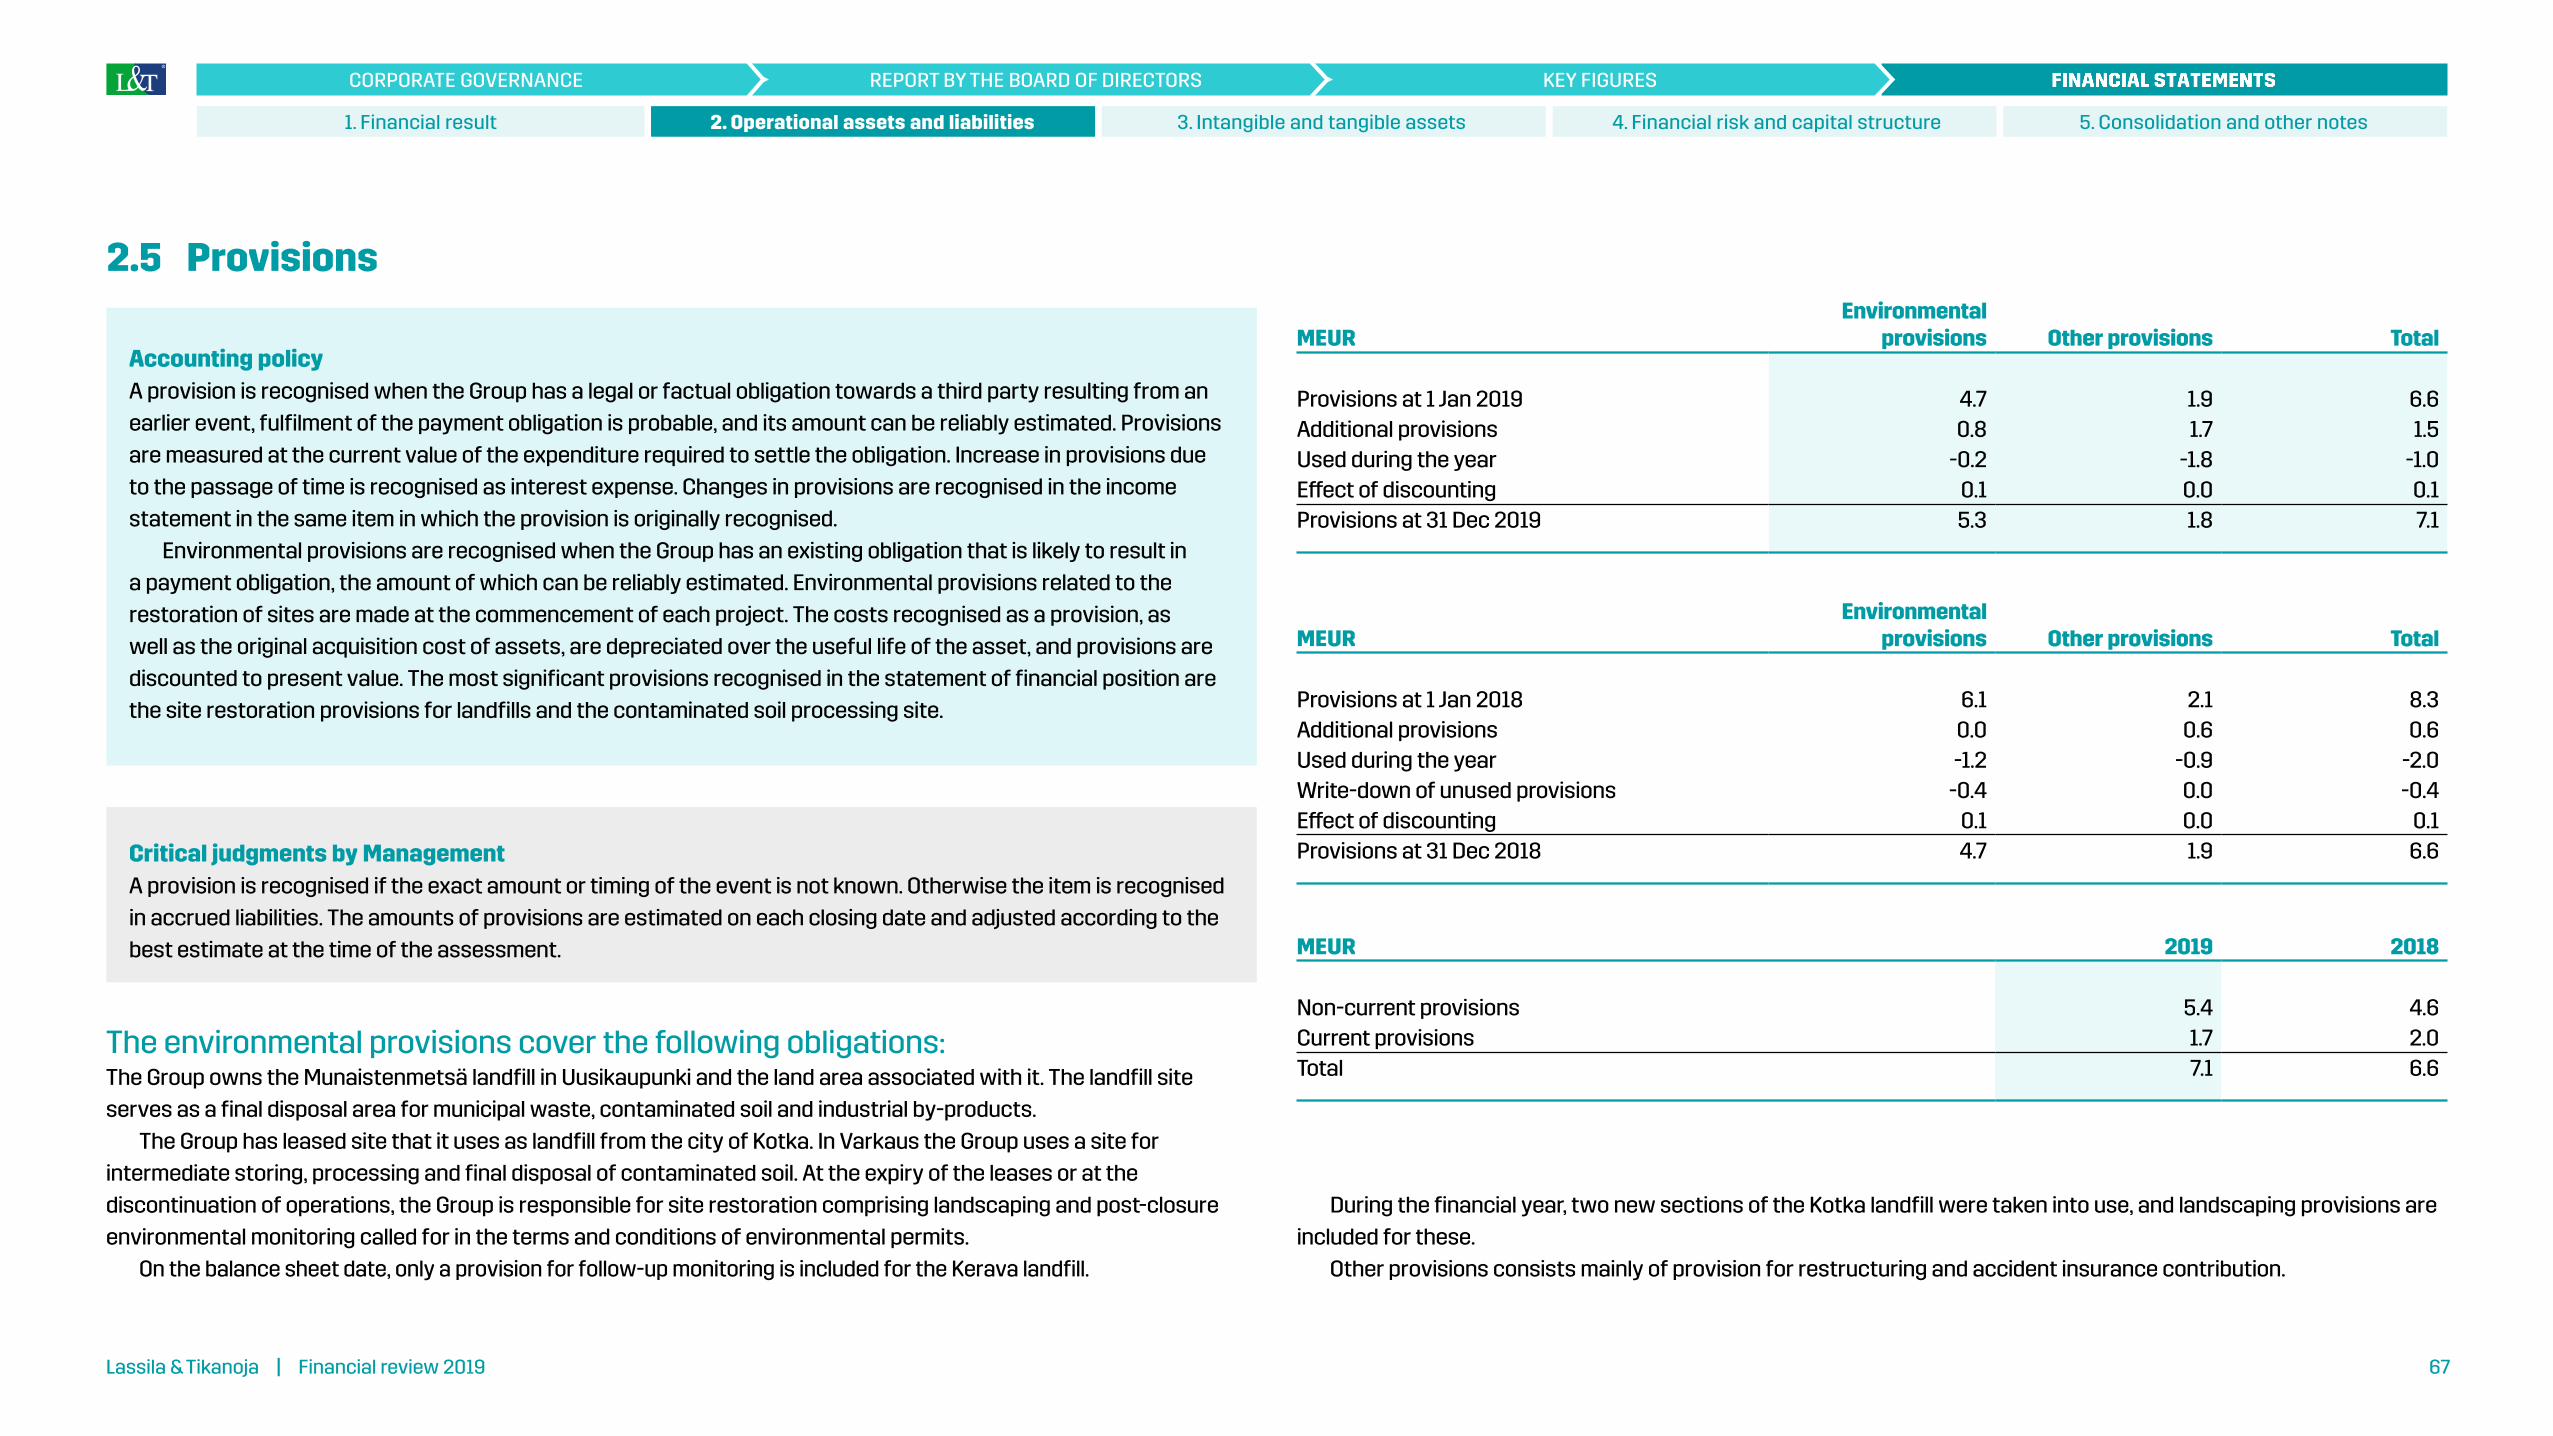
MEUREnvironmental
provisions Other provisions Total
Provisions at 1 Jan 2019 4.7 1.9 6.6Additional provisions 0.8 1.7 1.5Used during the year -0.2 -1.8 -1.0Effect of discounting 0.1 0.0 0.1Provisions at 31 Dec 2019 5.3 1.8 7.1
MEUREnvironmental
provisions Other provisions Total
Provisions at 1 Jan 2018 6.1 2.1 8.3Additional provisions 0.0 0.6 0.6Used during the year -1.2 -0.9 -2.0Write-down of unused provisions -0.4 0.0 -0.4Effect of discounting 0.1 0.0 0.1Provisions at 31 Dec 2018 4.7 1.9 6.6
MEUR 2019 2018
Non-current provisions 5.4 4.6Current provisions 1.7 2.0Total 7.1 6.6
Accounting policyA provision is recognised when the Group has a legal or factual obligation towards a third party resulting from an earlier event, fulfilment of the payment obligation is probable, and its amount can be reliably estimated. Provisions are measured at the current value of the expenditure required to settle the obligation. Increase in provisions due to the passage of time is recognised as interest expense. Changes in provisions are recognised in the income statement in the same item in which the provision is originally recognised.
Environmental provisions are recognised when the Group has an existing obligation that is likely to result in a payment obligation, the amount of which can be reliably estimated. Environmental provisions related to the restoration of sites are made at the commencement of each project. The costs recognised as a provision, as well as the original acquisition cost of assets, are depreciated over the useful life of the asset, and provisions are discounted to present value. The most significant provisions recognised in the statement of financial position are the site restoration provisions for landfills and the contaminated soil processing site.
Critical judgments by ManagementA provision is recognised if the exact amount or timing of the event is not known. Otherwise the item is recognised in accrued liabilities. The amounts of provisions are estimated on each closing date and adjusted according to the best estimate at the time of the assessment.
2.5 Provisions
The environmental provisions cover the following obligations:The Group owns the Munaistenmetsä landfill in Uusikaupunki and the land area associated with it. The landfill site serves as a final disposal area for municipal waste, contaminated soil and industrial by-products.
The Group has leased site that it uses as landfill from the city of Kotka. In Varkaus the Group uses a site for intermediate storing, processing and final disposal of contaminated soil. At the expiry of the leases or at the discontinuation of operations, the Group is responsible for site restoration comprising landscaping and post-closure environmental monitoring called for in the terms and conditions of environmental permits.
On the balance sheet date, only a provision for follow-up monitoring is included for the Kerava landfill.
During the financial year, two new sections of the Kotka landfill were taken into use, and landscaping provisions are included for these.
Other provisions consists mainly of provision for restructuring and accident insurance contribution.
Lassila & Tikanoja | Vuosikatsaus 2019 67Lassila & Tikanoja | Financial review 2019 67
2. Operational assets and liabilities1. Financial result
KEY FIGURESREPORT BY THE BOARD OF DIRECTORSCORPORATE GOVERNANCE
5. Consolidation and other notes4. Financial risk and capital structure3. Intangible and tangible assets

2.6 Retirement benefit obligationsMEUR 2019 2018
Amounts recognised in the statement of financial position:Present value of funded obligations 0.5 0.6Fair value of plan assets -0.4 -0.5
0.1 0.1
Present value of unfunded obligations 1.2 1.3Closing net liability 1.3 1.4
Changes in present value of obligation Opening defined benefit obligation 1.9 1.9Current service cost 0.0 0.0Interest cost 0.0 0.0Actuarial gain (-) and loss (+) on obligation 0.0 0.1Benefits paid -0.1 -0.1Closing value of obligation 1.7 1.9
Changes in fair value of plan assets Opening fair value of plan assets 0.5 0.5Interest income 0.0 0.0Employers' contributions 0.0 0.0Actuarial gain (+) and loss (-) 0.0 0.0Benefits paid 0.0 0.0Closing fair value of plan assets 0.4 0.5
Accounting policyPension plans are categorised as defined benefit and defined contribution plans. Under defined contribution plans, the Group pays fixed contributions for pensions, and it has no legal or factual obligation to pay further contributions. All pension arrangements that do not fulfil these conditions are considered defined benefit plans. Contributions to defined contribution plans are recognised in the income statement in the financial period to which they relate. The Group operates pen-sion schemes in accordance with local regulations and practices in the countries in which it operates, and these are mainly defined contribution plans.
The company operates some minor defined benefit plans originating mainly from business acquisitions. The Group is responsible for some of these defined benefit pension plans, while others are covered by pension insurance. The obligations have been calculated for each plan separately, using the projected unit credit method. Pension costs are recognised in the income statement over employees’ periods of service, in accordance with actuarial calculations. When calculating the present value of pension obligations, the discount rate is based on the market yield of the high-quality bonds issued by the company, whose maturity materially corresponds to the estimated maturity of the pension obligation. The risk premium is based on bonds issued by companies with an AA credit
rating. The pension plan assets measured at fair value on the balance sheet date are deducted from the present value of the pension obligation to be recognised in the balance sheet. The net liabilities (or assets) associated with a defined benefit pension plan are recorded in the balance sheet.
The expense (pension expense) based on the work performed during the period and the net interest of the defined benefit plan’s net debt are recognised in the profit and loss statement and included in employee benefit expenses. Items (such as actuarial gains and losses and return on funded defined benefit plan assets, except items related to net interest) arising from the redefinition of the net liabilities (or assets) associated with a defined benefit plan are recognised in other comprehensive income in the period in which they arise.
Past service costs are recognised as expenses through profit or loss at the earlier of the following: when the plan is rearranged or downsized, or a when the entity recognises the related rearrangement expenses or benefits related to the termination of employment.
L&T operates some minor defined benefit plans concern-ing a few persons in Finland. Most of them originate from company acquisitions. These plans are administered either by insurance companies or by the company.
Lassila & Tikanoja | Vuosikatsaus 2019 68Lassila & Tikanoja | Financial review 2019 68
2. Operational assets and liabilities1. Financial result
KEY FIGURESREPORT BY THE BOARD OF DIRECTORSCORPORATE GOVERNANCE
5. Consolidation and other notes4. Financial risk and capital structure3. Intangible and tangible assets

MEUR 2019 2018
Movements in the liability recognised in the statement of financial positionOpening liability 1.4 1.4Expense recognised in the income statement 0.0 0.0Employers' contributions 0.0 0.0Actuarial gain (-) and loss (+) 0.0 0.0Contributions paid -0.1 -0.1Closing liability 1.3 1.4
Amounts recognised in the income statement:Current service cost 0.0 0.0Interest cost 0.0 0.0Interest income 0.0 0.0Actuarial gain (-) and loss (+) 0.0 0.0Total 0.0 0.1
The Group estimates that it will contribute EUR 76 thousand to defined benefit plans in 2020.
MEUR 2019 2018
Present value of obligation 1.7 1.9Fair value of plan assets -0.4 -0.5Deficit 1.3 1.4
Principal actuarial assumptions usedDiscount rate 0.5% 1.2%Expected rate of return on plan assets 1.5% 1.9%Expected rate of salary increase 3.7% 4.1%Expected rate of inflation 1.2% 1.6%
Defined contribution maturity of the obligation
MEUR 2019 2018
Maturity of less than one year 0.1 0.11–5 years 0.6 0.35–10 years 0.5 0.310–15 years 0.2 0.315–20 years 0.2 0.220–25 years 0.1 0.125–30 years 0.1 0.1over 30 years 0.1 0.1Total 1.8 1.5
Lassila & Tikanoja | Vuosikatsaus 2019 69Lassila & Tikanoja | Financial review 2019 69
2. Operational assets and liabilities1. Financial result
KEY FIGURESREPORT BY THE BOARD OF DIRECTORSCORPORATE GOVERNANCE
5. Consolidation and other notes4. Financial risk and capital structure3. Intangible and tangible assets
Lassila & Tikanoja | Vuosikatsaus 2019 70Lassila & Tikanoja | Financial review 2019 70
2. Operational assets and liabilities1. Financial result
KEY FIGURESREPORT BY THE BOARD OF DIRECTORSCORPORATE GOVERNANCE
5. Consolidation and other notes4. Financial risk and capital structure3. Intangible and tangible assets
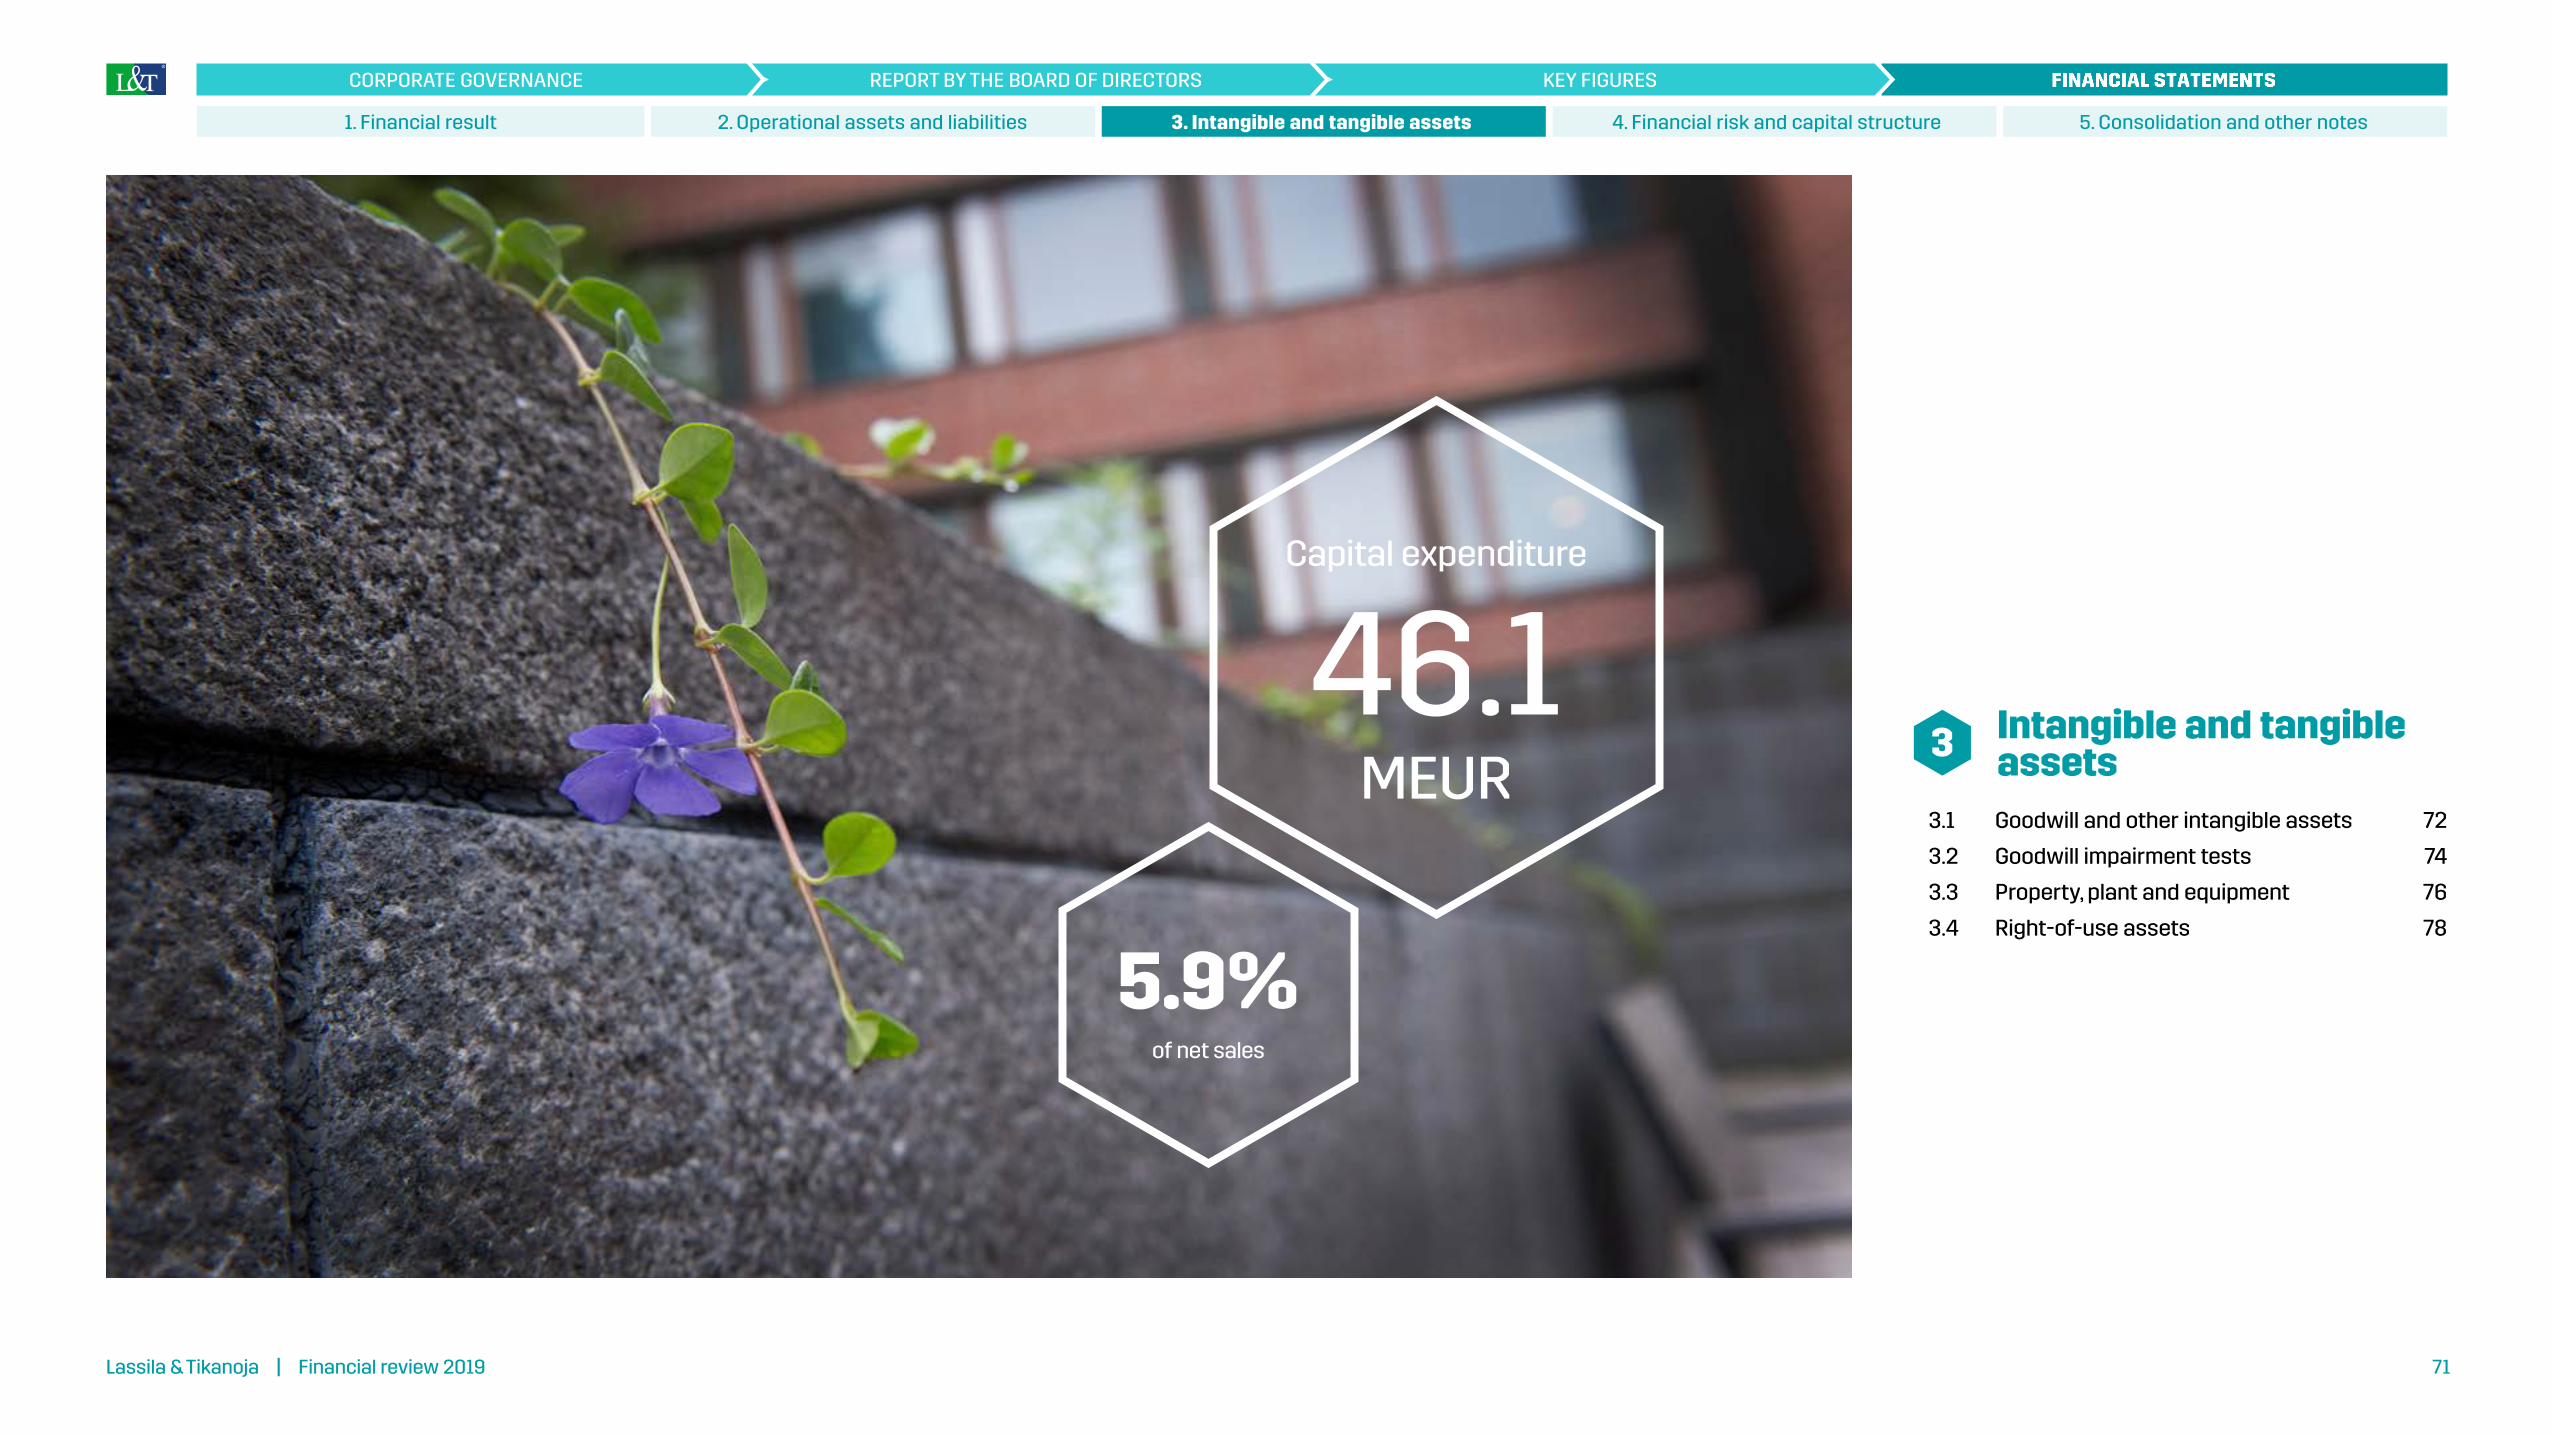
Intangible and tangible assets3
46.1Capital expenditure
MEUR
5.9%of net sales
3.1 Goodwill and other intangible assets 72
3.2 Goodwill impairment tests 74
3.3 Property, plant and equipment 76
3.4 Right-of-use assets 78
Lassila & Tikanoja | Vuosikatsaus 2019 71Lassila & Tikanoja | Financial review 2019 71
3. Intangible and tangible assets2. Operational assets and liabilities
KEY FIGURESREPORT BY THE BOARD OF DIRECTORSCORPORATE GOVERNANCE
1. Financial result 5. Consolidation and other notes4. Financial risk and capital structure
3.1 Goodwill and other intangible assets
Critical judgments by ManagementOn each closing day of a reporting period, the Group assesses the balance sheet values of its assets for any impairment. If any indication exists, an estimate of the asset’s recoverable amount is made. The need for recognition of impairment is assessed at the level of cash generating units – that is, the lowest level of unit that is primarily independent of other units and that generates cash flows that are separately identifiable.
The recoverable amount is the higher of an asset’s fair value less selling costs and its value in use. Value in use refers to the estimated future net cash flows available from an asset or cash-generating unit, discounted to the present value. The discount rate used is the pre-tax rate, which reflects the market view of the time value of money and the risks associated with the asset.
An impairment loss is recognised in the income statement when an asset’s carrying amount exceeds its recoverable amount. Impairment losses attributable to a cash-generating unit are used for deducting first the goodwill allocated to the cash-generating unit and, thereafter, the other assets of the unit on an equal basis.
An impairment loss for an asset other than goodwill recognised in prior periods is reversed if there is a change in circumstances and the recoverable amount has changed. An impairment loss recognised for goodwill is not reversed.
Goodwill is tested for impairment annually or whenever there is any indication of impairment. Recoverable amount calculations based both on values in use and on the net sales price are made for the cash-generating units to which the goodwill has been allocated.
Intangible assets under construction are software projects that cannot be tested separately for impairment, as they do not generate separate cash flow. There is no need for impairment if, at the end of the financial period, it is clear that the projects will be completed and the software will be introduced. Intangible assets under construction are, however, tested for impairment as part of the cash generating unit to which they belong.
Accounting policyGoodwill represents the portion of the acquisition cost by which the aggregate of the consideration given, the share of non-controlling owners in the acquired entity and the previously owned share exceed the fair value of the acquired entities at the time of acquisition. Goodwill is not amortised, but is tested annually for impairment. Goodwill is presented in the statement of financial position at original cost less impairment losses, if any.
Intangible assets acquired in a business combination are measured at fair value. The useful lives of intangible assets are estimated to be either finite or indefinite. In L&T, the intangible assets recognised in business combinations include items such as customer relations, non-competition agreements and environmental permits. They have finite useful lives, varying between three and thirteen years.
Other intangible assets consist primarily of software and software licences. The costs of software projects are recognised in other intangible assets starting from the time when
the projects move out of the research phase into the development phase and the outcome of a project is an identifiable intangible asset. Such an intangible asset must provide L&T with future economic benefit that exceeds the costs of its development. The cost comprises all directly attributable costs necessary for preparing the asset to be capable of operating in the manner intended by the management. The largest cost items are consultancy fees paid to third parties, as well as salaries and other expenses for the Group’s personnel.
The depreciation period for computer software and software licences is five years.Depreciation will cease when an intangible asset is classified as held for sale (or included in a disposal group
held for sale) in accordance with IFRS 5 Non-current Assets Held for Sale and Discontinued Operations.
Lassila & Tikanoja | Vuosikatsaus 2019 72Lassila & Tikanoja | Financial review 2019 72
3. Intangible and tangible assets2. Operational assets and liabilities
KEY FIGURESREPORT BY THE BOARD OF DIRECTORSCORPORATE GOVERNANCE
1. Financial result 5. Consolidation and other notes4. Financial risk and capital structure

MEUR Goodwill
Customer contracts arising from acquisitions
Agreements on prohibition of
competition
Other intangible assets arising
from acquisitions Intangible rightsOther intangible
assets Prepayments Total
Acquisition cost, 1 Jan 2019 166.0 47.4 23.9 10.1 15.3 51.0 0.6 314.3Additions 0.0 0.5 0.4 2.5 3.5Business acquisitions 0.1 0.4 0.0 0.5Disposals 0.0 -5.4 -1.1 0.0 -6.4Transfers between items 0.0 1.4 -1.4 0.0Exchange differences 0.2 -0.4 0.0 0.0 0.0 0.0 0.0 -0.2Acquisition cost, 31 Dec 2019 166.3 47.4 23.9 10.1 10.5 51.8 1.7 311.6
Accumulated amortisation and impairment at 1 Jan 2019 -14.5 -28.2 -23.9 -9.6 -12.5 -32.0 -120.8Accumulated amortisation on disposals and transfers 0.0 5.3 1.0 6.4Amortisation charge 0.0 -2.8 0.0 -0.1 -0.7 -5.8 -9.4Exchange differences 0.1 0.1 0.0 0.0 0.0 0.0 0.2Accumulated amortisation and impairment at 31 Dec 2019 -14.5 -30.9 -23.9 -9.7 -7.9 -36.8 -123.6Book value, 31 Dec 2019 151.9 16.4 0.0 0.4 2.6 15.0 1.7 188.0
Other intangible assets arising from acquisitions include mainly patents and permits.Contractual commitments related to intangible assets totalled EUR 2.2 million (0.2).
MEUR Goodwill
Customer contracts arising from acquisitions
Agreements on prohibition of
competition
Other intangible assets arising
from acquisitions Intangible rightsOther intangible
assets Prepayments Total
Acquisition cost, 1 Jan 2018 164.9 48.1 24.0 10.1 14.8 45.2 3.6 310.7Additions 0.1 0.9 1.2 3.1 5.3Business acquisitions 2.9 0.2 0.0 3.1Disposals -0.4 -1.6 -1.9Transfers between items 0.0 6.2 -6.1 0.1Exchange differences -1.9 -0.9 0.0 0.0 -0.1 0.0 -2.9Acquisition cost, 31 Dec 2018 166.0 47.4 23.9 10.1 15.3 51.0 0.6 314.3
Accumulated amortisation and impairment at 1 Jan 2018 -14.7 -25.5 -23.9 -9.6 -12.3 -28.5 -114.5Accumulated amortisation on disposals and transfers 0.0 0.0 0.0 0.0 0.4 1.6 1.9Amortisation charge 0.0 -2.9 0.0 -0.1 -0.6 -5.1 -8.6Exchange differences 0.1 0.2 0.0 0.0 0.0 0.0 0.4Accumulated amortisation and impairment at 31 Dec 2018 -14.5 -28.2 -23.9 -9.6 -12.5 -32.0 -120.8Book value, 31 Dec 2018 151.5 19.2 0.0 0.5 2.8 19.0 0.6 193.5
Lassila & Tikanoja | Vuosikatsaus 2019 73Lassila & Tikanoja | Financial review 2019 73
3. Intangible and tangible assets2. Operational assets and liabilities
KEY FIGURESREPORT BY THE BOARD OF DIRECTORSCORPORATE GOVERNANCE
1. Financial result 5. Consolidation and other notes4. Financial risk and capital structure

3.2 Goodwill impairment tests
Impairment tests in 2019Impairment testing has been prepared based on value-in-use calculations in which future cash flows are discounted to current value. The growth assumption used in the value-in-use calculations of cashflow-generating units is 1.9 per cent, which corresponds to the mid-term inflation goal of the European Central Bank. Long-term growth rates used in the value-in-use calculations of cash-generating units.
% 2019 2018
Environmental Services 1.9 1.3Industrial Services 1.9 1.5Facility Services, Finland 1.9 1.5Technical Services, Finland - 2.0L&T Service AB 1.9 1.5L&T FM AB 1.9 2.0
The discount rates used in calculations are based on the Group's weighted average cost of capital before tax (WACC). Factors in WACC are risk-free income, market risk premium, division-specific beta cost of capital as well as the ratio between equity and liabilities. A discount rate has been defined for each cash-generating unit. The definition of WACC has been clarified during the financial period. There are no grounds for the determination of separate division-specific risk allowances in addition to the sector-specific risk included in the WACC components as the management does not consider that the company’s operations include a risk higher than the division-specific risk. Furthermore, Finland and Sweden are similar geographic areas in terms of business operations.
Critical judgments by ManagementIn testing of goodwill for impairment, the recoverable amounts of the cash-generating units to which the goodwill is allocated are determined on the basis of value-in-use calculations. These calculations require management judgements. Though the assumptions used are appropriate according to the management’s judgement, the estimated cash flows may differ fundamentally from those realised in the future.
Goodwill allocationThe carrying amounts of goodwill are allocated to cash-generating units in accordance with the table below:
MEUR 2019 2018
Environmental Services 73.7 73.7Industrial Services 19.5 19.4Facility Services, Finland 22.6 19.0Technical Services, Finland - 3.6L&T Service AB 2.7 1.8L&T FM AB 33.4 34.0Total 151.9 151.5
Accounting policyIn impairment tests, recoverable amounts are estimated on the basis of an asset's value in use. Future cash flows are based on annual estimates of income statements and upkeep investments made by the management in connection with the budgeting process for a four-year period. The management bases its estimates on actual development and views on the growth outlook for the industry (general market development and unit profitability, pricing, municipalisation decisions, personnel costs and raw material costs). Approved investment decisions are taken into account in the growth estimates.
Cash flows extending beyond the four-year forecast period are calculated using the so-called terminal value method. The growth rates used in the calculations are based on the management's estimates of long-term growth in cash flow.
Lassila & Tikanoja | Vuosikatsaus 2019 74Lassila & Tikanoja | Financial review 2019 74
3. Intangible and tangible assets2. Operational assets and liabilities
KEY FIGURESREPORT BY THE BOARD OF DIRECTORSCORPORATE GOVERNANCE
1. Financial result 5. Consolidation and other notes4. Financial risk and capital structure

Discount rates used in the calculations:
% 2019 2018
Environmental Services 7.8 8.8Industrial Services 7.7 8.9Facility Services, Finland 7.7 10.3Technical Services, Finland - 10.1L&T Service AB 8.2 10.7L&T FM AB 8.0 10.3
No instances of impairment were identified during impairment testing.
Sensitivity analyses of impairment testingA sensitivity analysis of each cash-generating unit was performed, during which the key calculation assumptions were tested. In the sensitivity analysis, a key assumption was tested by changing the threshold values at which the value in use would equal the book value. Based on the results of the test, a change in the central assumptions which would be considered as somewhat likely could not result in the accounting value of a cashflow-generating unit exceeding the value-in-use. At the time of testing, all cashflow-generating units exceeded the accounting value by over 50 per cent. Value in use in relation to book value:
2019 2018
Environmental Services Over 50% Over 50%Industrial Services Over 50% Over 50%Facility Services, Finland Over 50% Over 50%Technical Services, Finland - Over 50%L&T Service AB Over 50% Over 50%L&T FM AB Over 50% 10-25%
Future EBITDA percentages have been set conservatively. Their values are based on actual development. The EBITDA percentages used in the calculation of terminal values are a significant factor in the calculation of value in use.
Key assumptions tested in the sensitivity analyses and their threshold values for those cash generating units that had a value in use relation to book value less than 50 per cent at closing date for current year and comparison year.
% 2019 2018
L&T FM AB 6.0 6.0
Key assumptions tested in the sensitivity analyses and their threshold values for those cash generating units that had a value in use relation to book value less than 50% at closing date for current year and comparison year.
Key assumptions tested in the sensitivity analysis and their limit values:
% 2019 2018
L&T FM ABDiscount rate 13.0 11.8EBITDA percentage used in the calculation of terminal value 2.8 4.9
Lassila & Tikanoja | Vuosikatsaus 2019 75Lassila & Tikanoja | Financial review 2019 75
3. Intangible and tangible assets2. Operational assets and liabilities
KEY FIGURESREPORT BY THE BOARD OF DIRECTORSCORPORATE GOVERNANCE
1. Financial result 5. Consolidation and other notes4. Financial risk and capital structure

3.3 Property, plant and equipment
Critical judgments by ManagementOn each closing day of a reporting period, the Group assesses the balance sheet values of its assets for any impairment. If any indication exists, an estimate of the asset’s recoverable amount is made. The need for recognition of impairment is assessed at the level of cash generating units – that is, the lowest level of unit that is primarily independent of other units and that generates cash flows that are separately identifiable.
The recoverable amount is the higher of an asset’s fair value less selling costs and its value in use. Value in use refers to the estimated future net cash flows available from an asset or cash-generating unit, discounted to the present value. The discount rate used is the pre-tax rate, which reflects the market view of the time value of money and the risks associated with the asset.
An impairment loss is recognised in the income statement when an asset’s carrying amount exceeds its recoverable amount. Impairment losses attributable to a cash-generating unit are used for deducting first the goodwill allocated to the cash-generating unit and, thereafter, the other assets of the unit on an equal basis.
An impairment loss recognised in prior periods is reversed if there is a change in circumstances and the recoverable amount has changed.
Accounting policyProperty, plant and equipment are recognised at acquisition cost less accumulated depreciation and impairment losses. The historical cost includes expenditure that is directly attributable to the acquisition of property, plant and equipment. Borrowing costs immediately arising from the acquisition, construction or manufacture of property, plant and equipment that meet the conditions are capitalised as part of the asset’s acquisition cost.
In business combinations, property, plant and equipment are measured at fair value on the acquisition date. In the statement of financial position, property, plant and equipment are shown less accumulated depreciation and impairment, if any.
Property, plant and equipment are depreciated using the straight-line method over their expected useful lives, excluding new landfills. The expected useful lives are reviewed on each balance sheet date, and, if expectations differ materially from previous estimates, the depreciation periods are adjusted to reflect the changes in expectations of future economic benefits.
Depreciation in the financial statements is based on the following expected useful lives:
Buildings and structures 5–30 yearsVehicles 6–15 yearsMachinery and equipment 4–15 year
For completed landfills the Group applies the units of production method, which involves depreciation on the basis of the volume of waste received. Land is not depreciated.
When an asset included in property, plant and equipment consists of several components with different estimated useful lives, each component is treated as a separate asset. Ordinary repair and maintenance costs are recognised in the income statement during the period in which they are incurred. Costs of significant modification and improvement projects are capitalised if it is probable that the projects will result in future economic benefits to the Group. When a tangible asset is classified as held for sales in accordance with IFRS 5 Noncurrent Assets Held for Sale and Discontinued Operations, depreciation will no longer be recorded. Gains and losses on sales and disposal of property, plant and equipment are recognised through profit or loss and are presented in other operating income or expenses.
Lassila & Tikanoja | Vuosikatsaus 2019 76Lassila & Tikanoja | Financial review 2019 76
3. Intangible and tangible assets2. Operational assets and liabilities
KEY FIGURESREPORT BY THE BOARD OF DIRECTORSCORPORATE GOVERNANCE
1. Financial result 5. Consolidation and other notes4. Financial risk and capital structure

MEUR LandBuildings and
constructions
Machinery and
equipment Other
Prepay-ments and
construction in progress Total
Acquisition cost, 1 Jan 2019 5.6 124.9 438.5 0.1 5.2 574.4IFRS 16 implementation -28.5 -28.5Additions 0.7 2.7 13.2 11.2 27.8Business acquisitions 0.1 0.1 0.2Disposals 0.0 -1.0 -29.4 0.0 0.0 -30.4Transfers between items 3.4 8.9 -12.3 0.0Exchange differences 0.1 0.2 0.8 0.0 0.0 1.1Acquisition cost, 31 Dec 2019 6.3 130.4 403.6 0.1 4.2 544.6
Accumulated depreciation at 1 Jan 2019
-0.5 -90.8 -327.8 -0.1 -419.2
IFRS 16 implementation 4.9 4.9Accumulated depreciation on disposals and transfers
0.9 27.6 28.5
Depreciation for the period -6.0 -22.7 -28.7Exchange differences -0.1 -0.5 0.0 -0.6Accumulated depreciation at 31 Dec 2019
-0.5 -96.0 -318.5 -0.1 0.0 -415.1
Net book value at 31 Dec 2019 5.8 34.4 85.1 0.1 4.2 129.5
The book value of machinery and equipment includes EUR 10.1 million (8.6) of compactors and balers sold through an external financing company. Due to the repurchase obligation the leased equipment is treated as tangible assets. Due to implementation of IFRS 16 the assets leased under a finance lease contract are presented under right-of-use assets, Note 3.4 Right-of-use assets.
Contractual commitments related to property, plant and equipment totalled EUR 7.5 million (8.9).
MEUR LandBuildings and
constructions
Machinery and
equipment Other
Prepay-ments and
construction in progress Total
Acquisition cost, 1 Jan 2018 5.8 123.9 436.5 0.1 2.0 568.2Additions 0.5 25.4 6.3 32.2Business acquisitions 0.1 0.1Disposals -0.1 -0.3 -24.4 0.0 -24.8Transfers between items 1.1 1.8 -3.0 -0.1Exchange differences -0.1 -0.3 -0.9 0.0 0.0 -1.2Acquisition cost, 31 Dec 2018 5.6 124.9 438.5 0.1 5.2 574.4
Accumulated depreciation at 1 Jan 2018
-0.5 -84.9 -323.7 -0.1 -409.2
Accumulated depreciation on disposals and transfers
0.2 23.1 23.3
Depreciation for the period -6.2 -27.7 -33.9Exchange differences 0.1 0.5 0.0 0.6Accumulated depreciation at 31 Dec 2018
-0.5 -90.8 -327.8 -0.1 -419.2
Net book value at 31 Dec 2018 5.1 34.1 110.7 0.1 5.2 155.2
The book value of machinery and equipment in the comparison perid includes EUR 23.6 million assets leased under a finance lease contract (IAS 17).
Lassila & Tikanoja | Vuosikatsaus 2019 77Lassila & Tikanoja | Financial review 2019 77
3. Intangible and tangible assets2. Operational assets and liabilities
KEY FIGURESREPORT BY THE BOARD OF DIRECTORSCORPORATE GOVERNANCE
1. Financial result 5. Consolidation and other notes4. Financial risk and capital structure
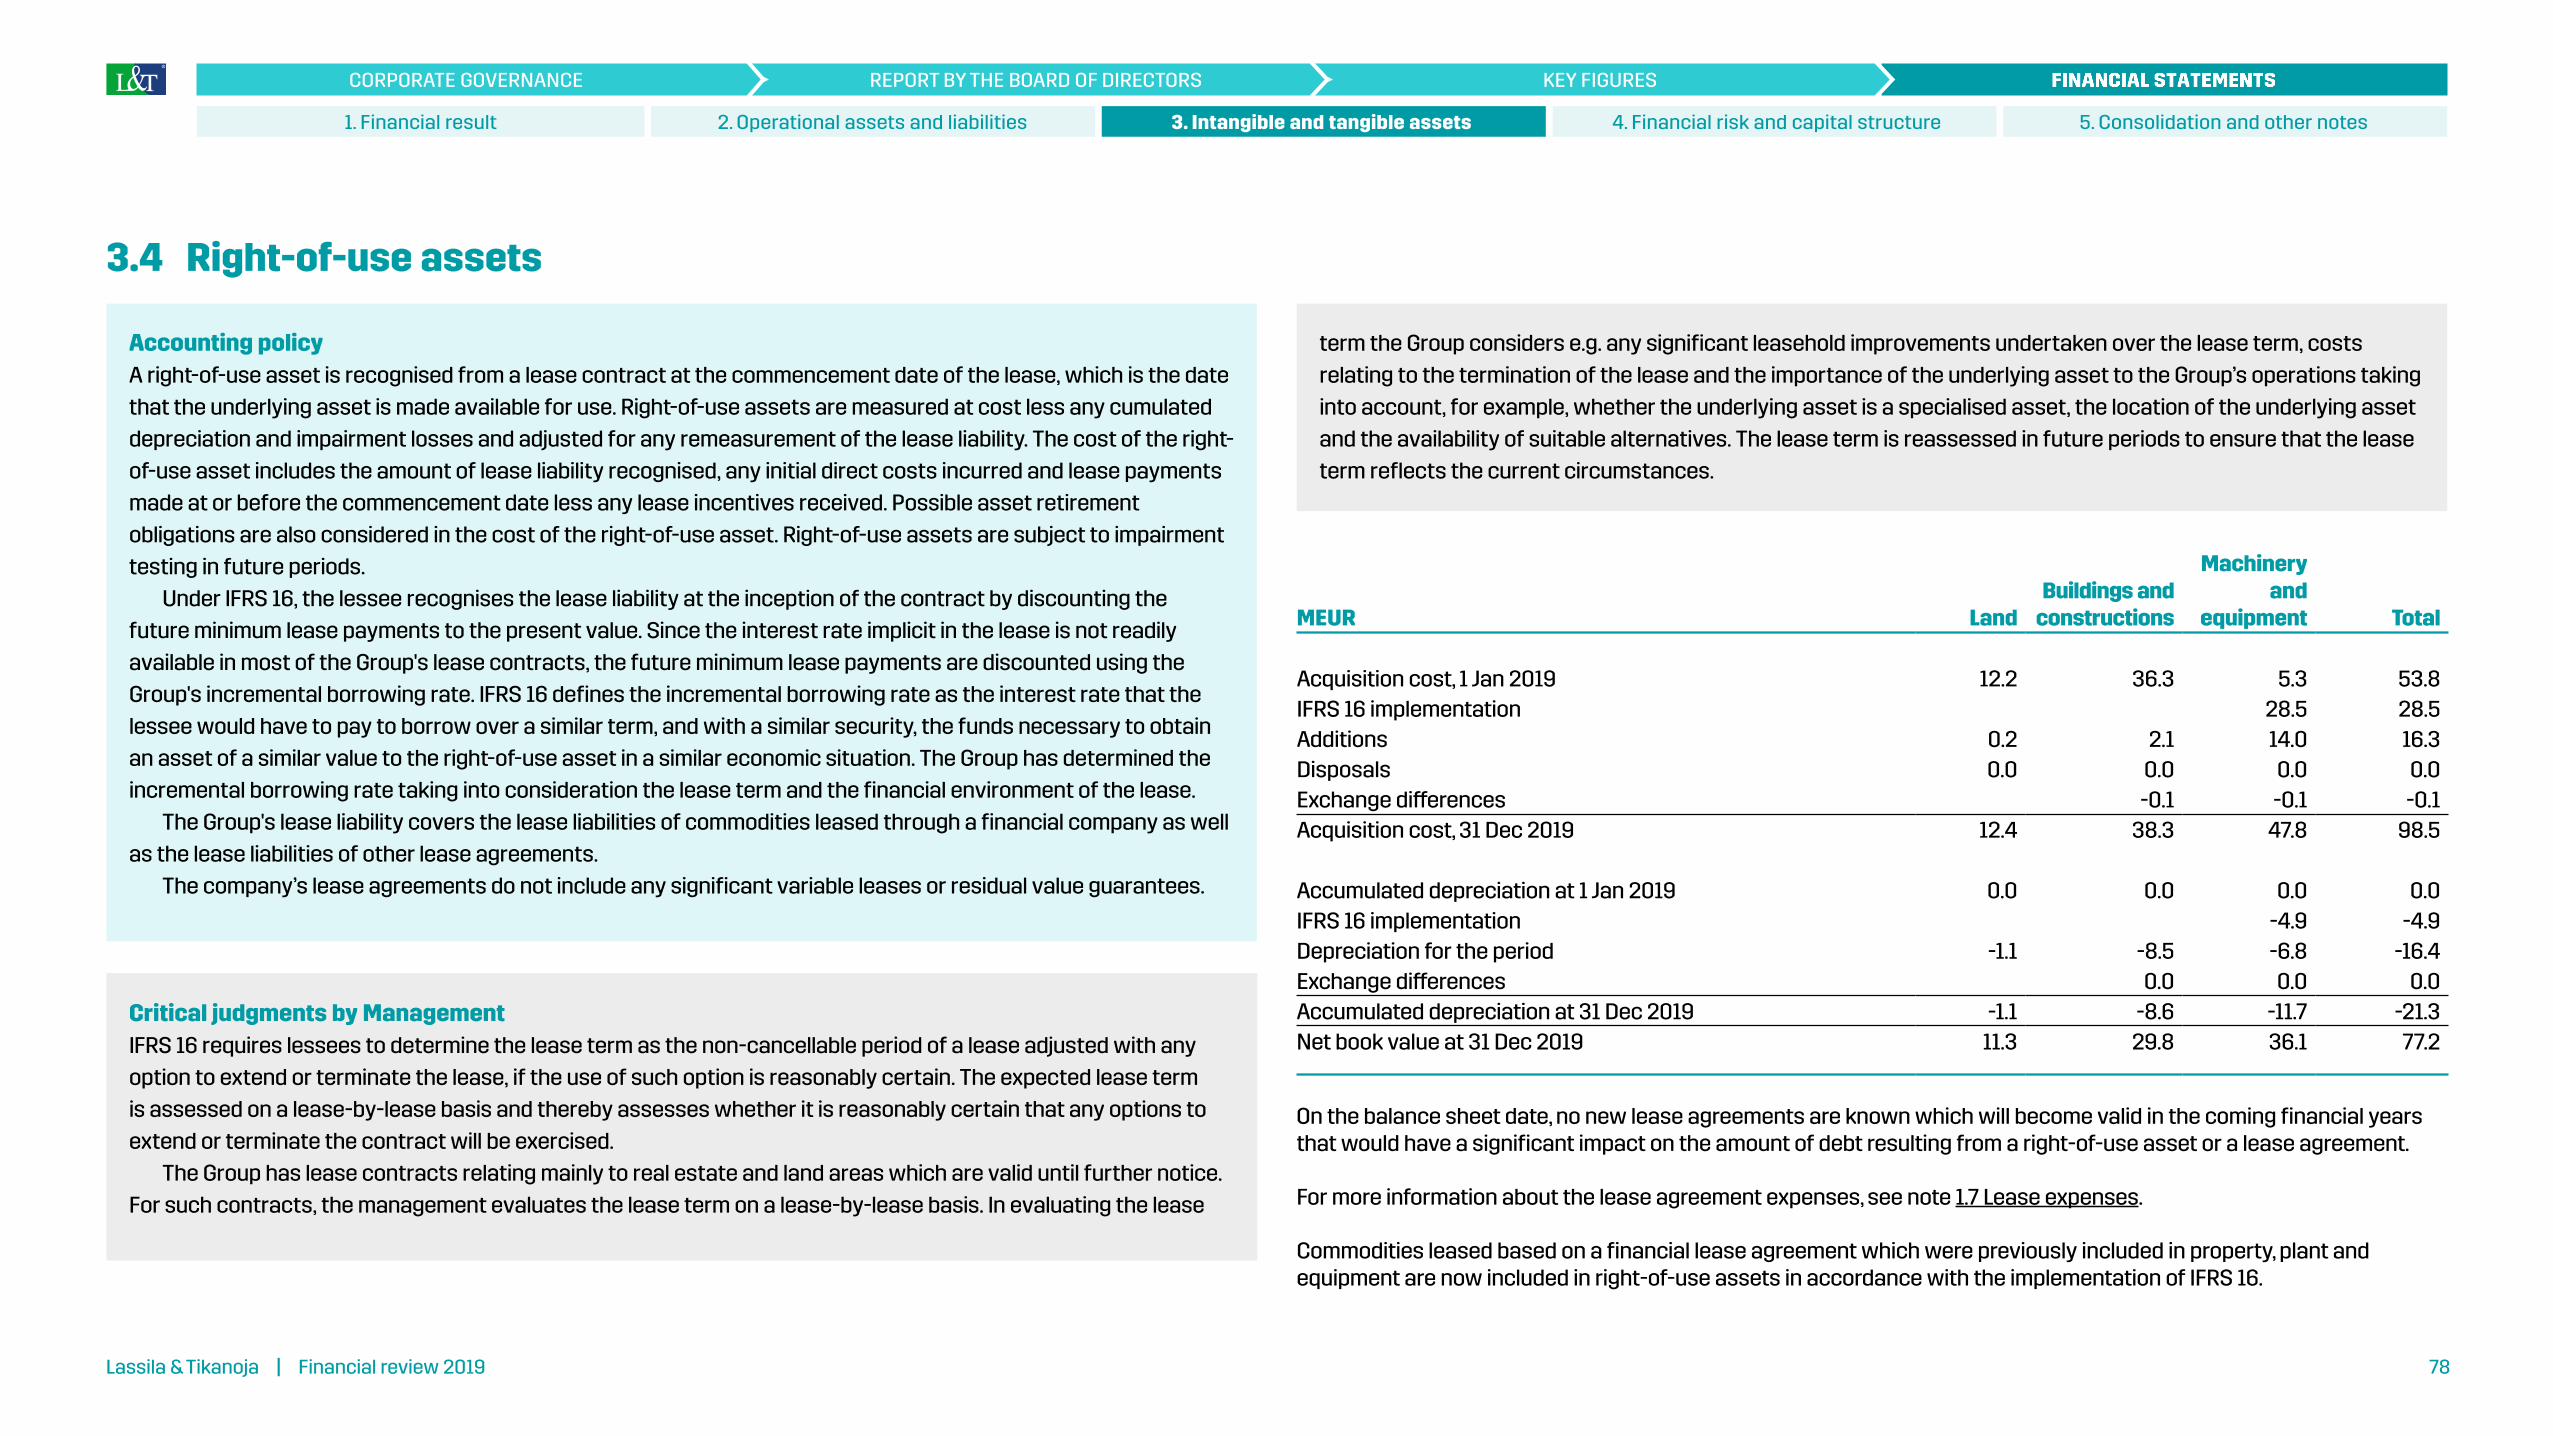
3.4 Right-of-use assets
MEUR LandBuildings and
constructions
Machinery and
equipment Total
Acquisition cost, 1 Jan 2019 12.2 36.3 5.3 53.8IFRS 16 implementation 28.5 28.5Additions 0.2 2.1 14.0 16.3Disposals 0.0 0.0 0.0 0.0Exchange differences -0.1 -0.1 -0.1Acquisition cost, 31 Dec 2019 12.4 38.3 47.8 98.5
Accumulated depreciation at 1 Jan 2019 0.0 0.0 0.0 0.0IFRS 16 implementation -4.9 -4.9Depreciation for the period -1.1 -8.5 -6.8 -16.4Exchange differences 0.0 0.0 0.0Accumulated depreciation at 31 Dec 2019 -1.1 -8.6 -11.7 -21.3Net book value at 31 Dec 2019 11.3 29.8 36.1 77.2
On the balance sheet date, no new lease agreements are known which will become valid in the coming financial years that would have a significant impact on the amount of debt resulting from a right-of-use asset or a lease agreement.
For more information about the lease agreement expenses, see note 1.7 Lease expenses.
Commodities leased based on a financial lease agreement which were previously included in property, plant and equipment are now included in right-of-use assets in accordance with the implementation of IFRS 16.
term the Group considers e.g. any significant leasehold improvements undertaken over the lease term, costs relating to the termination of the lease and the importance of the underlying asset to the Group’s operations taking into account, for example, whether the underlying asset is a specialised asset, the location of the underlying asset and the availability of suitable alternatives. The lease term is reassessed in future periods to ensure that the lease term reflects the current circumstances.
Critical judgments by ManagementIFRS 16 requires lessees to determine the lease term as the non-cancellable period of a lease adjusted with any option to extend or terminate the lease, if the use of such option is reasonably certain. The expected lease term is assessed on a lease-by-lease basis and thereby assesses whether it is reasonably certain that any options to extend or terminate the contract will be exercised.
The Group has lease contracts relating mainly to real estate and land areas which are valid until further notice. For such contracts, the management evaluates the lease term on a lease-by-lease basis. In evaluating the lease
Accounting policyA right-of-use asset is recognised from a lease contract at the commencement date of the lease, which is the date that the underlying asset is made available for use. Right-of-use assets are measured at cost less any cumulated depreciation and impairment losses and adjusted for any remeasurement of the lease liability. The cost of the right-of-use asset includes the amount of lease liability recognised, any initial direct costs incurred and lease payments made at or before the commencement date less any lease incentives received. Possible asset retirement obligations are also considered in the cost of the right-of-use asset. Right-of-use assets are subject to impairment testing in future periods.
Under IFRS 16, the lessee recognises the lease liability at the inception of the contract by discounting the future minimum lease payments to the present value. Since the interest rate implicit in the lease is not readily available in most of the Group's lease contracts, the future minimum lease payments are discounted using the Group's incremental borrowing rate. IFRS 16 defines the incremental borrowing rate as the interest rate that the lessee would have to pay to borrow over a similar term, and with a similar security, the funds necessary to obtain an asset of a similar value to the right-of-use asset in a similar economic situation. The Group has determined the incremental borrowing rate taking into consideration the lease term and the financial environment of the lease.
The Group's lease liability covers the lease liabilities of commodities leased through a financial company as well as the lease liabilities of other lease agreements.
The company’s lease agreements do not include any significant variable leases or residual value guarantees.
Lassila & Tikanoja | Vuosikatsaus 2019 78Lassila & Tikanoja | Financial review 2019 78
3. Intangible and tangible assets2. Operational assets and liabilities
KEY FIGURESREPORT BY THE BOARD OF DIRECTORSCORPORATE GOVERNANCE
1. Financial result 5. Consolidation and other notes4. Financial risk and capital structure

Financial risks and capital structure4
203.0Equity
MEUR
16.8Return on equity
(ROE)
%
135.6Net interest-bearing
liabilities
MEUR
66.8Gearing
%
4.1 Financial risk management 80
4.2 Financial assets and liabilities by category 84
4.3 Finance lease receivables 86
4.4 Cash and cash equivalents 86
4.5 Equity 87
4.6 Dividend per share 88
4.7 Financial liabilities 89
4.8 Contingent liabilities 90
4.9 Derivative financial instruments 91
Lassila & Tikanoja | Vuosikatsaus 2019 79Lassila & Tikanoja | Financial review 2019 79
5. Consolidation and other notes4. Financial risk and capital structure3. Intangible and tangible assets
KEY FIGURESREPORT BY THE BOARD OF DIRECTORSCORPORATE GOVERNANCE
2. Operational assets and liabilities1. Financial result

4.1 Financial risk management
The principles for L&T’s financial risk management are defined in the treasury policy approved by the Board of Directors. The purpose of financial risk management is to mitigate significant financial risks and strive to reduce the unfavourable effects of fluctuations in the financial market and other risk factors on the Group’s result.
The Group’s financing and liquidity management are handled centrally by the Group’s financial management, which is managed by the CFO. Transactions related to financial risk management are carried out by the Group’s financial management.
Foreign exchange riskThe Group consists of a parent company operating in Finland and subsidiaries operating in Finland, Sweden and Russia. The parent company’s and the Finnish subsidiaries’ functional and reporting currency is the euro. The foreign subsidiaries’ functional and reporting currency is the currency of their country of location. For this reason, changes in foreign exchange rates affect the Group’s result and equity.
Translation riskThe Group’s exposure to translation risk consists of net investments in foreign subsidiaries, which include equity investments and retained earnings. The position of net investments in foreign subsidiaries is not hedged, as these holdings are considered long-term strategic investments.
Transaction riskThe business operations of the Group’s foreign subsidiaries are carried out almost completely in their functional currency and thus does not cause any transaction risk. Financing for subsidiaries is provided through intra-Group loans that are denominated in the functional currency of each subsidiary. Group companies operating in Finland use the euro as the invoicing currency for sales almost exclusively.
The Group’s most significant transaction risk arises from the loan capital of subsidiary loans and accrued interest. The net position on the balance sheet date was as follows:
MEUR 2019 2018
SEK-denominated internal loan capital of subsidiary loans and accrued interest - 5.3RUB-denominated internal loan capital of subsidiary loans and accrued interest 8.1 6.7Netto 8.1 12.0
Changes in exchange rates in 2019 resulted in translation differences of EUR -0.6 million in equity (-3.4). Net investments by currency are presented in the table below.
Translation exposure of net investments
MEUR 2019 2018
SEK 32.2 28.3RUB 1.7 1.0Total 33.9 29.3
Price risk of investmentsThe Group has not invested in listed securities, the value of which changes as the market prices change, and is thus not exposed to securities price risk. The Group has only a minor holding in unlisted shares, and there is no substantial price risk related to these shares.
Commodity price riskThe fluctuations of the world market price of crude oil are reflected in the price of fuel used in production equipment as well as in the purchase prices of environmental products through oil-based raw materials. In waste management, some customer contracts specify such invoicing periods and contract terms that the sales prices cannot be raised monthly. This means that the rise in fuel prices is passed on to service prices with a delay. The diesel price risk has been partly hedged with commodity derivatives. Hedge accounting under IFRS 9 has been applied to these derivatives. The Group manages the raw material price risk for environmental products through fixing sales prices for a period not exceeding the period for which the suppliers’ purchase prices are valid.
During the financial period 2019 the Group decided to no longer hedge of future diesel oil purchases. Hedging contracts entered into earlier are valid at the end of the financial period.
Interest rate riskThe Group's interest rate risk is primarily related to borrowings, which are tied to variable interest rates and create cash flows that vary with the interest rate level. As the demand for the Group’s services or their prices are not significantly dependent on fluctuations in economic trends, the Group tries to keep interest costs steady. On account of this, over 50% of the cash flow associated with variable-rate borrowings is hedged against interest rate risk with interest rate swaps.
At end of the financial period, 80% (65) of the company’s borrowings were either fixed interest rate borrowings or hedged with interest rate swaps. Variable-rate borrowings accounted for 20% (35). Therefore changes in the interest rate level will not impact interest costs in full.
All interest rate swaps made to hedge the cash flow are hedges in accordance with the Group’s risk management policy and hedge accounting in accordance with IFRS 9 is applied to all contracts. Most of the Group’s net sales are generated by long-term service agreements. Due to good cash flow predictability, the Group’s treasury policy specifies that the company shall seek to minimise the amount of interest-bearing assets in proportion to the current short-term financing requirements, and to invest in relatively short-term instruments.
Lassila & Tikanoja | Vuosikatsaus 2019 80Lassila & Tikanoja | Financial review 2019 80
5. Consolidation and other notes4. Financial risk and capital structure3. Intangible and tangible assets
KEY FIGURESREPORT BY THE BOARD OF DIRECTORSCORPORATE GOVERNANCE
2. Operational assets and liabilities1. Financial result

Credit and counterparty riskFinancial instruments involve the risk of the counterparty being unable to fulfil its contractual commitments. Counterparty risk is managed by making financial and derivative contracts with major Nordic banks only and by making investments related to liquidity management only in certificates of deposit and commercial papers of issuers with a good credit standing. No impairment is expected on any outstanding investments at the balance sheet date.
The Group has a wide customer base consisting of companies, industrial plants, office and business properties, institutional property owners, housing corporations, public sector organisations and households. Its accounts receivable consist mostly of a high number of relatively small receivables and there are no significant concentrations of credit risk. The Group has credit control guidelines to ensure that services and products are sold only to customers with an appropriate credit standing or, if a customer’s creditworthiness is inadequate, prepayment is required.
Most customer relationships are based on long-term service contracts, and customers are not generally required to provide collateral.
According to the requirements of the IFRS 9 expected credit loss model, loss allowance must be recognized based on expected credit losses. A simplified model is used for trade receivables and contract assets and the amount of expected credit losses is based on the lifetime expected credit losses of receivables. The model is based on historical observed default amounts over the expected life of the trade receivables and is adjusted for forward-looking estimates depending on the overdue of the receivables.
With regard to Finnish trade receivables, collection operations are managed centrally by the financial management function. The foreign subsidiaries manage the collection of their trade receivables locally.
Credit risk related to financial assets
MEUR 2019 2018
Non-current finance lease receivables - 0.1Other non-current receivables 1.4 1.9Trade receivables 84.2 87.1Contract assets 22.0 31.9Other current receivables 13.1 11.4Prepayments 0.3 0.6Derivative receivables 0.0 0.0Cash and cash equivalents 41.8 54.3
Liquidity and refinancing riskLiquidity risk management ensures that the Group continuously will be able to answer for its financial obligations associated with operations at the lowest possible cost. The Group seeks to maintain good liquidity through efficient cash management and by investing in money market instruments that can be realised quickly. The liquidity situation is monitored in real time and predicted using cash flow forecasts. The group uses a group bank account system which facilitates the management of cash funds. To ascertain the availability of funding, the Group uses several banks in its financial operations. Refinancing risk is managed by a broad-based maturity profile of loans and by maintaining the level of the average duration of the loan portfolio at two years.
The Group seeks to keep its cash assets fairly small, while ensuring sufficient credit limits for liquidity management purposes. To meet any temporary need
for cash arising from cash flow fluctuations, the Group has a credit line of 10-million euro committed credit limits (totalling EUR 30 million) and a commercial paper programme (EUR 100 million). At the end of the financial period, the Group’s liquid assets and investments amounted to EUR 41.8 million (54.3). The commercial paper programme EUR 100.0 million was in all unused (comparison period used 20.0).
The following table shows the Group’s financial liabilities classified according to contractual maturity dates at the balance sheet date. The figures shown are undiscounted contractual cash flows. The long-term borrowings include equity ratio and interest cover covenants and other normal terms which restrict giving of collaterals to other financiers and discontinuance or disposal of present business. Breaching of these terms would entitle the borrowers to call in the loans immediately, which would lead to earlier realisation of the cash flows related to the borrowings.
Lassila & Tikanoja | Vuosikatsaus 2019 81Lassila & Tikanoja | Financial review 2019 81
5. Consolidation and other notes4. Financial risk and capital structure3. Intangible and tangible assets
KEY FIGURESREPORT BY THE BOARD OF DIRECTORSCORPORATE GOVERNANCE
2. Operational assets and liabilities1. Financial result

Maturity of financial liabilities
31 December 2019 MEURCarrying
amountContractual
cash flows 2020 2021 2022 2023 2024 2025 and later
Bank borrowings and loans from pension institutions 49.9 52.0 0.4 0.4 0.4 0.4 50.4 -Bonds 49.7 52.5 0.6 0.6 0.6 50.6 - -Lease liabilities 77.8 83.1 16.7 15.2 14.2 10.1 9.2 17.7Derivative liabilities 0.9 0.8 0.1 0.1 0.1 0.1 0.1 0.1Trade and other payables 80.7 80.7 80.7 - - - - -Total 259.0 269.1 98.6 16.4 15.3 61.3 59.8 17.8
31 December 2018 MEURCarrying
amountContractual
cash flows 2019 2020 2021 2022 2023 2024 and later
Bank borrowings and loans from pension institutions 75.8 78.6 1.5 25.5 0.4 0.4 0.4 50.4Bonds 52.6 56.2 3.7 0.6 0.6 0.6 50.6 -Financial lease liabilities 23.8 25.2 3.8 4.0 4.0 4.0 4.0 5.5Derivative liabilities 0.5 0.5 0.1 0.1 0.1 0.1 0.1 0.1Trade and other payables 85.7 85.7 85.7 - - - - -Total 238.4 246.2 94.8 30.2 5.1 5.1 55.1 56.0
Due to the adoption of IFRS 16 financial lease liabilities have been changed to lease liabilities.
During the financial period the Group made an early repayment of a loan of EUR 25 million that was originally set to mature in 2020.
Maturity of financial lease liabilities
MEUR 2019 2018
Finance lease liabilities– minimum lease payments by maturityNot later than one year 16.7 3.8Later than one year and not later than five years 48.8 15.9Later than five years 17.7 5.5Total minimum lease payments 83.1 25.2Future finance charges -5.3 -1.4Present value of finance lease liabilities 77.8 23.8
Maturity of present value of finance lease liabilitiesNot later than one year 15.8 3.5Later than one year and not later than five years 45.5 14.9Later than five years 16.5 5.5Total 77.8 23.8
Lassila & Tikanoja | Vuosikatsaus 2019 82Lassila & Tikanoja | Financial review 2019 82
5. Consolidation and other notes4. Financial risk and capital structure3. Intangible and tangible assets
KEY FIGURESREPORT BY THE BOARD OF DIRECTORSCORPORATE GOVERNANCE
2. Operational assets and liabilities1. Financial result

Breakdown of borrowings
2019 2018MEUR In use Undrawn Total In use Undrawn Total
Bank borrowings and loans from pension institutions 49.9 - 49.9 75.8 - 75.8Bonds 49.7 - 49.7 52.6 - 52.6Committed credit facility maturing in 2021 - 30.0 30.0 - 30.0 30.0Commercial paper programme - 100.0 100.0 - 100.0 100.0Lease liabilities from financial institutes 32.5 17.5 50.0 23.8 26.2 50.0Other lease liabilities 45.3 - 45.3 - - -Total 177.4 147.5 324.9 152.2 156.2 308.4
Sensitivity to market risks arising from financial instrumentsThe following sensitivity analysis required by IFRS 7 illustrates the sensitivity of the Group’s profit for the period and equity to changes in the interest rate level and diesel oil price level with regard to financial instruments in the statement of financial position, including financial assets and liabilities as well as derivative contracts. Changes in the fair value of derivative contracts under hedge accounting are assumed to be allocated entirely to equity, while changes in the fair value of other derivative contracts are assumed to be allocated entirely to the income statement.
The following assumptions have been used in calculating sensitivity to changes in the interest rate level:• The change in the interest rate level is assumed to be a rise of +0.5 percentage point and a decrease of
-0.2 percentage point.• The change in the price level of Diesel is assumed to be a rise of +10 percentage point and a decrease of
-10 percentage point.• The exposure underlying the calculation includes interest-bearing financial liabilities.
Net investments in foreign subsidiaries are not included in the sensitivity analysis.
Sensitivity analysis in accordance with IFRS 7 of market risk arising from financial instruments
2019 2018MEUR Profit after tax Equity Profit after tax Equity
Derivatives:+0.5% change in market interest rates -0.1 0.4 -0.2 0.5-0.2% change in market interest rates 0.0 -0.1 0.0 -0.1+10% change in diesel oil 0.0 0.1-10% change in diesel oil 0.0 -0.1
Group's internal loans: +10% change in SEK exchange rate - 0.5 -10% change in SEK exchange rate - -0.4 +10% change in RUB exchange rate 0.7 0.6 -10% change in RUB exchange rate -0.6 -0.5
Lassila & Tikanoja | Vuosikatsaus 2019 83Lassila & Tikanoja | Financial review 2019 83
5. Consolidation and other notes4. Financial risk and capital structure3. Intangible and tangible assets
KEY FIGURESREPORT BY THE BOARD OF DIRECTORSCORPORATE GOVERNANCE
2. Operational assets and liabilities1. Financial result

DerivativesFair values of interest rate swaps are valued using a technique based on present value of future cash flows, which is supported by market interest rates at the balance sheet date. Fair values describe the prices that the Group would gain or should pay, if the derivative financial instruments were cancelled at the balance sheet date.
Bank and other borrowingsFair values of borrowings are based on discounted cash flows measured at effective interest method. The discount rate is defined to be the interest rate the Group would pay for an equivalent loan at the balance sheet date. The overall interest is composed of a risk-free market interest rate and a company-based risk premium.
4.2 Financial assets and liabilities by category
Accounting policyFinancial assets and liabilities are classified as loans and receivables, available-for-sale investments, financial assets and liabilities at fair value through profit or loss, and as other financial liabilities. This classification is performed when the asset or liability is acquired and is based on the purpose of the acquisition.
A financial asset is derecognised when the rights to the cash flows from the asset expire, or when all material risks and rewards of the ownership of the asset have been transferred outside the Group.
Borrowings and other receivables are non-derivative financial assets with fixed or determinable payments that are not quoted in an active market. They are measured at amortised cost using the effective interest method. Trade and other receivables are included in this category and are recognised in the statement of financial position at historical cost less credit adjustments and impairment losses.
Financial assets and liabilities at fair value through profit or loss are derivative financial instruments to which hedge accounting is not applied.
Borrowings are recognised in the statement of financial position on the settlement date at fair value, on the basis of the consideration received, including transaction costs directly attributable to the acquisition or issue. These financial liabilities are subsequently measured at amortised cost using the effective interest rate method.
Critical judgments by ManagementThe Group assesses on each balance sheet date whether there is objective evidence that any financial asset item is impaired. If there is evidence of impairment, the cumulative loss in the fair value reserve is recognised in profit or loss. Impairment losses on shares classified as financial assets available for sale are not reversed through profit or loss, as is the case with impairment losses recognised on fixed income instruments that are subsequently reversed.
Lease liabilitiesDue to the implementation of IFRS 16 -standard the finance lease liability has been changed to lease liability in the balance sheet. Fair value of finance lease liabilities is calculated by discounting future cash flows. The discount rate is defined to be the interest rate with which the Group could enter into an equivalent lease contract at the balance sheet date.
Fair value hierarchy of financial assets and liabilities measured at fair valueFinancial assets and liabilities recognised at fair value must be categorised by using a three-level fair value hierarchy that reflects the significance of the input data used in fair value measurement. Financial instruments of hierarchy level 1 are shares and interest-bearing investments which are recognised at fair value through other comprehensive income. Financial instruments of hierarchy level 2 are over-the-counter (OTC) derivatives which are categorised into those which are recognised at fair value in the profit and loss statement and those which are recognised through other comprehensive income in case they meet the requirements for hedge accounting. A financial instrument is categorised to level 3 if it’s fair value cannot be determined based on observable market information.
In the Group, only derivatives are recognised at fair value. Derivatives, which comprise interest rate swaps, currency derivatives and commodity derivatives, are categorised in Level 2. The fair values of financial instruments are based on prices derived from prices quoted in an active market or generally accepted valuation models that are, to a significant degree, based on verifiable market data.
Lassila & Tikanoja | Vuosikatsaus 2019 84Lassila & Tikanoja | Financial review 2019 84
5. Consolidation and other notes4. Financial risk and capital structure3. Intangible and tangible assets
KEY FIGURESREPORT BY THE BOARD OF DIRECTORSCORPORATE GOVERNANCE
2. Operational assets and liabilities1. Financial result

2019 2018
31 December 2019 MEUR Amortised costDerivatives under hedge accounting
Carrying amounts by balance sheet item Amortised cost
Derivatives under hedge accounting
Carrying amounts by balance sheet item
Fair value hierarchy level Note
Non-current financial assetsFinance lease receivables - - 0.1 0.1 2 4.3Other receivables 1.4 1.4 1.9 1.9
Current financial assetsTrade and other receivables 106.8 106.8 119.8 119.8 2.1Finance lease receivables - - 0.2 0.2Derivative receivables 0.0 0.0 0.0 0.0Cash and cash equivalents 41.8 41.8 54.3 54.3Total financial assets 150.0 0.0 150.0 176.3 0.0 176.3
Non-current financial liabilitiesBorrowings 99.6 99.6 124.5 124.5 2Finance lease liabilities 62.0 62.0 20.3 20.3 4.1
Current financial liabilitiesBorrowings - - 3.9 3.9Finance lease liabilities 15.8 15.8 3.5 3.5 4.1Trade and other payables 80.7 80.7 85.7 85.7 2.3Derivative liabilities 0.9 0.9 0.5 0.5 2Total financial liabilities 258.2 0.9 259.0 237.9 0.5 238.4
The fair values of balance sheet items do not differ significantly from the carrying values of balance sheet items.
Due to the implementation of IFRS 16 -standard the finance lease liability has been changed to lease liability in the balance sheet.
Non-current other liabilities do not include advances received, Trade and other receivables do not include tax receivables and accruals, and Trade and other payables do not include statutory liabilities (e.g. tax liabilities), as such classifications are required of financial instruments only.
Lassila & Tikanoja | Vuosikatsaus 2019 85Lassila & Tikanoja | Financial review 2019 85
5. Consolidation and other notes4. Financial risk and capital structure3. Intangible and tangible assets
KEY FIGURESREPORT BY THE BOARD OF DIRECTORSCORPORATE GOVERNANCE
2. Operational assets and liabilities1. Financial result

4.3 Finance lease receivables
Finance lease receivables result from leases of compactors, balers and other assets to customers. The minimum payments include the payment of the transfer of the title to the asset at the end of lease term if the option to purchase is such that it is reasonably certain at the commencement of the lease term that the option will be exercised or if a binding contract has been made on the purchase.
The finance lease receivable of the comparison period was EUR 0.3 million and the present value of the receivables was EUR 0.3 million. EUR 0.2 million of this weas due within year 2019. The rest of the finance lease receivable was written down during the financial period as immaterial.
4.4 Cash and cash equivalents
Accounting policy The Environmental Services division leases out equipment, such as waste compactors, to customers under long-term leases that transfer the material risks and rewards associated with ownership to the lessee. Such leases are classified as finance leases, and net investment in them is recognised as a lease receivables upon commencement of the lease term. Each lease payment is apportioned between financial income and repayment of trade receivables. Financial income is allocated over the lease term on the basis of a pattern that reflects a constant periodic rate of return on the net investment.
Leases of assets and premises that do not transfer the material risks and rewards associated with ownership to the lessee are classified as operating leases. The lease payments are recognised on a straight-line basis over the term of the lease as income or cost, depending on whether the Group is the lessor or the lessee. Assets leased out under operating leases are recognised in property, plant and equipment and are depreciated over their expected useful lives using the method applied for corresponding property, plant and equipment owned by the company.
Accounting policyCash and cash equivalents consist of cash on hand, bank deposits redeemable on demand and other short-term liquid investments. Their maturity is no longer than three months from the acquisition date. They are recognised as of the settlement date and measured at historical cost. Foreign currency transactions are translated into euros using the exchange rates prevailing on the balance sheet date.
MEUR 2019 2018
Cash on hand and in banks 41.8 54.3Total 41.8 54.3
Cash and cash equivalents are presented in nominal values, which equal to their fair values.
Lassila & Tikanoja | Vuosikatsaus 2019 86Lassila & Tikanoja | Financial review 2019 86
5. Consolidation and other notes4. Financial risk and capital structure3. Intangible and tangible assets
KEY FIGURESREPORT BY THE BOARD OF DIRECTORSCORPORATE GOVERNANCE
2. Operational assets and liabilities1. Financial result

4.5 Equity
Share capital and share premium fund
MEURNumber of outstanding
shares, 1,000 shares Share capitalInvested non-restricted
equity reserve Own shares Total
At 1 Jan 2019 38,406 19.4 0.6 -6.5 13.515 February 2019 Return of own shares -7 -0.1 -0.125 February 2019 Transfer of own shares 11 0.1 0.120 March 2019 Transfer of own shares 6 0.1 0.129 August 2019 Return of own shares -1 0.0 0.0Acquisition of own shares -320 -4.5 -4.5Recognition of share-based benefits as expenses 0.0 0.0At 31 Dec 2019 38,094 19.4 0.6 -10.8 9.2
MEURNumber of outstanding
shares, 1,000 shares Share capitalInvested non-restricted
equity reserve Own shares Total
At 1 Jan 2018 38,398 19.4 0.6 -6.6 13.423 February 2018 Transfer of own shares 3 0.1 0.121 March 2018 Transfer of own shares 5 0.0 0.0Recognition of share-based benefits as expenses 0.0 0.0At 31 Dec 2018 38,406 19.4 0.6 -6.5 13.5
Accounting policyOrdinary shares are presented as share capital. Any expenses arising from the issue or acquisition of treasury shares are presented as a valuation allowance within equity. If the Group repurchases any equity instruments, the acquisition cost of such instruments is deducted from equity.
Lassila & Tikanoja | Vuosikatsaus 2019 87Lassila & Tikanoja | Financial review 2019 87
5. Consolidation and other notes4. Financial risk and capital structure3. Intangible and tangible assets
KEY FIGURESREPORT BY THE BOARD OF DIRECTORSCORPORATE GOVERNANCE
2. Operational assets and liabilities1. Financial result
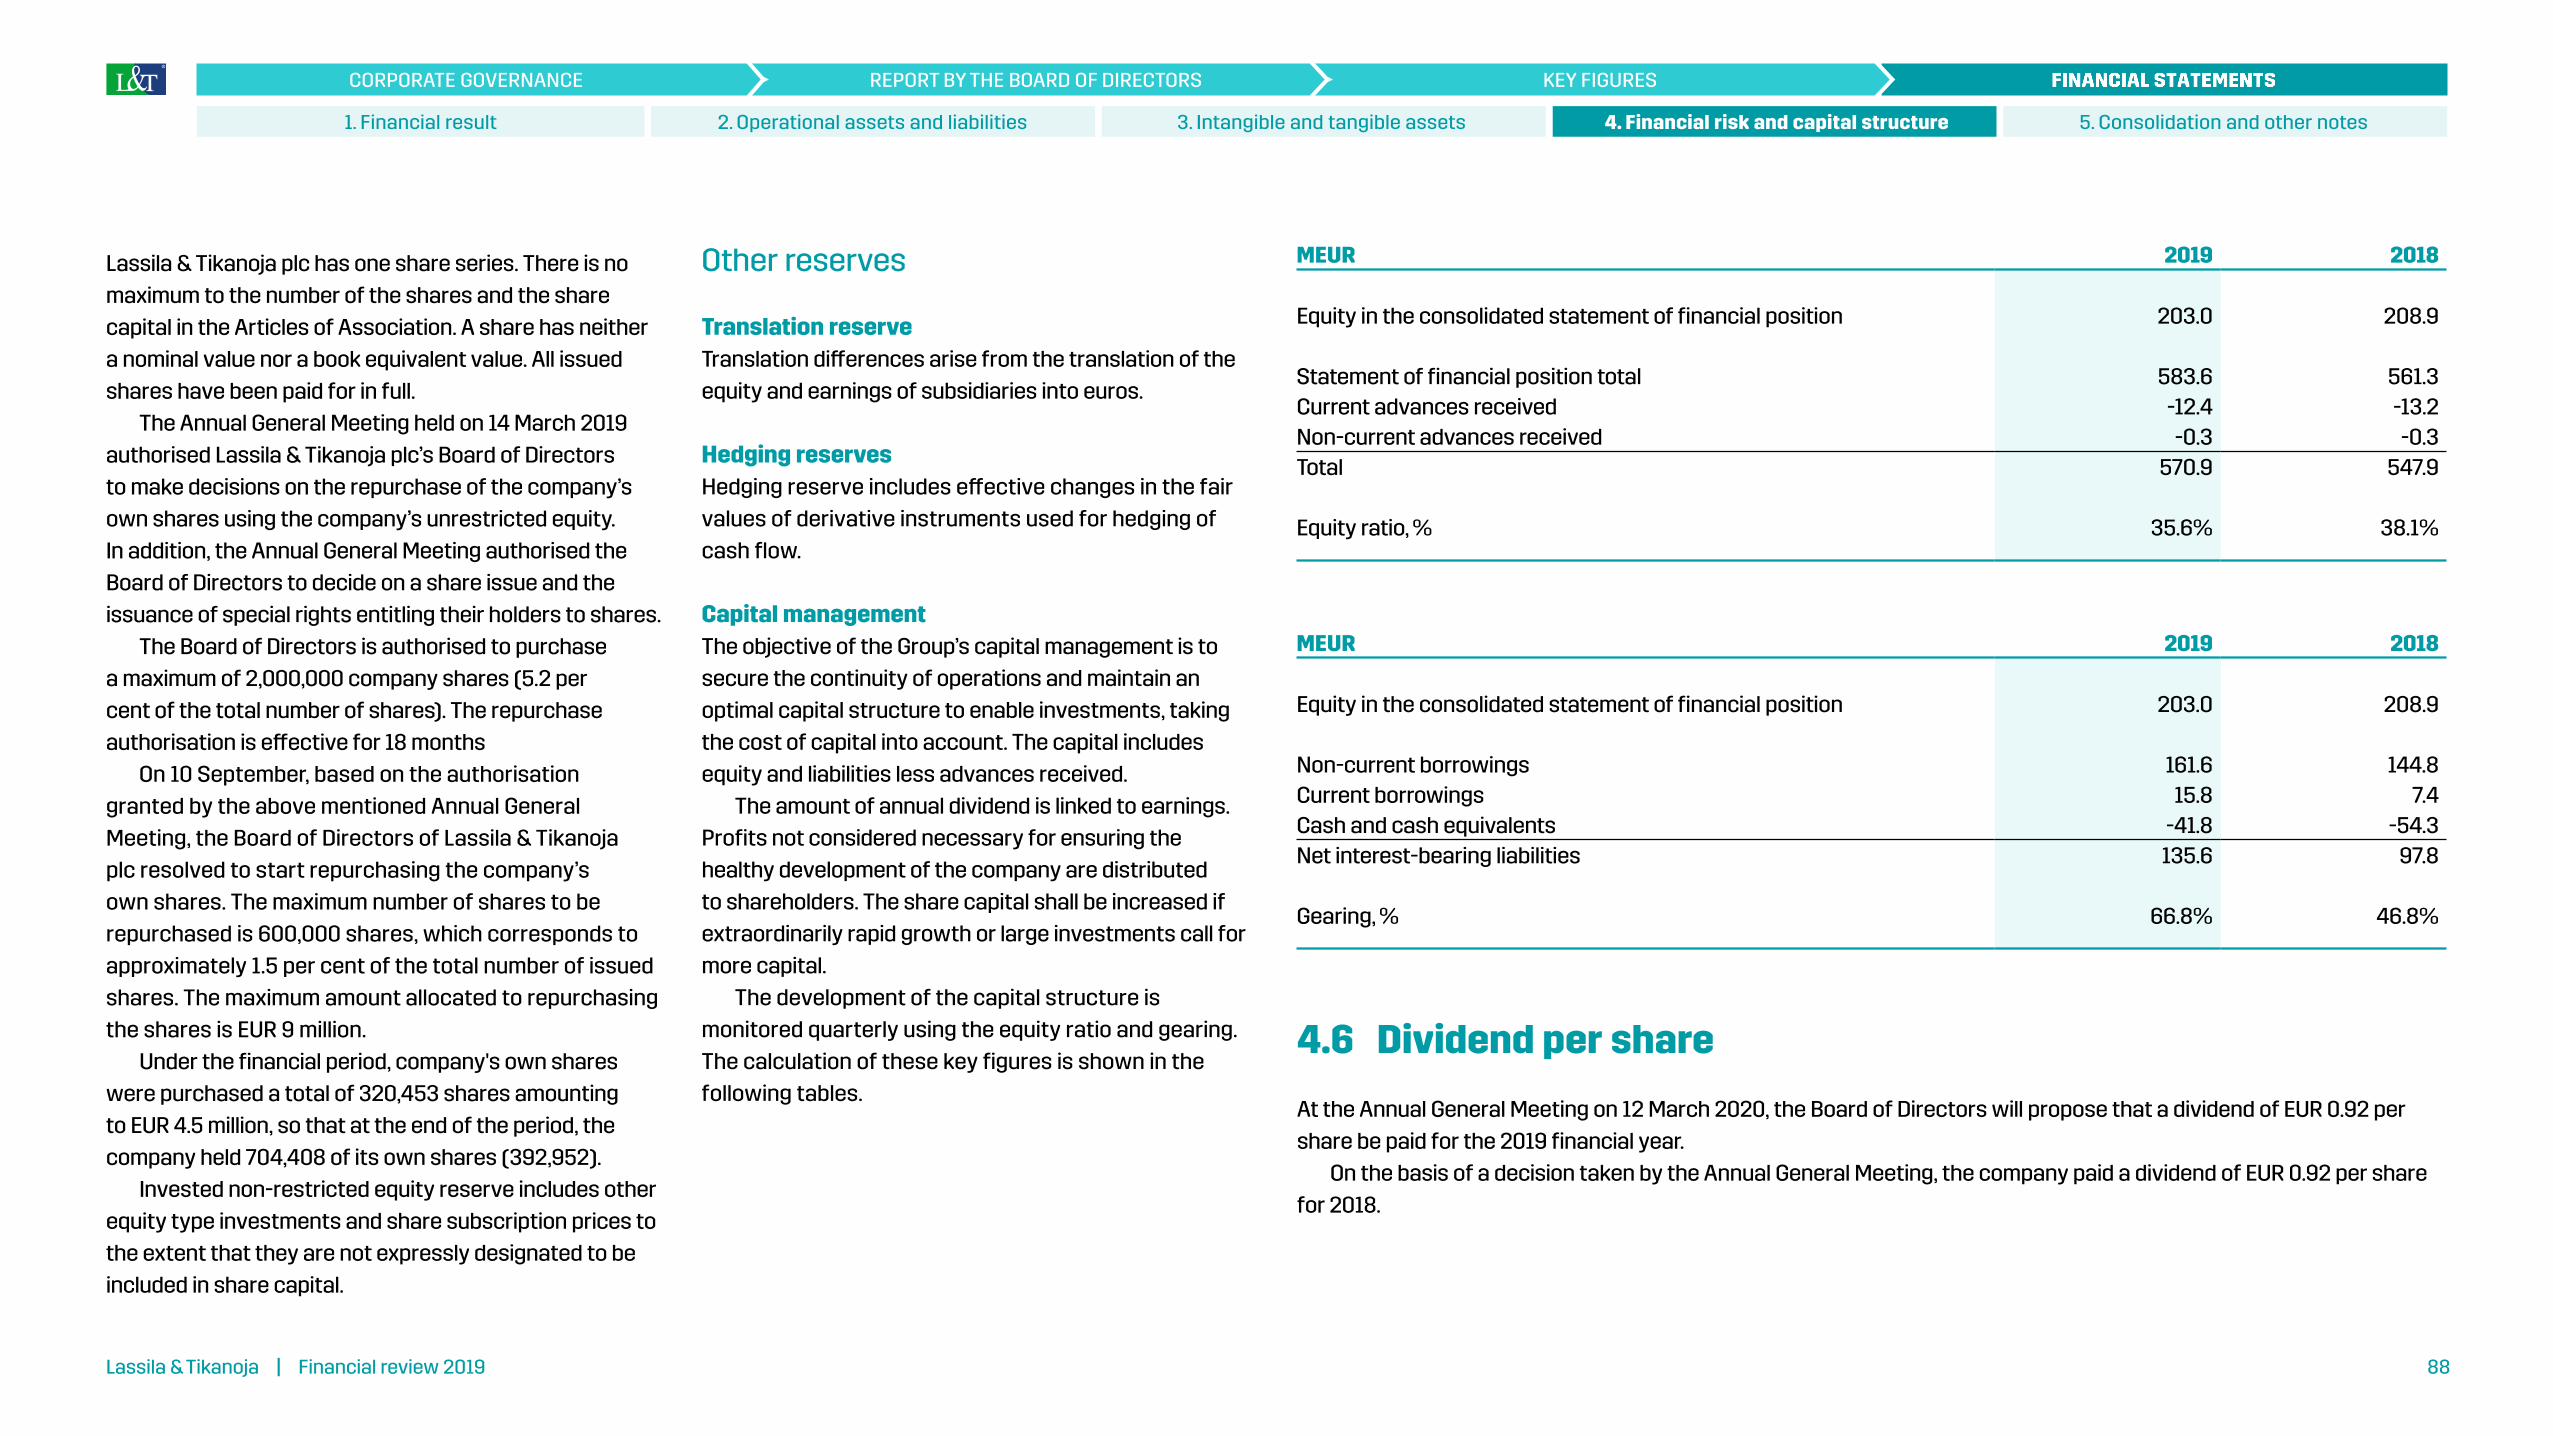
Other reserves
Translation reserveTranslation differences arise from the translation of the equity and earnings of subsidiaries into euros.
Hedging reservesHedging reserve includes effective changes in the fair values of derivative instruments used for hedging of cash flow.
Capital managementThe objective of the Group’s capital management is to secure the continuity of operations and maintain an optimal capital structure to enable investments, taking the cost of capital into account. The capital includes equity and liabilities less advances received.
The amount of annual dividend is linked to earnings. Profits not considered necessary for ensuring the healthy development of the company are distributed to shareholders. The share capital shall be increased if extraordinarily rapid growth or large investments call for more capital.
The development of the capital structure is monitored quarterly using the equity ratio and gearing. The calculation of these key figures is shown in the following tables.
Lassila & Tikanoja plc has one share series. There is no maximum to the number of the shares and the share capital in the Articles of Association. A share has neither a nominal value nor a book equivalent value. All issued shares have been paid for in full.
The Annual General Meeting held on 14 March 2019 authorised Lassila & Tikanoja plc’s Board of Directors to make decisions on the repurchase of the company’s own shares using the company’s unrestricted equity. In addition, the Annual General Meeting authorised the Board of Directors to decide on a share issue and the issuance of special rights entitling their holders to shares.
The Board of Directors is authorised to purchase a maximum of 2,000,000 company shares (5.2 per cent of the total number of shares). The repurchase authorisation is effective for 18 months
On 10 September, based on the authorisation granted by the above mentioned Annual General Meeting, the Board of Directors of Lassila & Tikanoja plc resolved to start repurchasing the company’s own shares. The maximum number of shares to be repurchased is 600,000 shares, which corresponds to approximately 1.5 per cent of the total number of issued shares. The maximum amount allocated to repurchasing the shares is EUR 9 million.
Under the financial period, company's own shares were purchased a total of 320,453 shares amounting to EUR 4.5 million, so that at the end of the period, the company held 704,408 of its own shares (392,952).
Invested non-restricted equity reserve includes other equity type investments and share subscription prices to the extent that they are not expressly designated to be included in share capital.
4.6 Dividend per share
At the Annual General Meeting on 12 March 2020, the Board of Directors will propose that a dividend of EUR 0.92 per share be paid for the 2019 financial year.
On the basis of a decision taken by the Annual General Meeting, the company paid a dividend of EUR 0.92 per share for 2018.
MEUR 2019 2018
Equity in the consolidated statement of financial position 203.0 208.9
Statement of financial position total 583.6 561.3Current advances received -12.4 -13.2Non-current advances received -0.3 -0.3Total 570.9 547.9
Equity ratio, % 35.6% 38.1%
MEUR 2019 2018
Equity in the consolidated statement of financial position 203.0 208.9
Non-current borrowings 161.6 144.8Current borrowings 15.8 7.4Cash and cash equivalents -41.8 -54.3Net interest-bearing liabilities 135.6 97.8
Gearing, % 66.8% 46.8%
Lassila & Tikanoja | Vuosikatsaus 2019 88Lassila & Tikanoja | Financial review 2019 88
5. Consolidation and other notes4. Financial risk and capital structure3. Intangible and tangible assets
KEY FIGURESREPORT BY THE BOARD OF DIRECTORSCORPORATE GOVERNANCE
2. Operational assets and liabilities1. Financial result
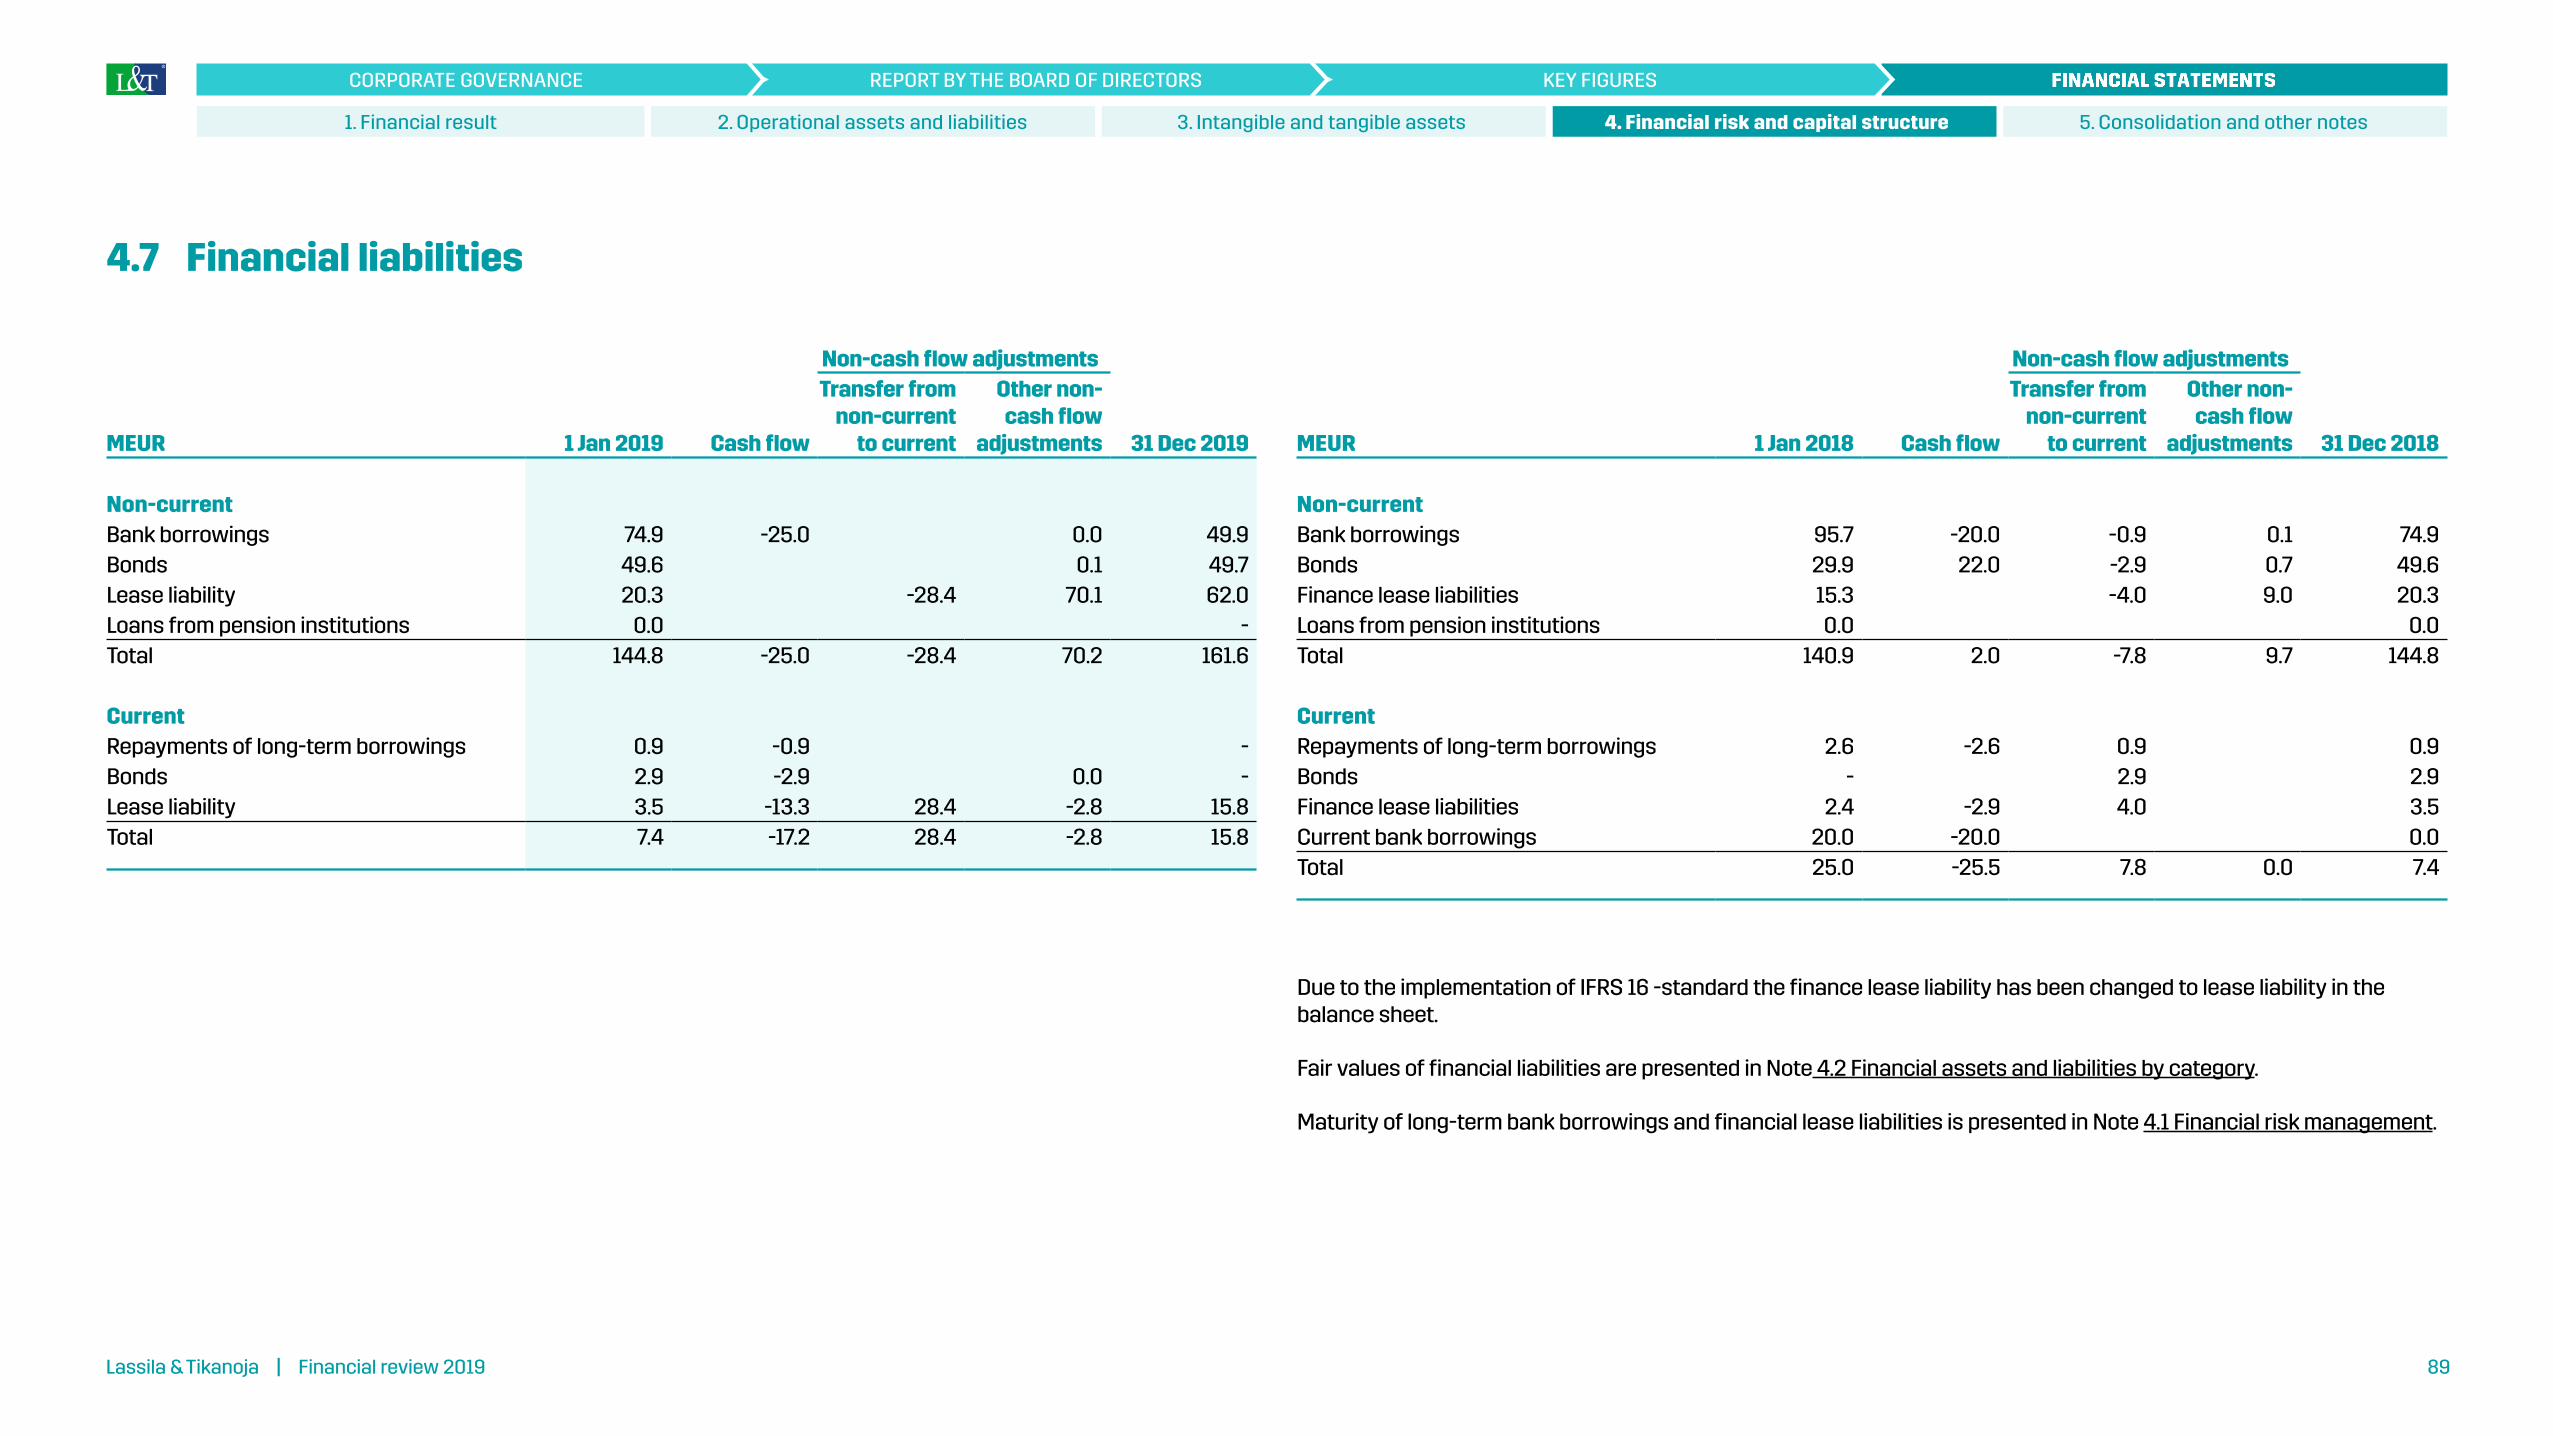
Non-cash flow adjustments
MEUR 1 Jan 2018 Cash flow
Transfer from non-current
to current
Other non-cash flow
adjustments 31 Dec 2018
Non-currentBank borrowings 95.7 -20.0 -0.9 0.1 74.9Bonds 29.9 22.0 -2.9 0.7 49.6Finance lease liabilities 15.3 -4.0 9.0 20.3Loans from pension institutions 0.0 0.0Total 140.9 2.0 -7.8 9.7 144.8
CurrentRepayments of long-term borrowings 2.6 -2.6 0.9 0.9Bonds - 2.9 2.9Finance lease liabilities 2.4 -2.9 4.0 3.5Current bank borrowings 20.0 -20.0 0.0Total 25.0 -25.5 7.8 0.0 7.4
Due to the implementation of IFRS 16 -standard the finance lease liability has been changed to lease liability in the balance sheet.
Fair values of financial liabilities are presented in Note 4.2 Financial assets and liabilities by category.
Maturity of long-term bank borrowings and financial lease liabilities is presented in Note 4.1 Financial risk management.
4.7 Financial liabilities
Non-cash flow adjustments
MEUR 1 Jan 2019 Cash flow
Transfer from non-current
to current
Other non-cash flow
adjustments 31 Dec 2019
Non-currentBank borrowings 74.9 -25.0 0.0 49.9Bonds 49.6 0.1 49.7Lease liability 20.3 -28.4 70.1 62.0Loans from pension institutions 0.0 -Total 144.8 -25.0 -28.4 70.2 161.6
CurrentRepayments of long-term borrowings 0.9 -0.9 -Bonds 2.9 -2.9 0.0 -Lease liability 3.5 -13.3 28.4 -2.8 15.8Total 7.4 -17.2 28.4 -2.8 15.8
Lassila & Tikanoja | Vuosikatsaus 2019 89Lassila & Tikanoja | Financial review 2019 89
5. Consolidation and other notes4. Financial risk and capital structure3. Intangible and tangible assets
KEY FIGURESREPORT BY THE BOARD OF DIRECTORSCORPORATE GOVERNANCE
2. Operational assets and liabilities1. Financial result
4.8 Contingent liabilities
MEUR 2019 2018
Collaterals for own commitmentsMortgages on rights of tenancy 0.1 0.1Other securities 0.1 0.1
Bank guarantees required for environmental permits 11.1 10.3
Other securities are guarantee deposits
With the implementation of IFRS 16, lease liabilities are recorded in the balance sheet as right-of-use assets and lease agreement debts. Short-term lease liabilities with a low value not included in the scope of application of IFRS are not presented in the financial statement because the lease liability resulting from them at the end of the financial year does not differ significantly from the expenses incurred from them during the financial year. In the previous year, the lease liabilities not included in the balance sheet amounted to 39.0 million euros.
Lassila & Tikanoja | Vuosikatsaus 2019 90Lassila & Tikanoja | Financial review 2019 90
5. Consolidation and other notes4. Financial risk and capital structure3. Intangible and tangible assets
KEY FIGURESREPORT BY THE BOARD OF DIRECTORSCORPORATE GOVERNANCE
2. Operational assets and liabilities1. Financial result

Interest rate swaps
MEUR
2019 2018Nominal value Fair value Nominal value Fair value
Maturity of interest rate swaps under hedge accountingNot later than one year - - 0.9Later than one year and not later than five years 30.0 -1.0 - -Later than five years - - 30.0 -0.6Total 30.0 -1.0 30.9 -0.6
The interest rate swaps are used to hedge cash flow related to a floating rate loan, and hedge accounting under IFRS 9 has been applied to it. The hedges have been effective, and the changes in the fair values are shown in the consolidated statement of comprehensive income for the period. The fair values of the swap contracts are based on the market data at the balance sheet date.
The fixed interest rates of the interest rate swaps at 31 December 2019 were 0.8% (0.8). The floating interest rate was 6-month Euribor.
Commodity derivatives
MEUR2019 2018
Nominal value Fair value Nominal value Fair value
Maturity of diesel swaps under hedge accounting Not later than one year 0.6 0.0 1.6 0.0Later than one year and not later than five years - - - -Total 0.6 0.0 1.6 0.0
Commodity derivative contracts were signed for the hedging future diesel oil purchases. IFRS 9 compliant hedge accounting is applied to these contracts, and the effective change in fair value is recognised in the hedging reserve within equity. The fair values of commodity derivatives are based on market prices on the balance sheet date. During the financial period 2019 the Group decided to no longer hedge of future diesel oil purchases. Hedging contracts entered into earlier are valid at the end of the financial period.
4.9 Derivative financial instruments
Accounting policyIn accordance with the financing policy, derivatives agreements are used for the reduction of financial risks related to changes in interest and commodity rates. The derivatives agreements concluded were interest rate swaps which have been implemented to protect the cashflow of floating rate loans from the interest rate risk, and commodity swaps which were implemented to balance the variation in price of future diesel fuel purchases.
Derivatives are recorded in the balance sheet initially at fair value. After the acquisition they will, however, be recorded at the fair value applicable on the balance sheet date. The fair values of are based on market prices on the balance sheet date. Any profits and losses created from the valuation at fair value are processed in accounting as specified by the purpose of use of the derivatives agreement.
All interest and commodity hedges meet the requirements of effective hedging stated in the group’s risk management. Any profits and losses resulting from derivatives included in hedging are recorded like the underlying asset. Derivative agreements are initially specified as hedging of future cashflows and forecast purchases (cashflow hedging) or as derivatives agreements to which hedging does not apply (financial hedging). Cashflow hedging applies to all interest swap and commodity derivative agreements.
The efficiency of hedging relationships is registered initially and in conjunction with each interim report by evaluating the hedging instrument’s ability to reverse the changes in the cashflow of the hedged item.
If the hedging is effective, the changes in the fair value of hedging instruments are recorded in the hedging reserve under capital and reserves. When a hedging instrument matures, it is sold or when the criteria for hedge accounting no longer meet the group’s risk management requirements, the profit or loss generated from the hedging instrument remains in equity until the hedged cashflow is realised. If the hedged cashflow is no longer expected to become realised, the profit or loss generated from the hedging instrument is recorded in the income statement with immediate effect. Any ineffective part of a hedging relationship is also recorded in the income statement with immediate effect.
The positive fair values of all derivatives are recorded in the balance sheet as derivative receivables. Correspondingly, the negative fair values of derivatives are recorded as derivative liabilities. All fair values of derivatives are included in short-term assets or liabilities.
The company uses hedge accounting in accordance with IFRS 9 for the commodity swap agreements related to purchases of diesel fuel. The goal of IFRS 9 is that an entity gives information in its financial statements which allows the users of the financial statements to evaluate the significance of the financial instruments on the entity’s financial position and result, the types and extent of risks related to the financial instruments to which the entity is exposed during the period and on the last day of the reporting period as well as what means the entity uses to control such risks.
Lassila & Tikanoja | Vuosikatsaus 2019 91Lassila & Tikanoja | Financial review 2019 91
5. Consolidation and other notes4. Financial risk and capital structure3. Intangible and tangible assets
KEY FIGURESREPORT BY THE BOARD OF DIRECTORSCORPORATE GOVERNANCE
2. Operational assets and liabilities1. Financial result
Consolidation and other notes5
5.1 Consolidation 93
5.2 Group companies 94
5.3 Business acquisitions 94
5.4 Related-party transactions 96
5.5 Auditing costs 96
5.6 Disputes and litigation 96
5.7 Events after the balance sheet date 96
Lassila & Tikanoja | Vuosikatsaus 2019 92Lassila & Tikanoja | Financial review 2019 92
5. Consolidation and other notes4. Financial risk and capital structure
KEY FIGURESREPORT BY THE BOARD OF DIRECTORSCORPORATE GOVERNANCE
3. Intangible and tangible assets2. Operational assets and liabilities1. Financial result

5.1 Consolidation
SubsidiariesThe consolidated financial statements include the parent company Lassila & Tikanoja plc and all subsidiaries in which the Group exercises control. The criteria for control are fulfilled when the Group is exposed, or has rights, to variable returns from its involvement with an entity and has the ability to affect those returns through its power over the entity.
Intra-Group shareholdings have been eliminated using the acquisition method. Consideration given and the identifiable assets and liabilities of an acquired company are recognised at fair value on the date of acquisition. Any costs associated with the acquisition, with the exception of costs arising from the issuance of debt securities or equity instruments, have been recorded as expenses. Any conditional additional sale price has been measured at fair value on the date of acquisition and classified as a liability or as equity. Additional sale price classified as a liability is measured at fair value on the closing day of each reporting period, and the resulting gains or losses are recognised through profit or loss. Additional sale price classified as equity will not be re-measured. Any non-controlling interests in the acquired entity are recognised either at fair value or at the proportionate share of non-controlling interests in the acquired entity’s net identifiable assets. The principle applied in measurement is specified separately for each
acquisition. The treatment of goodwill from acquisition of subsidiaries is presented in ”Goodwill and other intangible assets”.
The subsidiaries are fully consolidated from the date on which control is transferred to the Group until the date that control ceases.
The profit or loss for the period and the comprehensive income are attributed to the parent company’s shareholders and non-controlling interests, even if this would result in the non-controlling interest being negative. Equity attributable to non-controlling interests is presented as a separate item in the statement of financial position, as an equity component. Changes in the parent company’s holdings in the subsidiary and not resulting in loss of controlling interest are presented as equity transactions. The Group has no material non-controlling interests.
In an acquisition achieved in stages, the previous holdings are measured at fair value and the resulting gains or losses are recognised through profit or loss. If the Group loses its controlling interest in the subsidiary, its remaining holdings are measured at fair value on the date when control ceases, and the difference is recognised through profit or loss.
All intra-Group transactions, receivables, liabilities and unrealised gains, as well as distribution of profits within the Group, are eliminated in the consolidated financial statements. Unrealised losses are not eliminated if the losses are attributable to impairment. The distribution
of profit or loss for the period between equity holders of the parent company and the non-controlling interest is presented in a separate income statement and the statement of comprehensive income, and the share of equity belonging to the non-controlling interest is presented as a separate item in the consolidated statement of financial position under equity.
AssociatesAssociates are companies over which the Group has significant influence. L&T has significant influence when it holds more than 20 per cent of the voting rights or otherwise has significant influence but a non-controlling interest. The equity method has been used in the consolidation of associates.
Foreign currency translationFigures indicating the performance and financial position of the Group entities are specified in the currency of the economic operating environment in which the entity primarily operates (functional currency). The consolidated financial statements are presented in euros, which is the parent company's functional and presentation currency.
Any transactions in foreign currencies have been recognised in the functional currency using the exchange rate in effect on the transaction date. In practice, it is customary to use a rate that is close enough to the transaction day rate. Monetary assets denominated
in foreign currency are translated into euros using the exchange rates in effect on the balance sheet date. Non-monetary assets are translated using the exchange rate in effect on the transaction date. The Group has no non-monetary assets denominated in foreign currency that are measured at fair value. Exchange rate gains and losses arising from foreign-currency transactions and the translation of monetary items are recognised in the income statement. Foreign exchange gains and losses on business transactions are included in the respective items above operating profit. Foreign exchange gains and losses on financial assets and liabilities are included in financial income and costs.
The income statements of the Group entities whose functional currency is not the euro are translated into euros at average exchange rates for the period, and the statements of financial position at the exchange rates in effect on the balance sheet date. The difference in exchange rates applicable to the translation of profit in the income statement and statement of comprehensive income result in a translation difference recognised in the translation reserve within equity. Translation differences arising from the elimination of the acquisition cost of foreign subsidiaries, as well as translation differences in equity items accumulating after the acquisition, are recognised in the translation difference reserve.
Goodwill and fair value adjustments to the carrying amounts of the assets and liabilities arising on the acquisition of a foreign entity are treated as assets and liabilities of the foreign entity and translated into euros at the closing rate.
Lassila & Tikanoja | Vuosikatsaus 2019 93Lassila & Tikanoja | Financial review 2019 93
5. Consolidation and other notes4. Financial risk and capital structure
KEY FIGURESREPORT BY THE BOARD OF DIRECTORSCORPORATE GOVERNANCE
3. Intangible and tangible assets2. Operational assets and liabilities1. Financial result

5.2 Group companies
Konsernin emoyritys Lassila & Tikanoja Oyj
Finnish subsidiaries
Group holding of shares and
votes, %
L&T Relations Oy, Helsinki 100.0L&T Toimi Oy, Helsinki 100.0L&T Biowatti Oy, Helsinki 100.0Kiinteistö Oy Vantaan Valimotie 33, Helsinki 100.0L&T Hankinta Ky, Helsinki 100.0L&T Työllistämispalvelu Oy, Helsinki 100.0Tank Service Finland Oy, Hamina 100.0Huurinainen Oy, liquidated, Helsinki 100.0
Foreign subsidiariesLassila & Tikanoja Service AB, Stockholm, Sweden 100.0Lassila & Tikanoja FM AB, Stockholm, Sweden 100.0Lassila & Tikanoja Services OÜ, in voluntary liquidation, Tallinn, Estonia 100.0L&T Ecoinvest LLC, Dubna, Russia 100.0L&T LLC, Dubna, Russia 100.0The Russian-Finnish Company Ecosystem LLC, Dubna, Russia 90.0
Associated companiesSuomen Keräystuote Oy, Helsinki 40.0Moppicam Oy, liquidated, Helsinki 43.7
5.3 Business acquisitions
Accounting policy In business combinations, all property, plant and equipment acquired is measured at fair value on the basis of the market prices of similar assets, taking into account the age of the assets, wear and tear and similar factors. Tangible assets will be depreciated over their useful life according to the management’s estimate, taking into account the depreciation principles observed within the Group.
Intangible assets arising from business combinations are recognised separately from goodwill at fair value at the time of acquisition if they are identifiable. In connection with acquired business operations, the Group mostly has acquired agreements on prohibition of competition and customer relationships. The fair value of customer agreements and customer relationships associated with them has been determined on the basis of estimated duration of customer relationships and discounted net cash flows arising from current customer relationships. The value of agreements on prohibition of competition is calculated in a similar manner through cash flows over the duration of the agreement. Other intangible assets will be amortised over their useful life according to agreement or the management’s estimate.
In addition to the skills of the personnel of the acquired businesses, goodwill arising from business combinations comprises other intangible items. These unidentified items include the potential for gaining new customers in the acquired businesses and the opportunities for developing new products and services, as well as the regionally strong position of an acquired business. All business combinations also create synergy benefits that consist primarily of savings in fixed production costs.
Changes in acquisition costs may arise on the basis of terms and conditions related to the acquisition price in the deeds of sale. In many acquisitions a small portion of the acquisition price is contingent on future events (less than 12 months).These conditional acquisition prices are recognised at fair value at the time of acquisition, and any changes are recorded without profit impact through the acquisition cost calculation.
Critical judgments by ManagementAssets and liabilities acquired in business combinations are measured at fair value according to IFRS 3. Whenever possible, the management uses available market values when determining the fair values. When this is not possible, the measurement is based on the historical revenues from the asset. In particular, the measurement of intangible assets is based on discounted cash flows and requires the management to make estimates on future cash flows. Although these estimates are based on the management’s best knowledge, actual results may differ from the estimates. The carrying amounts of assets are reviewed continuously for impairment. More information on this is provided in notes 3.1–3.3.
Lassila & Tikanoja | Vuosikatsaus 2019 94Lassila & Tikanoja | Financial review 2019 94
5. Consolidation and other notes4. Financial risk and capital structure
KEY FIGURESREPORT BY THE BOARD OF DIRECTORSCORPORATE GOVERNANCE
3. Intangible and tangible assets2. Operational assets and liabilities1. Financial result

Business acquisitionsLassila & Tikanoja acquired Keski-Uudenmaan Keräyspaperi Oy’s business operations on 1 January 2019. The acquisition covered the waste collection, transport, sorting, storage and processing operations. On the same day, the acquisition of Jätehuolto Jorma Eskolin Oy business operations was completed, transferring the company’s paper collection, transport and processing operations to L&T.
Lassila & Tikanoja Oyj acquired Tank Service Finland Oy's entire share stock on 10 June 2019, resulting in the transfer of Tank Service Finland Oy’s transport tank washing, maintenance and repair operations in the Hamina region to L&T.
The figures for other acquired businesses are stated in aggregate, because none of them is of material importance when considered separately.
Lassila & Tikanoja acquired the business operations of Kymen Talopalvelu Oy on 1 December 2018. The acquisition includes property maintenance and the cleaning business in Kouvola area.
Business acquisitions had EUR 0.5 million effect on the company’s net sales for the financial period (comparison period no effect) and EUR 0.0 million (0.0) on operating profit.
Other business acquisitions, combined
MEUR 2019 2018
Intangible assets 0.4 0.2Property, plant and equipment 0.2 0.1Non-current available-for-sale financial assets 0.0 -Trade and other receivables 0.1 -Cash and cash equivalents 0.4 -Total assets 1.0 0.2
Trade and other payables 0.1 -Deferred tax liabilities 0.1 -Total liabilities 0.2 -
Total identifiable net assets 0.9 0.2
Total consideration 1.0 0.4Goodwill 0.1 0.2
Impact on cash flowPaid in cash -1.0 -0.4Cash acquired 0.4 -Outstanding payments 0.2 0.1Cash flows from investing activities -0.4 -0.3
The acquisition of L&T FM AB was completed on 31 August 2017.
In the first quarter of 2018, a transaction price refund of EUR 2.2 million was received, which affects cash flow from investing activities by EUR 1.6 million. This is shown in the item “Acquisition of subsidiaries and businesses,
net of cash acquired”, netted with the acquisition of the 2018 business. In addition, the value of the acquired balance sheet items was adjusted by SEK 34.5 million in the third quarter of 2018. The adjustments are presented as an increase in property, plant and equipment. The IFRS calculation of the acquisition price presented in the financial statements of 31 December 2018 is final.
L&T FM AB
MEUR 2018
Intangible assets 19.0Property, plant and equipment 0.1Non-current available-for-sale financial assets
0.0
Trade and other receivables 27.5Cash and cash equivalents 0.8Total assets 47.5
Trade and other payables 16.8Deferred tax liabilities 3.9Total liabilities 20.7
Total identifiable net assets 26.8
Total consideration 63.4Goodwill 36.6
Impact on cash flowPaid in cash -63.4Cash acquired 0.8Cash flows from investing activities -62.6
Divested businessesOn 30 April 2019, L&T sold the entire share capital of L&T Korjausrakentaminen Oy to Recover Nordic Group. The debt-free price was EUR 13.9 million and the Group recognised a capital gain of EUR 7.0 million on the sale. The gain on the sale is presented under other operating income.
The net sales of L&T Korjausrakentaminen Oy, which was part of Facility Services, amounted to EUR 35.0 million in 2018 and its operating profit was EUR 0.7 million.
The Group had no divested businesses during the comparison period.
MEUR 2019
Tangible and intangible fixed assets 1.4Trade and other receivables 7.7Cash and cash equivalents 1.7Trade and other payables -6.0Net assets 4.8
Effect on cash flowConsideration received in cash 13.9Selling expenses -0.4Cash and cash equivalents of the divested company -1.7Cash flow from investing activities 11.8
Lassila & Tikanoja | Vuosikatsaus 2019 95Lassila & Tikanoja | Financial review 2019 95
5. Consolidation and other notes4. Financial risk and capital structure
KEY FIGURESREPORT BY THE BOARD OF DIRECTORSCORPORATE GOVERNANCE
3. Intangible and tangible assets2. Operational assets and liabilities1. Financial result

Salaries and remunerations paid to members of the Board of Directors
TEUR 2019 2018
Heikki Bergholm, Chairman of the Board
76 76
Sakari Lassila, Deputy Chairman of the Board
53 53
Teemu Kangas-Kärki 39 40Laura Lares 39 39Miikka Maijala 39 39Laura Tarkka 39 39
On 20 March 2019, 5,903 shares were transferred to the members of the Board of Directors as part of the remuneration of the Board (21 March 2018: 5,326).
In 2019, the remuneration paid to the President and CEO totalled EUR 420 thousand (431), consisting of salaries and benefits of EUR 420 thousand (431) and a bonus of EUR 0 thousand (61). The President and CEO was not paid any rewards on the basis of the achievement of the targets of the share-based incentive programme in 2018 (37).
The remuneration paid to the other members of the Group Executive Board totalled EUR 1,310 thousand (1,120), which includes salaries and benefits of EUR 1,160 thousand (1,024) and bonuses of EUR 150 thousand (96). In addition, the other members of the Group Executive Board were paid rewards amounting to EUR 342 thousand on the basis of the achievement of the targets of the share-based incentive programme in 2018 (53). The figures include salaries for the period
5.6 Disputes and litigation
Lassila & Tikanoja plc is party to a few minor disputes related to the Group’s ordinary business operations. The outcome of these disputes will not have a material effect on the Group’s financial position.
5.7 Events after the balance sheet date
The company’s management is not aware of any events of material importance after the balance sheet date that might have affected the preparation of the financial statements.
during which the persons in question were on the Group Executive Board.
The members of the Board of Directors have no pension contracts with the company. In 2018, EUR 3 thousand (5) arising from the pension agreement of the President and CEO, Jari Sarjo (President and CEO until 13 June 2011) was recognised in the income statement.
In 2019, the company sold services included in normal business operations at market price to parties related to the key personnel for a total amount of EUR 70 thousand (70).
The members of the Board are not included in the share-based incentive programmes.
No loans were granted and no guarantees nor other securities given to persons belonging to the related parties.
5.5 Auditing costs
MEUR 2019 2018
Auditing 0.2 0.2Other assignments in accordance with the auditing act
0.0 -
Tax consulting services 0.0 -Other services 0.0 0.0Total 0.3 0.2
Non-audit services performed by the statutory auditor KPMG Oy Ab in the financial year 2019 totalled EUR 0.1 million (0.0).
5.4 Related-party transactions
The related parties of the Lassila & Tikanoja Group are the senior management, Suomen Keräystuote Oy (an associated company), Moppicom Oy (an associated company) and the L&T sickness fund.
Lists of the Group’s parent and subsidiary relationships, associated companies and joint ventures are presented in Note 15. Group companies.
The contributions paid by the parent company to the L&T sickness fund during the financial year amounted to EUR 0.6 million (0.7). In the comparison period the parent company has granted a EUR 0.1 million loan to Moppicom Oy which has been fully written down during the comparison period.
Employee benefits of top management
MEUR 2019 2018
Salaries and other short-term employee benefits
1.9 2.0
Share-based payment 0.6 0.3Total 2.5 2.3
Top management consists of the members of the Board of Directors, President and CEO and the Group Executive Board. An expense of EUR 0.2 million (0.2) was recognised in the income statement as the top managements' share of the share-based payment.
Lassila & Tikanoja | Vuosikatsaus 2019 96Lassila & Tikanoja | Financial review 2019 96
5. Consolidation and other notes4. Financial risk and capital structure
KEY FIGURESREPORT BY THE BOARD OF DIRECTORSCORPORATE GOVERNANCE
3. Intangible and tangible assets2. Operational assets and liabilities1. Financial result

Financial statements of the parent company
Income statement 99
Balance sheet 100
Cash flow statement 102
Summary of significant accounting policies 103
Notes to the financial statement 105
Lassila & Tikanoja | Vuosikatsaus 2019 97Lassila & Tikanoja | Financial review 2019 97
KEY FIGURESREPORT BY THE BOARD OF DIRECTORSCORPORATE GOVERNANCE

Lassila & Tikanoja | Vuosikatsaus 2019 98Lassila & Tikanoja | Financial review 2019 98
KEY FIGURESREPORT BY THE BOARD OF DIRECTORSCORPORATE GOVERNANCE
Financial statements of the parent company

Income statement of the parent company
MEUR 2019 2018 Note
Net sales 563.1 556.3 1
Other operating income 11.2 6.3 4Change of inventory -0.8 0.3
Materials and services -163.4 -161.6Employee benefit expenses -247.3 -238.0 2Other operating expenses -92.9 -87.7 3,4Depreciation and impairment -35.5 -35.9
Operating profit before goodwill amortisation 34.3 39.8 4Goodwill amortisation -1.6 -1.6
Operating profit 32.7 38.2Financial income and expenses -2.2 -2.9 5
Profit before appropriations and taxes 30.4 35.3Appropriations
Increase/decrease in accumulated depreciation 2.5 2.4Group contribution 1.0 1.2 6
Income tax -5.8 -4.6 7
Profit for the period 28.2 34.3
Lassila & Tikanoja | Vuosikatsaus 2019 99Lassila & Tikanoja | Financial review 2019 99
KEY FIGURESREPORT BY THE BOARD OF DIRECTORSCORPORATE GOVERNANCE
Financial statements of the parent company

Balance sheet of the parent company
MEUR 2019 2018 Note
ASSETSFixed assetsIntangible assets * 8
Intangible rights 1.2 1.4Goodwill 1.1 2.6Other intangible assets 14.4 18.4Advance payments and construction in progress 1.7 0.6
18.3 22.9Tangible assets * 9
Land 5.2 4.5Buildings and constructions 30.4 30.2Machinery and equipment 99.0 97.4Other tangible assets 0.0 0.0Advance payments and construction in progress 4.1 5.2
138.8 137.4Financial assets 10
Shares in Group companies 23.9 30.2Receivables from Group companies 12.5 12.5Shares in joint ventures 0.0 0.0Other shares and holdings * 0.3 0.3
36.7 43.1
Total fixed assets 193.8 203.4
MEUR 2019 2018 Note
Current assetsInventories
Raw materials and consumables 1.7 2.3Finished products/goods 1.2 1.3Other inventories 3.6 3.6
6.5 7.3Non-current receivables
Loan receivables from Group companies 105.7 105.7Loan receivables 0.1 0.4Prepayments 0.3 0.3Deferred tax assets * 2.5 2.4
108.6 108.9
Current receivables 11Receivables from Group companies 1.2 4.0Trade receivables from Associated companies 0.1 0.0Trade receivables 67.2 68.2Other receivables 0.4 0.7Prepaid expenses and accrued income 9.2 6.9
78.1 79.7
Cash and cash equivalents 25.8 44.6
Total current assets 219.0 240.5
Total assets 412.8 443.9
*) The balance sheet values for the comparison period have been adjusted due to prior period errors. More information on this is provided in the section Correction of prior period errors under accounting principles.
Lassila & Tikanoja | Vuosikatsaus 2019 100Lassila & Tikanoja | Financial review 2019 100
KEY FIGURESREPORT BY THE BOARD OF DIRECTORSCORPORATE GOVERNANCE
Financial statements of the parent company
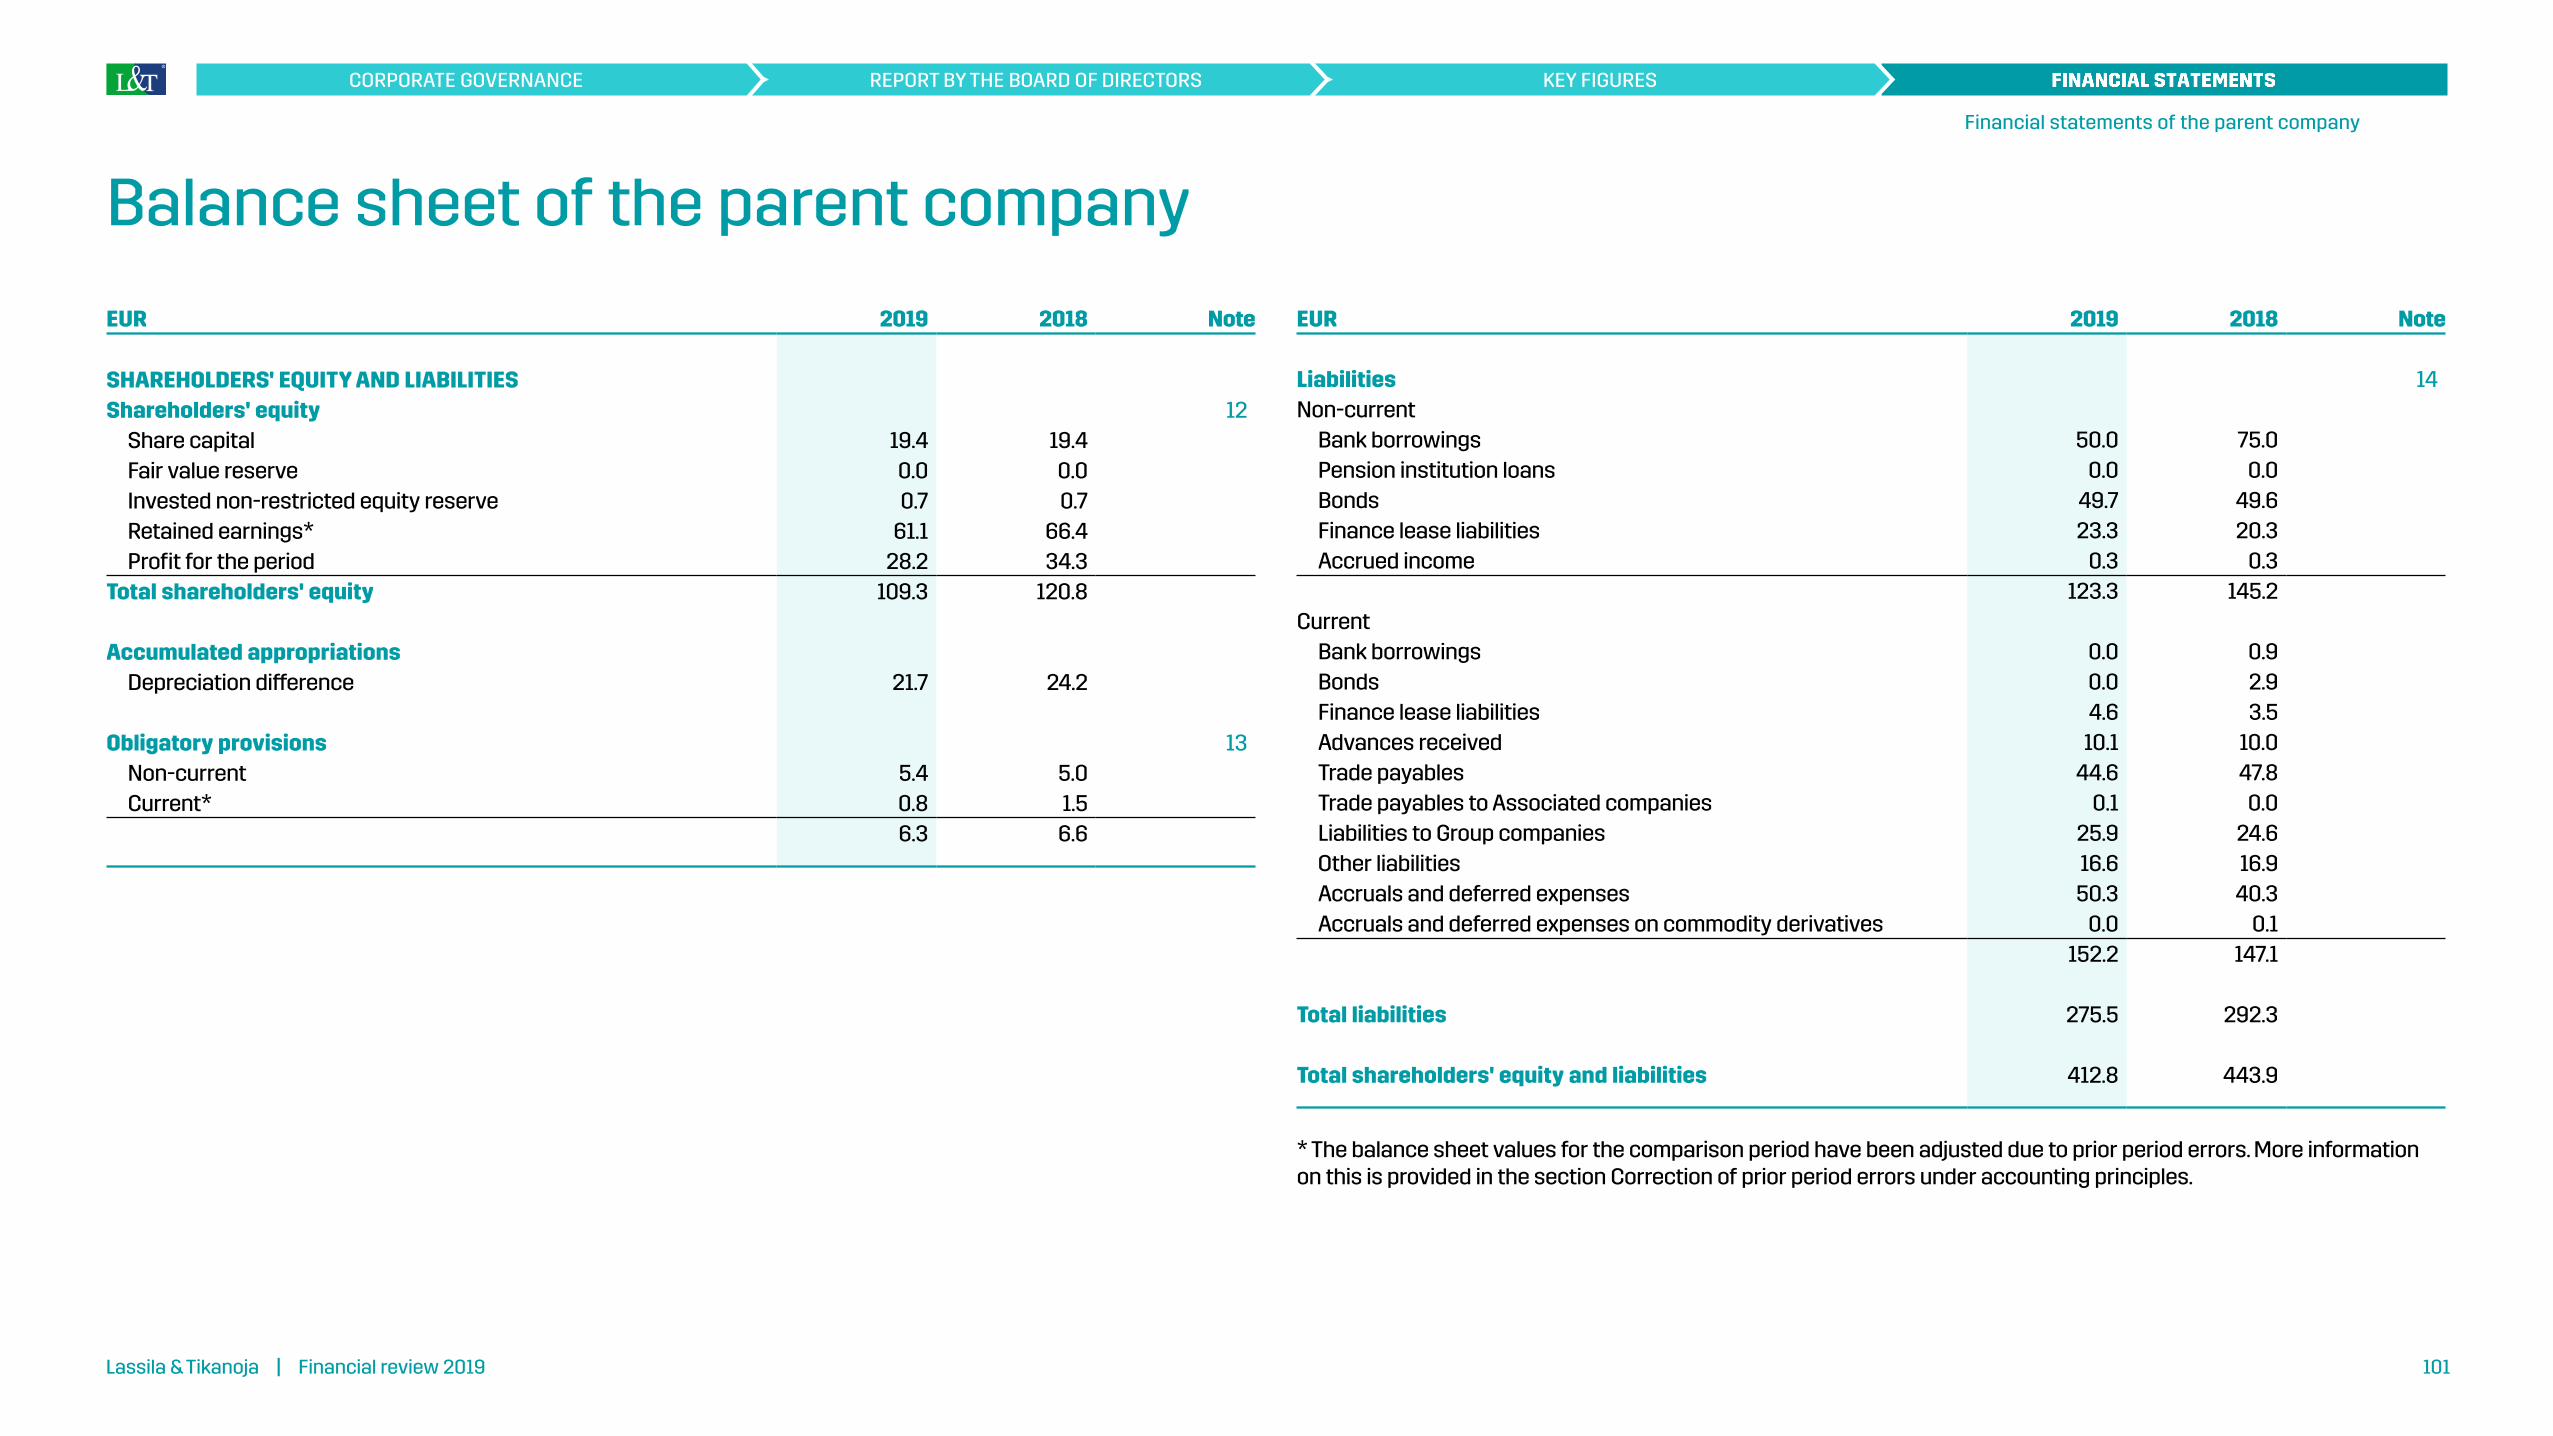
EUR 2019 2018 Note
SHAREHOLDERS' EQUITY AND LIABILITIESShareholders' equity 12
Share capital 19.4 19.4Fair value reserve 0.0 0.0Invested non-restricted equity reserve 0.7 0.7Retained earnings* 61.1 66.4Profit for the period 28.2 34.3
Total shareholders' equity 109.3 120.8
Accumulated appropriationsDepreciation difference 21.7 24.2
Obligatory provisions 13Non-current 5.4 5.0Current* 0.8 1.5
6.3 6.6
Balance sheet of the parent company
EUR 2019 2018 Note
Liabilities 14Non-current
Bank borrowings 50.0 75.0Pension institution loans 0.0 0.0Bonds 49.7 49.6Finance lease liabilities 23.3 20.3Accrued income 0.3 0.3
123.3 145.2Current
Bank borrowings 0.0 0.9Bonds 0.0 2.9Finance lease liabilities 4.6 3.5Advances received 10.1 10.0Trade payables 44.6 47.8Trade payables to Associated companies 0.1 0.0Liabilities to Group companies 25.9 24.6Other liabilities 16.6 16.9Accruals and deferred expenses 50.3 40.3Accruals and deferred expenses on commodity derivatives 0.0 0.1
152.2 147.1
Total liabilities 275.5 292.3
Total shareholders' equity and liabilities 412.8 443.9
* The balance sheet values for the comparison period have been adjusted due to prior period errors. More information on this is provided in the section Correction of prior period errors under accounting principles.
Lassila & Tikanoja | Vuosikatsaus 2019 101Lassila & Tikanoja | Financial review 2019 101
KEY FIGURESREPORT BY THE BOARD OF DIRECTORSCORPORATE GOVERNANCE
Financial statements of the parent company

MEUR 2019 2018
OperationsOperating profit 32.7 38.2Adjustments:
Depreciation and amortisation 37.1 37.5Gains and losses on sales -7.4 0.0Provisions 0.0 -1.7Other adjustments -1.3 0.2
Cash flow before change in working capital 61.1 74.1
Change in working capitalIncrease/decrease in current non-interest-bearing receivables 1.6 4.2Increase/decrease in inventories 0.8 -0.4Increase/decrease in current non-interest-bearing liabilities 8.3 6.0
Cash flow from operations before financial income/expenses and tax 71.8 83.9
Interest expenses and other financial expenses -1.0 -1.1Interest income from operations 0.1 0.1Direct taxes paid -8.0 -6.4
Cash flow from operating activities 62.6 76.4
InvestmentsInvestments in subsidiaries and associated companies and acquired businesses
- 0,2
Proceeds from sale of subsidiaries and businesses 13,8 -Investments in tangible and intangible assets -23,9 -24,6Proceeds from sale of tangible and intangible assets 0,9 2,2Proceeds from long-term receivables 0,3 0,6Proceeds from/repayments of current liabilities to Group companies -0,9 6,2
Cash flow from investing activities -9,8 -15,3
Cash flow statement of the parent company
MEUR 2019 2018
Financing
Paid Group contributions -0,4 -0,3Received Group contributions 1,6 2,4Proceeds from short-term borrowings 10,0 10,0Repayments of short-term borrowings -10,0 -32,6Proceeds from long-term loans - 49,6Repayments of long-term loans -28,9 -47,6Repayments of finance lease liabilities -4,2 -2,9Capital repayment and other distribution of profit paid -35,3 -35,1Acquisition of own shares -4,5 -
Cash flow from financing activities -71,7 -56,5
Changes in cash and cash equivalents -18,9 4,6Cash and cash equivalents at 1 January 44,6 40,0Cash and cash equivalents at 31 December 25,8 44,6
Cash and cash equivalents at 31 DecemberCash and cash equivalents 25.8 44.6
25.8 44.6
The items in the statement of changes in the financial position cannot be derived directly from the balance sheet owing, among other things, to mergers and dissolutions of subsidiaries.
Lassila & Tikanoja | Vuosikatsaus 2019 102Lassila & Tikanoja | Financial review 2019 102
KEY FIGURESREPORT BY THE BOARD OF DIRECTORSCORPORATE GOVERNANCE
Financial statements of the parent company

Summary of significant accounting policies
The financial statements of Lassila & Tikanoja plc have been prepared in accordance with the Finnish Accounting Standards (FAS). Items in the financial statements are stated at cost.
Fixed assetsTangible and intangible assets are stated in the balance sheet at direct acquisition cost less planned depreciati-on. Planned straight-line depreciation is calculated from the historical cost on the basis of probable economic life except for new landfills. The depreciation and amortisati-on periods are as follows:
Buildings and structures 5-30 yearsVehicles 6-15 yearsMachinery and equipment 4-10 yearsGoodwill 5-10 yearsIntangible rights and other capitalised expenditure 5-10 years
In 2008 the Group started to apply the units of pro-duction method to new landfills. Landfills are depreciated on the basis of the volume of waste received. This method reflects more closely than the straight-line method the expected future benefits to be derived from the landfills. As the Kerava landfill is about to be filled up, it will be fully depreciated using the straight-line method.
Depreciation on fixed assets acquired during the financial year is calculated from the day on which they become operational.
Lease payments are recognised as expenses in the income statement. The assets are not stated in the balan-ce sheet.
Investments are measured at cost.
Finance lease agreementAssets leased under a finance lease are recognised in property, plant and equipment at amounts equal to the fair value of the leased property or, if lower, the present value of the minimum lease payments. They are depre-ciated over the term of the lease or over their expected useful lives, if shorter. However, when there is reasonable assurance that the ownership of the leased asset will transfer to L&T by the end of the lease term, the asset will be depreciated using the method applied for a correspon-ding asset owned by the company. Liabilities arising from the leases are recorded under loans. Each lease payment is apportioned between financial cost and loan repay-ment. Financial costs are allocated to each period of the leasing term so as to produce a constant periodic rate of interest on the remaining balance of the liability.
At the end of financial year 2019 the booking of finance leases to the parent company’s bookkeeping has ended as the partial application in parent company’s bookkee-
ping is no longer possible due to implementation of IFRS 16 standard. Due to this change the items relating to finance leases are not comparable between the financial year and the comparison period. The contracts already booked in parent company’s bookkeeping before the change are processed as before in the above described manner.
InventoriesInventories are measured at the variable cost of produc-tion or the probable lower replacement or sales price. The inventories of Environmental Products are measured using the weighted average cost method. The value of other inventories is determined using the FIFO method. The cost of inventories produced by the company comp-rises, in addition to direct costs, a share of production overheads.
Items denominated in foreign currenciesForeign currency transactions are recorded using the exchange rates for the dates of the transactions. Recei-vables and liabilities denominated in foreign currencies are translated into euros at the reference rate of the Eu-ropean Central Bank for the balance sheet date. Exchange rate differences are recognised in the income statement.
DerivativesSwaps are used for hedging against the interest rate risk associated with variable-rate borrowings. Interest inco-me and expenses arising from the swaps are allocated over the contract period and recognised as adjustments to the interest on the hedged item.
Commodity swap agreements are used for hedging against the commodity risk associated with cash flows from diesel purchases. As far as the ineffective portion of the hedging is concerned, changes in the fair values of these agreements are recorded in the income statement, and similarly when the agreements mature or the hedged risk materialises.
Currency forward agreements are used to hedge against foreign exchange risk. Changes in fair values are recorded in the income statement as financial income or expenses.
Net salesSales are stated net of indirect sales taxes, discounts and exchange rate differences. Sales freights and other costs incurred in sales and deliveries are recognised as either costs of goods sold or sales expenses. Bad debt is recognised under other operating expenses.
Lassila & Tikanoja | Vuosikatsaus 2019 103Lassila & Tikanoja | Financial review 2019 103
KEY FIGURESREPORT BY THE BOARD OF DIRECTORSCORPORATE GOVERNANCE
Financial statements of the parent company

Research and development expenditureResearch and development expenditure is recognised as an expense.
Other operating income and expensesOther operating income and expenses consist of items not included in regular service and product sales, such as gains and losses on the sale or disposal of fixed assets, recognition and recovery of bad debt as well as the an-nual discounts on purchases.
Income taxes Current income tax is determined for the taxable profit for the period according to prevailing tax rates. Taxes are adjusted by current tax rates for previous periods, if any.
Deferred taxesDuring financial year 2019 the company has changed its accounting policy relating to deferred taxes. Defer-red tax liabilities and receivables have been calculated based on temporary differences in taxation and the financial statement. The statement of financial position includes deferred tax receivables to the amount of the probable receivable and deferred tax liabilities are stated in the notes to the financial statements. The sta-tement of financial position and the notes in the compa-rison period 2018 have been adjusted accordingly. The impact on the statement of financial position of financial year 2018 is EUR 1.8 million.
The correction of prior period errorsDuring the financial year, the company evaluated its financial management processes and observed cer-tain development areas related to the effectiveness of processes. Corrective measures have been taken with regard to these observations. In connection with this, information pertaining to the valuation of certain ba-lance sheet items was observed that, in the view of the management, should have influenced the valuation of the balance sheet items in question in periods preceding the periods presented in the financial statements. The Group’s management found that, for the items in ques-tion, the definition of prior period errors is fulfilled and, as a result, the management has decided to present the adjustments related to the valuation of the balance sheet items in question as corrections of errors by restating the starting balances of assets, liabilities and equity for the earliest period presented in the financial statements.
The correction of prior period errors consists of impairment recognised on non-current assets totalling EUR 1.8 million and a provision for accident compensati-on payments amounting to EUR 1.3 million. Furthermore, a deferred tax asset of EUR 0.6 million is recognised in non-current assets in relation to the correction of the errors. The net effect on the starting balance of equity on 1 January 2019 is therefore EUR 2.5 million. The finan-cial statement has been adjusted accordingly for the comparison year 2018.
Lassila & Tikanoja | Vuosikatsaus 2019 104Lassila & Tikanoja | Financial review 2019 104
KEY FIGURESREPORT BY THE BOARD OF DIRECTORSCORPORATE GOVERNANCE
Financial statements of the parent company

Notes to the financial statement of the parent company
1. Net sales
MEUR 2019 % 2018 %
Net sales by divisionEnvironmental Services 243.2 43.2 245.8 44.2Industrial Services 93.1 16.5 90.4 16.2Facility Services 226.9 40.3 220.1 39.6Total 563.1 100.0 556.3 100.0
Net sales by marketFinland 552.7 98.2 545.2 98.0Other countries 10.4 1.8 11.1 2.0Total 563.1 100.0 556.3 100.0
2. Personnel and administrative bodies
2019 2018
Average personnelSalaried employees 1,100 1,054Non-salaried employees 4,599 4,644Total 5,699 5,698
MEUR 2019 2018
Personnel expensesSalaries and bonuses 203.2 195.5Pension expenditure 35.7 34.9Other salary-related expenses 8.4 7.6Total 247.3 238.0
Salaries, bonuses and pension benefits of the management are described in the Note 5.4 Related-party transactions of the consolidated financial statements.
No loans were granted to the related parties of the Group companies.
3. Auditor's fees
MEUR 2019 2018
KPMGAuditing 0,1 0,1Other assignments in accordance with the auditing act 0,0 -Tax consulting services 0,0 -Other services 0,0 0,0Total 0,2 0,1
Lassila & Tikanoja | Vuosikatsaus 2019 105Lassila & Tikanoja | Financial review 2019 105
KEY FIGURESREPORT BY THE BOARD OF DIRECTORSCORPORATE GOVERNANCE
Financial statements of the parent company

4. Other operating income and expenses
MEUR 2019 2018
Other operating incomeFrom Group companies
Compensation for administration costs 0.8 2.0From others
Profit on sale of other fixed assets 0.9 0.9Government grants 0.3 0.3Recovery of bad debt 0.1 0.5Annual discounts 0.3 1.5Change in value of commodity derivatives 0.0 0.4Gains on sale of subsidiary 7.6 -Other operating income 1.2 0.6
Total 11.2 6.3
Other operating expensesTo others
ICT costs 12.6 11.4Travel costs 6.9 6.7Vehicles and machinery 35.8 34.9Rents and real estate costs 15.9 15.8Expert fees 5.4 4.3Voluntary social security costs 5.3 5.1Other 11.0 9.5
Total 92.9 87.7
5. Financial income and expenses
MEUR 2019 2018
Other interest and financial income 0.3 0.5Other interest and financial costs -2.5 -3.4Total financial income and costs -2.2 -2.9
Financial income and costs include:Interest income
from Group companies 0.2 0.1from others 0.2 0.4
Foreign exchange gainsfrom others 0.0 0.0
Interest coststo Group companies -0.1 -to others -1.8 -1.8
Other financial expensesto others -0.6 -1.5
-2.2 -2.9
Lassila & Tikanoja | Vuosikatsaus 2019 106Lassila & Tikanoja | Financial review 2019 106
KEY FIGURESREPORT BY THE BOARD OF DIRECTORSCORPORATE GOVERNANCE
Financial statements of the parent company

6. Appropriations
MEUR 2019 2018
Increase/decrease in accumulated depreciationIntangible assetsTangible assets 0.7 -1.1Total extraordinary income and expenses 1.8 3.5
2.5 2.4Group contributionGroup contribution received 1.0 1.6Group contribution paid 0.0 -0.4Total extraordinary income and expenses 1.0 1.2
Total Appropriations 3.5 3.6
7. Income taxes
MEUR 2019 2018
Income taxes on operations for the financial year 5.8 4.6Total 5.8 4.6
8. Intangible assets
MEURIntangible
rights Goodwill
Other intangible
assets
Advance payments
and construction
in progress Total
2019
Cost at 1 January 10.3 113.7 59.4 0.6 184.0Additions 0.1 0.1 0.2 2.5 3.0Disposals -5.3 -1.0 -6.3Transfers between items 0.0 1.4 -1.4 0.0Cost at 31 December 5.1 113.8 60.0 1.7 180.7
Accumulated depreciation at 1 January -8.9 -111.1 -41.1 -161.0Accumulated depreciation on disposals and transfers
5.3 0.0 1.0 6.3
Depreciation during the period -0.4 -1.6 -5.6 -7.5Accumulated depreciation at 31 December -4.0 -112.7 -45.6 -162.3
Total book value 1.2 1.1 14.4 1.7 18.3
2018
Cost at 1 January 10.0 113.4 53.9 3.6 180.9Additions 0.4 0.3 0.6 3.5 4.8Disposals -0.1 -1.6 -1.7Transfers between items 0.0 6.6 -6.5 0.1Adjustment to previous financial periods 0.0 -0.1 -0.1Cost at 31 December 10.3 113.7 59.4 0.6 184.0
Accumulated depreciation at 1 January -8.7 -109.5 -37.8 -156.0Accumulated depreciation on disposals and transfers
0.1 1.6 1.7
Depreciation during the period -0.3 -1.6 -4.9 -6.8Accumulated depreciation at 31 December -8.9 -111.1 -41.1 -161.0
Total book value 1.4 2.6 18.4 0.6 22.9
Other intangible assets include several ICT projects.
Lassila & Tikanoja | Vuosikatsaus 2019 107Lassila & Tikanoja | Financial review 2019 107
KEY FIGURESREPORT BY THE BOARD OF DIRECTORSCORPORATE GOVERNANCE
Financial statements of the parent company
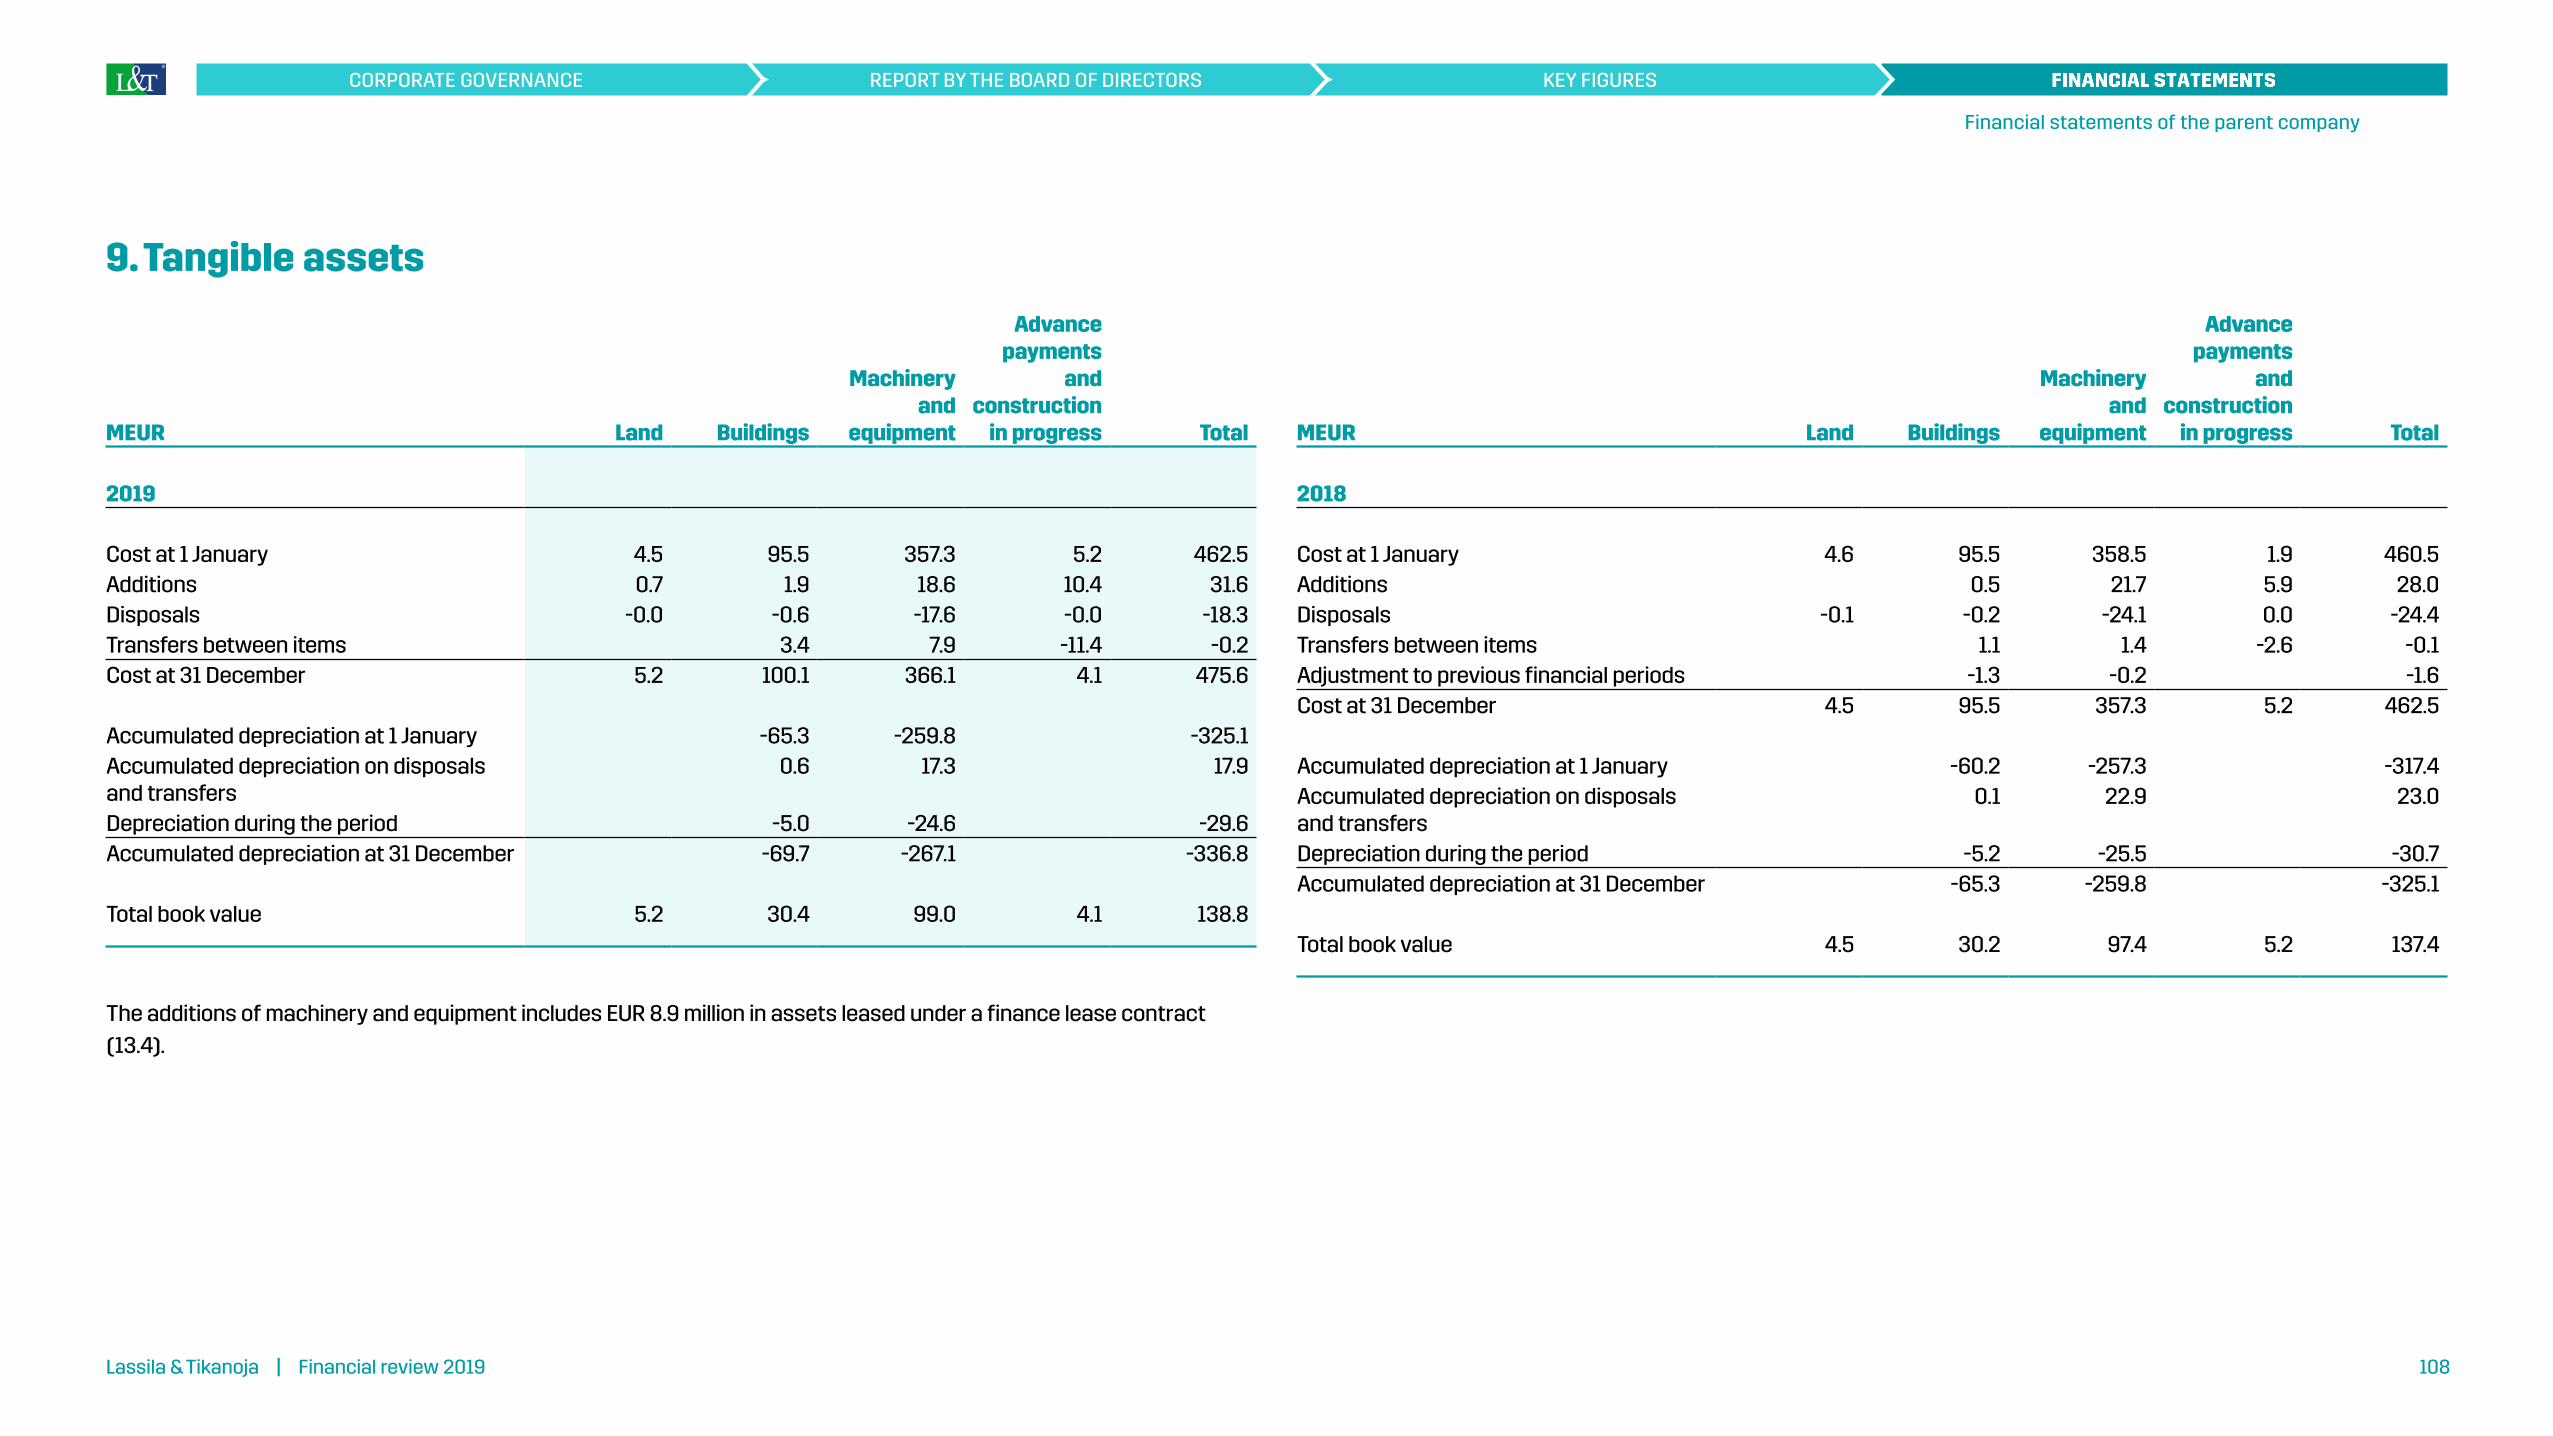
9. Tangible assets
MEUR Land Buildings
Machinery and
equipment
Advance payments
and construction
in progress Total
2019
Cost at 1 January 4.5 95.5 357.3 5.2 462.5Additions 0.7 1.9 18.6 10.4 31.6Disposals -0.0 -0.6 -17.6 -0.0 -18.3Transfers between items 3.4 7.9 -11.4 -0.2Cost at 31 December 5.2 100.1 366.1 4.1 475.6
Accumulated depreciation at 1 January -65.3 -259.8 -325.1Accumulated depreciation on disposals and transfers
0.6 17.3 17.9
Depreciation during the period -5.0 -24.6 -29.6Accumulated depreciation at 31 December -69.7 -267.1 -336.8
Total book value 5.2 30.4 99.0 4.1 138.8
The additions of machinery and equipment includes EUR 8.9 million in assets leased under a finance lease contract (13.4).
MEUR Land Buildings
Machinery and
equipment
Advance payments
and construction
in progress Total
2018
Cost at 1 January 4.6 95.5 358.5 1.9 460.5Additions 0.5 21.7 5.9 28.0Disposals -0.1 -0.2 -24.1 0.0 -24.4Transfers between items 1.1 1.4 -2.6 -0.1Adjustment to previous financial periods -1.3 -0.2 -1.6Cost at 31 December 4.5 95.5 357.3 5.2 462.5
Accumulated depreciation at 1 January -60.2 -257.3 -317.4Accumulated depreciation on disposals and transfers
0.1 22.9 23.0
Depreciation during the period -5.2 -25.5 -30.7Accumulated depreciation at 31 December -65.3 -259.8 -325.1
Total book value 4.5 30.2 97.4 5.2 137.4
Lassila & Tikanoja | Vuosikatsaus 2019 108Lassila & Tikanoja | Financial review 2019 108
KEY FIGURESREPORT BY THE BOARD OF DIRECTORSCORPORATE GOVERNANCE
Financial statements of the parent company

10. Investments
MEUR
Osuudet saman
konsernin yrityksissä
Muut osakkeet ja
osuudetPääoma laina-
saamiset Yhteensä
2019
Cost at 1 January 30.2 0.4 12.5 43.1Disposals -6.3 0.0 -6.3Cost at 31 December 23.9 0.4 12.5 36.7
Total book value 23.9 0.4 12.5 36.7
MEUR
Osuudet saman
konsernin yrityksissä
Muut osakkeet ja
osuudetPääoma laina-
saamiset Yhteensä
2018
Cost at 1 January 30.2 1.0 12.5 43.7Disposals -0.6 -0.6Adjustment to previous financial periods -0.1 -0.1Cost at 31 December 30.2 0.4 12.5 43.1
Total book value 30.2 0.4 12.5 43.1
Holding of shares and votes, %
Holdings in Group companiesKiinteistö Oy Vantaan Valimotie 33, Helsinki 100.0L&T Biowatti Oy, Helsinki 100.0L&T Relations Oy, Helsinki 100.0L&T Toimi Oy, Helsinki 100.0L&T Työllistämispalvelu Oy, Helsinki 100.0
Associated companiesSuomen Keräystuote Oy, Helsinki 40.0Moppicom Oy, in voluntary liquidation, Helsinki 43.7
11. Receivables
MEUR 2019 2018
From Group companiesLoan receivables 1.0 3.2Trade receivables 0.2 0.8Total 1.2 4.0
Prepaid expenses and accrued incomeEmployees' health care compensation 1.3 1.4Statutory personnel insurance 0.0 2.0Annual discounts 1.1 0.5Licences 2.0 0.7Taxes 3.9 1.8Other 0.9 0.5Total 9.2 6.9
Lassila & Tikanoja | Vuosikatsaus 2019 109Lassila & Tikanoja | Financial review 2019 109
KEY FIGURESREPORT BY THE BOARD OF DIRECTORSCORPORATE GOVERNANCE
Financial statements of the parent company
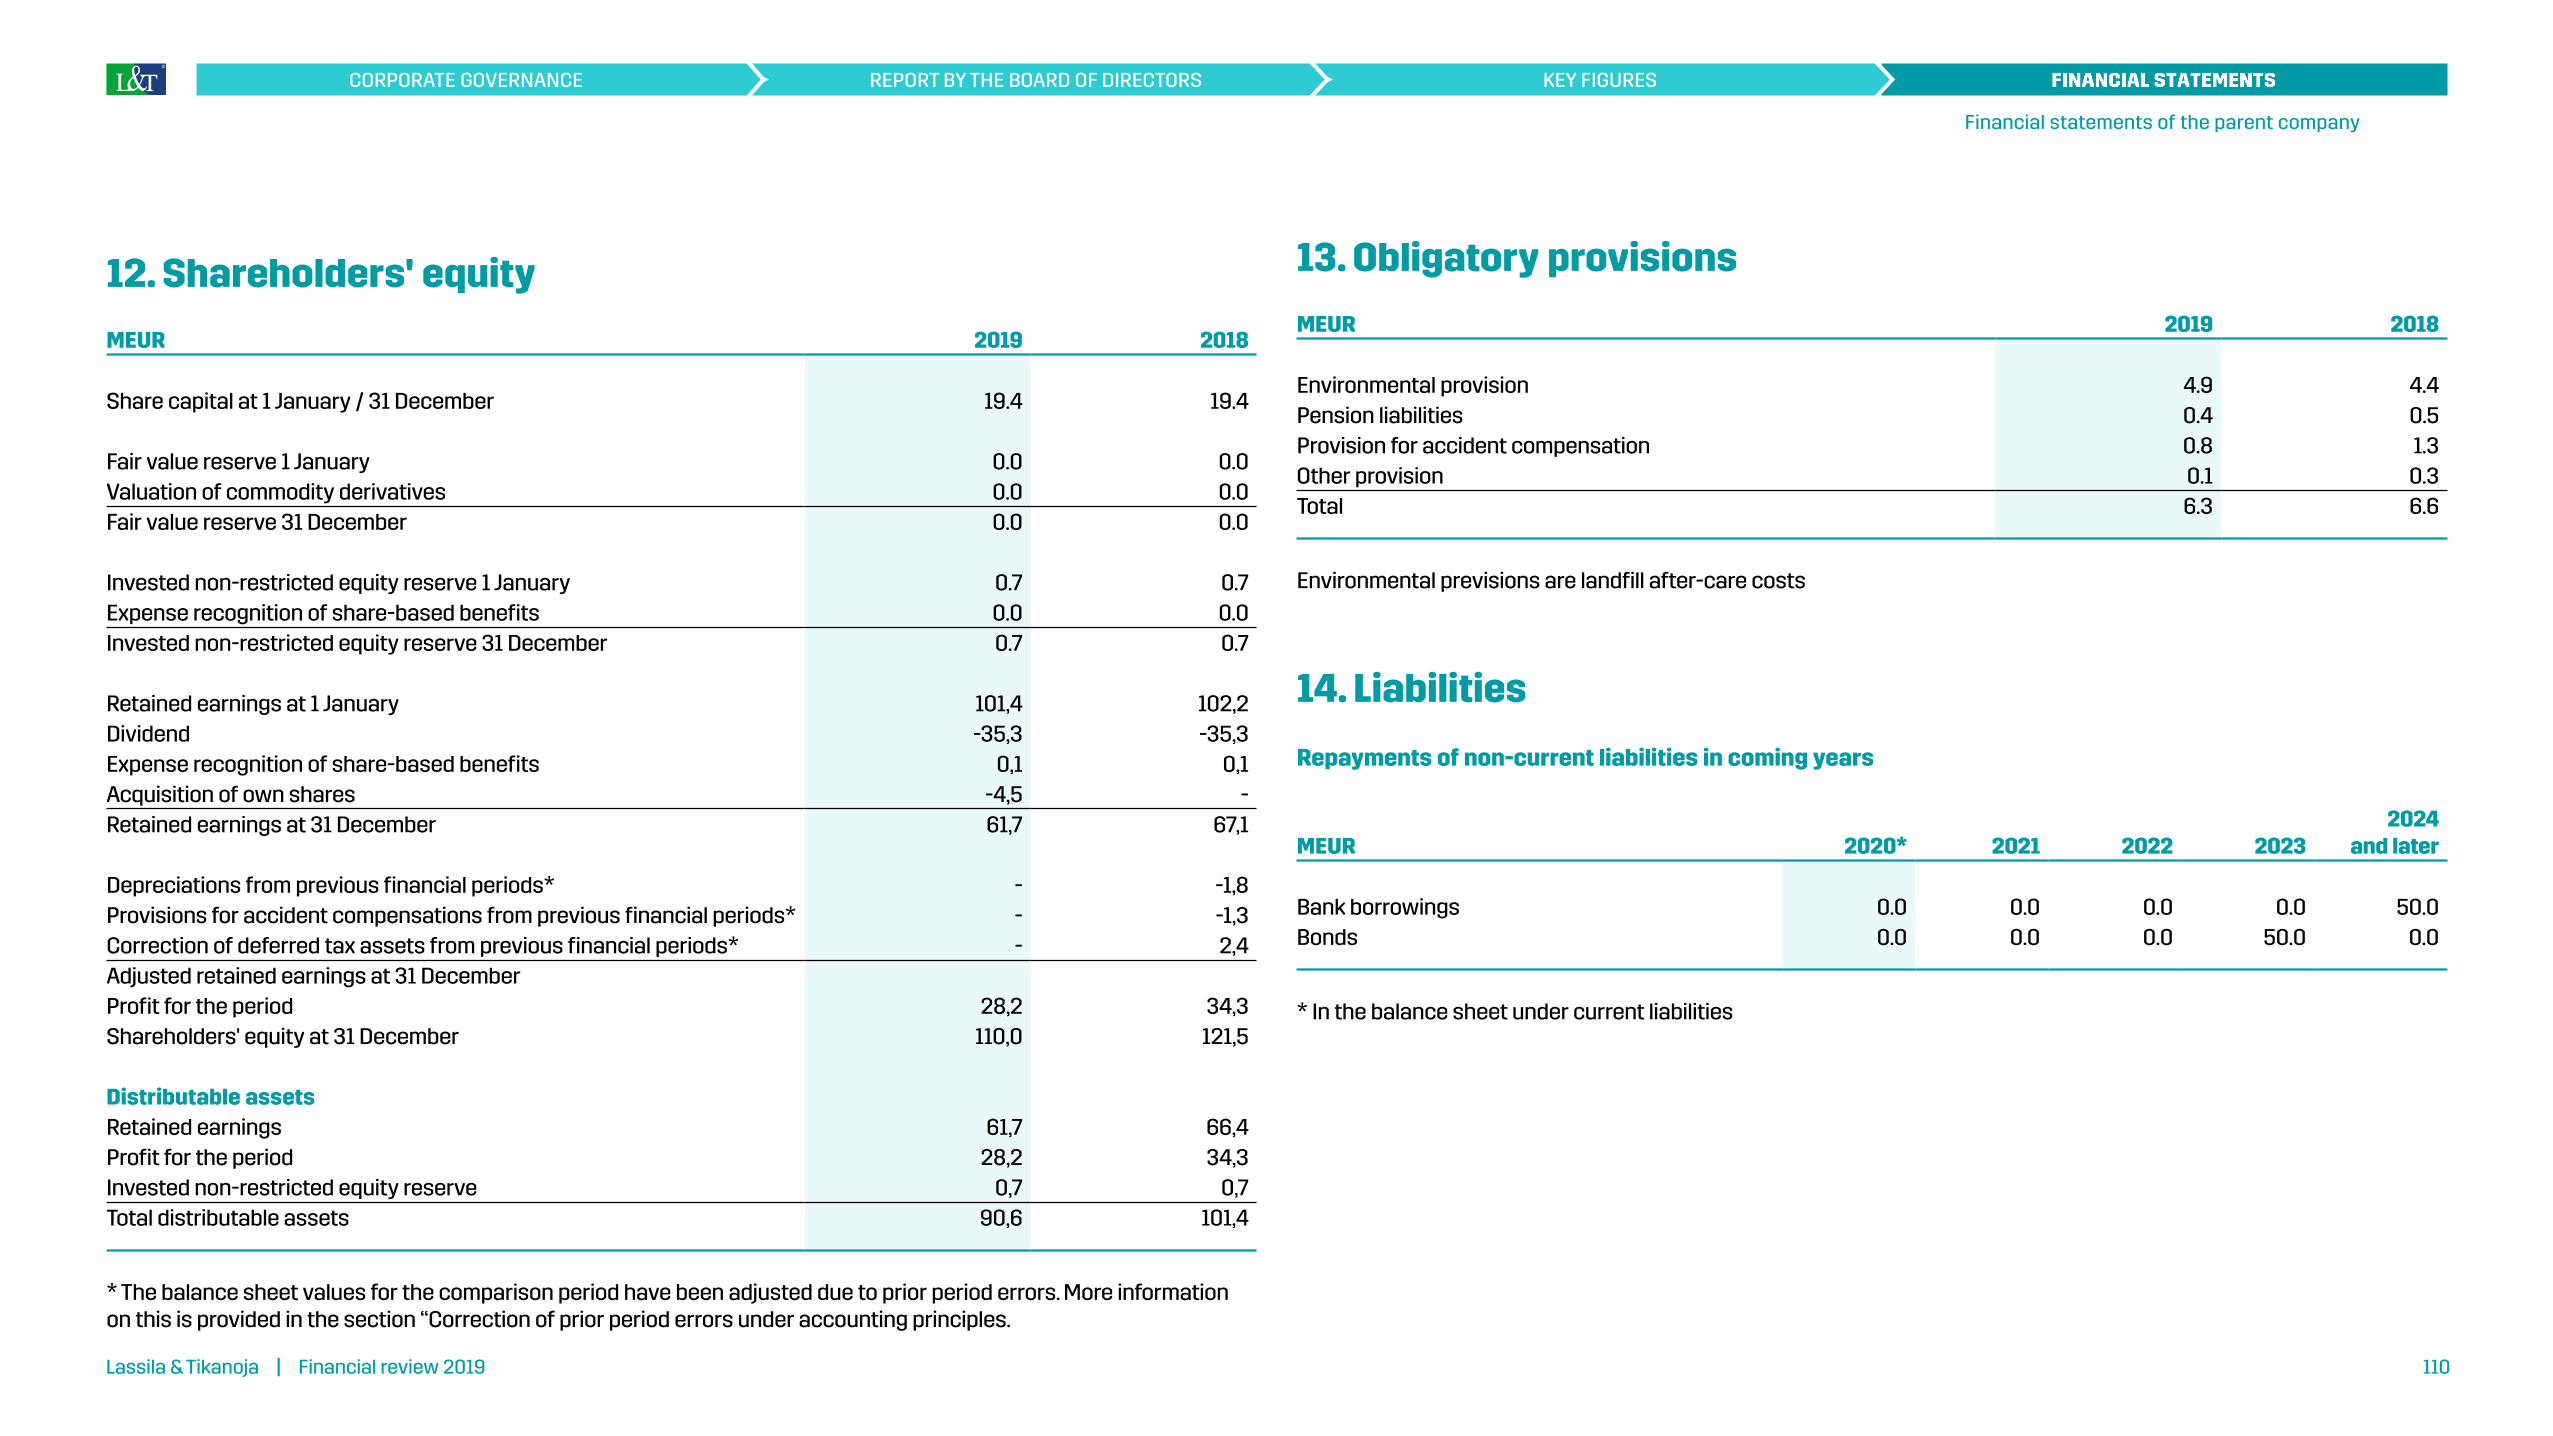
12. Shareholders' equity
MEUR 2019 2018
Share capital at 1 January / 31 December 19.4 19.4
Fair value reserve 1 January 0.0 0.0Valuation of commodity derivatives 0.0 0.0Fair value reserve 31 December 0.0 0.0
Invested non-restricted equity reserve 1 January 0.7 0.7Expense recognition of share-based benefits 0.0 0.0Invested non-restricted equity reserve 31 December 0.7 0.7
Retained earnings at 1 January 101,4 102,2Dividend -35,3 -35,3Expense recognition of share-based benefits 0,1 0,1Acquisition of own shares -4,5 -Retained earnings at 31 December 61,7 67,1
Depreciations from previous financial periods* - -1,8Provisions for accident compensations from previous financial periods* - -1,3Correction of deferred tax assets from previous financial periods* - 2,4Adjusted retained earnings at 31 DecemberProfit for the period 28,2 34,3Shareholders' equity at 31 December 110,0 121,5
Distributable assetsRetained earnings 61,7 66,4Profit for the period 28,2 34,3Invested non-restricted equity reserve 0,7 0,7Total distributable assets 90,6 101,4
* The balance sheet values for the comparison period have been adjusted due to prior period errors. More information on this is provided in the section “Correction of prior period errors under accounting principles.
13. Obligatory provisions
MEUR 2019 2018
Environmental provision 4.9 4.4Pension liabilities 0.4 0.5Provision for accident compensation 0.8 1.3Other provision 0.1 0.3Total 6.3 6.6
Environmental previsions are landfill after-care costs
14. Liabilities
Repayments of non-current liabilities in coming years
MEUR 2020* 2021 2022 20232024
and later
Bank borrowings 0.0 0.0 0.0 0.0 50.0Bonds 0.0 0.0 0.0 50.0 0.0
* In the balance sheet under current liabilities
Lassila & Tikanoja | Vuosikatsaus 2019 110Lassila & Tikanoja | Financial review 2019 110
KEY FIGURESREPORT BY THE BOARD OF DIRECTORSCORPORATE GOVERNANCE
Financial statements of the parent company

MEUR 2019 2018
Liabilities to Group companiesTrade payables 2.4 1.2Other liabilities 23.5 23.4Total 25.9 24.6
Accruals and deferred expensesPersonnel expenses 48.2 38.4Other expenses 2.1 2.0Total 50.3 40.3
Maturity of financial lease liabilities
MEUR 2019 2018
Finance lease liabilities– minimum lease payments by maturityNot later than one year 4.9 3.8Later than one year and not later than five years 20.2 15.9Later than five years 4.3 5.5Total minimum lease payments 29.4 25.2Future finance charges -1.5 -1.4Present value of finance lease liabilities 27.9 23.8
Maturity of present value of finance lease liabilitiesNot later than one year 4.6 3.5Later than one year and not later than five years 19.0 14.9Later than five years 4.3 5.5Total 27.9 23.8
Finance lease on heavy machinery is currently the only asset meeting the characteristics of a finance lease, and it is handled as a finance lease liability in the financial statements.
15. Contingent liabilities
MEUR 2019 2018
For own commitments Mortgages on rights of tenancy 0.1 0.1Other securities 0.0 0.1
Liabilities related to leasing and leasesFalling due next year 10.3 7.8Falling due in subsequent years 33.6 20.0Total 43.9 27.8
For Group entitiesGuarantees 13.5 13.5
Bank guarantees required for environmental permits 11.1 10.3
Lassila & Tikanoja | Vuosikatsaus 2019 111Lassila & Tikanoja | Financial review 2019 111
KEY FIGURESREPORT BY THE BOARD OF DIRECTORSCORPORATE GOVERNANCE
Financial statements of the parent company
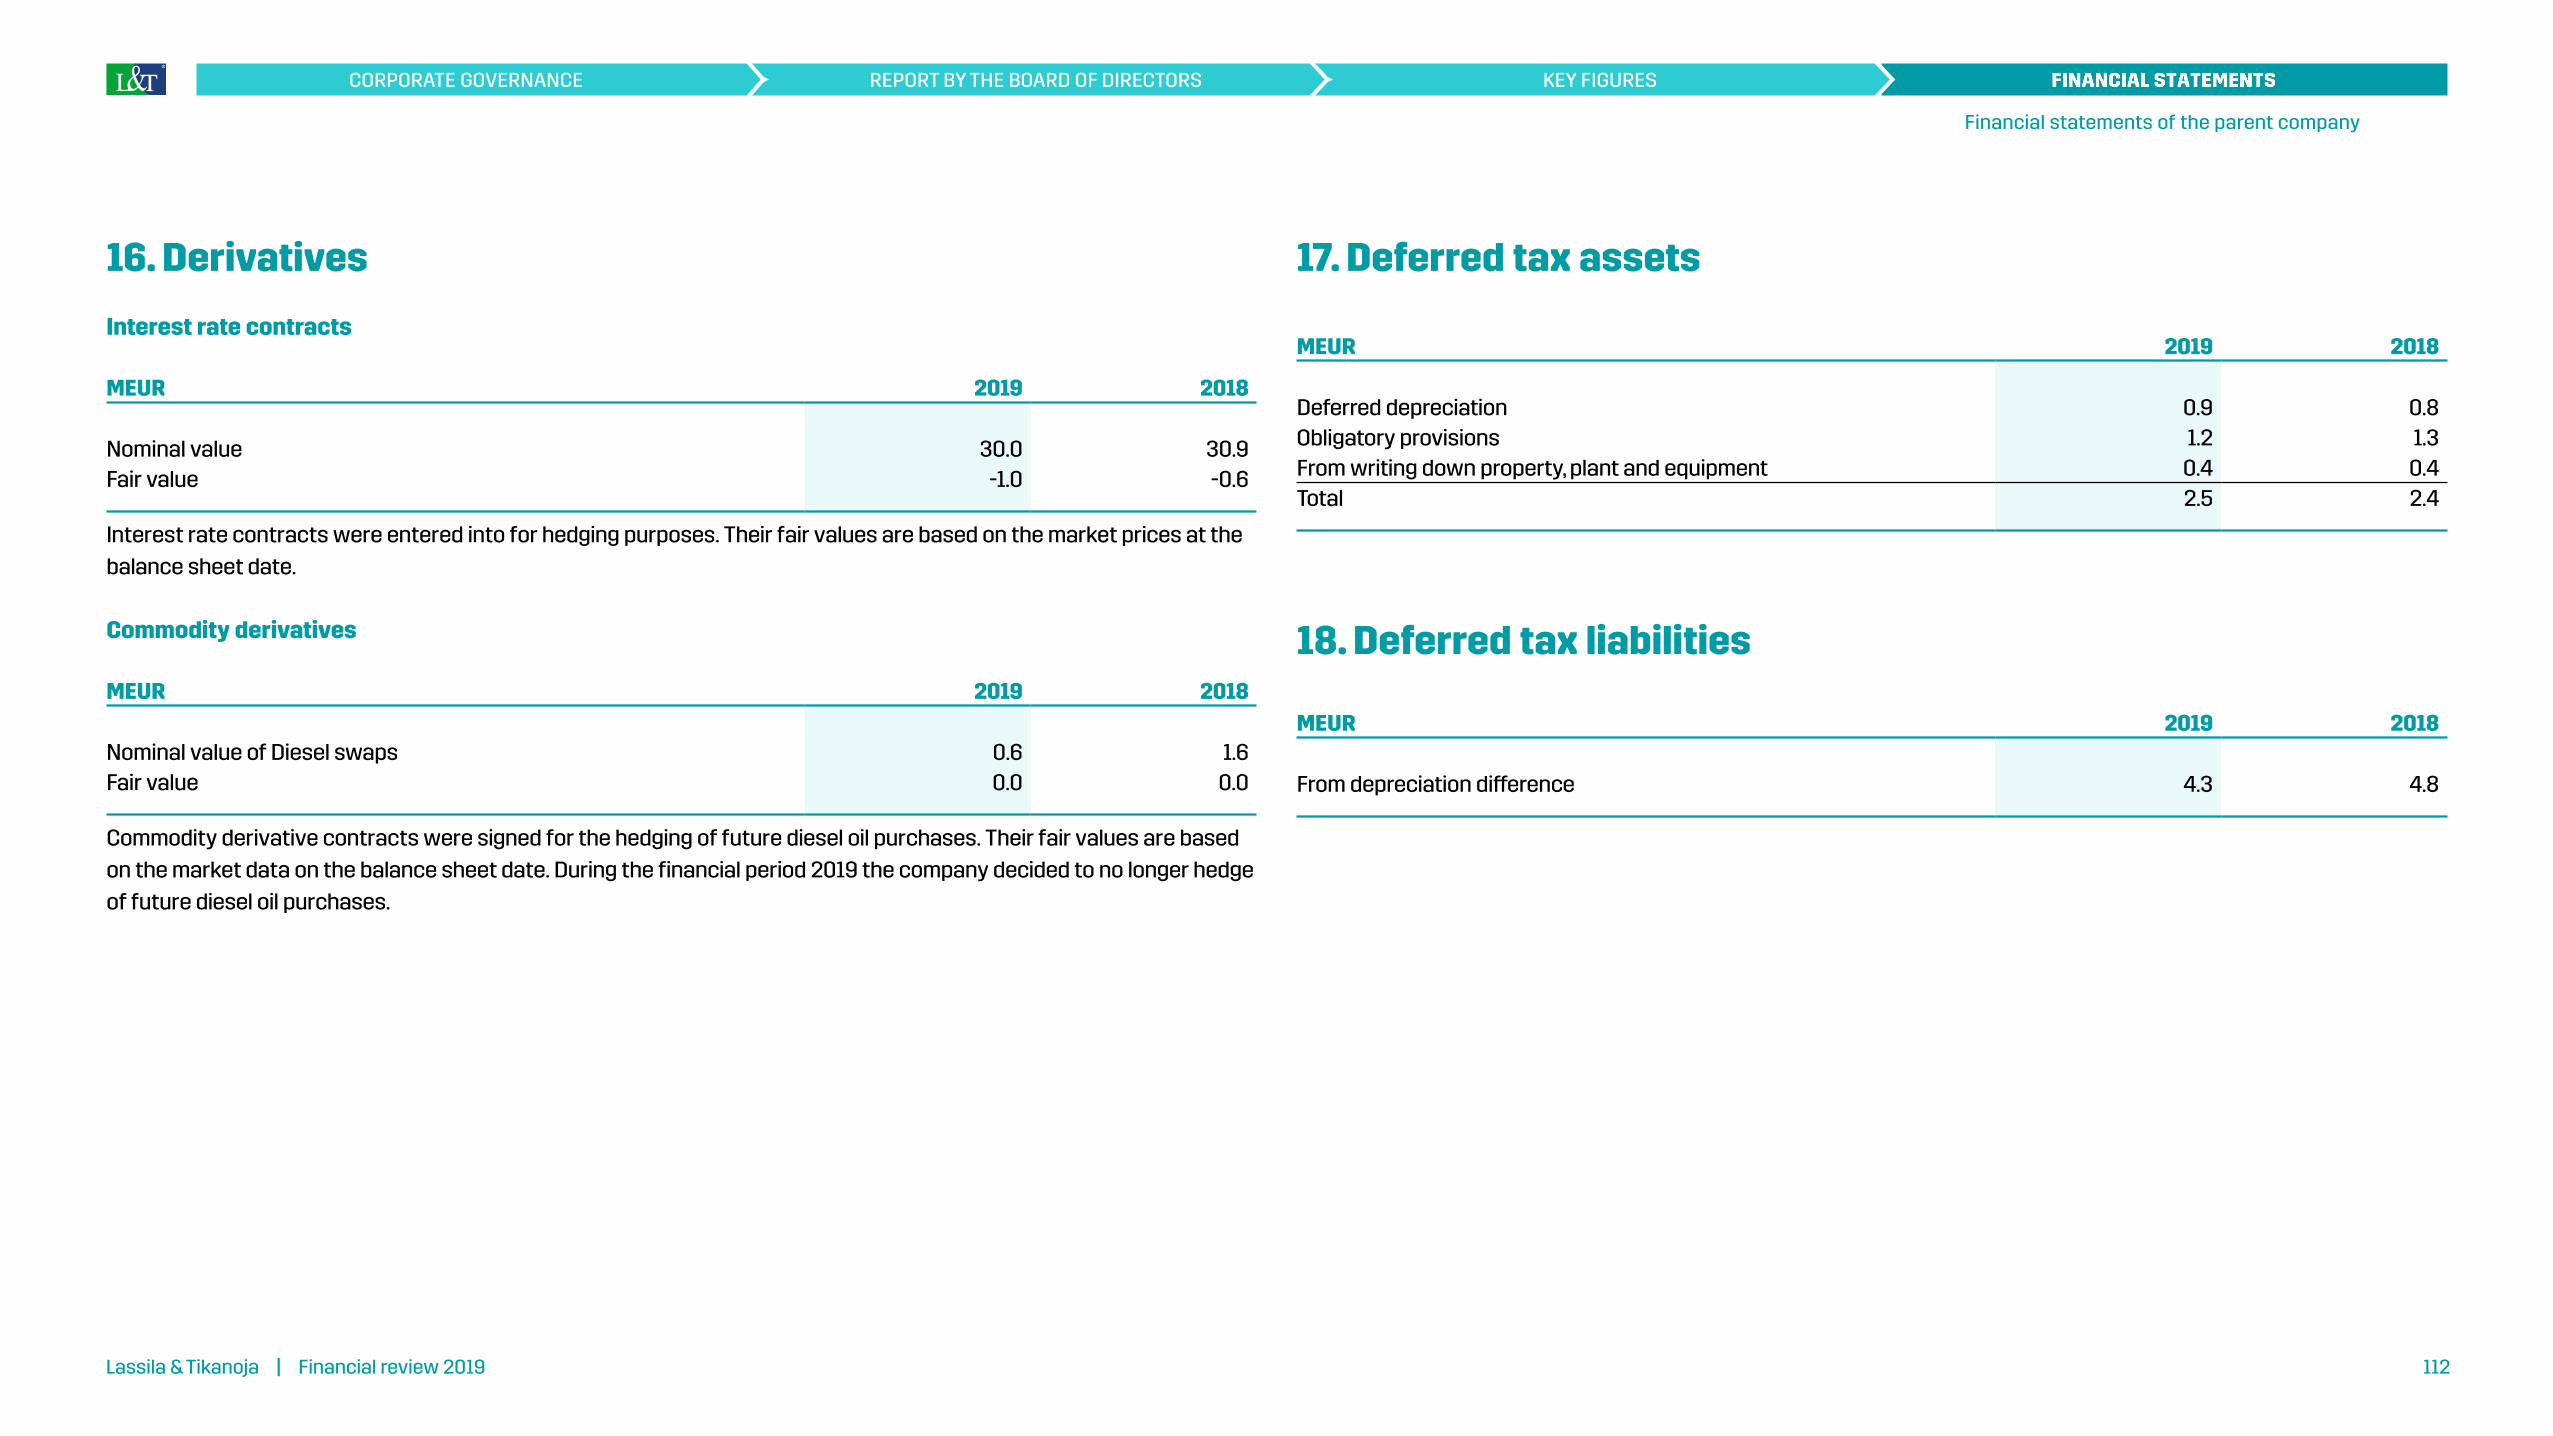
16. Derivatives
Interest rate contracts
MEUR 2019 2018
Nominal value 30.0 30.9Fair value -1.0 -0.6
Interest rate contracts were entered into for hedging purposes. Their fair values are based on the market prices at the balance sheet date.
Commodity derivatives
MEUR 2019 2018
Nominal value of Diesel swaps 0.6 1.6Fair value 0.0 0.0
Commodity derivative contracts were signed for the hedging of future diesel oil purchases. Their fair values are based on the market data on the balance sheet date. During the financial period 2019 the company decided to no longer hedge of future diesel oil purchases.
17. Deferred tax assets
MEUR 2019 2018
Deferred depreciation 0.9 0.8Obligatory provisions 1.2 1.3From writing down property, plant and equipment 0.4 0.4Total 2.5 2.4
18. Deferred tax liabilities
MEUR 2019 2018
From depreciation difference 4.3 4.8
Lassila & Tikanoja | Vuosikatsaus 2019 112Lassila & Tikanoja | Financial review 2019 112
KEY FIGURESREPORT BY THE BOARD OF DIRECTORSCORPORATE GOVERNANCE
Financial statements of the parent company

Proposal by the Board of Directors for the use of the profit shown on the balance sheet
The Auditor’s Note
According to the financial statements, Lassila & Tikanoja plc's unrestricted equity amount to EUR 89,944,979.49 with the profit for the period representing EUR 28,156,635.13. There were no substantial changes in the financial standing of the company after the end of the period, and the solvency test referred to in Chapter 13, section 2 of the Companies Act does not affect the amount of distributable assets.
The Board of Directors proposes to the Annual General Meeting that a dividend of EUR 0.92 per share be paid on the basis of the balance sheet to be adopted for the financial year 2019.
The dividend will be paid to a shareholder who is registered in the Company’s shareholders’ register maintained by Euroclear Finland Ltd on the record date for dividend payment, 16 March 2020. The Board of Directors proposes to the Annual General Meeting that the dividend be paid on 23 March 2020.
No dividend shall be paid on share held by the company on the record date of dividend payment, 16 March 2020.On the day the proposal for the distribution of assets was made, the number of shares entitling to dividend was 38,094,466, which means
the total amount of the dividend would be EUR 35,046,908.72To be retained and carried forward EUR 54,898,070.77Total EUR 89,944,979.49
Signatures to the Report of the Board of Directors and the Financial Statements for the year 2019Helsinki on 28 January 2020
Heikki Bergholm Sakari Lassila
Teemu Kangas-Kärki Laura Lares
Miikka Maijala Laura Tarkka
Eero HautaniemiPresident and CEO
We have today submitted our report on the audit conducted by us.
Helsinki on 5 February 2020
KPMG OY AbAuthorised Public Accountants
Leenakaisa WinbergAPA
Lassila & Tikanoja | Vuosikatsaus 2019 113Lassila & Tikanoja | Financial review 2019 113
KEY FIGURESREPORT BY THE BOARD OF DIRECTORSCORPORATE GOVERNANCE
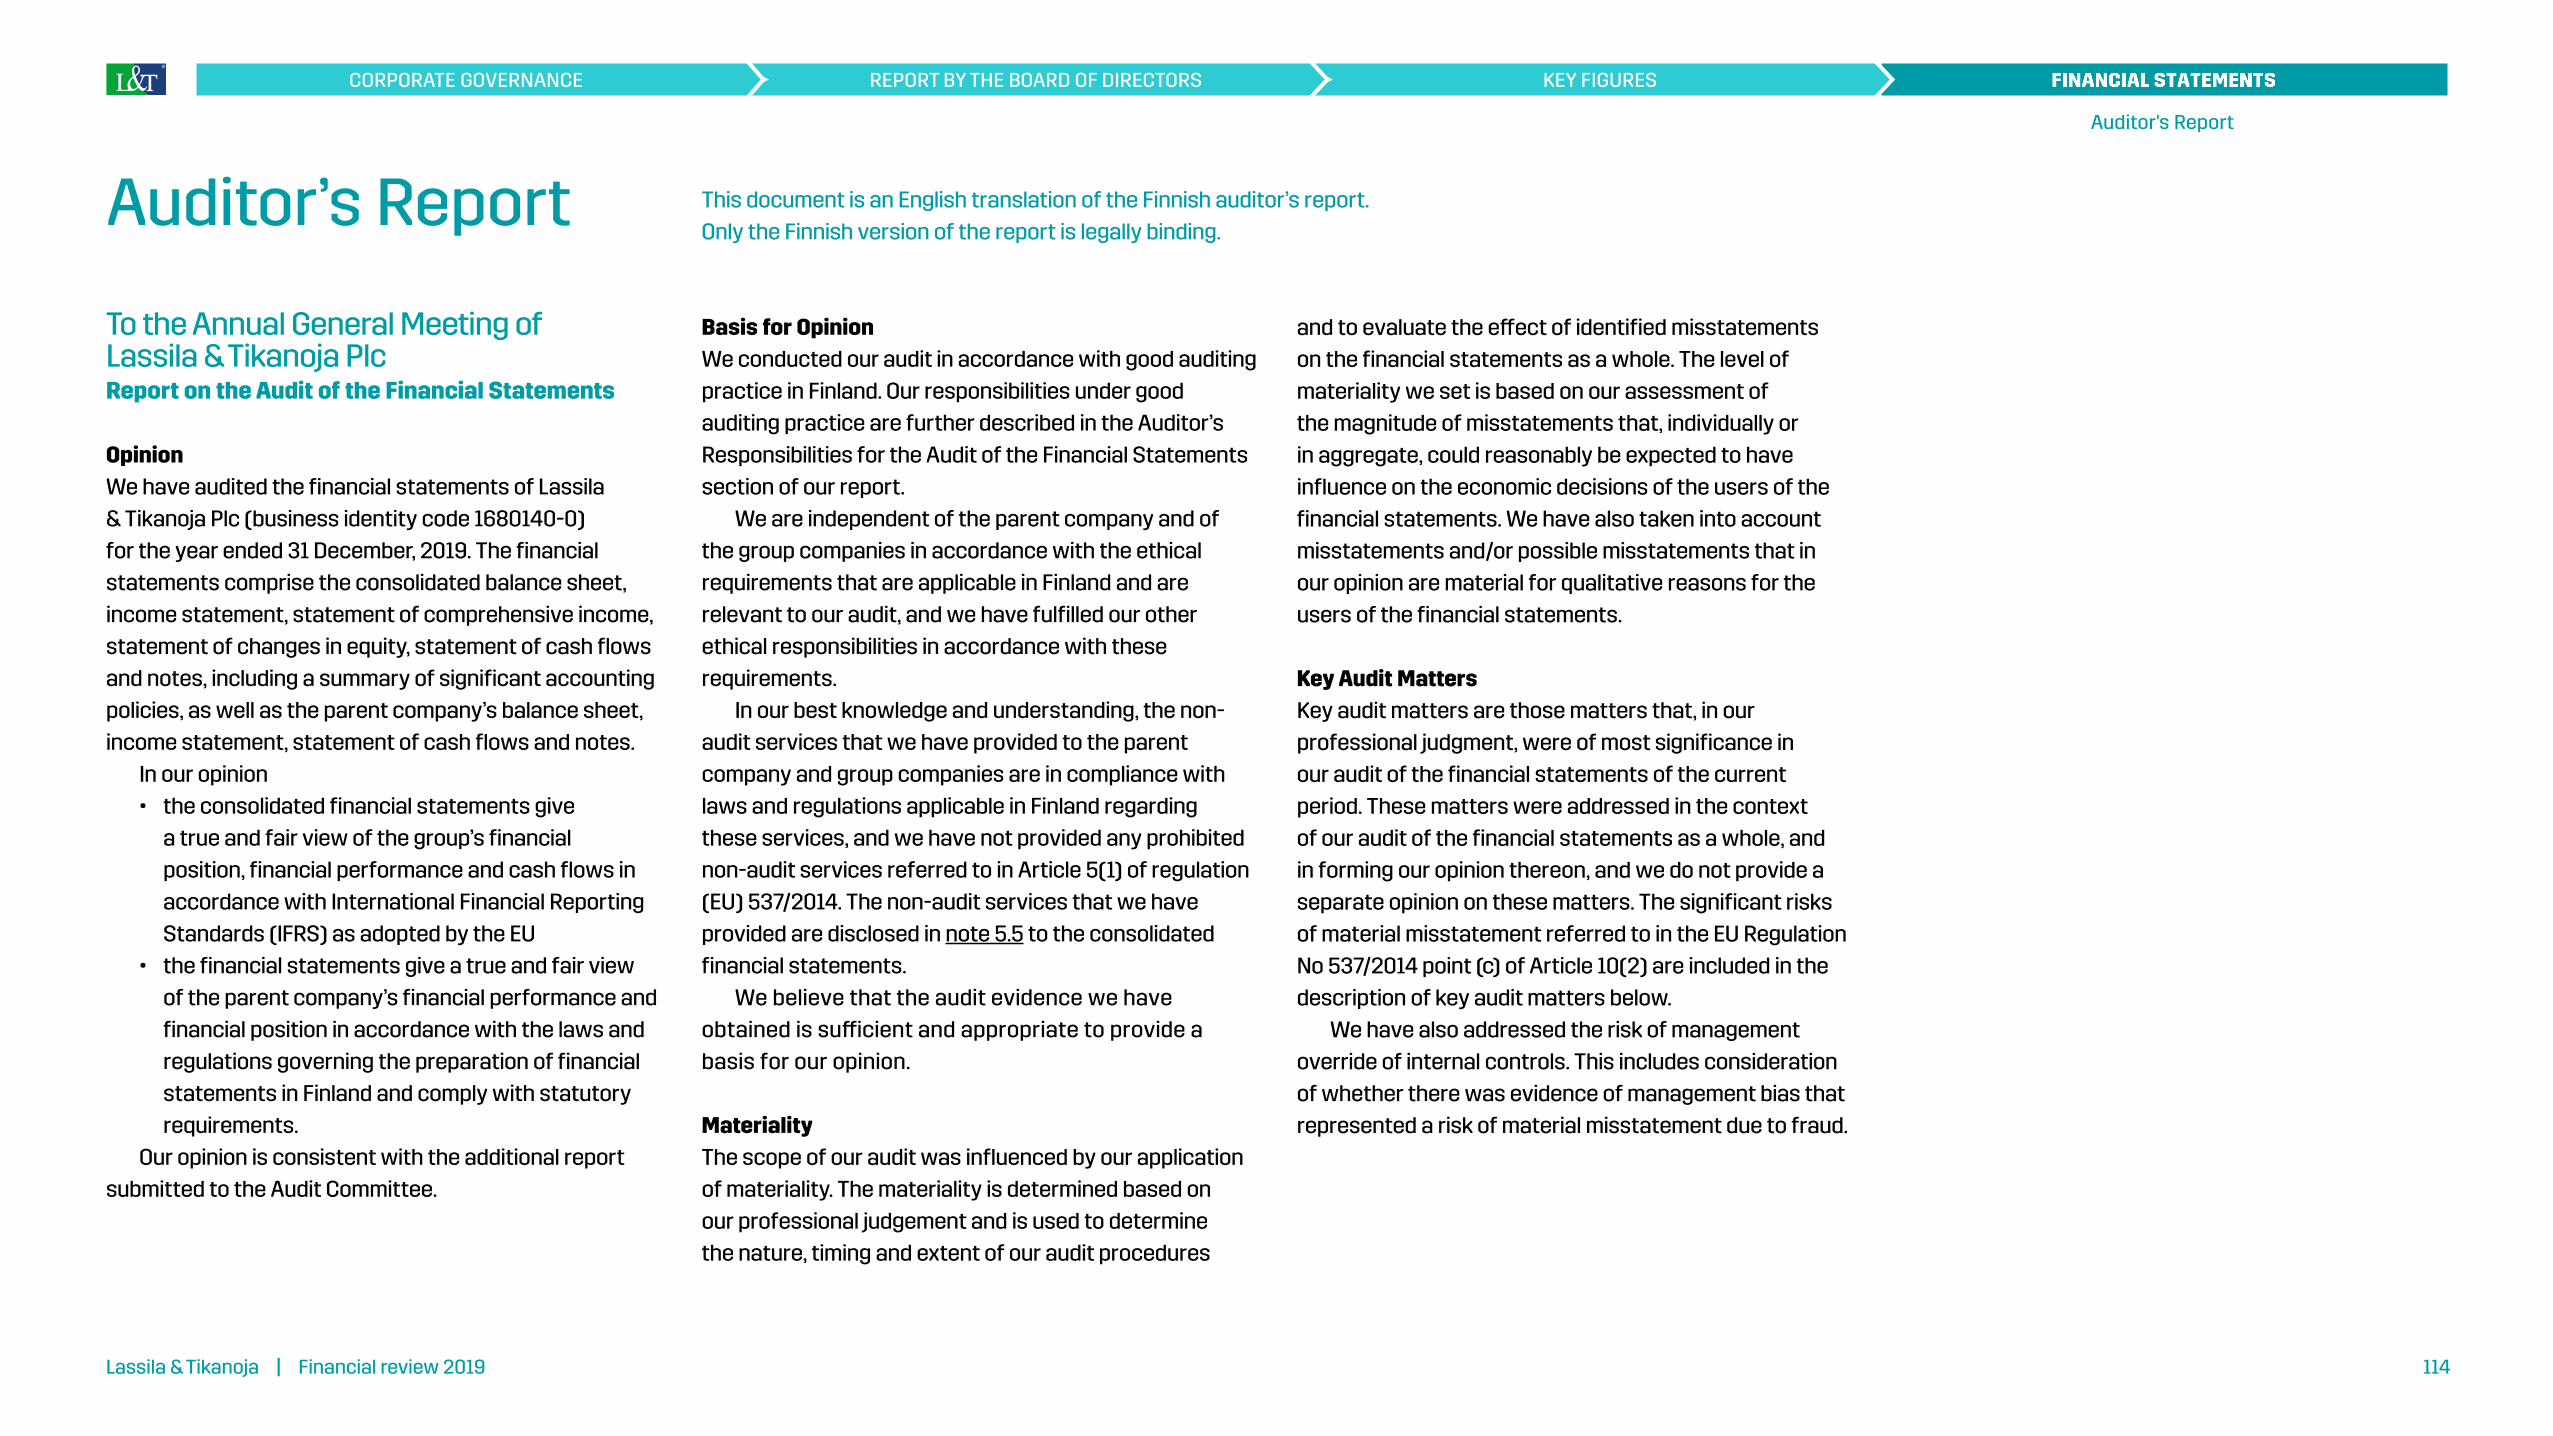
Auditor’s Report
To the Annual General Meeting of Lassila & Tikanoja PlcReport on the Audit of the Financial Statements
OpinionWe have audited the financial statements of Lassila & Tikanoja Plc (business identity code 1680140-0) for the year ended 31 December, 2019. The financial statements comprise the consolidated balance sheet, income statement, statement of comprehensive income, statement of changes in equity, statement of cash flows and notes, including a summary of significant accounting policies, as well as the parent company’s balance sheet, income statement, statement of cash flows and notes.
In our opinion• the consolidated financial statements give
a true and fair view of the group’s financial position, financial performance and cash flows in accordance with International Financial Reporting Standards (IFRS) as adopted by the EU
• the financial statements give a true and fair view of the parent company’s financial performance and financial position in accordance with the laws and regulations governing the preparation of financial statements in Finland and comply with statutory requirements.
Our opinion is consistent with the additional report submitted to the Audit Committee.
Basis for OpinionWe conducted our audit in accordance with good auditing practice in Finland. Our responsibilities under good auditing practice are further described in the Auditor’s Responsibilities for the Audit of the Financial Statements section of our report.
We are independent of the parent company and of the group companies in accordance with the ethical requirements that are applicable in Finland and are relevant to our audit, and we have fulfilled our other ethical responsibilities in accordance with these requirements.
In our best knowledge and understanding, the non-audit services that we have provided to the parent company and group companies are in compliance with laws and regulations applicable in Finland regarding these services, and we have not provided any prohibited non-audit services referred to in Article 5(1) of regulation (EU) 537/2014. The non-audit services that we have provided are disclosed in note 5.5 to the consolidated financial statements.
We believe that the audit evidence we have obtained is sufficient and appropriate to provide a basis for our opinion.
MaterialityThe scope of our audit was influenced by our application of materiality. The materiality is determined based on our professional judgement and is used to determine the nature, timing and extent of our audit procedures
and to evaluate the effect of identified misstatements on the financial statements as a whole. The level of materiality we set is based on our assessment of the magnitude of misstatements that, individually or in aggregate, could reasonably be expected to have influence on the economic decisions of the users of the financial statements. We have also taken into account misstatements and/or possible misstatements that in our opinion are material for qualitative reasons for the users of the financial statements.
Key Audit MattersKey audit matters are those matters that, in our professional judgment, were of most significance in our audit of the financial statements of the current period. These matters were addressed in the context of our audit of the financial statements as a whole, and in forming our opinion thereon, and we do not provide a separate opinion on these matters. The significant risks of material misstatement referred to in the EU Regulation No 537/2014 point (c) of Article 10(2) are included in the description of key audit matters below.
We have also addressed the risk of management override of internal controls. This includes consideration of whether there was evidence of management bias that represented a risk of material misstatement due to fraud.
This document is an English translation of the Finnish auditor’s report. Only the Finnish version of the report is legally binding.
Lassila & Tikanoja | Vuosikatsaus 2019 114Lassila & Tikanoja | Financial review 2019 114
KEY FIGURESREPORT BY THE BOARD OF DIRECTORSCORPORATE GOVERNANCE
Auditor's Report

THE KEY AUDIT MATTER HOW THE MATTER WAS ADDRESSED IN THE AUDIT
Impairment of goodwill and other acquisition-related intangible assets (Accounting policies and Notes 3.1 and 3.2 to the consolidated financial statements)
The Group expands its activities through acquisitions. As a result, the Group's assets include a significant amount of goodwill and other acquisition-related intangible assets. At the year-end 31.12.2019 the Group had €151.9 million in goodwill and €16.8 million in other acquisition-related intangible assets.
Goodwill and other intangible assets are tested for impairment annually.
Estimating future cash flows in impairment tests involves a significant amount of management judgment in respect of profitability, long-term growth rate and discount rates, among others.
Overall, due to the high level of management judgment involved, and the significant carrying amounts involved, impairment of goodwill and other acquisition-related intangible assets is considered one of the key areas of our audit.
Our audit procedures regarding impairment testing included, among others:
• We evaluated the key assumptions used in respect of profitability levels, discount rate and long-term growth rate.
• We involved KPMG valuation specialists when considering the appropriateness of the assumptions used by comparing to external market and industry data, and to test the technical accuracy of the calculations.
In addition, we considered the appropriateness of the related notes to the consolidated financial statements.
THE KEY AUDIT MATTER HOW THE MATTER WAS ADDRESSED IN THE AUDIT
Revenue recognition (Accounting policies and Notes 1.1 and 1.2 to the consolidated financial statements)
Revenue recognition is one of our focus areas for example due to following:
• Revenue consists of numerous individual service transactions generated in multiple business locations.
• Volumes of sales transactions processed in several IT systems are substantial. The Group also uses a number of service pricing models and client contract templates.
• The collection of basic data for invoicing purposes is based on various processes and IT systems, too.
• Partly due to the nature of business the user rights in the sales-related IT systems are relatively extensive.
Our audit procedures covered assessment of the sales-related internal control environment, as well as testing of the operating effectiveness of the associated key controls. We also carried out both analytical audit procedures and test of details.
Audit procedures included key person interviews in order to obtain an understanding of the whole process and to assess the appropriateness of the revenue recognition principles and practices applied.
We tested the functionality of the sales-related recording, recognition, invoicing and pricing processes and went through pricing and contract models. We also assessed the accuracy of the recognition of revenues on accrual basis.
In addition, we considered the appropriateness of the Group’s disclosures in respect of revenues.
Lassila & Tikanoja | Vuosikatsaus 2019 115Lassila & Tikanoja | Financial review 2019 115
KEY FIGURESREPORT BY THE BOARD OF DIRECTORSCORPORATE GOVERNANCE
Auditor's Report
THE KEY AUDIT MATTER HOW THE MATTER WAS ADDRESSED IN THE AUDIT
Accounting of employee benefits (Accounting policies and Notes 1.3 and 5.4 to the consolidated financial statements)
Accounting of employee benefits is one of our focus areas for example due to following:
• The Group operates in highly labour-intensive business and accordingly significant part of the Group’s operating expenses consists of employee-related costs.
• The collection of basic payroll data is carried out in numerous business locations using service line specific processes. Respectively, the number of individuals involved in the payroll process is high.
• Considering the above-mentioned circumstances, the importance of control environment is emphasized when ensuring the correctness of the Group’s financial reporting.
Our audit procedures covered assessment of the payroll internal control environment and testing the operating effectiveness of the related key controls.
In addition, we carried out both analytical and substantive audit procedures that included testing of individual payroll transactions, and comparing the cost accruals recognized at year-end to the confirmations obtained from external parties.
In addition, we considered the appropriateness of the Group’s disclosures in respect of employee benefits.
Responsibilities of the Board of Directors and the Managing Director for the Financial StatementsThe Board of Directors and the Managing Director are responsible for the preparation of consolidated financial statements that give a true and fair view in accordance with International Financial Reporting Standards (IFRS) as adopted by the EU, and of financial statements that give a true and fair view in accordance with the laws and regulations governing the preparation of financial statements in Finland and comply with statutory requirements. The Board of Directors and the Managing Director are also responsible for such internal control as they determine is necessary to enable the preparation of financial statements that are free from material misstatement, whether due to fraud or error.
In preparing the financial statements, the Board of Directors and the Managing Director are responsible for assessing the parent company’s and the group’s ability to continue as going concern, disclosing, as applicable, matters relating to going concern and using the going concern basis of accounting. The financial statements are prepared using the going concern basis of accounting unless there is an intention to liquidate the parent company or the group or cease operations, or there is no realistic alternative but to do so.
Auditor’s Responsibilities for the Audit of Financial StatementsOur objectives are to obtain reasonable assurance on whether the financial statements as a whole are free from material misstatement, whether due to
fraud or error, and to issue an auditor’s report that includes our opinion. Reasonable assurance is a high level of assurance, but is not a guarantee that an audit conducted in accordance with good auditing practice will always detect a material misstatement when it exists. Misstatements can arise from fraud or error and are considered material if, individually or in aggregate, they could reasonably be expected to influence the economic decisions of users taken on the basis of the financial statements.
As part of an audit in accordance with good auditing practice, we exercise professional judgment and maintain professional scepticism throughout the audit. We also:
• Identify and assess the risks of material misstatement of the financial statements, whether due to fraud or error, design and perform audit procedures responsive to those risks, and obtain audit evidence that is sufficient and appropriate to provide a basis for our opinion. The risk of not detecting a material misstatement resulting from fraud is higher than for one resulting from error, as fraud may involve collusion, forgery, intentional omissions, misrepresentations, or the override of internal control.
• Obtain an understanding of internal control relevant to the audit in order to design audit procedures that are appropriate in the circumstances, but not for the purpose of expressing an opinion on the effectiveness of the parent company’s or the group’s internal control.
Lassila & Tikanoja | Vuosikatsaus 2019 116Lassila & Tikanoja | Financial review 2019 116
KEY FIGURESREPORT BY THE BOARD OF DIRECTORSCORPORATE GOVERNANCE
Auditor's Report
• Evaluate the appropriateness of accounting policies used and the reasonableness of accounting estimates and related disclosures made by management.
• Conclude on the appropriateness of the Board of Directors’ and the Managing Director’s use of the going concern basis of accounting and based on the audit evidence obtained, whether a material uncertainty exists related to events or conditions that may cast significant doubt on the parent company’s or the group’s ability to continue as a going concern. If we conclude that a material uncertainty exists, we are required to draw attention in our auditor’s report to the related disclosures in the financial statements or, if such disclosures are inadequate, to modify our opinion. Our conclusions are based on the audit evidence obtained up to the date of our auditor’s report. However, future events or conditions may cause the parent company or the group to cease to continue as a going concern.
• Evaluate the overall presentation, structure and content of the financial statements, including the disclosures, and whether the financial statements represent the underlying transactions and events so that the financial statements give a true and fair view.
• Obtain sufficient appropriate audit evidence regarding the financial information of the entities or
business activities within the group to express an opinion on the consolidated financial statements. We are responsible for the direction, supervision and performance of the group audit. We remain solely responsible for our audit opinion.
We communicate with those charged with governance regarding, among other matters, the planned scope and timing of the audit and significant audit findings, including any significant deficiencies in internal control that we identify during our audit.
We also provide those charged with governance with a statement that we have complied with relevant ethical requirements regarding independence, and communicate with them all relationships and other matters that may reasonably be thought to bear on our independence, and where applicable, related safeguards.
From the matters communicated with those charged with governance, we determine those matters that were of most significance in the audit of the financial statements of the current period and are therefore the key audit matters. We describe these matters in our auditor’s report unless law or regulation precludes public disclosure about the matter or when, in extremely rare circumstances, we determine that a matter should not be communicated in our report because the adverse consequences of doing so would reasonably be expected to outweigh the public interest benefits of such communication.
Other Reporting RequirementsInformation on our audit engagementWe were first appointed as auditors by the Annual General Meeting on 15 March 2012, and our appointment represents a total period of uninterrupted engagement of 8 years.
Other InformationThe Board of Directors and the Managing Director are responsible for the other information. The other information comprises the report of the Board of Directors and the information included in the Annual Report, but does not include the financial statements and our auditor’s report thereon. We have obtained the report of the Board of Directors prior to the date of this auditor’s report, and the Annual Report is expected to be made available to us after that date. Our opinion on the financial statements does not cover the other information.
In connection with our audit of the financial statements, our responsibility is to read the other information identified above and, in doing so, consider whether the other information is materially inconsistent with the financial statements or our knowledge obtained in the audit, or otherwise appears to be materially misstated. With respect to the report of the Board of Directors, our responsibility also includes considering whether the report of the Board of Directors has been prepared in accordance with the applicable laws and regulations.
In our opinion, the information in the report of the Board of Directors is consistent with the information in the financial statements and the report of the Board of Directors has been prepared in accordance with the applicable laws and regulations.
If, based on the work we have performed on the other information that we obtained prior to the date of this auditor’s report, we conclude that there is a material misstatement of this other information, we are required to report that fact. We have nothing to report in this regard.
Other opinionsWe support that the financial statements should be adopted. The proposal by the Board of Directors regarding the use of the profit shown in the balance sheet is in compliance with the Limited Liability Companies Act. We support that the members of the Board of Directors of the parent company and the President and CEO should be discharged from liability for the financial period audited by us.
Helsinki 5 February 2020
KPMG OY AB
Leenakaisa WinbergPartner, Authorised Public Accountant, KHT
Lassila & Tikanoja | Vuosikatsaus 2019 117Lassila & Tikanoja | Financial review 2019 117
KEY FIGURESREPORT BY THE BOARD OF DIRECTORSCORPORATE GOVERNANCE
Auditor's Report

Lassila & Tikanoja Oyj
Valimotie 27, 00380 Helsinki puh. 010 636 111
www.lt.fi
EMPLOYED BY TOMORROW