Emplacement and Evolution of the Salt in Alaminos … · Emplacement and Evolution of ... authors...
25
1 Emplacement and Evolution of Salt in Alaminos Canyon Protraction Area, Gulf of Mexico. Carole Decalf 1 , Susan Lock-Williams 1 , Nathan Weber 1 , Mary Cubanski 1 , Charles Yough 1 , Mohamed Etemadi 1 , Lou Liro 2 1 Veritas DGC Inc., Veritas Exploration Services Division, 10300 Town Park Drive, Houston, Texas, 77072 2 Maxus Exploration Company, 1330 Lake Robbins Drive, The Woodlands, Texas, 77380 ACKNOWLEDGEMENT We would like to thank Veritas’ Houston Processing Center, especially Jerry Young and his processing team. The authors thank Veritas Marine Surveys for permission to publish this paper. We also thank Veritas DGC Inc. for reviewing this paper. ABSTRACT The Gulf of Mexico is one of the most prolific and challenging places in the world to explore for deepwater hydrocarbons. Success in deepwater exploration is contingent on knowledge of depositional systems as well as salt tectonic geology. Over the study area located in Alaminos Canyon, 3-D pre-stack depth imaging of seismic data provides definition of salt emplacement and evolution history. In this region, shallow allocthonous salt may be sourced directly from the Jurassic Louann layer. Emplacement of this salt occurred in a series of low angle and high angle surfaces toward the Sigsbee Escarpment. This basinward moving salt follows a salt nappe system evolution. The salt nappe progressively advances upsection and basinward over long distances from its feeders. The quality of the resulting depth migrated image allows description of prospect types in the sub-salt section. It also allows definition of the northeast termination of the Perdido fold belt and Sigsbee Escarpment in the study area.
Transcript of Emplacement and Evolution of the Salt in Alaminos … · Emplacement and Evolution of ... authors...

1
Emplacement and Evolution of Salt in Alaminos Canyon Protraction Area, Gulf of Mexico.
Carole Decalf 1, Susan Lock-Williams 1, Nathan Weber 1, Mary Cubanski 1, Charles Yough 1, Mohamed Etemadi 1,
Lou Liro 2
1 Veritas DGC Inc., Veritas Exploration Services Division, 10300 Town Park Drive, Houston, Texas, 77072
2 Maxus Exploration Company, 1330 Lake Robbins Drive, The Woodlands, Texas, 77380
ACKNOWLEDGEMENT
We would like to thank Veritas’ Houston Processing Center, especially Jerry Young and his processing team. The
authors thank Veritas Marine Surveys for permission to publish this paper. We also thank Veritas DGC Inc. for
reviewing this paper.
ABSTRACT
The Gulf of Mexico is one of the most prolific and challenging places in the world to explore for deepwater
hydrocarbons. Success in deepwater exploration is contingent on knowledge of depositional systems as well as salt
tectonic geology. Over the study area located in Alaminos Canyon, 3-D pre-stack depth imaging of seismic data
provides definition of salt emplacement and evolution history. In this region, shallow allocthonous salt may be
sourced directly from the Jurassic Louann layer. Emplacement of this salt occurred in a series of low angle and high
angle surfaces toward the Sigsbee Escarpment. This basinward moving salt follows a salt nappe system evolution.
The salt nappe progressively advances upsection and basinward over long distances from its feeders. The quality of
the resulting depth migrated image allows description of prospect types in the sub-salt section. It also allows
definition of the northeast termination of the Perdido fold belt and Sigsbee Escarpment in the study area.

2
INTRODUCTION
Salt interpretation is one of the most challenging aspects of petroleum exploration in the Gulf of Mexico.
The presence of salt fundamentally affects sub-salt trap geometry. Most sub-salt prospects in the Northern Gulf of
Mexico overlie an allochtonous or autochthonous salt source and are, at some depth, kinematically impacted by
underlying salt. To understand reservoir prospectivity, it is important to analyze the depositional setting and
correctly image sub-salt stratigraphy.
The Gulf of Mexico displays a wide variety of salt systems. Rowan et al. (1999) defined salt systems as
“genetically and kinematically linked groups of salt layers, diapirs, and welds with associated subsalt and suprasalt
strata”. There are two types of salt systems: autochthonous and allochthonous salt systems. Autochthonous salt
systems are characterized by salt rising up from the source layer to a higher layer. As they are not predominant in
this study area, they are not the focus of this paper. Allochthonous salt systems are characterized by transport of the
overburden strata as salt moves basinward (Rowan et al, 1999). Each allochthonous salt system has a distinct salt /
sediment evolution history and different structural styles such as salt tongue system, salt stock system and salt nappe
system (Rowan et al., 1999) (Figure 1).
The study area is located in the Alaminos Canyon Outer Continental Shelf (OCS) protraction area in the
contractional fold belt province as defined by Diegdel et al (1995). The study area represents the southeastern corner
of Alaminos Canyon (Figure 2). This area is influenced by the Perdido Fold Belt (PFB) which is a frontier area
between petroleum provinces located in northwestern deepwater Gulf of Mexico. Most of this fold belt is in
Mexican Waters, but nearly 3000 km2 of it lies within U.S. Waters (Fiduck et al, 1999). The PFB trends northeast -
southwest in the southern portion of Alaminos Canyon and is partially obscured by allocthonous salt. The salt-cored
detachment folds developed due to shortening above the autochthonous Louann salt layer (Trudgill, 1999; Liro,
2001), and were controlled by the underlying rifted-basement geometry. The fold belt occurs just landward of the
basinward pinch out of the allochtonous salt (Trudgill, 1999). The Perdido fold belt indicates the downdip limit of a
complex, linked system of gravitational spreading of the Paleogene passive margin (Trudgill, 1999; Rowan, 2001).
During the Tertiary and Quaternary, an intermittent but rapid sedimentary loading and progradation of shelf margins
allowed development of a variety of extensive salt masses on the outer shelf and on the slope of northern Gulf of
Mexico (Rowan et al., 1999; Liro, 2001). This sedimentation has been described as the genesis for distribution of
salt features.

3
Alaminos Canyon area provides an effective case study of both the value of the Pre-Stack Depth Migration
(PSDM) methodology and the model of the salt nappe-system. Within the study, the PSDM team applied a 3-D Pre-
Stack Depth methodology designed to address imaging below salt. This methodology is based on the integration of
seismic data processing and geologic interpretation for building the appropriate salt and sediment velocity model.
The correct velocity model enhances seismic imaging below salt and facilitates the understanding of salt
emplacement and evolution history. After defining the methodology used in this survey to image salt and sub-salt
reflectors, we summarize the salt structural style in southeastern Alaminos Canyon. The salt system in Alaminos
Canyon is an allochthonous salt system composed by salt nappes whose apparent movement is toward the Sigsbee
Escarpment. After describing these salt nappe systems, we explain its evolution through time. Finally, we look at the
possible play type localized in the study area.
METHODOLOGY
The PSDM methodology employed in this study involves joint effort between the interpretation and
processing teams. The Veritas Houston Processing Center (HPC) utilizes leading edge migration algorithms and data
conditioning techniques. HPC’s depth migration work flow in salt prone areas requires interpretation input of top
salt, base salt, and overhang top and base salt pairs in order to generate a complete velocity model containing
complex salt bodies. Complicated salt geometries require several migration iterations to fully image and model all
portions of the salt. The PSDM interpretation team utilizes all available data to define the three dimensional
complexities of the salt and supply HPC with a geologically reasonable salt model. The 48-fold seismic data used
for this study was acquired and processed by Veritas DGC in 2000. The study area processing included 212 input
blocks obtained from Veritas DGC, Inc. Marine Speculative Surveys.
Abrupt velocity contrasts between the salt and adjacent sediments – coupled with structural deformation
associated with salt tectonics – produce distortions in seismic ray paths. The understanding of subsalt prospectivity
may be adversely affected if the sub-salt strata are not well imaged. Therefore, building an accurate depth model is a
fundamental step in the sub-salt exploration process in deepwater Gulf of Mexico. This requires an understanding of
salt tectonics and quality interactions between the interpretation and processing teams.
The contribution of the PSDM interpretation team to the PSDM methodology involves the following steps:
- Water bottom interpretation (PSDM)

4
- Sediment flood below water bottom (HPC)
- Top salt (TOS) interpretation (PSDM)
- Salt flood below TOS (HPC)
- Base Salt (BOS) interpretation (PSDM)
- Iterate between TOS and BOS steps in areas of multiple salt layers (overhangs) (PSDM/ HPC)
- Full model with salt velocity in place where salt exists, sediment velocity in place around the salt
body and updates to the existing velocity field (HPC and PSDM)
Once the PSDM team has interpreted the water bottom on seismic, a sediment velocity field (also called
sediment flood) in depth is generated by HPC using Kirchhoff migration algorithm. This sediment flood allows the
top salt reflector to be imaged. The top salt reflector is picked and possible overhang top salt interpreted. HPC runs a
salt velocity (~4480m/s or ~14700 ft/s) field below all the top salt interpreted (regional and overhang top salt) in
order to image base salt reflector. The PSDM team then interprets base salt and defines full overhang model. At that
stage, a full velocity model is applied: Salt velocity is applied between the top and base salt and sediment velocity
field around the salt body (Figure 3). When the final model is migrated, distortions in the sediment package below
salt may be attributed to incorrect salt velocity in the velocity model or an incorrect salt model. In the case of pull up
effects (Figure 4.a), there is insufficient salt in the model. The base salt needs to be pushed deeper. When the
sediments show a push down effect (Figure 4.b), too much salt exists in the model and the base salt needs to be
shallower. It may be necessary to revise the base salt interpretation where sediments are distorted and re-run a
sediment flood beneath it. Several iterations may be required, however, a better-imaged base salt usually results
from following this methodology (Figure 4.c).
The accuracy of a PSDM model has direct implications on subsalt imaging and defining the presence and
geometry of potential prospects. A precise PSDM model is an integral part of the exploration process, however, it is
still subject to errors and uncertainties due to the complex nature of salt, imperfect migration routines and, at times,
inadequate seismic acquisition.
5
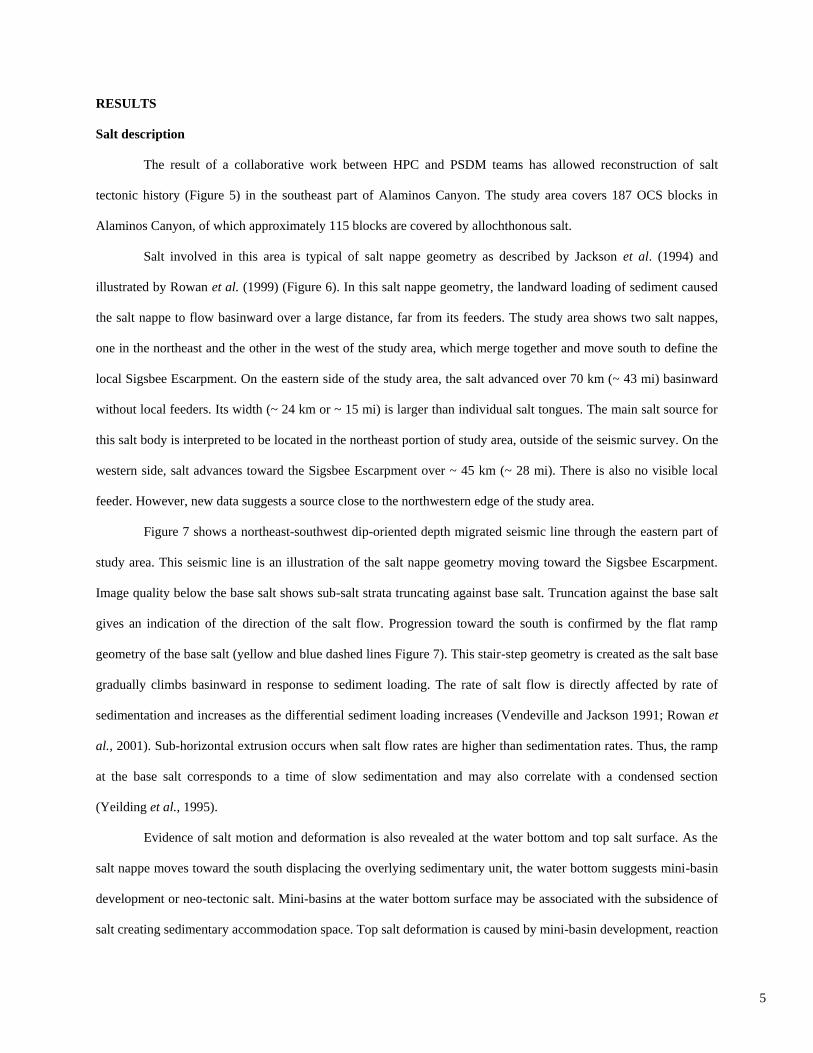
RESULTS
Salt description
The result of a collaborative work between HPC and PSDM teams has allowed reconstruction of salt
tectonic history (Figure 5) in the southeast part of Alaminos Canyon. The study area covers 187 OCS blocks in
Alaminos Canyon, of which approximately 115 blocks are covered by allochthonous salt.
Salt involved in this area is typical of salt nappe geometry as described by Jackson et al. (1994) and
illustrated by Rowan et al. (1999) (Figure 6). In this salt nappe geometry, the landward loading of sediment caused
the salt nappe to flow basinward over a large distance, far from its feeders. The study area shows two salt nappes,
one in the northeast and the other in the west of the study area, which merge together and move south to define the
local Sigsbee Escarpment. On the eastern side of the study area, the salt advanced over 70 km (~ 43 mi) basinward
without local feeders. Its width (~ 24 km or ~ 15 mi) is larger than individual salt tongues. The main salt source for
this salt body is interpreted to be located in the northeast portion of study area, outside of the seismic survey. On the
western side, salt advances toward the Sigsbee Escarpment over ~ 45 km (~ 28 mi). There is also no visible local
feeder. However, new data suggests a source close to the northwestern edge of the study area.
Figure 7 shows a northeast-southwest dip-oriented depth migrated seismic line through the eastern part of
study area. This seismic line is an illustration of the salt nappe geometry moving toward the Sigsbee Escarpment.
Image quality below the base salt shows sub-salt strata truncating against base salt. Truncation against the base salt
gives an indication of the direction of the salt flow. Progression toward the south is confirmed by the flat ramp
geometry of the base salt (yellow and blue dashed lines Figure 7). This stair-step geometry is created as the salt base
gradually climbs basinward in response to sediment loading. The rate of salt flow is directly affected by rate of
sedimentation and increases as the differential sediment loading increases (Vendeville and Jackson 1991; Rowan et
al., 2001). Sub-horizontal extrusion occurs when salt flow rates are higher than sedimentation rates. Thus, the ramp
at the base salt corresponds to a time of slow sedimentation and may also correlate with a condensed section
(Yeilding et al., 1995).
Evidence of salt motion and deformation is also revealed at the water bottom and top salt surface. As the
salt nappe moves toward the south displacing the overlying sedimentary unit, the water bottom suggests mini-basin
development or neo-tectonic salt. Mini-basins at the water bottom surface may be associated with the subsidence of
salt creating sedimentary accommodation space. Top salt deformation is caused by mini-basin development, reaction
6
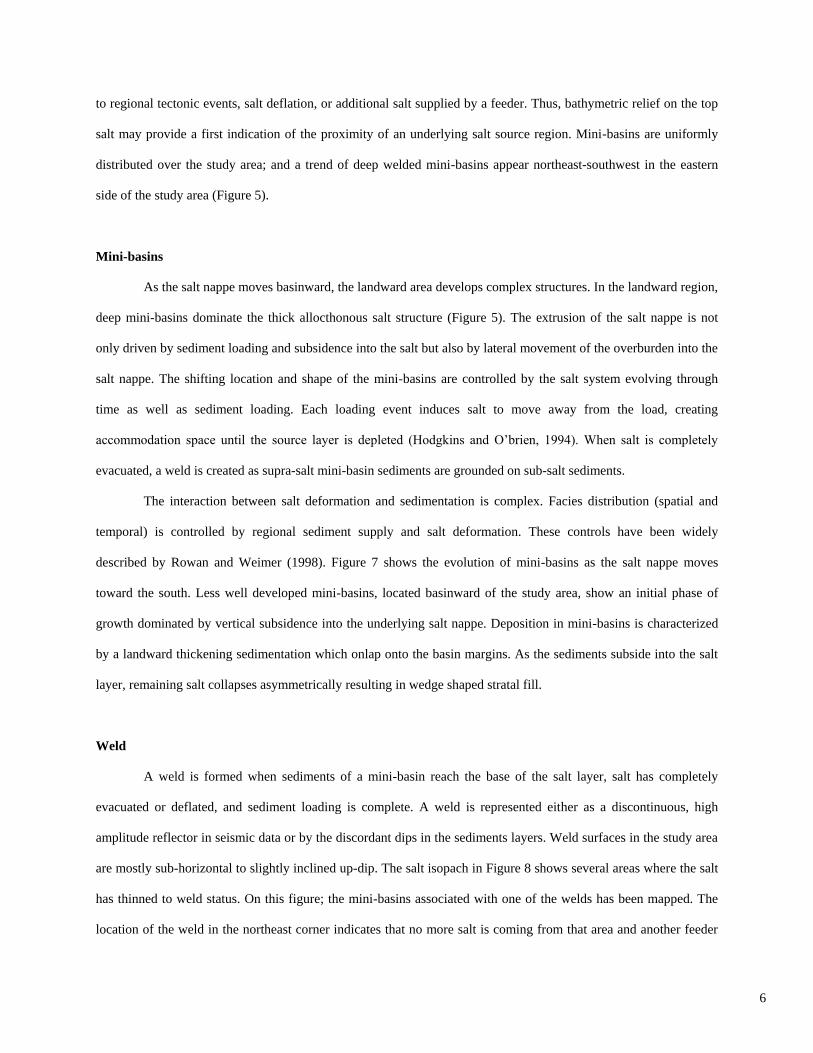
to regional tectonic events, salt deflation, or additional salt supplied by a feeder. Thus, bathymetric relief on the top
salt may provide a first indication of the proximity of an underlying salt source region. Mini-basins are uniformly
distributed over the study area; and a trend of deep welded mini-basins appear northeast-southwest in the eastern
side of the study area (Figure 5).
Mini-basins
As the salt nappe moves basinward, the landward area develops complex structures. In the landward region,
deep mini-basins dominate the thick allocthonous salt structure (Figure 5). The extrusion of the salt nappe is not
only driven by sediment loading and subsidence into the salt but also by lateral movement of the overburden into the
salt nappe. The shifting location and shape of the mini-basins are controlled by the salt system evolving through
time as well as sediment loading. Each loading event induces salt to move away from the load, creating
accommodation space until the source layer is depleted (Hodgkins and O’brien, 1994). When salt is completely
evacuated, a weld is created as supra-salt mini-basin sediments are grounded on sub-salt sediments.
The interaction between salt deformation and sedimentation is complex. Facies distribution (spatial and
temporal) is controlled by regional sediment supply and salt deformation. These controls have been widely
described by Rowan and Weimer (1998). Figure 7 shows the evolution of mini-basins as the salt nappe moves
toward the south. Less well developed mini-basins, located basinward of the study area, show an initial phase of
growth dominated by vertical subsidence into the underlying salt nappe. Deposition in mini-basins is characterized
by a landward thickening sedimentation which onlap onto the basin margins. As the sediments subside into the salt
layer, remaining salt collapses asymmetrically resulting in wedge shaped stratal fill.
Weld
A weld is formed when sediments of a mini-basin reach the base of the salt layer, salt has completely
evacuated or deflated, and sediment loading is complete. A weld is represented either as a discontinuous, high
amplitude reflector in seismic data or by the discordant dips in the sediments layers. Weld surfaces in the study area
are mostly sub-horizontal to slightly inclined up-dip. The salt isopach in Figure 8 shows several areas where the salt
has thinned to weld status. On this figure; the mini-basins associated with one of the welds has been mapped. The
location of the weld in the northeast corner indicates that no more salt is coming from that area and another feeder
7
should be located either in the northwest corner or on the west side of the study area (outside of the seismic data) in
order to provide salt as the salt nappe progresses toward the south.
DISCUSSION
Salt evolution
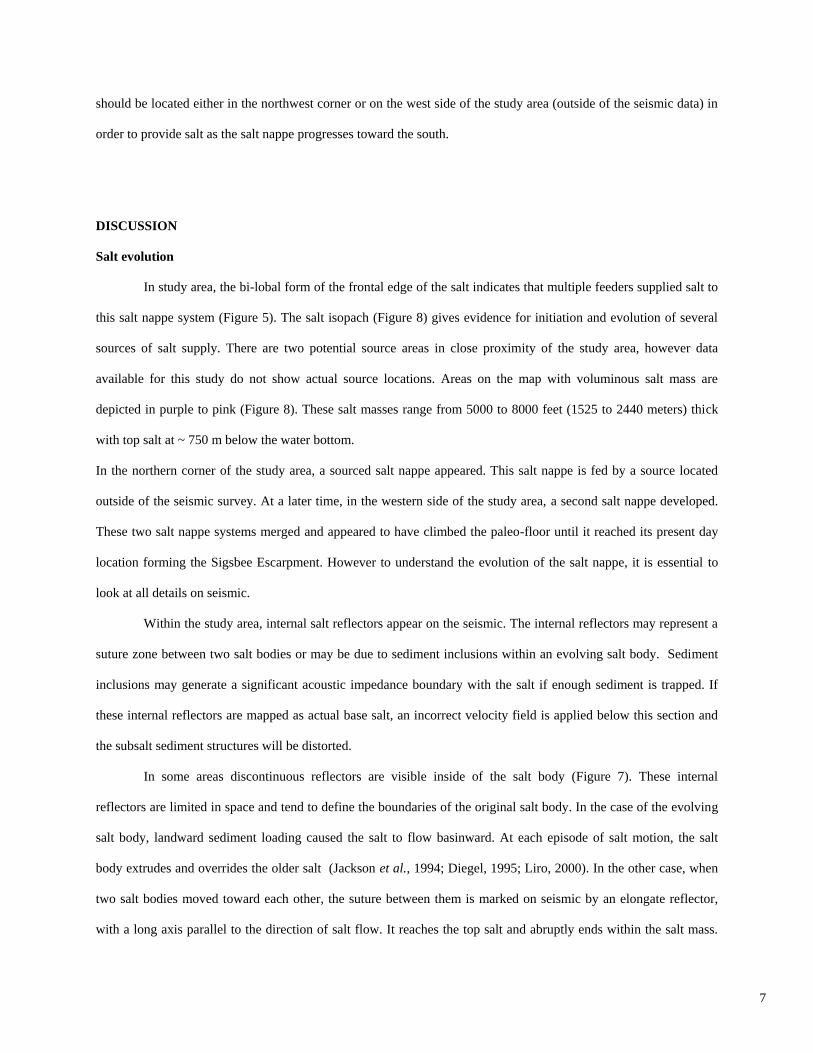
In study area, the bi-lobal form of the frontal edge of the salt indicates that multiple feeders supplied salt to
this salt nappe system (Figure 5). The salt isopach (Figure 8) gives evidence for initiation and evolution of several
sources of salt supply. There are two potential source areas in close proximity of the study area, however data
available for this study do not show actual source locations. Areas on the map with voluminous salt mass are
depicted in purple to pink (Figure 8). These salt masses range from 5000 to 8000 feet (1525 to 2440 meters) thick
with top salt at ~ 750 m below the water bottom.
In the northern corner of the study area, a sourced salt nappe appeared. This salt nappe is fed by a source located
outside of the seismic survey. At a later time, in the western side of the study area, a second salt nappe developed.
These two salt nappe systems merged and appeared to have climbed the paleo-floor until it reached its present day
location forming the Sigsbee Escarpment. However to understand the evolution of the salt nappe, it is essential to
look at all details on seismic.
Within the study area, internal salt reflectors appear on the seismic. The internal reflectors may represent a
suture zone between two salt bodies or may be due to sediment inclusions within an evolving salt body. Sediment
inclusions may generate a significant acoustic impedance boundary with the salt if enough sediment is trapped. If
these internal reflectors are mapped as actual base salt, an incorrect velocity field is applied below this section and
the subsalt sediment structures will be distorted.
In some areas discontinuous reflectors are visible inside of the salt body (Figure 7). These internal
reflectors are limited in space and tend to define the boundaries of the original salt body. In the case of the evolving
salt body, landward sediment loading caused the salt to flow basinward. At each episode of salt motion, the salt
body extrudes and overrides the older salt (Jackson et al., 1994; Diegel, 1995; Liro, 2000). In the other case, when
two salt bodies moved toward each other, the suture between them is marked on seismic by an elongate reflector,
with a long axis parallel to the direction of salt flow. It reaches the top salt and abruptly ends within the salt mass.

8
These intra-salt reflectors help with the reconstruction of the salt body evolution because locally, these reflectors
represent previous salt boundaries. Elongate internal reflectors have been mapped and the result defines the
boundaries of the two salt nappes. Looking at this suture (identified on Figure 7 as green dashed line), the salt
reaching the Sigsbee Escarpment came from two salt nappes: one coming from the north, the other one from the
west, merging and moving south.
Depth slices of the seismic volume (Figure 9) allow reconstruction of the origin and development of these
salt bodies. Away from Sigsbee Escarpment two small sources have been identified, and their extent mapped. A first
small salt body appeared on the northeast corner, immediately followed by salt coming from the northwest corner.
This northwestern salt nappe system developed as the northeastern salt nappe welded out. On seismic data, close to
the north edge of the area, there are slight downward bending events, which indicate that the source is located just
outside of the seismic survey. The two small salt bodies quickly merged and moved toward the south of the area. At
a later time, an additional salt nappe system developed on the west part of the area. This salt nappe merged with the
one coming from the north. This merger is marked on the seismic by an elongate internal reflector. As the combined
salt mass moved basinward, the basement and its paleo-canyons controlled its progression. The final salt body
moved south until it formed the Sigsbee Escarpment. The isopach map and depth slices were combined to evaluate
the history of the salt nappe (Figure 9).
Two base salt highs or “ridges” are evident on the base salt basemap (Figure 11) and on the depth slices
(Figure 9) at approximately 5000/5500m depth. They are located in a middle of the area and distant of about 27 km
(17 mi). The western ridge is located close to the suture area between two salt nappe systems. However, the merger
between the two salt bodies cannot explain this ridge (the suture does not coincide perfectly with the ridge). The
base salt high could derive from the Perdido Fold Belt fold just below it. On the western side of the study area, the
base salt seems to follow the Perdido Fold Belt trend (Figure 10). Generally the salt advances over a flat surface. Its
progression depends on the regional dip of the sea floor (only a few degrees), on the momentum of the salt and on
sedimentation rate. However, the eastern ridge seems associated with regional factors such as turbidity current
deposits that might have created a positive relief on the sea floor. The salt nappe arriving at that high started to
bypass it (Figure 9) and progressively built vertically until it flowed over it.

9
This study area can be divided into two salt nappe systems: (1) On the east, two salt nappe systems derived
from sources located outside of the study area. The combined salt nappe climbed the paleo-floor in a series of stair
and step ramps. This salt nappe system showed numerous deep welded basins. (2) On the west, a second salt nappe
system derived from a source located just outside of the seismic area. This salt nappe shows less mature structures
and appears to have developed at a later time than the Eastern one. The two salt nappes merged and formed the
present-day Sigsbee Escarpment (Figure 11).
Potential traps
In the study area, exploration plays are predominantly structural in nature and associated with the regional
allochthonous salt defining the Sigsbee Escarpment. Understanding the evolution of the salt nappe is critical to
developing an understanding of the petroleum system. Salt plays a major role in the control of distribution and
geometry of structural traps as well as stratigraphic traps. The present day salt geometry in the study area is
dominated by allochthonous salt and associated evacuation features such as salt welds and overhangs. Discussion of
the petroleum system of the northern Gulf of Mexico is beyond the scope of this paper however, improvement of
seismic quality using the PSDM methodology allows imaging of sub-salt reflectors and traps.
The deep salt-cored anticline shown in Figure 12 is a possible sub-salt structural trap. This salt-cored
anticline is located approximately at 20 km (~ 12, 5 miles) landward of the Sigsbee Escarpment. Another salt-related
trap type is the salt truncation trap (Figure 13). Salt truncation traps tend to be shallower and younger (Liro et al,
2001). Trapping formed during the salt deformation, when salt cuts across sediment (reservoir) that was deposited
around the original salt body. This trap shows a high exploration risk due to the timing of trap formation combined
with hydrocarbon migration. Thus, understanding the role of salt and its evolution is the key for successful
exploration in deep-water.
CONCLUSIONS
Different styles of allochthonous salt systems are not distributed randomly in the northern Gulf of Mexico.
Instead, there are larger areas that are dominated by roho, stepped counter-regional, salt canopies and salt nappe
systems. The regional pattern may be controlled by the original thickness and distribution of Louann salt, and its

10
subsequent evolution. The PSDM methodology applied in Veritas allows a good imaging of the salt and sub-salt
reflectors. The key to this good image is the interaction between the processing and the interpretation groups.
Additional iterations have been done in order to catch the complexities of the salt body (as in overhang areas and
complex suture zones). This has permitted the interpretation of the salt tectonics through the study area in Alaminos
Canyon. The top, base salt and the resulting salt body have been interpreted. The geologic evolution of the salt body
to the Sigsbee Escarpment has been defined. To the East, the salt system is dominated by salt nappe evacuated from
sources located north (and outside) of the area. This salt nappe shows mature structures landward. To the west, the
salt body consists of a younger salt nappe. The suture between the two zones is marked on seismic by elongate
internal reflectors. The location of the present day Sigsbee Escarpment is defined by the merged salt nappe. The
quality of the seismic imaging permits description of the exploration plays associated with and beneath the salt
nappe. The relative timing of salt deformation/evolution and subsequent remobilization is the key to a
comprehensive interpretation of the subsalt plays.
REFERENCES
Collings, E. L., R. J. Alexander, R. L. Phair, 2001. Regional mapping and maturity modeling for the Northern deep-
water Gulf of Mexico, GCSSEPM Foundation 21st Annual Research Conference Petroleum Systems of Deep-Water
Basins, p. 87-110.
Diegel, F. A., J. F. Karlo, D. C. Schuster, R. C. Shoup and P. R. Tauvers, 1995. Cenozoic structural evolution and
tectonostratigraphic framework of the northern Gulf Coast continental margin, in M. P. A. Jackson, D. G. Roberts
and S. Snelson, eds, Salt tectonics: a global perspective: AAPG Memoir 65, p. 109-147.
Fiduck, J. C., P. Weiner, B. D. Trudgill, M. G. Rowan, P. E. Gale, R. L. Phair, B. E. Korn, G. R. Roberts, W. T.
Gafford, R. S. Lowe and T. A. Queffelec, 1999. The Perdido fold belt, Northwestern deep Gulf of Mexico, Part 2:
Seismic stratigraphy and petroleum Systems, AAPG Bulletin, V. 83, No 4 (April 1999), p. 578-612.

11
Hodgkins, M.A., M. J. O’Brien, 1994. Salt sill deformation and its implications for subsalt exploration, Leading
Edge of exploration, v.13 (August 1994), p. 849-851.
Hudec, M. R., S.R. May, 1999. Control of sediment progradation on salt geometry and vice-versa, in the
northeasternParadox Basin, Utah: AAPG Annual Convention Official Program, p. A64
Jackson, M.P.A., B. C. Vendeville and D. D. Schultz-Ela, 1994. Structural dynamics of salt systems, Annual
Reviews of the Earth and Planetary Sciences, v. 22, p. 93-117.
Jackson, M.P.A., 1995. Retrospective in salt tectonics, in M. P. A. Jackson, D. G. Roberts and S. Snelson, eds, Salt
tectonics: a global perspective: AAPG Memoir 65, p. 1-28.
Liro, L., 2000. Walker Ridge phase 2 area 1 Prestack depth migration project: Base of salt interpretation,
unpublished, Veritas Exploration Services internal publication
Liro, L., N. Weber, S. O’Hara, M. Etemadi, S. Lock-Williams, M. Cubanski, M. Kadri, P. Montecchi, 2001. Subsalt
exploration trap styles, Walker ridge and Keatley Canyon areas Deep-water Gulf of Mexico, GCSSEPM Foundation
21st Annual Research Conference Petroleum Systems of Deep-Water Basins, p. 345-356.
Peel, F. J., C. J. Travis, J. R. Hossack, 1995. Genetic structural Provinces and salt tectonics of the Cenozoic
Offshore U.S Gulf of Mexico: A Preliminary analysis, in M. P. A. Jackson, D. G. Roberts and S. Snelson, eds, Salt
tectonics: a global perspective: AAPG Memoir 65, p. 153-175.
Rowan, M. G. and P. Weimer, 1998: salt-sediment interaction, Northern Green Canyon and Ewing Bank (offshore
Louisiana), Northern Gulf of Mexico1, , AAPG Bulletin, V. 82, No.5B (May1998, part B), p. 1055-1082.
Rowan, M. G., M. P. A., Jackson, B. D.Trudgill, 1999. Salt-related fault families and fault welds in the Northern
Gulf of Mexico, AAPG Bulletin, V. 83, No.9 (September 1999), p. 1454-1484.

12
Rowan M. G., B. C. Vendeville, F. J. Peel, 2001. The role of salt in gravitational failure of passive margins.
GCSSEPM Foundation 21st Annual Research Conference Petroleum Systems of Deep-Water Basins, p. 221-228
Trudgill B. D., M. G. Rowan, J. C. Fiduck, P. Weimer, P. E. Gale, B. E. Korn, R. L. Phair, W. T. Gafford, G. R.
Roberts and S. W. Dobbs, 1999. The Perdido fold belt, Northwestern deep Gulf of Mexico, Part 1: Structural
geometry, Evolution and regional implications, AAPG Bulletin, V.83, No.1 (January 1999), p. 88-113.
Vendeville B.C, and M.P.A. Jackson, 1991, Deposition, extension, and the shape of down building diapers (abs):
AAPG Bulletin, v.75, p.687-688.
Yeilding, C.A., C. J. Travis, E. J. Edstrand, D. M. Urban, M. T. May, and J. D. Boyd, 1995. Salt tectonics and
depositional architecture of the continental slope, northeasternGulf of Mexico: Proceedings volume of the gulf
GCSSEPM 16th Annual research conference: Salt, Sediment and Hydrocarbons, p. 307 - 308

Figure 2 - Map showing location of the study area in Alaminos Canyon, protraction area, Gulf of Mexico. The red outline box shows
the area of this three-dimensional study.
Study area

Figure 1 - Schematic cross section (not to scale) of the northern Gulf of Mexico showing allochthonous salt systems rooted in
autochthonous salt above rifted basement (Rowan et al., 1999). The section illustrates, from north to south, a stepped
counterregional system (A), a roho system (B), a salt-stock canopy (C), and a salt nappe (D). AAPG© 2003, “reprinted by
permission of the AAPG whose permission is required for further use”.
A B C D

Figure 3 - Salt velocity model utilizing top salt paired with base salt surface. A three dimensional salt body is defined (yellow)
and represented by salt velocity of 4480 m/s (14700 ft/s). Appropriate sediment velocity is represented by remaining color bar,
with water shown in purple along top of section.
N S
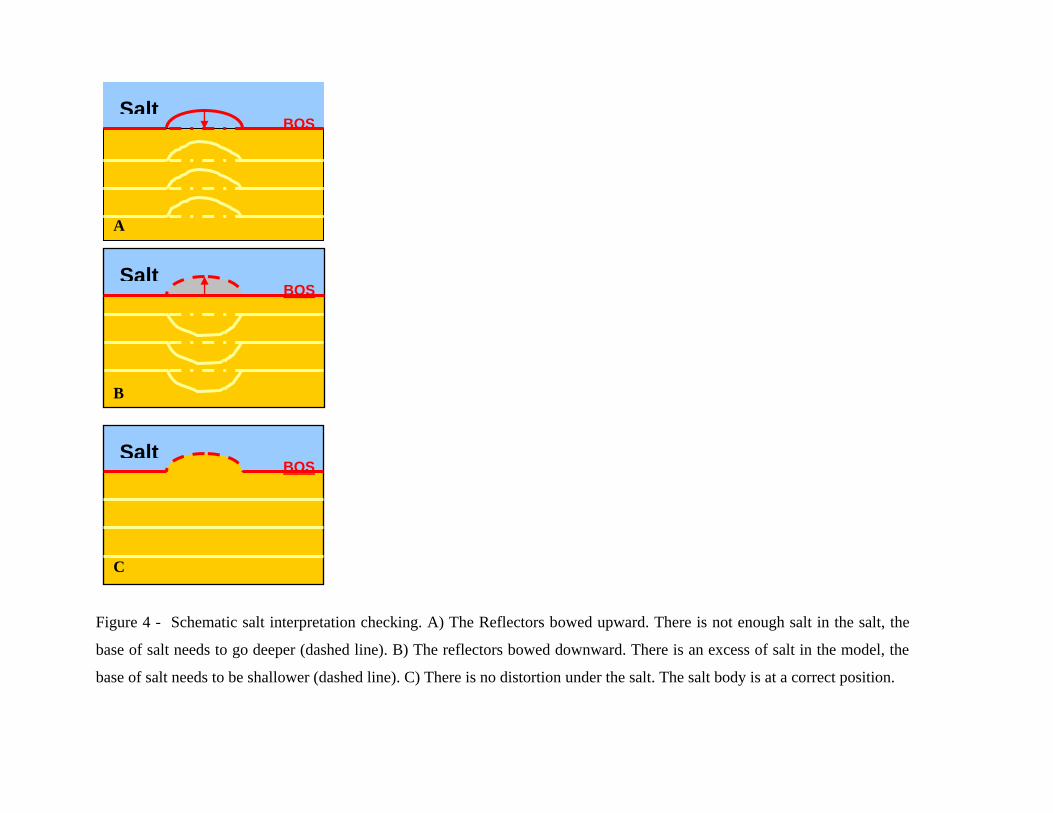
Figure 4 - Schematic salt interpretation checking. A) The Reflectors bowed upward. There is not enough salt in the salt, the
base of salt needs to go deeper (dashed line). B) The reflectors bowed downward. There is an excess of salt in the model, the
base of salt needs to be shallower (dashed line). C) There is no distortion under the salt. The salt body is at a correct position.
Salt BOS
Salt BOS
Salt BOS
A
C
B

Figure 5 - Top Salt basemap showing two frontal lobes at the Sigsbee Escarpment. Warm colors (yellow/ red) represent shallow top
salt; whereas cold colors (purple / blue) correspond to deepest top salt. The top salt basemap shows numerous mini-basins uniformly
distributed in the area. However, a trend of welded (noted W) mini-basins (black dashed line) runs northeast-southwest. Depth in
meters.

Figure 6 - Schematic block diagram showing typical assemblage of fault families in a salt nappe advancing over the abyssal
plain (Rowan et al., 1999). The basinward area shows an immature stage of evolution; the more landward area shows more
highly evolved structures. See also Figure 2. AAPG© 2003, “reprinted by permission of the AAPG whose permission is
required for further use”.

Figure 7 - Compressed seismic line through the entire eastern part of the study area. Salt nappe, moving towards the south, occurs in
an alternating series of low angle flats and high angle flats, related to episode of sedimentation rate and salt flow rate. Stair-stepped
base of salt is notified in blue and yellow lines correspond respectively to slow advance of salt (or rapid sedimentation), and to a time
without sedimentation. This seismic line shows evolution of the mini-basin through the area. From the deep welded mini-basin on the
landward side to the small mini-basin basinward. An example of high angle internal reflector representing the suture of the two salt
bodies merging together is shown highlighted in green dashed line. This elongate internal reflector gives also an indication of the
direction of the flow.
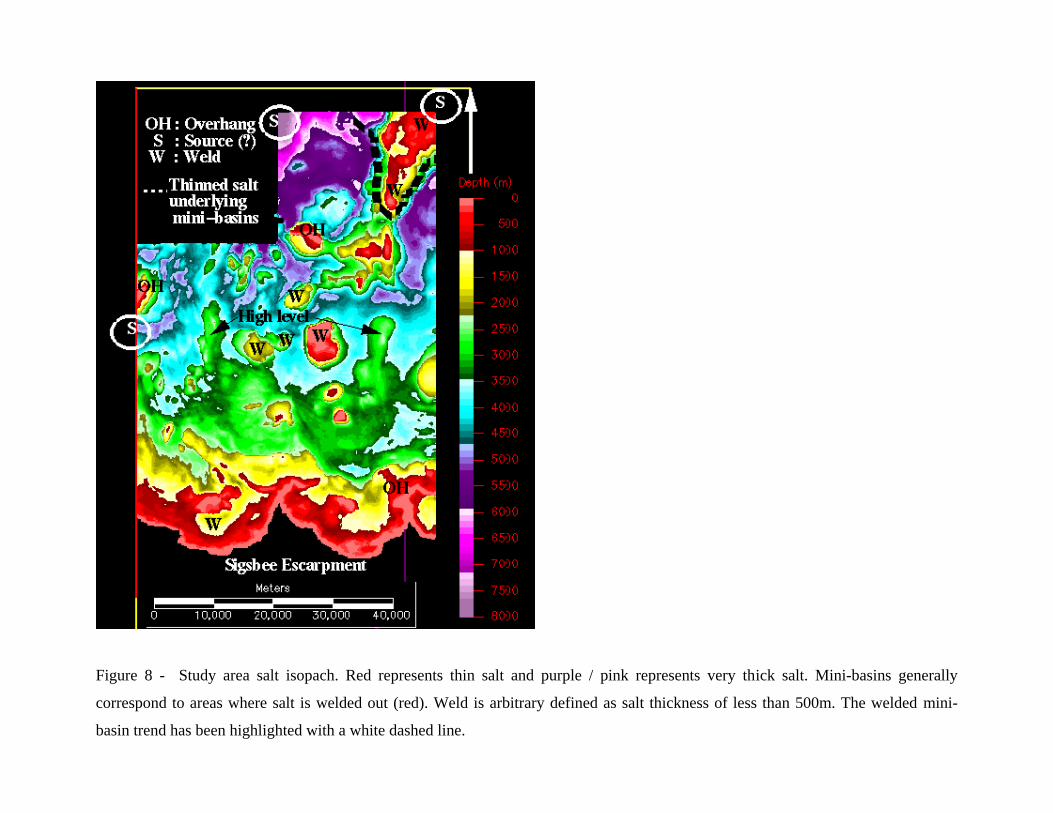
Figure 8 - Study area salt isopach. Red represents thin salt and purple / pink represents very thick salt. Mini-basins generally
correspond to areas where salt is welded out (red). Weld is arbitrary defined as salt thickness of less than 500m. The welded mini-
basin trend has been highlighted with a white dashed line.

Figure 9 - Depth slices at 7580m 6320m, 5580 m and 3390 m showing the progression of the salt thought the Sigsbee escarpment.
Blue shading indicates salt and yellow, the mini-basins. The green arrows show the direction of the salt motion. The probable feeders
(purple) are located at the outside of the study boundaries. The merger between the two salt bodies is well marked on seismic data.
The salt moved south until it reaches the Sigsbee Escarpment.

Figure 10 - The upper seismic line is a running through the two paleo-highs. A suture (green line) appears on the left side. Figure A)
represents a section of the upper seismic line. Noticed that the paleo-high curiously overrides a PFB fold. Some truncation and
sedimentation pattern have been mapped in purple. Figure B) is the cross section on the West area of the upper seismic line. It shows a
relief on the paleo floor.

Figure 11 - Base salt basemap showing the salt flow direction of each salt nappes. The suture between the two salt nappes is
highlighted with a dashed black line. The salt flow lines are represented by white dashed lines.

Figure 12 - Seismic line showing a salt cored event
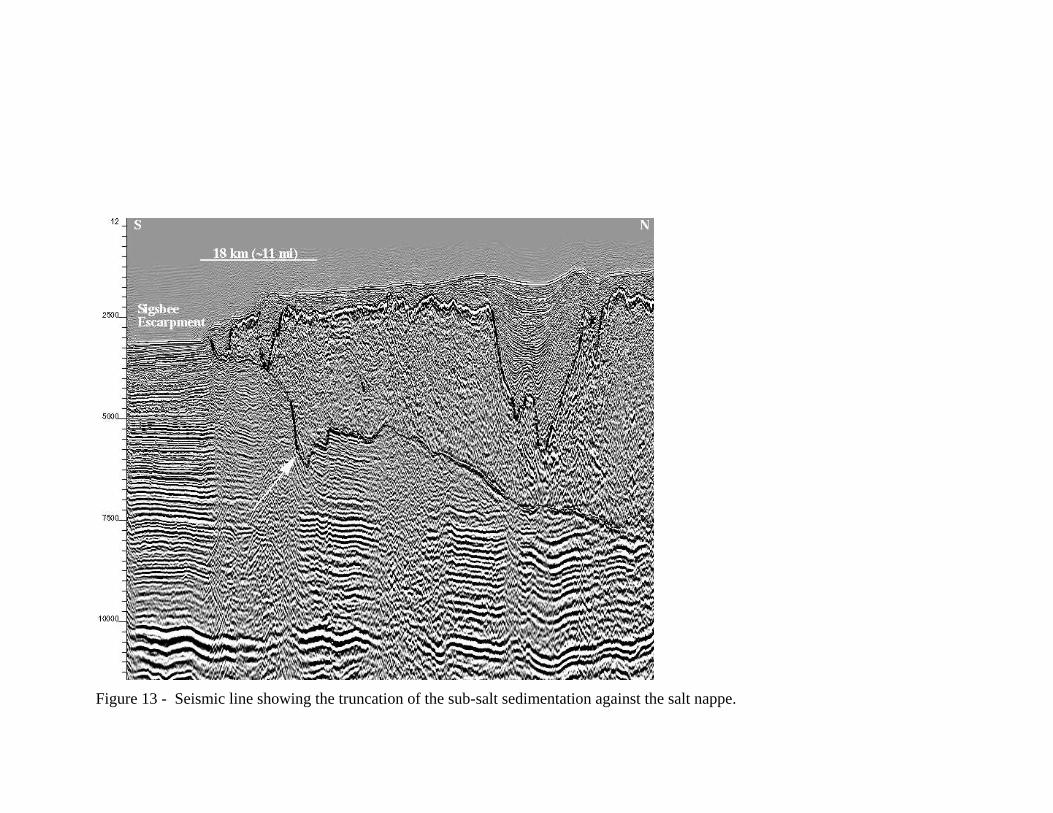
Figure 13 - Seismic line showing the truncation of the sub-salt sedimentation against the salt nappe.