Empirical Study on Shanghai Composite Index Forecast Based ...
4
Journal of World Economic Research 2017; 6(6): 71-74 http://www.sciencepublishinggroup.com/j/jwer doi: 10.11648/j.jwer.20170606.11 ISSN: 2328-773X (Print); ISSN: 2328-7748 (Online) Empirical Study on Shanghai Composite Index Forecast Based on ARIMA Model Wu Haijian, Li Qianqian * Department of Statistics, Beijing Wuzi University, Beijing, China Email address: * Corresponding author To cite this article: Wu Haijian, Li Qianqian. Empirical Study on Shanghai Composite Index Forecast Based on ARIMA Model. Journal of World Economic Research. Vol. 6, No. 6, 2017, pp. 71-74. doi: 10.11648/j.jwer.20170606.11 Received: November 7, 2017; Accepted: November 29, 2017; Published: January 2, 2018 Abstract: Time series analysis is an important research tool in the field of stock price prediction. It analyzes the historical data to find out its development rules and guide people's future decision-making. This paper selects the monthly average closing price of the Shanghai Composite Index from January 1991 to September 2017 as the research object. By using EViews 7.2 software, the stationary non-white noise sequence is obtained after the first-order difference of the non-stationary raw data, and then establishing the autoregressive integrated moving average (ARIMA) model to forecast the future trend of Shanghai Stock Index. Keywords: Shanghai Composite Index, ARIMA Model, Forecast, Time Series Analysis 1. Introduction 1.1. Research Background and Significance With the rapid development of China's economy in recent years, China's stock market has developed rapidly. The fluctuation trend of stock price has been widely concerned by government departments, entrepreneurs and investors. If the trend of stock prices can be forecasted, it will be not only help investors make reasonable decisions and get the maximum profit, but also enable the government to properly intervene and manage the stock market at the right time so as to promote China's economy sustainable and healthy development. Many scholars study the fluctuation of stock price. Among the various research methods they adopt, methods of time series analysis are most widely used. In the various methods of time series analysis, the autoregressive integrated moving average (ARIMA) model is the most fitted to forecast the future trend of stock prices. In view of such an upsurge of macroeconomic situation, it is very necessary to fit appropriate ARIMA model to accurately forecast the trend of stock prices so as to help investors make the best decisions. 1.2. Review of Research in Stock Price Forecasting Time series analysis can be traced back to 1927, and the British statistician G. U. Yule proposed an autoregressive model. Later, British mathematician G. T. Walker proposed and used the moving average (MA) model and the autoregressive moving average (ARMA) model. [1] The development of time series analysis so far, its theoretical method has been quite mature. Nowadays, time series analysis is widely applied in fields such as stock market, insurance, data mining, psychology and other fields. [2] Especially in the field of stock price forecasting, more and more scholars use the method of time series analysis to forecast stock price. Li Yujing and Cheng Zongmao (2011) selected the closing price of Zijin Mining and China Vanke A, from 2008 to 2011, a total of 672 data, as the research object. By using SPSS software and EViews software, they analyzed the data and fitted ARIMA model. The model achieved very good short-term forecasting effect. [3] Zhang Chao (2014) selected the Shanghai Composite Index as the research object. He analyzed its daily closing price from February 2 to March 12 2014, and established the autoregressive moving average-generalized autoregressive conditional heteroskedasticity (ARMA-GARCH) model based on error correction. Combined with regression model, the model fully extracted the effective information of the data and obtained good forecast values. [4] Dong Bolun and Xu Dongyu (2015) established respectively the ARIMA model for the representative shares
Transcript of Empirical Study on Shanghai Composite Index Forecast Based ...

Journal of World Economic Research 2017; 6(6): 71-74
http://www.sciencepublishinggroup.com/j/jwer
doi: 10.11648/j.jwer.20170606.11
ISSN: 2328-773X (Print); ISSN: 2328-7748 (Online)
Empirical Study on Shanghai Composite Index Forecast Based on ARIMA Model
Wu Haijian, Li Qianqian*
Department of Statistics, Beijing Wuzi University, Beijing, China
Email address:
*Corresponding author
To cite this article: Wu Haijian, Li Qianqian. Empirical Study on Shanghai Composite Index Forecast Based on ARIMA Model. Journal of World Economic
Research. Vol. 6, No. 6, 2017, pp. 71-74. doi: 10.11648/j.jwer.20170606.11
Received: November 7, 2017; Accepted: November 29, 2017; Published: January 2, 2018
Abstract: Time series analysis is an important research tool in the field of stock price prediction. It analyzes the historical data
to find out its development rules and guide people's future decision-making. This paper selects the monthly average closing price
of the Shanghai Composite Index from January 1991 to September 2017 as the research object. By using EViews 7.2 software,
the stationary non-white noise sequence is obtained after the first-order difference of the non-stationary raw data, and then
establishing the autoregressive integrated moving average (ARIMA) model to forecast the future trend of Shanghai Stock Index.
Keywords: Shanghai Composite Index, ARIMA Model, Forecast, Time Series Analysis
1. Introduction
1.1. Research Background and Significance
With the rapid development of China's economy in recent
years, China's stock market has developed rapidly. The
fluctuation trend of stock price has been widely concerned by
government departments, entrepreneurs and investors. If the
trend of stock prices can be forecasted, it will be not only help
investors make reasonable decisions and get the maximum
profit, but also enable the government to properly intervene
and manage the stock market at the right time so as to promote
China's economy sustainable and healthy development.
Many scholars study the fluctuation of stock price. Among
the various research methods they adopt, methods of time
series analysis are most widely used. In the various methods of
time series analysis, the autoregressive integrated moving
average (ARIMA) model is the most fitted to forecast the
future trend of stock prices. In view of such an upsurge of
macroeconomic situation, it is very necessary to fit
appropriate ARIMA model to accurately forecast the trend of
stock prices so as to help investors make the best decisions.
1.2. Review of Research in Stock Price Forecasting
Time series analysis can be traced back to 1927, and the
British statistician G. U. Yule proposed an autoregressive
model. Later, British mathematician G. T. Walker proposed
and used the moving average (MA) model and the
autoregressive moving average (ARMA) model. [1] The
development of time series analysis so far, its theoretical
method has been quite mature. Nowadays, time series analysis
is widely applied in fields such as stock market, insurance,
data mining, psychology and other fields. [2] Especially in the
field of stock price forecasting, more and more scholars use
the method of time series analysis to forecast stock price.
Li Yujing and Cheng Zongmao (2011) selected the closing
price of Zijin Mining and China Vanke A, from 2008 to 2011,
a total of 672 data, as the research object. By using SPSS
software and EViews software, they analyzed the data and
fitted ARIMA model. The model achieved very good
short-term forecasting effect. [3]
Zhang Chao (2014) selected the Shanghai Composite Index
as the research object. He analyzed its daily closing price from
February 2 to March 12 2014, and established the
autoregressive moving average-generalized autoregressive
conditional heteroskedasticity (ARMA-GARCH) model
based on error correction. Combined with regression model,
the model fully extracted the effective information of the data
and obtained good forecast values. [4]
Dong Bolun and Xu Dongyu (2015) established
respectively the ARIMA model for the representative shares

72 Wu Haijian and Li Qianqian: Empirical Study on Shanghai Composite Index Forecast Based on ARIMA Model
of Pear shares, Dunhuang Seed Industry and Guannong Stock,
and analyzed and forecasted their stock prices. The results
show that the short-term forecast effect of ARIMA model's
short-term forecast is very well. [5]
Gao Yuan (2015) chose the LETV stock as the research
object. She established the ARMA model after analyzing its
daily closing price of the last one year. The model well fitted
and forecasted the short-term trend of the stock price. [6]
Sun Xianqiang (2016) studied the Shanghai Composite
Index. He analyzed its closing price from December 10, 2004
to December 31, 2015, a total of 2687 data, and built ARIMA
model and Logistic regression model for the data. The two
models obtained good fitting and forecasting effect. [7]
Zhang Nan (2016) selected GuoDian Power as its research
object and analyzed its daily closing price from May 1, 2010
to May 1, 2015. The ARIMA model was used to model the
data, and the obtained model was used to predict the stock
price for a short time. The forecast effect was good. [8]
Wu Yuxia and Wen Xin (2016) selected HuaTai Securities
as the research object and analyzed the closing prices of
HuaTai Securities from March 24, 2014 to March 31, 2015, a
total of 250 data. The ARIMA model was established to
predict the law and trend of stock price changes. The empirical
results showed that ARIMA model had a good short-term
prediction effect. [9]
Ma Yanna and Zeng Jiying (2017) selected the Shanghai
Composite Index as the research object and analyzed its daily
closing prices from November 3, 2013 to November 18, 2016.
They established ARIMA model for the time series and used
the model to forecast the stock price for a short time. A good
prediction effect was achieved. [10]
Zhang Jie (2017) selected EJiao stock as the research object.
She built respectively the ARIMA model and the generalized
autoregressive conditional heteroskedasticity (GARCH) model
for the data after analyzing the daily closing price from January 5,
2015 to October 16, 2016. The two models were used to forecast
the stock price and the prediction errors were small. [11]
Although many scholars use the methods of time series
analysis to forecast the stock price, most of their research
objects are the daily closing price of stock price. As the daily
closing price is greatly affected by accidental factors, the
result of its forecast has great contingency. Due to the
limitations of the model itself, the longer the forecast period,
the worse the forecast result, the stock price can be forecasted
in just recent days. In order to get the future stock price
movements, it needs to constantly establish new models and
make latest forecasts to ensure the accuracy of the forecast. It
takes a lot of time and effort.
This paper chooses the monthly average closing price of the
Shanghai Composite Index as the research object. There are
three advantages for doing that. First, it can reduce the impact
of accidental factors in the daily closing price data. Second,
the forecast of model can provide a reference for investors'
investment in the next two months rather than just the next few
days. Third, the model can give investors a macro grasp about
the stock price movements of the entire stock market, rather
than some stock’s price in few days.
2. Data Preprocessing
This paper selects the Shanghai Composite Index published
by the official website of Shanghai Stock Exchange as the
research object and analyzes its monthly average closing price
from January 1, 1991 to September 30, 2017, a total of 321
data. The data is divided into two parts: 319 data from January
1991 to July 2017 are used to fit the model, and two data from
August to September 2017 are used to check the model’s
forecasted performance.
The data preprocessing in this paper includes two parts:
stationary checking and difference operation. Stationary
checking includes timing chart test, autocorrelation chart test
and unit root test.
2.1. Stationary Checking
As can be seen from Figure 1 and 2, the original data is
non-stationary and has an increasing time trend. It can be
judged that first-order difference can be taken for the raw data.
Figure 1. Raw data timing chart.
Figure 2. Raw data autocorrelation diagram.
Due to the subjectivity of the chart test, it needs to obtain
objective result by the unit root test. As shown in Figure 3, the
unit root test shows that the value of test statistic is greater
than the critical value at the significance level of 0.05 and the
p-value is bigger than 0.05. So the conclusion that the original
data is non-stationary can be obtained.
0
1,000
2,000
3,000
4,000
5,000
6,000
92 94 96 98 00 02 04 06 08 10 12 14 16

Journal of World Economic Research 2017; 6(6): 71-74 73
Figure 3. Unit root test of raw data.
2.2. Difference Operation
According to Figure 4 and 5, a preliminary judgment can be
obtained that the series is stationary after the first-order
difference.
Figure 4. Timing chart of first-order difference series.
Figure 5. Autocorrelation of first-order difference series.
Figure 6 shows that the test statistic value is far less than the
critical value when the significance level is 0.05, and the
p-value is less than 0.05. Therefore, the same conclusion can
be obtained that the first-order difference sequence is
stationary. In addition, according to Figure 5, the value of
Q-statistics of delayed 6th, 12th and 18th periods are very
large, and their p-values are far less than 0.05. That means that
the first-order difference sequence is non-white noise
sequence and the sequence can be further analyzed.
Figure 6. Unit root test of first-order difference series.
3. Model Fitting and Forecasting
Model fitting and forecasting include three parts: model
identification, model checking and model forecasting.
3.1. Model Identification
Figure 5 shows that the autocorrelation and partial
autocorrelation coefficients of first-order difference series are
trailing. After a lot of careful analysis of various fitting models,
the relative optimal model ( ) ( )( )13,7,4,3,1,1,6,5,4,3,1ARIMA
is obtained based on the AIC criteria and the SBC criteria.
Under the principle of Least Squares Estimation, the estimated
parameters of the model are obtained, as shown in Figure 7.
Figure 7. Estimated parameters of the model.
3.2. Model Checking
Figure 8 shows that the p-values of lag orders of the
residuals are bigger than 0.05, which proves that the residual
sequence is a white noise sequence and the model fully
extracts the valid information in the sequence.
Figure 8. Autocorrelation of residual series.
3.3. Model Forecasting
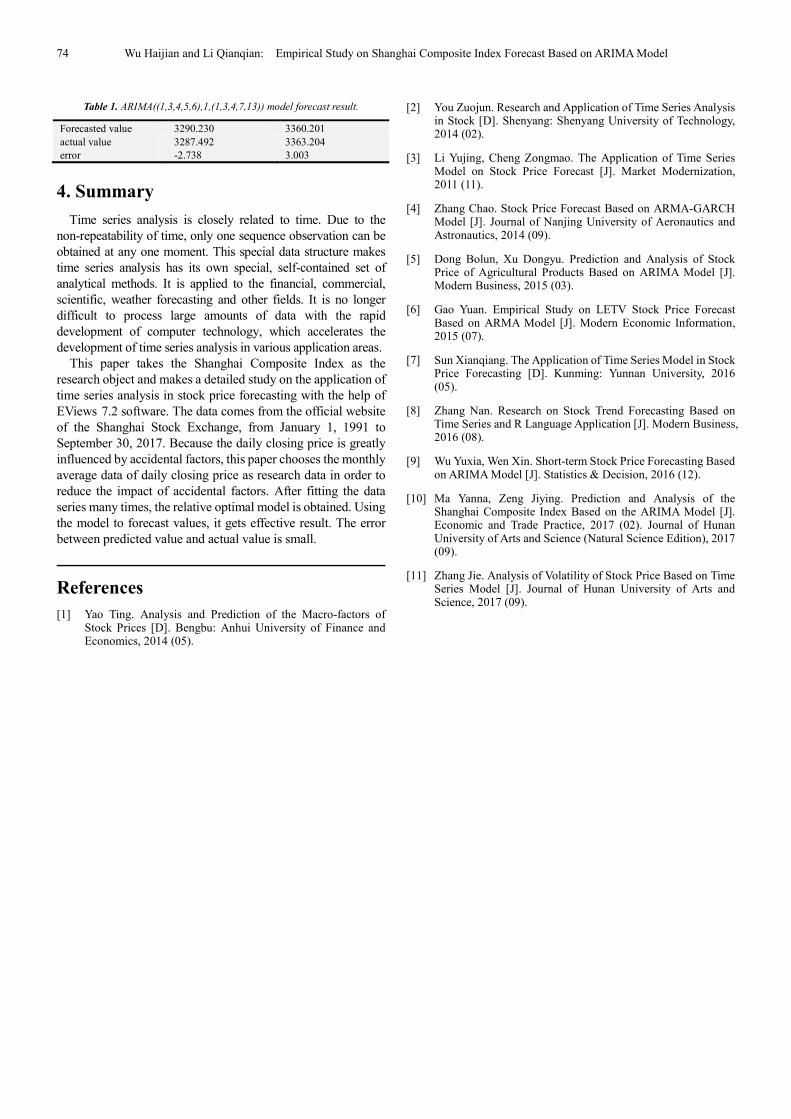
Table 1 shows that the forecast errors of the model are small,
which indicates that the forecast is effective. The one-stage
forecast error is -2.738, and the two-stage 3.003.
-1,000
-750
-500
-250
0
250
500
750
1,000
92 94 96 98 00 02 04 06 08 10 12 14 16
74 Wu Haijian and Li Qianqian: Empirical Study on Shanghai Composite Index Forecast Based on ARIMA Model
Table 1. ARIMA((1,3,4,5,6),1,(1,3,4,7,13)) model forecast result.
Forecasted value 3290.230 3360.201
actual value 3287.492 3363.204
error -2.738 3.003
4. Summary
Time series analysis is closely related to time. Due to the
non-repeatability of time, only one sequence observation can be
obtained at any one moment. This special data structure makes
time series analysis has its own special, self-contained set of
analytical methods. It is applied to the financial, commercial,
scientific, weather forecasting and other fields. It is no longer
difficult to process large amounts of data with the rapid
development of computer technology, which accelerates the
development of time series analysis in various application areas.
This paper takes the Shanghai Composite Index as the
research object and makes a detailed study on the application of
time series analysis in stock price forecasting with the help of
EViews 7.2 software. The data comes from the official website
of the Shanghai Stock Exchange, from January 1, 1991 to
September 30, 2017. Because the daily closing price is greatly
influenced by accidental factors, this paper chooses the monthly
average data of daily closing price as research data in order to
reduce the impact of accidental factors. After fitting the data
series many times, the relative optimal model is obtained. Using
the model to forecast values, it gets effective result. The error
between predicted value and actual value is small.
References
[1] Yao Ting. Analysis and Prediction of the Macro-factors of Stock Prices [D]. Bengbu: Anhui University of Finance and Economics, 2014 (05).
[2] You Zuojun. Research and Application of Time Series Analysis in Stock [D]. Shenyang: Shenyang University of Technology, 2014 (02).
[3] Li Yujing, Cheng Zongmao. The Application of Time Series Model on Stock Price Forecast [J]. Market Modernization, 2011 (11).
[4] Zhang Chao. Stock Price Forecast Based on ARMA-GARCH Model [J]. Journal of Nanjing University of Aeronautics and Astronautics, 2014 (09).
[5] Dong Bolun, Xu Dongyu. Prediction and Analysis of Stock Price of Agricultural Products Based on ARIMA Model [J]. Modern Business, 2015 (03).
[6] Gao Yuan. Empirical Study on LETV Stock Price Forecast Based on ARMA Model [J]. Modern Economic Information, 2015 (07).
[7] Sun Xianqiang. The Application of Time Series Model in Stock Price Forecasting [D]. Kunming: Yunnan University, 2016 (05).
[8] Zhang Nan. Research on Stock Trend Forecasting Based on Time Series and R Language Application [J]. Modern Business, 2016 (08).
[9] Wu Yuxia, Wen Xin. Short-term Stock Price Forecasting Based on ARIMA Model [J]. Statistics & Decision, 2016 (12).
[10] Ma Yanna, Zeng Jiying. Prediction and Analysis of the Shanghai Composite Index Based on the ARIMA Model [J]. Economic and Trade Practice, 2017 (02). Journal of Hunan University of Arts and Science (Natural Science Edition), 2017 (09).
[11] Zhang Jie. Analysis of Volatility of Stock Price Based on Time Series Model [J]. Journal of Hunan University of Arts and Science, 2017 (09).

![Brennan, Niamh [2000] An Empirical Examination of Forecast Disclosure by Bidding Companies, Accounting and Business Research, 30(3): 175-194.](https://static.fdocuments.in/doc/165x107/577ce4911a28abf1038e9ced/brennan-niamh-2000-an-empirical-examination-of-forecast-disclosure-by-bidding.jpg)


![Brennan, Niamh [2000] An Empirical Examination of Forecast Disclosure by Bidding Companies, Accounting and Business Research 30 (3): 175-194.](https://static.fdocuments.in/doc/165x107/5474bb9bb4af9fbe0a8b58f6/brennan-niamh-2000-an-empirical-examination-of-forecast-disclosure-by-bidding-companies-accounting-and-business-research-30-3-175-194.jpg)