
Empirical Essays on Business Cycle Analysis and Financial ...

EMPIRICAL ESSAYS ON PERFORMANCE OF
MANAGEMENT BUYOUTS
By
Lokman Tutuncu
A thesis submitted to
The University of Birmingham
for the degree of
Doctor of Philosophy
Department of Finance
Birmingham Business School
University of Birmingham
September 2014

University of Birmingham Research Archive
e-theses repository This unpublished thesis/dissertation is copyright of the author and/or third parties. The intellectual property rights of the author or third parties in respect of this work are as defined by The Copyright Designs and Patents Act 1988 or as modified by any successor legislation. Any use made of information contained in this thesis/dissertation must be in accordance with that legislation and must be properly acknowledged. Further distribution or reproduction in any format is prohibited without the permission of the copyright holder.

ABSTRACT
This thesis investigates value creation in MBO transactions and the effect of earnings
management on the perceived performance improvements following buyout. Various samples
of buyouts are used to examine earnings management and performance, however, especial
attention is given to private-to-private MBOs. We find that MBOs and private equity sponsors
generate little additional value after controlling for selection bias. MBO performance peaks in
the year preceding MBO, a result that could indicate practice of earnings management before
MBO transactions. Further analysis of accounting numbers reveals that managers of private
firms inflate earnings prior to MBO. The earnings management practice and resulting accrual
reversals have substantial impact on the subsequent performance. We also show that earnings
management is mainly practiced by private non-family firms while family firms do not
engage in earnings management prior to MBO transaction. The presence of a private equity
investor in the team tends to constrain practice of earnings management in MBOs, while
private equity investors tend to inflate earnings at the time of exit. Overall, the results suggest
that value gains or losses subsequent to buyout do not fully reflect operational activities.
Selective investment strategies of private equity funds and earnings management influence
performance. Key to understanding performance is the distinct managerial and ownership
motivations for undertaking an MBO that vary across different types of buyouts.

ACKNOWLEDGEMENTS
I am indebted to my supervisor Ranko Jelic for his continuous support and guidance during
this journey. This research would not come into existence without his excellent mentoring. I
thank my family and my parents Recep and Fevziye Tutuncu for including me in their daily
prayers. They have been my number one motivation in this research. I also thank Wasim
Ahmad and Dan Zhou for many useful discussions. I acknowledge financial support from
Ministry of Education, Turkey. Finally I express my gratitude to friends and people I cannot
mention by name for being with me in this journey.

Abbreviations
AGRO: Asset Growth
CEO: Chief Executive Officer
CMBOR: Centre for Management Buyout Research
DA: Discretionary Accruals
DTA: Discretionary Total Accruals
EBIT: Earnings Before Interest and Tax
EBITG: Operating Income Growth
EMPG: Employment Growth
EU: European Union
GAAP: Generally Accepted Accounting Principles
GLS: Generalised Least Squares
IndA: Industry Adjusted
IPO: Initial Public Offering
IROA: Industry Adjusted Return on Assets
IRR: Internal Rate of Return
K-S: Kolmogorov-Smirnov
LBO: Leveraged Buyout
LEV: Leverage
MBI: Management Buyin
MBO: Management Buyout
MW: Mann-Whitney
NDA: Non-discretionary Accruals
OLS: Ordinary Least Squares
PBA: Pre-Buyout Adjusted
PDA: Performance Adjusted Discretionary Total Accruals
PE: Private Equity
PPE: Property, Plant and Equipment
PSM: Propensity Score Matching
PTP: Public-to-private
R&D: Research and Development
REV: Revenues

ROA: Return on Assets
ROS: Return on Sales
RSS: Residual Sum of Squares
SALEFF: Sales Efficiency
SALEMP: Employee Efficiency
SBO: Secondary Buyout
SEO: Seasoned Equity Offering
SGRO: Sales Growth
SIC: Standard Industrial Classification
SMBO: Secondary Management Buyout
SMBI: Secondary Management Buyin
TA: Total Accruals
TAC: Total Accruals
TIMEX: Time to Exit
TOB: Thomson One Banker
UFO: Ultimate Family Owner
UK: United Kingdom
US: United States
VC: Venture Capital
WCA: Working Capital Accruals

Table of Contents
List of Tables vii
CHAPTER 1: INTRODUCTION 1
CHAPTER 2: LITERATURE REVIEW 6
2.1 Introduction 6
2.2 Motivations of Management Buyouts and Sources of Value Gains 8
2.2.1 Incentive Realignment Hypothesis 9
2.2.2 Control Hypothesis 10
2.2.3 Free Cash Flow Hypothesis 10
2.2.4 Tax Shield Hypothesis 11
2.2.5 Wealth Transfer Hypothesis 12
2.2.6 Undervaluation Hypothesis 13
2.2.7 Heterogeneity Hypothesis 14
2.2.8 Transaction Costs Hypothesis 15
2.2.9 Family Succession Hypothesis 15
2.3 Accounting Manipulation Hypothesis 16
2.4 Empirical Research on Buyout Performance 18
2.5 Buyout Survival and Exits from Buyout Organisational Form 20
2.5.1 Longevity of Buyouts 20
2.5.2 Exit Choice 22
2.5.3 Reverse LBOs 24
2.5.4 Secondary Buyouts 27
2.6 The Role of Private Equity and Venture Capital 30
2.6.1 Private Equity Firms as Active Investors 31
2.6.2 Private Equity Reputation and Venture Capital Certification 32
2.7 Conclusion 35
CHAPTER 3: THE PERFORMANCE OF MANAGEMENT BUYOUTS IN THE LAST
DECADE 40
3.1 Introduction 40
3.2 Literature and Hypothesis Development 45
3.2.1 Sources of Buyouts 45
3.2.2 Hypotheses on Sources of Buyouts 47
3.2.3 Hypotheses on the Role of Private Equity in Buyouts 48

3.3 Data and Methodology 50
3.3.1 Data and Sample 50
3.3.2 Selection and Survivorship Bias 52
3.3.3 Methodology 55
3.4 Empirical Results 57
3.4.1 Descriptive Statistics 57
3.4.2 Performance of Management Buyouts 60
3.4.3 Differences-in-Differences 65
3.4.4 Discussion of Results 67
3.4.5 Determinants of Performance 70
3.5 Conclusion 74
CHAPTER 4: EARNINGS MANAGEMENT AND MBO PERFORMANCE 97
4.1 Introduction 97
4.2 Literature and Hypothesis Development 101
4.2.1 Earnings Management in Buyouts 101
4.2.2 Earnings Management in Private-to-private Buyouts 103
4.2.3 Private Equity Backing 106
4.3 Data and Methodology 108
4.3.1 Sample Selection 108
4.3.2 Data Issues and Attrition Rate 110
4.3.3 Measuring Accruals 111
4.3.4 Model Selection 113
4.3.5 Control Firms 114
4.4 Tests of Earnings Management 116
4.4.1 Cross-sectional Tests 116
4.4.2 Pooled Time Series Tests 122
4.4.3 Private Equity Backed MBOs 124
4.4.4 Additional Accruals Tests 125
4.5 Earnings Management and MBO Performance 128
4.5.1 Performance Sample Industry Distribution 129
4.5.2 Net Income Performance of MBOs 130
4.5.3 Regression of Post-Buyout Performance and Discretionary Accruals 134
4.6 Discussion of Results 137
4.7 Conclusion and Further Research 139

CHAPTER 5: EARNINGS MANAGEMENT, SOURCES OF MANAGEMENT BUYOUTS
AND SECONDARY MBO EXITS 163
5.1 Introduction 163
5.2 Agency Conflicts and Earnings Management in Management Buyouts 165
5.2.1 Public-to-private MBOs 165
5.2.2 Private-to-private MBOs: Family vs. Non-Family Firms 166
5.2.3 Management Buy-ins 170
5.2.4 Divisional Buyouts 171
5.2.5 Secondary MBOs 171
5.2.6 Private Equity Sponsors 173
5.3 Data and Methodology 174
5.3.1 Data Sources and Sample Construction 174
5.3.2 Definition of Family Firm 175
5.3.3 Sample Descriptive Statistics 177
5.3.4 Measurement of Earnings Management 179
5.4 Results 181
5.5 Robustness Checks 185
5.6 Conclusion 186
CHAPTER 6: CONCLUSION 200
6.1 Summary Results of Empirical Chapters 201
6.1.1 Performance of Management Buyouts in the Last Decade 201
6.1.2 Earnings Management and MBO Performance 202
6.1.3 Earnings Management, Sources of Management Buyouts and Secondary MBO Exits 203
6.2 Managerial Implications 205
6.3 Further Research 206
REFERENCES 208

List of Tables
Table 2-1: Performance of Buyouts ...................................................................................................... 37
Table 2-2: Earnings Management in Management Buyouts ................................................................. 39
Table 3-1: Sample Selection ................................................................................................................. 76
Table 3-2: Variable definitions ............................................................................................................. 77
Table 3-3: Sample selection and distribution of deals across years ...................................................... 78
Table 3-4: Exit routes across private equity backing and sources of buyout ........................................ 79
Table 3-5: Distribution of MBOs by industry, private equity backing and exit routes ......................... 80
Table 3-6: Performance of Management Buyouts ................................................................................ 81
Table 3-7: Performance of PE-Backed Buyouts ................................................................................... 83
Table 3-8: PE-Backed vs. non-PE-Backed MBOs ................................................................................ 85
Table 3-9: Performance of Full MBOs ................................................................................................. 86
Table 3-10: Full MBOs vs. Divestment MBOs ..................................................................................... 88
Table 3-11: Performance of exited MBOs ............................................................................................ 89
Table 3-12: Exited vs. non-exited MBOs .............................................................................................. 91
Table 3-13: Differences in differences: full sample .............................................................................. 92
Table 3-14: Differences in differences: performance of PE-backed MBOs ......................................... 93
Table 3-15: Determinants of PE-backing .............................................................................................. 94
Table 3-16: Determinants of post-buyout performance ........................................................................ 95
Table 4-1: Distribution of deals across years and value ...................................................................... 142
Table 4-2: Variable definitions ........................................................................................................... 143
Table 4-3: Descriptive statistics for changes in Total Accruals, Sales and Earnings .......................... 144
Table 4-4: Two-digit industry/year portfolios and number of matched MBOs .................................. 145
Table 4-5: Descriptive statistics for MBOs and matched portfolios ................................................... 147
Table 4-6: Parameters of cross-sectional estimation ........................................................................... 148
Table 4-7: Prediction errors from cross-sectional estimation in year -1 and -2 .................................. 149
Table 4-8: Prediction errors from performance adjusted estimation in year -1 and -2 ....................... 150
Table 4-9: Prediction errors from cross-sectional WCA estimation ................................................... 151
Table 4-10: Prediction errors from time-series estimation .................................................................. 152
Table 4-11: Changes in Accruals, Sales and Earnings in PE-backed MBOs ...................................... 153
Table 4-12: Tests of prediction errors by private equity status ........................................................... 154
Table 4-13: Additional accruals tests .................................................................................................. 155
Table 4-14: Propensity Score Matched Discretionary Accruals ......................................................... 156
Table 4-15: Industry distribution of management buyouts- Performance sample .............................. 157
Table 4-16: Operating performance around management buyouts ..................................................... 158

Table 4-17: Performance by direction and magnitude of earnings management ................................ 159
Table 4-18: Spearman rank order correlations of discretionary accruals ............................................ 160
Table 4-19: Regression of post-buyout performance on discretionary accruals ................................. 161
Table 4-20: Economic impact of discretionary accruals ..................................................................... 162
Table 5-1: Sample time distribution .................................................................................................... 188
Table 5-2: Abnormal accruals: Private-to-private MBO sample ........................................................ 189
Table 5-3: Abnormal accruals: Family MBO sample ......................................................................... 190
Table 5-4: Abnormal accruals: non-family MBO sample ................................................................... 191
Table 5-5: Abnormal accruals: non-family MBOs: Dispersed ownership sample .............................. 192
Table 5-6: Abnormal accruals of non-family MBO: Single owner sample ........................................ 193
Table 5-7: Abnormal accruals: Public-to-private MBO sample.......................................................... 194
Table 5-8: Abnormal accruals: Management buy-in sample .............................................................. 195
Table 5-9: Abnormal accruals: Divisional MBO sample .................................................................... 196
Table 5-10: Abnormal accruals: SMBO sample ................................................................................. 197
Table 5-11: Abnormal accruals by private equity backing ................................................................. 198
Table 5-12: Tests with additional family MBO samples .................................................................... 199

1
CHAPTER 1: INTRODUCTION
Central to the justification of increasing management buyout (MBO) activity is the potential
to create additional value. The emergence of a vibrant MBO environment in 1980s led to the
discussion of public company as a viable organisational governance form. Jensen (1986) and
others argued that public companies are plagued by conflicts of interest between managers
and shareholders, which can be eliminated or at least mitigated by going private through
MBO transactions. MBO form of private ownership would offer benefits that cannot be
provided by simply delisting and going private without MBO. In fact, privately held firms are
also often acquired by their management in MBO deals. Therefore, the literature suggests
that, MBO is a superior form of organisation (Jensen, 1989). One implication of this argument
is that elimination of agency problems and improving managerial focus on profitable strategic
operations would translate into better performance.
The extensive literature on MBO performance suggests that MBOs offer at least partial
improvements to company governance. The research often recognises that incentive
realignment resulting from removal of moral hazard and improved monitoring is vital to the
value creation. Less often recognised is, however, that a strategic event like MBO can present
its own moral hazard problems that might influence performance. The bidding wars between
incumbent management team and private equity sponsors in the mega buyout of RJR Nabisco,
which was eventually sold for a 45% higher price per share than the original price offered by
managers, set the most well-known example of moral hazard problems existing in MBOs. In
a similar vein, managers may have opportunistic incentives to manage earnings prior to MBO
transaction. If managers engage in earnings management, the subsequent performance is
likely to be affected due to accruals reversals. The impact of accrual reversals on performance
2
is documented in the IPO and SEO literature (Rangan, 1998; Teoh et al., 1998b). As far as
buyouts are concerned, Perry and Williams (1994) and others show presence of earnings
management practice in PTP buyouts, however, they do not examine the effects associated
with performance. This study examines MBO performance, earnings management and the
relationship between the two. With the exception of few recent studies (e.g., Meuleman et al.,
2009; Jelic and Wright, 2011; Boucly et al., 2011), the focus of buyout research remains
fixated at public-to-private MBOs which represent a small portion of the buyout market
(Stromberg, 2008). There is also a need to distinguish between public and private forms of
ownership in their motivations to undertake buyout since different motivations impose
distinct firm prospective. This study recognises that buyouts are comprised of both public and
private firms as well as various forms of ownership structures. The main subjects of interest in
this thesis are, therefore, MBOs of privately held firms.
This thesis is motivated by the paucity of research on private-to-private buyouts. This
research questions the ability of private-to-private MBOs to create operational value and
examines their non-operational practices in doing so. Of particular concern is the
sustainability and generalisability of the so-called buyout superiority. This research examines
performance and earnings management practices of buyouts as well as managerial
motivations for earnings management in private firms across various ownership and buyout
types to find an answer.
An overview of the literature is presented in Chapter 2. Especial emphasis is given to the
sources of operating gains and value creation mechanisms in buyouts. The realisation of
buyout investment and the roles of PE sponsors in facilitating value creation are also briefly
addressed. The chapter concludes by identifying potential areas of further research.

3
The first empirical study presented in Chapter 3 examines operating performance of 412 UK
MBOs completed between 2000 and 2009. The sample consists of private-to-private and
divisional buyouts. Results indicate that performance improvements are mostly limited to the
first three years following transaction. MBO profitability remains better than industry from
two years before buyout to fifth buyout year. MBO profits peak in the year preceding
transaction. MBOs backed by private equity (PE) sponsors consistently have higher profits
and growth than non-backed MBOs. Buyouts and PE firms, however, generate little or no
additional value following transaction. Rather, they appear to capitalise on the good firm
prospects. Therefore, the higher profitability of PE-backed MBOs might be the result of a
selective investment strategy by PE firms. However, earnings management practices may also
be partly responsible for the performance peak before MBO. The research must, therefore,
distinguish between the two explanations.
Chapter 4 examines earnings management prior to MBOs and the subsequent performance.
Existing research indicates practice of earnings understatement prior to public-to-private
MBOs (e.g., Perry and Williams, 1994) and that upwards earnings management may
negatively influence the subsequent financial performance (e.g., Teoh et al., 1998b; Jo and
Kim, 2007). Therefore, we test whether post-buyout performance can be explained by
earnings management carried out before MBO. The study comprises 291 private-to-private
MBOs. We are not aware of any buyout study that examined the earnings management in
privately held firms and the relationship between earnings management and performance. In
the UK, one recent study (Mao and Renneboog, 2013) investigating earnings management in
public-to-private MBOs emerged in the course of writing the thesis. The results contradict
prior research on public-to-private MBOs. Privately held firms engage in upwards earnings
management one year before MBO. We speculate that private firms have different agency

4
problems from public firms and managers are consequently expected to behave differently.
We find, however, that earnings management is significantly and negatively associated with
performance changes in the next three years following transaction. This result implies that
post-buyout operating gains might be diluted due to accrual reversals. The recent evidence
from buyouts showing smaller performance gains might be partly an unintended consequence
of including large number of private-to-private MBOs in research samples. Likewise, the
large performance gains documented for early buyouts might be a result of the strong focus of
performance studies on public-to-private MBOs.
In Chapter 4 we speculated that upwards earnings management is a result of different agency
problems faced by private firms. Chapter 5 sheds more light on the earnings management
practices of managers prior to MBO transactions. We segregate private firms based on family
and non-family ownership status and use additional samples from MBI deals and secondary
MBO exits to compare earnings management motivations. The results indicate that
differences exist along the lines of family vs. non-family MBOs and full vs. divisional MBOs.
Family firms do not manage earnings while non-family firms manage earnings upwards.
Consistent with Chou et al. (2006) and Cao (2008), the findings also highlight the shifting
incentives of PE sponsors at the time of exit. PE sponsors tend to reduce earnings
management practice prior to MBO deals and tend to inflate earnings prior to secondary MBO
exits. The results emphasise that buyout is a heterogeneous organisational form and
generalised statements about buyouts might produce misleading conclusions.
This research makes several important contributions to the buyout literature. We use a novel
set of MBO transactions to provide recent evidence on MBO performance and earnings
management and show that PE sponsors and buyouts in general create little additional value.
The value gains or losses do not represent operational activities due to selective investment

5
strategy of PE funds and earnings management practice preceding buyouts. We document that
privately held firms have different reasons and motivations for undertaking an MBO, which is
manifested by their distinct upward earnings manipulation behaviour prior to transaction. We
also demonstrate that post-buyout performance changes can be partially explained by earnings
management. Therefore, we infer that existing research on value creation in buyouts is likely
to be biased. The research shows that differences not only exist between MBOs of public and
privately held firms, but also between MBOs of private family and non-family firms. This
research provides the first test of earnings management in family MBOs and in private-to-
private MBOs in general.
The remainder of the thesis is structured as follows. Chapter 2 reviews the existing literature
on buyout performance and value creation. Chapter 3 examines performance of UK MBOs.
Chapter 4 investigates earnings management in private-to-private MBOs and documents the
relationship between earnings management and post-buyout performance. Chapter 5 provides
additional evidence on the earnings management prior to MBO transactions. Chapter 6 offers
concluding remarks of the thesis.

6
CHAPTER 2: LITERATURE REVIEW
2.1 Introduction
An acquisition is called management buyout (MBO) when the firm equity is fully or partially
acquired by the incumbent management team often with the participation of private equity
(PE) investors (Wright et al., 1994). In many cases the ability of managers to self-finance a
takeover is limited due to large amounts of capital required, thus they often resort to external
borrowing and seek financial support from buyout specialists (DeAngelo and DeAngelo,
1987). These buyouts partly financed by debt are called leveraged buyout (LBO). MBO and
LBO terms often overlap since personal wealth of managers may not be large enough to
finance the entire takeover. Acquisition of a firm by an outside management team is called
management buy-in (MBI). While MBOs are often negotiated in friendly terms, MBIs are
more likely to be hostile transactions where incumbent management cannot realise the value
creation potential (Robbie and Wright, 1995). Consequently outsiders who discover the firm
potential may bid for acquisition. For example, the management buy-in of retailer stores chain
Gateway, also known as Somerfield, was one of the largest hostile buy-ins in the UK and
valued the company at £2,157 million in 1989 (Robbie and Wright, 1996). However,
incoming managers often face unexpected problems (Wright et al., 1995). Existing managers
are informed about these problems and do not continue with the purchase since they do not
see a feasible MBO opportunity. Therefore MBIs are more likely to occur when an MBO is
not possible (Jelic, 2011).
The emergence and rise of L/MBO activity is associated with the changing role of
institutional investors and the lack of appropriate control mechanisms (Jensen, 2010). The
subsequent increase in agency costs resulted in free cash flows invested in unprofitable
diversification projects (Jensen, 1986), which led to a wave of mergers and acquisitions as

7
well as emergence of LBO and MBO market (Renneboog and Simons, 2005). However, the
intense L/MBO activity in the late 1980s was associated with the increasing number of
bankruptcies resulting in anti-takeover legislative measures and nearly terminating L/MBO
activity until its re-emergence in 1997 (Kaplan and Stromberg, 2008). These so-called first
and second buyout waves are characterised by different market trends. The first wave
L/MBOs are often large companies acquired using high levels of debt while the second wave
witnessed more investor interest in small and private firms financed with lower levels of debt
(Renneboog and Simons, 2005; Guo et al., 2011) as well as the rise of secondary buyouts
(Zhou et al., 2013).
L/MBO transactions occur worldwide in a variety of industries, and target both private and
public companies (Stromberg, 2008). The literature has largely focused on public-to-private
(PTP) buyouts although they form only a minority of all transactions. Stromberg (2008)
reports that PTPs account for 6.7% of the worldwide buyout population in terms of number of
deals and 28% of the all transactions in terms of value. The remainder is accounted for mostly
by divisional, secondary and private-to-private buyouts where family-owned and other
privately owned companies arrange a buyout, which implies that the motivations behind
L/MBOs are not limited to solving principal-agent conflicts in public companies. In
recognition of this fact, this study places the emphasis on non-PTP buyouts.
The rest of the chapter is organised as follows. Section 2 reviews theoretical and empirical
literature on L/MBO value creation. Section 3 discusses buyout longevity and exit strategies.
Section 4 dwells on third party certification and the role of PE investors in buyouts. Section 5
concludes the chapter.

8
2.2 Motivations of Management Buyouts and Sources of Value Gains
The destruction of value by managers generates large profit opportunities which can be
captured by innovative organisational structures such as MBO (Jensen, 2010). The separation
of ownership and control mechanisms create agency problems between managers and
shareholders that managers are able to exploit in the absence of strict monitoring (Jensen and
Meckling, 1976; Jensen, 1986), leading to deviations from shareholder value maximisation.
The agency conflicts might be especially strongly pronounced for diversified companies
lacking a core business focus and a consistent investment strategy. The conflicts in these
companies can arise between managers and shareholders, and between parent organisation
and divisions. The divisions of large and diversified companies are usually constrained by the
centralised strategies of the parent, which precludes the division managers from utilising the
true capacity. The realisation of true capacity is particularly observed in privatisation buyouts
which are more likely to be forced to behave within the limits of central policies (Jones, 1992)
and grow fast when these constraints are removed (Wright et al., 1994). Therefore, division
managers who realise this potential might seek to take it over in an MBO transaction. In cases
where managers are mainly responsible for the value destruction with their entrenchment
behaviour (Fama and Jensen, 1983), outside investors and management may team up to
acquire the firm. The presence of outside investors and ensuing concentrated ownership
following MBO provide the necessary levels of incentives and monitoring to realign the
managerial objectives with firm objectives (Jensen, 1989; Gilhully, 1999). For publicly listed
firms, going-private through an MBO could be a defensive strategy by managers against
hostile takeover attempts (Renneboog and Simons, 2005). In many cases, managerial wealth
is insufficient to buy the entire firm share, thus management team agrees to PE sponsorship in
exchange for several concessions such as giving PE firms board seats and control roles (Barry

9
et al., 1990). In family firms, MBO could be a result of family succession issues when no
suitable member of family exists to succeed the retiring generation (Howorth et al., 2004).
2.2.1 Incentive Realignment Hypothesis
The removal of agency conflicts and managerial entrenchment behaviour through MBO
provides the motivation for undertaking MBO. Incentive realignment hypothesis proposes
that reunification of ownership and control and ensuing concentrated ownership allow
managers to create value (Renneboog and Simons, 2005). This is particularly true for public-
to-private transactions that suffer more from agency problems due to their dispersed
ownership structure. Jensen and Meckling (1976) argue that increased managerial ownership
could improve financial performance because managers have greater stakes in value
increasing actions. Managers, having substantial ownership share following buyout, are likely
to work more diligently towards value maximisation. Moreover, the motivations of managers
may be strengthened by the presence of an active PE investor, who sets performance targets
for managers and monitors them through equity ratchets by which the managerial ownership
may increase or decrease conditional upon meeting performance targets (Wright et al., 1994).
The opponents of incentive realignment hypothesis argue that increasing managerial
ownership could exacerbate financial performance due to managerial risk aversion (Fama and
Jensen, 1985) and risk-averse managers can reject high-risk but more profitable projects in
favour of low-risk but less profitable projects (Holthausen and Larcker, 1996). High levels of
managerial ownership may render the management indifferent to board restructuring and
delay the restructuring process that often takes place following buyout (Franks et al., 2001).
Demsetz (1983) and Fama and Jensen (1983) argue that concentrated managerial ownership
might give managers effective control over the organisation and disciplining mechanisms,
resulting in monitoring mechanisms becoming ineffective. Contrary to the implications of

10
incentive realignment, managerial risk aversion and entrenchment hypotheses suggest that a
decrease in managerial equity could lead to performance improvements (Holthausen and
Larcker, 1996).
2.2.2 Control Hypothesis
Control hypothesis suggests that wealth gains from L/MBOs are largely due to increasing
quality of monitoring. Grossman and Hart (1980) argue that investment in monitoring
activities will be limited in companies with dispersed ownership since an investment by one
shareholder will provide benefit to all shareholders. After MBO, however, the number of
shareholders will be fewer and stakeholders will have stronger incentives to invest in
monitoring (Admati et al., 1994). Fewer shareholders and high ownership concentration imply
that a main source of wealth gains is a reduction in agency costs (Renneboog and Simons,
2005). Consistent with control hypothesis, evidence shows that L/MBO boards convene more
frequently than those of public companies (Kaplan and Stromberg, 2008). The increasing
quality of interaction and communication between shareholders therefore result in a more
efficient management mechanism.
2.2.3 Free Cash Flow Hypothesis
Postulated by Jensen (1986), free cash flow hypothesis argues that L/MBOs eradicate agency
problems between managers and shareholders that stem from inefficient use of cash flows in
firms with few positive net present value projects, thereby creating wealth-increasing effects.
Murphy (1985) claims that managers tend to build empires, which means retaining resources
to grow beyond optimal size and consequently invest in suboptimal projects. An L/MBO has
disciplinary effects by virtue of high leverage; it solves cash allocation problems and allows
managers to allocate surplus cash to debt payments rather than investing in unprofitable
projects. The disciplinary effects of buyout are more pronounced for mature firms with

11
abundant cash but low growth opportunities (Jensen, 1986). High-growth firms with
profitable investment opportunities but no surplus cash are likely to have different agency
problems and not benefit from the disciplinary effects of leverage. Opler and Titman (1993)
examine determinants of LBO activity. They find that free cash flow problems and financial
distress costs are important determinants of which firms undertake LBOs. Consistent with the
free cash flow hypothesis, their results indicate that high cash flow firms simultaneously
having low Tobin’s q (proxy for incentive alignment) are more likely to undertake an LBO.
The deterrent effects of financial distress costs suggest that debt financing is crucial to
realising LBO gains. Firms with low financial distress costs might benefit from the
disciplinary effects of debt by undertaking an LBO. Recent studies, however, present a
challenge to Jensen’s free cash flow theory. For example, Weir et al. (2008) document that
PTP buyouts in the UK market do not have excess cash prior to buyout transaction. Similarly,
Datta et al. (2013) find that going private LBOs have high leverage than their non-buyout
industry counterparts prior to buyout, suggesting that reducing excess cash through leveraging
is not a primary motivation for undertaking buyout. In the same vein, Cohn et al. (2015) show
that PTP buyouts maintain high leverage levels following buyout and do not reduce leverage
even though they have excess cash to pay down debt. This is inconsistent with the Jensen’s
theory since it argues that excess cash in LBOs should be used to pay debt. They conclude
that public firms attempt to change their capital structure through LBOs rather than acting on
a purely transactional basis and the persistence of post-buyout high leverage brings substantial
wealth benefits due to tax shield.
2.2.4 Tax Shield Hypothesis
Lowenstein (1985) argues that tax deductions can be an important source of wealth in highly
levered LBOs and leads investors to pay a premium over the share price. This argument,

12
however, ignores other tax-creating operations that arise following buyout. Jensen (2010)
notes that if buyout specialists pay a premium over the market value, the shareholders would
realise these capital gains in their income and pay more income tax. MBOs also engage in
thorough restructuring activities and sell non-core assets subsequent to buyouts, which is
likely to generate additional tax payments on sale. The tax-generating asset sales may offset
the gains from tax deductions on interest payments. Moreover, realignment of managerial
incentives and other performance-improving activities are likely to increase taxable income.
In addition, external financing providers ensure that managers prioritise debt payments after
the buyout (DeAngelo and DeAngelo, 1987). Therefore, interest payments will decline along
with decreasing debt levels over time, creating less tax shield every post-buyout year. In
contrast with DeAngelo and DeAngelo (1987), Cohn et al (2015) show that LBO managers do
not prioritise debt payments following buyout. They document a persistent high leverage in
the five years following LBO transaction, suggesting that the value of the wealth generated by
tax shield might be higher than previously estimated. Kaplan (1989a) finds that half of the
LBOs pay no tax in the first year following buyout. However, average tax payments return to
pre-buyout levels by third post-buyout year due to performance improvements and partial
retirement of debt. This result is consistent with tax shield argument, but also shows that tax-
deductible interest does not entirely eliminate tax obligations.
2.2.5 Wealth Transfer Hypothesis
Critics of buyout investors suggest that L/MBOs create value by expropriating stakeholder
wealth (Jensen, 1989). Wealth transfer to shareholders may occur in the form of higher
dividend payments, issuance of debt of equal or higher seniority (Jensen, 1989; Renneboog
and Simons, 2005), false pricing through earnings management prior to buyout transaction
(Perry and Williams, 1994), and asset stripping behaviour (Wright et al., 2009). An

13
unexpected issue of debt could lead to substantial bondholder wealth expropriation in PTP
buyouts; however, this is not a continuing problem since protective measures such as
covenant provisions often accompany MBO transaction Jensen (2010). Consistent with
Jensen (2010), evidence shows that covenants offering low protection against capital
restructuring lead to a partial investment loss for bondholders (Renneboog and Simons, 2005),
whilst convertible bond and preferred stock holders generally record significant amounts of
wealth gains (Marais et al., 1989). The transfer of employee wealth is often alleged to form a
significant portion of value creation in MBOs. PE investors are accused of being short-sighted
investors, laying off employees and reducing wages to create value (Shleifer and Summer,
1988). The existing evidence, in general, does not support employee wealth expropriation.
Kaplan (1989a) and Smith (1990) find that post-buyout improvements in efficiency and
performance are not related to wealth transfers from employees and shareholders. Amess and
Wright (2007) show that LBOs pay lower wages than non-LBOs, however, they do not lay off
employees. Jelic and Wright (2011), in contrast, indicate that more jobs are generated
following MBO transactions. To our knowledge, the only empirical evidence supporting
wealth transfer hypothesis is presented by Datta et al. (2013) who show that improvements in
productivity and efficiency are due to a reduction in the labour force and cost of goods sold.
2.2.6 Undervaluation Hypothesis
The undervaluation hypothesis asserts that wealth gains are the result of unrealised growth
potential which can be exploited by insiders or outside investors who realise this potential. In
private firms where separation of ownership and control is not clearly delineated, managers
may not be able to exploit the true potential of the firm due to dominant role of owners in
decision-making process. These managers would seek to buy the firm through an MBO and
pursue growth opportunities. The undervaluation problem is also often pronounced for

14
subsidiaries of diversified companies. Wright et al. (1994) argue that divisions are constrained
by a central parental policy and have limited ability to pursue their own strategies and create
value. The centralised policies can lead to a decrease in the profitability of divisions and
companies often sell these unprofitable assets to focus on the core business (Lang et al.,
1995). Acquisition of division in an MBO transaction allows managers to realise the latent
growth potential previously restricted by the parent (Wright et al., 2001; Bruining and Wright,
2002). Public companies suffering from cautious investor approach in cold markets may also
choose to undertake an L/MBO to avoid undervaluation (Renneboog and Simons, 2005). The
existing research supports undervaluation hypothesis. Opler and Titman (1993) find that lack
of profitable investment opportunities is a defining characteristic of public firms undertaking
LBO. Renneboog et al. (2007) document a 30% increase in share price following buyout
announcement. They conclude that pre-MBO undervaluation, incentive realignment and tax
shields are important sources of value gains. Geranio and Zanotti (2010) find that financial
performance of public firms outperforms the market by 18% from buyout announcement to
delisting date. Undervaluation of company and company size are significant factors
explaining the positive announcement effect on share price. Datta et al. (2013) show that LBO
equity is significantly less valued than their counterparts despite having better performance
prior to buyout. Hence managers might be motivated to engage in value increasing
restructuring activities through an LBO. Consistent with this proposition, undervaluation
motivation of managers to undertake LBO is supported by improved post-buyout valuation.
2.2.7 Heterogeneity Hypothesis
The heterogeneity hypothesis argues that ownership structures of buyout targets are not
homogeneous and going private MBO decision is driven by ex ante managerial ownership.
Poor performance and incentive misalignment are common characteristics of a typical buyout

15
target; however it is the unique effects of low and high managerial equity that creates the
distinction (Halpern et al., 1999). Stulz (1988) argues that low managerial equity firms are
more frequently targeted by takeover attempts. Upon becoming target of a takeover attempt,
these managers might opt to undertake an MBO in order to maintain their position. High
managerial equity firms, on the other hand, are not concerned about hostile takeover attempts
since managers control the vital decisions. The MBOs in high managerial ownership firms are
therefore more likely to be voluntary transactions. However these managers may attribute
more importance to their unsystematic risk and seek to diversify their investments to preserve
their wealth (Halpern et al., 1999). These managers would be better off by selling a portion of
their shares in an LBO transaction.
2.2.8 Transaction Costs Hypothesis
The transaction costs hypothesis argues that wealth gains from LBOs are mainly the result of
delisting from stock exchange and consequently eliminating costs related to listing and
mandatory information disclosure rules (DeAngelo and DeAngelo, 1987). This hypothesis is
particularly illustrated by the enactment of Sarbanes-Oxley Act in the US in 2002, which
made listing on public markets costly for small listed firms. These companies may opt to go
private in LBO transactions. Note that in the UK and Europe, it is also mandatory for private
companies to disclose annual accounts while only private firms with public debt disclose
financial information in the US.
2.2.9 Family Succession Hypothesis
The family firm organisations provide an important source of MBO deals. Approximately
20% of European buyouts are acquisition of family firms (Scholes et al., 2008). The
generational succession issues are crucial to the survival of family business and culture
(Burkart et al., 2003). The retiring generation of family members may consider MBO as an

16
alternative succession route when there is no suitable family member to lead the family
business in the future (Wright et al., 1992; Howorth et al., 2004). The selection of an
incumbent manager as family successor is motivated by the fact that the relations between
managers and ruling family members are characterised by a personal connection based and
long-established altruistic business approach (Langli, 1983; Chrisman et al., 2004). In the
absence of an insider (family member or manager) to succeed the retiring family, an external
management team might acquire the business in an MBI transaction (Scholes et al., 2008).
2.3 Accounting Manipulation Hypothesis
The accounting manipulation hypothesis argues that ex post value gains do not represent real
performance improvements since managers expropriate shareholders by using their private
information and buy it below market value. Because the deal pricing is often based on
earnings multiples, managers might have incentives to exercise their discretion over account
numbers and to engage in earnings manipulation (DeAngelo and DeAngelo, 1987), which
would underprice shares and enable them to pay less for the purchase. MBO proposals by
managers, however, might be subject to close scrutiny by shareholders since the takeover
attempt may be interpreted as an attempt to expropriate them. Moreover, a buyout proposal by
the incumbent management team would reveal to other investors that managers view their
firm as an attractive investment opportunity. Thus, a buyout proposal at a low price might
generate a competing offer from another company. As a result buyout proposals frequently
offer a premium from 15% to 50% above market value (Kaplan, 1989b). Managers who hold
substantial amounts of equity and are not part of the MBO team also typically sell their shares
in the buyout (Kaplan, 1989b). This is irrational behaviour if non-participant managers have
the same information as MBO team and if the buyout is underpriced (Jensen, 2010). Evidence
also shows that a buyout announcement causes abnormal increases in stock price (DeAngelo

17
et al., 1984; Geranio and Zanotti, 2010) and stock prices tend to decrease following the
withdrawal of the offer. This implies that markets expect a premium to be offered and adjust
their behaviour accordingly. The evidence on earnings management in MBOs suggests that
managers deflate earnings prior to public-to-private transactions. DeAngelo (1986) finds that
public-to-private MBOs do not engage in earnings management which they interpret as
evidence of stricter monitoring and market attention accompanying the transaction. Perry and
Williams (1994) interprets the lack of earnings management evidence in DeAngelo sample in
the light of more recent methodological developments and concludes that DeAngelo earnings
management proxy does not fully reflect managerial discretion.1 Using a larger sample and a
novel prediction model, Perry and Williams (1994) show that MBOs manage earnings
downwards in the year preceding buyout transaction. Mao and Renneboog (2013) document
practice of income-decreasing accruals and real earnings management in the UK MBOs. The
existing evidence is, however, limited to public-to-private MBOs since no study tests earnings
management hypothesis at the time of MBO in private firms. This hypothesis does not explain
how post-buyout value is created should managers manage earnings prior to MBO. The link
between earnings management and ex post value creation is studied in equity issues, where
going public private firms publish their financial accounts prior to IPO, removing the
financial data constraints widely present in private firm research. The related literature
documents a negative relationship between earnings management and post-IPO/post-SEO
performance of equity issuing firms (Rangan, 1998; Teoh et al., 1998a; 1998b; Jo et al.,
2007). Although no studies attempt to examine this link in MBOs, a similar relationship
between earnings management and performance can be expected for going private MBO
1 DeAngelo (1986) assumes that nondiscretionary accruals are equivalent to last year total accruals and models
the discretionary accruals in the estimation year as the change in total accruals. Jones (1991) develops a time-
series regression based approach to more accurately estimate the discretionary component. Jones model and its
modified variants are some of the most popular techniques used in the earnings management literature.

18
transactions. In this case, prior evidence on buyout performance would not reflect the accrual
reversals following buyout.
2.4 Empirical Research on Buyout Performance
The literature on value creation in buyouts is consistent in suggesting that undertaking an
L/MBO substantially mitigates agency problems between managers and shareholders, reduces
managerial entrenchment and realigns the incentives of managers. The evidence is, however,
less consistent in showing how and how much value is generated following L/MBO
transaction. Considerable differences in performance are particularly observed along the lines
of early and late buyout waves. An important characteristic of early buyout studies is their
tendency to focus on very large and heavily publicised LBOs, which are hardly likely to
represent the general population and buyout trends. The L/MBO research today still preserves
its focus on public-to-private transactions, largely due to lack of data availability for private
firms in the US; however, a growing body of literature increasingly recognises that buyouts
are comprised of small and large firms as well as public and private firms. Table 2-1 presents
a summary treatment of select studies on L/MBO performance.
Early studies show large improvements in profitability and cash flow subsequent to LBO
(Kaplan, 1989a; Smith, 1990; Opler, 1992). Buyouts perform better than industry in the short
and medium term (Smith, 1990), while the long term performance might be subject to shifts
in performance (Opler, 1992). Evidence suggests that operating gains are due to real
performance improvements resulting from realignment of managerial incentives (Kaplan,
1989a; Smith, 1990). In contrast, the wealth transfer hypothesis is not supported. The use of
high leverage is critical to incentive realignment and value creation. DeAngelo and DeAngelo
(1987) find that debt levels increase from below 20% to 86% in LBOs. Managers of PE-
backed MBOs typically own a smaller fraction of shares prior to transaction than do the

19
managers of non-PE-backed MBOs. Their results suggest that the occurrence of an LBO and
the amount of debt used to leverage an MBO deal are conditional upon transaction size and
the ability of managers to self-finance the acquisition. LBO transactions tend to be undertaken
when the wealth of managers is insufficient to cover the acquisition.
The second wave L/MBOs are characterised by smaller operating gains and more
conservative use of leverage. The samples used in these studies tend to be more
comprehensive. For example, Boucly et al. (2011) studies 839 French LBOs while Kaplan
(1989a) examines 76 LBOs. The second wave and European buyout studies are able to utilise
larger samples since the samples often cover both buyout waves (e.g., Jelic and Wright, 2011)
and European studies are not constrained by the lack of private firm financial data. The firms
targeted in MBO transactions tend to be good performers (Desbrieres and Schatt, 2002;
Chung, 2011). LBOs continue to outperform their respective industries (Weir et al., 2008;
Caselli et al., 2011), however the improvements relative to pre-buyout performance are less
pronounced (Desbrieres and Schatt, 2002; Jelic and Wright, 2011; Guo et al., 2011). Instead,
the evidence highlights the value added by PE sponsors (Cressy et al., 2007; Weir et al., 2008)
and emphasises the growth-focused approach of L/MBOs in post-buyout period (Boucly et
al., 2011; Chung, 2011). This result is consistent with a scenario where post-buyout operating
gains are harder to generate in the second buyout wave (Weir et al., 2008; Guo et al., 2011)
and lower debt levels reduce the pressure on managers to create value (Desbrieres and Schatt,
2002; Guo et al., 2011). The recent emphasis on post-buyout growth is also attributable to the
analysis of a large number of small and medium private firms that often seek PE funding to
remove growth constraints (Boucly et al., 2011; Chung, 2011).
Studies begin to emphasise the heterogeneous nature of buyouts and non-generalisability of
results obtained from public-to-private L/MBO samples (Datta et al., 2013) as well as

20
operating performance obtained from restricted buyout samples where only buyouts issuing
public debt can be examined during their private period. Cohn et al. (2014) overcomes the
financial data issue in the US using a confidential dataset and separately examines
performance of public debt issuers and non-issuers. They find that public-to-private buyouts
do not result in performance improvements nor they outperform their respective industries;
however they significantly outperform industry peers when only public debt issuers are
considered. Therefore, they argue, performance indicators obtained from subsample of public
debt issuing buyouts are likely to be upward biased.2
2.5 Buyout Survival and Exits from Buyout Organisational Form
2.5.1 Longevity of Buyouts
Jensen (1986, 1989) argues that L/MBO is a superior organisational form since it offers better
managerial incentives and resolve agency conflicts between managers and shareholders
through leveraging and investor control. Therefore, managers and shareholders would prefer
buyout organisational form to public form of ownership. According to Jensen, L/MBOs
should stay in buyout form for an unspecified but considerably long period. Kaplan (1991)
argues that the performance-improving activities in L/MBOs tend to be one-off changes, and
once they are implemented relative benefits of future changes become relatively smaller.
Moreover, the substantial post-buyout debt levels do not represent a permanent capital
structure, instead they represent only a transition period in which debt was allocated to the
management to enable the purchase (DeAngelo and DeAngelo, 1987). Essentially, L/MBO
teams give debtholders assurances that paying debt would be their primary objective
following buyout. Therefore control effects of debt will be reduced in line with declining debt
2 These studies mainly correspond to the first wave buyouts where evidence from US PTP buyouts shows large
performance improvements. Financial data for private firms is available in the UK; hence this issue does not
cause a bias in UK studies (i.e., Weir et al., 2008; Jelic and Wright, 2011).

21
levels in the years to come. Furthermore, PE sponsors of L/MBOs are not permanent
investors. Most PE firms invest through closed-end funds which raise capital from limited
partners with the promise of above-market return within a certain time period (Kaplan and
Stromberg, 2008). When closed-end funds approach to termination, their investors seek a
return on their capital. Therefore PE sponsors need to realise their investment prior to the end
of fund life. Successful exists and a good track record allow PE firms to send a positive signal
to their limited partners and facilitate additional fundraising for future investment funds
(Schwienbacher, 2002). In addition, PE firms are likely to have exhausted possible
improvements and restructuring efforts, thus their marginal productivity will be higher if they
deploy their capital elsewhere (Muscarella and Vetsuypens, 1990). Managers usually hold
large blocks of equity in buyout firms and they are bound by agreements restricting sales of
managerial equity. Although these restrictions incentivise managers to stay affiliated with the
buyout firm and to exert considerable effort in order to improve profitability and performance
(DeAngelo and DeAngelo, 1987), prolonged form of private ownership may increase costs of
illiquidity and underdiversification, unless the value of managerial equity is realised by an
exit transaction (Kaplan and Stromberg, 2008). Hence, buyouts are eventually exited via trade
sales, IPOs and secondary buyouts (SBO). Kaplan (1991) finds that buyouts represent both
permanent and transitory forms of ownership structure. 45% of buyouts exit and return to
public ownership while a significant portion of buyouts continue to stay in private ownership
for long periods. Jelic (2011) documents that 47% of buyouts stay in private ownership for at
least 7 years. PE-backed buyouts are more likely to exit than pure buyouts. The evidence
collectively suggests that buyout is not an inferior organisational form to public ownership.
Acquisition of the buyout by another company is called trade sale exit. Trade sales are
reputable exits for PE firms; however, they are potentially unwelcome to management to the

22
extent that buyout is acquired by a larger company and cannot remain independent (Fenn et
al., 1997). Managers may also risk losing their positions since it is typical for acquirers to
bring their own team to replace incumbent management team. Buyout investments realised by
means of an IPO are called reverse LBO. Secondary buyouts represent a number of options
that may involve complete, partial change or no change in management and in capital
providers (Wright et al., 2000). A secondary transaction with no change in management and
partial or full change in capital provider is called secondary management buyout (SMBO).
Alternatively, incumbent managers can be replaced with new ones at the instigation of fund
providers. In this case the exit transaction is called secondary management buy-in (SMBI).
2.5.2 Exit Choice
The exit choice is critical because investors are able to extract more value from the company
and achieve higher returns through timing of a good exit strategy (Sousa, 2010). Kaplan and
Schoar (2005), and Kaplan and Stromberg (2008) show that the amount of capital committed
to PE funds is associated with past fund returns, which indicates that the return history of
funds is taken into consideration by limited partners before committing new capital. Given the
short term nature of the PE investment and implied return characteristics of different exit
routes, investor should be planning the exit strategy at the beginning of the initial investment
(Sousa, 2010). Barry et al. (1990) find that MBO firms often adopt equity based incentive
compensation plans under private ownership. The popularity of the equity based
compensation plans suggests that PE firms and managers might have been planning a return
to public ownership for long time. The so-called pre-planned exit strategy is a reasonable
expectation formed before contracting that PE investors want to abandon their investment
either by IPO or trade sale (Cumming and Johan, 2008). This expectation is often not revealed
to the managers since it is not an appealing option, particularly in the case of a trade sale exit.

23
However, they agree to allocate control rights to the PE investor in order to maximise the
value at the time of exit since they are aware that markets would take into account the
personally motivated managerial incentives and discount the value of the firm in the absence
of PE control.
Existing studies document that IPOs and trade sales are historically the most popular exit
channels (e.g., Stromberg, 2008; Jelic and Wright, 2011). IPO and trade sale are characterised
by higher returns and they are considered more reputable routes than secondary buyouts. For
instance, Nikoskelainen and Wright (2007) report that IPO exits strongly outperform trade
sales and trade sales outperform secondary buyouts. Although the higher returns achieved
through IPO and trade sales explain part of their preferability, reputation considerations also
play an important role in the exit choice (Schwienbacher, 2002). Bienz and Lenite (2008)
hypothesise a pecking order of buyout exits where IPO is the primary exit choice of PE
investors by virtue of its higher return characteristics. In their model, more profitable firms
seek to exit by IPO, followed by trade sale and secondary buyouts in a decreasing order or
profitability. Contrary to IPO and trade sale, secondary buyouts are not considered a desired
exit route (Bienz and Lenite, 2008; Arcot et al., 2015). However secondary transactions have
recently seen large increases in the frequency and size. Using a comprehensive global dataset,
Kaplan and Stromberg (2008) show that secondary buyouts account for only 2% of buyouts in
terms of enterprise value in 1990s, however their share of global buyout market increases to
25% by 2007.
Instead of finding an external buyer, PE firms may also opt to sell their holding to the
incumbent management, which is called a share buyback exit. Share buybacks are particularly
useful in small buyouts where PE investor has liquidity concerns and cannot find an outside
buyer (Sousa, 2010). This option might also appeal to managers who want to gain

24
independence. Finally, unsuccessful L/MBOs may declare bankruptcy in what is called
receivership exit. In the UK, 11.6% of all buyouts from 1985 to 2008 ended up in receivership
(CMBOR, 2008). The recent financial downturn also led to an increase in receiverships.
Statistics show that well over half of all buyout exits in 2009 are accounted for by
receivership exits (CMBOR, 2010).
2.5.3 Reverse LBOs
PE investors are experienced players (Cressy et al., 2007) and less experienced buyouts
sponsors usually invest in syndicates that include more market-savvy ones. Thus they are
expected to behave rationally and not realise their returns until value maximising restructuring
activities are completed. Ceteris paribus, buyout sponsors would seek to extract as much value
as they can from the portfolio firm. Building on this idea, Muscarella and Vetsuypens (1990)
argue that reverse LBOs represent a case where all benefits of undergoing an LBO are likely
to have been fully exhausted. By contrast, DeGeorge and Zeckhauser (1993) argue that
reverse LBOs are usually indicator of good times. LBO managers need to convince capital
markets of the firm’s favourable future prospects, thus they postpone IPO and wait for a better
year if the performance is not good enough. This argument known as hidden information
theory posits that managers know the expected value of the LBO firm and only choose to go
public when performance is better than average. If performance is below the true potential,
managers would choose to stay private. Reverse LBO decision is a product of good
performance and justified by the well informed managers who hold the informational
advantage over the general public. Shefrin and Statman (1985) find that investors tend to sell
their winning investments early because of the satisfaction from realising a good investment
and hold on to their losing investments possibly to avoid regret. Shiller (1988), in a survey of
IPO investors, shows that most IPO investors are more concerned about non-qualitative

25
aspects of the going public firm and reputation of underwriter than pricing of the IPO in their
investment decisions. In this case, a company or underwriter with a poor past performance
cannot attract investors by underpricing and leaving money on table. Instead investors would
prefer firms with good past performance. The vendors may also be reluctant to sell their
shares if the offering price is below the true firm potential. This would suggest that reverse
LBO decision is characterised by selection effects resulting from the opportunistic,
performance-based timing decisions. Therefore, the buyouts exiting through IPO are expected
to be good performers since poor performers would be filtered out in the selection process.
The debt overhang hypothesis (DeGeorge and Zeckhauser, 1993) argues that LBO managers
may be reluctant to raise outside equity when their debt is severely risky, since it will raise
price of bonds and part of the IPO proceeds will go to debtholders. This implies that debt
overhang exerts a selection effect, which leads high risk debt LBOs to stay private while good
performing LBOs having less risky debt go public. Zingales (1995) argues that going public is
an equilibrium decision, where incumbent owners who eventually want to sell their stake
develop a value maximising strategy. Zingales model implies that buyout sponsors aim to
optimise the governance structure through IPO and take LBOs public when monitoring costs
begin to exceed benefits of concentrated ownership. In other words, reverse LBOs occur only
when benefits of dispersed ownership outweigh costs of maintaining existing ownership
structure.
2.5.3.1 Pricing and Performance of Reverse LBOs
Teoh et al. (1998a) suggest that managerial opportunism at the time of equity offerings leads
to deterioration in performance. Information asymmetries present insiders a window of
opportunity to manage earnings upwards around the offering. Since inflated earnings must be
borrowed from future income, accrual reversals would cause underperformance in the long

26
run. IPO process is particularly vulnerable to earnings management due to high information
asymmetry between insiders and outside investors at the time of going public. This suggestion
is justified to some extent since evidence points to a lack of media coverage one year prior to
IPO (Rao, 1993). The scarcity of information forces investors to rely on prospectuses that
contain up to three years of financial statements (Chou et al., 2006). However, reverse LBOs
are quite distinct from private firms going public. Jalilvand et al. (1996) assert that
asymmetric information problems are less severe in LBOs returning to public ownership since
markets in general have knowledge about the firm due to past trading history of LBO and
buyout specialists. DeGeorge and Zeckhauser (1993) note that LBO managers have incentives
to manipulate earnings even though they do not sell their shares. This is because managers
typically retain a sizable share after IPO and a higher offering price expands their wealth.
Managers are often aware of the consequences of earnings management, thus they are more
likely to exert extraordinary effort to improve earnings. However they might also act
myopically knowing fully that markets cannot be fooled (Stein, 1989). Public investors cannot
observe manipulation directly; however, occurrence of post-IPO underperformance would
reveal unobservable characteristics of the reverse LBO.
The existing literature documents that reverse LBOs do not suffer severe post issue
underperformance (Holthausen and Larcker, 1996; Jelic et al., 2005; Chou et al., 2006; Datta
et al., 2013). However, managers and PE funds may opportunistically inflate earnings prior to
going public (Chou et al., 2006). DeGeorge and Zeckhauser (1993) show that markets have
considerable information about the LBO at the time of IPO. Holthausen and Larcker (1996)
propose that performance of reverse LBOs depend on the changes in insider ownership and
high leverage. Although reverse LBOs often state that debt reduction is a primary objective
following the offering, their goal might be removal of excessive debt and not to erase

27
disciplinary effect of leverage (DeGeorge and Zeckhauser, 1993). Therefore, to the extent that
they continue to have higher leverage and more concentrated ownership than industry
average, these firms might continue to perform their corresponding industries (Holthausen
and Larcker, 1996).
2.5.3.2 Private Equity Investors in Reverse LBOs
Buyout specialists typically hold on to a significant portion of their ownership following
reverse LBO to signal their confidence (Katz, 2009). Muscarella and Vetsuypens (1990) argue
that IPO represents the first step of PE exit and followed by a subsequent sale to an external
investor. These shares are often sold to interested buyers after the expiration of lock-up
clauses. Therefore IPO pricing and post-offering share performance has substantial wealth
implications for PE investors. Since PE sponsors are repeat players in the buyout market, they
may also suffer a reputation loss if their portfolio companies going public prove unsuccessful
and underperform the market in the long run (Cao and Lerner, 2009). Muscarella and
Vetsuypens (1990) study 72 reverse LBOs and find that sales from existing stockholders
represent only 38% of the total offered shares. They conclude that reverse LBOs are means
for partial investment realisation. Katz (2009) shows that PE investors continue to hold
between 20.8% and 48.9% ownership share until expiration of lock-ups. Mian and Rosenfeld
(1993) document that 39% of the reverse LBOs are taken over within three years after going
public. The reverse LBOs that are subsequently acquired have superior performance over
other reverse LBOs. This pattern supports the argument that IPO serves as a first step towards
the ultimate PE exit as well as illustrating motivations of PE firms to strive for value creation.
2.5.4 Secondary Buyouts
The preferable exit forms of IPO and trade sale were not easily available after the high-tech
bubble in the early years of the second millennium. PE firms faced a challenge in their

28
struggle for a timely exit and delivering returns to limited partners (Sousa, 2010), which led
PE investors to consider SBO3 as an alternative exit route (Sormani, 2002). Arcot et al. (2015)
find that secondary transactions are not the primary choice of investors and pressure to invest
is an important motivating factor of PE funds to engage in SBOs. Funds under pressure to
invest or to exit buyout investment more frequently use SBO transactions. Statistics show that
aggregate value of secondary transactions increased from 4.6% in 2000 to 45% in 2010 in the
UK (Zhou et al., 2013). The new value creation potential of SBOs has long been subject to
debate. Kaplan (1991) argues that resolution of agency problems often generates one-off
performance improvements; hence most of the value creation potential would be used up by
the first investors in the initial MBO. The new value creation might be particularly difficult if
the SBO is used as a last resort by the first PE investor to exit poorly performing portfolio
firms (Wang, 2012). Since the outgoing and incoming PE investors often rely on the same
mechanisms to create value (Bonini, 2015), the future prospects of SBO might be
questionable. Jensen (1993) argues that new investors have different skill sets and they
implement new strategies to sustain value creation. Perhaps the outgoing PE investor has not
been able to exhaust growth opportunities and SBOs can still offer significant value creation
potential (Achleitner and Figge, 2014). This might be a reasonable explanation in transactions
where PE firms decide to exit MBO due to nearing termination of investment fund life
(Sousa, 2010). Kitzmann and Schiereck (2009) argue that selling and buying PE firms
specialise in different stages of buyout investment. Therefore new investors might extract
more value by exercising their distinct skill sets. The re-leveraging of the firm might also
motivate managers to work harder and create new value creation potential (Bonini, 2015).
SMBOs have higher debt capacity since the managers are used to work with high debt (Wang,
3 The secondary buyout (SBO) term is used to jointly refer to secondary management buyouts and secondary
management buy-ins.

29
2012). If PE investor replaces management team, however, re-leveraging may not offer the
same potential.
Although an exit route may be planned at the time of MBO, PE sponsors are usually flexible
about the actual exit route (Relander et al., 1994). Evidence suggests that PE firms prefer
trade sales followed by IPO to realise their investment in buyouts (Wright et al., 1993). It is
unlikely that SBOs will be a preferred exit route at the time of the initial deal (Wright et al.,
2000). They occur when PE firms that seek to realise their investments cannot find any other
available exit option (Bonini, 2015). The search for the optimal exit time and route is likely
to result in greater buyout longevity for SBO exits compared to IPO and trade sale exits
(Wright et al., 2000). Kitzmann and Schiereck (1999) hypothesise that SBOs are inferior to
trade sales since the new investor has lower incentives and ability to invest in monitoring.
However, the continuing private status of SBOs mitigates managerial entrenchment relative to
IPOs where dispersed ownership makes monitoring costly for public shareholders (Jensen,
1989). The concentrated ownership in SBOs offers more efficient governance structure since
PE funds may more closely monitor activities of the management due to their high equity
interest.
2.5.4.1 Empirical Evidence on Secondary Buyouts
Evidence on secondary buyouts so far has been mixed. Bonini (2015) finds that SBOs do not
meaningfully improve profitability and operating performance but increase the target
company’s debt burden. In contrast, Achleitner and Figge (2014) conclude that SBOs are not
second rate deals, they still offer operational performance improvements and equity returns.
Sousa (2010) and Wang (2012) show that secondary buyout activity largely depends on the
capital market conditions and SBOs occur when other exit routes are not available. Kitzmann
and Schiereck (2009) find that SBOs still offer additional value creation potential by tapping

30
unexploited resources such as further reduction of agency costs. Zhou et al. (2013) document
that SBO performance is inferior to MBO performance and secondary transactions create little
additional value. Contrary to the argument that re-leveraging can provide further value
creation potential in SBOs, they show that high levels of debt are associated with poor
profitability. Existing evidence also indicates that SBOs are acquired at a premium compared
to initial buyouts (Achleitner and Figge, 2014; Wang, 2012) and this premium appears to be
driven by the availability of cheap debt (Axelson et al., 2013). Incoming PE investor is
unlikely to buy the target at a discounted price since the first PE investor strives to harvest as
much return as possible from the SBO exit. The new SBO investors, however, may exploit a
window of opportunity if the outgoing PE sponsor is under pressure to distribute returns to
limited partners and seeks for a quick exit. Arcot et al. (2015) find that secondary buyout
pricing is associated with the vendor and buyer funds’ respective pressure to make investment
or to exit investment. Funds under pressure to invest pay higher multiples, while funds under
pressure to exit buyout investment sell at lower multiples. When two PE funds under pressure
become opposite parties to a secondary transaction, it is their respective bargaining power that
determines the final pricing.
2.6 The Role of Private Equity and Venture Capital
The existing research does not make a clear distinction between private equity (PE) and
venture capital (VC) investments. The two terms are often used interchangeably in the
research. For example, Bottazzi et al. (2004) survey of European VC industry includes buyout
specialists. To differentiate VC investments from buyout sponsors they invent a “pure venture
capital” term purported to represent PE/VC investments excluding buyouts. Others more
commonly refer to buyout investors as LBO specialist and buyout specialist (e.g., Barry et al.,
1990; Cao, 2008). The common characteristics of the two investment classes include the

31
fundraising and operating methods, investing in private firms with the purpose of developing
and eventually exiting them to realise a return on investment, holding a portfolio of invested
firms and actively managing them (Barry et al., 1990; Gilligan and Wright, 2010). They can,
however, be distinguished by the characteristics of their investment targets. VC funds often
invest in early stage entrepreneurial companies lacking necessary capital to exploit growth
opportunities while buyout sponsors invest in late stage companies with predictable cash flow
(Barry et al., 1990). Therefore, VCs and buyout sponsors are likely to face different
information asymmetries (Katz, 2009).
2.6.1 Private Equity Firms as Active Investors
PE firms are typically active investors who try to create value through long term involvement
and holding majority equity stakes in their portfolios. Buyout specialists have great incentives
to take the job seriously since they control an average of 60% of the portfolio firm shares
(Kaplan, 1989a). A PE provider often specialises in a particular industry (Barry et al., 1990).
In line with the increasing peer competition and difficulty in creating value, specialisation is
fast becoming standard in the PE market (Wright and Gilligan, 2010).
VC and buyout sponsors use a number of strategies to exert control over their portfolio
companies. They typically control the board of directors and often have the power to replace
managers (Jensen, 2010). VCs usually provide capital in stages conditional upon meeting pre-
determined targets at important points of company life cycle (Sahlman, 1988; Vanacker et al.,
2011). Staged financing enables VC sponsors periodically to assess their investment risk and
abandon it should expected performance targets are not met (Barry et al., 1990). Sahlman
(1988) shows that staged financing solves agency conflicts between VC and entrepreneur
because the entrepreneur works harder to create value than if all financing were provided at

32
once. In resolving agency conflicts, staged financing is a similar mechanism to the high
leverage used by buyout specialists in LBOs (Jensen, 1986).
The involvement of PE in their portfolio companies suggests similarities to the large
stockholders and active investors. These active investors have the potential to play important
roles in monitoring and reorganizations (Jensen, 1986). Holderness and Sheehan (1988) point
out that large shareholders can engage in value increasing or value decreasing activities. Barry
et al. (1990) argue that frequency of PE investments indicates their value-increasing roles. PE
firms have reputation concerns due to the fact that they are repeat market players (Cressy et
al., 2007). Should they fail to create performance, their future fundraising and follow-up
investments could be jeopardised.
2.6.2 Private Equity Reputation and Venture Capital Certification
PE firms have strong incentives to establish a trustworthy reputation. The reputation of
buyout specialists plays a key role in their ability to raise additional funds from capital
providers (DeAngelo and DeAngelo, 1987). PE funds have responsibilities towards their
portfolio firms in the form of value creation and realisation of their investment through a
successful exit. The grandstanding hypothesis (Gompers, 1996) argues that exit decisions of
VC firms are influenced by their reputation considerations. Evidence shows that a good
record of successful exits enhances their reputation and facilitates additional fundraising
(Schwienbacher, 2002). Fundamental to the continuity of their fundraising activity are their
responsibilities towards limited partners and debt providers, who seek a high return on their
committed capital and timely repayment of loans respectively. PEs cannot afford harming
investor relationships they built over long time. In their efforts to deliver high returns, PE
firms are accused of asset stripping practice and being short-sighted investors (Jelic and
Wright, 2011). Jensen (1989) argues that buyout sponsors have a long term vision; however

33
they often seek exit within 3-5 years following deal (Gilligan and Wright, 2010). The buyout
research suggests little evidence to justify these accusations. Stromberg (2008) finds that
quick exits account for around 12% of the worldwide buyout exits. The average PE holding
period is longer than that of large investors in public companies (Gottschalg, 2007) and
buyouts without PE sponsor (Jelic, 2011). The PE reputation, however, influences the holding
period. Kaplan (1991) finds that more reputable buyout sponsors are more likely to exit
within a certain time period. Jelic (2011) shows that PE-backed buyouts go public sooner than
non-PE-backed buyouts. He concludes that this is more likely to reflect superior screening
abilities and value creation skills of more reputable PE sponsors, rather than flipping
investments.
VC certification hypothesis posits that the presence of a VC sponsor reduces asymmetric
information between insiders and external investors. The certification effect is particularly
visible at the time of IPO. Megginson et al. (1991) argue that insiders might exploit their
informational advantage and conceal adverse information to obtain a higher offering price.
Investors are only convinced that disclosed information accurately reflects the relevant
information when a third party with a significant capital at stake certifies the offering.
Therefore, companies going public often use an investment banker with a good track record.
Investment bankers can contribute to the market efficiency by confirming the information in
IPO prospectuses (Jalilvand et al., 1996). Megginson et al. (1991) show that the certification
role is also played by VC investors at the time of IPO. Their results indicate that VC-backed
IPO offerings more accurately reflect the relevant information and consequently they are less
underpriced than non-VC-backed offerings. Barry et al. (1990) document that IPOs backed by
higher quality VC firms are less underpriced. Similarly, Gompers (1996) find that more
prestigious VC firms are associated with lower initial returns. Recent evidence also suggests

34
that VC investors constrain earnings management practice in IPO year (Morsfield and Tan,
2006; Hochberg, 2012). Wongsunwai (2013) documents that offerings certified by more
prestigious VC sponsors curb earnings management prior to lock-up expiration while
offerings certified by less prestigious VC firms do not show meaningful differences from non-
VC-certified IPOs. However, the certification role of VC might be less important in reverse
LBOs since buyouts have a history of trading and the asymmetric information problems are
less severe (Jelic et al., 2005). Jalilvand et al. (1996) argue that large reverse LBOs could be
highly underpriced as they try to avoid the possibility of undersubscription. In contrast, Chou
et al. (2006) find evidence that buyouts specialists tend to overstate earnings prior to reverse
LBO exits to obtain a higher offering price. The literature shows, however, that PE investors
do not fully realise their investment at IPO to signal their confidence in the future prospects of
the firm. Barry et al. (1990) find that managers and VCs hold on to majority of their shares
following IPO. The reduction in their percentage holding stems from issuance of new shares
rather than sale in IPO. Likewise, evidence shows that PE firms hold significant equity stakes
continue to be actively involved in management after IPO/reverse LBO (Muscarella and
Vetsuypens, 1990; Cao, 2008; Katz, 2009). The continuing involvement of PE firms might
imply that these firms would perform better than non-PE-backed industry peers (Cao, 2008).
However, the evidence on long run performance of reverse LBOs is mixed. Muscarella and
Vetsuypens (1990) find improvements in operating performance subsequent to offering.
Holthausen and Larcker (1996) document that accounting performance of reverse LBOs is
better than industry in the next four years following IPO. DeGeorge and Zeckhauser (1993)
show that operating performance peaks in the pre-offering year; however, deteriorates fast
following IPO. Cao (2008) finds a similar pattern in the year before IPO. He interprets the
increase in profits as evidence of potential earnings management. The financial performance

35
of reverse LBOs is also inconclusive. There is evidence that share performance remains at
market levels (Holthausen and Larcker, 1996) and PE-backed offerings do not outperform
non-PE-backed offerings in the long run (Jelic et al., 2005). In contrast, Cao and Lerner
(2009) find that financial performance of reverse LBOs is better than market and other IPOs.
The evidence from PE-backed buyout exits does not fully support VC certification effect.
However it is consistent with the scenario that going public MBOs suffer less asymmetric
information problems and they are likely to be more accurately priced in efficient markets.
2.7 Conclusion
This chapter provides an overview of the existing MBO literature and empirical evidence on
MBO performance. Theories attempting to explain the reasons behind increasing L/MBO
activity are briefly presented. Vital to the common justification of MBO transactions is the
purported performance improvements that follow MBOs. The evidence is, however, less
conclusive than theory in suggesting consistent performance improvements. The empirical
findings, in general, indicate that buyout performance depends on various factors such as size,
the extent to which leveraging is used in the purchase, amount of managerial equity, presence
of an active PE investor and sources of MBO (e.g., public firm, private firm, division). It is
observed that shifting market dynamics and evolution of buyout transactions in late 1990s and
2000s produce distinct performance effects. The collective evidence from recent buyouts
suggests that differences exist in the form of deal trends, magnitude of value gains and
preferred route of subsequent exit. Specifically, going private and going public MBOs decline
substantially in line with the increasing risk aversion while value generation becomes harder.
There is, however, much that needs to be done to explain buyout performance. The theoretical
literature heavily emphasises the rationale for going private although public-to-private
buyouts constitute a small portion of all buyouts (Stromberg, 2008). For example, Jensen

36
(1986) admits that free cash flow problems might be restricted to large, public firms with
dispersed ownership. The accounting manipulation hypothesis is also based on the assumption
that managers always understate earnings prior to MBO. This might be a reasonable
assumption in public-to-private transactions; however, it does not attempt to explain how
managers behave in private firms where the roles of managers and owners are not clearly
segregated. Should managers overstate earnings, the accounting manipulation hypothesis
would imply value loss in the years following MBO instead of value gain. Therefore it is
important to adopt an inclusive approach and recognise that buyouts occur in both private and
public firms. This study is a step towards recognition of this fact.

37
Table 2-1: Performance of Buyouts
Authors Country Period/Sample Findings
Kaplan (1989a) US
1980-1986, 48 Public-
to-private buyouts
Operating income and net cash flow increase in the three post-buyout years while
capital expenditures decrease. Buyouts outperform their industry counterparts in terms
of profit margins and operating income.
Smith (1990) US
1977-1986, 58 Public-
to-private buyouts
Improvements in operating returns in two post-buyout years. Changes in employment
is insignificant, buyouts outperform industry firms in terms of operating return and
cash per employee.
Opler (1992) US
1985-1989, 42 Public-
to-private buyouts
Industry adjusted operating gains increase by 11.6% in the first two years. Cash flows
increase, R&D and capital expenditures decline.
Desbrieres and
Schatt (2002) France
1988-1994, 161
Leveraged buyouts
Industry adjusted return on equity deteriorates after buyout. Buyouts outperform
industry firms both before and after buyout in terms of return on investment and
profitability. These findings do not suggest improved performance.
Cressy et al. (2007) UK
1995-2002, 122 PE-
backed buyouts
Buyouts outperform industry counterparts in terms of operating profitability and sales
growth over the first three years after buyout. Profitability in buyout year is a
significant determinant of post buyout profitability.
Weir et al. (2008) UK
1998-2004, 122
Public-to-private
buyouts
Post-buyout performance deteriorates relative to pre-buyout; however buyouts do not
perform worse than comparable public firms. PE-backed buyouts perform better than
industry average, the performance differences between PE-backed and non-PE-backed
buyouts are insignificant. Employment falls in the first year, subsequently rises.
Chung (2011) UK
1997-2006, 886
Private-to-private &
122 Public-to-private
buyouts
Private-to-private buyouts grow substantially in post-buyout period. PE firms focus on
growth and mitigating investment constraints rather than operating efficiency.
Jelic and Wright
(2011) UK
1980-2004, 1225
Management buyouts
Buyouts improve performance relative to pre-buyout period in terms of profitability
and output; however do not outperform rivals in post-buyout period. Change in
employment is positive in every post-buyout year. Findings are robust to different
performance models.
Guo et al. (2011) US
1990-2005, 192
Public-to-private
buyouts
Profit margins deteriorate relative to pre-buyout. Profitability is largely insignificantly
different from benchmarks. When significant gains occur, they are much smaller than
those found in early studies.

38
Caselli et al. (2011) UK and Europe
1998-2007, 344
Public-to-private
buyouts
Buyouts show performance improvements in the short and medium term but cannot
outperform the market. Performance is less positive in the long run. PE presence
positively affects performance and efficiency. Capital expenditures initially fall but rise
again, implying that buyouts invest in growth after restructuring.
Boucly et al. (2011) France
1994-2004, 839
Leveraged buyouts
Buyouts are more profitable, grow faster than comparable firms and increase capital
expenditures after buyout. Post-transaction growth is particularly strong in private-to-
private buyouts. PE funds mitigate financial constraints of targets.
Datta et al. (2013) US
1978-2006, 208
Public-to-private
reverse LBOs
PTP LBOs have higher leverage than non-LBOs prior to buyout. LBOs outperform
non-LBOs prior to buyout; however they have lower valuations than non-LBOs. LBO
value increases subsequent to LBO. LBOs benefit from disciplinary effects of leverage;
however debt underutilisation is not a motivating factor for buyout. Equity
undervaluation is the main motivation for LBO deals.
Cohn et al. (2014) US
1995-2007, 317
Public-to-private
LBOs
Overcomes private firm financial data issue by using a confidential dataset. LBOs do
not improve operating performance. Consistent with prior studies, subsample of LBOs
issuing public debt outperforms non-buyouts; however this result is non-generalisable.
Debt increases are persistent after buyout, suggesting that value of tax shield is high
and leveraging is aimed at changing capital structure.

39
Table 2-2: Earnings Management in Management Buyouts
Authors Country Period/Sample Findings
DeAngelo (1986) US
1973-1982, 64 Public-to-
private MBOs
Managers do not systematically manage earnings prior to MBO due to
litigation fears and detailed examination of financial statements by public
shareholders before buyout transactions.
Perry and Williams (1994) US
1981-1988, 175 Public-to-
private MBOs
Going private management buyouts show negative discretionary accruals
prior to buyout transaction, suggesting that managers manipulate earnings.
Downwards earnings management does not stem from declining
performance.
Wu (1997) US
1980-1987, 87 Public-to-
private MBOs
Industry adjusted earnings decline significantly prior to MBO
announcement. Examination of discretionary accruals shows downwards
earnings management prior to MBO transaction.
Chou et al. (2006) US
1981-1999, 247 Reverse
LBOs
Earnings are managed upwards prior to reverse LBOs. Positive
discretionary accruals prior to IPO exit are negatively associated with post-
exit stock performance. Earnings management can explain post-IPO returns
of reverse LBOs.
Fischer and Louis (2008) US
1985-2005, 138 Public-to-
private MBOs
Earnings are managed downwards prior to MBO. Managers' earnings
management motivations are also associated with their need to obtain
external financing. Managers that have the most reliance on external funds
manage earnings less.
Mao and Renneboog (2013) UK
1997-2007, 163 Public-to-
private MBO and LBOs
Managers engage in downwards accruals manipulation and real earnings
management prior to MBO transactions. MBOs exhibit more earnings
management relative to LBOs and non-buyouts. The need to obtain external
financing does not affect earnings management.

40
CHAPTER 3: THE PERFORMANCE OF MANAGEMENT BUYOUTS IN THE LAST
DECADE
3.1 Introduction
Buyouts have been at the centre of corporate finance since the intense merger and acquisition
activities of 1980s led to the development of a vibrant buyout market. The total number of
UK buyouts has surpassed 10,000 (CMBOR, 2010), representing around 20% of the global
buyout activity (Stromberg, 2008). At the same time, private equity (PE) funds have grown in
their size and importance as market players managing around $1 trillion of capital annually;
two thirds of which is accounted for by buyout specialists (Metrick and Yasuda, 2010). As
PE firms strengthen their foothold in financial markets, they have come to the receiving end
of the criticism. Several high profile takeovers and bankruptcies in the last decade intensified
the public attention on PE funds and their alleged malpractices.4 Researchers that analyse
wealth creation in buyouts have found largely positive results that suggest a favourable effect
in the wake of a buyout announcement as well as performance improvements during PE
involvement in the target firm. However, it is understandable that public opinion remains
divided over the usefulness of buyouts due to the fact that PE funds have a relatively short
term vision, which results in the abandonment of targets within 3-5 years. Although this short
term vision would increase PE investors incentives to be more actively involved in the firm to
obtain the best possible return (Cressy et al., 2007), suspicions over whether economic
impacts such as employment will contribute to the financial health of the general public, and
whether the positive consequences of the PE involvement will be sustained in the long run
are alive.
4 The acquisition of a FTSE 100 company; Alliance Boots Plc and the bankruptcy of Southern Cross Care
Homes are arguably the most publicised examples of UK buyouts. Alliance Boots is the largest buyout in the
UK history, being valued at £11.40 ($22) billion in 2007. Southern Cross Care Homes, an operator of retirement
houses, was sold to Blackstone Capital in 2004. Shortly after an IPO exit, the company went bankrupt in 2011.
41
A management buyout (MBO) has three distinctive features that make the transaction and its
consequences remarkably different from a regular acquisition. The takeover of the company
by its own management team, the presence of PE investors and use of high leverage are
characteristics of a typical MBO. The value is then created through combined effects of debt,
managerial incentivisation and an active PE investor which involves in the decision-making
process and monitors the firm effectively. Value creation is measured as post-deal financial
gains to pre-buyout shareholders, the post-buyout improvements in operating performance
and as the return obtained by the PE investor following exit. These measures often suggest
increases in the share price following the announcement of the buyout (Renneboog et al.,
2007; Geranio and Zanotti, 2010), and improvements in the post-buyout operating
performance (Kaplan, 1989a; Smith, 1990; Opler, 1992), and large positive returns to PE
investor in the form of IRR (Nikoskelainen and Wright, 2007). The positive outcomes of
buyouts prompted Jensen (1989) to anticipate buyout superiority over traditional public
corporations which would see all companies being eventually reverted to the superior buyout
form. Although buyout markets collapsed soon after Jensen’s prediction, they quickly
recovered and survived multiple financial crises confirming a long lasting buyout
phenomenon. The last decade has been particularly tumultuous; starting with high-tech
bubble and ending with a global recessionist environment it paved the way for a thorough
evolution of buyout deals. The gradual demise of IPOs (Gao et al., 2013) and increasing
investor risk-aversion left PE funds with an exit dilemma, resulting in a decline in the number
of primary buyouts.5 In such circumstances, an interesting question that arises is whether
Jensen’s theory still holds and whether primary buyouts can still generate value through
operations.
5 The UK buyout market recorded only 1 IPO exit in 2008 and 2009. The number of MBOs hit a record low and
receiverships accounted for 157 of 245 buyout exits in 2009, making it the worst exit environment in the UK
(CMBOR, 2010).

42
Studies on value creation can be broadly examined in two buyout waves. The general
tendency in the literature is such that first wave buyouts are characterised by high leverage
and large performance improvements while debt levels decrease and operating gains become
smaller in the second wave. Kaplan (1989a) shows large increases in firm value two months
before buyout announcement to post-buyout period. Industry adjusted operating income and
net cash flows improve over three years after buyout while capital expenditures decline.
Smith (1990) finds significant improvements in industry adjusted operating returns from the
year prior to buyout to one post buyout year. Operational improvements are maintained in the
medium term and they are not due to layoffs or reductions in expenditures. Similarly, Opler
(1992) finds that industry adjusted operating cash flow to sales increase by 11.6% in the two
years after buyout. Consistent with Kaplan (1989a), capital expenditures and R&D decline,
nonetheless this evidence contrasts with Smith (1990). Guo et al. (2011) find that operating
gains in the second wave are small or non-existent relative to a control sample matched on
industry and pre-buyout characteristics. They argue that without larger operating gains,
sustenance of high returns is unlikely under less favourable market conditions.
The UK evidence for first wave buyouts is largely consistent with US studies. For example
Wright et al. (1992) find significant performance improvements after buyout. The second
wave evidence on performance is less conclusive. Weir et al. (2008) show that buyout
performance deteriorates relative to pre-buyout period; however not outmatched by the
performance of comparable public firms. Cressy et al. (2007) find that PE-backed buyouts
outperform non-buyouts 4.5% in terms of profitability in the three years after buyout. The
profitability in the buyout year is an important determinant of post-buyout profitability,
suggesting that selectivity of PE investors could play an important role in good performance.
In a similar vein, Chung (2011) documents that PE firms target already profitable companies.
PTPs reduce their size and expenditures, while private-to-private buyouts are associated with

43
substantial post-buyout growth. Jelic and Wright (2011) provide evidence of better
profitability and improvements in employment and sales, but deterioration in efficiency.
However most of the improvements remain limited to short term.
Apart from the changing market conditions, one of the important reasons for documenting
lower returns in the recent buyout studies is the changing characteristics of samples used in
the research. The recent buyout literature has increasingly recognised the heterogeneity of
buyouts; meaning that type of buyout (LBO/MBO/MBI), and source of buyout (PTP,
divestment, private-to-private) have different characteristics and important implications for
the subsequent trajectory of the company (Wright et al., 2000; Nikoskelainen and Wright,
2007). Studies using mixed samples of public-to-private and private-to-private buyouts (e.g.,
Boucly et al., 2011; Chung, 2011; Jelic and Wright, 2011) that allow researchers to more
closely examine relative performance of different types of buyouts suggest substantial
differences between buyouts of public and private origin. In particular, studies that utilise a
large number of private-to-private buyouts often report small performance improvements
following transaction (e.g., Desbrieres and Schatt, 2002; Jelic and Wright, 2011). These
studies, however, mostly examine private-to-private buyouts in the classical agency
framework, which is more suitable to public firms than private firms. A special focus on
private-to-private buyouts would better address their motives and performance.
This study examines MBOs in the UK market. This choice is imposed by several
requirements. The European Union and UK regulations allow us to access private firm
financial statements which are not publicly available in the US. For this reason, US buyout
research is mostly restricted to PTP transactions, and in the PTP transactions it is restricted to
buyouts that issue public debt during private period. However, results obtained from
subsamples of debt issuing buyouts are likely to be biased (Cohn et al., 2014). The UK choice
enhances sample representation and mitigates bias. Moreover, the UK market is the largest

44
buyout market in Europe, enabling us to utilise a larger and more representative sample than
other European markets.
This study has two main objectives. First, we aim to examine the performance of buyouts in
the last decade. This period is chosen due to evolving nature of buyout markets. Second, we
aim to shed light on the performance of non-public-to-private (PTP) buyouts. Stromberg
(2008) reports that private-to-private and divisional buyouts account for 78% of all buyouts
while in 6.7% of the cases a public firm becomes the target of buyout. More efforts need to
be dedicated to explain the motives and consequences of the non-PTP buyouts given their
large share in the buyout market. We use a hand-collected sample of 412 UK management
buyouts completed between 2000 and 2009, of which 308 are private-to-private and 104 are
divestment buyouts. Our study adds to the growing performance studies of non-PTP buyouts,
namely Meuleman et al. (2009), Chung (2011), and Boucly et al. (2011).
The results suggest improvements in industry adjusted profitability and growth following
buyout. The main focus of the post-buyout company is on growth rather than improved
profitability and efficiency. However, we find little evidence that changes in performance are
associated with the MBO transaction. PE-backed buyouts and buyouts in general have an
increasing trend of profitability prior to transaction, where profitability peaks at year -1 and
reverts to year -3 levels several years after buyout, which may indicate practice of earnings
management or selective PE investment prior to buyout. When this potential selection effect
is controlled, the performance improvements disappear. Divisional and full buyouts do not
show substantial differences.6 The results also support the idea of a pecking order exit for
buyouts. Buyouts that successfully complete an exit transaction have higher pre-exit
profitability, lower efficiency and growth than non-exited buyouts. Regression tests confirm
6 Full buyout refers to non-divisional private-to-private MBO in this study.

45
that PE-backing is not positively associated with performance improvements. Leverage;
however, significantly impacts profitability, efficiency and growth despite being low.
The rest of the chapter is organised as follows: Section 2 discusses motives of buyout
transactions and develops hypotheses. Section 3 describes data and methodology, and
discusses sample issues. Section 4 presents empirical results. Concluding remarks are offered
in Section 5.
3.2 Literature and Hypothesis Development
3.2.1 Sources of Buyouts
Jensen (2010) states that managers of public corporations tend to destroy a large part of the
firm value. Post-Second World War regulations eased the monitoring activities of
institutional investors, which resulted in extreme managerial discretion and entrenchment
behaviour to the detriment of shareholders (Fama and Jensen, 1983). In addition, the
dispersed ownership structure made it harder to monitor managers who invest in negative net
present value projects because of aspirations for undue corporate expansion. The investments
in unproductive projects waste free cash flow and the resultant deviation from shareholder
value maximisation creates agency conflicts between managers and shareholders. Going
private in leveraged buyout transactions removes a number of agency issues that exist in the
public company, creating a better form of governance. Essentially, many of the buyouts are
financed partly by debt whose re-payments provide the basis for preventing cash
extravagance. When forced to allocate future cash flows to debt payments, managers are
unable to squander available funds (Jensen, 1986). In addition, they need to create extra value
to assure financiers of their capital. Furthermore, going private creates a concentrated
ownership structure with most of the equity shared between managers and PE investors,
which limits managerial discretion through increasing monitoring activities and provides
managers more incentives to meet company targets.

46
On the other hand, buyouts of private firms already have a concentrated ownership structure
prior to buyout which makes agency motives mostly invalid for undergoing a buyout
transaction. Instead, the rationale for buyout could be such that private companies might be
having financial issues that could be resolved by additional equity or debt capital. Being
unable to stage an IPO or lacking consistent lender relationships, managers of private
companies may think of a third alternative source of capital: private equity. PE firms are
known to have good relationships with banks, and their ability to borrow at lower interest
rates is documented in the literature (Demiroglu and James, 2010). The support of PE would
relax the financial constraints and facilitate the implementation of new projects that would
remain in the waiting list without buyout transaction. In fact, the recent evidence from French
market shows that private-to-private transactions have the strongest post-buyout growth
among buyouts (Boucly et al., 2011). Then managers of private companies who seek further
growth and removal of investment constraints would be better off by taking over the
company with the backing of PE funds. According to Meuleman et al. (2009), succession
issues in private firms can also form the basis for undertaking an MBO. Following the
buyout, latent growth opportunities can be realised in cases where the managers have been
extremely risk-averse. An important element of the MBO is the transfer of knowledge from
PE investors to firm managers (Bruining and Wright, 2002), which would enable
management to avoid a time-consuming learning process. The involvement of PE investor in
the strategic decision-making would also enhance the ability of managers to guide the
company in the right direction.
Contrary to private-to-private transactions, private divisional MBOs have substantial agency
issues prior to buyout. However these issues are related to internal decision systems and
bureaucracy of the parent company unlike the classic agency problems between managers
and shareholders. Fama and Jensen (1983) note that the complex systems of the large

47
diversified corporations may create agency problems in the absence of an efficient internal
control and monitoring mechanism. Additionally, the divisions of large companies might be
restricted in their ability to implement new projects due to central policies of the parent
company (Wright et al., 1994). Thus, the over-diversification of the parent company may
result in the destruction of value that creates an opportunity for division managers to seize.
These companies are expected to grow fast when parental constraints disappear and they
focus on the core business independently. Managers that realise the growth potential in the
division would seek to acquire the company in an MBO transaction. The evidence on
divisional buyouts is scarce. Meuleman et al. (2009) study the changes in profitability and
growth potential of 238 PE-backed buyouts between 1993 and 2003. Their results suggest
that divisional buyouts do not cause significant changes in profitability; however they result
in improvements in efficiency and employment growth. The evidence on corporate spin-offs
also suggests positive changes after a spin-off. For example, Rudisuli (2005) find that market
response to the spin-off announcement is positive, and both parent and former divisions of
parents generate more value following the spin-off.
3.2.2 Hypotheses on Sources of Buyouts
To summarise above discussion, PTP and divisional buyouts might benefit from the reduction
of agency costs and create more value following the buyout transactions with the assistance
of PE investor. Private companies do not suffer from high agency costs since they largely
have a familial ownership structure; however an MBO can be used to solve family succession
issues and a buyout might provide private companies an opportunity to clear financial
constraints. However, we see no reason to think that the subsequent performance of
divestments and private companies will differ. The present literature on buyouts and spin-offs
document performance improvements following the transaction, however it does not provide

48
comparative evidence regarding divisional MBO performance. Accordingly we develop
following hypotheses:
H1: Management buyouts will show improvements in performance following buyout.
H2: Private-to-private and divisional buyouts will not have significant differences in
performance.
3.2.3 Hypotheses on the Role of Private Equity in Buyouts
The importance of PE is manifested in the novel business philosophy they introduced to
markets. Before the emergence of PE, finance and consulting services were two separate
activities provided by separate institutions. Fenn et al. (1997) explain that creators of
organized PE institutions aimed to combine professional counselling and funding activities. It
is this philosophy that gave birth to PE in the first place. Using their unique skills and their
expertise in management, they are able to extract the latent potential that would otherwise
remain unexploited or wasted. Since PE funds hold significant portions of equity, they
actively participate in the decision-making process and appoint board members to ensure that
the portfolio firms create value and progress in the right direction (Gompers, 1995; Cotter
and Peck, 2001). In addition, they have strong incentives to get actively involved in the
implementation of strategies due to the fact that they are obliged to deliver a return to their
investors in a limited time period (Cressy et al., 2007). There is limited evidence on the
operating performance of PE-backed buyouts partly due to difficulties of collecting data
during private status. The existing literature largely suggests that PE investors add value
through specialisation (Cressy et al., 2007) and early PE-backed buyouts outperform non-
buyout counterparts (Kaplan, 1989a; Smith, 1990; Opler, 1992; Weir et al., 2008). Contrary
to the general view, Jelic and Wright (2011) find that PE-backed buyouts do not perform
better than non-PE-backed buyouts.

49
PE firms are known to be temporary investors. Most buyout specialists invest through closed-
end funds which provide them a limited time to extract returns. Fenn et al. (1997) note that
most investors commit capital to PE funds for “strictly financial reasons”; meaning that they
expect to earn above-market return on their capital. Thus ability of PE firms to raise
additional funds is dependent on delivering superior returns to their investors within a limited
time period. To convince their limited partners that their funds are worthy of new capital
commitments, PE firms need to produce a higher return than the average market return.
Therefore they seek to maximise buyout performance and value. The pro-active policies and
superior monitoring skills of PE funds, in general, have positive results for buyout companies
both before and after the exit. The evidence shows that markets view buyouts as promising
transactions. A buyout announcement leads to increases in the stock price of takeover targets
(Renneboog et al., 2007), and buyout firms perform better than their non-buyout counterparts
(Holthausen and Larcker, 1996). The post-buyout performance of the firm also has
considerable influence on the exit decision (Sudarsanam and Nwaghodoh, 2005) and the exit
route chosen. Bienz and Lenite (2008) argue that there exist an exit hierarchy where more
profitable companies are exited through more reputable routes. The remaining buyouts are
those that take more time to restructure or those unfit for a successful exit. It is well-
documented in the literature that positive consequences of buyouts continue to linger after the
PE exit, which is best reflected in the share performance of buyouts going public. Most
notably, stocks of reverse LBOs do not suffer from long run underperformance anomaly after
going public (DeGeorge and Zeckhauser, 1993; Jelic et al., 2005; Cao and Lerner, 2009).
This outcome is primarily attributed to investor confidence in PE firms (Megginson and
Weiss, 1991) and to real improvements in the accounting performance indicators.
The discussion above produces two more hypotheses:
H3: Private equity-backed buyouts perform better than non-backed buyouts.

50
H4: Post-buyout profitability of exited buyouts is better than those staying in their original
buyout form.
3.3 Data and Methodology
3.3.1 Data and Sample
We benefit from two commercial databases and various internet sources in data collection. A
three-step procedure is followed to construct the sample. First, MBO transactions from 2000
to 2009 have been obtained from Thomson One Banker (TOB). Using merger and
acquisitions module, our search resulted in 2,607 UK MBOs.7 This list contains information
about deal date, deal value, target industry and deal synopsis. To identify our sample
companies, we search each company on TOB and drop those that have missing information
on PE backing status, past and future acquisitions on company Extel cards, ending up with
601 transactions. For these 601 firms, we collect deal origin and PE sponsor information from
deal synopsis. Separately, we obtain the list of secondary buyouts and PTP buyouts from
TOB, cross check the samples and drop 46 matching PTP deals and 29 secondary buyouts.
This resulted in 526 remaining MBOs. Table 3-1 summarises the data collection steps.
[Table 3-1]
Necessary financial data to examine operating performance is collected from FAME. Buyouts
often change their names following completion of the deal. For instance, Thales High Tech
Optics changed its name to Qioptiq after a Candover Plc backed MBO in 2005. Many
examples like Qioptiq cause difficulty in tracking companies and often lead researchers to
exclude a large number of deals from their sample. An advantage of using FAME is that it
reports changes in company names, which enables us to track them after buyout. To be
7 The deal coverage of Thomson One Banker is much smaller than that of Centre for Management Buyout
Research (CMBOR). According to CMBOR (2010), over 4,000 MBOs have been completed between 2000 and
2009 while Thomson One Banker reports 2,607 MBOs in the same period.

51
included in the post-buyout performance sample, we require companies to have at least one
year of data –excluding the deal year- after buyout. More generally, we collect data in a (-3,
+5) event window which corresponds to maximum 9 calendar years around the deal. In many
cases accounting items are inconsistently reported; repetitive figures in several consecutive
years are a common characteristic of the data. We discard these years, if not the firms
entirely, to ensure consistency of data. At the end, we are forced to drop 114 deals that don’t
have data on FAME, leaving a final sample of 412 MBOs. The data is unbalanced panel, e.g.
the number of observations is not equal across different years and variables. The number of
observations changes for three reasons. First, buyouts originating from divestment of a parent
company rarely report separate financial statements in pre-buyout years. More commonly,
their performance is absorbed by the parent’s consolidated statements. Second, FAME
provides access to accounting data of UK companies in the last 10 accounting years. This
leads to a loss of pre-event data for early decade deals. This issue was also reported in Cressy
et al. (2007) and Sousa (2010). Third, data attrition is high in the sample. In many cases,
accounting items are intermittently reported across years. To illustrate these three issues, we
report figures from operating income (EBIT). In our sample of 412 MBOs, EBIT is absent
through three pre-buyout years in 119 deals (29%), which could be attributed to data attrition,
divisional buyout effect and/or early decade buyout effect. An extreme example of missing
data would be the cash flow statement. Cash flow from operations is missing through the
entire event window in 217 (53%) of the companies, while EBIT is fully missing in 20 cases
(5%) only.
A final issue is survivorship bias that occurs when successful buyouts leave the sample
several years after the transaction, potentially causing performance deterioration in remaining
buyouts. Buyout firms are often sold to trade buyers or floated on exchange markets several
years after the deal. Less often, they fail and end up in receivership. Inclusion of exited

52
companies in the analysis after their exit would distort the results. Therefore, we exclude
these companies from the analysis in the years following their exit, if the exit occurs during
(+1, +5) event window. Researchers must be cautious when interpreting results since their
exclusion would leave the sample with buyouts that are unable to organise an exit, which is
likely to have a negative impact on the subsequent performance. The survivorship bias is
likely to have more effect in longer event windows since most exits in our sample occur in
the first four years after the deal. We identify exit status of MBOs, exit dates and routes
through PE sponsor websites, www.unquote.com and www.angelnews.co.uk . We also check
the exit status via TOB merger and acquisitions, and London Stock Exchange new IPO
admissions. Lastly, we collect acquisition data from Extel cards previously downloaded from
TOB. A total of 183 exits are identified through these sources. The most popular exit route in
our sample is trade sales with 83 MBOs acquired by trade buyers. Secondary (management)
buyouts are the second popular route with 69 MBOs sold to another PE investor or to the
management. 23 MBOs end up in receivership and finally 8 MBOs are exited by IPO.
3.3.2 Selection and Survivorship Bias
Selection bias arises when a researcher is unable to use the population of interested
companies. There could be several reasons for selection bias. For example, presence of PE
sponsor may introduce a selection bias in the sample, because the investment choice of PE
might not be the result of a random selection process (Katz, 2009; Jelic and Wright, 2011).
The inclusion criteria of the researcher could also introduce a bias to the sample. Prior
evidence shows that VC and PE investors carefully examine candidates and often lend
backing to those with strong growth prospects (Chung, 2011). In this case, performance
analysis would be upward biased and buyouts would outperform their non-buyout
counterparts. One way to avoid this bias is to use non-PE-backed buyouts. However, this
approach would neglect the value added provided by the experience and specialisation of PE

53
sponsor. The major commercial databases are known to have specific size thresholds and
other inclusion criteria, which could force researcher to drop a portion of the companies of
interest and introduce a selection bias. In the US, the potential for selection bias is stronger in
buyout research because financial reporting is mandatory only for private companies that use
public debt (e.g., Katz, 2009). In order to enlarge the sample size and cover more of the
buyout transactions, researchers often need to use voluntarily reported financial accounts
which are likely to be upward biased in terms of performance. The UK buyouts should suffer
less in this aspect because regulations require private companies to report financial accounts
without regard to their financial situation and type of the debt used. Therefore, UK buyout
studies are able to use relatively larger portion of the population available, which would
mitigate selection bias.
The existing literature suggests three ways of handling selection bias. The comparison of key
ratios from population and final samples can be useful to examine bias caused by inclusion
criteria (Smith, 1990; Wang, 2010), and 2-stage regressions with Heckman’s (1979)
correction term are used for bias caused by PE sponsors investment choice (Cressy et al.,
2007; Nikoskelainen and Wright, 2007; Cao, 2008; Katz, 2009; Jelic and Wright, 2011).8 In
the US studies, selection bias is also addressed by re-examination of performance using only
buyouts with publicly held debt (Kaplan, 1989a; Guo et al., 2011). In addition, performance
benchmarks can be constructed in a manner that mitigates selection bias. Matching buyouts
on firms with similar pre-event characteristics would give us an approximation of an
alternative PE-backed sample. One way to construct such industry group is matching on firms
with similar pre-event performance as suggested by Barber and Lyon (1996). Then buyout
performance should be largely purified of selection bias and the analysis would better reflect
the marginal contribution of PE sponsors. Alternatively, a differences-in-differences
8 See Li and Prabhala (2005) for a review of selection models in corporate finance.

54
approach can be used. In this study, differences-in-differences and Heckman 2-stage
regressions are used to address selection bias.
Survivorship bias occurs when a portion of the sample firms exit and subsequently dropped
from the sample in the analysis of post-exit years since they are no longer buyouts. Contrary
to mutual funds where low performers are dropped, the majority of non-survivor buyouts are
successful ones which causes a downward biased estimate of buyout performance in the years
subsequent to exit. In our sample, failed non-survivors (receivership exits) comprise 12% of
all exits while successful ones (trade sale, secondary buyout and IPO exits) constitute 88% of
all exits. Survivorship bias is difficult to deal with and literature does not suggest a certain
way to address it. It is often the case that survivorship bias is acknowledged rather than
claiming to eliminate it completely. Less often, authors argue that successful and
unsuccessful exits offset each other (e.g., Caselli et al., 2011), eliminating the bias. In our
view, this approach makes a far-fetched argument. As previously mentioned, successful exits
outnumber failure exits which would likely cause a downward biased estimate of subsequent
performance rather than delivering a balanced estimate. As an alternative approach, survival
time of buyouts (TIMEX) can be computed and argument can be made based on mean and
median TIMEX. For example, Guo et al. (2011) state that the first three post-buyout years are
the most informative because PE sponsors conduct most of their restructuring activities
during this period and begin to seek exit after the third year. In our sample, mean TIMEX is
48 months and median TIMEX is 47 months for 183 exits. 70% of all exits occur within five
years after buyout transaction, 51% occur within four years, 37% within three years and 5%
within one year. As shown in Table 3-4, mean and median TIMEX for trade sale, secondary
sale and receivership exits are around four years. In the light of this information we argue that
the first four post buyout years are likely to suffer less from survivorship bias and the results
for these years should correctly reflect the status of the average buyout. The IPO exits have

55
shorter survival time; however this is unlikely to affect the conclusion due to their low count.
All in all, it is vital that analysis of performance is terminated at exit and non-survivors are
dropped from the sample to prevent dilution of results by already exited buyouts.
3.3.3 Methodology
We construct performance benchmarks following Barber and Lyon (1996). The majority of
studies that examine post-buyout performance rely on industry adjusted performance models
(e.g., Kaplan, 1989a; Weir et al., 2008). Although industry adjustment offers the benefit of a
direct comparison with similar companies, it ignores past performance of sample companies
which can influence performance in subsequent years. Barber and Lyon (1996) document that
expected performance models incorporating firm past performance always dominate those
that exclude past performance. However, depending on the underlying theoretical background
and formulated hypotheses, both models can reveal useful and informative results for the
researcher. Therefore, we employ two models of abnormal performance in the light of the
presented hypotheses, suggestions of Barber and Lyon (1996) and previous studies.
The first model of expected performance is a buyout firm’s past performance.
E(Pi, t) = Pi, t-k; t= 1, 2, 3, 4, 5 and k= 1, 2, 3.
(1)
Where E(Pi, t) represents expected performance of a buyout company and Pi, t-k 3-year median
of a certain variable prior to buyout. The abnormal performance is then estimated as:
Actual – Expected: APi, t = Pi, t - Pi, t-k.
(2)
The second model uses industry median in each event year as expected performance:
E (Pi, t) = PIi, t; t= 1, 2, 3, 4, 5. Then,

56
APi, t = Pi, t - PIi, t,
(3)
where PIi, t represents median industry performance.
We first calculate relevant ratios in each event year for each buyout firm. Then we compute
3-year pre-buyout median for each ratio in order to use in performance benchmark. For the
second model we first identify matching industry firms based on 2-digit SIC code. Finally,
we compute relevant ratios for each firm and calculate median performance for each industry
group. When buyout and control sample 2-digit SIC codes cannot be matched, we use
industry medians for the entire control sample. To construct industry control groups, we use
the population of active and inactive private companies with available accounting data.
Active and inactive samples are merged since benchmarking on active companies alone
would overestimate industry performance, which would result in downward biased estimates
of post-event buyout performance. Similarly, benchmarking on inactive companies alone
would result in upward biased estimates of performance. Therefore, a merger of active and
inactive samples provides a more balanced performance benchmark. We assess the
significance of the results with Wilcoxon signed rank test for medians.
[Table 3-2]
Table 3-2 shows definitions for the set of profitability, efficiency and growth variables we
employ to measure performance. Specifically, the variables are constructed as follows:
Profitability (ROA) = Earnings before interest and tax divided by total assets, profitability
(ROS) = Earnings before interest and tax divided by sales, leverage (LEV) = Short term debt
and overdrafts plus long term liabilities divided by total assets, sales efficiency (SALEFF) =
Sales divided by total assets, employee efficiency (SALEMP) = Inflation adjusted sales
divided by number of employees, asset growth (AGRO)= The difference between total assets

57
and 3-year median assets prior to buyout divided by their average, sales growth (SGRO) =
The difference between sales and 3-year median sales prior to buyout divided by their
average, profit growth (EBITG) = The difference between earnings before interest and tax
and 3-year median prior to buyout divided by their average, employment growth (EMPG) =
The difference between number of employees and 3-year median prior to buyout divided by
their average. For industry adjusted performance models, growth ratios (AGRO, SGRO,
EBITG, EMPG) are computed as the difference between year t and t-1, divided by their
average value following Boucly et al. (2011). This is due to differences between the two
models; industry adjusted performance considers a cross-section of time while adjusting on
pre-buyout performance involves time series.
3.4 Empirical Results
3.4.1 Descriptive Statistics
Table 3-3 displays the number of MBOs across years and statistics for sample representation.
We report Kolmogorov-Smirnov (K-S) test for sample representation and separately test
equality of deal values for potential size bias. The population tends to have a higher number
of MBOs in the early years and the numbers tend to decrease towards the end of the decade9.
The final sample, however, is heavily dominated by the mid-decade buyouts which may
imply a selectivity issue in our process. The K-S statistic on yearly number of MBOs
suggests significant difference between population and final sample (p=0.000). There are also
differences regarding information disclosure between population and final sample. 43.7% of
the population firms report deal values while this ratio is 51.7% in the final sample, which
may result in a small selection bias introduced by the information availability. However the
difference in disclosure distributions is not significant (p= 0.152). The disclosure rates across
9 The decrease in deal numbers is in line with the UK trends reported by CMBOR (2010), which shows a
declining trend in the number of deals starting with 536 MBOs in 2003 and ending with 262 MBOs in 2009.

58
years also suggest that PE firms are becoming more secretive about deals, which is reflected
by a sharp decline from 55% disclosure rate in 2000 to 21% in 2009. The mean (median)
buyout size, measured by enterprise value, is $88 ($16) million for population and $71 ($28)
million for final sample. The sample median is considerably smaller than £30 million
reported by Jelic and Wright (2011), however larger than £10 million reported by Chung
(2011). PE-backed buyouts tend to be larger than non-PE-backed buyouts; however the
differences in means and medians are statistically insignificant. The differences in buyout
size are partially caused by exclusion of large PTPs and very small private deals, which is
reflected in the reduced variation of final sample. Tests for equality of mean and medians also
confirm more homogenous composition of final sample; the difference in means is
insignificant (p=0.420) while medians are confirmed to be different (p=0.000). It should be
noted that only MBOs with disclosed deal values can be included in the size statistics. The
tests also suggest significant differences between the industrial distributions of population
and final sample. In short, the statistics in Table 3-3 show that the final sample is not a good
representation of the population and sample selection procedure and data limitations
introduce bias to the process.
[Table 3-3]
Table 3-4 reports the exits and the distribution of exit routes across PE backing and source of
buyouts. There are 253 PE-backed MBOs versus 159 pure MBOs in the sample. Full MBOs
outnumber divestments, with 308 and 104 deals being buyouts of private companies and
divestments respectively. Trade sales and secondary buyouts are the most popular exit routes,
while the number of receivership and IPO exits is considerably smaller. PE-backed buyouts
account for 80% of the all exits while non-PE-backed MBOs constitute 20% of exits.
Interestingly, PE-backed buyouts stay in the original buyout form for longer periods.
Unreported statistics show that median holding period is 48 months for PE-backed buyouts

59
while it is 37.5 months in non-PE-backed buyouts. This finding contrasts with Jelic (2011)
who reports that PE-backed buyouts tend to exit faster. IPO and receivership are the fastest
and slowest exit routes respectively. Trade sale and secondary buyout exits occur around 4
years after the initial buyout transaction. The median holding period for all exits is 47 months
which is longer than 36 months found by Jelic (2011) and 42 months reported by Stromberg
(2008). This pattern is expected due to characteristics of the period of interest in this study
that exhibits an increasing trend for longer holding periods (Stromberg, 2008) and since
arranging a successful exit has become more difficult in the second buyout wave (Sousa,
2010; Bonini, 2015), which would result in delays on the part of PE sponsors who seek more
appropriate exit conditions. In line with this scenario, the IPO route, which involves shorter
holding periods relative to secondary buyout exits (Jelic, 2011) and often includes quick flips
(Stromberg, 2008; Jelic, 2011), is less frequently used in the recent UK buyout market
(CMBOR, 2010). Only a fraction of total exits in our sample are going public buyouts while
IPO exits constitute a larger portion in other studies that cover both first and second buyout
waves. For example, 42% of total exits are comprised of IPO in Jelic and Wright (2011)
while in our study 4% of buyouts exit via IPO route. In sum, different sample and exit
characteristics result in longer holding period for our sample MBOs.
[Table 3-4]
Panel A of Table 3-5 shows the sectoral distribution of sample MBOs across PE-backing, exit
status and exit routes. Buyouts are concentrated in three major industry groups: Business and
Industrial, Consumer, Business Services. These industries constitute 69% of all deals and
58% of the total transaction value. The largest buyouts are in Energy and Financial Services
industries accounting for 7.5% of deals and 24% of deal value. Our industry composition is
similar to previous UK studies of Weir et al. (2008), Jelic and Wright (2011), and Chung
(2011). Overall, the concentration of buyouts in certain sectors is consistent with the view

60
that buyouts mostly occur in mature industries such as chemicals, machinery and retailing
(Stromberg, 2008). Panel B reports the K-S test statistics for equality of industry distributions
across PE-backing, exit status and routes. The results do not suggest significant differences in
industry compositions with the exception of IPO exits.
[Table 3-5]
To summarise, our descriptive statistics suggest significant differences between population
and final sample. In addition, less information tends to be disclosed about MBO transactions
towards the end of the decade. This is unlikely to be a result of database issues since known
commercial databases offer better coverage for more recent periods (Jelic and Wright, 2011).
Rather, it might reflect increasing reluctancy of PE funds and MBO teams to disclose
information in line with the difficult market conditions. PE-backed buyouts have higher exit
rates and longer holding periods compared to pure MBOs. Finally, PE firms maintain their
core investment base of industries despite the evolution of buyout market.
3.4.2 Performance of Management Buyouts
Table 3-6 presents abnormal performance for the entire sample. In the first model only post-
buyout performance can be measured since the performance is benchmarked on pre-buyout
period. The results for industry adjusted performance are presented for (-3, +5) window. Our
findings provide little evidence of improvements in profitability. Changes in return on assets
are insignificant while positive changes in return on sales are small (H1). Buyouts outperform
industry firms in every year; however better-than-industry performance is not limited to post-
buyout period. There is a tendency for improvements in profitability in the years leading to
buyout, peaking at one year before the transaction, which could imply practice of earnings
management prior to buyout. This result contrasts with Boucly et al. (2011), who find low
pre-buyout profitability followed by 4% increase subsequent to transaction for a sample of

61
French private-to-private LBOs. This pattern may also suggest that profitability plays a role
in selecting the buyout target. Although this study does not distinguish between these two
explanations, the evidence shows that post-buyout profitability remains superior in the long
run. The findings on employee efficiency suggest slight improvements and consistently better
utilisation of employees in both pre- and post-buyout periods than industry firms. There is a
sharp deterioration in sales efficiency after buyout; however this result is attributable to the
increasing asset growth rate. The sample buyouts exhibit substantial growth following the
transaction. The median buyout has 60% more assets and 40% more sales by the end of fifth
year. The increase in assets is consistently significant in five years while sales growth stops
after third year. Similarly, buyouts exhibit significantly higher growth rates than industry for
three subsequent years following the deal. There is also evidence of improvements in profit
growth; however the growth in profit remains at industry levels. Finally, buyouts exhibit
large increases in the number of employees. The employment increases by 24% in the first
three post-buyout years and slightly declines afterwards. The median buyout displays
approximately 4% higher employment growth than comparable firms in the first three years
following buyout. The employment growth prior to buyout is smaller and insignificant,
suggesting adoption of more growth-focused strategies subsequent to buyout.
[Table 3-6]
In sum, results lend mixed support to H1. Buyouts show positive performance changes in
terms of return on sales, employee efficiency, and growth rates. However the magnitude of
improvements appears to be much smaller than those documented for the first wave buyouts.
In line with Boucly et al. (2011), the results suggest that post-buyout strategies are more
growth oriented and put less focus on profitability and efficiency improvements. The results
are also consistent with Chung (2011) and Jelic and Wright (2011) who find weak efficiency

62
accompanied by high growth in sales and employment in UK buyouts. Although our results
related to post-buyout performance are similar to existing recent evidence, we provide the
first evidence that that some of the changes in performance are not specific to post-buyout
period. Specifically, the increasing pattern of profitability prior to MBO indicates that buyout
transaction alone cannot explain performance. In this regard, other potentially influential
factors such as earnings management, mean reversion and PE-backing should be considered.
Below we examine the performance of PE-backed and non-PE-backed MBOs.
[Table 3-7]
Table 3-7 displays the performance of PE-backed buyouts. PE-backed buyouts do not
improve profitability; however they maintain superior profitability over comparable industry
firms. The first three years have the highest abnormal performance, and profitability revert to
pre-buyout levels after fourth year. Both models suggest considerable deterioration in
efficiency following buyout. Improvements in employee utilisation are not significant while
sales efficiency drops below pre-buyout levels immediately after the deal. There is also
strong evidence of high growth in assets and sales; however these changes are limited to the
first three post-buyout years. Although profits increase by more than 80% by the end of fifth
year, growth in profits remains at industry levels. The number of employees increases by
26% in the first four years; however buyouts hire more employees than non-buyouts only in
the first and third years.
[Table 3-8]
Table 3-8 reports performance differences between PE-backed and pure MBOs. PE-backed
buyouts have higher profitability starting from two years prior to buyout and persisting until
the fourth post-buyout year. This finding implies that PE funds assess the prospects of their
targets relative to their industries and tend to select those with promising potential. Overall,

63
PE-backed buyouts consistently have higher profitability and growth ratios, but lower
efficiency than pure MBOs. The results for profitability and growth are consistent with
Cressy et al. (2007), but different from Jelic and Wright (2011) who find that PE-backed
buyouts perform better only in terms of changes in employment. In contrast, we find
significant differences in profitability, efficiency and growth rates between PE-backed and
pure MBOs. Therefore, H3 cannot be rejected. It is important to note that these differences are
observed only in terms of industry adjusted performance, which does not measure
performance changes or value added by PE funds. More importantly, differences in both
profitability and efficiency are observed starting from up to three years prior to buyout.
Hence it cannot be concluded that the observed differences are a result of PE-sponsorship.
Rather results imply that differences are associated with firm characteristics, which may
encourage PE firms to apply a selection effect in their investments.
[Table 3-9]
Table 3-9 presents performance of full and divestment MBOs. We provide the first direct
analysis of divisional buyouts and their comparison with full buyouts. To our knowledge, the
only studies to examine performance of divisional buyouts are Meuleman et al. (2009) and
Boucly et al. (2011) who use a set of similar performance measures; however at the same
time fail to track performance over time. Meuleman et al. (2009) examine the effect
divisional buyouts by means of dummy variables in regressions; however do not conduct
univariate tests to observe changes or improvements in performance through time. Moreover,
their sample consists of PE-backed buyouts only, which is likely to reduce information
asymmetries across sample firms and introduce selection bias, potentially resulting in more
uniform results across sample; an issue they also acknowledge. Their definition of divisional
buyout dummy also does not correctly reflect the full vs. divisional buyout distinction since
the other category in their dummy variable includes secondary buyouts as well as private-to-

64
private buyouts, which have different buyout characteristics. Similarly, Boucly et al. (2011)
rely on regressions to analyse effect of LBO on divisional buyouts. A more comprehensive
examination of full and divisional buyouts is therefore required. The results in Table 3-9
show that full MBOs perform better than industry in terms of profitability, efficiency and
growth with the exception of profit growth. The better performance in profitability and
efficiency is maintained until fifth year, while growth ratios begin to decline after third post-
buyout year. Notably, the increase in pre-buyout profitability peaks at one year before buyout
and similar levels of profitability are preserved following the transaction. Divisional buyouts
draw a less clear picture. Their pre-buyout profitability is inconsistent and post-buyout years
are accompanied by decreasing profitability levels. Among two efficiency measures, only
employee utilisation is significantly positive. There is also weak evidence of better post-
buyout growth. The growth in assets and sales are significant in the first two years, while
profit and employment growth are not significantly different from industry. This result is
inconsistent with the view that divisions will grow fast following the removal of parental
restrictions (e.g., Wright et al., 1994).
[Table 3-10]
Table 3-10 shows differences in full and divisional MBOs. In general, full MBOs have better
profitability, lower efficiency and higher growth than divestments. However, the differences
in performance are only marginally significant. Consistent with H2, there is little significant
difference between full MBO and divestment MBO performance.
[Table 3-11]
Panel A of Table 3-11 shows the performance of exited buyouts. In general, buyouts exits are
characterised by high profitability, weak efficiency and slow growth rates. Return on assets
and return on sales consistently outperform industry peers in every post-buyout year while

65
the low post-buyout growth is limited to the first three years. In contrast, buyouts staying in
their original form have lower profitability ratios but consistently stronger efficiency and
growth rates than industry peers. Comparison of the two groups reported in Table 3-12
confirms the differences in profitability and efficiency, however the results on growth is
mixed. This result is consistent with Bienz and Lenite (2008) in that a pecking order of
profitability exists in buyout exits. The results imply that investors that are able to achieve
higher profitability rates facilitate their exit from buyout. On the other hand, buy-and-hold
investors develop long term strategies by focusing on improved efficiency and high growth,
which might be harvested in the form of higher valuation in the future.
[Table 3-12]
3.4.3 Differences-in-Differences
In the prior section we examined MBO performance relative to pre-buyout company and
comparable industry firms. Although these two measures of performance provide useful
observations regarding pre-post buyout changes in performance and how MBOs perform
compared to non-buyouts, they do not measure how MBOs perform relative to industry firms
through time. To illustrate this point, pre-buyout adjusted performance measures changes
through time and ignores how industry performs in the corresponding time period. In the
same vein, industry adjusted performance ignores changes in time and measures performance
relative to comparable firms at a point of time. In other words, pre-buyout adjustment
considers only time-series while industry adjustment confines the analysis to cross-sections.
Since our data carries the properties of an unbalanced panel, it is a sensible approach to
combine these two dimensions and conduct a differences-in-differences analysis which will
enable us to simultaneously measure performance relative to pre-buyout firm and industry.
[Table 3-13]

66
Table 3-13 presents the differences-in-differences analysis for full sample MBOs. The
performance is measured for post-buyout years only since the post-buyout performance is
benchmarked on pre-buyout performance. Consistent with previous results, we find no
significant improvement while there is evidence of deterioration in performance. While most
measures show negative changes, the performance deterioration most visibly manifested in
the proxies for profitability (ROA), which is negative and significant in all years except year
4, and sales efficiency (Saleff). In highly levered deals, the decrease in profitability can be
attributed to debt repayments, which would have been represented by higher leverage in early
years and lower in later years. However, we find no evidence of higher leverage for private-
to-private buyouts. On the contrary leverage remains flat and low through most of the post-
buyout period. Similarly, asset growth (AGRO) and sales growth (SGRO) are mostly
negative and insignificant. The results suggest that private-to-private buyouts are
characterised by low leverage and growth. While they outperform the industry firms
following buyout transaction, this result is not associated with performance improvements or
the perception of buyout superiority (e.g., Jensen, 1989), rather they are mostly attributable to
pre-buyout firm performance characteristics and when pre-buyout performance is accounted
for, significant drops in performance are observed.
[Table 3-14]
The results for the subsample of MBOs with PE sponsors are presented in Table 3-14. Results
of two sample tests for the equality of PE-backed and non-PE backed MBOs is also presented
in the third row of each variable. Contrary to expectations, PE sponsors add little or no value
to their portfolio firms. PE-backed MBOs are accompanied by negative levels of profitability
in all post-buyout years up to 5 years and significant differences are observed between PE-
backed and non-PE-backed MBOs in terms of ROA and employee efficiency. PE-backed
MBOs underperform non-PE-backed buyouts in both measures of performance. Note that this

67
result is observed despite the fact that PE-backed companies outperform both comparable
non-buyout firms and non-PE-backed MBOs in industry adjusted performance measures
(Table 3-7 and Table 3-8). The findings related to full sample are consistent with recent
evidence from Weir et al. (2008) and Guo et al. (2011) who find that value generation has
become harder for recent buyouts. The results related to PE-backing are consistent with
Chung (2011) and Jelic and Wright (2011) who show that PE firms do not improve profit and
efficiency margins. The results are discussed in more detail in the following section.
3.4.4 Discussion of Results
Early studies on buyouts find large and significant performance improvements following
transaction (e.g., Kaplan 1989a, Smith, 1990). More recent studies, however, paint a less
positive picture regarding post-buyout performance. Guo et al. (2011) for example, find that
post-buyout performance is mostly comparable to industry firms and not better. Weir et al.
(2008) show deterioration in performance following buyout. Similarly, Chung (2011) and
Boucly et al. (2011) find that buyouts are focused more on growth than profit. The theoretical
basis for all these studies is provided by Jensen (1986, 1989) who suggests that buyout is a
superior form of ownership. Based on the theoretical and empirical evidence, we proposed
and tested four hypotheses.
If one lesson is to be drawn from existing broad evidence on buyouts, the buyouts are
heterogeneous and they do not offer a guaranteed uniform performance. Recent studies tend
to take into account different forms of buyouts and acknowledge their effect in the
performance properties. Desbrieres and Schatt (2002) for example, acknowledge that their
sample of French buyouts do not show large performance improvements similar to those in
the US and UK since their sample consists mostly of private family originated buyouts and
divestments while most US and UK studies are conducted on samples of publicly listed

68
companies. Cohn et al. (2014) also acknowledge and document for the first time that different
performance results are obtained when the sample is restricted to public debt issuing buyouts,
and when full sample performance is observed. Except Cohn et al. (2014), all US studies are
restricted to public debt issuing buyouts in their performance analysis since private company
data is not available in the US unless they issue public debt. Another important point of
difference is to distinguish between public-to-private and private-to-private buyouts.
Although buyout superiority can be proposed for most types of buyouts as an inclusive
phenomenon, PTP and private-to-private buyouts have substantial differences and
motivations to undertake a buyout, which are also reflected in their post-buyout performance.
Concentrated pre-buyout ownership, low leverage utilisation compared to PTP buyouts (e.g.,
Desbrieres and Schatt, 2002) and frequent occurrence of MBO due to family succession
issues (e.g., Howorth et al., 2004) are three key distinct characteristics of private-to-private
buyouts. Of these, low utilisation of leverage reduces the pressure on managers to perform
well since there is less debt to be repaid. Concentrated pre-buyout ownership removes one of
the pillars of buyout superiority argument, since it proposes that conversion of pre-buyout
firm from dispersed ownership to concentrated ownership will mitigate agency problems and
improve performance. In most private firms, the ownership structure does not undergo such
transformation during buyout, hence the advantages -e.g., performance improvement
following buyout- will be limited since there is little agency problem (e.g., Fama and Jensen,
1983) resulting from ownership structure which can be solved through a buyout. As far as
buyouts originating from family businesses concerned, they are likely to be undertaking a
buyout since there is no viable successor among family members. These distinct
characteristics of private-to-private MBOs would indicate that there is less agency conflict to
be solved and consequently less room for performance improvement relative to public-to-
private MBOs. The effect of these differences can be observed in studies that employ

69
comprehensive private-to-private or mixed buyout samples in the research (e.g., Desbrieres
and Schatt, 2002; Chung, 2011, Boucly et al., 2011; Jelic and Wright, 2011). Documented
performance improvements in these studies are substantially lower than studies that use only
public-to-private buyout samples (e.g., Kaplan, 1989a; Smith, 1990; Opler, 1992). Although
the large improvements in public-to-private samples can be partly attributed to upward biased
estimates of performance in those studies since they are confined to subsamples of public
debt issuers which are likely to bias performance upwards (Cohn et al., 2014), the role of
above-mentioned differences between private and public companies in the trajectory of post-
buyout firm cannot be overstated.
Our results in general show that although buyouts outperform industry, they are not
accompanied by performance improvements following MBO. Moreover, better-than-industry
MBO performance is not associated with buyout transaction; rather MBO candidates
outperform comparable non-buyout firms starting from two years prior to buyout. Therefore
H1 is rejected. The findings lend support to the proposition regarding the differences between
divestment and full buyouts. We find that performance differences between full and
divestment MBOs are minor and not significant in conventional levels. Hence H2 is
supported. The hypothesis related to the contribution of PE funds is given support in terms of
industry adjusted performance measures; however it is worth noting that PE-backed firms do
not become profitable following MBO. On the contrary, more profitable firms tend to be
targeted by PE funds and subsequently even though their profitability levels suffer a decline,
they remain higher than non-PE-backed buyouts. When this selection effect is controlled
(e.g., by differences-in-differences) they perform no better than non-PE-backed buyouts.
Therefore H3 which projects a better performance for PE-backed buyouts is rejected. The
findings related to successful buyout exits and non-exits also support H4, which suggests that
successfully exited buyouts tend to be more profitable during their buyout period. The results

70
related to PE-backing and buyout performance in general contrast with the overall tendency
in the literature that projects a positive role for buyouts and PE funds (e.g., Kaplan, 1989a;
Opler, 1992; Cressy et al., 2007). Our results; however, more consistent with a developing
literature that acknowledges buyout heterogeneity and recognises the utilisation of potentially
upward biased samples in public-to-private buyout research (e.g., Desbrieres and Schatt,
2002; Meuleman et al., 2009; Jelic and Wright, 2011; Chung, 2011; Cohn et al., 2014).
Apart from firm and sample characteristics, two other explanations can be provided for the
observed performance patterns. One possible explanation is examined by Cohn et al. (2015)
who show that performance improvements following buyout might be due to mean reversion
in profitability rather than real improvements. In this scenario, lower post-transaction profit
levels could be observed for buyouts with high pre-transaction profitability. Since PE funds
tend to target more profitable companies before transaction (Table 3-8), it is likely that the
observed decline in profitability for PE-backed MBOs is due to mean reversion. In addition,
accrual reversals could also be driving the performance changes following transaction in the
presence of earnings management. The literature shows that managers involved in MBO
deals engage in earnings management prior to transaction (e.g., Perry and Williams, 1994).
Although we do not elaborate on these explanations in this chapter, we test for earnings
management scenario and its effect on the performance in the subsequent chapter. In either
scenario, however, evidence points that buyouts are not superior performers and little credit
can be attributed to PE firms for their contributions in improving performance.
3.4.5 Determinants of Performance
We examine value creation mechanisms by means of ordinary lest squares (OLS) regressions.
Previously, our performance analysis indicated that PE-backed buyouts are significantly
different from pure buyouts. Important to this finding is the superior pre-buyout performance
of PE targets, which is likely to reflect a selectivity issue in the sense that PE funds invest in

71
firms with better profitability. To address potential selection bias in the sample, we employ a
2-step regression commonly referred as Heckman procedure. The procedure involves
estimation of a probit model to explain determinants of PE investment, where a PE dummy is
dependent variable. Then the probability of receiving PE investment is calculated from the
probit as the inverse Mills ratio and added to the following regressions as explanatory
variable. We model PE-backing as a function of buyout origin, industry, age, pre-buyout
profitability and size. The industry dummy (Services) is motivated by Stromberg (2008) who
reports that buyouts are concentrated in traditional industries. The divestment dummy
(Divest) is inspired by Wright et al. (1994) who project a stronger performance for
divestments in the wake of the removal of parental restrictions. Pre-buyout performance
variable (PreROA) is added due to the fact that PE-backed firms might target firms with
superior profitability. Size variable (LnSize) is motivated by the fact that PE-backed buyouts
tend to be larger than non-PE-backed buyouts (Stromberg, 2008). Finally, a company age
variable is added to the right hand side since PE firms are more likely to invest in mature, late
stage companies (e.g., Katz, 2009). All variables are defined in Table 3-2. This results in the
following probit model:
PEi = α + β1Divesti + β2Servicesi + β3PreROAi + β4Agei + β5LnSizei + Ɛi (4).
In the second stage regression, we model performance as a function of PE sponsorship,
leverage (LEV), change in leverage (∆LEV) and buyout origin (Divest). Dependent variables
are changes in industry adjusted profitability (ROA), sales efficiency (Saleff) and asset
growth (AGRO). As in Guo et al. (2011) we control for pre-buyout ROA in profitability
regressions. Following Jelic and Wright (2011) we also control for high growth industries
(h1, h2, h3) since they might have different performance properties. Other controls include a
size control and a crisis dummy is included to control for changes in recession years. Fitted

72
probability of receiving PE investment (Lambda) is included to control for selection bias. All
variables are defined in Table 3-2. The following model is estimated:
Perfit = α + β1PreROAi + β2PEi + β3LEVi + β4∆LEVi + β3Divesti + β4LnSizei + β5Crisisi +
β6Lambdai + β7h1i + β8h2i + β9h3i + Ɛit (5).
[Table 3-15]
The results of the probit are reported in Table 3-15. PE investment is positively associated
with the size (LnSize) and industry (Services) of buyouts. The size and industry coefficients
are significant at conventional levels while Age coefficient is only marginally significant.
Multivariate regressions for determinants of changes in profitability, efficiency and growth
for three post-buyout years are presented in Table 3-16. The variation explained by models
(R2) ranges from 13.26% for efficiency regression to 76.19% for profitability regression. All
models are significant at 1% level. The first three columns show that changes in profitability
are associated with PE dummy, level of leverage and change in leverage. While the univariate
tests in Table 3-6 and Table 3-13 do not show large and significant increases in leverage,
regression results indicate that leverage and change in leverage are positively and
significantly related to profitability. The large and positive coefficients on both variables
imply that existence of debt exerts a disciplinary pressure on managers to perform better.
Consistent with univariate results in Table 3-13, PE-backing dummy is negatively associated
with changes in profitability after controlling for selection bias. Although the negative
coefficients are only marginally significant, they indicate that PE-backed buyout profitability
is 14% and 24% less than non-PE-backed buyouts in year 1 and year 3. Buyout origin
(Divest) appears unrelated to changes in profitability. The selection control lambda is
significant at 1%, highlighting the importance of controlling for selection bias. Pre-buyout
profitability and size controls are also significantly associated with changes in profitability. In

73
the efficiency and growth models, only leverage change is significantly associated with
performance. The coefficients on ∆LEV variable remain large in both models; however they
carry opposite signs. In the efficiency model, the positive sign of ∆LEV coefficient indicates
that increasing debt levels have a positive effect on the sales efficiency. On the contrary, the
negative sign of ∆LEV in growth model shows that increasing debt levels have an adverse
effect on growth. Both results are consistent with Jensen’s agency view of buyouts in the way
that higher debt levels apply pressure on managers to create value through improving
efficiency and allocation of cash to debt payments delays new investments and hamper
further growth. They are also consistent with the results of Guo et al. (2011) and Cohn et al.
(2014), who project a similar role for leverage in the post-buyout firm. Contrary to prior
literature on divestment buyouts that they are likely to grow fast following buyout transaction
(Wright et al., 1994) and improve efficiency (Meuleman et al., 2009), we find no significant
relation between divestments and changes in growth and efficiency. Divestments are
associated with growth only in the first year following buyout. Selection control lambda is
only significant in profitability regressions and insignificant in efficiency and growth
regressions, indicating that PE firms tend to target firms that have higher profit ratios relative
to industry average. However, regression results do not show a significant role for PE firms
in improving efficiency or facilitating company growth.
[Table 3-16]
We repeat the regressions using raw performance changes (pre-buyout adjusted. The
economic and statistical interpretation of the results remains the same. Lambda, however,
becomes insignificant in the profitability model. This result is expected since PE selection is
expected to be associated with relative performance with industry firms, rather than raw
performance. We also repeat the tests excluding Heckman correction term Lambda. The

74
results remain the same except for PE dummy which becomes significant at 1% level. This
shows the importance of controlling for selection bias not to draw misleading conclusions.
Overall, the regression results are consistent with findings in univariate tests. We find that PE
backing is not associated with performance improvements in terms of profitability and
efficiency, and it is not significantly associated with growth. The main driver of performance
appears to be leverage change which is significant in all regressions. Consistent with previous
results, divestment buyouts are not associated with a differential effect on performance. The
results related to PE-backing contrast with a major part of the prior literature (e.g., Kaplan,
1989a; Smith, 1990; Opler, 1992; Cressy et al., 2007) who find that PE firms improve
performance by adding value. The results are more consistent with recent studies that show
little or no improvements in performance following buyout (e.g., Desbrieres and Schatt,
2002; Weir et al., 2008; Guo et al., 2011; Jelic and Wright, 2011). As discussed in the
previous sub-section, this outcome is attributable to distinct sample and buyout characteristics
used in previous studies as well as potential mean reversion and earnings management.
3.5 Conclusion
This study examines the performance of management buyouts using 412 UK companies from
the last decade. In recognition of the heterogeneity of buyouts we differentiate between PTP,
private-to-private and divestment buyouts. While MBOs outperform comparable non-buyout
firms in general, we find no significant performance improvement following buyout
transaction. PE-backed firms have better profitability and growth rates while pure MBOs
have better efficiency. However, PE-backed buyouts outperform non-PE-backed buyouts and
industry peers starting from two years before transaction, suggesting that these findings are
not due to contribution of PE funds in terms of governance and value creation. Rather we find
that PE funds undertake selective investments by targeting firms with better performance.
Although changes in leverage are low; leverage is still a significant driver of post-buyout

75
performance. The buyout profitability in general is the highest in the year preceding buyout
transaction which may indicate practice of earnings management. In line with Boucly et al.
(2011) we find that full MBOs have better profitability and higher growth rates. Nonetheless,
performance differences between divisional and full MBOs are largely insignificant. Finally,
we find evidence in support of Bienz and Lenite (2008) who argue that profitability is the
most important driver of exit choice. We document that exited buyouts have higher post-
buyout profitability, but lower efficiency and growth compared to non-exited buyouts. The
results of multivariate regressions are consistent with the univariate results which suggest that
PE-backing is not a significant determinant of performance, while PE selection must be
controlled. Leverage is the main driver of performance changes, while differences between
divisional and full buyouts appear irrelevant. Future studies may explore earnings
management practice prior to buyout deals and the effect of accrual reversals on performance.
This may also help explain the high profitability preceding buyouts and distinguish between
PE selection and earnings management scenarios.

76
Table 3-1: Sample Selection
This table presents an overview of our sample selection process. We follow a three step procedure to collect
deal value, deal synopsis, data on private equity provider, accounting data and final status of the buyout deal.
We start with downloading the population of MBO transactions between 2000 and 2009 from Thomson ONE
Banker database. The population include public-to-private, private-to-private and secondary management
buyouts.
Procedure MBOs
Population: Thomson ONE Banker; 2000-2009 2607
We manually search each transaction on Thomson ONE Banker and collect company Extel
cards where available. Extel cards include information on private equity backing and
acquisitions involved. We exclude 2006 companies that do not supply Extel cards.
-2006
Remaining sample 601
For each of the 601 transactions, we collect data on deal origin and type of buyout from deal
synopsis. Separately, we obtain the list of public-to-private buyouts and secondary buyouts
from Thomson ONE Banker database. After checking with our sample, we drop 46 matching
public-to-private and 29 secondary buyouts. For the remaining sample transactions, we collect
private equity sponsor data from Extel cards and deal synopsis.
-75
Remaining sample 526
We further check 526 companies with FAME database to collect data on accounting items.
FAME doesn't supply financial statements for 114 sample companies or reports data in an
inconsistent manner. Therefore we exclude these buyouts, ending up with 412 final sample
buyouts.
-114
Final sample 412
In the final step, we collect data on buyout status through reported acquisitions in Extel cards,
LSE initial public offerings, www. Unquote.com, www.angelnews.co.uk and private equity
firm websites. As a result of this search, we identify a total of 183 exits; of which 83 are trade
sale, 69 secondary buyout, 8 IPO and 23 receivership exits.
0
Final sample 412
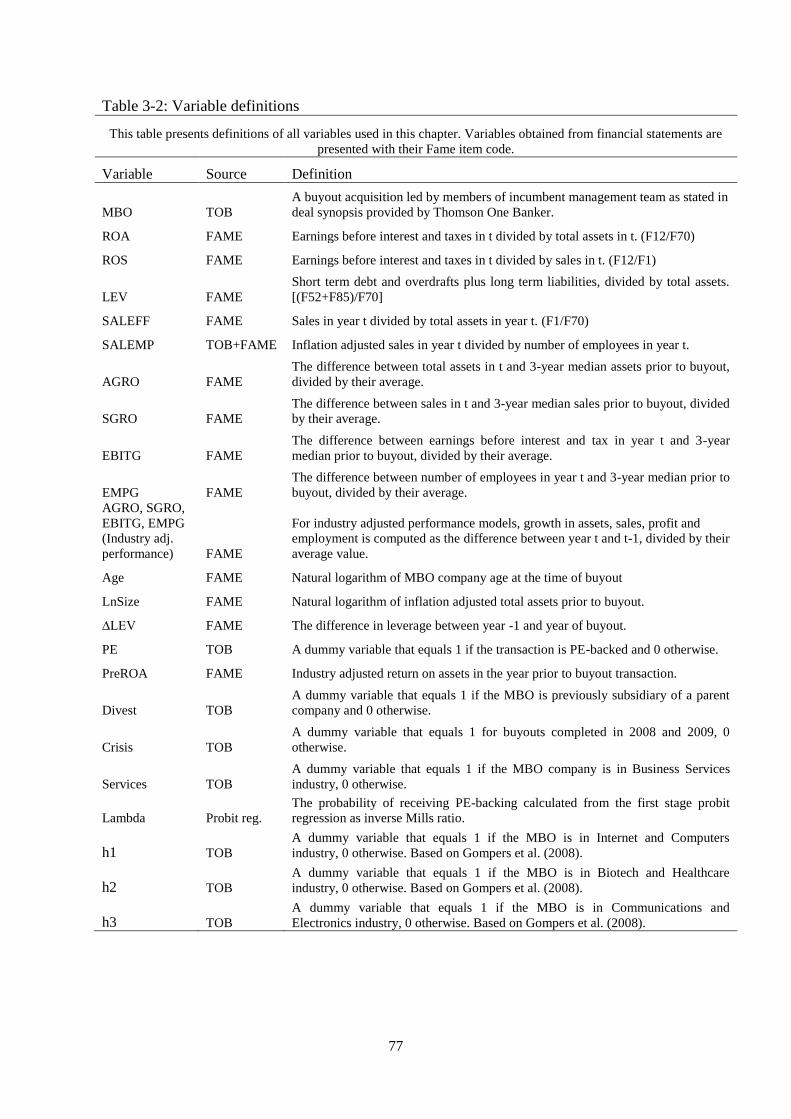
77
Table 3-2: Variable definitions
This table presents definitions of all variables used in this chapter. Variables obtained from financial statements are
presented with their Fame item code.
Variable Source Definition
MBO TOB
A buyout acquisition led by members of incumbent management team as stated in
deal synopsis provided by Thomson One Banker.
ROA FAME Earnings before interest and taxes in t divided by total assets in t. (F12/F70)
ROS FAME Earnings before interest and taxes in t divided by sales in t. (F12/F1)
LEV FAME
Short term debt and overdrafts plus long term liabilities, divided by total assets.
[(F52+F85)/F70]
SALEFF FAME Sales in year t divided by total assets in year t. (F1/F70)
SALEMP TOB+FAME Inflation adjusted sales in year t divided by number of employees in year t.
AGRO FAME
The difference between total assets in t and 3-year median assets prior to buyout,
divided by their average.
SGRO FAME
The difference between sales in t and 3-year median sales prior to buyout, divided
by their average.
EBITG FAME
The difference between earnings before interest and tax in year t and 3-year
median prior to buyout, divided by their average.
EMPG FAME
The difference between number of employees in year t and 3-year median prior to
buyout, divided by their average.
AGRO, SGRO,
EBITG, EMPG
(Industry adj.
performance) FAME
For industry adjusted performance models, growth in assets, sales, profit and
employment is computed as the difference between year t and t-1, divided by their
average value.
Age FAME Natural logarithm of MBO company age at the time of buyout
LnSize FAME Natural logarithm of inflation adjusted total assets prior to buyout.
∆LEV FAME The difference in leverage between year -1 and year of buyout.
PE TOB A dummy variable that equals 1 if the transaction is PE-backed and 0 otherwise.
PreROA FAME Industry adjusted return on assets in the year prior to buyout transaction.
Divest TOB
A dummy variable that equals 1 if the MBO is previously subsidiary of a parent
company and 0 otherwise.
Crisis TOB
A dummy variable that equals 1 for buyouts completed in 2008 and 2009, 0
otherwise.
Services TOB
A dummy variable that equals 1 if the MBO company is in Business Services
industry, 0 otherwise.
Lambda Probit reg.
The probability of receiving PE-backing calculated from the first stage probit
regression as inverse Mills ratio.
h1 TOB
A dummy variable that equals 1 if the MBO is in Internet and Computers
industry, 0 otherwise. Based on Gompers et al. (2008).
h2 TOB
A dummy variable that equals 1 if the MBO is in Biotech and Healthcare
industry, 0 otherwise. Based on Gompers et al. (2008).
h3 TOB
A dummy variable that equals 1 if the MBO is in Communications and
Electronics industry, 0 otherwise. Based on Gompers et al. (2008).

78
Table 3-3: Sample selection and distribution of deals across years
This table presents the statistics for UK buyout transactions in the last decade. The presented values are in $ million
(unadjusted). % columns represent the proportion of firms disclosing deal values to all buyouts in relevant years and
samples. "Total" columns represent the aggregated value of all disclosed deals in relevant years and samples. Panel B
reports p values for equality tests for sample representation. Mean and median tests are for the equality of deal size. T tests
for equality of means are performed under the assumption of unequal variances (Welch's test). T tests for equality of
medians are performed by Mann-Whitney (MW) Test for unmatched samples. Two sample Kolmogorov-Smirnov (K-S)
Test is performed under the null hypothesis that the samples have the same distribution. A total of 1139 and 213 buyouts
disclosed deal values for the population and final sample respectively. Deal value proxies for buyout size.
Panel A Number of deals Transaction size
% disclosure Total value
Year Population Final S. % of
populati
on
Population Final S. Population Final S.
N n % % ($ millions) ($ millions)
2009 111 23 21 20.7 21.7 712.12 215.31
2008 173 23 13 30.0 39.0 2713.42 518.94
2007 245 53 22 33.1 37.7 32346.43 2296.92
2006 253 61 24 32.4 42.6 8253.97 1562.58
2005 237 57 24 42.6 56.1 9962.86 2494.36
2004 280 50 18 47.9 64.0 14760.86 2386.63
2003 333 41 12 50.8 53.7 6219.38 1119.95
2002 287 38 13 46.0 60.5 5635.63 1719.45
2001 335 25 7 52.5 64.0 11743.65 1381.59
2000 353 41 12 55.4 68.3 8283.09 1321.91
Sample 2607 412 16 43.7 51.7 100631.4 15017.6
Panel B K-S Test: Population vs. Final Sample T test MW Test
All MBOs across
years Information disclosure
across years By industry Mean Median
Tests for
equality 0.000 0.152 0.006 0.420 0.000

79
Table 3-4: Exit routes across private equity backing and sources of buyout
This table presents statistics for exit types across private equity status, source of buyout and TIMEX. PE
status displays the number of private equity backed and non-backed exits within their respective exit route.
Full MBO and Divestment indicate acquisition of an independent company and acquisition of a former
subsidiary respectively. % column reports the proportion of buyouts using an exit route to final sample. Other
columns report absolute numbers. TIMEX stands for time-to-exit and represents the number of months a
sample firm stays in its original buyout form across relevant exit routes.
PE status Source of buyout
TIMEX
Type of exit PE Non-PE Full MBO Divest. All % Mean Median
Trade sale 62 21 57 26 83 2 48.5 50
Secondary 63 6 56 13 69 17 48.8 45
IPO 7 1 3 5 8 2 23.6 20.5
Receivership 14 9 18 5 23 6 52.2 51.5
All exits 146 37 134 49 183 44 48 47
Non-exit 107 122 174 55 229 56 - -
All 253 159 308 104 412 100 - -

80
Table 3-5: Distribution of MBOs by industry, private equity backing and exit routes
Panel A of this table presents distribution of sample buyouts by industry group and enterprise value at entry for respective sectors. Presented percentage columns are
the proportion of sample firms in an industry group to the relevant sample and the proportion of total deal valuation for each industry group to the total sample
valuation respectively. n column reports the number of sample firms in each industry group. Panel B reports p values from two sample Kolmogorov-Smirnov test for
equality of industry distributions in relevant samples. Industry classification is adapted from Gompers et al. (2008).
Panel A %
PE status Exit status Exit route
Industry n E Value PE Non-PE Exit
Non-
exit
Trade
Sale Second. IPO Rec. All
Internet and Computers 19 3 4 6 6 3 10 3 13 0 5
Biotech and Healthcare 25 4 8 3 7 5 8 6 0 9 6
Communications and
Electronics 40 5 9 11 8 11 8 6 0 17 10
Consumer 91 24 19 26 22 22 17 26 0 35 22
Business and Industrial 123 23 28 33 32 30 33 30 25 22 30
Energy 9 8 3 1 1 3 0 1 13 0 2
Financial Services 22 16 5 6 6 5 6 6 13 4 5
Business Services 70 11 21 11 16 17 17 17 25 9 17
All Others 13 6 4 3 2 3 1 4 13 4 3
Sample 412 100 61 39 44 56 20 17 2 6 100
Panel B: Differences in industry distributions
K-S Test
Population
vs. Final
Sample
PE vs. non-
PE
Exits vs.
non-Exits
Trade S. vs.
Second.
Trade S. vs.
Rec.
Second. vs.
Rec.
IPO vs.
Trade S.
IPO vs.
Second.
p value 0.006 0.352 0.989 0.352 0.126 0.352 0.004 0.004

81
Table 3-6: Performance of Management Buyouts
This table presents median abnormal performance (AP) measures for the entire sample. For pre-buyout adjusted performance, AP is measured as AP i, t = P i, t – P i, t-k,
where Pi represents actual performance in a given post-buyout year and P i, t-k 3-year median performance prior to buyout. Industry adjusted performance is measured as
AP i, t = P i, t – PI i, t, where P i,t represent buyout performance in a given year and PI i, t median performance of industry group matched on 2-digit SIC code in the same
year. Performance is measured by 9 ratios and presented in 4 categories as follows: (1) Profitability: measured by return on assets (ROA) and return on sales (ROS), where
ROA= earnings before interest and tax/total assets, and ROS= earnings before interest and tax/sales. (2) Leverage: measured as short term debt and overdrafts plus long
term liabilities/total assets. (3) Efficiency: measured by output per employee (SALEMP) and sales per unit of assets (SALEFF), where SALEMP=inflation adjusted real
sales/number of employees, and SALEFF=sales/total assets. (4) Growth: measured by asset growth (AGRO), sales growth (SGRO), profit growth (EBITG) and
employment growth (EMPG). (4.a) Pre-buyout adjusted growth: AGRO= Total assets in year t minus 3-year pre-buyout median assets divided by their average. The
remaining growth ratios are calculated in the same fashion. (4.b) Industry adjusted growth: AGRO= Total assets in year t minus total assets in year t-1 divided by their
average. The remaining growth rations are calculated in the same fashion. The calculations are terminated at exit and non-survivor buyouts are dropped from sample in
subsequent years. The significance of medians is tested by Wilcoxon signed rank test. ***, ** and * represent significance at 1, 5 and 10 percent respectively. Z-statistics
are shown in parentheses.
T-3 T-2 T-1 T1 T2 T3 T4 T5
Profitability
ROA Pre-buyout
adjusted - - -
0.003 -0.018 -0.013 0.002 -0.016
(-.824) (-1.437) (-1.437) (-.878) (-1.415)
Industry
adjusted
0.048*** 0.027*** 0.066*** 0.063*** 0.058*** 0.053*** 0.050*** 0.055***
(3.657) (3.91) (8.01) (7.828) (7.116) (7.253) (6.552) (5.282)
ROS Pre-buyout
adjusted - - -
0.009** 0.006** 0.005 0.009*** 0.001
(1.967) (2.011) (1.556) (2.351) (.657)
Industry
adjusted
0.018*** 0.022*** 0.036*** 0.039*** 0.034*** 0.033*** 0.030*** 0.022***
(3.225) (3.412) (7.154 (6.628) (6.561) (6.785) (6.098) (3.909)
Leverage
LEV Pre-buyout
adjusted - - -
-0.014 -0.04 -0.048 -0.042 0.003
(-1.351) (-1.583) (-1.598) (-1.431) (.689)
Industry
adjusted
-0.01 -0.04 -0.071* -0.066 -0.032 -0.034 -0.061 -0.024
(-.041) (-.626) (-1.67) (-.582) (-.034) (-.087) (-.903) (.168)
Efficiency
SALEMP Pre-buyout
adjusted - - -
6.14*** 7.59*** 8.66*** 9.51*** 11.39***
(4.716) (4.713) (4.438) (4.04) (4.24)
Industry
adjusted
67.58*** 85.11*** 56.66*** 46.75*** 51.16*** 57.32*** 51.76*** 50.91***
(5.11) (6.136) (6.358) (6.905) (7.051) (6.838) (5.897) (4.714)

82
SALEFF Pre-buyout
adjusted - - -
-0.057** -0.164*** -0.168*** -0.102*** -0.257**
(-2.023) (-2.894) (-2.569) (-2.603) (-1.91)
Industry
adjusted
0.264** 0.236*** 0.289*** 0.168*** 0.134*** 0.147*** 0.137*** 0.459***
(2.312) (3.448) (3.865) (3.318) (2.865) (3.514) (3.04) (4.149)
Growth
AGRO Pre-buyout
adjusted - - -
0.266*** 0.340*** 0.434*** 0.497*** 0.591***
(8.27) (8.632) (8.497) (8.052) (6.792)
Industry
adjusted
0.017* 0.050*** 0.028*** 0.054*** 0.044*** 0.012 0.037
(1.906) (2.82) (2.952) (4.306) (3.031) (.925) (.997)
SGRO Pre-buyout
adjusted - - -
0.264*** 0.326*** 0.424*** 0.376*** 0.404***
(7.05) (7.34) (7.231) (6.408) (5.726)
Industry
adjusted
0.047*** 0.021 0.044*** 0.030** 0.088*** -0.001 0.043**
(2.688) (1.486) (3.118) (2.027) (4.377) (-1.317) (2.238)
EBITG Pre-buyout
adjusted - - -
0.441*** 0.520*** 0.614*** 0.663*** 0.709***
(4.409) (3.256) (4.326) (4.016) (2.795)
Industry
adjusted
0.134 0.031 0.020 0.040 0.023 0.003 0.092
(1.026) (.736) (.276) (.061) (-.536) (-.546) (1.635)
EMPG Pre-buyout
adjusted - - -
0.108*** 0.164*** 0.239*** 0.188*** 0.230***
(5.168) (4.826) (5.188) (4.125) (3.747)
Industry
adjusted
0.018* 0.017 0.037*** 0.033** 0.047*** -0.002 0.013
(1.651) (1.224) (3.581) (2.341) (4.82) (-.281) (.578)

83
Table 3-7: Performance of PE-Backed Buyouts This table presents median abnormal performance (AP) for the PE-backed subsample. For pre-buyout adjusted performance, AP is measured as AP i, t = P i, t – P i, t-k,
where Pi represents actual performance in a given post-buyout year and P i, t-k 3-year median performance prior to buyout. Industry adjusted performance is measured as
AP i, t = P i, t – PI i, t, where P i, t represent buyout performance in a given year and PI i, t median performance of industry group matched on 2 digit SIC code in the same
year. Performance is measured by 9 ratios and presented in 4 categories as follows: (1) Profitability: measured by return on assets (ROA) and return on sales (ROS),
where ROA= earnings before interest and tax/total assets, and ROS= earnings before interest and tax/sales. (2) Leverage: measured as short term debt and overdrafts plus
long term liabilities/total assets. (3) Efficiency: measured by output per employee (SALEMP) and sales per unit of assets (SALEFF), where SALEMP=inflation adjusted
real sales/number of employees, and SALEFF=sales/total assets. (4) Growth: measured by asset growth (AGRO), sales growth (SGRO), profit growth (EBITG) and
employment growth (EMPG). (4.a) Pre-buyout adjusted growth: AGRO= Total assets in year t minus 3-year pre-buyout median assets divided by their average. The
remaining growth ratios are calculated in the same fashion. (4.b) Industry adjusted growth: AGRO= Total assets in year t minus total assets in year t-1 divided by their
average. The remaining growth rations are calculated in the same fashion. The calculations are terminated at exit and non-survivor buyouts are dropped from sample in
the subsequent years. The significance of medians is tested by Wilcoxon signed rank test. ***, ** and * represent significance at 1, 5 and 10 percent respectively. Z-
statistics are shown in parentheses.
T-3 T-2 T-1 T1 T2 T3 T4 T5
Profitability
ROA Pre-buyout
adjusted - - -
-0.015 -0.023 -0.023* -0.002 -0.027
(-1.606) (-1.425) (-1.789) (-1.167) (-1.597)
Industry adjusted
0.054*** 0.054*** 0.090*** 0.079*** 0.078*** 0.063*** 0.061*** 0.054***
(3.737) (4.273) (6.896) (6.276) (6.594) (6.305) (5.506) (4.663)
ROS Pre-buyout
adjusted - - -
0.012 0.008 0.007 0.013* 0.005
(1.276) (1.54) (1.194) (1.859) (0.88)
Industry adjusted
0.036*** 0.040*** 0.055*** 0.061*** 0.052*** 0.039*** 0.047*** 0.029***
(3.364) (4.36) (6.04) (5.839) (6.421) (6.122) (5.576) (3.883)
Leverage
LEV Pre-buyout
adjusted - - -
-0.022 -0.045 -0.064** -0.052* -0.026
(-1.62) (-1.456) (-2.002) (-1.913) (-.502)
Industry adjusted
-0.006 -0.071 -0.073 -0.021 0.003 0.003 -0.060 -0.021
(.435) (-.463) (-.994) (.532) (.972) (.535) (-.698) (.176)
Efficiency

84
SALEMP Pre-buyout
adjusted
- - - 4.62*** 6.10*** 8.12*** 4.99*** 10.62***
(3.508) (3.256) (2.73) (2.653) (3.251)
Industry adjusted
38.47** 33.02*** 43.22*** 25.24*** 25.05*** 35.42*** 27.16*** 25.65***
(2.41) (2.991) (3.323) (4.01) (4.125) (4.216) (3.606) (2.826)
SALEFF Pre-buyout
adjusted - - -
-0.061** -0.183*** -0.218*** -0.120*** -0.257**
(-1.941) (-2.458) (-2.789) (-2.683) (-2.263)
Industry adjusted
0.238* 0.327*** 0.30*** 0.127** 0.075 0.066** 0.045 0.277**
(1.907) (2.68) (3.168) (2.111) (1.584) (1.983) (1.543) (2.506)
Growth
AGRO Pre-buyout
adjusted - - -
0.303*** 0.369*** 0.484*** 0.540*** 0.599***
(7.248) (7.242) (6.941) (6.531) (5.907)
Industry adjusted
0.060*** 0.086** 0.045*** 0.059*** 0.058*** 0.021 0.044
(2.604) (2.506) (3.123) (3.692) (3.474) (1.443) (1.539)
SGRO Pre-buyout
adjusted - - -
0.281*** 0.358*** 0.444*** 0.442*** 0.394***
(6.087) (6.099) (5.416) (4.908) (4.382)
Industry adjusted
0.042** 0.030 0.047*** 0.032 0.103*** 0.016 0.021*
(2.457) (1.564) (2.866) (1.401) (3.907) (-.096) (1.807)
EBITG Pre-buyout
adjusted - - -
0.598*** 0.565*** 0.728*** 0.776*** 0.811**
(3.283) (3.239) (4.302) (3.063) (2.159)
Industry adjusted
0.289*** 0.031 0.090* 0.058 0.026 0.026 0.037
(2.915) (.595) (1.848) (.188) (-.74) (-.087) (.545)
EMPG Pre-buyout
adjusted - - -
0.129*** 0.210*** 0.234*** 0.26*** 0.23***
(4.852) (4.25) (3.825) (3.357) (2.634)
Industry adjusted
0.004 0.029** 0.038*** 0.018 0.047*** 0.006 0.009
(.874) (2.043) (2.922) (1.141) (3.532) (.809) (.496)

85
Table 3-8: PE-Backed vs. non-PE-Backed MBOs
This table presents the p values for two sample Mann-Whitney test for equality of abnormal performance in
private equity backed and non-backed subsamples. PBA stands for pre-buyout adjusted performance and IndA
stands for industry adjusted performance. ">" and "<" indicate superior and inferior performance of private
equity backed subsample respectively. Significant p values are in bold.
T-3 T-2 T-1 T1 T2 T3 T4 T5
Profitability
ROA PBA - - - <0.11 <0.45 <0.15 <0.35 <0.32
IndA >0.10 >0.00 >0.00 >0.04 >0.00 >0.10 >0.09 <0.90
ROS PBA - - - >0.83 >0.99 >0.93 >0.88 >0.66
IndA >0.07 >0.00 >0.00 >0.00 >0.00 >0.02 >0.02 >0.12
Leverage
LEV PBA - - - <0.29 <0.51 <0.16 <0.19 <0.10
IndA >0.63 <0.82 <0.67 >0.17 >0.21 >0.43 >0.90 >0.90
Efficiency
SALEMP PBA - - - <0.55 <0.05 <0.22 <0.32 <0.38
IndA <0.02 <0.00 <0.00 <0.00 <0.00 <0.00 <0.02 <0.08
SALEFF PBA - - - <0.55 <0.47 <0.27 <0.28 <0.32
IndA <0.48 >0.63 >0.64 <0.33 <0.34 <0.09 <0.11 <0.02
Growth
AGRO PBA - - - >0.14 >0.24 >0.21 >0.15 >0.17
IndA
>0.05 >0.85 >0.09 >0.38 >0.03 >0.21 >0.24
SGRO PBA - - - >0.15 >0.22 >0.64 >0.48 <0.82
IndA
<0.30 >0.48 >0.58 >0.90 >0.47 >0.08 <0.64
EBITG PBA - - - >0.96 >0.34 >0.02 >0.41 >0.56
IndA
>0.01 <0.95 >0.00 >0.81 >0.64 >0.51 <0.21
EMPG PBA - - - >0.08 >0.19 <0.74 >0.37 <0.72
IndA <0.72 >0.08 >0.95 <0.33 >0.88 >0.09 <0.95

86
Table 3-9: Performance of Full MBOs
Panel A of this table presents abnormal performance of full MBOs. Panel B presents abnormal performance
for divestment MBOs. Results are based on industry adjusted performance measures. The calculations are
terminated at exit and non-survivor buyouts are dropped from sample in subsequent years. The significance of
medians is tested by Wilcoxon signed rank test. ***, ** and * represent significance at 1, 5 and 10 percent
respectively. Z-statistics are shown in parentheses.
Panel A T-3 T-2 T-1 T1 T2 T3 T4 T5
ROA 0.033*** 0.032*** 0.063*** 0.063*** 0.065*** 0.063*** 0.052*** 0.055***
(3.497) (4.137) (6.922) (7.173) (7.071) (6.851) (6.147) (4.478)
ROS 0.011*** 0.020*** 0.030*** 0.039*** 0.037*** 0.035*** 0.032*** 0.026***
(2.671) (3.502) (5.526) (6.19) (6.482) (6.298) (5.938) (3.618)
LEV -0.022 -0.065 -0.070 -0.086 -0.056 -0.062 -0.085 -0.039
(-.16) (-1.399) (-1.466) (-.757) (-.49) (-.495) (-1.209) (-.212)
SALEMP 45.51*** 79.43*** 60.6*** 46.38*** 43.2*** 54.19*** 53.32*** 26.87***
(4.105) (5.047) (5.661) (6.001) (5.923) (5.609) (4.944) (3.26)
SALEFF 0.212** 0.347*** 0.434*** 0.196*** 0.128** 0.139*** 0.137*** 0.552***
(1.982) (3.623) (4.319) (3.218) (2.467) (3.188) (2.902) (3.9)
AGRO
0.034** 0.072*** 0.028*** 0.054*** 0.046*** 0.011 0.048
(2.141) (2.95) (2.935) (3.483) (2.564) (.359) (1.438)
SGRO
0.054*** 0.023* 0.037*** 0.021 0.087*** -0.007 0.040**
(2.778) (1.674) (2.752) (1.259) (3.499) (-1.469) (2.32)
EBITG
0.134 0.064 0.027 0.027 0.007 -0.032 0.094
(.92) (.787) (.921) (-.881) (-.336) (-1.208) (1.25)
EMPG
0.028 0.021** 0.041*** 0.037** 0.048*** -0.007 0.017
(1.561) (2.185) (3.67) (2.19) (4.644) (-.52) (.817)

87
Panel B: Performance of Divestment MBOs
T-3 T-2 T-1 T1 T2 T3 T4 T5
ROA 0.067* 0.008 0.088*** 0.062*** 0.039** 0.029*** 0.038*** 0.042***
(1.957) (.265) (3.584) (3.018) (2.128 (2.65) (2.794) (2.725)
ROS 0.040* 0.029 0.070*** 0.038** 0.019** 0.033*** 0.018** 0.015*
(1.708) (.958) (3.432) (2.21) (1.998) (2.746) (2.195) (1.861)
LEV -0.004 0.055 -0.095 0.028 0.028 0.042 -0.049 -0.016
(.17) (1.2) (-.86) (.322) (1.039) (.928) (-.056) (.292)
SALEMP 67.93*** 87.87*** 53.81*** 50.71*** 94.42*** 89.87*** 60.95*** 113.47***
(2.883) (3.456) (2.806) (3.388) (3.793) (3.968) (3.316) (3.666)
SALEFF 0.388 -0.118 -0.08 0.102 0.062 0.147 0.063 0.181
(1.285) (.581) (.031) (.871) (1.132) (1.225) (.779) (1.306)
AGRO
-0.015 0.011 0.024 0.030*** 0.043* 0.012 0.017
(-.114) (.417) (.644) (2.363) (1.753) (1.204) (-.295)
SGRO
0.021 0.005 0.115 0.035* 0.079** 0.04 0.067
(.571) (.157) (1.482) (1.703) (2.567) (.106) (.689)
EBITG
0.18 -0.018 0.016 0.188* 0.034 0.11 0.051
(.524) (.196) (-1.248) (1.678) (-.322) (.612) (.92)
EMPG
-0.0221 -0.023 0.014 0.004 0.03 0.01 0.008
(-.317) (-.277) (.833) (.672) (1.4) (.443) (.023)

88
Table 3-10: Full MBOs vs. Divestment MBOs
This table presents the p values for two sample Mann-Whitney test for equality of abnormal performance in full
MBO and divestment MBO subsamples. The results are based on industry adjusted performance. ">" and "<"
indicate superior and inferior performance of full MBO subsample respectively. Significant p values are in
bold.
T-3 T-2 T-1 T1 T2 T3 T4 T5
ROA <0.68 >0.12 <0.53 >0.45 >0.10 >0.11 >0.20 >0.74
ROS <0.92 <0.55 <0.29 >0.23 >0.12 >0.14 >0.08 >0.81
LEV <0.78 <0.09 >0.58 <0.76 <0.28 <0.27 <0.43 <0.67
SALEMP <0.54 <0.71 >0.86 <0.89 <0.51 <0.46 <0.92 <0.10
SALEFF <0.99 >0.18 >0.04 >0.45 >0.74 <0.46 >0.35 >0.28
AGRO
>0.32 >0.29 >0.47 >0.71 >0.62 <0.34 >0.30
SGRO
>0.21 >0.44 <0.65 <0.51 >0.60 <0.31 <0.77
EBITG
<0.82 >0.95 >0.21 <0.07 <0.93 <0.23 >0.93
EMPG >0.16 >0.31 >0.33 >0.56 >0.24 <0.48 >0.63

89
Table 3-11: Performance of exited MBOs
Panel A of this table presents abnormal performance of exited MBOs. Panel B presents abnormal
performance for MBOs that are still in their original buyout form. Results are based on industry adjusted
performance measures. The calculations are terminated at exit and non-survivor buyouts are dropped from
sample in subsequent years. The significance of medians is tested by Wilcoxon signed rank test. ***, ** and
* represent significance at 1, 5 and 10 percent respectively. Z-statistics are shown in parentheses.
Panel A T-3 T-2 T-1 T1 T2 T3 T4 T5
ROA 0.048** 0.057*** 0.081*** 0.077*** 0.079*** 0.052*** 0.046*** 0.073***
(2.103) (2.768) (5.06) (5.158) (4.917) (4.959) (3.788) (3.75)
ROS 0.033** 0.032*** 0.053*** 0.067*** 0.056*** 0.037*** 0.037*** 0.042***
(2.103) (2.898) (4.59) (4.813) (4.821) (4.08) (3.841) (3.082)
LEV -0.022 -0.104* -0.028 -0.076 -0.043 -0.082 -0.041 -0.077
(-.682) (-1.882) (-.525) (-.703) (.122) (-.417) (-.669) (-.431)
SALEMP 40.03 60.01** 14.78** 25.24*** 8.42*** 32.92*** 9.26** 23.11
(1.568) (2.524) (2.183) (3.136) (2.646) (2.984) (2.032) (1.477)
SALEFF 0.045 0.041 0.102 0.028 -0.095 0.083** 0.137 0.540**
(.156) (1.188) (1.284) (.122) (.062) (1.858) (.876) (2.458)
AGRO
-0.009 0.065 0.024** 0.028* 0.050** 0.018 0.064
(-.152) (1.486) (1.959) (1.904) (2.112) (.63) (1.263)
SGRO
0.017 0.012 0.035** 0.018 0.105*** -0.041** 0.062
(1.025) (1.159) (2.276) (1.053) (3.261) (-2.079) (1.356)
EBITG
0.126 -0.072 0.048 0.01 -0.052 0.07 0.372***
(1.234) (.606) (1.308) (-.141) (-.909) (.506) (3.199)
EMPG
0.008 -0.011 0.016** 0.032 0.053*** -0.003 -0.006
(-.241) (.162) (2.251) (1.344) (3.248) (-.179) (-.278)

90
Panel B: Performance of non-exited MBOs
T-3 T-2 T-1 T1 T2 T3 T4 T5
ROA 0.057*** 0.022*** 0.066*** 0.059*** 0.043*** 0.053*** 0.049*** 0.043***
(3.782) (3.061) (6.156) (6.212) (5.579) (5.524) (5.229) (3.807)
ROS 0.021*** 0.018*** 0.036*** 0.019*** 0.023*** 0.032*** 0.027*** 0.013***
(2.839) (2.686) (4.895) (4.844) (4.773) (5.644) (4.634) (2.628)
LEV -0.024 -0.015 -0.140* -0.058 -0.023 -0.032 -0.070 0.009
(-.294) (.27) (-1.716) (-.682) (-.377) (.525) (-.615) (.656)
SALEMP 79.65*** 92.88*** 68.02*** 75.38*** 83.19*** 84.07*** 63.57*** 67.80***
(4.538) (5.448) (5.795) (5.83) (6.431) (6.047) (5.581) (4.473)
SALEFF 0.299** 0.313*** 0.309*** 0.334*** 0.240*** 0.143** 0.180*** 0.357***
(2.211) (3.066) (3.446) (3.637) (2.971) (2.379) (2.912) (3.058)
AGRO
0.017** 0.048** 0.030*** 0.059*** 0.037*** 0.006 0.017
(2.019) (2.55) (2.624) (3.976) (2.712) (.445) (.229)
SGRO
0.058** 0.021 0.059*** 0.032 0.082*** 0.028 0.04
(2.488) (1.002) (2.728) (1.476) (2.921) (.168) (1.516)
EBITG
0.145 0.065 -0.058 0.059 0.037 -0.050 -0.028
(.918) (.515) (-.822) (.639) (.252) (-1.515) (-.425)
EMPG
0.030** 0.021 0.045*** 0.032** 0.043*** -0.005 0.019
(2.283) (1.345) (2.911) (2.011) (3.442) (-.125) (.602)

91
Table 3-12: Exited vs. non-exited MBOs
This table presents the p values for two sample Mann-Whitney test for equality of abnormal performance in
exited MBO and non-exited MBO subsamples. The results are based on industry adjusted performance. ">"
and "<" indicate superior and inferior performance of exited MBO subsample respectively. Significant p
values are in bold.
T-3 T-2 T-1 T1 T2 T3 T4 T5
ROA <0.95 >0.24 >0.29 >0.21 >0.06 <0.45 <0.98 >0.03
ROS >0.89 >0.20 >0.31 >0.13 >0.06 >0.91 >0.40 >0.06
LEV >0.81 <0.23 >0.27 <0.83 <0.87 <0.43 >0.99 <0.47
SALEMP <0.19 <0.47 <0.12 <0.06 <0.02 <0.06 <0.03 <0.04
SALEFF <0.43 <0.58 <0.38 <0.01 <0.08 <0.87 <0.22 >0.95
AGRO
<0.35 >0.87 <0.76 <0.63 >0.57 >0.78 >0.33
SGRO
<0.76 <0.80 <0.96 <0.72 >0.28 <0.06 >0.81
EBITG
<0.50 <0.83 >0.16 <0.58 <0.33 >0.20 >0.00
EMPG <0.14 <0.55 <0.68 <0.80 >0.54 >0.92 <0.53

92
Table 3-13: Differences in differences: full sample This table presents results of differences in differences performance tests for full sample for 5 years
following buyout. For each post-buyout year, the abnormal performance is computed as industry
adjusted performance in relevant post-buyout year minus industry adjusted performance in year -1.
Variables are defined in Table 3-2. The results are tested by Wilcoxon signed rank test. Z-statistics are
in parentheses. ***, ** and * represent statistical significance at 1%, 5 and 10% level respectively.
n T1 T2 T3 T4 T5
ROA 173 -0.011* -0.024** -0.033** -0.017 -0.084***
(-1.753) (-2.065) (-2.128) (-1.547) (-2.672)
ROS 152 0.011 -0.002 0.003 0.011 -0.014
(-0.344) (0.05) (-0.024) (0.966) (-1.27)
LEV 138 -0.011 -0.035* -0.025 -0.032** 0.025
(-1.276) (-1.681) (-1.524) (-2.245) (0.823)
SALEMP 142 -5.061 -9.684 -5.449 -10.089 -3.741
(-0.125) (-1.133) (-0.65) (-0.283) (0.566)
SALEFF 152 -0.068 -0.177* -0.121* -0.167*** -0.081
(-0.903) (-1.942) (-1.822) (-2.746) (-0.949)
AGRO 169 -0.003 0.01 -0.033 -0.045* -0.011
(-0.418) (-0.425) (-1.095) (-1.603) (-1.07)
SGRO 113 -0.026* -0.052* 0.013 -0.029 0.084*
(-1.932) (-1.68) (0.556) (-1.138) (1.874)
EBITG 126 -0.207 0.049 -0.118 -0.121 0.127*
(-0.939) (0.605) (-0.976) (-0.331) (1.605)
EMPG 105 0.001 -0.042** 0.006 0.001 -0.054*
(-0.519) (-2.539) (-1.14) (-0.667) (-1.758)

93
Table 3-14: Differences in differences: performance of PE-backed MBOs This table presents results of differences in differences tests for PE-backed and non-PE-backed
MBOs for 5 years following buyout. First row of each variable displays performance of PE-backed
MBOs. Second row displays z-statistics and third row shows p-values for Mann-Whitney test for
performance differences between PE-backed and non-PE-backed MBO subsamples. For each post-
buyout year, the abnormal performance is computed as industry adjusted performance in relevant
post-buyout year minus industry adjusted performance in year -1. Variables are defined in Table 3-2.
The results are tested by Wilcoxon signed rank test. Z-statistics are in parentheses. M-W test p-
values are in brackets. ">" and "<" indicate superior and inferior performance of PE-backed
subsample respectively. Significant M-W p-values are in bold. ***, ** and * represent statistical
significance at 1%, 5 and 10% level respectively.
n T1 T2 T3 T4 T5
ROA 98 -0.051** -0.054** -0.064*** -0.054** -0.162***
(-2.302) (-2.181) (-2.983) (-2.144) (-2.603)
<[0.061] <[0.088] <[0.013] <[0.092] <[0.020]
ROS 86 -0.001 -0.008 -0.014 0.002 -0.041
(-0.252) (-0.525) (-1.044) (0.187) (-1.185)
<[0.682] <[0.298] <[0.117] <[0.366] <[0.350]
LEV 80 -0.022 -0.058* -0.054** -0.045** 0.021
(-1.353) (-1.601) (-2.174) (-2.194) (0.514)
<[0.514] <[0.492] <[0.119] <[0.506] <[0.862]
SALEMP 81 -9.375 -20.442*** -20.926 -11.692 -8.481
(-1.448) (-2.941) (-1.502) (-1.401) (-0.747)
<[0.058] <[0.005] <[0.166] <[0.189] <[0.086]
SALEFF 86 0.005 -0.177 -0.228** -0.267*** -0.318
(-0.381) (-1.285) (-2.056) (-2.731) (-1.412)
>[0.696] >[0.905] <[0.264] <[0.267] <[0.245]
AGRO 90 -0.008 0.008 -0.047 -0.053 -0.002
(-0.424) (-0.353) (-0.52) (-1.305) (-0.889)
>[0.877] <[0.895] <[0.778] <[0.596] <[0.787]
SGRO 58 -0.02 -0.151** -0.056 -0.076 0.004
(-1.312) (-2.205) (-0.098) (-1.286) (0.135)
>[0.876] <[0.144] <[0.472] <[0.470] <[0.220]
EBITG 65 -0.127 0.024 -0.392** -0.076 -0.114
(-0.31) (-0.022) (-2.284) (-1.177) (-0.14)
>[0.616] <[0.463] <[0.048] >[0.197] <[0.189]
EMPG 58 -0.001 -0.055** -0.08 -0.018 -0.091*
(-0.554) (-2.236) (-1.602) (-0.48) (-1.68)
<[0.806] <[0.489] <[0.186] <[0.991] <[0.599]

94
Table 3-15: Determinants of PE-backing This table presents results of probit estimation for the probability of receiving PE backing
(equation 4). Dependent variable: PE is a dummy variable that equals 1 if MBO received PE
backing and 0 otherwise). Independent variables: Divest is a dummy variable that takes value
of 1 if buyout is formerly a subsidiary, 0 otherwise. Services is a dummy variable that equals 1
if MBO is in business services industry, and 0 otherwise. PreROA is the industry adjusted
return on assets in the year prior to buyout. Age is natural logarithm of MBO company age at
the time of buyout, and LnSize is natural logarithm of inflation adjusted total assets prior to
buyout. The model converged after four iterations. Reported results are for robust variance
estimates. P-value for Wald test is for probability > chi2. N is the number of sample buyouts
used for the probit estimation. Z-statistics are reported in parentheses. ∗∗∗, ∗∗, ∗, represent
significance at 1, 5 and 10 percent levels respectively.
Regressor Coefficient
Divest
-0.069
(-0.31)
Services
0.585**
(2.34)
PreROA
0.318
(1.20)
Age
-0.261*
(-1.83)
LnSize
0.185***
(2.58)
Intercept
-0.894
(-1.16)
Log likelihood
-131.0415
N
204
Wald Chi2
16.65***
Pseudo R2 (%) 6.23

95
Table 3-16: Determinants of post-buyout performance
This table presents the results of cross-sectional regressions for determinants of post-buyout performance (equation 5). Dependent variables in the regressions
are changes in industry adjusted Return on Assets (ROA), Sales/Assets (Saleff) and Asset Growth (AGRO). For dependent variables, changes are measured
from year -1 to relevant post-buyout years. Other variables are defined in Table 3-2. PreROA is the industry adjusted return on assets in the year prior to
buyout. PE is a dummy variable that equals 1 if MBO received PE backing and 0 otherwise). LEV is short term debt plus long term debt divided by total
assets in the year prior to MBO. ∆LEV is the difference in leverage between year -1 and year of buyout. Divest is a dummy variable takes value of 1 if buyout
is former subsidiary of a parent company, and 0 otherwise. Lambda is the inverse Mills ratio computed from the probit estimation in the 1st stage. LnSize is
natural logarithm of inflation adjusted total assets prior to buyout. Crisis is a dummy variable that equals 1 if MBO transaction is completed in either of 2008,
2009 and 0 otherwise. h1, h2 and h3 are high-tech industry dummies based on Gompers et al. (2008) classification that correspond to Internet and Computers,
Biotech and Healthcare, Communications and Electronics industries respectively. N is the number of firm-year observations in each model. All models are
estimated via OLS regressions with robust standard errors and omitted collinear covariates. ∗∗∗, ∗∗, ∗, represent significance at 1, 5 and 10 percent levels
respectively.

96
Table 3-16: Continued
ROA1 ROA2 ROA3
Saleff1 Saleff2 Saleff3
AGRO1 AGRO2 AGRO3
PreROA 1.518*** 1.85*** 1.828***
(3.27) (3.46) (4.61)
PE -0.147* -0.104 -0.242*
0.318 0.019 -3.124
-0.038 0.05a 0.184
(-1.88) (-1.28) (-1.92)
(1.08) (0.08) (-1.21)
(-0.36) (0.45) (0.96)
∆LEV 1.38*** 1.734*** 1.454***
2.217*** 2.298*** 7.133*
-9.002*** -7.616** -1.265***
(4.31) (4.54) (4.46)
(3.1) (3.49) (1.6)
(-3.14) (-2.49) (-3.23)
LEV 0.603*** 0.852*** 0.623***
-0.065 0.058 2.119
0.114 0.204 -0.071
(2.7) (3.22) (2.86)
(-0.18) (0.16) (1.05)
(0.63) (1.00) (-0.28)
Divest -0.103 -0.011 0.063
-0.251 -0.237 -0.715
0.269** 0.078 -0.069
(-1.18) (-0.13) (0.51)
(-0.98) (-0.92) (-0.74)
(2.46) (0.79) (-0.38)
Lambda 1.613*** 1.958*** 1.842***
1.006 1.167 -6.889
0.279 0.371 0.391
(3.84) (3.9) (3.8)
(1.19) (1.53) (-0.47)
(0.91) (1.41) (0.77)
LnSize 0.184*** 0.219*** 0.224***
0.104 0.167* -0.249
0.052 0.026 0.018
(3.58) (3.83) (4.07)
(1.17) (1.88) (-0.82)
(0.98) (0.64) (0.27)
Crisis 0.191* 0.101
0.322 -0.185
0.172 0.016
(1.87) (0.65)
(1.22) (-0.85)
(1.26) (0.12)
h1 -0.039 -0.134 -0.101
-0.229 -0.245 -0.437
-0.008 0.373** 0.121
(-0.46) (-0.91) (-0.46)
(-0.98) (-1.06) (-0.28)
(-0.05) (2.3) (0.72)
h2 -0.182 -0.042 -0.007
0.392 0.699 0.798
-0.875*** -0.446*** 0.983*
(-0.79) (-0.31) (-0.03)
(1.02) (1.42) (0.78)
(-3.15) (-2.68) (1.73)
h3 0.038 0.116 0.051
1.35 1.457 -0.576
-0.164 -0.256 -0.074
(0.25) (0.67) (0.24)
(0.79) (1.09) (-0.64)
(-1.01) (-1.28) (-0.27)
Intercept -3.263*** -3.988*** -3.839***
-1.94 -2.644* 9.352
-0.819 -0.605 -0.638
(-3.84) (-4.02) (-4.28)
(-1.32) (-1.92) (0.74)
(-1.11) (-0.98) (-0.58)
N 120 102 77
108 95 73
95 77 54
R2 (%) 62.65 71.95 76.19 14.42 21.57 13.26 33.43 29.45 37.74

97
CHAPTER 4: EARNINGS MANAGEMENT AND MBO PERFORMANCE
4.1 Introduction
The combined effects of ownership concentration and high leverage of buyouts ensure
creation of a company with superior structure and performance compared to public
companies (Jensen, 1986; 1989). Much research has documented improvements in company
performance after buyouts, providing support for the above argument.10
However, public-to-
private buyouts have previously been described as perverse transactions where managers and
large shareholders take advantage of their power and insider knowledge in order to structure
deals to their benefit (Sommer, 1974; Longstreth, 1983). This moral hazard problem becomes
stronger in management buyouts (MBO) where managers stand as both vendors and buyers.
If managers have strong personal incentives, they might be tempted to exploit their
informational advantage to acquire firm for less than its true value. For example, the $24
billion MBO of computer maker Dell by incumbent management team led by its founder and
CEO faced lawsuit by shareholders who argued that managers abused their insider status and
knowledge to significantly undervalue the MBO deal (Feeley, 2013).
The literature has documented presence of earnings management before public-to-private
buyouts (Perry and Williams, 1994; Wu, 1997; Fischer and Louis, 2008). The managerial
self-interest accompanying MBO transactions provides sufficient incentives and forms an
ideal setting for managers to exercise their discretion over accruals and understate earnings to
pay an undervalued equity price. The collective evidence from public-to-private buyouts
supports this notion. However the evidence comes only from public-to-private buyouts and
managers accounting practices before private-to-private buyouts have not been documented.
In this study we examine earnings management prior to private-to-private MBOs. Our private
10
See Gilligan and Wright (2010) for a review of evidence on buyout performance.

98
firm choice is motivated by the fact that private-to-private MBOs constitute the largest
portion of worldwide buyouts (Stromberg, 2008) whose undisputable economic value is not
given enough attention in the literature. One of the reasons for the lack of evidence on
private-to-private buyouts is that US private firms are not required to report financial
statements. Therefore research is limited to publicly listed corporations whose managers need
not disclose financial information after going private (Perry and Williams, 1994). In Europe,
all private firms are subject to the same accounting standards and reporting requirements as
public firms11
(Ball and Shivakumar, 2005), although minor exemptions for specific
accounting items exist for certain private firms. The similarities in the publication of annual
accounts between public and private firms allow us to obtain results that are comparable with
public firm evidence, as well as enabling us to utilise a fairly large sample of private-to-
private MBOs. Furthermore, the private firm literature provides limited evidence regarding
earnings management. Research is either based on case studies (Howorth et al., 2004), or on
large, multi-country level private firm populations (e.g., Coppens and Peek, 2005;
Burgstahler et al., 2006). The data considerations also play a part in sample choice and
research design. Focusing on a single event would substantially reduce the number of firm-
observations with available data to do such analysis. We deal with this issue by relying on the
UK market, the second largest buyout market after the US. The UK choice allows us to
narrow down population-based samples in previous research to a specific earnings
management inducing event where incentives are stronger and earnings management is more
likely.
Much research has investigated the relevance of the MBO to firm performance (Kaplan,
1989a; Guo et al., 2011; Jelic and Wright, 2011). The present literature also provides us
11
Since 2005 UK public firms have to prepare their consolidated financial statements in accordance with
International Financial Reporting Standards (IFRS). In the case of our private sample, however, 290 firms
prepare their annual accounts in accordance with UK historical convention and only 1 firm follows IFRS
principles.

99
ample evidence regarding earnings management practices around major corporate events and
the effects of accrual reversals following equity issues in public firms (Rangan, 1998; Teoh et
al., 1998a; 1998b; Jo et al., 2007). This study explores new grounds by investigating the
effect of earnings management on operating performance of MBOs. Specifically, we examine
the impact of pre-buyout accrual management on the post-buyout company through a hand-
collected sample of private-to-private buyouts.
We examine earnings management in 291 UK private-to-private MBOs between 2004 and
September 2012 using cross-sectional version of Jones (1991) model developed by Defond
and Jiambalvo (1994) and its performance adjusted version by Kothari et al. (2005). Our
main findings contrast with prior evidence reported for public-to-private MBOs. Contrary to
predictions that managers understate earnings in the years before transaction, we find
evidence of strong income-increasing earnings management in the year preceding MBO. This
year coincides with large positive changes in total accruals and earnings. Separate
examination of PE-backed and non-PE backed MBOs reveal that managers of PE-backed
MBOs are less likely to engage in earnings management. These findings remain consistent
across cross-sectional and performance adjusted cross-sectional discretionary accruals models
and remain robust to the choice of accruals. The results still hold after tests with various
subsamples. The performance analysis is carried out with 254 MBOs for which the data
requirements are met. The univariate analysis of performance, measured by return on assets
(ROA) shows that MBO performance peaks in the first year before buyout and begins to
deteriorate after the first post-buyout year. MBOs continue to outperform industry in the 5
years examined; however performance drops to industry levels when PE-backed buyouts are
excluded. On the other hand, PE sponsors invest in firms with already high levels of
profitability and no significant performance improvement is detected in PE-backed buyouts
after PE investment. Therefore results do not suggest a positive PE role in buyout

100
performance. Spearman correlation test and cross-sectional tests of discretionary total
accruals show that earnings management is negatively associated with performance changes
and discretionary accruals is a significant determinant of changes in performance.
Our study makes two important contributions to the existing body of research. We extend
case study evidence of Howorth et al. (2004) and add to the MBO literature by providing the
first formal analysis of earnings management in private-to-private MBOs. More broadly, we
contribute to the private firm literature by providing the first analysis of earnings
management in a specific corporate event. Previously, emphasis has been given to the
analysis of institutional settings across different markets due to lack of information on
earnings management inducing events (Coppens and Peek, 2005; Burgstahler et al., 2006).
We also add to the private equity (PE) literature by providing an analysis of earnings
management in PE-backed and non-PE-backed MBOs. Bargeron et al. (2008) raise the issue
that managers of buyout targets might be collaborating with PE investors to pay a lower
price. Such an analysis is important to shed light on lingering suspicions over the role of PE
funds in their target investments. While there is a large body of literature on corporate
governance mechanisms of venture capital (VC) and PE firms (e.g., Lerner 1995, Kaplan and
Strömberg, 2003), relatively few studies examine their role in earnings management practices
of their portfolio companies. The findings of this study are complementary to the existing
evidence on earnings management in VC-backed initial public offerings (IPOs) (Morsfield
and Tan, 2006; Hochberg, 2012; Wongsunwai, 2013) and role of buyout sponsors in reverse
leveraged buyouts (Chou et al., 2006; Wang, 2010).
The second contribution we make is to the value creation debate surrounding buyouts and PE
firms. It comes in the form of an exploration of the connection between earnings management
and post-buyout performance; a link that has been examined in the context of equity offerings
but missing from buyout literature. By documenting a negative correlation between earnings

101
management and performance changes, and showing that upwards (downwards) earnings
management results in deterioration (improvement) in subsequent buyout performance, this
study complements research on equity offerings, Rangan (1998) and Teoh et al. (1998b) in
particular, and retrospectively helps us develop a more insightful understanding of buyout
performance. The negative correlation between earnings management and performance
implies that previous MBO performance studies (e.g., Kaplan, 1989a) might have been
contaminated and buyout performance overstated due to their omission of earnings
management factor prior to buyout and led to the erroneous conclusion that buyouts perform
better following MBO deal. Taken in isolation, profitability ratios are not indicators of the
real buyout performance and effects of earnings management must be controlled to draw
conclusions.
The rest of the chapter is organised as follows. In Section 2, we review literature and develop
hypotheses. Section 3 describes the data and discusses methodology. Section 4 presents the
results of cross-sectional and times series model estimations of discretionary accruals.
Section 5 examines earnings management and subsequent performance. Section 6 discusses
the results and Section 7 concludes the chapter.
4.2 Literature and Hypothesis Development
4.2.1 Earnings Management in Buyouts
There is ample anecdotal and empirical evidence regarding existence of agency conflicts
between different stakeholders. Jensen and Meckling (1976) argue that agency conflicts will
largely disappear in the wake of the acquisition of total shares by insiders because they will
themselves incur agency costs should they continue to pursue their self interests. The same
argument goes for MBOs where managerial incentives are aligned with those of shareholders
in the post-MBO period through various tools such as high levels of debt (Jensen, 1986).

102
Although this argument may well be true, the acquisition process might generate its own
moral hazard issues.
One such problem arises from managers’ implementation of Generally Accepted Accounting
Principles (GAAP). The managerial discretion over accounting practices allows managers to
adjust specific items in the desired direction. Healy and Wahlen (1999) explain that earnings
management can occur to influence stock market perceptions, to avoid violation of contracts
and to evade intervention by regulatory bodies. In special corporate events such as MBO, the
motivations for earnings management could be stronger. In MBO transactions, the reasons for
managing earnings stem from the two-sided standing of the managers. Managers can use their
superior knowledge and their vast discretion over accruals to acquire the company in an
undervalued transaction. To achieve this aim, they might understate earnings and take
deliberate decisions in a way that negatively affects company value. In the occurrence of
income-decreasing earnings management prior to transaction, an MBO is likely to produce
post-transaction gains for managers resulting from shareholder wealth expropriation. The
existing evidence shows that earnings in public firms are often managed upwards to achieve
targets (Gore et al., 2007), to meet analysts’ earnings forecasts (Athanasakou et al., 2009) and
for managers’ personal benefits from bonus schemes (Healy, 1985). Managers of private
firms also tend to inflate earnings prior to IPOs (Teoh et al., 1998a). In the special MBO
setting, however, an increase in earnings would cost managers more in terms of their personal
wealth. Therefore incumbent managers might benefit from a decrease in the firm value,
which provide them incentives to understate earnings and reap post-transaction gains.
The collective evidence from US public-to-private MBOs conclusively shows downward
earnings management or no earnings management. For example, DeAngelo (1986) concludes
that the detailed scrutiny accompanying MBOs prevent managers from systematically
manipulating earnings. Perry and Williams (1994) provide evidence of income-decreasing

103
accruals management one year before MBO date. Wu (1997) documents significant decline
in industry-adjusted earnings and existence of negative discretionary accruals one year before
MBO, lending support to earnings management. Similarly, Fischer and Louis (2008) found
negative accrual changes in the year before MBO. They hypothesise a two-pronged situation
where manipulative motives are influenced by managers’ ability to finance deal with their
personal wealth and their need to obtain external financing.
The presented evidence reported for public-to-private MBOs suggests a negative relationship
between buyout transaction and discretionary accruals. Unlike US market, however, UK
MBOs do not operate under full financial information blackout after transaction. Regardless
of their public status, EU regulations still require them to report audited financial statements
which are publicly accessible.12
Due to fear of detection, managers of UK firms might have
reduced incentives to manage earnings.
4.2.2 Earnings Management in Private-to-private Buyouts
Schulze et al. (2003) argue that governance mechanisms designed for public companies do
not work as planned when firms are private. Private companies are often owned by a few
individual blockholders in contrast with public companies where equity is dispersed across a
large number of investors. This ownership concentration allows managers and shareholders to
establish more personal relationships (Fama and Jensen, 1983) and to use private
communication channels to exchange information (Burgstahler et al., 2006). Many private
firms are run by families where the roles of managers and owners are not clearly separated.
The unclarity of borders between managerial and ownership roles invalidate inferences based
on the standard principal-agent relationship. However different types of private firms might
12
EU 4th
Directive Article 47(1) and 51(1) respectively state that companies must make their annual reports
publicly accessible and have their financial accounts audited. The Fourth Directive also clarifies that member
states can lighten publication requirements of annual accounts for small and medium sized companies and
auditing exemptions can be introduced for small companies.

104
introduce different issues within the organization. Howorth et al. (2004) report that
information asymmetries can be strong in private non-family firms which have a separate
ownership and management structure. Family firms too may incur severe agency costs, not
because of conflicting goals of managers and owners, but because family members can be
driven by non-economic objectives and make irrational decisions that are not always in the
best interest of company (Dawson, 2011). MBOs therefore act as a viable way to deal with
succession issue in family firms. It allows the family to realise investment and maintain the
independence of the company (Howorth et al., 2004; Scholes et al., 2008). In this case, the
purchasing team is likely to have good relations with the family, which would minimise
conflicts of interest. Their incentives to manage earnings for personal gain are then
substantially reduced.
The evidence points to a complex mix of asymmetric forces related to markets and company
structure. While private companies are often considered to have less agency conflicts (e.g.
Fama and Jensen, 1983), evidence from European private firms consistently shows the
presence of earnings management and that the incentives to do so remain in place (Coppens
and Peek, 2005; Burgstahler et al., 2006). Various incentives for earnings management has
been examined in prior literature, with an emphasis on comparing private and public
companies, and on the effects of institutional settings. Of particular interest is how private
firms perform in the absence of capital market pressures. Beatty et al. (2002) find that private
banks exhibit less earnings management than publicly held banks. Coppens and Peek (2005)
argue that the absence of capital market pressures does not eliminate motives for earnings
management. Private firm managers adjust their standing to the particular legal system and
market, and exercise discretion over accounting practices. Burgstahler et al. (2006) present
evidence that private firms exhibit more severe earnings management than public firms. They

105
argue that public markets serve to mitigate manipulative incentives through various
monitoring activities that private markets are unable to provide.
Our study shares most aspects of the private firm studies presented above. As every other
private company, our MBOs have concentrated ownership and their managers are not under
pressure of strict capital market scrutiny. In addition to other manipulative forces, however,
MBO managers have additional incentives stemming from their acquisition of company. Note
that the expected direction of earnings management is not the same. While managers often
adjust earnings upwards for the fear of loss-reporting, MBO event provides them stronger
incentives to adjust earnings downwards, thus acquiring a higher percentage of ownership at
a lower price. Our sample private firms are, however, subject to a different set of influential
factors than US public-to-private MBOs. In private family firms where MBO acts as an
acceptable succession tool (Howorth et al., 2004); the friendly nature of the deal would
substantially mitigate incumbent managers’ incentives to manage earnings to their benefit.
Moreover, European private firm managers are unable to operate under cover due to
differences in reporting requirements between US and European private firms. Perry and
Williams (1994) note that a main driver of earnings management prior to US MBOs is the
disappearance of detection fear resulting from regulatory cover in post-buyout period for the
newly private firm. Since our sample private firms do not undergo a change in their reporting
requirements after buyout, a considerable reduction in managers’ personal wealth motivations
is expected. In general, we conjecture that conflicting considerations related to family
succession issues, differences in reporting regulations and managers’ personal wealth factor
will impose a divergent outcome with respect to the existing evidence reported for public-to-
private MBOs, and offset managers’ incentives for earnings management.
H1: Managers of private-to-private MBOs do not understate earnings prior to buyout.

106
4.2.3 Private Equity Backing
The importance of separate examination for PE-backed and non-PE-backed buyouts has
recently been pointed out in the literature (Jelic and Wright, 2011). PE firms are not ordinary
sponsors; the influential role they play in their portfolio companies and the resulting
differences between MBOs with and without PE sponsors might generate divergent
managerial behaviour prior to buyout transaction. PE firms invest through closed-end funds
which have a limited life span, thus they require divesting their holdings and extracting return
on their investments. They provide the experience of business professionals and external
financing in one package (Fenn et al., 1997). Venture capitalists and buyout specialists are
known to be repeat market players (Cressy et al., 2007) who have the ability to go beyond
financial statements and extract managers private information (Hand, 2005). Their skills,
specialisation and market experience give them an advantage in managing their portfolio
companies. However, their ability to realise scale of economies and create synergy by
acquisitions are limited or non-existent (Bargeron et al., 2008), whereas public and private
acquirers can merge their business with the target company and generate more value.
The activities of PE firms have been subject to widespread suspicion and criticism. They
have been repeatedly accused by politicians and trade unions of asset stripping in several high
profile bankruptcies (Godley, 2011). The literature presents us conflicting evidence regarding
the role of PE in the process leading to the buyout and after the buyout transaction. While
performance improvements are documented in the post-transaction firm (Kaplan, 1989a; Jelic
and Wright, 2011), the evidence related to their pre-buyout involvement is less positive.
Acharya and Johnson (2010) show presence of large insider trading in PE-backed buyouts.
Bargeron et al. (2008) find that PE funds pay lower acquisition premiums than other
acquirers. They argue that this could be a reflection of their limited capacity to generate
synergy gains and their limited time to extract returns; nonetheless it also raises the question

107
of whether PE firms collaborate with target management in MBOs. With managers lacking
the funds to acquire the total equity, the financial assistance of PE could benefit both parties
in an undervalued acquisition.
On the other hand, PE firms are known to have a positive bias for better performing firms
(Jelic and Wright, 2011). The performance provisions related to PE funding might lead
managers to seek better performance to attract PE investment. Fischer and Louis (2008) argue
that managers’ desire for personal gain might be offset by their need for external financing.
Their incentives for earnings management are related to their financial independence and
personal ability to finance MBO deal. If managers cannot finance transaction with their
personal wealth, they might manage earnings upwards to show their firm as an attractive
investment option. However, PE firms would detect earnings management practice if their
screening skills allow them to fully extract managers’ private information. Moreover, PE
firms are repeat market players who have serious reputation considerations. Collaborating
with managers to understate earnings would taint their credibility in the case of detection by
regulators. European private firms report audited financial statements, which would increase
the probability of detection and reduce manipulative incentives related to the going private
notion raised for US MBOs.
The evidence from IPOs suggests that effective monitoring and reputation concerns of VC
firms constrain earnings management around IPO. For example, VC-backed IPO firms tend
to show lower abnormal accruals and exhibit more conservative earnings management than
comparable non-VC backed IPOs (Morsfield and Tan, 2006; Hochberg, 2012). In the same
vein, Wang (2010) finds that presence of buyout sponsors leads to improvement in
discretionary accruals in reverse leveraged buyouts. One exception is Chou et al. (2006) who
find that buyout sponsors engage in upwards earnings management prior to IPO exit. Lee and

108
Masulis (2011), Wongsunwai (2013) and Brau and Johnson (2009) report negative
association between earnings management and VC reputation.
We expect the opposing considerations related to managers incentives for personal gain, their
need for external financing and reputation concerns of PE firms to temper the incentives for
earnings management in either direction. Therefore we propose that:
H2: There are differences in earnings management between PE-backed and pure buyouts.
H3: PE-backed private-to private MBOs do not exhibit earnings management prior to buyout.
4.3 Data and Methodology
4.3.1 Sample Selection
We construct our sample and subsamples by the following procedure. First, MBOs completed
between 2004 and September 2012 are identified from Thomson One Banker Deal Analysis
(TOB) database. We select deals based on three criteria: Target must be registered in the UK,
the target of acquisition must be a private company, and deal must be led by an incumbent
management team. Our search resulted in 1004 MBOs. TOB provides deal announcement
and completion dates, firm industry and SIC codes, deal value where available, and deal
synopsis that gives information on bidders, presence of PE investor and the origin of
acquisition target. From deal synopsis, we identify secondary buyouts, former subsidiaries,
public-to-private buyouts and management buy-ins (MBI) for exclusion from sample. These
buyouts are excluded to obtain a homogenous sample of private-to-private MBOs since
mixing with other types of buyouts with different characteristics and motivations might dilute
the results and lead to erroneous conclusions that do not correctly reflect the motivations for
earnings management. We also drop formerly bankrupt targets following Perry and Williams
(1994). Finally we drop financial firms following the standard practice in corporate finance

109
research. A total of 144 firms are identified and dropped in this step, leaving us with 860
private- to-private buyouts.
Second, for the remaining 860 private companies we collect financial statements from Fame
database. A minimum of 2 year historical data is required to calculate changes in accruals and
perform the cross-sectional version of Jones regression. Therefore we eliminate firms with
missing data in any of the immediate 2 years before MBO and firms with fewer than 2 years
of pre-buyout data. We also drop MBOs which occurred in 2003 since we cannot obtain
financial statements to construct industry/year portfolios in this year. At the end of this step
we are left with 291 MBOs for which the required data is available. Our final sample contains
291 MBOs.
[Table 4-1]
Table 4-1 presents the distribution of MBO transactions and their deal values across years.
The TOB population holds 860 deals between 2004 and September 2012 of which 291 are
included in the cross-sectional analysis. This number is larger than any of previous related
studies. A comparison with Perry and Williams (1994) sample reveals that their 175 public-
to-private MBOs have an aggregated market value of approximately $54 billion, whereas the
total value of our sample remains around $9 billion. The large difference between the two
samples arises for two reasons; the first one is that private-to-private MBOs are, in general,
smaller than public-to-private MBOs (Stromberg, 2008), and the second reason being that
private firms are not required to disclose deal information. The latter is important since only
one third of our final sample firms have disclosed deal value, leading to a low aggregate
sample valuation. There is substantial deal clustering at the time referred to as mega buyouts

110
period.13
The highest number of deals is reported in 2006. Two of the sample years (2005,
2006) collectively account for more than 40% of our sample buyouts. Over 80% of deals are
completed between 2004 and 2008 and the number of buyouts drops after 2008. The last
three years (2009, 2010, 2011) coinciding with stagnation period account only for 15% of the
total. This pattern is consistent with the sharp fall in worldwide buyout activity around 2008
(Scholes and Wright, 2009; Gilligan and Wright, 2010). However, our sample represents a
good portion of the UK population, comprising 64% of the aggregated transaction value
where deal information is disclosed. In terms of total number of private-to-private buyouts, it
represents 34% of the MBO population. Considering the reporting exemptions related to
small and medium sized private firms and extensive pre- and post-buyout data requirements,
our sample covers a sizeable section of the private-to-private MBO market.
4.3.2 Data Issues and Attrition Rate
The present literature (Perry and Williams (1994); Wu (1997); Fischer and Louis, (2008))
relies on Compustat for financial data. In the UK, Fame is the main source to obtain financial
statements of private companies. Another database published by the same company,
Amadeus, also offers private company information for European firms as well as UK firms. It
has previously been used in multi-country level earnings management studies of Coppens and
Peek (2005), and Burgstahler et al. (2006) where their particular research settings impose
Europe-wide company coverage. Fame, however, has a special focus on UK and Ireland
companies. Although Amadeus offers more detailed financial statements compared to Fame,
the latter is chosen due to its better coverage of UK companies.14
13
Loosely defined, the buyout market revival in mid-2000 is often referred to as mega buyouts age. Nine of the
ten largest buyouts occurred during this period (Samuelson, 2007). These include the largest buyout in history;
$45 billion TXU Corp. deal and the largest UK buyout Alliance Boots valued at $22 billion. 14
Fame database covers more than 7 million active and inactive UK companies, while Amadeus covers around
2.5 million UK companies.

111
The limitations of commercial databases have been discussed in Stromberg (2008) and Jelic
and Wright (2011). A major disadvantage of Fame is that historic financial data is limited to
the last 10 years, which means that we have no access to data before 2003 at this point of
time. Another issue with Fame is that some accounting items are reported under different
names than those in Compustat. We examine formulas and enumeration of Compustat items,
annual reports and Fame financial statements to ensure consistency and that we use
appropriate accounting items in calculations.15
The sample includes a large number of small and medium sized companies which are allowed
to report modified or abridged accounts. Companies classified as small do not have to file
income statement while companies classified as medium do not need to report sales. These
reporting exemptions introduce data intermittence across years and consequently a significant
data loss to our sample since models require items from both balance sheet and income
statement.
4.3.3 Measuring Accruals
We follow the balance sheet approach where total accruals are computed as non-cash
working capital minus depreciation expense.16
This definition is the same as in Perry and
Williams (1994), Dechow et al. (1995) and Burgstahler et al. (2006).17
It is argued that
current accruals are more relevant when measuring year-to-year discretion since non-current
15
This is done to ensure consistency with US MBO research on earnings management. The names and formulas
of equivalent accounting items are: Cash & cash equivalents (C1) = Bank and deposits (F42); Plant, property &
equipment (C7) = Tangible assets (F31); Current maturities of long term debt (C44) = Short term loans &
overdrafts (F52); Sales (C12) = Turnover (F1). C and F indicate Compustat and Fame data item numbers
respectively. 16 We compute total accruals as follows (Fame data items are indicated in parentheses): Total Accrualst =
[∆Current Assetst (48) - ∆Casht (42)] - [∆Current Liabilitiest (66) - ∆Short term debtt (52)] - Depreciationt (21).
Items displayed by Fame with a negative sign are multiplied by -1 prior to calculating total accruals. These
items are current liabilities and short term debt. Variables are defined in Table 4-2.
17 Hribar and Collins (2002) argue that earnings management studies using balance sheet items to calculate
accruals are likely to be contaminated and recommend a cash flow based approach. However private companies
are not required to file cash flow statements and thus we are limited to a balance sheet approach in accruals
calculation.

112
portion of discretionary accruals may not reflect the recent accounting practices (Jones, 1991;
Teoh et al., 1998b). There has been increasing use of working capital accruals (Gore et al.,
2007; Athanasakou et al., 2009) and many studies rely on both total and working capital
accrual measures to examine manipulative behaviour. Arguably, working capital accrual
models are more useful in cases where disclosures are quarterly, (e.g., public companies,
equity offerings) and might convey less information in cases of private companies that
publish their accounts annually. Kothari et al. (2005) performance modification to the
original model is also useful to correct misspecifications and errors in cases that companies
are likely to exhibit extreme financial performance.
Table 4-3 provides descriptive statistics for MBO firms with respect to changes in total
accruals, sales and earnings. The variables are obtained as first differences scaled by lagged
total assets. Only MBOs with sufficient time series observations are used in the table to
ensure consistency and avoid large differences in the number of observations across years.
First-differencing extends data requirements for variables, hence making it unlikely to use
cross-sectional sample MBOs. Accordingly, 101 MBOs that have enough historical data are
used for the table.
[Table 4-3]
As shown in the table, the changes in total accruals are generally small and positive in the
years prior to MBO year. They maintain a normal behaviour that indicates no manipulative
activity until the first year before MBO. A considerable percentage of firms have negative
changes in accruals in the second year prior to buyout. These negative changes in year -2
transform into strong positive changes in year -1. However t-tests and Wilcoxon tests show
that neither year represents significant changes in total accruals. A similar pattern is seen in
the changes in earnings. The year -1 is preceded by small and mostly insignificant positive

113
changes, however the mean (median) change in year -1 grows to 0.035 (0.026). This change
in earnings is significant at (p=0.003) using two-tailed t-test and at (p=0.000) using two-tailed
Wilcoxon test. We do not interpret this as a sign of upward management due to repeated
cautions in the literature that changes in earnings and total accruals may represent other
underlying forces (e.g., Jones, 1991; Defond and Jiambalvo, 1994). Rather these statistics are
presented for descriptive purposes. We conduct formal tests in section 4.4 to examine
earnings management.
4.3.4 Model Selection
We employ a cross-sectional variant of Jones (1991) time series regressions introduced by
Defond and Jiambalvo (1994) and Kothari et al. (2005) performance adjusted model to test
earnings management. These models use a measure of aggregate accruals as dependent
variable and three explanatory variables to estimate model parameters. Both cross-sectional
and time-series models require partition of total accruals into discretionary and non-
discretionary portions and estimating the unobservable discretionary accruals based on
expected value of non-discretionary part. As far as data availability is concerned, the cross-
sectional variant provides an advantage over original pooled time series regressions,
especially in the case of private companies where historical accounting data is scarcely
available. The main difference between two models is that pooled time-series regressions
assume constant coefficients during the entire test period, while cross-sectional regressions
estimate coefficients separately for the each specific year examined. Performance adjusted
model is especially useful to correct model misspecification when the sample tested has
extreme performance (Kothari et al., 2005). Since MBOs are likely to have abnormal
performance around buyout, performance adjustment adds a useful additional control to our
earnings manipulation tests.

114
Recently there has been increasing use of models that examine specific accruals or statistical
properties of earnings distributions to detect manipulative behaviour. Both approaches make
a number of assumptions and impose different data requirements that constrain their area of
application. As discussed in McNichols (2000), specific accruals models have a particular
emphasis on unique industry settings where a single accrual is judged to be vulnerable to
manipulation due to industry-specific circumstances. On the contrary, our study does not
have a particular interest in a single accrual or industry, rather it incorporates 52 different
industries measured by 2-digit SIC code. The strict data requirements would also make
application of this approach impossible in our private firm setting. Distributional approaches
(e.g., Burgstahler and Dichev, 1997) examine frequency and statistical properties of earnings
around manipulative event. Although these models do not require many data items, their use
in MBO context, in our opinion, will be flawed since substantial restructuring is carried out
following buyout. In addition, managers might continue to manage earnings in the first year
after buyout. Hence, we argue that earnings in the immediate year after buyout may not
represent the real performance and may not contain as much information as we would like. In
the context of this study, we examine earnings by the means of univariate performance
analysis and consider Kothari et al. (2005) performance adjusted regressions a better model
choice due to the explicit performance focus that this study has. In the light of these concerns
related to specific accruals and distributional approaches, our choice of cross-sectional
discretionary accruals models is justified.
4.3.5 Control Firms
A control sample is created by matching each MBO firm on industry and year with private
non-buyout firms. The non-buyout private firm sample is collected from Fame as 160,000

115
active and inactive UK companies with available data.18
These firms are used for the analysis
of cross-sectional model as well as comparison purposes. For cross-sectional model of
expected accruals we construct groups of firms in the same year and 2-digit SIC code, which
are called industry/year portfolios or estimation portfolios. Our matching procedure relies on
the standard assumptions that firms in the same sectoral groups are subject to similar
economic and market forces. One drawback of such method is noted by McNichols (2000)
who argues that firms are more likely to manage earnings if their competitors engage in such
practice. Our industry portfolios may not provide a correct representation of a comparable
manipulation-free setting should this argument materialise. In our private firm case, however,
the flow of information among market players is weaker than in public markets, which makes
detecting and mimicking a particular behaviour more difficult. Our industry portfolios also
contain considerably large number of firms, with a mean of 1,288 and median of 665 firms in
each portfolio. Hypothesising a homogenous mimicking behaviour for so many firms would
not be a realistic assumption. Finally our buyout firm managers have distinct incentives for
earnings management stemming from the occurrence of a major corporate event that other
private firm managers do not possess. The unique characteristics of our study therefore
provide a realistic basis for us to perform such analysis. The detailed statistics on 160
industry/year control portfolios are given in Table 4-4.
[Table 4-4]
Table 4-5 provides descriptive statistics and compares MBOs and their corresponding
estimation portfolios with respect to total assets, sales and earnings in the two years prior to
MBO announcement. Presented mean and medians for estimation portfolios are calculated
18
Specifically, we impose search criteria such that each private firm in the UK must have data on each of the
Tangible assets, Bank and deposits, Current assets, Total assets, Short term loans & overdrafts, Current
liabilities, Long term liabilities, Turnover, Taxation, Net profit, and Depreciation in at least one of the years
between 2003 and 2011 to be included in the control sample.

116
from medians of 225 unique portfolios. For comparison purposes, a paired difference score is
calculated by subtracting portfolio median from MBO firm value. Significance of paired
differences is tested by parametric t-test and non-parametric Wilcoxon test.
[Table 4-5 here]
The statistics on assets and sales of Table 4-5 indicate that MBO firms are, on average, 8
times larger than their non-buyout counterparts. This difference in size is significant at 1%
level for both t-tests and Wilcoxon tests (2-tailed). This result is expected since our control
sample utilises a fairly large number of private firms, many of which are classified as small
and medium sized companies. Although we are not aware of any size-effect related to
earnings management incentives, matching on size is previously used in the literature by
Perry and Williams (1994) to eliminate its potential effects. We control for size in section
4.4.4 using a propensity score matching method. The earnings panel shows that MBO firms
are highly profitable in the years preceding transaction. The number of MBO firms with
negative earnings are considerably small (15%) in both years and the magnitude of earnings
are comparable with control firms. Paired difference scores indicate that control firms are
slightly more profitable than MBOs. The differences, however, are not significant, thus
lending support to representativeness of our control firms.
4.4 Tests of Earnings Management
4.4.1 Cross-sectional Tests
4.4.1.1 Discretionary Total Accruals
We test earnings management during two years preceding buyout. For cross-sectional tests,
we use portfolios of industry firms matched on two-digit SIC codes to estimate parameters.
Our MBO sample has 53 two-digit industry groups for 291 firms. We are able to match 52
industry groups with control firms and derive estimation portfolios for 291 MBOs. The top

117
three two-digit industry groups with the largest number of MBOs (SIC code 50 (Whole sale-
durable goods), SIC code 73 (Business services) and SIC code 87 (Engineering, accounting,
research, management, and related services)) account for around one third of our sample. In
total, there are 160 unique industry/year combinations across 8 calendar years. 42 (79% of)
industry portfolios and 64 (38% of) industry/year combinations are used for multiple
MBOs.19
225 unique regressions are performed to obtain parameters. In the discretionary
total accruals model, total accruals are a function of inverse lagged assets, revenues and
tangible assets.
(1)
where TAijt = total accruals for estimation portfolio i matched with MBO firm j on
industry in year t; ∆REVijt = changes in turnover for estimation portfolio i matched with
buyout firm j on industry in year t; PPEijt = tangible assets for estimation portfolio i matched
with buyout firm j in year t; εijt = error term for estimation portfolio i matched with buyout
firm j in year t; i = 1, ...., I, estimation firm index for the number of firms in estimation
portfolios (number of firms in portfolios ranges from 14 to 9,268); j = buyout firm index, 1,
…., 291; and t is prediction year (the first or second year prior to buyout). All variables in the
regression are scaled by lagged total assets to mitigate heteroskedasticity. The parameters of
the model; β1jt, β2jt and β3jt are estimated with OLS regressions. The discretionary accruals
are then computed as:
(2)
where DAjt = discretionary accruals, or non-standardised prediction error for MBO firm j in
year t; TAjt = total accruals for buyout firm j in year t; 1/Assetsj,t-1 is the inverse value of
19
There are 49 two-digit industry groups and 128 industry/year combinations in year -2.

118
lagged total assets for buyout firm j in year t; ∆REVjt = changes in turnover for MBO firm j in
year t; PPEjt = tangible assets for MBO firm j in year t; and β1jt, β2jt, β3jt are estimated
parameters obtained from model (1). In the absence of managerial discretion, there will be no
unobservable decisions and therefore no error term in the equation (2). In this case total
accruals will be equal to non-discretionary accruals. Thus, the left-hand side of the equation
would equal the right-hand side. When managerial discretion is involved, there will be
additional noise and unobservable error term will have a non-zero value. Therefore
discretionary accruals are obtained as actual total accruals minus computed (non-
discretionary) total accruals:
Descriptive statistics for the regression parameters obtained from model (1) are presented in
Table 4-5. The number of firms in industry portfolios ranges from 14 to 9,268, with a mean
of 1288 and median of 665 firm observations. The median adjusted R2
is 77%, which is
higher than any of the public-to-private MBO studies. The parameters exhibit expected signs.
Mean and median revenues coefficient (β2) is positive, and PPE coefficient (β3) is negative.
More than 50% of all coefficients are significant at conventional levels. Since our portfolios
include large number of private firms, potential influence of extreme values on the estimated
parameters cannot be ruled out. Hence we re-estimate parameters using data winsorised at 1%
and 99% levels. The results are statistically and economically consistent with our previous
estimates.
[Table 4-6]
Discretionary accruals or non-standardised prediction errors are calculated for 2 years prior to
MBO. We obtain prediction errors from model (2) and also calculate standardised prediction
errors following Jones (1991). Standardised prediction errors are computed by dividing each
prediction error to its standard deviation estimated from the related cross-sectional regression.

119
Error standard deviations are computed as: where RSS = residual sum of
squares, T = the number of observations in related industry/year portfolio, k = number of
parameters in the regression. The significance of standardised prediction errors are tested by a
Z statistic introduced by Patell (1976):
(3)
where Vij is standardised prediction error for estimation portfolio i matched with buyout firm
j, Tij is the number of observations in the estimation portfolio i for buyout firm j, and k is the
number of parameters in the cross-sectional model.
The results of the cross-sectional tests are presented in Table 4-7. The first two columns show
prediction errors for the year immediately before MBO transaction. Statistics for the second
year before MBO are also presented because the MBO planning might not be limited to
preceding year. Our results follow a different pattern than those found in previous earnings
management studies. Past studies hypothesise that MBO firms will exhibit negative
discretionary accruals and thus report one-tailed p-values. On the contrary, we do not make
prediction about the direction of earnings management, rather our hypotheses attempt to
discover whether earnings management is present or absent in private firms. We therefore
present 2-tailed p-values to maintain consistency with our hypotheses and to highlight the
differences of our findings.20
The first column indicates that the mean and median non-
standardised prediction errors are positive and significant in both parametric and non-
parametric tests (p = 0.000, two-tailed). The standardised prediction errors in the second
column are also significant using Wilcoxon test (p = 0.002, two-tailed). The third and fourth
columns show negative accruals, with the exception of mean non-standardised prediction
error. The positive mean in the third column is significant (p = 0.013, two-tailed), the
20
The unreported results obtained from winsorised data are qualitatively identical to Table 6.

120
negative median and non-standardised mean/median in fourth column are not significant (p >
0.1, two-tailed). Therefore it is not possible to draw conclusion for the second year prior to
buyout. The results of year -1 indicate strong upward management, contrary to existing
evidence for public-to-private MBOs which suggests that buyouts are preceded by
downwards earnings management. Rather it shows that private firm managers have stronger
incentives to make upward adjustment than their potential wealth benefits from downward
adjustment. This result is consistent with our H1 and Howorth et al. (2004) who suggest that
family succession plays an important role in private-to-private MBOs. Our findings
underscore the differences in agency motives between public and private firms prior to MBO
transactions, where a public firm’s accounting practices are characterised by the pursuit of
managerial self interest while the private one is characterised by the family succession issues.
In the next section, we present results from performance adjusted model estimations.
[Table 4-7]
4.4.1.2 Performance Adjusted Discretionary Accruals
Kothari et al. (2005) suggest two ways of performance adjustment. The first one involves
matching each MBO on a firm with the same industry and nearest profitability. The second
one is carried out by augmenting the original regression by an additional profitability (return
on assets – ROA) variable. Both methods are widely used in the earnings management
literature. We estimate the augmented cross-sectional Jones regression as follows:
(5),
where TAijt = total accruals for estimation portfolio firm i matched with MBO firm j on
industry in year t, ∆REVijt = changes in turnover for estimation portfolio firm i matched with
MBO firm j on industry in year t, PPEijt = Tangible assets for estimation portfolio firm i

121
matched with MBO firm j in year t, ROAijt = Net income divided by assets for estimation
portfolio firm i matched with MBO firm j on industry in year t, Assetsi,jt-1 = Total assets one
year before manipulation year .
[Table 4-8]
The results presented in Table 4-8 give support to the previous findings that private-to-private
MBOs manage earnings upwards in the year preceding buyout. Consistent with results from
discretionary total accruals tests, prediction errors in year -1 are positive and year -2 are
negative, while only those in year -1 are significant. There is a visible drop in the mean and
median non-standardised accruals, which we attribute to the correction of type II errors due to
performance adjustment as explained in Kothari et al. (2005). The mean and median non-
standardised prediction errors and median standardised prediction errors in year -1 are
significant at 5%. The negative prediction error statistics for year -2 are not significant.
Overall, the results are consistent with the previous inferences that private-to-private MBOs
engage in upwards earnings manipulation in the year preceding buyout and this earnings
management phenomenon does not extend back to the second year prior to buyout.
4.4.1.3 Working Capital Discretionary Accruals
We estimate cross-sectional regressions with working capital accruals (WCA) to examine the
management of short term accruals. WCA are computed as non-cash working capital, and can
be obtained by subtracting depreciation from total accruals. Since depreciation represents a
long term accrual, removal of it leaves short term accruals in the equation. In the same vein,
PPE explanatory variable is dropped from model because it is associated with depreciation.
The model used to estimate WCA model parameters is as follows:
(6)

122
The obtained results are presented in Table 4-9. In general, estimates of cross-sectional model
with working capital accruals are consistent with previous estimates with total and
performance adjusted accruals. The non-standardised mean and median prediction errors in
year -1 are positive and significant at 5% and 1% respectively, and median standardised
prediction errors is significant at 1%. In line with previous findings, negative prediction
errors in year -2 are not significant. Overall the results from 3 cross-sectional models suggest
that private-to-private MBOs manage earnings upwards in the year preceding buyout. Given
the previous MBO evidence on earnings management (Perry and Williams, 1994; Wu, 1997)
that public-to-private MBOs understate earnings, this behaviour is consistent with the notion
that different agency problems and regulatory environment of private companies impose
distinct motives on managers for undertaking a buyout. The differences are then reflected in
the way managerial discretion is exercised.
[Table 4-9]
4.4.2 Pooled Time Series Tests
To assess robustness of our results, we re-estimate discretionary accruals using Jones (1991)
pooled time series model.21
The expected accruals model to obtain parameters is:
(7),
where TAjt = total accruals for buyout firm j in estimation period year; ∆REVjt = changes in
turnover for buyout firm j in estimation period year t; PPEjt = tangible assets for buyout firm j
in estimation period year t; Assetsj,t-1 = lagged total assets for buyout firm j in estimation
period year t; j = 1, ..., 101, buyout firm index; t= 1, ..., Tj, year index for buyout firm j’s
estimation period length, Tj ranges from 4 to 8 years.
21
A limitation of this approach is that a minimum of 6 years data required to compute Patell (1976) Z statistic
for standardised prediction errors. Therefore sample is substantially reduced in the calculation of standardised
prediction errors.

123
The number of years in the estimation period ranges from 4 to 8, with a mean of 5.4 and a
median of 5 years.22
As in cross-sectional models, the coefficients of revenues and PPE
generally carry their expected signs. However there is a considerable decrease in the overall
parameter significance. Less than half of the coefficients are significant at conventional
levels. The median adjusted R2
is 32.9%, which is lower than Perry and Williams (1994) but
higher than Jones (1991). The Durbin-Watson test statistics indicate that serial correlation is
not present in the average test.
[Table 4-10 here]
The results of time-series tests presented in Table 4-10 are partly consistent with cross-
sectional results. Mean and median prediction errors are positive in year -1 and negative in
year -2. The magnitude of non-standardised prediction errors is similar to those in cross-
sectional tests. However all prediction errors are insignificant with the exception of non-
standardised prediction error in year -1, which is significant at 5% using 2-tailed t test. The
drop in significance levels is attributable to the short estimation windows used in the
expected accruals model as well as the low observation count in standardised accruals tests.
The results from pooled time series estimations confirm the findings of cross-sectional tests
that private-to-private MBOs are not preceded by income-decreasing earnings management.
These findings are in contrast with the existing evidence from public-to-private buyouts
(Perry and Williams, 1994; Wu, 1997; Fischer and Louis, 2008) that MBO managers
understate earnings for ex post personal gains. A plausible explanation for this behaviour
could be that combined effects of conflicting factors such as family succession and
22
Note that 8 is the maximum number of years possible for private companies. Researchers often use longer
estimation windows. For example the mean and median values for Perry and Williams (1994) sample are 11.3
and 12 years respectively, with a minimum of 4 and a maximum of 16 years in the estimation period. However,
availability of data for private companies is more constrained. Therefore our estimation windows are smaller
than those in public firm studies.

124
differences in reporting regulations faced by UK private firm managers prevent their pursuit
of self-interest and override their personal wealth goals.
4.4.3 Private Equity Backed MBOs
To examine the effect of PE involvement in earnings management the sample is stratified
based on PE sponsor status. Segregation of PE-backed and non-PE-backed buyouts is
important to gain more insight into post-buyout MBO performance. Slightly more than half
of the sample MBOs has PE sponsors. There are 151 and 52 PE-backed MBOs in the cross-
sectional and time-series samples respectively. The descriptive statistics for changes in total
accruals, sales and earnings for the PE-backed subsample are presented in Table 4-11. Time-
series sample is used for descriptive analysis to maintain consistency with the whole sample
statistics presented in Table 4-3. The significance of mean and medians is tested by one-
sample t-tests and Wilcoxon tests. Two-sample Mann-Whitney tests for the equality of
medians are also performed in PE-backed and non-PE-backed MBOs.
The patterns observed in PE-backed subsample are in line with statistics in Table 4-3. The
changes in total accruals are largely positive, except year -2, and changes in earnings are
positive throughout 4 years examined. The largest changes in statistics occur in the first year
before MBO, where both total accruals and earnings grow by 3% from the year prior. Mean
changes in earnings are significant at 5% (p = 0.033, 2-tailed) and median changes at 1% (p =
0.000, 2-tailed). Mann-Whitney p-values indicate that the differences between PE-backed and
non-backed MBOs are not significant. In sum, presented statistics do not suggest a significant
role for PE sponsors in the accounting practices of managers prior to MBO transaction.
However these statistics should not be interpreted as evidence of presence or absence of
earnings management as they are only for descriptive purpose. The results of formal tests are
presented in the next table.

125
[Table 4-11]
Table 4-12 displays the results of cross-sectional tests for PE-backed and non-PE-backed
subsamples. The whole sample statistics are also presented for ease of comparison.23
Consistent with the expectations, PE-backed buyouts do not show significant upwards
earnings management in year -1. The mean discretionary total accruals and median working
capital discretionary accruals are weakly significant. The non-PE-backed sample, on the other
hand, shows significant upwards management in all 3 models tested. We previously
hypothesised that PE-backed and pure buyout behaviour will be different as far as earnings
management is concerned. The results demonstrate support for H3 that PE-backed buyouts do
not engage in earnings management while confirming that accounting practices of PE-backed
buyouts differ from those of non-PE-backed buyouts, highlighting the differences in
motivations, PE firms continuing involvement in the markets and their reputation concerns.
Our findings related to PE backing support the evidence from IPOs that PE firms constrain
earnings management (Morsfield and Tan, 2006; Wongsunwai, 2013) whilst we find no
support for the argument that PE firms collude with managers prior to MBOs to understate
earnings (Bargeron et al., 2008). Overall, our findings are consistent with a positive venture
capital certification role for PE firms (Megginson and Weiss, 1991).
[Table 4-12]
4.4.4 Additional Accruals Tests
In previous sections we used 3 cross-sectional and 1 time-series models to examine earnings
management. The consistent results of the tests provide sufficient evidence that upwards
earnings management occurs prior to private-to-private MBOs. However, there might be
concerns associated with private company regulations that the results might not be
23
Time-series tests are not presented due to lack of sufficient observations and the powerless tests statistics
resulting from short parameter estimation windows.

126
extrapolated to the public companies. For example, EU member states might introduce
disclosure and audit exemptions for small and medium sized firms. Since previous studies
examine public-to-private MBOs that do not face such exemptions, it might be useful to
repeat the tests excluding these firms and to obtain more comparable results. In addition,
there might be concerns about the large differences between the observation numbers in
industry/year control portfolios. Table 4-4 showed that the largest portfolio has 9268 firm
observations while the smallest portfolio has 14 firm observations. The standard deviation is
1781 firms. This large standard deviation is a by-product of the big industries in the private
company population numbering in several millions.24
These big industries are also heavily
represented in our sample pushing up the standard deviation.25
Some might argue that the
large standard deviation might cause a bias in the test statistics, with large portfolios yielding
powerful tests and small portfolios yielding weak tests. In the light of Defond and Jiambalvo
(1994) method where portfolios are constructed from the population of companies with
available data, this argument is not justified. In fact the bias might occur if big industries are
purposefully trimmed to obtain a smaller standard deviation. Still, it might be useful to
exclude the largest and smallest portfolios – and corresponding MBOs accordingly- and
repeat the tests to verify our findings. The results of the experiments with 4 subsamples are
presented in Table 4-13.
[Table 4-13]
Panel A reports the statistics for MBOs filing audited accounts. Panel B reports statistics for
MBOs that report full accounts from the date of buyout to the last year they that filed
accounts. This is done to obtain a more homogenous sample in terms of audit and disclosure.
24
Portfolios constructed from public companies do not suffer from large standard deviation in the number of
observations since the public company population is relatively small. 25
Table 3 shows the industry/year portfolios and number of matched MBOs for each portfolio. The most
heavily represented big industries are 2-digit SIC code 50 (23 MBOs), 2-digit SIC code 73 (43 MBOs) and 2-
digit SIC code 87 (29 MBOs).

127
Although all sample MBOs must file full accounts in the 2 years preceding MBO to be
included in the sample, using registered account types (e.g., full accounts, small company,
total exemption etc.) would provide formal results. Panel C excludes the MBOs matched on
smallest portfolios that are likely to yield weak tests and Panel D presents the results
excluding the bottom and top portfolio deciles. Since whole sample tests do not show
earnings management in year -2, only results for year -1 are presented in the table. Consistent
with previous findings, all models yield positive and significant discretionary accruals
suggesting that private-to-private MBOs are preceded by upwards earnings management.
Finally we use propensity score matching (PSM) to estimate earnings management. Contrary
to dimension-to-dimension matching applied in the previous three cross-sectional models,
PSM controls for multiple dimensions to select a matching firm with similar characteristics
(Li and Prabhala, 2005). We estimate a probit regression to predict likelihood of being a
buyout target, where dependent variable is a dummy that equals 1 for sample MBOs and 0 for
non-buyouts and independent variables are sales growth, size (natural logarithm of assets),
ROA and asset turnover (sales/assets). The regression is executed in each calendar year
instead of pooling the data. After the balancing property of regression is satisfied, for each
MBO firm we select a non-buyout with the nearest propensity score with replication. The
PSM discretionary accruals are calculated as MBO firm discretionary total accruals minus
PSM matched firm discretionary total accruals. The results presented in Table 4-14 show that
MBOs manage earnings upwards prior to transaction. The results related to the provision of
PE-backing also suggest that PE-backed MBOs engage in less earnings management relative
to non-PE-backed MBOs. Overall, findings are consistent with prior estimations and private-
to-private MBOs conclusively exhibit upwards earnings management.
[Table 4-14]

128
4.5 Earnings Management and MBO Performance
The existing body of research from initial public offerings (IPO) and seasoned equity
offerings (SEO) documents that earnings management around equity issues has substantial
impact on subsequent firm performance (Teoh et al., 1998a; 1998b; Rangan, 1998; Li et al.,
2006; Jo and Kim, 2007; Jo et al., 2007; Cohen and Zarowin, 2010; Kothari et al., 2012). The
negative association between discretionary accruals and performance is well documented
(Rangan, 1998; Teoh et al., 1998b). The income increasing earnings management prior to
share issues results in post-issue accrual reversals and leads to deterioration of operating
performance and stock returns in the following periods. The effects of earnings manipulation
are also manifested in the form of subsequent delisting method, where IPOs associated with
conservative earnings management are more likely to be merged or acquired and IPOs
associated with aggressive earnings management are more likely to delist involuntarily from
markets (Li et al., 2006).
The question of whether buyouts bring good returns to their investors and how they perform
in their buyout form was of particular interest since the buyout boom of 1980s. For example,
Kaplan (1989a) showed large improvements in operating performance and increases in
market value following buyout transaction. Attempts were also made to explain determinants
of buyout performance and returns to investors (Guo et al., 2011; Jelic and Wright, 2011).
The performance dimension is important to show that buyouts create value and since it plays
an influential role in the way investors realise their returns. Initial public offerings (IPO) and
trade sales have historically been the most preferred exit channels to realise investments
(Stromberg, 2008; Jelic and Wright, 2011) due to their perceived superiority and higher
return characteristics over other exit routes. Nikoskelainen and Wright (2007) document that
such superiority indeed exists in the form of subsequent returns to investors. Bienz and Lenite
(2008) formulate the relation between performance and exit channel into a pecking order,

129
where the most profitable company is exited by IPO, followed by trade sales and secondary
buyouts in a decreasing order of profitability. Cumming and Johan (2008) and Sousa (2010)
suggest that buyout teams and investors plan their exit strategy prior to consummation of
buyout transaction. Although buyouts are unlikely to exit using the conceived channels
(Wright et al., 1992), the inherent properties of a pre-determined strategy are likely to be
significant elements of post-buyout performance of the company. Hence substantial influence
on performance is expected as a result of the actions taken before buyout.
Starting with DeAngelo (1986), the role of accrual manipulation in MBO value creation is
debated. Contrary to equity offerings where issuers possess opportunistic incentives to inflate
earnings in order to maximise stock price, MBO teams tend to deflate earnings prior to
transaction in order to pay less. Perry and Williams (1994) and Fischer and Louis (2008)
study pre-buyout accrual management and provide evidence that managers understate
income. However these studies make no attempt to explore the impact of expected accrual
reversals following buyout. Since accrual management effectively means shifting income
from one period to another, a set of influential post-transaction outcomes is expected. In this
section we attempt to shed light on the buyout performance from an earnings management
viewpoint. In line with the evidence from equity offerings, we expect that earnings
management will be inversely related to subsequent buyout performance. In the light of the
above discussion and prior evidence, we propose that:
H4: Aggressive earnings management results in performance deterioration.
H5: Discretionary accruals are negatively associated with performance changes after buyout.
4.5.1 Performance Sample Industry Distribution
Table 4-13 reports industry characteristics of the performance sample. Panel A displays
detailed industry statistics and Panel B shows industries based on Gompers et al. (2008)

130
venture capital classification. Both panels show that the sample is clustered by industry, i.e.
computer equipment and services industries account for over 18% of the sample. Gompers et
al. (2008) venture capital classification reveals clustering around three industry groups.
Consumer, Business and Industrial, and Business Services industries account for over 73% of
the sample. This pattern of buyout concentration around business and service industries is
consistent with the UK and worldwide market trends.26
[Table 4-15]
4.5.2 Net Income Performance of MBOs
If we follow the agency line of argument advocated by Jensen (1986, 1989), the mere
realisation of a buyout transaction should result in performance and governance
improvements due to its superiority over traditional company structures. This argument is
well suited for public-to-private buyouts where pre-buyout earnings understatement (e.g.
Perry and Williams, 1994) may account for part of the performance improvements after
buyout. In private-to-private buyouts the relation between performance and earnings
management can be more complex. Since we find an upwards earnings management pattern,
the expected income-decreasing effect of future accruals reversals will pull earnings down
while the improved corporate structure (e.g. Jensen, 1989) will push them upwards. To
examine whether upwards or downwards earnings management introduce distinct
performance outcomes, we stratify the sample by direction of earnings management and
repeat the tests. We also rank MBOs by magnitude of discretionary accruals into aggressive
and conservative quartiles. Each quartile contains 64 firms, with varying numbers of firm-
year observations in the years examined. Then we perform Spearman rank correlation and
26
For example Stromberg (2008) notes that mature industries such as machinery and retailing are popular
buyout targets. Jelic (2011) documents the rise of service industries in the UK buyout market over time. Our
sample industry distribution is comparable to Weir et al. (2011) and Jelic and Wright (2011). For example,
Consumer, Business and Industrial, and Business Services industries constitute 65% of the Jelic and Wright
(2011) sample.
131
cross-sectional regression tests to determine the link between earnings management and post-
buyout performance. The expected sign of relation between performance and discretionary
accruals is negative without regard to the direction of earnings management.
Table 4-16 reports net income performance in the 6 years around MBO transaction. We limit
our performance analysis to three post-buyout years for mainly two reasons. First, most of the
corporate governance and performance changes & improvements occur in the first three years
following buyout (Guo et al., 2011). Second, buyout sponsors are more likely to exit after the
first three years. Average holding period in the UK for PE-backed buyouts is around 3.5
years (Nikoskelainen and Wright, 2007; Jelic, 2011). Hence the first three years would offer a
better representation of the MBOs. Top two panels display medians for the entire sample and
bottom two panels present performance by PE sponsor status. Year 0 is the buyout year and
year -1 is the first year before buyout where earnings management activity is observed. We
measure performance in two ways: raw operating performance which is calculated as net
income divided by beginning assets and industry adjusted net income performance. Industry
adjustment is performed by subtracting the medians of firms in the corresponding industry
matched on 2-digit SIC code and year from raw MBO net income. Performance changes are
computed as year-to-year differences in net income. Net income is Fame item 18 (Profit &
loss for period). Reported statistics represent median performance for the relevant samples
and years. Since performance measures scaling income by lagged assets can inflate
performance, we repeat the tests using net income scaled by current assets and find similar
results.
[Table 4-16]
Observed patterns for the entire sample suggest improvements prior to buyout and slight
deterioration after. Unadjusted performance rises from 7.7% to 8.9% in year -1. Industry
adjusted performance observes a similar improvement from year -2 to -1. Performance peaks

132
in year 0 (10.5% unadjusted and 2.9% industry adjusted), then begins to decline in year 1
before eventually reverting to pre-buyout levels in year 3. Performance improvements before
buyout are significant as shown by industry-adjusted change of 2.1%. The percentage of
firms with negative performance changes rises from 41% in year -1 to 58% in year 2. The
post-buyout changes are significant at conventional levels. It should be noted that despite
decreasing levels of net income, MBOs continue to outperform their industry peers in all
three post-buyout years examined. This performance pattern is consistent with Jensen’s
(1989) agency view and prior studies on buyout performance.
Analysis of PE-backed and non-PE backed samples reveals substantial differences in buyout
performance. PE-backed MBOs are more profitable throughout and at least two times more
profitable than non-backed MBOs in the post-buyout period. Unadjusted performance of PE-
backed sample peaks at year 1 while non-PE sample performance monotonically declines
following buyout. More importantly, industry-adjusted performance of PE-backed buyouts
shows improvements and significantly outperforms industry from year -1 to year 3 while
non-backed buyouts remain at the same industry levels. Mann-Whitney (MW) test statistics
show that performance differences between medians are significant. It appears that better-
than-industry post-buyout performance is driven solely by PE sponsored buyouts. The
reported performance changes in the bottom panel exhibit a similar pattern. Industry adjusted
performance increases in the earnings management year by 1.9% and 2.6% and declines
following buyout. The differences in performance changes between PE-backed and non-
backed samples are not significant at conventional levels. In sum, PE sponsorship is
associated with higher performance, however does not prevent deterioration of performance
in post-buyout period.
Prior studies (Rangan, 1998; Teoh et al., 1998b; Jo and Kim, 2007) show that incentives to
manage earnings may remain in place for a certain time after equity issues. This also appears

133
to be the case in MBOs. Although we cannot estimate discretionary accruals after buyout due
to data issues, Panel B of Table 4-16 shows significant performance improvements in year 0
relative to year -1. In general, the performance drops are observed only after the end of year
0. The buyout year, year 0 in our tables, is known to be a transition period where major
restructuring activities take place and it is often not seen as an unbiased indicator of buyout
performance. However it is useful to take note of the good performance observed in year 0.
[Table 4-17]
The performance of MBOs stratified by the direction and magnitude of earnings management
are reported in Table 4-17. Upwards-downwards earnings management categorisation is
based on discretionary total accruals.27
The levels of performance presented in Panel A
suggest that upwards earnings managers tend to be more profitable prior to buyout and less
profitable afterwards. The opposite pattern is true for the downwards earnings managers. The
downwards subsample registers significant performance improvements from pre- to post-
buyout period. While they underperform industry by a median of 2.8% two years before
buyout, by the end of year 3 they outperform industry by a median of 3%. Upwards
subsample performance, on the other hand, declines to industry levels in year 3. The results
presented in Panel B for aggressive and conservative earnings management quartiles are
consistent with prior evidence that aggressive earnings managers subsequently experience
performance deterioration (e.g., Teoh et al., 1998b). Unadjusted earnings for aggressive
quartile MBOs are around 10% of assets which is then reduced to just over 6% in the year 3.
In contrast conservative quartile MBOs register higher earnings in all post buyout years.
Moreover, aggressive earnings managers fail to perform better than industry after buyout
while conservative earnings managers outperform the industry in all post-buyout years. MW
27
Similar patterns are observed in unreported tests of performance based on working capital accruals and
performance adjusted accruals.

134
p-values show that the performance differences between aggressive and conservative
quartiles are significant in year 1 and year 2.
Overall, the univariate analysis offers support to the proposition that earnings management
prior to buyout influences performance after buyout. In the specific context of private-to-
private MBOs, accrual reversals following upwards earnings management gives result to
deterioration in performance and vice versa. The H4 is also supported. Upwards earnings
managers outperform industry only in two years while aggressive earnings managers do not
outperform the industry in any years. The results so far imply a negative relationship between
earnings management and performance. In the next section OLS regressions are conducted to
examine this relationship (H5).
4.5.3 Regression of Post-Buyout Performance and Discretionary Accruals
Spearman rank correlations between discretionary accruals and performance changes
(∆ROA) are reported in Table 4-18. In correlations and regressions, we present results with
both unadjusted and industry adjusted changes in net income for robustness purposes. Panel
A and Panel B display unadjusted and industry adjusted correlations respectively.
Correlations in both panels are consistent, discretionary accruals are negatively correlated
with performance changes in all years; however with varying degrees of significance. The
correlations with discretionary total accruals (DTA) are significant in all years, while
correlations with performance adjusted discretionary total accruals (PDA) are only significant
in year 1 and correlations with WCA are not significant. Therefore we conclude that only
discretionary total accruals predict the long term buyout performance.
[Table 4-18]
Prior literature provides evidence of the negative relation between earnings management and
performance in equity issues (Rangan, 1998; Teoh et al., 1998b; Jo et al., 2007). Consistent

135
with previous studies, our H5 posits that earnings management is negatively associated with
post-buyout performance changes. To examine this prediction we estimate cross-sectional
regressions in each of the three post-buyout years. We first run univariate regressions of
performance on discretionary accruals and then we control for other factors that are likely to
influence performance. Performance and discretionary accruals variables are winsorised at 1st
and 99th
percentiles to reduce the effect of outliers. The following regression is estimated.
∆ROAt= α+ b1DTA+Ɛit, (8)
Panel A of Table 4-19 reports univariate regressions. The dependent variables are unadjusted
and industry-adjusted changes in ROA relative to year -1. DTA is the common independent
variable in all regressions. The first and last three columns display results for unadjusted and
industry adjusted ROA changes respectively. Consistent with previous studies, the results
demonstrate that DTA is negatively associated with post-buyout performance changes. In
Panel B we control for several other variables following prior literature as follows:
∆ROA3= α+ b1DTA+ b2PE+ b3SGRO+ b4SIZE+ b5g1+ b6g2+ b7g3+ Ɛit, (9)
where ∆ROA3= raw and industry adjusted net income change in year 3. DTA= discretionary
total accruals in year -1; PE= dummy variable, equals 1 if MBO is PE-backed and 0
otherwise; SGRO= percentage growth in sales from year -2 to -1, included following Rangan
(1998); SIZE= inflation adjusted log of total sales in year -1; g1, g2 and g3 are industry
dummies for buyouts in high-tech industries defined as in Gompers et al. (2008), included
following Jelic and Wright (2011).28
The models R2 ranges from 7.68% to 16.7%. Our main
variable of interest DTA maintains a negative sign and remains statistically significant in all
regressions. Consistent with the findings in univariate performance analysis, PE is not
28 High-tech industry classification in Gompers et al. (2008) corresponds to Internet and Computers, Biotech
and Healthcare, Communications and Electronics industries respectively

136
significantly associated with performance changes. To assess economic significance of
results, we calculate the effect of one standard deviation change in DTA on dependent
variable by multiplying its coefficient with its sample standard deviation following Rangan
(1998) and Teoh et al. (1998b). The sample standard deviations and economic impact of DTA
are presented in Table 4-18. The results show a consistent trend of increasing negative impact
on earnings from year 1 through year 3. For example, accruals reversals are associated with a
2.66% negative impact on raw performance changes in the first year following buyout, which
rises to a cumulative 4.75% impact in the third year. For industry adjusted income,
discretionary accruals are associated with 2.29% decline in performance, rising to 4.35% in
the third year. The implied economic impact of discretionary accruals in univariate and
multivariate tests are consistent and quantitatively similar. These results are economically
important in the sense that earnings management explains more than 4% of the performance
changes in the three years following MBO, which is the approximate improvement or
deterioration in earnings reported by recent buyout studies (Chung, 2009; Boucly et al.,
2011). Prior literature also documents that most of the improvements in earnings are limited
to first two or three years subsequent to buyout (Kaplan, 1989a, Smith, 1990; Opler, 1992).
Therefore our findings provide useful insights into post-transaction performance of buyouts.
In unreported multivariate regressions with changes in ROA in year 0 as dependent variable,
DTA also carries a negative sign; however not significant at conventional levels. Hence the
coefficients in year 0 do not have economic importance. Contrary to evidence from equity
offerings as in Rangan (1998), Jo and Kim (2007), and Jo et al. (2007) that show a short-term
relationship between earnings management and performance, accrual reversals in buyouts
appear related to long term performance than as well as short term.
[Table 4-19]

137
In sum, our results show that upwards earnings management in the immediate year before
MBO coincides with increases in net income. Consistent with an accrual reversals
explanation, buyout transactions are followed by deterioration in performance in the three
subsequent years. Earnings management proxied by discretionary total accruals is a
significant determinant of post-buyout performance changes. Given the fact that prior studies
document performance improvements subsequent to public-to-private buyouts (e.g., Kaplan,
1989a; Boucly et al., 2011; Guo et al., 2011) and earnings understatement prior (Perry and
Williams, 1994), our findings retrospectively suggest that income decreasing earnings
management prior to buyout transaction may account for part of the post-buyout performance
improvements.
[Table 4-20]
4.6 Discussion of Results
We used Jones pooled time-series and several versions of cross-sectional Jones model to
examine accruals management in MBO transactions. The tests of earnings management
conclusively show upwards earnings management in the immediate year prior to MBO.
Important to explain this finding is complex and varying ownership structures of private
firms introducing different agency issues throughout sample firms. While prior research on
buyouts (e.g., Perry and Williams, 1994) finds downwards earnings management in PTP
buyouts, the interpretation of this result is straightforward. The wealth considerations of
public firm managers arising from separation of ownership and control in addition to their
acquisition of the company introduce a self-interested bias in the accounting practices, which
would result in them understating earnings to offer a lower bid for the acquisition. Private
company ownership structures, on the other hand, cannot be discounted to one formula since
they possess various types of owner and manager relationships. Although private firms
typically have concentrated ownership, the degree to which managers and owners influence

138
decisions varies from one firm to another. Many private firms have a familial ownership
structure in addition to some minority shareholders and many other private firms are held by
owner/managers. Consequently, each private firm has a different motivation for undertaking
an MBO, which would also affect the practices of earnings management. For example, if the
majority shareholder or owner/manager sells his shares in the MBO, he is highly likely to
have enough incentives and power to engage in upwards earnings management. In family
owned firms, on the other hand, earnings management is less likely due to the fact that MBO
is triggered by family succession issues (Howorth et al., 2004) and wealth considerations are
minimal or non-existent due to a pervasive family identity in the firm (Stockmans et al.,
2010). It is, therefore, necessary to examine them separately to infer conclusions.29
We also examine the link between accruals manipulation and subsequent performance, and
show that earnings management results in mean reversion in performance following buyout.
Aggressive earnings managers perform worse than conservative earnings managers;
moreover they do not outperform industry following buyout. Similar results are detected for
upwards and downwards earnings managers. While downwards earnings managers show an
increasing trend of profitability following buyout, upwards earnings managers’ profitability
decreases to industry level in the third year after buyout. The regression results also
consistently suggest statistically and economically significant impact for earnings
management. These results imply that PTP buyout performance, which is the main focus of
buyout literature, is often overstated due to omitted accruals reversal component of
profitability. Should PTP buyouts understate earnings prior to MBO as pointed by the
existing literature, then subsequent performance will be upward-biased. The opposite holds
for private-to-private buyouts which we show in this chapter. Overall, earnings management
29
We examine earnings management in private-to-private MBOs across different types of ownership in the next
chapter.

139
is an important determinant of post-buyout performance and discussion of accrual reversals is
necessary to have an unbiased debate about value creation in buyouts.
4.7 Conclusion and Further Research
Based on a unique sample of 291 UK MBOs, we test earnings management prior to private-
to-private buyouts and whether accrual reversals can explain subsequent buyout performance.
We hypothesise that the different agency problems faced by private firm managers and the
resulting distinct motives for undertaking buyout will affect the exercise of earnings
management practices relative to existing evidence from public-to-private MBOs. Supportive
of this hypothesis, we find significant income-increasing earnings management in the year
preceding buyout transaction. This year coincides with large increases in total accruals and
earnings. In separate tests for PE-backed and non-PE-backed subsamples we find evidence of
PE involvement inhibiting earnings management. Buyouts without PE sponsor, however,
exhibit significant upwards earnings management behaviour. These findings are robust across
several prediction models and to the choice of accruals. Overall our results highlight the
differences in agency problems between private and public companies while the results
related to PE backing are consistent with a venture capital certification explanation.
The performance analysis suggests that pre-buyout earnings management can explain post-
buyout performance. The results of univariate analysis show significant drops in performance
following buyout in aggressive earnings managers and upwards earnings managers.
Aggressive earnings managers fail to outperform industry peers while upwards earnings
managers cease to outperform industry after second post-buyout year. The results of
univariate and multivariate regressions suggest that performance drops can be explained by
upwards earnings management prior to buyout. Earnings management proxy discretionary
total accruals are statistically and economically significant in all regressions. Consistent with

140
the prior evidence from equity offerings, the results suggest that earnings management is a
significant determinant of buyout performance.
This research makes several important contributions for practitioners and regulators. It shows
that earnings management is not a generic phenomenon in MBOs and there is considerable
heterogeneity with respect to the existence as well as direction of earnings management. The
heterogeneity exists in the form of public and private companies, and between companies
with and without PE sponsors. The distinction between public and private companies is
manifested by their starkly contrasting earnings management practices. Private firm managers
overstate earnings whilst literature shows that managers of public firms understate earnings in
pursuit of personal wealth. The presence or absence of PE sponsor also leads to divergent
accounting practice by private firm managers. PE sponsors substantially constrain exercise of
managerial discretion and inhibit earnings management in both directions. The findings
related to performance analysis underline challenges in value creation and difficulties in
assessing it, as well as demonstrating that the classic agency view of Jensen does not fully
explain post-buyout performance in private-to-private buyouts. The results suggest that
earnings management accompanying buyouts is a significant explanatory element of buyout
performance, rather than the buyout transaction itself. It is highly likely that previous studies
lending support to Jensen’s buyout superiority view overstate performance due to downwards
earnings management preceding public-to-private MBOs and their negligence of earnings
management element in post-buyout performance. This study calls for more research on
value creation in buyouts, paying particular attention to accrual reversals and the role they
play in buyout performance.
This study does not attempt to explore earnings management practices in other types of
buyouts. Although the results suggest substantial heterogeneity, relevant inferences are made
based on prior evidence from public-to-private buyouts. Therefore a useful area for further

141
research would be to examine earnings management in all major types of buyouts,
distinguishing between public and private firm governance structures (e.g., family firms,
agent-led firms) and deal type (e.g., management buy-in, divestment, secondary buyout).
Further research can separately examine family and non-family MBOs, full MBOs and
divisional MBOs to fully analyse the implied heterogeneous behaviour and shed more light
on the motives of earnings management.

142
Table 4-1: Distribution of deals across years and value
This table presents the distribution of sample and population MBO deals across years. Population and sample
statistics exclude 57 and 20 financial firms respectively. 244 MBOs in the population and 104 MBOs in the final
sample disclosed deal values. ND indicates that sample MBOs in the related year did not disclose deal values.
Number of deals
Sample as %
of population
Transaction value
Sample as %
of population Year
Population
(N)
Sample
(n)
Population ($
mil)
Sample
($ mil)
2004 147 29 20 4521 3157 70
2005 150 54 36 2308 968 42
2006 154 64 42 2258 1126 50
2007 128 51 40 2606 2457 94
2008 101 34 34 769 486 63
2009 51 9 18 14 ND -
2010 52 19 37 177 89 50
2011 40 15 38 367 139 38
2012 37 16 43 460 258 57
Total 860 291 34 13480 8681 64

143
Table 4-2: Variable definitions This table presents definitions of all variables used in 4th and 5th chapters. Variables obtained from financial
statements are presented with their Fame item code (in parentheses).
Variable Source Definition
MBO TOB
A buyout acquisition led by members of incumbent management team as stated in
deal synopsis provided by Thomson One Banker.
Total Accruals FAME
Non-cash working capital minus depreciation: [∆Current Assets (F48) - ∆Cash
(F42)] - [∆Current Liabilities (F66) - ∆Short term debt (F52)] - Depreciation (F21).
Working Capital
Accruals FAME
Non-cash working capital: [∆Current Assets (F48) - ∆Cash (F42)] - [∆Current
Liabilities (F66) - ∆Short term debt (F52)].
∆REV FAME Difference between sales in the year of earnings management and prior year. (F1)
PPE FAME Tangible assets in the year of earnings management. (F31)
ROA FAME
Net income in the year of earnings management divided by lagged total assets.
(F18/F70)
∆ROA FAME
Difference in raw ROA between relevant post-buyout year and the year prior to
buyout for three years following buyout.
∆IROA FAME
Difference in industry adjusted ROA between relevant post-buyout year and the
year prior to buyout for three years following buyout.
DTA Estimated Discretionary total accruals obtained from cross-sectional regressions (eq. 2).
PE TOB A dummy variable that equals 1 if the transaction is PE-backed and 0 otherwise.
SGRO FAME
Difference between sales in the year of earnings management and prior year,
divided by prior year sales.
SIZE FAME Natural logarithm of inflation adjusted total sales prior to buyout.
g1 TOB
A dummy variable that equals 1 if the MBO is in Internet and Computers industry,
0 otherwise. Based on Gompers et al. (2008).
g2 TOB
A dummy variable that equals 1 if the MBO is in Biotech and Healthcare industry,
0 otherwise. Based on Gompers et al. (2008).
g3 TOB
A dummy variable that equals 1 if the MBO is in Communications and Electronics
industry, 0 otherwise. Based on Gompers et al. (2008).

144
Table 4-3: Descriptive statistics for changes in Total Accruals, Sales and Earnings This table presents changes in total accruals, sales and earnings in the 4 years preceding MBO. Year 0 is
MBO year. Total accruals are defined as: [(∆Current Assets - ∆Cash) - (∆Current Liabilities - ∆Short term
debt) - Depreciation]. Earnings are net income. The variables are obtained as first differences scaled by lagged
assets. P-values are obtained from 2-tailed t test and Wilcoxon test under the null that mean and median
change = 0.
Year -1 Year -2 Year -3 Year -4
n = 101 n = 101 n = 101 n = 101
Changes in Total Accruals
Mean 0.050 -0.022 0.006 0.022
Median 0.042 -0.040 0.020 -0.008
Percent negative 42 60 42 55
T test p-value 0.082 0.441 0.722 0.322
Wilcoxon p-value 0.070 0.081 0.338 0.890
Changes in Sales
Mean 0.168 0.210 0.280 0.223
Median 0.102 0.095 0.160 0.159
Percent negative 39% 36% 29% 33%
T test p-value 0.003 0.000 0.000 0.000
Wilcoxon p-value 0.001 0.000 0.000 0.000
Changes in Earnings
Mean 0.035 0.008 0.016 0.018
Median 0.026 0.009 0.008 0.010
Percent negative 34% 45% 44% 43%
T test p-value 0.003 0.450 0.109 0.113
Wilcoxon p-value 0.000 0.195 0.334 0.198

145
Table 4-4: Two-digit industry/year portfolios and number of matched MBOs
Target
SIC Code
Matched
Year
No. of
firms in
portfolio
No. of
matched
MBOs Target
SIC Code
Matched
Year
No. of
firms in
portfolio
No. of
matched
MBOs
07 2007 298 1
32 2007 188 1
08 2004 35 1
33 2005 202 1
13 2006 186 1
34 2005 1154 2
13 2009 247 1
34 2006 1148 3
15 2004 3096 3
34 2007 1091 1
15 2005 3049 2
35 2004 891 1
15 2006 2835 4
35 2005 571 1
15 2007 2699 2
35 2006 811 2
16 2007 417 1
35 2007 781 2
16 2010 467 1
35 2008 749 1
17 2004 3120 2
35 2010 849 1
17 2007 2934 4
36 2004 682 2
17 2008 2702 3
36 2006 614 3
20 2004 757 3
36 2007 595 1
20 2005 730 3
37 2004 352 2
20 2006 665 3
37 2006 274 1
20 2007 742 1
37 2009 292 1
20 2010 819 1
37 2011 286 1
22 2005 157 1
38 2005 315 1
22 2006 152 1
38 2007 282 3
23 2006 139 1
38 2008 292 1
23 2009 119 1
38 2010 313 2
24 2004 275 1
39 2004 1051 2
25 2006 196 3
39 2005 1018 1
25 2007 205 1
39 2006 959 2
26 2005 274 1
39 2007 950 1
26 2006 275 2
42 2004 978 1
26 2010 310 1
42 2006 937 1
27 2004 1421 6
42 2007 905 2
27 2005 1339 1
42 2010 893 1
27 2006 1198 3
45 2005 184 1
27 2008 986 1
45 2006 181 1
27 2010 876 3
47 2004 610 1
27 2011 716 1
47 2006 579 1
28 2006 544 2
47 2010 561 1
28 2010 609 1
47 2011 482 1
30 2007 377 1
48 2004 477 1
30 2008 361 2
48 2005 491 2
30 2009 365 1
48 2006 471 1
30 2011 372 1
48 2011 349 1
31 2010 14 1
49 2005 467 2

146
32
49
2004
2009
226
539
1
2
49
65
2006
2005
467
3390
1
1
50 2004 3655 5
67 2004 2133 1
50 2005 3456 5
70 2007 802 1
50 2006 3236 5
70 2011 727 1
50 2007 3109 5
72 2011 558 1
50 2010 3452 1
73 2004 9268 8
50 2011 3062 2
73 2005 9140 7
51 2004 1762 4
73 2006 8879 9
51 2005 1579 1
73 2007 8394 10
51 2006 1588 1
73 2008 7852 1
51 2007 1522 1
73 2009 7223 3
51 2008 1425 1
73 2010 7209 1
51 2009 1501 1
73 2011 7152 4
51 2011 1422 1
75 2005 830 1
54 2004 404 1
76 2006 427 1
54 2006 430 1
78 2006 350 1
55 2004 84 1
78 2011 232 1
55 2005 112 1
79 2005 1174 1
55 2007 101 1
80 2006 835 1
55 2011 87 1
80 2007 805 1
56 2004 442 2
80 2011 719 1
56 2005 433 2
82 2007 449 1
56 2006 350 1
82 2009 395 1
56 2008 337 1
82 2011 435 2
56 2010 346 1
83 2004 269 1
57 2004 379 2
83 2005 334 1
57 2005 370 1
83 2006 275 1
57 2006 340 1
83 2007 346 1
58 2004 765 1
87 2004 3748 8
58 2005 1533 1
87 2005 2878 5
58 2007 1304 1
87 2006 2681 3
58 2011 793 1
87 2007 2577 5
59 2004 1528 2
87 2008 2454 1
59 2006 1382 1
87 2009 2227 4
59 2007 1507 2
87 2010 2070 1
59 2010 1082 2
87 2011 1643 2

147
Table 4-5: Descriptive statistics for MBOs and matched portfolios
Statistics are derived from 291 MBOs and median values of each of 225 unique estimation portfolios matched
on 2-digit SIC code and year. Portfolio statistics are mean and medians of median values of related portfolios.
Paired differences are computed as MBO value minus median value of the matching portfolio. The mean and
median portfolio size is 3672 and 1730 respectively. Firms with extreme positive earnings are dropped from
portfolios. P-values are for two-tailed tests.
Year -1
Year -2
MBO
firms
Portfolio
firms
Paired
differences MBO
firms
Portfolio
firms
Paired
differences Total assets (£ mil)
Mean 23.78 2.84 20.94
17.44 2.62 14.81
Median 9.19 1.59 6.66
8.35 1.32 5.68
Significance level
T test p-value
0.000
0.000
Wilcoxon p-value 0.000 0.000
Sales (£mil)
Mean 43.32 4.10 39.21
34.29 3.77 30.52
Median 17.39 2.55 13.62
17.31 2.42 12.93
Significance level
T test p-value
0.000
0.000
Wilcoxon p-value 0.000 0.000
Earnings (ROA)
Mean 0.073 0.079 -0.005
0.066 0.078 -0.012
Median 0.075 0.065 -0.003
0.061 0.063 -0.009
Percent negative 16% 0% 52%
15% 0% 54%
Significance level
T test p-value
0.579
0.167
Wilcoxon p-value 0.950 0.295

148
This table presents the results of cross-sectional parameter estimates for the year prior to MBO. The expected
accruals model for parameter estimates is TAijt /Assetsijt-1 = β1jt (1/Assetsijt-1) + β2jt (∆REVijt /Assetsijt-1) + β3jt (PPEijt
/Assetsijt-1) + εijt, where TAijt = total accruals for estimation portfolio firm i matched with MBO firm j on industry
in year t, ∆REVijt = changes in turnover for estimation portfolio firm i matched with MBO firm j on industry in year
t, PPEijt = Tangible assets for estimation portfolio firm i matched with MBO firm j in year t, Assetsijt-1 = Total
assets one year before manipulation year. Presented statistics are obtained from 160 cross-sectional regressions for
unique industry-year portfolios in year -1. N displays statistics for the number of observations in estimation
portfolios. Statistics for p values (p1, p2, p3) correspond to t values for coefficients (β1, β2, β3) respectively.
Adj. R2 β1 β2 β3 p1 p2 p3 N
Mean 0.577 72.886 0.178 -2.869 0.290 0.099 0.105 1287.96
1st Quartile 0.111 -2.106 -0.036 -0.276 0.000 0.000 0.000 346
Median 0.770 -0.000 0.024 -0.098 0.011 0.000 0.000 665
3rd Quartile 0.999 1.876 0.112 -0.013 0.619 0.021 0.080 1425
Min -0.041 -79.028 -4.046 -318.745 0.000 0.000 0.000 14
Max 1 10976 20.861 44.711 1 0.998 0.991 9268
Stdev 0.421 846.44 1.702 26.078 0.386 0.248 0.221 1781.89
Table 4-6: Parameters of cross-sectional estimation

149
Table 4-7: Prediction errors from cross-sectional estimation in year -1 and -2 This table presents prediction errors for two years prior to MBO announcement. Prediction errors are computed
using cross-sectional parameter estimates from following model: TAijt /Assetsijt-1 = β1jt (1/Assetsijt-1) + β2jt
(∆REVijt /Assetsijt-1) + β3jt (PPEijt /Assetsijt-1) + εijt, where TAijt = total accruals for estimation portfolio firm i
matched with MBO firm j on industry in year t, ∆REVijt = changes in turnover for estimation portfolio firm i
matched with MBO firm j on industry in year t, PPEijt = Tangible assets for estimation portfolio firm i matched
with MBO firm j in year t, Assetsijt-1 = Total assets one year before manipulation year. Presented statistics are
obtained from 311 MBOs in year -1 and 223 MBOs in year -2. Non-standardised prediction errors are the
difference between reported and predicted accruals. Standardised prediction errors are calculated by dividing
each prediction error by its standard deviation estimated from the related cross-sectional regression. Standard
deviation of errors are computed for each industry/year estimation portfolio as √(RSS/(T-k)); where RSS =
residual sum of squares, T = the number of observations in related portfolio, k = number of parameters in the
regression. Parametric p-values for non-standardised prediction errors are from t tests; non-parametric p-values
are obtained from Wilcoxon sign rank test. Parametric p-values for standardised prediction errors are obtained
from Patell's (1976) Zv statistic computed as: ∑Vij/√[∑(Tij-k)/(Tij-(k+2))]; where Vij is standardised prediction
error for estimation portfolio i matched with MBO firm j, Tij is the number of observations in the estimation
portfolio i for MBO firm j and k is the number of parameters in the cross-sectional model. All p-values are 2-
tailed). N (#:#) is the number of total (positive: negative) prediction errors in the dataset.
Year -1
Year -2
Non-standardised Standardised
Non-standardised Standardised
Mean 0.538 0.035
0.622 -0.004
Median 0.037 0.001
-0.032 -0.001
Standard deviation 2.164 0.515
3.582 0.472
Minimum -3.739 -2.376
-4.488 -2.376
Maximum 13.051 2.449
24.485 2.485
Parametric p-value 0.000 0.542
0.013 0.948
Nonparametric p-value 0.000 0.002
0.252 0.313
N (Positive:Negative) 291 (176:115) 291 (176:115)
207 (91:116) 207 (91:116)

150
Table 4-8: Prediction errors from performance adjusted estimation in year -1 and -2 This table presents performance augmented prediction errors for two years prior to MBO announcement.
Prediction errors are computed using cross-sectional parameter estimates from following model: TAijt /Assetsijt-1
= β1jt (1/Assetsijt-1) + β2jt (∆REVijt /Assetsijt-1) + β3jt (PPEijt /Assetsijt-1) + β4jt (ROAijt /Assetsijt) + εijt, where TAijt =
total accruals for estimation portfolio firm i matched with MBO firm j on industry in year t, ∆REVijt = changes in
turnover for estimation portfolio firm i matched with MBO firm j on industry in year t, PPEijt = Tangible assets
for estimation portfolio firm i matched with MBO firm j in year t, ROAijt = Net income divided by assets for
estimation portfolio firm i matched with MBO firm j on industry in year t, Assetsijt-1 = Total assets one year
before manipulation year . Presented statistics are obtained from 291 MBOs in year -1 and 206 MBOs in year -2.
Non-standardised prediction errors are the difference between reported and predicted accruals. Standardised
prediction errors are calculated by dividing each prediction error by its standard deviation estimated from the
related cross-sectional regression. Standard deviation of errors are computed for each industry/year estimation
portfolio as √(RSS/(T-k)); where RSS = residual sum of squares, T = the number of observations in related
portfolio, k = number of parameters in the regression. Parametric p-values for non-standardised prediction errors
are from t tests; non-parametric p-values are obtained from Wilcoxon sign rank test. Parametric p-values for
standardised prediction errors are obtained from Patell's (1976) Zv statistic computed as: ∑Vij/√[∑(Tij-k)/(Tij-
(k+2))]; where Vij is standardised prediction error for estimation portfolio i matched with MBO firm j, T ij is the
number of observations in the estimation portfolio i for MBO firm j and k is the number of parameters in the
cross-sectional model. All p-values are 2-tailed). N (#:#) is the number of total (positive: negative) prediction
errors in the dataset.
Year -1
Year -2
Non-standardised Standardised
Non-standardised Standardised
Mean 0.024 0.072
-0.008 -0.035
Median 0.012 0.035
-0.016 -0.045
Standard deviation 0.193 0.667
0.223 0.638
Minimum -0.937 -2.715
-1.031 -2.916
Maximum 0.956 2.398
1.717 3.472
Parametric p-value 0.035 0.218
0.593 0.616
Nonparametric p-value 0.023 0.021
0.127 0.127
N (Positive:Negative) 291 (162:129) 291 (162:129)
206 (96:110) 206 (96:110)

151
Table 4-9: Prediction errors from cross-sectional WCA estimation This table presents prediction errors for working capital accruals 2 years prior to MBO announcement. The
expected accruals model for parameter estimates is WCAjt /Assetsjt-1 = β1jt (1/Assetsjt-1) + β2jt (∆REVjt
/Assetsjt-1) + εjt, where WCAjt = working capital accruals for MBO firm j in estimation period year t, ∆REVjt =
changes in turnover for MBO firm j in estimation period year t, Assetsjt-1 = Lagged total assets for MBO firm j
in estimation period year t. Non-standardised prediction errors are computed as the difference between
reported and predicted accruals. Standardised prediction errors are calculated by dividing each prediction error
by its standard deviation estimated from the related regression. Standard deviation of errors are computed for
each MBO firm as √ (RSS/T-k); where RSS = residual sum of squares, T = the number of observations in
estimation portfolio, k = number of parameters in the regression. T ranges from 15 to 9163 firms. Parametric
p-values for non-standardised prediction errors are from t tests; non-parametric p-values are obtained from
Wilcoxon sign rank test. Parametric p-values for standardised prediction errors are obtained from Patell's
(1976) Zv statistic computed as: ∑Vj/√[∑(Tj-k) /(Tj-(k+2))]; where Vj is standardised prediction error for
MBO firm j, Tj is the number of observations in the estimation portfolio and k is the number of parameters in
the model. p values are for 2-tailed tests.
Year -1
Year -2
Non-standardised Standardised
Non-standardised Standardised
Mean 0.032 0.079
-0.121 0.041
Median 0.022 0.001
-0.001 -0.001
Standard deviation 0.296 0.526
1.024 0.476
Minimum -0.944 -2.137
-5.098 -1.847
Maximum 2.886 4.481
6.329 3.345
Parametric p-value 0.031 0.178
0.088 0.559
Non-parametric p-value 0.007 0.004
0.325 0.721
N (Positive:Negative) 291 (169:122) 291 (169:122)
207 (103:104) 207 (103:104)

152
Table 4-10: Prediction errors from time-series estimation This table presents prediction errors for 2 years prior to MBO. The expected accruals model for parameter
estimates is: TAjt /Assetsjt-1 = β1jt (1/Assetsjt-1) + β2jt (∆REVjt /Assetsjt-1) + β3jt (PPEjt /Assetsjt-1) + εjt,
where TAjt = total accruals for MBO firm j in estimation period year t, ∆REVjt = changes in turnover for
MBO firm j in estimation period year t, PPEjt = Tangible assets for MBO firm j in estimation period year
t, Assetsjt-1 = Lagged total assets for MBO firm j in estimation period year t. Unstandardised prediction
errors are computed as the difference between reported and predicted accruals. Standardised prediction
errors are calculated by dividing each prediction error by its standard deviation estimated from the related
pooled time-series regression. Standard deviation of errors are computed for each MBO firm as √ (RSS/T-
k); where RSS = residual sum of squares, T = the number of observations in estimation period, k =
number of parameters in the regression. T ranges from 4 to 8 years. Parametric p-values for non-
standardised prediction errors are from t tests; non-parametric p-values are obtained from Wilcoxon sign
rank test. Parametric p-values for standardised prediction errors are obtained from Patell's (1976) Zv
statistic computed as: ∑Vj/√[∑(Tj-k)/(Tj-(k+2))]; where Vj is standardised prediction error for MBO firm
j, Tj is the number of observations in the estimation period MBO firm j and k is the number of parameters
in the model. p values are for 2-tailed tests.
Year -1
Year -2
Non-standardised Standardised
Non-standardised Standardised
Mean 0.059 -0.021
-0.002 -0.041
Median 0.034 -0.004
-0.024 -0.038
Standard deviation 0.311 0.034
0.339 0.237
Minimum -0.679 -1.463
-1.041 -0.615
Maximum 1.091 0.788
1.428 0.515
Parametric p-value 0.054 0.392
0.965 0.291
Nonparametric p-value 0.114 0.174
0.646 0.646
N (Positive:Negative) 101 (56:45) 40(20:20) 63 (30:33) 26 (11:14)

153
Table 4-11: Changes in Accruals, Sales and Earnings in PE-backed MBOs This table presents changes in total accruals, sales and earnings of PE-backed MBOs in four years preceding
MBO announcement. Year 0 is MBO year. Total Accruals are defined as: [(∆Current Assets - ∆Cash) -
(∆Current Liabilities - ∆Short term debt) - Depreciation]. Earnings are net profit. All three variables are
obtained as first differences scaled by lagged total assets. Parametric p-values are from 2-tailed t test under the
null that mean change=0. Wilcoxon p-values are from 2-tailed Wilcoxon sign rank test under the null that
median change=0. Mann-Whitney test is for the equality of changes in total accruals, sales and earnings in PE-
backed and non-PE backed MBOs.
Year -1 Year -2 Year -3 Year -4
n = 52 n = 52 n = 52 n = 52
Changes in Total Accruals
Mean 0.031 -0.051 0.029 0.028
Median 0.019 -0.042 0.036 -0.011
Percent negative 44% 62% 35% 62%
Parametric p-value 0.338 0.101 0.188 0.35
Wilcoxon p-value 0.291 0.085 0.122 0.649
Mann-Whitney p-value 0.822 0.241 0.188 0.995
Changes in Sales
Mean 0.229 0.199 0.285 0.182
Median 0.134 0.107 0.189 0.175
Percent negative 27% 31% 17% 23%
Parametric p-value 0.003 0.000 0.000 0.008
Wilcoxon p-value 0.000 0.000 0.000 0.000
Mann-Whitney p-value 0.067 0.658 0.289 0.458
Changes in Earnings
Mean 0.033 0.006 0.031 0.021
Median 0.032 0.011 0.013 0.011
Percent negative 31% 40% 38% 42%
Parametric p-value 0.033 0.641 0.042 0.221
Wilcoxon p-value 0.000 0.282 0.109 0.251
Mann-Whitney p-value 0.497 0.645 0.454 0.708

154
Table 4-12: Tests of prediction errors by private equity status This table presents non-standardised prediction errors by private equity status. See previous tables for the details of accruals
models tested. Significance of mean and medians is tested by parametric t-test and non-parametric Wilcoxon sign rank test.
*, ** and *** represent significance at 10%, 5% and 1% level. N (#; #) is the number of MBOs in year -1 and -2 in relevant
samples.
Total accruals Performance adjusted Working capital accruals
Year -1 Year -2
Year -1 Year -2
Year -1 Year -2
All MBOs
Mean 0.538*** 0.622**
0.024** -0.008
0.032** -0.121*
Median 0.037*** -0.032
0.012** -0.016
0.022*** -0.001
N (positive:negative) 291(176:115) 207(91:116)
291(162:129) 206(96:110)
291(169:122) 207(103:104)
PE-backed
Mean 0.305* 0.328
0.031 -0.007
0.046 -0.267**
Median 0.016 -0.034
0.010 -0.032
0.021* -0.002
N (positive:negative) 140 (79:61) 106 (45:61)
140 (72:68) 106 (46:60)
106 (78:62) 106 (51:55)
Non-PE
Mean 0.753*** 0.931**
0.017** -0.009
0.018 0.031
Median 0.072*** -0.031
0.013** 0.001
0.025* 0.003
N (positive:negative) 151 (97:54) 101 (46:55) 151 (90:61) 100 (50:50) 151 (91:60) 101 (52:49)

155
Table 4-13: Additional accruals tests
This table presents statistics from additional discretionary accruals tests for non-standardised accruals in year
-1. Panel A displays statistics excluding MBOs that are exempt from reporting audited accounts. Panel B
shows discretionary accruals for MBOs that reported full accounts in the last available accounting year. Panel
C excludes portfolio deciles with the highest and lowest number of observations. Panel D shows statistics
excluding matched portfolios having fewer than 50 observations.
Total accruals
Perf. adjusted
Working capital
Panel A: Excluding MBOs with audit exemption
Mean 0.542
0.025
0.032
Median 0.038
0.012
0.022
T test p value 0.000
0.016
0.062
Wilcoxon p value 0.000
0.015
0.006
N (positive:negative) 289 (176:113)
289 (162:127)
289 (168:121)
Panel B: MBOs registered as full accounts disclosure
Mean 0.675
0.029
0.032
Median 0.045
0.012
0.028
T test p value 0.000
0.035
0.054
Wilcoxon p value 0.000
0.022
0.002
N (positive:negative) 226 (140:86)
226 (127:99)
226 (136:90)
Panel C: Excluding portfolios with fewer than 50 observations
Mean 0.540
0.023
0.031
Median 0.037
0.012
0.022
T test p value 0.000
0.044
0.075
Wilcoxon p value 0.000
0.025
0.008
N (positive:negative) 289 (175:114)
289 (161:128)
289 (168:121)
Panel D: Excluding bottom and top portfolio observation deciles
Mean 0.636
0.032
0.046
Median 0.047
0.021
0.026
T test p value 0.000
0.016
0.025
Wilcoxon p value 0.000
0.007
0.001
N (positive:pegative) 231 (148:83) 231 (133:98) 231 (141:90)

156
Table 4-14: Propensity Score Matched Discretionary Accruals This table presents discretionary total accruals for sample MBOs matched on non-buyout firms by propensity
scores (PSM). Each MBO is matched on a non-buyout firm with the nearest propensity score. Discretionary
total accruals are obtained by industry-year matched cross-sectional Jones regressions. PSM matched
discretionary accruals are calculated as discretionary accruals of MBO firm minus discretionary accruals of
PSM-matched non-buyout firm. Results are based on accruals winsorised at 1% level. ***, ** and *
represent significance at 1%, 5% and 10% levels.
Full Sample
PE-backed
Non-PE
Mean 0.318***
0.237*
0.393**
Median 0.048**
0.051
0.043
T-test p-value 0.0018
0.0715
0.011
Wilcoxon p-value 0.0421
0.1375
0.1705
N (Positive:Negative) 290 (156:134) 140 (76:64) 150 (80:70)

157
Table 4-15: Industry distribution of management buyouts- Performance sample
Industry 2-digit SIC Codes Frequency %
Oil and gas 13 3 1.18
Food products 20 13 5.12
Paper and paper products 25, 26, 27 16 6.30
Chemical products 28 3 1.18
Manufacturing 30, 31, 32, 33, 34 14 5.51
Computer equipment and services 35, 73 46 18.11
Electronic equipment 36 6 2.36
Transportation 37, 39, 42, 45 15 5.91
Scientific instruments 38 7 2.76
Communications 48 4 1.57
Electric, gas and sanitary services 49 5 1.97
Durable goods 50 18 7.09
Non-durable goods 51 7 2.76
Retail
53, 54, 56, 57, 59 18 7.09
Eating and drinking establishments 58 3 1.18
Entertainment services 70, 78, 79 5 1.97
Health
80 2 0.78
All others
7, 8, 15, 16, 17, 22, 23, 47,
55, 65, 67, 75, 76, 82, 83,
87
69 27.16
Total 254 100
Table 4-15 Panel B: Industry distribution by Gompers et al. (2008) classification
Industry 2-digit SIC Codes Frequency %
Internet and Computers 50, 73 11 4.33
Biotech and Healthcare 28, 38, 80, 83
11 4.33
Communications and
Electronics 27, 36, 38, 48, 50, 73, 78, 87 30 11.82
Consumer 8, 20, 22, 23, 25, 27, 31, 32, 34, 39, 50,
51, 54-59, 73, 76
58 22.83
Business and Industrial 7, 15-17, 26, 28, 30, 32-35, 37-39, 42,
45, 50, 51, 79, 87
78 30.71
Energy 13, 36, 49 11 4.33
Business Services 45, 67, 73, 75, 82, 83, 87 49 19.29
Others 47, 65, 70, 73
6 2.36
Total 254 100

158
Table 4-16: Operating performance around management buyouts This table presents median net income performance of management buyouts from year -2 to year +3 relative to
buyout transaction year (year 0 is the year buyout is completed).
The unadjusted performance is measured as net income divided by beginning assets. Industry adjusted performance
is measured as net income divided by beginning assets minus industry median. Performance changes are computed
as year-to-year changes in unadjusted and industry-adjusted net income divided by beginning assets. Computation of
discretionary accruals is explained in Table 4-2. Significance of medians is tested by 2-tailed Wilcoxon sign rank
test. Mann-Whitney (M-W) p value is for the significance of performance differences between relevant PE-backed
and non-PE-backed subsamples. *, ** and *** represent significance at 10, 5, and 1 % level.
Year -2 -1 0 1 2 3
Panel A: Performance of MBOs
Unadjusted 0.077*** 0.089*** 0.105*** 0.072*** 0.079*** 0.067***
Industry adjusted -0.009 0.011** 0.029*** 0.011*** 0.009*** 0.012***
N (raw:adjusted) 238:180 253:253 237:237 214:212 186:185 161:158
Panel B: Performance changes in MBOs
Unadjusted - 0.009 0.011* -0.012** -0.014*** -0.016***
% negative - 47 46 57 61 59
Industry adjusted - 0.021*** 0.010** -0.005 -0.007** -0.005
% negative - 41 45 54 58 53
Panel C: Performance by PE backing
Unadjusted earnings
PE-backed 0.107*** 0.108*** 0.130*** 0.142*** 0.122*** 0.092***
Non-PE backed 0.058*** 0.078*** 0.075*** 0.058*** 0.052*** 0.044***
M-W p value 0.022 0.010 0.025 0.001 0.018 0.004
N (PE:non-PE) 115:123 121:132 113:124 99:115 85:101 77:84
Industry adjusted earnings
PE-backed 0.005 0.020*** 0.059*** 0.078*** 0.060*** 0.050***
Non-PE backed -0.015 0.002 0.012 -0.001 -0.002 0.000
M-W p value 0.179 0.031 0.023 0.002 0.036 0.005
N (PE:non-PE) 91:89 121:132 113:124 98:114 85:100 76:82
Panel D: Performance changes by PE backing
Unadjusted earnings changes
PE-backed - 0.011 0.027 -0.012 -0.032*** -0.013
Non-PE backed - 0.006 0.007 -0.014** -0.003 -0.017***
M-W p value - 0.751 0.555 0.528 0.054 0.569
Industry adjusted earnings changes
PE-backed - 0.019** 0.021** -0.004 -0.028** -0.012
Non-PE backed - 0.026** 0.004 -0.006 -0.002 -0.002
M-W p value - 0.595 0.546 0.556 0.081 0.686

159
Table 4-17: Performance by direction and magnitude of earnings management This table presents median net income performance of downwards and upwards earnings managers as well as
conservative and aggressive earnings managers from year -2 to year +3 relative to buyout transaction year (year 0
is the year buyout is completed).
MBOs with negative discretionary total accruals are classified as downwards and MBOs with positive
discretionary total accruals are classified as upwards earnings managers. Conservative and aggressive quartiles
contain MBOs with the smallest and largest absolute discretionary total accruals in year -1 respectively. The
unadjusted performance is measured as net income divided by beginning assets. Industry adjusted performance is
measured as net income divided by beginning assets minus industry median. Significance of medians is tested by
2-tailed Wilcoxon sign rank test. Mann-Whitney (M-W) p value is for the significance of performance differences
between downwards and upwards, conservative and aggressive earnings management subsamples. *, ** and ***
represent significance at 10, 5, and 1 % level.
Year -2 -1 0 1 2 3
Panel A: Performance around management buyout
Unadjusted earnings
Downward 0.047*** 0.071*** 0.107*** 0.068*** 0.099*** 0.073***
Upward 0.103*** 0.101*** 0.092*** 0.077*** 0.065*** 0.061***
M-W p value 0.002 0.056 0.917 0.962 0.204 0.392
Industry adjusted earnings
Downward -0.028* 0.001 0.042*** 0.012** 0.039*** 0.030***
Upward 0.014* 0.028*** 0.025*** 0.010*** 0.004** 0.004
M-W p value 0.016 0.031 0.938 0.925 0.329 0.298
Panel B: Performance of aggressive and conservative quartiles
Unadjusted earnings
Conservative 0.069*** 0.067*** 0.083*** 0.077*** 0.102*** 0.081***
Aggressive 0.101*** 0.101*** 0.142*** 0.061*** 0.076*** 0.062***
M-W p value 0.453 0.424 0.161 0.081 0.263 0.422
Industry adjusted earnings
Conservative 0.003 0.012 0.027** 0.023*** 0.051** 0.028***
Aggressive 0.001 -0.002 0.032*** -0.007 0.001 0.006
M-W p value 0.745 0.277 0.943 0.021 0.012 0.123

160
Table 4-18: Spearman rank order correlations of discretionary accruals
This table presents Spearman rank order correlations between discretionary accruals in year -1 and changes in net
income. Panel A lists correlations with the changes in unadjusted net income and Panel B lists correlations with
changes in industry adjusted net income. DTA, WCA and PDA represent discretionary total accruals,
discretionary working capital accruals and performance adjusted discretionary total accruals respectively.
∆ROA0 ∆ROA1 ∆ROA2 ∆ROA3
Panel A: Correlations with unadjusted net income
DTA-1 -0.0538 -0.1388** -0.1322* -0.1304***
WCA-1 -0.1263 -0.0946 -0.0477 -0.0444
PDA-1 -0.2640*** -0.0874* -0.0560 -0.0924
Panel B: Correlations with industry adjusted net income
DTA-1 -0.0384 -0.0962** -0.0678** -0.0561***
WCA-1 -0.1126 -0.1049 -0.0737 -0.0433
PDA-1 -0.1989*** -0.2367** -0.0038 -0.1105

161
Table 4-19: Regression of post-buyout performance on discretionary accruals This table reports regressions of post-buyout performance changes on earnings management and control variables.
The dependent variables in regressions are changes in raw income (∆ROA) and changes in industry-adjusted income
(∆IROA). Changes in net income are computed as change relative to year -1 for a given post-buyout year. Panel A
reports univariate regressions of performance changes on earnings management. The following multivariate model is
estimated in Panel B:
∆ROA= α+ b1DTA+ b2PE+ b3SGRO+ b4SIZE+ b5g1+ b6g2+ b7g3,
where ∆ROA= raw and industry adjusted net income change in year 1, 2, 3. DTA= discretionary total accruals in year
-1; PE= dummy variable, equals 1 if MBO is private equity sponsored and 0 otherwise; SGRO= percentage growth in
sales from year -2 to -1; SIZE= log of total sales in year -1; g1, g2 and g3 are dummies for buyouts in high-tech
industries defined as in Gompers et al. (2008) industry classification. Variables are winsorised at 1% and 99%
percentiles. All models are estimated via OLS regressions with robust standard errors and omitted collinear covariates. Second row displays t values in parentheses. *, ** and *** represent significance at 10, 5, and 1% levels.
Variable ∆ROA1 ∆ROA2 ∆ROA3
∆IROA1 ∆IROA2 ∆IROA3
Panel A: Univariate regressions
DTA -0.014*** -0.015*** -0.022**
-0.012*** -0.012*** -0.20**
(t) (-3.32) (-3.75) (-2.26)
(-2.98) (-3.32) (-2.09)
R2 2.59% 1.78% 8%
1.89% 1.27% 6.51%
F ratio for regression 11.05*** 14.03*** 5.09**
8.09*** 11*** 4.38**
N 214 186 161 212 185 158
Panel B: Multivariate regressions
Dependent variable: ∆ROA
Dependent variable: ∆IROA
∆ROA1 ∆ROA2 ∆ROA3
∆IROA1 ∆IROA2 ∆IROA3
DTA -0.011*** -0.014*** -0.022**
-0.010** -0.013*** -0.021**
(-2.83) (-3.32) (-2.45)
(-2.47) (-2.98) (-2.33)
PE 0.041* -0.001 -0.003
0.041* 0.003 0.002
(1.71) (-0.01) (-0.12)
(1.69) (0.10) (0.06)
SGRO 0.000 -0.022 -0.015
0.000 -0.020 -0.007
(0.00) (-1.02) (-0.32)
(0.06) (-0.92) (-0.14)
SIZE -0.016 -0.034 -0.023
-0.018 -0.038 -0.029
(-0.85) (-0.98) (-0.88)
(-0.91) (-1.12) (-1.08)
g1 0.116 0.111 0.103
0.111 0.104 0.107
(1.24) (1.55) (1.60)
(1.18) (1.50) (1.48)
g2 -0.081 0.141 -0.099
-0.089 0.119 -0.126*
(-1.48) (0.58) (-1.54)
(-1.59) (0.49) (-1.75)
g3 -0.058** -0.055 -0.098**
-0.056* -0.051 -0.091**
(-2.01) (-1.46) (-2.57)
(-1.93) (-1.36) (-2.32)
Year dummies Yes Yes Yes
Yes Yes Yes
R2 11.65% 8.44% 16.7%
9.86% 7.68% 15.22%
N 210 182 157 208 181 154

162
Table 4-20: Economic impact of discretionary accruals This table reports the economic impact of discretionary accruals. St. deviation is the sample standard deviation
of discretionary total accruals (DTA). Coefficients are estimated by univariate OLS and multivariate ∆ROA= α+
b1DTA+ b2PE+ b3SGRO+ b4SIZE+ b5g1+ b6g2+ b7g3 regression, the results of which are reported in the Table
4-18. Impact is calculated by multiplying the DTA coefficient by the relevant sample standard deviation.
∆ROA1 ∆ROA2 ∆ROA3
∆IROA1 ∆IROA2 ∆IROA3
Panel A: Univariate regressions
St. deviation 1.902 2.018 2.158
1.911 2.022 2.176
Coefficient -0.014*** -0.015*** -0.022**
-0.012*** -0.012*** -0.20**
Impact (%) -2.66 -3.03 -4.75
-2.29 -2.42 -4.35
N 214 186 161
212 185 158
Panel B: Multivariate regressions
St. deviation 1.891 2.01 2.153
1.899 2.014 2.153
Coefficient -0.011*** -0.014*** -0.022**
-0.010** -0.013*** -0.021**
Impact (%) -2.08 -2.81 -4.73
-1.89 -2.62 -4.52
N 210 182 157 208 181 154

163
CHAPTER 5: EARNINGS MANAGEMENT, SOURCES OF MANAGEMENT
BUYOUTS AND SECONDARY MBO EXITS
5.1 Introduction
Past research has investigated earnings management in public-to-private buyouts (Perry and
Williams, 1994; Fischer and Louis, 2008; Mao and Renneboog, 2013) and there exists
evidence of earnings management around reverse leveraged buyouts (Chou et al., 2006; Katz,
2009). This study explores earnings management practice preceding management buyout
(MBO), management buy-in (MBI) and secondary management buyout (SMBO)
transactions. Special emphasis is given to private-to-private buyouts that form the dominant
majority of all buyout transactions worldwide (Stromberg, 2008), however neglected in the
past research. Recent years have seen a substantial shift in the buyout exit routes used by
private equity (PE) investors. The popularity of initial public offerings (IPO) declined with
the end of second buyout wave and the recent decade witnessed a substantial increase in the
SMBO deals (Zhou et al., 2013). The managerial behaviour and the role of PE sponsors prior
to secondary MBO exit therefore also become an empirical issue.
This study distinguishes between family and non-family ownership and control structures in
private firms. The existing buyout literature suggests that family succession is an important
source of MBO transactions (Howorth et al., 2004; Scholes et al., 2008); however the
evidence on family firms remains exploratory. Limited evidence exists on earnings
management in private firms (Burgstahler et al., 2006) and family owned firms (Prencipe et
al., 2008; Stockmans et al., 2010; Kvaal et al., 2012). Nevertheless, they lack the unique
motivations and distinct agency conflicts of stakeholders at the time of MBO/MBI. This
study attempts to shed light on the family and non-family firm behaviour prior to buyout
transactions. Earnings management offers an ideal setting to examine conflicts between
owners and managers due to its association with their wealth concerns at the time of buyout.

164
In order to execute the research, data on different types of UK buyouts are collected and
annual company filings are examined to identify private firm ownership form. Our results
suggest considerable tendency to inflate earnings one year before buyout transaction. Private-
to-private MBOs30
, MBIs and SMBOs manage earnings upwards while private divisional
MBOs show evidence of downwards earnings management. Contrary to existing evidence,
public-to-private MBOs do not manage earnings, a result we interpret as related to the high
percentage of deals with PE sponsors. Substantial heterogeneity exists within private-to-
private MBOs. Family businesses avoid earnings management altogether while non-family
MBOs show differences conditional upon PE-backing. Differences in ownership structures of
family and non-family firms do not change tendencies to manage earnings; rather it is the
presence or absence of family identification that affects earnings management. This result is
demonstrated by significant differences between family and non-family firms ultimately
controlled by one individual. PE-backed buyouts, in general, exhibit lower abnormal accruals
than non-PE-backed buyouts. PE investors, however, do not curb earnings management in
secondary MBOs, suggesting a shift in their incentives at the time of exit. The results urge
caution against drawing general conclusions about buyouts and highlight their heterogeneity.
This study contributes to the literature in four ways. First, the prior earnings management
studies provide evidence from public-to-private MBOs. This study examines MBOs of public
and private firm origin as well as divisional MBO and MBI transactions. Second, empirical
evidence regarding agency conflicts during private firm family successions is non-existent.
Although calls have been made for more research (e.g., Chrisman et al., 2004), past studies
are limited to theoretical discussions and exploratory evidence (Howorth et al., 2004; Scholes
et al., 2008). Third, the literature emphasises the need for comparative studies to segregate
family and non-family firm effects (Chrisman et al., 2004) and to discern different uses of
30
In this study, private-to-private MBO refers to MBOs of independent private firms. This term includes private
family and non-family businesses.

165
earnings management in family and non-family firms (Salvatore and Moore, 2010). This
study follows their invitation for more comparative research. Fourth, the positive role of PE
sponsors in buyouts is widely acknowledged. Less debated is their role in earnings
management practices and their shifting motivations at buyout exit. Prior evidence on PE-
backed buyouts relies on IPO exits (Chou et al., 2006; Katz, 2009). This study extends
previous research by examining the effect of PE-backing prior to buyout and complements
IPO evidence with a secondary MBO perspective.
The remainder of the chapter proceeds as follows. Section 2 examines motivations for
earnings management and constructs hypotheses. Section 3 describes data and discusses
family firm definition. Section 4 presents the results and Section 5 concludes the study.
5.2 Agency Conflicts and Earnings Management in Management Buyouts
5.2.1 Public-to-private MBOs
Jensen (1986) argues that MBO reduces agency conflicts between managers and
shareholders. However, an MBO is often accompanied by its own moral hazard problems.
The vendor management team needs to make a choice between its own wealth and wealth of
shareholders. Should managers choose to maximise their wealth, they can expropriate
shareholders by manipulating earnings and purchase the firm at an undervalued price. Prior
literature finds that separation of ownership and management creates incentives for managers
of public firm to understate earnings before MBO (Perry and Williams, 1994; Fischer and
Louis, 2008; Mao and Renneboog, 2013). Managers have the ability to exert a self interest-
oriented control over the accounting practices since they possess an informational advantage
over the shareholders and dispersed ownership structure of public firms allows them to evade
strict monitoring by shareholders. With the exception of DeAngelo (1986), the evidence

166
collectively suggests that managers adjust earnings downwards in the year preceding MBOs.
Therefore we hypothesise that:
H1: Managers of public-to-private MBOs understate earnings prior to buyout transaction.
5.2.2 Private-to-private MBOs: Family vs. Non-Family Firms
Although researchers argue that agency conflicts are substantially reduced (Jensen and
Meckling, 1976; Fama and Jensen, 1983), the traditional principal agent relationships do not
accurately describe rather complex nature of conflicts in private firms (Schulze et al., 2001;
Howorth et al., 2004). There exist various types of ownership structures and owner-manager
relationships which cannot be formulated into one single recipe. The research must
essentially distinguish between private family and private non-family firms since the former
blends ownership and management into a family culture that imposes behavioural
expectations in line with family reputation on both managers and owners. Such expectations,
however, do not exist in non-family firms where a family culture is not present.
Contrary to public firms where managers have self-motivated incentives to manipulate
earnings, the agency conflicts between managers and shareholders largely take a back seat in
the private firm literature since the concentrated ownership and non-separation of ownership
and control reduce information asymmetries between insiders (e.g., Fama and Jensen, 1983).
Instead, more attention is given to relations between shareholders and outsiders, shareholders
themselves, institutional settings and capital markets. The existing research indeed suggests
that private firm managers might have other incentives to manipulate earnings. Less
importance is attributed to informativeness of earnings (Ball and Shivakumar, 2005) as a
means to convey information to shareholders since few shareholders can exchange
information using private channels (Burgstahler et al., 2006). The financial statements,
however, might be used to communicate with outside investors. In the unique MBO setting,

167
the relations with outside investors and lenders may be especially important should managers
seek external financing to cover the purchase (Fischer and Louis, 2008). Therefore managers
may resort to upwards earnings management to facilitate financing. The manager-on-manager
conflicts can also play an important role in the buyout setting. Kaplan (1989b) finds that a
large number of managers who are not part of the MBO team sell their shares in the MBO.
These managers are likely to have incentives to inflate earnings to obtain a higher profit.
Earnings can also be overstated by outgoing managers before leveraged buyout transactions
since they cease involvement in the firm following buyout and do not bear the future costs of
reversals (Mao and Renneboog, 2013). In private firm MBOs, incentives to overstate
earnings might be even stronger if the outgoing managers also hold large chunks of shares.
Demsetz and Lehn (1985) argue that large shareholders are able to monitor management
more effectively and prevent managerial expropriation in firms where ownership and control
is not separated. However, personal wealth driven concerns might motivate owner-managers
themselves to take advantage of their unique position and expropriate independent managers
in MBO deals. This pattern can be more visibly observed in private firms ultimately or fully
owned by one individual.31
In contrast, ability of management team to understate earnings is
likely to be constrained due to strict monitoring by outgoing shareholders. Hence an upwards
earnings management can be projected in private firms prior to MBO.
The private firm research emphasises that altruism between family members (Eisenhardt,
1989), while reducing agency conflicts, can lead to pursuit of non-economic objectives in
family firms (Chrisman et al., 2004; Stockmans et al., 2010) creating family-on-family
conflicts which are harder to resolve due to family members reluctance to put pressure on
other members (Schulze et al., 2001). These unique conflicts are often associated with poorer
performance for family firms (Demsetz and Villalonga, 2001; Che and Langli, 2014) and
31
This study includes 52 private firms 100% owned by one person. With regards to ultimate ownership, we
differentiate between ultimate family owner and ultimate non-family owner.

168
willingness to manage earnings upwards (Stockmans et al., 2010). On the other hand, the
agency conflicts in private firms might be manifested in the form of an attempt by entrenched
large shareholders to expropriate minority shareholders (Chrisman et al., 2004; Salvato and
Moores, 2010). In both cases, the underlying assumption is that the family or large
shareholder strives for its survival. Private family firms, however, are less likely to witness
expropriation of minority shareholders by family since family wealth itself is dependent on
firm wealth (Schulze et al., 2001). Moreover, in the context of MBO by which the dominant
shareholder effectively terminates its ownership, stakeholders are less likely to suffer from
intra-family conflicts or from expropriation attempts by large shareholders. Expropriation
theory implicitly assumes that minority shareholder wealth is sufficiently large to deserve
expropriation. As reported in descriptive statistics, the median non-family shareholding in
our sample family firms is only 6%. Thus we find it unlikely that family will risk alienating
minority shareholders. This explanation is more likely to be valid in public firms where
family firm ownership is more loosely defined than in private firms. Therefore the emphasis
should be given to the relationship between managers and outgoing owners.
The stewardship theory (Davis et al., 1997) is an ideal starting point to explain relations
between managers and family owners (Corbetta and Salvato, 2004). It posits that family
members identify with the organisation and this identification process can be internalised by
the selected managers who hold close relationships with the owners. Lansberg (1983) reports
that family firms often select and appoint non-family managers based on the personal
connections between controlling family and individuals. As a result, managers and owners
form a trust-based relationship driven by more than economic goals (Chrisman et al., 2004;
Howorth et al., 2004; Stockmans et al., 2010). In this type of governance structure, both
managers and owners are likely to forego their private rents for the benefit of the entire
family organisation.

169
Burkart et al. (2003) emphasise that family succession issues are crucial to the family firm
governance and survival. In the absence of a suitable family member to succeed the retiring
generation (Wright et al., 1992), families might consider transferring control to a trusted
management team through an MBO (Howorth et al., 2004; Scholes et al., 2008). Family
identity and reputation concerns play a vital role in the succession decisions. An MBO
succession route is often preferred for the preservation of business, family identity and
reputation (Westhead, 1997; Howorth et al., 2004). Family firms gain economic and non-
economic benefits from their reputation in their dealings with third parties, suppliers and
lenders. For example, families with a long history in the business can enjoy more favourable
debt financing terms compared to non-family firms (Anderson et al., 2002). Since transfer of
the family business to an outsider would reduce the private benefits of family control
(Burkart et al., 2003), families seek to sustain and capitalise on their reputation built over a
long time. Therefore family successions constitute a sizeable portion of MBO transactions.
Scholes et al. (2008) report that 20% of MBOs in Europe results from takeover of family
businesses. Although information asymmetries still exist between management team and
family during MBO negotiations (Howorth et al., 2004), the opportunistic incentives to
manage earnings are expected to be minimal in these friendly deals.32
Although more emphasis has been given to family firms recently, the research on earnings
management in family firms is rather limited. In a study of Italian public family firms,
Prencipe et al. (2008) find that family owned businesses are less likely to manage earnings
for income smoothing purpose; however they have incentives to do so for debt covenant
reasons. Stockmans et al. (2010) examine Flemish family firms and show that poor
performing family businesses can inflate earnings for the preservation of so-called
32
For example, MBO team of Mansfield Pollard & Co Limited “express their gratitude to the controlling family
for their 40 years of service” and stress the sustenance family culture in the annual account. Another family firm
Raymond Brown Limited initiated succession plans three years before MBO. The senior management team
involved in the MBO had, on average, 14 years of service with Raymond Brown.
170
socioemotional wealth which refers to non-financial characteristics of the family business
such as identity and reputation. Kvaal et al. (2012) argue that compared to non-family firms,
private family business owners are more likely to manage earnings downwards to hide their
true wealth. Their earnings management proxy, however, is not significantly different
between family and non-family firms. The limited evidence fails to shed light on the earnings
management motivations and the trade-off between managers and owners in the unique MBO
setting. We formulate two hypotheses for family and non-family firms as follows:
H2: Managers of private family firms do not manage earnings prior to MBO.
H3: Managers of private non-family firms overstate earnings prior to MBO.
5.2.3 Management Buy-ins
MBIs are likely to occur when incumbent managers who are aware of the problems with the
firm are unwilling to buy the firm (Jelic, 2011). The shareholders are then likely to search for
external buyers. Scholes et al. (2008) argue that family owned firms resort to MBI as a
succession route when there is no suitable internal family owner or manager. The incoming
management teams often face unexpected problems (Wright et al., 1995) that are not revealed
in the negotiation process. Howorth et al. (2004) argue that the mutual commitment of parties
to the future of firm is expected to be lower in MBI deals. MBI negotiations between family
owners and external managers are likely to be beset with opportunistic approach from both
parties, with the outgoing owners having the informational advantage over incoming
managers. Therefore, agency conflicts between vendors and buyers would arise. On the other
hand, the incentives of incumbent management and outgoing shareholders are likely to be
aligned since neither party would have a stake in firm following MBI deal. They might be
tempted to seek short term personal gains by inflating earnings to obtain a better bargaining

171
position in price negotiations. Hence vendors may attempt to expropriate incoming
management team. Based on the discussion we hypothesise that:
H4: Managers of private firms overstate earnings prior to MBI deals.
5.2.4 Divisional Buyouts33
The agency conflicts in divisional MBOs mainly appear in the form of differences in the
priorities of division managers and their parent companies. Fama and Jensen (1983) point out
that the lack of appropriate incentive and control mechanisms in large companies may create
agency problems between divisions and their parents. These problems in particular relate to
the parental constraints imposed on the division, which restrict realisation of growth potential
in favour of the parental organisation targets. Therefore, divisions have limited ability to
create value (Wright et al., 1994). An MBO enables the managers to overrule these
constraints and unleash the latent growth potential by exercising their discretion (Wright et
al., 2001; Bruining and Wright, 2002). As there are significant asymmetric forces (Wright et
al., 2001) managers might be tempted to act opportunistically. On the other hand, large firms
often divest their unprofitable and inefficient assets as part of a restructuring effort to focus
on their core business (Lang et al., 1995). Managers may use this argument to motivate the
sale even if there are other reasons. Hence an unprofitable division may set the ideal
environment for a divisional MBO. We hypothesise that:
H5: Managers of divisions understate earnings prior to MBO deals.
5.2.5 Secondary MBOs
SMBO mainly represents a form of exit for the private equity (PE) investor where the
original buyout management team maintains its position and outgoing investor is replaced
with a new PE investor. The literature suggests that secondary MBOs are not a desired exit
33
Divisional MBOs used in this study are divisions of private firms.

172
route (Bienz and Lenite, 2008) and used when other routes are not feasible (Jelic and Wright,
2011). In secondary deals, agency conflicts between managers and exiting investor are likely
to be minimal due to control mechanisms introduced in the initial buyout (Meuleman et al.,
2009). Managers who seek a new investor and PE investor who seeks a successful exit are
likely to work together towards their mutual target. Hence, the interests of managers and
incumbent PE investor would be aligned (Chou et al., 2006). Agency conflicts, however,
might emerge between outgoing and incoming PE investors. With both sides having similar
skills, the party with the informational advantage can structure a deal to its benefit. The self-
motivated incentives of the selling PE might be strengthened by its need to create a
successful track record (Kaplan and Schoar, 2005) and provide a high return for its limited
partners. On the other hand, the incoming PE, being under pressure to make investment,
might be less willing to negotiate a more favourable price. Note that incentives to manage
earnings are different when PE investors buy (MBO) and sell (SMBO) shares. While PE
funds are likely to curb earnings management practice prior to purchase, they are more likely
to act towards profit maximisation at the time of exit (Chou et al., 2006; Cao, 2008). The
only evidence in this regard comes from buyout initial public offerings called reverse
leveraged buyouts. Chou et al. (2008) find that PE-backed buyout IPOs manage earnings
upwards while those without buyout sponsor do not manage earnings. In contrast, Katz
(2009) finds that PE-backed IPOs engage in less upward earnings management. While the
limited evidence points to a mixed picture for IPO exits, secondary MBOs are private
negotiations which are characterised by higher information asymmetries between vendor and
buyer than in IPOs. Therefore the opportunities and incentives for the selling party to engage
in earnings management are expected to be higher. Thus, we hypothesise that:
H6: Managers of MBOs overstate earnings prior to secondary MBO exits.

173
5.2.6 Private Equity Sponsors
It is often argued that PE sponsors curb earnings management prior to IPOs. The evidence,
however, mostly comes from venture capital (VC) backed transactions. The importance of
distinguishment between PE and VC-backed deals in the context of earnings management is
highlighted by Katz (2009) who argues that VC-related findings are hard to extrapolate to PE
investors since the two have significant institutional differences. For example, VC funds
often invest in early stage firms while PE investments involve mature firms with a history
and different disclosure requirements. Therefore VC and PE sponsors might have distinct
motivations with regards to earnings management. The VC-related findings draw a positive
role for VC firms. Morsfield and Tan (2006) and Hochberg (2008) provide evidence that VC-
backed IPOs have lower discretionary accruals than non-VC-backed IPOs. Wongsunwai
(2013) shows that VC sponsors curb earnings management prior to lock-up expiration. The
evidence on the role of PE investors is more ambiguous. Chou et al. (2006) find that PE funds
manage earnings before reverse leveraged buyouts, while the results of Katz (2009) indicate
lower earnings management in PE-backed IPOs. This study involves both entry (MBO, MBI)
and exit (SMBO) type of deals, therefore earnings management motivations of PE firms
related to entry and exit must be separately addressed. PE investors are likely to detect and
curb earnings management in entry deals since they have a greater need to obtain undiluted
information in the negotiation process. They are also likely to be similarly motivated to
reduce upwards earnings management not to pay a high price. At the time of exit, however,
PE investors have the informational advantage over the buying party and they are in need to
maximise their profits (Chou et al., 2006; Cao, 2008). Therefore, two different outcomes
related to entry and exit are expected:
H7: PE-backed buyouts engage in less earnings management than non-PE-backed buyouts in
entry deals.

174
H8: PE-backed buyouts engage in more earnings management than non-PE-backed buyouts in
exit deals.
5.3 Data and Methodology
5.3.1 Data Sources and Sample Construction
This study comprises buyouts completed between 2004 and 2012 in the UK. Data for
different sources of buyouts and buyout types are collected from Thomson One Banker
(TOB) and Centre for Management Buyout Research (CMBOR) databases. We collect data
on private-to-private MBOs, public-to-private MBOs and MBI deals from TOB and
supplement the data with secondary buyout data from CMBOR to obtain a comprehensive
sample of UK buyout deals. Accounting data required for earnings management estimations
collected from financial statements obtained from Fame database. Company annual accounts
and annual return documents used in the identification of family and non-family firms are
also downloaded from Fame.
Private-to-private buyout deals are selected based on the following general criteria:
Acquisition target must be a private company registered in the UK, transaction must be led by
an incumbent management team –hence MBO- and the selected companies must have the
necessary accounting data to estimate earnings management prior to buyout transaction. A
similar procedure is followed for MBI deals, with the exception that a buyout must be led by
an incoming management team to qualify as MBI. Public-to-private MBOs are identified
from the population of going private deals and MBOs.
The limitations of TOB and other buyout databases have been well documented in the
literature (i.e. Stromberg, 2008; Jelic and Wright, 2011). Inconsistent reporting is a common
erroneous feature of these databases. Hence buyout samples suffer from overlaps between
samples and occasional infiltration from repeated transactions. For instance, the initial

175
private-to-private MBO sample obtained from TOB also contains several public-to-private
and secondary buyout deals. Therefore additional refinement is made by removing these
deals and transferring them to their relevant samples. Various filters are used to drop
irrelevant companies. We read through deal synopsis to identify buyouts originating from
subsidiaries and formerly bankrupt companies. A separate divisional MBO sample is
constructed by importing subsidiaries from the main sample and formerly bankrupt
companies are dropped following Perry and Williams (1994). Following the common practice
companies in financial industries are also excluded due to differences in their composition of
financial statements.
For secondary buyouts and other buyouts we collected data on deal characteristics, financial
statements, PE sponsorship and presence of existing management in the buyout team using
following sources: (i) Fame database; (ii) PE sponsor websites, TOB, www.unquote.com and
news search. To obtain the final secondary MBO sample, we excluded secondary buy-ins and
determined whether the deal is an MBO or not using the sources above. Private and public
firm control samples used in tests of earnings management are also constructed using the
population of active and inactive companies on Fame database. The final samples for
different buyout types include 229 private-to-private MBOs, 18 public-to-private MBOs, 24
MBIs, 47 divisional MBOs and 138 secondary MBOs.
5.3.2 Definition of Family Firm
Family business literature defines a family firm in a variety of ways depending on the market
and research question. In countries such as Italy and Norway, family research is facilitated by
collective research projects on family firms whereby the market-specific family business data
is collected and made available to researchers (e.g., Sciascia and Mazzola, 2008; Che and
Langli, 2014). Surveying top managers of companies is also a widely utilised method to
identify family businesses (Zahra, 2005; Westhead and Howorth, 2006; Wang and

176
Poitziouris, 2010). While a wide range of family definitions exist in the literature, there are
certain points that are agreed upon by most researchers. Chua et al. (1999) and Miller et al.
(2007) review the definitions of family firms and conclude that a family firm is typically
defined as a business owned and managed by multiple family members. Three combinations
of family ownership and management patterns are described by Chua et al. (1999). Some
researchers consider a firm family business if owned and managed by family while others see
it sufficient to have family involvement in either ownership or management alone.
Differences also arise as to how much ownership is required to consider a firm as family
owned and what exactly qualifies a firm as family controlled. Notably, different family
definitions with varying degrees of family ownership and managerial involvement are
adopted in private and public firms. In publicly listed firms, where dispersed ownership is
more pronounced than privately held firms it is a common practice to consider less than 50%
family ownership sufficient to qualify as family business provided that the founder is still in
the management team, CEO or top members of management are family members (Anderson
and Reeb, 2003; Gomez-Mejia et al., 2003; Ali et al., 2007). In this definition, family control
is exerted through strategic managerial positions even though only a minority of shares is
held by family. For example, average family ownership in Anderson and Reeb (2003) sample
is only 18%. Other researchers consider controlling majority voting rights as a means to
assume family control over firm (Barontini and Caprio, 2006; Kvaal et al., 2012). On the
contrary, in private firms a family network is often required to hold majority ownership to
qualify as family business without necessarily family involvement in management (Westhead
and Howorth, 2006; Scholes et al., 2008; Stockmans et al., 2010). Chua et al. (1999) note that
it would be injustice to ignore firms who insist that they are family firms even though the
family network does not have majority ownership.
177
Based on the prior literature, we adopt a strict, at the same time inclusive family definition for
our private firm sample. Three conditions are imposed to qualify a firm as family business: i)
more than 50% of ordinary shares are held by multiple individuals who are linked by blood or
marriage, ii) at least one member of family serves in board of directors, iii) a firm is reported
to be family business in company annual accounts. Firms must meet the first two conditions
or the last condition to qualify as family business. Surnames and addresses of shareholders
and managers in annual return filings are used to identify blood relations. This definition is
consistent with Wilson et al. (2013) for UK family firms.34
Miller et al. (2007) point out that most family research on performance does not distinguish
between lone founder and family founder, considering firms ultimately owned by one
individual as family business even though there is zero involvement of other family members
as shareholders or managers, making it difficult to assess the unique effects of the two. In this
study we implement another approach and distinguish between ultimate family owner (UFO)
and lone ultimate owner. Firms owned by a single individual are therefore considered a
distinct non-family firm category.
5.3.3 Sample Descriptive Statistics
The final sample count and distribution of buyouts over time are presented in Table 5-1 Panel
A. The private-to-private sample is divided into family and non-family groups where the first
group contains 71 MBOs and the latter 158 MBOs. Only firms for which the annual account
and annual return filings are available, and the ownership status can be determined from
those filings are included in the private-to-private MBO sample. To identify family and non-
family firms we examine shareholders, board members and annual accounts one year before
and after MBO. To qualify as a family business, more than 50% of ordinary shares must be
34
This definition is different from prior earnings management studies in by Prencipe et al. (2008) and
Stockmans et al. (2010), which do not require family members to hold managerial positions to qualify as family
business.

178
owned by one family and at least one member of family must hold board seat. 63 firms are
identified family business using this definition. Firms that explicitly describe themselves as
family business in annual accounts are also considered family firm even if their ownership
structure cannot be determined from annual reports. 8 firms are identified as family business
by virtue of this definition. The main results are inferred from 71 family MBOs, however
separate results for the 63 family firms (excluding 8 firms that perceive themselves as family
business, but lacking data to empirically verify this) are also presented in additional tests.
Further examination of private non-family firms also reveals three different ownership
patterns. The first one is businesses wholly owned by a single individual. 52 firms fall into
this category. These firms are not considered family business since the shares are exclusively
held by one individual and no other member of family is involved in the management. The
second ownership pattern is firms jointly owned by two individuals where each person holds
50% of equity and no member of their family occupies managerial posts. 14 firms fall into
this category. The third and last ownership pattern is firms with dispersed ownership where
no single controlling individual or entity exists and all shareholders own less than 50% of
shares. 92 firms fall into this ownership category. Separate tests for wholly owned non-family
firms and firms with dispersed ownership are also presented in the results section.
[Table 5-1]
Panel B of Table 5-1 reports mean and median ownership and board size for family firms.
The first two columns present percentage family and non-family ownership for 63 firms
where ownership data is available. The average family (non-family) ownership is 88.3%
(11.6%) and median family ownership is 94% (6%). The third column shows statistics for
firms controlled by an ultimate family owner (UFO). UFO information is obtained from the
ultimate controlling party section of company annual accounts. Ultimate controlling persons
in non-family firms are not included in this classification. 30 family firms are reported to be

179
controlled by UFOs. Mean and median ownership for UFOs is 73.8% and 72.5%
respectively. The last two columns display number of all board members and number of
family members on board. The median family firm has 5 managers on board and 2 of these
posts are occupied by family members. In summary, these statistics suggest that prior to
MBO transaction family firms are closely held and controlled by family through their
substantial shareholding and occupied board seats while non-family shareholders own only a
fraction of common equity.
5.3.4 Measurement of Earnings Management
Three proxies are used for earnings management. We initially estimate discretionary total
accruals with Defond and Jiambalvo (1994) cross-sectional version of Jones model. As
shown below, this method involves estimating earnings management parameters using
samples of control firms and computing discretionary accruals are as the difference between
realised accruals and predicted accruals. As a second measure of earnings management,
discretionary working capital accruals (WCA) are also estimated. For the third measure of
earnings management, performance-adjusted discretionary accruals are estimated as in
Kothari et al. (2005) who show the importance of controlling for performance to overcome
the likelihood of wrongly rejecting null hypothesis in the events where incentives for
earnings management are associated with performance. Public and private non-buyout firm
control portfolios are constructed by matching MBOs on 2-digit SIC code and year.
Based on prior research (e.g., Perry and Williams, 1994; Dechow et al., 1995; Burgstahler et
al., 2006), we calculate total accruals (TAC) as change in noncash working capital minus
depreciation expense. Formally total accruals in year t are defined as: [∆Current Assetst
(Fame item 48) - ∆Casht (Fame item 42)] - [∆Current Liabilitiest (Fame item 66) - ∆Short

180
term debtt (Fame item 52)] - Depreciationt (Fame item 21).35
Working capital accruals are
defined as change in noncash working capital. Total accruals are modelled as a function of
inverse lagged assets, change in sales and plant, property and equipment (PPE).
(1)
where i= 1, …., 133 index for private control firm samples matched with buyouts in the same
2-digit industry and year36
; and t= index for the corresponding earnings management
estimation year. Normal or nondiscretionary accruals (NDA) are estimated as:
(2)
where α1, α2 and α3= industry-year specific parameter estimates generated by the equation (1)
and j= 1, …., 254 buyout firm index. Discretionary total accruals (DTA) are calculated as the
difference between realised and normal accruals.
DTAjt = TACjt - NDAjt (3)
The same procedure is repeated in the estimation of discretionary working capital and
performance-adjusted total accruals. WCA regressions exclude plant, property and equipment
variable. Models (1) and (2) are augmented by net income scaled by current assets (ROA) to
obtain performance-adjusted discretionary total accruals estimates.
35
It is reported that earnings management studies using balance sheet items to calculate accruals are likely to be
contaminated (Hribar and Collins, 2002). A cash flow based approach is recommended to overcome this issue.
However, we are limited to a balance sheet approach in accruals calculation since most private firms do not
report cash flow statement. 36
It is reported that earnings management studies using balance sheet items to calculate accruals are likely to be
contaminated (Hribar and Collins, 2002). A cash flow based approach is recommended to overcome this issue.
However, we are limited to a balance sheet approach since most private firms do not report cash flow statement.

181
5.4 Results
We start with the full sample of private-to-private MBOs and proceed to divide the sample
into family and non-family owned categories. The non-family owned sample is further
divided into dispersed ownership and single ownership samples based on the ownership
structure. Abnormal accruals for two years preceding MBO are presented since buyout
planning may not be limited to the immediate year before MBO. Year -1 and -2 represent the
first and second years before buyout respectively. Our hypotheses predict no earnings
management for family and upwards earnings management for non-family MBOs. The
results are presented in Table 5-2 through Table 5-6.
[Table 5-2]
Table 5-2 reports abnormal accruals for the full sample of private-to-private MBOs. All
earnings management proxies show significant upwards manipulation in year -1. Mean and
median total discretionary accruals are significant at 1% while median accruals are significant
at 5% in performance adjusted discretionary accruals and working capital accruals models.
Results show that earnings management practice is limited to year -1.
[Table 5-3]
Table 5-3 presents abnormal accruals for 71 family owned firms. Consistent with H2, none of
the three discretionary accruals measures show significant earnings management. The
number of firms with upwards and downwards earnings adjustment is notably almost equal.
[Table 5-4]
Non-family firms reported in Table 5-4, however, show significant upwards earnings
management in all models. Again, the earnings management does not extend to year -2. T-
test and Mann-Whitney tests for differences in abnormal accruals reveal that mean and

182
median differences between family and non-family firms are significant at 1% (not reported).
The results support our predictions regarding family and non-family MBOs in H2 and H3.
[Table 5-5]
Further partition of non-family sample into dispersed ownership and single ownership groups
reported in Table 5-5 and Table 5-6 confirm that both ownership structures form a convenient
ground for upwards exploitation of managerial/owner discretion and control over accounting
procedures. The differences between the two non-family ownership forms are not significant
(tests not reported). The findings related to family MBOs are consistent with a succession
(Howort et al., 2004; Scholes et al., 2008) and stewardship explanation for family firms
(Davis et al., 1997). Moreover, the results suggest that different asymmetric forces shape firm
dynamics of family firms and single owned firms. Single owned firm behaviour resembles
that of non-family firms, thus inclusion of these firms in the family business definition is
likely to produce erroneous findings.
[Table 5-6]
The results for public-to-private MBOs are presented in Table 5-7. Although mean and
median statistics generally suggest downwards earning management as predicted in H1,
abnormal accruals are not significantly different from zero. This result can be explained by
two scenarios. In the first scenario, the low number of observations in the sample might cause
insignificant test statistics and in the second earnings management practice might be
discouraged by the PE sponsor. A closer look at the sample reveals that 15 of 18 MBOs are
backed by a PE investor. The PE explanation might be reasonable since prior MBO literature
on earnings management (e.g., Perry and Williams, 1994; Mao and Renneboog, 2013) does
not take into account the effect of PE involvement.
[Table 5-7]

183
Table 5-8 shows the results related to MBI transactions. Consistent with H4, mean and
median abnormal accruals suggest significant upwards earnings management in the year
preceding buyout. Note that this result comes about in spite of having both family and non-
family MBIs in the sample. As predicted, opportunistically motivated owners exploit their
informational advantage and parties in MBI deals have lower commitment to business
without regard to ownership form prior to buyout.
[Table 5-8]
The divisional MBO results presented in Table 5-9 show a less conclusive picture.
Performance adjusted abnormal accruals in year -1 are negative and significant at 5% while
year -2 shows significant downwards management in performance adjusted and working
capital accruals measures. While the abnormal accruals are generally negative, the
downwards earnings management is more strongly pronounced for year -2 than year -1. This
pattern is, however, consistent with H5 and with Lang et al. (1995) argument that
underperforming divisions are more likely to be sold. Thus, division managers may attempt
to set the stage for an MBO by deflating earnings in two subsequent years before buyout.
[Table 5-9]
SMBO abnormal accruals presented in Table 5-10 suggest significant income overstatement
in two of the three prediction models. Mean and median discretionary total accruals and
working capital accruals in year -1 are positive and significant at conventional levels. This
result is consistent with a scenario where the outgoing PE investor who needs to arrange a
profitable exit exploits its informational advantage over the incoming investor. The findings
therefore support the upwards earnings management hypothesis of H6. Tests of difference
conducted in family vs. non-family, MBO vs. MBI, full MBO vs. divisional MBO and MBO
vs. Secondary MBO samples suggest significant differences in earnings management

184
between family vs. non-family MBOs and full MBO vs. divisional MBOs.37
The differences
between MBO vs. MBI and MBO vs. SMBO deals are not significant.
[Table 5-10]
Table 5-11 reports abnormal accruals relative to PE-backing status. Nearly half of all buyouts
receive PE funding in the sample. PE sponsors are most heavily represented in public-to-
private and SMBOs. The results show that PE-backed MBO/MBIs in general have lower
abnormal accruals than non-PE-backed MBO/MBIs. PE sponsors prevent earnings
management in private-to-private MBOs; however their role in curbing earnings management
is limited to non-family MBOs. Family firms do not manage earnings regardless of the PE-
backing status. Non-family firms and in particular those with dispersed ownership manage
earnings with or without PE-backing, however earnings management is more strongly
pronounced for non-PE-backed firms. 15 of 18 public-to-private MBOs receive PE funding,
which suggests that the previous result of no earnings management in public-to-private could
be due to PE monitoring. There is evidence of earnings management by non-PE-backed
MBIs, significant at 10%. The non-PE-backed MBI sample size is small; hence the power of
tests could be limited. SMBOs form an exception to the role of PE in reducing earnings
management. As predicted, evidence suggests that both PE-backed and non-PE-backed
SMBOs manage earnings. The differences between the PE-backed and non-PE-backed
subsamples are, however, only significant in non-family firms (tests not reported). We
cannot, therefore conclusively state that PE-backing is associated with less earnings
management. Note that non-family firms constitute a large portion of the private-to-private
MBOs -158 of 229 buyouts in this sample-; thus this result can be extended to a large section
of the buyout market. In addition, the role of PE-backing with respect to earnings
37
MBO and full MBO samples consist of 229 independent private-to-private MBOs. The comparison between
MBO and MBI samples is done only with private firms since public-to-private MBIs are not considered in this
study.

185
management is likely to be minimal or non-existent in family firms since family businesses
do not possess opportunistic motivations to manage earnings. In summary, findings suggest
that PE behaviour differs depending on whether they are in the buyer or seller position.
Consistent with Chou et al. (2006) PE firms act opportunistically at the time of exit to
maximise their return. In contrast, PE sponsors reduce earnings management in non-family
owned private firms at the time of entry. The findings lend partial support to H7 and H8.
[Table 5-11]
5.5 Robustness Checks
Additional tests are carried out using various definitions and subsamples of family firms.
First, a strict definition of family business is employed by excluding firms that perceive
themselves as family business absent data on their ownership structure. This definition
reduces the size of family sample from 71 to 63 firms. Second, to differentiate family
succession and stewardship explanations from minority shareholder expropriation
explanation, tests are conducted in subsamples of family firms 100% owned by family and
less than 100% owned by family. Firms wholly owned by family should provide the ultimate
test of earnings management in family firms. As noted previously, however, the median
ownership of non-family shareholders is a small 6% in family firms. Therefore the temptation
to expropriate other shareholders might be small. Lastly tests are conducted in subsamples of
family firms controlled by one member of family (UFO) through majority shareholding and
firms with dispersed family ownership structure. The importance of separately treating UFOs
and non-family ultimate owners is highlighted by Miller et al. (2007). The results presented
in Table 5-12 display no significant earnings management pattern. Adoption of a different
family definition produces results consistent with previous findings. The differences between
family ownership subsamples 100% owned vs. less than 100% owned and UFO vs. non-UFO
family firms are not significant. Tests suggest, however, that UFO and ultimate non-family

186
owner firms have significant differences (results not reported). The results support family
succession (Howort et al., 2004; Scholes et al., 2008) and stewardship explanations (Davis et
al., 1997) that the interests of family owners and managers are aligned when dealing parties
identify with the firm culture and committed to the business.
[Table 5-12]
5.6 Conclusion
This chapter provides further evidence on earnings management preceding buyout
transactions. Differentiating between various types of buyout transactions, we show that
managers do not monotonically possess opportunistic incentives to understate earnings.
Earnings management behaviour is influenced by different agency conflicts present in private
and public firms, as well as having a PE sponsor in the buyout team. The main findings of the
study emphasise the importance of separate examination of family and non-family buyouts
and the shifting earnings management motivations of buyout sponsors at times of entry and
exit.
We find that family firm managers do not manage earnings prior to MBO, while non-family
MBOs managers engage in upwards earnings management. This result is robust to adoption
of a different family business definition, various ownership structures in family and non-
family firms, presence and absence of an ultimate controlling owner in the business. The
results show that outgoing managers exploit their informational superiority and inflate
earnings in MBI deals. Divisional MBO managers, in contrast, tend to understate earnings
prior to buyout. Public-to-private MBOs do not exhibit significant earnings management,
likely due to a high percentage of PE-backed deals. PE sponsors, in general, curb earnings
management in entry level buyouts (MBO and MBI) whilst they attempt to maximise their
profits by upwards earnings manipulation in exits (SMBO). Significant differences in

187
earnings management are observed along the lines of ownership and buyout origin (family vs.
non-family, full MBO vs. divisional MBO, UFO vs. ultimate non-family owner) and across
PE-backing status (PE-backed non-family vs. non-PE-backed non-family). The results
highlight heterogeneity of buyouts and cautions against generalisation of prior earnings
management evidence from public-to-private MBOs (e.g., Perry and Williams, 1994; Fischer
and Louis, 2008).
Little attention has been given to family businesses in buyout research. Empirical evidence on
family behaviour in MBO context is quite limited or non-existent. Future buyout research can
examine other aspects of family MBOs such as performance and survival. The lack of
research on family MBOs also reflects a wider neglect of buyout heterogeneity. Future
research may take the spotlight away from public-to-private buyouts and enhance our
understanding of buyouts originating from private firms.
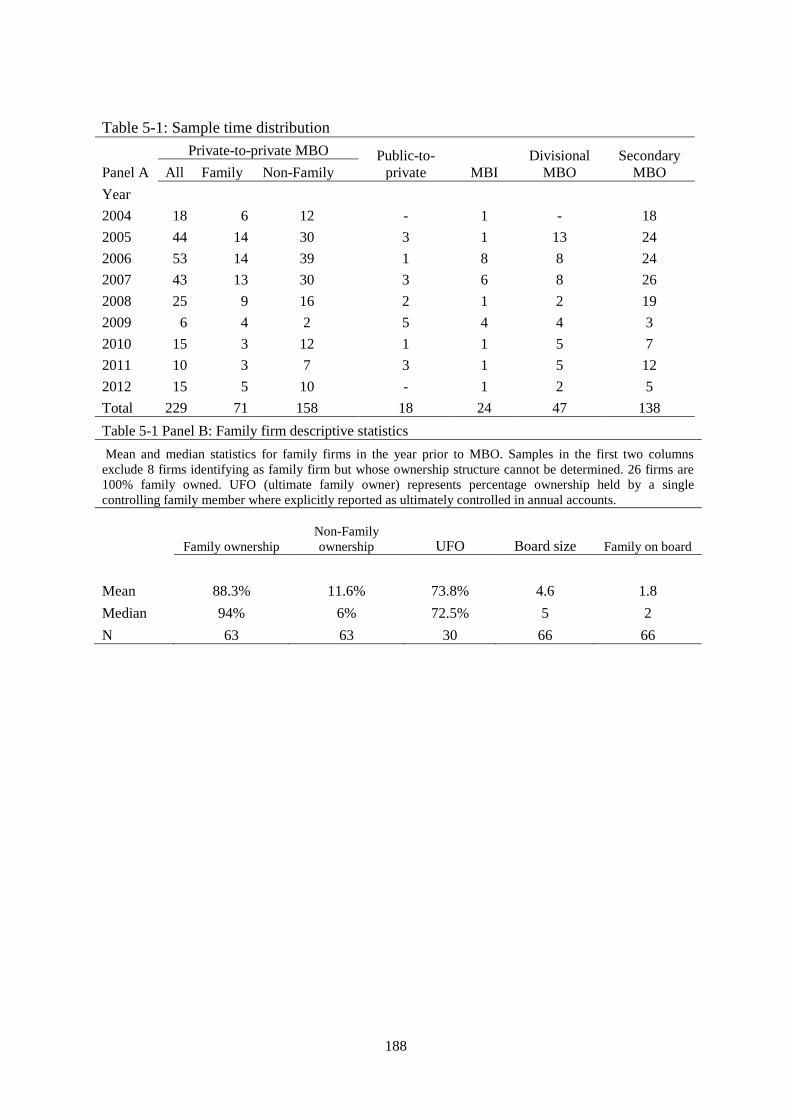
188
Table 5-1: Sample time distribution
Private-to-private MBO Public-to-
private MBI
Divisional
MBO
Secondary
MBO Panel A All Family Non-Family
Year
2004 18 6 12 - 1 - 18
2005 44 14 30 3 1 13 24
2006 53 14 39 1 8 8 24
2007 43 13 30 3 6 8 26
2008 25 9 16 2 1 2 19
2009 6 4 2 5 4 4 3
2010 15 3 12 1 1 5 7
2011 10 3 7 3 1 5 12
2012 15 5 10 - 1 2 5
Total 229 71 158 18 24 47 138
Table 5-1 Panel B: Family firm descriptive statistics
Mean and median statistics for family firms in the year prior to MBO. Samples in the first two columns
exclude 8 firms identifying as family firm but whose ownership structure cannot be determined. 26 firms are
100% family owned. UFO (ultimate family owner) represents percentage ownership held by a single
controlling family member where explicitly reported as ultimately controlled in annual accounts.
Family ownership
Non-Family
ownership UFO Board size Family on board
Mean 88.3% 11.6% 73.8% 4.6 1.8
Median 94% 6% 72.5% 5 2
N 63 63 30 66 66
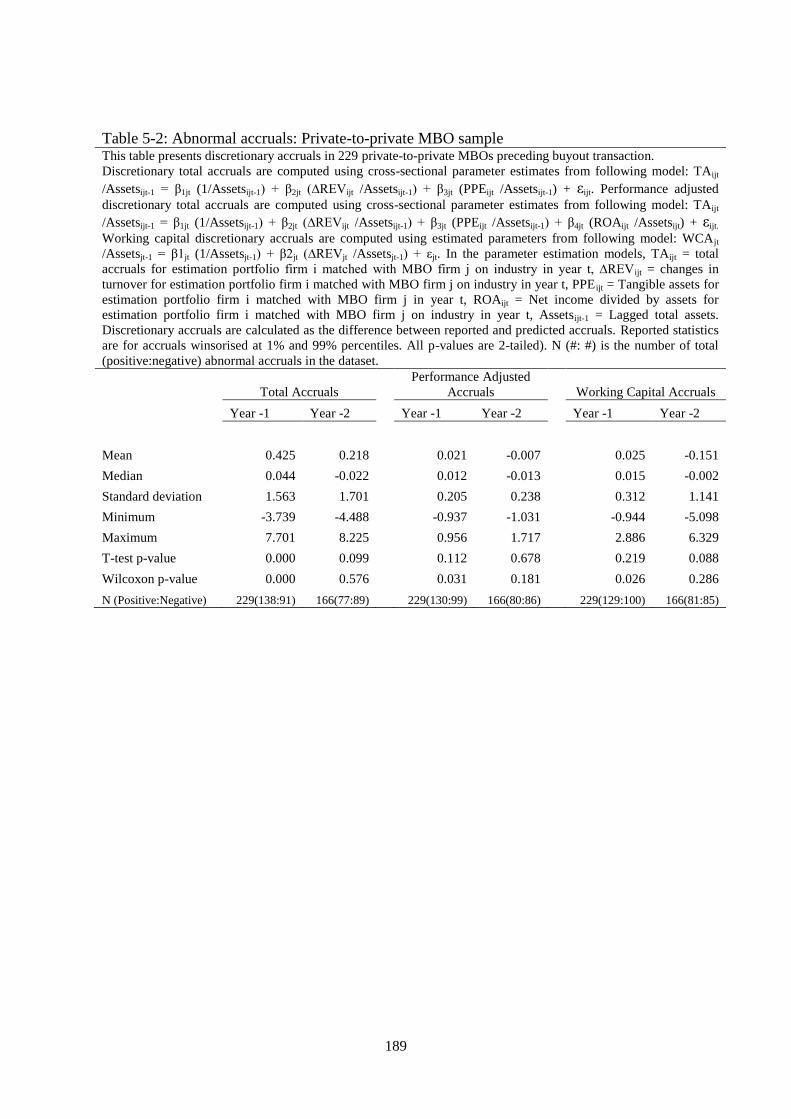
189
Table 5-2: Abnormal accruals: Private-to-private MBO sample This table presents discretionary accruals in 229 private-to-private MBOs preceding buyout transaction.
Discretionary total accruals are computed using cross-sectional parameter estimates from following model: TAijt
/Assetsijt-1 = β1jt (1/Assetsijt-1) + β2jt (∆REVijt /Assetsijt-1) + β3jt (PPEijt /Assetsijt-1) + εijt. Performance adjusted
discretionary total accruals are computed using cross-sectional parameter estimates from following model: TAijt
/Assetsijt-1 = β1jt (1/Assetsijt-1) + β2jt (∆REVijt /Assetsijt-1) + β3jt (PPEijt /Assetsijt-1) + β4jt (ROAijt /Assetsijt) + εijt.
Working capital discretionary accruals are computed using estimated parameters from following model: WCAjt
/Assetsjt-1 = β1jt (1/Assetsjt-1) + β2jt (∆REVjt /Assetsjt-1) + εjt. In the parameter estimation models, TAijt = total
accruals for estimation portfolio firm i matched with MBO firm j on industry in year t, ∆REVijt = changes in
turnover for estimation portfolio firm i matched with MBO firm j on industry in year t, PPE ijt = Tangible assets for
estimation portfolio firm i matched with MBO firm j in year t, ROAijt = Net income divided by assets for
estimation portfolio firm i matched with MBO firm j on industry in year t, Assetsijt-1 = Lagged total assets.
Discretionary accruals are calculated as the difference between reported and predicted accruals. Reported statistics
are for accruals winsorised at 1% and 99% percentiles. All p-values are 2-tailed). N (#: #) is the number of total
(positive:negative) abnormal accruals in the dataset.
Total Accruals
Performance Adjusted
Accruals
Working Capital Accruals
Year -1 Year -2
Year -1 Year -2
Year -1 Year -2
Mean 0.425 0.218
0.021 -0.007
0.025 -0.151
Median 0.044 -0.022
0.012 -0.013
0.015 -0.002
Standard deviation 1.563 1.701
0.205 0.238
0.312 1.141
Minimum -3.739 -4.488
-0.937 -1.031
-0.944 -5.098
Maximum 7.701 8.225
0.956 1.717
2.886 6.329
T-test p-value 0.000 0.099
0.112 0.678
0.219 0.088
Wilcoxon p-value 0.000 0.576
0.031 0.181
0.026 0.286
N (Positive:Negative) 229(138:91) 166(77:89) 229(130:99) 166(80:86) 229(129:100) 166(81:85)

190
Table 5-3: Abnormal accruals: Family MBO sample This table shows discretionary accruals in 71 family private-to-private MBOs preceding buyout transaction.
Total accruals are defined as change in noncash working capital minus depreciation. Working capital accruals are
defined as change in noncash current assets minus change in current liabilities excluding short term portion of long
term debt. Discretionary accruals are estimated as suggested by Defond and Jiambalvo (1994). Kothari, Leone and
Wasley (2005) performance adjusted discretionary accruals are estimated by augmenting prediction model by
(ROA) of control sample matched on 2-digit SIC code. ROA is defined as net income divided by total assets in the
year prior to management buyout. Discretionary accruals are calculated as the difference between realised and
predicted accruals in the year prior to management buyout. Reported statistics are for accruals winsorised at 1%
and 99% percentiles. 2-tailed t and Wilcoxon p values are under the null that mean (median) discretionary
accruals=0. N (#: #) is the number of total (positive: negative) abnormal accruals in the dataset.
Total Accruals
Performance Adjusted
Accruals
Working Capital
Accruals
Year -1 Year -2
Year -1 Year -2
Year -1 Year -2
Mean -0.008 0.191
-0.013 -0.017
-0.043 -0.093
Median -0.012 -0.011
-0.004 -0.012
-0.006 0.008
Standard deviation 0.907 1.373
0.202 0.189
0.222 0.448
Minimum -3.739 -2.902
-0.937 -0.602
-0.944 -2
Maximum 3.796 7.241
0.571 0.574
0.341 0.579
T-test p-value 0.940 0.326
0.579 0.504
0.107 0.144
Wilcoxon p-value 0.701 0.992
0.739 0.358
0.261 0.866
N (Positive:Negative) 71 (35:36) 51 (25:26) 71 (35:36) 51 (24:27) 71 (33:38) 51 (28:23)

191
Table 5-4: Abnormal accruals: non-family MBO sample This table shows discretionary accruals in 158 non-family private-to-private MBOs preceding buyout transaction.
Total accruals are defined as change in noncash working capital minus depreciation. Working capital accruals are
defined as change in noncash current assets minus change in current liabilities excluding short term portion of
long term debt. Discretionary accruals are estimated as suggested by Defond and Jiambalvo (1994). Kothari,
Leone and Wasley (2005) performance adjusted discretionary accruals are estimated by augmenting prediction
model by (ROA) of control sample matched on 2-digit SIC code. ROA is defined as net income divided by total
assets in the year prior to management buyout. Discretionary accruals are calculated as the difference between
realised and predicted accruals in the year prior to management buyout. Reported statistics are for accruals
winsorised at 1% and 99% percentiles. 2-tailed t and Wilcoxon p values are under the null that mean (median)
discretionary accruals=0. N (#: #) is the number of total (positive:negative) abnormal accruals in the dataset.
Total Accruals
Performance Adjusted
Accruals
Working Capital
Accruals
Year -1 Year -2
Year -1 Year -2
Year -1 Year -2
Mean 0.594 0.136
0.037 -0.003
0.056 -0.125
Median 0.066 -0.031
0.025 -0.014
0.036 -0.011
Standard deviation 1.683 1.581
0.206 0.257
0.341 1.201
Minimum -2.013 -4.488
-0.653 -1.031
-0.9 -5.098
Maximum 7.701 8.225
0.956 1.717
2.886 6.329
T-test p-value 0.000 0.355
0.023 0.894
0.040 0.264
Wilcoxon p-value 0.000 0.544
0.017 0.332
0.006 0.304
N (Positive:Negative) 158 (103:55) 115(52:63) 158(95:63) 115(56:59) 158(96:62) 115(53:62)

192
Table 5-5: Abnormal accruals: non-family MBOs: Dispersed ownership sample This table shows discretionary accruals in 106 non-family MBOs with dispersed ownership prior to buyout
transaction.
Total accruals are defined as change in noncash working capital minus depreciation. Working capital accruals
are defined as change in noncash current assets minus change in current liabilities excluding short term portion
of long term debt. Discretionary accruals are estimated as suggested by Defond and Jiambalvo (1994). Kothari,
Leone and Wasley (2005) performance adjusted discretionary accruals are estimated by augmenting prediction
model by (ROA) of control sample matched on 2-digit SIC code. ROA is defined as net income divided by total
assets in the year prior to management buyout. Discretionary accruals are calculated as the difference between
realised and predicted accruals in the year prior to management buyout. Reported statistics are for accruals
winsorised at 1% and 99% percentiles. 2-tailed t and Wilcoxon p values are under the null that mean (median)
discretionary accruals=0. N (#: #) is the number of total (positive: negative) abnormal accruals in the dataset.
Total Accruals
Performance Adjusted
Accruals
Working Capital
Accruals
Year -1 Year -2
Year -1 Year -2
Year -1 Year -2
Mean 0.434 0.316
0.037 -0.002
0.039 -0.072
Median 0.057 -0.009
0.025 -0.032
0.026 -0.008
Standard deviation 1.424 1.772
0.225 0.261
0.271 1.177
Minimum -2.013 -2.867
-0.653 -0.475
-0.9 -5
Maximum 7.701 8.225
0.956 1.717
1.063 6.329
T-test p-value 0.002 0.121
0.092 0.942
0.138 0.592
Wilcoxon p-value 0.000 0.989
0.066 0.196
0.042 0.457
N (Positive:Negative) 106 (70:36) 77 (38:39) 106 (65:41) 77 (34:43) 106 (64:42) 77 (36:41)

193
Table 5-6: Abnormal accruals of non-family MBO: Single owner sample This table shows discretionary accruals in 52 non-family MBOs wholly owned by a single individual
shareholder prior to buyout transaction.
Total accruals are defined as change in noncash working capital minus depreciation. Working capital accruals
are defined as change in noncash current assets minus change in current liabilities excluding short term portion
of long term debt. Discretionary accruals are estimated as suggested by Defond and Jiambalvo (1994). Kothari,
Leone and Wasley (2005) performance adjusted discretionary accruals are estimated by augmenting prediction
model by (ROA) of control sample matched on 2-digit SIC code. ROA is defined as net income divided by total
assets in the year prior to management buyout. Discretionary accruals are calculated as the difference between
realised and predicted accruals in the year prior to management buyout. Reported statistics are for accruals
winsorised at 1% and 99% percentiles. 2-tailed t and Wilcoxon p values are under the null that mean (median)
discretionary accruals=0. N (#: #) is the number of total (positive: negative) abnormal accruals in the dataset.
Total Accruals
Performance Adjusted
Accruals
Working Capital
Accruals
Year -1 Year -2
Year -1 Year -2
Year -1 Year -2
Mean 0.921 -0.226
0.037 -0.005
0.091 -0.233
Median 0.118 -0.063
0.022 0.015
0.044 -0.034
Standard deviation 2.094 1.024
0.161 0.252
0.454 1.254
Minimum -0.775 -4.488
-0.347 -1.031
-0.9 -5.098
Maximum 7.127 0.949
0.411 0.781
2.886 2.027
T-test p-value 0.002 0.181
0.096 0.898
0.155 0.259
Wilcoxon p-value 0.007 0.248
0.111 0.777
0.055 0.446
N (Positive:Negative) 52 (33:19) 38 (24:14) 52 (30:22) 38 (22:16) 52 (32:20) 38 (17:21)

194
Table 5-7: Abnormal accruals: Public-to-private MBO sample This table shows discretionary accruals in 18 public-to-private MBOs preceding buyout transaction.
Total accruals are defined as change in noncash working capital minus depreciation. Working capital accruals are
defined as change in noncash current assets minus change in current liabilities excluding short term portion of
long term debt. Discretionary accruals are estimated as suggested by Defond and Jiambalvo (1994). Kothari,
Leone and Wasley (2005) performance adjusted discretionary accruals are estimated by augmenting prediction
model by (ROA) of control sample matched on 2-digit SIC code. ROA is defined as net income divided by total
assets in the year prior to management buyout. Discretionary accruals are calculated as the difference between
realised and predicted accruals in the year prior to management buyout. Reported statistics are for accruals
winsorised at 1% and 99% percentiles. 2-tailed t and Wilcoxon p values are under the null that mean (median)
discretionary accruals=0. N (#: #) is the number of total (positive:negative) abnormal accruals in the dataset.
Total Accruals
Performance Adjusted
Accruals
Working Capital
Accruals
Year -1 Year -2
Year -1 Year -2
Year -1 Year -2
Mean -0.007 -0.078
-0.013 -0.072
-0.015 -0.085
Median -0.012 -0.034
-0.008 -0.057
0.024 -0.033
Standard deviation 0.178 0.212
0.173 0.159
0.107 0.315
Minimum -0.381 -0.702
-0.409 -0.474
-0.354 -0.897
Maximum 0.525 0.124
0.483 0.119
0.095 0.259
T-test p-value 0.856 0.192
0.736 0.114
0.552 0.332
Wilcoxon p-value 0.743 0.245
0.616 0.157
0.878 0.683
N (Positive:Negative) 18 (8:10) 14 (5:9) 18 (8:10) 14 (5:9) 18 (11:7) 14 (6:8)

195
Table 5-8: Abnormal accruals: Management buy-in sample This table shows discretionary accruals in 24 MBIs preceding buyout transaction. MBI is defined as a buyout
transaction where an incoming management team buys the firm and none of the existing managers is involved in
the purchasing team.
Total accruals are defined as change in noncash working capital minus depreciation. Working capital accruals
are defined as change in noncash current assets minus change in current liabilities excluding short term portion
of long term debt. Discretionary accruals are estimated as suggested by Defond and Jiambalvo (1994). Kothari,
Leone and Wasley (2005) performance adjusted discretionary accruals are estimated by augmenting prediction
model by (ROA) of control sample matched on 2-digit SIC code. ROA is defined as net income divided by total
assets in the year prior to management buyout. Discretionary accruals are calculated as the difference between
realised and predicted accruals in the year prior to management buyout. Reported statistics are for accruals
winsorised at 1% and 99% percentiles. 2-tailed t and Wilcoxon p values are under the null that mean (median)
discretionary accruals=0. N (#: #) is the number of total (positive:negative) abnormal accruals in the dataset.
Total Accruals
Performance Adjusted
Accruals
Working Capital
Accruals
Year -1 Year -2
Year -1 Year -2
Year -1 Year -2
Mean 0.128 0.255
0.061 0.048
0.055 0.168
Median 0.061 0.116
0.027 0.073
0.029 0.141
Standard deviation 0.297 0.718
0.157 0.439
0.152 0.703
Minimum -0.308 -1.218
-0.329 -0.976
-0.326 -0.936
Maximum 1.287 1.892
0.386 0.762
0.325 1.573
T-test p-value 0.035 0.128
0.043 0.627
0.089 0.296
Wilcoxon p-value 0.020 0.156
0.045 0.390
0.076 0.331
N (Positive:Negative) 24 (16:8) 20 (13:7) 24 (17:7) 20 (12:8) 24 (15:9) 20 (12:8)

196
Table 5-9: Abnormal accruals: Divisional MBO sample This table shows discretionary accruals in 47 divisional MBOs preceding buyout transaction.
Total accruals are defined as change in noncash working capital minus depreciation. Working capital accruals are
defined as change in noncash current assets minus change in current liabilities excluding short term portion of
long term debt. Discretionary accruals are estimated as suggested by Defond and Jiambalvo (1994). Kothari,
Leone and Wasley (2005) performance adjusted discretionary accruals are estimated by augmenting prediction
model by (ROA) of control sample matched on 2-digit SIC code. ROA is defined as net income divided by total
assets in the year prior to management buyout. Discretionary accruals are calculated as the difference between
realised and predicted accruals in the year prior to management buyout. Reported statistics are for accruals
winsorised at 1% and 99% percentiles. 2-tailed t and Wilcoxon p values are under the null that mean (median)
discretionary accruals=0. N (#: #) is the number of total (positive:negative) abnormal accruals in the dataset.
Total Accruals
Performance Adjusted
Accruals
Working Capital
Accruals
Year -1 Year -2
Year -1 Year -2
Year -1 Year -2
Mean 0.067 0.026
-0.068 -0.138
-0.039 -0.311
Median -0.014 -0.094
-0.029 -0.097
-0.012 -0.261
Standard deviation 0.758 0.953
0.182 0.454
0.305 0.811
Minimum -1.273 -1.349
-0.883 -1.447
-1.089 -3.908
Maximum 3.897 3.621
0.188 1.042
0.958 1.054
T-test p-value 0.545 0.875
0.013 0.090
0.381 0.055
Wilcoxon p-value 0.452 0.082
0.032 0.044
0.227 0.016
N (Positive:Negative) 47(22:25) 33 (12:21) 47 (20:27) 33 (11:22) 47 (20:27) 33 (10:23)

197
Table 5-10: Abnormal accruals: SMBO sample This table shows discretionary accruals in 138 secondary MBOs preceding buyout transaction.
Total accruals are defined as change in noncash working capital minus depreciation. Working capital accruals
are defined as change in noncash current assets minus change in current liabilities excluding short term portion
of long term debt. Discretionary accruals are estimated as suggested by Defond and Jiambalvo (1994). Kothari,
Leone and Wasley (2005) performance adjusted discretionary accruals are estimated by augmenting prediction
model by (ROA) of control sample matched on 2-digit SIC code. ROA is defined as net income divided by total
assets in the year prior to management buyout. Discretionary accruals are calculated as the difference between
realised and predicted accruals in the year prior to management buyout. Reported statistics are for accruals
winsorised at 1% and 99% percentiles. 2-tailed t and Wilcoxon p values are under the null that mean (median)
discretionary accruals=0. N (#: #) is the number of total (positive:negative) abnormal accruals in the dataset.
Total Accruals
Performance Adjusted
Accruals
Working Capital
Accruals
Year -1 Year -2
Year -1 Year -2
Year -1 Year -2
Mean 0.411 0.029
0.015 -0.011
0.037 -0.009
Median 0.028 -0.027
0.005 -0.022
0.026 0.002
Standard deviation 1.496 0.978
0.166 0.201
0.794 0.216
Minimum -0.875 -5.745
-0.649 -0.928
-6.639 -1.147
Maximum 7.258 7.258
0.852 1.231
6.024 0.911
T-test p-value 0.001 0.763
0.280 0.589
0.018 0.667
Wilcoxon p-value 0.000 0.248
0.276 0.094
0.005 0.801
N (Positive:Negative) 138(87:51) 102(44:58) 138(73:65) 101(39:62) 138(86:52) 102(53:49)

198
Table 5-11: Abnormal accruals by private equity backing This table presents discretionary accruals for private equity backed and non-private equity backed subsamples
across buyouts. See previous tables for the details of expected accruals models used in the parameter estimation.
Mean and median significance of accruals is tested by parametric t-test and non-parametric Wilcoxon sign rank
test. *, ** and *** represent significance at 10%, 5% and 1% level. N (#: #) is the number of total
(positive:negative) abnormal accruals in relevant samples.
Private Equity Backed
Non-PE Backed
Total Acc. Perf. Adj. WCA
Total Acc. Perf. Adj. WCA
Private-to-private MBO
Mean 0.211* 0.038* 0.048
0.623*** 0.006 0.004
Median 0.024 0.016 0.007
0.071*** 0.009 0.022
N(Positive:Negative) 110(62:48) 110(57:53) 110(58:52)
119(76:43) 119(69:50) 119(71:48)
Family MBO
Mean -0.193 0.006 -0.046
0.105 -0.025 -0.041
Median -0.079 -0.021 -0.033
0.017 0.002 0.013
N(Positive:Negative) 27(11:16) 27(12:15) 27(10:17)
44(24:20) 44(23:21) 44(23:21)
Non-Family MBOs
Mean 0.343** 0.049* 0.078*
0.873*** 0.024 0.031**
Median 0.041** 0.022* 0.044*
0.169*** 0.029 0.034**
N(Positive:Negative) 83(51:32) 83(45:38) 83(48:35)
75(52:23) 75(46:29) 75(48:27)
Non-Family Dispersed Ownership
Mean 0.171 0.056* 0.048
0.777*** 0.012 0.027
Median 0.046** 0.025* 0.033
0.094*** 0.021 0.026
N(Positive:Negative) 60 (38:22) 60(32:28) 60(34:26)
46(32:14) 46(29:17) 46(30:16)
Non-Family Single Owner
Mean 0.791* 0.031 0.158
1.025*** 0.043 0.037
Median 0.041 0.012 0.047
0.272*** 0.033 0.041
N(Positive:Negative) 23(13:10) 23(13:10) 23(14:9)
29(20:9) 29(17:12) 29(18:11)
Public-to-Private MBO
Mean -0.001 -0.009 -0.008
- - -
Median 0.027 0.018 0.025
- - -
N(Positive:Negative) 15(8:7) 15(8:7) 15(11:4)
3 (0:3) 3 (0:3) 3 (0:3)
MBI
Mean 0.119 0.016 0.033
0.144* 0.132* 0.091
Median 0.057 0.014 0.023
0.139* 0.137* 0.111
N(Positive:Negative) 15(10:5) 15(10:5) 15(19:6)
9(6:3) 9(7:2) 9(6:3)
Divisional MBO
Mean 0.082 -0.062* -0.018
0.053 -0.073 -0.057
Median 0.046 -0.041* -0.027
-0.018 -0.021 -0.009
N(Positive:Negative) 22(13:9) 22 (9:13) 22 (8:14)
25(9:16) 25(11:14) 25(12:13)
Secondary MBO
Mean 0.282** 0.026 0.119*
0.642** -0.005 -0.112
Median 0.025*** 0.007 0.026***
0.037** 0.004 0.024
N(Positive:Negative) 89(54:35) 89(46:43) 89(57:32) 49(33:16) 49(27:22) 49(29:20)

199
Table 5-12: Tests with additional family MBO samples This table presents results for a different adopted family definition and 4 other family MBO subsamples based
on various levels of family ownership and control. Firms in Panel A require over 50% family ownership and at
least 1 board seat allocated to a family member to qualify as family firm. This sample excludes firms for which
ownership data is not available but perceived as family business. Panel B sample shows firms wholly owned
by family. Panel D shows family firms where a member of family is identified as ultimate owner. Panel C and
E show family firms excluded from Panel B and D samples respectively. Significance of mean and medians
are tested by t-test and Wilcoxon sign test. * shows significance at 10%.
Total Accruals
Perf. adjusted
WCA
Panel A: Family MBOs excluding firms without ownership data
Mean -0.049
-0.021
-0.054
Median -0.026
-0.007
-0.016
N(Positive:Negative) 63 (31:32)
63 (30:33)
63 (28:35)
Panel B: MBOs 100% owned by family
Mean 0.101
-0.026
-0.027
Median -0.043
-0.022
-0.026
N(Positive:Negative) 26 (12:14)
26 (10:16)
26 (12:14)
Panel C: MBOs less than 100% owned by family
Mean -0.109
-0.021
-0.077*
Median -0.061
0.001
-0.022
N(Positive:Negative) 37 (16:21)
37 (19:18)
37 (15:22)
Panel D: Family MBOs controlled by an ultimate owner
Mean -0.088
-0.046
-0.097*
Median -0.061
0.013
-0.051
N(Positive:Negative) 30 (14:16)
30 (16:14)
30 (13:17)
Panel E: Family MBOs not controlled by an ultimate owner
Mean 0.051
0.011
-0.003
Median 0.001
-0.006
-0.001
N(Positive:Negative) 41 (21:20) 41 (19:22) 41 (20:21)

200
CHAPTER 6: CONCLUSION
This thesis aims to examine performance of management buyouts in the UK. In doing so, this
study argues that post-MBO performance can be explained by value-adding mechanisms
introduced following MBO as well as potential earnings management activity in the process
towards MBO. We try to answer three questions throughout the study. First, do recent MBOs
still create value? Second, do managers manipulate earnings prior to MBO transactions and
what are the effects of earnings management on subsequent performance? Third, how do
sources of buyout and different ownership structures in pre-buyout firms influence the
earnings management practice?
The hypotheses related to these three questions are tested using various hand-collected
samples of MBOs undertaken in the UK. The period of the research comprises buyouts
completed between 2000 and 2012 at its longest point. This period serves to provide recent
evidence on MBOs. However the choice is also influenced by the restrictions imposed by
data sources on historical data. The benefits of using more comprehensive datasets, both in
terms of market and historical coverage cannot be ruled out. The key characteristics and
limitations of databases used in this study are discussed in Chapter 3 and 4. This research
mainly used Thomson One Banker (TOB) and Fame databases to collect required data. TOB
is used to collect MBO samples while Fame is used to gather financial and ownership data
related to MBO companies.
This chapter is organised as follows. Section 2 present summary findings of the three
empirical chapters. Section 3 discusses limitations and further research.

201
6.1 Summary Results of Empirical Chapters
6.1.1 Performance of Management Buyouts in the Last Decade
Chapter 3 examines operating performance around 412 private-to-private and divisional
MBOs. The performance is represented by various measures of profitability, efficiency and
growth. The performance is measured relative to pre-buyout company and industry
performance. The results of univariate analysis show improvements in return on sales,
employee productivity and growth. MBOs outperform the industry firms in terms of
profitability starting from two years prior to buyout and the year preceding buyout coincides
with a peak in profit levels. We speculate that this pattern might indicate a selective PE
investment strategy based on superior profits or an earnings management scenario. The
performance improvements are, however, smaller than those documented for early buyouts
and they are mostly limited to the first three years following buyout. Consistent with prior
research (e.g., Boucly et al., 2011), private-to-private MBOs focus more on growth while
divisional MBOs have larger profitability improvements. Private equity-backed MBOs
consistently have better profitability and growth, but lower efficiency than non-private
equity-backed MBOs. This result is, however, due to a selection effect and PE-backed
buyouts do not outperform other buyouts by any measures of performance after this effect is
controlled, although they continue to outperform industry. This result implies that PE firms
capitalise on better performing firms rather than improving their performance. Buyouts that
arrange a successful exit through IPO, trade sale and secondary MBO have better post-buyout
profitability, lower efficiency and growth. Buyouts staying in their original form for more
than five years tend to be less profitable but continue their growth. We interpret this result
from the perspective of a short and long term investor vision. Temporary investors such as PE
funds seek to extract as much value as possible within a limited time frame so that they can
realise the highest possible return at a successful exit. Long term investors, however, choose

202
to focus on company growth and reinvest the profits. OLS regressions confirm that PE
sponsorship is not significantly associated with post-buyout performance changes while
leverage remains a significant driver of profitability, efficiency and growth. The regressions
also confirm the importance of controlling for selection bias resulting from the investment
choice of PE firms. The findings of the study suggest that generating operational value is
harder in recent buyouts. Moreover, the post-buyout performance is mostly attributable to
existing firm characteristics rather than a result of buyout effect and little or no additional
value is created following buyout. The research should, however, distinguish between
selective investment and earnings management explanations to explain buyout performance.
6.1.2 Earnings Management and MBO Performance
Chapter 4 investigates earnings management preceding private-to-private MBOs and
subsequent performance. The prior literature establishes a link between discretionary accruals
and performance, showing that earnings management proxies are negatively associated with
future performance (e.g., Teoh et al., 1998b). Literature also documents downwards earnings
management prior to MBOs (e.g., Perry and Williams, 1994). If earnings understatement is a
generic phenomenon across all buyouts, we argue that performance improvements following
buyout might be overstated. The tests are performed using a sample of 291 UK MBOs.
Privately held firms are used to test earnings management for two reasons. First, several
studies examine public-to-private MBOs. Second, private-to-private MBOs represent a larger
section of the buyout market (Stromberg, 2008), thus it is easier to make market-wide
inferences based on private-to-private MBOs. The earnings management is tested by means
of cross-sectional and time-series total discretionary accruals models. The results of cross-
sectional tests suggest significant and consistent tendency to overstate earnings in the year
preceding MBO transaction. We find that earnings management activity is limited to non-PE-
backed buyouts and PE sponsorship curbs earnings management. The results are consistent

203
across Defond and Jiambalvo (1994) cross-sectional model, Kothari et al. (2005)
performance adjusted estimation and application of propensity score matching as well as the
use of working capital discretionary accruals. The results of time-series tests are inconclusive.
We attribute this result to the limited availability of historical time series used in the
parameter estimation.
To examine the effect of earnings management to subsequent performance, we divide the
sample into upward and downwards earnings management subsamples. Further, we construct
aggressive and conservative earnings manager quartiles. The results show that aggressive
earnings managers and upward earnings managers suffer deterioration in performance
following buyout. MBOs that inflate earnings have significantly higher profitability before
buyout and lower afterwards. Aggressive earnings managers follow the same pattern;
however, the differences between aggressive and conservative quartiles are significant only
for post-buyout years. More importantly, upward earnings managers stop performing better
that industry after second post-buyout year while MBOs in the aggressive quartile do not
outperform the industry at all. In contrast, downwards and conservative earnings managers
perform significantly better than industry in all post-buyout years examined. The Spearman
rank order correlations show that discretionary total accruals and changes in performance
have a significant relationship. The regression analysis confirms that discretionary accruals
can explain the post-buyout performance changes. The results of this study suggest that
performance improvements in buyouts may not be solely due to superior organisational
structure and value-adding strategies implemented following the transaction.
6.1.3 Earnings Management, Sources of Management Buyouts and Secondary MBO
Exits
Chapter 5 extends the prior work in Chapter 4 by investigating earnings management across
different sources of buyouts and ownership structures amongst them. We examine public,

204
private and divisional MBOs as well as MBI deals and secondary MBO transactions. The
largest sample, private-to-private MBOs are further categorised based on their family and
non-family ownership prior to buyout. The purpose of this study is to shed light on the
agency forces in different governance structures that are likely to explain the reasons for
undertaking an MBO. MBOs also present a unique opportunity to examine manager and
owner relationships due to shifting roles of the parties. Various samples of buyouts are used
to test earnings management. The ownership status of 229 private-to-private MBOs is
identified. This sample includes 71 family and 158 non-family MBOs. In addition, we use 18
public-to-private MBOs, 24 MBIs, 47 divisional and 138 secondary MBOs in the tests.
The results suggest significant differences in earnings management practices of buyouts.
Family owned private firms avoid earnings management in all tests while private non-family
firms inflate earnings prior to MBO. Adoption of a different family definition and tests using
ultimate ownership do not change the results. We find that in the context of private firms,
differences exist along the lines of family and non-family businesses rather than other forms
of ownership within these groups. The differences between family and non-family firms are
significant. Contrary to existing evidence, we find that public-to-private MBOs do not
manage earnings. We attribute this result to the presence of PE sponsors in the majority of
going private deals. The results also suggest MBIs manage earnings upwards while divisional
MBOs tend to manage earnings downwards prior to buyout. The difference between full and
divisional MBOs is significant. The certification role of PE investors appears to change at the
time of entry and exit transactions in line with their changing investor position. PE sponsors
mitigate upwards earnings management in non-family firms at the time of entry while they
tend to act opportunistically and overstate earnings prior to secondary MBO exits. Family
firm tendencies are not related to the provision of PE sponsorship. Family businesses do not
engage in earnings management whether they are backed by PE investors or not. In general,

205
this study suggests that considerable heterogeneity exists within different sources of buyouts.
The findings are consistent with the family business literature (e.g., Chrisman et al., 2004;
Howorth et al., 2004) that family firms suffer less agency problems and they are an important
source of buyouts. Evidence from private non-family MBOs indicates that agency problems
in prospective MBO firms are not limited to owners and managers. Instead, manager-on-
manager conflicts of interests also play an important role when ownership and control are not
clearly separated. In contrast to public firms, where MBO team managers have the ability to
act opportunistically to deflate earnings (Perry and Williams, 1994), MBO teams in private
non-family firms exert less control over financial reporting. Also consistent with Chou et al.
(2006) and Cao (2008), the results suggest that PE sponsors may engage in earnings
management when they are under pressure to deliver returns to their limited partners.
6.2 Managerial Implications
This research contributes to the value creation debate around buyouts. Buyouts and buyout
sponsors have a long history of public controversy. Ethical concerns about buyouts were
raised as early as 1970s (e.g., Sommer, 1974) and the debate continues today after several
high profile bankruptcies such as Southern Cross Care Homes and Phones 4u. We show that
buyouts and buyout sponsors generate little value following MBO transaction. Buyouts
largely sustain superior performance relative to industry; however, improvements relative to
pre-buyout performance are small or non-existent. We also show that buyout performance
has an earnings management component and post-buyout value gains or losses do not fully
reflect operational activities. We acknowledge that the results are partly due to different
nature of private-to-private buyouts and caution against generalisations. The implications for
researchers, investors and regulators are threefold: First, buyout research should control for
earnings management and selection components of performance; otherwise the value creation
debate is likely to be based on biased parameters. Second, the targeted investment strategies

206
of PE firms and their subsequent inability to generate additional value raise questions about
the role of PE sponsors in buyouts as well as sustainability of their investment strategies.
Third, the prevalent practice of earnings management with the exception of family MBOs
raises suspicions about the transparency of buyout deals, especially for private-to-private
MBOs where deal pricing is based on private negotiations and little deal information is
disclosed. Regulators and standard setters may need to consider imposing better disclosure
requirements for this type of acquisitions.
6.3 Further Research
In this study, we examine performance and earnings management in the UK MBOs. This
research can be extended in several ways. Below we discuss suggestions for future research.
First, empirical chapters in this study cover a 9-year period at their longest point. The
research might benefit from longer historical time series that cannot be obtained through
available commercial databases. Proprietary datasets might be useful in this context. Second,
this study examines only one MBO market. Future research can cover other active MBO
markets where private company data is available. The markets with a strong family business
culture can provide interesting extensions to this study. Third, early and mid-2000 years are
heavily represented in our MBO samples. Most of these MBOs are likely to have been
realised by an exit transaction around the latest financial downturn. Statistics suggest that the
recent financial crisis provided the worst exit environment in the UK, with 157 of 245 buyout
exits ending up in receivership in 2009 (CMBOR, 2010). The findings of our study also
indicate that MBOs that aggressively manage earnings have poor post-buyout performance.
Therefore, it would be interesting to know to what extent these failed MBOs engage in
earnings management prior to initial buyout. Fourth, the implications of earnings
management on MBO survival would offer additional insights into value creation in buyouts

207
both in the light of recent exit environment and in general context. To our knowledge, no
study has examined the relation between earnings management and MBO survival. Fifth, a
significant number of MBOs are sourced from family businesses that aim to sustain the
family reputation and culture. Future research can shed more light on the family firm
behaviour both before and after MBO. This can provide significant contributions to the
mainly agency theory oriented MBO literature.

208
REFERENCES
Acharya, V.V. and Johnson, T.C. (2010) More insiders, more insider trading: Evidence from
private-equity buyouts. Journal of Financial Economics, 98 (3): 500-523.
Achleitner, A.K. and Figge, C. (2014) Private equity lemons? Evidence on value creation in
secondary buyouts. European Financial Management, 20 (2): 406-433.
Admati, A.R., Pleiderer, P. and Zechner, J. (1994) Large shareholder activism, risk sharing,
and financial market equilibrium. Journal of Political Economy, 102 (6): 1097-1130.
Ali, A., Chen, T.Y. and Radhakrishnan, S. (2007) Corporate disclosures by family firms.
Journal of Accounting and Economics, 44 (1-2): 238-286.
Amess, K. and Wright, M. (2007) The wage and employment effects of leveraged buyouts in
the UK. International Journal of the Economics of Business, 14 (2): 179-195.
Anderson, R.C., Mansi, S.A and Reeb, D.M. (2003) Founding family ownership and the
agency cost of debt. Journal of Financial Economics, 68 (2): 263-285.
Anderson, R.C. and Reeb, D.M. (2003) Founding-family ownership and firm performance:
evidence from the S&P 500. Journal of Finance, 58 (3): 1301-1327.
Arcot, S., Fluck, Z., Gaspar, J-M. and Hege, U. (2015) Fund managers under pressure:
rationale and determinants of secondary buyouts. Journal of Financial Economics, 115 (1):
102-135.
Athanasakou, V., Strong, N.C. and Walker, M. (2009) Earnings management or forecast
guidance to meet analyst expectations? Accounting and Business Research, 39 (1): 3-35.
Axelson, U., Jenkinson, T., Strömberg, P., et al. (2013) Borrow cheap, buy high? The
determinants of leverage and pricing in buyouts. Journal of Finance, 68 (6): 2223-2267.
Ball, R. and Shivakumar, L. (2005) Earnings quality in UK private firms: comparative loss
recognition timeliness. Journal of Accounting and Economics, 39 (1): 83-128.
Barber, B. and Lyon, J. (1996) Detecting abnormal operating performance: The empirical
power and specification of test statistics. Journal of Financial Economics, 41 (3): 359-399.
Bargeron, L.L., Schlingemann, F.P., Stulz, R., et al. (2008) Why do private acquirers pay so
little compared to public acquirers? Journal of Financial Economics, 89 (3): 375-390.
Barontini, R. and Caprio, L. (2006) The effect of family control on firm value and
performance: evidence from Continental Europe. European Financial Management, 12 (5):
689-723.
Barry, C., Muscarella, C. and Vetsuypens, M. (1990) The role of venture capital in the
creation of public companies. Journal of Financial Economics, 27 (2): 447-471.
Beatty, A.L., Ke, B. and Petroni, K.R. (2002) Earnings management to avoid earnings
declines across publicly and privately held banks. The Accounting Review, 77 (3): 547-570.

209
Bienz, C. and Lenite, T. (2008) A pecking order of venture capital exits. Working Paper,
Social Science Research Network.
Bonini, S. (2015) Secondary buyouts: operating performance and investment determinants.
Financial Management, forthcoming.
Bottazzi, L., DaRin, M. and Hellmann, T. (2004) The changing face of the European venture
capital industry: facts and analysis. Journal of Private Equity 7 (2): 26-53.
Boucly, Q., Sraer, D. and Thesmar, D. (2011) Growth LBOs. Journal of Financial
Economics, 102 (2): 432-453.
Brau, J.C. and Johnson, P.M. (2009) Earnings management in IPOs: Post-engagement third-
party mitigation or issuer signaling? Advances in Accounting, 25 (2): 125-135.
Bruining, H. and Wright, M. (2002) Entrepreneurial orientation in management buy-outs and
the contribution of venture capital. Venture Capital, 4 (2): 147-168.
Burgstahler, D. and Dichev, I. (1997) Earnings management to avoid earnings decreases and
losses. Journal of Accounting and Economics, 24 (1): 99-126.
Burgstahler, D.C., Hail, L. and Leuz, C. (2006) The importance of reporting incentives:
Earnings management in European private and public firms. The Accounting Review, 81 (5):
983-1016.
Burkart, M., Panunzi, F. and Shleifer, A. (2003) Family firms. Journal of Finance, 58 (5):
2167-2201.
Cao, J. (2008) What role does private equity play when leveraged buyouts go public?
Working Paper, Boston College.
Cao, J. and Lerner, J. (2009) The performance of reverse leveraged buyouts. Journal of
Financial Econometrics, 91 (2): 139-157.
Caselli, S., Capizzi, V., Giovannini, R., et al. (2011) Voluntary delistings? A valid option for
firms restructuring? Working Paper, Social Science Research Network.
Che, L. and Langli, J.C. (2014) Family involvement and firm performance in private family
firms. Working Paper, Social Science Research Network.
Chou, D.W., Gombola, M. and Liu, F.Y. (2006) Earnings management and stock
performance of reverse leveraged buyouts. Journal of Financial and Quantitative Analysis,
41 (2): 407-438.
Chrisman, J.J., Chua, J.H. and Litz, R.A. (2004) Comparing the agency costs of family and
non-family firms: Conceptual issues and exploratory evidence. Entrepreneurship Theory and
Practice, 28 (4): 335-354.
Chua, J. H., Chrisman, J. J. and Sharma, P. (1999) Defining the family business by behavior.
Entrepreneurship Theory and Practice, 23 (4): 19-39.
Chung, J. (2011) Leveraged buyouts of private companies. Ohio State University, Columbus.

210
CMBOR (2008) Trends in management buyouts. Management buy-outs: Quarterly Review
from the Centre for Management Buyout Research, Spring: 1-30.
CMBOR (2010) Centre for Management Buyout Research Quarterly Review. Winter 2009/
2010.
Cohen, D.A. and Zarowin, P. (2010) Accrual-based and real earnings management activities
around seasoned equity offerings. Journal of Accounting and Economics, 50 (1): 2-19.
Cohn, J.B., Mills, L.F. and Towery, E.M. (2014) The evolution of capital structure and
operating performance after leveraged buyouts: evidence from US corporate tax returns.
Journal of Financial Economics, 111 (2): 469-494.
Coppens, L. and E. Peek. (2005) An analysis of earnings management by European private
firms. Journal of International Accounting, Auditing and Taxation, 14 (1): 1-17.
Corbetta, G. and Salvato, C. (2004) Self-serving or selfactualizing? Models of man and
agency costs in different types of family firms. Entrepreneurship Theory and Practice, 28
(4): 355-362.
Cotter, J.F. and Peck, S.W. (2001) The structure of debt and active equity investors: The case
of the buyout specialist. Journal of Financial Economics, 59 (1): 101–147.
Cressy, R., Malipiero, A. and Munari, F. (2007) Playing to their strengths? Evidence that
specialization in the private equity industry confers competitive advantage. Journal of
Corporate Finance, 13 (4): 647-669.
Cumming, D. and Johan, A.J. (2008) Pre-planned exit strategies in venture capital. European
Economic Review, 52 (7): 1209-1241.
Datta, S., Gruskin, M. and Iskandar-Datta, M. (2013) Lifting the veil on reverse leveraged
buyouts: what happens during the private period? Financial Management, 42 (4): 815-842.
Davis, J.H., Schoorman, F.D. and Donaldson, L. (1997) Toward a stewardship theory of
management. Academy of Management Review, 22 (1): 20-47.
Dawson, A. (2011) Private equity investment decisions in family firms: The role of human
resources and agency costs. Journal of Business Venturing, 26 (2): 189-199.
DeAngelo, L. (1986) Accounting numbers as market valuation substitutes: A study of
management buyouts of public stockholders. The Accounting Review, 61 (3): 400-420.
DeAngelo, H. and DeAngelo, L. (1987) Management buyouts of publicly traded
corporations. Financial Analysts Journal, 43 (3): 38-49.
DeAngelo, H., DeAngelo, L. and Rice, E.M. (1984) Going private: minority freezeouts and
stockholder wealth. Journal of Law and Economics, 27 (2): 367-401.
Dechow, M.P., Sloan, R.G. and Sweeney, A.P. (1995) Detecting earnings management. The
Accounting Review, 70 (2): 193-225.

211
DeFond, M.L. and Jiambalvo, J. (1994) Debt covenant violation and manipulation of
accruals. Journal of Accounting and Economics, 17 (1-2): 145-176.
DeGeorge, F. and Zeckhauser, R. (1993) The reverse LBO decision and firm performance:
Theory and evidence. Journal of Finance, 48 (4): 1323-1349.
Demiroglu, C. and James, C.M. (2010) The role of private equity group reputation in LBO
financing. Journal of Financial Economics, 96 (2): 306-330.
Demsetz, H. (1983) The structure of ownership and the theory of the firm, Journal of Law
and Economics. 26 (2): 375-90.
Demsetz, H. and Lehn, K. (1985) The structure of corporate ownership: Causes and
consequences. Journal of Political Economy, 93 (6): 1155-1177.
Demsetz, H. and Villalonga, B. (2001) Ownership structure and corporate performance.
Journal of Corporate Finance, 7 (1): 209-233.
Desbrieres, P. and Schatt, A. (2002) The impacts of LBOs on the performance of acquired
firms: The French case. Journal of Business Finance & Accounting, 29 (5): 695-729.
Eisenhardt, K.M. (1989) Agency theory: An assessment and review. Academy of
Management Review, 14 (1): 57-74.
Fama, E. and Jensen, M. (1983) Separation of ownership and control. Journal of Law and
Economics, 26 (2): 321-325.
Fama, E. and Jensen, M. (1985) Organizational forms and investment decisions. Journal of
Financial Economics, 14 (1): 101-119.
Feeley, J. (2013) Dell directors sued over $24.44 billion management buyout. Bloomberg
Business. 7th
February.
Fenn, G. W., Liang, N. and Prowse, S. (1997) The economics of the private equity market.
Staff Study no. 168, Board of Governors of the Federal Reserve System.
Fischer, P.E. and Louis, H. (2008) Financial reporting and conflicting managerial incentives:
The case of management buyouts. Management Science, 54 (10): 1700-1714.
Franks, J., Mayer, C. and Renneboog, L. (2001) Who disciplines management of poorly
performing companies? Journal of Financial Intermediation, 10 (3-4): 209-248.
Gao, X., Ritter, J.R. and Zhu, Z. (2013) Where have all the IPOs gone? Journal of Financial
and Quantitative Analysis, 48 (6): 1663-1692.
Geranio, M. and Zanotti, G. (2010) Equity markets do not fit all: An analysis of public-to-
private deals in Continental Europe. European Financial Management, 18 (5): 867-895.
Gilhully, E.A. (1999) Private equity investors in the new European marketplace, in US-
German Economic Yearbook 1999, Philadelphia: German-American Chamber of Commerce,
Inc.

212
Gilligan, J. and Wright, M. (2010) Private equity demystified - An explanatory guide, 2nd
ed.,
ICAEW, London.
Godley, S. (2011) Southern Cross Care fiasco sheds light on the secretive world of private
equity. The Guardian. 3rd June.
Gomez-Mejia, L.R., Larraza-Kintana, M. and Makri, M. (2003) The determinants of
executive compensation in family controlled public corporations. Academy of Management
Journal, 46 (2): 226-237.
Gompers, P.A. (1995) Optimal investment, monitoring, and the staging of venture capital.
The Journal of Finance, 50 (5): 1461-1489.
Gompers, P.A. (1996) Grandstanding in the venture capital Industry. Journal of Financial
Economics, 42 (1): 133-156.
Gompers, P., Kovner, A., Lerner, J., et al. (2008) Venture capital investment cycles: the
impact of public markets. Journal of Financial Economics, 87 (1): 1-23.
Gore, J.P.O., Pope, P.F. and Singh, A. (2007) Earnings management and the distribution of
earnings relative to targets: UK evidence. Accounting and Business Research, 37 (2): 123-
150.
Gottschalg, O. (2007) Private equity and leveraged buyouts. Study IP/A/ECON/IC/2007-25,
European Parliament, Policy Department: Economic and Scientific Policy.
Grossman, S.J. and Hart, O.D. (1980) Takeover bids, the free-rider problem and the theory of
the corporation. Bell Journal of Economics, 11 (1): 42-64.
Guo, S., Hotchkiss, E.S. and Song, W. (2011) Do buyouts (still) create value? Journal of
Finance, 66 (2): 479-517.
Halpern. P., Kieschnick, R. and Rotenberg, W. (1999) On the heterogeneity of leveraged
going private transactions. Review of Financial Studies, 12 (2): 281-309.
Hand, J.R.M. (2005) The value relevance of financial statements in venture capital market.
The Accounting Review, 80 (2): 613-648.
Healy, P.M. (1985) The effect of bonus schemes on accounting decisions. Journal of
Accounting and Economics, 7 (1-3): 85-107.
Healy, P.M. and Wahlen, J.M. (1999) A review of the earnings management literature and its
implications for standard setting. Accounting Horizons, 13 (4): 365-383.
Heckman, J. (1979) Sample selection bias and a specification error. Econometrica, 47 (1):
153-161.
Hochberg, Y. (2012) Venture capital and corporate governance in the newly public firm.
Review of Finance, 16 (2): 429-480.

213
Holderness, C. and Sheehan, D. (1988) The role of majority shareholders in publicly held
corporations: An exploratory analysis. Journal of Financial Economics, 17 (1): 317-346.
Holthausen, D. and Larcker, D. (1996) The financial performance of reverse leveraged buy-
outs. Journal of Financial Economics, 42 (3): 293-332.
Howorth, C., Westhead, P. and Wright, M. (2004) Buyouts, information asymmetry and
family management dyad. Journal of Business Venturing, 19 (4): 509-534.
Hribar, P. and Collins, D.W. (2002) Errors in estimating accruals: implications for empirical
research. Journal of Accounting Research, 40 (1): 105-134.
Jalilvand, A., Stewart, S.M. and Switzer, J.A. (1996) A synthesis on investment banker
reputation and pricing of initial public offerings: New evidence on reverse LBOs. Financial
Markets, Institutions and Instruments, 5 (5): 37-61.
Jelic, R. (2011) Staying power of UK buy-outs. Journal of Business Finance and Accounting,
38 (7): 945-986.
Jelic, R., Saadouni, B. and Wright, M. (2005). Performance of private to public MBOs: The
role of venture capital. Journal of Business Finance and Accounting, 32 (3): 643-681.
Jelic, R. and Wright, M. (2011) Exits, performance and late stage private equity: The case of
UK MBOs. European Financial Management, 17 (3): 560-593.
Jensen, M. (1986) Agency costs of free cash flow, corporate finance, and takeovers.
American Economic Review, 76 (2): 323-329.
Jensen, M. (1989) Eclipse of the public corporation. Harvard Business Review, 67 (5): 61-74.
Jensen, M. (1993) The modern industrial revolution: exit and the failure of internal control
systems. Journal of Finance, 48 (3):831-880
Jensen, M. (2010) Active investors, LBOs, and the privatization of bankruptcy. Journal of
Applied Corporate Finance, 22 (1): 34-44
Jensen, M. and Meckling, W. (1976) Theory of the firm, managerial behavior, agency costs
and ownership structure. Journal of Financial Economics, 3 (4): 305-360.
Jo, H. and Kim, Y. (2007) Disclosure frequency and earnings management. Journal of
Financial Economics, 84 (2): 561-590.
Jo, H., Kim, Y. and Park, M.S. (2007) Underwriter choice and earnings management:
evidence from seasoned offerings. Review of Accounting Studies, 12 (1): 23-59.
Jones, J.J. (1991) Earnings management during relief investigations. Journal of Accounting
Research, 29 (2): 193-228.

214
Jones, C.S. (1992) Accounting and organizational change: An empirical study of
management buy-outs. Accounting, Organizations and Society, 17 (2): 151-68.
Kaplan, S. (1989a) The effects of management buyouts on operating performance and value.
Journal of Financial Economics, 24 (2): 217-54.
Kaplan, S. (1989b) Management buyouts: Evidence on taxes as a source of value. The
Journal of Finance, 44 (3): 611-632.
Kaplan, S.N. (1991) The staying power of leveraged buyouts. Journal of Financial
Economics, 29 (2): 217-254.
Kaplan, S.N. and Schoar, A. (2005) Private equity performance: Returns, persistence, and
capital flows. Journal of Finance, 60 (4): 1791-1823.
Kaplan, S. and Strömberg, P. (2008) Leveraged buyouts and private equity. Journal of
Economic Perspectives, 22 (4): 121-146.
Katz, S.P. (2009) Earnings quality and ownership structure: The role of private equity
sponsors. The Accounting Review, 84 (3): 623-658.
Kitzmann, J. and Schiereck, D. (2009) A note on secondary buyouts-creating value or
recycling capital. iBusiness, 1 (2): 113-123.
Kothari, S.P., Leone, A.J. and Wasley, C.E. (2005) Performance matched discretionary
accrual measures. Journal of Accounting and Economics, 39 (1): 163-197.
Kvaal, E., Langli, J.C. and Abdolmohammadi, M. (2012) Earnings management priorities of
private family firms. Working Paper, Social Science Research Network.
Lang, L., Poulsen, A. and Stulz, R. (1995) Asset sales, firm performance, and the agency
costs of managerial discretion. Journal of Financial Economics, 37 (1): 3-37.
Lansberg, I. (1983) Managing human resources in family firms: The problem of institutional
overlap. Organizational Dynamics, 12 (1): 39-46.
Lee, G. and Masulis, R.W. (2011) Do more reputable financial institutions reduce earnings
management by IPO issuers? Journal of Corporate Finance, 17 (4): 982-1000.
Li, J., Zhang, L. and Zhou, J. (2006) Earnings management and delisting risk of initial public
offerings. Working Paper, Social Science Research Network.
Li, K. and Prabhala, N.R. (2005) Self-selection models in corporate finance. Working Paper,
Social Science Research Network.
Longstreth, B. (1983) Management buyouts: Are public shareholders getting a fair deal?
Remarks to the International Bar Association, Toronto, Canada.
Mao, Y. and Renneboog, L. (2013) Do managers manipulate earnings prior to management
buyouts? ECGI Working Paper Series in Finance.

215
Marais, L., Schipper, K. and Smith, A. (1989) Wealth effects of going private for senior
securities. Journal of Financial Economics, 23 (1): 155-191.
McNichols, M.F. (2000) Research design issues in earnings management studies. Journal of
Accounting and Public Policy, 19 (4-5): 313-345.
Megginson, W. and Weiss, K. (1991) Venture capitalist certification in initial public
offerings. Journal of Finance, 46 (3): 879-903.
Metrick, A. and Yasuda, A. (2010) The economics of private equity funds. Review of
Financial Studies, 23 (6): 2303-2341.
Meuleman, M., Amess, K., Wright, M., et al. (2009) Agency, strategic entrepreneurship and
the performance of private equity backed buyouts. Entrepreneurship Theory and Practice, 33
(1): 213-239.
Mian, S. and Rosenfeld, J. (1993) Takeover activity and the long run performance of reverse
leveraged buyouts. Financial Management, 22 (4): 46-57.
Miller, D., Le Breton-Miller, I., Lester, R. H., et al. (2007) Are family firms really superior
performers? Journal of Corporate Finance, 13 (5): 829-858.
Morsfield, S. and Tan, C. (2006) Do venture capitalists influence the decision to manage
earnings in initial public offerings? Accounting Review, 81 (5): 1119-1150.
Murphy, K.J. (1985) Corporate performance and managerial remuneration: an empirical
analysis. Journal of Accounting and Economics, 7 (1-3): 11-42.
Muscarella, C. and Vetsuypens, M. (1990) Efficiency and organisational structure: A study of
reverse LBOs. Journal of Finance, 45 (5): 1389-1413.
Nikoskelainen, E. and Wright, M. (2007) The impact of corporate governance mechanisms
on value increase in leveraged buy-outs. Journal of Corporate Finance, 13 (4): 511-537.
Opler, T.C. (1992) Operating performance in leveraged buyouts: Evidence from 1985-1989.
Financial Management, 21 (1): 27-34.
Opler, T.C. and Titman, S. (1993) The determinants of leveraged buyout activity: free cash
flow versus financial distress costs. Journal of Finance, 48 (5): 1985-1999.
Patell, J.M. (1976) Corporate forecasts of earnings per share and stock price behavior:
Empirical tests. Journal of Accounting Research, 14 (2): 246-276.
Perry, S. and Williams, T. (1994) Earnings management preceding management buyout
offers. Journal of Accounting and Economics, 18 (2): 157-179.
Prencipe, A., Markarian, G. and Pozza, L. (2008) Earnings management in family firms:
Evidence from R&D cost capitalization in Italy. Family Business Review, 21 (1): 71-88.
Rangan, S. (1998) Earnings management and the performance of seasoned equity offerings.
Journal of Financial Economics, 50 (1): 101-122.

216
Rao, G. R. (1993) The relation between stock retum and eamings: A study of newly-public
firms. Working Paper. University of Illinois at Urbana Champaign.
Relander, K., Syrjanen, A. and Miettinen, A. (1994) Analysis of trade sales as a venture
capital exit route, chapter 6 in Bygrave, W., Hay, M. and Peeters, J. (eds), Realizing
Investment Value, FT-Pitman, London.
Renneboog, L. and Simons, T. (2005) Public-to-private transactions: LBOs, MBOs, MBIs
and IBOs. Working Paper. Tilburg University.
Renneboog, L., Simons, T. and Wright, M. (2007) Why do public firms go private in the UK?
Journal of Corporate Finance, 13 (4): 591-628.
Robbie, K. and Wright, M. (1995) Managerial and ownership succession and corporate
restructuring: the case of management buy-ins. Journal of Management Studies, 32 (4): 527-
549.
Robbie, K. and Wright, M. (1996) Management buy-ins: entrepreneurship, active investors
and corporate restructuring. Manchester University Press.
Rudisuli, R. (2005) Value creation of spin-offs and carve-outs. Doctoral Dissertation,
University of Basel, Switzerland.
Sahlman, W. (1988) Aspects of financial contracting in venture capital. Journal of Applied
Corporate Finance, 1 (2): 23-36.
Salvato, C. and Moores, K. (2010) Research on accounting in family firms: Past
accomplishments and future challenges. Family Business Review, 23 (3): 193-215.
Samuelson, R. J. (2007) The private equity boom. The Washington Post. 15th
March.
Scholes, L., Westhead, P. and Burrows, A. (2008) Family firm succession: the management
buy-out and buy-in routes. Journal of Small Business and Enterprise Development, 15 (1): 8-
30.
Scholes, L. and Wright, M. (2009) Leveraged buyouts and recession. CMBOR Paper Series.
Schulze, W.S., Lubatkin, M. and Dino, R.N. (2003) Exploring the agency consequences of
ownership dispersion among the directors of private family firms. Academy of Management
Journal, 45 (2): 179-194.
Schulze, W.S., Lubatkin, M.H., Dino, R.N., et al. (2001). Agency relationships in family
firms: Theory and evidence. Organization Science, 12 (2): 99-116.
Schwienbacher, A. (2002) An empirical analysis of venture capital exits in Europe and in the
United States. Working Paper. University of California at Berkeley.
Sciascia, S. and Mazzola, P. (2008) Family involvement in ownership and management:
Exploring nonlinear effects on performance. Family Business Review, 21 (4): 331-345.

217
Shefrin, H. and Statman, M. (1985) The disposition to sell winners too early and ride losers
too long: Theory and evidence. Journal of Finance, 40 (3): 777-790.
Shiller, R. (1988) Initial public offerings: Investor behavior and underpricing. Working
Paper. National Bureau of Economic Research.
Shleifer, A. and Summers, C.H. (1988) Breach of trust in hostile takeovers. Chapter 2 in
Auerbach, A.J., ed., Corporate takeovers: causes and consequences, Chicago: University of
Chicago Press.
Smith A. (1990) Corporate ownership structure and performance: The case of management
buyouts. Journal of Financial Economics, 27 (1): 143-164.
Sommer, A.A. (1974) Going private: a lesson in corporate responsibility. Law Advisory
Council Lecture Notre Dame Law School, South Bend, Indiana.
Sormani, A. (2002) Exits: The IPO alternative, in EVJC, 20–23, November.
Sousa, M. (2010) Why do private equity firms sell to each other? Working Paper. Social
Science Research Network.
Stein, J. (1989) Efficient capital markets, inefficient firms: A model of myopic corporate
behavior. Quarterly Journal of Economics, 104 (4): 655-669.
Stockmans, A., Lybaert, N. and Voordeckers, W. (2010) Socioemotional wealth and earnings
management in private family firms. Family Business Review, 23 (3): 280-294.
Strömberg, P. (2008) The new demography of private equity. The Global Impact of Private
Equity Report 2008, 3-26.
Stulz, R. (1988) Managerial control of voting rights: Financing policies and the market for
corporate control. Journal of Financial Economics, 20 (1): 25-54.
Sudarsanam, S. and Nwaghodoh, U. (2005) Exit strategy for UK leveraged buyouts:
Empirical evidence on determinants. Working Paper, Social Science Research Network.
Teoh, S.H., Welch, I. and Wong, T.J. (1998a) Earnings management and the long run
performance of initial public offerings. Journal of Finance, 53 (6): 1935-1974.
Teoh, S.H., Welch, I. and Wong, T.J. (1998b) Earnings management and the under-
performance of seasoned equity offerings. Journal of Financial Economics, 50 (1): 63-99.
Vanacker, T., Seghers, A. and Manigart, S. (2011) Follow-on financing of venture capital-
backed companies. Handbook of Entrepreneurial Finance, Douglas J. Cumming, ed., Oxford
University Press.
Wang, C. (2010) Does the monitoring role of buyout houses improve discretionary accruals
quality? Accounting and Finance, 50 (4): 993-1012.
Wang, Y. (2012) Secondary Buyouts: Why buy and at what price? Journal of Corporate
Finance, 18 (5): 1306-1325.

218
Wang, Y. and Poutziouris, P. (2010) Entrepreneurial risk taking: empirical evidence from UK
family firms. International Journal of Entrepreneurial Behaviour & Research, 16 (5): 370-
388.
Weir, C., Jones, P. and Wright, M. (2008) Public-to-private transactions, private equity and
performance in the UK: an empirical analysis of the impact of going private. Working Paper.
Social Science Research Network.
Westhead, P. (1997) Ambitions, external environment and strategic factor differences
between family and non-family companies. Entrepreneurship and Regional Development, 9
(2): 127-157.
Westhead, P. and Howorth, C. (2006) Ownership and management issues associated with
family firm performance and company objectives. Family Business Review, 19 (4): 301-316.
Wilson, N., Wright, M. and Scholes, L. (2013) Family business survival and the role of
boards. Entrepreneurship Theory and Practice, 37 (6): 1369-1389.
Wongsunwai, W. (2013) The effect of external monitoring on accrual-based and real earnings
management: Evidence from venture-backed initial public offerings. Contemporary
Accounting Research, 30 (1): 296-324.
Wright, M., Chiplin, B., Thompson, S., et al. (1990) Management buy-outs and large-small
firm relationships. Management International Review, 30 (1): 55-72.
Wright, M., Gilligan, J. and Amess, K. (2009) The economic impact or private equity: what
we know and what we would like to know. Venture Capital, 11 (1): 1-21.
Wright, M., Hoskisson, R. and Busenitz, L. (2001) Firm rebirth: Buyouts as facilitators of
strategic growth and entrepreneurship. Academy of Management Executive, 15 (1): 111-125.
Wright, M., Hoskisson, R., Busenitz, L., et al. (2000) Entrepreneurial growth through
privatization: The upside of management buy-outs. Academy of Management Review, 25 (3):
591-601.
Wright, M., Robbie, K. and Albrighton, M. (2000) Secondary management buy-outs and buy-
ins. International Journal of Entrepreneurial Behaviour & Research, 6 (1): 21-40.
Wright, M., Robbie, K., Steve, T., et al. (1994) Longevity and the life cycle of management
buyouts. Strategic Management Journal, 15 (3): 215-227.
Wright, M., Thompson, S., Chiplin, B., et al. (1993) Harvesting, longevity and the life-cycle
of management buy-outs: A four country study, in W. Bygrave, M, Hay and J, Peters (eds).
Harvesting Venture Capital Investments: IPOS, Buy-outs and Trade Sales (FT-Pitman).
Wright, M., Thompson, S. and Robbie, K. (1992) Venture capital and management-led,
leveraged buy-outs: An European perspective. Journal of Business Venturing, 7(1): 47-71.
Wright, M., Thompson, S., Robbie, K., et al. (1995) Management buy-outs in the short and
long term. Journal of Business Finance and Accounting, 22 (4): 461-483.

219
Wu, W.Y. (1997) Management buyouts and earnings management. Journal of Accounting,
Auditing & Finance, 12 (4): 373-389.
Zahra, S.A. (2005) Entrepreneurial risk taking in family firms. Family Business Review, 18
(1): 23-40.
Zhou, D., Jelic, R. and Wright, M. (2014) SMBOs: buying time or improving performance?
Managerial and Decision Economics, 35 (2): 88-102.
Zingales, L. (1995) Insider ownership and the decision to go public. Review of Economics
Studies, 62 (3): 425-448.


