EMPIRE ENERGY GROUP LIMITED · The hydraulic fracturing moratorium in New York State to be lifted...
16
ACHIEVING SIGNIFICANCE IN THE OIL & GAS INDUSTRY Update - March 2012 1 EMPIRE ENERGY GROUP LIMITED www.empireenergygroup.net
Transcript of EMPIRE ENERGY GROUP LIMITED · The hydraulic fracturing moratorium in New York State to be lifted...
ACHIEVING SIGNIFICANCE IN THE OIL & GAS INDUSTRY
Update - March 2012
1
EMPIRE ENERGY GROUP LIMITED www.empireenergygroup.net
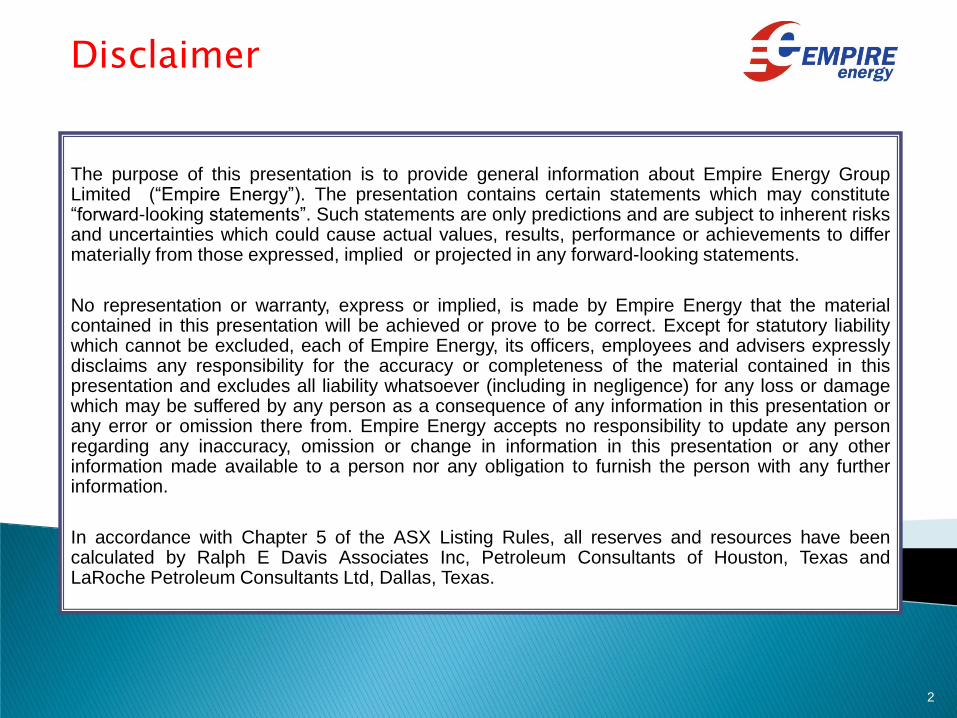
The purpose of this presentation is to provide general information about Empire Energy Group Limited (“Empire Energy”). The presentation contains certain statements which may constitute “forward-looking statements”. Such statements are only predictions and are subject to inherent risks and uncertainties which could cause actual values, results, performance or achievements to differ materially from those expressed, implied or projected in any forward-looking statements.
No representation or warranty, express or implied, is made by Empire Energy that the material contained in this presentation will be achieved or prove to be correct. Except for statutory liability which cannot be excluded, each of Empire Energy, its officers, employees and advisers expressly disclaims any responsibility for the accuracy or completeness of the material contained in this presentation and excludes all liability whatsoever (including in negligence) for any loss or damage which may be suffered by any person as a consequence of any information in this presentation or any error or omission there from. Empire Energy accepts no responsibility to update any person regarding any inaccuracy, omission or change in information in this presentation or any other information made available to a person nor any obligation to furnish the person with any further information.
In accordance with Chapter 5 of the ASX Listing Rules, all reserves and resources have been calculated by Ralph E Davis Associates Inc, Petroleum Consultants of Houston, Texas and LaRoche Petroleum Consultants Ltd, Dallas, Texas.
Disclaimer
2
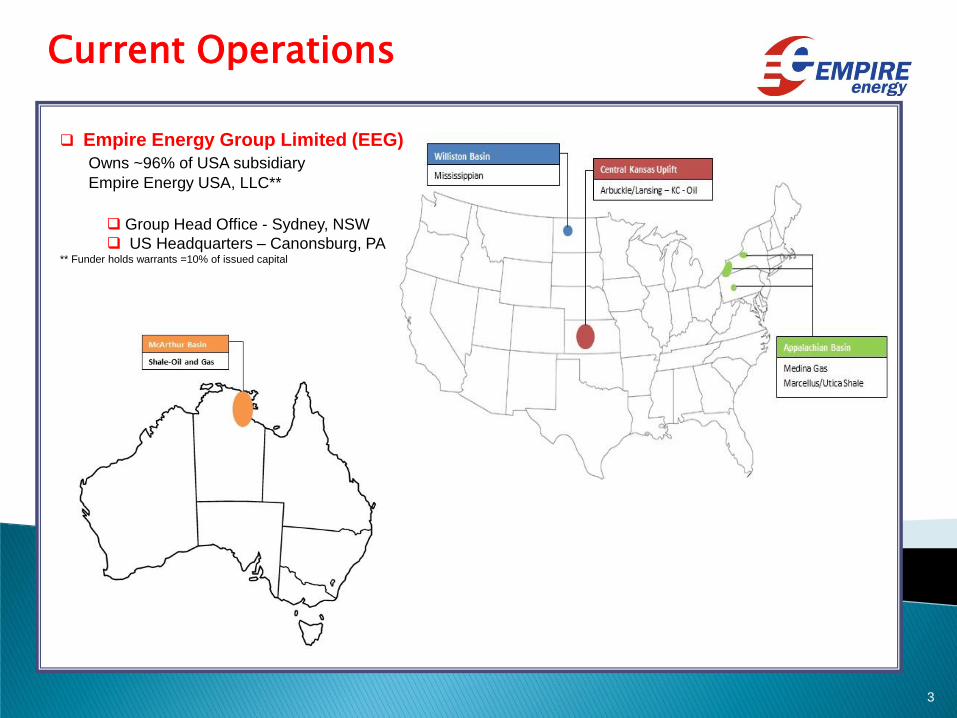
Current Operations
3
Empire Energy Group Limited (EEG)
Owns ~96% of USA subsidiary
Empire Energy USA, LLC**
Group Head Office - Sydney, NSW
US Headquarters – Canonsburg, PA ** Funder holds warrants =10% of issued capital
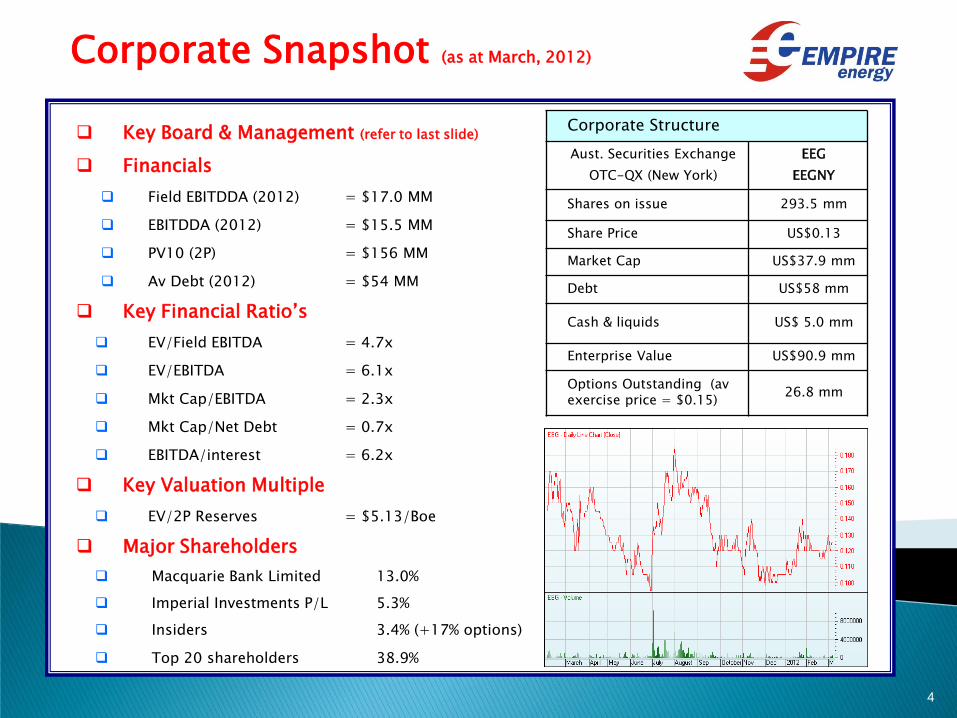
Key Board & Management (refer to last slide)
Financials
Field EBITDDA (2012) = $17.0 MM
EBITDDA (2012) = $15.5 MM
PV10 (2P) = $156 MM
Av Debt (2012) = $54 MM
Key Financial Ratio’s
EV/Field EBITDA = 4.7x
EV/EBITDA = 6.1x
Mkt Cap/EBITDA = 2.3x
Mkt Cap/Net Debt = 0.7x
EBITDA/interest = 6.2x
Key Valuation Multiple
EV/2P Reserves = $5.13/Boe
Major Shareholders
Macquarie Bank Limited 13.0%
Imperial Investments P/L 5.3%
Insiders 3.4% (+17% options)
Top 20 shareholders 38.9%
Corporate Snapshot (as at March, 2012)
4
Corporate Structure
Aust. Securities Exchange
OTC-QX (New York)
EEG
EEGNY
Shares on issue 293.5 mm
Share Price US$0.13
Market Cap US$37.9 mm
Debt US$58 mm
Cash & liquids US$ 5.0 mm
Enterprise Value US$90.9 mm
Options Outstanding (av exercise price = $0.15)
26.8 mm
Central Kansas Uplift
Field operations based in Wichita, KS
Operating ~256 wells
Commenced drilling program June 2011
FY 12 - budget includes 10 development wells and 5 polymer recompletions
Well target:– 30-40 Boe/d; EUR +50,000 Bbl/well
Seeking opportunities to book new 1P & 2P reserves by:
Reviewing existing assets and targeting formations (behind pipe)
Identifying new assets for farm-in or acquisition of development acreage
Appalachia
Operating ~1,800 wells
Continuing program to upgrade transportation network
Expect increased production through improved operational efficiencies
Marcellus and Utica exploratory programs being implemented
McArthur Basin - Australia
Early stage exploration – 14.5 million acres black shale targeting +12Tcfe
Corporate
Continue development of on-line management systems
US operations centralised in Pittsburgh, PA
Operations
5
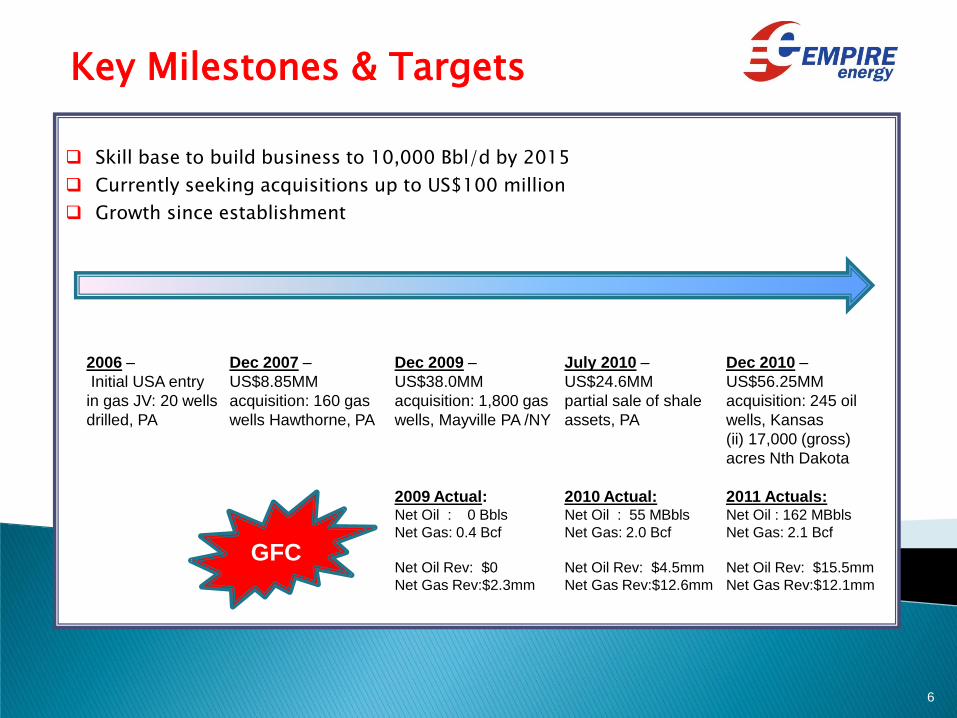
Key Milestones & Targets
6
Skill base to build business to 10,000 Bbl/d by 2015
Currently seeking acquisitions up to US$100 million
Growth since establishment
2006 –
Initial USA entry
in gas JV: 20 wells
drilled, PA
Dec 2007 –
US$8.85MM
acquisition: 160 gas
wells Hawthorne, PA
Dec 2009 –
US$38.0MM
acquisition: 1,800 gas
wells, Mayville PA /NY
2009 Actual: Net Oil : 0 Bbls
Net Gas: 0.4 Bcf
Net Oil Rev: $0
Net Gas Rev:$2.3mm
July 2010 –
US$24.6MM
partial sale of shale
assets, PA
2010 Actual: Net Oil : 55 MBbls
Net Gas: 2.0 Bcf
Net Oil Rev: $4.5mm
Net Gas Rev:$12.6mm
Dec 2010 –
US$56.25MM
acquisition: 245 oil
wells, Kansas
(ii) 17,000 (gross)
acres Nth Dakota
2011 Actuals: Net Oil : 162 MBbls
Net Gas: 2.1 Bcf
Net Oil Rev: $15.5mm
Net Gas Rev:$12.1mm
GFC
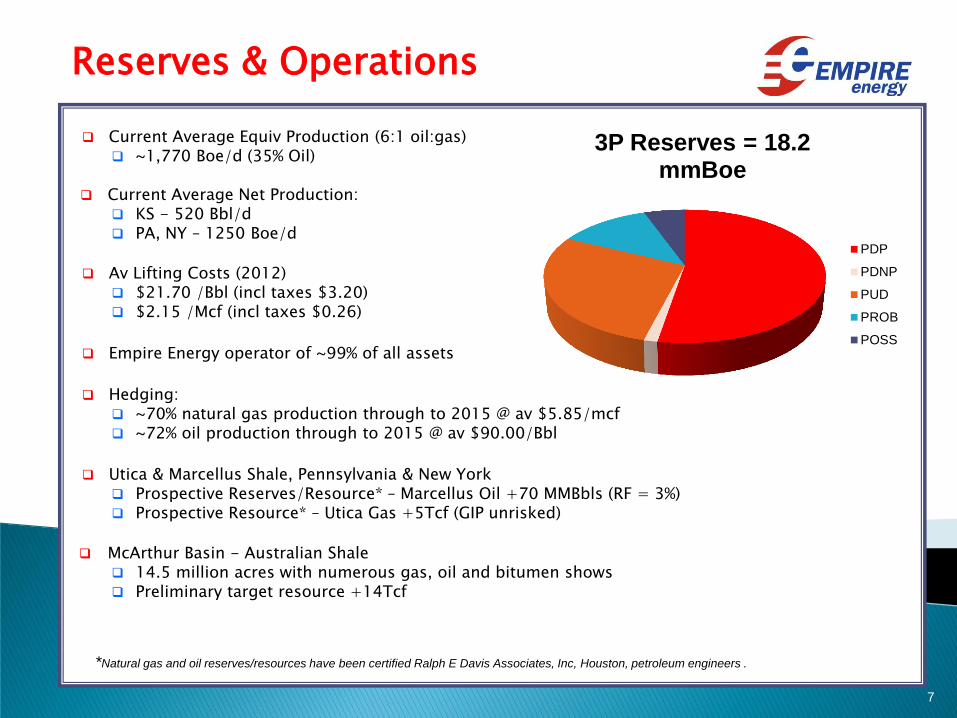
Current Average Equiv Production (6:1 oil:gas) ~1,770 Boe/d (35% Oil)
Current Average Net Production:
KS - 520 Bbl/d PA, NY – 1250 Boe/d
Av Lifting Costs (2012) $21.70 /Bbl (incl taxes $3.20) $2.15 /Mcf (incl taxes $0.26)
Empire Energy operator of ~99% of all assets
Hedging: ~70% natural gas production through to 2015 @ av $5.85/mcf ~72% oil production through to 2015 @ av $90.00/Bbl
Utica & Marcellus Shale, Pennsylvania & New York Prospective Reserves/Resource* – Marcellus Oil +70 MMBbls (RF = 3%) Prospective Resource* – Utica Gas +5Tcf (GIP unrisked)
McArthur Basin - Australian Shale 14.5 million acres with numerous gas, oil and bitumen shows Preliminary target resource +14Tcf
Reserves & Operations
*Natural gas and oil reserves/resources have been certified Ralph E Davis Associates, Inc, Houston, petroleum engineers .
7
3P Reserves = 18.2 mmBoe
PDP
PDNP
PUD
PROB
POSS
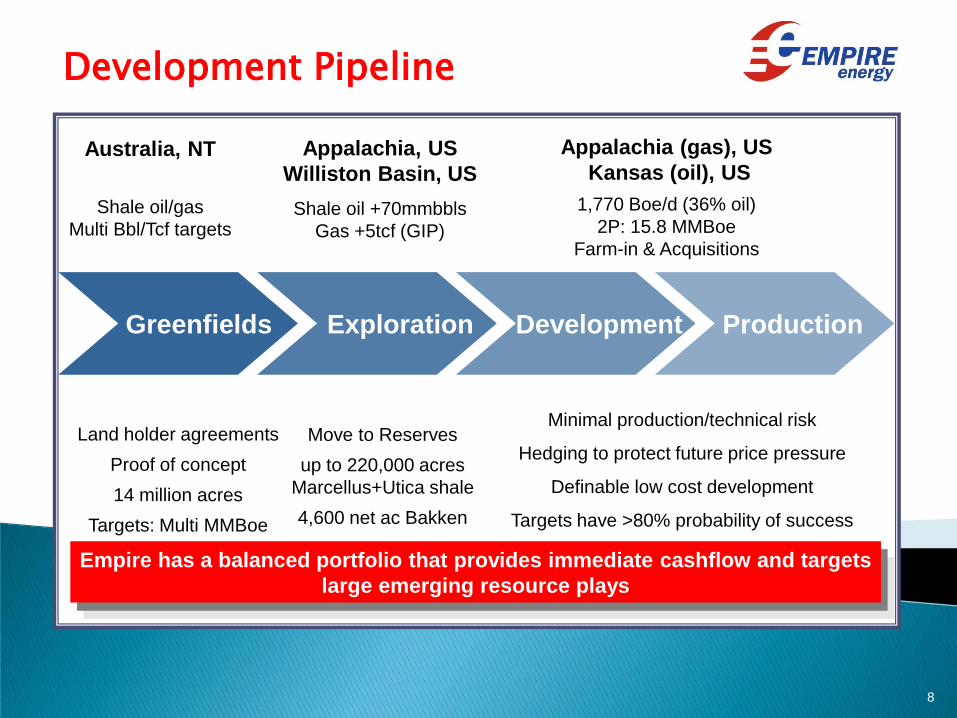
Development Pipeline
Empire has a balanced portfolio that provides immediate cashflow and targets
large emerging resource plays
Greenfields Exploration Development Production
Australia, NT
Shale oil/gas
Multi Bbl/Tcf targets
Appalachia, US
Williston Basin, US
Shale oil +70mmbbls
Gas +5tcf (GIP)
Appalachia (gas), US
Kansas (oil), US
1,770 Boe/d (36% oil)
2P: 15.8 MMBoe
Farm-in & Acquisitions
Land holder agreements
Proof of concept
14 million acres
Targets: Multi MMBoe
Move to Reserves
up to 220,000 acres
Marcellus+Utica shale
4,600 net ac Bakken
Minimal production/technical risk
Hedging to protect future price pressure
Definable low cost development
Targets have >80% probability of success
8
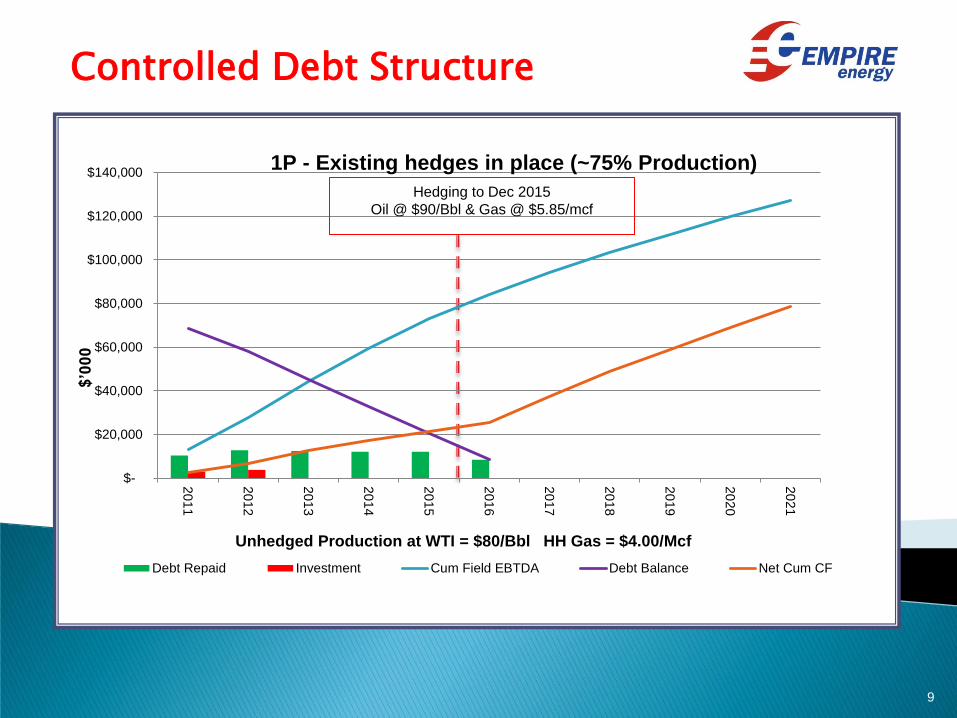
Controlled Debt Structure
9
$’000
$-
$20,000
$40,000
$60,000
$80,000
$100,000
$120,000
$140,000
20
11
20
12
20
13
20
14
20
15
20
16
20
17
20
18
20
19
20
20
20
21
Debt Repaid Investment Cum Field EBTDA Debt Balance Net Cum CF
Hedging to Dec 2015
Oil @ $90/Bbl & Gas @ $5.85/mcf
Unhedged Production at WTI = $80/Bbl HH Gas = $4.00/Mcf
1P - Existing hedges in place (~75% Production)
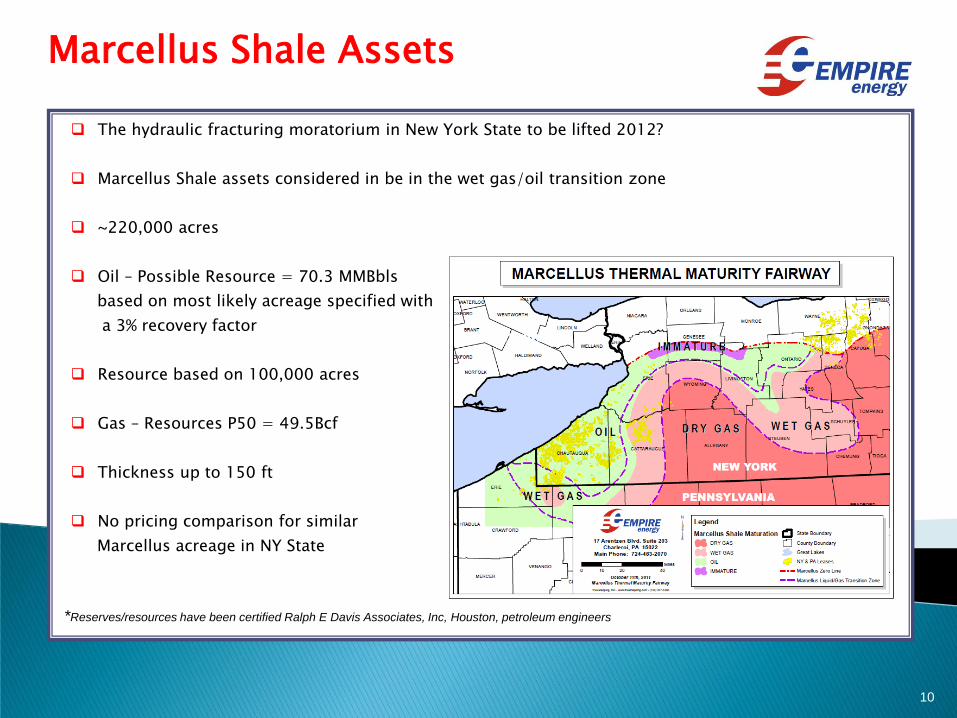
The hydraulic fracturing moratorium in New York State to be lifted 2012?
Marcellus Shale assets considered in be in the wet gas/oil transition zone
~220,000 acres
Oil – Possible Resource = 70.3 MMBbls
based on most likely acreage specified with
a 3% recovery factor
Resource based on 100,000 acres
Gas – Resources P50 = 49.5Bcf
Thickness up to 150 ft
No pricing comparison for similar
Marcellus acreage in NY State
Marcellus Shale Assets
10
*Reserves/resources have been certified Ralph E Davis Associates, Inc, Houston, petroleum engineers
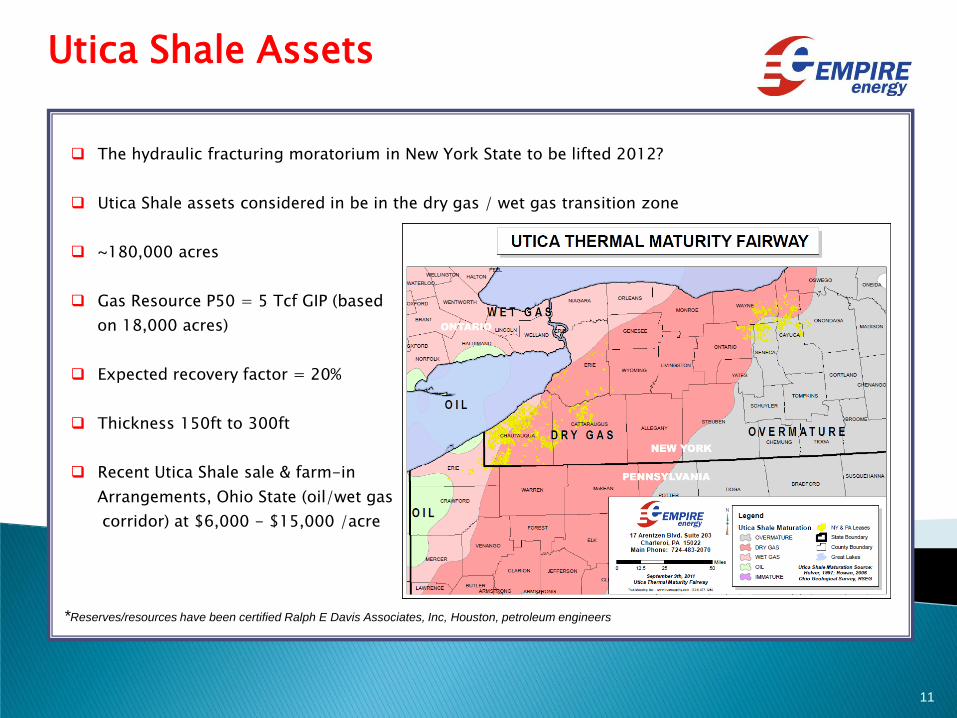
The hydraulic fracturing moratorium in New York State to be lifted 2012?
Utica Shale assets considered in be in the dry gas / wet gas transition zone
~180,000 acres
Gas Resource P50 = 5 Tcf GIP (based
on 18,000 acres)
Expected recovery factor = 20%
Thickness 150ft to 300ft
Recent Utica Shale sale & farm-in
Arrangements, Ohio State (oil/wet gas
corridor) at $6,000 - $15,000 /acre
Utica Shale Assets
11
*Reserves/resources have been certified Ralph E Davis Associates, Inc, Houston, petroleum engineers
12
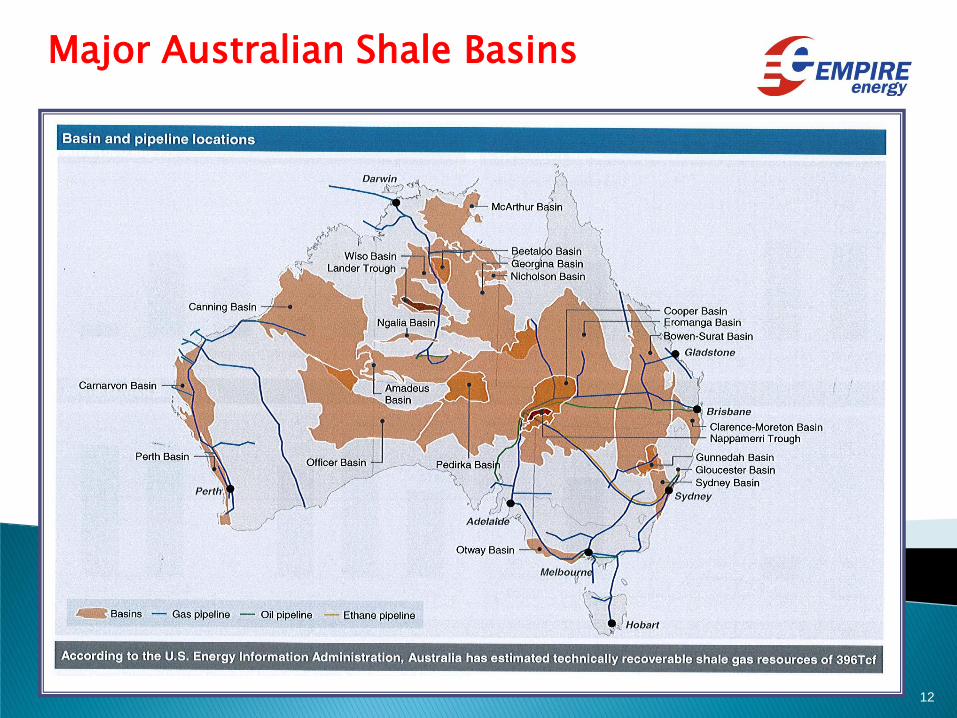
Major Australian Shale Basins
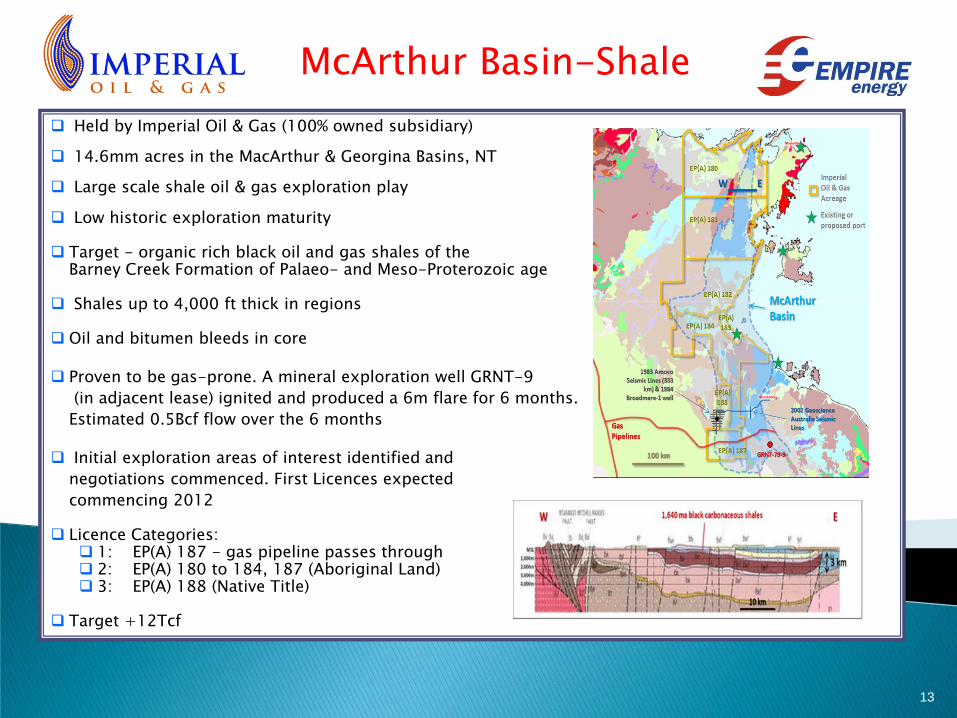
Held by Imperial Oil & Gas (100% owned subsidiary)
14.6mm acres in the MacArthur & Georgina Basins, NT
Large scale shale oil & gas exploration play
Low historic exploration maturity
Target - organic rich black oil and gas shales of the Barney Creek Formation of Palaeo- and Meso-Proterozoic age
Shales up to 4,000 ft thick in regions
Oil and bitumen bleeds in core
Proven to be gas-prone. A mineral exploration well GRNT-9
(in adjacent lease) ignited and produced a 6m flare for 6 months.
Estimated 0.5Bcf flow over the 6 months
Initial exploration areas of interest identified and
negotiations commenced. First Licences expected
commencing 2012
Licence Categories: 1: EP(A) 187 - gas pipeline passes through 2: EP(A) 180 to 184, 187 (Aboriginal Land) 3: EP(A) 188 (Native Title)
Target +12Tcf
McArthur Basin-Shale
13
14
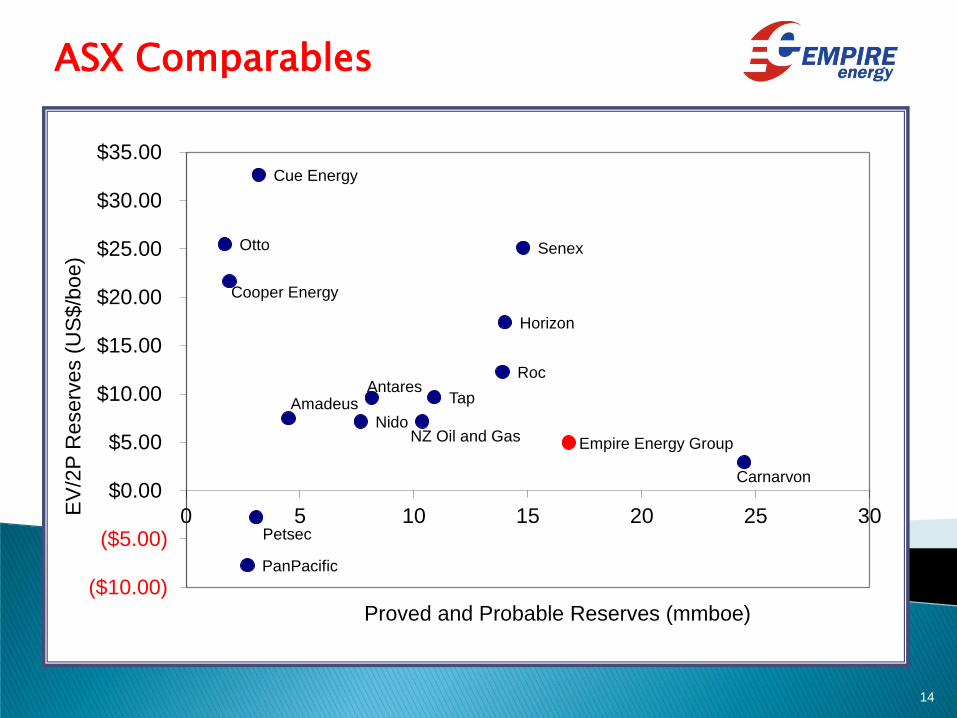
ASX Comparables
14
Cooper Energy
Cue Energy
Carnarvon
Horizon
Nido NZ Oil and Gas
Otto
PanPacific
Roc
Senex
Tap
Empire Energy Group
Amadeus Antares
Petsec
($10.00)
($5.00)
$0.00
$5.00
$10.00
$15.00
$20.00
$25.00
$30.00
$35.00
0 5 10 15 20 25 30EV
/2P
Reserv
es (
US
$/b
oe)
Proved and Probable Reserves (mmboe)
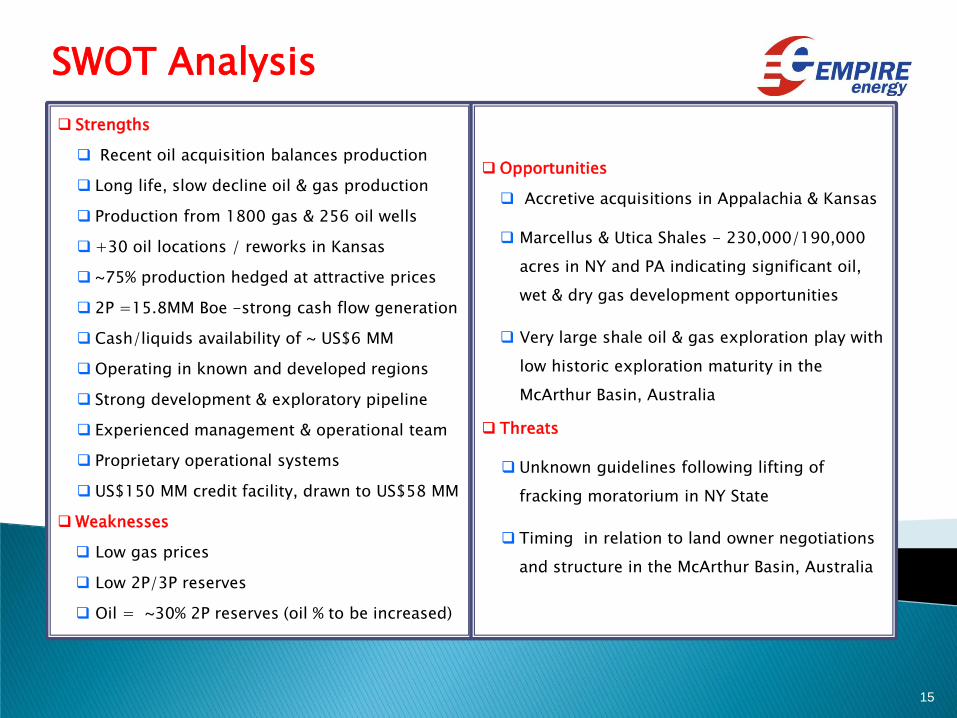
SWOT Analysis
15
Strengths
Recent oil acquisition balances production
Long life, slow decline oil & gas production
Production from 1800 gas & 256 oil wells
+30 oil locations / reworks in Kansas
~75% production hedged at attractive prices
2P =15.8MM Boe -strong cash flow generation
Cash/liquids availability of ~ US$6 MM
Operating in known and developed regions
Strong development & exploratory pipeline
Experienced management & operational team
Proprietary operational systems
US$150 MM credit facility, drawn to US$58 MM
Weaknesses
Low gas prices
Low 2P/3P reserves
Oil = ~30% 2P reserves (oil % to be increased)
Opportunities
Accretive acquisitions in Appalachia & Kansas
Marcellus & Utica Shales - 230,000/190,000
acres in NY and PA indicating significant oil,
wet & dry gas development opportunities
Very large shale oil & gas exploration play with
low historic exploration maturity in the
McArthur Basin, Australia
Threats
Unknown guidelines following lifting of
fracking moratorium in NY State
Timing in relation to land owner negotiations
and structure in the McArthur Basin, Australia
Bruce W McLeod - Executive Chairman & CEO, B.Sc (Maths), M.Com (Econ) - extensive experience in the Australian Corporate and Resource Capital markets. Over the past 20 years he has been involved in the acquisition and rationalisation of listed and unlisted companies, as well as raising debt and equity capital for projects and companies. Prior to this he spent six years with the Bank of America subsidiary BA Australia Limited, where he was Executive Director, responsible for the financial and capital markets operations.
David Sutton – Non Executive Director Kevin Torpey – Non Executive Director
Dr John Warburton –Director & CEO Imperial Oil & Gas Pty Ltd, FGS, MAICD - 27 years of technical and leadership
experience in International Petroleum E&P including 11 years with BP and 4 years as General Manager Exploration & New Business for LASMO-ENI in Pakistan. John's petroleum expertise covers the Middle East, Kazakhstan, Azerbaijan, North & West Africa, Pakistan, Europe, Australia, New Zealand, PNG, SE Asia, China, Korea and Japan. He has published 28 internationally recognised technical articles with particular focus on petroleum exploration in complex fold and thrust belts.
Al Boyer – SVP & COO - involved in the natural gas business for +40 years. Operates over 40 privately owned wells. In early 2000’s involved in a well drilling program (200 wells in 20 months) and the consolidation of field operations for Somerset Oil & Gas Inc until its takeover by EOG Resources. Has drilled 1,000’s of wells in western PA, NY, OH and WV.
Rob Kramer - VP - Mid Continent Operations, B.Sc (Ind. Eng) - responsible for the Company’s Mid-Continent operations in Kansas and North Dakota. Prior to joining Empire Energy Rob was a Completions and Production Engineer for Anshutz Exploration Corp, USA. Prior to that Rob played a key role in the establishment of Sanjel (USA) Inc in the Mid Continent where he was Lead Engineer for well design including cementing, fracturing, acidizing as well as coil tubing operations. Rob began his E&P engineering career with Schlumberger where he was a Field Engineer for Well Stimulation Services
Tim Hull - VP – Appalachia Operations – responsible for Appalachian operations. Tim has been involved in the North Eastern US natural gas industry for over 20 years. He is a director member of IOGA (New York).
Tony Crisafio – CFO - serves as Contract Chief Financial Officer. Tony is an independent business consultant, providing financial and operational advice to 8 businesses. Prior, Tony was the Chief Operating Officer to Cinema World, Inc. and a Partner with Ernst & Young. Tony is also a Director and Chairman of the Audit Committee of Petroleum Development Corporation Inc, an E&P company with operations in the Appalachians, Michigan and the Rocky Mountain Region.
Board & Management
16