EMPERICAL INVESTIGATION OF ENERGY POVERTY IN JAPAN A ...
22
Amin Nazarahari , Behrooz Asgari, Koji Tokimatsu EMPERICAL INVESTIGATION OF ENERGY POVERTY IN JAPAN – A CATEGORICAL COMPARISON OF HOUSEHOLDS 1 st IAEE Online Conference Concurrent Session 9: Energy Poverty Parallel Room 9
Transcript of EMPERICAL INVESTIGATION OF ENERGY POVERTY IN JAPAN A ...
Amin Nazarahari, Behrooz Asgari, Koji Tokimatsu
EMPERICAL INVESTIGATION OF ENERGY POVERTY IN JAPAN –
A CATEGORICAL COMPARISON OF HOUSEHOLDS
1st IAEE Online Conference Concurrent Session 9: Energy Poverty
Parallel Room 9
2
Table of Contents
• Introduction
• Literature Review + Research Question & Focus
• Methodology (Original Survey)
• Results
• Conclusion
2Introduction Literature Review Methods Results Conclusion
3
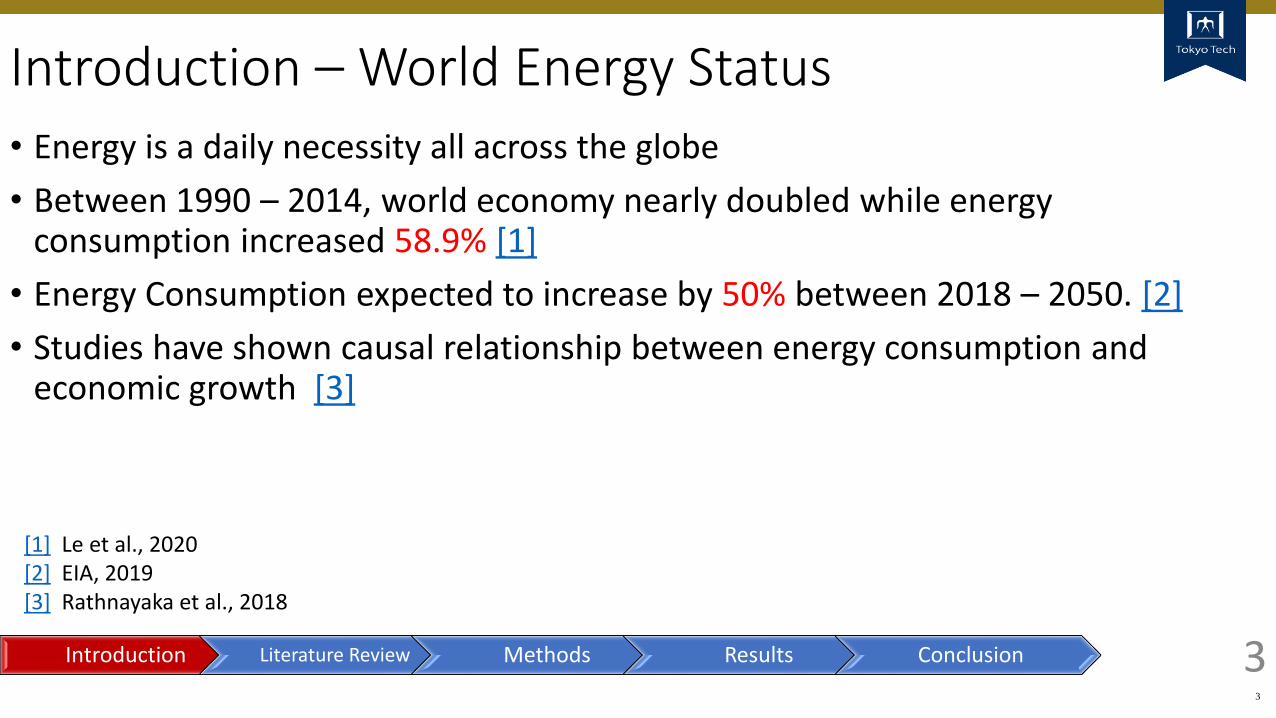
Introduction – World Energy Status• Energy is a daily necessity all across the globe
• Between 1990 – 2014, world economy nearly doubled while energy consumption increased 58.9% [1]
• Energy Consumption expected to increase by 50% between 2018 – 2050. [2]
• Studies have shown causal relationship between energy consumption and economic growth [3]
3
[1] Le et al., 2020[2] EIA, 2019[3] Rathnayaka et al., 2018
Introduction Literature Review Methods Results Conclusion
4
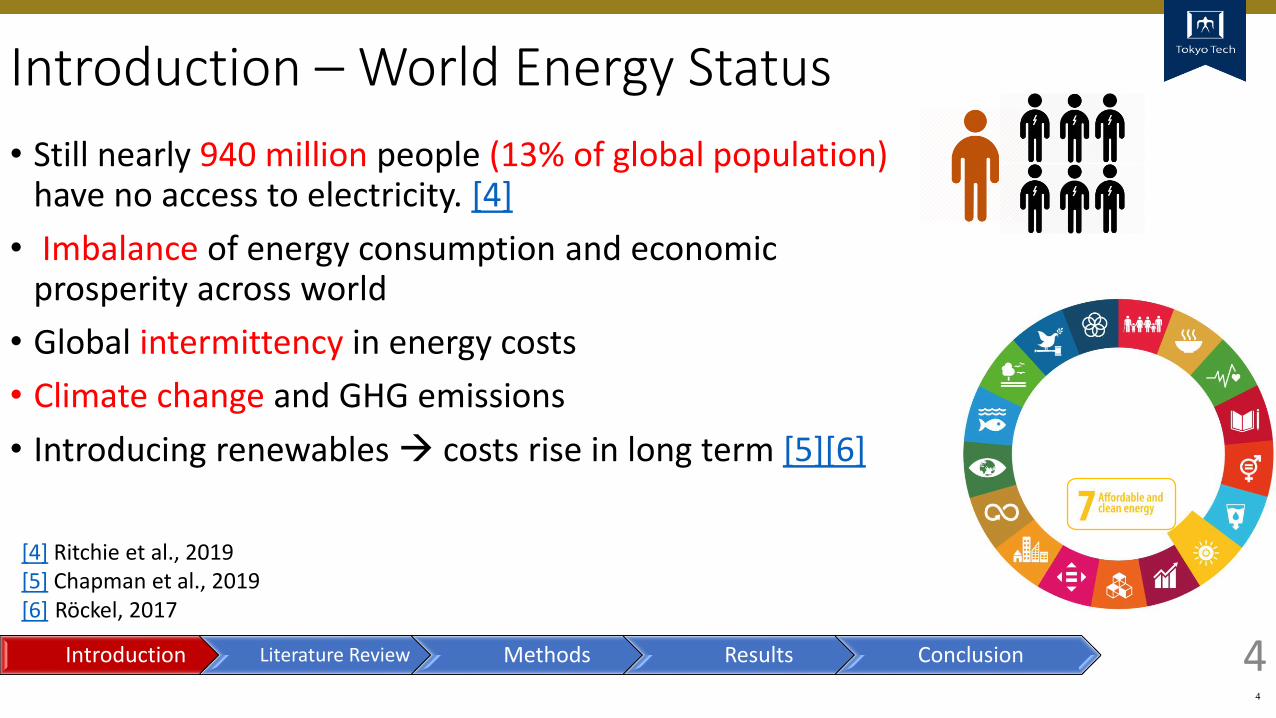
Introduction – World Energy Status
• Still nearly 940 million people (13% of global population) have no access to electricity. [4]
• Imbalance of energy consumption and economic prosperity across world
• Global intermittency in energy costs
• Climate change and GHG emissions
• Introducing renewables → costs rise in long term [5][6]
4
[4] Ritchie et al., 2019[5] Chapman et al., 2019[6] Röckel, 2017
Inclusive in comparison
Introduction Literature Review Methods Results Conclusion
5
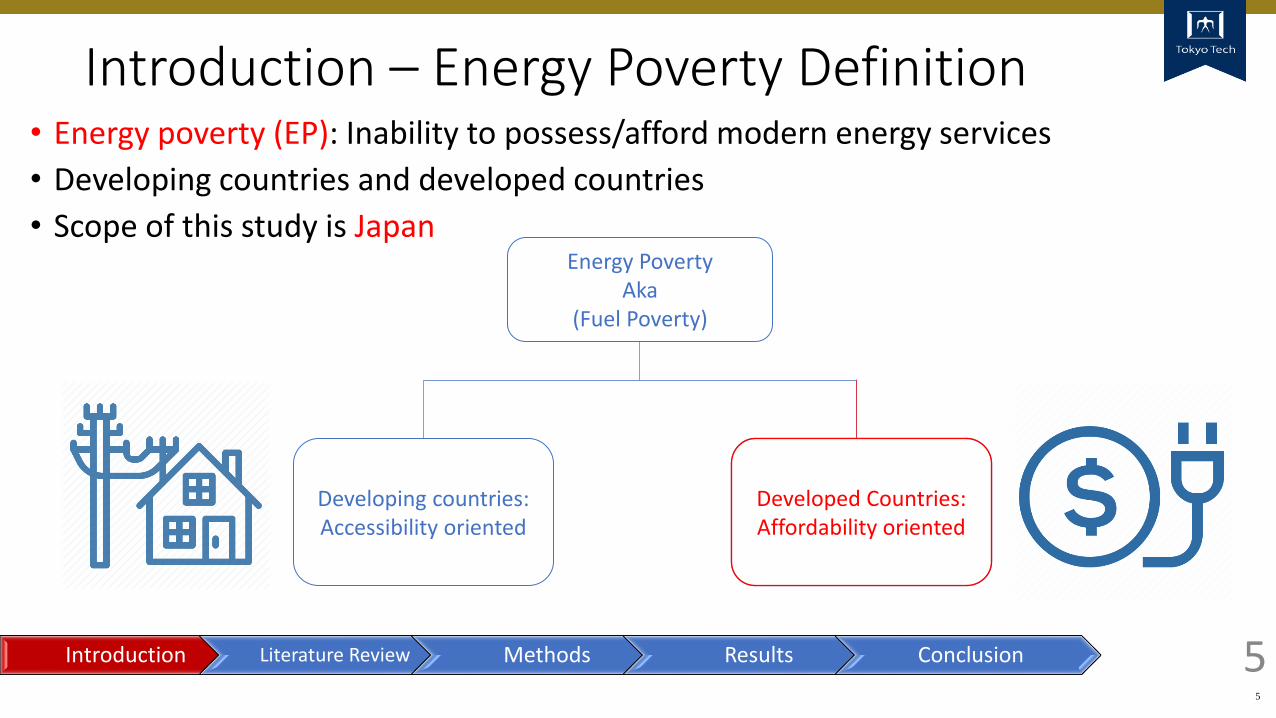
• Energy poverty (EP): Inability to possess/afford modern energy services
• Developing countries and developed countries
• Scope of this study is Japan
5
Introduction – Energy Poverty Definition
Developing countries: Accessibility oriented
Developed Countries: Affordability oriented
Energy PovertyAka
(Fuel Poverty)
Introduction Literature Review Methods Results Conclusion
Developed Countries: Affordability oriented
6
6
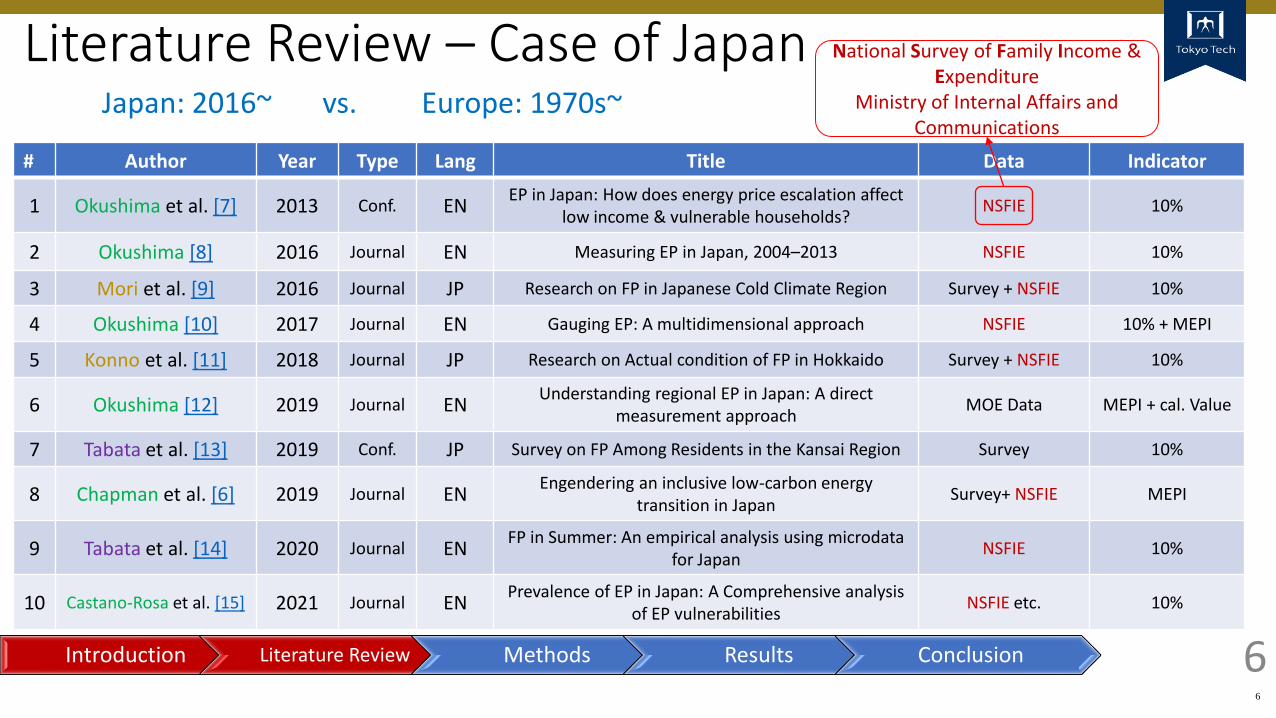
Literature Review – Case of Japan
# Author Year Type Lang Title Data Indicator
1 Okushima et al. [7] 2013 Conf. ENEP in Japan: How does energy price escalation affect
low income & vulnerable households?NSFIE 10%
2 Okushima [8] 2016 Journal EN Measuring EP in Japan, 2004–2013 NSFIE 10%
3 Mori et al. [9] 2016 Journal JP Research on FP in Japanese Cold Climate Region Survey + NSFIE 10%
4 Okushima [10] 2017 Journal EN Gauging EP: A multidimensional approach NSFIE 10% + MEPI
5 Konno et al. [11] 2018 Journal JP Research on Actual condition of FP in Hokkaido Survey + NSFIE 10%
6 Okushima [12] 2019 Journal ENUnderstanding regional EP in Japan: A direct
measurement approachMOE Data MEPI + cal. Value
7 Tabata et al. [13] 2019 Conf. JP Survey on FP Among Residents in the Kansai Region Survey 10%
8 Chapman et al. [6] 2019 Journal ENEngendering an inclusive low-carbon energy
transition in JapanSurvey+ NSFIE MEPI
9 Tabata et al. [14] 2020 Journal ENFP in Summer: An empirical analysis using microdata
for JapanNSFIE 10%
10 Castano-Rosa et al. [15] 2021 Journal ENPrevalence of EP in Japan: A Comprehensive analysis
of EP vulnerabilitiesNSFIE etc. 10%
National Survey of Family Income & Expenditure
Ministry of Internal Affairs and Communications
Introduction Literature Review Methods Results Conclusion
Japan: 2016~ vs. Europe: 1970s~
7
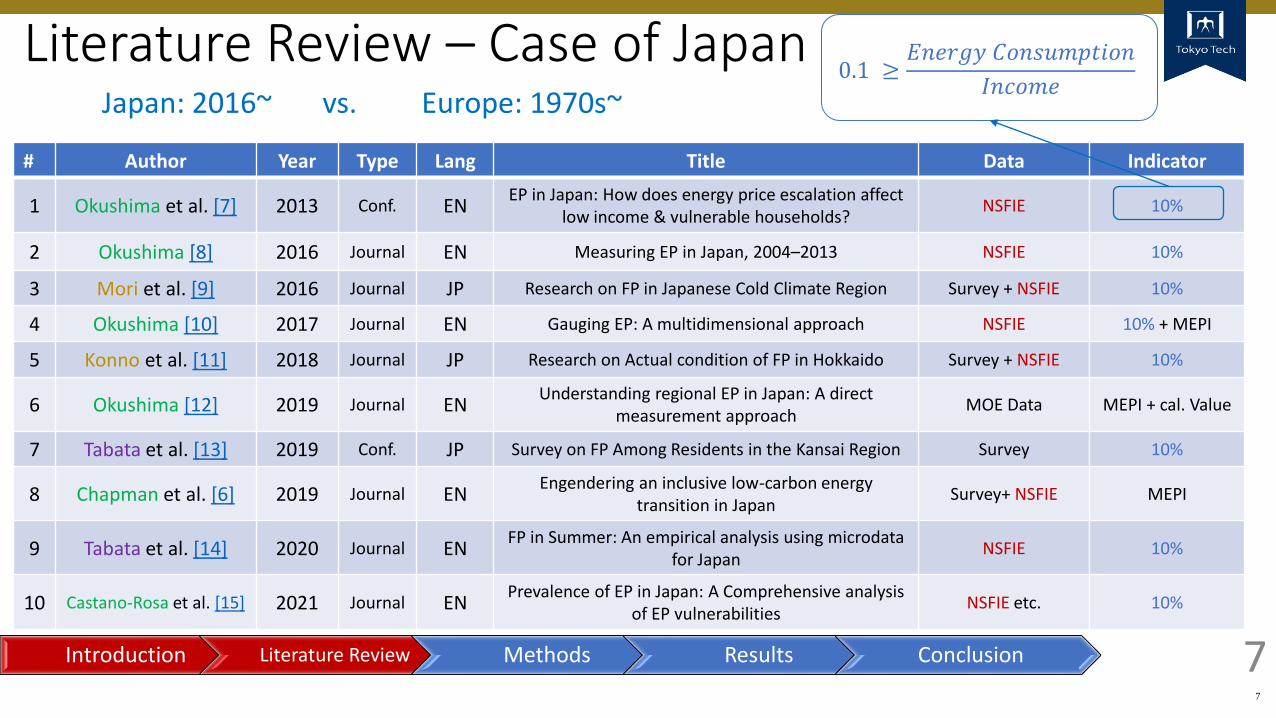
# Author Year Type Lang Title Data Indicator
1 Okushima et al. [7] 2013 Conf. ENEP in Japan: How does energy price escalation affect
low income & vulnerable households?NSFIE 10%
2 Okushima [8] 2016 Journal EN Measuring EP in Japan, 2004–2013 NSFIE 10%
3 Mori et al. [9] 2016 Journal JP Research on FP in Japanese Cold Climate Region Survey + NSFIE 10%
4 Okushima [10] 2017 Journal EN Gauging EP: A multidimensional approach NSFIE 10% + MEPI
5 Konno et al. [11] 2018 Journal JP Research on Actual condition of FP in Hokkaido Survey + NSFIE 10%
6 Okushima [12] 2019 Journal ENUnderstanding regional EP in Japan: A direct
measurement approachMOE Data MEPI + cal. Value
7 Tabata et al. [13] 2019 Conf. JP Survey on FP Among Residents in the Kansai Region Survey 10%
8 Chapman et al. [6] 2019 Journal ENEngendering an inclusive low-carbon energy
transition in JapanSurvey+ NSFIE MEPI
9 Tabata et al. [14] 2020 Journal ENFP in Summer: An empirical analysis using microdata
for JapanNSFIE 10%
10 Castano-Rosa et al. [15] 2021 Journal ENPrevalence of EP in Japan: A Comprehensive analysis
of EP vulnerabilitiesNSFIE etc. 10%
7
Literature Review – Case of Japan 0.1 ≥
𝐸𝑛𝑒𝑟𝑔𝑦 𝐶𝑜𝑛𝑠𝑢𝑚𝑝𝑡𝑖𝑜𝑛
𝐼𝑛𝑐𝑜𝑚𝑒
Introduction Literature Review Methods Results Conclusion
Japan: 2016~ vs. Europe: 1970s~
8
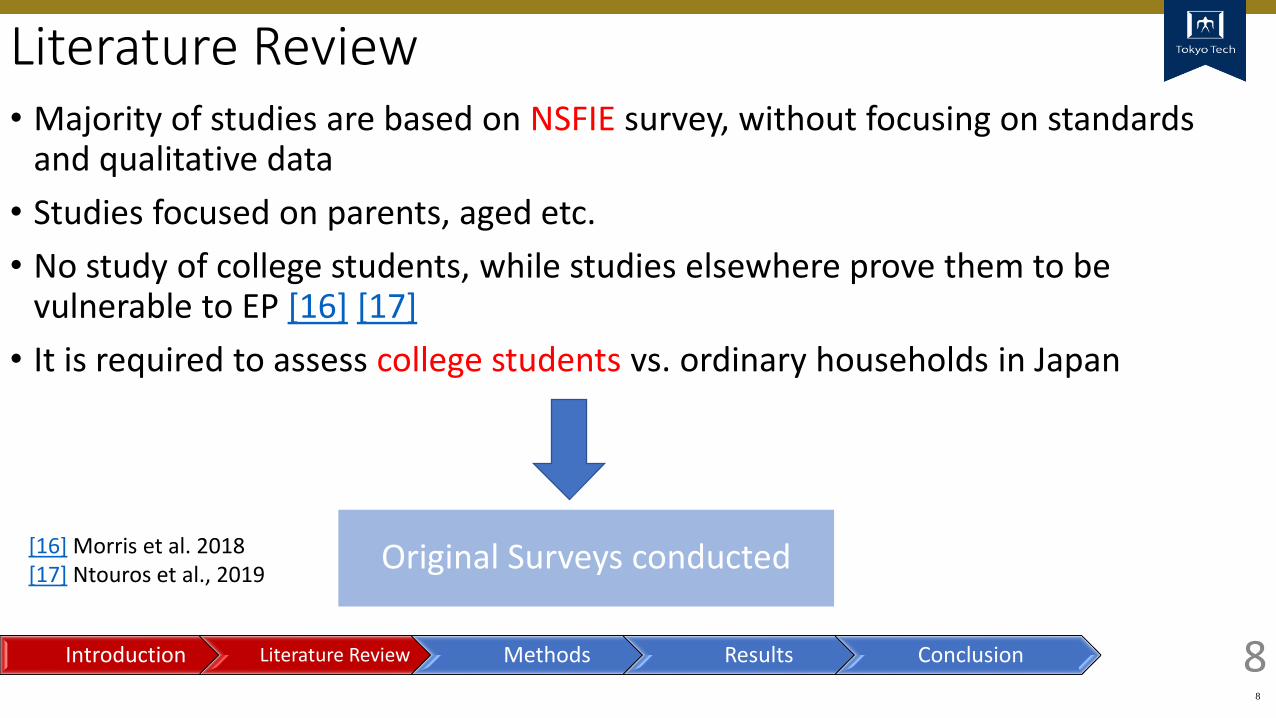
Literature Review• Majority of studies are based on NSFIE survey, without focusing on standards
and qualitative data
• Studies focused on parents, aged etc.
• No study of college students, while studies elsewhere prove them to be vulnerable to EP [16] [17]
• It is required to assess college students vs. ordinary households in Japan
8
Original Surveys conducted [16] Morris et al. 2018[17] Ntouros et al., 2019
Introduction Literature Review Methods Results Conclusion
9
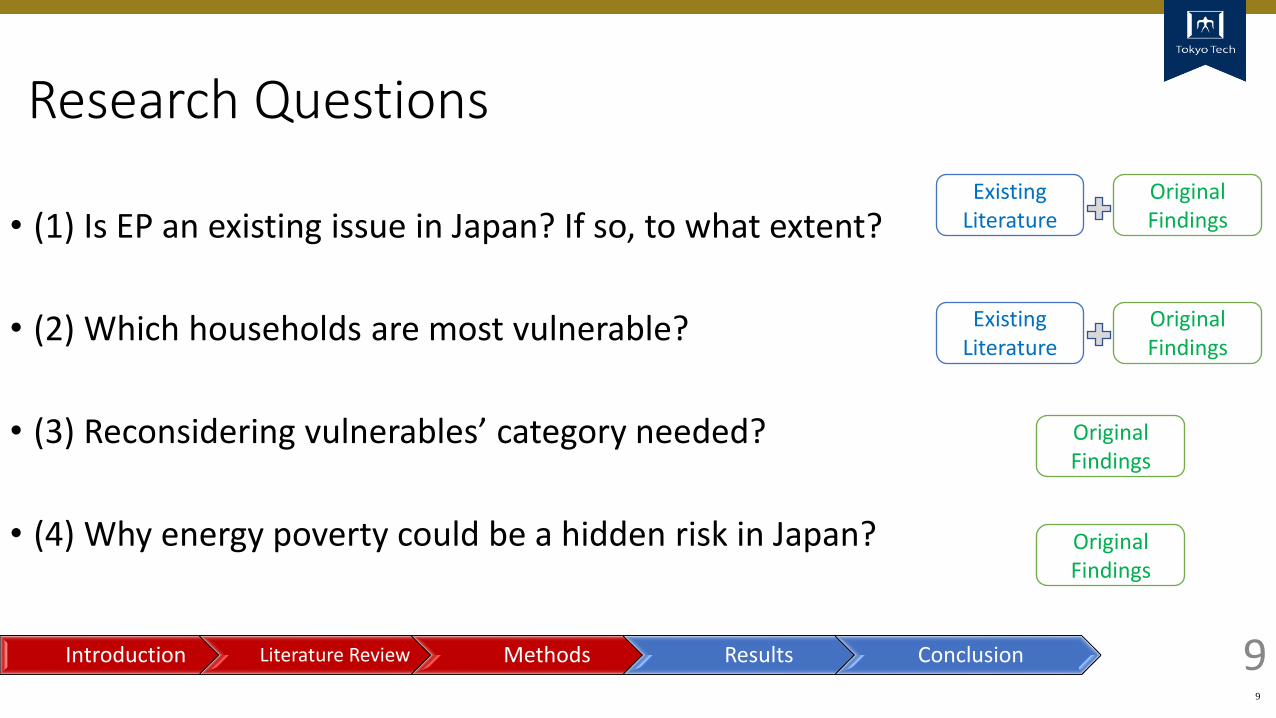
Research Questions
• (1) Is EP an existing issue in Japan? If so, to what extent?
• (2) Which households are most vulnerable?
• (3) Reconsidering vulnerables’ category needed?
• (4) Why energy poverty could be a hidden risk in Japan?
9
Existing Literature
Original Findings
Existing Literature
Original Findings
Original Findings
Original Findings
Introduction Literature Review Methods Results Conclusion
10
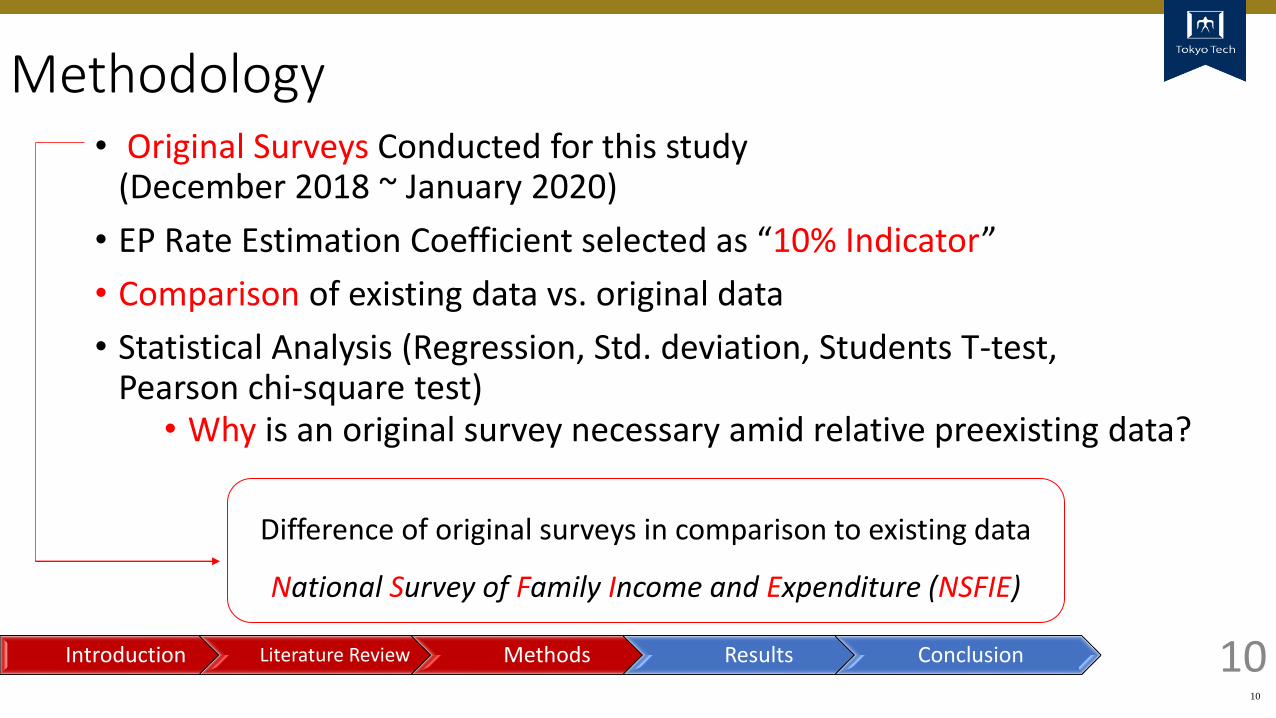
Methodology• Original Surveys Conducted for this study
(December 2018 ~ January 2020)
• EP Rate Estimation Coefficient selected as “10% Indicator”
• Comparison of existing data vs. original data
• Statistical Analysis (Regression, Std. deviation, Students T-test, Pearson chi-square test)
10
Demographics Energy Carriers
Consumption pattern
Energy Oriented Actions & behaviors
• Why is an original survey necessary amid relative preexisting data?
Difference of original surveys in comparison to existing data
National Survey of Family Income and Expenditure (NSFIE)
Introduction Literature Review Methods Results Conclusion
11
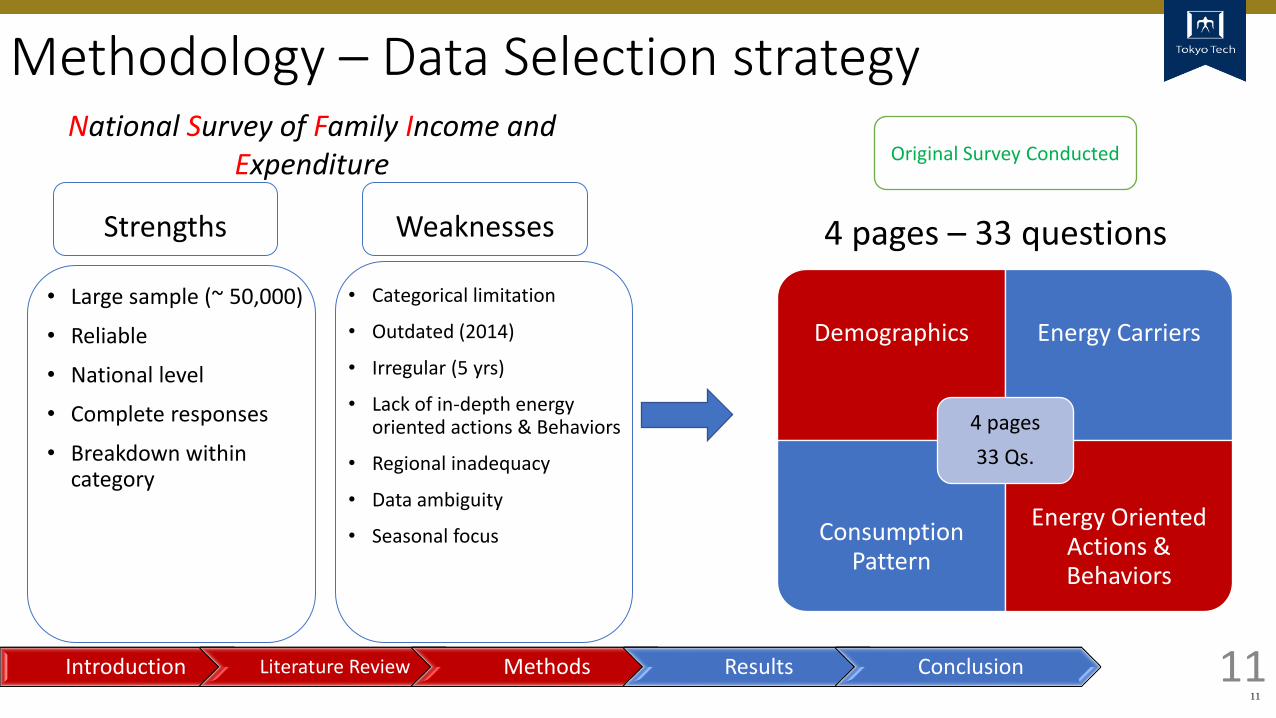
Methodology – Data Selection strategy
4 pages – 33 questions
11
Strengths Weaknesses
National Survey of Family Income and Expenditure
• Large sample (~ 50,000)
• Reliable
• National level
• Complete responses
• Breakdown within category
Demographics
Consumption pattern
Energy Oriented Actions & behaviors
Demographics Energy Carriers
Consumption Pattern
Energy Oriented Actions & Behaviors
4 pages
33 Qs.
Original Survey Conducted
Introduction Literature Review Methods Results Conclusion
• Categorical limitation
• Outdated (2014)
• Irregular (5 yrs)
• Lack of in-depth energy oriented actions & Behaviors
• Regional inadequacy
• Data ambiguity
• Seasonal focus
12
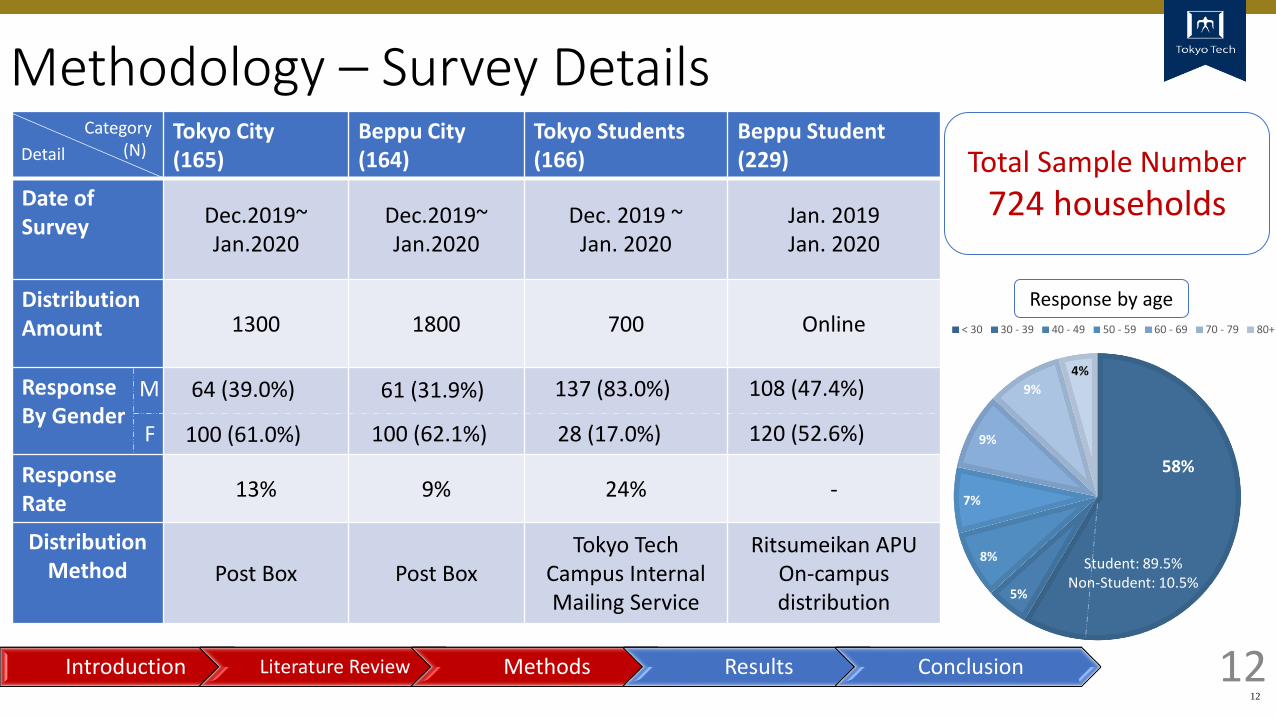
Methodology – Survey Details
12Introduction Literature Review Methods Results Conclusion
Tokyo City (165)
Beppu City (164)
Tokyo Students (166)
Beppu Student (229)
Date of Survey Dec.2019~
Jan.2020Dec.2019~ Jan.2020
Dec. 2019 ~ Jan. 2020
Jan. 2019Jan. 2020
Distribution Amount 1300 1800 700 Online
ResponseBy Gender
Response Rate
13% 9% 24% -
Distribution Method Post Box Post Box
Tokyo Tech Campus Internal Mailing Service
Ritsumeikan APU On-campus distribution
F
M 64 (39.0%)
100 (61.0%)
61 (31.9%)
100 (62.1%)
137 (83.0%)
28 (17.0%)
108 (47.4%)
120 (52.6%)
Category(N)Detail Total Sample Number
724 households
Response by age
58%
5%
8%
7%
9%
9%
4%
< 30 30 - 39 40 - 49 50 - 59 60 - 69 70 - 79 80+
Student: 89.5%Non-Student: 10.5%
13
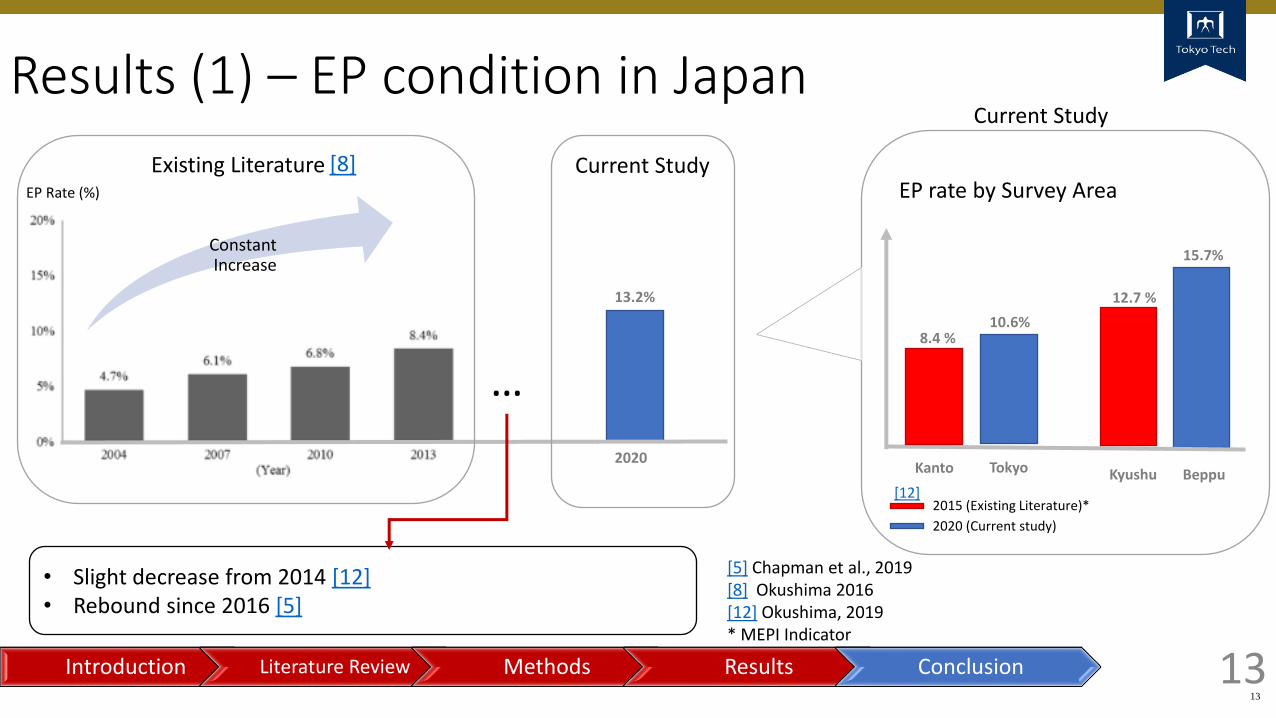
Results (1) – EP condition in Japan
13
Tokyo Beppu
15.7%
EP rate by Survey Area
Current Study
Kanto
8.4 %
Kyushu
12.7 %
10.6%
2020 (Current study)
2015 (Existing Literature)*
13.2%
2020
• Slight decrease from 2014 [12]• Rebound since 2016 [5]
Existing LiteratureEP Rate (%)
[5] Chapman et al., 2019[8] Okushima 2016[12] Okushima, 2019* MEPI Indicator
[8]
Constant Increase
Current Study
[12]
Introduction Literature Review Methods Results Conclusion
…
14
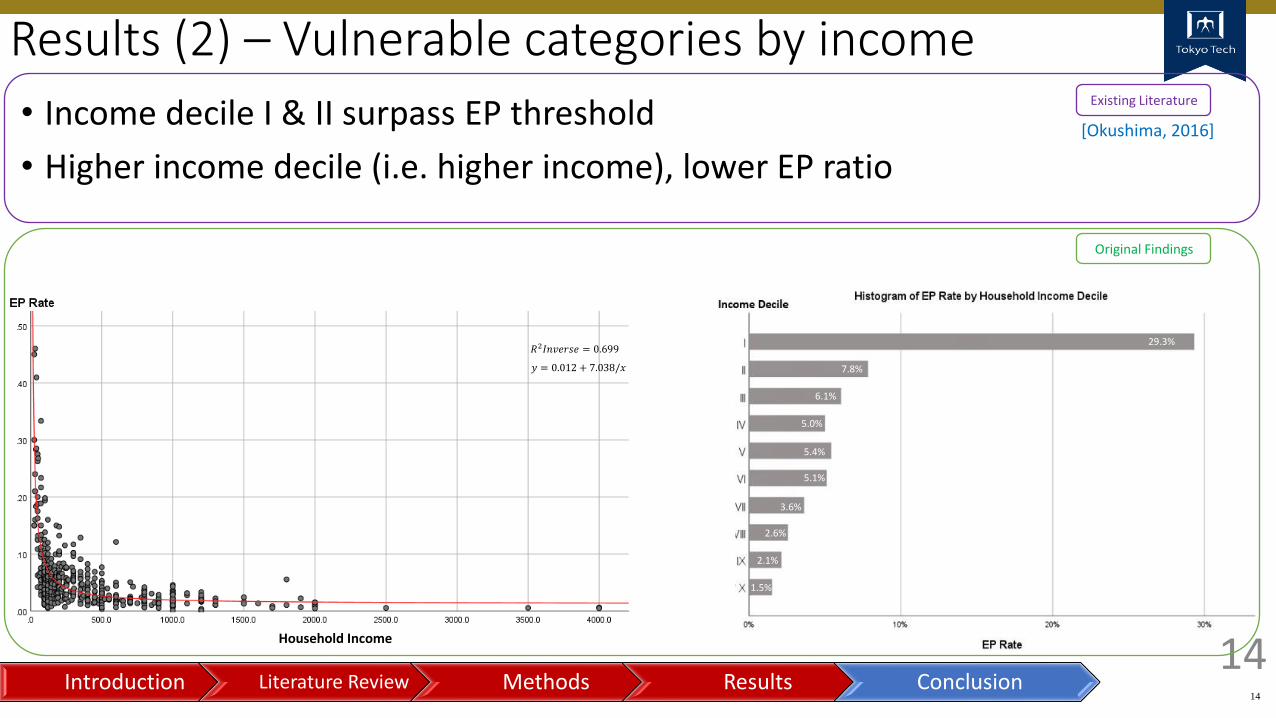
29.3%
7.8%
6.1%
5.0%
5.4%
5.1%
3.6%
2.6%
2.1%
1.5%
𝑅2𝐼𝑛𝑣𝑒𝑟𝑠𝑒 = 0.699
𝑦 = 0.012 + 7.038/𝑥
Household Income
Results (2) – Vulnerable categories by income
14
Original Findings
• Income decile I & II surpass EP threshold
• Higher income decile (i.e. higher income), lower EP ratio
Existing Literature
[Okushima, 2016]
Introduction Literature Review Methods Results Conclusion
15
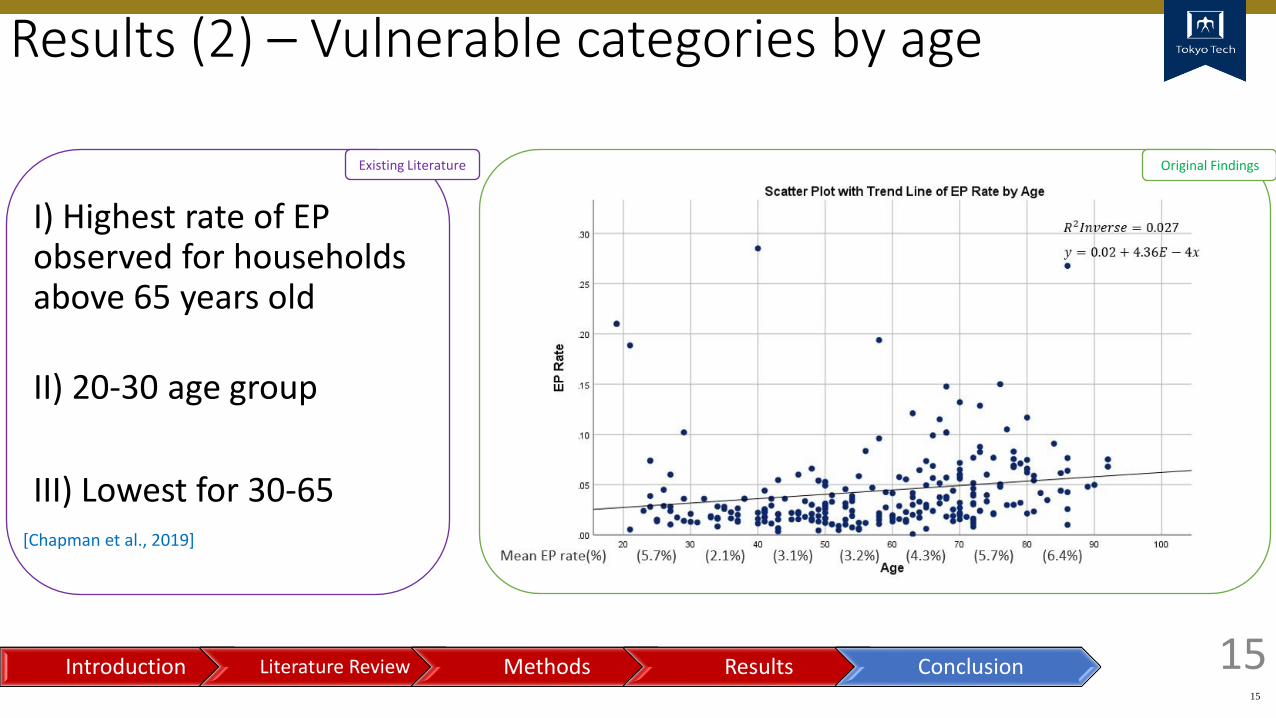
I) Highest rate of EP observed for households above 65 years old
II) 20-30 age group
III) Lowest for 30-65
Results (2) – Vulnerable categories by age
15Introduction Literature Review Methods Results Conclusion
Original Findings
[Chapman et al., 2019]
Existing Literature
16
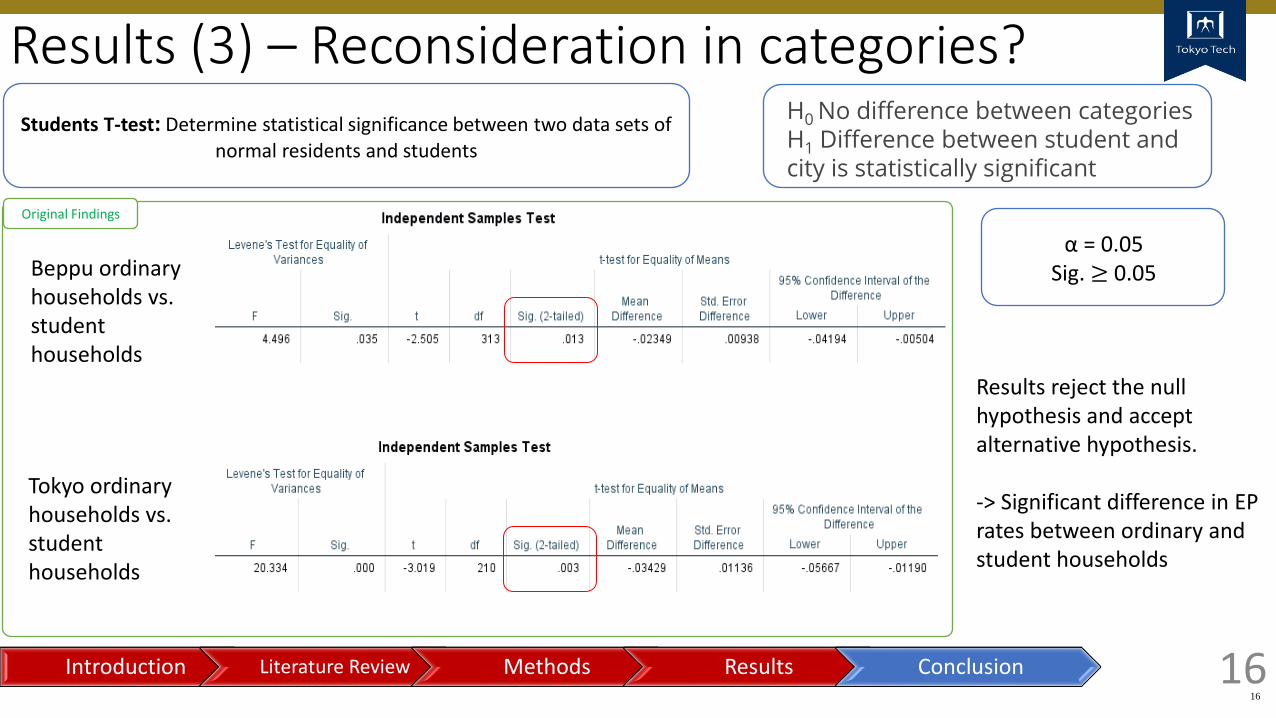
Results (3) – Reconsideration in categories?
16
Students T-test: Determine statistical significance between two data sets of normal residents and students
Introduction Literature Review Methods Results Conclusion
H0 No difference between categoriesH1 Difference between student and city is statistically significant
Original Findings
Beppu ordinary households vs. student households
α = 0.05Sig. ≥ 0.05
Results reject the null hypothesis and accept alternative hypothesis.
-> Significant difference in EP rates between ordinary and student households
Tokyo ordinary households vs. student households
17
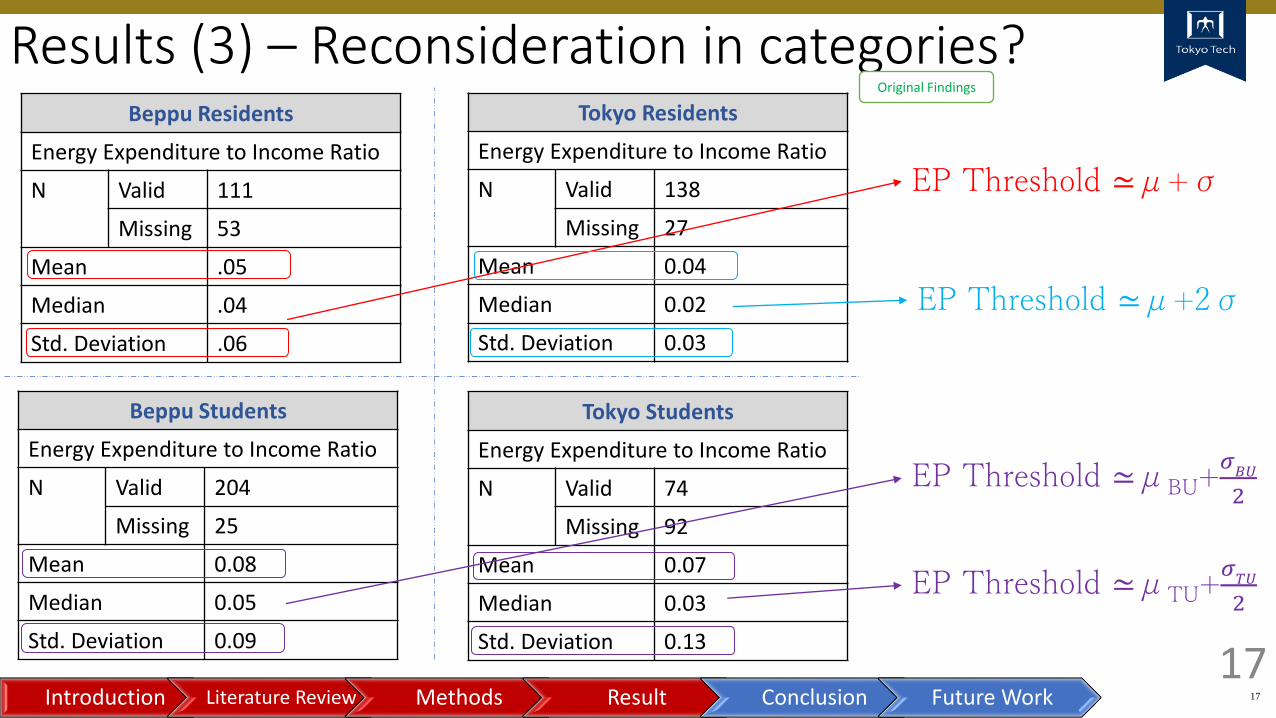
Results (3) – Reconsideration in categories?
17Introduction Literature Review Methods Result Conclusion Future Work
Beppu Residents
Energy Expenditure to Income Ratio
N Valid 111
Missing 53
Mean .05
Median .04
Std. Deviation .06
Tokyo Residents
Energy Expenditure to Income Ratio
N Valid 138
Missing 27
Mean 0.04
Median 0.02
Std. Deviation 0.03
Beppu Students
Energy Expenditure to Income Ratio
N Valid 204
Missing 25
Mean 0.08
Median 0.05
Std. Deviation 0.09
Tokyo Students
Energy Expenditure to Income Ratio
N Valid 74
Missing 92
Mean 0.07
Median 0.03
Std. Deviation 0.13
EP Threshold ≃μ+σ
EP Threshold ≃μ+2σ
EP Threshold ≃μBU+𝜎𝐵𝑈
2
EP Threshold ≃μTU+𝜎𝑇𝑈
2
Original Findings
18
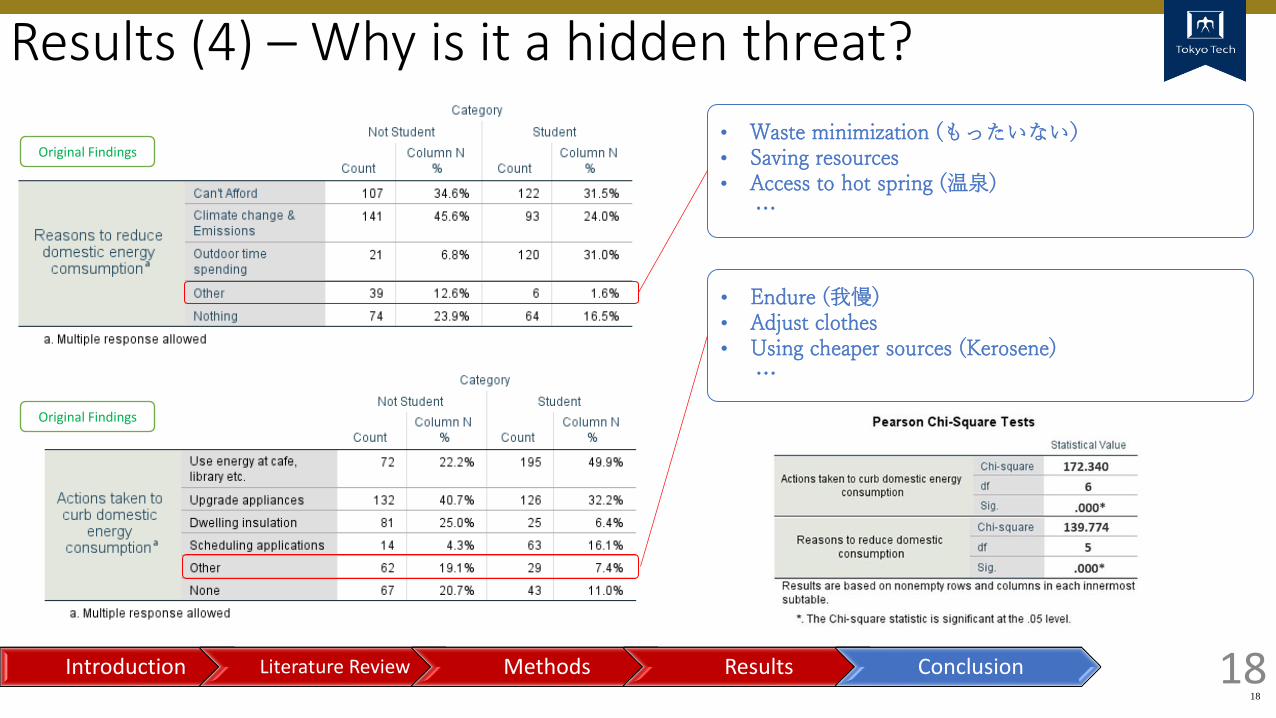
Results (4) – Why is it a hidden threat?
18
• Endure (我慢)• Adjust clothes• Using cheaper sources (Kerosene)
…
• Waste minimization (もったいない)• Saving resources• Access to hot spring (温泉)
…
Introduction Literature Review Methods Results Conclusion
Original Findings
Original Findings
19
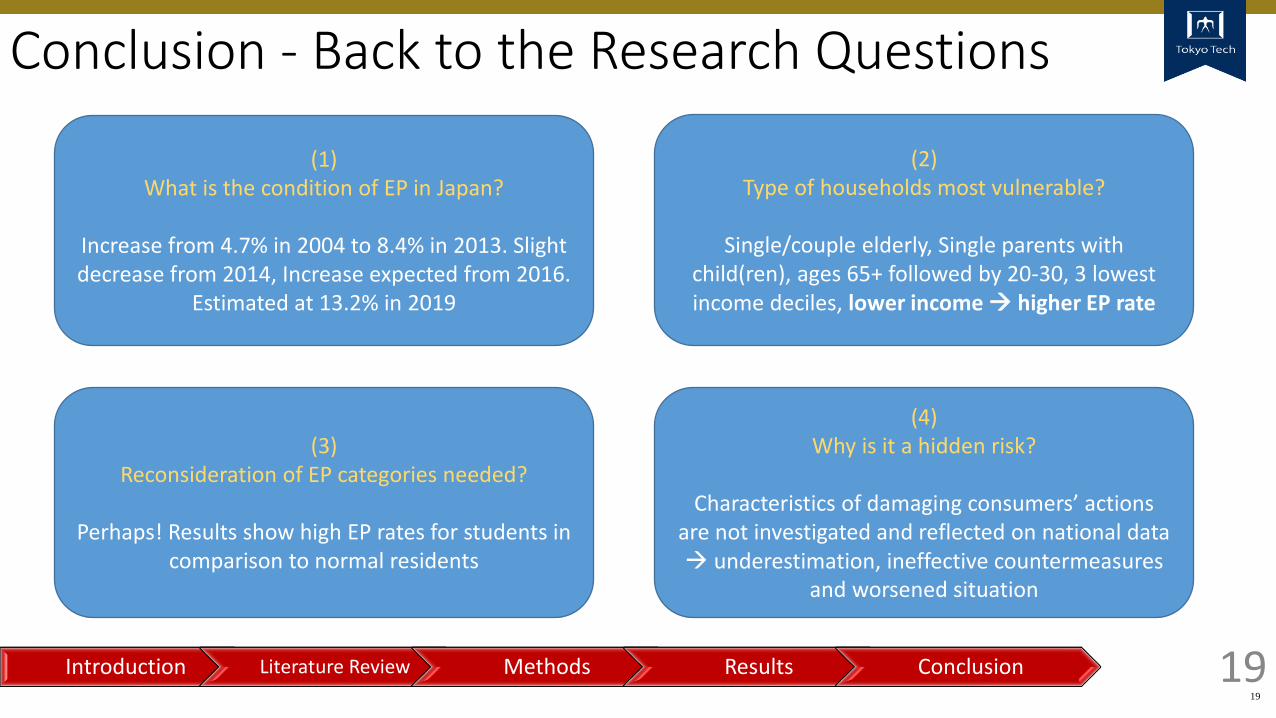
Conclusion - Back to the Research Questions
19Introduction Literature Review Methods Results Conclusion
(2)Type of households most vulnerable?
Single/couple elderly, Single parents with child(ren), ages 65+ followed by 20-30, 3 lowest income deciles, lower income → higher EP rate
(1)What is the condition of EP in Japan?
Increase from 4.7% in 2004 to 8.4% in 2013. Slight decrease from 2014, Increase expected from 2016.
Estimated at 13.2% in 2019
(3)Reconsideration of EP categories needed?
Perhaps! Results show high EP rates for students in comparison to normal residents
(4)Why is it a hidden risk?
Characteristics of damaging consumers’ actions are not investigated and reflected on national data→ underestimation, ineffective countermeasures
and worsened situation
• [1] Le, H. P. & Sarkodie, S. A., 2020. DOI: https://doi.org/10.1016/j.egyr.2020.04.020
• [2] U.S. Energy Information Administration, International Energy Outlook 2019 Report, Page 20
• [3] Rathnayaka, K. T., Seneviratna, D. M. K. N. & Long, W., 2018. DOI: https://doi.org/10.1080/15567249.2015.1084402
• [4] Ritchie, H. & Roser, M., 2019. Access to Energy. [Online] Available at: https://ourworldindata.org/energy-access [Accessed 10 July 2020].
• [5] Chapman, A. & Okushima, S., 2019. DOI: https://doi.org/10.1016/j.enpol.2019.111017
• [6] Röckel, M., 2017. Energy Is Expensive in Germany - Can This Be A Good Thing?. [Online] Available at: https://www.dotmagazine.online/issues/powering-and-greening-IT/energy-is-expensive-in-germany[Accessed 14 June 2020].
• [7] Okushima, S., & Okagawa, A. (2013). Energy Poverty in Japan: How Does the Energy Price Escalation Affect Low Income and Vulnerable Households?
• [8] Okushima, S., 2016. DOI: https://doi.org/10.1016/j.enpol.2016.09.005 20
Reference List
• [9] Mori, T., Ozawa, T. & Tamakoshi, A., 2017. Research on Fuel Poverty in Japanese Cold Climate Region. J.
Environ. Eng., Volume 44, pp. 133-144.
• [10] Okushima, S., 2017. DOI: https://doi.org/10.1016/j.energy.2017.05.137
• [11] Konno, Y., Mori, T. & Iwama, Y., 2018. DOI: http://dx.doi.org/10.3130/aije.83.729
• [12] Okushima, S., 2019. DOI: https://doi.org/10.1016/j.enbuild.2019.03.043
• [13] Tabata, T. & Peii, T., 2019. Survey on Fuel Poverty Among Residents in the Kansai Region. 47th Env. Sys. Research Paper Presentation, Tokyo.
• [14] Tabata, T. & Peii, T., 2020. DOI: https://doi.org/10.1016/j.scitotenv.2019.135038
• [15] Castaño-Rosa, R. & Okushima, S., 2021. DOI: https://doi.org/10.1016/j.rser.2021.111006
• [16] Morris, J. & Genovese, A., 2018. DOI: https://doi.org/10.1016/j.enpol.2018.05.032
• [17] Ntouros, V. et al., 2019. DOI: http://dx.doi.org/10.2478/picbe-2019-0088
21
Reference List