emotions intelligence
14
www.tjprc.org [email protected] BIOGRAPHIC AND PERSONAL FACTORS THAT AFFECT IMPACT OF ENTREPRENEURSHIP EDUCATION IN GHANAIAN POLYTECHNICS SAMUEL TUFFOUR Lecturer, University of Professional Studies, Accra & Accra Institute of Technology, Accra, PhD Candidate, Open University, Malaysia ABSTRACT This paper seeks to investigate the effect of biographic and personal attributes on the impact that entrepreneurship education makes on students in Ghanaian polytechnics. A quantitative and descriptive research technique is adopted. The population of this study is polytechnic graduates who have been active entrepreneurs for at least two years. A sample size of 205 participants is used. One-way Analysis of Variance (ANOVA), independent samples t-test and Kendall’s tau-b correlation test are used in presenting findings. Findings show that impact of entrepreneurship education in Ghanaian polytechnics is influenced by the factors of gender, academic capability, employment status, financial status, parenting status, marital status and type of school. It is recommended that tertiary institutions in Ghana consider these factors in designing curricula, recruiting tutors, developing teaching methods, designing admission criteria and acquiring teaching materials for entrepreneurship education in Ghanaian polytechnics and other tertiary institutions. KEYWORDS: Entrepreneurship, Education, Entrepreneurship Education, Impact, Polytechnics, Biographic Factors INTRODUCTION Throughout the world, entrepreneurship is known to be a primary endeavor of job creation (Honu & Gakpe, 2006). Owing to its utmost relevance to nation building, entrepreneurship is one of the few academic disciplines enshrined in the tertiary curriculum throughout the globe (McMillan & Long, 1987). Entrepreneurship is defined as a process of identifying and starting a business venture, sourcing and organizing the required resources and taking both the risks and rewards associated with the venture (Reynolds, 2010; Shane, 2003). Personally, entrepreneurship is thought to involve pulling resources together to start a business in the face of risks whilst aiming to earn and maximize returns in the business. The term “entrepreneur” was first used in 1723 and implies qualities of leadership, initiative and innovation in manufacturing, delivery, and services (Stuart & Des, 2000). Economist Robert Reich has called team-building, leadership and management ability essential qualities for the entrepreneur (Reynolds, 2010). The entrepreneur is a factor in microeconomics, and the study of entrepreneurship reaches back to the work in the late 17th and early 18th centuries of Richard Cantillon and Adam Smith, which was foundational to classical economics (Stuart & Des, 2000). In the 20th century, entrepreneurship was studied by Joseph Schumpeter in the 1930s and other Austrian economists such as Carl Menger, Ludwig von Mises and Friedrich von Hayek (Osnabrugge & Robinson, 2000; Stuart & Des, 2000). The term "entrepreneurship" was coined around the 1920s (Osnabrugge & Robinson, 2000), and became something of a buzzword beginning about 2010, in the context of disputes which have erupted surrounding the wake of the Great Recession (Reynolds, 1997). Education has served as the medium of massive disputes and argument about the concept of entrepreneurship. International Journal of Educational Science and Research (IJESR) ISSN(P): 2249-6947; ISSN(E): 2249-8052 Vol. 4, Issue 2, Apr 2014, 21-34 © TJPRC Pvt. Ltd.
Transcript of emotions intelligence

www.tjprc.org [email protected]
BIOGRAPHIC AND PERSONAL FACTORS THAT AFFECT IMPACT OF
ENTREPRENEURSHIP EDUCATION IN GHANAIAN POLYTECHNICS
SAMUEL TUFFOUR
Lecturer, University of Professional Studies, Accra & Accra Institute of Technology,
Accra, PhD Candidate, Open University, Malaysia
ABSTRACT
This paper seeks to investigate the effect of biographic and personal attributes on the impact that entrepreneurship
education makes on students in Ghanaian polytechnics. A quantitative and descriptive research technique is adopted.
The population of this study is polytechnic graduates who have been active entrepreneurs for at least two years. A sample
size of 205 participants is used. One-way Analysis of Variance (ANOVA), independent samples t-test and Kendall’s tau-b
correlation test are used in presenting findings. Findings show that impact of entrepreneurship education in Ghanaian
polytechnics is influenced by the factors of gender, academic capability, employment status, financial status, parenting
status, marital status and type of school. It is recommended that tertiary institutions in Ghana consider these factors in
designing curricula, recruiting tutors, developing teaching methods, designing admission criteria and acquiring teaching
materials for entrepreneurship education in Ghanaian polytechnics and other tertiary institutions.
KEYWORDS: Entrepreneurship, Education, Entrepreneurship Education, Impact, Polytechnics, Biographic Factors
INTRODUCTION
Throughout the world, entrepreneurship is known to be a primary endeavor of job creation (Honu & Gakpe,
2006). Owing to its utmost relevance to nation building, entrepreneurship is one of the few academic disciplines enshrined
in the tertiary curriculum throughout the globe (McMillan & Long, 1987). Entrepreneurship is defined as a process of
identifying and starting a business venture, sourcing and organizing the required resources and taking both the risks and
rewards associated with the venture (Reynolds, 2010; Shane, 2003). Personally, entrepreneurship is thought to involve
pulling resources together to start a business in the face of risks whilst aiming to earn and maximize returns in the business.
The term “entrepreneur” was first used in 1723 and implies qualities of leadership, initiative and innovation in
manufacturing, delivery, and services (Stuart & Des, 2000). Economist Robert Reich has called team-building, leadership
and management ability essential qualities for the entrepreneur (Reynolds, 2010). The entrepreneur is a factor in
microeconomics, and the study of entrepreneurship reaches back to the work in the late 17th and early 18th centuries of
Richard Cantillon and Adam Smith, which was foundational to classical economics (Stuart & Des, 2000). In the 20th
century, entrepreneurship was studied by Joseph Schumpeter in the 1930s and other Austrian economists such as Carl
Menger, Ludwig von Mises and Friedrich von Hayek (Osnabrugge & Robinson, 2000; Stuart & Des, 2000). The term
"entrepreneurship" was coined around the 1920s (Osnabrugge & Robinson, 2000), and became something of a buzzword
beginning about 2010, in the context of disputes which have erupted surrounding the wake of the Great Recession
(Reynolds, 1997). Education has served as the medium of massive disputes and argument about the concept of
entrepreneurship.
International Journal of Educational
Science and Research (IJESR)
ISSN(P): 2249-6947; ISSN(E): 2249-8052
Vol. 4, Issue 2, Apr 2014, 21-34
© TJPRC Pvt. Ltd.

22 Samuel Tuffour
Impact Factor (JCC): 3.9678 Index Copernicus Value (ICV): 3.0
Entrepreneurship education has served a vital role in equipping people with the basic skills and competences for
creating businesses. According to Lundstrom & Stevenson (2005), it is for the sake of the practicality of its education that
entrepreneurship is mostly reserved to tertiary education in many sectors. Thus, education given to students on
entrepreneurship is expected to help them set up businesses. This role of entrepreneurship in tertiary education is grossly
underplayed (McMillan & Long, 1987; Veciana et al. 2005; Kuratko, 2005). Even in developed countries of the world such
as Britain, Germany, United States of America and Italy, research has shown that entrepreneurship education is not serving
its role effectively (Kuratko, 2005).
STATEMENT OF THE PROBLEM
To a larger extent, entrepreneurship education in Africa for that matter Ghana is not yielding expected results
(Honu & Gakpe, 2006). Tertiary education curriculum in Ghana shows that nearly all graduates of tertiary institutions in
Ghana had access to, at least, a year’s entrepreneurship education. Conversely, most of Ghana’s graduates are unable to
create jobs, though they have been endowed with the skills and knowledge to, at least, employ themselves (if situations
demand) after graduation (Trade Union Congress, Ghana, 2013). TUC-Ghana (2013) has argued that the inability of
graduates to savor entrepreneurship education by creation jobs for themselves is attributable to lack of impact of teaching
and learning of the entrepreneurship subject in tertiary institutions. Lack of impact of entrepreneurship education on
graduates and students has been blamed by Wilson & Peter (2006) on the fact that entrepreneurship teaching methods and
curricula are not designed to suit the personalities of students and lecturers. This is premised on the argument that the
impact of entrepreneurship education on students is influenced by the biographical attributes of students and lecturers such
as gender, marital status, parenting status and income (Wegner, 2011; Mathews et al., 2003; Skinner, 1963).
The problem is that most teaching and learning methods of entrepreneurship education in Ghana do not recognize
these biographic attributes of participants of teaching and learning (i.e. students and teachers). To provide a basis for
factoring these biographic features in designing methods and curricula of entrepreneurship education in Ghana, this study
seeks to identify the extent at which some biographic features of students influence the impact of entrepreneurship
education. This is done at the polytechnic level, since polytechnics have a more critical role in practical training and
provision of human resources for industry in Ghana.
RESEARCH OBJECTIVE
This paper seeks to identify how human factors; namely gender, level of education, employment status, financial
status, parenting status, marital status and type of school affect the impact of entrepreneurship education in Ghanaian
polytechnics.
REVIEW OF LITERATURE
The idea that biographic attributes affect the impact of entrepreneurship education on students is rooted in theory
and research. This section reviews theories and studies that make a bearing with the subject matter of this paper.
The Five Factor Model (FFM) is the primary basis of arguing the relationship between biographic human
attributes and the impact of entrepreneurship education. This model is the formal way of describing the “Big five
personality traits” (Costa & McCrae, 1991), which are the five broad dimensions of personality that are used to describe
human personality (Mathews et al. 2003; Wegner, 2011). The Big Five factors are openness, conscientiousness,
Biographic and Personal Factors that Affect Impact of 23 Entrepreneurship Education in Ghanaian Polytechnics
www.tjprc.org [email protected]
extraversion, agreeableness, and neuroticism (Costa & McCrae, 1991). Under each factor, a cluster of correlated specific
traits is found. For example, extraversion includes such related qualities as gregariousness, assertiveness, excitement
seeking, warmth, activity, and positive emotions (Wegner, 2011; Costa & McCrae, 1991).
Wegner (2011) argues in the line of this model that human understanding of things taught or learned is influenced
by these five traits of personality. These five traits are further subject to gender, income, culture, religion and other
biographic human attributes (Wegner, 2011; Mathews et al. 2003; Costa & McCrae, 1991). It is of this reason that people
of different sex, exposure to education, income, culture and parenting status have varying level of comprehension of the
same taught or/and learned subject in a class (Wegner, 2011; Mathews et al., 2003).
The Social Learning Theory argues that learning is a cognitive process that involves the social environment
(Bandura, 1963). It is said to take place purely through observation or direct instruction, even in the absence of motor
reproduction or direct reinforcement (Bandura, 1963; Skinner, 1963). In addition to the observation of behavior, learning
also occurs through the observation of rewards and punishments, a process known as vicarious reinforcement
(Bandura, 1963). The theory expands on traditional behavioral theories, in which behavior is governed solely by
reinforcements, by placing emphasis on the important roles of various internal processes in the learning individual.
According to Skinner (1963), these internal processes interplay with the learner and sometimes the teacher’s biographic
attributes such as sex, income, marital status, culture and race. Skinner (1963) argues on the basis of the Social Learning
Theory that the way a person reacts and responds to learning or teaching is influenced by the social environment and such
attributes as gender, financial status of learner or parents, culture, religion and other biographic features.
Having discussed the Five Factor Model (Costa & McCrae, 1991) and the Social Learning Theory
(Bandura, 1963), it is evident that the approach to teaching and learning of entrepreneurship and its impact on students are
influenced by such demographic attributes as gender, income, culture, religion, level of education, employment status and
type of social environment.
Wilson & Peter (2006) embarked on a meta-analysis that proves to argue the relationship between biographic
human attributes and impact of entrepreneurship education. Findings in their study show that such attributes as gender,
culture, income, parenting status, marital status, social environment and the like drive the course of impact that teaching
and learning makes on students and teachers. Other studies such as those of Veciana et al. (2005), Boyle (2001) and
Kuratko (2005) convey similar notions and arguments. Even so, none of these studies could reveal the effect of such
biographic factors on the impact that entrepreneurship education makes on students in Ghana.
HYPOTHESES
Based on reviewed literature and research problem, this paper seeks to test the following hypothesis at 5%
significance level:
H01: Impact of entrepreneurship education in Ghanaian polytechnics is not influenced by each of gender,
academic capability, employment status, financial status, parenting status, marital status and type of school.
H11: Impact of entrepreneurship education in Ghanaian polytechnics is significantly influenced by each of gender,
academic capability, employment status, financial status, parenting status, marital status and type of school.

24 Samuel Tuffour
Impact Factor (JCC): 3.9678 Index Copernicus Value (ICV): 3.0
RESEARCH VARIABLES
Dependent Variable
The dependent variable is impact of entrepreneurship education in Ghanaian polytechnics. This was measured as
participants’ financial performance in their businesses. The assumption of this measurement was that the impact of
entrepreneurship education at the polytechnic level translated into academic performance and the ability of participants to
grow their businesses. The researcher ensured that participants did not upgrade their education as at the time of the study.
This was to make room for measuring only the impact of polytechnic entrepreneurship education.
Independent Variables
These constitute gender, level of education, employment status, financial status, parenting status, marital status
and type of school.
METHODOLOGY
The study involved a quantitative research paradigm, survey and secondary data analysis. The quantitative
research paradigm was employed so that reliability and validity could be determined for the study. This design, coupled
with the survey research design, made way for generalizing findings on Ghana. The study was partly a secondary data
analysis, as it employed existing data on the financial performance of the businesses of alumni (who were currently
entrepreneurs) of polytechnics in Ghana.
The population of this study was graduates from eight (8) polytechnics who were identified as permanent
entrepreneurs. The sampling frame of this study was population members who had been entrepreneurs for at least two (2)
years and who had not acquired any higher education after their polytechnic education. The population of members of this
sampling frame was 440.
The simple random sampling technique; thus the table of random numbers, was used to sample 205 participants
using the theoretical sample size table of Krejcie & Morgan (1970). The simple random sampling, a probability sampling
method, was used to enable the researcher to generalize findings over Ghanaian polytechnics.
Data employed in this study was continuous secondary data. Meanwhile, they were considered with regard to
gender, level of education, employment status, financial status, parenting status, marital status, academic ability (based on
grades of participants on entrepreneurship) and type of school (i.e. type of polytechnic) of participants. These data
constituted aggregated annual revenues generated in the businesses of participants from 2005 to 2012.
A greater part of data was taken from admission forms completed by participants when applying for admission to
the various polytechnics. Some data were also taken from participants’ academic records and alumni information existing
in the various polytechnics. Annual revenues were supplied by participants through contacts provided by participating
polytechnics.
Data validity was guaranteed in this study, as data was carefully extracted from the databases of the chosen
polytechnics. Moreover, the accuracy and correctness of this data was double-checked from National Board for Tertiary
and Vocational Examinations (NABTEX), Ghana. Annual revenues provided by participants corresponded with tax
invoices, and this suggests a high level of these data’s credibility.

Biographic and Personal Factors that Affect Impact of 25 Entrepreneurship Education in Ghanaian Polytechnics
www.tjprc.org [email protected]
The Statistical Package for the Social Sciences (SPSS) and Ms Excel were used to analyze data. The first research
hypothesis was tested using independents samples student’s t-test (i.e. for two groups like ‘gender’) and one-way Analysis
of Variance (ANOVA) (i.e. for three or more groups like ‘level of education’). The second research hypothesis was
analyzed using partial correlation test. Since data was continuous in nature, the above-named parametric statistical tools
were appropriate for data analysis. However, the Shapiro-Wilk test of normality was used to identify whether data was
normally distributed. Non-normal data were standardized by taking their inverse and natural logarithm.
RESULTS
This section presents findings of this study. All tests are carried out at 5% level of significance. As a result of the
fact that the dependent variable, Impact (of entrepreneurship education), involved continuous data that was analyzed with
parametric statistical tools, the normality assumption and other basic assumptions need to be satisfied. The following table
comes with the test of normality on the independent variable, Impact.
Table 1: Tests of Normality
Kolmogorov-Smirnova Shapiro-Wilk
Statistic df Sig. Statistic df Sig.
Impact .113 200 .000 .956 200 .000
a. Lilliefors Significance Correction
Table 1 shows the Kolmogorov-Smirnov and Shapiro-Wilk tests of normality. Kolmogorov-Smirnov test applies
to a sample size of more than 2000 whereas the Shapiro-Wilk test applies to smaller samples. As a result, the Shapiro-Wilk
test is considered in this analysis. The null hypothesis is that data associated with the variable Impact are normally
distributed. From the table, the test is significant at 5% level of significance (p = .000).
This means that the null hypothesis could be rejected. It can therefore be said that data associated with the
independent variable are not normally distributed. This required data standardization to achieve normality. Normality of
the independent variable was then met by taking their natural logarithm.
Table 2 comes with group statistics for impact of entrepreneurship education, with gender constituting the group.
Table 2 is associated with Table 3 in testing the first null hypothesis, which states that “impact of entrepreneurship
education is the same for males and females”.
Table 2: Group Statistics (Impact by Gender)
Gender N Mean Std. Deviation Std. Error Mean
Impact Female 100 4.0808 1.50045 .15004
Male 100 6.6866 1.44850 .14485
Table 2 shows descriptive statistics associated with impact of entrepreneurship education across males and
females. From the table, males had a higher level of impact (M = 6.69, SD = 1.45) relative to females
(M = 4.08, SD = 1.50). Possibly, entrepreneurship education makes better impact on male students. But table 3 indicates
through an independent student’s (significance) t-test if the difference in these means is significant.
Table 3: Independent t Test (Impact by Gender)
F Sig t df Sig. (2-Tailed)
Impact Equal variances assumed .005 .942 -12.495 198 .000
Equal variances not assumed -12.495 197.755 .000
26 Samuel Tuffour
Impact Factor (JCC): 3.9678 Index Copernicus Value (ICV): 3.0
Table 3 shows the independent t-test associated with the first null hypothesis. It indicates that there is a significant
difference in the impact of entrepreneurship education across males and females, t (198) = -12.495, p = .000. Thus there is
ample evidence that entrepreneurship education in Ghanaian polytechnics impacts better on males relative to females.
It can also be said that gender influences impact of entrepreneurship education in Ghanaian polytechnics.
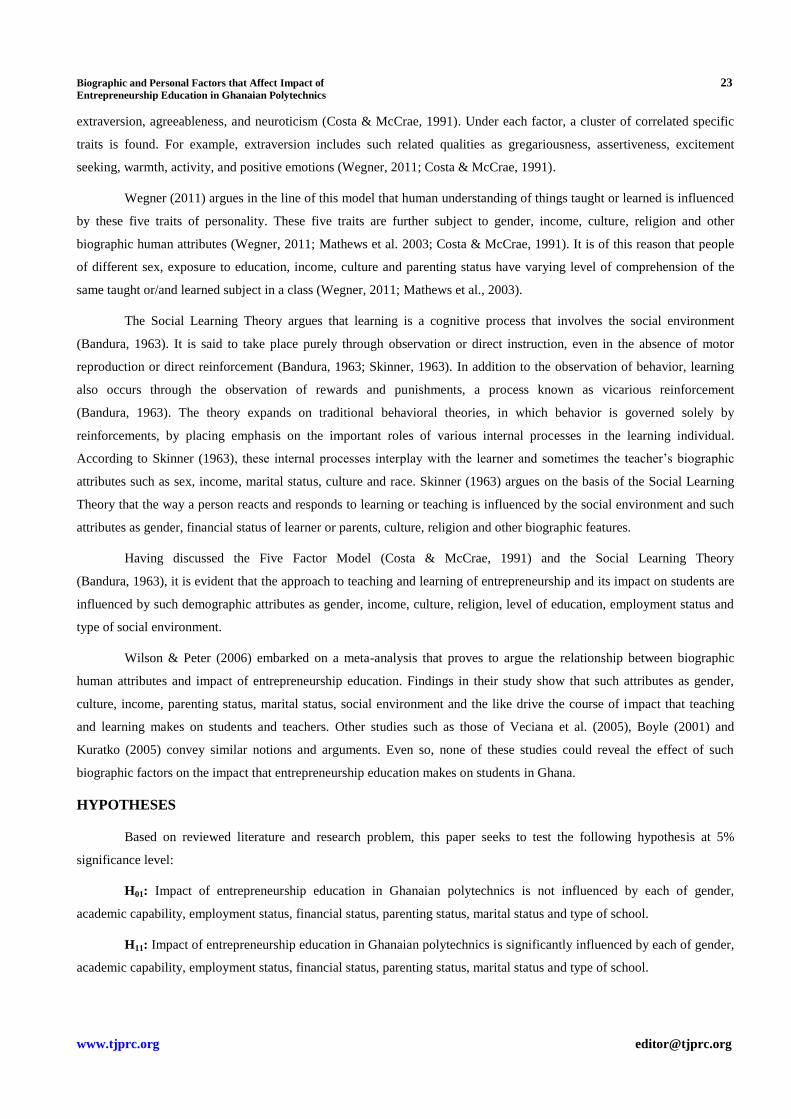
Table 4: Descriptive Statistics (Impact by Academic Capability)
N Mean Std. Deviation Std. Error 95% Confidence Interval for Mean
Lower Bound Upper Bound
Low 60 3.0840 .72102 .09308 2.8977 3.2703
Average 80 5.5760 1.04542 .11688 5.3434 5.8086
High 60 7.4270 1.18120 .15249 7.1219 7.7321
Total 200 5.3837 1.96721 .13910 5.1094 5.6580
Table 4 is coupled with Tables 5, 6 and 7 in testing the second null hypothesis of this study. This hypothesis states
that “impact of entrepreneurship education is the same across different levels of academic capability”. This is tested using
one-way Analysis of Variance (ANOVA). From the table, students with high academic capability had the highest impact
(M = 7.42, SD = 1.97), followed with students with average academic capability (M = 5.58, SD = 1.05) and students with
low academic capability (M = 3.08, SD = 0.72). Perhaps, academic capability influences impact of entrepreneurship
education (i.e. impact differs across the three levels of academic capability). Yet, the F-statistics could confirm this as
follows.
Table 5: Test of Homogeneity of Variances (Impact by Academic Capability)
Levene Statistic df1 df2 Sig.
9.650 2 197 .000
Table 5 comes with a test of homogeneity of variances assumption. It tests the hypothesis that variances across the
three groups of academic capability are equal or approximately equal. At 5% significance level, this test is significant
(p = .000). This means that there is no homogeneity of variances. This would require that post hoc findings of this ANOVA
test are based on the lack of homogeneity; thus if it shows a significant difference.
Table 6: ANOVA (Impact by Academic Capability)
Sum of Squares df Mean Square F Sig.
Between Groups 570.780 2 285.390 282.053 .000
Within Groups 199.331 197 1.012
Total 770.111 199
Table 6 comes with an F test for a difference in the impact of entrepreneurship education on the three levels of
academic capability. The test is significant at 5% level of significance, F (2,197) = 285.39, p = .000. The second null
hypothesis is therefore rejected. Hence, impact of entrepreneurship education differs across the three levels of academic
capability. There is a higher likelihood that academic capability influences impact of entrepreneurship education. Table 7 is
a multiple comparison test for this significance difference.
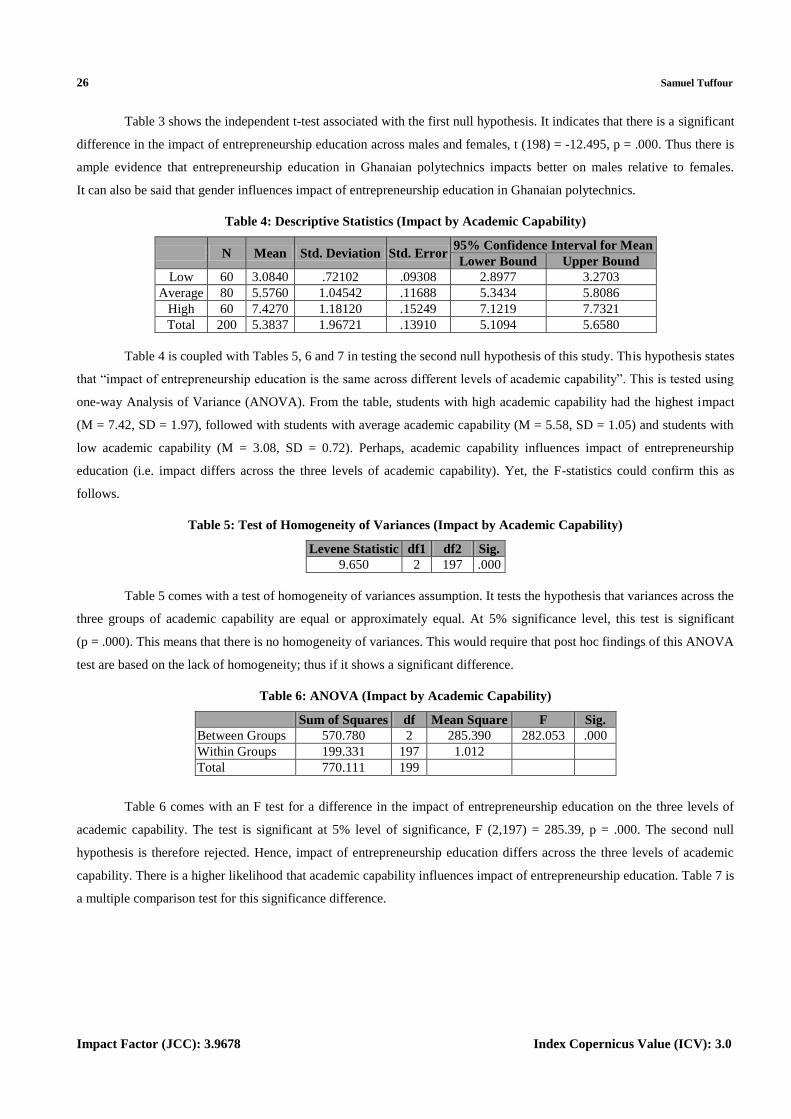
Biographic and Personal Factors that Affect Impact of 27 Entrepreneurship Education in Ghanaian Polytechnics
www.tjprc.org [email protected]
Table 7: Multiple Comparison (Impact and Academic Capability)
(I)
Academic
Capability
(J)
Academic
Capability
Mean
Difference
(I-J)
Sig.
95% Confidence
Interval
Lower
Bound
Upper
Bound
Tamhane
Low Average -2.49200
* .000 -2.8532 -2.1308
High -4.34300* .000 -4.7770 -3.9090
Average Low 2.49200
* .000 2.1308 2.8532
High -1.85100* .000 -2.3164 -1.3856
High Low 4.34300
* .000 3.9090 4.7770
Average 1.85100* .000 1.3856 2.3164
Table 7 is the Tamhane’s multiple comparison test (a counterpart to Bonferroni multiple comparison test when
there is no homogeneity of variances). It gives detail about the extent of the difference across the three levels of academic
capability as revealed in Table 6. It can be seen that there is a significant difference in impact for each combination of the
three levels of academic capability; Low*Average (p = .000), Low*High (p = .000) and Average*High (p = .000).
This could mean that increased academic capability increases impact of entrepreneurship education.
Table 8: Group Statistics (Impact by Employment Status)
Employment
Status N Mean
Std.
Deviation
Std. Error
Mean
Impact Employed 96 3.2111 1.50045 .15004
Unemployed 104 7.0006 1.44850 .14485
Table 8 shows the group statistics for impact of entrepreneurship education, where the groups include
“Employed” and “Unemployed” students. From the table, unemployed students had higher impact (M = 7.00, SD = 1.449)
relative to employed students (M = 3.211, SD = 1.500). At a glance from the table, students who were not employed during
their study in the polytechnics had better impact of entrepreneurship education. However, Table 9 would justify this claim.
Table 9: Independent t Test (Impact by Employment Status)
F Sig t df Sig. (2-Tailed)
Impact Equal variances assumed .005 .942 -12.495 198 .000
Equal variances not assumed -12.495 197.755 .000
Table 9 shows an independent student’s t-test for a difference between the two levels of employment status.
The null hypothesis is that “there is no difference in the impact of entrepreneurship education on employed and
unemployed students”. From the table, this test is significant, t (198) = -12.495, p = .000. The third null hypothesis is
therefore rejected. Hence, students who were not employed during their study of entrepreneurship in the polytechnics had a
higher impact of entrepreneurship education. There is a higher likelihood that employment status affects entrepreneurship
education.
Table 10: Descriptive Statistics (Impact by Financial Status)
N Mean Std.
Deviation
Std.
Error
95% Confidence Interval for Mean
Lower Bound Upper Bound
Low 58 3.1007 .72387 .09505 2.9104 3.2910
Average 87 5.5755 1.17179 .12563 5.3258 5.8253
High 55 7.4878 1.16389 .15694 7.1732 7.8025
Total 200 5.3837 1.96721 .13910 5.1094 5.6580

28 Samuel Tuffour
Impact Factor (JCC): 3.9678 Index Copernicus Value (ICV): 3.0
Table 10 shows descriptive statistics of impact of entrepreneurship education across the three levels of financial
status. It appears that high income students had better impact of entrepreneurship education (M = 7.488, SD = 1.164),
followed by average income students (M = 5.576, SD = 1.171) and low income students (M = 3.100, SD = 0.724). As to
whether there is a significant difference in the impact of entrepreneurship education across the three levels of financial
status would depend on findings of the following ANOVA test.
Table 11: Homogeneity of Variances (Impact by Financial Status)
Levene Statistic df1 df2 Sig.
8.796 2 197 .000
Table 11 comes with test for homogeneity of variances across the three levels of financial status. This is done
partly in testing the null hypothesis that impact of entrepreneurship education is the same across the three levels of
financial status. From the table, there is no homogeneity of variances across the three levels (p = .000) at 5% significance
level. This requires that the Tamhane Multiple Comparison test is used instead of Bonferroni Multiple Comparison should
there be any need for a post hoc analysis.
Table 12: ANOVA (Impact by Financial Status)
Sum of
Squares df
Mean
Square F Sig.
Between Groups 549.007 2 274.504 244.579 .000
Within Groups 221.103 197 1.122
Total 770.111 199
Table 12 is an ANOVA test for a difference in the impact of entrepreneurship education across the three levels of
financial status. It can be seen that this test is significant at 0.05 level of significance, F (2, 197) = 244.579, p = .000.
The null hypothesis is therefore rejected. This means that there is a significant difference in the impact of entrepreneurship
education across the three levels of financial status.
Table 13: Multiple Comparison (Impact by Financial Status)
(I)
Financial
Status
(J)
Financial
Status
Mean
Difference
(I-J)
Std.
Error Sig.
95% Confidence
Interval
Lower
Bound
Upper
Bound
Tamhane
Low Average -2.47483
* .15753 .000 -2.8555 -2.0942
High -4.38713* .18348 .000 -4.8336 -3.9407
Average Low 2.47483
* .15753 .000 2.0942 2.8555
High -1.91230* .20103 .000 -2.3994 -1.4252
High Low 4.38713
* .18348 .000 3.9407 4.8336
Average 1.91230* .20103 .000 1.4252 2.3994
*. The mean difference is significant at the 0.05 level.
Table 13 is the Tamhane's Multiple Comparison test that explains the nature of the difference in Table 12.
Evidently, low income students had a significantly lower impact relative to average (p = .000) and high (p = .000) income
students. Moreover, high income students had a higher impact relative to average income students (p = .000). It is therefore
likely that financial status is related to impact of entrepreneurial education.

Biographic and Personal Factors that Affect Impact of 29 Entrepreneurship Education in Ghanaian Polytechnics
www.tjprc.org [email protected]
Table 14: Descriptive Statistics (Impact by Parenting Status)
N Mean Std.
Deviation
Std.
Error
95% Confidence Interval for Mean
Lower Bound Upper Bound
No parenting 67 3.3337 1.06479 .13009 3.0740 3.5935
Single parenting 89 5.8856 1.24756 .13224 5.6228 6.1484
Full parenting 44 7.4900 1.17266 .17679 7.1335 7.8465
Total 200 5.3837 1.96721 .13910 5.1094 5.6580
Table 14 indicates descriptive statistics that depict impact on entrepreneurship education across the three levels of
parenting status. Students who had full parenting status had the highest impact (M = 7.490, SD 1.173), followed by
students with single parenting status (M = 5.886, SD = 1.248) and students with no parenting status (M = 3.334, SD =
1.065). This table gives a clue about the fact that parenting situation of students influence impact of entrepreneurship
education. Table 15 shows homogeneity of variances test, which is associated with the test of the null hypothesis that
impact of entrepreneurship education is the same across the three levels of parenting status.
Table 15: Homogeneity of Variances (Impact by Parenting Status)
Levene Statistic df1 df2 Sig.
2.372 2 197 .096
Table 15 is a test for homogeneity of variances across the three levels of parenting status. It is seen that there is
homogeneity of variances across the three levels (p = .096) at 5% significancee level. This means that the homogeneity of
variances assumption for ANOVA is satisfied.
0
Table 16: ANOVA (Impact by Parenting Status)
Sum of Squares df Mean Square F Sig.
Between Groups 499.186 2 249.593 181.489 .000
Within Groups 270.925 197 1.375
Total 770.111 199
Table 16 is the F-test for the statement that impact of entrepreneurship education is the same across the three
levels of parenting status. This test, according to Table 16, is significant at 5% significance level, F (2, 197) = 181.489,
p = .000. The null hypothesis is therefore not confirmed. Hence, there is a significant difference in the impact of
entrepreneurship education across the three levels of parenting status.
Table 17: Multiple Comparisons (Impact by Parenting Status)
(I) Parenting
Status
(J) Parenting
Status
Mean
Difference (I-J) Sig.
95% Confidence Interval
Lower Bound Upper Bound
Bonferroni
No parenting Single parenting -2.55189
* .000 -3.0099 -2.0939
Full parenting -4.15627* .000 -4.7057 -3.6068
Single parenting No parenting 2.55189
* .000 2.0939 3.0099
Full parenting -1.60438* .000 -2.1262 -1.0825
Full parenting No parenting 4.15627
* .000 3.6068 4.7057
Single parenting 1.60438* .000 1.0825 2.1262
*. The mean difference is significant at the 0.05 level.
Table 17 is a post hoc test (Bonferroni Multiple comparison). From this table, full parenting status students had
the highest impact relative to single and no parenting status students at p = .000. Moreover, single parenting status students
had better impact relative to no parenting status students at p = .000, when 5% is the level of significance.
30 Samuel Tuffour
Impact Factor (JCC): 3.9678 Index Copernicus Value (ICV): 3.0
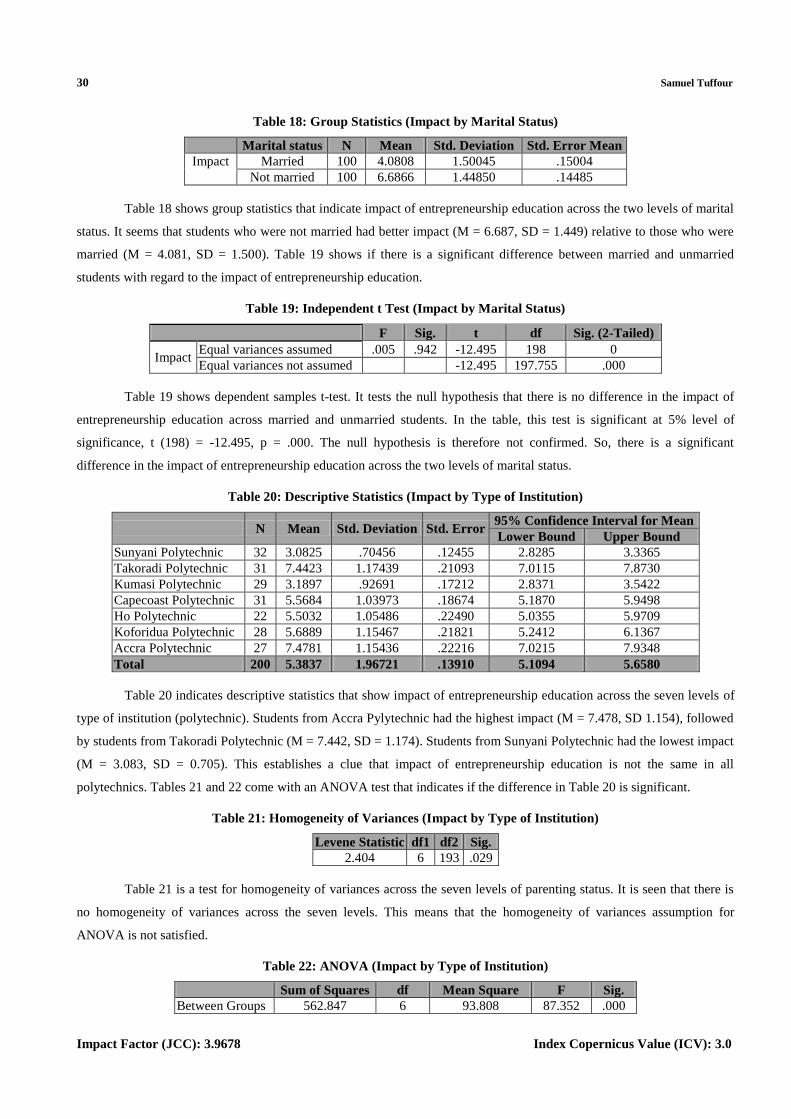
Table 18: Group Statistics (Impact by Marital Status)
Marital status N Mean Std. Deviation Std. Error Mean
Impact Married 100 4.0808 1.50045 .15004
Not married 100 6.6866 1.44850 .14485
Table 18 shows group statistics that indicate impact of entrepreneurship education across the two levels of marital
status. It seems that students who were not married had better impact (M = 6.687, SD = 1.449) relative to those who were
married (M = 4.081, SD = 1.500). Table 19 shows if there is a significant difference between married and unmarried
students with regard to the impact of entrepreneurship education.
Table 19: Independent t Test (Impact by Marital Status)
F Sig. t df Sig. (2-Tailed)
Impact Equal variances assumed .005 .942 -12.495 198 0
Equal variances not assumed -12.495 197.755 .000
Table 19 shows dependent samples t-test. It tests the null hypothesis that there is no difference in the impact of
entrepreneurship education across married and unmarried students. In the table, this test is significant at 5% level of
significance, t (198) = -12.495, p = .000. The null hypothesis is therefore not confirmed. So, there is a significant
difference in the impact of entrepreneurship education across the two levels of marital status.
Table 20: Descriptive Statistics (Impact by Type of Institution)
N Mean Std. Deviation Std. Error 95% Confidence Interval for Mean
Lower Bound Upper Bound
Sunyani Polytechnic 32 3.0825 .70456 .12455 2.8285 3.3365
Takoradi Polytechnic 31 7.4423 1.17439 .21093 7.0115 7.8730
Kumasi Polytechnic 29 3.1897 .92691 .17212 2.8371 3.5422
Capecoast Polytechnic 31 5.5684 1.03973 .18674 5.1870 5.9498
Ho Polytechnic 22 5.5032 1.05486 .22490 5.0355 5.9709
Koforidua Polytechnic 28 5.6889 1.15467 .21821 5.2412 6.1367
Accra Polytechnic 27 7.4781 1.15436 .22216 7.0215 7.9348
Total 200 5.3837 1.96721 .13910 5.1094 5.6580
Table 20 indicates descriptive statistics that show impact of entrepreneurship education across the seven levels of
type of institution (polytechnic). Students from Accra Pylytechnic had the highest impact (M = 7.478, SD 1.154), followed
by students from Takoradi Polytechnic (M = 7.442, SD = 1.174). Students from Sunyani Polytechnic had the lowest impact
(M = 3.083, SD = 0.705). This establishes a clue that impact of entrepreneurship education is not the same in all
polytechnics. Tables 21 and 22 come with an ANOVA test that indicates if the difference in Table 20 is significant.
Table 21: Homogeneity of Variances (Impact by Type of Institution)
Levene Statistic df1 df2 Sig.
2.404 6 193 .029
Table 21 is a test for homogeneity of variances across the seven levels of parenting status. It is seen that there is
no homogeneity of variances across the seven levels. This means that the homogeneity of variances assumption for
ANOVA is not satisfied.
Table 22: ANOVA (Impact by Type of Institution)
Sum of Squares df Mean Square F Sig.
Between Groups 562.847 6 93.808 87.352 .000

Biographic and Personal Factors that Affect Impact of 31 Entrepreneurship Education in Ghanaian Polytechnics
www.tjprc.org [email protected]
Table 22: Contd.,
Within Groups 207.264 193 1.074
Total 770.111 199
Table 22 is the F-test for the null hypothesis that impact of entrepreneurship education is the same in Ghanaian
polytechnics. This test, according to Table 22, is significant at 5% significance level, F (2, 193) = 93.808, p = .000.
The null hypothesis is therefore not confirmed. Hence, there is a significant difference in the impact of entrepreneurship
education across Ghanaian polytechnics.
In Table 25 of Appendix A is a post hoc test for findings in Table 22. In this table, impact of entrepreneurship
education in Cape Coast Polytechnic is not significantly different from that of Koforidua Polytechnic (p = 1.00) and Ho
Polytechnic (p = 1.00). Also, the impact of entrepreneurship education in Accra Polytechnic is not significantly different
from that of Takoradi Polytechnic (p = 1.00). In Table 26 of Appendix B, the impact of entrepreneurship education on
Kumasi Polytechnic is not significantly different from that of Sunni Polytechnic.
Table 23: Correlations (Impact by Gender, Academic Capability, Employment Status and Financial Status)
Impact Gender Academic
Capability
Employment
Status
Financial
Status
Kendall's
tau_b Impact
Correlation Coefficient 1.000 .543**
.718**
.543**
.705**
Sig. (2-tailed) . .000 .000 .000 .000
N 200 200 200 200 200
**. Correlation is significant at the 0.05 level (2-tailed).
Table 23 shows Kendall's tau_b correlations between impact of entrepreneurship education and gender, academic
capability, employment status and financial status. It can be seen that impact of entrepreneurship education is highly
positively related to gender, r (200) = 0.543, p = .000; academic capability, r (200) = 0.718, p = .000; employment status, r
(200) = 0.543, p = .000; and financial status, r (200) = 0.705, p = .000, at 5% significance level. This means that each of
gender, academic capability, employment status and financial status affects impact of entrepreneurship education highly.
Table 24: Correlations (Impact by Parenting Status, Marital Status and Type of Institution)
Impact Parenting
Status
Marital
Status
Type of
Institution
Kendall's
tau_b Impact
Correlation Coefficient 1.000 .665**
.543**
.342**
Sig. (2-tailed) . .000 .000 .000
N 200 200 200 200
**. Correlation is significant at the 0.01 level (2-tailed).
Table 24 shows Kendall's tau_b correlations between impact of entrepreneurship education and parenting status,
marital status and type of institution. It can be seen that impact of entrepreneurship education is highly positively related to
parenting status, r (200) = 0.665, p = .000; marital status, r (200) = 0.543, p = .000; and type of institution, r (200) = 0.342,
p = .000, at 0.05 significance level. This means that each of parenting status and marital status affects impact of
entrepreneurship education strongly. Type of institution affects impact of entrepreneurship education weakly.
DISCUSSIONS
Considering findings in this study, it is worth saying that the primary hypothesis of the study is rejected at 5%
significance level. Therefore, impact of entrepreneurship education is affected by each of gender, academic capability,
employment status, financial status, parenting status, marital status and type of school. This implies that the potential of

32 Samuel Tuffour
Impact Factor (JCC): 3.9678 Index Copernicus Value (ICV): 3.0
entrepreneurship education in Ghanaian polytechnics in terms of equipping students with the practical ability to setup and
manage businesses depends on gender of students; the academic ability of student; whether a student is employed or not;
the financial ability of the student or his/her parents; the kind of parenting a student is involved in; whether a student is
married or not; and the type of polytechnic the student attends. At the theoretical level, this finding is supported by
Wegner, 2011, Mathews et al. 2003 and Costa & McCrae, 1991) in discussing the essence of the “Big five personality
traits” and its model, Five Factor Model. Skinner (1963) also argued along the meaning of the Social Learning Theory in
favor of this study’s finding. At the empirical level, the investigation of Wilson & Peter (2006) showed that this study’s
biographic and personal attributes affect the effect of entrepreneurship education. There is therefore ample reliable
evidence that impact of entrepreneurship education in Ghanaian polytechnics is influenced by the factors of gender,
academic capability, employment status, financial status, parenting status, marital status and type of school.
CONCLUSIONS AND RECOMMENDATIONS
It is concluded that the impact of entrepreneurship education is affected by each of gender, academic capability,
employment status, financial status, parenting status, marital status and type of school.
Therefore, students in Ghana can be better empowered to create jobs when entrepreneurship education is
administered based on a consideration of these factors in: (1) entrepreneurship education designing curricula; (2) recruiting
tutors for teaching entrepreneurship; (3) developing entrepreneurship teaching methods; (4) designing admission criteria
and (5) acquiring entrepreneurship teaching materials. Findings of this study also suggest that institutions need to employ
Psychologists heavily in planning and implementing schemes of entrepreneurship education. This is owing to the fact that
these biographic and personal factors would be better understood and considered in granting entrepreneurship education
when they are reckoned from a psychological viewpoint.
Future researchers are encouraged to investigate the affect of factors such as race, culture, religion and the like on
the impact of entrepreneurship education. This study could not consider these factors owing to data unavailability on them.
Meanwhile Wegner’s (2011) interpretation of the Big Five Model and Skinner’s (1963) interpretation of the Social
Learning Theory recognize these factors as determinants of impact of entrepreneurship education.
REFERENCES
1. Bandura, A. (1963). Social learning and personality development. New York: Holt, Rinehart, and Winston.
2. Costa, P.T.,Jr, McCrae, R.R. (1992). Revised NEO Personality Inventory (NEO-PI-R) and NEO Five-Factor
Inventory (NEO-FFI) manual. Odessa, FL: Psychological Assessment Resources.
3. Ghana Statistical Service (2010). Annual Report 2010, the Level of Employment in Ghana, pp. 14-16.
4. Honu, F. L.; Gakpe, G. (2006). Why pursue entrepreneurship education: National productivity perspective,
Journal of African Business and Management, 18 (2): 234-244.
5. Kuratko, D. F. (2005). A review of factors influencing entrepreneurship education: Tertiary perceptive,
International Journal of Entrepreneurship and Business, 23 (1): 321-338.
6. Lundstrom, A.; Stevenson, L. A. (2005). Entrepreneurship Policy: Theory and Practice. Springer.
ISBN 038724140X.

Biographic and Personal Factors that Affect Impact of 33 Entrepreneurship Education in Ghanaian Polytechnics
www.tjprc.org [email protected]
7. Matthews, G., Deary, I. J., Whiteman, M. C. (2003). Personality Traits. Cambridge University Press. Page 24.
8. McMillan, W. Long, W. A. (1987). Entrepreneurship education in the nineties, Journal of Business Venturing, 2:
261-275.
9. Osnabrugge, M. V.; Robinson, R. J. (2000). Angel Investing. John Wiley & Sons. ISBN 0787952028.
10. Reynolds, P. D. (2010). Entrepreneurship in the United States: The Future Is Now. Springer. ISBN 1441942750.
11. Reynolds, P. D. (1997). Leveraging Resources: Building An Organization On An Entrepreneurial Resource Base.
Frontiers of Entrepreneurship Research, 1997. Babson College. ISBN 0910897182.
12. Shane, S. A. (2003). A General Theory of Entrepreneurship: the Individual-Opportunity Nexus. Edward Elgar
Publishing. ISBN 1843769964.
13. Skinner, B. F. (1963). Science and human behavior. New York: Appleton.
14. Stuart, C.; Des, D. (2000). Generation Entrepreneur. FT Press. p. 202.
15. Trade Union Congress (2013). 2014 Budget Fails to Recognize need for Intervention to Unemployment in Ghana,
Press Release, 26th
November 2013, Accra Ghana.
16. Veciana, J. M.; Aponte, M.; Urbano, D. (2005): University students’ attitudes towards entrepreneurship: A two
country comparison, International Entrepreneurship and Management Journal, 1: 165-182.
17. Wegner, S. G. (2011). Psychology (2nd ed.), Worth, pp. 474–475.
18. Wilson, S. M., Peterson, P. L. (2006). Theories of Learning and Teaching: What do they Mean for Educators?
National Education Association, 34 (1): 5-23.
APPENDICES
APPENDIX A
Table 25: Tamhane Multiple Comparison (Impact by Type of Institution) – Block 1
(I) Type of Institution (J) Type of Institution Mean
Difference (I-J) Sig.
Capecoast Polytechnic
Accra Polytechnic -4.28849* .000
Sunyani Polytechnic 2.48589* .000
Takoradi Polytechnic -1.87387* .000
Kumasi Polytechnic 2.37873* .000
Ho Polytechnic .06521 1.000
Koforidua Polytechnic -.12054 1.000
Accra Polytechnic -1.90976* .000
Ho Polytechnic
Sunyani Polytechnic 2.42068* .000
Takoradi Polytechnic -1.93908* .000
Kumasi Polytechnic 2.31353* .000
Capecoast Polytechnic -.06521 1.000
Koforidua Polytechnic -.18575 1.000
Accra Polytechnic -1.97497* .000
Koforidua Polytechnic
Sunyani Polytechnic 2.60643* .000
Takoradi Polytechnic -1.75333* .000
Kumasi Polytechnic 2.49927* .000
Capecoast Polytechnic .12054 1.000
Ho Polytechnic .18575 1.000

34 Samuel Tuffour
Impact Factor (JCC): 3.9678 Index Copernicus Value (ICV): 3.0
Accra Polytechnic -1.78922* .000
Accra Polytechnic
Sunyani Polytechnic 4.39565* .000
Takoradi Polytechnic .03589 1.000
Kumasi Polytechnic 4.28849* .000
Capecoast Polytechnic 1.90976* .000
Ho Polytechnic 1.97497* .000
Koforidua Polytechnic 1.78922* .000
*. The mean difference is significant at the 0.05 level.
APPENDIX B
Table 26: Tamhane Multiple Comparison (Impact by Type of Institution) – Block 2
(I) Type of Institution (J) Type of Institution Mean
Diffrences (I-J) Sig.
Sunyani Polytechnic
Takoradi Polytechnic -4.35976* .000
Kumasi Polytechnic -.10716 1.000
Capecoast Polytechnic -2.48589* .000
Ho Polytechnic -2.42068* .000
Koforidua Polytechnic -2.60643* .000
Accra Polytechnic -4.39565* .000
Takoradi Polytechnic
Sunyani Polytechnic 4.35976* .000
Kumasi Polytechnic 4.25260* .000
Capecoast Polytechnic 1.87387* .000
Ho Polytechnic 1.93908* .000
Koforidua Polytechnic 1.75333* .000
Accra Polytechnic -.03589 1.000
Kumasi Polytechnic
Sunyani Polytechnic .10716 1.000
Takoradi Polytechnic -4.25260* .000
Capecoast Polytechnic -2.37873* .000
Ho Polytechnic -2.31353* .000
Koforidua Polytechnic -2.49927* .000
Accra Polytechnic -4.28849* .000