Emotional intelligence and its effect on health behaviour · R. , Tranel, Denburg, & Bechara,...
38
Emotional intelligence and its effect on health behaviour Erasmus University Rotterdam Behavioural Economics Supervisor: Han Bleichrodt Co-reader: Chen Li Thesis by: Jemimah Erasmus 323961 Abstract This paper shows how emotional intelligence has a positive correlation with doing well on cognitive tasks and exercising.
Transcript of Emotional intelligence and its effect on health behaviour · R. , Tranel, Denburg, & Bechara,...
Emotional intelligence and its
effect on health behaviour
Erasmus University Rotterdam Behavioural Economics
Supervisor: Han Bleichrodt Co-reader: Chen Li
Thesis by: Jemimah Erasmus 323961
Abstract This paper shows how emotional intelligence has a positive correlation with doing well
on cognitive tasks and exercising.

1
Introduction ......................................................................................................................................................................... 2
Statement of the problem .......................................................................................................................................... 2
Purpose of the study .................................................................................................................................................... 2
What is emotional intelligence? ................................................................................................................................... 3
Emotional intelligence, mental and physical health ....................................................................................... 4
Lower emotional intelligence and deviant behaviour ................................................................................... 4
Higher emotional intelligence and 'good' behaviour ..................................................................................... 5
Emotional intelligence, leadership skills, and task performance .............................................................. 5
Training emotional intelligence .............................................................................................................................. 5
Hypothesis options ............................................................................................................................................................ 6
Measures of emotional intelligence ............................................................................................................................ 6
SSEIT scale ....................................................................................................................................................................... 7
The Dulewicz and Higgs EIQ ..................................................................................................................................... 7
The MEIS, MSCEIT, and MSCEIT V2.0 ................................................................................................................... 7
The EQ-i ............................................................................................................................................................................. 8
Experimental design ......................................................................................................................................................... 8
7-point Likert scale as dependent variable ........................................................................................................ 8
Procedure ......................................................................................................................................................................... 8
Data analysis ........................................................................................................................................................................ 9
Nonparametric testing ............................................................................................................................................. 12
Assumptions ................................................................................................................................................................. 13
Regression ..................................................................................................................................................................... 17
Discussion .......................................................................................................................................................................... 18
Reference list .................................................................................................................................................................... 20
Appendix 1 ......................................................................................................................................................................... 25
Appendix 2 ......................................................................................................................................................................... 27

2
Introduction People with higher emotional intelligence tend to do better in many aspects of life compared to
people with lower emotional intelligence. Emotional intelligence has been shown to have strong
correlations with developmental, educational, clinical, and counselling, industrial, and
organizational psychology (Bar-On R. , 2001). Emotional intelligence has also been related to
success and academic achievements (Parker J. D., Summerfeldt, Hogan, & Majeski, 2004) (Van
der Zee, Thijs, & Schakel, 2002), work success and performance (Vakola, Tsaousis, & Nikolaou,
2004), leadership (Cooper & Sawaf, 1997), and occupational stress (Bar-On, Brown, Kirkcaldy, &
Thome, 2000); (Nikolaou & Tsaousis, 2002). The higher one advances in one’s career, the more
important emotional intelligence becomes (Dulewicz & Higgs, 2003). In Ciarrochi, Deane, &
Anderson (2002). People who scored high on emotional intelligence, cope more effectively with
environmental demands and pressures. In 2005, research showed that people with higher EI
levels used exercise both for interpersonal and intrapersonal reasons. Interpersonally, as these
individuals exercised to socialize with other people, and interpersonal, as they exercised to
moderate their mood (Austin & Saklofske, 2005). Austin and Saklofske also show the negative
correlation between peer pressure for excessive amount of alcohol consumption and individuals
with high emotional intelligence levels. Furthermore, in Tsaousis & Nikolaou’s (2005), the
association with smoking, for example, is discussed to be negatively correlated with people who
have high emotional intelligence levels.
This paper will make an empirical study to show the positive relationship between emotional
intelligence and cognitive tasks. Furthermore, this paper will also show a significant positive
correlation between emotional intelligence and exercising, and show what errors should be
avoided when using several categories per variable to explain the data. By giving focus on
training people on their emotional intelligence, people can perform better on tasks, and adopt
healthier behavioural traits. Since it is possible to improve the emotional intelligence of a
person, relatively more than the IQ of a person, more people could benefit of having a higher
emotional intelligence, especially people with lower IQ levels.
Statement of the problem IQ has always been one of the main indicators for success in life. However, research has shown
that people who tend to have higher emotional intelligence levels tend do to better personally
and professionally in their lives, compared to people who only have high IQ’s (Aydin, Leblebici,
Arslan, & Oktem, 2005). In a society where the world has become more globalised, and different
cultures become more entangled every day, and different types of people need to communicate
and work well together, understanding one’s emotions, and those of others has become more
crucial. Emotional intelligence can be taught, measured and developed (Dulewicz & Higgs,
1999). By doing so, one can deal with emotions successfully, such as frustration, stress, and
other negative emotions. This way, people deal better with issues in life. By focussing on
emotional intelligence, performance on many aspects in life can be improved.
Purpose of the study Research shows that emotional intelligence can improve one’s life in different ways. Since
evidence (Piaget, 1981) suggests that mood states influence cognitive performance, one might
expect those with higher emotional intelligence to do better on difficult cognitive tasks
(Damasio, 1999). Furthermore, higher emotional intelligence should enable individuals to better
regulate negative emotions such as frustration when dealing with difficult situations and not
interfere with performance, nor resorting to drinking or smoking, and exercise more. When
individuals have high emotional intelligence, they can identify and control their own emotions,
and understand those of others. This same control on emotions can help focus on the positive

3
emotions to achieve maximum personal engagement and productivity in themselves and others
(Lam & Kirby, 2002), showing that emotional intelligence adds to the improvement of one’s
personal and professional life. This study further supports these previous researches, where the
focus lies on the positive correlations that exist between emotional intelligence and exercise, and
the negative correlations with drinking and smoking. Thus, the research question of this paper.
How does emotional intelligence affect one’s health behaviour?
What is emotional intelligence? Dating back to the 1920’s, E. L. Thorndike divided intelligence into three sectors; abstract,
mechanical, and social intelligence. Here, he referred social intelligence as the ability to
understand and manage people. Gardner (1983) continued this research in intrapersonal and
interpersonal intelligence. However, the first authors to coin the term ‘emotional intelligence’
were Salovey and Mayer in 1990. Emotional intelligence is a subset of Gardner’s personal
intelligences. Salovey and Mayer (1990) divided emotional intelligence into three categories;
appraisal and expression of emotion in oneself and of others, regulation of emotion, and
utilization of emotions in problem solving. The authors defined emotional intelligence as “the ability to monitor one’s own and others’ feelings and emotions, to discriminate among them and to use this information to guide one’s thinking and actions” (Salovey & Mayer, 1990, p. 149). To
elaborate, if a person can perceive emotions, this person is able to recognize facial expressions,
voice, and body language. If a person can use emotion to help one think, and being able to
recognize when to use which suitable emotion or if it is needed in the first place, one can
generate emotions to assist thought. As for understanding emotion, one can analyse emotion and
be aware in which direction this emotion will go. Furthermore, one can also understand how
these emotions work, and how it goes hand in hand with prepositional thought and the growth
of language. Managing emotions on the other hand, involves the remaining parts of one's
personality and how this person manages emotions in a contextual form of one's goal, self-
knowledge, and social awareness (Salovey & Mayer, 1990) . In 1995, Goleman wrote the book ‘Emotional Intelligence’ which expanded the term to also include specific social and
communication skills which are connected to understanding and expressing of emotions. A
model created by Cooper and Sawaf (1997) divided emotional intelligence into four keystones
which included, emotional literacy, emotional fitness, emotional depth, and emotional alchemy.
Emotional literacy is defined as knowing one’s own emotions and how they function, emotional
fitness is defined as emotional hardiness and flexibility, emotional depth includes emotional
intensity and potential for growth, while emotional alchemy is defined as the ability to use
emotions to spark creativity. In that same year, Mayer and Salovey revised their definition of
emotional intelligence, arguing it to be a real intelligence. It was defined as the capacity to
reason about emotions, and of emotions to enhance thinking. Divided into four sections, it
included the abilities to accurately perceive emotions, to access and generate emotions to assist
thought, to understand emotions and emotional knowledge, and to reflectively regulate
emotions to promote emotional and intellectual growth (Mayer & Salovey, What is Emotional
Intelligence?, 1997). The latter being the most complex processing. Each section can cover a
basic developmental progress or become a more sophisticated version of it. Emotional
intelligence is also considered to make an individual become more effective in their social and
personal life by improving one’s emotional and social abilities competencies, and skills (Bar-On
R. , Tranel, Denburg, & Bechara, 2003). Lam and Kirby (2002) found that overall emotional
intelligence, emotional perception, and emotional regulation uniquely explained individual
cognitive-based performance over and beyond the level attributable to general intelligence. The
authors explain that it is not the presence of emotions which causes problems for task
performance, rather the specific emotion experienced and the interpretation and regulation of
these emotions. Therefore, it is important that the cognitive system of the brain recognizes and

4
is aware of these negative emotions to guard against them and build on enhancing emotions
which help improve individual and team performance (Lam & Kirby, 2002).
Emotional intelligence, mental and physical health Slaski & Cartwright (2002) state that when a person has a negative connection with its
environment, this leads to stress and negative emotions, pinpointing how the link exists
between stress and emotional intelligence. By being capable of being aware and in control of
these emotions for the person and of others, one can help reduce stress for oneself. Goldman,
Kraemer, and Salovey (1996) studied 134 undergraduate students, and determined that the
undergraduates who focussed on mood repair, were less likely to report illness, concluding that
how one assesses mood is a crucial mediator between reporting illnesses and having symptoms
and distress. When Ciarrochi et al. (2002) measured stress, emotional intelligence (both
objectively and self-measured), and mental stability, the authors concluded that stress had an
association with negative emotions including suicidal thoughts for people who scored high in
emotional perception and those who scored low in managing others’ emotions. In Tsaousis &
Nikolaou’s (2005) paper, emotional intelligence is also proven to be negatively associated with
not only good physical and psychological health, but also gathered data showing that emotional
intelligence was negatively associated with smoking and drinking, and positively associated with
exercising. This shows the relationship between emotional intelligence and health functioning.
Dulewicz et al. (2003) also found a correlation between physical and psychological health with
emotional intelligence in a group of retail managers. Stress, distress, morale, and poor quality
were measured against emotional intelligence. Parker et al. (2004) show that there is a strong
association with several dimensions of emotional intelligence for students who achieved a GPA
of 80% or better. These dimensions include intrapersonal, adaptability, and stress management
abilities. The authors show in their study that stress management is a good predictor for
academic success, and are therefore an important factor for a successful transition from high
school to university, since it includes that students can manage stressful situations in a relatively
calm and proactive way. People who receive a high score for stress management ability, are
rarely impulsive and work well under pressure (Bar-On R. , 1997). As Matthews and Zeinder
accurately put it; ‘adaptive coping might be conceptualized as emotional intelligence in action,
supporting mastery emotions, emotional growth, and both cognitive and emotional, allowing us
to evolve in an ever-changing world’ (p. 460). This can be explained by a few factors. An
individual might have a general way of thought that helps the individual with specific stressful
situation. Aside from that, there might be specific personality traits, which play a critical role in
controlling one’s adaptive outcome. Emotional intelligence might be the factor between handling
stress and the ability to select which traits need to be used at which time. Furthermore, a study
was performed to test the general wellbeing of a group of managers and it was concluded that in
general, the managers who exercised more often had a higher emotional intelligence. These
managers also had better health, since these managers used to exercise to reach achievement
and create a positive mind-set (Slaski & Cartwright, 2002). However, this was only a correlation,
as direct causality was not established.
Lower emotional intelligence and deviant behaviour Some studies have suggested lower emotional intelligence is related to involvement in self-
destructive behaviours such as deviant behaviour, cigarette smoking, (Brackett & Mayer, 2003)
(Trinidad & Johnson, 2002) and alcohol consumption (Formica, 1998). Lower emotional
intelligence in males, principally the inability to perceive emotions and to use emotion to
facilitate thought, was associated with negative outcomes, including illegal drug and alcohol use,
deviant behaviour, and poor relations with friends (Bracket, Mayer, & Warner, 2004) (Mayer,
Caruso, & Salovey, 1999). Studies have also shown that these correlations are independent from
5
personality and verbal intelligence (Bracket, Mayer, & Warner, 2004). Goleman (1995)
hypothesized that low levels of emotional intelligence resulted in an inability to cope and
manage one’s emotions which contributes to the onset of substance abuse. One of the abilities
one had when having a higher emotional intelligence, is the ability to manage emotions. One of
these emotions studied is the effect of peer pressure on adolescents. Lower tobacco and alcohol
abuse can be reduced, if adolescents are able to better detect unwanted peer pressure and
overcome it. If kids are being taught and trained on their emotional intelligence, this can be
achieved, and thus possibly lead to better health behaviour.
Higher emotional intelligence and 'good' behaviour Research has also shown that emotional intelligence has been linked with positive behaviours.
For example, Seipp (1991) suggests that individuals with high emotional intelligence can use
buffering techniques to ensure that emotions can be segregated and controlled to maintain a
good level of performance of oneself and as a team, since they are less likely to be negatively
affected by fear, anxiety, and other negative emotions. Similarly, individuals with high emotional
intelligence can also use positive emotions to help produce maximum engagement and
productivity for themselves and for a team (Seipp, 1991). High emotional intelligence is related
to self-reported parental warmth, secure attachment, in children’s pro-social behaviour in
school, and manager effectiveness (Mayer, Caruso, & Salovey, 1999). Stein and Book (2011),
mention in their book that individuals who are highly emotional intelligent can intuitively grasp
what others want and need; are aware of their own strengths and weaknesses; are able to
remain unflustered by stress and are generally regarded as having good ‘people skills’. Children
also benefit from having a higher emotional intelligence, being considered more prosocial by
their teachers and less aggressive by other children (Rubin, 1999). As for work environments,
teams who scored higher on their emotional intelligence levels were rated as more effective
workers by their managers (Rice, 1999). Overall, individuals who had higher emotional
intelligences, coped better stress, were relatively healthier and had better performance levels.
Emotional intelligence, leadership skills, and task performance To be a successful leader, one is believed to have a high emotional intelligence. Those leaders
who can regulate their own emotions, can serve as great role models for their teams, which in
turn makes the team trust their leader. Empirical studies have shown significant correlations
between emotional intelligence and three aspects of transformational leadership, namely
idealized influence, inspirational motivation, and individualized consideration (Barling, Slater, &
Kelloway, 2000). A high correlation between emotional intelligence and all categories of
transformational leadership was found. It was also advised that emotional intelligence should be
tested when selecting new leaders/management (Gardner & Stough, 2002) (Palmer, Walls,
Burgess, & Stough, 2001). Furthermore, Schutte et al. (2001) also analysed the correlation
between emotional intelligence and cognitive tasks. By controlling for IQ, the researchers
measured emotional intelligence levels of the participants, with how well they did on difficult
cognitive tasks. Moreover, research has shown that combining IQ and emotional intelligence
together was a better indicator for success, than measuring them separately (Dulewicz & Higgs,
Emotional intelligence; a review and evaluation study, 2000). A moderate high level of emotion
can also facilitate learning (McGaugh, 1990) and a pleasant emotional state can enhance
problem solving abilities (Nantais & Schellenberg, 1999).
Training emotional intelligence Much can be said about emotional intelligence, however, if it is something given and cannot be
trained or developed, there is not much that can be done to improve or increase the level of
emotional intelligence. It is therefore of importance to show that training emotional intelligence is achievable and can be done successfully, and can lead to an improvement in health behaviour.
6
There are several ways to improve emotional intelligence of individuals and by doing so, it could
be used as a tool to nudge people's behaviour into finding practical ways to reduce stress and
promote health (Slaski & Cartwright, 2002). Many studies have shown how emotional
intelligence can be developed through training. For example, Lam and Kirby (2002) show that
two opposite emotional control mechanisms will be employed, depending on the emotion being
enhancing or distracting; namely buffering and personal engagement. Buffering entails
controlling unwanted emotions by segregating emotions, so the task performed is not
interrupted by such emotions (Ashforth & Humphrey, 1995). On the other hand, personal
engagement in tasks leads to high performance in tasks (Kahn, 1990) and Goleman (1997, p. 90)
also discusses that this peak performance is where ‘emotions are not just contained and
channelled, but positive, energized, and aligned with the task at hand’. Emotional knowledge can
be improved through education and if these relations are causal, perhaps training children and
adults in emotional intelligence can lead to their more adaptive behaviour. For example, it
appears that infusing emotional literacy programs into existing school curricula can help
increase emotional knowledge and work against the initiation and progression of harmful
behaviours such as excessive alcohol consumption, illegal drug use and deviant behaviour
(Brackett & Salovey, 2006). Goleman (1995) shows how emotional intelligence grows with age
and seems to also be linked with maturity. Through practice and commitment emotional
intelligence can be learned, developed, and improved. Furthermore women, in general, tend to
have a better understanding of their emotional intelligence. Reviewed research shows that
mothers communicate their feelings more to their daughters versus their sons. Additionally,
mothers also tend to display a wider range of feelings to their daughter, while responding less
expressively to their sons. Brody (2009) reports that when mothers communicate with their
daughters, as compared to their sons, they use more vivid facial expressions. This may
contribute to girls developing better skills at recognizing each other’s emotions, which leads to
them having a higher level of EI, compared to boys. Essentially, this shows that the level of EI a
person has is explained partially through the characteristics and gender of the child, but also on
how a parent communicated with the child. This can be compared with trainings in emotional
intelligence. Through the training of emotional intelligence, emotional intelligence can increase,
which in turn van help improve health behaviour.
Hypothesis options From the literature and everything discussed so far, the following hypothesis was formulated.
H1: People with higher emotional intelligence work better on cognitive tasks.
H2: People with higher emotional intelligence behave in a healthier manner.
Measures of emotional intelligence Ciarrochi et al. (2002) show in their paper that emotional intelligence has a distinctive construct
from other personality trait measures such as the big five personality traits, making it an
additional value when evaluating an individual, and not just measuring the same thing in a
different way. They also discuss that emotional intelligence is statistically different from other
relevant measures. A few assessments have been created to measure emotional intelligence, and
even though they do not contradict each other, they tend to have slightly different perspectives
on how to measure emotional intelligence. There are mainly two different concepts of emotional
intelligence, and therefore also two different categories in measuring emotional intelligence. The
first concept is the ability of emotional intelligence, and the second is a “mixed” emotional
intelligence. The ability of emotional intelligence is defined as being able to “engage in sophisticated information processing about one’s own and others’ emotions and the ability to
7
use this information as a guide to thinking and behaviour” (Mayer, Salovey, & Caruso, 2008). The
“mixed” emotional intelligence considers a combination of non-cognitive capabilities that leads
to successful coping under difficult situations. Aside from the abilities of emotional intelligence,
motivation, personality, temperament, character, and social skills are also included.
One of the best-known tests are the MSCEIT V2.0 and its predecessors (MEIS and MSCEIT),
which is an ability test of emotional intelligence (Mayer, Caruso, & Salovey, 2002). The best
known mixed emotional intelligence tests are the EQ-i (the Emotional Quotient Inventory),
which is a self-report test of emotional intelligence (Bar-On R. , 1997), and the SSEIT (Schutte et
al.’s self-report Emotional Intelligence test (Schutte, et al., 1998), another self-report test. Self-
report tests are not as accurate as an ability test, where answers are either correct or incorrect.
Cooper and Sawaf (1997) also had an assessment created to measure emotional intelligence;
however, no information regarding its validity or reliability was presented. The EQ MAP
consisted out of 250 items, which in turn is divided in 21 scales. To obtain as many responses as
possible, it was decided to employ a survey using the lowest number of questions, while still
providing a realistic portrayal of the respondents’ level of emotional intelligence. The SSEIT
scale from Schutte et al. was chosen to measure participants’ emotional intelligence, based on
the size of the self-report. The SSEIT scale has one of the shortest questionnaires, which makes it
convenient when the individuals being asked, receive no compensation for filling it in. It has also
been shown to be a valid measure of emotional intelligence by several researchers mentioned
above. The SSEIT-scale and other emotional intelligence measures are explained below.
SSEIT scale The selected measure for emotional intelligence for this paper is the SSEIT scale. The SSEIT is a short self-report scale based on Salovey and Mayer’s (1990) original model of emotional intelligence. A pool of 62 items was created, which then after further analysis became a 33-item scale. The SSEIT scale was independently evaluated for clarity, readability, and the adequacy of implementation of the model. The test has a good internal consistency and test-retest variability, and has been able to predict grade point averages (GPA) of college students (Schutte, et al., 1998). Thirty of the 33 items are ranged from negative to strongly positive, whilst 3 are the other way around, where a reverse item scoring is needed for these 3 items. The SSEIT uses a self-report Likert scale test ranging from strongly agree to strongly disagree. The test measures emotional intelligence on four sub-scales: emotion perception, utilizing emotions, managing self-relevant emotions, and managing others’ emotions. Each sub-test score is graded and added together to the total score for the subjects.
The Dulewicz and Higgs EIQ The Dulewicz and Higgs EIQ started as a self-report test consisting out of 16 competencies
related to emotional intelligence. Later, it was tailored into a 7 elements self-report
questionnaire. The validity of this test has been examined by reviewing different books and
articles form several authors and papers to ensure that the questionnaire does indeed measure
emotional intelligence in a valid way. A positive, significant relationship was found between
scores of emotional intelligences and scores received of mental health, and job satisfaction
measures (Dulowicz, Higgs, & Slaski, 2003). For this paper, this test could not be found for use.
The MEIS, MSCEIT, and MSCEIT V2.0 Mayer, Caruso and Salovey attempted to measure emotional intelligence with the MEIS test,
which was later improved into the MSCEIT, and ultimately into the MSCEIT V2.0. The MEIS was
designed to measure emotional intelligence as a mental ability, where one’s capacity to emotions
to assist cognition is evaluated (Mayer & Salovey, 1997). This assessment is performance based
and argues that emotional intelligence can successfully describe specific skills related to
emotions, i.e. perceiving emotions, using emotions to facilitate thought, understanding emotions,

8
and managing emotions. The MSCEIT is an objective assessment as it can be answered either
right or wrong. There is a correlation between existing intelligences, but the test also shows
unique variance. Research has shown it to be reliable and valid as well. The MSCEIT V2.0
consists out of 141-item scale, making it a rather long test for the participants who do not have
enough incentive to fill in 141 items, making it less ideal for this paper.
The EQ-i The EQ-i is a self-report model approach to emotional intelligence. The EQ-i is a 133-item self-report measure divided into 15 different scales, measuring empathy, emotional self-awareness, stress tolerance, interpersonal relationships, social responsibility, impulse control, flexibility, happiness, optimism, assertiveness, self-regard, independence, self-actualization, problem solving, and reality testing. This assessment measures an “array of non-cognitive capabilities, competencies, and skills that influence one’s ability to succeed in coping with environmental demands and pressures” (Bar-On R. , 1997). Despite the EQ-i being a great measure for emotional intelligence, it is quite long as well to fill in, and was therefore not chosen this paper.
Experimental design 7-point Likert scale as dependent variable In the original SSEIT scale, a five-point Likert scale was used for their research. For this thesis, a
seven-point Likert scale was used as it would make the results more refined as the participants
would have more options to select from. Using a 7-point scale has shown to reach the upper
limits of the scale’s reliability (Nunnally, 1978), and might therefore affect the constructed
validity of the SSEIT scale, since the variance per question could be bigger. However, it has been
demonstrated that score from either a five-point scale of a seven-point scale are practically
equivalent and thus quite unlikely that any difference might arise from this adjustment (Colman,
Norris, & Preston, 1997).
The dependent variable is a sum of 33 Likert scale ordinal variables, with 7 categories, ranging
from completely disagree to completely agree. The minimum is 33 points, while the maximum
score possibly obtained is 231. When the dependent variable is considered an ordinal variable,
nonparametric tests should be applied, and will be tested in this paper. However, the Likert scale
can also be considered as a continuous interval variable. When the data is treated as interval
instead of ordinal data, it enables the possibility to use parametric tests, which in general have
more power and provide more information compared to non-parametric alternatives.
Furthermore, parametric tests tend to be more accurate, even when assumptions do not hold, up
to an extreme degree (Norman, 2010), concluding that using parametric tests are acceptable
when analysing Likert scale responses. Some researchers still do not agree with this, since you
cannot prove that the difference between “completely agree” and “somewhat agree” is the same
between “completely disagree” and “somewhat disagree”. However, other researchers believe
that there is an underlying latent variable that is continuous, especially if more than 5 categories
are present (Johnson & Creech, 1983) (Zumbo & Zimmerman, 1993). Since the SSEIT test is a
combined test to describe the trait emotional intelligence, a combined score will be used as the
dependent variable.
Procedure Each surveyor filled in the 33-points measure of emotional intelligence. Each sub-test score is
graded and then added together to give the total score for each individual. The 33 items of the
questionnaire are the indicators of the latent variable, emotional intelligence. The participants
needed to rate themselves on a seven-Likert scale which ranged from 1 = “to strongly disagree”
to 7 = “strongly agree”. Next, surveyors needed to participate in an assessment test, where 7
9
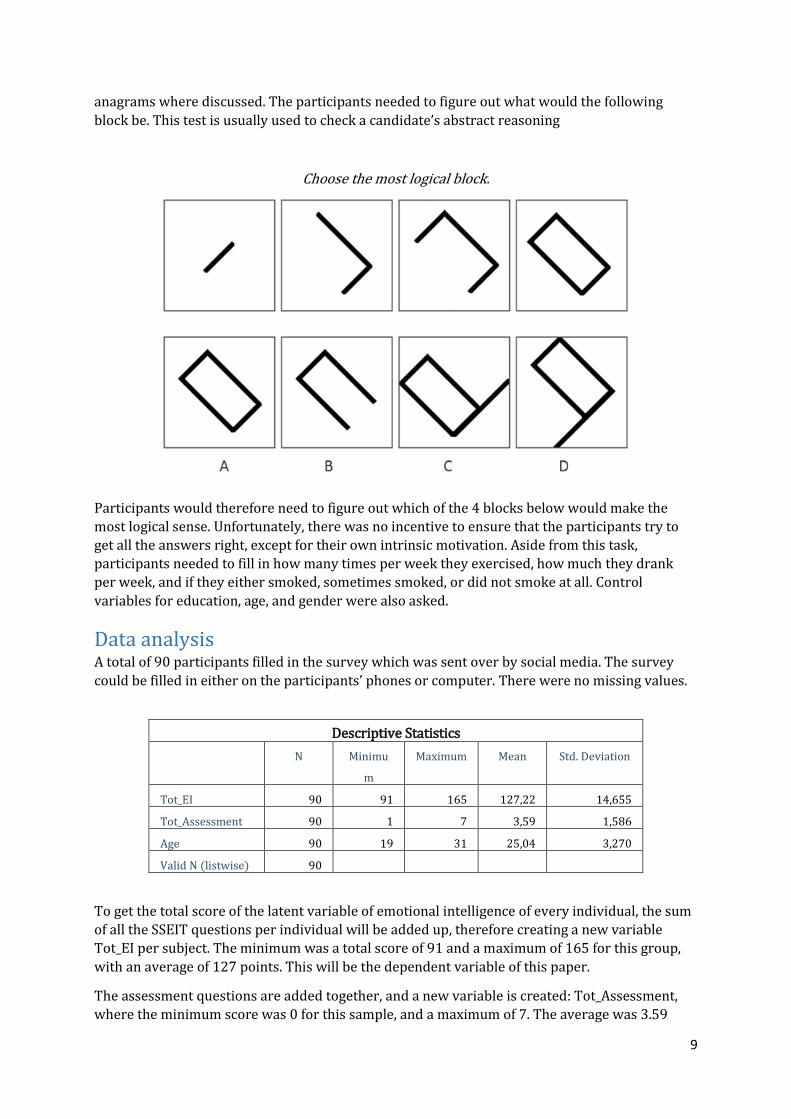
anagrams where discussed. The participants needed to figure out what would the following
block be. This test is usually used to check a candidate’s abstract reasoning
Choose the most logical block.
Participants would therefore need to figure out which of the 4 blocks below would make the
most logical sense. Unfortunately, there was no incentive to ensure that the participants try to
get all the answers right, except for their own intrinsic motivation. Aside from this task,
participants needed to fill in how many times per week they exercised, how much they drank
per week, and if they either smoked, sometimes smoked, or did not smoke at all. Control
variables for education, age, and gender were also asked.
Data analysis A total of 90 participants filled in the survey which was sent over by social media. The survey
could be filled in either on the participants’ phones or computer. There were no missing values.
Descriptive Statistics
N Minimu
m
Maximum Mean Std. Deviation
Tot_EI 90 91 165 127,22 14,655
Tot_Assessment 90 1 7 3,59 1,586
Age 90 19 31 25,04 3,270
Valid N (listwise) 90
To get the total score of the latent variable of emotional intelligence of every individual, the sum
of all the SSEIT questions per individual will be added up, therefore creating a new variable
Tot_EI per subject. The minimum was a total score of 91 and a maximum of 165 for this group,
with an average of 127 points. This will be the dependent variable of this paper.
The assessment questions are added together, and a new variable is created: Tot_Assessment,
where the minimum score was 0 for this sample, and a maximum of 7. The average was 3.59
10
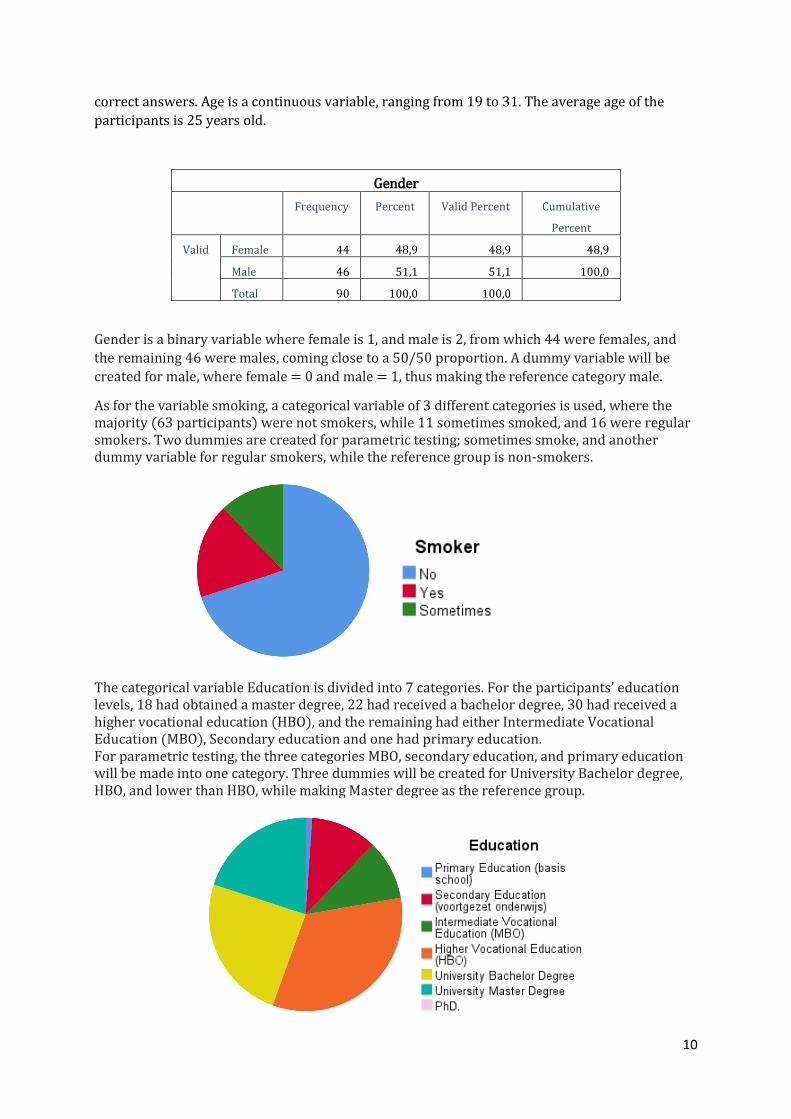
correct answers. Age is a continuous variable, ranging from 19 to 31. The average age of the
participants is 25 years old.
Gender
Frequency Percent Valid Percent Cumulative
Percent
Valid Female 44 48,9 48,9 48,9
Male 46 51,1 51,1 100,0
Total 90 100,0 100,0
Gender is a binary variable where female is 1, and male is 2, from which 44 were females, and
the remaining 46 were males, coming close to a 50/50 proportion. A dummy variable will be
created for male, where female = 0 and male = 1, thus making the reference category male.
As for the variable smoking, a categorical variable of 3 different categories is used, where the majority (63 participants) were not smokers, while 11 sometimes smoked, and 16 were regular smokers. Two dummies are created for parametric testing; sometimes smoke, and another dummy variable for regular smokers, while the reference group is non-smokers.
The categorical variable Education is divided into 7 categories. For the participants’ education levels, 18 had obtained a master degree, 22 had received a bachelor degree, 30 had received a higher vocational education (HBO), and the remaining had either Intermediate Vocational Education (MBO), Secondary education and one had primary education. For parametric testing, the three categories MBO, secondary education, and primary education will be made into one category. Three dummies will be created for University Bachelor degree, HBO, and lower than HBO, while making Master degree as the reference group.
11
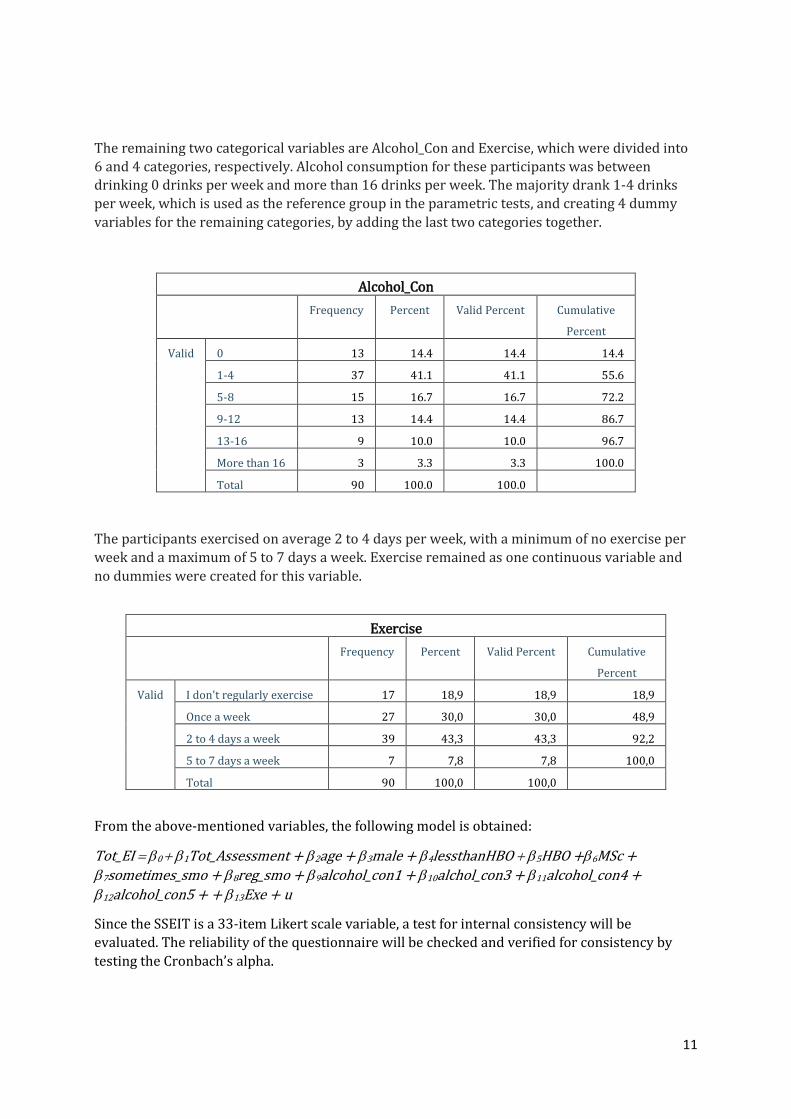
The remaining two categorical variables are Alcohol_Con and Exercise, which were divided into
6 and 4 categories, respectively. Alcohol consumption for these participants was between drinking 0 drinks per week and more than 16 drinks per week. The majority drank 1-4 drinks
per week, which is used as the reference group in the parametric tests, and creating 4 dummy
variables for the remaining categories, by adding the last two categories together.
Alcohol_Con
Frequency Percent Valid Percent Cumulative
Percent
Valid 0 13 14.4 14.4 14.4
1-4 37 41.1 41.1 55.6
5-8 15 16.7 16.7 72.2
9-12 13 14.4 14.4 86.7
13-16 9 10.0 10.0 96.7
More than 16 3 3.3 3.3 100.0
Total 90 100.0 100.0
The participants exercised on average 2 to 4 days per week, with a minimum of no exercise per
week and a maximum of 5 to 7 days a week. Exercise remained as one continuous variable and
no dummies were created for this variable.
Exercise
Frequency Percent Valid Percent Cumulative
Percent
Valid I don't regularly exercise 17 18,9 18,9 18,9
Once a week 27 30,0 30,0 48,9
2 to 4 days a week 39 43,3 43,3 92,2
5 to 7 days a week 7 7,8 7,8 100,0
Total 90 100,0 100,0
From the above-mentioned variables, the following model is obtained:
Tot_EI 0 1Tot_Assessment + 2age + 3male + 4lessthanHBO 5HBO +6MSc + 7sometimes_smo + 8reg_smo + 9alcohol_con1 + 10alchol_con3 + 11alcohol_con4 +
12alcohol_con5 + + 13Exe + u
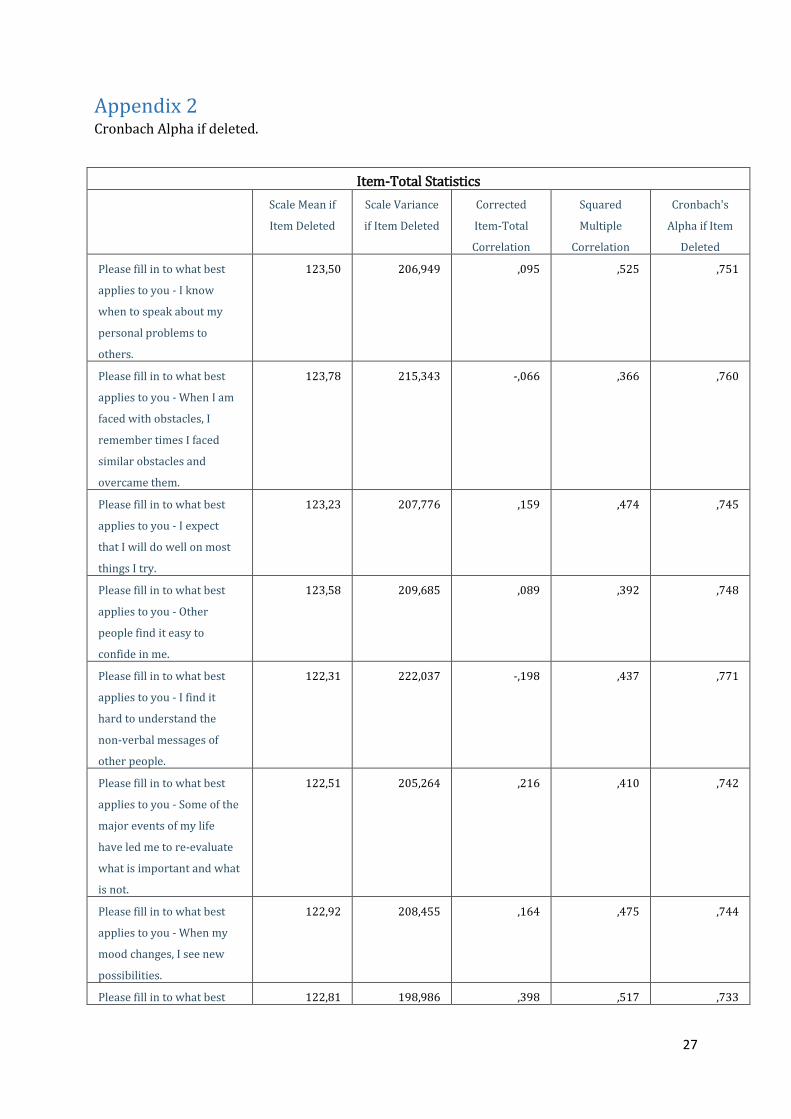
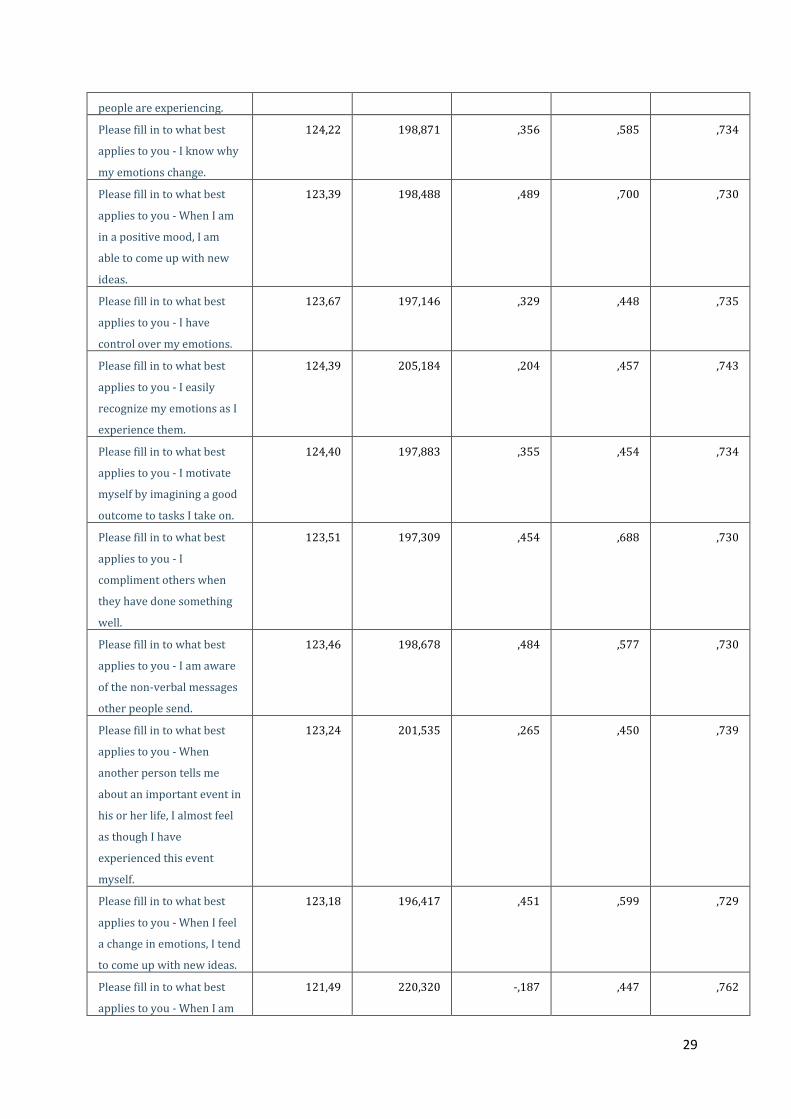
Since the SSEIT is a 33-item Likert scale variable, a test for internal consistency will be
evaluated. The reliability of the questionnaire will be checked and verified for consistency by
testing the Cronbach’s alpha.

12
Reliability Statistics
Cronbach's
Alpha
Cronbach's Alpha Based on
Standardized Items
N of Items
,746 ,770 33
From the table above can be seen that the Cronbach’s Alpha is 0.746, which indicates a high level
of internal consistency (on a scale from 0 to 1) for the emotional intelligence measure. A higher
alpha is possible if some items are removed, however, it is not a very substantial difference.
Despite possible higher alphas, these questions will not be removed as the alpha with all the
questions included is a reasonable alpha. From the Cronbach test can be concluded that these 33
questions are measuring the same latent variable. The remaining Cronbach’s Alpha test can be
found in the appendix of this paper.
Nonparametric testing The first test presented is to check if Tot_EI is normally distributed. The one-sample
Kolmogorov-Smirnov test is used. The significance level is higher than 5% (20%), indicating that
the null hypothesis cannot be rejected, showing that there is indeed a normal distribution for
this sample.
Testing across gender shows us that there is no significant difference between genders. By using
the independent-samples Mann-Whitney U test, we have a significance level of 0.622, which is
higher than a 10% level, which shows us that the null-hypothesis cannot be rejected. EI levels
are therefore on average not statistically different between male and female.
For the category smoking, a significance level of 0.303 is present, giving once more a higher
significance level of 10%. The independent-samples Kruskal-Wallis test is used. As for the
variable smoker, no significant difference can be seen between the three categories and their
emotional intelligence levels.
The same conclusions can be made for the category alcohol. Using the same test as for the
variable smoking. The significance level is 0.247, and thus higher than the 10% significance
level. Therefore, the variable Alcohol_Con does not have any statistically significant difference
between the groups when comparing their emotional intelligence levels and amount of average
weekly alcohol consumption.
As for exercise, the same conclusions can be made. By using the independent-samples Kruskal-
Wallis test, we can see that the significance level is 0.101, making it higher than the significance
level of 10%. We therefore cannot reject the null-hypothesis, which means that there is no
significant difference of emotional intelligence levels across the different categories of average
weekly exercise.
For the last parametric test, a Kruskal-Wallis test is also performed on emotional intelligence
levels and the different categories of education. As the previous tests, there is no significant
difference between education level with a significance level of 0.262, and thus higher than the
significance level of 10%. It can be therefore concluded that there is not statistical difference
between the levels of emotional intelligence levels and the different categories of education.

13
Assumptions Since not much information could be gathered from non-parametric tests, the focus will next be
put on parametric testing. To be able to use parametric tests, a few assumptions should hold for
a classic linear regression model.
Model must be linear in the parameters The scatterplot of the standardized predicted value with the standardized residuals is scattered
randomly and roughly linear around the zero line. This assumption does hold.
Furthermore, the plot below shows linearity in the model, as the plot is used by applying ordinary least squares. The dots remain quite close to the line.
14
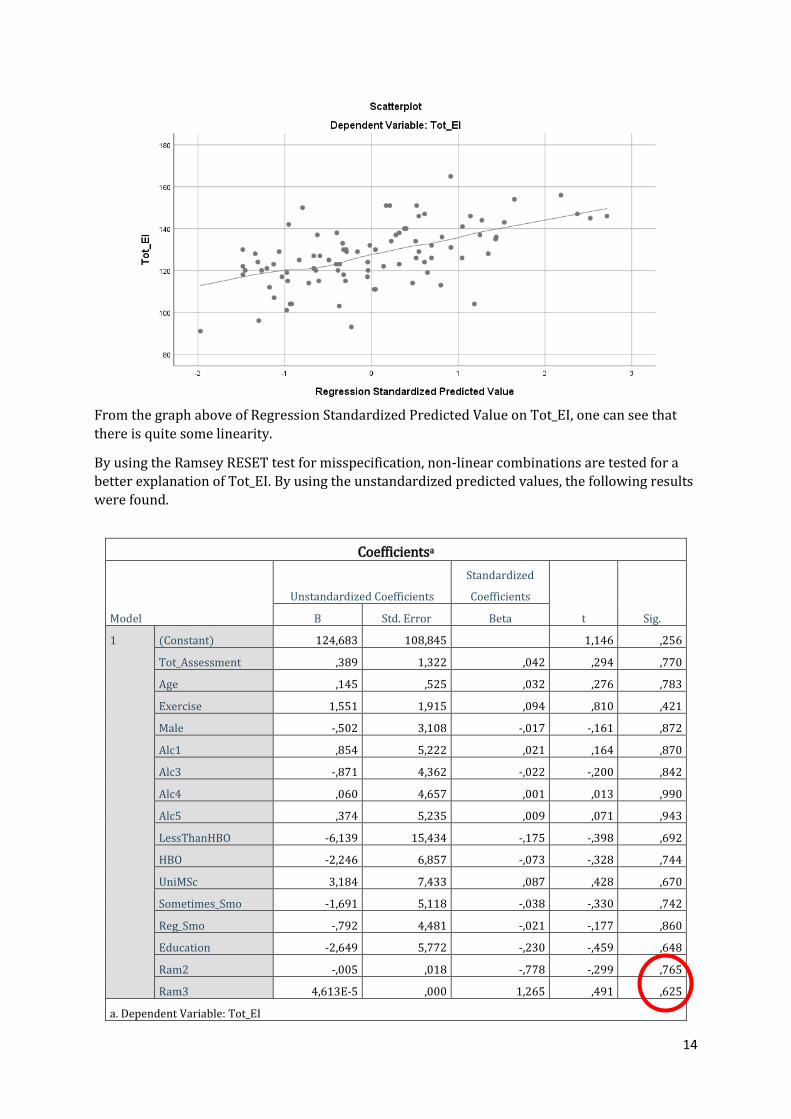
From the graph above of Regression Standardized Predicted Value on Tot_EI, one can see that
there is quite some linearity.
By using the Ramsey RESET test for misspecification, non-linear combinations are tested for a
better explanation of Tot_EI. By using the unstandardized predicted values, the following results
were found.
Coefficientsa
Model
Unstandardized Coefficients
Standardized
Coefficients
t Sig. B Std. Error Beta
1 (Constant) 124,683 108,845 1,146 ,256
Tot_Assessment ,389 1,322 ,042 ,294 ,770
Age ,145 ,525 ,032 ,276 ,783
Exercise 1,551 1,915 ,094 ,810 ,421
Male -,502 3,108 -,017 -,161 ,872
Alc1 ,854 5,222 ,021 ,164 ,870
Alc3 -,871 4,362 -,022 -,200 ,842
Alc4 ,060 4,657 ,001 ,013 ,990
Alc5 ,374 5,235 ,009 ,071 ,943
LessThanHBO -6,139 15,434 -,175 -,398 ,692
HBO -2,246 6,857 -,073 -,328 ,744
UniMSc 3,184 7,433 ,087 ,428 ,670
Sometimes_Smo -1,691 5,118 -,038 -,330 ,742
Reg_Smo -,792 4,481 -,021 -,177 ,860
Education -2,649 5,772 -,230 -,459 ,648
Ram2 -,005 ,018 -,778 -,299 ,765
Ram3 4,613E-5 ,000 1,265 ,491 ,625
a. Dependent Variable: Tot_EI
15
Ram2 is the unstandardized predicted values squared, and Ram3 is to the third power. Both variables are statistically insignificant, which indicates that these two additional powers do not improve the regression. Therefore, the model without these 2 variables is correctly specified, and the linear regression model is good and therefore meets the assumption of linear parameters. Sample Variation and random sampling When looking at the VIF of the multicollinearity tests, which can be found in the appendix, all VIF coefficients are smaller than 4, showing no multicollinearity between the variables. Furthermore, the higher VIF’s were on the dummy variables of exercise, which has 4 categories. The variables do not have the same value, and there is no correlation between two different values of the variables. Additionally, can be seen that there is no prefect multicollinearity. Zero conditional mean The average of this unobserved variable should be the same regardless of the independent variables. The expectation of the error, given any of the independent variables, is equal to zero as can be seen in the graph below.
Residuals Statisticsa
Minimum Maximum Mean Std. Deviation N
Predicted Value 111,46 145,15 127,22 7,385 90
Residual -35,346 29,002 ,000 12,658 90
Std. Predicted Value -2,135 2,428 ,000 1,000 90
Std. Residual -2,580 2,117 ,000 ,924 90
a. Dependent Variable: Tot_EI
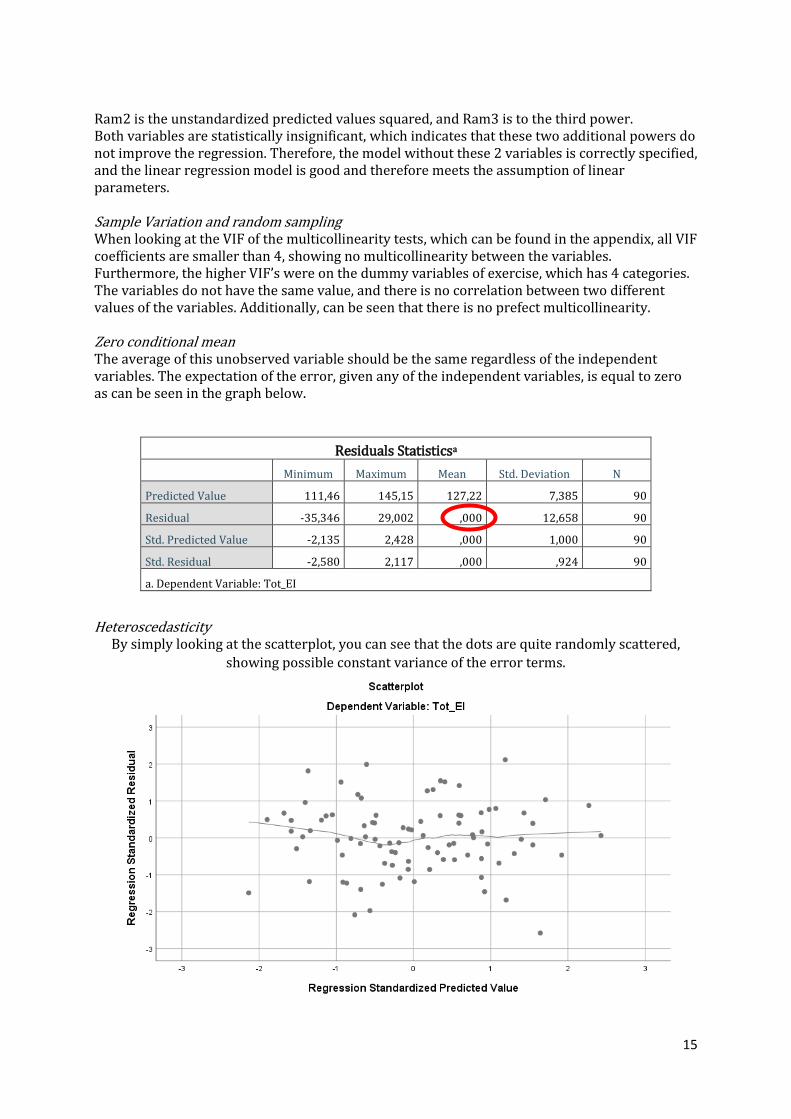
Heteroscedasticity
By simply looking at the scatterplot, you can see that the dots are quite randomly scattered,
showing possible constant variance of the error terms.

16
The Breusch Pagan test is performed and from the graph below can be seen that the p-value is
bigger than 5%, which shows that the null-hypothesis of homoscedasticity cannot be rejected,
indicating that there is no sign of heteroscedasticity, complying with this assumption.
Breusch-Pagan Test for Heteroskedasticitya,b,c
Chi-Square df Sig.
,039 1 ,843
a. Dependent variable: Tot_EI
b. Tests the null hypothesis that the variance of the errors does not depend on the values of
the independent variables.
c. Predicted values from design: Intercept + Tot_Assessment + Exercise + Age + Male +
Alc1 + Alc3 + Alc4 + Alc5 + LessThanHBO + HBO + UniMSc + Sometimes_Smo + Reg_Smo
No serial correlation The residuals should be uncorrelated. A Durbin-Watson Statistic will be performed to test this assumption. If the Durbin-Watson test is between 1.5 and 2.5, it is considered relatively normal. It can be concluded that the residuals are independent.
Model Summaryb
Model R R Square
Adjusted R
Square
Std. Error of the
Estimate Durbin-Watson
1 ,504a ,254 ,126 13,698 1,920
a. Predictors: (Constant), Reg_Smo, Exercise, LessThanHBO, Alc3, Sometimes_Smo, Male, Age,
Tot_Assessment, Alc1, UniMSc, Alc5, Alc4, HBO
b. Dependent Variable: Tot_EI
Normally distributed errors The error terms are normally distributed with zero mean and variance, and independent of the independent variables.
17
Additionally, as can be seen in the table below, the test of normality is also applied for the
residuals.
Tests of Normality
Kolmogorov-Smirnova Shapiro-Wilk
Statistic df Sig. Statistic df Sig.
Tot_EI ,058 90 ,200* ,993 90 ,906
*. This is a lower bound of the true significance.
a. Lilliefors Significance Correction
Since the p-value is higher than the 10% level, no statistically significant difference can be seen from a normal distribution, which means that this assumption is also met.
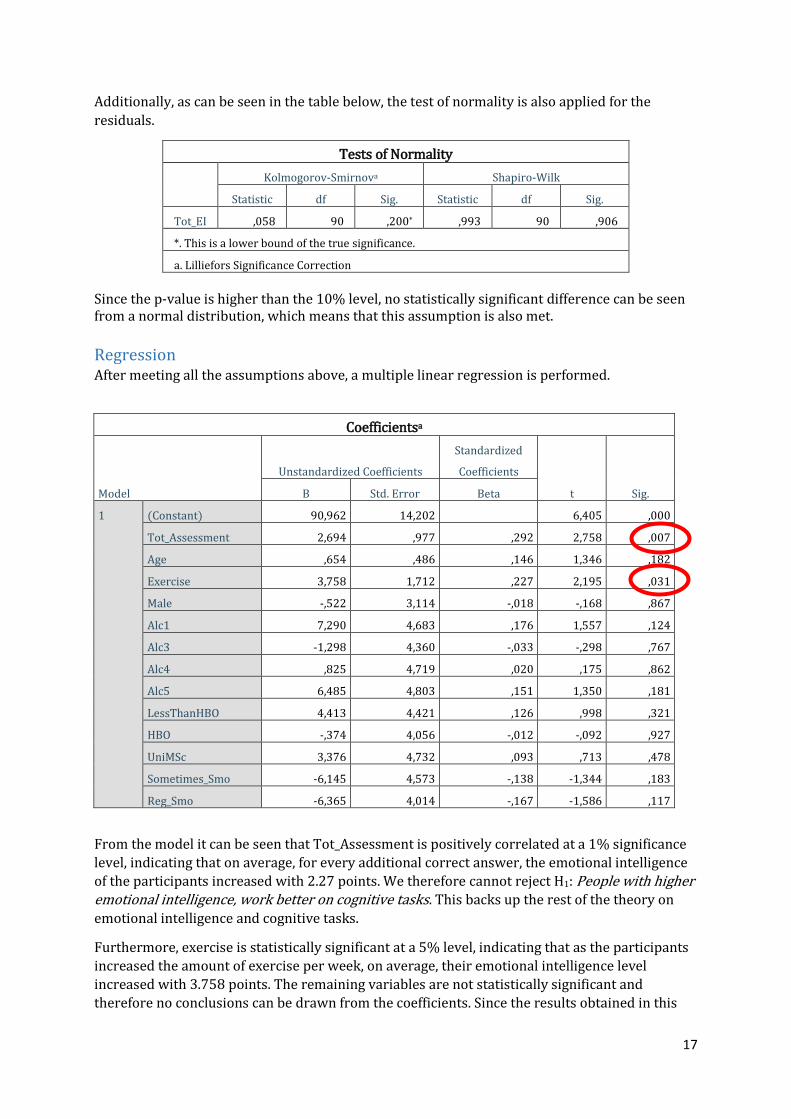
Regression After meeting all the assumptions above, a multiple linear regression is performed.
Coefficientsa
Model
Unstandardized Coefficients
Standardized
Coefficients
t Sig. B Std. Error Beta
1 (Constant) 90,962 14,202
6,405 ,000
Tot_Assessment 2,694 ,977 ,292 2,758 ,007
Age ,654 ,486 ,146 1,346 ,182
Exercise 3,758 1,712 ,227 2,195 ,031
Male -,522 3,114 -,018 -,168 ,867
Alc1 7,290 4,683 ,176 1,557 ,124
Alc3 -1,298 4,360 -,033 -,298 ,767
Alc4 ,825 4,719 ,020 ,175 ,862
Alc5 6,485 4,803 ,151 1,350 ,181
LessThanHBO 4,413 4,421 ,126 ,998 ,321
HBO -,374 4,056 -,012 -,092 ,927
UniMSc 3,376 4,732 ,093 ,713 ,478
Sometimes_Smo -6,145 4,573 -,138 -1,344 ,183
Reg_Smo -6,365 4,014 -,167 -1,586 ,117
From the model it can be seen that Tot_Assessment is positively correlated at a 1% significance
level, indicating that on average, for every additional correct answer, the emotional intelligence
of the participants increased with 2.27 points. We therefore cannot reject H1: People with higher emotional intelligence, work better on cognitive tasks. This backs up the rest of the theory on
emotional intelligence and cognitive tasks.
Furthermore, exercise is statistically significant at a 5% level, indicating that as the participants
increased the amount of exercise per week, on average, their emotional intelligence level
increased with 3.758 points. The remaining variables are not statistically significant and
therefore no conclusions can be drawn from the coefficients. Since the results obtained in this
18
research are different from what has been shown in the past, H2: People with higher emotional intelligence behave in a healthier manner, in two hypotheses.
H2a: People with higher emotional intelligence, exercise more.
H2b: People with higher emotional intelligence, drink and smoke less.
From the regression above, H2a cannot be rejected. This backs up the theory behind emotional
intelligence and exercising. H2b on the other hand, is rejected.
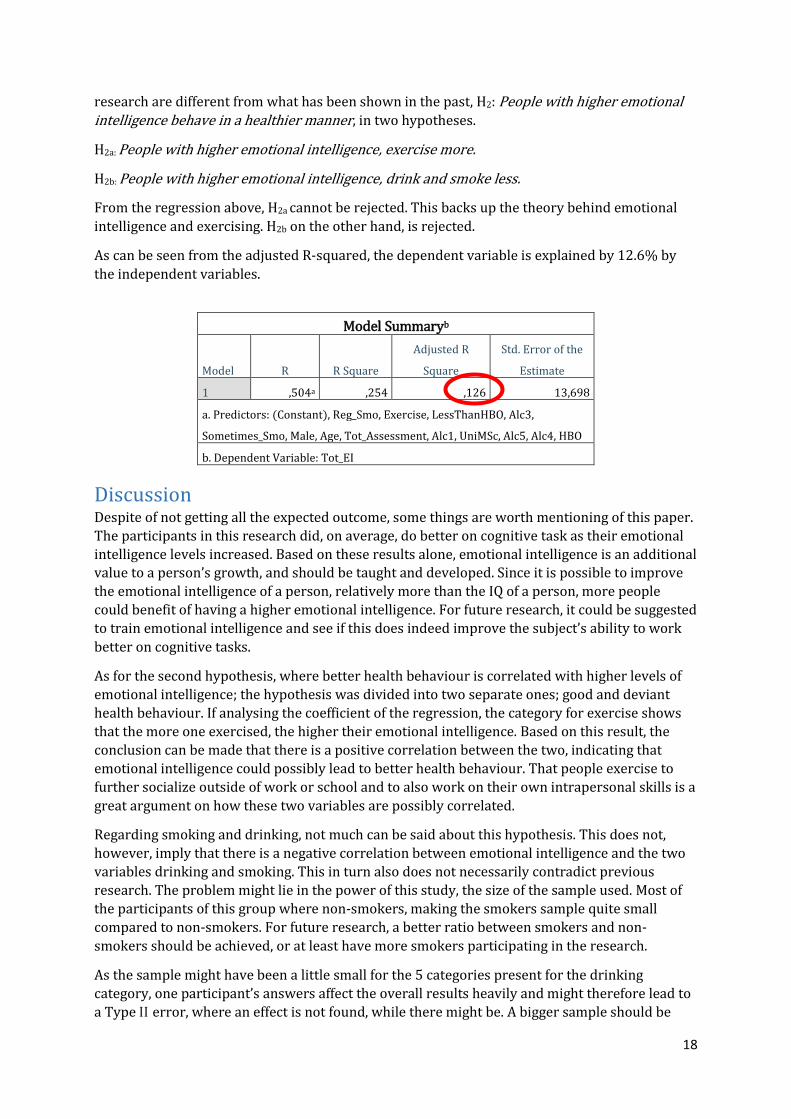
As can be seen from the adjusted R-squared, the dependent variable is explained by 12.6% by
the independent variables.
Model Summaryb
Model R R Square
Adjusted R
Square
Std. Error of the
Estimate
1 ,504a ,254 ,126 13,698
a. Predictors: (Constant), Reg_Smo, Exercise, LessThanHBO, Alc3,
Sometimes_Smo, Male, Age, Tot_Assessment, Alc1, UniMSc, Alc5, Alc4, HBO
b. Dependent Variable: Tot_EI
Discussion Despite of not getting all the expected outcome, some things are worth mentioning of this paper.
The participants in this research did, on average, do better on cognitive task as their emotional
intelligence levels increased. Based on these results alone, emotional intelligence is an additional value to a person’s growth, and should be taught and developed. Since it is possible to improve
the emotional intelligence of a person, relatively more than the IQ of a person, more people
could benefit of having a higher emotional intelligence. For future research, it could be suggested
to train emotional intelligence and see if this does indeed improve the subject’s ability to work
better on cognitive tasks.
As for the second hypothesis, where better health behaviour is correlated with higher levels of
emotional intelligence; the hypothesis was divided into two separate ones; good and deviant
health behaviour. If analysing the coefficient of the regression, the category for exercise shows
that the more one exercised, the higher their emotional intelligence. Based on this result, the
conclusion can be made that there is a positive correlation between the two, indicating that
emotional intelligence could possibly lead to better health behaviour. That people exercise to
further socialize outside of work or school and to also work on their own intrapersonal skills is a
great argument on how these two variables are possibly correlated.
Regarding smoking and drinking, not much can be said about this hypothesis. This does not,
however, imply that there is a negative correlation between emotional intelligence and the two
variables drinking and smoking. This in turn also does not necessarily contradict previous
research. The problem might lie in the power of this study, the size of the sample used. Most of
the participants of this group where non-smokers, making the smokers sample quite small
compared to non-smokers. For future research, a better ratio between smokers and non-
smokers should be achieved, or at least have more smokers participating in the research.
As the sample might have been a little small for the 5 categories present for the drinking
category, one participant’s answers affect the overall results heavily and might therefore lead to
a Type II error, where an effect is not found, while there might be. A bigger sample should be

19
considered for future research. As other things could affect the level of emotional intelligence of
a person, further research can be done to test this. Furthermore, aside from having small
statistical power other reasons might have affected the results. There might have been a bias
due to convenience sampling; the individuals easiest to reach and willing to fill in the survey
were approached, which could lead to biased results. The sample that was available were
friends, colleagues, and members of one student sport’s association. Furthermore, comments
were also received where people believed that a certain outcome was not an acceptable form of
behaviour. In the emotional intelligence test, the higher your score, the better your emotional
intelligence, however, many believed that the higher the score, the more emotional you were,
which might have led to some lower scores. This is a form of desirable answering. Furthermore,
when filling in a survey, some people might find it discouraging to really put effort in answering
the questions seriously. In hindsight, better incentives, either being monetary or non-monetary
does increase response rates (Church, 1993). Furthermore, the method used was by sending the
survey online, which is known to be have less response as offline surveys (Kwak & Radler,
2002).
When going back to the research question of this paper; How does emotional intelligence affect one’s health behaviour?, the conclusion can be made that emotional intelligence does have some
impact on one’s health behaviour, especially when focussing on the good behaviour aspect. For
the deviant side of health behaviour, no negative correlations are shown, as the results are not
statistically different. Much more effort should be put in trying to obtain more participants as
there where many variables that were divided into several categories, which led to some small
samples, which affect the results quite heavily. However, this paper still shows some evidence of
emotional intelligence having an impact on one abilities in a positive way and should therefore
not be disregarded for future policies.

20
Reference list
Ashforth, B., & Humphrey, R. (1995). Emotions in the workplace: A reappraisal. Human Relations, 48,
97-125.
Austin, E., & Saklofske, D. (2005). Far too many intelligences? On the communalities and differences
between social, practical, and emotional intelligences. Emotional intelligence: An
international handbook , 107-128.
Aydin, M. D., Leblebici, D. N., Arslan, M., & Oktem, M. K. (2005). The impact of IQ and EQ on pre-
eminent achievement in organizations: implications for the hiring decisions of HRM
specialists. . The International Journal of Human Resource Management, 16(5), 701-709.
Barling, J., Slater, F., & Kelloway, E. (2000). Transformational leadership and emotional intelligence:
An exploratory study. Leadership & Organization Development Journal, 21(3), 157-161.
Bar-On, R. (1996). The Emotional Quotient Inventory (EQ-i): A test of emotional intelligence. Toronto:
Multi-Health Systems.
Bar-On, R. (1997). The Emotional Quotient Inventory (EQ-I). Technical Manual. Toronto, Canada:
Multi-Health Systems.
Bar-On, R. (2001). Emotional intelligence and self-actualization. Emotional intelligence in everyday
life: a scientific inquiry, 82-97.
Bar-On, R., Brown, J. M., Kirkcaldy, B. D., & Thome, E. P. (2000). Emotional expression and
implications for occupational stress; an application of the Emotional Quotient Inventory (EQ-
i). Personality and individual differences, 28(6), 1107-1118.
Bar-On, R., Tranel, D., Denburg, N., & Bechara, A. (2003). Exploring the neurological substrate of
emotional and social intelligence. Brain, 126(8), 1790-1800.
Bar-On, R., Tranel, D., Denburg, N., & Bechara, A. (2003). Exploring the neurological substrate of
emotional and social intelligence. Brain, 126(8), 1790-1800.
Bernet, M. (1996). The era of the 'EQ': Defining and assessing emotional intelligence. Toronto: Annual
Convention of the American Psychological Association.
Bracket, M., Mayer, J., & Warner, R. (2004). Emotional intelligence and its relation to everyday
behaviour. Personality and Individual differences, 36(6), 1387-1402.
Brackett, M., & Mayer, J. (2003). Convergent, discriminant, and incremental validity of competing
measures of emotional intelligence. Personality and social psychology bulletin, 29(9), 1147-
1158.
Brackett, M., & Salovey, P. (2006). Brackett, M. A., & Salovey, P. (2006). Measuring emotional
intelligence with the Mayer-Salovery-Caruso Emotional Intelligence Test (MSCEIT).
Psicothema, 18., 34-41.
Church, A. H. (1993). Estimating the effect of incentives on mail survey response rates: A meta-
analysis. Public opinion quarterly, 57(1), 62-79.
21
Ciarrochi, J., Deane, F., & Anderson, S. (2002). Emotional intelligence moderates the relationship
between stress and mental health. Personality and Individual Differences, 32, 197–209.
Colman, A., Norris, C., & Preston, C. (1997). Comparing rating scales of different lengths: equivalence
of scores from 5-point and 7-point scales. Psychological Reports, 80, 355-362.
Cooper, R., & Sawaf, A. (1997). Executive EQ: Emotional intelligence in leadership and organisations.
New York: Grosset/Putnam.
Damasio, A. (1999). The Feeling of What Happens: Body and Emotions in the Making of
Consciousness. Hartcourt Brace, New York.
Dulewicz, V., & Higgs, M. (1999). Can emotional intelligence be measured and developed? Leadership
& Organization Development Journal, 20(5), 242-253.
Dulewicz, V., & Higgs, M. (2000). Emotional intelligence; a review and evaluation study. Journal of
Managerial Psychology, 341-372.
Dulewicz, V., & Higgs, M. (2003). Leadership at the top: The need for emotional intelligence in
organizations. The International Journal of Organizational Analysis, 11(3), 193-210.
Dulowicz, V., Higgs, M., & Slaski, M. (2003). Measuring emotional intelligence: Content, construct,
and criterion-related validity. Journal of Managerial Psychology 18.5, 405-420.
Fitness, J. (2001). Emotional intelligence and intimate relationships. Emotional intelligence in
everyday life., 98-112.
Formica, S. (1998). Describing the socio-emotional life space. Unpublished senior’s honor thesis.
University of New Hampshire.
Gardner, H. (1983). Frames of mind: The theory of multiple intelligences. New York: Basic Books.
Gardner, L., & Stough, C. (2002). Examining the relationship between leadership and emotional
intelligence in senior level managers. Leadership & organization development journal, 23(2),
68-78.
Goldman, S., Kraemer, D., & Salovey, P. (1996). Goldman, Susan Lee, Deborah T. KraBeliefs about
mood moderate the relationship of stress to illness and symptom reporting. Journal of
Psychosomatic Research 41.2, 115-128.
Goleman, D. (1995). Emotional Intelligence. New York: Bantam.
Goleman, D. (1997). Emotional intelligence: Why it can matter more than IQ. New York: Bantam
Books.
Goleman, D. (2006). Emotional intelligence. Bantam.
hfhfh. (2001). Examining the relationship between leadership and emotional intelligence in senior
level managers. Leadership & Organization Development Journal 23(2), 68-78.
Johnson, D., & Creech, J. (1983). Ordinal measures in multiple indicator models: a simulation of
categorization error. American Sociological Review, 398-407.
Kahn, W. (1990). Psychological conditions of personal engagement and disengagement at work.
Academy of management journal, 33(4), 692-724.
22
L.R., B. (2009). Gender, emotion, and the family. Harvard University Press.
Lam, L., & Kirby, S. (2002). Is emotional intelligence an advantage? An exploration of the impact of
emotional and general intelligence on individual performance. The journal of social
Psychology(142(1)), 133-143.
Long, J., & Laurie, H. (2000). Using heteroscedasticity consistent standard errors in the linear
regression model. The American Statistician, 54(3), 217-224.
Matthews, G., & Zeinder, M. (2000). Emotional intelligence, adaptation to stressful encounters, and
health outcomes. The handbook of emotional intelligence: Theory, development, assessment,
and application at home, school, and in the workplace, 460.
Matthews, G., Emo, A., Funke, G., Zeidner, M., Roberts, R., Costa Jr, P., & Schulze, R. (2006).
Emotional intelligence, personality, and task-induced stress. Journal of Experimental
Psychology 12(2), 96.
Mayer , J., & Salovey, P. (1997). What is Emotional Intelligence? In P. Salovey, & D. J. (Eds.),
Emotional Development and Emotional Intelligence (pp. 2-31). New York, USA: Basic Books.
Mayer, J. D., Salovey, P., & Caruso, D. R. (2000). Models of Emotional Intelligence. In R. J. (Ed.),
Handbook of Intelligence (pp. 396-420). Cambridge, England: Cambridge University Press.
Mayer, J., Caruso, D., & Salovey, P. (1999). Emotional intelligence meets traditional standards for an
intelligence. Intelligence, 27, 267-298.
Mayer, J., Caruso, D., & Salovey, P. (2002). Mayer-Saolvey-Caruso Emotional Intelligence Test
(MSCEIT), version 2.0. Toronto: Multi-Health Systems.
Mayer, J., Salovey, P., & Caruso, D. (2008). Emotional intelligence: New ability or eclectic traits?
American Psychologist 63(6), 503.
McGaugh, J. L. (1990). Significance and remembrance: The role of neuromodulatory systems. , .
Psychological Science, 1(1), 15-25.
Nantais, K., & Schellenberg, E. (1999). The Mozart Effect: An Artefact of Preference. Psychological
Science, 10, 370-373.
Nikolaou, I., & Tsaousis, I. (2002). Emotional intelligence in the workplace: Exploring its effects on
occupational stress and organizational commitment. The International Journal of
Organizational Analysis, 10(4), 327-342.
Norman, G. (2010). Likert scales, levels of measurement and the "laws" of statistics. . Advances in
health sciences education 15.5, 625-632.
Nunnally, J. (1978). Psychometric Theory, 2nd ed. . New York: McGraw-Hill Book Company.
Palmer, B., Donaldson, C., & Stough, C. (2002). Emotional intelligence and life satisfaction. Personality
and individual differences, 33(7), 1091-1100.
Palmer, B., Walls, M., Burgess, Z., & Stough, C. (2001). Emotional intelligence and effective
leadership. ), . Leadership & Organization Development Journal, 22(1), 5-10.
Parker, J. D., Summerfeldt, L. J., Hogan, M. J., & Majeski, S. A. (2004). Emitional intelligenceand
academic success: examining the transition from high school to university. Personality and
Individual Diffences, 36, 163-172.
23
Parker, J. D., Summerfeldt, L. J., Hogan, M. J., & Majeski, S. A. (2004). Emotional intelligence and
academic success: Examining the transition from high school to university. Personality and
individual differences 36(1), 163-172.
Piaget, J. (1981). Intelligence and Affectivity. Annual Reviews, Palo Alto, 6. A.
Rice, C. (1999). A quantitative study of emotional intelligence and its impact on team performance.
Unpublished master’s thesis, Pepperdine University.
Rubin, M. (1999). Emotional intelligence and its role in mitigating aggression: A correlational study of
the relationship between emotional. Unpublished dissertation. Immaculata College,
Pennsylvania.
Salovey, P., & Mayer, J. (1989). Emotional Intelligence. Imagination, cognition, and personality, 185-
211.
Salovey, P., & Mayer, J. (1990). Emotional Intelligence. Imagination, Cognition, and Personality, 9,
185-211.
Salovey, P., & Mayer, J. D. (1990). Emotional Intelligence. Imagination, Cognition and Personality.
185-211 (p. 189).
Schutte, N., Malouff, J., Hall, L., Haggerty, D., Cooper, J., Golden, C., & et al. (1998). Development and
validation of a measure of motional intelligence. Personality and Individual Differences, 25,
167-177.
Schutte, N., Schuettpelz, E., & Malouff, J. (2001). Emotional intelligence and task performance.
Imagination, Cognition and Personality, 20(4), 347-354.
Seipp, B. (1991). Anxiety and academic performance: A meta-analysis of findings. Anxiety Research,
4(1), 27-41.
Slaski, M., & Cartwright, S. (2002). Health, performance and emotional intelligence: an exploratory
study of retail managers. Stress and Health 18(2), 63-68.
Stein, S., & Book, H. (2011). The EQ edge: Emotional intelligence and your success. John Wiley & Sons.
Thorndike, E. (1920). Intelligence and its uses. Harper's magazine.
Trinidad, D., & Johnson, C. (2002). The association between emotional intelligence and early
adolescent tobacco and alcohol use.,. Personality and individual differences, 32(1), 95-105.
Tsaousis, I., & Nikolaou, I. (2005). Exploring the relationship of emotional intelligence with physical
and psychological health functioning. Stress and Health 21(2), 77-86.
Vakola, M., Tsaousis, I., & Nikolaou, I. (2004). Vakola, Maria, Ioannis Tsaousis, and Ioannis Nikolaou.
"The role of emotional intelligence and personality variables on attitudes toward
organisational change. Journal of managerial psychology 19.2, 88-110.
Van der Zee, K., Thijs, M., & Schakel, L. (2002). The relationship of emotional intelligence with
academic intelligence and the Big Five. European journal of personality, 16(2), 103-125.
Zumbo, B., & Zimmerman, D. (1993). Is the selection of statistical methods governed by level of
measurment? Canadian Psychology, 34, 390-400.

24

25
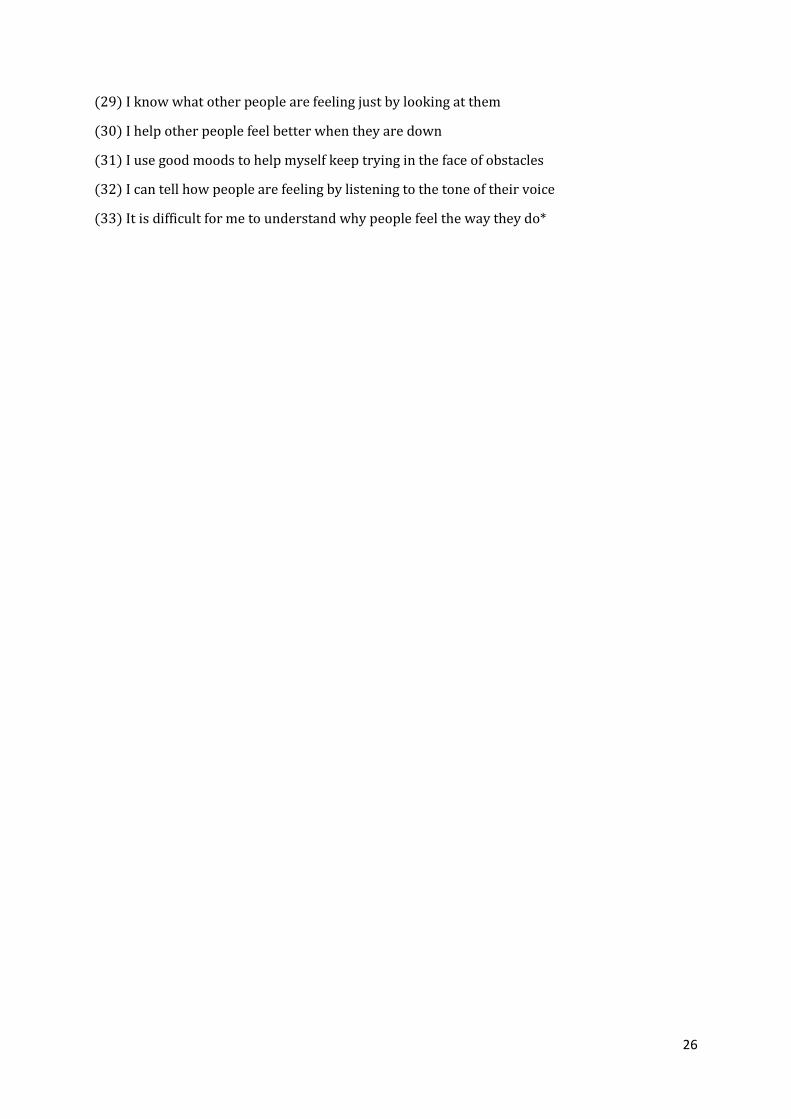
Appendix 1 The 33-item emotional intelligence scale
(1) I know when to speak about my personal problems to others
(2) When I am faced with obstacles, I remember times I faced similar obstacles and overcame
them
(3) I expect that I will do well on most things I try
(4) Other people find it easy to confide in me
(5) I find it hard to understand the non-verbal messages of other people*
(6) Some of the major events of my life have led me to re-evaluate what is important and not
important
(7) When my mood changes, I see new possibilities
(8) Emotions are one of the things that make my life worth living
(9) I am aware of my emotions as I experience them
(10) I expect good things to happen
(11) I like to share my emotions with others
(12) When I experience a positive emotion, I know how to make it last
(13) I arrange events others enjoy
(14) I seek out activities that make me happy
(15) I am aware of the non-verbal messages I send to others
(16) I present myself in a way that makes a good impression on others
(17) When I am in a positive mood, solving problems is easy for me
(18) By looking at their facial expressions, I recognize the emotions people are experiencing
(19) I know why my emotions change
(20) When I am in a positive mood, I am able to come up with new ideas
(21) I have control over my emotions
(22) I easily recognize my emotions as I experience them
(23) I motivate myself by imagining a good outcome to tasks I take on
(24) I compliment others when they have done something well
(25) I am aware of the non-verbal messages other people send
(26) When another person tells me about an important event in his or her life, I almost feel as
though I have experienced this event myself
(27) When I feel a change in emotions, I tend to come up with new ideas
(28) When I am faced with a challenge, I give up because I believe I will fail*
26
(29) I know what other people are feeling just by looking at them
(30) I help other people feel better when they are down
(31) I use good moods to help myself keep trying in the face of obstacles
(32) I can tell how people are feeling by listening to the tone of their voice
(33) It is difficult for me to understand why people feel the way they do*
27
Appendix 2 Cronbach Alpha if deleted.
Item-Total Statistics
Scale Mean if
Item Deleted
Scale Variance
if Item Deleted
Corrected
Item-Total
Correlation
Squared
Multiple
Correlation
Cronbach's
Alpha if Item
Deleted
Please fill in to what best
applies to you - I know
when to speak about my
personal problems to
others.
123,50 206,949 ,095 ,525 ,751
Please fill in to what best
applies to you - When I am
faced with obstacles, I
remember times I faced
similar obstacles and
overcame them.
123,78 215,343 -,066 ,366 ,760
Please fill in to what best
applies to you - I expect
that I will do well on most
things I try.
123,23 207,776 ,159 ,474 ,745
Please fill in to what best
applies to you - Other
people find it easy to
confide in me.
123,58 209,685 ,089 ,392 ,748
Please fill in to what best
applies to you - I find it
hard to understand the
non-verbal messages of
other people.
122,31 222,037 -,198 ,437 ,771
Please fill in to what best
applies to you - Some of the
major events of my life
have led me to re-evaluate
what is important and what
is not.
122,51 205,264 ,216 ,410 ,742
Please fill in to what best
applies to you - When my
mood changes, I see new
possibilities.
122,92 208,455 ,164 ,475 ,744
Please fill in to what best 122,81 198,986 ,398 ,517 ,733

28
applies to you - Emotions
are one of the things that
make my life worth living.
Please fill in to what best
applies to you - I am aware
of my emotions as I am
feeling them.
123,27 205,703 ,272 ,466 ,740
Please fill in to what best
applies to you - I expect
good things to happen.
123,30 208,729 ,190 ,325 ,743
Please fill in to what best
applies to you - I like to
share my emotions with
others.
123,02 200,831 ,332 ,502 ,736
Please fill in to what best
applies to you - When I
experience a positive
emotion, I know how to
make it last.
124,01 203,337 ,169 ,485 ,746
Please fill in to what best
applies to you - I arrange
events others enjoy.
123,60 196,333 ,451 ,524 ,729
Please fill in to what best
applies to you - I seek out
activities that make me
happy.
123,11 197,066 ,445 ,655 ,730
Please fill in to what best
applies to you - I am aware
of the non-verbal messages
I send to others.
124,11 209,066 ,105 ,411 ,748
Please fill in to what best
applies to you - I present
myself in a way that makes
a good impression on
others .
123,33 197,124 ,436 ,568 ,730
Please fill in to what best
applies to you - When I am
in a positive mood, solving
problems is easy for me.
123,11 193,943 ,540 ,733 ,725
Please fill in to what best
applies to you - By looking
at their facial expressions, I
recognize the emotions
123,14 193,159 ,555 ,631 ,724
29
people are experiencing.
Please fill in to what best
applies to you - I know why
my emotions change.
124,22 198,871 ,356 ,585 ,734
Please fill in to what best
applies to you - When I am
in a positive mood, I am
able to come up with new
ideas.
123,39 198,488 ,489 ,700 ,730
Please fill in to what best
applies to you - I have
control over my emotions.
123,67 197,146 ,329 ,448 ,735
Please fill in to what best
applies to you - I easily
recognize my emotions as I
experience them.
124,39 205,184 ,204 ,457 ,743
Please fill in to what best
applies to you - I motivate
myself by imagining a good
outcome to tasks I take on.
124,40 197,883 ,355 ,454 ,734
Please fill in to what best
applies to you - I
compliment others when
they have done something
well.
123,51 197,309 ,454 ,688 ,730
Please fill in to what best
applies to you - I am aware
of the non-verbal messages
other people send.
123,46 198,678 ,484 ,577 ,730
Please fill in to what best
applies to you - When
another person tells me
about an important event in
his or her life, I almost feel
as though I have
experienced this event
myself.
123,24 201,535 ,265 ,450 ,739
Please fill in to what best
applies to you - When I feel
a change in emotions, I tend
to come up with new ideas.
123,18 196,417 ,451 ,599 ,729
Please fill in to what best
applies to you - When I am
121,49 220,320 -,187 ,447 ,762

30
faced with a challenge, I
give up because I believe I
will fail.
Please fill in to what best
applies to you - I know
what other people are
feeling just by looking at
them.
123,70 207,920 ,114 ,583 ,748
Please fill in to what best
applies to you - I help other
people feel better when
they are down.
123,53 203,645 ,313 ,530 ,738
Please fill in to what best
applies to you - I use good
moods to help myself keep
trying in the face of
obstacles.
123,41 203,481 ,321 ,498 ,737
Please fill in to what best
applies to you - I can tell
how people are feeling by
listening to the tone of their
voice.
124,28 196,900 ,450 ,633 ,730
Please fill in to what best
applies to you - It is difficult
for me to understand why
people feel the way they do.
122,59 213,323 -,018 ,469 ,756
Appendix
Coefficientsa
Model
Collinearity Statistics
Tolerance VIF
1 Tot_Assessment ,740 1,351
Age ,632 1,582
Male ,871 1,148
less_than_HBO ,599 1,669
HBO ,555 1,803
MSc ,564 1,772
Sometimes_Smo ,883 1,132
Reg_Smo ,844 1,185
Alcohol_Con1 ,755 1,324

31
Alcohol_Con4 ,735 1,361
Alcohol_Con3 ,848 1,180
Exer0 ,361 2,768
Exer1 ,415 2,407
Exer3 ,336 2,972
a. Dependent Variable: Tot_EI
Coefficientsa
Model
Collinearity Statistics
Tolerance VIF
1 Age ,548 1,826
Male ,867 1,153
less_than_HBO ,619 1,615
HBO ,556 1,797
MSc ,564 1,772
Sometimes_Smo ,886 1,128
Reg_Smo ,843 1,186
Alcohol_Con1 ,783 1,278
Alcohol_Con4 ,765 1,307
Alcohol_Con3 ,846 1,182
Exer0 ,278 3,595
Exer1 ,367 2,725
Exer3 ,316 3,168
Tot_EI ,656 1,525
a. Dependent Variable: Tot_Assessment
Coefficientsa
Model
Collinearity Statistics
Tolerance VIF
1 Male ,867 1,153
less_than_HBO ,596 1,677
HBO ,555 1,803
MSc ,607 1,647
Sometimes_Smo ,882 1,133
Reg_Smo ,838 1,193
Alcohol_Con1 ,766 1,305
Alcohol_Con4 ,738 1,355
Alcohol_Con3 ,837 1,195
Exer0 ,394 2,538
Exer1 ,461 2,171
Exer3 ,345 2,899
Tot_EI ,745 1,343

32
Tot_Assessment ,728 1,373
a. Dependent Variable: Age
Coefficientsa
Model
Collinearity Statistics
Tolerance VIF
1 less_than_HBO ,597 1,676
HBO ,555 1,801
MSc ,566 1,767
Sometimes_Smo ,882 1,134
Reg_Smo ,833 1,200
Alcohol_Con1 ,753 1,328
Alcohol_Con4 ,785 1,274
Alcohol_Con3 ,844 1,185
Exer0 ,271 3,685
Exer1 ,360 2,779
Exer3 ,315 3,172
Tot_EI ,612 1,634
Tot_Assessment ,688 1,455
Age ,517 1,935
a. Dependent Variable: Male
Coefficientsa
Model
Collinearity Statistics
Tolerance VIF
1 HBO ,779 1,283
MSc ,690 1,449
Sometimes_Smo ,886 1,129
Reg_Smo ,830 1,205
Alcohol_Con1 ,765 1,308
Alcohol_Con4 ,742 1,348
Alcohol_Con3 ,845 1,183
Exer0 ,276 3,627
Exer1 ,359 2,782
Exer3 ,318 3,145
Tot_EI ,613 1,632
Tot_Assessment ,715 1,399
Age ,518 1,932
Male ,869 1,151
a. Dependent Variable: less_than_HBO
Coefficientsa
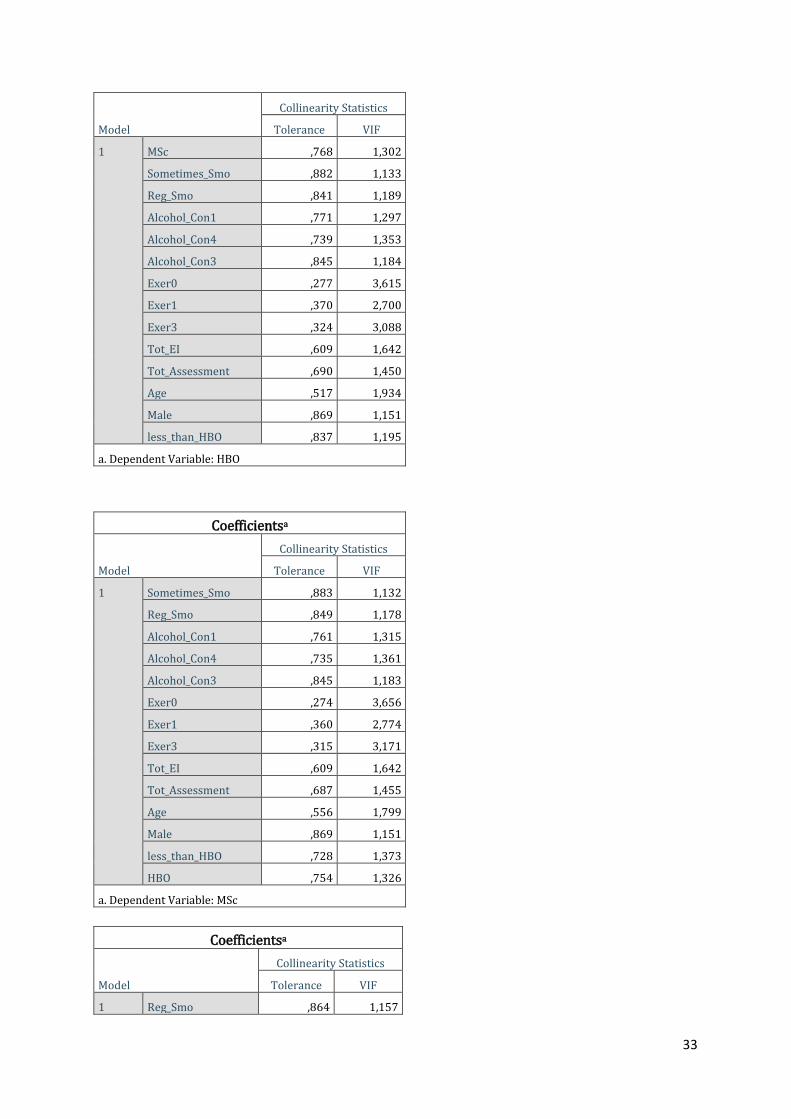
33
Model
Collinearity Statistics
Tolerance VIF
1 MSc ,768 1,302
Sometimes_Smo ,882 1,133
Reg_Smo ,841 1,189
Alcohol_Con1 ,771 1,297
Alcohol_Con4 ,739 1,353
Alcohol_Con3 ,845 1,184
Exer0 ,277 3,615
Exer1 ,370 2,700
Exer3 ,324 3,088
Tot_EI ,609 1,642
Tot_Assessment ,690 1,450
Age ,517 1,934
Male ,869 1,151
less_than_HBO ,837 1,195
a. Dependent Variable: HBO
Coefficientsa
Model
Collinearity Statistics
Tolerance VIF
1 Sometimes_Smo ,883 1,132
Reg_Smo ,849 1,178
Alcohol_Con1 ,761 1,315
Alcohol_Con4 ,735 1,361
Alcohol_Con3 ,845 1,183
Exer0 ,274 3,656
Exer1 ,360 2,774
Exer3 ,315 3,171
Tot_EI ,609 1,642
Tot_Assessment ,687 1,455
Age ,556 1,799
Male ,869 1,151
less_than_HBO ,728 1,373
HBO ,754 1,326
a. Dependent Variable: MSc
Coefficientsa
Model
Collinearity Statistics
Tolerance VIF
1 Reg_Smo ,864 1,157

34
Alcohol_Con1 ,751 1,331
Alcohol_Con4 ,741 1,349
Alcohol_Con3 ,839 1,192
Exer0 ,271 3,688
Exer1 ,359 2,783
Exer3 ,320 3,129
Tot_EI ,610 1,640
Tot_Assessment ,691 1,448
Age ,517 1,934
Male ,867 1,153
less_than_HBO ,598 1,672
HBO ,555 1,803
MSc ,565 1,769
a. Dependent Variable: Sometimes_Smo
Coefficientsa
Model
Collinearity Statistics
Tolerance VIF
1 Alcohol_Con1 ,748 1,336
Alcohol_Con4 ,739 1,352
Alcohol_Con3 ,836 1,196
Exer0 ,272 3,682
Exer1 ,367 2,722
Exer3 ,323 3,094
Tot_EI ,619 1,615
Tot_Assessment ,699 1,431
Age ,522 1,915
Male ,871 1,149
less_than_HBO ,596 1,679
HBO ,562 1,780
MSc ,577 1,732
Sometimes_Smo ,918 1,089
a. Dependent Variable: Reg_Smo
Coefficientsa
Model
Collinearity Statistics
Tolerance VIF
1 Alcohol_Con4 ,751 1,332
Alcohol_Con3 ,871 1,147
Exer0 ,271 3,688
Exer1 ,365 2,739
Exer3 ,316 3,167

35
Tot_EI ,615 1,625
Tot_Assessment ,720 1,389
Age ,530 1,887
Male ,874 1,144
less_than_HBO ,609 1,641
HBO ,572 1,748
MSc ,575 1,740
Sometimes_Smo ,887 1,128
Reg_Smo ,831 1,203
a. Dependent Variable: Alcohol_Con1
Coefficientsa
Model
Collinearity Statistics
Tolerance VIF
1 Alcohol_Con4 ,768 1,302
Exer0 ,271 3,691
Exer1 ,360 2,778
Exer3 ,318 3,146
Tot_EI ,618 1,619
Tot_Assessment ,696 1,437
Age ,517 1,932
Male ,875 1,142
less_than_HBO ,602 1,661
HBO ,560 1,785
MSc ,571 1,752
Sometimes_Smo ,885 1,130
Reg_Smo ,830 1,204
Alcohol_Con1 ,779 1,283
a. Dependent Variable: Alcohol_Con3
Coefficientsa
Model
Collinearity Statistics
Tolerance VIF
1 Exer0 ,278 3,599
Exer1 ,361 2,773
Exer3 ,327 3,055
Tot_EI ,609 1,642
Tot_Assessment ,716 1,396
Age ,519 1,925
Male ,926 1,080
less_than_HBO ,601 1,663
HBO ,558 1,793
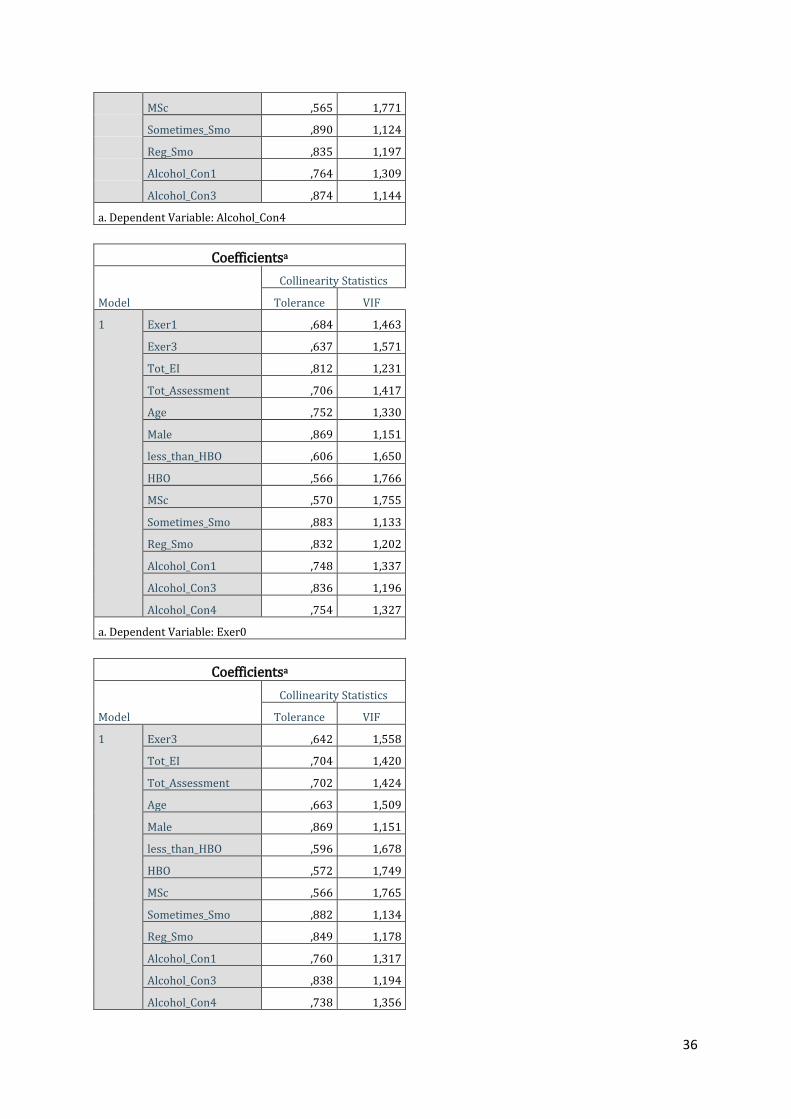
36
MSc ,565 1,771
Sometimes_Smo ,890 1,124
Reg_Smo ,835 1,197
Alcohol_Con1 ,764 1,309
Alcohol_Con3 ,874 1,144
a. Dependent Variable: Alcohol_Con4
Coefficientsa
Model
Collinearity Statistics
Tolerance VIF
1 Exer1 ,684 1,463
Exer3 ,637 1,571
Tot_EI ,812 1,231
Tot_Assessment ,706 1,417
Age ,752 1,330
Male ,869 1,151
less_than_HBO ,606 1,650
HBO ,566 1,766
MSc ,570 1,755
Sometimes_Smo ,883 1,133
Reg_Smo ,832 1,202
Alcohol_Con1 ,748 1,337
Alcohol_Con3 ,836 1,196
Alcohol_Con4 ,754 1,327
a. Dependent Variable: Exer0
Coefficientsa
Model
Collinearity Statistics
Tolerance VIF
1 Exer3 ,642 1,558
Tot_EI ,704 1,420
Tot_Assessment ,702 1,424
Age ,663 1,509
Male ,869 1,151
less_than_HBO ,596 1,678
HBO ,572 1,749
MSc ,566 1,765
Sometimes_Smo ,882 1,134
Reg_Smo ,849 1,178
Alcohol_Con1 ,760 1,317
Alcohol_Con3 ,838 1,194
Alcohol_Con4 ,738 1,356

37
Exer0 ,516 1,939
a. Dependent Variable: Exer1
Coefficientsa
Model
Collinearity Statistics
Tolerance VIF
1 Tot_EI ,650 1,538
Tot_Assessment ,689 1,452
Age ,566 1,767
Male ,867 1,153
less_than_HBO ,601 1,665
HBO ,570 1,755
MSc ,565 1,771
Sometimes_Smo ,894 1,118
Reg_Smo ,851 1,175
Alcohol_Con1 ,749 1,336
Alcohol_Con3 ,843 1,186
Alcohol_Con4 ,763 1,311
Exer0 ,547 1,827
Exer1 ,732 1,367
a. Dependent Variable: Exer3