Emotional Intelligence across Cultures: The Relationship ...
33
119 Emotional Intelligence across Cultures: The Relationship between Emotional Intelligence and Cultural Distance Moon, Tae-Won ** This study focuses on the workplaces of two distinct nations, the United States and Korea, to ascertain the impact of culture on emotional intelligence (EI). This paper examines if EI is dependant on culture by finding significant variances of emotional responses under a given situation. The results suggest that EI is significantly impacted by national culture. In addition, this study investigates the relationship between cultural distance and EI by using the secondary data of 19,402 participants across 13 nations. The results demonstrate that only power distance among Hofstede’s dimensions has significant effect on EI. Key Words : emotional intelligence; culture; cultural distance Ⅰ. Introduction As businesses and industries progress toward rapid globalization through foreign direct investment, international joint ventures, strategic alliances and other forms of collaboration, cross-cultural studies are becoming more demanding in order to solve several problems caused by cultural differences in complex international working environments. Understanding and 논문접수일: 2010년 5월 12일 수정일: 2010년 6월 15일 게재확정일: 2010년 6월 21일 * Assistant Professor, Dept. of Business Administration, Hongik University, [email protected] <Abstract> 大韓經營情報學會 「經營情報硏究」第29券 第2號 2010年 6月
Transcript of Emotional Intelligence across Cultures: The Relationship ...

Emotional Intelligence across Cultures: The Relationship between Emotional Intelligence and Cultural Distance 119
Emotional Intelligence across Cultures:
The Relationship between Emotional
Intelligence and Cultural Distance
Moon, Tae-Won**
This study focuses on the workplaces of two distinct nations, the United
States and Korea, to ascertain the impact of culture on emotional intelligence
(EI). This paper examines if EI is dependant on culture by finding significant
variances of emotional responses under a given situation. The results suggest
that EI is significantly impacted by national culture. In addition, this study
investigates the relationship between cultural distance and EI by using the
secondary data of 19,402 participants across 13 nations. The results
demonstrate that only power distance among Hofstede’s dimensions has
significant effect on EI.
Key Words : emotional intelligence; culture; cultural distance
Ⅰ. Introduction
As businesses and industries progress toward rapid globalization through
foreign direct investment, international joint ventures, strategic alliances and
other forms of collaboration, cross-cultural studies are becoming more
demanding in order to solve several problems caused by cultural differences
in complex international working environments. Understanding and
논문접수일: 2010년 5월 12일 수정일: 2010년 6월 15일 게재확정일: 2010년 6월 21일
* Assistant Professor, Dept. of Business Administration, Hongik University, [email protected]
<Abstract>
大韓經營情報學「經營情報硏究」第29券 第2號 2010年 6月

120 經營情報硏究 第29券 第2號
coordinating a culturally diverse workforce is an essential factor necessary
in dealing with the challenges of managing a diverse workforce (Earley &
Ang, 2003; Earley, Ang & Tan, 2006). Hence, the degree of attention given
by the managers of an organization towards the culturally patterned
emotional expressions and behaviors of each member within their workforce,
has a direct correlation with the effective administration of people from
varying cross cultural backgrounds (Earley & Ang, 2003; Earley, Ang &
Tan, 2006; Gabel, Dolan & Cerdin, 2005).
Despite the fact that emotion is an inevitable and inseparable factor of the
workplace, emotion in organizational life has been a long neglected topic in
organizational behavior and cross-cultural management studies (Muchinsky,
2000). Furthermore, many scholars in organizational behavior often regarded
emotions in workplace as the antithesis of rationality and maintain a
negative view of emotion in the workplace (Muchinsky, 2000). Whyte
(1956) views effective business people as being logical, reasoned, rational
decision makers and holds emotion as an undesired impact which disoriented
people from the way of objectivity. However, with the introduction in the
early 1990’s of Emotional Intelligence (EI) and the development of EI
assessment, the view on neglecting emotional factors in relation to the
workplace has diminished among increasing views that emotions connect
logical mental activities rather than interrupting them (Mayer & Salovey,
1993). Furthermore, with the publication of Emotional Intelligence by Daniel
Goleman (1995), the topic of emotional intelligence has gained greater
attention and public interest.
Recent studies in cultural psychology have found that cultural orientation
has a great impact on emotional expression as well as on the content and
perceptions of the self (Markus & Kitayama 1991; Matsumoto 1989; Aaker &
Williams 1998). People of different cultures not only have different contexts
of the self, of others, and of the interdependency of the two, but also hold
different patterns of emotional response under a given situation.
Numerous studies have demonstrated the effect of emotional intelligence
on individual and organizational performance (Bar-On, 2000; Cherniss &
Goleman, 2001; Goleman, 1988; Higgs & Dulewicz, 2001). However, few

Emotional Intelligence across Cultures: The Relationship between Emotional Intelligence and Cultural Distance 121
studies have investigated the differential comprehension and response in the
workplace with respect to emotions, as exhibited by individuals of varying
cultures. The majority of studies conducted thus far have overwhelmingly
dealt with cross-cultural or cross-national research in the field of Human
Resource Development (Brewer, Tregaskis, Hegewicsh & Mayne, 1996).
Moreover, the empirical studies of the relationship between emotional
intelligence and cultural differences are potentially flawed despite the rises of
interest in cultural dimensions of behavior in organizations (Kim, 2000).
In order to measure the effect of cultural difference, this study uses the
constructs of cultural distance (CD) that is widely employed in international
business. Cultural distance involves the dissimilarities between cultures
regarding a variety of their aspects, such as language, religion, values, the
status of women, individualism-collectivism, attitudes to authority, forms of
government, the legal system, etc (Chirkov, Lynch, & Niwa, 2005). Cultural
distance has obtained a great and broad deal of acceptance in the
international business literatures, and several frameworks of CD have been
developed and used in the measurement of cultural differences among
countries (Hofstede, 1980; Kogut & Singh, 1988; Shenkar, 2001; Triandis,
1989). This study uses Hofstede’s (1980) cultural dimensions to examine the
relationship between emotional intelligence and cultural distance.
This study connects research on cultural orientation and emotional
intelligence to find how responses may vary when cross-cultural/
cross-national emotions are taken into consideration on an international level.
The premise of this study is that interpretation of emotional arousal or
change can be subject to cultural or national differences. Since an
individual’s emotion is greatly influenced by culture, how one manages and
copes with emotions differ largely based on one’s ethnic and national
background (Markus & Kitayma, 1991).
The objective of this study is two-fold. First, Study 1 examines that
emotional intelligence is influenced by culture, based on the responses of 160
participants (80 from the United States and 80 from South Korea). More
specifically, the most frequent response for a given question on an EI
assessment, or test, varies by culture, and the distribution of answers differs

122 經營情報硏究 第29券 第2號
by culture because the fundamental comprehension and responses of
emotions under a given situation vary by national or cultural origin. In
addition, the moderating factors that influence the relationship between
emotional intelligence and cultural distance, such as age, gender, and
educational level are analyzed empirically. Second, Study 2 examines the
relationships between emotional intelligence and cultural distance by using
the secondary data of 19,402 participants across 13 nations drawn from the
Bar-On Emotional Quotient-Inventory (EQ-i) of the MHS Technical Manual
(2006).
Ⅱ. Theoretical Background
1. The Effects of Culture on Self
“Self” affects the nature of interpersonal phenomena, such as conformity,
obedience, and social comparison, as well as intrapersonal phenomena, such
as self-affirmation, self-verification, and self-esteem (Markus & Kitayama,
1991). Previous studies have proven that people develop and exert a sense
of self within certain cultural contexts (Markus & Wurf 1987; Markus &
Oyserman 1993; Bailey & Chen 1997). The self is a combination of beliefs,
feelings and knowledge of the individual that consist of one’s intellectual,
emotional and behavioral responses to the external environment (Bailey &
Chen, 1997). The self is molded via one’s experience by which humans
interpret and react to socio-cultural contexts. Since individual experience is
largely influenced by national origin or culture, it can be inferred that the
self is culturally shaped.
One of the dimensions that form the concept of self is individualism and
collectivism (Hofstede 1980; Markus & Kitayama 1991; Triandis 1989; Bailey
& Chen 1997; Asai & Lucca, 1988). Individualists are more likely to
emphasize their own idiosyncratic values, attitudes and preferences while
collectivists tend to emphasize shared group norms and social welfare rather
than their own interests. Markus and Kitayma (1991) use the term

Emotional Intelligence across Cultures: The Relationship between Emotional Intelligence and Cultural Distance 123
‘independent’ and ‘interdependent’ to parallel the individualism and
collectivism dimension respectively. In the independent construction of the
self, individuals are not connected but separate. This vision is predominant
in Western cultures, especially in the United States. Since the independent
vision emphasizes the uniqueness of internal qualities, like preferences and
abilities, the expression and display of skills and abilities are encouraged
(Bailey & Chen, 1997). In contrast, the interdependent vision implies that
individuals are not separate but closely connected. Collectivistic cultures, like
Japan and Korea, place high value on the connectedness of people and
harmony between one another. An individual’s fundamental goal is to adjust
oneself to fit into social norms and create harmony with others (Bailey &
Chen, 1997). Therefore, people in this vision tend to organize and form their
emotions, thoughts and behaviors in reference to their social relationships.
2. The Effects of Culture on Emotions
Culture has a great influence on patterns of emotion, and provides
guidance for emotional expression (Hochschild, 1983). Since emotion is a set
of complicated internal processes and reactions that occur between the self
and the social stimuli, emotion or emotional intelligence should be explained
within the domain of culture (Marcus & Kitayama, 1991). The recognition
and experience of many emotions are not independent characteristics, but
interdependent characteristics within socio-cultural contexts. Culture
establishes the rules that guide emotional expression and social behavior for
effective and harmonious social interactions (Marcus & Kitayama, 1991).
Emotional expression and experience rely on the current socio-cultural
context, and experienced emotions play an important role in altering and
transforming the nature of the social situation (Matsumoto, 1989). They
achieve this change by allowing the emergence of a new construct of the
social context, and by enabling people to act according to a certain situation
(Markus & Kitayama, 1991).
Culture governs emotional expression by providing rules for feelings
(Hochschild, 1983). For instance, some foods which are categorized as

124 經營情報硏究 第29券 第2號
nutritious and delicious in one country can equally evoke a feeling of
disgust and fear in another country. These feeling rules give a baseline in
deciding which emotions should be expressed under a given situation and
what level of intensity and length of time individuals use in expressing their
emotions (Hochschild, 1996). For example, in Japanese society, the internal
emotional experience of sadness is often masked by an external expression
of cheerfulness and a disguised smile is often made as an indication of the
person’s intention to engage in a relationship with others(Markus &
Kitayama, 1991). Culture also shapes emotional experience in relation to a
variety of social interactions and stimuli (Hochschild, 1996).
3. Emotional Intelligence (EI) and Cultural Distance (CD)
The study of emotion has been legitimized by the appearance of EI as a
concept and the corresponding development of EI measurement techniques.
The current conceptualization of emotional intelligence originated with
Thorndike’s (1920) social intelligence. Thorndike (1920) introduced the
concept of social, concrete and abstract intelligence, as the ability to
understand and manage others in social context. Thorndike’s (1920) theory
is represented in detail in Sternberg’s (1986) formulation of practical
intelligence, and Gardner’s (1993) multiple intelligence. Both Sternberg (1986)
and Gardner (1993) broadened traditional cognitive perceptions of analytical
intelligence. Reuven Bar-On (1988) was the first to use the term “emotional
quotient” in his dissertation to approach EI in relation to the measurement of
well–being. Bar-On (2000) defined EI as an array of emotional and social
knowledge and abilities that impacted one’s overall ability to effectively
handle the demands of the environment. The concept of EI appeared again
when Salovey and Mayer (1990) defined the term in their paper, “Emotional
Intelligence.” Salovey and Mayer’s (1990) definition of EI was, “Emotional
intelligence involves the ability to perceive accurately, appraise and express
emotion; the ability to access and/or generate feelings when they facilitate
thought; the ability to understand emotion and emotional knowledge; and the
ability to regulate emotions to promote emotional and intellectual growth”

Emotional Intelligence across Cultures: The Relationship between Emotional Intelligence and Cultural Distance 125
(p.10). The notion of EI has gained more attention since Daniel Goleman
published his article, “Emotional Intelligence,” in 1995. Goleman (1995)
defined EI as a different way of being smart. According to Goleman (1998),
EI is the competency of managing yourself and your relationships with
others, making effective teamwork, leading others, and forecasting the future.
In order to examine the variances of emotional intelligence by culture, the
objective construct for measuring cultural differences was used in this study.
From a practical point of view, culture is extremely difficult to be accurately
measured due to its complex, broad and subjective characteristics (Shenkar,
2001; Soutar, Lee & Ng, 2006). However, researchers have suggested using
cultural indices for measuring cultural differences in order to simplify its
operationalization, and measure at least some elements of culture (Hofstede,
1980). Among many culture-related constructs, cultural distance is the most
broadly used construct in international business (Shenkar, 2001; Sousa &
Bradley, 2004).
Cultural distance is defined as the degree to which one nation’s culture is
similar to or different from the other nation’s culture (Shenkar, 2001; Soutar,
Lee & Ng, 2006). Cultural distance score reflects the extent of cultural
differences on various cultural dimensions between the different cultural
groups. By transforming complex, intangible and subtle concepts of culture
into an aggregate quantitative construct, cultural distance has been used in
most business administration disciplines, such as management, marketing,
finance, accounting and human resource management (Shenkar, 2001). Even
if the construct of cultural distance has been criticized due to problems in
conceptualization and measurement (Shenkar, 2001), it has offered a simple
and standardized measure for cultural differences by overcoming the
complexities and intricacies of culture (Kogut & Singh, 1988).
Among several measurements of cultural distance, Hofstede’s (1980) cultural
index is clearly the most frequently used approach to measure cultural distance
(Agarwal, 1994; Brouthers & Brouthers, 2001; Grosse & Trevino, 1996; Manev
& Stevenson 2001; Soutar, Lee & Ng, 2006). Cultural distance index based on
Hofstede’s (1980) four cultural dimensions, such as power distance, uncertainty
avoidance, individualism, masculinity was used in this study.

126 經營情報硏究 第29券 第2號
Ⅲ. Conceptual Framework and Hypotheses
1. Study1 : Cultural Impact on Emotional Intelligence
The first hypotheses examined the variances of emotional reactions,
between two countries, for certain situations. McConatha, Lightner and
Deaner (1994) discuss that primary emotions, such as fear, anger and
sadness are universally common to the human experience while secondary
emotions, such as pride, guilt and shame, evolve in relation to the
socio-cultural context and differ across cultures. McConatha, Leone and
Armstrong (1997) suggest that rules governing cultural feeling influence an
individual’s internal interpretation of the self, others and the environment
whereas rules of cultural display provide a guideline of which emotion is
expressed under a certain situation. Both rules of feeling and display are
significantly impacted by one’s cultural or national norms (Marcus &
Kitayama, 1991).
Previous studies found that there were three major factors influencing
emotional intelligence: age, gender, and educational level (Petrides &
Furnham, 2000; Mayer, Caruso & Salovey, 1999; McConatha, Lighter, &
Deaner, 1994; Sjöberg, 2001). The literature on gender and EI has not
offered any conclusive results. Some studies have found gender-based EI
disparities (Hart, 2002; Mayer, Caruso & Salovey, 1999; Petrides & Furnham,
2000; Schutte, Malouff, Hall, Haggerty, Cooper, Golden, & Dornheim, 1998)
while others have noted no significant differences (Cavallo & Brienza, 2002;
Eagly, Karau & Makhijani, 1992). Unlike gender however, research on age
have found that a positive relation with emotional intelligence exists
(McConatha, Lightner & Deaner, 1997; Mayer, Caruso & Salovey, 1999).
Their findings have shown that emotional intelligence increases with age
(McConatha, Lightner & Deaner, 1997). Similarly, research on EI and
education level has shown that there is a link between EI and the level of
schooling an individual has attained (Sjöberg, 2001; Chipain, 2003). Sjöberg
(2001) found that emotional intelligence was positively related to higher
levels of educational achievement.

Emotional Intelligence across Cultures: The Relationship between Emotional Intelligence and Cultural Distance 127
Study 1 includes the four hypotheses. First, in order to test whether the
most populated answer for each question of the EI test varies by culture,
descriptive statistics was used to compare the frequency of answers for
each question from respondents of both cultural groups. The study
demonstrated which emotional response was predominantly perceived as the
best choice for employees in Korea and the United States in certain
scenarios. Second, Chi-Square test was conducted to examine whether
distribution of answers differs by culture. Third, the multiple regression was
used to find the effects of independent variable (culture) on dependent one
(EI) while controlling for the other independent variables. Finally, this study
examined the moderating effect of the three demographic factors, such as
age, gender and educational level on the relationship between emotional
intelligence and culture.
H1a. The most populated answer on EI differs by culture.
H1b. The distribution of answers on EI differs by culture.
H1c. Emotional intelligence and its attributes, such as self regulation and
other regulation are influenced by culture.
H1d: Demographic variables, such as age, gender, and educational level will
moderate the relationship between emotional intelligence and culture.
2. Study2 : Relationship between Cultural Distance and
Emotional Intelligence
Study 2 examined the effect of cultural differences on emotional
intelligence. Cultural distance involves the dissimilarities between cultures
regarding a variety of their aspects, such as language, religion, values, the
status of women, individualism-collectivism, attitudes toward authority,
forms of government, the legal system, etc (Chirkov, Lynch, & Niwa, 2005).
Differences in race, social norms, and language affect the self-concept and
emotion of individual (Bailey & Chen, 1997). Correspondingly, cultural

128 經營情報硏究 第29券 第2號
distance would affect emotional intelligence.
Hofstede’s (1980) cultural indices were used to tap in the objective
dimensions. Hofstede’s (1980) cultural indices include the four cultural
dimensions such as power distance, uncertainty avoidance, individualism, and
masculinity. Power distance refers to “the extent to which members of a
society perceive that an institution has unequal distribution in power”
(Hofstede, 1980, p. 45). In cultures with high power distance, people are
more likely to perceive that their superiors wield more power than they do,
and individuals are also remarkably affected by inherited wealth and social
status (Steenkamp, 2001). In cultures with low power distance, people tend
to accept the power of expertise rather than coercive power; they also
consider respect and equality as the most important elements of social
interaction (Hofstede, 1980). Thus, subordinates are easy to socialize with
their superiors, perceive them as colleagues, guest ion their directives, and
make decision making with their bosses in low-power distance culture
(Early, Ang & Ten, 2006). In such cultural environments people are more
likely to have both greater emotional intensity and greater emotional
expressiveness, the level of emotional intelligence is expected to be higher.
H2a. Power distance has a negative effect on EI.
The individualism/collectivism dimension is the most frequently used in
cross-cultural research (Triandis, 1989; Traindis, Bontempo & Villareal, Asai
& Lucca, 1988). Both self-concept and emotion are formed by dimensions
of individualism and collectivism (Hofstede 1980; Marcus & Kitayama 1991;
Triandis 1989; Bailey and Chen 1997; Asai and Lucca, 1988). Collectivists
are more likely to value the overall welfare of the group over the needs of
the individual, whereas individualists stress the exceptional significance of
their own idiosyncratic values, attitudes and preferences.
The terms “interdependent” and “independent” are utilized by Marcus and
Kitayama (1991) to describe the social dynamics of collectivism versus
individualism. For an independent construal of the self, individuals are
separate, disconnected identities. Thus, the expression and display of one’s

Emotional Intelligence across Cultures: The Relationship between Emotional Intelligence and Cultural Distance 129
own skills are encouraged because this valuation of independence emphasizes
the uniqueness of exceptional qualities, preferences and abilities (Bailey &
Chen, 1997). In contrast, the concept of interdependence is underscored by a
network of connectedness between individuals. Collectivistic cultures highly
value this ability to connect with others and strive for mutually harmonious
relationships (Marcus & Kitayama, 1991). In these cases, the individual
should not strive to assert their own identities, but rather, negotiate norms
and work together with others for the greater good (Bailey & Chen, 1997).
People in collectivistic cultures tend to formulate their personal emotions,
thoughts and behaviors according to broader social relationships. Therefore,
individualism is expected to have a positive effect on emotional intelligence.
H2b. Individualism has a positive effect on EI.
Uncertainty avoidance refers to ambiguity and the extent to which
countries perceive the tolerance of deviation from the norm (Hofstede, 1980).
In a culture with low uncertainty avoidance, individuals exhibit higher levels
of tolerance to behavior that stands outside generally accepted social
practices and behaviors (Hofstede, 1980). Compared to cultures with high
uncertainty avoidance, these individuals view diversity and change as a
given aspect of life and tend to take more risks. However, members of
cultures with high uncertainty avoidance adhere more rigidly to written
rules, clear statements, and a formality to the structure of life (Yeniyurt &
Townsend, 2003). As a result, in cultures with high uncertainty avoidance
less attention would be paid to the emotional world of the individual.
H2c. Uncertainty avoidance has a negative effect on EI.
The masculinity dimension expresses the extent to which society values
power, money and assertiveness, as opposed to people, quality of life and
caring for others (Hofstede, 1980). Material wealth, power, and assertiveness
are emphasized in a masculine culture. People in these cultures emphasize
competition, performance, personal ambition, independence and work. On the
other hand, a feminine culture is highly focused on people. In particular,
service and responsibility to others, interdependence between people, and the

130 經營情報硏究 第29券 第2號
quality of social life are valued (Hofstede, 1980). Consequently, individuals in
the feminine cultures are more likely to have both greater emotional
intensity and greater emotional expressiveness than those in the masculine
cultures (Paez & Vergara, 1995; Berrocal, Salovey, Vera, Extremera &
Ramos, 2005). Hence, it is expected that masculinity dimension has a
negative effect on emotional intelligence.
H2d. Masculinity has a negative effect on EI.
Ⅳ. Methods
1. Study1 : Participants and Data Collection
The author selected a Korean/American comparison due to the remarkably
increased business opportunities between the two nations. The experimental
design implemented for the study focused on minimizing the impact of
factors such as differences between organizations, industries, etc. by finding
a single corporate entity (one organization) with similar facilities (electronics
manufacturing plants) in each country. The EQ Episode Test was
administered to a random sample of participants at two sites, one located in
Seoul, South Korea and one located in Dallas, Texas, United States of
America. Demographics show that the participants represent all ages, all
educational levels, all salary ranges, both genders, and all job positions
typical of this corporation's manufacturing facilities. A total of 160
individuals (80 from the United States and 80 from South Korea)
participated in this study. The EQ Episode Test was used to measure the
level of the individual’s ability in each of the two attributes; self regulation
and other regulation.
This study used a survey based on experimental design with cross-
sectional convenience sampling to examine the relationship between culture
and EI. The EQ Episode Test, developed by Dr. Moon (1999) was used as
the data collection instrument for this study. The EQ Episode Test was
originally designed for measuring various behavioral tendencies in terms of

Emotional Intelligence across Cultures: The Relationship between Emotional Intelligence and Cultural Distance 131
how people express and regulate their emotion in given situations (Moon,
Kang & Choi, 2004). More specifically, the EQ Episode Test was designed
to measure the extent and degree of the individual’ ability for regulating and
managing emotions in others and ourselves (Moon, Kang & Choi, 2004).
This instrument attempts to portray more detailed and complicated situations
in each question by using multiple-task ability scales rather than simply
presenting the statement by using a numeric point Likert scale.
The EQ Episode Test consists of 25 questions organized into two
attributes: 1) self regulation and 2) other regulation, which are adapted from
Salovey and Mayer’s (1990) Multifactor Emotional Intelligence Scale (MEIS)
(Moon, Kang & Choi 2004). Table 1 presents a definition of each attribute,
and examples of questions. Each question reflects one out of the two
attributes, e.g. Question 11 reflects other regulation while Question 15
reflects self regulation. The EQ Episode Test was translated into an English
version for the American participants by the author. In addition and
consistent with protocol of the Institutional Review Board at George
Washington University, the instrument was reverse translated to ensure the
accuracy of the translation. However, controlling potential translation nuance
and vagaries are limited when the original EI test written in Korean was
translated by the author into English.
Table 1. EI Attributes and Examples of Questions
Attributes Self Regulation
Definition
▪ The ability to perceive and identify one’s emotional content from
a current situation
▪ Calm oneself and control one’s negative feeling
Example of
Question
15. Today is not your day. Your family was in a bad mood this
morning, and most daily tasks have not progressed well as
normal. However, you have a lot of tasks still ahead of you.
What would you do?
Attributes Other Regulation
Definition▪ Calm other’s negative feeling
▪ Transform other’s feeling into a positive
Example of
Question
11. Your daughter or son often shows a temper over little things.
Today, he/she also shows nervousness and makes a sharp retort
after returning from school. What would you do?

132 經營情報硏究 第29券 第2號
Cronbach’s alpha estimate for reliability of the EQ Episode Test is 0.81
based on a total 160 individuals (80 from the U.S. and 80 from Korea)
participated in this study. More specifically, the reliabilities of the two
attributes are 0.80 for self-management, and 0.82 for other management.
Confirmatory factor analysis (CFA) demonstrated good fit of the data to a
two-factor correlated model: X2 (23 df) = 856.68, Goodness-of-Fit (GFI) =
0.90 Non-Normed Fit Index (NNFI) = 0.95, Comparative Fit Index (CFI) =
0.93, and root mean square of approximation (RMSEA) = 0.047.
2. Study 2 : Participants and Data Collection
While Study 1 used primary data by utilizing random samples from two
countries, Study 2 employed secondary data, consisting of 19,402 participants
(9,892 from South Africa, 534 from Singapore, 1,759 from Sweden, 516 from the
United States, 1,036 from Canada, 1,342 from Finland, 1,009 from Norway, 1,623
from United Kingdom, 310 from Australia, 446 from Argentina, 168 from
German, 418 from Israel, and 235 from India) drawn from the Bar-On
Emotional Quotient-Inventory (EQ-i) of the MHS Technical Report (2006). In
addition, we collected the secondary data from helps of the MHS Company
which has promoted and sold both Reuven Bar-On's product, the BarOn EQi,
and the Mayer Salovey Caruso product, the MSCEIT.
The Bar-On Emotional Quotient Inventory (EQ-i, 133 item version) was
designed to measure social and emotional competencies related to the construct
of emotional (EQ-i Technical Report, 2006). The Bar-On EQ-i has been
translated into more than 30 languages, and data have been collected in over
48,000 individuals worldwide. As self-assessment, the EQ-i includes the five
components: 1) Intrapersonal EQ (Emotional Self-Awareness, Assertiveness,
Self-Regard, Self-Actualization, and Independence); 2) Interpersonal EQ
(Empathy, Interpersonal Relationship, Social Responsibility, Problem Solving,
Reality Testing, and Flexibility); 3) Adaptability EQ (empathy, organizational
awareness and service orientation); 4) Stress Management EQ (Stress
Tolerance, and Impulse Control); and 5) General Mood (Happiness, and
Optimism) (EQ-i Technical Report, 2006). The first two components

Emotional Intelligence across Cultures: The Relationship between Emotional Intelligence and Cultural Distance 133
(intrapersonal and interpersonal EQ) are similar in comprehension and
knowledge, although one concerns the ability to express oneself and the other
involves the ability to relate to other, or empathy. The third component,
adaptability EQ deals with adaptability to change and the ability to solve
problems of a personal or social nature. The fourth component, stress
management deals with control: how adeptly one handles strong emotions and
regulates impulses. Finally, the last component, general mood refers to the
ability to look at the brighter side of life, to continue a positive attitude, and to
feel satisfied with one’s life. Table 2 describes the mean EI scores of the 13
countries, and their index scores of the 4 cultural dimensions.
Table 2. EI Mean Scores and Index Scores of Cultural Dimensions in 13 Countries
Country Mean EI SD PDI IDV MAS UAI
Argentina 415.53 50.11 49 46 56 86
Australia 441.23 53.15 36 90 61 51
Canada 438.32 19.3 39 80 52 48
Finland 482.5 37.13 33 63 26 59
German 438.46 23.21 35 67 66 65
India 400.44 19.45 77 48 56 40
Israel 543.24 33.55 13 54 47 81
Norway 477.02 34.76 31 69 8 50
Singapore 454.78 44.82 74 20 48 8
South Africa 480.73 41.84 49 65 63 49
Sweden 477 11.3 31 71 5 29
UK 453.37 47.81 35 89 66 35
USA 470.94 15.5 40 91 62 46
Ⅴ. Results from This Study
1. Study1 : Cultural Impacts on Emotional Intelligence
The first hypothesis for Study 1 states that the most frequent answer to
questions on an EI test varies between cultures. Table 3 shows outcomes
from the H1a testing and attributes of each question. The results presented

134 經營情報硏究 第29券 第2號
in Table 3 were obtained by asserting a null hypothesis that is consistent
with current common usage of EI tests, i.e. 'The most populated answer for
each question on the EI test is equal between two cultures', and proceeding
with typical hypothesis testing. These results indicate that the most frequent
answer to questions on the EI test were identical in 14 questions (3, 4, 5, 6,
7, 9, 11, 12, 14, 16, 17, 18, 21 and 22) and different in 11 questions (1, 2, 8,
10, 13, 15, 19, 20, 23, 24 and 25) between the two cultural groups. In other
words, hypothesis testing revealed that the overall results are mixed and the
most frequent answer on the EI test is identical in some questions and
different in the other questions between two cultural groups.
Table 3. Outcomes of H1a
H1a: The most frequent answer for each question on the EI test varies between two
cultures.
Question Number
Question Content Attribute Result of H1a
12345678910111213141516171819202122232425
Episode of life situationEpisode of interpersonal relationshipEpisode at workEpisode at homeEpisode of interpersonal relationshipEpisode of interpersonal relationshipEpisode of car accidentsEpisode of man and wifeEpisode of traffic problemEpisode of friend relationshipEpisode of family relationshipEpisode of friend relationshipEpisode of colleague relationshipEpisode of colleague relationshipEpisode of life situationEpisode of interpersonal relationshipEpisode of family relationshipEpisode at workEpisode at workEpisode of interpersonal relationshipEpisode of interpersonal relationshipEpisode of friend relationshipEpisode of interpersonal relationshipEpisode of neighbor relationshipEpisode of family relationship
Other RegulationSelf RegulationOther RegulationOther RegulationOther RegulationSelf RegulationOther RegulationSelf RegulationOther RegulationSelf RegulationOther RegulationSelf RegulationSelf RegulationOther RegulationSelf RegulationSelf RegulationOther RegulationOther RegulationSelf RegulationSelf RegulationSelf RegulationSelf RegulationOther RegulationOther RegulationSelf Regulation
H=SupportedH=SupportedH=RejectedH=RejectedH=RejectedH=RejectedH=RejectedH=SupportedH=RejectedH=SupportedH=RejectedH=RejectedH=SupportedH=RejectedH=SupportedH=RejectedH=RejectedH=RejectedH=SupportedH=SupportedH=RejectedH=RejectedH=SupportedH=SupportedH=Supported

Emotional Intelligence across Cultures: The Relationship between Emotional Intelligence and Cultural Distance 135
In order to test whether or not the study can generalize its findings for
significant variances in the answers (A, B, C, or D) selected by the two
cultural groups for each question, a Chi-Square Test was conducted to
verify the statistical significance of each question. Table 4 summarizes the
statistical significance of each question with 95% confidence. Complete
details of the statistical analysis are shown in Appendix I.
Table 4. Outcomes of H1b
H1b: The distributions of answers (A, B, C, or D) for each question differ by
culture.
Question
NumberAttribute
X2
(Chi-square)
Is it statistically significant at
95%? (P-Value)
1
2
3
4
5
6
7
8
9
10
11
12
13
14
15
16
17
18
19
20
21
22
23
24
25
Other Regulation
Self Regulation
Other Regulation
Other Regulation
Other Regulation
Self Regulation
Other Regulation
Self Regulation
Other Regulation
Self Regulation
Other Regulation
Self Regulation
Self Regulation
Other Regulation
Self Regulation
Self Regulation
Other Regulation
Other Regulation
Self Regulation
Self Regulation
Self Regulation
Self Regulation
Other Regulation
Other Regulation
Self Regulation
7.94
40.11
17.56
54.42
4.81
23.26
20.82
12.45
11.74
15.74
5.79
6.78
32.87
1.46
11.88
10.79
2.29
2.18
23.14
19.74
2.79
11.34
37.85
18.86
91.75
Yes (0.047)
Yes (0.000)
Yes (0.001)
Yes (0.000)
No (0.186)
Yes (0.000)
Yes (0.000)
Yes (0.006)
Yes (0.008)
Yes (0.001)
No (0.055)
No (0.079)
Yes (0.000)
No (0.483)
Yes (0.008)
Yes (0.013)
No (0.515)
No (0.536)
Yes (0.000)
Yes (0.000)
No (0.425)
Yes (0.010)
Yes (0.000)
Yes (0.000)
Yes (0.000)
As shown in, only 7 questions out of 25 (5, 11, 12, 14, 17, 18 and 21)
show no statistically significant differences in the distribution of answers

136 經營情報硏究 第29券 第2號
between the two cultural groups. Although the most frequent answer to
each question on the EI test were identical in 14 questions (3, 4, 5, 6, 7, 9,
11, 12, 14, 16, 17, 18, 21 and 22) between the two cultural groups, 7 of these
questions (3, 4, 6, 7, 9, 16 and 21) showed significant variances in the
distribution of answers, i.e. the distribution of the frequency of respondents
selecting answer A, B, C or D for a given question. The findings support
that feeling and rules for emotional display are significantly influenced by
cultural norms. The reason for statistically significant variances in the
distributions of answers between the two cultural groups is due to these
different standards of acceptability, which have evolved in relation to
socio-cultural contexts and differ across cultures.
This study represented that EI was largely dependent on culture by
analyzing the answer sheets between the two cultural groups. In order to
see whether culture was a truly unique factor that influences EI regardless
of other variables, such as gender, age and educational level, the multiple
regressions were conducted. The nominal variables, such as culture and
gender were converted into the dummy variables for multiple regression
analyses.
First of all, a multiple regression analysis among educational level (1=high
school, 2=college, 3=graduate), gender (1=male, 2=gender), age, and EI was
conducted except ‘culture’ variable. By including or excluding ‘culture’
variable in multiple regression models, the influencing power of culture on
EI can be examined through the comparisons of R2 and F-change between
the two multiple regression models. The multiple regression test without
‘culture’ variable leads to 95% confidence that there is a linear relationship
between EI and independent demographic variables like gender, age, and
education (Adjusted R2=0.322, F=26.211, P<0.05). It was concluded that
32.2% of the variance in EI level is shared with gender, age and education.
The results of the multiple regression also lead to 95% confidence that all of
the independent variables, such as gender (β=0.161, t=2.423), age (β=0.359,
t=5.448) and education (β=0.372, t=5.564) significantly impact EI (p<0.05).
The results of multiple regression test including ‘culture’ variable lead to
95% confidence that there is a linear relationship between EI and

Emotional Intelligence across Cultures: The Relationship between Emotional Intelligence and Cultural Distance 137
independent demographic variables like gender, age, education and culture.
Adjusted R2 increased by 2.4% from 0.322 to 0.346, and F-value also
increased significantly (p<0.05). Thus, involvement of ‘culture’ variable in a
model increases the explanatory power of an overall multiple regression
model. The independent variables such as gender, age, educational level and
national culture have a unique, determining relationship with EI. The results
of multiple regression show that culture is a truly unique factor that
influences EI. The multiple regression results with emotional intelligence and
its attributes as the dependent variables and the culture, age, gender, and
educational level as the independent variables are presented in Table 5.
Table 5. Multiple Regression Results (N = 160)
H1c. Emotional intelligence and its attributes, such as self regulation and other
regulation are influenced by culture.
Independent
Variables
Total EI Self Regulation Other Regulation
Std beta p-value Std beta p-value Std beta p-value
Culture
Age
Gender
Educational Level
0.203
0.446
0.148
0.290
0.000
0.000
0.025
0.000
-0.232
0.254
0.113
0.200
0.010
0.002
0.130
0.016
0.383
0.415
0.122
0.250
0.000
0.000
0.060
0.001
Based on Table 5, it was concluded that 34.6% of the variance in total EI,
16.8% of the variance in self regulation, and 36.9% of the variances in other
regulation are shared with gender, age, educational level and culture. Based
on an observation of beta weights, age appears to be the best predictor in
all three regressions, with a beta weight of 0.446 (total EI), 0.254 (self
regulation), and 0.415 (other regulation). In the regressions of self regulation
and other regulation, the next best predictor is culture, with a beta weight
of - 0.232 and 0.383 while the next best predictor is educational level, with
a beta weight of 0.290 in the regression of total EI. Based on the multiple
regression of total EI, the independent variables such as gender, age,
educational level, and culture have a unique, determining relationship with
EI. However, in the regressions of self regulation, and other regulation,

138 經營情報硏究 第29券 第2號
gender have no significant relationships between EI attributes (p>0.05).
To test the moderating effects of demographic variables, such as age,
gender, and educational level on the relationship between EI and culture, a
series of hierarchical moderated regression analyses were conducted for each
of the three dependent variables. In the first step of each regression
analysis, the independent variable (culture) was entered. The second step
added the moderator variables (culture, gender, and educational level). The
third step included interaction effects of Culture X Age, Culture X Gender,
and Culture X Education with all variables.
Table 6. Hierarchy Regression Analysis Predicting EI and Attributes (N = 160)
H1d: Demographic variables, such as age, gender and educational level will moderate
the relationship between emotional intelligence and culture.
Predictor VariableTotal EI Self Regulation Other Regulation
Beta T Beta T Beta T
Step 1Culture 0.16 2.032* -0.238 -3.085** 0.333 4.434***
Adjusted R2
Change in FSignificance (F Change)
0.0194.1280.044
0.0519.5190.002
0.10519.6570.000
Step 2CultureAgeGenderEducation
0.2030.4460.1480.290
2.591**6.117***2.261*3.983***
-0.2320.2540.1130.200
-2.623**3.087**1.523
2.439*
0.3830.4150.1220.250
4.977***5.794***1.897
3.498***
Adjusted R2
Change in FSignificance (F Change)
0.34627.3430.000
0.1688.4320.000
0.36922.9800.000
Step 3CultureAgeGenderEducationCulture x AgeCulture x GenderCulture x Education
-0.0680.3670.2630.3061.011-0.325-0.561
-0.193
4.409**2.850**3.529**2.946**-2.585*-1.799
-1.1040.1100.1450.2011.309-0.170-0.355
-2.756**1.1631.386
2.048*3.362***-1.190-1.003
0.5320.3970.2480.2690.531-0.311-0.502
1.510
4.776***2.685**3.113**1.549
-2.477*-1.613
Adjusted R2
Change in FSignificance (F Change)
0.3904.748
0.003**
0.2154.065
0.008**
0.3923.003
0.032*

Emotional Intelligence across Cultures: The Relationship between Emotional Intelligence and Cultural Distance 139
The results partially supported the hypothesis that the demographic
variables, such as age, gender and educational level moderate the
relationship between emotional intelligence and culture. As Table 6 suggests,
a significant interaction effect of Culture x Age and Culture x Gender were
found for the total EI. In other words, the results supported that age and
gender have moderating effects on the relationship between culture and the
total EI. Table 6 indicates that the interaction of Culture x Age was
significant for self regulation while the interaction of Culture x Gender was
significant for other regulation. The results supported that age functioned
as a moderator on the relationship between culture and self regulation
whereas gender moderated the relationship between culture and other
regulation.
2. Study2 : Relationship between Cultural Distance and
Emotional Intelligence
Study 2 examined the relationship between cultural distance and emotional
intelligence by utilizing Hofstede’s cultural dimension scores across nations
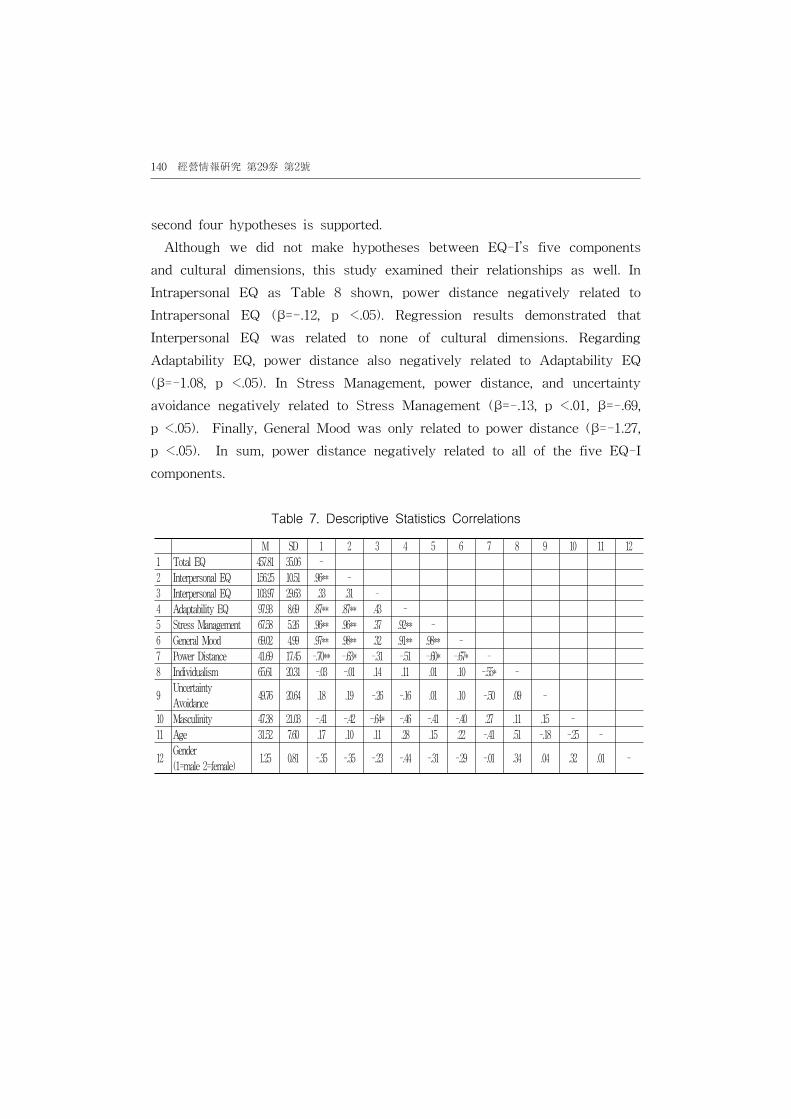
and the Bar-On EQ-i data. Table 7 presents the descriptive statistics, and
correlations used in this study. The hierarchical regression results with
emotional intelligence (total EQ-i) and its five components as the dependent
variables and the cultural dimensions as the independent variables can be
seen in Table 8.
In the first step of each regression analysis, the two control variables
(age, and gender) were entered and the four cultural dimensions (power
distance, individualism, uncertainty avoidance, and masculinity) were included
at the second step of each regression analysis. As shown in Table 8, the
coefficient for power distance is negative and significant, supporting H2a
that power distance has a negative effect on total EQ-i (ß=-.13, p<.05).
However, the coefficients for the other three dimensions, such as
individualism, uncertainty avoidance, and masculinity are insignificant, failing
to provide support for H2b, H2c, and H2d. Therefore, only one of the
140 經營情報硏究 第29券 第2號
second four hypotheses is supported.
Although we did not make hypotheses between EQ-I’s five components
and cultural dimensions, this study examined their relationships as well. In
Intrapersonal EQ as Table 8 shown, power distance negatively related to
Intrapersonal EQ (β=-.12, p <.05). Regression results demonstrated that
Interpersonal EQ was related to none of cultural dimensions. Regarding
Adaptability EQ, power distance also negatively related to Adaptability EQ
(β=-1.08, p <.05). In Stress Management, power distance, and uncertainty
avoidance negatively related to Stress Management (β=-.13, p <.01, β=-.69,
p <.05). Finally, General Mood was only related to power distance (β=-1.27,
p <.05). In sum, power distance negatively related to all of the five EQ-I
components.
Table 7. Descriptive Statistics Correlations
M SD 1 2 3 4 5 6 7 8 9 10 11 12
1 Total EQ 457.81 35.06 -
2 Interpersonal EQ 156.25 10.51 .96** -
3 Interpersonal EQ 103.97 29.63 .33 .31 -
4 Adaptability EQ 97.93 8.69 .87** .87** .43 -
5 Stress Management 67.58 5.26 .96** .96** .37 .92** -
6 General Mood 69.02 4.99 .97** .98** .32 .91** .98** -
7 Power Distance 41.69 17.45 -.70** -.63* -.31 -.51 -.60* -.67* -
8 Individualism 65.61 20.31 -.03 -.01 .14 .11 .01 .10 -.55* -
9Uncertainty
Avoidance49.76 20.64 .18 .19 -.26 -.16 .01 .10 -.50 .09 -
10 Masculinity 47.38 21.03 -.41 -.42 -.64* -.46 -.41 -.40 .27 .11 .15 -
11 Age 31.52 7.60 .17 .10 .11 .28 .15 .22 -.41 .51 -.18 -.25 -
12Gender
(1=male 2=female)1.25 0.81 -.35 -.35 -.23 -.44 -.31 -.29 -.01 .34 .04 .32 .01 -

Emotional Intelligence across Cultures: The Relationship between Emotional Intelligence and Cultural Distance 141
Table 8. Hierarchical Multiple Regression Results Including the 13 Countries (N = 19,402)
Variable
Total EQIntrapersonal
EQ
Interpersonal
EQ
Adaptability
EQ
Stress
Management
General
Mood
Step
1Step 2
Step
1
Step
2
Step
1
Step
2
Step
1
Step
2
Step
1
Step
2
Step
1
Step
2
Age .18 -.17 .10 -.23 .11 -.49 .29 -.17 .15 -.26 .22 -.16
Gender -.32 -.15 -.36 -.19 -.24 -.12 -.44 -.35 -.31 -.14 -.29 -.16
Power
Distance-.13 -.12 -.49 -1.08 -.13 -1.27
Individuali
sm-.54 -.47 .27 -.21 -.51 -.43
UA -.50 -.41 -.54 -.71 -.69 -.53
Masculinit
y.10 .02 -.55 .03 .10 .08
F .78 4.64 .81 4.78 .38 2.1 4.83 .68 5.59 .79 4.71
ΔF 5.82 4.38 2.82 4.63 5.96 4.30
R2 .13 .82 .13 .73 .07 .67 .73 .12 .78 .13 .73
ΔR2 .68 .59 .60 .45 .66 .59
Adjusted
R2 -.03 .64 -.03 .47 -.11 .35 .47 -.05 .56 -.03 .46
Notes: Gender (1=male, 2=female), UA (Uncertainty Avoidance) *p<.05. **p<.01. *** p<.001.
Ⅵ. Discussion and Managerial Implications
The fundamental question of Study 1 asked is, "Do the perceptions and
reactions of emotion under a certain situation differ between employees in
Korea and in the United States?" That is, the question of whether emotional
intelligence is culturally-dependent has been answered by this research.
This study finds that emotional intelligence does not depend completely on
national culture, but is significantly influenced by it. The findings support
that feeling and rules for emotional display are significantly influenced by
cultural norms. The reason for statistically significant variances in the
distributions of answers between the two cultural groups is due to these
different standards of acceptability, which have evolved in relation to
socio-cultural contexts and differ across cultures. There are two possible
reasons for similar distributions of answers between the two cultural groups.
The first reason is due to the existence of basic emotion, which is

142 經營情報硏究 第29券 第2號
universally common to the human experience. The second reason is
explained by the complexity of culture. Although this study attempted to
explore two national cultures (American and Korean) in terms of
individualism versus collectivism, the boundaries defining individualism and
collectivism were not always apparent, but sometimes blurred.
The most populated answers chosen by the Korean group do not
consistently reflect the traits of collectivistic society, but sometimes reflect
the traits of individualistic society. Similarly, the most populated answers
selected by the American group also reflect the characteristics of both
individualism and collectivism. Collectivism and individualism can coexist in
a single culture and emphasis on either in each culture depends on the
situation (Triandis, 1993). In other words, there are individualists in
collectivistic cultures and collectivists in individualistic cultures (Bandura,
2002). The distinction between vertical and horizontal individualism/
collectivism is relevant here. There are individuals with strong
characteristics of individualism/collectivism as well as individuals with weak
traits of individualism/collectivism within an individualistic/collectivistic
society. This cultural complexity contributes to the similar distribution of
answers between the two cultural groups.
The purpose of Study 2 examined the relationship between cultural
distance and emotional intelligence. The results of multiple regression
analyses did not prove that causal relationships existed between emotional
intelligence and cultural dimensions, such as individualism, uncertainty
avoidance, and masculinity, but the results of this study indicated a strong
association between emotional intelligence and power distance. Although the
results were not consistent with all of the expected hypotheses, Study 2
contributes to the body of empirical evidence regarding the relationship
between emotional intelligence and cultural distance. Since most studies have
examined EI’s relationship with individual performance or organizational
effectiveness, Study 2 is actually the first attempt to define the relationship
between emotional intelligence and cultural distance in the EI literatures.
New management and social theories are formulated and tested all the
time. Nevertheless, our ethnic cultures change only slowly and will remain,

Emotional Intelligence across Cultures: The Relationship between Emotional Intelligence and Cultural Distance 143
by and large, the same. Today, managers who are responsible for activities
such as directing, communicating and coordinating the work lives of very
diverse groups of people must exercise emotional intelligence continuously.
In addition to exercising emotional intelligence, studies such as the one
presented in this paper illustrate that to be effective managers must also be
cognizant of the differences between cultures in the work place. That is, this
study concludes that there is a definite and appreciable effect of culture on
emotional intelligence. And, that this cultural effect is rooted in our ethnic
background. Results of analysis completed show that now only is there a
discernible effect of culture overall but that each attribute of emotional
intelligence is affected differently by culture.
As with any study, there are limitations in this study. This study
assumes that by studying two different sites for the same company, one in
South Korea and one in the United States, the data collected is
representative of the differences in culture of each country and the
differences found between different companies has been mitigated. This has
not been proven. Nor have the differences in organizational culture from
group to group inherent in any company been considered in any detail. In
addition, since the data samples collected in this study are limited to the
workers of a single company with one site each in South Korea and in
America, generalizations of the study is limited and the chance of sampling
errors cannot be excluded. Therefore, the results of the study may not be
universally applicable to all Korean and American firms. Another limitation
is a small number of countries involved in Study 2. This study attempted to
collect a large number of the secondary data from helps of the MHS
Company. The initial aim of collecting average EI data for the countries was
much more than those of the 13 countries, but it was limited due to its
copy right issue. If EI data for more numbers of countries were collected,
this study would demonstrate stronger relationships between emotional
intelligence and cultural distance. Since Study 2 includes only 13 countries,
we need to add more numbers of countries from all over the world in the
future study.

144 經營情報硏究 第29券 第2號
References
01. Aaker, J. and Williams, P. (1998). Empathy versus pride: The influence
of emotional appeals across cultures. Journal of Consumer Research,
25(3), 241-261.
02. Agarwal, S. (1994). Sociocultural distance and the choice of joint
ventures: A contingency perspective. Journal of International Marketing,
2(2), 63-80.
03. Assai, M. and Lucca, N. (1988). Individualism and collectivism:
Cross-cultural perspectives in self-ingroup relationship. Journal of
Personality and Social Psychology, 54(2), 323-338.
04. American Heritage Dictionary of the English Language: 4th Edition. 2003.
05. Bailey, J. and Chen, C. (1997). Conceptions of self and performance-
related feedback in the U.S., Japan and China. Journal of International
Business Studies, 28(3), 605-625.
06. Bandura, A. (2002). Social cognitive theory in cultural context. Applied
Psychology: An International Review, 51(2), 269-290.
07. Bar-On, R. (1988). The development of a concept of psychological
well-being. Doctoral dissertation, Rhodes University, South Africa.
08. Bar-On, R. (2000). Emotional and social intelligence: Insights from the
emotional quotient inventory, In R. Bar-On and J.D.A. Parker (Eds.),
The Handbook of emotional intelligence: theory, development,
assessment, and application at home, school, and in the workplace,
363-388. San Francisco: Jossey Bass.
09. Bar-On, R. (2006). Emotional quotient inventory (EQI) Technical Manual,
MHS.
10. Benson, E. (2003). Intelligence across cultures: Research in Africa, Asia
and Latin America is showing how culture and intelligence interact.
Monitor on Psychology, 34(2), 56-58.
11. Berrocal, P.F., Salovey, P., Vera, A., Extremera N. and Ramos, N. (2005).
Cultural influence on the relationship between perceived emotional
intelligence and depression. Revue Internationale de Psychologie Sociale,

Emotional Intelligence across Cultures: The Relationship between Emotional Intelligence and Cultural Distance 145
18(1), 91-107.
12. Brewer, C., Tregaskis, O., Hegewicsh, A., and Mayne, L. 1996.
Comparative research in human resource management: A review and
example. The International Journal of Human Resource Management,
7(3), 585-604.
13. Brouthers, K. D. and Brouthers, L. E. (2001). Explaining the national
culture distance paradox. Journal of International Business Studies,
32(1), 177-189.
14. Cavallo, K. and Brienza, D. (2002) “Emotional competence and leadership
excellence at Johnson & Johnson: The emotional intelligence and
leadership study.” http://www.eiconsortium.org/research/jj_ei_study.htm,
accessed 14 March 2004
15. Cherniss, C. and Goleman, D. (2001). The emotionally intelligent
workplace: How to select for measure, and improve emotional
intelligence in individuals, groups, and organizations. San Francisco:
Jossey-Bass.
16. Chipain, G. C. (2003). Emotional intelligence and its relationship with
sales success. A thesis in educational leadership. School of Education
in DePaul University, July 2003.
17. Chirkov, V. I., Lynch, M. and Niwa, S.(2005). Application of the
scenario questionnaire of horizontal and vertical individualism and
collectivism to the assessment of cultural distance and cultural fit.
International Journal of Intercultural Relations, 29, 469-490.
18. Cohen, Jacob. (1988). Statistical power analysis for the behavioral
sciences (Rev. Ed.). New York: Academic Press.
19. DeMente, B. L. (1988). Korean etiquette and ethics in business.
Lincolnwood: NTC Business Books.
20. Doi, T. (1973). The anatomy of dependence. Tokyo, New York: Kodansha
International.
21. Eagly, A., Karau, S. and Makhijani, M. (1992). Gender and the evaluation
of leaders: A meta analysis. Psychological Bulletin, 111(1), 3-22.
22. Earley, P. C. and Ang, S. (2003). Cultural intelligence: An analysis of
individual interactions across cultures. Palo Alto, CA: Stanford

146 經營情報硏究 第29券 第2號
University Press.
23. Earley, P. C., Ang, S., and Tan, J. (2006). CQ: Developing cultural
intelligence at work. Palo Alto, CA: Stanford University Press.
24. Emotional Quotient Inventory (EQI) Technical Report (2006), MHS.
25. Gabel, R. S., Dolan, S. L. and Cerdin, J. L. (2005). Emotional intelligence
as predictor of cultural adjustment for success in global assignments.
Career Development International, 10(5), 375-395.
26. Gardner, H. (1993). Multiple Intelligences: The Theory in Practice. New
York: Basic.
27. Goleman, D. (1995). Emotional intelligence. New York: Bantam Books.
28. Goleman, D. (1998). Working With Emotional Intelligence. New York:
Bantam Books.
29. Greenfield, P. M. (1997). You can’t take it with you: Why ability
assessments don’t cross culture? American Psychologist, 52(10),
1115-1124.
30. Grosse, R. & Trevino, L. J. (1996). Foreign direct investment in the
United States: An analysis of country of origin. Journal of International
Business Studies, 27(1), 139-155.
31. Hair, J. F., Anderson, R. E. , Tatham, R. L. and Black, W. C. (1995).
Multivariate data analysis. Englewood Cliffs, NJ: Prentice Hall.
32. Hall, E. T. (1976). Beyond culture. Garden City, NY: Anchor Press.
33. Hall, E. T. & Hall M. R. (1990). Understanding cultural differences.
Yarmouth, ME: Intercultural Press.
34. Hart, B. (2002). Men and women should celebrate differences. Salt Lake
City, UT: The Desert News Publishing Co.
35. Hay/McBer (1996). Generic Competency Dictionary. Boston, Hay/McBer.
36. Hemphill, C. (1998). Class, gender, and the regulation of emotional
expression. In P. Stearns and J. Lewis (Eds) An emotional history of
the United States: 33-51. New York: New York University Press.
37. Higgs, M. and Dulewicz, S.V. (1999). Making sense of emotional
intelligence. Windsor, Berkshire, UK: NFER Nelson.
38. Higgs, M. and McGuire, M. (2001). Emotional intelligence and culture: an
exploration of relationship between individual emotional intelligence and

Emotional Intelligence across Cultures: The Relationship between Emotional Intelligence and Cultural Distance 147
organizational culture. Henley Working Papers and Research Notes:
HWP0118, 1-35.
39. Hochschild, A. R. (1996). The sociology of emotion as a way of seeing.
In G. Bendelow and S. Williams (Eds) emotions in social life: critical
themes amid contemporary issues. London: Routledge.
40. Hochschild, A. R. (1983). The managed heart: The commercialization of
human feeling. Berkeley: University of California Press.
41. Hofstede, G. (1980). Motivation, leadership, and organization: Do
American theories apply abroad? Organizational Dynamics, 9(1), 42-63.
42. Kim, E. S. (2000). Emotional intelligence assessment: Working with culture,
Multicultural Matters. http://www.indiana.edu/~div16/ MultiCultural.html accessed
5 May 2003.
43. Kim, U. (1994). Individualism and collectivism: theory, method, and
applications. Thousand Oaks, CA: Sage.
44. Kogut, B., and Singh, H. (1988). The effect of national culture on the
choice of entry mode. Journal of International Business Studies, 19(3),
411-432.
45. Ledger, L. D. (1997). "Cultural bias in IQ testing," Liberal Arts and
Crafts. http://www.liberalartsandcrafts.net/contentcatalog/social/bias.shtml
assessed 06 March, 2004.
46. MacConatha, J. T., Leone, F. M. and Armstrong, J. M. (1997). Emotional
control in adulthood. Psychological Reports, 80(2), 499-507.
47. Marcus, H. and Kitayama, S. (1991). Culture and the self: Implications
for cognition, emotion, and motivation. Psychology Review, 98(2),
224-253.
48. MacConatha, J. T., Lightner, E., and Deaner, S. L. (1994). Culture, age,
and gender as variables in the expression of emotion. Journal of Social
Behavior and Personality, 9(3), 481-488.
49. Manev, I. M. and William B. S. (2001). Nationality cultural distance and
expatriate status: Effects on the managerial in a multinational enterprise.
Journal of International Business Studies, 32(2), 285-303.
50. Matsumoto, D. (1989). Cultural influences in the perception of emotion.
Journal of Cross-Cultural Psychology, 20(1), 92-105.

148 經營情報硏究 第29券 第2號
51. Marcus, H. R. and Wurf, E. (1987). The dynamic self-concept: A social
psychological perspective. Annual Review of Psychology, 38, 299-337.
52. Mayer, J. D., Caruso, D. R., and Salovey, P. (1999). Emotional
intelligence meets traditional standards for an intelligence. Intelligence,
27(4), 267-298.
53. Mayer, J. and Salovey, P. (1993). The intelligence of emotional
intelligence. Intelligence, 17(4), 433-442.
54. Moon, Y (1999). The EQ Episode Test, Seoul National University.
55. Moon, Y., Kang, M. and Choi, K. (2004). Exploring the validity of EQ
Episode Test. The Korean Journal of Human Development, 11(3), 1-16.
56. Mesquita, B., Frijda, N., and Scherer, K. (1997). Culture and emotion. In
J.W. Berry, P.R. Dasen, and T.S. Saraswathi (Eds) Handbook of
cross-cultural psychology: Basic processes and human development (Vol
2): 255-297. Needham Heights, MA: Allyn and Bacon.
57. Muchinsky, P. (2000). Emotions in the workplace: the neglect of
organizational behavior. Journal of Organizational Behavior, 21(7),
801-805.
58. Oyserman, D. and Marcus, H. R. (1993). The Sociocultural self. In J.
Suls (Ed) Psychological Perspectives on the Self: Vol 4 (The Self in
Social Perspective). Hillsdale, NJ: Lawrence Erlbaum Assoc.
59. Paez, D. and Vergara A. (1995). Cultural difference in emotional
knowledge. In J.A. Russell, J.M. Fernandez-Dols, A.S.R. Manstead &
J.C. Wellenkamp (eds.) Everyday conceptions of emotion. Dordrecht:
Kluwer Academic Press.
60. Petrides, K. and Furham, A. (2000). Gender differences in measured and
self-estimated trait emotional intelligence. Sex Roles: A Journal of
Research, 42(5), 449-461.
61. Poortinga, Y. H. (1989). Equivalence of cross-cultural data: An overview
of basic issues. International Journal of Psychology, 24(6), 737-756.
62. Salovey, P. and Sluyter, D. (1997). Emotional development and emotional
intelligence. New York: Basic Books, HarperCollins.
63. Salovey, P. and Mayer, J. (1990). Emotional intelligence. Imagination,
Cognition & Personality, 9, 185-211.

Emotional Intelligence across Cultures: The Relationship between Emotional Intelligence and Cultural Distance 149
64. Sandhu, D. S. (1997). Psychocultural profiles of Asian and Pacific
Islanders Americans: Implications for counseling and psychotherapy.
Journal of Multicultural Counseling and Development, 25(1), 7-22.
65. Shenkar, O. (2001). Cultural distance revisited: Towards a more rigorous
conceptualization and measurement of cultural differences. Journal of
International Business Studies, 32(3), 519-535.
66. Schutte, N. S., Malouff, J. M., Hall, L. E., Haggerty, D. J., Cooper, J. T.,
Golden, C. J. and Dornheim, L. (1998). Development and validation of a
measure of emotional intelligence. Personality and Individual
Differences, 25, 523-536.
67. Sjöberg, L. (2001). Emotional Intelligence and Life Adjustment: A
Validation Study. SSE/EFI Working Paper Series. Center for Economic
Psychology, Stockholm School of Economics, Sweden, 1-14.
68. Sousa, C. M. and Bradley, F. (2006). Cultural distance and psychic
distance: two peas in a pod? Journal of International Marketing, 14(1),
49-70.
69. Soutar, N. G.., Lee, J. A. and Ng, S. I. (2007). Are Hofstde’s and
Schwartz’s value frameworks congruent? International Marketing
Review, 24(2), 164-180.
70. Steenkamp, J.-B.E.M. (2001). The role of national culture in international
marketing research. International Marketing Review, 18(1), 30-44.
71. Sternberg, R. J (1986). Handbook of human intelligence. New York:
Cambridge University Press.
72. Steinberg, D. I. (2000). Euphoria after the summit. KOIS Special.
http://www.korea.net/issue/sn/news/xnews.asp accessed 01 June, 2004.
73. Thorndike, R. (1920). Intelligence and its uses. Harper Magazine, 140,
227-235.
74. Triandis, H. C. (1989). The Self and social behavior in differing cultural
Contexts. Psychological Review, 96(3), 506-520.
75. Triandis, H. C., Bontempo, R., Villareal, M., Asai, M. and Lucca, N.
(1988). Individualism and collectivism: Cross-cultural perspectives on
self-ingroup relationship. Journal of Personality and Social Psychology,
54(2), 323-338.

150 經營情報硏究 第29券 第2號
76. Trompennars, F. (1994). Riding the waves of culture: Understanding
diversity in global business. Burr Ridge, IL: Irwin Professional
Publications.
77. Whyte, W. H. (1956). The organization man, New York: Simon and
Schuster.
78. Yoo, S. (2001). The cultural impact on depression expression and
attitudes toward seeking professional help: A comparative study of
Americans and South Koreans. Asian Pacific Education Review, 2(1),
94-100.

Emotional Intelligence across Cultures: The Relationship between Emotional Intelligence and Cultural Distance 151
문화와 정서지능 : 정서지능과 문화 거리의 계를
심으로
문태원**
요 약
본 연구는 문화와 정서지능과의 의존 계를 정립하여 정서지능 연구에 새로
운 시각을 부여하려고 했다. 본 연구의 제는 개인정서의 지각, 평가, 표 , 이
해, 조 등이 문화에 크게 향을 받기 때문에 인간의 다양한 정서 로세스를
기 로 개발된 정서지능 역시 문화에 많은 향을 받는다는 것이다. 본 논문은
문화가 정서지능에 미치는 향을 규명하기 해서 미국과 한국의 직장인을
상으로 정서지능을 측정한 후, 정서지능과 문화의 의존 계를 실험하 다. 주어
진 상황 아래서 정서 반응이 문화 간 다양한 변화를 보인다는 것을 입증함으
로서 정서지능이 문화에 의존한다는 것을 보 다. 한, 본 연구는 Bar-On
Emotional Quotient-Inventory (EQ-i)의 2차 데이터를 사용하여 13개국의
19,402명의 정서지능과 문화 거리의 계를 조사하 다. 연구결과로서
Hofstede의 문화차원 권력의 거리 (power distance)만이 정서지능에 유의미
한 결과를 보 다.
핵심주제어 : 문화, 정서지능, 문화 거리
* 홍익 학교 경 학과 조교수, [email protected]