
EMMA - World Radio History
274
EMMA Review Cutting the VideoDisc Master 2..5MHZ- March 1982 Volume 43 No. 1 RCARCI 43(1) 1-274 (1582)
Transcript of EMMA - World Radio History

EMMA Review
Cutting the VideoDisc Master
2..5MHZ-
March 1982 Volume 43 No. 1
RCARCI 43(1) 1-274 (1582)
Cover Fourteen kilometers of metal "chip", 1/200 the thickness of a human hair, are Cut from a VideoDisc master in recording an hour-long program. Pictured on the cover, at 5000 times magnification, is a 50 -micrometer - long section of such a Chip showing the minute signal undulations, whose counterpart on the master will ulti- mately be pressed into a disc to pro- vide a color video program. This fig- ure Is taken from the paper on Mi- cromachining VideoDisc Grooves and Signals by J. Guarracini, J.H. Reisner,. J.L. Walentine, and C.A. Whybark in this issue.
RCA Review, published quarterly in March, June, September and De- cember by RCA Research and En- gineering, RCA Corporation, Prince- ton, New Jersey 08540. Entered as second class matter July 3, 1950 under the Act of March 3, 1879., Second-class postage paid at Princeton, New Jersey, and at addi- tional mailing offices. Effective Jan- uary 1, 1978, subscription rates as follows: United States and Canada: one year $8.00, two years $14.00, three years $18.00; in other coun- tries, one year $8.60, two years $15.20, three years $19.80. Single copies (except for special issues) up to five years old $3.00.

}4a Review
RCA Review (ISSN 0033-6831) is a technical journal published quarterly by RCA Research and Engineering in cooperation with the subsidiaries and divisions of RCA.
VideoDisc Mastering Stylus and Pickup Circuit Record Developmental Testing
March 1982 Volume 43 Number 1 ISSN 0033-6831

nffia Review
VideoDisc Special Issue
Contents
1. VideoDisc Mastering
RCA Review (ISSN 0033-6831) Is a technical journal published quarterly by RCA Research and Engineering In cooperation with the subsidiaries and divisions of RCA.
5 VideoDisc Mastering-An Overview J. A. vanRaalte
21 Principles for the Design of Cutters for VideoDisc Recording J. H. Reisner, J. Valachovic, R. E. Simms, and H. I. Moss
35 Power Dissipation in Piezoelectric Cutterheads G. A. Alphonse
44 Thermal Analysis of VideoDisc Cutter R. Shahbender
57 Approximate Resonance Spectrum of a VideoDisc Cutter R. Shahbender, K. S. Vanguri, and B. T. Khuri-Yakub
66 Micromachining VideoDisc Grooves and Signals J. Guarracini, J. H. Reisner, J. L. Walentine, and C. A. Whybark
84 A Method for the Characterization of Piezoelectric VideoDisc Recording Heads Using a Bridge Circuit G. A. Alphonse
95 A Ouadrature Michelson Interferometer System for Probing Surface Vibrations-Applications to VideoDisc Cutters K. F. Etzold
116 Testing Methods for the Characterization of Cutterhead Performance in Mastering VideoDiscs R. L. Truesdell
128 High Performance Optical Reader for Substrates M. Lurie. W. Barnette. I. Gorog, and R. Jebens

2. Stylus and Pickup Circuit
167 The VideoDisc Stylus Electrode H. L. Pinch, D. A. Furst, and R. T. Smith
179 Basics of VideoDisc Stylus Dynamics and Interaction with Surface imperfec- tions R. W. Nosker and D. L. Matthies
194 Capacitive -Pickup Circuitry for VideoDiscs R. C. Palmer, E. J. Denlinger, and H. Kawamoto
3. VideoDisc Record
212 Electrical and Physical Properties of Carbon -Filled PVC for Capacitance Pickup VideoDiscs P. Datta and H. Kawamoto
224 Capillary Behavior and Lubricating Properties of the RCA VideoDisc R. Williams and C. C. Wang
4. System Testing
228 VideoDisc Systems Testing at the RCA David Sarnoff Research Center D. P. Barton, R. R. Barton, M. Blecker, P. W. Lyons, K. A. Pitts, P. G. Stein, and J. R. Woolston
257 Patents
260 Authors

RCA Corporation Thornton F. Bradshaw Chairman and Chief Executive Officer
Editorial Advisory Board Chairman, J. J. Tietjen RCA Laboratories
G. C. Hennessy RCA Laboratories E. O. Johnson RCA Research Laboratories, Inc. H. Kressel RCA Laboratories J. Kurshan RCA Laboratories W. J. Merz Laboratories RCA, Ltd. K. H. Powers RCA Laboratories C. C. Richard International Licensing T. O. Stanley RCA Laboratories A. H. Teger RCA Laboratories W. M. Webster RCA Laboratories B. F Williams RCA Laboratories
Editor Ralph F. Ciafone
Associate Editors D. R. Higgs Missile and Surface Radar C. Hoyt Consumer Electronics Division T. King RCA Research and Engineering R. Mausler National Broadcasting Company M. Rosenthal RCA Americom, Inc. J. Schoen Solid State Division M. G. Pietz RCA Advanced Technology Laboratories W. S. Sepich Commercial Communications Systems Division J. E. Steoger RCA Service Company D. Tannenbaum Government Communications Systems
© RCA Corporation 1982. All rights reserved, except that express permission is hereby granted for the use in computer -based and other information -service systems of titles and abstracts of papers published in RCA Review.

VideoDisc Mastering-An Overview
J. A. van Raalte RCA Laboratories, Princeton, NJ 08540
Abstract-This paper gives a brief overview of the design of cutterheads and the mastering process used for making CED VideoDiscs. In the RCA VideoDisc system, signals are recorded in a copper substrate using a piezoelectrically driven cutterhead. A small diamond tool cuts the FM signals at one-half real-time rate with a bandwidth of about 5 MHz. The recorded spiral groove, which has a pitch of about 2.6 µm and is 13 miles long, contains signal elements of submicron dimensions. Nickel replicas made from this substrate serve as stampers to press the vinyl CED VideoDiscs.
The 5 MHz bandwidth requires that the cutterhead components be made as small as possible. Even though the diamond tools weigh only a few micrograms, the 875 A peak -to -peak video signal, corresponding to an acceleration of several million g's, produces inertial forces on the diamond that exceed the copper machining forces and that stress some cutterhead interfaces to several thousand psi. The piezoelectric material is chosen to produce maximum sensitivity (A/volt) with minimum power dissi- pation. The electrical and mechanical power dissipations are both important design considerations, particularly since they increase superlinearly above the main resonance of the cutterhead. Ac- cordingly the cutterhead dimensions are chosen to place this resonance at or above the highest video frequencies. Special attention must also be paid to the heat dissipation from the cutterhead; the primary source of heat loss is via the diamond to the copper substrate.
Several of the subsequent papers in this special issue of RCA Review devoted to the VideoDisc system discuss aspects of cut- terhead design and mastering in greater detail.
RCA Review Vol. 43 March 1982 5

Introduction
That standard audio -disc pressing techniques could replicate features of a few hundred angstrom dimensions into vinyl discs was known more than three decades ago. It followed therefore that a single disc could, in principle, store the vast amount of information necessary for video playback purposes if the technologies for recording the infor- mation and retrieving it from the disc surface could be developed. The introduction of the CED (Capacitance Electronic Disc) VideoDisc system in March of 1981 was the culmination of a fifteen year effort at RCA to develop these two crucial technologies.
The information capacity demanded for a VideoDisc follows directly from the bandwidth requirements, the signal-to-noise performance, and the somewhat arbitrary choice of playing time. A typical audio disc provides a bandwidth of about 30 kHz, a 65 dB S/N, and a playing time of 25 minutes per side. By comparison the CED system, requiring effectively 3 MHz response, a 46 dB S/N, and one hour per side playing time, represents about a 175 -fold increase in information content (Fig. 1). Thus the CED discs contain some 1.7 x 10" bits of information per side in a three -inch -wide band on a twelve -inch diameter disc; this corresponds to a bit size of about 0.3 µm- covering an area of about 550 cm' of the disc where information is recorded. A requirement of the
AUDIO I 83X
VIDEO 10,000X
Fig. 1-Comparison of audio record and VideoDisc grooves. Top: audio groove at 83 x magnification; bottom: VideoDisc groove at 10,000 x magnification.
6 RCA Review Vol. 43 March 1982

VIDEODISC MASTERING
mastering process is to record this information in a copper substrate with a high degree of precision, control, and uniformity, so that a large number of high quality discs can then be pressed from replicated nickel stampers.
Recording Techniques
The invention of a capacitive stylus playback system' in the early 1960's promised a technique for retrieving serial information from a grooved disc using a simple, metallized stylus; the thickness of the metal (of the order of 0.25 µm) determined the shortest wavelength that could be read out which, incidentally, was well suited for a video playback system. A major problem remained, namely the recording of the submicron information into a suitable substrate.
Audio masters are commonly recorded electromechanically using a diamond stylus to cut the signal in a smooth lacquer master. By making the cutting stylus sufficiently small and having the required tip geometry, the same technology could be used to record a video signal provided its bandwidth was suitably reduced, i.e., provided the recording was slowed down from "real time". Indeed the early experi- ments used modified audio recording apparatus, slowed down by a factor of 200:1, to demonstrate the overall VideoDisc concept.
It soon became clear that the recording time could not remain so much larger than the playback time in high volume production. It seemed more practical to achieve the small -signal dimensions using a modified scanning electron microscope to record the signaLs in an electron -beam -sensitive resist covering a previously -grooved substrate. Thus the preferred recording system used by RCA in the early 1970's was an EBDR2 (Electron Beam Disc Recorder). Initially, signals were still slowed down by 200:1, but through steady improvements in electron -beam resist formulations, electron guns, and electron optics designs in the EBDR, real-time recording was eventually demon- strated.'
During the same years that this electron -beam recording technology was being developed, efforts were also underway to use optical record- ing techniques in photoresist and to further improve the electrome- chanical (EM) recording technology.' By the late 1970's, RCA had developed all three technologies to the point where high -quality re- cordings had been made. The discs produced by each type of recording were, however, different in fine details, such as groove shape, predom- inant distortions, and types of defects. When the decision was made to market the CED VideoDisc system, these subtle differences meant that a specific recording technology had to be chosen. Largely because of the perfection of the recording and the lower defect levels as well as its relative simplicity, the absence of vacuum processing, and the lack
RCA Review Vol. 43 March 1982 7

of "wet" resist processing (with its inevitable problems of cleanliness and reproducibility), electromechanical recording was chosen as the preferred system. Since then thousands of EM recordings have been made confirming the wisdom of this choice.
Design of EM Cutterhead
Audio recordings are normally made by electromechanically cutting signals into lacquer substrates; the cutterhead is driven magnetically in order to achieve the required linearity and signal amplitudes. VideoDisc signals are much shallower but also much shorter in wave- length. Consequently, achieving the forces required to accelerate the cutting stylus is a more difficult problem in VideoDisc mastering. As will be discussed in more detail later, even with the half-time recording process used presently, the standard 875 .4 peak -to -peak signal ampli- tude requires accelerations of several million g's (g = acceleration of earth gravity) to carve the signals out of the substrates. The inertial forces on the cutting stylus, in fact, greatly exceed the forces required to machine the copper substrates presently used:'
It was primarily the hope of bringing the advantages of electrome- chanical recording to VideoDisc Mastering that led J. B. Halter to develop a family of piezoelectric cutterhea<ls in the early 1970's, steadily increasing the frequency limitations from 200:1 below real time to real time in a few years.' A great deal of additional effort has been expanded since then to develop a reliable cutterhead fabrication technology suitable for making production masters.
The requirements for an electromechanical cutterhead follow largely from the specification of the CED encoding system (Fig. 2). The 3-
A MP
STEREO AUDIO SIGNALS
AUDIO FREQUENCY MODULATORS
I
I/II -f- ill II 1
III III I I
I ___!__ I I Ili_ 20 dB +
Ai O .716 I
905
2
VIDEO FREQUENCY MODULATOR
VIDEO SIGNAL
6.3 9.3 FREQUENCY (MHz
Fig. 2-Spectrum of CED system.
8 RCA Review Vol. 43 March 1982
VIDEODISC MASTERING
MODULATION ELECTRODE
CUTTERHEAD DIAMOND
PZT ELECTRODE
MODULATION ELECTRODE
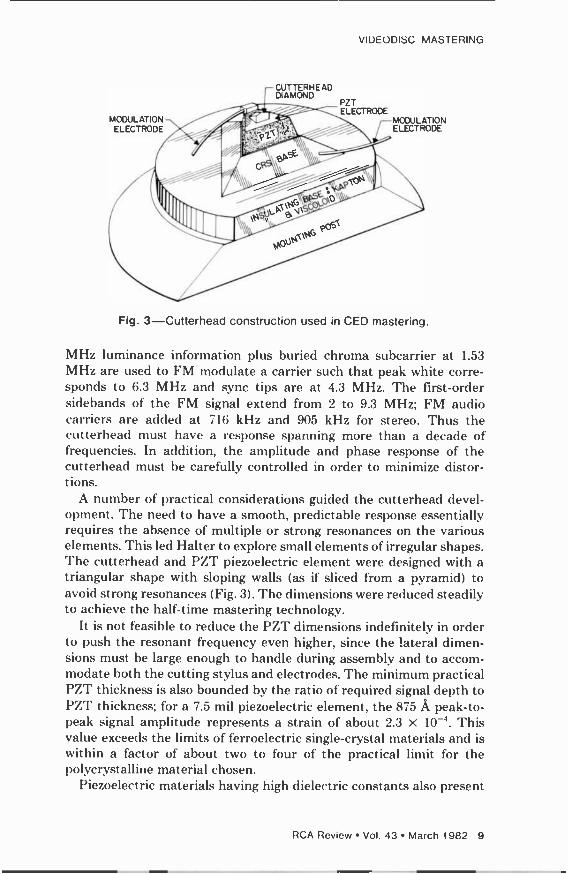
Fig. 3-Cutterhead construction used in CED mastering.
MHz luminance information plus buried chroma subcarrier at 1.53 MHz are used to FM modulate a carrier such that peak white corre- sponds to 6.3 MHz and sync tips are at 4.3 MHz. The first -order sidebands of the FM signal extend from 2 to 9.3 MHz; FM audio carriers are added at 716 kHz and 905 kHz for stereo. Thus the cutterhead must have a response spanning more than a decade of frequencies. In addition, the amplitude and phase response of the cutterhead must he carefully controlled in order to minimize distor- tions.
A number of practical considerations guided the cutterhead devel- opment. The need to have a smooth, predictable response essentially requires the absence of multiple or strong resonances on the various elements. This led Halter to explore small elements of irregular shapes. The cutterhead and PZT piezoelectric element were designed with a triangular shape with sloping walls (as if sliced from a pyramid) to avoid strong resonances (Fig. 3). The dimensions were reduced steadily to achieve the half-time mastering technology.
It is not feasible to reduce the PZT dimensions indefinitely in order to push the resonant frequency even higher; since the lateral dimen- sions must be large enough to handle during assembly and to accom- modate both the cutting stylus and electrodes. The minimum practical PZT thickness is also bounded by the ratio of required signal depth to PZT thickness; for a 7.5 mil piezoelectric element, the 875 A peak -to - peak signal amplitude represents a strain of about 2.3 x 10`'. This value exceeds the limits of ferroelectric single -crystal materials and is within a factor of about two to four of the practical limit for the polycrystalline material chosen.
Piezoelectric materials having high dielectric constants also present
RCA Review Vol. 43 March 1982 9
an appreciable stray capacitance to the drive amplifier, thus requiring significant amounts of reactive power. This consideration further limits the minimum thickness and maximum lateral dimensions of the PZT element. In a typical design, the stray capacitance is of the order of 7.3 pF, corresponding to an impedance of about 4.35 k52 at 5 MHz.
The sensitivity of piezoelectric elements depends on the material chosen. Even with a high sensitivity material (1.5-3.0 A/volt), high voltages and large electric fields (14-20 kV/cm) are still required. At these field strengths, it is important to control the material, in partic- ular its density, uniformity, and the condition of its surfaces and electrodes. The PZT material is first densified at high pressure and high temperature to reduce the number and size of voids in the material. Following this, a slicing and polishing operation is used to produce PZT wafers of controlled thickness and surface properties. These wafers are electroded, poled, and diced into precisely dimen- sioned cutterhead elements. Various electromechanical properties of the PZT are checked to ascertain that resonant frequency, electrical properties, and mechanical losses are within specs.
At this point the PZT elements are bonded to a slightly larger, similarly shaped triangular base. This base is sufficiently massive to provide an inertial platform for the cutterhead at video frequencies. Its effect on the resonant properties of the PZT are slight.
The PZT-base sandwich is then attached to the post that eventually supports and aligns the cutterhead in the recording lathe. Since it is desirable to electrically ground the copper substrate being mastered, the closest surface of the PZT is also electrically grounded to avoid accidental shorting by the copper chip being cut; this makes the other surface and the steel base electrically "hot". For this reason an electrically insulating wafer is inserted between the base and mounting post. The properties and dimensions of this insulating layer are opti- mized further to minimize low -frequency coupling between the turn- table and the cutterhead assembly, thereby providing electrical as well as mechanical isolation.
To smooth out the response of the cutterhead, a layer of viscoloid or other acoustically absorbing material is applied to the cutterhead assembly. The response of this assembly can be measured by a variety of techniques, for instance, a capacitive proximity sensor, a bridge circuit which relates mechanical movement to current,' or a specially designed interferometer described in more detail later.'
The final assembly steps consist of bonding the diamond cutting stylus to the outer surface of the PZT transducer and adding some more acoustic .damping material. This mounting operation is crucial and delicate, since the diamond is exceedingly small and its alignment and orientation must be controlled very carefully in order to cut a
10 RCA Review Vol. 43 March 1982

VIDEODISC MASTERING
symmetric V-shaped groove in the substrate and to obtain the desired rake angle for the recording process. The typical response of such a completed cutterhead, as shown in Fig. 4, has a major resonance near 4.2 MHz (8.4 MHz real time) which is later equalized electronically.
It is fairly obvious that the diamond must he as small as possible. If one could tolerate a diamond as large as 10-20 mils in height its acoustic properties would become important, that is, the diamond would introduce its own resonances and modify the cutterhead re- sponse as a function of frequency. However, much smaller diamonds (only a few mils on the side) are necessary to minimize the forces acting on the PZT to drive the mass of the stylus. To cut an 875 A
peak -to -peak signal at 7 -MHz real time, the diamond would have to experience a maximum acceleration of
a = Aowz - 875 x 10-10 m x(7)' x 101" x (2^)'''
2 x 9.81 m/sec-
= 8.6 x l oe g's
where Ao is the signal amplitude and w is the frequency of recording. Even for half-time recording, the cutting stylus experiences a maxi-
mum acceleration of about 2 x 10" g's. The cutting diamond must he tall enough to allow the copper chip
cut from the substrate to curl away from its cutting face without
W O 7 I- J
20
-lo 4
20 W
O W 20- O 40- W 60- 0 60-
< 140- d
160- 160
o 2 3 4 5 6 MHz
Fig. 4-Typical cutterhead response measured with interferometer.
RCA Review Vol. 43 March 1982 11

contacting the PZT element; this sets a minimum size limit for the diamond of about 4 mils. The mass of such a diamond stylus is about 3.5 microgiams. For a base area of about 2.3 x 10-' cm2 = 36 mil2, the highest forces and pressure at the diamond-PZT interface are
Fax = ma z 7.4 x 10" dynes (7.4 grams force)
Fmax Prax = - 3.2 x 101 dynes/cm- = 460 psi
Area
These forces are quite large, and in fact not much below the tensile strength limit typically quoted for the piezoelectric material (3000- 12000 psi). At real time the tensile strain would quadruple. Additionally the PZT electrode and the diamond bond to the PZT element must withstand these forces. Although real-time recordings at reduced signal amplitudes had been made, these considerations led to the conclusion that half-time recordings would be more reliable and consistent in production.
Thermal Considerations
The power dissipated in the cutterhead is of great importance for several reasons. Large temperature variations in the cutterhead can weaken it structurally and cause one of the bonds to fail. Moreover even a moderate temperature rise of 20°C or more is of concern, since it produces changes in the cutterhead properties, in particular the dielectric constants of the PZT driver. These changes produce errors in the amplitude and phase response of the recorder, since the equalizer is no longer precisely adjusted. Also the loss tangent tends to increase with temperature, i.e., the power dissipation increases and under certain conditions (e.g. when high -frequency, high -amplitude signals are applied to the cutterhead) a thermal runaway condition can actually occur.
Given the requirement for 875 A peak -to -peak signal amplitude in a half-time recorder, the piezoelectric driver material should be chosen for minimum power dissipation. The sensitivity (A/volt) is not a first - order function of the thickness of the PZT element, since the same voltage produces a higher field strength but essentially equal elonga- tion in a thinner wafer. The capacitance, resonant frequency, mechan- ical dissipation, and reactive power, however, all increase as the wafer thickness decreases. Thus the most desirable characteristics in a piezoelectric material are high sensitivity, low mechanical dissipation, and low loss tangent.
During the recording process there are two major sources of heat: (1) the electric and mechanical power dissipation in the PZT element and (2) the mechanical work expended by the diamond in cutting the
12 RCA Review Vol. 43 March 1982

VIDEODISC MASTERING
copper substrate. As shown in related papers," the heating caused by the diamond cutting the copper substrate is negligible compared to the PZT power dissipation. In fact, the intimate contact between the diamond and the copper substrate represents the principal heat loss, or cooling, of the cutterhead. It is therefore possible to apply high - frequency, high -amplitude signals to a cutterhead recording in copper that would cause thermal failure in air.
A more detailed analysis of heat conduction in cutterheads9 shows that cooling through the diamond and copper substrate is mainly limited by the poor thermal conductivity of the PZT itself, diamond being among the best heat conductors. Heat losses to the mounting post through the steel base are significantly smaller due to the higher thermal impedance of the insulating, low -frequency absorbing layer. Were it not for the other requirements of this layer discussed earlier, appreciably more heat could be removed from the cutterhead through the base.
In addition to the choices of design and materials, the resonant frequency of the cutterhead has a first -order influence on the power dissipated. The power dissipated by a constant amplitude sine -wave of frequency w varies as a super -linear function of w since both the mechanical and electrical dissipations increase faster than w. Near the cutterhead resonance, however, the voltage required to produce a full amplitude signal is reduced by the Q of the resonance; consequently the reactive power and electrical power dissipation are quite small near the resonance, but the mechanical dissipation continues to in- crease with frequency. The net effect is that the heat generated in the cutterhead is reasonably small up to the resonance frequency but increases almost exponentially above the resonance where both types of dissipation contribute significantly. It is therefore beneficial to choose the dimensions of the cutterhead elements to cause the reso- nance to fall fairly close to the upper frequency of the video band. From this point of view, the 7.5 mil cutterheads respresent a near - optimum choice.'"
Equalization
The purpose of equalization is to record the encoded FM signal with constant amplitude and linear phase. Fig. 5 is a block diagram of the arrangement used to equalize the cutterhead response as well as the cutterhead equivalent circuit. The equalizing circuit itself has a fre- quency response that is the inverse of the cutterhead response so as to produce a flat overall response for the system.
The cutterhead consists of a stray capacitance Cs in parallel with a series RLC circuit representing the electromechanical conversion in
RCA Review Vol. 43 March 1982 13

o --
EQUALIZER
i Freq
POWER AMPLIFIER
cs
GIs L_CUTTERHEAD EQUIVALENT CIRCUIT
TCM
Fig. 5-Arrangement used for cutterhead equalization.
the PZ'I'. The current Ir is proportional to the cutter velocity; its integral, that is charge, is therefore proportional tc the cutter displace- ment, the quantity we wish to equalize over the range of video frequencies. This signal is monitored across capacitor Cm. The unde- sirable shunt current (I,) is cancelled by the out -of -phase current (IT) injected by proper adjustment of CT.
A number of techniques are used to obtain the desired smooth response, each differing slightly in the final adjustment. For instance, the cutterhead current can be monitored across the capacitor C,, to indicate stylus motion." Thus the response can be equalized by sweep- ing the band of frequencies of interest and by monitoring the bridge current. This technique has the advantage that it can, be made initially on the bench, often at low amplitude (-6 dB), and can subsequently be checked and finally adjusted while cutting copper at full amplitude. Its disadvantage is that the current -induced motions of the PZT surface are not generally the simple one-dimensional vibrations in which one is interested: several more complex vibrational or shear modes can exist that impart to the diamond other than pure z -motion (direction normal to the copper substrate surface).
A very sophisticated technique has been developed' using a sensitive interferometer to measure the motion of the diamond surfaces at very low amplitudes. By measuring the three major surfaces of the cutting stylus, its motion in three dimensions can be measured (Fig. 6). It is then possible to adjust the equalizing circuitry specifically to smooth out the z -response of the cutterhead. The x- and y -motions (x = in the direction of the groove, y = in the radial direction) are significantly smaller, though more irregular as well. The y -motion of the stylus is not considered bothersome; the x -motion, if appreciable, can lead to
14 RCA Review Vol. 43 March 1982
VIDEODISC MASTERING
m cr 4
30
20-
-40 O I 2
n 3 4 5 6 MHz
EXCITATION FREQUENCY ( CONsTANT AMPLITUDE)
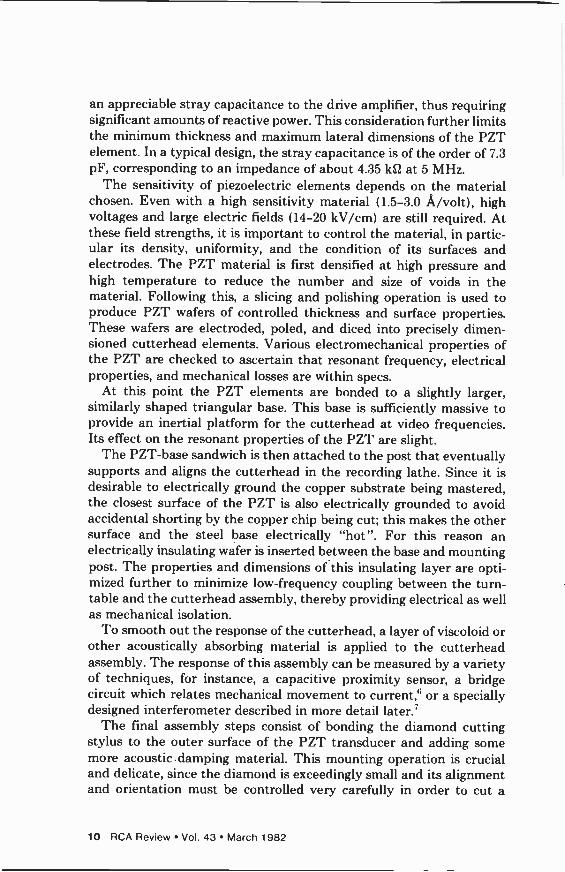
Fig. 6-X, Y, and Z response of cutterhead diamond; measured with interfer- ometer.
phase or harmonic distortions in the recorded signal. Ideally the x and y responses of the cutterhead are at least 20 dB below the z -response.
The advantage of interferometric characterization of the cutterhead response is that it permits the equalization of the z -amplitude specifi- cally to obtain constant signal depth. The measurements are made at low amplitude, however, since the interferometer response itself is highly nonlinear at large amplitudes (equal to a significant fraction of a quarter wavelength of light). The interferometric characterization of a cutterhead therefore neglects the nonlinearities of the stylus motion at high amplitudes (875 24.) as well as any loading of the cutterhead while cutting copper.
The most practical way of equalizing the cutterhead response after initial adjustments is to make a test recording in a copper substrate at full amplitude. The test signal is then monitored for amplitude, differ- ential phase, and gain using a laser reader developed for such purposes some time ago.'Z The response of the laser reader itself is also frequency dependent. Its response is shaped like a haystack; low frequencies are rolled off due to differentiation in the detector while high frequencies roll off very sharply when the signal elements are equal to, or shorter than, the diffraction -limited laser spot size. It is possible, however, to measure and equalize the laser reader response using an "aperture disc", i.e., a substrate having a signal recorded in it of known, constant
RCA Review Vol. 43 March 1982 15
amplitude. This aperture disc is cut with a single cutterhead operating at constant frequency and voltage while the recording turntable varies its rotational speed to change the recorded wavelength gradually. The assumption that t his aperture disc has constant amplitude seems justified since the cutting forces acting on the cutterhead are not, to first order, velocity dependent. This technique using a calibrated laser reader is routinely used for equalizing cutterheads prior to mastering.
Cutting Process
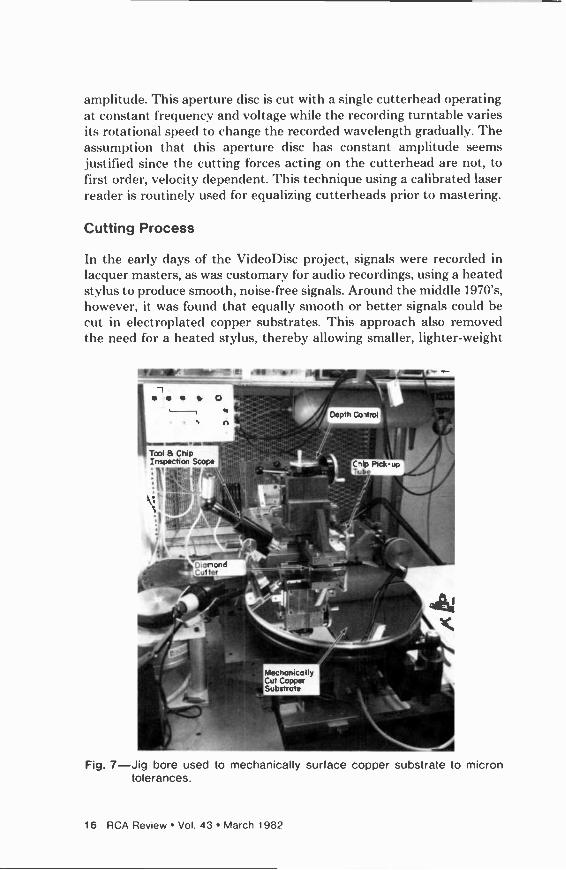
In the early days of the VideoDisc project, signals were recorded in lacquer masters, as was customary for audio ecordings, using a heated stylus to produce smooth, noise -free signals. Around the middle 1970's, however, it was found that equally smooth or better signals could he
cut in electroplated copper substrates. This approach also removed the need for a heated stylus, thereby allowing smaller, lighter -weight
XI r /, ̀,,, . , 1
.r °:r
Tool Chip ^i !1 ' Inspection Sc
M . Depth Co itrol
"Dionond Cutter ,.1
ro
Mechanically Cut Copper Substrate
tl
1
Fig. 7-Jig bore used to mechanically surface copper substrate to micron tolerances.
16 RCA Review Vol. 43 March 1982

VIDEODISC MASTERING
cutterhead designs that could be operated at higher frequencies. Since
then CEI) mastering has used copper substrates exclusively. It should not he surprising that the copper substrate used in CFI)
mastering has to meet stringent specifications of purity, uniformity of properties, and extremely low levels of defects; after all a 13 -mile -long
spiral track with sub -micron signal elements must be mechanically cut
in this surface. The substrate consists of an aluminum blank, about 14 inches in
diameter and about 92 inches thick, that is mechanically faced off to a
high degree of flatness and parallelism. Onto one side of this aluminum blank, a layer of fine-grained or amorphous copper is plated with precise control of its metallurgical properties. "Then this sul st rate is
again faced off mechanically to re-establish smooth, parallel surfaces.
Finally the copper surface is turned down on a highly precise jig -bore
lathe (Fig. 7) which produces a mirror like surface whose contour is
controlled to about one micrometer precision. This surface is t hen
critically inspected for defects and monitored for hardness before it is
used in mastering. The mastering lathe (Fig. 8) uses a carefully balanced precision
turntable to spin the substrate at half -speed; a massive air suspension
table provides the required isolation from building vibrations. The cutterhead is mounted in an assembly that uses an air -puck to float at
Substrate Level Sensor
r `!ami Groove Inspection
amera
!Groove Inspection Mic oscope "Chin)
r Vacuum Line
Cutter Suspension
Recorded tSubstrate 1111
Yf
Drive Electronics
Fig. 8-Recording lathe used for CED mastering.
Tool S Chip Inst coon Comro
l
T anslation Side
RCA Review Vol. 43 March 1982 17

a fixed distance over the substrate surface. The cutterhead and dia- mond stylus can then be lowered relative to the air -puck in order to precisely maintain the cutting depth at about 2 micrometers.
During the recording operation, the V-shaped cutting stylus is buried two micrometers under the surface of the substrate (Fig. 9). Since the pitch of the recorded spiral is accurately controlled, the recorded grooves are extremely uniform in width, depth, and symmetry, despite possible substrate flatness variations of the order of one micrometer. The residual cutting depth variations are unimportant since the forces on the cutting stylus do not vary appreciably with depth and, in any case, tend to be small compared to the inertial forces required to accelerate the diamond.
During the mastering operation, a thin sliver, or "chip", of copper is continuously cut. Since this chip could damage the recorded grooves if it came in contact with the substrate surface, it is important to remove the chip from the cutterhead area; this is done by means of a small vacuum suction device. As the chip is cut it curls up along the front face of the diamond into the suction tube. As mentioned previ- ously, the clearance required to pull the chip out of the way of the PZT element sets one of the practical lower limits on the height of the cutting diamond.
During mastering this chip cut from the substrate is virtually con -
i AXIS
DEPTH OF CUTTER
DEPTH OF CUT
GROOVE WIDTH CENTER
LNCUT SURFACE
DISC MOTION
Fig. 9-Diagram showing cutterhead stylus while recording signals in copper substrate.
18 RCA Review Vol. 43 March 1982

VIDEODISC MASTERING
5MHz
iJ"rirfi,tli%lj/Il4 Yt
1
t ; mm1
SO -235A 0N WK1262 11i20i80 ERC
30Kt1 X1040 10U 01_6 _-_ R'CA
Fig. 10-Scanning electron micrograph of copper chip produced during mastering of 5 MHz signal (calibration mark shows 10µm).
tinuous for the full length of the spiral. It also contains signals from
the current and preceding grooves as shown in an SEM photograph of a sampled chip (Fig. 10); the texture and dimensions of the signal elements on the chip provide important information about the metal- lurgical properties of the substrate and the quality of the recording."
When the full-length recording has been made, a number of test signals are recorded at the outside diameter of the substrate; these are used to verify that the cutterhead characteristics and sensit:vity are unchanged. The complete program is also monitored on a laser reader' to monitor the quality of the recording. The substrate is then ready for fan -out; that is, a family of nickel replicas is made to produce a
large number of nickel stampers that are then used in disc production.
Acknowledgements
In writing this overview of VideoUisc mastering, I have had the privilege of summarizing the work of the many key contributors who
created the knowledge and developed the technologies discussed here. In addition to the pioneering work by J. Halter, I would like to
acknowledge many years of technical direction by E. O. Keizer; con-
tributions by members of the mastering team at our product division in Indianapolis, notably G. John, J. Seward, and H. Wharton; and
RCA Review Vol. 43 March 1982 19

most importantly the work by members of the mastering group in Princeton whose efforts are discussed in more detail in some of the subsequent articles in this issue of RCA Review. 'Though not discussed specifically here, the efforts by P. Valembois, E. Holub, and C. Morris in providing and preparing copper recording substrates to consistent and demanding specifications are of course crucial to the success of our mastering efforts. Finally I would like to acknowledge particularly the support, critical reading, and many invaluable discussions with J. Heisner.
References:
T. O. Stanley, "High -Density Capacitive Information Records and Playback Apparatus Therefor," U.S. Patent No. 3,783,196 (Jan. 1, 1974). 2 E. O. Keizer, "VideoDisc Mastering," RCA Review, 39, p. 60 (1978). 3 J. H. Reisner, G. H. N. Riddle, S. M. Zollers, L. H. Lin, E. D. Simshauser, W. P. Morewood, R. R. Demers, J. Guarracini, "Electron Beam Recording of Masters for the VideoDisc," Proc. Eighth International Cont. Electron and Ion Beam Science and Technol., R. Bakish Editor, 78-5, p. 500 (1978), Electrochem. Soc. Inc., Princeton, N.J. " J. Guarracini, J. H. Reisner, J. L. Walentine, and C. A. Whybark, "Micromachining VideoDisc Grooves and Signals," RCA Review, 43, p. 66, March 1982 (this issue). 5 J. B. Halter, "Triangular Piezoelectric Transducer for Recording Video Information," U.S. Patent No. 3,865,997 (1975), Reissued RE 29,113 (1977); "Apparatus for Electromechanical Recording of Short Wavelength Modulation in a Metal Master," U.S. Patent No. 4,035,590 (1977); "Method and Apparatus for Electromechanical Recording of Short Wavelength Modulation in a Metal Master," U.S. Patent No. 4,044,379 (1977); "Wideband Electromechanical Recording System," U.S. Patent No. 4,060,831 (1977). 6 G. A. Alphonse, "A Method for the Characterization of Piezoelectric VideoDisc Recording Heads Using a Bridge Circuit," RCA Review, 43, p. 84, March 1982 (this issue).
K. F. Etzold, "A Quadrature Michelson Interferometer System for Probing Surface Vibrations: Application to VideoDisc Cutters," RCA Review, 43, p. 95, March 1982 (this issue). " G. A. Alphonse, "Power Dissipation in Piezoelectric Cutterheads," RCA Review, 43, p. 35, March 1982 (this issue). ' R. Shahbender, "Thermal Analysis of VideoDisc Cutter," RCA Review, 43, p. 44, March 1982 (this issue).
1O J. H. Reisner, J. Valachovic, R. E. Simms, and H. I. Moss, 'Principles for the Design of Cutters for VideoDisc Recording," RCA Review, 43, p. 21, March 1982 (this issue). "R. Truesdell, "Testing Methods for the Characterization of Cutterhead performance in Mastering Video Discs," RCA Review, 43, p. 1 1 7, March 1982 (this issue). '2M. Lurie, W. Barnette, I. Gorog, R. Jebens, and A. Witchey, "High Performance Optical Reader for VideoDisc Master Recordings," RCA Review, 43, p. 129, March 1982 (this issue); see also I. Gorog, "Optical Techniques Developed for the RCA VideoDisc," RCA Review, 39, p. 162 (1978).
20 RCA Review Vol. 43 March 1982
Principles for the Design of Cutters for VideoDisc Recording
J. H. Reisner, J. Valachoviic, R. E. Simms, and H. I. Mcss RCA Laboratories, Princeton, NJ 08540
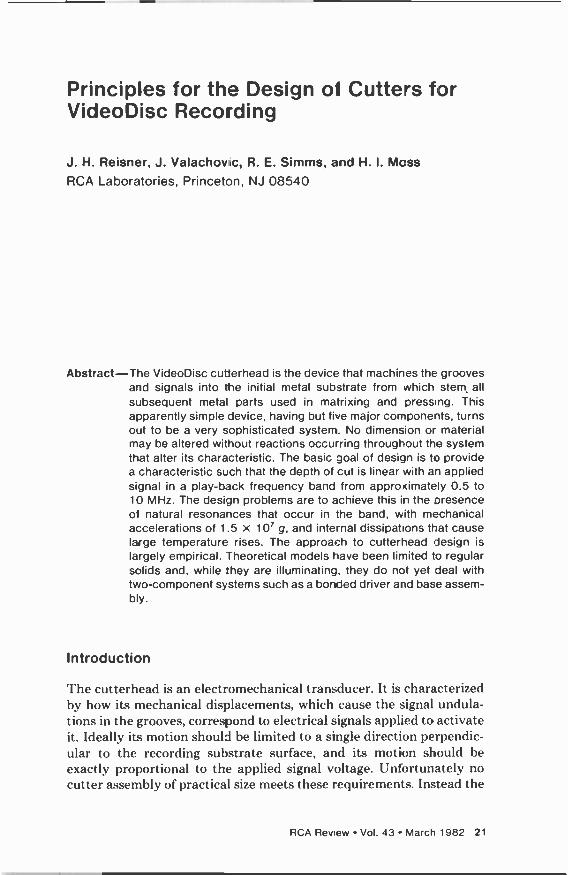
Abstract-The VideoDisc cutterhead is the device that machines the grooves and signals into the initial metal substrate from which stem, all subsequent metal parts used in matrixing and pressing. This apparently simple device, having but five major components, turns out to be a very sophisticated system. No dimension or material may be altered without reactions occurring throughout the system that alter its characteristic. The basic goal of design is to provide a characteristic such that the depth of cut is linear with an applied signal in a play -back frequency band from approximately 0.5 to 10 MHz. The design problems are to achieve this in the presence of natural resonances that occur in the band, with mechanical accelerations of 1 .5 x 10' g, and internal dissipations that cause large temperature rises. The approach to cutterhead design is largely empirical. Theoretical models have been limited to regular solids and, while they are illuminatinc, they do not yet deal with two -component systems such as a bonded driver and base assem- bly.
Introduction
The cut terhead is an electromechanical transducer. It is characterized by how its mechanical displacements, which cause the signal undula- tions in the grooves, correspond to electrical signals applied to activate it. Ideally its motion should be limited to a single direction perpendic- ular to the recording substrate surface, and its motion should be exactly proportional to the applied signal voltage. Unfortunately no cutter assembly of practical size meets these requirements. Instead the
RCA Review Vol. 43 March 1982 21

assembly has a spectrum of resonances that cause spurious mechanical responses to the electrical driving signals applied to the transducer. The sensitivity of the cutter in the direction of motion for cutting signals frequency varies 20 dB between 1 MHz and the major longi- tudinal resonance of the cutter. The frequency response of a typical cutterhead is shown by curve Z, Fig. 2. Above the major resonance (the highest peak), the response is irregular and largely unpredictable because of the large number of parameters affecting the vibrational spectrum.
Unfortunately, the resonances of the assembly involve more than a simple longitudinal motion in one dimension. There are shear and flexural modes as well as longitudinal modes and combinations of modes and harmonics that depend upon the geometry and materials of the parts and of the assembly. The presence of these several modes causes the tip of the cutting blade to move in three dimensional space. Fig. 1 shows the convention used to designate cutter motions. In addition to the up and down Z motion, which cuts the signals in the grooves, the X motions are chosen to be tangent to the record grooves and Y motions are radial. Thus the apex of the cutter is the origin of this rectangular coordinate system. X motions have the effect of changing the phase of the signals being cut in the Z direction. Y motions, being perpendicular to the Z and X directions, do not appre- ciably affect the contour of the signal being recorded, although they may influence the relative depth of the signals recorded on the two walls of the V groove, the net affect does not influence playback.
DIRECTION OF CUTTER MOTION IN CUTTING SIGNALS
FACE OF CUTTER IN Z Y PLANE
+Y %' RADIAL DIRECTION IN WHICH CUTTER MOVES TO MAKE SPIRAL
+ Z AXIS
-z
AXIS AND DIRECTION OF ROTATION
MASTER SUBSTRATE
+X DIRECTION TANGENT TO GROOVES AT CUTTER APEX
Fig. 1-Coordinates and conventions relating cutter and turntable dimensions and motions.
22 RCA Review Vol. 43 March 1982
DESIGN OF CUTTERS FOR VIDEODISC RECORDING
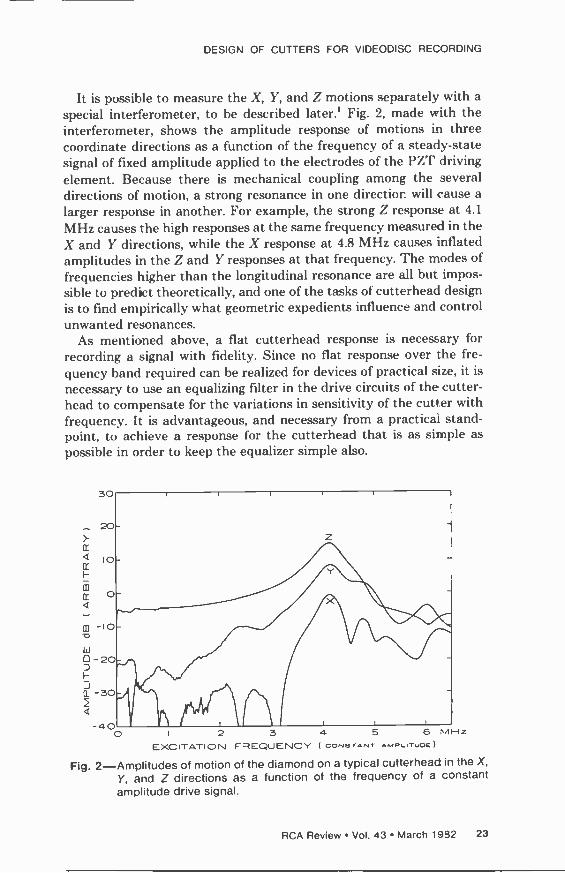
It is possible to measure the X, Y, and Z motions separately with a
special interferometer, to be described later.' Fig. 2, made with the interferometer, shows the amplitude response of motions in three coordinate directions as a function of the frequency of a steady-state signal of fixed amplitude applied to the electrodes of the PZT driving element. Because there is mechanical coupling among the several directions of motion, a strong resonance in one direction_ will cause a
larger response in another. For example, the strong Z response at 4.1
MHz causes the high responses at the same frequency measured in the X and Y directions, while the X response at 4.8 MHz causes inflated amplitudes in the Z and Y responses at that frequency. The modes of frequencies higher than the longitudinal resonance are all but impos-
sible to predict theoretically, and one of the tasks of cutterhead design is to find empirically what geometric expedients influence and control unwanted resonances.
As mentioned above, a flat cutterhead response is necessary for recording a signal with fidelity. Since no flat response over the fre-
quency hand required can be realized for devices of practical size, it is
necessary to use an equalizing filter in the drive circuits of the cutter - head to compensate for the variations in sensitivity of the cutter with frequency. It is advantageous, and necessary from a practical stand- point, to achieve a response for the cutterhead that is as simple as
possible in order to keep the equalizer simple also.
30
} cr
cr 10-
I - In
cr 4
J 11 -30- Q
-40 O I 2 3 4 5 6 MHz
EXCITATION FREQUENCY ( CONSTANT AM PLrTUOE)
Fig. 2-Amplitudes of motion of the diamond on a typical cutterhead in the X,
Y, and Z directions as a function of the frequency of a constant amplitude drive signal.
RCA Review Vol. 43 March 1952 23
SIGNAL ' ' VOLTAGE
DIAMOND CUTTER X.
DIRECTION OF MOTION OF RECORDING MEDIUM
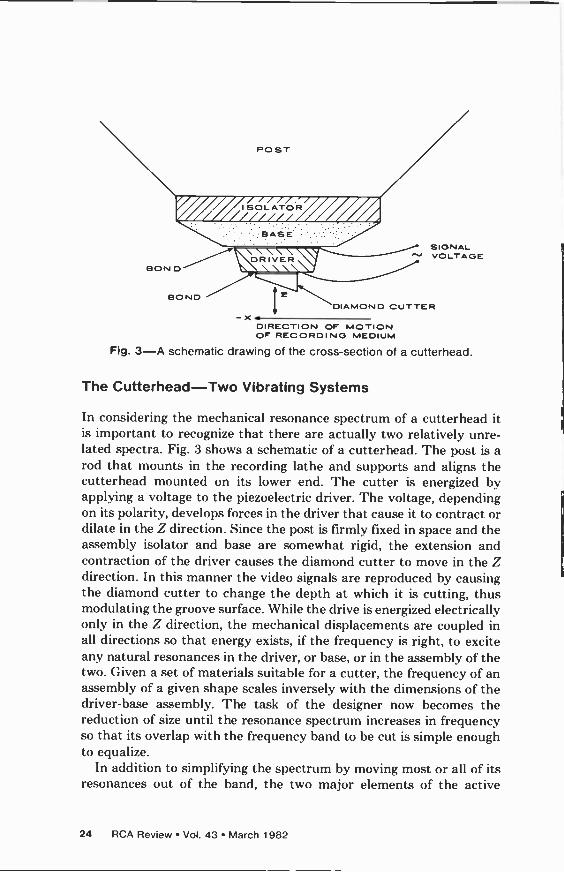
Fig. 3-A schematic drawing of the cross-section of a cutterhead.
The Cutterhead-Two Vibrating Systems
In considering the mechanical resonance spectrum of a cutterhead it is important to recognize that there are actually two relatively unre- lated spectra. Fig. 3 shows a schematic of a cutterhead. The post is a rod that mounts in the recording lathe and supports and aligns the cutterhead mounted on its lower end. The cutter is energized by applying a voltage to the piezoelectric driver. The voltage, depending on its polarity, develops forces in the driver that cause it to contract or dilate in the Z direction. Since the post is firmly fixed in space and the assembly isolator and base are somewhat rigid, the extension and contraction of the driver causes the diamond cutter to move in the Z direction. In this manner the video signals are reproduced by causing the diamond cutter to change the depth at which it is cutting, thus modulating the groove surface. While the drive is energized electrically only in the Z direction, the mechanical displacements are coupled in all directions so that energy exists, if the frequency is right, to excite any natural resonances in the driver, or base, or in the assembly of the two. Given a set of materials suitable for a cutter, the frequency of an assembly of a given shape scales inversely with the dimensions of the driver -base assembly. The task of the designer now becomes the reduction of size until the resonance spectrum increases in frequency so that its overlap with the frequency band to he cut is simple enough to equalize.
In addition to simplifying the spectrum by moving most or all of its resonances out of the hand, the two major elements of the active
24 RCA Review Vol. 43 March 1982

DESIGN OF CUTTERS FOR VIDEODISC RECORDING
assembly, driver and base, must be tuned to one another to prevent such phenomena as doubling of resonances or distortion of the shape of the resonance curves. Establishing a suitable cut terhead response is
largely an empirical procedure, reminiscent of edge grinding a quartz crystal to bring it on frequency.
Thus there is a spectrum associated with the base/driver assembly that is related to the main or longitudinal (thickness) frequency f and can be usefully controlled from about 0.2 f, to 1.3 f,. The cutting diamond is a component of the base/driver/diamond assembly, but is
very small and exercises a negligible influence upon the vibration spectrum of the assembly other than to drop the frequency of the longitudinal resonance slightly.
The second resonance spectrum of the cutterhead involves the base/ driver/diamond assembly acting essentially as a lumped mass, with the isolator acting as a "spring", connecting the assembly to the fixed post. In useful cutterhead units the resonances involve almost exclu- sively longitudinal "Z" motions. Shear modes exist but are about 20 to 30 dB lower in amplitude. The frequency range of these assembly -to - post resonances is generally below 1 MHz, and their amplitudes rarely exceed one tenth of that expected from the higher frequency resonance of the base/driver assembly.
The isolator fulfills the function of preventing acoustical energy from the base/driver assembly from reaching the post, where it could excite a wide spectrum of resonances in the post. Since the point where the post is clamped to the lathe is fixed, all motions from that point to the tip of the cutter-in the post, in the isolator, and in the base/driver assembly-affect additively the position of the diamond cutting edge with respect to the disc being cut on the recording lathe.
The isolator first demonstrated by Halter' utilizes two thin layers of plastic to provide damping and to insulate the base electrically from the post. The insulation is necessary because the metallic base is solder bonded to one electrode of the piezoelectric driver. Thus the base is
electrically "hot", because the other PZT electrode is held at or near ground potential so that it can be shorted to the metal master by the chip without doing damage. The thin insulating layers of plastic are bonded to one another, to the post, and to the base, with a very acoustically lossy material. As a result of this construction of the isolator, a negligibly small amount of the acoustical energy reaches the post and its resonances are not excited.
Just as the driver/base-assembly-related resonances are dealt with by moving the frequencies of that spectrum out of the frequency band to be recorded, so also are the frequencies of the isolator systEnt moved out of the band. However, for the isolator system this is done by
RCA Review Vol. 43 March 1982 25

lowering the frequency spectrum below the end of the recording band where the audio carriers are located. The reduction of frequency is achieved by changing the thickness and mass of the isolator by appropriate use of damping materials. The isolator must never be made so flexible as to permit appreciable deflection of the cutter under the drag of cutting. Such a deflection can cause chatter, which may in turn lead to overstressing the bond causing the loss of the diamond.
An essential factor to be considered in the design of cutterheads is the realization of as much as possible of the motion that is generated by the driver at the diamond cutter edge. Out -of -phase motions excited in the base or isolator can oppose the motion of the driver and reduce the net motion applied to the cutter diamond. The ideal situation is where the interface between the base and the piezoelectric driver does not move with respect to the post so that all the motion of the driver is applied to the diamond. The base is the key to achieving this.' It should be made of a material of high acoustical impedance to minimize excitation of displacements in its thickness and of sufficient mass to put the center of gravity of the base/driver assembly near the interface of the two elements or into the base. At the same time, the lossy low - impedance isolator minimizes reflection of acoustical energy back into the base at the other base interface, while little amplitude is developed in the isolator. Thus, it can be seen, the design of the base involves very sophisticated resonance, impedance, bulk, damping, and bonding problems. The bonds that hold the diamond and the base to the driver must be thin and of low loss and, in the case of the base bond, electrically conductive.
Driver Design Criteria
Designing the piezoelectric driver is also a system -oriented problem. The material must have the highest sensitivity and low dissipation such as exhibited by PZT. The shape of the driver determines the nature of the spectrum of resonances. The scale of the dimensions of a given shape determine the relative magnitude of the frequencies of that spectrum. That is to say, for drivers of a specific shape, the ratio of frequencies of a given mode will be inversely proportional to the ratio of any corresponding dimensions of the drivers. This scaling rule of frequency and dimensions applies to cutter assemblies also, but with the reservation that the bonds and isolators do not scale and thereby cause a small deviation from the rule.
The primary dimension of interest in the driver is the Z dimension, the distance between the two electroded surfaces of the piezoelectric material. This is the direction of the applied electric field, and the
26 RCA Review Vol. 43 March 1982
DESIGN OF CUTTERS FOR VIDEODISC RECORDING
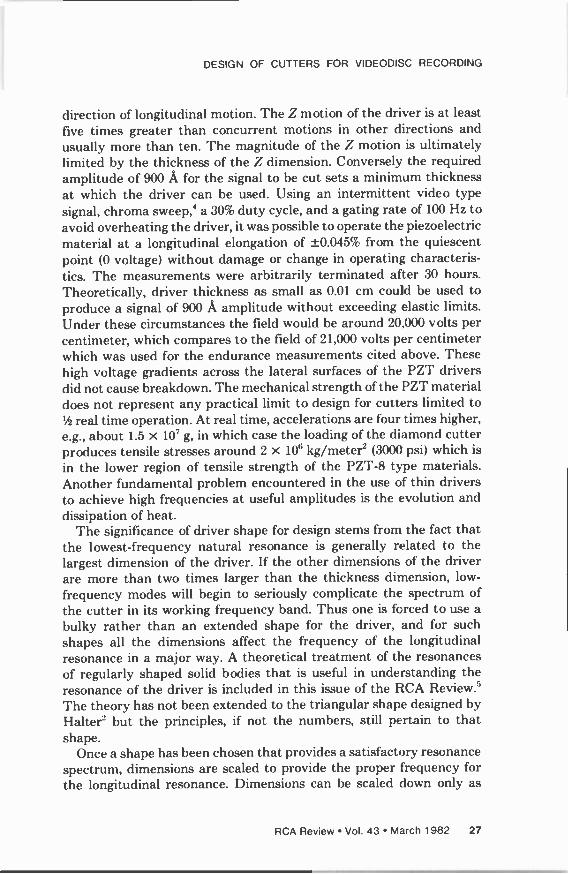
direction of longitudinal motion. The Z motion of the driver is at least five times greater than concurrent motions in other directions and usually more than ten. The magnitude of the Z motion is ultimately limited by the thickness of the Z dimension. Conversely the required amplitude of 9(0 Á for the signal to be cut sets a minimum thickness at which the driver can be used. Using an intermittent video type signal, chroma sweep,' a 30% duty cycle, and a gating rate of 1(X) Hz to avoid overheating the driver, it was possible to operate the piezoelectric material at a longitudinal elongation of ±0.045% from the quiescent point (0 voltage) without damage or change in operating characteris- tics. The measurements were arbitrarily terminated after 30 hours. Theoretically, driver thickness as small as 0.01 cm could be used to produce a signal of 900 A amplitude without exceeding elastic limits. Under these circumstances the field would be around 20,000 volts per centimeter, which compares to the field of 21,000 volts per centimeter which was used for the endurance measurements cited above. These high voltage gradients across the lateral surfaces of the PZT drivers did not cause breakdown. The mechanical strength of the PZT material does not represent any practical limit to design for cutters limited to 1/2 real time operation. At real time, accelerations are four times higher, e.g., about 1.5 x 10' g, in which case the loading of the diamond cutter produces tensile stresses around 2 x 10⁶ kg/meter2 (3000 psi) which is
in the lower region of tensile strength of the PZT-8 type materials. Another fundamental problem encountered in the use of thin drivers to achieve high frequencies at useful amplitudes is the evolution and dissipation of heat.
The significance of driver shape for design stems from the fact that the lowest -frequency natural resonance is generally related to the largest dimension of the driver. If the other dimensions of the driver are more than two times larger than the thickness dimension, low -
frequency modes will begin to seriously complicate the spectrum of the cutter in its working frequency band. Thus one is forced to use a bulky rather than an extended shape for the driver, and for such shapes all the dimensions affect the frequency of the longitudinal resonance in a major way. A theoretical treatment of the resonances of regularly shaped solid bodies that is useful in understanding the resonance of the driver is included in this issue of the RCA Review.5 The theory has not been extended to the triangular shape designed by Halter' but the principles, if not the numbers, still pertain to that shape.
Once a shape has been chosen that provides a satisfactory resonance spectrum, dimensions are scaled to provide the proper frequency for the longitudinal resonance. Dimensions can be scaled down only as
RCA Review Vol. 43 March 1982 27

long as adequate mounting area is provided for the diamond cutter and electrical connection.
Thermodynamic Design Considerations
A major deleterious influence on the life of a cutter assembly is the temperature rise it experiences while a signal is applied to it. In normal recording of program material where an overcut is used, the energy released in cutting is far less, e.g., 10-2 watts, than the energy dissipated in the body of the cutter energized by a typical video signal, e.g., 1.5
x 10-' watts. This release of energy can raise a cutterhead temperature at the base of the diamond enough to weaken its bond and to modify the damping properties of the cutterhead assembly enough to negate some of the equalization achieved at lower signal amplitudes. Shah - bender shows that this signal energy is removed both by conduction through the isolator and by conduction through the diamond into the metal substrate being cut.6
Infrared microscopes are used to measure the thermal properties of cutterheads. They provide good resolution, 25 to 35 pm, without any thermal or physical loading, and accurate and reproducahle measure- ments of small and large temperature rises above ambient. The mea- surements described herein were made with a Barnes RM2A infrared microscope with a 15 x objective and a 2.5 cm working distance. It can make spot measurements of temperature for areas 35 pm in diameter to an accuracy of 0.5°C. Scanning measurements to give a two dimen- sional display of temperature distribution were made on a Barnes RM50 Infrared Microscanner with a 40 x objective that can scan a 1
mm2 area with a 25 µm spot and a temperature resolution of 0.1°C. Routine temperature -rise measurements are made with the RM2A, while studies of temperature profiles are made on the RM50 Scanner and are used to locate hot spots or temperature anomalies indicating constructional problems, such as poor contact of an electrical lead with the PZT electrode. Fig. 4 shows a temperature scan. The approximate position of the PZT and base are indicated. The slight dome at the center of the display shows slight heating, 5°C, in the electrical lead construction. The disadvantage of using the microscope is that it does not very closely represent the operating condition of a cutter in the recording process where heat loss is achieved through the diamond and the substrate, as well as through the base and post. Thus infrared microscope resul is are done in air and give higher than actual operating temperatures by a factor of very approximately two.
For a given amplitude of motion of the cutter, the temperature rise increases with frequency of applied signal. The rise is not smooth,
28 RCA Review Vol. 43 March 1982

+
DESIGN OF CUTTERS FOR VIDEODISC RECORDING
o
+E' imam»
4 1,7 3"c .. 'set '
PZT-8--01
BASE
Fig. 4-The super position of kinescope traces of the temperature profiles resulting from an X, Y scan of a fully energized triangular cutterhead. The horizontal axis of the display is in the Y direction and the positions of the base, FZT-8 driver, and center line are indicated.
reflecting the presence of resonances, the equalization of the drive voltage, and the run -away that occurs above resonance. Fig. 5 shows a typical family of temperature -frequency curves. Fig. 6 displays the same functional relationship but for two cutters with different resonant frequency driven by the same voltages. The temperature/frequency responses of Fig. 5 and 6 reflect the effect of equalizing the cutterhead by reducing the drive voltage in an inverse manner with cutter sensi-
tivity. Fig. 7 shows qualitatively with the solid line the generic form of the temperature rise for a single equalized resonance. The somewhat exponential dashed line postulates what would happen if the cutter had no resonance and constant sensitivity with frequency. While an
equalized resonance produces a decrease in temperature, clue to re-
duced dielectric losses, an unequalized resonance causes an increase over an ideal response due to increased acoustical osses. At times, temperature/frequency curves such as those shown in Fig. 6 have been used to identify resonances that were missed in direct amplitude measurements.
RCA Review Vol. 43 March 1982 29

N W W
99-
U 78- W
71
2 54 W I-
41
I I I I
6 r
O I 2 3 4 5 7 MHZ
Fig. 5-Temperature rise in a typical equalized cutterhead as a function of the frequency of a sine wave at various peak -to -peak drive voltages.
These temperature/frequency displays are not directly useful as performance criteria, since the cutter is not used as a single frequency device. To approximate the distribution of frequencies actually en- countered by a cutter, an easily duplicatable signal, a chroma sweep test signal described by R. Truesdell,' is used. It has the added versatility that the cutter frequency can be scaled from a half -real- time value of 2.65 MHz, to 3.34 MHz, 4.21 MHz and 5.3 MHz (real time). Cutters energized in air at cutting voltages with these test signals display a temperature rise related to that achieved in mastering video signals. If cutter temperature is plotted against driving voltage, one gets curves such as shown in Fig. 8. Between 200 and 500 volts p- p, the slope of the curves is about 2.5. At higher drive voltages, dielectric losses and external clamping losses which increase with temperature cause the slope of the experimental curves to increase until a thermal runaway occurs.
In general, the temperature -rise curves such as Fig. 6 are character- ized by a relatively flat and low area in the frequencies below the cutter resonance and a very large and fast temperature rise for fre- quencies above resonance. Therefore to minimize temperature rise in cutting a video -like frequency distribution, the resonant frequency of
30 RCA Review Vol. 43 March 1982

DESIGN OF CUTTERS FOR VIDEODISC RECORDING
85 - 83-
w (A 73_
W 67-
ll
6 F 1
4 cr W
54 a 2 45- W I-
31
21
2 3
MHZ
DRIVE 400 V p -p
SP 283 SP 294
I I
4 5 6
Fig. 6-Temperature rise as a function of frequency for two equalized cutter - heads with differing major resonance frequencies. Both are driven at 400 V p -p.
the cutter should be made to occur at well above the frequency of the maximum point of the energy distribution curve, so that the video frequencies are in a range of relatively lower temperature rise for the cutter. Referring again to Fig. 6, the temperature curve of SP283 runs away within the range of frequencies cut (shown by the arrow below the abscissa). With the SP294, all frequencies cut are below the runaway zone. The temperature rise in cutting "video -like" signals was
40° for the low -frequency cutter and 24° for the high -frequency cutter. For the distribution of frequencies typical of a video recording at I/z
real time, the cutter resonance should be about 4.3 MHz for minimum temperature rise. Three groups of cutters of identical shape were scaled in size to give resonant frequencies of 3.65, 4.3, and 5.4 MHz. These were all driven with a 400 V p -p chroma sweep signal. The average temperature rises under various combinations of characteris- tics are given in Table 1.
There is an optimum cutterhead resonance frequency at each given
RCA Review Vol. 43 March 1982 31

60
Ñ50 iY
Sr 40 I- 4 tr w
230 w
} 120
H
m
I
fr
0 O I 2 3 4 5 6
FREQUENCY MH2
Fig. 7-Temperature rise as a function of frequency for a hypothetical cutter without resonances, dashed curve, and for the same cutter with a longitudinal resonance at fr.
center frequency of the video signals. If the cutter frequency is below the optimum, the high frequencies recorded will raise the temperature more than at optimum, and if the cutter frequency is too high the heating will be more than optimum at the lower frequencies recorded.
As the distribution of signal frequencies scales up in frequency, the temperature rise becomes larger even for the optimum cutter fre- quency. From Table 1, 4.3 MHz is nearly optimum for the distribution centering at 2.5 MHz while the 5.4 MHz unit is nearly optimum for a
center frequency of :3.2 MHz. Between these two points, the tempera -
Table 1-Average Temperature Rise of Cut terheads at Two Video Center Frequencies (fe)
Resonant Frequency of Cutterbead
Temperature Rise Above Ambient 1°C)
= 2.5 MHz 1= 3.2 MHz
3.65 45° 80° 4.3 21° 50° 5.4 23° 44°
32 RCA Review Vol. 43 March 1982

DESIGN OF CUTTERS FOR VIDEODISC RECORDING
100
90 80
70
O 60
w
O so
w o
w 40
Q w a 2 w 20 H
/ RL 396 fr=S.7
to 200 300 400 500 600
DRIVE VOLTAGE p -p CHROMA SWEEP
SP 331 fr=4.4
Fig. 8-Temperature rise as a function of p -p drive voltage for a chroma sweep signal for cutterheads with different longitudinal resonance frequencies.
ture rise doubles from 21'C to 44°C. As frequencies move up, the importance of cutter frequency optimization increases.
It is important in design to observe precautions that minimize temperature rise. The most obvious expedient is to increase heat conductivity through the isolator through judicious use of materials. Unfortunately good damping materials for the isolator are not good heat conductors. However, in the materials that have worked well, the heat conductivities have varied by a factor of fifteen and the better conductors can provide a significant heat removal path as compared to the conduction through the diamond.
Obviously heat conductivity through the isolator will he improved by decreasing its thickness and increasing the area of the base. Unfor- tunately one has only limited choice for these thermally significant parameters, since they also exercise a major influence over the fre- quency response of the cutterhead.
RCA Review Vol. 43 March 1982 33

Conclusions
The apparently simple device, a VideoDisc cutterhead shown in Fig. 3, having but five major components, turns out to he a very sophisti- cated system. No dimension or material may be altered without reactions occurring throughout the system that affect its ability to give a flat response over a decade of frequencies from 0.7 to 10 MHz. Dimensions are so small that exciting electric fields and resultant mechanical strains border on the limits of breakdown and failure.
The approach to cutterhead design is largely empirical. Theoretical models have been limited to regular solids and, while they are illumi- nating, they do not yet deal with two component systems such as a bonded base and driver assembly. Essential to this empirical approach have been the detailed insights that have been gained from the use of the microbeam interferometer, the scanning electron microscope, and the infrared microscope, as well as a variety of micromachining and assembly tools and jigs required to handle the microscopic components of the cutterhead.
In spite of the good success that has been achieved in designing practical and reliable cutterheads for the VideoDisc, those who are designing and using the minute devices are aware that only a small portion of the possible art and technology of cutterheads has as yet been explored and exploited.
Acknowledgement
The authors wish to acknowledge the contribution of their several associates who have directly assisted in the work from which this paper stems, W. H. Bleacher, E. R. Campbell, W. L. Lees, P. Mitnaul, F. Sultanowski, and C. A. Whybark.
References:
K. F. Etzold, "A Quadrature Michelson Interferometer System For Probing Surface Vibrations: Application to VideoDisc Cutters," RCA Review, 43, p. 95, March 1982 (this issue). 2 J. B. Halter, "Triangular Piezoelectric Transducer for Recording Video Information," U.S. Patent No. 3,865,997 (1975), Reissued RE 29,113 (1977). 3 J. B. Halter, "Method and Apparatus for Electromechanical Recording of Short Wavelength Modulation in a Metal Master," U.S. Patent No. 4,044,379 (1977). 4 R. L. Truesdell, "Testing Methods for the Characterization of Cutterhead Performance in Mastering VideoDiscs," RCA Review, 43, p. 117, March 1982 (this issue). 5 R. Shahbender K. S. Vanguri, and B. T. Khuri-Yakub, "Approximate Resonance Spectrum of a VideoDisc Cutter," RCA Review, 43, p. 57, March 1982 (this issue). e R. Shahbender, "Thermal Analysis of VideoDisc Cutter," RCA Review, 43, p. 44, March 1982 (this issue).
34 RCA Review Vol. 43 March 1982

Power Dissipation in Piezoelectric Cutterheads
Gerard A. Alphonse RCA Laboratories, Princeton, NJ 08540
Abstract-The high signal levels used in VideoDisc cutterheads during re- cording may cause substantial power dissipation and enough internal temperature rise to damage the cutterheads if no adequate heat sink is used. There are two mechanisms responsible for power dissipation-dielectric loss in the piezoelectric and acous- tic absorption in it and in the surrounding damping and bonding materials. A typical one-half real time cutterhead dissipates about 100 milliwatts under normal operating condition, a power density of over 2.5 kilowatts per cubic centimeter.
Introduction
The high signal levels used in VideoDisc cutterheads during recording may cause substantial power dissipation and enough internal temper- ature rise to damage the cutterheads if no adequate heat sink is used. Power dissipation is due to two causes: dielectric loss in the piezoelec- tric and acoustic absorption clue to the loss factors in it, in the bonds, and in the other absorbing materials used in the construction of the device. Cutterhead damage due to those mechanisms include loss of sensitivity (depolarization) and burning. This paper evaluates the contribution from those mechanisms. It shows that a typical one-half real time cutterhead dissipates about 100 milliwatts under normal operating conditions, a power density of over 2.5 kilowatts per cubic centimeter.
RCA Review Vol. 43 March 1982 35

Dielectric Loss
The dielectric loss in a material is represented by its so-called loss tangent, tan 8. In PZT ceramics, tan 8 is a function of voltage, stress and temperature. As can be seen in Fig. 1, it is about 6 times larger at 8 kV/cm than at I kV/cm at room temperature (25°C)» At 100°C it is twice as large as at 25°C. At full voltage level (5011 p -p) the electric field in 1/2 RT (1/2 Real Time) cutterhead is about 10 kV/cm, high enough to cause significant power dissipation.
In the cutterhead equivalent circuit2 of Fig. 2, the parameter respon- sible for the dielectric loss is the shunt conductance G. = we, tan across the clamped capacitance Co. In addition to G. and C. the equivalent circuit includes the motional impedance Z,,, = RI + j(wL - 11 C), in which L corresponds to the PZT's mass, C corresponds to its stiffness, w is the angular frequency, and RI, represents all the factors in and around the ceramic responsible for acoustic absorption. RI, may not be the same for all devices having the same nominal dimensions.
If the rms terminal voltage across the cutterhead is VT, the dielectric power loss is P,1= V7:2G. The following normalized form will be found useful later:
Pd = P, /Q', 11]
where P. = VT2/RL, 1. = w/w w, = (LC) -'/2, Q' = (w,CR,,tan 8)-'.
From Fig. 1, a reasonable assumption for tan 8 for the '/a RT cutterheads is 0.04 to 0.06. Typically, C = 6 pF, w,/277. = 3.75 MHz, RI,
3kg2,L= 1 mH, C 1.8 pF. This gives Q'=50 and P_ 10 watts for a typical cutterhead voltage of 500 volts peak to peak (VT = 177 volts).
60
0.06
0.04 z
0.02
0.01
1.0 2.0 3.0 4.0 5.0 6.0 7.0 8.0 AC RMS FIELD KV /cm
Fig. 1-Dielectric loss factor in PZT-8 as a function of ac electric field and temperature.
36 RCA Review Vol. 43 March 1982

VT Go
Z
Fig. 2-Simplified equivalent circuit of cutterheads.
POWER DISSIPATION
At resonance (r = 1), this power loss for an unequalized cutterhead is
about 200 milliwatts.
Acoustic Loss
The acoustic power is obtained from the "motional impedance" Z,,,
and the rms values VT and I,,, of the terminal voltage and "motional current ". Denoting by I/,,,, I and 8,,, the magnitude and phase of Z,,,, the acoustic power is written as
P = VTI,cos 8,,, = (VT2/ I Z, I )cos Om.
In the normalized form, Z0, = RLF(r), where F(r) = 1 + jQ(r - 1/r) and Q = w.,L/R,.. Then
Z, I= R,, I F(r) I, cos 0, = I F(r) I -I,
I F(r) I = 11 + Q`'(r - 1/r)2]Ú2
and
P = PIF(r)I-z. t2j
F(r) I
is the generalized resonance function; its value is unity at resonance and increases more or less sharply away from resonance, depending upon the value of Q. Hence P is large and equal to Po at resonance and falls off rapidly on either side of that point.
Plots of Pd and P for constant cutterhead voltage of 5(X) volts peak to peak (i.e., without equalization) for various values of Q are shown in Fig. 3. The total power Pr is P,, + P, or
PT = P1(r/Q') + IF(r)I-2] 131
and is plotted in Fig. 4. The dielectric power increases monotonically with frequency and its value is about 20) milliwatts at resonance. The acoustic power is relatively small below r = 0.6, but becomes dominant as r increases. It reaches its peak at r = 1, which is about 10 watts (power density 250 kW/cm) for a Q of 8.
It is clear that operation of the cutterhead without equalization would destroy the device, even at moderate voltages.
RCA Review Vol. 43 March 1982 37

0.2 0.4 0.6 0.8 1.0 1.2 NORMALIZED FREQUENCY tv/<us
Fig. 3.-Dielectric and acoustic power loss for half -real-time cutterheads at 500 volts p -p for several values of Q.
1.4
Effect of Equalization The displacement response of cutterheads at constant voltage is flat or constant at low frequencies (r < 1) and increases with frequency until r = 1 (resonance) where it reaches Q times its low frequency value; then it rolls off. For recording of a broad spectrum signal, a constant response is required. To achieve this goal, an equalizer with the inverse response of the cutterhead is placed in the signal path. It can he shown that for a constant input voltage V; to the equalizer the actual cutterhead voltage is*
VT = Vrr I F(r) I/fib. 141
Since the power goes as V72, then the power PE in the equalized cutterhead is
Pr. = (r.I F(r) I /Q)'Pr, 151 " It is easy to verify that for r < .1, I PHI z Q/r and VT =_ V, as expected.
38 RCA Review Vol. 43 March 1982

POWER DISSIPATION
10.0
1.0
0.1
0.01
0-8 0.12 ---0=16
.1
l \ \\ \
1 1 I I I 1 1» 0.2 0.4 0.6 0.8 1.0 1.2 1.4
NORMALIZED FREQUENCY CA)/ Ws
Fig. 4.-Total power in unequalized cutterhead at 500 volts p - p for several values of Q.
where Pr is the power without equalization, given by Eq. [31. The plot for several values of l? are shown in Fig. 5. The power is essentially constant in mid -range, with a value of 60 to 120 milliwatts for Q between 20 and 8. It rolls off at low frequencies, but increased sharply above resonance roughly as the 5th power of frequency.
The power dissipation characteristics has been verified experimen- tally by means of an infrared microscope. The sample is coated with black paint and the r( is applied to its terminals. An infrared sensor detects the black body radiation which can then be plotted. In Fig. 6,
the infrared data for an equalized cutterhead, shown as circles, is
plotted against the theoretical curve. The agreement is in general good, but the infrared data showed more dissipation above resonance than the theory. The discrepancy is due to the oversimplifying as- sumption in the analysis that the loss tangent was a constant. As can
RCA Review Vol. 43 March 1982 39

1.0
0.1
0.01
0.00
I 1 I
0.2 0.4 0.6 0.8 1.0 1.2 NORMALIZED FREQUENCY w/ws
Fig. 5-Total power in equalized cutterhead at 500 volts p -p for several values of Q.
1.4.
be seen in Fig. 1, tan S is a function of both the electric field and the temperature. The voltage changes by a factor equal to the Q of the device over the frequency range, and tan S should vary with it as in Fig. 1. In addition, the power generation increases the cutterhead temperature, which in turn increases the loss tangent. The effect of the voltage variations is shown as the solid curve in Fig. 7, and the additional effect of temperature is approximately represented by the dashed curve. 'These modifications account well for the observed thermal behavior. This self -enhanced feature is regenerative and may be the cause of earlier observed thermal runaway.
Conclusion
Power dissipation in cutterheads is due to dielectric and acoustic losses. For unequalized cutterheads, the dielectric loss increases mon-
40 RCA Review Vol. 43 March 1982
1.0
0.1
0.01
POWER DISSIPATION
O
O
O
0.2 0.4 0.6 0.8 1.0 1.2 1.4
NORMALIZED FREQUENCY W/Ws
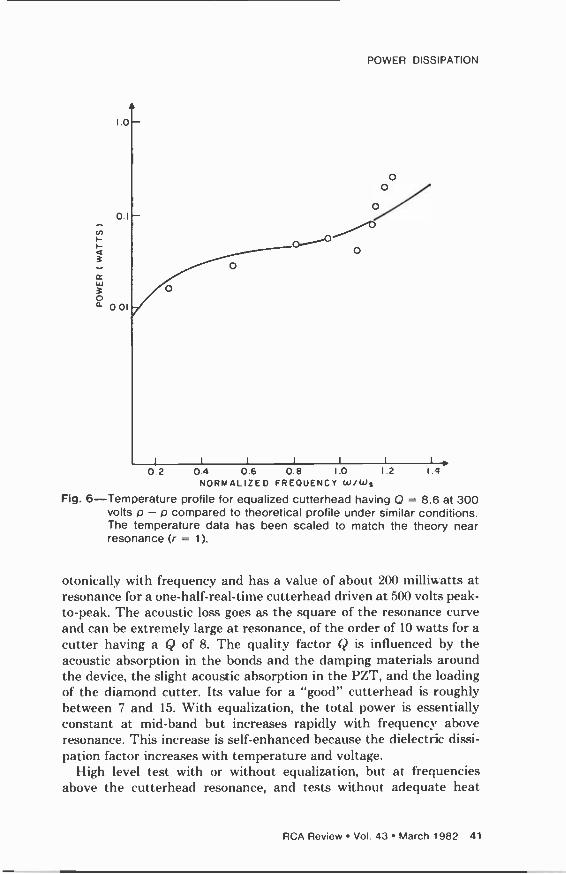
Fig. 6-Temperature profile for equalized cutterhead having Q = 8.6 at 300 volts p - p compared to theoretical profile under similar conditions. The temperature data has been scaled to match the theory near resonance (r = 1).
otonically with frequency and has a value of about 200 milliwatts at resonance for a one -half -real-time cutterhead driven at 500 volts peak - to -peak. The acoustic loss goes as the square of the resonance curve and can be extremely large at resonance, of the order of 10 watts for a
cutter having a Q of 8. The quality factor Q is influenced by the acoustic absorption in the bonds and the damping materials around the device, the slight acoustic absorption in the PZT, and the loading of the diamond cutter. Its value for a "good" cutterhead is toughly between 7 and 15. With equalization, the total power is essentially constant at mid -band but increases rapidly with frequency above resonance. This increase is self -enhanced because the dielectric dissi- pation factor increases with temperature and voltage.
High level test with or without equalization, but at frequencies above the cutterhead resonance, and tests without adequate heat
RCA Review Vol. 43 March 1982 41
I.0
0.1
0.01
TAN S VARYING WITH VOLTAGE AND TEMPERATURE
o o
TAN S VARYING WITH VOLTAGE o j oo
o
FROM THERMAL MEASUREMENT
TAN S CONSTANT
I I I I I
0.2 0.4 0.6 0.8 1.0 1.2 1.4.
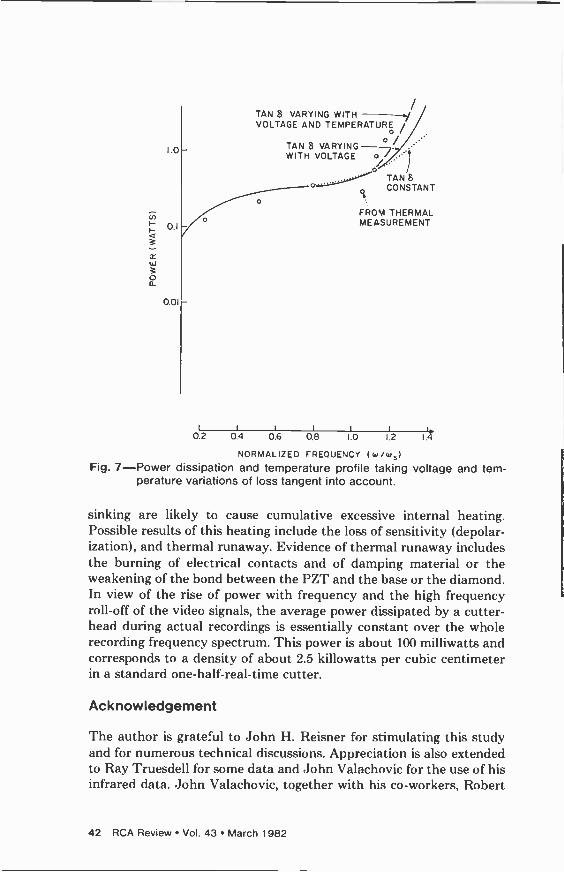
NORMALIZED FREQUENCY (w/ws) Fig. 7-Power dissipation and temperature profile taking voltage and tem-
perature variations of loss tangent into account.
sinking are likely to cause cumulative excessive internal heating. Possible results of this heating include the loss of sensitivity (depolar- ization), and thermal runaway. Evidence of thermal runaway includes the burning of electrical contacts and of damping material or the weakening of the bond between the PZT and the base or the diamond. In view of the rise of power with frequency and the high frequency roll -off of the video signals, the average power dissipated by a cutter - head during actual recordings is essentially constant over the whole recording frequency spectrum. This power is about 100 milliwatts and corresponds to a density of about 2.5 killowatts per cubic centimeter in a standard one -half -real-time cutter.
Acknowledgement
The author is grateful to John H. Reisner for stimulating this study and for numerous technical discussions. Appreciation is also extended to Ray Truesdell for some data and John Valachovic for the use of his infrared data. John Valachovic, together with his co-workers, Robert
42 RCA Review Vol. 43 March 1982

POWER DISSIPATION
E. Simms and Florence C. Sultanowski, is also responsible for the construction of the cutterheads.
References:
1). A. Berlincourt and H. H. A. Krueger, `Behavior of Piezoelectric Ceramics Under Various Environmental and Operation Conditions of Radiating Sonar Transducers," Clevite Corp., Piezoelectric Division, Technical Report TP-228, Engineering Memoran- dum 64-27.
1). A. Berlincourt, I). R. Curran; and H. Jaffe, "Piezoelectric and Piezomagnetic Material, and Their Functions in Transducers", in Physical Acoustics, Warren P. Mason, ed., Ch. 3, (Academic Press, New York, 1964).
RCA Review Vol. 43 March 1982 43

Thermal Analysis of VideoDisc Cutter
Rabah Shahbender RCA Laboratories, Princeton, NJ 08540
Abstract-In a VideoDisc electro -mechanical cutter, machining of a substrate dissipates power and heats the cutting tool. Electrical signal applied to the PZT transducer in the cutter generates heat. By considering the above two thermal sources and by computing the thermal resistance of components of a cutter, an equivalent ther- mal circuit diagram is developed. This allows estimating the tem- perature rise of cutter components as a function of operating conditions.
1. Introduction
An electro -mechanical cutter' for mastering VideoDiscs (see Fig. 5) consists of a PZT-8 ceramic piezoelectric transducer with a diamond tool epoxy bonded to one of the major faces. The other major face is soldered to a steel base. The base -transducer combination is bonded to a relatively large steel post by a combination of films of Kapton and layers of Viscoloid.
A VideoDisc master is recorded by applying an electrical drive signal to the PZT transducer. The cutterhead is positioned over a rotating copper disc substrate with the diamond tool protruding into the substrate so as to machine a groove several micrometers deep. The PZT transducer, in response to a drive signal, modulates the depth of groove machined by the diamond. The depth of modulation is on the order of 0.1 micrometer.
Both machining of the substrate by a diamond and excitation of the PZT transducer generate considerable heat. It is of importance to estimate temperature rise of a cutterhead under operating conditions.
44 RCA Review Vol. 43 March 1982

THERMAL AN3L1'SIS
For PZT-8, Curie temperature is 300°C and maximum recommended operating temperature is 175 °C2. Considerable depolarization occurs for operation at temperatures in excess of 175°C. Additionally, the epoxy bond between diamond tool and l'ZT transducer is subject to failure at high temperatures.
2. Substrate Heating Due to Diamond Machining
The groove formed by a diamond tool in a copper substrate is on the order of several micrometers deep and slightly larger across. For our purpose the copper substrate is sufficiently thick that it may be
considered infinitely thick. Heat generated by a tool flows into a substrate raising its tempera-
ture. Since the copper substrate is in motion, temperature at a given point in the substrate is a function of time and of the coordinates of the point. Some of the heat generated by a tool flows from the tip of
the diamond to the steel post via the PZT transducer, the steel base,
and the Kapton-Viscoloid layers. The thermal resistance of this path is quite high leading to negligible heat flow compared to heat flow into the substrate.
To calculate temperature rise in a substrate, we will follow Pitta - way's' analysis for determining temperature distribution in a semi - infinite target machined with an electron beam. Pittaway assumed that the energy of a scanning electron beam with a Gaussian spatial distribution is absorbed at the surface of a target. He solved the heat - flow problem and obtained temperature distribution in the target. Similarly we assume that heat generated by a tool in machining a
substrate is absorbed at the surface of a substrate. The tool is consid- ered a heat source with a spatial Gaussian distribution. Under these assumption Pittaway's results may be used to calculate temperature rise.
Referring to Fig. 1, the temperature rise at point "0" is due to a heat
pd=b
m - ve
r
md-~s v
SOURCE
m+ve 0
e
Fig. 1-Geometry of heat flow from a source into a substrate.
RCA Review Vol. 43 March 1982 45

source at an infinite distance from 0, which moves toward 0 along a straight line with constant velocity v, passes by or through 0, and then moves away. The temperature rise is given by'
where
TKd - 1
1"/2 E03z exP[
\m - 1' + fi2 }sinµ - tanLµ l)l
dilla»J
a J
Eo = Total power incident on substrate (watts) K = thermal conductivity of copper = 3.85 x 10² W/m-°C
= 92 Cal/sec-m-°C a = 4k/vd k = thermal diffusivity of copper = 1.11 x 10-' m2/sec v = source velocity
µ2=(1/d2) + (1/4kt) t = time parameter measured from an arbitrary reference
point /id = h = distance of closest approach of beam center to point
0 (see Fig. 1)
and = .ro - vt, -oc <_ m <_ oc = distance parameter along trajec- tory of energy source measured from reference related to the reference for t (see Fig. 1)
The heat source is assumed to be a beam with a spatial distribution that is gaussian. This distribution is given by
S22 E= E0 exp-S2, 0<_S<oo 121 -d d
where E is the power density in W/m2, d is the standard deviation of gaussian distribution (meter), and S is the radial distance from beam center in the plane of the substrate (see Fig. 1). Power density at the center of the beam is
E0
Trd 2 W/m2 131
Temperature rise experienced by point "0" in a substrate directly in the path of an energy source when the center of the source coincides with point "0" is given by Eq. [1 ] with
b=/3d=0 Ind =0.
46 RCA Review Vol. 43 March 1982

THERMAL ANALYSIS
Substituting leads to /z 2
TF rl T3/2
fo exp - asin µ tan µ dµ =
v3/2. 141
Integral I, defined by the above equation, may be evaluated numer- ically and leads to the results given in Table 1. A value of the parameter a is assumed and the corresponding value of d is calculated from
4k ad= - , V
with v = 3.8 rn/sec.
Table 1-Temperature Rise in Degree Centrigade per Incident Watt
d(meter) / T/Eu °C/W
1 1.17 x 10-' 0.819 3.26 10 1.17 x 10⁻⁵ 1.414 56.3 20 5.85 x 10-" 1.488 118.5 50 2.34 X 10 " 1.537 306.0
200 5.85 X 10-' 1.561 1244
Calculation of temperature rise is based on a Gaussian beam with a radius extending to infinity. VideoDisc mastering uses a diamond tool of finite dimensions. If we assume that the power Po of a Gaussian beam within a radius So is a large fraction R of the total power E0 of the beam; and if we assume that the power released by a diamond of effective radius So (effective radius is derived later) is the same as Po,
then temperature rise due t,o diamond machining will be given by the data of Table 1.
Power Po within a radius So is
I.et
Po= ,
-x2/rSdS o
=Eo[1- exp -(-S.l 2i d
Po Power within radius So
R -
Eo Total Power within gaussian beam
Substituting
S0 = -ln(1 - 1?), d'2
151
RCA Review Vol. 43 March 1982 47

Table 2-Characteristics of Gaussian Beam
I? 0.5 0.6 0.7 0.8 0.9 0.95 0.99 Sfd 0.83 0.96 1.1 1.3 1.5 1.7 2.1
we obtain values of Sold corresponding to assumed values of R (see Table 2).
3. Effective Radius of Diamond Tool
An estimate of So, the effective radius of a diamond tool, may be made by determining the value of Ae, the contact area between a diamond and a substrate as a function of type and dept? of cut, and by equating A,. to the area of a circle with radius So.
Fig. 2 is a perspective view of the tip of a diamond tool. The diamond is shown inverted in the figure. For machining, point T is imbedded in a copper substrate, and substrate rotation is such that point T leads and point e lags. Plane ace is horizontal and coincides with the free surface of a substrate.
For a fast spiral groove in which a diamond is cutting an essentially isolated, symmetric groove, the contact area Air is
= 2[Area of triangle Tab + Area of triangle TceJ = 8.7D2,
and the effective size of a tool is
=1.7D.
Here D is the depth of penetration of the tool into the substrate, and representative dimensions of a tool have been used to calculate
For normal recording in which a tool is overcutting, the geometry of machining is asymmetrical as illustrated in Fig. 3. The contact area
for a representative tool is
AcN = 12.98D2 + 2.64D1 µm2 for D in µm.
The effective size of a tool is
So = I0.95D2 + 0.84D 1"2.
Fig. 2-Geometry of tool tip during machining.
48 RCA Review Vol. 43 March 1982

"I 111?I1MAL ANALYSIS
° 140 r0.48µm 1 i --1
D=2.64µm
Fig. 3-Geometry of groove during program recording.
4. Substrate Temperature
1. Guarracini4 measured the cutting force F experienced by a diamond tool in producing isolated grooves in a copper disc. His data show that F is independent of surface speed, and quadratically dependent on groove depth. Analysis of the experimental data leads to the values of F given in Table 3 for assumed values of groove depth. The power generated by grooving is
Eo=Fxvx9.807x 10-"W,
where F is the cutting force in gm and v is the surface speed (3.8 m/ sec).
Table 3 gives values of calculated temperature rise of a substrate as a function of groove depth for a fast spiral cut and for normal recording. Temperature is calculated for two assumed values of R, viz R = 0.9 and 0.95. As can be seen, difference in calculated values of T for the two assumed values of R are relatively minor.
To arrive at a value of T, data of Table 1 were plotted on log -log scales and the plot used to interpolate the value of T/Eo for computed values of d.
Referring to Table 3, we note that for fast spirals, T increases dramatically as groove depth increases; for normal recording, on the other hand, temperature rise plateaus at about 18°C above ambient.
5. Thermal Resistance of Cutterhead Components
To complete thermal analysis of a cutterhead it is necessary to estimate thermal resistance of its component parts.
5.1 Diamond Tool
Heat can flow from a copper substrate to a PZT transducer or vice versa through the diamond tool. Because of the complex shape of a tool we will approximate it by half of a right circular cone, i.e., a cone sectioned by a plane perpendicular to the base and passing through
RCA Review Vol. 43 March 1982 49

I Ó
c,5
F
E °o á
Q Q
h op NCCDOoO
9-1
cv un un Ó h N n UC r O
M el* hC)M NMO[
'+uDC? Mu7C0 t--
ChOn CID Q:C)
O W CO rnOnun CS . ci OS 'I;
a0 cNi OD ñ OD
O
MMMcrJnN '+NM u]l
i i i ii i 000000 XXXXXX CJ "C. CV
OO +
N MOOM C`OO b CV N CNMCi '+CYC`M ..NC
j t10 0 ..., E b
k. GD ó
i 14 qNMUDhO ñ ~NM Cu7r
1 i 1
` L Z
50 RCA Review Vol. 43 March 1982

I I11,,ItA'1H1. ANA1.111J
the apex (see Fig. 4). Typical values for the base area and height of the half cone are:
Area of base of half cone = 7rr/12/2 = 2.14 x 10'' µm2, where r is the radius of base of cone = 116.7 µm;
Height of cone h = 100 µm; Half angle of cone = arc tan rn/h = 49.4°.
At a distance D, from the apex of the half cone, the cross-sectional area (see Fig. 4) is
Tr(D, tan 49.4)2 A,- -2.14D,2. 2
We will set area A,. equal to the contact area between a diamond and a copper substrate. Thus we have
D, = 1.51) for fast spiral cutting
De = 11.4D2 + 1.2D JI"2 for normal recording
Thermal resistance of a half cone may be approximated by
J.,,
d7, 2 In
h R -
Kr, 2
^r K tan 49.4 D,'
where Ku = thermal conductivity of diamonds
= 9 X 10² W/m-°C for Type I diamond
= 26 x 102 W/m-°C for Type II diamond
rB -1
Fig. 4-Geometry of half cone.
161
RCA Review Vol. 43 March 1982 51

For a fast spiral groove, thermal resistance of a diamond is
Rev = Kv
(4.2 - In D), where D is in µm;
and for normal recording, thermal resistance of a diamond is
0.25 ReN =
Ku (9.2 - In(1.4D2 + 1.2D)}
where D is in µm.
Table 4 gives computed values of thermal resistance of a diamond tool as a function of groove depth for both the fast spiral groove and for normal recording.
5.2 Thermal Resistance of PZT-8 Transducer
171
Fig. 5 is a sketch of a transducer -base configuration used in construct- ing a cutterhead. Thermal resistance of a transducer may be calculated from its known dimensions. However, since a transducer is also a heat source, estimating its temperature rise would require consideration of a distributed system rather than a lumped system. For our purposes, we will divide a transducer into two elements of equal thickness, calculate thermal resistance of each element, and assume the heat source to be connected between the two elements.
Let A(Z) be the area of a transducer cross-section in a plane perpendicular to thickness direction. Thermal resistance of the top half of a transducer (the one in contact with a diamond) is approxi- mately
RT = fy2 c1Z 0.3 1 1 l
Jo KTA(Z) Kr I_ vA(t/2)J
where K, is the thermal conductivity of PZT-8' = 1.8 W/m-°C.
Table 4-Thermal Resistance of Diamond Tool Groove I)epth
U µm Thermal Resistance
Type I 'Type II
Fast Spiral Groove 2 1.9 x 10-' 6.7 x 10-' 3 1.7 x 10 ' 6 x 10-' 5 1.4 x 10-' 5 x 10 ' 7 1.3x10-" 4.3x10'
10 1.1 x 10-" 3.6 x 10-' Normal Recording
1 2.3 x 10-' 7.9 x 10' 2 2 x 10-" 6.8 x 10-' 3 1.8 x 10-' 6.2 x 10-' 4 1.6 X 10-' 5.6 X 10' 5 1.5 x 10-' 5.3 x 10' 7 1.3 x 10-' 4.7 x 10'
[8]
52 RCA Review Vol. 43 March 1982

THERMAL ANALYSIS
DIAMOND
V ISCOLOID
.-KAPTON
STEEL BASE
STEEL POST
Fig. 5-Cutterhead structure.
Similarly, thermal resistance of the bottom half of a transducer is
R - K f T A(t/2) A(t)
Substituting values of A(Z) and Kr leads to
RT = 227
Re= 78.4
0.3 1 1
191
The top and bottom faces of the PZT are metallized to provide electrodes. This metallization will tend to form a plane of uniform temperature thus allowing computation of RT and R5 as given above.
5.3 Thermal Resistance of Steel Base
Thermal resistance of a steel base may be calculated using the formula given above for a PZT-transducer,
r (IZ Rs, =
Jo KA (Z) - 9.72, 1101
where K.,, is the thermal conductivity of steel = 46 W/m-°C.
5.4 Thermal Resistance of Kapton-Viscoloid Layers
To calculate thermal resistance of Kapton-Viscoloid layers we will
assume that each layer has an area AK equal to that of the bottom surface of a steel base. Further we will assume that thermal conduc- tivity of viscoloid is the same as that of Kapton, KK, which ís the same as that of Mylar. Thermal resistance RK of Kapton-Viscoloid combi-
RCA Review Vol. 43 March 1982 53

nation is
7,K R [111 ,, -
KKA,'
where Z, is the total thickness of all layers and KA = 0.15 W/m-°C. Substituting leads to RK = 1.21 x 10³.
6. Cutterhead Equivalent Thermal Circuit
The equivalent circuit for determining temperature of a cutterhead, shown in Fig. 6, may be constructed by assuming that: (a) The steel post is an ideal thermal sink whose temperature is
constant at ambient. (b) The copper disk is an ideal thermal source whose temperature is
constant at ambient plus an increment T specified in Table 3. (c) The power dissipation in a transducer is equivalent to a heat
source located at the center of a transducer. Typically, transducer dissipation over the operating frequency band ranges from a low of 0.1 watt to a high of 1 watt.
Referring to Fig. 6, we have
RK = resistance of Kapton-Viscoloid = 1.21 x 10' Rs, = resistance of steel base = 9.72 R = resistance of bottom half of PZT = 78.4 Rr = resistance of top half of PZT = 227 Kn = resistance of Diamond tool ranging from a low of 4.7 x
10' to a high of 2.3 x 10-"
Let T7 be the temperature rise above ambient of the diamond interface, T, be the temperature rise above ambient of the steel base interface, and TTR be the temperature rise above ambient at the center of the transducer. We will estimate the values of these temperatures under varying conditions.
From the equivalent circuit, we have
Pr - TrF TT!?- rub [ 12 R, + Rsr + Re Rr + RD
Tame RK R ST RB TTR RT Ro
,",___pTame ' Tut
OPT
Fig. 6-Equivalent thermal resistance circuit.
54 RCA Review Vol. 43 March 1982

Solving this expression leads to
PT(Rh' + RsT + Rrr)(RT + RD)
- + T,,,b(Rh' + RsT + R,r) TTR
(Ric +RsT+RR+RT+RD) = 1.9 x 10² PT + 0.85 Tgb,
where we have used the highest value of RD.
6.1 Normal Recording
TIIERMAl. ANALYSIS
1131
For normal recording the maximum substrate temperature rise Tb is
19°C (Table 3). Thus the value of TTR is strongly dependent on the value of PT. For a 1 -watt transducer dissipation, TTR ranges from a
low of 190°C for a shallow groove to a high of 206°C for a deep groove. For a 0.1-wattt dissipation, the corresponding values of TTR are 19°C and 35°C, respectively.
If the depth of cut increases during normal recording, the effect on
TTR is negligible, as can be seen from data of Table 3. This assumes that PT remains constant.
6.2 Fast Spiral Cutting
If a fast spiral is cut with a transducer de -energized, then the temper- ature rise of the transducer for a groove depth of 10 pm is TTR = 87°C.
If a transducer is energized during fast spiral cutting, then excessively high temperatures can result. For example, if PT is 0.65 W and D = 10 pm,
Tb = 103°C and
TTR =211°C
6.3 Cutter Raised Off Substrate
If a diamond is not in contact with a substrate, and the transducer is
energized, we have
TTR = (RA' + RsT + RH)PT
= 1.3x 10' PT;
for PT = 0.1 watt we obtain TTR = 130°C. This shows the importance of heat sinking the transducer through
the diamond to the copper substrate.
[141
RCA Review Vol. 43 March 1982 55

7. Conclusions
The analysis presented above allows computation of temperature rise above ambient of components of a cutterhead under various operating conditions. Further, since the analysis is explicitly in terms of geometric dimensions and material properties of the various components, the effect of changes in these parameters can he readily estimated.
The division of thermal resistance of a transducer into a top and bottom half is somewhat arbitrary. The value of resistance of the top half RT is somewhat critical in determining the heat sinking effect of a substrate. Computation of RT, as presented above, is probably reasonably accurate if a transducer electrode is sufficiently thick and is of a material with high heat conductivity. Under such a condition the top surface of a transducer is at a uniform temperature. Further, maintaining intimate thermal contact between a diamond and an electrode is of obvious importance.
The two operating conditions that should be avoided to eliminate excessive high temperatures are: (1) deep fast spiral grooves with the transducer energized and (2) energizing the transducer when a diamond is not in contact with a copper substrate.
Acknowledgments
The author is grateful to A. E. Bell for the reference to Pittaway's work, to G. Alphonse and R. Truesdell for use of their analysis of transducer dissipation, and to J. Guarracini and J. Reisner for use of their data on power dissipation in machining copper.
REFERENCES:
E. O. Keizer, "Video Disc Mastering," RCA Review, 39, No. I, p. 60, March 1978. Clevite Corp., Vernitron Piezo-electric Division, Bedford, Ohio 44146 "Data for De- signers."
L. G. Pittaway, "The Temperature Distribution in Thin Foil and Semi -infinite Targets Bombarded by an Electron Beam," Brit. .1. App!. Phys., 15, p. 967, 1964. ' 1. Guarracini, private communication. `' DeBeeis Industrial Diamond Division, "Properties of Diamond."
56 RCA Review Vol. 43 March 1982

Approximate Resonance Spectrum of a
VideoDisc Cutter
R. Shahbender, K. S. Vanguri, and B. T. Khuri-Yakub' RCA Laboratories, Princeton, NJ 08540
Abstract-Numerical solutions of the frequency equation for coupled modes
in piezoelectric ceramics are presented. Computed frequencies are in reasonably good agreement with primary resonance ob- served in typical VideoDisc cutterheads. Subsidiary resonances seen in typical cutterheads correspond to shear modes related to
the primary resonance and to flexure modes.
1. Introduction
Empirical design of a cutter assembly attempts to place spurious resonances of an assembly outside the signal bandwidth. This approach has led to cutters that display a major resonance and other undesirable low-level resonances within the signal bandy, idth. The multi -element multi -material structure of a cutter'-diamond tool, PZT driver, steel base, and isolator-necessarily implies a complex spectrum of reso-
nance frequencies that probably defy rigorous analysis. However, the coupling theory developed by Onoe and Tiersten` for piezoelectric ceramic vibrators may be used to determine resonance frequencies of
the dominant element, the PZT driver, as an aid to empirical design of
a cutter. The two types of piezoelectric ceramic vibrators considered by Onoe and Tiersten, a parallelepiped and a cylindrical structure, are analyzed.
Dr. B. 'P. Khuri-Yakub is with KYS, Inc., 4151 Donald Dr., Palo Alto, Calif. 94304.
RCA Review Vol. 43 March 1982 57

2. Resonant Frequencies of a Piezoelectric Parallelepiped
For the parallelepiped shown in Fig. 1 (top) poled along the Z-axis and driven along Z from a voltage source, i.e., short-circuit conditions, the hicubic frequency equation given by Onoe and Tiersten2 is
(fa¿- f2) it f,fb
ctffi, (fb' - f2)
afbfy 0
fy afbly (fyz - fz)
where f fy, and f, are the lowest -order resonant frequencies of uncou- pled vibrations in the X, Y, and Z directions, and a and y are the constants coupling these vibrations. The values of resonance frequen- cies and coupling constants are:
2L rC[C11/2. - ILL J
1
I/2 2 fi,=2xPJ -X,
ILL lW
[C1ll,/z fy
P JI
= C13/[CIIC33I1/2
y = C,2/Ci,
and X, is the first positive nonzero root of
tan X, = X,/k,2.
In the above expressions, the C coefficients are superscript E, p is the density, and Lx W x H are the dimensions of the parallelepiped.
For computational purposes, we define the configuration ratios Gr. = L/H and G,v = 147H and the normalized frequencies
Z = fH x 10-" (kHz mm)
Z2 = (f,H x 10-:3) 1 CI
x 10-6 Gr. 4p
Zr,z = (fi,H x 10-3)2 - C33Xiz x 10-6
TT
3 ., 1 CI -f¡ Zy`= (f,.Hx ]0-')`= G,v z x lO
58 RCA Review Vol. 43 March 1982

RESONANCE SPEC] RUM
t z - aXIS
Fig. 1-(Top) Piezoelectric parallelepiped and (bottom) piezoelectric cylinder.
The normalized bicubic frequency equation is given by
Z6-Z4(Z,2+Zr,2+ZY2)
+ Z2[(1 - a2)(Z2Zh2 + Z,,2Z,2) + (I - y2)Z022Zy2J
- (1 -2a2+2a2y-y2)Z2Z,,2Zy2=0 For assumed values of Gw and G, we solve the frequency equation
for its three real roots Z,, Z2, and Z3. These correspond to three coupled mode resonance frequencies.
Table 1 lists values of the pertinent coefficients for PZT-8 as given in the literature.' Substituting in the expression for X, we obtain
X, = 1.4082
Figs. 2, 3, and 4 show plots of Z,, Z2, and Z3 as functions of GI, for assumed values of Gw = 0.5, Gw = I, and Gl, = 2.7, respectively.
Table 1-PZT-8 Constants' Cn = 13.7 x 10' N/m2 C,2E=6.97
= 7.16 Cr,E = 12.4 CuE = 3.14
= 3.37
= 16.1 k,= 0.481 p = 7.6 X 10'Kg/m
.A, = 1.408 1.= 2.171 J} comput.ed121
/'''= 2.145
RCA Review Vol. 43 March 1982 59

lo
8
6
4 -
2-
00 " I I l
2 3
Fig.2 Pzt-Porollelepiped GL=L/H (Gw=0.5)
Fig. 2-Real roots Z,, Z2, and Z3 as functions of GL(L/H of PZT-8 parallele- piped) for GW = 0.5.
Experimental data obtained by J. Reisner6 shows that a 9 mil cube of PZT-8 (GL = Gw = 1) has a dominant resonance frequency of 6.6
MHz in close agreement with the value of Z2 in Fig. 3.
3. Resonant Frequencies of a Piezoelectric Solid Cylinder
For a solid cylinder of diameter L and height H, poled along the cylinder axis (Z-axis) and driven from a voltage source, a biquadratic equation determines the coupled mode resonance frequencies. The equation as given by Onoe and Tiersten2 is
(fit f2) sf,f sfaf,, (42 - f2) = o
where f and fn are the first -order uncoupled resonant frequencies corresponding to a radial mode of a long cylinder and a thickness - dilatation mode of a large area disc, respectively; and S is a coupling coefficient. The uncoupled frequencies and coupling coefficient are
.(17, f.= L , ] ``C',.', 2
fn 2H V p Xr
60 RCA Review Vol_ 43 March 1982

RESONANCE SPECTRUM
r ¡ P 2 1/2
8=LI1-a211 I -1J
The quantities a and X, /have their previously defined values; S and are solutions of transcendental equations defined by Onoe and
Tiersten2 and have numerical values for PZT-8 of 2.171 and 2.045, respectively.
In terms of an aspect ratio G and a normalized frequency Z, defined by
G L Diameter H Height
Z = fH x 10-3 KHzmm, the uncoupled frequencies are
z
Za2= I f,,H )<10-312- 1 C11 x 10-6
G2172 P
Z,,2 = I MI x 10-12 C X,2
x 10-6 P
and the biquadratic equation is
-!. 2IZa2 + Zlyz] + (1 - S2)Zn2Z,l2 = 0.
10
8
E E
6
i
z_
= 4
2
o 1 ,
o 1 1, 1 1 1 1 1 1 1 1 1 1 1 1
2 3 4
Fig. 3-Real roots Z,, Z2, and Z3 as functions of GL(L/H of PZT-8 parallele- piped) for Gw = 1.
RCA Review Vol. 43 March 1982 61

E E
x
z_
_ x u.
10
8
6
4
2
0 1 1 1 :-_l 1 1
o I 2 3 4 5
Fig. 4-Real roots Z,, Z2, and Z3 as functions of GL(L/H of PZT-8 parallele- piped) for Gw = 2.7.
Fig. 5 is a plot of the two roots Z, and Z2 of the above biquadratic as a function of the aspect ratio G. For a thin disc, corresponding to a large value of G, the roots Z1 and Z2 tend, respectively, to the resonant frequencies corresponding to a pure thickness -dilatational mode of a disc, i.e., fb, and a pure radial mode of a disc. Similarly for a tall disc, corresponding to a small value of G, the roots Z, and Z. tend to the frequencies corresponding to a pure radial mode of a disc, i.e., fa, and a pure thickness -dilatational mode of a disc.
4. Subsidiary Resonances of a Piezoelectric Parallelepiped
4.1 Shear Modes
For the parallelepiped of Fig. 1 additional resonances will occur if the polarization has a net component in the X -Y plane. A drive field in the Z -direction will produce shear coupling due to the in -plane polar- ization. To a first order, the frequencies of the shear modes are related to the frequency of the main resonance (f2 corresponding to root Z2 in the Onoe-Tiersten model) by the ratio of the velocity of a shear to that of a bulk wave.' Thus two subsidiary shear resonances will occur
62 RCA Review Vol. 43 March 1982

E E
2
z_
I x
10
6
4
RESONANCE SPECTRUM
- z
o 2
i
4 6 8
ft
10
Fig. 5-Real roots Z, and Z2 as a function of the aspect ration G.
at frequencies of f,, and f,2 given by
For PZT-8 we find that
f.,., = 0.503f2
f..2 = 0.52112
4.2 Flexure Modes
The velocity of propagation G1 of flexure waves in a rectangular plate is'
C I
Y,a' J'/4w,i'
12p(1 - a-') '
where yo = Young's Modulus a = Plate thickness (assumed smaller than the lateral
dimensions of plate) p = density a = Poisson's ratio w = angular frequency
RCA Review Vol. 43 March 1982 63
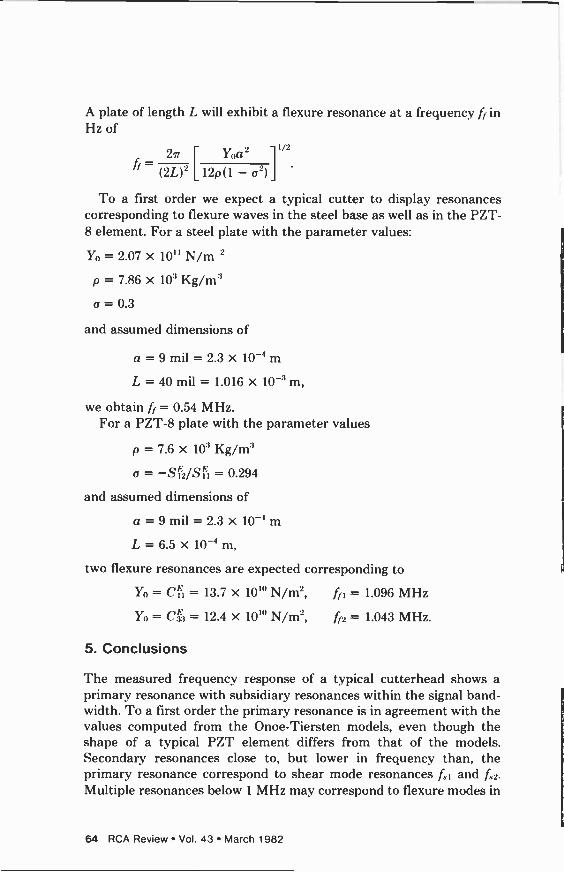
A plate of length L will exhibit a flexure resonance at a frequency ff in Hz of
2r, Yoa2 1/2
ff (2L)2 [12p(1 - (72)] .
To a first order we expect a typical cutter to display resonances corresponding to flexure waves in the steel base as well as in the PZT- 8 element. For a steel plate with the parameter values:
Yo = 2.07 x 10"N/m22
p = 7.86 x 10³ Kg/m3
= 0.3
and assumed dimensions of
a=9 mil =2.3x 10`'m
L = 40 mil = 1.016 x 10⁻³ m,
we obtain ff = 0.54 MHz. For a PZT-8 plate with the parameter values
p = 7.6 x 10³ Kg/m3
a = -SS/SF = 0.294
and assumed dimensions of
a=9 mil =2.3x 10-'m
L = 6.5 x 10-'m,
two flexure resonances are expected corresponding to
Yo = Cf, = 13.7 x 10'0 N/m2, ffi = 1.096 MHz
Yo = C13 = 12.4 x 10'0 N/m2, 112 = 1.043 MHz.
5. Conclusions
The measured frequency response of a typical cutterhead shows a primary resonance with subsidiary resonances within the signal band- width. To a first order the primary resonance is in agreement with the values computed from the Onoe-Tiersten models, even though the shape of a typical PZ'1' element differs from that of the models. Secondary resonances close to, but lower in frequency than, the primary resonance correspond to shear mode resonances f.,., and f,2.
Multiple resonances below 1 MHz may correspond to flexure modes in
64 RCA Review Vol. 43 March 1982
RESONANCE SPECTRUM
the individual elements-steel base and PZT-8-or in the cutter struc- ture as a unit.
Acknowledgments
The authors wish to thank J. Reisner, K. F. Etzold, and J. van Raalte for many fruitful discussions.
References:
E. O. Keizer, "Video Disc Mastering," RCA Review, 39, No. 1, p. 60, March, 1978. 2 M. Onoe and H. F. iersten, "Resonant Frequencies of Finite Piezoelectric Ceramic Vibrators with High Electromechanical Coupling," IEEE Trans. on Ultrasonics Engi- neering, p. :32, .July 1963.
Brush p.Clevite
Co.. "Piezoelectricity-Data Book for Designers". " W. P. Mason, Physical Acoustics, Vol. I, Part A, Academic Press, NY (1965). 51'. F. Hueter and H. H. Bolt, Sanies, J. Wiley and Sons, Inc., NY (1955). "J. H. Reisner, personal communication.
RCA Review Vol. 43 March 1982 65

Micromachining VideoDisc Grooves and Signals
J. Guarracini, J. H. Reisner, J. L. Walentine, and C. A. Whybark RCA Laboratories, Princeton, NJ 08540
Abstract-The very small scale of the grooves and signals cut for the VideoDisc places the initial mastering in the category of micro - machining. Grooves are only 0.5 µm deep, and 2.64 µm wide, while signals are 0.09 µm in amplitude. Metal cutting on so small a scale requires considerable refinement of established macro- scopic cutting techniques, as well as some new techniques, tools, and materials. Measurements have been made of cutter friction, work hardness, cutting forces, and shearing angles over a wide range of cutting conditions such as speed, rake angle, and depth of cut. The primary purpose was to determine the optimum con- ditions for cutting VideoDisc master substrates. Secondarily, the empirical data is necessary to establish a theoretical model of the cutting process. There are also specialized problems involved in
cutting for the VideoDisc, such as reliable chip pick-up and ac- curate following of irregular surfaces to maintain constant cutter depth, for which specialized mechanical solutions have been re- quired.
Introduction
The term micromachining seems appropriate to describe the cutting of grooves and signals for VideoDisc recordings when one remarks that the grooves are 2.64 µm wide, 0.5 µm deep and the signals are only 0.09 µm in amplitude. It is not surprising that the techniques used and the principles understood for cutting materials at a scale larger by 10 to 100 times or more do not apply directly to such micromachining.
66 RCA Review Vol. 43 March 1982

MICROMACHINING
Historically, the cutting of master discs in the audio record field has involved the use of a heated stylus cutting in a resinous material. Early attempts at transferring this technology to cut video discs was less than successful. In 1976 G. B. Halter' conceived and demonstrated the scheme for cutting electroplated copper with a KT -driver diamond cutter at megahertz rates. Halter's success quickly prompted major efforts in the development of cutters of improved performance and durability and in the study of means and materials to improve cutting technology and tools. 'I'his paper deals with the latter study in areas related particularly to what has been designated as micromachining.
The Cutting Process
Although the cutting of soft metals with diamond tools has been known for many years, the widespread usage of this technique did not commence in earnest until the early 1960's with the need for smooth aluminum substrates for memory discs. Subsequently a great impetus was also given to this technique by the need for faster methods of making mirrors.' The cutting of copper is particularly attractive in that the coefficient of friction of diamond on copper is relatively low, and the tendency to cause tool cratering and built-up edges is almost
.30
20
lo O, A - OPPOSITE DIRECTIONS (COLI NE AR r
X - ORTHOGONAL TO "O, A"
O 0 50 IOO 150
"N"- NORMAL LOAD IN GRAMS Fig. 1-Static coefficient of friction of the (1 10) face of diamond on electro-
lytic copper.
200
RCA Review Vol. 43 March 1982 67

nonexistent. The coefficient of friction of the material being cut on the tool is an important factor in how materials and tools behave. Pub- lished information is fragmentary and not directly applicable to sub- strate materials being used, so that some survey studies were made of friction of copper on diamond. Fig. 1 is a seies of curves showing the variations in the static coefficient of friction as a function of a force perpendicular to the sliding face. It is clearly evident that for a diamond with this particular (110) crystallographic orientation, the frictional properties against electroformed copper are not constant with either a normal force or direction of sliding. Fig. 2 is another static friction test with three diamonds (111 crystallographic plane) as the sliding face arranged in a triangular pattern and bonded to a glass plate. This procedure was necessary because a single diamond was too small to sustain stably a physically large weight on its face. The three diamonds were randomly oriented about an axis perpendicular to their sliding faces. Despite this, a difference appears to exist between the coefficients for the oppositely directed motions, with the orthogonal result somewhere between (similar to the curves in Fig. 1). For a more detailed discussion of frictional anisot ropy in diamond sliding refer to, e.g., J. E. Field's book The Properties of Diamond (Academic Press 1979). The next step is to determine the dynamic frictional properties under actual cutting conditions.
030
020
DRY (I I I ) DIAMOND FACE O N O
GLASS
F DIAMOND} (3) PADS
COPPER
COEFFICIENT OF FRICTION f = F
N
O, A -OPPOSITE DIRECTIONS - X -ORTHOGONAL TO O, A
IO 20 30 40 50 60 70 80 "N" -NORMAL LOAD IN GRAMS
90 100
Fig. 2-Static coefficient of friction of the (1 1 1) face of diamond on electro- lytic copper.
68 RCA Review Vol. 43 March 1982

M1CItOMACHINING
Another factor affecting cutting properties is the hardness of the material being cut. Electroplated cooper is particularly good in that grain size is in the sub -micrometer region and the surface hardness, about 180 to 230 on the Knoop scale, appears to he most satisfactoy for cutting. The ultimate test of the quality of the cut is done by
measuring the signal-to-noise ratio of a signal with a laser reader. The laser reader permits one to avoid touching the freshly cut surface before replication begins.
To enhance understanding of the cutting process, a number of tests were performed and measurements made of tangential cutting forces on a true scale. Knowledge of the level of forces involved was necessary to develop bonds adequate to prevent diamond loss during cutting. Fig. 3 shows some of the force measurements that were made. It is
immediately apparent from the curves shown that the back rake angle is a significant parameter in determining the cutting force. It is further evident that this tangential cutting force is nonlinear with cutting depth when cutting V -grooves. It should be mentioned here that there is little side rake to the tool. hence the cutting process resembles the classical orthogonal cutting procedure. Fig. 4 shows the small variation in tangential cutting force with cutting speed. At the present time the
140' DIAMOND ON DRY
8 ELECTROFORMED COPPER, NO OVERCUTTING,
1. 50- CUTTING SPEED= 3eo cm/sec
N Q,_lo z
40- a. 0° _
w o
E/ 30- Q.2'
z_
3 20- J 4 F Q= BACK RAKE ANGLES z
10- z 4 H
I 2 3
DEPTI- OF CUT IN MICROMETERS
Fig. 3-Cutting forces of a 140° V shaped diamond tool in dry electroformed copper with a cutting speed of 380 cm/sec.
RCA Review Vol. 43 March 1982 69
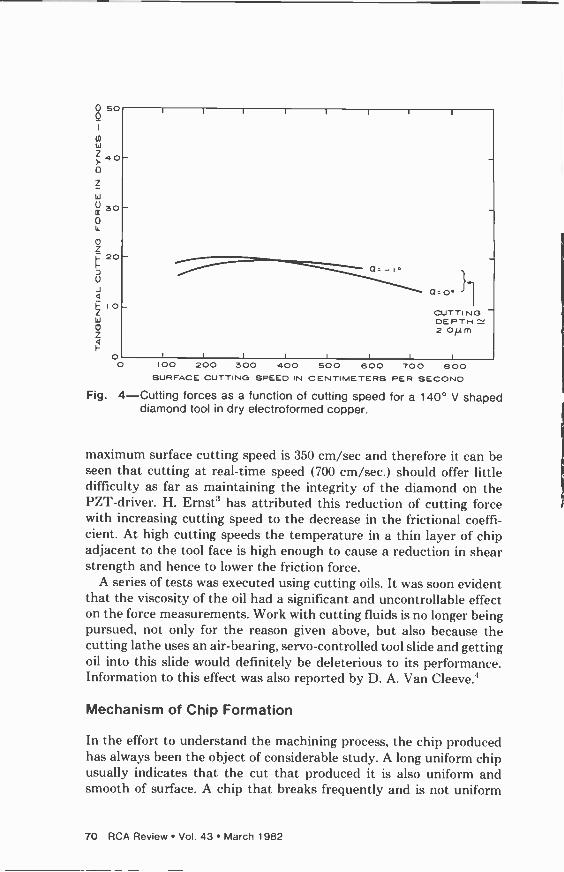
0 50 o
o
W
o Z 4 F
O O IOO 200 300 400 500 600 700 800
SURFACE CUTTING SPEED IN CENTIMETERS PER SECOND
Fig. 4-Cutting forces as a function of cutting speed for a 140° V shaped diamond tool in dry electroformed copper.
maximum surface cutting speed is 350 cm/sec and therefore it can he seen that cutting at real-time speed (70() cm/sec.) should offer little difficulty as far as maintaining the integrity of the diamond on the PZT-driver. H. Ernst" has attributed this reduction of cutting force with increasing cutting speed to the decrease in the frictional coeffi- cient. At high cutting speeds the temperature in a thin layer of chip adjacent to the tool face is high enough to cause a reduction in shear strength and hence to lower the friction force.
A series of tests was executed using cutting oils. It was soon evident that the viscosity of the oil had a significant and uncontrollable effect on the force measurements. Work with cutting fluids is no longer being pursued, not only for the reason given above, but also because the cutting lathe uses an air -hearing, servo -controlled tool slide and getting oil into this slide would definitely be deleterious to its performance. Information to this effect was also reported by I). A. Van Cleeve.4
Mechanism of Chip Formation
In the effort to understand the machining process, the chip produced has always been the object of considerable study. A long uniform chip usually indicates that the cut that produced it is also uniform and smooth of surface. A chip that breaks frequently and is not uniform
70 RCA Review Vol. 43 March 1982

MICROMACHINING
indicates a cut with surface flaws and irregularities. Even mild flaws and irregularities are undesirable in VideoDisc recording, as the signal detail in the grooves has an amplitude of about 900 A. The differences in shape and dimensions of the cross-section of the chip from those of the cut itself provide information on the mechanical properties of the metal being cut and the effect of cutting parameters such as speed, depth, and tool geometry.
A section of chip is very small; it is about 7 µm wide and 1.5 µm thick, and a continuous chip from the cutting of an hour-long record would be over 12 miles long. The cross section bears little superficial resemblance to the "V" groove (which is about 0.5 µm deep and 2.6
µm wide) that is left in the record. The tool used for VideoIisc cutting is V shaped with a 140° angle to the V. The cut is generally made so that the apex of the tool is approximately 2 µm below the surface of the metal disc that it is cutting. Under such circumstances the chip has a " V" shaped cross section and is 11 µm wide if the pitch of the spiral is such as to keep the successive turns from overlapping (Fig. 5A). This kind of cut is produced in what is termed the "fast spiral".
DIAMOND CUTTER
CROSS SECTION OF METAL REMOVED FROM SURST RATE
T
DISC TURNING INTO PAGE CUTTER -RAVERSING
GROOVE DEPTH 0.5 p m
2
PLANE OF SURFACE I- BEING CUT
SUBSTRATE
CROSS SECTION OF METAL REMOVED FROM SUESTR ATE
DIAMOND CUTTER
OR WIDTH OF Cmi
P 1//
T - - DEPTH OF
2.67 f.(.m CUTTER GROOVE DEPTH OF
CUT WIDTH o9/ym
Fig. 5-Cross section of the diamond cutter in the substrate it is cutting for; (5A) a V -cu, (fast spiral), and (5B) an overcut (program recording).
RCA Review Vol. 43 March 1982 71

It is cut between the end of the program material on a record and the final inside turns cut on the disc. The situation is very different when recording program material. Then the pitch or tightness of the groove spiral is such that the cutter advances only 2.64 µm per turn so that a new cut overlaps the preceding cut. In this way the record grooves are actually cut in a plane 2µm below the original surface of the metal disc. Fig. 5B shows a section through the face of the cutter in the program recording mode, while Fig. 6 shows the same situation (with more perspective).
The cutting of the metal master for recording is on the order of 100 times smaller than considered in previous studies of the cutting process of diamond tools on common metals.' While cutting dimensions can be scaled down by a known amount, the change in scale of micro- crystaline structure of the metal used in mastering has not as yet been accurately established. Since micromachining obviously represents a major change from conventional machining practice, a number of studies have been conducted to establish the cutting conditions to he used.
The cutting process involves shearing the metal from the edge of the cutting blade to the surface of the metal ahead of the edge as postulated in Merchant's thin zone theory.' This is shown diagram- matically in Fig. 7 along with the shear angle and the rake and clearance angles. The shear angle is primarily determined by the mechanical properties of the metal being cut. Fig. 8 shows how the VideoDisc chip takes form in program recording (see also Fig. 6). Fig. 9 is a scanning electron microscope view of a loop in such a chip
CUTTER AXIS
GROOVE WIDTH
DEPTH OF CUTTER
DEPTH OF CUT
i--_- .
GROOVE DEPTH
CENTER
0/DISC
UNCUT SURFACE
i DISC MOTION
Fig. 6-Perspective of the cutter rake in a substrate while cutting program.
72 RCA Review Vol. 43 March 1982

CUTTER a
MICItOMACIIINING
' SURFACE
1, OF MASTER
RECORDING MASTER DIRECTION OF MOTION
1, = DEPTH OF CUT
t,= CHIP THICKNESS
= SHEAR ANGLE
a = RAKE ANGLE
Fig. 7-Cross section along a groove showing the chip being removed.
showing both sides. The smooth side was pressed flat against the diamond by pressures of the order of 105 psi. The side with the signals is more complex in origin. There are two sequences of signals as seen
in the lower micrograph of Fig. 10. The well defined signals along the upper half of the chip were cut in the substrate on the previous turn and are on t he side of the chip away from the center of rotation of the substrate. On the other side of the chip, toward the center of the recording (bottom of Fig. 10), a portion of the chip one groove wide shows an undulation that is the result of the shearing point occurring at different depths in the substrate as the cutter moves up and clown
with the applied electrical signal. This surface undulation actually occurs all across the chip. It is clearly visible in the portion of the chip from the previously uncut area, but in the area of the chip where the surface was cut with a signal on the previous turn the shear undulation interferes with the previously cut signal. When the interference of the cut signal and the sheared undulation are in phase they reinforce one
another and give a deep well defined signal, as in Fig. 10. When they are out of phase, the signals oppose and the signals on the surface are more poorly defined. The chip shears in a direction perpendicular to the cutting edge. With a V cut, this sends the chip straight up the cutter. However, with the overcut the chip direction is tilted toward the outside of the record as shown in Fig. 8. The chip in taking a
trajectory over the cut grooves must be prevented from contacting and possibly damaging the already cut grooves. Chips for study are usually cut with a 2.5 MHz signal.
The Chip As a Measure of Cutting Performance
The chip bends quickly on the diamond cutter face, contacting it for about a micron and then curling hack in the opposite director. There
RCA Review Vol. 43 March 1982 73

I CUTTER AXIS CHIP COMES OFF of AT AN ANGLE
I
HIP BUCKLES \\ I
SIGNALS PRESSED OUT ON CUTTER SI
CHIP THICKNESS
THESE SIGNALS ARE SHEARED THROUGH ON THE PRESENT TURN
CENTER OF DISC
UNCUT SURFACE
/ i i r- SIGNALS CUT ON / PREVIOUS TURN
DISC MOTIOA{ / ///////
Fig. 8-A sketch of a chip moving up the face of a cutter. Compare to Fig. 6.
it is picked up in a flow of air from a jet to a vacuum orifice where it is removed from the recorder. An experienced operator can often tell from the stability of the chip motion, or lack of it, how well the cutting process is proceeding. The height of the trajectory is affected by the chip removal air flow and by the rake angle of the cutter. For sampling the chip, a small air lock in the chip -pick-up vacuum line permits insertion of a Q -tip which collectes a small amount of chip in the form of a metal wool as seen in the upper micrograph of Fig. 10.
To measure the angle of shear in a normal turning operation, a section of chip is measured for thickness 19, as is the depth of cut t, Then, according to Merchant,' the shear angle is given by the equation
r cos a tan> -
1 - r sina
where r is the ratio of 11112, 4 is the angle of shear, and a is the rake angle. Because t2 is difficult, if not impossible, to measure on the minute chips obtained from cutting a VideoDisc, another system was devised that works very well on micromachining and might he a very useful technique for macroscopic measurements as well. It is based on two assumptions; (1) that mass (and density) are conserved and (2) that the width of the chip does not change in cutting. This later assumption has been verified for 7 tam chips and is a major reason to
74 RCA Review Vol. 43 March 1982

MICROMACHINING
2.5MHZ
.1
SP235A ON WK1262 11/20/80 ERG 30KV X4460 10U 015 ri.
Fig. 9-A loop in a chip from a VideoDisc showing the smooth and signal sides.
assume the validity of Merchant's thin -zone theory.' This means that t111 = t212 where t, and t2 are as defined above and 11 and /2 are the movement of the disc and the movement of the chip in a given interval of time.
If the frequency of signals recorded and observed on the chip are fixed, e.g., 2.5 MHz, then the wavelength on the chip, Az, and the wavelength on the record, A,, give the relationship A,/A2 = t2/t, and r = A2/A,. In practice the wavelength on the record is calculated since the radius at which the cut produces the chip is always known.
The master surfaces (of fine grained copper) that are cut have a Knoop hardness in the range of 180 to 230. Such cutting media give shear angles of about 35° at a rake angle of 0°. Fig. 11 shows measure- ments of the shear angle as a function of the rake angle for a particular copper master. The hardness limits for good cutting are not well defined. Well outside these limits, on very soft materials, the signal on the chip become pressed together as in Fig. 12 where the shear angle was only 24°. Also the chip does not coil up smoothly as for normal material (Fig. 13) but buckles repeatedly. At the other extreme, well above the hardness range specified, the chip breaks frequently and a
continuous chip is impossible. Apparently the rake angle is very uncritical to the smoothness of the grooves and signals cut in the substrate. In general a negative rake produces a very smooth surface
RCA Review Vol. 43 March 1982 75
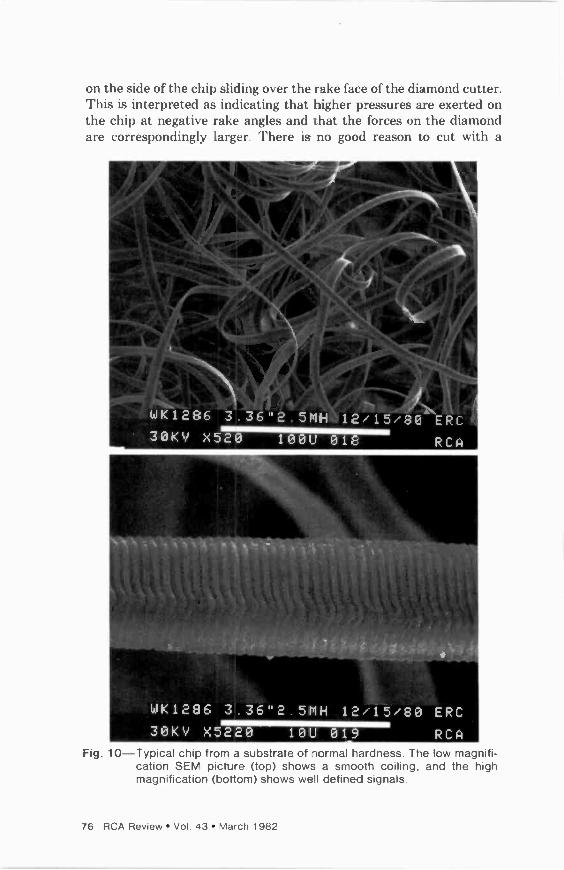
on the side of the chip sliding over the rake face of the diamond cutter. This is interpreted as indicating that higher pressures are exerted on the chip at negative rake angles and that the forces on the diamond are correspondingly larger. There is no good reason to cut with a
1
cam
f ='
. ;
/
WK1286 3.36"2.5MH 12/15/80\ERC 30KV.X520 1000 018. RCA.
WK1286 31.36"2.5MH 12í15i80 ERG 30KV X5220 10U' 019 RCA
Fig. 10-Typical chip from a substrate of normal hardness. The low magnifi- cation SEM picture (top) shows a smooth coiling, and the high magnification (bottom) shows well defined signals.
76 RCA Review Vol. 43 March 1982

MICROMACHINING
negative rake, and in light of greater force on the diamond the negative rake has not been used.
A wide range of positive rake angles (0 to +10°) was explored. No cutting problems were experienced. In all cases the grooves ana signals appeared smooth to the limits of the SEM examination. However, an unnecessarily large rake angle has two adverse affects. It takes the signal out of the vertical ZY plane and spreads it out in the X -direction with respect to a playback stylus whose electrode is essentially in the ZY plane. The tolerance for the cutter face to be aligned with the Y
43
W41
W
W Q 39 W J
37
Q W I (1) 35
33 -6 -4 -2 0 2 4 6
RAKE ANGLE (DEGREES)
Fig. 11-The shear angle as a function of the rake angle of the cutter.
B lo a
axis (radius) is 1° or less. A 4° rake angle causes a similar spread out of the signal in the X -direction. The second factor limiting the rake angle is that the rake angle must occur at the expense of either the dihedral angle that forms the diamond edge or bf the clearance angle required for the cutter to clear the slope of the signal it has just cut.
Other cutting conditions in addition to rake angle have been tested, and they are all relatively uncritical over the range of parameters exercised. During these tests the rake angle was held at +0.3° ± 0.2°. The chips showed no appreciable differences with cutting speeds ranging from a speed of 60)0 cm/sec down to 150 cm/sec. For conven- tional machine shop work 600 cm/sec is very fast. The quality of the
RCA Review Vol. 43 March 1982 77

cuts in the substrate showed no appreciable differences with speed. Cuts were made with the apex of the cutter penetrating 1, 2, and 4µm into the substrate and a cutting speed required for half -real-time recording. Such a range represents a spread of values around the nominal depth of 2 to 3µm. Examination of the chips showed no differences in the quality of the signals. The shear angles were identical. Only the width of the chip and its shape were different.
A distinction is made between depth of cut and depth of cutter (Figs. 5 and 6). The depth of the cutter is described above as the
ar
2795 R=5" 2.5MHZ 11/26/80 ERC 30KV X52.20 10u 015 LT' C1
Fig. 12-Signal on chip cut on very soft material.
A distinction is made between depth to cut and depth of cutter (Figs. 5 and 6). The depth of the cutter is described above as the distance from its apex to the uncut plane of the master. The depth of cut is the perpendicular distance of the cutter edge to the surface cut on the previous turn. Since the cutter rake face always has an included angle of 140° and since the pitch of the normal cut always advances the cutter 2.64 µm each turn, the depth of cut is always about 0.9 pm. However, to determine whether this depth was a rapidly changing parameter, cuts were made at twice the regular pitch distance 5.3 µm. The cutter depth was 2 in both cases. The chip thickness was doubled. If cut well, although the chip was much stiffer, the shear
78 RCA Review Vol. 43 March 1982

MICFtOMACHINING
angles were identical with those of a standard pitch cut. Again no
appreciable changes were observed. It is interesting now to contemplate the V or fast spiral cut described
earlier (Fig. 5). A chip from a V cut is shown in Fig. 14. Since the cutter is symmetrical and is cutting a new surface, the chip is sym- metrical and does not curl in the usual spiral from the overcut grooves.
,F
-
-^ a-%' -. ; '
c
R- - J`
2795 R=5" 2.5MHZ 11/26780 -ERC
30KV X525 1000 017 Fig. 13-Chips from abnormally soft substrate. Compare to Fig. 10 of a
normal chip.
The signals seen on the chip represent the different thicknesses of the chip that result from the up and down motion of the cutter due to the applied signal. The chip is thicker when the cutter is down than when
the cutter is up. This difference in thickness is flattened against the rake face of the cutter and shears through the chip to form the undulations on the outer face of the chip. All the signals thus formed on the V chip are similar to those formed in the previously uncut area of the overcut chip (Figs. 9, 10). Since the shearing changes due to cutter signals occur simultaneously at the surface of the master, they appear roughly perpendicular to the chip length. They are less well
formed than the signals of an overcut chip which are actually cut into the master on the preceding cut. The rounding of the chip at what should be the apex of the V, which corresponds to a very sharp V in
RCA Review Vol. 43 March 1982 79
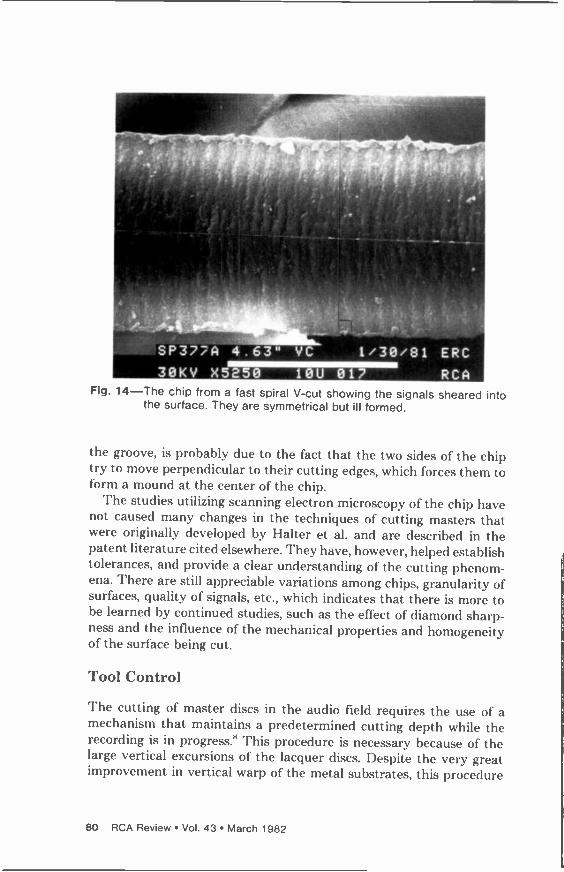
r.
SP377A 4.x63" VC" L/30/81 ERC 30KV X5250 10U 017 . RCA
Fig. 14-The chip from a fast spiral V -cut showing the signals sheared into the surface. They are symmetrical but ill formed.
the groove, is probably due to the fact that the two sides of the chip try to move perpendicular to their cutting edges, which forces them to form a mound at the center of the chip.
The studies utilizing scanning electron microscopy of the chip have not caused many changes in the techniques of cutting masters that were originally developed by Halter et al. and are described in the patent literature cited elsewhere. They have, however, helped establish tolerances, and provide a clear understanding of the cutting phenom- ena. There are still appreciable variations among chips, granularity of surfaces, quality of signals, etc., which indicates that there is more to be learned by continued studies, such as the effect of diamond sharp- ness and the influence of the mechanical properties and homogeneity of the surface being cut.
Tool Control
The cutting of master discs in the audio field requires the use of a mechanism that maintains a predetermined cutting depth while the recording is in progress.' This procedure is necessary because of the large vertical excursions of the lacquer discs. Despite the very great improvement in vertical warp of the metal substrates, this procedure
80 RCA Review Vol. 43 March 1982

Jl ICKOJ1AC111 V l \G
is still a necessary requirement because of the microscopic tolerances involved in mechanical cutting.
The "advance ball" is the mechanism referred to above, and, although it is adequate for its application on audio masters, it can not be used on the VideoDisc substrate surface for fear of marring the super finished surface into which the modulated grooves are cut. There originally appeared to be two choices for depth control of the cutting tool. The first involved the use of a contoured foil -like slider running close enough to the surface of the disc to develop an aerodynamic film capable of supporting the entire tool holder. Unfortunately, the mass of the tool structure and the relatively low speed made the design of this system impractical. The second choice provides tool depth control through a hydrostatic thrust bearing. These devices are often called "pucks". Such a control offers a number of advantages: (1) high load -carrying capacity at all speeds, including zero speed, (2) no starting friction and extremely low running friction, (3) no metal -to -metal contact at any operating speed or load, and (4) adjustable bearing performance with regard to load -displacement
charcteristics. Two variations of a hydrostatic hearing (the "puck") have been
constructed and are presently being used. The earlier design used was of the multiple orifice type which utilized a porous metal structure to achieve load/flow control. While simple in concept, the difficulty in
finding uniformity of porous metal led to the use of the more predict- able conventional pocket type. The porous puck is used in a standard parallelogram type of spring structure that permits of only one degree of freedom, i.e., vertically. The pocket type uses a spherical -ended air - feed that permits the puck additional angular degrees of freedom to improve its alignment with the surface of the substrate.
Thepocket type of design was based in the work of H. C. Rippel". His design involved the use of bearing pad coefficients that were obtained using linear pressure -drop approximations and was based on the electrical conducting sheet analogy.
An important parameter of this type of bearing is its load carrying capability. Fig. 15 shows experimental data obtained with both types of pucks. At a film thickness of 10 micrometers, film stiffness for the porous type is 2.5 x 10' dynes/mm and for the pocket type is 3.0 x 10'
dynes/mm. These are maxima and are respective tangents to the steepest portion of the curves shown in Fig. 15.
In a further step toward achieving a high dynamic rsponse, and to use the puck most effectively, the moving mass of the tool structure was designed to have a low value.
If one compares the equivalent spring rates of the air film and that of the suspension, i.e., :3.0 x 10' dynes/mm versus 4.4 x 10r, dynes/
RCA Review Vol. 43 March 1982 81

} o
Z
o 4 0 J
5 IO 15 FILM THICKNESS IN MICROMETERS
Fig. 15-Puck stiffness characteristics.
20
mm, one finds a difference of about 70. It would appear then that the stiffness of the air film beneath the puck is not being fully used. The limiting factors in the vertical response are to be found in both the spring suspension and the mechanical linkage between the puck and the cutting tool. There are a number of' friction points in these links and possible sources of lost motion between the puck and the cutting tool.
One of the most important requirements in micromachining is precise tool control, with motions in very small increments. A typical full depth of' cut is approximately 3 micrometers, and this depth is achieved by moving in increments of perhaps 0.5 micrometers at a time. A smooth nearly friction -free motion is obtained by varying the amount of' air with a needle valve that is in series with both the puck and a tlowmeter. It is a characteristic of a hydrostatic puck that the air film thickness is a nearly linear function of air flow through the puck. As the film thickness changes, the resulting vertical position changes of the puck are communicated via mechanical linkage to the cutting tool. Fig. 16 shows a graph of air flow versus film thickness for both the single orifice and the porous puck types. A graph such as this serves as a calibration chart in that a mere glance at the tlowmeter tells one at what height the puck is "flying". A touch -down of the puck on the substrate will damage the surface and result in a rejected disc.
82 RCA Review Vol. 43 March 1982

MICROMACHINING
W
F 5
z_
E 4 W a.
ID
3 IJ
J
z - 2
o J L
O
POROUS TYPE - 110 GRAM LOAD
x SINGLE ORIFICE TYPE -400 GRAM LOAD
5 IO 15
FILM THICKNESS IN MICROMETERS
Fig. 16-Puck air flow as a function of film thickness.
References
' .1. B. Halter, "Apparatus for Electromechanical Recording of Short Wavelength Mod- ulation in a Metal Master," U.S. Patent No. 4,035,590 (1977). 2 J. M. Casstevens, "Development of a One Microinch (250A) Spindle for Diamond Turning of Optics," Proc. Soc. of Photo -Optical Instrumentation Engineers, 159, Precision Turning of Optics, Aug. 1978, San Diego, Calif. "H. Ernst, "The Physics of Metal Cutting," The Cincinnatti Milling Co. (1938).
I). A. Van Cleve, "Diamonds Give the Ultimate in Precision Machining," iron Age, June 1977. `' M. E. Merchant, "Comparative Cutting Tests of a Diamond Tool and a High Speed Tool," Industrial Diamond Review, 4, p. 119, (1944).
M. E. Merchant, Journal Appl. Meeks., 66, 1944. ' I. Gorog, "Optical Techniques Developed for the RCA VideoDisc," RCA Review, 39, 162. (1978). G. R. Yenzer, "Lateral Feed -back Disc Recorder," Disc Recording and Reproduction,
H. E. Roys e(1., Vol. 42, Dowden, Hutchinson, and Ross, Inc., Stroudsberg, Pa. (1978) Distributed by Academic Press). H. C. Rippel, "Cast Bronze Hydrostatic Bearing Design Manual," Cast Bronze Bearing
Institute, 1964.
RCA Review Vol. 43 March 1982 83

A Method for the Characterization of Piezoelectric VideoDisc Recording Heads Using a Bridge Circuit
G. A. Alphonse RCA Laboratories, Princeton, NJ 08540
Abstract-There is a need to measure or monitor the displacement response of VideoDisc recording heads during construction, testing, equal- ization, and actual recording. Also the equivalent circuit is needed for the design of a suitable equalizer. The displacement is typically less than 1000 A, and direct measurement requires the use of cumbersome interferometric equipment. From known electrome- chanical correspondence in piezoelectric devices, measurements in only one domain (either electrical or mechanical) are sufficient to obtain all the device parameters using suitable conversion factors. This paper describes an electrical method using a bridge circuit to monitor the response as well as to obtain the equivalent circuit. It has been used successfully to characterize hundreds of recording heads, and it compares well with optical interferometric methods.
1. Introduction
In VideoI)isc recording, the recording head or cutter head is used to encode the video electrical signal as depth variations in a groove of a rotating substrate. In its simplest form a typical cutterhead is shown in Fig. 1. It consists of a piezoelectric element mounted on a metal base on one side, and attached to a diamond cutting tool on the other side. The parallel surfaces are metallized and connected to a signal source. The application of a voltage VT to the electrodes results in a
84 RCA Review Vol. 43 March 1982
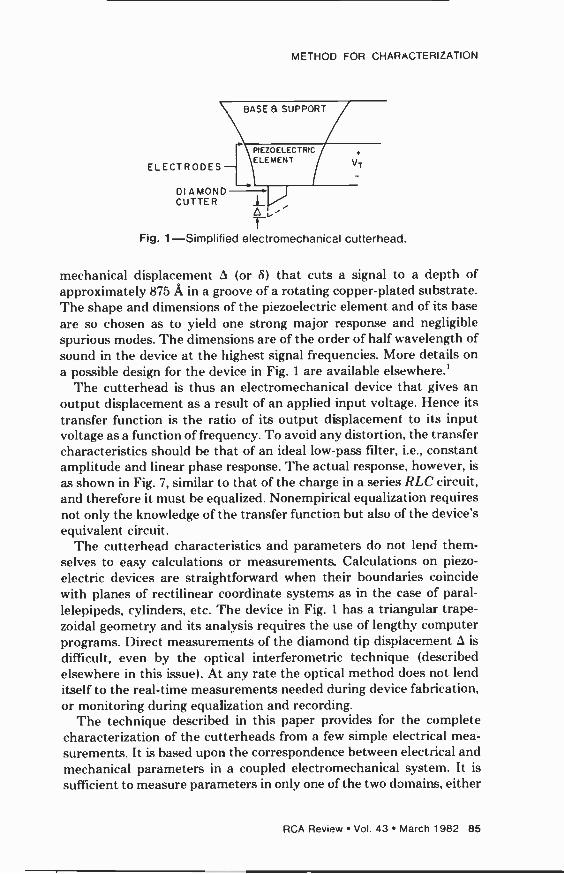
ELECTRODES - DIAMOND CUTTER
METHOD FOR CHARACTERIZATION
BASE 8 SUPPORT
PIEZOELECTRIC ELEMENT
I T
Fig. 1-Simplified electromechanical cutterhead.
VT
mechanical displacement 3 (or 8) that cuts a signal to a depth of approximately 875 in a groove of a rotating copper -plated substrate. The shape and dimensions of the piezoelectric element and of its base are so chosen as to yield one strong major response and negligible spurious modes. The dimensions are of the order of half wavelength of sound in the device at the highest signal frequencies. More details on a possible design for the device in Fig. 1 are available elsewhere.'
The cutterhead is thus an electromechanical device that gives an output displacement as a result of an applied input voltage. Hence its transfer function is the ratio of its output displacement to its input voltage as a function of frequency. To avoid any distortion, the transfer characteristics should be that of an ideal low-pass filter, i.e., constant amplitude and linear phase response. The actual response, however, is
as shown in Fig. 7, similar to that of the charge in a series RLC circuit, and therefore it must be equalized. Nonempirical equalization requires not only the knowledge of the transfer function but also of the device's equivalent circuit.
The cutterhead characteristics and parameters do not lend them- selves to easy calculations or measurements. Calculations on piezo- electric devices are straightforward when their boundaries coincide with planes of rectilinear coordinate systems as in the case of paral- lelepipeds, cylinders, etc. The device in Fig. 1 has a triangular trape- zoidal geometry and its analysis requires the use of lengthy computer programs. Direct measurements of the diamond tip displacement .5 is
difficult, even by the optical interferometric technique (described elsewhere in this issue). At any rate the optical method does not lend itself to the real-time measurements needed during device fabrication, or monitoring during equalization and recording.
The technique described in this paper provides for the complete characterization of the cutterheads from a few simple electrical mea- surements. It is based upon the correspondence between electrical and mechanical parameters in a coupled electromechanical system. It is
sufficient to measure parameters in only one of the two domains, either
RCA Review Vol. 43 March 1982 85

electrical or mechanical, and then use a suitable conversion factor to obtain the actual counterpart in the other domain. In particular, the mechanical displacement is the counterpart of a component of electri- cal charge, and this paper identifies and measures the charge compo- nent in the equivalent circuit of the cutterhead that corresponds to the displacement. It then describes a bridge to measure the charge and describes methods to calibrate the bridge, convert charge to displace- ment, obtain the equivalent circuit parameters, and completely char- acterize the cutterheads.
2. Cutterhead Equivalent Circuit
The correspndence between electrical and mechanical systems is shown in Table 1. Voltage, current, and charge correspond to force, velocity, and displacement, respectively. Inductance, capacitance, and resistance correspond to mass, compliance, and damping, respectively. Energy relations and equations of motion are the same in both systems.
In a cutterhead, the driving voltage causes a displacement of the diamond tip. This must cause an extra charge, called "motional charge," to flow into the device from the signal source, in addition to the capacitance charge due to the dielectric. To identify the motional charge and determine the means of measuring it, the cutterhead's equivalent circuit is needed.
The choice of the equivalent circuit and the values of the compo- nents depend upon the configuration of the device. Although the major response is determined by all the dimensions of the device, the design is optimized by choice of geometry and acoustic loading, or damping, so that the displacement is mainly along the thickness, i.e., in the direction normal to the electrode surfaces. Experimentally it is found by optical probing' that the thickness displacement spectrum has one broad major resonance that is quite smooth and extends from dc to slightly beyond that major resonance. Hence the equivalent circuit is that of a mechanically -loaded thickness -vibration transducer" having only one main mechanical resonance.
Such an equivalent circuit is shown in Fig. 2 and is considered to be valid from dc to approximately 1.2 f., where f., is the resonant frequency. It consists of a electrical port and a mechanical port connected by means of a transformer. The electrical side contains the transducer's "clamped" capacitance Ce,, a shunt conductance Go responsible for some dielectric loss, and the negative capacitance -C in series with the transformer's primary. The mechanical side is represented simply by a series resonance consisting of a mass M proportional to that of the transducer, a stiffness parameter K related to the piezoelectric
86 RCA Review Vol. 43 March 1982
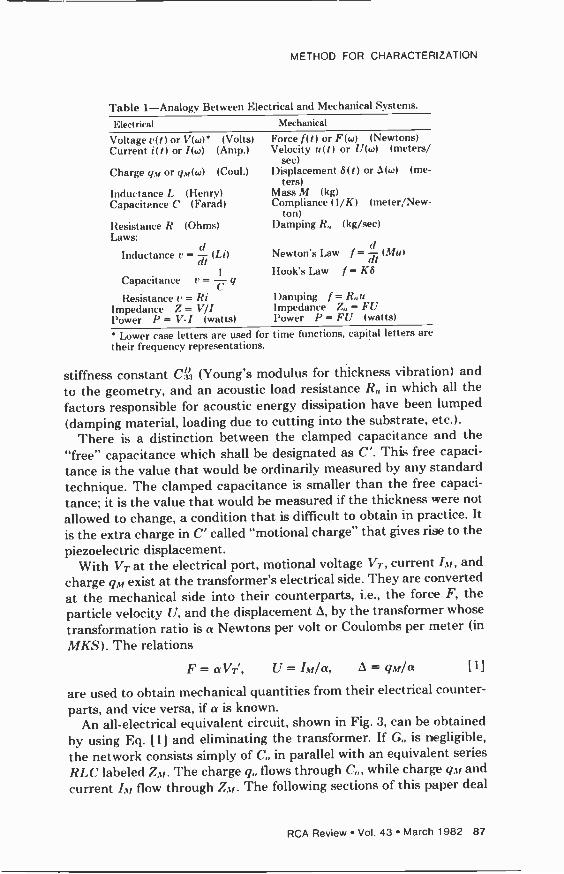
METHOD FOR CHARACTERIZATION
Table 1-Analogy Between Electrical and Mechanical Systems.
Electrical Mechanical
Voltage v(t) or I'M' (Volts) Current i(t) or /(w) (Amp.)
Charge (pi or y,,t(w) (Coul.)
Inductance L (Henry) Capacitance C (Farad)
Resistance 1? (Ohms) Laws:
Inductance ¿' = (Li)
Capacitance u = C
Resistance n = Hi Impedance Z = 171 Power 1'= V1 (watts)
Force f(t) or F(w) (Newtons) Velocity u(t) or U(.') (meters/
sec) Displacement 8(t) or .1(w) (me-
ters) Mass .1/ (kg) Compliance (1/ti) (meter/New-
ton) Damping R (kg/sec)
Newton's Law f = (Mu)
Hook's Law f = KO
Damping f = Ru Impedance Z = FU Power 1' = FU (wat ts)
Lower case letters are used for time functions, capital letters are
their frequency representations.
stiffness constant CI (Young's modulus for thickness vibration) and
to the geometry, and an acoustic load resistance R in which all the factors responsible for acoustic energy dissipation have been lumped
(damping material, loading due to cutting into the substrate, etc.). There is a distinction between the clamped capacitance and the
"free" capacitance which shall be designated as C'. This free capaci-
tance is the value that would be ordinarily measured by any standard technique. The clamped capacitance is smaller than the free capaci-
tance; it is the value that would be measured if the thickness were not
allowed to change, a condition that is difficult to obtain in practice. It
is the extra charge in C' called "motional charge" that gives rise to the
piezoelectric displacement. Wíth VT at the electrical port, motional voltage Vr, current I.t,, and
charge y.t, exist at the transformer's electrical side. They are converted
at the mechanical side into their counterparts, i.e., the force F, the particle velocity U, and the displacement .5, by the transformer whose
transformation ratio is a Newtons per volt or Coulombs per meter (in
MKS). The relations
F=oVT, U=h,/a, L1=yr/a [11
are used to obtain mechanical quantities from their electrical counter-
parts, and vice versa, if a is known. An all -electrical equivalent circuit, shown in Fig. 3, can be obtained
by using Eq. [ 1 J and eliminating the transformer. If G is negligible,
the network consists simply of C in parallel with an equivalent series RLC labeled ZA,. The charge q flows through C, while charge q.t, and
current It, flow through ZA,. The following sections of this paper deal
RCA Review Vol. 43 March 1982 87

VT
I,a -Co M K T I I 1+ u
TqMM vT
F A
ELECTRICAL E/M MECHANICAL TRANSFORMER
Fig. 2-Cutterhead equivalent circuit with electrical and mechanical ports.
with methods for measuring q.; and a, from which 1, as well as the parameters of the equivalent circuit of Fig. 3, can be obtained.
3. Principle of the Bridge Measurements
The total charge qr in the equivalent circuit of Fig. 3 is the sum of q and q.t,. To measure q.ti,, a test set-up is needed that can measure qr - q. Such a set-up is the bridge circuit shown in Fig. 4. One arm of the bridge consists of the cutterhead in series with a fairly large capacitor CA,. The other arm consists of an adjustable reference capacitor C, in series with another capacitor of value equal to C.t,. The voltages V, and V2 are connected to a high input impedance differential amplifier of gain G. The total cutterhead charge flows through C.,, at V, so that VI =- (q.,, + q)/C.v. If C, = Co and if Cu > G then essentially q flows through C and V2 = q/C.t,. The output voltage of the amplifier is then V = G(V, - 172) _ Gq.t,/C.,,, giving
C.V Ct,V q.0 = or 9 - aG .
[2]
A useful variation of this bridge system, shown in Fig. 5, has been proposed by R. Truesdell et al.4 It takes advantage of the fact that a transformer is normally used to step up the voltage to drive the cutterhead. Due to the polarity reversal in the transformer configura- tion, the charge tapped by C, is -q if Cr = nC, where n is the transformer's turns ratio. Thus only q,,, flows through C.,, and the amplifier output and the displacement are again given by Eq. 12]. This circuit configuration will be used for the rest of this paper.
It was mentioned earlier that C is difficult to measure. How then can C, be adjusted to correctly give q.,,? The adjustment is made from considerations of the known frequency respone of series RLC circuits represented by Zn,, which can be shown to be, for Z,,, in Fig. 3,
QCI VTI I gm(w) I f ( l, I Y
1 4.4,/ + wsz J
L31
88 RCA Review Vol. 43 March 1982

METHOD FOR CHARACTERIZATION
-Mcz2 C. CoCa La
+ Q 1Q0 IM au VT
CO QM=C1
Z M
Co -C o
2 ; Ca. /K
Fig. 3-All electrical equivalent circuit.
where w = 27rf, co = 27rf., where f is the frequency, f the resonant frequency, and where Q is the quality factor given by f,/.5f, where ..5f
is the 3 -dB bandwidth of 7,,,,. From Eq. 131 it can be seen that the ratio of I y.t, l at do to its value at resonance is just 1/Q or .5f/f giving
q.v(I)C) = j yer(w.,). 141
Eq. 141 is used to obtain the correct setting for Cr. Using the circuit of Fig. 5, a swept signal is applied to the primary of the transformer and the resonant frequency f and the 3 -dB bandwidth are recorded. Adjustment of Cr causes the whole response curve to tilt with respect to the peak at f, which remains fixed. The correct value of Cr and the proper frequency response are obtained by varying Cr until the mag- nitude of the portion of the curve near do is less than the peak by the ratio shown in Eq. 14 J. It should be noted that this adjustment also gives the value of Co, since Cr, which can be directly measured, is nCo.
4. Determination of a and of the Other Parameters
To convert gm into actual displacement, the value of the electrome- chanical transformation factor a must be obtained. For devices having simple geometry that factor can be easily calculated. Thus for a thin thickness vibration piezoelectric plate' having cross-section areas S much larger than the thickness d,
S s 151
where h', = .l - e s3/e; 3 is the electromechanical coupling factor, e the permittivity of free space, el3 is the clamped dielectric constant for that mode of vibration, and 43 the free dielectric constant. Eq. 151
cannot be used in this work because the geometrical factor S/d is not well defined for the cutterhead. This factor can be eliminated by using C' = ee:,S/d for the free capacitance, C = ee%,S/d for the clamped
RCA Review Vol. 43 March 1982 89

CUTTERHEAD
r- - - - - -i 4
i aMc7 i _z VT l ZM Col o-, Cr=Co _ I I L__ __J V2
V QM +Qpi C. gol C M
CM
Fig. 4-Bridge circuit for measuring motional charge (displacement).
capacitance, giving
Thus
k,= I - C/C'. 161
= AC'k, v i - k, 17]
where A = i, sr Caa/EE as
Hence it is sufficient to measure C and C' and use Eqs. 161 and 171 to obtain o. The value of C' is obtained by simply measuring the capacitance between the cutterhead terminals on a capacitance bridge. Typical values for standard 1/2 real time cutterheads is 7.2 pf. As mentioned earlier, C is obtained by measuring Cr. Although C can be measured by removing it from the circuit, the method of substitution was experimentally found more accurate. After adjusting C,, the cutterhead is removed from the test set-up and replaced by a dummy variable capacitor. With the sweep signal applied, the dummy is adjusted until a null output is obtained at V of Fig. 5 at all frequencies, at which time its value is equal to C. It can then be removed and measured without disturbing the test set-up.
The remaining components of the equivalent circuit are obtained in a straightforward manner. 'Their knowledge is useful for the design of the equalizer. From the observed output voltage V(w.,) of the test set- up at resonance and from the known applied voltage V, at the transformer's secondary (Fig. 5), Eqs. 121 and 131 give
C-V(w..)C.t. QGV, 181
l'hen
L=
90 RCA Review Vol. 43 March 1982

METHOD FOR CHARACTERIZATION
Cr=nCo
-qo
. Íi....-
-CUTTERHEAD l:n I
VM I
VT 1----1 - ZIT CN
Vo=G CM
- -
Fig. 5-Truesdell's version of the bridge.
w.,L - Q. If the dielectric loss is desired, the conductance G, given by
G=wCtan', must he used as in Fig. 2, where tan S is the loss tangent of the dielectric. This conductance does not appreciably affect the displace- ment at moderate voltages, but is a major source of heat under normal operating conditions.`'
5. Experimental Set-up, Procedure and Results
In general both the magnitude and the phase responses a e needed. If a network analyzer is not available, a set-up using a gain -phase meter such as the HI'3575A can be used. It takes two input signals A and B
and can be configured to give two outputs, the magnitude of A and the phase difference between A and B. A complete test set-up using this instrument is shown in Fig. 6. The sweeper signal is split between a
"signal channel and a "reference channel, and the channel outputs are fed to the A and B inputs of the gain -phase meter. The signal channel contains the cutterhead, its driver, and the equalizer; the reference channel has a dummy capacitor of value approximately equal to C in place of the cutterhead and a suitable delay line to match the electrical path length of the signal channel. At low frequencies both channels act as capacitive voltage dividers with approximately equal outputs, and the reference channel is adjusted for zero phase. As the frequency varies, the gain -phase meter outputs give the correct mag-
nitude and phase, which can he plotted and displayed on a scope.
When device characterization is desired, the switches are set in position 1, hypass'ng the equalizer, the amplifier, and the delay. For equaliza- tion and monitoring, switch positions 2 are used.
This test set-up has been used to characterize several hundred samples with reproducible results. Fig. 7 shows the amplitude and
RCA Review Vol. 43 March 1982 91

EXT.
HORIZ
POWER SPLIT
RUS
VOLT Al
EOUAL- POWER o- IZER ^ AMP -o z 250
WAY- AYT
DELAY T
CUTTER HEAD
Cr
I n t 2
50
f Cm
xSIGNAL CHANNEL C -Co
1Cmj
HORIZ
GAIN PHASE
REFERENCE CHANNEL
Fig. 6 -A complete test set-up for cutterhead characterization.
phase response of a typical half -real-time cutterhead. The circled dots represent points computed from Eq. 131 using the experimentally obtained components of the equivalent circuit. Fig. 8 shows the "equalized" response of the same sample.
The test set-up can also be used to measure the motional impedance Z and the total transducer impedance. The motional impedance is
-lo
-20
-30
-40
-50
-60
- 70
54A
.54 Lt
r -PHASE .t
1 I I
1.0 2.0 3.0 FREQUENCY (MHz)
Fig. 7 -Frequency response of typical half real time cutterhead.
4.0
92 RCA Review Vol. 43 March 1982

lo
METHOD FOR CHARACTERIZATION
-20 -5.4
-60
-70
PHASE
-O.54Á t AMPLITUDE
I 1 1
1.0 2.0 3.0 4.0 FREQUENCY (GHz
Fig. 8 -Equalized response of a half real time cutterhead.
simply measured by replacing C,,, in the signal channel by a resistance whose value is much less than the reactance of C (say 50 to 2(X) 2). The signal channel now gives the motional current I..,,. Switching the gain -phase function to B/A (refer to HP3575A manual) gives the ratio of Vr/I.,, which is equal to Z.,. The total impedance is measured in the same manner, but after disconnecting Cr.
6. Conclusion
This paper describes a method of measuring characteristics of piezo- electric videodisc cutterheads. It is based on a few simple measure- ments of capacitances, Q, resonant frequency, and on the measurement of the motional charge in the device. The motional charge is measured by means of a bridge or balance circuit designed to give an output that is the difference between the total charge through the device and the charge flowing through its clamped capacitance. Simple formulas are given that relate those measurements to yield values for the displace- ment, the piezoelectric coupling factor, and the elements of the device's equivalent circuit. The test set-up can also he used to measure imped- ance or to monitor displacement during equalization or during record- ing. The method applies to any piezoelectric device in which geomet- rical factors make analysis or conventional measurements difficult.
RCA Review Vol. 43 March 1982 93

Acknowledgement
I thank E. O. Keizer and J. K. Clemens for initiating this research and W. C. Stewart for his part in the conception of this technique. I also thank J. H. Reisner for his support and for many technical discussions. Appreciation is also extended to R. Truesdell for his initial develop- ment work on many aspects of the test circuitry, and to J. Valachovic and R. Simms for their perseverance and care in the fabrication of the numerous samples used in the tests. Finally I thank G. E. Bodeep and S. Chasin for their invaluable assistance and cooperation in the tests and the development of test procedures in the course of this research. References:
3. B. Halter, "Triangular Piezoelectric Transducer for Recording Video Information," US Patent #3,805.997, K. F. Etzold, "A Quadrature Michelson Interferometer System for Probing Surface Vibrations-Applications to Videol)isc Cutters," RCA Rev., 43, p. 99, March 1982 (this issue). W. P. Mason, Phvsical Acouslics, Vol. 1, Part A, p. 2, 9, Academic Press, 1964. ' R. L. Truesdell, "-Testing Methods for the Characterization of Cutterhead Performance in Mastering VideoDiscs, RCA Rev., 43, p. 117, Mara 1982 (this issue)
r' G. A. Alphonse. "Power Dissipation in Piezoelectric Cutterheads," RCA Review, 43, p. 38, March 1982 (this issue).
94 RCA Review Vol. 43 March 1982

A Quadrature Miichelson Interferometer System for Probing Surface Vibrations- Application to VideoDisc Cutters
K. F. Etzold RCA Laboratories, Princeton, NJ 08540
Abstract-An optical test system for evaluation of VideoDisc cutterheads or other ultrasonic transducers is described. The system measures phase, group delay and absolutely calibrated amplitude in a fre- quency range from 100 kHz to 13 MHz. Amplitudes greater than about 10-3 A can be measured but a calibration correction factor is necessary at amplitudes greater than about 100 Á. The surfaces to be measured need not be specular and good response data is obtained from granular materials such as typical PZT surfaces.
1. Introduction
The VideoDisc cutter head is fundamentally an ultrasonic transducer. However, unlike most such transducers which are designed to radiate their ultrasonic power into liquid or solid media, the task of this device is to produce a machined surface whose contour represents the FM - encoded television signal. Optical techniques have traditionally played an important role in investigating and measuring acoustic fields. In a typical application, an optical probe detects the ultrasonic motion of a suitable surface or, more rarely, an acousto-optic interaction is used in a transparent liquid or solid.' Systems whose electrical signal is proportional to the acoustic amplitude and that have good spatial resolution are clearly the most desirable. Interference' as well as diffraction' have been used extensively to detect, visualize, and mea- sure acoustic wave fronts.
In most imaging and measuring applications, it is not necessary to
RCA Review Vol. 43 March 1982 95

transducer base motion can he measured and, in fact, such motion has been observed. R. Shahbender5 has hypothesized that a radiation pressure force is generated at the steel -damping -material interface, tending to move the entire steel-PZT assembly away from the mount- ing post. Other possible mechanisms are heating accompanied by expansion and nonlinear behavior of the viscolloid damping material. The observed time constant of this effect of about I sec favors a
thermal explanation, while one would expect essentially instantaneous response from mechanical rectification or from a radiation pressure force. The principal difficulty in postulating heating as a mechanism is that the calculated magnitude of such an effect is too small.
3. Example of a Typical Cutterhead Test
The interferometer is routinely used to characterize VideoDisc cutter - heads for research on new structures and for production control. Despite the fact that the surface displacements that are being mea- sured are only of the order of a few angstroms, the instrument is easy to use and has good stability. The sample is mounted on a prealigned block that directs the probing light beam within a few tens of microns of the desired location. The optical alignment is completed in a few minutes and the system is ready for the calibration cycle. The ampli- tude, phase, and group delay sweeps are then taken over a frequency range from 0 to 6.5 MHz for a half real-time cutter. The entire procedure takes about 15 minutes for a subassembly and somewhat longer for complete cutterhead. The response is measured at the center of gravity of the triangle on a subassembly. The diamond is then mounted and the response is remeasured as near to the cutting tip as possible. Normally Face 1, Face 2, as well as the X -face are probed (Figs. 1 and 3). The drive to the transducer in a typical qualification run is 2-3 V with a source impedance of 50 ohms. The amplitude to he measured is about 2 V x 1.2 A/V = 2.4 Á = 0.24 nm, where 1.2 A/V is
the approximate sensitivity of a typical transducer. The computer is used to find the frequency of the main resonance by searching for a maximum in the response. The Q is determined by finding the 3 dB points on both sides of the resonance. The computer generates a calculated response and plots the results for comparison to the actual response. The peak of the model resonance curve is matched to the peak of the measured curve. The difference between the two is also taken and it allows a ready inspection of the response for secondary resonances.
In actual use, the cutterhead response is approximated by consid- ering only the single main resonance that is to be equalized. The
98 RCA Review Vol. 43 March 1982
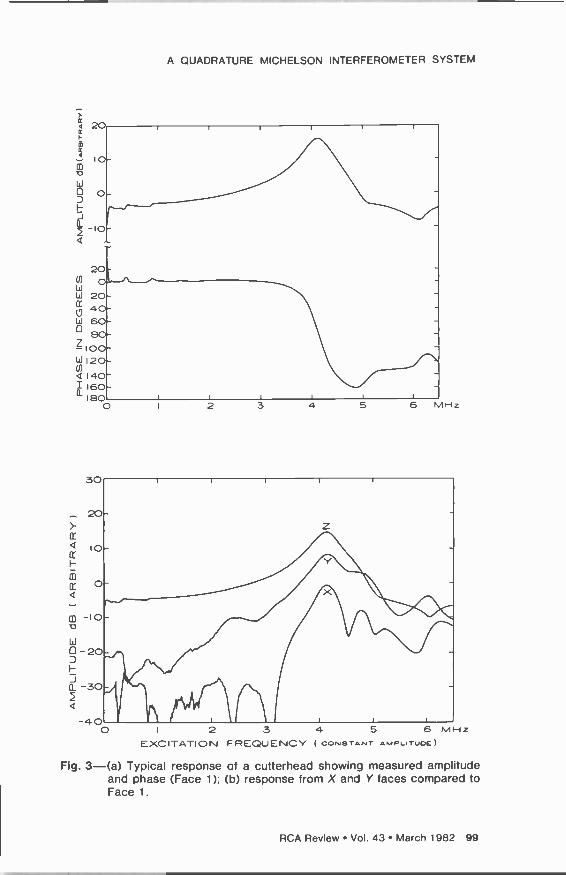
2 3 4 5 6 MHz
(n
20 O
W 20 cc 4 W 60 0 e
100 W120 N 4 140 I 160 d160
30
A OUADRATURE MICHELSON INTERFEROMETER SYSTEM
O
W 0 - 20 J I -
-40 O I 2 3
EXCITATION FREQUENCY 4 5 6 MHz
( CONSTANT AMPLITUDE)
Fig. 3-(a) Typical response of a cutterhead showing measured amplitude and phase (Face 1); (b) response from X and Y faces compared to Face 1.
RCA Review Vol. 43 March 1982 99

residue must meet certain specifications to qualify the cutter for mastering, but no attempt is made to equalize any other resonances. Ideally the cutterhead resonates at the lowest normal mode and all other resonances are well separated and at higher frequencies. In fact, many other resonances are present that cause aberrations in the recorded response. The goal of our research effort has been to find structures that have the largest size for a given frequency, thereby reducing the strain in the material and making for ease of manufacture. The interferometer system has been used extensively to investigate many experimental structures manufactured to achieve the above goal. Unfortunately only very few simple geometries are amenable to limited theoretical analysis,5.'8 and the interferometer has been used to verify the calculated vibrational structure of such devices.
4. Correlation to Other Test Methods and Relation to System Performance
The principal objective of the interferometric measurements is to obtain detailed understanding of cutterhead performance as it relates to overall VideoDisc system performance. As a check on the meaning of interferometer results, it is important (1) to compare the interfer- ometer data to impedance, capacitive probe, or cutterhead current measurements and (2) to compare the results on cutterheads obtained with the interferometer to playback data obtained from the substrate with the laser reader' and from discs with a capacitive stylus. All techniques except interferometry average the cutterhead response and thus one would expect only limited correspondence with interferometer data. Indeed, neither the bridge nor the impedance measurements detect the low -frequency resonances, and the high -frequency response above resonance is significantly different.
Reasonably good correspondence of capacitive probe data with interferometer measurements is obtained in the mid -frequency range up to the resonance. However, because of the difficulty of measuring the equilibrium capacity of the measuring capacitor gap, the sensitivity of the transducer cannot be determined. The capacitive probe does measure surface displacement just as the interferometer, however, motion is averaged over the probe tip area, which is roughly equal to the top surface of the entire transducer, and complicated averaging takes place in the fringe area of the probe. Because the surface to be measured has to be conductive, the use of this technique is limited, and completed transducers with the diamond in place cannot be measured at all with this technique.
Averaging also takes place in the cutterhead current measurement. The motional components of the cutterhead current are measured by
100 RCA Review Vol. 43 March 1982
A QUADRATURE MICHELSON INTERFEROMETER SYSTEM
cancelling the current through the static or clamped capacity. Here, what is really measured is the piezoelectric conversion efficiency of the entire transducer block regardless of the direction of motion.
Consider an extreme example of potential errors that can occur as a result of such averaged measurements. For a resonance mode that is symmetric about the center of the triangle, there can be a node at the center of gravity. Current measurements would show a strong response at resonance, but in fact the displacement would tend toward zero in the vicinity of the point where the diamond is mounted. Measurements on the X and Y -faces illustrate well that many vibrational mcxles are not detected by current measurements because of averaging. The complicated structure of the low -frequency modes (see Fig. 3a) that is observed is weak or totally absent when a current or capacitive probe response is taken.
Specific experiments were performed to directly compare the cut- terhead current with interferometric measurements in the Z -direction. As expected, the high -Q structure around 1 MHz disappeared. Ap- proximate correspondence was obtained in the frequency range from 1 MHz up to resonance. Above resonance there was no correspondence at all, primarily, it is suspected, because of mode symmetry consider- ations.
The most difficult problem, however, is that no technique has produced complete correspondence to the final result, the picture playback from a pressed disc with a capacitive pickup player. Some of the unresolved issues revolve around the question of whether a flat amplitude response is sufficient to characterize the transducer or whether the phase or group -delay should be equalized. Aberations can be introduced directly into the phase response by motion in the X (forward or tangential) direction and by second -order effects due to motion in the Y (radial) direction. Unsuccessful attempts have been made to correlate the separation and structure of the X -response to picture quality. Nevertheless, it is believed that the forward motion is
undesirable because it can be shown that it introduces undesired phase distortion into the recorded signal. This can be seen intuitively by observing that the zero crossings of the signals are displaced from their normal position by motion in the X -direction. The major unresolved question is what nonlinearities contribute to the generation of base - band signals and the various heats that can be observed. While there is no doubt that nonlinearities are present, it has not been possible so fat to attribute any beats to a specific property of the cutter or any other specific part of t he VideoDisc system. An example is the attempts to correlate measurements of differential gain and differential phase or color bar performance to parameters determined by the interfer-
RCA Review Vol. 43 March 1982 101

ometer. No correlation could be established, implying the existence of hidden, untested parameters.
5. System Description
5.1 Theory of Optical Detection System
A modified Michelson Interferometer is used to detect the motion, and suitable electronics process the signals corresponding to the displace- ment. Secondary stabilization and normalization signals are also gen- erated. A block diagram of the system electronics is shown in Fig. 4. The system consists of a stable air -supported optical table that holds the interferometer and the photodetector preamplifiers (Fig. 5). A separate rack holds the video -signal generation and the detection equipment, monitoring scopes, and the stabilization and normalization electronics (Fig. 6).
The optical front end contains the Michelson quadrature interfer- ometer (Fig. 7) described in detail in Sec. 5.3. It is the fundamental motion -to -signal transducer. For small amplitudes, the output from the optical front end is proportional to the displacement and to the amount of light reflected by the device under test, assuming that the
C=k- TRANS.- DUCER
(OUTR
INTER- FEROMETER
OPTICS
MIRROR 0 5ERGO
11 \Mv DRIVER
IN PHASE
OUADRA TURE
DRIVED l _
V
O VIDEO l - MONITOR
PRE AMP IN -PHASE
COMPUTER 9835
DATA l
PLOTTER
TO HOST COMPUTER
SYNTH
TO ANALOG OUT -PUT FROM STAGE
CONTROL PRASE SIG REF
1
yp[p'-I NETWORK ANAL
vICEO
ARE AMP QUADRAT DC
TUNE SE
RAMP
SCAN
PP
LOG AMPL
DUN
NORMALIZATION SELECT
TUNE
CAL
MODE L
TESTI *-1 N 1
GROUP DELA
Fig. 4-Block diagram of the interferometer system.
PROCESSING CHANNEL
SIGNAL CHANNEL
NORMALIZATION CHANNEL
SERVO CHANNEL
102 RCA Review Vol. 43 March 1982

A OUADRATURE MICHELSON INTERFEROMETER SYSTEM
\ \ I ow, o t
J .1
.. .
.1 ---- -
! 1
I 0, --- F-,-- psi .... . rip- Ti
IT t
Pql
Fig. 5-View of the optical front end.
17" - Z.
Fig. 6-Electronic systems (computer not shown).
RCA Review Vol. 43 March 1982 103
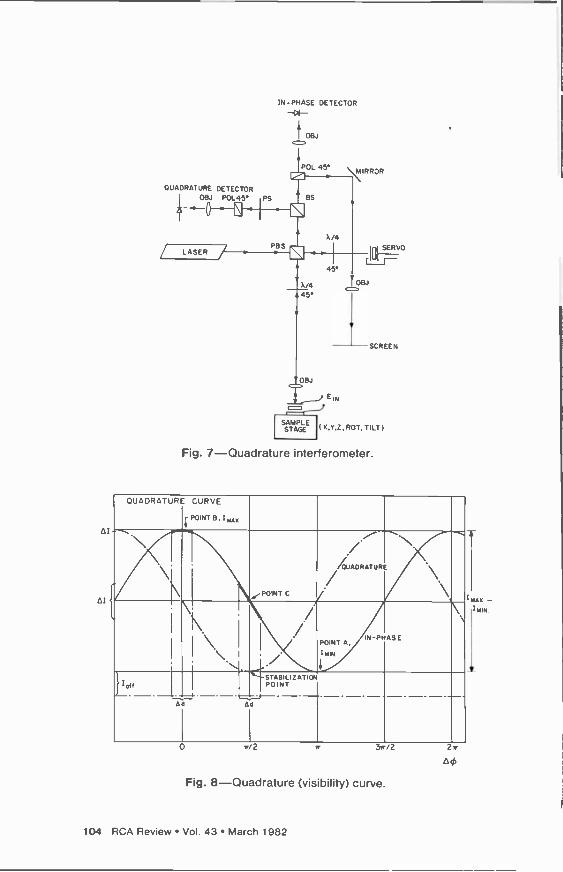
A
AI
OUADRATURE DETECTOR OBJ. P0L45 PS
Qlh-- o-
IN - PHASE DETECTOR
OBJ.
POL 45° \MIRROR
OBJ
SAMPLE STAGE
IOI
SERVO L- OBJ
FEIN
( X,Y,Z, ROT, TILT )
SCREEN
Fig. 7-Quadrature interferometer.
QUADRATURE CURVE
POINT B, I,,,,x
\ fP01NT C
/ OADRATURE
/ °\
\ \ I I/
I \ (
IN-PHA$E POINT A,
IMIN
} tott
A0
ti AE
STABILIZATION POINT ___-.__-_-_-.
o
Fig. 8-Quadrature (visibility) curve.
MAX.
I M IN.
Z
104 RCA Review Vol. 43 March 1982
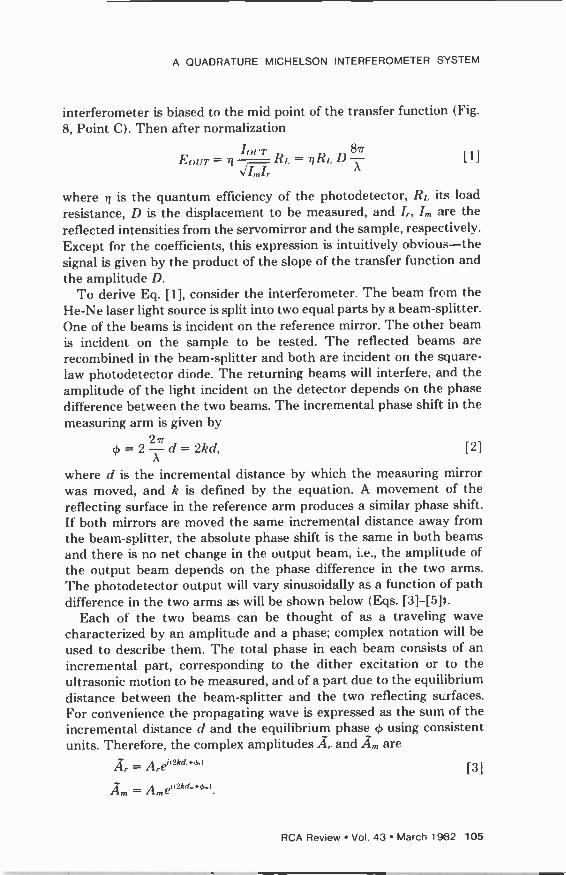
A QUADRATURE MICHELSON INTERFEROMETER SYSTEM
interferometer is biased to the mid point of the transfer function (Fig.
8, Point C). 'Then after normalization
Four - n Io_ R,. = +1Rc D 8/7
11] NImir
where n is the quantum efficiency of the photodetector, I? . its load
resistance, D is the displacement to be measured, and Ir, I,,, are the reflected intensities from the servomirror and the sample, respectively. Except for the coefficients, this expression is intuitively obvious-the signal is given by the product of the slope of the transfer function and the amplitude 1).
To derive Eq. [1], consider the interferometer. The beam from the He-Ne laser light source is split into two equal parts by a beam-splitter. One of the beams is incident on the reference mirror. The other beam is incident on the sample to be tested. The reflected beams are recombined in the beam-splitter and both are incident on the square - law photodetector diode. The returning beams will interfere, and the amplitude of the light incident on the detector depends on the phase difference between the two beams. The incremental phase shift in the measuring arm is given by
2/r = 2 d = 21rd, [2]
where d is the incremental distance by which the measuring mirror was moved, and k is defined by the equation. A movement of the reflecting surface in the reference arm produces a similar phase shift. If both mirrors are moved the same incremental distance away from the beam-splitter, the absolute phase shift is the same in both beams and there is no net change in the output beam, i.e., the amplitude of the output beam depends on the phase difference in the two arms. The photodetector output will vary sinusoidally as a function of path difference in the two arms as will he shown below (Eqs. [3]-[5It.
Each of the two beams can be thought of as a traveling wave characterized by an amplitude and a phase; complex notation will be
used to describe them. The total phase in each beam consists of an incremental part, corresponding to the dither excitation or to the ultrasonic motion to be measured, and of a part due to the equilibrium distance between the beam-splitter and the two reflecting surfaces. For convenience the propagating wave is expressed as the sum of the incremental distance d and the equilibrium phase g5 using consistent units. Therefore, the complex amplitudes Ár and A,,, are
Ár =
RCA Review Vol. 43 March 1982 105

where the subscripts r and m refer to the reference and measuring arms, respectively.
The amplitude of the output beam is the sum of the reference and measuring beam amplitudes
A = Á,. + Á,,, 141
where, for simplicity, we consider single -plane polarization. The square -law detector measures the intensity I = ÁÁ*. Thus, the de- tected intensity is
I = Ar`' + A,,,2 + 2A,A,,,cos[2k(d,,, - dr) + - I. 151
The video -frequency surface motion is present only in the measuring arm, while the low -frequency pilot signal is impressed on the reference mirror. For purposes of understanding the detection process, it suffices to recognize that there is a small perturbation, ád = d,,, - dr, present. The resulting signal varies as a function of the equilibrium phase difference ᢠ= - Or. The incremental intensity AI corresponding to ád is small at 0¢ = 0 and ¢ = 27r (Fig. 8, point A or B), approaching zero in the limit of á 0; whereas at ág5 = r/2 it has a maximum (Fig. 8, point C). Indeed, for small signals áI is linearly related to .d by the slope of the curve. For large values of ád (e.g., 850 A p -p), the typical cutting amplitude, the excursion expressed as the fraction of a wave, is 850/6328 = 0.13; and the peak -to -peak interferometer signal excursion is about 26% of a full wave. At these amplitudes the transfer function is beginning to exhibit nonlinearities, i.e., the excursion is entering the curved portion of the sine function. This implies that harmonics are introduced into the detected signal. Narrow -band de- tection must be used or appropriate corrections have to be made if the large -amplitude sensitivity or harmonic distortion is to be measured. To see what the response of the system will be for small and large amplitudes, consider a sinusoidal motion of amplitude D and angular frequency w:
d,,, = D sin wt.
Assume for the moment that there is no drive -signal applied to the reference -beam reflector. Then, Eq. [5] becomes
I=Ar2+A,,,2+2ArA,,, cos (2kD sin w [6]
If the amplitude D is small and if 0m - ¢r = ^/2, the cosine function can be expanded. Thus,
cos(2kD sin wt + -/2) = sin(2kD sin wt) - 2/,D sin wt, [7]
where sin x x is used for small x. Therefore, the time dependent part
106 RCA Review Vol. 43 March 1982

A OUADRATURE MICHELSON INTERFEROMETER SYSTEM
of the intensity is given by
I(t) = 4 I I RD sin wt, [8]
since A,2 and A,,,2 are constant; also A,. = NIT.; and A. = v . By measuring the intensity due to the reference arm (Ir) and the measur- ing arm (I,), an absolute determination of the amplitude can be made. It is also seen that for large D, Eq. [7] is no longer valid and the cosine term in Eq. [ 6 ] has to be expanded by the Fourier-Bessel expansion,
sin (2RD sin wt) = 2 E J(2kD)sin(nwt). [9] 2+l
This expression will be valid at the exact bias point where 41 = Tr/2,
and gives rise to a system response with a fundamental as well as odd harmonics. At the maximum or minimum of the visibility curve, Eq. [5], the even expansion will be valid
cos(2kD sin wt) = 2 1 J(2kD)cos(nwt) + J(21?D), 2
giving even -order harmonics. At intermediate points, both expressions will contribute to the response, and even and odd harmonics will be present.
Because of the presence of harmonics in the detected signal, the value of the amplitude will depend on the detection method. A narrow - band receiver such as the HP 3570A Network Analyzer detects only the fundamental, and the results will be equivalent to Eq. 18] for small amplitudes. For large amplitudes, the output at the fundamental is
given by Eq. [9] with n = 1,
I(t) = 4 I I J1(2kD)sin wt. [11]
Since
[10]
J1(21D) = RD [12]
for small arguments of the Bessel function, it can be seen that Eq. [8]
is equivalent to Eq. [11] in the limit of small amplitudes. At the maximum cutting amplitude, (850 p -p), RD = 0.42 and J,(2kD) = 0.386. Thus, the maximum error in the amplitude measurement would be 9% if Eq. [8] was used instead of Eq. [11]. To obtain the full
accuracy, the Bessel function series must be inverted. A simple algo- rithm suffices since J(x) approaches zero very rapidly for x > n. In the present system no corrections for large amplitude are made, i.e.,
Eq. [8] is used to obtain the amplitude. The presence of system -generated harmonics complicates not only
the measurement of the sensitivity and frequency response of the cutterheads but also makes difficult the determination of nonlinearities
RCA Review Vol. 43 March 1982 107

of the device under test. Typically at 850 A p -p, the system generated :3rd harmonic is 30 dB down from the fundamental (Eq. [9]). Certainly if the cutterhead 3rd harmonic is comparable to this value, one cannot separate the two without taking additional measurements and invoking an appropriate algorithm to separate the contributions.
At the exact bias point for the interferometer, the system does not contribute any even harmonics. Thus, in principle, the important 2nd harmonic could be measured directly. In fact there are small inten- tional (dither) and unintentional (air currents, etc.) fluctuations around the bias -point, sufficient to introduce significant and sharply varying second harmonics. Typically at an amplitude of 850 A p -p, the system second harmonic is 13 dB clown from the fundamental when the interferometer is set ± 90° away from the correct bias point (Eq. 1101). Therefore, if the bias point error is 10°, the system second harmonic will be only 28.5 dB down from the carrier.
5.2 Normalization and Calibration
The magnitude of the detected signals not only depends on the surface amplitude D of the transducer under test but also on the amount of light in the reference and measurement arms. However, if one sepa- rately measures the quantity v'I I, and divides the detected signal by it, an absolute measurement of the surface amplitude S (in A) of the transducer is obtained from Eq. [81,
1 I(t) S = D sin wt = 4k 1T
Because the wavelength of the light that is used is the metric for the sensitivity measurement, no other measurements are necessary to obtain an absolute determination of the surface amplitude. Thus, inaccuracies are related only to uncertainties in the signal measure- ment and errors in the determination of the amplitude of the visibility, or quadrative, curve, Fig. 8.
In the present system, three methods of determining fi,L, are used. They are: (a) peak -to -peak detection, (b), square -and -add detection, and (c) lock -in detection. Each method will be described below.
It should be recognized that in most interferometers the interference is not perfect. Thus, Eq. 15] has an additional offset term in it,
I= I, + I,,, + 2 I,1,,, cos1 2 k( d,,, - d,.) 1141 +4)m - Or] +'off
where all quantities are now expressed in terms of intensities rather than amplitudes. Therefore the visibility curve (Fig. 8) has its origin
108 RCA Review Vol. 43 March 1982

A OUADRATURE MICHELSON INTERFEROMETER SYSTEM
shifted as indicated by the dashed line. The quantity to be determined
is the coefficient of the cosine term in Eq. 114], independent of the de
terms. The detection techniques were designed to achieve this end.
(a) Peak -to -Peak Detection
To obtain the peak -to -peak values the negative and the positive peaks
are determined separately and subtracted from each other (Figs. 8 and
9). Because the light intensity is proportional to the photodetector
output voltage, the maximum and minimum values can be expressed
in terms of the intensities rather than the photodetector voltages.
From Eq. 1141,
,,,,,X = I, + I,,, + 2. I,I,,, +
I,,,r = I, + I,,, - 2 I,I,,, +
and therefore, as required,
I,,,.,X - I,,,;,, = 4 JI,1,,,.
using cost) = 1
using cos/) = -1,
Consider a typical calibration cycle. Immediately after the start of
the measurement both detectors acquire the present value of the
intensity Lt. By driving the servo mirror with a slow ramp, the intensity will initially decrease and eventually reach 1,,,,,,. The positive -peak
detector (Fig. 9a) will, during this interval, retain I., since the input
voltage is decreasing. The negative peak detector, however, follows the
present voltage until the minimum is reached. As the interferometer continues to be driven, the latter value will no longer change since the
intensity is now increasing. The positive peak detector will start to
follow the input when the intensity is greater than IV,, and it war do so
until I,,,qr is reached. Even if the interferometer continues to be driven,
the peak values will then no longer change, and both values have been
properly acquired. It was assumed for this example that the intensity will decrease. If the system was tuned initially such that the starting
slope is positive (Fig. 8), then the intensity would have increased in
response to the ramp signal and the sequence of operation of the peak
detectors would have been reversed. The difference amplifier forms
- 1,,,,,, and, therefore, the output is as desired.
A refinement was introduced to eliminate the traditional diode often
used in peak detectors. Ideally the diode conducts perfectly when
charging the holding capacitor and is turned off when the capacitor
voltage is equal or greater than the input voltage to the peak detector.
In fact, there is a variable voltage drop across the diode, depending on
the forward current, and significant errors are introduced.
A new peak detector was devised to overcome this problem. Instead
RCA Review Vol. 43 March 1982 109
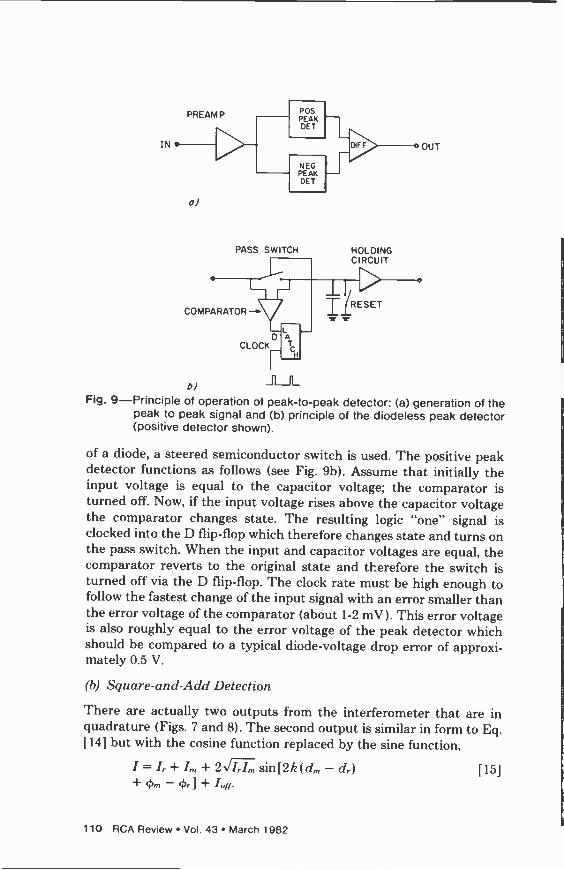
IN
a)
PASS SWITCH
COMPARATOR - D
CLOCK
HOLDING CIRCUIT
RESET
OUT
el mil_ Fig. 9-Principle of operation of peak -to -peak detector: (a) generation of the
peak to peak signal and (b) principle of the diodeless peak detector (positive detector shown).
of a diode, a steered semiconductor switch is used. The positive peak detector functions as follows (see Fig. 9b). Assume that initially the input voltage is equal to the capacitor voltage; the comparator is turned off. Now, if the input voltage rises above the capacitor voltage the comparator changes state. The resulting logic "one" signal is clocked into the D flip-flop which therefore changes state and turns on the pass switch. When the input and capacitor voltages are equal, the comparator reverts to the original state and therefore the switch is turned off via the D flip-flop. The clock rate must be high enough to follow the fastest change of the input signal with an error smaller than the error voltage of the comparator (about 1-2 mV ). This error voltage is also roughly equal to the error voltage of the peak detector which should be compared to a typical diode -voltage drop error of approxi- mately 0.5 V.
(b) Square -and -Add Detection
There are actually two outputs from the interferometer that are in quadrature (Figs. 7 and 8). The second output is similar in form to Eq. [141 but with the cosine function replaced by the sine function,
7=1,+I,,,+2l sin)2h(d,,,-d,) 151
+4)»,-4,,.J+Iff.
110 RCA Review Vol. 43 March 1982

A QUADRATURE MICHELSON INTERFEROMETER SYSTEM
If suitable high pass filters remove the constant terms, and the identity
sín2 e + cos2 0 = 1
is used, the normalization factor can be determined:
212 = 411,,,.
[16]
117]
In the present version of the system there is no square -rooter circuit, but when the computer is used it can be programmed accordingly.
(c) Lock -In Detection
This technique uses the pilot signal for normalization. Just as the video drive to the transducer under test produces a signal, so will the pilot -drive to the servo mirror. The latter signal is detected with an
Ithaco* lock -in amplifier. The disadvantage of using this signal is that its magnitude depends on the sensitivity of the servo mirror which
must therefore be calibrated. The lock -in method must he used when
fluctuations of the signal occur during the measurement, such as
scanning a transducer to determine the mode structure. Typically the
reflectivity of the scanned sample varies over a wide range due to the granular structure of the PZT material or other surface structure and contamination. It should be recognized that methods (a) and (b)
amount to establishing the metric for the measurement, but that the very operation of generating such a calibration signal prevents normal
operation of the interferometer. The real-time lock -in method is in-
herently incapable of generating such an absolute calibration signal.
5.3 Implementation of the Quadrature Interferometer
To derive Eq. 151, it was assumed that the interferometer is tuned to
the proper bias -point on the visibility curve, .10 _ 7/2 (Fig. 8, point
C). The purpose of the stabilization loop is to achieve this goal.
Consider a pilot or dither signal (= 550 Hz) which is generated by a
small amplitude motion of the servo or reference mirror. The maximum
dither signal will occur at the midpoint of the curve just as the maximum of the video signal will. In principle this signal could he used
to stabilize the system, i.e., a feedback loop would act to maximize this
signal, but a suitable phase reference would have to be derived from
the signal. Consider now the situation at a maximum or minimum of the
visibility curve. Here the slope of the curve and, therefore, the phase
Ithaco, Inc., 753 West Clinton St., Ithaca, NY 14850.
RCA Review Vol. 43 March 1982 111

of the pilot signal changes as the extremum is passed, and furthermore, the signal will be zero at the exact maximum or minimum. Thus, this is the natural signal to stabilize the system. Of course, this stabilization point is unsuitable for video detection, since the desired signal there is zero as well. The answer to this dilemma lies in having a second channel in the system which is 90° out of phase with the signal channel (in quadrature). When the signal in this latter channel has an extre- mum, the in -phase channel will be biased at the correct point. Thus, the quadrature channel can be used to stabilize the system, while the in -phase channel is used for measurement.
The requirement for the quadrature channel makes it necessary to modify the optical arrangement. Quarterwave plates in each arm and a polarizing beam-splitter (PBS, Fig. 7) are used to obtain circularly polarized light that falls onto each of the reflecting surfaces. On return, the beams are still circularly polarized but they are converted back to linear polarization, perpendicular to the original direction, by the quarterwave plates. The effect of this is that the returning beams will emerge from the output side of the beam-splitter. The polarization of the beam from the measuring arm and the reference arm will be 90° apart. To obtain interference from these two beams, 45° components are taken with a polarizer (actually, a polarizing beam-splitter). The quadrature light is obtained by picking off a sample from both beams with an ordinary 50/50 beam-splitter (BS, Fig. 7) and phase -shifting the reference beam only by 90° (PS, Fig. 7). The phaseshifter consists of a piece of plexiglass to which an uniaxial strain may be applied. If the system is not in quadrature, the circle display will change into an ellipse, a condition readily corrected by adjusting the pressure screw that generates the strain. Interference is obtained in the same manner as in the measuring beam, with the polarizer set at 45°. The incidental beam from one of the output polarizer beam-splitters is projected onto a small screen and is used for alignment purposes.
5.4 System Electronics
A block diagram of the entire interferometer system is given in Fig. 4. The task of the system electronics is to generate a normalized, abso- lutely calibrated signal proportional to the displacement being me - su red.
(a) Signal Channel
The stimulus to the transducer is generated by the synthesizer. The response, which is detected by the interferometer optics and photo -
112 RCA Review Vol. 43 March 1982

A QUADRATURE MICHELSON INTERFEROMETER SYSTEM
preamp, is measured by the network analyser. One of the two channels is used to measure the preamplified signal from the photodetector. The other serves as a reference for phase and group delay measure- ments. The network analyzer has outputs for amplitude, phase, and group delay. After scaling, phase and group delay signals are routed directly to the X- Y recorder and the effects of linear phase are removed by a delay line in the reference channel. One of the three normalization signals generated as described in Sec. 5.2 is selected, routed to the log amplifier, and subtracted from the logarithmic -amplitude do signal from the network analyser.
It has been found that peak -to -peak detection yields the best am- plitude accuracy of about ± 0.5 dB. The source of the residual error is unknown at the present time.
(h) The Servo Channel
The servo -channel contains the electronics to lock the system to the correct bias point (Fig. 8, point C). It also contains the signal sources for set-up (tune -mode) and calibration. Electronic switches, selected by front panel push buttons and by appropriate logic circuitry route the signals to the servo mirror via a summing amplifier and a high voltage driver. A suitable dither or pilot signal is applied via the pilot switch to the servo mirror. The frequency (550 Hz) was chosen for good servo response and minimum interference with the video signal. The drive amplitude is about 10_2 nm. This signal induces the phase - sensitive signal in the interferometer which is then amplified and detected in the servo lock -in amplifier. The resulting do correction signal is applied to the mirror if the servo switch is closed. An increasing error away from the desired stabilization point causes a larger correction voltage due to the larger slope of the quadrature curve. The polarity is such as to drive the system back to the desired point. The accuracy with which the system can be maintained at this position depends on the loop gain of the correction circuit and on the speed with which the mirror can respond to an input signal. For diagnostic purposes the dither signal alone can be applied to the mirror.
The presence of a quadrature signal allows a convenient check on the alignment of the system.
In the tune mode,
Ir = 1,.I,,, sin! (2 kD)sin 52t]
I,, = .I,1,,, cos( (2 kDsin Sgt]
RCA Review Vol. 43 March 1982 113

where 12 is the tune -signal angular frequency (40 Hz). If the amplitude D is large enough to drive the system through about 1'/2 fringes, I; and I,, are the parametric equations for a complete circle. The in -phase and quadrature signals are connected to an X -Y oscilloscope and a circle is displayed. The diameter is a measure of the strength of the signal, i.e., the quality of the tested surface. It is maximized by adjusting the focus and position of the probing beam on the sample under test. Fine positioning is necessary because of imperfections or dirt on the surface of the PZT or diamond. When the adjustment is
satisfactory the tune signal is disconnected and the servo is enabled. The monitor will show that the system is locked up properly and the display spot will move to the in -phase position.
In the Cal mode the ramp signal is applied to the servo mirror when it is desired to generate the peak -to -peak normalization signal. The ramp signal is applied to generate a normalization signal that is
captured by the peak -to -peak detectors. As the interferometer is made to slowly traverse the fringe pattern (10 sec for a 11/2 fringe ramp) the peak detectors will capture the minimum and maximum values.
(c) The Processor
The data generated by the system is routed via the IEEE 488 bus to the HP 9835A computer. The center frequency and Q of the dominant resonance are determined by the computer using the 3 -dB points. A
more sophisticated mode analysis program using about 600 data points has been implemented but the center frequency and Q fit were not significantly improved. The program is presently being expanded to characterize as many normal modes as possible. The ultimate goal is to identify all modes and to find the corresponding physical displace- ment pattern on the transducer. To do the more sophisticated mode analysis, a main frame computer is required. The transducer data will then be transferred via the appropriate interface.
6. Summary
An optical test system based on a Michelson interferometer has been described. While the system was specifically designed and built for testing of VideoDisc mastering styli, it is suitable for measuring the amplitude of any vibrating surface provided the frequency is within the systems operating range and the surface is sufficiently reflective. Because of its inherent high sensitivity, freedom from frequency re- sponse aberations, high spatial resolution, and absence of the need to
114 RCA Review Vol. 43 March 1982

A QUADRATURE MICHELSON INTERFEROMETER SYSTEM
make physical contact to the surface under test, the system can be used to investigate a very wide class of ultrasonic devices.
The system could not have been built without the constant and enthusiastic support of J. Reisner, who grasped very early its potential value. I. Gorog helped in many discussions and provided the necessary encouragement and support to build the system. J. Valachovic supplied many experimental transducers and built single handedly a second production test system.
References:
' R. Ingenito and B. Cook, "Theoretical Investigation of the Integrated Optical Effect Produced by Sound Fields Radiated from Plane Piston Transducers," J. Acous. Soc. Amer., 45, p. 572 (1969). 2 R. Mezrich, K. F. Etzold, and D. Vilkomerson, Acoustic Holography, Vol. 6, p. 165, Plenum Press (1974). 3 R. Whitman, M. Ahmed, and A. Korpel, Acoustic Holography, Vol. 4, p. 11, Plenum Press (1972).
J. Guarracini, J. Reisner, J. Walentine, and C. Whybark, "Micromachining VideoDisc Grooves and Signals," RCA Review, 43, p. 66, March 1982 (this issue). 5 R. Shahbender, K. Vanguri, and B. Khuri-Yakub, "Approximate Resonance Spectrum of a VideoDisc Cutter," RCA Review 43, p. 57, March 1982 (this issue). 6 J. Gibson, private communication.
J. Larson, "A New Vibration Mode in Tall, Narrow Piezoelectric Elements," 1979 IEEE Ultrasonics Symposium Proc., p. 108. 8 R. Holland and E. P. EerNisse, Design of Resonant Piezoelectric Devices, MIT Press (1969).
A. H. Firester, C. B. Carroll, I. Gorog, M. E. Heller, J. P. Russell, and W. C. Stewart, "Optical Readout of the RCA VideoDisc," RCA Review, 39, p. 392, Sept. 1978.
RCA Review Vol. 43 March 1982 115

Testing Methods for the Characterization of Cutterhead Performance in Mastering VideoDiscs R. L. Truesdell RCA Laboratories, Princeton, NJ 07060
Abstract-An electro -mechanical cutter designed to record television video information at one half the real time rate is not an ideal device. It introduces undesirable amplitude, phase, and frequency distor- tions to the signal being recorded. This article describes testing methods used to evaluate the effect of these distortions on the quality of the television image ultimately produced.
1. Introduction
The signal recorded by the electro -mechanical cutter is a 2.5 -MHz carrier frequency modulated by hurried subcarrier television video information at one half the real-time rate. The minimum bandwidth required to resolve the first order sidebands of the highest video frequency (1.5 MHz at half real time) extends from about one to 4.5 MHz. These frequencies must he reproduced with high fidelity in the recording process.
In addition to the video spectrum, stereo sound carriers are recorded as amplitude modulation at about 358 kHz and 452 kHz (one-half real time). ItF response at these frequencies relative to the video carrier must be well controlled in order to maintain proper audio -carrier -to - noise characteristics.
An overall basic recording bandwidth of 5 MHz is used in half real- time recording. The manner in which the cutter and its associated equalizer modifies the amplitude, phase, and distortion characteristics of the rf within this bandwidth will determine the degree of fidelity of
116 RCA Review Vol. 43 March 1982
TESTING METHODS
the cutter -equalizer pair. Cutter evaluation tests therefore are a mea- sure of the cutter -equalizer pair as a unit.
The evaluation of cutter performance must be made in terms of its effect on the quality of the television image ultimately produced. The following parameters are measured in making this evaluation. (a) Chroma Differential Gain. This is a measure of color intensity
change clue to variations in luminance level. If differential gain is
poor the brilliance of a color will appear to change as it moves in or out of differently lit scenes.
(h) Chroma Differential Phase. This is a measure of color hue change due to variations in luminance level. If differential phase is poor, the color of an object will appear to change as it moves in or out of differently lit scenes.
(c) Luminance Response. This is the amplitude response of the 3 -
MHz bandwidth luminance channel. Poor luminance response can effect picture fine detail resolution and transient response at the edge of objects.
(d) Chroma Beat. This is an rf interference beat that occurs in the luminance channel as a result of haseband and harmonic distortion in the FM domain. Bad chroma beat would produce fine wavy lines in a picture and would be most noticeable in red or blue colors.
(e) Audio RF Response. This is the rf amplitude response in the domain of the stereo audio carriers. This test is used primarily to verify that the rf response about the audio carriers is flat. Variations in level between the carriers could make carrier setup more difficult when cutting a substrate. These parameters are also influenced by the characteristics of the
playback device, which can be a capacitance pickup player for playback of a pressed disc or a laser reader for playback of a substrate. Because of this, many: measurements are comparative in nature, the absolute value representing total system response.
2. Cutter Characteristics
The ideal electrical equivalent circuit for the mechanical cutting motion of a cut ter is a series resonant circuit with a Q of: about 8 to 10.
The actual characteristics of a cutter, however, can deviate from the ideal in several ways. Fig. 1 (curve A) shows a comparison of an ideal response to that of a typical cutter. The most important of these deviations are: (1) Spurious peaks in the area of the stereo sound carriers. (2) Cutter shear mode resonance which distorts the cutter amplitude
response below the cutter resonance. (3) Distortions that alter the response above cutter resonance.
RCA Review Vol. 43 March 1982 117
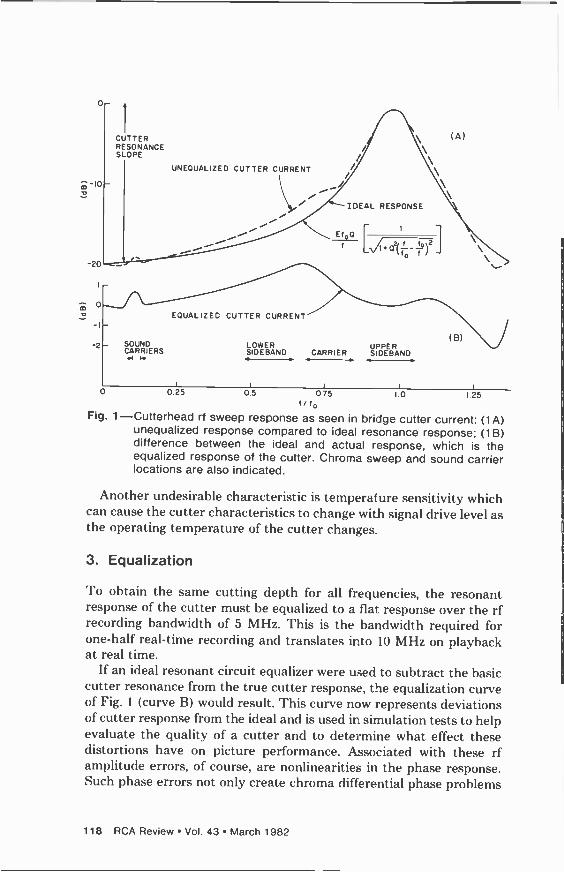
1 CUTTER RESONANCE SLOPE
-10
-20
_2 -- SOUND CARRIERS N H
UNEQUALIZED CUTTER CURRENT
EQUALIZED CUTTER CURRENT
(A) \ \
\
\ -IDEAL RESPONSE
1
Ef Q -- 01 f
fo 2
0
SIDEBAND CARRIER UPPER
(B)
\ \
0 0.25 0.5 0.75
filo I.0 1.25
Fig. 1-Cutterhead rf sweep response as seen in bridge cutter current: (1 A) unequalized response compared to ideal resonance response; (1 B) difference between the ideal and actual response, which is the equalized response of the cutter. Chroma sweep and sound carrier locations are also indicated.
Another undesirable characteristic is temperature sensitivity which can cause the cutter characteristics to change with signal drive level as the operating temperature of the cutter changes.
3. Equalization
To obtain the same cutting depth for all frequencies, the resonant response of the cutter must be equalized to a flat response over the rf recording bandwidth of 5 MHz. This is the bandwidth required for one-half real-time recording and translates into 10 MHz on playback at real time.
If an ideal resonant circuit equalizer were used to subtract the basic cutter resonance from the true cutter response, the equalization curve of Fig. 1 (curve B) would result. This curve now represents deviations of cutter response from the ideal and is used in simulation tests to help evaluate the quality of a cutter and to determine what effect these distortions have on picture performance. Associated with these rf amplitude errors, of course, are nonlinearities in the phase response. Such phase errors not only create chroma differential phase problems
118 RCA Review Vol. 43 March 1982

TESTING METHODS
but also modify the relationships of distortion spectra which then
makes their correction more difficult. In actual substrate cutting for production, the equalizer used is more
elaborate than a basic resonant circuit in order to also compensate for some of these distort ions.
4. Required Test Signals
The effect of cutter characteristics on television signal parameters, either during simulation tests or test recordings, are measured by use
of the following test signals: (a) RF Sweep-Measures 0.5-5 MHz system rf amplitude response.
During simulation tests, group delay (phase linearity) can also be
measured. (h) aroma Sweep-Measures chroma differential gain and chroma
heat at the demodulator output. During simulation tests differential phase can also he measured. This signal is generated by frequency modulating a 2.5 MHz carrier
with the signal shown in Fig. 2A. The low -frequency sawtooth sweeps
the carrier from 2.5 to 3 MHz which represents the black to white range of luminance. Simultaneously this carrier is frequency modulated with the chromanance carrier. 'Phis produces the rf carrier and side - band spectrum display of Fig. 2B. Since this test signal sweeps at a low
frequency rate, it produces a clean rf spectrum in both the rf domain and the demodulated video domain. No sidehand components of the sweep rate obscure the spectra being analyzed.
For chroma beat measurement, the chromanance carrier amplitude is set to about 200 IRE units to simulate maximum chromanance level.
For differential phase and differential gain measurements the level is
set at 120 IRE units to match the level used with the linearity ramp test. (c) Chroma Stepped-Measures chroma beat. This signal is similar to
the chroma sweep test signal except that the rf carrier is modulated in six discreet steps rather than being swept. The demodulated chroma beat is displayed on a spectrum analyzer as six discrete spectra spaced at 100 KHz intervals between i to 1.5 MHz (half real
time). This helps distinguish the chroma heat spectra more easily from noise and other spurious beats when pressed discs are played back.
(d) Video Sweep-Measures luminance amplitude response in a 1.5
MHz bandwidth. This signal is generated by frequency modulating the 2.5 MHz carrier with a signal that is sweeping from 0 to 1.5 MHz (half real time).
(e) NTSC Linearity Ramp-Used to measure overall chroma differ -
RCA Review Vol. 43 March 1982 119
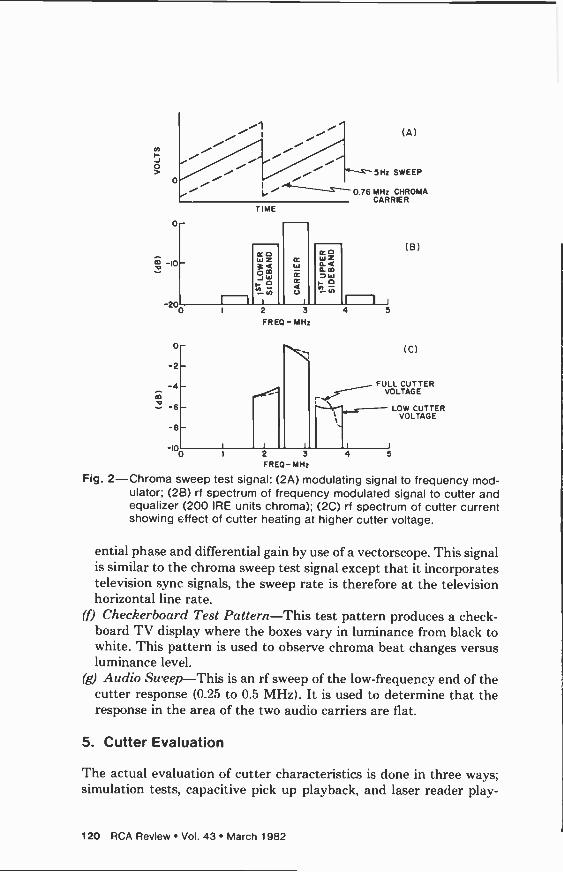
In
o
/i1 /i' (A)
i i / / / i SHz SWEEP o' i L'"0.76MHz CHROMA
CARRIER
0
200
0
-2
-4 vo -6
-8
R O w a4 am 7 w H O
V,
100
2 3
FREO - MHz
1 1
2 3
FREO- MHz
4 5
(B)
(C)
FULL CUTTER VOLTAGE
LOW CUTTER VOLTAGE
1 I
4 5
Fig. 2-Chroma sweep test signal: (2A) modulating signal to frequency mod- ulator; (2B) rf spectrum of frequency modulated signal to cutter and equalizer (200 IRE units chroma); (2C) rf spectrum of cutter current showing effect of cutter heating at higher cutter voltage.
ential phase and differential gain by use of a vectorscope. 'Phis signal is similar to the chroma sweep test signal except that it incorporates television sync signals, the sweep rate is therefore at the television horizontal line rate.
(f) Checkerboard Test Pattern-This test pattern produces a check - board TV display where the boxes vary in luminance from black to white. This pattern is used to observe chroma beat changes versus luminance level.
(g) Audio Sweep-This is an rf sweep of the low -frequency end of the cutter response (0.25 to 0.5 MHz). It is used to determine that the response in the area of the two audio carriers are flat.
5. Cutter Evaluation
The actual evaluation of cutter characteristics is done in three ways; simulation tests, capacitive pick up playback, and laser reader play -
120 RCA Review Vol. 43 March 1982

TESTING METHODS
back. Simulation tests evaluate the basic cutter as ideally as possible by monitoring the characteristics of the cutter current. These mea- surements give a good indication of how well a cutter should perform under actual cutting conditions.
Capacitive pickup playback evaluates the pressed disc that even- tually results from processing the copper substrate while laser reader playback evaluates the copper substrate as originally cut by the cutter.
5.1 Simulation Tests
To adjust the equalizers needed for each cutter and to help evaluate cutter designs without actually making a recording, a means of moni- toring cutter current is necessary. Since the equivalent series resonant circuit of the cutter also has a shunt stray capacitance associated with it, that capacitance must be neutralized in order to monitor only the cutter current. This cutter current, when integrated, is t hen a measure of cutter movement.'
Fig. :3 shows the electrical equivalent circuit of a cutter being driven by a wide band 4:1 transformer. The signal to be monitored is measured across capacitance Cs,. A capacitor is used instead of a resistor so as to integrate the cutter current, because a measure of cutter displace- ment is desired and it is the charge that is equivalent to this displace- ment.
The undesirable shunt current (Is) is cancelled by the out -of -phase current (IT) injected by proper adjustment of CT. The current sensed by C.t, is then a measure of cutter current (Ic) only.
The value of CT can be determined in two ways. First, the Q of the cutter resonance can be measured after CT is set to its approximate value. The resonant circuit slope can then be calculated as 20 log Q
R.F. SIGNAL INPUT II
1 14
CT
.44°
IT
I -+I c
I
I R I Cs L
II
L -0> Is J CUTTER ---4-
IM
TCM
ICM=Ic+is-IT=IC WHEN IT = Is
CUTTER CURRENT SIGNAL OUTPUT
Con »C OR Cs
Fig. 3-Electrical equivalent circuit of a cutter shown in a circuit used to cancel the shunt capacitance Cs in order to measure the cutter current Ic.
RCA Review Vol. 43 March 1982 121
(Fig. 1, curve A). Second, the slope can he directly measured from similar curves obtained by means of an interferometer which uses a laser to measure the actual cutter motion.' The value of CT is then adjusted to obtain this same slope measurement while observing the unequalized rf response of the cutter in the cutter current.
Cutter current measurement is sufficiently accurate to perform all simulation test measurements, both at low and high cutter voltages. Some cutter nonlinearities due to the isolator, such as those below 1
MHz, are not resolveable by this technique but can be analyzed by means of the interferometer.
Tests Performed
Only two test signals are necessary to adequately evaluate the perform- ance of a cutter during simulation tests. Using cutter current as a measure, these tests are as follows:
HF Sweep Test: The unequalized rf response of the cutter is mea- sured (Fig. 1, curve A) and the value of CT is set as previously described. An equalizer designed to compensate for the basic cutter resonance is then inserted in the signal path and adjusted to obtain the flattest (equalized) rf response (Fig. 1, curve B) and most linear phase response (flattest group delay). The resulting equalized rf and group delay response is a measure of the cutter deviation from the ideal. An ideal response would be flat over the cutter's 5 -MHz band- width.
Chroma Sweep Test: This is a very versatile test signal and is used to evaluate the effect of the equalized cutter on chroma differential gain, chroma differential phase, cutter temperature stability, and chroma beat.
Chroma Differential Gain and Phase
The manner in which an equalized cutter effects the amplitude re- sponse of the carrier and its first upper and lower sidebands, and the phase relations between them, determines the chrominance different ial phase and gain error. These measurements are made by demodulating the cutter current signal to obtain the chrominance signal and then measuring its change in phase and amplitude with a half -real-time phase comparator test unit.
Fig. 2, curve B shows the chroma sweep rf spect rum as it is generated for a 200 IRE unit level of chroma. This chroma sweep spectrum location is also shown below the cutter equalized response in curve B of Fig. I. The variations in amplitude seen in the equalized response at
122 RCA Review Vol. 43 March 1982

TESTING METHODS
the chroma sweep locations will also occur to the amplitude of the chroma sweep spectrum. This amplitude variation is illustrated in Fig. 2C. The result of these amplitude variations is the production of chroma differential gain error in the demodulated chroma signal. Associated phase nonlinearity in this region similarly produces chroma differential phase error in the demodulated chroma signal. Any mis - adjustment of the equalizer or any change in equalization due to cutter heating therefore translates into differential phase and gain errors.
Temperature Stability
Monitoring changes in cutter characteristics due to cutter heating by the applied signal" can be made by observing the chroma sweep rf response as the applied signal is increased with the cutter mounted in free air. Ideally, response should remain unchanged up to full cutter drive voltage. However, as the cutter temperature rises, rf response of the cutter -equalizer pair can change. This change can he seen primarily at cutter resonance but also occurs at the shear mode distortion (Fig. 2C).
The effect of this response change on chroma differential phase and gain can also be seen in Figs. 4A and 4B. The magnitude of this error would not be as severe as shown during actual recording, however, since some heat is carried away in the cutting process.
Problems can occur in the assembly of a cutter, however, which can make the cutter more sensitive to temperature. By simply applying the chroma sweep test signal at a relatively high level, its stability can be verified and possible problem cutters weeded out.
Chroma Beat
Fig. 5A shows the chroma sweep rf spectrum of the cutter current with the principle distortion spectra shown as dashed lines. The baseband chroma fundamental is not a problem, since it demodulates to a 3.5 MHz component which is outside the system video bandwidth of 3
MHz. Baseband second harmonic, however, produces a component that falls inside this bandwidth. The second lower sideband of the rf carrier second harmonic, shown as 2f,. - 2f,,,, also demodulates into an identical in -hand distort ion component.
The frequency demodulated spectrum of this signal is shown in Fig. 5B. The desirable chroma signal is shown as a single spectra at about 0.76 MHz. The baseband second harmonic and (2f,. - 2f,,,) components, acting as lower and upper FM sidebands about the carrier (f,.), de- modulate into the indicated chroma beat spectrum.
RCA Review Vol. 43 March 1982 123

10- (A) CHROMA DIFFEREN rIAL PHASE
5
CUTTER VOLTAGE (FREE AIR) FULL LEVEL
)///' N W w /_LOW LEVEL
rc 0 w - o
<MIDLEVEL -5 /
10
BLACK 2.50
-10
LUMINANCE LEVEL CARRIER FREQUENCY (MHz)
(B) CHROMA DIFFERENTIAL GAIN
WHITE 3.15
CUTTER VOLTAGE (FREE AIR)
LOW LEVEL
MID LEVEL
FULL LEVEL 20 I
BLACK LUMINANCE LEVEL WHITE 2.50 CARRIER FREQUENCY (MHz) 3.15
Fig. 4-(A) Chroma differential phase change due to increasing cutter tem- perature as the applied chroma sweep cutter voltage is increased and (B) chroma differential gain change for the same cutter voltage levels.
As shown in Fig. 5A, when the carrier is at 2.5 MHz (video black level), the upper and lower distortion sidebands are 1 MHz away from the carrier and therefore demodulate into an undesirable spectra at 1
MHz. When the carrier is at about 3.1 MHz (video white level) these sidebands are about 1.6 MHz away from the carrier which demodulates into 1.6 MHz. The magnitude of this beat is dependent on many factors, such as how well the equalizer is able to compensate the cutter characteristics, the playback device (capacitive stylus or laser), rf filtering preceding the demodulator limiter, and the symmetry of the limiter itself.
Testing therefore is necessary not only to optimize cutter design but to optimize overall system performance.
124 RCA Review Vol. 43 March 1982
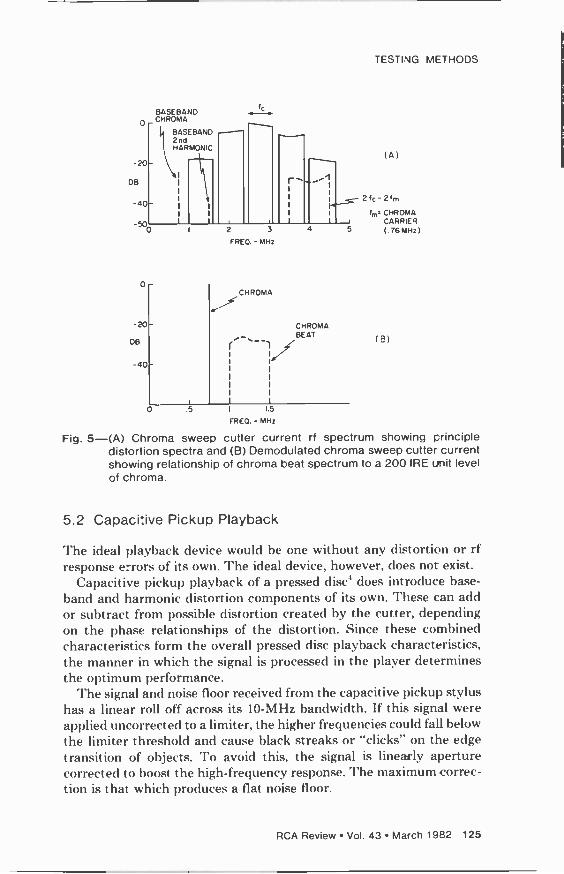
BASEBAND CHROMA
BASEBAND 2nd HARMONIC
- 20 -
D8
-p
1c
r-_ -1
0.-
-20
De
-40
o ._
.5
2 3
FREQ. - MHz
CHROMA
1.5
FRED. - MHz
CHROMA BEAT
TESTING METHODS
(4)
- 2/c -21m
Im= CHROMA CARRIER
5 (.76MHz)
(B)
Fig. 5-(A) Chroma sweep cutter current rf spectrum showing principle distortion spectra and (B) Demodulated chroma sweep cutter current showing relationship of chroma beat spectrum to a 200 IRE unit level of chroma.
5.2 Capacitive Pickup Playback
The ideal playback device would be one without any distortion or rf response errors of its own. The ideal device, however, does not exist.
Capacitive pickup playback of a pressed disc' does introduce base - hand and harmonic distortion components of its own. These can add or subtract from possible distortion created by the cutter, depending on the phase relationships of the distortion. Since these combined characteristics form the overall pressed disc playback characteristics, the manner in which the signal is processed in the player determines the optimum performance.
The signal and noise floor received from the capacitive pickup stylus has a linear roll off across its 10 -MHz bandwidth. If this signal were applied uncorrected to a limiter, the higher frequencies could fall below the limiter threshold and cause black streaks or "clicks" on the edge transition of objects. To avoid this, the signal is linearly aperture corrected to boost the high -frequency response. The maximum correc- tion is that which produces a flat noise floor.
RCA Review Vol. 43 March 1982 125

This signal must also pass through a nonlinear aperture corrector (NLAC), which reduces audio beats in the picture, and through a bandpass filter to improve the demodulated signal-to-noise ratio. The signal is then symmetrically limited before being demodulated. These four signal -processing steps can improve or worsen chroma beat, differential phase, and differential gain since each step can alter the phase, amplitude, and signal symmetry seen by the limiter. Ideally the limiter wants to see a symmetrical signal. If the signal is not symmet- rical, the second harmonic component increases at the limiter output which will increase chroma beat.
The phase characteristics of these processing circuits, when com- bined with those that exist in the recording, can also make distortion components appear more or less as AM or FM. The more AM in nature they can be made to be, the more the distortion will be reduced by the limiter.
It can be seen therefore, that given a specific cutter and capacitive pickup design, the proper adjustment of the cutter -equalizer and player -input characteristics will determine optimum system perform- ance.
In making comparative cutter measurements, however, the limiter is first balanced, using an ideal chroma sweep test signal, so that the demodulated chroma beat is at a minimum. The signal from the capacitive pickup is then applied directly to the limiter without any filtering in order to avoid any further modification of the amplitude or phase of the FM spectrum by filter characteristics.
An overall system comparative performance evaluation of cutters can be made in this way and judgements made as to how different cutter designs effect system parameters.
5.3 Laser Playback
As with capacitive pickup playback, laser playback of the substrate also introduces its own distortion and rf response characteristics. The laser reader' reads the signal on a substrate (originally cut copper master) by sensing the reflection of a laser light beam from the signal modulation recorded in the grooves of the recording. The reader uses a split -detector system to detect this reflected light in order to extend the ability of the laser to resolve the shorter wavelengths recorded with the RCA VideoDisc format. However, the laser reader still has its problems when used as a measurement tool for cutter evaluation.
RF response of the laser rolls off 6 dB per octave below 3 MHz. This influences the magnitude of chroma baseband distortion and the output level of the recorded sound carriers. Also, since the laser reader
126 RCA Review Vol. 43 March 1982

TESTING METHODS
is a wavelength sensitive device, the high frequency response will suffer as the radius played decreases. This occurs because as the radius decreases the recorded wavelengths become shorter and the laser's ability to resolve the higher frequencies therefore decreases. The effect of this high -frequency roll off is minimized by limiting tests, meant for laser playback, to the outer radius of the recording.
Roll off in low -frequency response attenuates the haseband distor- tion, while roll off of high -frequency response attenuates second har- monic distortion.
Since chroma beat results from these distortions, such frequency response roll off will produce errors in chroma beat measurements. Also, any frequency roll off that influences the chroma first -order sidebands will produce errors in chroma differential phase and gain measurements. For these reasons, reliable absolute measurements are difficult to make. However, for the purpose of comparing the charac- teristics of various cutter designs laser playback data is usually ade- quate.
References:
' G. A. Alphonse, "A Method for the Characterization of Piezoelectric VideoDisc Recording Heads Using a Bridge Circuit," RCA Review, 43, p. 84, March 1982 (this issue). 2 K. F. F.tzold, "A 9uadrature Michelson Interferometer System for Probing Surface Vibrations: Application to VideoDisc Cutters," RCA Review, 43, p. 95, March 1982 (this issue).
G. A. Alphonse, "Power Dissipation in Piezoelectric Cutterheads," RCA Review, 43, p.
35, March 1982 (this issue). .1. K. Clemens, "Capacitive Pickup and the Buried Subcarrier Encoding System for the
RCA Videol)isc," RCA Review, 39, No. I, p. 33, March, 1978. `' I. Gorog, "Optical 'Techniques Developed for the RCA \'ideol)isc," RCA Review, 39, No. i, p. 162. March, 1978.
RCA Review Vol. 43 March 1982 127

Obviously, the actual reader is much more complicated than this simple concept.
The laser reader described in this paper is a new version of a reader that has been in use for several years'.2. The new one was designed with two major goals: reproducibility and improved accuracy and stable focusing. Several systems will be needed as disc production expands, and RCA would like subsequent machines to be built by outside contractors. Therefore, more than the usual consideration was given to producing an integrated, complete system, fully documented and having as few custom designed components as possible.
Because the reader is primarily used as an inspection tool in pro- duction, simple operation and consistent results are important even though extraordinary tolerances are required. This is particularly true of the focus system, which automatically keeps the lens focused on the spinning substrate with an accuracy of about 20 nm (see Sec. 5).
One desired goal, which the system did not meet, was to improve reader linearity to provide better measurements of recorded beats and harmonics. A great deal of analysis and experimentation was carried out in that area. The origins of nonlinearity are now much better understood, but the conclusion is that, so far, the inherent optical nonlinearities cannot be eliminated in any practical system.
On the other hand, the understanding of system response gained from these studies led to the concept of optical low-pass filtering to improve reader audio performance.
2. Optical Detection of Phase -Only VideoDisc Signals
The principles of optical reading of CED signals, notably phase -only, relief patterns with dimensions of about a wavelength of light, some- times less, have been described in the literature1"3. Here, we will extend those results to consider focus effects, nonlinearity, and effects of the V-shaped groove in the present CED format.
We begin with a simplified case. Assume that the signal on the CED VideoDisc is a depression whose depth is sinusoidal along the spiral groove, so that as the disc rotates, the height of the reflecting surface at the focus of the lens varies sinusoidally (Fig. 2). The groove is assumed to be very wide, reducing the problem to one dimension. At any instant, the disc surface can he considered as a grating causing the reflected cone of light to he diffracted into three cones, the +1, 0, and -1 orders. The diffraction and cone angles in Fig. 2 correspond to realistic dimensions. The entire reflected 0th -order passes hack through the lens, but only portions of the first orders do. After reflection at the beam splitter, the beam fills a circle as shown at the right of the figure.
130 RCA Review Vol. 43 March 1982

BEAM SPLITTER
VIDEODISC SUBSTRATES
~ I TYPICALLY DISC 85 nn MOTION
Fig. 2-Schematic representation of the diffraction pattern from sinusoidal grooves.
In the absence of any signal, i.e., no grating, there would he only the 0th -order beam forming a uniformly illuminated circle. The references cited show that as the disc turns, the desired signal information is contained in the interference between the 0th -order beam and either of the 1st -order beams, and further, that the two signals, 0 interfering With +1, and 0 interfering with -1, are 180° out of phase. The output of a photodetector placed in this beam, illuminated by either the upper or lower halves of the circle at the right of Fig. 2, will reproduce the signal. But the best arrangement is a split photodetector, with the two 180° signals subtracted (Fig. 3). This is the basic detector used in all the CEI) optical readers.
If this model is simplified even further, and a uniformly illuminated square lens aperture is assumed, the frequency response of the optical detector system can easily he predicted. Fig. 4 shows a square aperture with a square split detector. The location of the entire first -order beams is shown for clarity, although it is obvious that on'_y the portions inside the square lens aperture ever reach the detector. Fig. 5 illustrates the illumination of the detector by the three orders. The 0 -order always fills both halves of the detector.
RCA Review Vol. 43 March 1982 131

SPLIT / -I/'\\ PHOTODETECTOR SIGNAL
\4i/r Fig. 3-Split detector arrangement.
Consider first a very high spatial frequency on the disc, which would produce a very high temporal frequency if played back. If the frequency is sufficiently high, as in Fig. 5a, the diffraction angle will be so great that neither 1st -order beams will reach the detector, and there will be no signal. For a slightly lower spatial frequency, the diffraction angle will be small enough that there will be some over ap of the 1st -orders with the 0 -order, shown by the shaded rectangles in Fig. 5b. These shaded areas produce the desired playback signal as the disc spins.
BEAM SPLITTER
,1
/ I
i
0 ORDER
AUr4 / :
,
DISC
SQUARE LENS
I/ V
SPLIT DETECTOR
Fig. 4-Schematic representation of the diffraction pattern using an objective lens with a square aperture.
132 RCA Review Vol. 43 March 1982
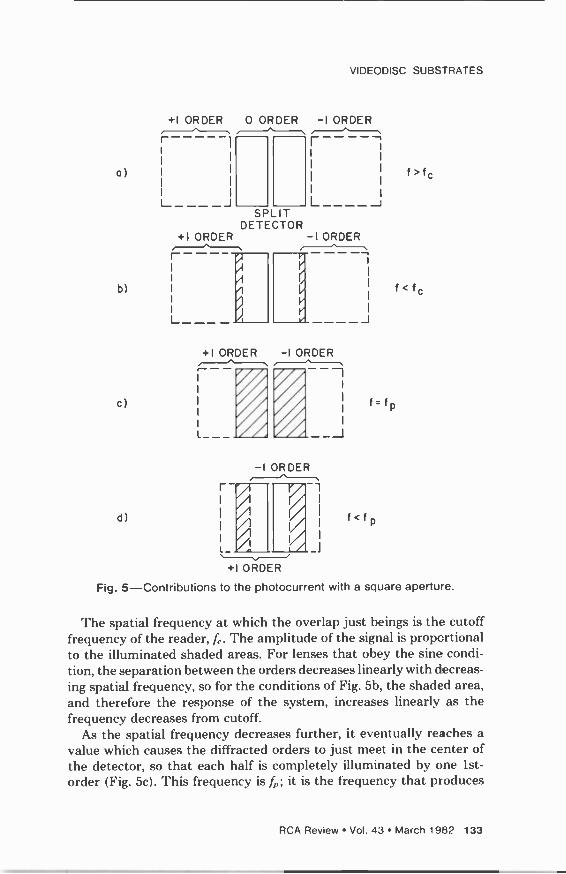
VIDEODISC
+I ORDER 0 ORDER -I ORDER
SUBSTRATES
a) f>fc
, r .. . r
L_ L_-___ _-_J SPLIT
DETECTOR +I ORDER -I ORDER
b) I
I L____
c)
d)
+I ORDER -I ORDER -^ f=fp
J
-I ORDER
J
f<fp
f<fc
Fig. 5-Contributions to the photocurrent with a square aperture.
The spatial frequency at which the overlap just beings is the cutoff frequency of the reader, 4. The amplitude of the signal is proportional to the illuminated shaded areas. For lenses that obey the sine condi- tion, the separation between the orders decreases linearly with decreas- ing spatial frequency, so for the conditions of Fig. 5b, the shaded area, and therefore the response of the system, increases linearly as the frequency decreases from cutoff.
As the spatial frequency decreases further, it eventually reaches a value which causes the diffracted orders to just meet in the center of the detector, so that each half is completely illuminated by one 1st - order (Fig. 5c). This frequency is f,,; it is the frequency that produces
RCA Review Vol. 43 March 1982 133

the largest response. For lower frequencies, there are areas of the detector illuminated by both interference patterns, +1 and 0 as well as -1 and 0, which cancel because they have opposite phase, (Fig. 5d). Only the outer shaded rectangles contain the required combination of 0 -order and just one of the 1st -orders. Thus the effective areas now decrease with decreasing spatial frequency. As the frequency ap- proaches zero, the diffraction angles approach zero and the shaded areas in Fig. 5d disappear. Thus, optical readout of the CED disc has no response at zero frequency.
Since the areas of the rectangles are proportional to spatial fre- quency in this ideal example, it is easy to plot the response of the system (Fig. 6). It is a bandpass response, with the signal falling linearly from a central peak, located at half the cutoff frequency. The actual cutoff spatial frequency depends on the wavelength of the light and the numerical aperture of the focusing optics, as determined by the beam limiting aperture. The temporal frequencies then depend further on the speed of the disc beneath the light beam, that is, on the radius and rotation speed of the disc. Fig. 6 presents some typical values, to give more meaning to these parameters.
Although the model used here is a gross simplification, the response of the actual system is surprisingly similar. Fig. 7 shows a plot of the output of the spectrum analyzer on the player reading a disc with a sweep frequency recording (the measured system response) compared to the calculated curve of Fig. 6 replotted on the same coordinates and including the measured electrical response of the detectors. The agree- ment is very good given the extremely idealized model used for this calculation. In fact, the biggest difference, the dip in the measured
SIGNAL AMPL.
X =0.633 nm na= 0.80
fpeak (cutoff SPATIAL FREQ.
1250 2500 CYCLES/mm
9 18 MHz FOR 450 rpm, R=6 in
Fig. 6-Calculated frequency response of an optical CED VideoDisc reader with a square lens aperture.
134 RCA Review Vol. 43 March 1982

0
-10
-0 -20
-3D
VIDEODISC SUBSTRATES
--- IDEALIZED OPTICAL RESPONSE
------ MEASURED SYSTEM RESPONSE
IDEAL OPTICAL x MEASURED ELECTRICAL RESPONSE
o--o-- X-o--o Igi^
e°*'' / o
0 2 4 6 8 10
(MHz)
Fig. 7-LSR-1 frequency response at a radius of 6.0 inches.
response at 9 MHz, is attributed to the recording process, and therefore has nothing to do with the player.
3. Effect of Focus Error on Differential Optical Readout
General descriptions of differential optical detectors have been given' with far more rigor than the previous discussion in this paper. But the specific details of focus effects have not been described.
It is convenient to unfold the optical system and analyze it as if it were a transmission system (Fig. 8). Assume that the illuminating beam is an infinite, uniform intensity plane wave, incident from the left and propagating in the direction. The objective lens is repre- sented by two identical, ideal diffraction -limited lenses, L1 and L2. The incident beam is focused onto the disc surface by L1, while L2 collects the light diffracted by the disc and projects it onto the detectors. The lenses have focal length f, and, in the absence of focusing error, they
f f+ f
II I n 1
I I ®--Z I I
V x
1 L I L2 LIMITING DISC DETECTOR
APERTURE PLANE PLANE PLANE Fig. 8-Unfolded schematic of the readout optics.
RCA Review Vol. 43 March 1982 135

are located at a distance f from the disc. The lenses are assumed to be well corrected, so they satisfy the Abbe sine condition. Any ray that leaves the disc surface at an angle a with respect to the disc normal emerges from L2 at distance S from the axis, where S = f sin a (Fig. 9). The beam -limiting aperture is located in the front focal plane of L, .
The disc is rotating in the focal plane between L, and L2. The disc tangential direction coincides with the x -direction, i.e. the signal pat- tern is moving in the x -direction with a linear speed t'. The signal is assumed to be a sinusoidal phase relief with peak -to -peak depth d and with recorded wavelength A. Furthermore, assume that the transverse dimension (in the disc radial direction) of the grating is much larger than the corresponding dimension of the light spot incident on it. Thus, the signal pattern is treated as a one-dimensional phase grating, as in the previous simple analysis.
The disc reflectivity is then described in the equivalent fold -out configuration by the transmission function
ixinl 2^Ix-MJ im 2nlx-N)
T=e LA =1:J,,,(e)e A
n,
lIJ
where e = 2ad/A, A is the wavelength of the read-out light, t is the time variable, and J, (e) are Bessel functions of the first kind. For simplicity of notation, J,,, = J,,(i;) is used. Utilizing the well known Fourier transforming properties of lenses', the light amplitude distribution in the detector plane can be described as
V(x, y) = E J,, ein," A,,,(x, y) [2I
n,
where w = 27v/A, and An,(x, y) is the image of the input beam limiting aperture projected by the m-th diffraction order through lens L2 onto the detector plane. Ao(x, y) is an exact inverted replica of the input aperture, i.e., Ao(x, y) = 1 inside the region where light would fall on the detector plane if there were no phase perturbations at the disc plane and Ao(x, y) = 0 outside this region. In general, A,,,(x, y) is
Fig. 9-Diffracted ray propagation.
136 RCA Review Vol. 43 March 1982

VIDEODISC SUBS -RATES
identical to A0(x, y) but shifted in position in the x -direction by an amount mf A/A. It is also zero outside of the circle of radius R = f(NA), where NA is the numerical aperture of lens L2. Fig. 5b illustrates the aperture function, assuming a rectangular input beam limiting aper- ture. In Fig. 5b, A, (x, y) = 1 inside the left shaded region and i5 zero outside of it; likewise A_,(x, y) = 1 inside the right shaded region and is zero outside of it. The detector photocurrent is proportional to the light intensity incident on it and integrated over the detector area. In the case of a split detector, the regions x > 0 and x < 0 are covered by separate detectors. Let lo+ and describe the photocurrents produced from the x > 0 and x < 0 regions, respectively. Then,
4(±) = J dxdyV(x, y) V *(1', y) [31
r>0 (.r<O)
where the integration extends over the appropriate detector areas. Eq. 121 can be simplified by noting that for the CED VideoDisc d
=80nm,so for A=633nm, =0.8. Then Jo=0.85,.1, = 0.37, J2 = 0.07, J3 = 0.01, and higher order terms get progressively smaller. The amplitude distribution can he approximated over the detector plane by
2
V(x, y) = J,,ein'An,(x, y) 141
-2
By substituting Eq. 141 into 131, the photocurrents can be directly calculated. Since 1,,, = (-1)"'.I_m, the fundamental and second har- monic current contributions are directly obtained as
/0+(wt) = 2JJ,(A0+A2+ - Ao+A±,)cos wt [51
/0 -(cot) = -to+((et) 16]
Io+(2wt) = 2(JoJ.A10+A2+ - J,2A1+A±,)cos 2w1 1 7 1
/0 -(lot) = Io+(2wt) [8]
An,+A+ denotes the mutual overlap area over the x > 0 region of the aperture functions An,(x, y) and A(x, y). Eqs. 151 through 18] show that the difference signal of the split detector enhances the fundamen- tal frequency term and cancels the second harmonic produced by diffraction from a phase grating. For any signal more complicated than a single sinusoid, these expressions become very involved. In general, the nonlinearities associated with the phase grating diffraction and square -law detection processes generate beat terms and harmonic distortions that are present in the split detector output.
In the foregoing, perfect focus was assumed. A focus error of distance
RCA Review Vol. 43 March 1982 137

D will correspond to an L, to L2 distance in Fig. 8 of 2(f+ D), and then the disc plane is located at a distance f + D from either lens. In the presence of a focus error the waves incident on the detector are no longer planar, but they are spherical. For small focusing errors the field amplitude at the detector plane can be written as
V(x, y) = e"°',Y) ;' ig,(x,Y)
,,,
where
gm(x, y) = 277. 1 - [(x - mf Al A) - y2]f-2
From Eqs. 191 and [31 the photocurrent can be written as
I` = J dr dy E E xo n
An,(x, y)An(x, y)eilti,(x.Y)-R(x.Y11
[10]
Thus in the presence of focusing errors every term in the photocurrent sum contains a quadrature component.
This analysis is concerned with the relative sign of these quadrature components in the two halves of the split detector. To simplify the analysis, the contributions made by two points located symmetrically about the y axis to the (m - n)w frequency component of the photo - current are important. Eq. [11] shows that the term corresponding to J»,J»* in the x > 0 region is J*»,J_ in the x > 0 region. Thus the corresponding current contributions from small regions around points x, y and -x, y are
sr = Jn,J» a;lm-n1,.r'e iI ,(x. y)-Rlx, y11 [ 121
SI = J_ J- ei(n,-nl le-,lA_,ls,yl-ti_(.r.Y11 m n 113]
Eq. [ 10] shows that g_,(-x, y) = g,( -r, y) and thus Eq. [13 ] can he rewritten as
SI+ = Jm Je,(nrnla,/ei(:,,,,Ix.Y) [14]
where
SI- = J_ J_ e;(,»-,ne-ra,,.,(x.Yl n, n [15]
G,,,.n(x, y) = g,,,(x, y) - gn(x, y) [16]
If the focussing error is small, [ G,,,.n(x, y) [ « 7r/2. Then the local photocurrents for the symmetric points in the two half planes can be
138 RCA Review Vol. 43 March 1982

VIDEODISC SUBS -RATES
described by
Sr = filo + ifiloGm.,,(r, y)
81- = (-1)1SIo - i810Gn,.n(x, y)]
[171
[18]
where SIo is the local photocurrent at point x, y in the absence of focusing error due to the nr, n interference term and p = I m I + I n I .
The above indicates that the relative phase in the two half planes of the out of focus correction components is opposite to that of the in - focus components. Since Eqs. 117] and 1181 hold for all pairs of symmetric points, the same phase relationship holds when the out of focus correction terms are integrated over the area of the detectors. If the integrated correction terms are called AI, the out of focus photo - currents are
14(wt) = 10+(wt) + i01+(wt) [19]
1 -(wt) = -t0+(wt) + iA1+(wt) [20]
I+(2wt) = I0+(2wt) + i.I+(2wt) [211
1-(2wt) = 10+ (2w1) - iá1+(2wt) [221
Eqs. 1191-1221 are illustrated by phasor diagrams in Fig. 10. In the presence of focus errors, the optically generated second harmonic component cannot be cancelled by a differential readout system. The focus error causes a relative phase shift between the photocurrents detected by the two halves of the photodetector. Since the phase shifts depend on nr, n, and A, the detector balance error is different for each frequency and harmonic term.
As a consequence of the symmetry properties of G,,.n(x, y), the entire detector area does not necessarily contribute to the out of focus photocurrent correction terms. It can be shown that
Gm,n(xm.n + b, y) = -Gmn(xrnn - b, y) [231
where xn,,,, = (nr + n)f A/(2A) and h may have any value such that xn,.,,
rs--- ---- wt
2 w _I
x<0 x>0 Fig. 10-Phasor diagram description of the out of focus photocurrents.
RCA Review Vol. 43 March 1982 139
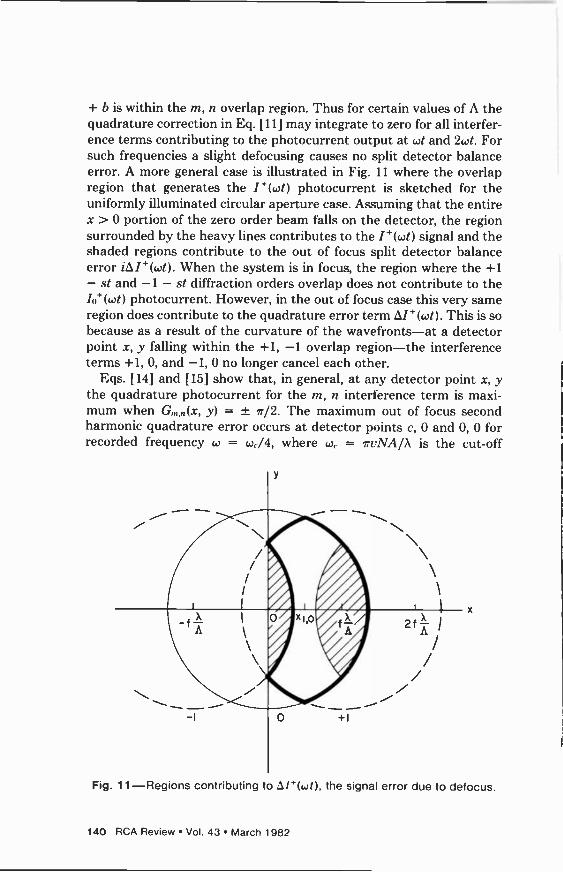
+ b is within the m, n overlap region. Thus for certain values of A the quadrature correction in Eq. 1111 may integrate to zero for all interfer- ence terms contributing to the photocurrent output at wt and 2wt. For such frequencies a slight defocusing causes no split detector balance error. A more general case is illustrated in Fig. 11 where the overlap region that generates the I+(wt) photocurrent is sketched for the uniformly illuminated circular aperture case. Assuming that the entire x > 0 portion of the zero order beam falls on the detector, the region surrounded by the heavy lines contributes to the I+(wt) signal and the shaded regions contribute to the out of focus split detector balance error iDI+(wt). When the system is in focus, the region where the +1 - st and -1 - st diffraction orders overlap does not contribute to the /0+(cot) photocurrent. However, in the out of focus case this very same region does contribute to the quadrature error term 01 +(wt ). This is so because as a result of the curvature of the wavefronts-at a detector point x, y falling within the +1, -1 overlap region-the interference terms +1, 0, and -1, 0 no longer cancel each other.
Eqs. [141 and [ 15] show that, in general, at any detector point x, y the quadrature photocurrent for the m, n interference term is maxi- mum when G,,,,(x, y) = ± it/2. The maximum out of focus second harmonic quadrature error occurs at detector points c, 0 and 0, 0 for recorded frequency w = we/4, where we = rrr'NA/A is the cut-off
l,o
+1
x
Fig. 11-Regions contributing to . l+(wt), the signal error due to defocus.
140 RCA Review Vol. 43 March 1982

VIDEODISC SUBSTRATES
frequency, i.e., the maximum quadrature error occurs when the second harmonic frequency coincides with the mid -frequency of the passband at the detector points located on the axis and at the edge of the aperture. At these points, the quadrature error is maximum when the focus error is
1
1!0 - 41- Ji-NA2 )24)
For no = 1, 0.9, 0.8, the above expression gives D0 = A/4, 1.8(x\/4), 2.5(x\/4), respectively. To keep the harmonic distortion low, it is
important to maintain beam symmetry about they axis. Eq. (23) shows that if the detectors cover their entire respective half planes, the quadrature error integrates to zero at frequency we/2 for symmmtric aperture illumination. When the system is in focus, beam asymmetries can be compensated for by detector gain and detector positioning adjustments. However, such adjustments are simple scaling operations; they do not reconstitute the beam symmetry required to keep the differential detector phase balance error at its theoretical minimum when the system is out of focus.
As discussed previously2, the interference of the wavefronts in the presence of focus errors results in fringes in the detector plane. As a
consequence of the fringes, when a portion of a detector produces a
positive contribution to the photocurrent, another portion of the same detector produces a negative contribution and thus the total photo - current is reduced. As indicated by Eqs. [ 14] and ) 15), the magnitude of the locally generated photocurrent is independent of the focus condition, only the phase changes. Furthermore, as shown in Eqs. 1151
-[22), in the presence of small focus errors the integrated photocurrent is approximately the same as that for the in -focus case, but a small quadrature component is present.
The existence of this quadrature photocurrent component at small focus errors can he of great practical importance. With state-of-the-art focus servo techniques, large focus errors can be eliminated, but small focus errors are likely to occur. Furthermore, spherical aberration makes it impossible to focus perfectly over the entire detector. As a consequence of focus errors, the differential photodetector output is
likely to contain second harmonic distortion. A distortion of particular interest is difference frequency distortion that may interfere with proper recovery of the low frequency sound carrier signals from CED substrates.
If it is assumed that there are two recorded frequencies at w, and w2, the expression for the photocurrent analogous to Eq.) 11) involves a 4 -fold summation. If only terms up to second order in the transmis-
RCA Review Vol. 43 March 1982 141

2.6 µm
GROOVE WIDTH
0.4 µm
GROOVE DEPTH
Fig. 12-VideoDisc signal and groove pattern.
sion expression (see Eq. [1]) are retained, then the photocurrent comprises 625 terms, each of the type
8I+ = J,(1)Jk(2)J*(1)JI*(2)e,ii,-lair+fk-nw2/l [25]
wherein the Bessel function arguments 1 and 2 denote, respectively, the phase depths of the two signals. Symmetrically located points on the two half -plane detectors, show that the differential output is zero for all terms for which I m l+ n I+ l k l+ I l l is an even integer. Likewise, when the sum of the absolute value of the indices is odd the split detector sum output is zero.
The terms that contribute to the signal at frequency w, - w2, particularly when w, and 0)2 are video frequencies whose difference falls in the audio carrier range,* are of importance here. The index sum for such terms shows that the differential output is zero at the difference frequency for the infocus case. Thus, the behavior of the difference frequency signal is analogous to that of the second harmonic. In the presence of focus errors, there will be a differential signal generated by the quadrature terms. If it is assumed that the two
In the CEO format, video is recorded as FM of a 5 -MHz carrier, and audio as FM of a 0.716 -MHz carrier. FM analysis shows that terms like m, - 4...)2 produce "baseband interference, i.e., a component in the FM signal whose frequency is that of the modulating signal. Here, the modulating signal is video, which includes the 0.7 -MHz range, so its baseband can interfere with the audio FM.
142 RCA Review Vol. 43 March 1982
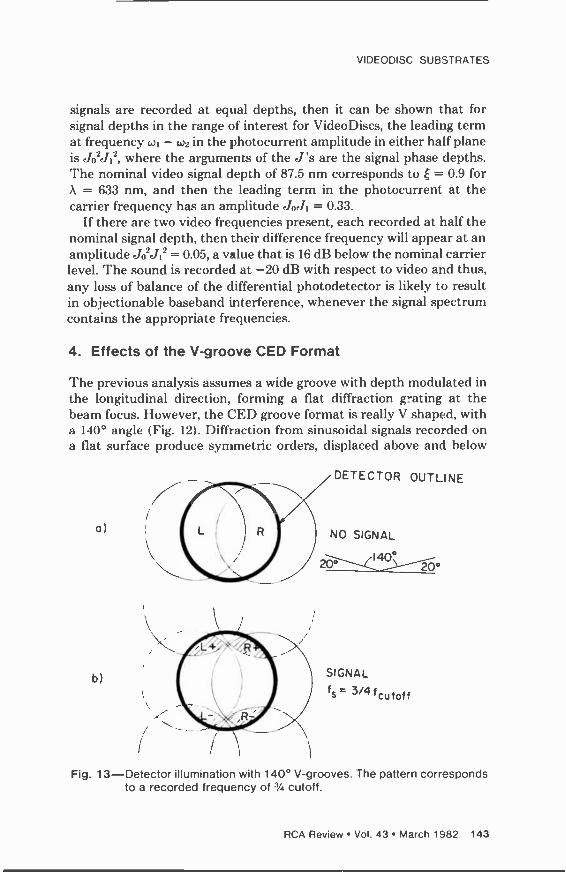
VIDEODISC SUBSTRATES
signals are recorded at equal depths, then it can be shown that for signal depths in the range of interest for VideoDiscs, the leading term at frequency w, - w2 in the photocurrent amplitude in either half plane is Jo2J12, where the arguments of the J's are the signal phase depths. The nominal video signal depth of 87.5 nm corresponds to e = 0.9 for
= 633 nm, and then the leading term in the photocurrent at the carrier frequency has an amplitude JoJ1 = 0.33.
If there are two video frequencies present, each recorded at half the nominal signal depth, then their difference frequency will appear at an amplitude Jo2J12 = 0.05, a value that is 16 dB below the nominal carrier level. The sound is recorded at -20 dB with respect to video and thus, any loss of balance of the differential photodetector is likely to result in objectionable haseband interference, whenever the signal spectrum contains the appropriate frequencies.
4. Effects of the V -groove CED Format
The previous analysis assumes a wide groove with depth modulated in the longitudinal direction, forming a flat diffraction g ating at the beam focus. However, the CED groove format is really V shaped, with a 140° angle (Fig. 12). Diffraction from sinusoidal signals recorded on a flat surface produce symmetric orders, displaced above and below
a)
b)
DETECTOR OUTLINE
NO SIGNAL
20°
SIGNAL
fs= 3/4fcutoff
Fig. 13-Detector illumination with 140° V -grooves. The pattern corresponds to a recorded frequency of 3/4 cutoff.
RCA Review Vol. 43 March 1982 143

the zero order (Fig. 2). The V groove complicates that because it separates the zero order into a left and a right beam by simple reflection from the two faces of the groove, even in the absence of a signal, as in Fig. 13a. In the presence of a signal, each of these 0 orders produces a pair of first orders, (Fig. 13b). The combined effect of the V groove and a fairly high frequency signal, 3/4 f., places all the signal - bearing light near the edges of the aperture, where lens performance is poorest. This is an unfortunate effect of the V groove from the standpoint of optical readout. The improved reader (LSR-1) minimizes the degradation this causes by insuring that the photodetectors cover the entire aperture, so that no signal is lost in the "corners." The signal is obtained by subtracting the beats between the zero and minus orders from the beats between the zero and plus orders, that is, by forming the photodetector signal [(L+) + (R+)] - I(L-) + (R-)]. A tracking error signal is easily obtained by comparing the amplitudes of the signals from the two sides of the groove, e.g. 1(L+) + (L-) I - 1(R+) + (R-) I. Signal and tracking information are obtained from a single quad detector (Fig. 14).
The degradation produced by the V groove does not seem to be significant until the reader characteristics are examined at low fre- quency, in the range of the CED audio subcarrier, 0.716 MHz. Fig. 13b is redrawn in Fig. 15 for a frequency of 1.0 MHz, playing radius of 6 inches, readout lens NA = 0.9, A = 633 nm. Just those areas containing only the required zero order beam and one first order beam contribute to the signal. Fig. 15 shows that, for this low frequency, not only is there a small area contributing to the signal, already known from the
TRACKING
ED
EACH QUADRANT
SIGNAL
TRACKING = (A+C)-(B+D)
SIGNAL =(A+B)-(C+D)
RF
DC
Fig. 14-LSR-1 light detector.
144 RCA Review Vol. 43 March 1982

VIDEODISC SUBSTRATES
+I ORDERS APERTURE no. 0.9
ZERO ORDER FROM ONE SIDE
OF GROOVE -I ORDER-
SINE 400=.64
SHADED AREAS= SIGNAL AT fs WITH fs 1/20 fcutoff =1/10f peak
V -GROOVE 0
Fig. 15-Low frequency diffraction pattern on the detectors with 140° V - grooves and a fully illuminated lens aperture. This pattern corre- sponds to a recorded frequency of 1 /20 cutoff.
bandpass optical response, but also there is a large illuminated area that provides no signal and can contribute noise, particularly surface noise from the substrate which affects all the returned light.
The audio performance of the optical substrate readers has always been poor. In fact, the CNIZ measured on the substrate at 0.716 MHz with the earlier optical readers has typically been poorer than the same measurement on a vinyl disc played with a stylus, while the equivalent measurement at video frequencies has been much better with the optical reader/substrate combination.
This problem has been improved by the addition of an optical low pass filter, simply a slit (Fig. 16). For clarity, only the zero order beam is shown. The slit obviously reduces the system numerical aperture in the signal direction, which compresses the entire bandpass response so
that 0.716 MHz lies nearer to the response peak. However, the com- plete effect of the slit can be best seen in Fig. 17a, which shows the same conditions as in Fig. 15, except for the slit reducing the aperture to 1/10 its full size.
The signal -hearing light is now nearer to the center of the lens, and most of the light containing no signal has been eliminated, reducing noise. Inserting the slit increases the CNR at 0.716 MHz by 8 dB (see
Section 7). Of course, with the slit, the video signals are beyond cutoff, so the improved audio cannot be obtained simultaneously with the video.
The expected response has the same shape as does the square aperture (Fig. 6), but the frequencies are reduced in proportion to the na, making fe = 250c/mm or 1.8 MHz for the condition of that figure. In Section 7, it is shown that the measured response goes higher than expected, and has several secondary peaks well above f, . A reasonable
RCA Review Vol. 43 March 1982 145

a)
b)
SLIT
BEAM SPLITTER/
MOM FULL LENS APERTURE
ZERO -ORDER BEAM
RECORDED SURFACE
Fig. 16-Operation of the aucio slit.
+1 ORDER
ZERO ORDER -v
-I ORDER
APERTURE FOR no=0.9
FROM ONE SIDE OF GROOVE
FROM ONE SIDE OF GROOVE
;%
SLIT WIDTH
APERTURE no. 0.09
Fig. 17-Low frequency diffraction pattern on the detectors with 140° V -
grooves. a) A large lens aperture is limited by the audio slit, b) A
small lens aperture is used.
146 RCA Review Vol. 43 March 1982

VIDEODISC SUBSTRATES
explanation of this effect is diffraction at the slit, which produces an illumination pattern at the lens aperture that is wider than the slit and contains secondary lobes.
The low frequency improvement obtained with the slit cannot he obtained by simply substituting a low numerical aperture optical system (Fig. 17B). The angles of the beams reflected from the sides of the V groove are large enough that high numerical aperture optics are required to capture that light, even in the absence of any signal. In principle, off -axis systems could be made with small apertures to capture one or both reflected beams, but that does not seem practical.
The present player contains an easily removable slit, with appropri- ate atteruators to keep the photodetector signals at suitable levels. The in and out positions of the slit provide two playback modes: normal audio/video, and enhanced audio without video.
5. Automatic Optical Focus System
Focus in earlier VideoDisc optical readers was maintained either by the use of an air bearing mounted on the final objective lens or by a capacitive -sensor -controlled electromagnetic transducer. Both of these approaches had thermal drifts as well as errors dependent on playing radius and on effective sensor aperture size. Accurate focus could be maintained only by manually trimming focus while playing the sub- strates, thus decreasing the accuracy of quantitative data for quality control. A second and more serious problem, particularly with the capacitive sensor, was crashing of the objective lens into the moving substrate. This always ruined a master and could damage the lens and associated components.
Early attempts to utilize standard optical focus sensing methods based on sensing the effects of changes in the disc to objective distance on the returning read-out beam were unsuccessful because in the CED V -groove format, tracking errors and small focus errors could not he clearly separated. The grooves are 450 nm deep and a slight change of readout beam position away from the groove center can cause apparent focus error of several hundred nanometers. This early work suggested that optical focus sensing of CED format discs can he accomplished provided a secondary sensing beam is used so that the focus sensing beam integrates over a number of grooves and is thus insensitive to tracking errors.
The new optical reader uses a secondary infrared laser beam for multigroove optical sensing of the record position, and incorporates an electromagnetic transducer for moving the objective, with mechanical stops to prevent crashing. The drive electronics prevent the objective
RCA Review Vol. 43 March 1982 147

PHOTO DETECTORS
B A
FOCUSED IMAGE OF ILLUMINATED AREA PROJECTED ON PHOTO DETECTORS.
IMAGING BEAM LENS /SPLITTER
i
VIRTUAL POINT SOURCE O
ILLUMINATED AREA
OBJECTIVE LENS
COLLECTING LENS
LASER POINT SOURCE
Fig. 20-Focus sensor ray diagram.
DESIRED FOCAL PLANE
N POINT SOURCE IMAGE
objective lens and a lens system, denoted as the "imaging lens" in Fig. 20, on a plane that contains two split photocletectors. The inner detector halves, B, are fully illuminated while the outer detector halves, A, are approximately half illuminated by the circular image. By nulling approximately half of the combined B detectors outputs against the combined A detctors, a very sensitive measurement of the image diameter can be made. The illuminated area on the desired focal plane is 0.004 inch in diameter, while the image diameter at the photodetectors is 0.4 inch. The 0.004 -inch diameter is about one half of the useful field of view of the objective. This choice allows a
reasonable amount of tracking by the galvanometer while averaging the focus over several VideoDisc grooves. This eliminates the inter- action between tracking and focus found in systems in which the focus signal comes from a small spot less than a groove width in size.
Fig. 21 shows the long range focus sensor characteristic for a Leitz 100x/0.90 NA objective. Inside focus, with the lens low in the reader, the illuminated area is large and dim, and both A and B are totally illuminated. Since the A output is weighted over the B output, a low positive voltage that tends to lift the lens in the closed servo loop is
generated. As proper focus is approached, the illuminated circle di- ameter becomes equal to the outside separation of the A detectors. At this point a maximum signal lifting the lens is produced. At proper focus the A detectors are roughly half covered and zero output occurs. With the lens moving further up, the image diameter decreases and the negative B output outweighs the weighted A output.
As the circle decreases further, approaching and going through focus of the point source image, the output is near zero. Well outside of focus
150 RCA Review Vol. 43 March 1982

-2
-3 -4
-5 -6 -7
-8 -9 -10
-II
-12
VIDEODISC SUBSTRATES
-At- .001" -a-
I lI 1 i
I
I
-8 -7 -6 -5 -4 -3 -2 -I 0 +1 +2 +3 +4 +5 +6 +7 +8 VOLTS
Fig. 21-Long range focus sensor characteristics.
the circle of confusion is once again large and a weak positive signal tends to raise the lens. Thus the range of the focus sensor to obtain proper focus is from approximately 0.0005 -inch outside of focus all the way to lens contact inside of focus. The servo loop can be closed only when the objective is within this focus range.
Fig. 22 shows the short range focus sensor characteristic taken on a
bench test of the system. In the actual machine, the noise increased from 4-nm peak to peak to about 18 nm, due to vibration and a
somewhat wider bandwidth. Also, in the actual machine the sensitivity was reduced purposely from 125 nm/volt to approximately 400 nm/ volt to increase the electrical fine focus range, ie., the amount of focus trimming available by offsetting the focus error signal. The electrical fine focus control is important to the operator, because it is a conven- ient means to assure that the system is always operating at optimum focus set t ing.
Fig. 23 is a block diagram of the servo system. The infrared light from the injection laser is chopped by the 40 -kHz square wave elec- tronic modulator. The chopped light is passed through the optical focus sensing system and is detected by the infrared sensitive photo -
RCA Review Vol. 43 March 1982 151

+4
wcn+3- oz iñ ó+2 - zu- - +1 -
E 0
-1
NOISE= 40A° P -P SLOPE=1250 A°/VOLT
-8 -7 -6 -5 -4 -3 -2 -I 0 +I +2 +3 +4 +5 +6 +7 +8 VOLTS
Fig. 22-Short range focus sensor characteristics.
diodes. A 40-KHz chopped electrical error signal is produced by taking the difference between the sum of the electrical outputs from the A photodiode detectors and subtracting 0.452 times the sum of the electrical outputs from the B photodiode detectors. This modulated, 40 -kHz electrical error signal is amplified and then synchronously detected to produce the error signal in Fig. 21. This frequency was chosen to make the beat frequencies-with the recorded, radially aligned horizontal sync signal and its harmonics-fall outside of the passband of the servo loop.
The focus sensing system optics are adjusted so that when the substrate is in position to give proper focus for readout, the detected focus error signal is at the 0 voltage point on the sloping portion of the curve in Fig. 21. The focus error signal from the output of the synchronous detector is coupled to the automatic focus control logic, which has several functions. Manually pressing a focus button provides automatic acquisition of proper focus. This logic also turns the focus system off if pre-set operating limits for the lens position are exceeded. When a substrate is not being read, the lens is normally in a Lens Up position. A substrate to be tested is first loaded in a low position and it is then raised to a pre -determined operating height. Then the focus button is pressed, initiating the operation of the automatic focus control logic. The lens slowly moves down until it reaches the zero voltage point in the curve of Fig. 21. Then an electronic switch automatically couples the error signal to the servo amplifier. The
152 RCA Review Vol. 43 March 1982

FREQUENCY COMPENSATED
SERVO AMPLIFIER
SYNCHRONOUS.
VIDEODISC SUBSTRATES
INFRARED SENSORS
OPTICS
WIDE BANDWIDTH
LOW PASS DRIVER
J AUTOMATIC FOCUS
CONTROL LOGIC
NARROW BANDWIDTH LOW PASS
DRIVER
DC STATIC POSITIONING
DRIVER
R2
I2
----vv R3 I3
40KHi MOD -
UL ATOR
INFRARED INLEASERN
G N E T
----TRANSDUCER
L LJ M A
Nr,
\--/MICROSCOPE \--/ LENS
1 1 DISC
Fig. 23-Automatic focus servo block diagram.
output of the servo amplifier drives the transducer through the wide and narrow bandwidth drivers thereby completing the signal path for closed loop operation.
There are three current sources driving the transducer in parallel with its damping resistor, RI). The value of RD is set to critically or slightly overdamp the transducer. Only the first two current drive sources are part of the servo loop. The wide bandwidth low-pass driver is current limited by resistor R1 so that at dc the drive current can displace the lens by only twice the expected substrate vertical runout. The combination of R 1, Cl provides a lead network to change the nominal 12-dh per octave transducer roll -off to approximately 6-db per octave.
'Phis circuit also produces a rising current drive characteristic with frequency, but the displacement at any frequency does not exceed the dc displacement. Since current limiting is controlled passively, short- circuit -type failures in the drive amplifiers cannot cause high currents in the transducer that would drive the lens against the mechanical limits. Under open loop conditions, the narrow bandwidth low-pass servo driver is current limited, permitting the lens to be moved to the upper and lower limits provided by the mechanical stops. Under closed loop conditions, the servo loop is automatically opened if the narrow bandwidth driver displaces the lens by about plus or minus 2 mils.
After the loop is opened, the lens is automatically lifted to a Lens
RCA Review Vol. 43 March 1982 153
Up position, close to the upper mechanical stop. The narrow band- width driver essentially adjusts the closed loop dc -operating point of the wide bandwidth driver so that its output is averaged near zero, thus decreasing its dc -drive range requirements. Since the narrow bandwidth driver has a wide displacement range, its speed of response has purposely been made slow to prevent it from slamming the lens against the substrate or the mechanical stops. The narrow bandwidth servo driver allows the tolerances to be increased for the initial positioning of the substrate for nominal focus. Also, thermal drifts occurring during operation can he taken up by this servo. The narrow bandwidth servo driver also provides the function of supplying the current drive for lifting the lens to its rest or Lens Up position.
The nominal focus operating position of the lens is set by the dc - static positioning current driver which is not part of the servo loop. Without this static driver current, the weight of the lens assembly in its suspension would allow the lens to lie against the lower mechanical stop. Since the current required to lift the lens to its nominal focus position is relatively high, the narrow bandwidth driver is not used to do this. Therefore, the narrow bandwidth driver can have a reduced dynamic range, making the system more crash -proof.
If the static current driver loses power, the lens will drop only as far as the lower mechanical stop. If this static positioning current source should somehow short circuit to its single polarity power supply, its current is limited and the polarity of its power supply causes the lens to lift away from the disc. The upward motion of the lens is also limited by a mechanical stop about 10 mils above nominal focus.
The unrecorded portion of the copper plated substrate reflects more IR light than the recorded portion, so the output signals are higher when focusing there. The higher level of reflected light increases the level of the focus error voltage which represents an increase in the open loop servo gain. Because of this, the maximum gain for stable closed loop operation must be set while focusing on the unrecorded portion of the substrate. A 72-db stable, dc, closed loop servo gain has been measured while focusing on a typical substrate. The 72-db gain is determined by the dc gain through the narrow -bandwidth low-pass driver amplifier. The wide bandwidth low-pass amplifier has a com- pensated frequency response curve that is flat to the 7.5 -Hz turntable once -around frequency. The do gain of this driver is set at a level 26 db below the gain of the narrow bandwidth driver. This produces a 46-db closed loop gain at 7.5 Hz. The response rolls off at 6 db per octave from 7.5 Hz, resulting in unity gain at about 1.5 KHz. A residual closed loop focus error of 40-nm peak -to -peak has been measured when focusing on a typical substrate.
154 RCA Review Vol. 43 March 1982

VIDEODISC SUBSTRATES
6. The LSR-1 Laser Reader
The new laser reader (LSR-1) has been built using the principles just discussed. The design was influenced heavily by the two major goals for the reader, reproducibility and accurate, stable focusing as well as by a desire to keep operation simple and safe.
Incorporating several commercial subsystems makes the system easier to reproduce, focus is accomplished by a single push button, and numerous sensors and controls prevent accidental injury to the oper- ator, to the reader, and to the substrate being played.
Fig. 24 shows the complete system. The optics and mechanics are in the covered unit at the far left. The first two racks of electronic equipment contain power supplies, the control and servo systems, displays to monitor system status and performance, and logic to operate the various safety systems. The third rack provides program output through a video monitor and audio amplifier, and also contains the decoder electronics (often called the player). Loudspeakers are external. The fourth rack is for the test equipment, shown with vectorscope, wave -form monitor and spectrum analyzer. After the photograph was taken, suitable interfaces were added to put the spectrum analyzer on line to a calculator, largely automating the taking and processing of test data. In the third rack, a decoder for DAXI (Digital Auxiliary Information recorded on every VideoDisc) was added to indicate the exact TV field number being played.
PóA NI OI11N;) CC:PTEM T
ó--
.nu_.c310
Fig. 24-The substrate reader system LSR-1.
`4111111111
MEASUREMENT SYSTEM
.
RCA Review Vol. 43 March 1982 155

Fig. 25 shows the reader's mechanics and optics, the equipment under the cover in Fig. 24. Everything is mounted on a 4 -inch thick, 2
x 4 foot steel honeycomb table supported on air cushions. A commer- cial positioning stage secured to the table moves the entire turntable beneath the radially fixed lens as the substrate is being played. The stage moves at the required average speed of 0.00075 inch/second while playing. The optical system generates a tracking error signal and adjusts that speed to keep the groove approximately centered on the optic axis. The radius being played is indicated by a display to an accuracy of 100 [tin. The stage can be sent to any radius with the same accuracy, a convenience when going back to play a particular test band. There are also two speeds of manual search in forward and reverse. A button sends the turntable all the way to the left (Fig. 25) for loading a new substrate. Above the positioning stage is a motor driven lift mechanism, which adjusts the height of the entire turntable. That compensates for thickness tolerance in the substrates, which can be over 0.050 inch, while setting the height of the playing surface within 100 µin.
A capacitive height sensor automatically stops the lift motor at the correct position. Should that fail, a second, independent, inductive sensor shuts off power to the lift motor before the substrate is driven up into the reader lens. System logic requires that the turntable be at its lowest position before it can be moved in under the lens from the loading position, insuring that a substrate cannot start out so high that it damages something.
If the operator tries to load a substrate that is much thicker than
MOTOR
FOCUS B TRACKING
HEIGHT SENSORS -1^ ri
CENTERING SCREWS
DISC
J OPTICS
TURNTABLE
_J L-
TURNTABLE MOTOR
a AIR
BEARING
LIFT MECHANISM
RADIAL POSITIONING B MEASUREMENT i
YJ
TOWER
READING
1LASER
JEAN
I,LASER
BEAM ._/ EXPANDER
4 FEET
Fig. 25-LSR-1 mechanics.
156 RCA Review Vol. 43 March 1982

VIDEODISC SUBSTRATES
the pre-set maximum, the inductive height sensor stops t he positioning stage before any damage occurs. Above the lift mechanism is the turntable assembly, consisting of a brushless do motor integral with an air hearing, and the turntable itself. The motor/bearing is a commercial unit, controlled by electronics designed and built by RCA. This motor is also interlocked to the rest of the system. Whenever the positioning stage is moved towards the load position, beyond the playing radius, the motor is stopped and cannot be started again until the radius is
suitable for playing. This prevents the operator from loading or un- loading a substrate with the turntable spinning.
Electro -magnetic braking on the motor applies full reverse power to stop the heavy substrate and turntable in about 7 seconds. Without the brake, the unit would coast on the air bearing for many minutes. The brake works together with an air tank mounted at the motor (hut not shown) to prevent destruction of the bearing if the air supply fails. In that event, a pressure switch stops the motor, and a check valve prevents the tank from discharging back to the supply. The tank can run the bearing for more than the required 7 seconds. The turntable contains three support pads, accurately machined in place, that hold the substrate level (i.e., perpendicular to the rotation axis) and two centering screws, 90° apart, which work against a spring loaded plunger.
Behind the radial stage, on the table, is the laser (5 mW polarized HeNe). An I 1 X beam expander, also on the table, expands the beam to about 9 mm at the 1/e2 diameter, to slightly overfill the 4.5 -mm diameter aperture of the objective. Two mirrors direct the beam up to a subassembly containing most of the optics. A stiff aluminum tower supports the optics subassembly and the focus and t racking transducer as well as the height sensors. The optics subassembly contains all the remaining optics except the reading lens, tracking mirror, and signal detector.
The complete optical system is shown in Fig. 26. The HeNe laser is used for signal detection. The beam, after expansion, passes through half -wave plate PI which rotates the polarization to any desired orientation. Next comes the audio slit, shown swung out of the beam in the normal audio/video mode. The slit is followed by the PBS (Polarizing Beam Splitter) which reflects any desired portion of the incoming beam according to the angle of polarization. Together, the PBS and PI from a variable attenuator to adjust the amount of light falling on the substrate. The PBS is followed by the quarter -wave plate I'3 in the usual manner, so that all the light coming back from the disc is transmitted by the PBS to the detector. The incoming beam, after passing through the PBS and P3, is reflected by dichroic
RCA Review Vol. 43 March 1982 157
T

RED LASER BEAM
MI S BEAM EXPANDER
SPLIT DETECTORS (FOCUS) /- OPTICS
PLATE IR LASER BEAM
FOCUS LASER //M3 L3 \\ DETECTOR /---. -,IR LASER
<\\ PI L2 \ ice/ \\
1/2 WAVE.'" \\ PLATE #1 \\ Mg
L4 / Al
..- ',is M4 AUDIO SLIT\ and 1/2 WAVE\ P2 PLATE#2
M2
SHUTTER
CLEAR APERTURE
< M7 PBS and 1/4 WAVE
QUADRANT DETECTOR PLATE P3 (SIGNAL and TRACKING)
HeNe LASER
Fig. 26-LSR-1 optical system.
SUBSTRATE
mirror M4 into the focus transducer. The galvanometer scanner (mounted in the transducer) controls M5 so that the beam can be reflected either straight down through the objective lens onto the substrate or to either side to follow off -center grooves. The galvanom- eter is servo controlled by the optical tracking error signal. After reflection from the substrate and again from M5, the returning beam follows precisely its incoming path regardless of the rotation of M5.
Now, after passing hack through the quarter -wave plate, the beam is completely transmitted by the PBS, and is directed by M7 onto the signal detector. Adjustments on M7 center the beam horizontally, for signal balance on the split detector, and vertically, to achieve a balanced tracking signal when the readout spot is centered on a groove.
For the enhanced audio mode, the slit is swung into the beam. The slit holder carriers another half -wave plate with it, which rotates the polarization again to select a different light level for this mode. The slit must be accurately centered on the optic axis. Otherwise, the centering of the beam on the detector will be altered, and M7 will have to be adjusted whenever the slit is inserted.
The optical focus sensor works as explained in the preceding section. The source is an IR injection laser operating at about 820 nm. The small size of the laser is convenient, it is easily modulated to permit the use of ac -coupled detectors for good stability, and the IR wave- length allows both combination and separation of the focus and signal
158 RCA Review Vol. 43 March 1982

VIDEODISC SUBSTRATES
beams. The collecting lens L4 is followed by aperture AI which reduces stray light. M6 is the beam splitter.
The wasted light transmitted by M6 is detected to provide an indication that the laser is working. A panel light indicates focus laser failure, because that would not he obvious for the HZ laser. The beam reflected by M6 then passes through dichroic mirror M4, which trans- mits 820 nm but reflects 633 nm.
After that, operation follows the previous explanation, except that the imaging lens now has two elements, L2 and L3. It is an extremely simple example of a slightly telephoto zoom lens. The telephoto property shortens the overall length of the system for a given focal length, increasing the rigidity of the optics plate. The zoom property, only an approximation for this very simple configuration, allows ad- justing the magnification between the substrate surface and the focus detector, without moving the detector.
Changing that magnification changes the diameter of the circle of light on the substrate corresponding to the fixed diameter that pro- duces a null detector output. That, in turn, changes the position at which the focus servo holds the lens. Therefore, the variable focal length of the combination L2 and L3 can set the servo for correct focus. An electrical offset in the servo provides fine focus control without requiring mechanical adjustments.
Fig. 27 shows the mechanics and optics again, now with the signals and controls added. (This simplified schematic does not include most of the interlock system nor various protective shields.) The complete system complies with laser safety requirements for BHH Class IIIb.
One of the operator's more tedious tasks is centering the substrate on the turntable. The tracking servo can adequately follow off -center errors of about ± 5 grooves, or 0.1)005 inch. Unfortunately, there is no mechanical reference, such as the center hole, with anything like that accuracy. To provide a way for indicating and adjusting the centering, a circular groove, as distinct from the spiral grooves, is cut in the substrate at a known radius. The reader uses that groove and a special mode of the tracking system to indicate the centering error.
In the centering mode, the tracking servo is turned off, and a ramp is fed to the tracking galvanometer causing it to scan the substrate over a range of about 0.0114 inch. The same ramp drives the horizontal deflection of an oscilloscope, so the horizontal position of the display spot corresponds to the position being illuminated on the substrate, forming a type of scanning microscope. The tracking error signal is fed to the vertical input of the oscilloscope. As the light beam scans across the groove, the error signal indicates that the groove is first to one side, then centered, then to the other side. 'l'he horizontal position of
RCA Review Vol. 43 March 1982 159

HEIGHT SIGNAL
HE IS NT READOUT
B CONTROL
STOP
STOP
FOCUS DRIVE
HEIGHT SENSORS
TURNTABLE
CENTERING _J I
SCREWS
TURNTABLE CONTROL
TTBL DRIVE
LIFT DRIVE
TTBL SPEED
TURNTABLE MOTOR
e AIR
BEARING
LIFT MECHANISM
RADIAL POSITIONING B MEASUREMENT
FOCUS SERVO
TRACKING SERVO
TRACKING CDR IVE
FOCUS B TRACKING
TRACKING ERROR
PROGRAM
OPTICS
TOWER
FOCUS ERROR
6READING
?LASER
?BEAM
6/L A SER
1 BEM
XAPAENDER
4 FEET
RADIUS DRIVE RADIUS CONTROL
K INDICATOR
RADIUS SIGNAL
Fig. 27-LSR-1 mechanics, signals, and controls.
the pattern on the screen indicates the position of the groove beneath the lens (Fig. 28).
To center a substrate, the operator first sends it to the correct radius to play the circular groove, using the digitally controlled stage. Next the raise switch is turned on, raising the substrate to the correct height. Then the Focus button is pushed to lock on focus, and the centering mode is turned on. If the groove is cut at the correct radius and the substrate is centered, the blip appears at the center of the oscilloscope screen, and does not move as the substrate is slowly rotated by hand.
6
Fig. 28-Centering groove signal. The location of the pattern indicates the location of the circular groove on the substrate.
160 RCA Review Vol. 43 March 1982

VIDEODISC SUBSTRATES
Most likely, the substrate is not centered, causing the groove to move back and forth beneath the lens and producing the corresponding movement of the observed blip. In this case, the operator uses the centering screws to center the blip on the screen at the two screw locations 90° apart, uniquely defining the position of the circular groove. Centering is then complete.
If the circular centering groove is cut at the wrong radius, then, obviously, setting the circle at the specified radius at two points leaves it off center. This is apparent because the blip still moves as the substrate is rotated. When that happens, the correct radius at which to set the groove using the two centering screws is just the midpoint of the extremes of travel of the blip. The required condition is always that the groove does not move more than ± 0.0005 inch as the substrate is rotated. The system has been designed to make that distance correspond to one major division on the oscilloscope.
If the cut radius of the groove is wrong by more than 0.002 inch, it is out of the scanner's field of view, and it must be searched for, but that tolerance is well within the accuracy of the cutting process.
After centering is complete, the operator starts the turntable motor and is ready to play the substrate.
7. Reader Performance
The main application of the optical reader is in production quality control. It makes quantitative measurements on such items as recorded SNR, signal levels, and frequency response. Also, it is used to simply view the entire program in checking for subjective quality and record- ing errors. Although absolute calibration of the reader is very difficult, and the precise correlation of optical readout of the copper substrate with capacitive stylus readout of the vinyl replicas is uncertain, relative measurements of these parameters are important, so that recording parameters can be standardized. For that reason, stability and repeat- ability are also critical features. The same qualities naturally make the reader a useful research tool.
The reader's typical frequency response appears in Fig. 29. The flatter curve is the video mode response, using the total available bandwidth. The curve itself is the output of a spect rum analyzer sweeping from 0 to 10 MHz while the reader is playing a substrate containing a recorded frequency sweep signal. This curve is the product of two responses, the recording process and the reader. Neither re- sponse is known accurately. The curve's greatest value is as a stand- ardization criterion; if the curve represents the output of a recording made with the best known technique producing flat response, then
RCA Review Vol. 43 March 1982 161

EZ
REF 10.0 éBn' r MARKER 5 00 ®00.0- Hz 10 dB/OISt$6 ¢ PONCE 10.0 dBn =<1R dRea,
9 g
g 5
_¡
- 4
CENTER 5 04:10=00q0 Hz SPAN .iO Q00 0¿0.0- /511 30 KHz e. If Eli 10 KHz 41 104 SEC
- -
é
Fig. 29-Typical LSR-1 response to a recorded sweep -frequency signal at a radius of 6.0 inches. The flatter curve shows the video -mode re- sponse, the other curve the audio -mode.
future recordings should produce the same result. Comparison of the Fig. 29 curve with the calculated response based on our very crude model, produces a rather good similarity. Fig. 7 shows the calculated response, and that response multiplied by the measured photodetector- amplifier response, plotted on the same coordinates as the spectrum analyzer data.
The second curve in Fig. 29 is the low-pass response produced by the slit in the audio mode. The slit improved audio CNR and reduced video information that interferes with the audio.
Figs. 30 and 31 are examples of measured CNR using the normal video mode (widehand) and the audio mode (low pass). This recorded signal is the sum of two carriers at approximately 0.7 MHz and 5 MHz, with measured depths of 8.7 nm and 90.0 nm, respectively. The sidebands around the upper carrier are produced by nonlinearity in both the recording and reading processes. In the video mode (Fig. 30), the noise floor is approximately flat over the bandwidth shown, sug- gesting that the disc noise is widehand and the readier response is about flat. The CNR for the 5 -MHz carrier is 63 dB. However, the lower carrier is poorer, with a CNR of 32 dB. Switching the reader to the audio mode raises the 0.7 -MHz carrier CNR to 40 dB (Fig 31). This result seems reasonable. If the system noise is assumed to he flat, and the recorded low frequency signal depth is 20 dB less than the
162 RCA Review Vol. 43 March 1982

VIDEODISC SUBSTRATES
REF 10.0., dBn 3 OFFSET 28' 1`000:0 `Hz 10 dB/DIY RANGE 10.0 dBn -31:6 dB
CENTER 5 000 000.0 -Hz SPAN 10.000 000',..0 Nz' PAW 30.KHz :VBW 300 Hz _ST 3.6 SEC 1.
Fig. 30-Measured LSR-1 video -mode response to a two -carrier test signal. Radius is 6.0 inches.
high frequency signal depth, the CNR is expected to also be about 20 dB lower. Thus, the audio mode slit increases the low frequency CNR by 8 dB, in this example, to nearly the expected value. These values for CNR are typical of good recorded substrates. Occasionally, values of a few dB higher are seen.
Optimum focus is substantially different for the audio and video modes. It is believed-but not yet confirmed-that this is due to spherical aberration in the player objective lens. The results above were obtained by refocusing whenever the mode was changed. In this example, if the audio mode was used without refocusing, that is with focus still set for normal video mode, the CNR was 38 dB, a loss of 2 dB.
Focus and tracking stability are best illustrated by the uniform amplitude of the carrier. The upper trace in Fig. 32 shows the carrier envelope at the output of the differential detector amplifier, through a 17 dB attenuator. The time span of the trace is 133 ms, one disc revolution. The absence of amplitude modulation indicates that focus and tracking are maintained as the disc spins. The lower trace is the sum of the halves of the split detector, without the attenuator. For a simple sinusoidal recording, that signal should be zero. For even slightly more complex signals, calculating the detailed response be- comes very tedious, but in all cases examined, the sum signal is much
RCA Review Vol. 43 March 1982 163

itr" REF 10.0 ¡BR ` OFFSET 2tf0 000.0 Hz i 10 dB/DIV- g FANGE 10.0 dBn ij 40.3 dB
1 á:3. e
` _
a
_
. 5 3
g
= a
;
CENTER 5 0G0ª0013.0 Hz SPRNª10A00 000.0 Hz g º P8w.30 KHz VBw 300 Hz SI 3.6 SEC
Fig. 31-Measured LSR-1 audio -mode response to a two -carrier test signal. Radius is 6.0 inches.
smaller than the differential signal, as expected from the simple model. In this example, it is 25 dB lower.
Improved performance would be particularly useful in two areas. The amplitude of second harmonics is larger than expected. The signal at 10 MHz in Fig. 30 is an example. The amplitude of the second harmonic output for the case when a signal was recorded with some second harmonic distortion (due to the cutting process nonlinearity) has been calculated. This calculation is rather lengthy and it mainly shows that the result depends critically on parameters of the system adjustment: focus, balance of the signal at the photodetectors, ampli- fier gain and phase balance, uniform beam radiance, etc. In this reader, special attention was paid to these items. Yet the 10 -MHz signal in Fig. 30 is larger than that measured with earlier readers. The origin of harmonics, in fact the entire subject of nonlinearity in optical readout, is an important area of further study.
Audio quality is a second area needing improvement. The bandpass characteristic of optical readout of recorded substrates causes reduced response at the audio subcarrier frequency when video bandwidth is required. Audio quality with this type of reader has typically been poorer than a stylus on a plastic record. The slit low pass filter used in the player's special audio mode improves the sound substantially-a difference the listener can easily hear-but it would be useful to have
164 RCA Review Vol. 43 March 1982
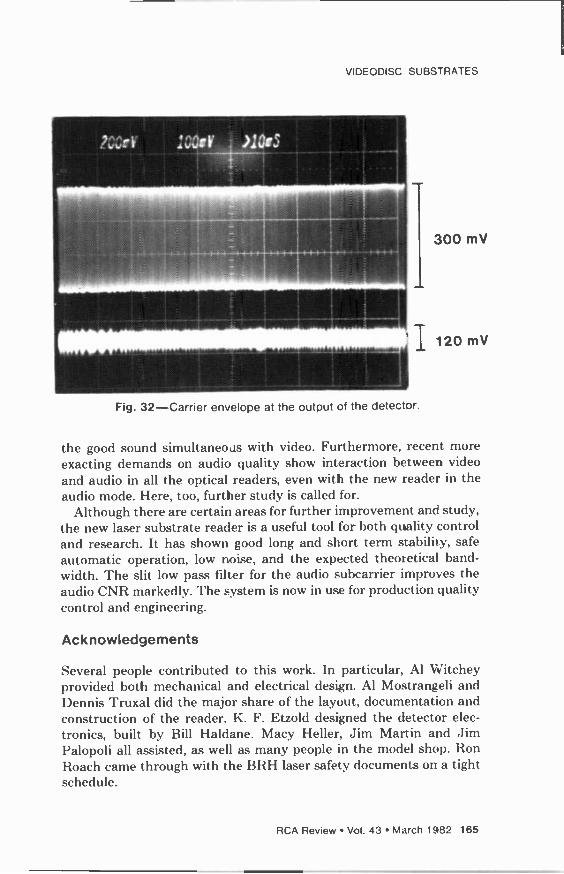
r'
VIDEODISC SUBSTRATES
::....Z.A112111~
J
300 mV
1120 mV
Fig. 32-Carrier envelope at the output of the detector.
the good sound simultaneous with video. Furthermore, recent more exacting demands on audio quality show interaction between video and audio in all the optical readers, even with the new reader in the audio mode. Here, too, further study is called for.
Although there are certain areas for further improvement and study, the new laser substrate reader is a useful tool for both quality control and research. It has shown good long and short term stability, safe automatic operation, low noise, and the expected theoretical band- width. The slit low pass filter for the audio subcarrier improves the audio CNR markedly. The system is now in use for production quality control and engineering.
Acknowledgements
Several people contributed to this work. In particular, Al Witchey provided both mechanical and electrical design. Al Mostrangeli and Dennis Truxal did the major share of the layout, documentation and construction of the reader. K. F. Etzold designed the detector elec- tronics, built by Bill Haldane. Macy Heller, Jim Martin and Jim Palopoli all assisted, as well as many people in the model shop. Ron Roach came through with the BRH laser safety documents on a tight schedule.
RCA Review Vol. 43 March 1982 165

References
I. Gorog, "Optical Techniques Developed for the RCA VideoDisc," RCA Review 39, jpp. 162-185, March 1978.
A. H. Firester, C. B. Carroll, I. Gorog, M. E. Heller, J. P. Russell, and W. C. Stewart, "Optical Readout of the RCA VideoDisc," RCA Review 39, pp. 392-426, September 1978. 3 W. C. Stewart, "On Differential Phase Contrast with an Extended Illumination Source," J. Opt. Soc. Am. 66, pp. 813-818, August, 1976.
J. W. Goodman, Introduction to Fourier Optics, Chapter 3, McGraw-Hill Book Co., New York, (1968).
166 RCA Review Vol. 43 March 1982

The VideoDisc Stylus Electrode
H. L. Pinch, D. A. Furst, and R. T. Smith RCA Laboratories, Princeton, NJ 08540
Abstract-The stylus electrode of the RCA VideoDisc system is a thin film of titanium deposited by rf sputtering on the diamond stylus. Exten- sive x-ray diffraction analysis has shown that the titanium film is
highly oriented with respect to the diamond electrode face and is
virtually single crystal. An intermediate, very thin layer of TiO2 was found at the electrode -diamond interface. The electrode is durable and has satisfactory playback performance.
Introduction
The capacitive pick-up scheme was chosen for the RCA VideoDisc system to provide inexpensive, simple, and reliable signal retrieval offering good picture quality. The original stylus material was sapphire and an effective pick-up stylus was made by depositing a metal film electrode on the trailing edge side of a triangular wedge-shaped point. The capacity of recording one hour per side on a disc was achieved in late 1976.' The decrease in groove width from approximately 4.6 to 2.7 µm of this improved format required a stylus with a finer tip. In view of the superior strength of diamond, its resistance to breakage, and better wear properties, diamond was chosen over sapphire. Diamond is considerably more difficult to shape than sapphire but techniques were successfully developed for faceting diamonds to sharp points and lapping a "keel" point that maintains a constant width as the tip is
eroded. Fig. I depicts a perspective view of a keeled electroded stylus positioned in a disc groove as in playback.
One of the principle functions of the stylus in the RCA CED system
RCA Review Vol. 43 March 19.82 167

Fig. 1-Perspective drawing of a keeled electroded stylus and segment of a disc.
is to provide a support for the thin film electrode. Conversely, the electrode, in addition to its major role of signal recovery from the disc, must adhere and remain intact to the stylus tip through the diamond shaping processes and through many hours of play. These require- ments of tenacity, durability and toughness govern the choice of possible electrode materials.
Diamond is a difficult substrate to metallize. It is chemically inert below 1100°C and diffusion rates in diamond are extremely low.' Mechanisms that promote film -to -substrate bonding and adhesion,' such as (1) intermediate layer formation due to chemical reaction at the
interface, or (2) interdiffusion layer formation brought about by the solid-state
diffusion or mutual solubility of the film and substrate, are not readily attainable with diamond as a substrate. However, if one assumes that a compound interface is possible, those electroposi- tive elements that form stable carbides are the most rational choices for the electrode application.' A partial listing of free energies of formation of carbides is shown in Table 1.
Of the commonly available metals the elements in group IVB of the periodic table, in particular, titanium, have the greatest tendency to form carbides. The suitability of titanium as the electrode is further
168 RCA Review Vol. 43 March 1982
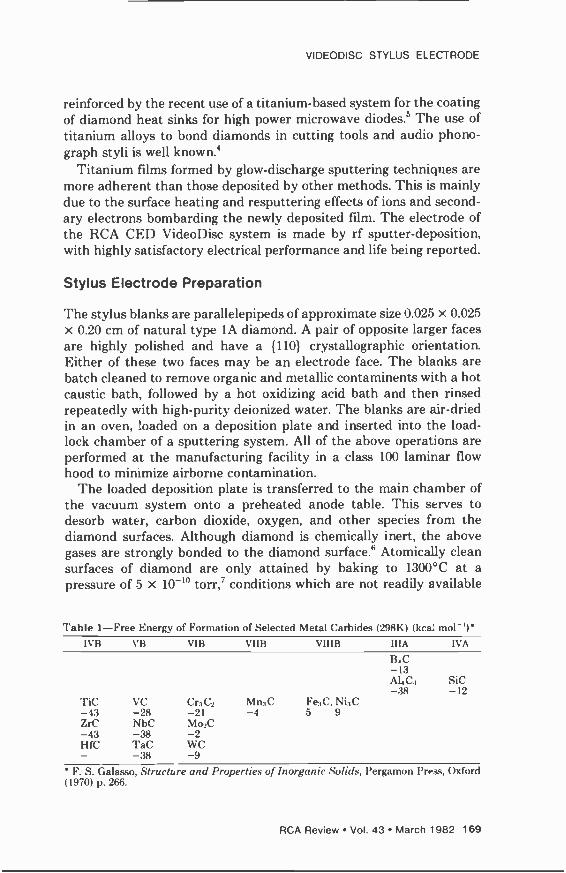
VIDEODISC STYLUS ELECTRODE
reinforced by the recent use of a titanium -based system for the coating of diamond heat sinks for high power microwave diodes.' The use of titanium alloys to bond diamonds in cutting tools and audio phono- graph styli is well known.'
Titanium films formed by glow -discharge sputtering techniques are more adherent than those deposited by other methods. This is mainly due to the surface heating and resputtering effects of ions and second- ary electrons bombarding the newly deposited film. The electrode of the RCA CED VideoDisc system is made by rf sputter -deposition, with highly satisfactory electrical performance and life being reported.
Stylus Electrode Preparation
The stylus blanks are parallelepipeds of approximate size 0.025 x 0.025 x 0.20 cm of natural type IA diamond. A pair of opposite larger faces are highly polished and have a (110) crystallographic orientation. Either of these two faces may be an electrode face. The blanks are batch cleaned to remove organic and metallic contaminents with a hot caustic bath, followed by a hot oxidizing acid bath and then rinsed repeatedly with high -purity deionized water. The blanks are air-dried in an oven, !oaded on a deposition plate and inserted into the load - lock chamber of a sputtering system. All of the above operations are performed at the manufacturing facility in a class 100 laminar flow hood to minimize airborne contamination.
The loaded deposition plate is transferred to the main chamber of the vacuum system onto a preheated anode table. This serves to desorb water, carbon dioxide, oxygen, and other species from the diamond su..faces. Although diamond is chemically inert, the above gases are strongly bonded to the diamond surface.6 Atomically clean surfaces of diamond are only attained by baking to 1300°C at a pressure of 5 x 10⁻¹⁰ ton,' conditions which are not readily available
Table 1-Free Energy of Formation of Selected Metal Carbides (298K) (kca. mol 1)*
IVB \B VIB \'IIB VIIIB IIIA 1\'A
B.0 -13 A4 C:, -38
SiC -12
TiC VC Cr3C2 Mn3C Fe:,C, Ni:,C -43 -28 -21 -4 5 9 ZrC NbC Ma2C -43 -38 -2 HfC TaC WC - -38 -9
F. S. Galasso, Structure and Properties of Inorganic Solids, Pergamon Press, Oxford (1970) p. 266.
RCA Review Vol. 43 March 1982 169

in elastomer-sealed commercial sputtering systems. The titanium tar- get is sputtered in ultra -pure argon at a power density of (4-8) x 10' W/m2.
Electrode Characterization and Film Properties
Of utmost importance to the continuing manufacture of high perform- ance electrodes are means of evaluating the product and maintaining a consistent level of quality. The ultimate test is stylus reliability under actual playback conditions in the field, which is obviously not a practical form of quality control. We have found that physical char- acterization of the film by standard metallurgical, thin-film, and ana- lytical procedures provides a rapid way to monitor and control the deposition process.
The electrodes are subjected to a variety of tests. Because of the unique characteristics of the diamond -titanium interface, measure- ments are only made on coated diamond blanks or styli. Representative samples from each deposition run are selected. The thickness is deter- mined by multiple -beam or Tolansky interferometry at a chemically etched step. Film resistivity is determined with a miniature four -point probe head, and corrections for the near -equivalence of sample dimen- sions and probe spacing are made in calculating the resistivity." Values between (60-130) x 10-6 ohm -cm are obtained, which compares well to values reported by others. ° A gross test for film adhesion is made using a scratch test. Styli are assembled onto cartridges and thoroughly electrically tested. Playback testing is - erformed for several hundred hours to evaluate the quality of the electrode.
In-depth characterization is done with x-ray diffractometry. Film properties such as the average crystallite size, the maximum nonuni- form local strain or the microstrain, the uniform elastic strain or the macrostrain, and the degree of preferred uniaxial crystallographic order or texture are measured. The extent of azimuthal order of the titanium with respect to the crystallographic orientation of the dia- mond is determined using Laue methods. Many of the structural properties are process dependent and the x-ray techniques are useful for quality control.
Titanium is dimorphic and the stable structure below 882°C is hexagonal close -packed. The interfacial free energy of a metal -sub- strate system is minimized when the densest packed planes of the metal are parallel to the plane of the substrate. The extent to which this occurs depends on the surface mobility of the arriving atoms during deposition. Titanium films exhibit a pronounced c -axis texture which starts from the initial stages of film formation, even on amor -
170 RCA Review Vol. 43 March 1982
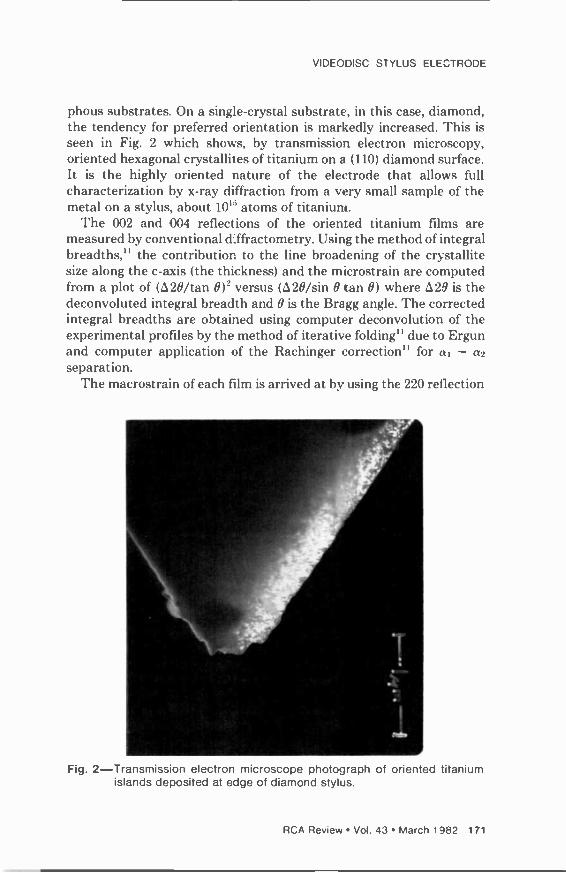
VIDEODISC STYLUS ELECTRODE
phous substrates. On a single -crystal substrate, in this case, diamond, the tendency for preferred orientation is markedly increased. This is seen in Fig. 2 which shows, by transmission electron microscopy, oriented hexagonal crystallites of titanium on a (110) diamond surface. It is the highly oriented nature of the electrode that allows full characterization by x-ray diffraction from a very small sample of the metal on a stylus, about 10" atoms of titanium.
The 002 and 004 reflections of the oriented titanium films are measured by conventional diffractometry. Using the method of integral breadths," the contribution to the line broadening of the crystallite size along the c -axis (the thickness) and the microstrain are computed from a plot of (020/tan 0)2 versus (á20/sin 0 tan 0) where .520 is the deconvoluted integral breadth and 0 is the Bragg angle. The corrected integral breadths are obtained using computer deconvolution of the experimental profiles by the method of iterative folding" due to Ergun and computer application of the Rachinger correction" for a, - a2 separation.
The macrostrain of each film is arrived at by using the 220 reflection
.
Fig. 2-Transmission electron microscope photograph of oriented titanium islands deposited at edge of diamond stylus.
RCA Review Vol. 43 March 1982 171

of the diamond stylus substrate as an internal standard, making possible precise determination of the c -axis lattice spacing of titanium. For a strain -free powdered bulk sample of titanium, a diffractometric measurement of C', was made that differed from the National Bureau of Standards value by only 2 parts in 10'. The macrostrain is calculated from the ratio (Co - C)/Co, where C is the film lattice constant computed from the adjusted 004 and 0t)2 titanium reflections. For positive values of (Co - C)/C the film is in compression normal to the substrate plane and can be considered to be in tension in the film plane. The opposite considerations apply when (Co - C)/Co is negative. The film macrostress S, is given by S = (E/21')(C,, - CMG. E is Young's Modulus and :' is Poisson's ratio; for titanium the values are 1.16 x l0" N/m2 and 0.32 respectively.
The degree of crystallographic orientation and single crystallinity of the titanium films is determined by a combination of two techniques, the co -scan and the back -reflection Laue. As pointed out previously, the c -axes of each of the hexagonal single -crystalline titanium domains tend to align themselves normal to the (110) diamond electrode plane. The w -scan measures the extent of c -axis alignment. This is done by placing the x-ray counter tube at the 002 Bragg angle position and then rotating the sample through the angular (w) range over which coherent diffraction due to the 002 reflection is detected. The half - width of the resultant u -scan diffraction profile is used as a relative measure of preferred orientation of the c -axis.
The w -scan measures the alignment of only one axis of the titanium crystallite array which constitutes the film. It is possible to have a small w -scan half -width and have complete random crystallographic order in an azimuthal sense about the aligned c -axes. This case occurs for titanium deposited on glass substrates. Information on the 3 - dimensional order of the titanium crystallites is obtained from Laue hack -reflection methods. In the Laue method a collimated x-ray beam is aligned along the c -axes of the titanium film, or normal to the diamond (110) plane in this case. Depending on the relative basal plane alignment of the titanium crystallites about their c -axes, the back diffracted radiation recorded on a photographic film will appear as concentric circles, segments of concentric circles, or spots. For completely random azimuthal order, concentric circles are seen. For partial azimuthal order, segments of these circles are observed, and for complete order (single crystallinity) an array of spots are recorded.
Fig. 3 shows a comparison of the azimuthal order of two films of titanium. The basic pattern in both is the 2 m Laue symmetry due to the (110) orientation of the diamond. In part 3a segmented rings are seen superimposed on the diamond pattern. These are due to diffrac-
172 RCA Review Vol. 43 March 1982
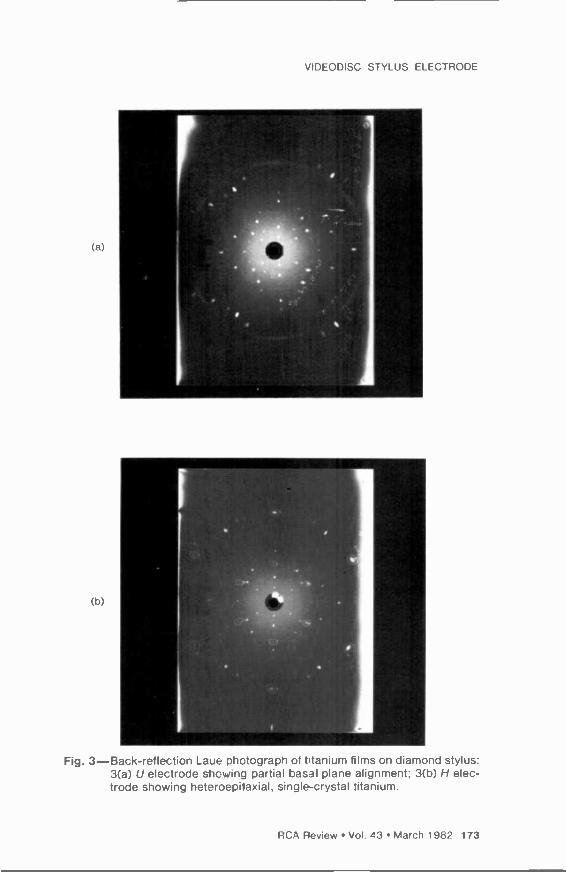
(a)
(b) ti
VIDEODISC STYLUS ELECTRODE
Fig. 3-Back-reflection Laue photograph of titanium films on diamond stylus: 3(a) U electrode showing partial basal plane alignment; 3(b) H elec- trode showing heteroepilaxial, single -crystal titanium.
RCA Review Vol. 43 March 1982 173
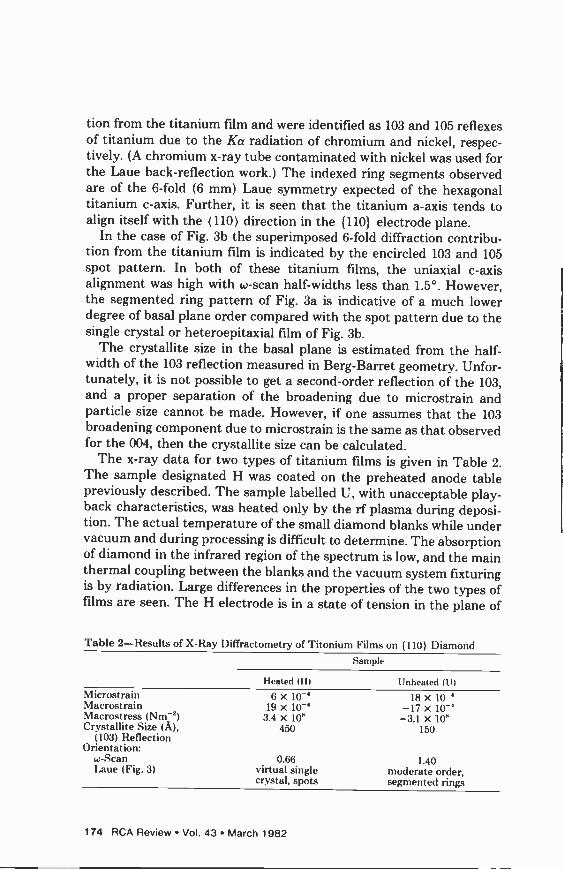
tion from the titanium film and were identified as 103 and 105 reflexes of titanium due to the Ka radiation of chromium and nickel, respec- tively. (A chromium x-ray tube contaminated with nickel was used for the Laue back -reflection work.) The indexed ring segments observed are of the 6 -fold (6 mm) Laue symmetry expected of the hexagonal titanium c -axis. Further, it is seen that the titanium a -axis tends to align itself with the (110) direction in the (110) electrode plane.
In the case of Fig. 3b the superimposed 6 -fold diffraction contribu- tion from the titanium film is indicated by the encircled 103 and 105 spot pattern. In both of these titanium films, the uniaxial c -axis alignment was high with w -scan half -widths less than 1.5°. However, the segmented ring pattern of Fig. 3a is indicative of a much lower degree of basal plane order compared with the spot pattern due to the single crystal or heteroepitaxial film of Fig. 3b.
The crystallite size in the basal plane is estimated from the half - width of the 103 reflection measured in Berg -Barret geometry. Unfor- tunately, it is not possible to get a second -order reflection of the 103, and a proper separation of the broadening due to microstrain and particle size cannot be made. However, if one assumes that the 103 broadening component due to microstrain is the same as that observed for the 004, then the crystallite size can be calculated.
The x-ray data for two types of titanium films is given in Table 2. The sample designated H was coated on the preheated anode table previously described. The sample labelled U, with unacceptable play- back characteristics, was heated only by the rf plasma during deposi- tion. The actual temperature of the small diamond blanks while under vacuum and during processing is difficult to determine. The absorption of diamond in the infrared region of the spectrum is low, and the main thermal coupling between the blanks and the vacuum system fixturing is by radiation. Large differences in the properties of the two types of films are seen. The H electrode is in a state of tension in the plane of
Table 2-Results of X -Ray Diffractometry of Titonium Films on (110) Diamond Sample
Ileated (H) Unheated (U) Microstrain 6 x 10' 18 x 10 ' Macrost rain 19 x 10' -17 x l0-' Macrostress (Nm-2) 3.4 x 10⁸ -3.1 x 1(i Crystallite Size (A), 450 150
(10:3) Reflect ion Orient ation:
w -Scan 0.66 1.40 Lane (Fig. 3) virtual single
crystal, spots moderate order, segmented rings
174 RCA Review Vol. 43 March 1982

VIDEODISC STYLUS ELECTRODE
the film, while the U electrode is under compression. The H electrode is virtually single crystal. The deposit is heteroepitaxial (001) Ti// (110) diamond with the titanium a -axis [2101//(110) diamond in the electrode plane. The Laue pattern of Fig. 3b is of the H electrode while that of the U film is shown in Fig. 3a.
X-ray diffraction can detect subtle changes in film structure. This information, in turn, can be used to ascertain inadvertent changes in the deposition process and allow subsequent adjustment of the depo- sition process.
The Titanium -Diamond Interface
The rationale for choosing titanium as the stylus electrode was pre- sented in the Introduction. In view of the stated durability of the elect rode and the apparent strong adhesion of the titanium electrode to the diamond stylus, one would expect that a compound interface, where a chemical reaction between the deposit and substrate has
occurred, exists for titanium and diamond. The presence of titanium carbide, TiC, at the titanium -diamond interface was detected by Zudema and Caveney using transmission electron diffraction on
thinned diamond substrates." The films for that study were deposited from electrically heated titanium wires. They reported that epitaxy of the titanium with respect to the diamond and carbide formation occurred at 500°C. We have investigated the titanium -diamond inter- face that results from the deposition of titanium by rf planar diode sputtering. The interface in the VideoDisc stylus differs from that described by Zudema and Caveney.
Two approaches were used: (a) Electron microscopy and diffraction. When the diamond blanks
are ground to a point to form the stylus tip, the resultant edges are very sharp. The radius of curvature is several tens of angstroms. Diamond (atomic number 6) is quite transparent to the 100 keV beam of the electron microscope. It is possible to "see" in through the wedge shaped edge of the stylus for a distance of about 0.2 pm. Thin metal films deposited on an electrode face of a pointed stylus can be examined by transmission electron microscopy and diffraction directly without further sample preparation. Fig. 2 is such a transmission electron microphotograph of a film nominally 15 nm thick. Electron diffraction of this discontinuous film confirms our x-ray results that the titanium is ordered on the surface of the diamond. The direction of the long sides of the small titanium islands in Fig. 2 is along the (110) of the diamond. Most important for this discussion, electron diffraction shows
RCA Review Vol. 43 March 1982 175

the presence of only two phases, hcp-titanium and tetragonal TiO2. No evidence for cubic TiC was seen as reported by Zudema and Caveney.
(b) Chemical Etching. A solution of bromine in ethylacetate is selective etch between TiO2 and titanium meta_ (and other low -oxi- dation state compounds)." The two types of titanium coated styli were treated with the bromine etchant.
1. Unheated (U) styli. These titanium films dissolve and leave no titanium -containing surface residues. The etched diamond surfaces were examined by electron probe microanalysis and RHEED. The resultant electron diffraction pattern was that of (110) diamond only.
2. Heated (H) styli. These films also dissolve in the bromine etch. However, a grey to pale -brown, strongly adherent residue was left on the diamond electrode face. This residue is soluble in standard titanium etch solutions. Examination of the residue by electron probe microa- nalysis indicates a titanium phase of thickness 0.5 to 1 nm. The residue is electrically conducting with an approximate resistivity of 10-2-10' ohm -cm. RHEED indicates that the residue is predominantly tetra- gonal TiO2 with a trace of another phase, possibly a suboxide of titanium.
Films of TiC were prepared on heated diamond blanks by reactive sputtering of titanium with acetylene or ethylene. RHEED indicated the presence of cubic TiC. The response of the TiC films to the bromine etch was similar to the metallic U -type titanium film.
Lurie and Wilson' investigated the initial reaction of aluminum deposited by vacuum evaporation on diamond. Aluminum is also a strong carbide -forming metal element with a room temperature free energy of formation of -38 cal mole-' (Table 1). Atomically clean surfaces were obtained in their LEED apparatus. On the (100) face, used by Zudema and Caveney, the presence of Al ,C3, aluminum carbide, was detected by Auger electron spectroscopy. However the carbide was formed only after raising the temperature of the diamond to 1300°C after a deposition at 600 to 800°C. Similar results were obtained for deposition on (110) surfaces. The temperatures for carbide formation in the Lurie and Wilson study are considerably above those mentioned by Zudema and Caveney and higher than are present during deposition in our sputtering system.
Our study indicates that the compound interface on the VideoDisc stylus consists of Ti-TiO2-C(diamond) and does not involve TiC. The interface is formed by the reaction between the absorbed oxygen at the diamond surface' and the arriving titanium atoms. The strength of the titanium -diamond bond appears to be enhanced by the highly adherent TiO2 intermediate layer. For the case of styli coated at lower
176 RCA Review Vol. 43 March 1982

VIDEODISC STYLUS ELECTRODE
substrate temperatures (U -type) with unacceptable playback lifetime, only lower oxides of titanium may be produced. These suboxides are chemically attacked by the bromine etchant, no oxide residue remains and no advanced film -diamond adhesion results.
Electrode Erosion and Wear
Electrode erosion and wear are the subject of a continuing study. Satisfactory models for the erosion processes and correlation of erosion to playback performance are not yet at hand. Within several tens of hours of playback, in the great majority of cases, the electrode is worn up from or thinned at the stylus tip to a height of 0.03 to 0.05 pm. There is an initial small decrease in signal output due to the electrode wear -up. Thereafter, a steady-state configuration of wear -up is reached that is governed by the extremely slow rate of wear of the diamond keel. The output is relatively constant with time in this steady-state regime. The wear -up of the electrode is clue to the combined mechan- ical, chemical, and electrical erosional effects of the disc materials (carbon particles and PVC), disc lubricants and additives, and their degradation products. Picture quality, however, is satisfactory throughout. Separation of the electrode from the stylus is rare and it can be traced to improper diamond cleaning.
Conclusion
The deposition of thin fi!ms of titanium on diamond styli by rf sputtering techniques has yielded a long-lived and effective electrode for signal retrieval in the capacitive pick-up mode. Properly prepared films are heteroepitaxial with respect to the single -crystal diamond substrate and the metal films are strongly adherent to the diamond.
Acknowledgment
The development of a durable VideoDisc stylus electrode was a group effort drawing on the skills and commitments of many people, both at RCA Laboratories at Princeton and the VideoDisc facility at Indian- apolis. All of them deserve to be commended. We especially acknowl- edge the contributions of S. -S. Chio, G. A. Kim, M. .J. Mindel, and J. Schubert of Indianapolis. The support of our colleagues at the Labo- ratories, E. P. Bertin, E. R. Levin, J. T. McGinn, E. M. Botnick, G. O. Fowler, and J. H. Thomas III for help in characterization of the electrode is also acknowledged.
RCA Review Vol. 43 March 1982 177

References
E. O. Keizer, and D. S. McCoy, "The Evolution of the RCA "Selectavision" VideoDisc System-A Historical Perspective," RCA Review, 39, p. 14, March (1978).
2 J. E. Field, ed., The Properties of Diamond, p. 644, Academic Press, London, (1979).
3 B. Chapman, Glow Discharge Process, p. 279, J. Wiley and Sons, New York, (1980).
F. A. Raal, "The Importance of Bonding to Diamond Surfaces in Industrial Appli- cations," 1968 Diamond Conference, University of Bristol, England.
5 D. A. Decker, and A. J. Schorr, "High Power IMPATT Diodes on Diamond Heat Sinks," IEEE Trans. Electron Devices, ED -17, p. 739, (1970).
6 H. P. Boehm, "Chemical Identification of Surface Groups," Advances in Catalysis, 16,_p. 179 (1966).
' P. G. Lurie and J. M. Wilson, "The Diamond Surface -I," Surface Science, 65, p. 453, (1977).
F. M. Smits, "Measurement of Sheet Resistivities with the Four -Point Probe," Bell Syst. Tech. J., 37, p. 711 (1958).
9 J. R. Matey, Private communication. 1O B. Singh and N. A. Surplice, "The Electrical Resistivity and Resistance Tempera-
ture Characteristics of Thin Titanium Films," Thin Solid Films, 10, p. 243, (1972). 11 H. P. Klug and L. E. Alexander, X -Ray Diffraction Procedures, J. Wiley and Sons,
New York, 2nd Edition (1974); see p. 634 for method of integral breadths; p. 628 for method of iterative holding; and p. 624 for Rachinger correction.
12 G. Zudema and R. J. Caveney, "The Preparation and Study of Single Crystal Metal Films on Diamond," Proc. So. African Electron Microscopy Soc., Pretoria (1971).
13 J. van Landuyt, et al., "Electron Microscope Study of Twins, Anti -Phase Bound- aries and Dislocations in Thin Films of Rutile," Phys. Stat. Sol., 7, p. 307, (1964).
178 RCA Review Vol. 43 March 1982
Basics of VideoDisc Stylus Dynamics and Interaction With Surface Imperfections
R. W. Nosker and D. L. Matthies RCA Laboratories, Princeton, NJ 08540
Abstract-The RCA Selectavision VideoDisc system utilizes a stylus mechan- ically tracking a grooved disc. We present a simple model describ- ing the stylus -disc interaction, and then utilize this model to analyze the consequences of gross disc movements such as horizontal runout, vertical warp, and vertical acceleration, and of collisions with abrupt imperfections such as bumps and dents. We describe examples of bumps and dents.
1. Introduction
The RCA VideoDisc system employs a stylus riding in a groove. The grooves are only a fraction of a micrometer deep, and the video signal elements are about a micrometer apart. The relative speed between stylus and disc, due to the 450 rpm rotation, is about 500 cm/sec; if the stylus loses contact with the disc for 63 µsec (0.3 mm), an entire line of video information is lost. The grooves have a radial density of nearly 4,000/cm, which is some 40 times the density of an audio disc; if the stylus is kicked over by 2.6 pm, it is in an adjacent groove and 133 cosec of audio and video information are lost or repeated. In this article, we describe the system design and engineering tolerances that allow high performance in spite of the problems of scale.
The disc V -groove geometry is shown in Fig. 1. The included angle at groove top and bottom is 140°. The disc is made of a rigid, carbon - loaded polyvinylchloride material that has the uniaxial, compressive stress -strain curve shown in Fig. 2. We approximate the true stress - strain curve (dotted curve in Fig. 2) with an elastic -perfectly plastic
RCA Review Vol. 43 March 1982 179

2.
GROOVE WI
6µm
DTH
1µm VIDEO , 11 WAVELENGTH 1 0.4 µm
GROOVE DEPTH
Fig. 1-VideoDisc groove geometry.
model (solid curve); as seen by the stylus, the modulus E - 5 x 10¹⁰
dynes/cm', and the yield stress ay - 2.1 x 10" dynes/cm'. Stylus geometry is shown in Fig. 3. The shoe of the diamond stylus
fits into the groove with the same 140° included angle. The disc moves in a direction such that it encounters the prow first and the electrode last. The front faces of the stylus meet at the prow line, which makes a 35° angle with the disc. The stylus arm, Fig. 4, is very light and rigid. The entire arm moves in a carriage that keeps the arm oriented along a tangent to the grooves at the point of stylus -disc contact.' To keep the analysis simple and retain physical insight, we use very simple models for the stylus and arm, as shown in Fig. 5, where we assume
\Qy^ 2.1 x IO9dynes/cm2
E - 5x 1O10dynes/cm2
1 °/ 10% STRAIN
Fig. 2-Carbon-loaded polyvinylchloride disc material. Compressive stress - strain response as seen by the stylus. The dotted line is the true material response, while the solid lines are the elastic -perfectly plastic approximation.
180 RCA Review Vol. 43 March 1982

ELECTRODE
W = 2µm
SIDE VIEW
STYLUS SHOE
I - 22.7°
VIDEODISC STYLUS DYNAMICS
FRONT VIEW
^t 3µm
4µm
Fig. 3-Diamond stylus geometry.
the mass is concentrated, with external forces applied by the Be -Cu spring and the disc. For long-term interactions (milliseconds), which characteristically move the stylus by several tens of micrometers, we
use a mass of 17 mg which reflects the entire mass of the diamond, plastic holder, and magnet, plus one-third of the masses of the Al tube and the Be -Cu spring. There is little compromise in modeling the system in this mariner for long-term interactions. For short-term interactions (microseconds), the deflections of interest are typically a
micron or less, and the stylus is properly modeled as a dist ributed mass system with compliant joints and members. Such models are complex, require computer solution, and sacrifice physical insight. In this paper, we simply use an effective mass term, m,.ff, which is somewhere between 17 mg and the mass of the diamond alone (0.5 mg). The fundamental bending mode of the plastic holder is several kilohertz, and the magnitude of the bending movements it will undergo due to typical applied forces is several micrometers, so this comlx,nent alone will partially decouple the more distant masses from the diamond. For interactions on the order of 100 µsec, we will use melt = 2 mg.
The vertical stiffness of the Be -Cu spring, kY, is 200 dyne/cm, and the lateral stiffness, kr, is 40 dyne/cm. In normal tracking, the stylus exerts a vertical force of (kyy0 + w) = 65 dynes on the disc, with about 80% due to a preload in the Be -Cu spring. We will use 65 dynes as the
\\\\\\\ 'CARRIAGE \\\\\\\\\\
COMPLIANT RUBBER COUPLER
RIGID Al TUBE
KICKER COILS
MAGNET
PLASTIC HOLDER
Fig. 4-Stylus arm.
Be - Cu SPRING
DISC MOTION
DIAMOND STYLUS
RCA Review Vol. 43 March 1982 181

fdr meff
k,ro
kr (Be -Cu)
a) HORIZONTAL
kv (Be -Cu)
kyYo
k,, ( DISC)
I)) VERTICAL
Fig. 5-Models for (a) horizontal and (b) vertical stylus movement.
approximate downward force even for those short-term interactions where w = men- g < 17 dynes. Standard application of the theory of contact mechanics' relates disc deflection to applied load
y= 0.94frry(' ' ) [1]
v E
where y is the local vertical disc deflection, f r, is the load applied to the disc, E is Young's modulus (5 x 10¹⁰ dyne/cm'), y is Poisson's ratio (0.4), and A is the area of contact (5 x 10-H cm2). For normal tracking, y = 460 A. The disc can be thought of as a spring pushing against the stylus, fry = k,ry, where the spring constant
- . E k rr0.94(1-v2)
2. Tracking Basics
[2]
Under ideal circumstances, there is no radial force between stylus and disc. In reality, radial forces can be exerted by spring preload and by disc horizontal runout. Radial mistracking occurs (Fig. 6) when
fo-(max) > 65 tan 20° = 23.7 dynes. [3]
Fig. 6-Forces to consider for radial mistracking.
182 RCA Review Vol. 43 March 1982

VIDEODISC STYLUS DYNAMICS
The largest probable spring preload comes about from a lateral stylus spring misalignment not exceeding 0.6 mm, which results in a preload of 2.4 dynes. Disc horizontal runout will not exceed ± 0.1 min. This can result directly in a radial force of 0.4 dynes. The radial movement will he approximately sinusoidal, rsinwl. The radial frequency w = 27rf,n, where f, is the fundamental frequency (7.5 Hz) and n is one for once -around, two for twice -around, etc. The force generated from such movement is thus
Idr = 111 1' = -me!!rW Sin Wi
['Amax) = nle!!r°(2irf11)2 .
For r = 0.1 mm, n = 1, and me!! = 17 mg, fdr(max) is 0.4 dynes. Higher modes have an n2 effect, but r also diminishes quickly for higher modes. Radial forces due to spring preload and horizontal runout are therefore well within the tracking limits of the system.
Vertical warp and acceleration of the disc surface will cause devia- tions from the normal 65 dyne tracking force. Warp normally does not exceed 0.25 mm; at the vertical spring rate of 200 dynes/cm, a maxi- mum variation of 5 dynes can thus be generated. Surface acceleration will not exceed about 600 cm/sec2, so the maximum tracking force variation due to acceleration is
. Minax) = nle!!ymex = 10.3 dynes.
141
[51
Therefore neither warp nor acceleration can cause the stylus to lose contact with the groove.
Finally, we consider the worst -case combination of horizontal run - out, warp, and vertical acceleration. The worst -case for mistracking occurs when the tracking force is at a minimum, while the side force is at a maximum. Minimum tracking force occurs when disc height is
0.25 mm low due to warp at the same time acceleration is at its negative maximum of 600 cm/sec2. (Note that a negative maximum acceleration implies downward motion, so the minimum height cannot really occur at the same point; we assume the acceleration is due to a relatively sudden undulation in the disc that has essentialy no effect on the height.) We also assume the nominal tracking force was set 10%
too low. Then, at this moment, the tracking force is
fdy (min) = 65 - 5 - 10.3-6.5=432dynes. [61
The side force for mistracking is then
fdy(min) tan 20° = 15.7 dynes. [7]
The maximum applied side force might include a worst -case once - around horizontal runout of 0.1 mm, plus a worst -case combination of
RCA Review Vol. 43 March 1982 183
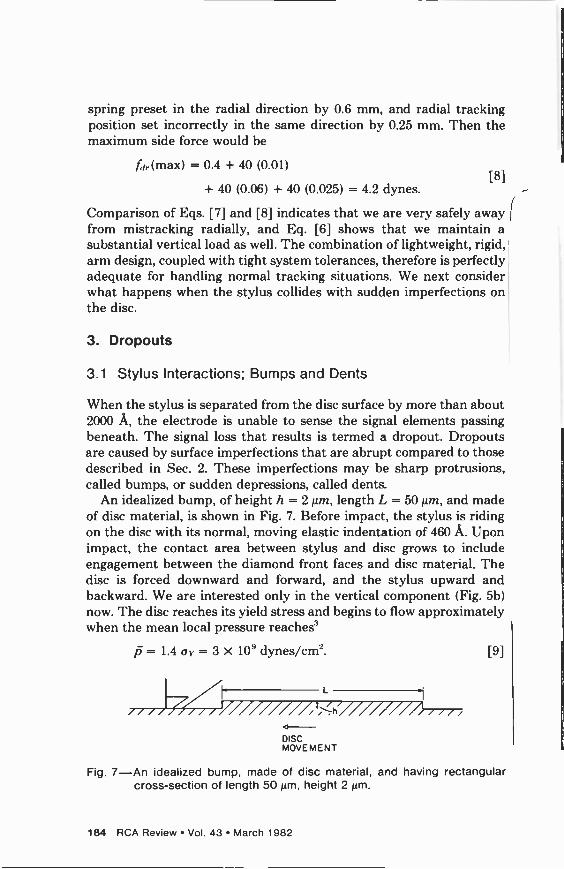
spring preset in the radial direction by 0.6 mm, and radial tracking position set incorrectly in the same direction by 0.25 mm. Then the maximum side force would be
frr(max) = 0.4 + 40 (0.01)
+ 40 (0.06) + 40 (0.025) = 4.2 dynes. [8]
Comparison of Eqs. [7] and [8] indicates that we are very safely away from mistracking radially, and Eq. [6] shows that we maintain a substantial vertical load as well. The combination of lightweight, rigid, arm design, coupled with tight system tolerances, therefore is perfectly adequate for handling normal tracking situations. We next consider what happens when the stylus collides with sudden imperfections on the disc.
3. Dropouts
3.1 Stylus Interactions; Bumps and Dents
When the stylus is separated from the disc surface by more than about 2(X)0 A, the electrode is unable to sense the signal elements passing beneath. The signal loss that results is termed a dropout. Dropouts are caused by surface imperfections that are abrupt compared to those described in Sec. 2. These imperfections may be sharp protrusions, called bumps, or sudden depressions, called dents.
An idealized bump, of height h = 2 length L = 50 µm, and made of disc material, is shown in Fig. 7. Before impact, the stylus is riding on the disc with its normal, moving elastic indentation of 460 A. Upon impact, the contact area between stylus and disc grows to include engagement between the diamond front faces and disc material. The disc is forced downward and forward, and the stylus upward and backward. We are interested only in the vertical component (Fig. 5b) now. The disc reaches its yield stress and begins to flow approximately when the mean local pressure reaches'
p = 1.4 ay = 3 x 10' dynes/cm". [9]
/ / J L l /// ////////tíh////////4///i
DISC MOVEMENT
Fig. 7-An idealized bump, made of disc material, and having rectangular cross-section of length 50 µm, height 2µm.
184 RCA Review Vol. 43 March 1982

VIDEODISC STYLUS DYNAMICS
The diamond is extremely stiff and hard, so all of the elastic and plastic work is in the polymer. The stylus (even the diamond alone) is massive enough that it cannot move vertically by a significant amount compared to the height of the defect, so the stylus simply cleaves through the defect. The total projected area of vertical support (Fig. 3) is
wh Ay = Ashoe + tan 35° - 10.7 (µm) 2 [10]
so that the impulsive force during impact
F, = (fdy) i,npae, -p Ay = 320 dynes. [ 11 ]
The elastic deflection of the disc (Eq. [1]) during impact is 1550 A, using Eqs. [ 10] and [11]; we neglect this movement as small relative to the height of the defect. We also neglect the normal tracking force in Fig. 5b, (hyya + w) = 65 dynes, relative to the impulsive force, so we are left with a very simple equation of motion
F; = me" Utz , [12]
with F; consideredd constant. Integrating this expression once, we get the stylus velocity at the end of impact
(dy F,T, [13]
dt ,_,. melt.
where T; is the impact duration, 10 µsec. The vertical displacement at the end of impact is
F,7,2
2m Of
After impact, the stylus is in free flight, with motion governed by the model shown in Fig. 5b again, this time with fry = 0. Once again we have a very simple equation to integrate,
z
melt jt2 = -(kyyo + w) = -65 dynes,
from which the time -of -flight, tn, is found to be
Fir j [ y t 1+ l+ (k..Ya +w) n (hyya + w) F;
2F;Tr
(kyya + u') - 100 µsec
[14]
[15]
116]
RCA Review Vol. 43 March 1982 185

and the maximum height of projectile -like motion is
F; r; to y, (max) =--. [17]
m,.ff 4
Note that the time -of -flight is mass independent, while the maximum height is not. For meff = 2 mg, the maximum height is 4000 A. The signal is lost for about 80µsec(y > 2000 A).
At the end of flight, the stylus impacts the disc with velocity given by Eq. [13]. We again ignore all but the most important force term in Fig. 5b, leaving another simple equation of motion
dzv men' t2 = fdy = -kdy,
which has the solution
kd fdy = - men -)1/2
r 1/2
F;7; sin f- t]. nleff
[18]
[19]
The impact has a duration r , given by (kd/nreff)'/2T = -. Assuming the contact area is the diamond shoe area only, and using meff = 2 mg, then r = 37 sec and fdy(max) = 270 dynes. Plastic flow of the disc occurs when fry exceeds 1 A.,i,e = 150 dynes. During the time when plastic flow is occurring, the area of contact will increase somewhat, increasing 15A. Eq. [ 19] will not apply during this time. More detailed analysis shows that plastic flow occurs for about 20 µsec, which is 0.1
mm along the groove. All of the energy that goes into plastic flow is lost as heat. In addition, the disc has significant hysteresis losses of perhaps 20% in the "elastic regime. Therefore, the next bounce will be considerably less forceful than the first. The stylus velocity on each exit from disc contact will be less than on entry. If (dy/dt ) is the launch velocity at the start of the nth bounce, the time -of -flight for that bounce is
2meff dy l (kvy + (1t
while the force on the next impact is
y 1/2z
, d (fy),+ d (-) (m,ffkd)'f- sin
k t
dt meff /
[20]
[21]
The net stylus -disc bump interaction thus consists of an initial cut straight through the defect, followed by a series of bounces of dimin- ishing intensity. The first few bounces may produce some disc damage, but later ones will not.
186 RCA Review Vol. 43 March 1982

(b)
VIDEODISC STYLUS DYNAMICS
Interaction with a dent is similar in most regards to a bump. If the dent is sharply defined, the stylus will begin with a free flight (Eq.
151). The analysis follows that for a bump, except that the boundary conditions (yo, dyo/dt) must be carefully accounted for, since they depend on the vertical location at each landing and launching site.
3.2 Examples of Dropouts
Real examples of surface imperfections large enough to launch the stylus off the VideoDisc surface can be found. To locate these imper- fections, a VideoDisc player was modified by the addition of a signal loss detection circuit which was connected to a printer. The printer recorded the radius and angle of all signal losses. Using a microscope with an r -O table, the location of the signal losses were examined. Bumps and dents on the VideoDisc surface were found to be respon- sible for the signal losses.
The bumps found on the surface are localized bulges of the disc material. They typically had heights of 0.5 to 4µm and widths of 10 to 100 µm. Fig. 8a shows an example of a relatively large bump, with a maximum height of 3µm and a width of 50 µm. A special illumination
(a)
1
1---1 0.3 mm
II I0 µm
Fig. 8-Photomicrograph (a) shows an actual bump defect found on a once - played disc. The stylus marks made by initial impact (tar left) and the first three bounces are evident. Photomicrograph (b) shows how the stylus Cut through the bump.
RCA Review Vol. 43 March 1982 167

(a) 0.2 mill
IIµm
1000µm
LANDING MARK ¡sr BOUNCE
MARKS
(b)
Fig. 9-Photomicrograph (a) shows an actual dent defect found on a disc. The initial landing and later bounce marks are visible to the right of the dent. The profile of the dent is plotted in (b). The horizontal scales of (a) and (b) are equal and aligned so that the location of the landing and bounce marks can be determined on the profile.
technique was used to highlight the contrast of this bump. This illumination also makes it possible to visualize the stylus landing areas, which are the dark V-shaped areas to the right of the bump. Fig. 81) is a photomicrograph image of the bump after one play. Note the visible cutting of the grooves. Inspection of the landing areas shows a similar distortion. This bump launched the stylus off the disc surface for more than 64 µsec for 28 grooves in a row. The maximum dropout time was 109 µsec. In all cases, the stylus landed in the same groove that it left. Subsequent plays of the same defect would result in shorter dropouts, because of the cutting taking place on the first play.
Dents can also be found on VideoDisc surfaces. An example of a dent plus the stylus landing marks is shown in Fig. 9a. Also included in Fig. 9a are the first and second stylus bounce marks. These bounce marks are created when the stylus rebounds from its first landing and is launched again due to the nearly elastic nature of the vinyl. About 10 successive bounce marks can be identified for this dent using the special illumination technique. The spacing between successive bounce marks gradually decreases as expected (Eq. [201). The spacing of the first bounce initiated by a dent may be very different from the others,
188 RCA Review Vol. 43 March 1982
VIDEODISC STYLUS DYNAMICS
because it is not launched from the plane of the surface, but rather from the recess of the dent. As can be seen from Fig. 9a, the first spacing between the landing marks in the dent and first bounce marks is larger than the spacing between the first and second bounce marks. This is analogous to a golfer's chip shot out of a sand trap. The chip shot must be long and high enough to get up and over the edge, but successive bounces will dribble along the green.
The stylus -dent interaction illustrated here resulted in launching the stylus into the air for 120 revolutions, and as in the example of the bump, the stylus always landed in the same groove from which it was launched. Fig. 9b is a Taylsurf profilometer tracing of the dent. The arrows indicate the location of the initial stylus landing area, and the first and second bounce locations. Subsequent plays through a dent will not reduce the stylus interaction significantly, because the stylus does not seriously deform the defect. Fifty additional plays of the dent shown in Fig. 9 produced no further changes.
3.3 Dropout Correction
The VideoDisc player electronics contains a CCD 1-H delay line.' This component continuously stores the most recent horizontal line of video. Another circuit is designed to detect any loss of the video signal. When a signal loss is detected, the lost signal is replaced by the signal stored in the CCD delay line. This same signal is fed back into CCD storage, ready to he called again if needed. Therefore, even humps and dents causing signal loss of more than one horizontal line of video are
compensated. This dropout compensation scheme makes the signal loss, rlue to the bumps and dents discussed here, undetectable by the viewer. Larger humps can induce a tracking error in addition to the signal dropout. This category of defects is described in the following section.
4. Tracking Errors
4.1 Stylus Interaction
As described in Sec. 2, the stylus cannot mistrack due to long-term interactions, such as ordinary horizontal runout, vertical warp, or side - bias settings of the stylus. When mistracking events do occur, they are normally the result of collision with sudden imperfections on the disc. After such collisions, described in Sec. 3, the stylus bounces on the disc. If, during the time -of -flight, the stylus moves over by at least half a groove dimension (2.6/2 = 1.3 µm) and flies high enough to clear the
RCA Review Vol. 43 March 1982 189

top of the groove wall (0.4 µm ), the stylus can get into the next groove. One cause of mistracking might be a combination of bump -induced
flight with a radial movement due to horizontal runout. The radial position in normal tracking (Sec. 2) is R + rsin2irfont, where I-. (max) - 0.1 mm at the fundamental frequency (n = 1). The maximum effect occurs when the stylus is kicked up at 2irft = 0; when the stylus lands again at (t + dt), the disc will be at a new position R + r27rfdt. This gives a maximum relative displacement of 0.47 µm, which is not enough to cause mistracking. As the stylus bounces, it will be recentered in the groove each time it strikes the disc. As noted in Sec. 2, the product [r(max)n] should diminish rapidly for n > 1. This effect could cause mistracking for bounces of duration greater than about 270 µsec, but a disc with such an enormous defect would be unlikely to slip through quality control.
Another cause of mistracking might be a radial drift, during flight, due to stylus side bias. In Fig. 5a, k, r is the bias force and fir = 0, since the stylus is in flight. The equation of motion is
, d -r krr = meff tl ,
which gives a radial movement of
krr rf, - t¡1,
2meff
[22]
[231
where (fl) refers to the first flight. If we take krr(max) = 3.4 dynes from Sec. 2 and tf, = 1(X) sec from Sec. 3, then rf, = 850 for meff = 2 mg. Mistracking is therefore very unlikely from this cause also.
The principal cause of mistracking is the radial impulsive force imparted to the stylus during a collision. In Fig. 5a, we now apply an impulsive fir = Fr;, and ignore krro as insignificant. We assume the stylus impacts the same idealized defect (Fig. 7) analyzed for vertical impulse in Sec. 3. Idealized impacts with this defect will have no radial force component. Since the defect is not as high as the keel of the stylus, there is no overlap of removed material as the stylus proceeds from one groove to the next. The material that is removed from the path of the stylus certainly must appear somewhere, but we have assumed for simplicity that each pass of the stylus is independent of what has happened before and is the same as a single idealized impact. In reality, there are a wide range of circumstances that evolve as a defect is distorted by the stylus and, of course, real defects do not have ideal shapes to begin with. To get an estimate of Fr;, we assume the stylus impacts the 2-µm high defect of Fig. 7 on one front face only.
190 RCA Review Vol. 43 March 1982

VIDEODISC STYLUS DYNAMICS
The projected area of contact on that face in the radial direction is (cf. Fig. 3)
A hui - 4.8(µm) -.
2 tan 22.7°
Therefore
Fri = pA, = 145 dynes.
The equation of motion from Fig. 5a is
rlZl = -theft -
which integrates to give
2Fr; F T;_., - lllefí(,.'yyO + u')
[241
[251
[261
[271
using Eq. (16). The radial drift is 0.71 µ»l for the idealized defect, using = 2 mg, and mistracking will not occur. Larger defects can have
substantially greater effects. A defect that is twice as tall and twice as long as Fig. 7 will have a radial drift (2)4 times greater. (The effect can be even greater than this because a 4-µm tall defect is above the keel of the stylus, so the projected area of contact (Eq. [241) can begin to grow as h2.) It is partly because of this effect that very strict quality control standards have been set.
4.2 Tracking Error Example
An example of a bump -type defect which caused the stylus to skip forward by one groove is shown in Fig. 10. This forward skip was detected and recorded by a player designed particularly for location of tracking errors. One can also determine that a forward skip took place by examining the groove damage. The arrow in Fig. 10a points to the groove left uncut by the first play of this disc. The defect is 3.8 pm high and 44 µm long. The maximum stylus flight time was 117 µsec. The calculations of the previous section established that the most probable cause of mistracking is the generation of a radial impulse to the stylus during cutting. Examination of the SEM micrograph of Fig. l0a reveals that the groove in which the forward skip was generated is
the first groove in which a substantial chunk of the defect was broken away. This material may have been broken away because the height of this part of the defect exceeded the height of the stylus keel. The
RCA Review Vol. 43 March 1982 191
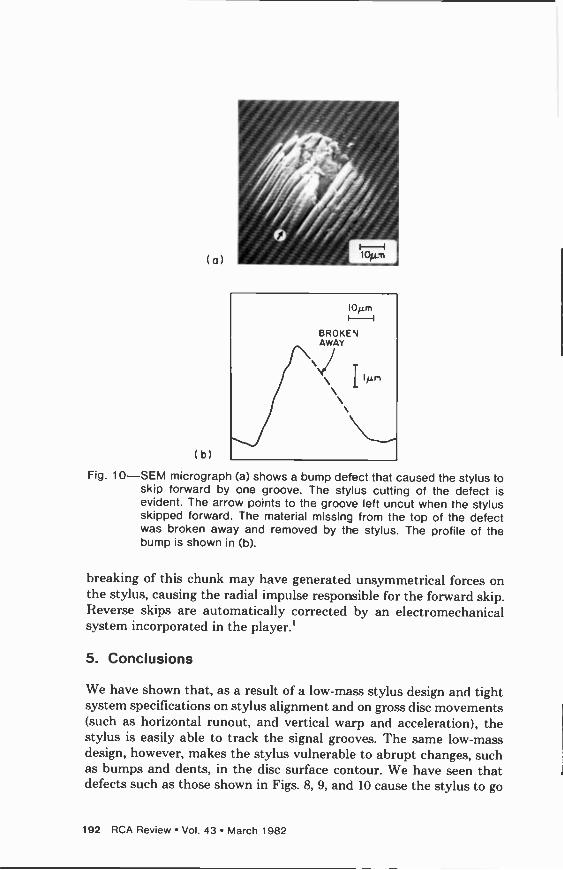
(a)
(b)
----a I Oµm
10µm F-1
BROKEN AWAY
I 1µn
Fig. 10-SEM micrograph (a) shows a bump defect that caused the stylus to skip forward by one groove. The stylus cutting of the defect is evident. The arrow points to the groove left uncut when the stylus skipped forward. The material missing from the top of the defect was broken away and removed by the stylus. The profile of the bump is shown in (b).
breaking of this chunk may have generated unsymmetrical forces on the stylus, causing the radial impulse responsible for the forward skip. Reverse skips are automatically corrected by an electromechanical system incorporated in the player.'
5. Conclusions
We have shown that, as a result of a low -mass stylus design and tight system specifications on stylus alignment and on gross disc movements (such as horizontal runout, and vertical warp and acceleration), the stylus is easily able to track the signal grooves. The same low -mass design, however, makes the stylus vulnerable to abrupt changes, such as bumps and dents, in the disc surface contour. We have seen that defects such as those shown in Figs. 8, 9, and 10 cause the stylus to go
192 RCA Review Vol. 43 March 1982

VIDEODISC STYLUS DYNAMICS
through a series of bounces, each of duration ca. 100 µsec. For these defects, the stylus flies about as high as the groove is deep, so any substantial radial asymmetry may cause the stylus to move into an adjacent groove. Dropout compensation and tracking correction sys- tems are included in the player to make such defects unobtrusive.
Acknowledgments
The authors wish to thank B. Seabury and J. LaPata for their photo- graphs, which were used in this article, and J. Morewood for his Talysurf profilometer tracings of defects. J. Bowen and M. Coutts have contributed much to our understanding of actual disc defects. The stylus arm and defect correction systems were developed by the player design engineers in Indianapolis and Princeton.
References
J. J. Brandinger, "The RCA CED VideoDisc System-An Overview," RCA Re- view, 42, p. 333, Sept. 1981.
2 S. P. Timoshenko and J. N. Goodier, Theory of Elasticity, McGraw-Hill Book Co., New York, (1970). ' D. Tabor, Review of Physics in Technology, 1, 3, p. 145 (1970).
RCA Review Vol. 43 March 1982 193
Capacitive -Pickup Circuitry for VideoDiscs
R. C. Palmer, E. J. Denlinger, and H. Kawamoto` RCA Laboratories, Princeton, N. J. 08540
Abstract Circuits for capacitive pickup from a VideoDisc were designed using the concept of transmission lines printed on circuit boards. Circuits of the printed -board type have achieved an accuracy required in microwave design and a reproducibility needed in
mass production. A theoretical analysis has revealed that the pickup sensitivity increases with operating frequency, which gives an advantage to the design with the microwave transmission -line circuit over an earlier design using a 250 -MHz lumped -element circuit. The pickup circuit operating at 915 MHz has generated an output of 10 mV peak -to -peak from a signal capacitance as small as 10'" pF, and a ratio of carrier -to -circuit noise as high as 68 dB measured in a 30 -kHz bandwidth.
1. Introduction
The key to the operation of the IUCA CEI) Videoi)isc system is a capacitive pickup that detects a capacitance as small as 10' pF to transverse slots engraved in the grooves of the VideoDisc. To meet the system performance target, a carrier -to -noise ratio near 50 dB measured in a 30 -kHz bandwidth is required, necessitating a pickup system with internal circuit noise about 10 dB below disc noise.
In this paper, we first describe the development as it progressed from an earl, design of a lumped -element circuit operating near 250 MHz to a current design of a transmission -line circuit operating at 915 MHz. The main body of the paper is a design theory of the 915 MHz
Now with Sony Consumer Electronics Laboratories, Paramus, NJ.
194 RCA Review Vol. 43 March 1982

CAPACITIVE -PICKUP CIRCUITRY FOR VIDEODISCS
pickup circuit. Circuits of a printed -board type have been used throughout the design to achieve an accuracy required in microwave design and a reproducibility needed in mass production. The paper discusses the design theory of a microwave resonator consisting of stripline, fly lead, stylus -to -disc capacitance, and varactor diode. Since the body of the VideoDisc is a part of the microwave resonator, the paper discusses the effect of disc electrical resistance on the pickup sensitivity. The design includes some detail of the stylus -to -disc inter- acting region. The paper includes descriptions of a stable oscillator, an automatic frequency control (AFC), and a preamplifier, all of which have been assembled with the resonator.
2. Lumped -Element Circuit
Capacitive pickup used in the RCA CED VideoDisc system employs a form of slope detector, in which the change in stylus -to -disc capaci- tance modulates the center frequency of a resonant circuit. 'l'he resonant circuit in early designs was made of lumped circuit elements,' as shown in Fig. 1. Response of the resonant circuit to a fixed drive signal that is removed from the center frequency ís determined by a
simple diode detector; variation of the stylus -to -disc capacitance shifts the resonant frequency so that the drive signal in effect moves up and down the flank of the tuning curve, and the detected signal thus varies with the signal capacitance. Several features of the behavior of this simple capacitance -detection system are of interest and served to point the directions for improvement in succeeding developments.
Pickup sensitivity, which is defined as the rate of change in diode voltage u with respect to the change in the stylus -to -disc capacitance Csn, is of main concern in the pickup circuit design. The sensitivity is
expressed by
du (If
Cs» df t1Cs1,'
where f is the center ti equencv of the resonant circuit. For a bellshaped resonant curve, in which t' = Vp/./1 + 2(fr, - f)/B 12, it can be shown
6 dB
RF SIGNAL PAD
GENERATOR #
EFFECTIVE TUNING/ CAPACITANCE, CL
VIDEO DISC
HP2900A DETECTED SIGNAL OUT
1 2 pF
FLY LEAD
1
STYLUS
STYLUS TO DISC CAPACITANCE
CSD
Fig. 1-Lumped-element pickup circuit used at 250 MHz.
RCA Review Vol. 43 March 1982 195
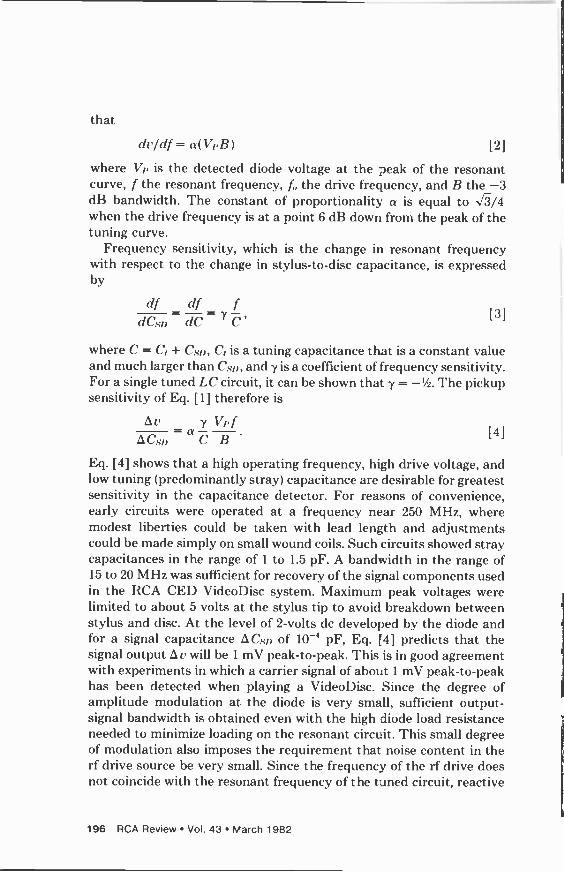
that
dv/df = a(VpB) 12]
where Vp is the detected diode voltage at the peak of the resonant curve, f the resonant frequency, f, the drive frequency, and B the -3 dB bandwidth. The constant of proportionality a is equal to f/4 when the drive frequency is at a point 6 dB down from the peak of the tuning curve.
Frequency sensitivity, which is the change in resonant frequency with respect to the change in stylus -to -disc capacitance, is expressed by
cif df f dCsu dC C
13]
where C = C, + Csu, C, is a tuning capacitance that is a constant value and much larger than Csn, and y is a coefficient of frequency sensitivity. For a single tuned LC circuit, it can be shown that y = -'/z. The pickup sensitivity of Eq. [II therefore is
y Vpf J Csv C B
141
Eq. [41 shows that a high operating frequency, high drive voltage, and low tuning (predominantly stray) capacitance are desirable for greatest sensitivity in the capacitance detector. For reasons of convenience, early circuits were operated at a frequency near 250 MHz, where modest liberties could be taken with lead length and adjustments could be made simply on small wound coils. Such circuits showed stray capacitances in the range of 1 to 1.5 pF. A bandwidth in the range of 15 to 20 MHz was sufficient for recovery of the signal components used in the RCA CED VideoDisc system. Maximum peak voltages were limited to about 5 volts at the stylus tip to avoid breakdown between stylus and disc. At the level of 2 -volts do developed by the diode and for a signal capacitance SCsn of 10-' pF, Eq. [4] predicts that the signal output .5v will be 1 mV peak -to -peak. This is in good agreement with experiments in which a carrier signal of about 1 mV peak -to -peak has been detected when playing a VideoDisc. Since the degree of amplitude modulation at the diode is very small, sufficient output - signal bandwidth is obtained even with the high diode load resistance needed to minimize loading on the resonant circuit. This small degree of modulation also imposes the requirement that noise content in the rf drive source be very small. Since the frequency of the rf drive does not coincide with the resonant frequency of the tuned circuit, reactive
196 RCA Review Vol. 43 March 1982

CAPACITIVE -PICKUP CIRCUITRY FOR VIDEODISCS
components are presented to the rf source. Effects of this mismatch in
early circuits were minimized by the simple expedient of inserting an attenuator pad in the rf drive path.
3. Design Theory of Transmission -Line Circuit
The lumped -element circuit operating at 250 MHz generated a carrier output of 1 mV peak -to -peak. To minimize the level of noise relative to the carrier level in the detector output, it was desired to increase the pickup sensitivity. The carrier -to -noise ratio may be expressed by
CNR - z
J7l p2 + n 11/1 + G1n) 151
where _Sv is the output carrier level, nD represents the noise originating in the disc, and nc represents the noise generated in the pickup circuit. When the sensitivity is increased, both carrier At, and disc noise nu increase; but the ratio 5v/nu, which is a carrier -to -noise ratio intrinsic to disc properties, stays unchanged. The principal cause of the circuit noise /lc is frequency instability of the driving oscillator. The (dc/df) term of Eq. [ 1] cannot be increased because the bandwidth of the resonant circuit must be held at about 20 MHz to pass sidebands of the signal, and peak drive voltage is limited by stylus -to -disc break- down. Increased sensitivity may he realized by increasing the term (df/desD) in Eq. [ 11, which does not affect the circuit noise. The CNR is therefore increased through the reduction of nc/nD. As was seen in Sec. 2, the frequency sensitivity of the lumped -element circuit in- creases with operating frequency. Operation at frequencies substan- tially higher than 250 MHz requires design with the concept of dist rib- uted circuits. It will be shown later that the sensitivity increases with operating frequency regardless of the choice between the lumped - element circuit and the transmission -line circuit.
The choice of operating frequency has been made in view of the requirements of FCC regulations. To avoid interference with television UHF channels, current FCC regulation' calls for the radiation at UHF bands from television -type devices to be less than 15 µV/m measured at a distance of 1 m from the radiation source. The FCC assigns a band from 902 to 928 MHz for Industrial, Scientific, and Medical use (known as ISM band), within which radiation is permitted up t.o 50,000 V/m at a distance of 30 ni. For reasons of economical design, we have
chosen the 915 MHz band as the operating frequency for the Videolisc pickup.
RCA Review Vol. 43 March 1982 197

3.1 Mechanism of Operation
Fig. 2 illustrates the mechanism of operation for a transmission -line pickup circuit operating at 915 MHz. The circuit consists of three transmission lines that are coupled with each other. A fly lead con- necting the stripline resonator to the stylus is a thin flexible metal strip that can accommodate small movements of pickup stylus relative to the transmission -line circuit. The stylus is composed of a main body of diamond shaped to fit the groove and a thin metal electrode sputtered on a surface perpendicular to the groove. The disc has an electrical resistance that is determined by its resistivity and the field pattern in the area around the stylus. The length of a stylus shoe is 3.5 µm in the rotational direction, and one cycle of the relief pattern is typically 1
µm. Because of its physical dimensions and mechanical resonant frequency, the stylus rides on the tops of the relief pattern. The stylus - to -disc capacitance between the electrode tip and the disc surface varies as the VideoDisc is moved relative to the stylus. The stylus -to - disc capacitance is a part of the resonant circuit, which consists of the center transmission line, fly lead, stylus electrode, stylus -to -disc capac- itance, disc resistance, circuit housing, varactor diode, and coupling capacitor.
The center frequency of the resonant circuit varies slightly with changes in G. as the disc is rotated. A 915 -MHz signal from an oscillator is coupled through the resonator transmission line to a
DIAMOND
DISC MOTION
SIGNAL CAPACITANCE 4CSp = IC 74 pF
OSCILLATOR 915 MHz
DISC RESISTANCE
AUTOMATIC FREQUENCY CONTROL
VARACTOR
1
DETECTOR
:1000 A
*OIL
/\A.,IOmVpp
22 k OUTPUT
Fig. 2.-Schematic diagram showing how the relief pattern is replicated as an electrical signal in a transmission -line pickup circuit.
198 RCA Review Vol. 43 March 1982

CAPACITIVE -PICKUP CIRCUITRY FOR VIDEODISCS
FREQ. DEVIATION
115 kHz
Vp
V
SLOPE= s/3
3w
V V 10 mVPV
f0=9 5 MHz FREQUENCY
RESONANT DRIVE FREQ. FREQ.
Fig. 3.-The response of detector output as a function of driving frequency illustrating how the shift in resonant frequency is converted into an output voltage.
detector transmission line. The frequency response curve of the detec- tor output is bell shaped as shown in Fig. 3. The frequency of resonance is adjusted such that the 915 -MHz signal is at a point 6 dB down from the resonant peak. Corresponding to the change in resonant frequency, the resonant curve in Fig. 3 moves horizontally. The detector output, which is a voltage at 915 MHz on the resonant curve, varies as the stylus rides on the relief pattern. Therefore, the detector output becomes an electrical replication of the relief pattern engraved on the surface of the VideoDisc.
3.2 Circuit Parameters
The circuit parameters are important considerations in designing the pickup circuit. In particular, the signal capacitance _SC.tio and the characteristic impedance of the transmission line Z0 directly affect the sensitivity and the carrier -to -noise ratio. Fig. 4 is an equivalent circuit for the resonant loop in the pickup assembly. The transmission line has a characteristic impedance of Z and its physical length is 10. The tly lead is considered to behave as a transmission line having charac- teristic impedance Zr and length 1r. The vat -actor diode has a capaci- tance Cv that can be varied from 6 to 18 pF.
In the design, it is important to know how the tip of the electrode interacts with the signal element on the disc surface. Fig. 5 illustrates a pattern of electrical field lines around the tip of the stylus elect rode. It is seen that a portion of the field lines originating from the stylus directly reaches the surface of the VideoDisc. This component of field
RCA Review Vol. 43 March 1982 199

Fig. 4.-Equivalent circuit of a transmission -line resonator.
lines is represented by a capacitor Csi, in Fig. 4. Note that the field lines that go through a signal element right underneath the stylus electrode are only a fraction of the stylus -to -disc field lines. This component corresponds to the signal capacitance ,Cw, to he detected by the pickup circuit. Moving the electrode position from peak to valley of the relief pattern, the stylus -to -disc capacitance varies only by 10-" pF. The disc is conductive on its surface and has a finite resistance R1,. The field lines that are bridging the disc to the bottom of the circuit housing provide a return path for the electrical current in the disc. The disc -to -housing capacitance has been calculated to he much higher than the stylus -to -disc capacitance; thus the return path is assumed in Fig. 4 to be short-circuited. Fig. 5 indicates that a portion of the field lines from the stylus directly reaches the housing without touching the surface of the VideoDisc. This fringing field is represented by a capacitor C,.. in Fig. 4. The total stylus capacitance (Cs, + CF) has been estimated to be approximately 0.1 pF.
Assuming that the characteristic impedance of the transmission line is equal to that of the fly lead and the disc resistance is much smaller
STYLUS ELECTRODE CIRCUIT
HOUSING
Fig. 5.-A sketch of electrical field lines ifn the vicinity of the stylus electrode.
200 RCA Review Vol. 43 March 1982

CAPACITIVE -PICKUP CIRCUITRY FOR VIDEODISCS
than the impedance of other circuit components, we can analytically calculate the frequency sensitivity of the resonant circuit of Fig. 4. The circuit is in resonance when
1 wCv cos /3l+ jZ°sin/3/
jwC+Z° -0 [6]
Z0cos/31+- sin /31 LICv
where C = Csu + CF, I = 1° + 1F, /3 = w/u,,, w is the angular frequency, and up the velocity of propagation in the transmission line. The first term in Eq. [6] represents an impedance seen from the stylus electrode toward the disc and the second term an impedance seen from the electrode toward the transmission line. Solving Eq. [6 ], the frequency of resonance is given by
+ C) tan l3l-
CC,.w. Z2 - 1
The value of /31 required for the circuit to resonate at 915 MHz has been calculated as a function of C,, and is shown in Fig. 6. The calculation has been done assuming C = 0.1 pF and with Z. as a parameter varying from 100 to 300 a The frequency sensitivity of the transmission -line circuit is given by [3], which was given in Sec. 2 for the lumped -element circuit. As shown in the Appendix, the coefficient of frequency sensitivity y is expressed by
Y-
1
1
wC Z.° tan /3/
2 + 1
+ 1) 1 [ /3/(tan /3l + cot /31) - 1) ] (-C,,
C wZ° tan /31
181
The value of y has been calculated as a function of /3/, and is shown in Fig. 6.
It can he seen in Fig. 6 that the coefficient of frequency sensitivity y increases almost proportionally with the characteristic impedance. The varactor capacitance required for resonance at 915 MHz increases with a decreasing length of transmission line. Assuming that a char- acteristic impedance of 300 5.Z has ben obtained, the angular length /3l must he larger than 80.20° for the circuit to he resonant at 915 MHz. The optimum value for /31 will be 84° when the varactor voltage is approximately in the middle of its adjustable range. The 84° angular length corresponds to 7.7 cm if the resonant line is surrounded by air
RCA Review Vol. 43 March 1982 201

medium and, as shown by Fig. 6, y = 0.1. The frequency sensitivity therefore is
df f - 1.0 x f. [3a]
dC( pF) C(pF)
Assuming that the operating point is 6 dB down from the resonant peak, V7, = -4 volts, and the bandwidth is 20 MHz, the detector output has been calculated to be 8 mV peak -to -peak. This detector output is much larger than the 1 mV p -p obtained from the lumped -element circuit. Experimentally, a pickup circuit of transmission -line type has achieved a detector output as large as 10 mV p -p.
It is interesting to consider the contribution of the individual terms of Eq. [3a] to the increase in sensitivity afforded by the transmission - line design over the lumped -constant circuit. The capacitance C for the lumped -element design includes distributed capacitance of the tuning coil together with the stylus (stylus -to -disc and stylus-to-hous-
100
50
20 vY (VOLT 51
-10F - á 12 5- 0
> 2-
0.5
02-
00170
6.4
---15 20
(alms) 100
200
300 I
Z0
(.hms) 300
_200 1
100
80 90 100 fit (DEGREE)
110 120
7 3 8 2 9 1 .0 O 10 9 L IN MR (CO
Fig. 6.-The frequency sensitivity coefficient y and varactor capacitance Cv as a function of angular length 131 for a resonant frequency of 915 MHz.
202 RCA Review Vol. 43 March 1982

CAPACITIVE -PICKUP CIRCUITRY FOR VIDEODISCS
ing) capacitance and is 1 pF, whereas C for the transmission -line consists only of the stylus capacitance, which is 0.1 pF. According to the above computations, the coefficient of frequency sensitivity y for the lumped element circuit is 0.5, while that for the transmission -line circuit ranges from 0.05 to 0.1 depending on the length of the line and choice of characteristic impedance. The term y/C appears to be a parameter representing the effect of distributed capacitance on the sensitivity and stays in the narrow range from 0.5/pF for the lumped - constant design to I/pF for the 300 ohm transmission -line design. This term therefore accounts for a factor of two improvement in sensitivity if the best 300 -ohm transmission -line design is adopted. However, the term f in Eq. [3a ] directly improves sensitivity by a factor of four when the operating frequency is moved from 250 MHz to 915 MHz. It can thus be said that operating frequency is the parameter that has contributed most to the increase in sensitivity of the transmission -line circuit over the lumped -constant circuit.
3.3 Disc Resistance
In the foregoing discussion of the effect of circuit parameters on the pickup sensitivity, the disc resistance has been assumed negligibly small compared with the impedance of other circuit parameters. The disc is a part of the microwave resonant circuit; hence the disc resistance is an important parameter in the design of the pickup circuit. Since the stylus -to -disc capacitance Cs is a very small fraction of the total tuning capacitance (C, + C), it is expected that the resistance RD in series with Csu does not affect the Q of the resonator nor the peak detected voltage and thus does not change the (du/df) term in Eq. [1]. Experiment has verified that playing a disc having high resistance does not change the Q of the resonator nor the peak detected voltage but does significantly degrade the pickup sensitivity. Therefore, the disc resistance has an effect only on the (df/dc) term in Eq. [ 1 ].
A digital computer has been used to simulate the effect of disc resistance on the frequency sensitivity (df/de). The circuit parameters used in the simulation are:
Transmission -line impedance = T,,, = 275 St
Transmission -line length = 1 = 5.95 cm Fly lead impedance = Z,. = 301) It Fly lead length = /F = 2.25 cm Total stylus capacitance = Csu + CF = 0.1 pF Signal capacitance = .1Csu = 10-' pF Varactor capacitance in series with coupling capacitance = 1/
(1/C,. + 1/Ce) = 4.78 pF
RCA Review Vol. 43 March 1982 203

In the computation, the stylus -to -disc capacitance Cm) was used as a parameter, while the total stylus capacitance (Csu + CF) is held at 0.1 pF. Fig. 7 shows the frequency deviation áf and the resonant frequency f as a function of disc resistance. It can be seen that the resonant frequency stays at 915 MHz when the disc resistance is small and shifts to a higher value when the disc resistance becomes larger than a critical value. The shift in frequency occurs at a point where
Iu = 1 /wC.,w. [9]
This can he understood because when the disc resistance is much less than the capacitor impedance, the transmission -line directly sees the stylus -to -disc capacitor; whereas, when the disc impedance is much larger than that of the capacitor, the transmission -line does not see the stylus -to -disc capacitor. The amount of frequency shift is seen to he proportional to the value of Cs!). Fig. 7 also shows that the frequency deviat ion J f corresponding to .Csu of 10' pF stays constant until the disc resistance reaches approximately '/ 0. Csu, at which point it declines with a slope of the square of disc resistance.
The effect of disc resistance has been investigated using a number of discs having sheet resistance ranging from 23 St/O to 5 M52/111. The result shown in Fig. 8 verifies the characteristics predicted by the computer simulation of Fig. 7. It is seen that the frequency starts shifting when the sheet resistance is 10 kSt/O. Fitting the theory to the experiment, we have found that the value of Cs!, is 0.011 pF and the
100
50
30 20
1000
= 950
` 920 915
910
0.017\0.007
= 0.1 pF
CSD
ACSD =104 pF
0.0001\
0.017 0.007
300 275 ohms ohms
=1T10.1 pF - CSD)
0.0001 -
*}4.78 pF
100 Ik IOM IOOk IM
DISC RESISTANCE RD (ohm)
Fig. 7.-Computer simulation of resonant frequency f and its deviation .If for 1Cso = 10-4 pF as a function of disc resistance Ro.
204 RCA Review Vol. 43 March 1982

CAPACITIVE -PICKUP CIRCUITRY FOR VIDEODISCS
o 0 0
o I kSr
o
0
10 100 1k 10k IOOk IM IOM SHEET RESISTANCE AT 915 MHz (A/a)
Fig. 8.-Experimentally obtained carrier output and resonant frequency as a function of disc sheet resistance.
critical disc resistance is 16 kS2. Assuming that the disc resistance is in the form of a spreading resistance of a ring -shaped resistor with inner radius a and outer radius h, the disc resistance is given by RD= R01/27; In h/ a. The results of R = 10 ka2/0 when lib = 16 k52, for instance, corresponds to a ring of rr = 1µm and b = 2 cm.
Experiment has shown that the pickup sensitivity will not be affected when the disc resistance is less than 36 k52/ and that the resonant frequency stays at 915 MHz when the disc resistance is less than 10 142/0. A sheet resistance of 200 12/0 was routinely obtained with the disc coating technique3 developed at RCA; this value is well below the critical sheet. resistances. Because the sheet resistance can he as high as 361(52/0, we have developed' a bulk conductive disc made of carbon - loaded PVC. In the carbon -loaded PVC disc, the sensitivity is ex- pressed as a function of bulk resistivity; it has been found that the resistivity must be less than 5 52 -cm to achieve a carrier -to -noise ratio near 50 dB measured in a 30 -kHz bandwidth.
4. Construction of Transmission -line Circuit on Printed Board
In a prior design of a transmission -line circuit,'' a metal arm that supported the stylus was also used as an electrical transmission line. Since the stylus and arm were held in position by the disc and the arm moved according to groove displacements when the disc was played, the reproduction of exact arm position was difficult to achieve in mass production. As a result, the design value for the pickup sensitivity had to be sacrificed in favor of margins needed in production. In the design currently in use, the transmission line is a separate unit from the
RCA Review Vol. 43 March 1982 205

supporting arm and is printed on a circuit board.b Circuit -board con- struction has been used throughout the design of the oscillator and the AFC -preamplifier circuit, as well as in the resonator circuit. The printed -circuit -board approach offers the accuracy required in micro- wave design as well as the efficiency and reproducibility needed in mass production.
4.1 Resonator for 915 MHz Operation
A photograph of a prototype 915 -MHz pickup circuit is shown at the bottom half of Fig. 9. The circuit has been fabricated on copper -clad fiberglass boards (Er z 2.4) with copper cladding removed from the bottom surface of the board. The stripline etched on the top surface and a metal housing behave as a rectangular transmission line. A coupling loop placed on the oscillator side is made of a metal wire. The metal -wire loop can be lifted for the purpose of adjusting the level of oscillator driving power. The detector diode is an HP 5082-2900 Schottky barrier diode, and the varactor diode is a Siemens BB105B silicon double -diffused epitaxial planar diode. The circuit components are placed on the bottom side of the circuit board. Fig. 10 is a typical resonant curve obtained from 915 MHz transmission -line circuit and shows that the Q of resonant circuit is 45.
4.2 Oscillator for 915 MHz Operation
A 915 -MHz oscillator fabricated on fiberglass circuit board is shown at the top half of Fig. 9. Fig. 11 illustrates a circuit diagram of the oscillator.
TUNING PLATE TRANSISTOR
DETECTOR OUTPUT
Fig. 9.-Prototype 915 MHz oscillator (top) and resonator (bottom).
206 RCA Review Vol. 43 March 1982

CAPACITIVE -PICKUP CIRCUITRY FOR VIDEODISCS
915 MHz
FREQUENCY; 15 MHz /div.
Fig.10.-Resonant curve for the 915 -MHz resonator showing that its O is approximately 45.
It has been found that the instability of the oscillator is one of the principal causes of the noise generated in the pickup circuit. For better stability, the oscillator design has to be such that the power reactively circulating in the oscillator is much larger than the power actually delivered to the resonator circuit. The oscillator used in the pickup design is capable of delivering 50 mW power if a matched load is
connected to the oscillator, while the power actually delivered to the resonator is estimated to be less than 1 mW. Under this condition, the oscillator is very lightly loaded, and operates by itself without being disturbed by fluctuations in loading. It has also been found that the noise level relative to the carrier level at the detector output decreases as the coupling between the oscillator and the resonator is loosened. Since the coupling in this circuit is of a nondirectional type, the noise in the resonator box transmits to the oscillator box and modulates the oscillator. The oscillator modulation adds an additional contribution to the originally existing instability. Loosening the coupling reduces the noise fed to the oscillator, hence reducing the degree of oscillator modulation. The oscillator designed for the signal pickup has achieved a noise as small as 1 µV rms measured at 5 MHz in a 30 kHz bandwidth at the detector output.
FERRITE BEAD
6.8k
MT2060
4701 2.7 It T 184 3.3T
+ 15 V
4704.7P
TUNING PLATE
1 915 MHz _a OUTPUT
Fig.11.-Circuit diagram for the 915 -MHz oscillator.
RCA Review Vol. 43 March 1982 207

DETECTOR
4.3 AFC and Preamplifier Circuit
Fig. 12 shows a circuit diagram of the automatic frequency control used in the pickup design. The AFC circuit is designed hold the dc level of the detector output at the -2 volt point, which is 6 dB down from the resonant peak. If the detector voltage increases to a level higher than -2 volts because of, for instance, the increase in fringing capacitance Cr, the following events take place in order. The voltage at the base of transistor T2 rises, the current through transistor T3 decreases, the voltage across capacitor Cl increases, the varactor capacitance decreases and the resonant frequency increases. As a result, the detector voltage returns to the original -2 volts. If the fringing capacitance changed beyond the range of AFC, the voltage across Cl charges to 10 volts. At this point, the unijunction transistor is fired, and the voltage across C1 is pulled down to zero. The capacitor starts charging again until it reaches the 10 -volt threshold voltage. The capacitor repeats charging and discharging in search of a stable point until conditions for stable operation are re-established.
A preamplifier used with this pickup design has a gain of 44 (lB at 5 MHz and a pass -band of 10 MHz. Equivalent input noise of the preamplifier has been measured to be 0.8 µV rms at the detector output.
4.4 Assembly of 915 MHz Circuits
Fig. 13 shows the arrangement of resonator, oscillator, and AFC - preamplifier circuit in their housing. Also shown in Fig. 13 are the fly lead, a stylus supporting arm, and an arm stretcher` that compensates
TO PRE- AMPLIFIER
+8.5V
T0 -2 V TI
22k
=33k 2.2k -14 Vó
1500 oFT
5.6 k
.05T
+14V
T4 UNI-JUNCTION
CI TRANSISTOR
.051 2.7k 56µH
TO VARACTOR DIODE
1.5k
14 V
Fig.12.-Automatic frequency control circuit connected to the pickup reson- ator.
208 RCA Review Vol. 43 March 1982

CAPACITIVE -PICKUP CIRCUITRY FOR VIDEODISCS
f«ií OSCILLATOR
i u 1 . v
ARM- --_ STRETCHER 7 %' r
/ 7 STYLUS ARM FLY RESONATOR AFC -
CARTRIDGE LEAD PREAMPLIFIER
Fig.13.-Assembly of pickup circuits.
the speed error caused by eccentricity of the disc. The 915 -MHz pickup has generated a carrier level as high as 10 mV peak -to -peak. The total system noise originating in the oscillator, detector, and preamplifer has been measured to he 1.41.tV rms at the detector output. The pickup circuit has achieved a ratio of carrier -to -internal -circuit noise measured in a 30 -kHz bandwidth of 68 dB, thus affording a substantial margin between disc and circuit noise.
5. Conclusions
The capacitance pickup circuit for the RCA VideoDisc system has been designed based upon the concept of transmission lines printed on a circuit board. A printed -board type of circuit assures the dimensional accuracy required in microwave design and the reproducibility needed in mass production.
Analysis of the transmission line circuit has revealed that the pickup sensitivity increases with the characteristic impedance of the trans- mission line, and with the operating frequency. The pickup sensitivity has been shown to increase from 1 mV peak -to -peak for an early design of a 250 -MHz lumped -element circuit to 10 mV peak -to -peak for the current design of a 915 -MHz transmission -line circuit. When a disc of the metal -coated type is played, the pickup circuit operates with a disc sheet resistance up to 36 k12/0 without degradation in pickup sensitiv- ity. When a disc of the carbon -loaded PVC type is played, the disc's bulk resistivity must be less than 512 -cm to achieve a commercially - acceptable carrier -to -noise ratio.
The 915 MHz pickup circuit has achieved a ratio of carrier -to - internal -circuit noise measured in a 30 -kHz bandwidth as high as 68 dB, assuring that performance is not limited by the capacitance detector.
RCA Review Vol. 43 March T982 209
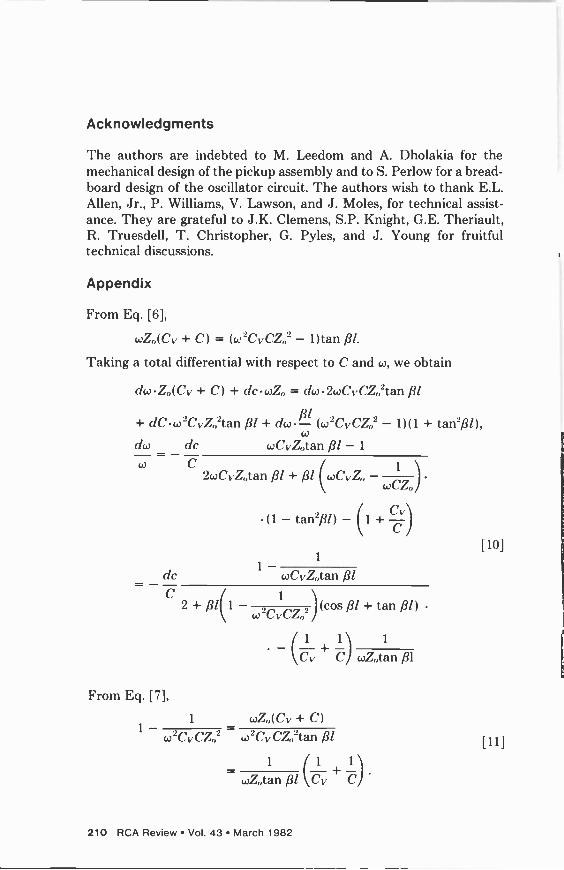
Acknowledgments
The authors are indebted to M. Leedom and A. Dholakia for the mechanical design of the pickup assembly and to S. Perlow for a bread- board design of the oscillator circuit. The authors wish to thank E.L. Allen, Jr., P. Williams, V. Lawson, and J. Moles, for technical assist- ance. They are grateful to J.K. Clemens, S.P. Knight, G.E. Theriault, R. Truesdell, T. Christopher, G. Pyles, and J. Young for fruitful technical discussions.
Appendix
From Eq. [61,
wZ0(Cv + C) = (w2CvCZ02 - 1)tan /3l.
Taking a total differential with respect to C and w, we obtain
dwZ (Cv + C) + dcwZ0 = dw2wCvCZ 2tan /il
+ cICw2CvZo2tan /31 + dw (w2CvCZo2 - 1)(1 + tan2fil),
dw dc wCvZatan /31 - 1
w C 1
2wCvZotan /31 + /31 (coCvZ. - wC7o)
(1-tan2/3l)-(1+ Cv)
1101
dc
C
From Eq. [7],
1
1
1
wCvZotan /31
w2C1vC7 2 (cos /3l + tan /31)
1 1 1
Cv + C) wZtan /31
1 wZo(Cv + C)
w2CvCZ2 w2CvCZo2tan /31
wZotan /31 (Cv + C)
210 RCA Review Vol. 43 March 1982

CAPACITIVE -PICKUP CIRCUITRY FOR VIDEODISCS
Substituting Eq. [11] into [10]
dw dc 1 wCvZtan /31
1
w C 1 11 1 2+ +CJwZtan/31
[fl/(tan ,31 + cos /31) - 1 ]
Therefore, y in the expression dw/w = -y do/C is given by Eq. [8].
References:
J. K. Clemens, "Information Records and Recording/Playback Systems Therefor," US Patent 3,842,194, Oct. 15, 1974. 2 Rules and Regulations; Part 15, Radio Frequency Devices, Federal Communications Commission. 3 D. L. Ross, "Coatings for VideoDiscs," RCA Review, 39, No. 1, 136, March 1978.
L. P. Fox, "The Conductive VideoDisc," RCS Review, 39, No. 1, p. 116, March 1978. 5 S. E. Hilliker, "Information Playback System," US Patent 3,806,668, April 23, 1974. 6 H. Kawamoto and E. J. Denlinger, "Pickup Circuitry for a VideoDisc Player with Printed Circuit Board," US Patent 4,080,625, March 21, 1978.
R. N. Rhodes, "The VideoDisc Player,' RCS Review, 39, No. 1, p. 198, March 1978.
RCA Review Vol. 43 March 1982 211

Electrical and Physical Properties of Carbon -Filled PVC for Capacitance Pickup VideoDiscs
P. Datta and H. Kawamoto' RCA Laboratories, Princeton, NJ 08540
Abstract-Carbon-filled PVC has been successfully used as a molding ma- terial for a capacitive -pickup VideoDisc. The high loading of car- bon gives the electrical conductivity necessary for the operation of the capacitive pickup. To achieve a picture quality equivalent to that which a home television receiver is capable of delivering, the resistivity of the disc must be less than 5 52 -cm measured at 915 MHz and the carbon particles should be less than 300 A in
diameter. The shear modulus of the disc must be of the order of 2 x 10¹⁰ dynes/cm2 to withstand stylus forces as large as 14,000 psi. The carbon -filled molding compound has been formulated with adequate plasticizers and the use of a low molecular weight PVC to achieve the low melt viscosity necessary for replicating a relief pattern as small as 0.25 µm.
1. Introduction
Conductive plastics containing carbon black have been widely used in power -transmission cables, anti -static sheets, belts, hoses, and auto- mobile tires. We have developed polyvinylchloride (PVC) formulations containing Ketjen blackt EC (KB) carbon and used these materials
Present Address, Sony Corp. of America, Consume Electronics Laboratories, Para- mus, NJ. T A product of Akzo Chemie, The Netherlands.
212 RCA Review Vol. 43 March 1982

ELECTRICAL AND PHYSICAL PROPERTIES
for molding RCA's capacitive pickup VideoDiscs.' The VideoDisc is a 12 -inch black disc similar to an ordinary audio record. The disc utilizes a spiral groove of V-shaped cross-section with a width of 2.66 µm (a pitch of 9541 grooves per inch). The encoded color video and stereo audio signals are recorded as transverse slots of varying width and separation engraved in the bottom of the grooves. The slot size is typically 0.1 µm in depth and 2.5 µm long in the transverse direction. The size of the narrowest slot is as short as 0.25 µm in the rotational direction. The information is detected by a stylus which rides in the groove as the disc is rotated. The stylus is composed of a main body of diamond shaped to fit the groove and a thin metal electrode perpen- dicular to the groove. The stylus detects the relief pattern by sensing the changes in capacitance between the tip of the electrode and the surface of the conductive vinyl. The signal detected from the relief pattern is translated in a player into a standard NTSC color signal and, after being converted to a VHF signal, is fed to a commercial television receiver. The disc rotates at a constant speed of 450 revo- lutions per minute. The system generates color picture and stereo sound for two hours from the two sides of the VideoDisc.
The quality of the picture and sound produced on a television receiver is a function of the properties of the disc material. We will define in this paper some of trie electrical, mechanical, and rheological properties pertaining to the operation of the capacitive VideoDisc.
2. Electrical Property
2.1 Mechanism of Signal Pickup
Fig. 1 illustrates how the capacitive pickup detects the relief pattern embossed into the surface of the VideoDisc. Because of the physical dimensions of the stylus and its mechanical resonant frequency, the stylus rides on the tops of the relief pattern. The capacitance between the tip of the stylus electrode and the disc surface changes as the disc is moved relative to the stylus position. Electrically, the stylus- o -disc capacitance is a part of a resonator circuit that consists of a loop of strip -line, stylus electrode, stylus -to -disc capacitor, disc resistor, ca- pacitor, pickup arm housing, and varactor diode. As the signal capac- itance changes, the resonant frequency of the loop changes. To sense the change in the resonant frequency, an oscillator operating at 915 MHz is coupled through the resonator to a detector circuit. In this configuration, the change in the resonant frequency causes modulation of the signal coupled from the oscillator to the detector. The modulated 915 -MHz signal is detected at a diode and fed to an output terminal.
RCA Review Vol. 43 March 1982 213

STRIP -LINE RESONATOR
FLY LEAD
ELECTRODE.
DIAMOND
DISC MOTION
SIGNAL CAPACITANCE
ACs0=104 pF
OSCILLATOR 915 MHz
AUTOMATIC FREQUENCY CONTROL
VARACTOR
DETECTOR
r\A,IOmVpp
>22k OUTPUT
DISC RESISTANCE
11030 *OIL
Fig. 1-Schematic diagram illustrating how the relief pattern on the disc is replicated as an electrical signal output.
As a result, the output signal becomes an electrical reproduction of the physical relief pattern embossed into the surface of the disc.
2.2 Electrical Resistivity
As seen in Fig. 1, the resistance of the disc material is a part of the electrically resonant circuit. Since the pickup system operates at a frequency of 915 MHz, the electrical conductivity at that frequency determines important playback characteristics of the VideoDisc. The measurement of disc resistivity was performed at 915 MHz, and later has been extended to the frequency range from dc to 130(1 MHz for the purpose of understanding the mechanism of electrical conduction in the carbon -PVC composite.
In the measurement, a button -shaped sample was cut out of the conductive disc. The sample was metallized on its two sides and connected to an automatic network analyzer interfaced with a desktop computer. The network analyzer measured the reflection coefficient which was immediately converted by the computer to the resistivity and dielectric constant.
The resistivity of carbon loaded PVC's has been found to exhibit a strong frequency dependence at high resistivities. For example, Fig. 2
illustrates the conductivity at the dielectric constant of a PVC -poly- vinyl -acetate (PVA) copolymer loaded with Ketjen black EC carbon.
214 RCA Review Vol. 43 March 1982

ELECTRICAL AND PHYSICAL PROPERTIES
I -aA 1 `A\n\
E, A
10'
10'3 DC
THEORE TICAL
A-e- A
v EXPERIMENTAL
\\ \\ \\ \`e \\
I 1 \\A, 10 100 1,000
FREQUENCY f ( MHz )
10,000
1,000
- 100
10
Fig. 2-Frequency dependence of the conductivity and dielectric constant of a Ketjen-black-loaded PVC-PVA copolymer.
The conductivity stays at 2 x 10⁻² 52-1 cm-' at frequencies less than 2 MHz and shifts to 10-' S2-' cm-' for frequencies higher than 915 MHz.
It has also been found that the frequency dependence becomes less pronounced as the level of loading is increased. The resistivity has been measured on PVC -polypropylene copolymers loaded at various levels with Ketjen black carbon. As can be seen in Fig. 3, the resistivity drops very rapidly as the loading density is increased; the resistivity at 915 MHz is as high as 1.2 x 10312 -cm at a 5% loading level, whereas it drops to 0.6 12 -cm at 22.5%. Note that the difference in resistivity from 0.5 MHz to 915 MHz is a factor of 400 at the 5% loading level, but no frequency dependence is observed at loading levels above 15%.
2.3 Mechanism of Electrical Conduction
The, frequency and loading -level dependence of the electrical conduc- tivity has been interpreted in terms of an effective medium theory for composite materials.2 The present paper presents a simplified model based upon a microscopic view of the material (Fig. 4). Scanning electron photomicrography has shown that, in the carbon -PVC com- posite, the carbon grains are in the form of agglomerates dispersed in the medium of PVC. The carbon agglomerates are almost in contact with each other. The distance between the agglomerates is typically 1(X) and decreases with increasing loading density. Fig. 4 illustrates that there are two electrical current components competing with each other; one is a current through a resistance Re, the other is ac current through the capacitance Cc. At low frequencies, the current is blocked
RCA Review Vol. 43 March 1982 215

by the capacitance; thus, it flows through the resistance. The net resistance of the sample is (Rc + RA). At high frequencies, the current flows through the capacitance, since the impedance of the capacitor is much lower than the resistance. Furthermore, since the capacitor's impedance is much lower than the resistance Rc, the net resistance at the high frequencies is equal to RA, which is lower than the net resistance (Rc + RA) for the low frequencies. This parallel RC circuit model has been applied to the frequency dependence of the Ketjen black -loaded PVC-PVA. As is seen in Fig. 2, good agreement is ob- tained between the experiment and the above model.
That no frequency dependence was observed at high loading levels may he explained based upon the model shown in Fig. 4 in the following manner. As the loading density is increased, the agglomerates are more tightly packed and pressed against each other. This results in the reduction of resistance Re; hence, no frequency dependence exists at a high loading level.
2.4 The Effect of Disc Resistivity on Picture Quality
The resistivity of the disc determines the quality of the signal recovered from the VideoDisc. Fig. 5 shows that the level of the carrier signal,
105
104
103
10
KETJEN BLACK IN PCV-PROPYLENE
0 5 10 15 20 25 KETJEN BLACK EC WEIGHT PERCENT
Fig. 3-The electrical resistivity of a Ketjen black EC -loaded vinyl chloride - propylene copolymer (PVC -propylene) as a function of carbon -load- ing level with frequency as a parameter.
216 RCA Review Vol. 43 March 1982

CARBON AGGLOMERATE
CONTACT / 1 C PVC
C MEDIUM
ELECTRICAL AND PHYSICAL PROPERTIES
REGION ~I R
CARBON AGGLOMERATE IIP
NET RESISTANCE AT DC = RA+ RC
NET RESISTANCE AT HIGH FREQUENCY = RA
Fig. 4-Schematic microscopic structure of carbon -PVC composite illustrat- ing that there are resistive and capacitive components in a contact region between carbon agglomerates.
which is the output of the pickup detector, increases as the disc resistivity is decreased. If the carrier level is very low, the player is unable to process the carrier signal, and no picture is produced. If the carrier level is high, electronic noise signals mixed in the carrier signal become an important factor in determining the picture quality. Fig. 6
shows the level of carrier relative to the level of noise mixed in the carrier output measured with a spectrum analyzer. The carrier -to - noise ratio (CNR) is expressed in units of dB, which is equal to 20 x log,o(carrier level/noise level). It is seen that the carrier -to -noise ratio increases with reducing resistivity.
The electronic noise may originate from the fact that the conductiv- ity of the composite material results from the carbon grains randomly dispersed in an otherwise uniform medium. The conductivity at local- ized points varies from position to position; hence, the conductivity seen by the stylus varies as the stylus moves relative to the disc. The random variation of the localized conductivity appears as an electrical noise in the output signal. When the material is heavily loaded and has a low resistivity, the separation between carbon grains is small, which will smooth out variations in the localized resistivity; therefore, the noise level becomes lower as the resistivity is decreased as seen in Fig. 6.
The discs made of KB -loaded polymers (white circles in Fig. 6) have achieved a CNR of 49 dB at the inside area of the VideoDisc, which satisfied the disc CNR specification. The most critical test area is the
RCA Review Vol. 43 March 1982 217

innermost area of the disc because the wavelength is the shortest in that area. The disc exhibited an excellent picture quality. To obtain an acceptable picture quality, the disc resistivity must be less than 5
52 -cm.
3. Dynamic Mechanical Properties
When the pickup stylus rides on the VideoDisc, the disc receives a pressure as high as 106 g/cm2 (14,(X)0 psi) from the stylus. The disc material has to withstand this pressure or the relief pattern would suffer deformation. To examine the behavior of the disc under moving styli, dynamic mechanical properties of the carbon -filled PVC com- pounds were determined' using a Rheometric mechanical spectrome- ter.' The measurement was performed at 3°C intervals from -130°C to +100°C at a frequency of 1 Hz, and also at a fixed temperature as a function of frequency in the range of 0.04 Hz to 10 Hz. Fig. 7 shows the shear modulus G' and loss tangent, tan S = G"/G', as a function of temperature at 1 Hz for a typical carbon -filled compound, where G'
lo
0.1
to loo 1,000
RESISTIVITY p AT 915 MHz (A -cm)
Fig. 5-The level of carrier output as a function of disc resistivity at 915 MHz. The data represent signals recovered from grooves at the innermost radius of the disc.
10,000
218 RCA Review Vol. 43 March 1982

ELECTRICAL AND PHYSICAL PROPERTIES
O KB CARBON
FINE CARBON BLACK PEARL 700
INSIDE AREA OF DISC
10 ICO 1,000
RESISTIVITY p AT 915 MHz (f) -cm )
Fig. 6-The carrier -to -noise ratio as a function of disc resistivity at 91 5 MHz. The data represent signals recovered from grooves at the innermost radius of the disc.
is the loss modulus. A glass transition temperature for the carbon - filled PVC compound is found at approximately the same temperature as that for the unfilled compound; the glass transition temperature seems to be independent of the presence of the carbon black.
Fig. 8 shows G' and G" measured for a Ketjen black -filled PVC at 23°C on a three -decade frequency scan from 0.04 Hz to 10 Hz. Since the pickup stylus passes the relief pattern at the rate of 106 to 107
peaks/sec, the shear modulus of the compounds at these frequencies determines the mechanical performance of the VideoDiscs. The shear modulus G' is known to exhibit a linear relationship with frequency.' The shear modulus at 10 MHz has been estimated to be 2 x 10¹⁰
dynes/cm2 by linearly extrapolating the experimental points in Fig. 8.
This result agreed with a direct observation of shear modulus at the frequency of 10 MHz using an ultrasonic measurement technique.'
Discs made from carbon -loaded PVC having an estimated shear modulus of 2 x 10¹⁰ dynes/cm' have successfully operated as capacitive VideoDiscs. However, it has been found that a disc made from carbon - loaded polypropylene having shear modulus much lower than 2 x 10¹⁰
dynes/cm2 produced no signal output, though it otherwise satisfied all property requirements for the conductive disc. A theoretical compu- tation' (static case) has shown that deformation in the relief pattern is small when the Young's modulus is 1 x 10" dynes/cm'; whereas,the relief pattern is almost squashed when the Young's modulus is 3 x 101°
dynes/cm2. Since the Young's modulus is approximately five times the shear modulus in an isotropic material,' it is reasonable to say that the shear modulus of the disc material must be at least of the order of 10" 1
dynes/cm2 when the stylus pressure is 10' g/cm2.
RCA Review Vol. 43 March 1982 219

10'
10
109
108
PVC MATRIX +35% BLACK -PEARL
=10
0'
7:10-2
107 I I I I I I 10-3 -120 -80 -40 0 40 60
TEMPERATURE DEGREE CEN-IGRADE
Fig. 7-Shear modulus and loss tangent of carbon -loaded PVC's. G " is the loss modulus.
4. Melt Rheology
To achieve a satisfactory picture quality, it is important to replicate exactly the submicron relief pattern on the metal stamper during the disc molding process. The quality of replication is a direct result of the melt viscosity of carbon -PVC formulations. To understand the inter- facial interactions between carbon filler and plastic and their relation to rheological properties, viscosity of carbon -filled PVC compounds was determined using an Instron capillary rheometer. The melt rheol- ogy was measured in the temperature range of 180°C to 200°C and in the range of shear rates from 3 to 103 sec -I. In all cases, the melt flow curves of the carbon -filled materials exhibited higher shear stresses at a given shear rate than observed for the unfilled materials. The melt flow curves of these filled materials, over three decades of shear rate,
220 RCA Review Vol. 43 March 1982

10U
ELECTRICAL AND PHYSICAL PROPERTIES
TEMP 23°C
\SHEAR MODULUS (G')% 1010, -
io 9
LOSS MODULUS (G")
1 I
10.2 10-I 100 101
FREQUENCY (Hz 1
Fig. 8-Shear modulus and Icss modulus of a Ketjen black -loaded PVC as a function of stress frequency.
can be represented by a power -law relation of the form
log T=Co+C1 log y
where T and y are the shear stress and shear rate, respectively, and Co
and C1 are material constants. The apparent melt viscosity ,) versus shear rate y at 200°C for
typical Ketjen-black-filled and corresponding unfilled compounds is shown in Fig. 9. At the intermediate shear rate of 1 to 1(R) sec -I and at temperatures of 180 to 200°C, the melt viscosities of the carbon -filled materials are one order of magnitude higher than those of the unfilled compounds. In the melt, the carbon particles in the polymer matrix act as dispersed deformable spheres in a non -Newtonian viscoelastic liquid, and experimentally observed melt viscosity phenomena can be explained in terms of the general micro-rheology of dispersions." The melt viscosities (11) of carbon -filled polyisobutylenes follow an empirical relationship 10
/ ->lo-A(y)I!- I +B (y2)(
2.
Here n is a constant that is characteristic of the filler, A and B are functions that depend on shear rate y, d,, is the average particle diameter, ,lo the viscosity of unfilled polyisobutylene, and the volume fraction of the fillers. The melt flow behavior of the carbon -filled PVC is found to follow a similar relationship.
RCA Review Vol. 43 March 1982 221

106
105
104
103
15% KB IN PVC -PROPYLENE
15% KB IN MODIFIED PVC -PROPYLENE
N
PVC -PROPYLENE UNFILLED
MODIFIED. PVC -PROPYLENE UNFILLED
TEMPERATURE: 200°C
N
10-1 10 102 103
SHEAR RATE (s-1)
Fig. 9-Apparent melt viscosity of unloaded and Ketjen-black-loaded molding compounds as a function of shear rate. The compounds were modi- fied with special additives.
The addition of carbon particles produces a sharp increase in the viscosity of a polymer melt." In general, a satisfactory reproduction of signal elements requires a carbon -filled compound with a low viscosity at intermediate shear rates encountered in conventional plastic mold- ing. We offset the increase of melt viscosity by adding flow modifiers and by choosing an appropriate PVC matrix as shown with the dashed lines in Fig. 9. The modified PVC formulation having 15% Ketjen black carbon has achieved a melt viscosity of 5 x 10" poise at a shear rate of 45 sec' at 200°C. This material has been found to be acceptable in molding VideoDiscs.
5. Conclusions
We have defined the physical properties of disc material required for the operation of a capacitive pickup VideoDisc system. The resistivity measured at 915 MHz determines the playback characteristics such as the pickup sensitivity and the carrier -to -noise ratio. The resistivity of discs made with the use of Ketjen black carbon must be held to below 5 52 -cm to achieve an acceptable picture quality. The present experi- ments suggest that the shear modulus of the material must be of the
222 RCA Review Vol. 43 March 1982

ELECTRICAL AND PHYSICAL PROPERTIES
order of 2 x 10'' dynes/cm2 or higher to withstand stylus pressures as high as 14,100 psi.
To achieve a satisfactory replication of submicron relief patterns, the melt viscosity of the carbon -PVC formulation has been reduced with flow modifiers and with the use of an appropriate PVC matrix. An apparent melt -viscosity as low as 5 x 10⁴ poise at 200°C has been obtained at a shear rate of 45 sec-'.
Acknowledgments
The authors wish to thank E. L. Allen, N. A. Arroyo, G. R. Danovsky, R. N. Friel, and J. S. Levin for their technical assistance. They are grateful to M. D. Coutts, F. L. Dixon, L. P. Fox, and G. S. Lozier for useful technical discussions and to D. L. Ross and J. K. Clemens for their useful comments on the manuscript.
References:
Special Issue on VideoDisc, RCA Review, 39, March 1978. 2 B. E. Springett, Phys. Rev. Lett., 31, 1463 (1973). 3 Measured by N. A. Arroyo. 4 Rheometries, Inc., 2438 U.S. Highway No. 22, Union, NJ 07083. 5 D. Ferry, Viscoelastic Properties of Polymers, pp. 24-25, John Wiley and Sons. Inc.,
New York, 1970. 6 J. R. Matey, private communication.
A. E. Bell, private communication. e R. W. Nosker, private communication. 9 H. L. Goldsmith and S. G. Mason, Rheology, Vol. 4, p. 86, Edited by F. R. Eirch, Academic Press. New York, (1967). 1O C. D. Han, Rheology of Polymer Processing, p. 182, Academic Press, New York (1976). " H. Kubota, J. Appl. Polymer Sci., 19, p. 2299 (1975).
RCA Review Vol. 43 March 1982 223

Capillary Behavior and Lubricating Properties of the RCA VideoDisc
R. Williams and C. C. Wang RCA Laboratories, Princeton, NJ 08540
Abstract-The RCA VideoDisc is lubricated by a thin layer of oil on the surface. In the fine grooves of the disc the oil is subjected to strong capillary forces. These determine its flow properties on the surface. We have measured the capillary flow as a function of time and find it to be a useful guide to the lubricating properties of an oil.
Introduction
The RCA VideoDisc is lubricated by a thin layer of oil on the surface. This layer is about 200 thick and is used to reduce stylus and disc wear. As the stylus moves, the oil under it is disturbed and then recovers after some time. The behavior of the oil is controlled, in part, by capillary forces. An understanding of these forces is needed to interpret oil behavior.
The groove pattern on a VideoDisc is remarkable in that a regular coherent structure on a very fine scale covers a large area. A pattern of parallel grooves, each 2.6 micron in diameter and several tenths of a micron deep, covers a total area of about 500 cm2. In such fine grooves a liquid is subjected to strong capillary forces and moves in response to them. Because of the regularity of the groove structure over large areas these movements are visible to the unaided eye.
We note that the VideoDisc surface is unique in having a carefully controlled morphology of regular grooves over a large area. The oil spreading experiments described below illustrate this property and
224 RCA Review Vol. 43 March 1982

CAPILLARY BEHAVIOR AND LUBRICATING PROPERTIES
give us a useful method to explore the behavior of lubricants in a capillary environment.
Oil Migration Along the Grooves
We can understand the capillary effect of the grooves from the sche- matic drawing of Fig. 1. To follow the movement of oil we start with an unoiled disc and, with a small brush, paint on a stripe of oil about 1 -mm wide, 0.5 -mm thick, and several cm long, running perpendicular to the grooves. The grooves behave like small horizontal capillary tubes. The oil is drawn into them as it would be drawn into a capillary tube. The liquid surface makes a small contact angle of a few degrees
CURVED MENISCUS WITHIN GROOVE
GROOVE PROFILE
(a)
(b) Fig. 1-(a) Schematic illustration of the capillary flow of oil in the grooves of
a VideoDisc. At the left are shown the oil stripe and the capillary flow into the grooves. The transverse cross section of the grooves is shown schematically at the right. (b) Photograph of spreading oil. Diameter of oil stripe is 1.3 mm. The advance of the oil front is blocked by dust particles in several places.
RCA Review Vol. 43 March 1982 225

with the surface of the disc and so, to a good approximation, is tangent to the solid surface where they meet. The effect of this is to give a curved meniscus. The surface of the liquid would like to be planar to minimize its surface energy, but the condition that it must be tangent to the walls of the grooves requires that it be curved. As the surface tries to become planar it pulls liquid into the tube giving the well- known capillary rise effect. In a vertical tube, the liquid rises until the weight of the column of liquid balances the surface tension force and then stops. In a horizontal tube there is no gravity force to balance the capillary force and the liquid will continue to move into the tube indefinitely. However, the viscous force acting on the column of liquid that has to be pulled along gets larger in proportion to its length, making the motion slower and slower as time goes on. This is a problem in fluid flow and the solution is known.' One finds that the length, x, of the column of liquid in the tube is related to the radius, R, of the tube, the surface tension, y, and the viscosity, 1q, of the liquid, and the time, 1, by
r''=(2R)t. lit 1
It is convenient to express this in the form
x = (Dt),iz (2]
where I) = yR/(2q). We refer to D as a spreading mobility. Eq. [2] resembles a diffusion equation, although the actual physics of the oil migration in the grooves has nothing to do with diffusion.
These equations refer to flow in capillary tubes. They give the correct general form for the dependence of x on t that we observe for the flow of oil on a VideoDisc, but to apply them to the video disc problem, the quantitative coefficient must be modified to take account of difference between a groove and a tube. Some discs have grooves that are nearly sinusoidal in transverse cross-section. The coefficient can be calculated for this case and agrees with experiment to within a factor of two for most oils. Some oils depart quite far from theory and we believe that this indicates strong specific interactions between oil and surface. The groove shape in our present discs is not sinusoidal, and we have not calculated the quantitative mobility for this case.
The progress of the liquid front moving in the grooves is easily followed visually, and we have measured x as a function of time for many different oils. Some representative data for two oils of widely differing viscosity are shown in Fig. 2 where x is plotted against t'/l.
W.E. Brittin, J. Appl. Phys., 17, p. 37 (1946).
226 RCA Review Vol. 43 March 1982

CAPILLARY BEHAVIOR AND LUBRICATING PROPERTIES
E V
o 0 25 50 75 100
t 1/2 ( seC 112 )
125 150
Fig. 2-The distance, x, as a function of t'12for two different oil fractions. A more detailed description of the oil is given in the text and in Table 1.
Table 1-Relevant Properties of Silicon Oils Employed in This Study
Oil 1 Oil 2
Density (glint) 0.868 0.874 Surface Tension (dyne/
cm) 26 26
Viscosity (centipoise) a 25°C
40±10 14±1
Molecular Weight Mu- (weight average) 1200 ± 100 660 ± 60 D (dispersity) (from GPC <1.3 <1.1
Chromatography) Spreading Mobility, D
(cm'/sec) 0.55 x l0-' 2.1 x 10-'
The square root relation between x and t is maintained quite accurately over periods as long as several days.
One of the oils was a silicone oil and the other was a distillate fraction of the original oil, obtained from molecular distillation. Phys- ical properties of the oils are shown in Table 1. They are very similar, except for molecular weight and viscosity. These differences are re- flected in the different values for the spreading mobility, D.
RCA Review Vol. 43 March 1982 227
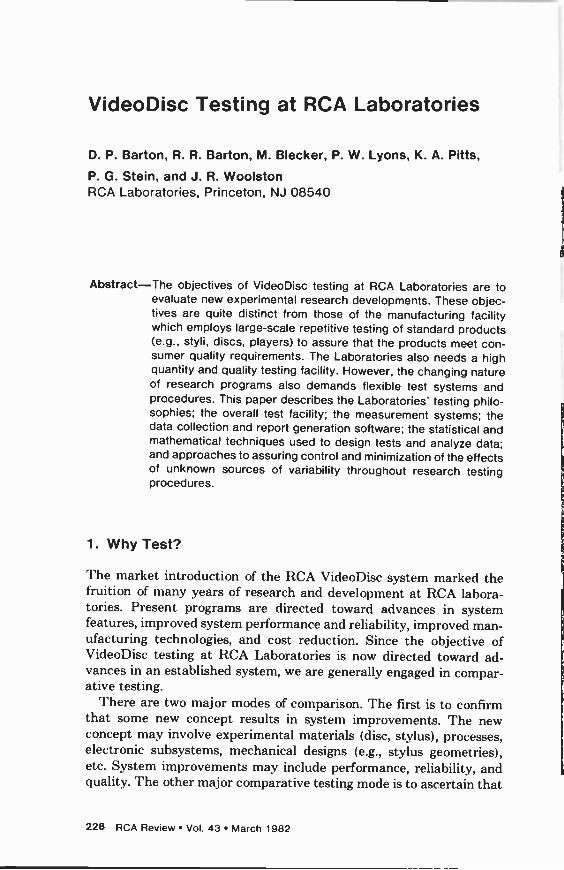
VideoDisc Testing at RCA Laboratories
D. P. Barton, R. R. Barton, M. Blecker, P. W. Lyons, K. A. Pitts,
P. G. Stein, and J. R. Woolston RCA Laboratories, Princeton, NJ 08540
Abstract-The objectives of VideoDisc testing at RCA Laboratories are to evaluate new experimental research developments. These objec- tives are quite distinct from those of the manufacturing facility which employs large-scale repetitive testing of standard products (e.g., styli, discs, players) to assure that the products meet con- sumer quality requirements. The Laboratories also needs a high quantity and quality testing facility. However, the changing nature of research programs also demands flexible test systems and procedures. This paper describes the Laboratories' testing philo- sophies; the overall test facility; the measurement systems; the data collection and report generation software; the statistical and mathematical techniques used to design tests and analyze data; and approaches to assuring control and minimization of the effects of unknown sources of variability throughout research testing procedures.
1. Why Test?
The market introduction of the RCA VideoDisc system marked the fruition of many years of research and development at RCA labora- tories. Present programs are directed toward advances in system features, improved system performance and reliability, improved man- ufacturing technologies, and cost reduction. Since the objective of VideoDisc testing at RCA Laboratories is now directed toward ad- vances in an established system, we are generally engaged in compar- ative testing.
There are two major modes of comparison. The first is to confirm that some new concept results in system improvements. The new concept may involve experimental materials (disc, stylus), processes, electronic subsystems, mechanical designs (e.g., stylus geometries), etc. System improvements may include performance, reliability, and quality. The other major comparative testing mode is to ascertain that
228 RCA Review Vol. 43 March 1982

VIDEODISC TESTING
a proposed technique for cost reduction does not result in system degradation.
These objectives are quite distinct from those of the RCA VideoDisc manufacturing facility, where large scale repetitive testing of standard manufactured product (styli, discs, players) is employed to assure that outgoing product meets consumer quality requirements. RCA Labo- ratories research programs also require a high quantity and quality testing facility. However, the changing nature of research demands flexible test systems and procedures. Standard, repetitive test condi- tions are not sufficient.
This paper provides an overview of how these R&D test require- ments have been addressed. It briefly describes the testing philoso- phies, the overall test facility, the measurement systems, the data collection and report generation software, the application of statistical and mathematical techniques to design tests and analyze data, and approaches to assuring control and minimization of the effects of unknown sources of variability throughout our test procedures.
These systems and statistical techniques constitute a major effort to ensure that research for the product division not only will be acceptable for some small sample of experimental discs, styli and/or players but also operate for large production quantities. This is an extremely important screening step. Once a development leaves RCA Laborato- ries, it goes to the product engineering department for a whole new program of extensive evaluation and testing.
2. What To Look For?
Research testing evaluates performance -related properties in three different domains of the VideoDisc playback system: physical factors affecting the stylus -disc interface; measurements of the signals gener- ated by the player; and measurements of the quality of the resulting picture and sound program produced for the home viewer (Fig. 1).
Inaccuracies in picture and/or sound reproduction can originate in
any of these domains, but tend to propagate through to the consumer
STYLUS- DISC - PLAYER SIGNAL -ELECTRICAL PHYSICAL SYSTEM DOMAIN
CONSUMER OBSERVABLE
DOMAIN
Fig. 1-Three domains for measuring VideoDisc system performance.
RCA Review Vol. 43 March 1982 229

observable domain. For example, surface roughness on the VideoDisc may propagate to the signal domain as a poor SIN ratio, which will, in turn, result in a picture with poor clarity.
We make measurements in each of these domains-stylus track force, sound beat, and viewer perception of skips are examples. The relative ease of designing quantitative performance measures for the signal domain has greatly influenced testing methods and equipment. Some of these measures are peculiar to the VideoDisc system; Table 1 describes a few of these. Typically, the signal domain measures serve only as proxies for events occurring in the other two domains. VideoDisc scientists and engineers seek to understand the underlying physical phenomena affecting performance, to see if proposed changes improve performance in the ways expected, and to know the effects of proposed changes on consumer perceptions of program quality.
In addition to designing valid and reliable signal domain measure- ments, we must also assess their relations to underlying physical phenomena and to viewer perceptions of program quality. Fig. 2 shows a partial list of measures in each domain along with some of the relations among measures in different domains.
Recent studies at the Laboratories have investigated these relations. These have included physical analysis of defects located by signal domain measures and viewer tests to correlate signal domain measures with viewer response. The results have contributed to refinements in measurement techniques for tracking errors and carrier distress and to improvements in frequency response and defect -locator clustering algorithms.
Current testing facilities do not investigate all aspects of the VideoDisc system (e.g., analysis of stamper plating baths), nor even all
Table 1-Signal Domain Measurements Unique to the VideoDisc System
Arm Output (mv)
Carrier Distress Time (seconds)
Defect Gate Open Time (seconds)
Sound Beat (dB)
Skips
Peak -to -peak amplitude of the FM carrier at the player -arm output
Time during which the arm output falls below a specified threshold
Time during which a production player's defect substitution circuit would be active
Undesired modulation of the video carrier by the audio carrier(s) during playback of the disc
Improper movement of the stylus as detected by reading the digital codes recorded in each vertical interval (out of sequence program frames)
230 RCA Review Vol. 43 March 1982

VIDEODISC TESTING
PHYSICAL SIGNAL/ELECTRICAL CONSUMER OBSERVABLE
DEFECTS AND LOCAL COMPOSITION
Dnc (
DIU/ Stylus
GLOBAL COMPOSITION
SHAPE (GROOVE, SIGNAL ELEMENTS)
DEBRIS BUILDUP
WEAR
STYLUS LAUNCH
COMPOSITION
'TRACK FORCE AND SIDE BIAS
SHAPE (KEEL. ELECTRODE)
(WARP Dnc
RUNOUT
MOTOR SPEED VARIATION
LOCAL SIGNAL LEVEL AND S/N (ARM OUTPUT, CARRIER DISTRESS. DEFECT GATE)
GLOBAL SIGNAL LEVEL AND S N
(,.. B MHt LEVEL VIDEO SIN. AUDIO C/N. SOUND BEAT. ARM OUTPUT)
TRACKING ERRORS E. BACKWARD SKIPS
FORWARD SKIPS
TIME BASE ERRORS
LOSS OF PICTURE
SPECKS IN PICTURE
TICKS INSOUND
PICTURE CLARITY, INTERFERENCE
SOUND CLARITY
JUMPS, JERKS. FROZEN ACTION IN PROGRAM
PICTURE WOBBLE
COLOR ERROR
Fig. 2-Sample of VideoDisc performance measures in three domains, and
some of the links between them.
aspects shown in Fig. 2. Such an effort would be impractical and an inefficient use of resources. The specific areas of emphasis depend on
the needs of the VideoDisc research staff.
3. Overview of Research Testing Facilities
3.1 Background
During the development of the VideoDisc system at RCA Laboratories, an ad hoc testing center evolved to meet the needs of the scientists and engineers. The center's functions and associated equipment are described below.
Carrier distress measurement (carousel tester) was typically used for disc testing. The carousel could play six discs simultaneously. The arms could he made to rotate from one disc position to another (a capability not frequently used). Play performance was monitored by special hardware and a Data General NOVA minicomputer.
The micro -defect locator was used for locating angle and groove at which dropout and/or tracking errors occur. The hardware also was able to identify and locate the start/stop of long carrier distress type events. Off-line software had been written to process the raw data in various ways, e.g., consolidate dropout and tracking events into defects.
The wear -test stations were employed for wearing styli and/or discs. No electrical measurements were taken and the stations generated no
RCA Review Vol. 43 March 1982 231

data, but they did generate testing requirements on other equipment. The equipment consisted of three in -line wear testers (5, 5, and 6
positions) and 8 individual players. Frequency response measurements (spectrum analyzer) were made
on styli and discs. The equipment consisted of a player, an HP3585 spectrum analyzer and an HP9825 calculator controller. The measure- ments taken depended on the particular signals recorded on a disc and the control program being run, but generally included things like 8, 5, and 2 MHz carrier signals, audio carrier amplitude and C/N, sound - beat, etc.
Once the decision to manufacture the VideoDisc system was made, it became clear that the test system as it originally evolved could no longer serve RCA's research needs. Despite periodic upgradings, many problems still existed:
Several generations of research and development VideoDisc systems (arms, player electronics, and mechanics, etc.) were in use, resulting in: -uncertain relation of test results to modern players -difficulty of repair and maintenance. Test equipment was difficult to maintain, calibrate, control and enhance. Many measurements required an operator to read a display and manually record the data; the data were often then typed into a computer system for further analysis. Flexibility of the testing hardware was limited: -The 24 wear -test positions were completely noninstrumented -Only 6 play positions were available for carrier distress measure-
ments -The 1 micro -defect locator position could only locate certain pre-
defined types of defects -Most measurements were made with fixed (hardware) parameters,
e.g., carrier distress threshold, minimum time for a micro -defect, etc.
None of the test spindles used caddy loading of discs, requiring the playing, handling and storage of unprotected discs.
3.2 Objectives of Testing Center Design
To address the issues described above and to provide an effective means of continued testing of new research and development concepts, a new testing center system was designed to provide:
Effective means of using up-to-date standard player, stylus and disc systems
232 RCA Review Vol. 43 March 1982

VIDEODISC TESTING
Flexibility to meet changing test requirements Avoidance of manual data collection Easy generation of a multitude of user reports Ability to archive and access test results Easy application of statistical packages to analyze data More detailed and comprehensive measurements Capability for expansion of measurements and players Improved operator efficiency and throughput Automatic monitoring of test system status Easy maintenance and serviceability Maximal control of variability
3.3 System Design
The overall system approach to meeting the design goals is illustrated in Fig. 3. It is a modular system, consisting of three main subsystems: a player bank, an instrument, bank, and a computer bank.
The player bank is an expandable set of standard production players, each having an attached interface (Fig. 4). T:e interface consists of a
digital portion (for player control) and an analog portion (for buffer -
OPERATOR
CONSOLES
IEEE 48B BUS
CONTROL DATA
COMPUTER ',COLLECT
(COIIPU ER
TO CMS
(CHERRY HILL COMPUTER SYSTEM)
IEEE 488 BUS
INSTRUMENT BANK
ANALOG PATCH PANEL SWITCH
DIGITAL', ANALOG
INTI PEACE
I l
PLAYER
I
i PLAYER/INTERFACE
YANK
Fig. 3-VideoDisc testing system design.
RCA Review Vol. 43 March 1982 233
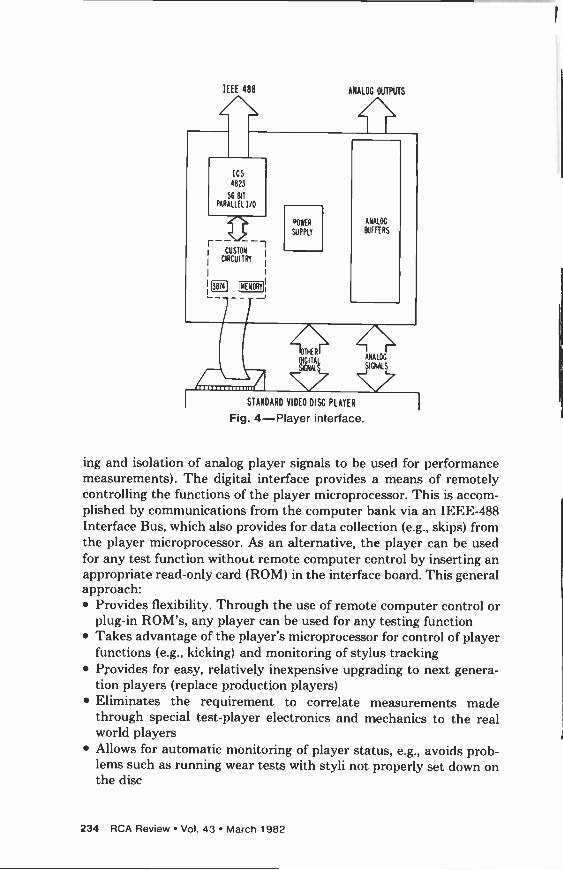
IEEE 488 ANALOG OUTPUTS
STANDARD VIDEO DISC PLAYER
Fig. 4-Player interface.
ing and isolation of analog player signals to be used for performance measurements). The digital interface provides a means of remotely controlling the functions of the player microprocessor. This is accom- plished by communications from the computer bank via an IEEE -488 Interface Bus, which also provides for data collection (e.g., skips) from the player microprocessor. As an alternative, the player can be used for any test function without remote computer control by inserting an appropriate read-only card (ROM) in the interface board. This general approach:
Provides flexibility. Through the use of remote computer control or plug-in ROM's, any player can be used for any testing function Takes advantage of the player's microprocessor for control of player functions (e.g., kicking) and monitoring of stylus tracking Provides for easy, relatively inexpensive upgrading to next genera- tion players (replace production players) Eliminates the requirement to correlate measurements made through special test -player electronics and mechanics to the real world players Allows for automatic monitoring of player status, e.g., avoids prob- lems such as running wear tests with styli not properly set down on the disc
234 RCA Review Vol. 43 March 1982

VIDEODISC TESTING
The analog signals from each player are routed through a switching matrix to an expandable hank of instruments. This switching matrix could eventually be a solid-state computer -controlled analog switch. However, initially a simple, manually operated patch panel was used. The important feature is that any player can easily be connected to any measurement device, making possible important new capabilities. For example, wear tests can be monitored without physically removing the discs or stylus cartridges from the life test players.
The instrument bank contains the equipment necessary to perform all the various types of measurements. Design of these instruments was based upon RCA's experience during many years of research and development. Special emphasis was placed upon the need of explora- tory research programs for flexible and detailed analysis of test data (diagnostic tools as well as performance measures).
To eliminate errors and the burden of manual data recording, all new measurement instruments provide computer -readable outputs. In
addition, to provide maximum flexibility, any combination of measure-
ment instruments can be connected to any single player. Also, because
of the flexible patch panel approach of connecting instruments to players, newly developed instrumentation can be easily incorporated into the system.
The computer subsystem of the new testing center is implemented at three physical levels. At the lowest level, a microprocessor is in each player. It performs standard player control functions. However, these functions are altered for the particular test function that player is
performing (e.g., recycle for life testing). In addition, the microproces- sor serves as a tracking monitoring system to report out -of -sequence program frames (skips).
At the next level are two Data General NOVA 4 comlxtters for control and data collection computers. The control function (1) mon- itors player status, (2) provides computer aids to operators for sched- uling of tests and players, (3) provides signals to the individual player microprocessors as to what test function they should he performing; and (4) supplies operators with system status, alarms, etc.
The data collection function receives data from all of the test instruments and players, aggregates data by test, locally stores the data and ships test results to a large timesharing system for report generation and data analysis.
Test data is transmitted via a data communications interface from the NOVAs to a central timesharing system. At this highest level the data are stored, statistica: data analysis is performed, and test reports are generated. Performance of the tasks on this central computer facility enables the use of sophisticated software for statistical analysis, data archival and retrieval, and report generation.
RCA Review Vol. 43 March 1982 235

The system is inherently protected against the following system fail- ures:
Microprocessor failure-remove player and replace with spare NOVA failure-either install back-up NOVA, or run with single NOVA in degraded mode, or run without NOVA and insert ROMs for player control and/or record data manually off instruments Timesharing system failure-record all test data locally on mass storage devices, and ship to timesharing system when it is opera- tional.
Thus, under most conditions, the test center will continue to operate.
4. The Player Testing Interface
The player testing interface was conceived as a key element in the new VideoDisc testing center. It employs standard production players that are both more cost effective and more realistic in providing the spindles needed for testing than specially designed turntables are; production players are readily available and should have a satisfactory lifetime. Furthermore, this approach has the added advantage that future players with enhanced features (e.g., stereo audio) can be utilized as soon as they are available.
There is also the advantage that all spindles are identical; no spindles need he dedicated to any particular mode of testing (e.g., wear -testing or tracking -error measurements). All spindles can serve any function at any time, and the set of spindles can be configured entirely by computer control. The center, therefore, gains the ability to respond rapidly to changing test requirements.
Central to the interface's design is the replacement of the player's microcomputer, a Mostek 3870, with a Mostek 3874 relocated into the interface and re -programmed as necessary. The 3874 accepts an exter- nal piggyback EPROM whereas the 3870 contains an internal mask - programmed ROM. The interface contains a connection to the IEEE - 488 Interface Bus so that control of the cpu can be achieved by any computer or calculator capable of driving the bus. This permits mul- tiple players to be easily controlled by a single computer.
A second major function of the interface is to provide the dozen or so analog signals from the player that are needed for testing or research. Each such signal passes through a buffer amplifier capable of driving reasonable cable lengths with minimum distortion, minimum cross -contamination, and negligible interference with the player itself. Five "video" signals are provided: arm output, FM demodulator out- put, compositive video, the 1.53 MHz clock output, and the defect gate. Four "logic level" signals are supplied: serial DAXI bits out, two DAXI error flags (forward and reverse skip), and a squelch signal derived
236 RCA Review Vol. 43 March 1982

VIDEODISC TESTING
from video muting (DAXI, which stands for digital auxiliary informa- tion, is the digital control information recorded in each vertical inter- val). There are two audio buffers with balanced 600 -ohm outputs and two do signals-AFT voltage and time -base error (arm -stretcher).
Physically, the interface is a box, 13 x 17 x 2-1/2 inches, attached to the bottom of the SFT-100 player (Fig. 5). Internally, the box is divided into two halves; one is the digital circuit board and the other the analog circuit board and the power supplies (Fig. 6). All cable connec- tions are made at the rear of the box. The front contains several LED indicators and a plug-in module. This module is either the IEEE -488
bus communication circuit or it is a manual control plug-in (for stand- alone applications). The sides of the box have chassis slides for
mounting in a rack. Five complete player/interfaces are mounted in a 5 -foot enclosure
(Fig. 7). Each player can be drawn out for access to the cartridge and to the cable connections on the rear. A malfunctioning player can be replaced in the rack in less than 5 minutes. The racks also provide shielding to keep interference between players to a negligible level, both for all measurements and for viewing on a TV set. The racks are set up on a 6 -inch high wooden base to provide easier access to the lowest player (Fig. 7). All cabling emerges vertically from the top of each rack and is carried to the instrumentation racks on an overhead cable trough. This provides a very uncluttered arrangement with good access to the whole system (Fig. 8).
L., 17-1,
`5.
' . %
`.!. ' % t .
. . - , - - J
Fig. 5-Videodisc player on top of i-terface box.
RCA Review Vol. 43 March 1982 237

. r
anuWr2
,4tr -: " :
II --II
Fig. 6-Interface box showing digital and analog halves.
A single 40 -wire, flat ribbon cable with a male plug on each end plugs into a socket installed on the player's control board where its 3870 microcomputer has been removed. This cable passes through a slot in the interface box and plugs into a 40 -pin socket on the digital circuit board. The analog -signal cable passes through another slot and terminates in connectors on the analog board. The player's original case can remain in place (for physical protection of the player) and requires no modifications. Two shallow recesses are cut in the plastic baseplate of the player for the cables to emerge. In addition to the analog connections, one jumper is installed on the player control board. No other changes are required on the player.
Communication between the player/interface and a control com- puter (or calculator) consists of strings of ASCII characters transmitted over the IEEE -488 Interface Bus. Each player/interface is assigned a unique 5 -bit binary address. The messages sent to the interface contain from 2 to 8 characters. The first 2 characters constitute a command code and the remaining characters represent parameters. For example, the string "05024750" means "put the player in the wear -test mode (code 05) starting each play at minute 02, ending at minute 47, and play the disc 50 times."
The string "06" means "tell me (the control computer) what play number you are currently doing." A message such as the last example
238 RCA Review Vol. 43 March 1982

41
I
r W tkl
:1: <I_ ,
¡¡ I
a
. 11 - 1
'
VIDEODISC TESTING
Fig. 7-Players and interfaces mounted in racks.
requires an answer from the player/interface. In such a case, the interface always sends a 6 -character string back to the control com- puter. The first 2 characters are the identification code of the particular interface (not its address, but a unique internal hard -wired value). The remaining characters convey the data requested by the control com- puter. A large and expandable repertoire of commands is available. In adding a new command to the repertoire (to meet future needs) the source code for the 3874 is edited, assembled, debugged, and a new EPROM is burned and installed on the 3874.
The manual plug-in module operates much the same as the 488 bus communications. The desired command code and any required param- eters are set via eight small rotary switches and are sent to the interface by push-button. Data from the interface are displayed on the LEDs on the front of the manual plug-in unit.
5. Measurement Instrumentation Systems
The new VideoDisc integrated testing center has a number of measur- ing and test instruments (Fig. 9) for making the actual measurements.
RCA Review Vol. 43 March 1982 239

r.... 9,
:
-
r
.. I
Fig. 8-Back of testing player rack.
These instruments can be connected in patched, switched, or matrix fashion to provide all the signal sources required for each measure- ment.
5.1 Measurement Entities and Instruments
Amplitude measures are characterizations of the instantaneous or long-term amplitudes and noises of various signal sources and pro- cesses. They may also include time correlations of disorders in the above parameters.
Carrier distress -instruments (Fig. 10) measure recovered carrier amplitudes and their disorders. Each instrument is self-contained on a group of circuit cards, and groups can be bussed together for communication with, and control by, a computer or calculator via the IEEE -488 instrument interface bus. Each fundamental group contains a display and controls. The testing center utilizes an instrument consisting of 12 fundamental groups with one 488 interface.
The carrier distress instrument consists of three portions. The first is a video amplitude detector. Research indicated this detector should
240 RCA Review Vol. 43 March 1982

_:? ==
VIDEODISC TESTING
-..,aamº x
,. r._=.:,...1
C, '',`?:
Fig. 9-Measuring and test instruments.
ts
1'
be an average -responding circuit with an input bandwidth of at least 500 kHZ to 10 MHz and a time constant of 2 µsec.
The circuit's most important characteristic is a linear response to the amplitude of incoming signals. The detector responds down to an input of 20 mV and to at least 2 volts maximum. This enables direct generation and measurement of comparison thresholds and obviates the need to individually calibrate detectors.
The second portion is a discriminator circuit that compares the output of the detector and an externally applied threshold voltage. The discriminator's output is a single digital level indicating whether the signal is above or below the external reference based on criteria adjusted by the operator. These criteria may be externally pro- grammed in the future.
Two threshold voltages, V1 and V2, are applied to the discriminator. Two times, T1 and T2, are set on switches, or optionally applied as digital levels. If the input signal stays below V1 for TI, the input is
considered to be below threshold, or above threshold if the input signal returns above V2 for longer than T2.
The resolution of the detector is better than 20 mV. The resolution of T is 0.25 µsec, with a maximum of 63.5 µsec. The T clock can be
RCA Review - Vol. 43 March 1982 '241
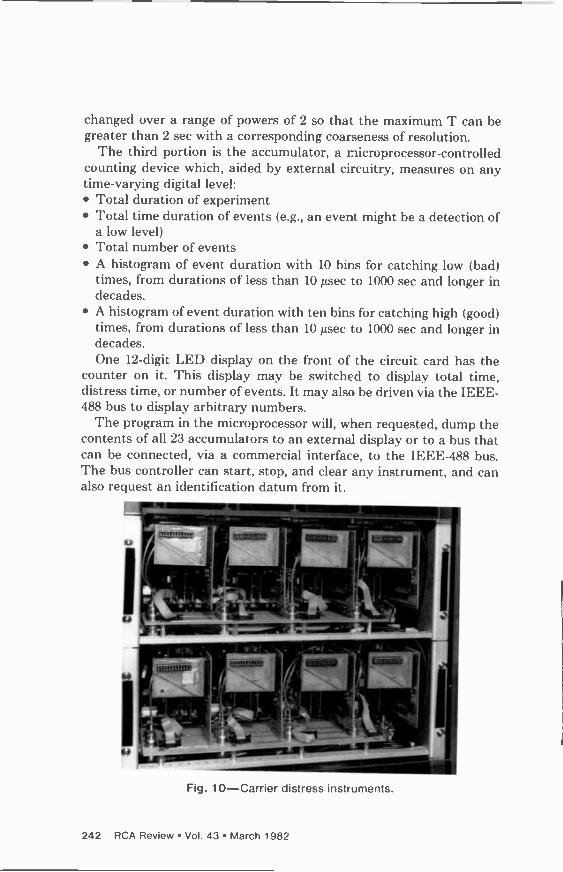
changed over a range of powers of 2 so that the maximum T can be greater than 2 sec with a corresponding coarseness of resolution.
The third portion is the accumulator, a microprocessor -controlled counting device which, aided by external circuitry, measures on any time -varying digital level:
Total duration of experiment Total time duration of events (e.g., an event might he a detection of a low level) Total number of events A histogram of event duration with 10 bins for catching low (bad) times, from durations of less than 10 sec to 1000 sec and longer in decades. A histogram of event duration with ten bins for catching high (good) times, from durations of less than 10 µsec to 1000 sec and longer in decades. One 12 -digit LED display on the front of the circuit card has the
counter on it. This display may be switched to display total time, distress time, or number of events. It may also be driven via the IEEE - 488 bus to display arbitrary numbers.
The program in the microprocessor will, wnen requested, dump the contents of all 23 accumulators to an external display or to a bus that can be connected, via a commercial interface, to the IEEE -488 bus. The bus controller can start, stop, and clear any instrument, and can also request an identification datum from it.
- -
Fig. 10-Carrier distress instruments.
242 RCA Review Vol. 43 March 1982

VIDEODISC TESTING
This card group may, therefore, he used in collections in a chassis or stand alone for individual experimenters with displays provided in some mounting box.
The carrier distress instrument has an arm gain control mounted externally, but properly part of the same functional system. This gain control allows the average arm output to he set to some known level so t hat drops in carrier amplitude may be referred to the local, relative reference rather than to an absolute.
The defect gate monitor detects the standard production player signal that indicates delayed video is being substituted for new program (defect gate `open"). Its construction is almost identical to the carrier distress instrument, and its output data is the same, i.e., it measures
total time, event time, event count, and 20 bins of histogram. The difference is that a low event is now defined as the time during which the defect gate is open.
The testing center has a defect gate monitor consisting of six fundamental groups connected to one IEEE -488 interface.
Frequency measures are characterizations of the instantaneous car-
rier and modulating frequencies of the various signal sources and
processes. They are traditionally used to characterize styli and to measure system performance.
Time -base error is measured by capturing the burst frequency recovered from the playing disc and comparing it with the correct frequency. This may be done implicitly by the player or by external circuitry. The arm stretcher can be on or off, but the results are
different. At this writing, the center has no time -base instrumentation. Spectrum analyses are normally used for electrical characterization
of styli. Spectrum analysis of the playback amplitudes of modulated and unmodulated signals permits sensitive measures of stylus and arm performance. Spectrum analyzers may also be used for measurement of audio and video carrier -to -noise or signal-to-noise ratios. The spec-
trum analyzers are inside shielded rooms to reduce the possibility of outside interference.
Measurement of the modulated and unmodulated signals with the spectrum analyzer requires considerable sophistication. The analyzer is fully programmable via the IEEE -488 bus and is connected to a
desktop calculator that controls the measurement sequences and an-
alyzes the output data. A series of algorithms has been developed for amplitude measure-
ments of these single -frequency test signals in the presence of consid-
erable FM. The algorithms require the dynamic interaction of the analyzer, the calculator, and the data to first determine, and then to
execute, the best way of measuring each test signal. 'I'he algorithm
RCA Review Vol. 43 March 1982 243

finds the carrier center frequency in the presence of the modulation and then makes sophisticated measurements of the amplitude of the recovered signal at that frequency.
Geometric measures relate disorders (amplitude, time or whatever) to the physical location on a disc where the disorder took place. This information is then used to find evidence of physical phenomena that caused the disorder. This process is called micro -defect location.
Keyed locators keep track of the physical location on a disc from which the video program is being recovered. An angular resolution of 0.2 degrees is provided, as is a radial resolution of 1 groove. In response to an external key signal, the locator puts the then current radius and angle into a buffer memory (FIFO).
Another datum-to indicate the nature of the event causing the key-is stored in memory, along with the key, by external logic. With the keyed locator, micro -defect location can be appended to any disorder measurement (for example carrier distress with the program- mable threshold mentioned above). This is a very powerful tool for general purpose diagnosis of the correlations between the physical disc world and the program signal world. The locator's buffer memory is emptied by a computer whenever time is available at that computer. This allows the collection of many data without significant refractory time, yet without requiring the constant attention of a fast controller or data processor. The testing center has 6 locators, each with a 488 interface. The 488 interfaces are connected to the FIFO buffers, and when a buffer is half full the SRQ interrupt line of the 488 bus is exercised. This indicates to the controlling computer that the data are ready and overflow is imminent.
As indicated above, keys from carrier distress, or whatever measure, can directly operate the locator. Nevertheless, there are many experi- ments not having key signals routinely available. Six special key generators, consisting mostly of delay elements, logic gates, and signal shapers, allow an experimenter to specify combinations of conditions of both time and threshold that taken together will key a locator.
Time domain measures look upon the signal recovered from the disc as a series of single field presentations having an inherent order. Another view, with finer resolution, sees the recovered signal as a video waveform. There are facilities to measure both.
Program sequence disorder monitors keep track of the order of the video fields recovered from the play to monitor tracking performance, i.e., whether the stylus stays in the groove or skips forward or back- wards. Since the microprocessor in each player must keep track of this same function for its own operation, the core of this function is left intact there, and a keyed locator records the position of these errors.
244 RCA Review Vol. 43 March 1982

VIDEODISC TESTING
As part of the modification to the player, the microprocessor outputs a key indicating the existence and nature of a program sequence disorder. This implies that the function is available in any player.
The keyed locator has no memory for recent history. Therefore the field (DAXI) number recovered upon receipt of a program disorder key shows the new current field number, but no information on the magnitude or direction of the disorder. The player microprocessor has been modified so that the least significant portion of the last good DAXI before the disorder may be produced as a 10 -bit number. This number is transmitted from the player and replaces the angle infor- mation which is usually sent from the keyed locator to its buffer memory. The result is that a record is made without angle information but with both the current field number and the previous field number. In any case, when monitoring program order, this angle information becomes irrelevant, because tracking can only be checked once per field when the digital control information (DAXI) is read off the disc.
Video amplitudes and timing are monitored by a TV waveform monitor (a special purpose oscilloscope). Information about the color content of a signal, its differential phase, hue, and saturation are monitored with a vectorscope. For conventional measurements of video signal-to-noise and for selective viewing of lines in the vertical interval, a noise measuring set is employed.
5.2 Patchbay
Signals from the players and from various auxiliary signal sources (such as the building antennaplex system) are all terminated in a large patchbay. The signals are then routed to the test instruments and monitors according to the needs of the experimenter and test center operator.
The patched signals include: Player arm output Player squelch (a do signal indicating the presence of recovered signals) Player NTSC video output Player audio output (two channels available) Player 1.53 -MHz clock Player defect -gate output (open or closed) Two bits of tracking error key for forward or reverse skip Player arm -stretcher -servo output for time base measurements AFT voltage for arm -cavity tuning measurements Player FM demodulator output
RCA Review Vol. 43 March 1982 245

Player DAXI serial data Player antenna output All the rf connections are carried on 75 -ohm cable and terminated
at the patch panel. The panel has automatic terminating plugs that remove the termination when a plug is inserted to take the signal to an instrument input. Each instrument input is looped through to another terminating plug so that the signals may be cascaded and sent to several (high impedance) instrument inputs, yet the last connection on the panel is always terminated correctly.
The pat chbay, in addition to player outputs and instrument inputs, has many instrument outputs available. The carrier distress insult: ment, for example, has a low frequency carrier amplitude output that can be patched to a chart recorder or to an analog -to -digital converter. This converter is also equipped to be read via the IEEE -488 bus, and the control computer reads long-term average carrier levels in this fashion.
The great flexibility provided by the general-purpose uncommitted players and instruments makes possible quick responses that are suitable to the varying requirements of VideoDisc research testing.
6. Computer Systems
Testing center computerization was desired for three tasks: (1) player control, (2) data collection (from instruments), and (3) report genera- tion. Because of flexibility and storage requirements, report generation was allotted to a mainframe timesharing system. The other two tasks required on -site minicomputers.
Although a natural partition might have been to create a player control computer and a data collection computer (since sizing con- straints pointed in the direction of two minicomputers), this approach entails drawbacks. Failure of either minicomputer could disable the entire system, and the whole system would have to be brought into operation at one time during the system integration stage. Instead, the system was partitioned with two minicomputers, each of which con- trolled players in one ground and collected data in the other. Failure of either minicomputer would then reduce capacity by 50% instead of disabling the system.
Structured analysis was employed to allot subtasks to minimize data flow (and interdependence) among tasks. A simple system of files was created to provide data paths among asynchronous tasks to eliminate the need for scheduling such exchanges. A test was broken down into events (example: measure carrier distress on 12 discs for 30 minutes). The data collection computer manages events and periodically sends the results from a number of such events to the report generator.
246 RCA Review Vol. 43 March 1982

VIDEODISC TESTING
The report generation system (Fig. 11), upon receiving results from the data collection system, stacks them in a pending file while main- taining a list of pending tests in a queue file by examining the incoming results. The report generator determines what types of reports are needed as well as whether an event is the final one for a test. It sets flags for these conditions in the queue file. The generator then splits the results for each completed test into a series of temporary files for the different report types. The generator then produces reports by reformatting the information in the intermediate files. The interme- diate files are deleted, the pending and queue files are pruned of completed tests, and the most recent results are compressed into a save file for archiving.
FROM DATA COLLECTION SYSTEM
RESULTS FILE
PEND
EVENT
QUEUE
F LE.'
PRUNE
QUEUE
PENDING FILE..
Pruned at end of execution.
Deleted at end of execution.
()Sorted.
SAVED RESULTS
COMPRESS
RESULTS
CARRIER DISTRESS FILE'
CARRIER DISTRESS REPORT FILE
PRUNE PENDING
FILE
SPLIT
RESULTS
DEFECT GATE FILE'
FILE
REPORT
DEFECT GATE REPORT FILE
Fig. 11-Report generation system.
KEYED LOCATOR FILE
KEYED LOCATOR REPORT FILE
RCA Review Vol. 43 March 1982 247

Sample reports include: (1) The carrier distress report-Player, stylus, and disc identities,
experimental group, play number and stressing (for discs), temper- ature, humidity, duration of event, carrier distress time, number of carrier distress events, the operator's initials and comments, and collection time and date. It also includes the contents of each of the bad and good bins of the carrier distress histograms. An interface to the statistical packages in the time-sharing computer is also provided.
(2) The format for a defect gate report is the same as that for carrier distress.
(3) The keyed locator report includes disc identity and a table of position reports with groove, angle, what happened, and skip size for each. It interfaces directly with cluster analysis and consolida- tion programs in the time-sharing computers.
7. Mathematical and Statistical Test Desicn and Analyses
7.1 Test Design and Standard Analyses
We have applied mathematics and statistics to several areas in design- ing experiments and testing results: (1) testing with controls, blocking, and randomization to insure the data are good (i.e., they lack sys- tematic error and are representative) and (2) experimental design techniques (complete factorial designs and fractional factorial designs) to maximize the information from experiments. The appropriate ana- lytical techniques, statistical or mathematical, were chosen to evaluate the experimental results. Since most tests are designed, the center has powerful tools to analyze the data. Finally the current data are em- ployed to plan new experiments-to determine the sample size, the number of variables, and so on.
Controls, blocking, and randomization minimize bias and spurious noise, and also provide a basis for valid comparisons. Experiments always have controls that usually represent current production. All the experimental groups are compared to the controL Available measures of standard material provide a baseline for comparison with the experimental groups. Whenever possible a control is chosen from the same production lot (material, production conditions, operator, and so on) as the experimental material. This ensures that any differences uncovered are due to the treatments or stresses applied and not from some unusual production condition. Furthermore, with a rapidly de- veloping product, information on last month's production may no longer be valid.
248 RCA Review Vol. 43 March 1982
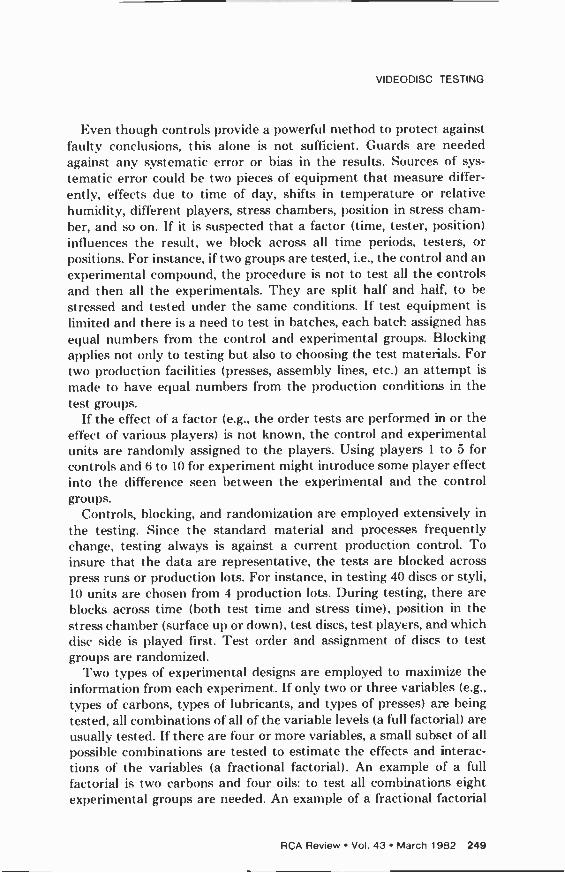
VIDEODISC TESTING
Even though controls provide a powerful method to protect against faulty conclusions, this alone is not sufficient. Guards are needed against any systematic error or bias in the results. Sources of sys-
tematic error could he two pieces of equipment that measure differ- ently, effects due to time of day, shifts in temperature or relative humidity, different players, stress chambers, position in stress cham- ber, and so on. If it is suspected that a factor (time, tester, position) influences the result, we block across all time periods, testers, or positions. For instance, if two groups are tested, i.e., the control and an
experimental compound, the procedure is not to test all the controls and then all the experimentals. They are split half and half, to be stressed and tested under the same conditions. If test equipment is
limited and there is a need to test in batches, each batch assigned has equal mimhers from the control and experimental groups. Blocking applies not only to testing but also to choosing the test materials. For two production facilities (presses, assembly lines, etc.) an attempt is
made to have equal numbers from the production conditions in the test groups.
If the effect of a factor (e.g., the order tests are performed in or the effect of various players) is not known, the control and experimental units are randomly assigned to the players. Using players 1 to 5 for controls and 6 to 10 for experiment might introduce some player effect into the difference seen between the experimental and the control groups.
Controls, blocking, and randomization are employed extensively in the testing. Since the standard material and processes frequently change, testing always is against a current production control. To insure that the data are representative, the tests are blocked across press runs or production lots. For instance, in testing 40 discs or styli, 10 units are chosen from 4 production lots. During testing, there are blocks across time (both test time and stress time), position in the stress chamber (surface up or down), test discs, test players, and which disc side is played first. Test order and assignment of discs to test groups are randomized.
Two types of experimental designs are employed to maximize the information from each experiment. If only two or three variables (e.g.,
types of carbons, types of lubricants, and types of presses) are being tested, all combinations of all of the variable levels (a full factorial) are
usually tested. If there are four or more variables, a small subset of all possible combinations are tested to estimate the effects and interac- tions of the variables (a fractional factorial). An example of a full factorial is two carbons and four oils: to test all combinations eight experimental groups are needed. An example of a fractional factorial
RCA Review Vol. 43 March 1932 249

experiment is evaluating pressing discs to investigate press tempera- ture, press closing speed, extruder speed, extruder temperature, vis- cosity of the material, resins, and carbons. If each of the seven variables has two categories, very useful information can be gained with 16 experiments, rather than the 128 experiments needed to cover all possible combinations.
The analytical techiques employed fall into three categories: (1) robust or nonparametric methods that are very good for small samples, (2) powerful statistical methods such as analysis of variance (chosen to match the design mentioned above), and (3) standard techniques modified for the special behavior of VideoDisc parameters.
Robust methods are not sensitive to anomalies in the data. Non - parametric methods do not depend on strong assumptions of normality in the data. With small samples, it is hard to spot anomalies and to test whether data follow a certain distribution. It is very useful to have techniques that are not sensitive to strange points and/or are not sensitive to assumptions about the data. In exploratory investigations, there frequently are small samples and the underlying phenomena are not yet understood. One of the most useful techniques for these investigations is the Wilcoxon Rank -sum test (also called the Mann - Whitney test). This test compares two groups to see if their medians (50% center points) differ. It is generalized for one-way analysis of variance in the Kruskal-Wallis test. A similar test by Wilson is available for two- and three-way designs.
Analysis of variance is applied to complete factorial designs. This powerful technique provides estimates of unexplained variability (er- ror), the magnitude and statistical significance for each variable and all interactions, the explanatory power of the equation involving the variables and their interactions, and the amount of variability each category (oil, carbon, press, etc.) has. Standard analysis of variance techniques can also be applied to fractional factorial designs to deter- mine the significant variables and interactions.
The most commonly asked question is "How many discs, styli, or components do I need to test?" The number depends on the inherent variability of the parameter to be measured, the type of difference sought, the parameter being measured (mean, variance, or proportion), and the error in the decision that can be tolerated (such as testing at 5% or 1%).
The information from exploratory experiments is used to estimate the variance and the differences commonly seen. This information is employed in designing confirmatory experiments. Frequently, normal- ity (or approximate normality) is assumed to get a ballpark estimate of the sample size.
250 RCA Review Vol. 43 March 1982

VIDEODISC TESTING
Much of the early experimentation on any new Videol)isc process compares means (or averages), since tests on means require the small- est sample size. Statistically significant differences in play quality (e.g.,
carrier distress) can frequently be seen with samples of ten in each group. To compare variances requires a similar amount of testing, with 10 to 20 in a group yielding a fairly sensitive test. Testing for propor- tions (does this sample have a better yield?), however, is costly in
terms of experimentation, requiring a minimum of 50 to 100 units in
each group. The results of the designed experiments are employed to focus
further research. Planned experimentation makes possible the assess- ment of the effects of variables, estimation of the error in measurement or variability in projections, and the collection of useful information on what to investigate further.
7.2 Analysis of Carrier Distress Data
Carrier distress is a valuable measurement for the evaluation of the quality of discs. Unfortunately, it is difficult to analyze because it has a skewed distribution. Most carrier distress values are small. However, in experimental work a few values that are large or very large are produced, generally in evaluating new formulations of disc conipounds, lubricants, etc.
Since the most powerful statistical techniques assume a symmetric hell -shaped distribution, the following transformations on carrier dis- tress (CD) were tested: logarithm (log CI)), square root ('CI)), reciprocal (1 /CD), and reciprocal square root (1/CD) . None removed the skewness. We also tried fitting alternative probability distributions to the data: log normal, Poisson, negative exponential, and beta. None were successful. A final attempt-turning carrier distress into a prob- ahilty, then into odds, and then taking the logarithm-works most, but not all of the time. (Technically for small carrier distress values, there is not uniform variance with increasing means.)
Because the standard parametric techniques provide only partial success and the samples to be tested are small, nonparametric tech- niques are also employed to test the difference in carrier distress across test groups.
'Pests are made for differences in the medians, differences in the mean of the transformed variable, which is more sensitive to large values, and differences in yields against a specification. For the median, the Wilcoxon rank -sum test is used for two -group comparisons; the generalized Wilcoxon (i.e., the Kruskal-Wallis test), for k -group com- parisons; and Wilson's two and three-way nonparametric analysis of
RCA Review Vol. 43 March 1982 251

variance routines for more complicated designs. To test the differences in the transformed mean, we choose the comparisons to he made and perform tests on the appropriate pairs. The proportion of discs that pass a certain specification and the binomial confidence intervals for each proportion are calculated. This combination of tests provides good information on whether different groups of discs differ on carrier distress.
7.3 Microdefect Location
One analysis performed by the test center is the location of disc defects that affect the program signal. Unfortunately, a single 1 -mm -diameter defect spans 370 gr(xves, and so can give rise to hundreds of signal dropouts. A test disc with more than a few defects can produce many hundreds or thousands of individual error reports, keyed by groove number and angle.
Using information from scientists investigating the underlying de- fects, we have developed a clustering scheme that can reduce a set of thousands of dropouts to a relatively few consolidated defect locations. This scheme uses a binning approach to lump defect reports together when their groove and angle are sufficiently similar. Much larger data sets can be quickly consolidated than with conventional clustering algorithms because the scheme takes advantage of the ordering of the raw data and the physical nature of the underlying defects.
Material impurities and stamper damage can both lead to disc defects, but their nature makes it possible to identify them separately. Since stamper damage produces a defect in the same location on every disc, a consolidation of dropout reports from several discs can be used to identify stamper damage. A different clustering algorithm is used for this pattern defect search, to take advantage of the data structure of the 2 or more (up to 50) discs that are to be compared. The pattern defect analysis yields a table showing which consolidated defects occur on which discs, as well as summaries of pattern versus random defects.
8. Variability Control Mechanisms
8.1 Statistical
Statistical techniques answer three questions for measurement vari- ability and control. The first question is "How large is our measure- ment variability or how repeatable is our measurement?" The second is "What parts of our system are affecting our measurement?" For instance: "I)o stylus measurements depend on the disc used? Uoes carrier distress depend on the position in the stress chamber? Do the
252 RCA Review Vol. 43 March 1982
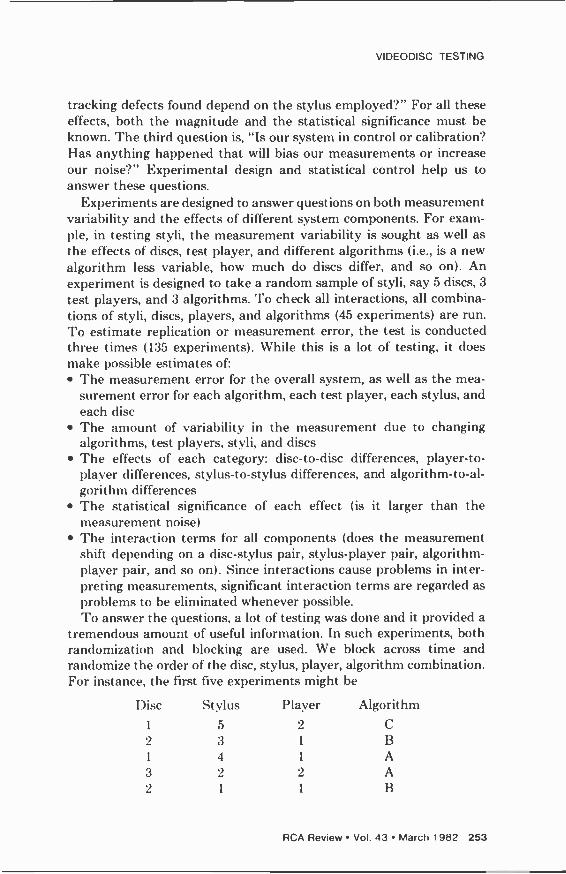
VIDEODISC TESTING
tracking defects found depend on the stylus employed?" For all these effects, both the magnitude and the statistical significance must be known. The third question is, "Is our system in control or calibration? Has anything happened that will bias our measurements or increase our noise?" Experimental design and statistical control help us to answer these questions.
Experiments are designed to answer questions on both measurement variability and the effects of different system components. For exam- ple, in testing styli, the measurement variability is sought as well as the effects of discs, test player, and different algorithms (i.e., is a new algorithm less variable, how much do discs differ, and so on). An experiment is designed to take a random sample of styli, say 5 discs, 3
test players, and 3 algorithms. To check all interactions, all combina- tions of styli, discs, players, and algorithms (45 experiments) are run. To estimate replication or measurement error, the test is conducted three times (135 experiments). While this is a lot of testing, it does make possible estimates of:
The measurement error for the overall system, as well as the mea- surement error for each algorithm, each test player, each stylus, and each disc The amount of variability in the measurement due to changing algorithms, test players, styli, and discs The effects of each category: disc -to -disc differences, player -to - player differences, stylus -to -stylus differences, and algorithm -to -al- gorithm differences The statistical significance of each effect (is it larger than the measurement noise) The interaction terms for all components (does the measurement shift depending on a disc -stylus pair, stylus -player pair, algorithm - player pair, and so on). Since interactions cause problems in inter- preting measurements, significant interaction terms are regarded as problems to be eliminated whenever possible. To answer the questions, a lot of testing was done and it provided a
tremendous amount of useful information. In such experiments, both randomization and blocking are used. We block across time and randomize the order of the disc, stylus, player, algorithm combination. For instance, the first five experiments might be
Disc Stylus Player Algorithm
1 5 2 C
2 3 1 I3
1 4 1 A
3 9 2 A
2 1 1 B
RCA Review Vol. 43 March 1982 253

Randomization and blocking protect against confusing noise or bias with real system effects.
Such studies indicated that frequency -response measurements have minimal disc -to -disc variation, statistically distinguishable stylus -to - stylus variation, player -to -player offsets, and algorithm differences. In the location of microdefects, sensitivities to the track force of the stylus were discovered. For carrier distress, dependencies on position in stress chamber and which side is tested first were unearthed. This information makes it possible to define better, more reliable test procedures.
The final question answered statistically concerns system calibration and control. On all systems, the equipment is measured daily with discs and styli. These measurements are plotted, and statistical quality control procedures determine when the equipment is out of control (broken) or when a stylus or disc should be replaced. All these procedures provide accurate and reliable information about the VideoDisc testing system.
8.2 Physical Effects
All experiments requiring a finite, as opposed to infinitesimal, amount of time to complete immediately introduce variability due to time - varying sources. Materials aging, electronic systems drift, and equip- ment failures are a few examples of time dependent events. Sources of time variability can be complex, interactive, and very difficult to detect concurrently with testing. Since all the sources of variability due to time cannot definitely be eliminated, the effects can be minimized by testing a sample from each experimental material group at the same time.
For each experimental test performed, all relevant differences in the test materials are identified, usually by the experimenter. These ma- terials differences might include disc press runs, oil types, disc com- pounds, surface treatments, stylus electrode metalizations, stylus ma- terials or geometric designs, to name a few. These materials differences are translated into group designations; one group for each combination of materials factors. When simultaneous testing of samples from each group is not possible, due to insufficient equipment capability, samples from each of the designated groups are tested consecutively. These two approaches distribute the time varying effects across all groups in a particular test, provided that no changes due to time have occurred in the interval needed to play a sample from all groups.
To further reduce the effects of random failures, which may or may not be detected, or the effects of the time drift of one piece of test
254 RCA Review Vol. 43 March 1982

VIDEODISC TESTING
equipment out of many pieces of test equipment, all material groups are blocked across test stations. This means that samples from a particular material group are played on many test stations rather than playing one material group on one test station.
Ideally every material group in a test would see the same variety and number of test stations. For this to happen, each material group must contain the number of items to be tested equal to a multiple of the number of groups in the test. This approach distributes test station differences uniformly across groups, thereby reducing test -station -to - test -station variability effects on the results. Sample size for each group becomes important. because small sample size can seriously hinder any attempts to block across test stations. It is also desirable to play more than one sample from a particular group on a particular test station. This improves the chances of identifying equipment or mate- rials failures on a given play by looking for data that are far different from the average data collected for a particular group in that test station.
Control materials are tested along with experimental materials whenever possible. Control materials are, by definition, materials that behave in a known fashion. These controls are given a group designa- tion and blocked as though they were one of the experimental groups. The controls are thereby intermixed with the experimentals through- out the test. Each particular test play should contain at least one control. By playing controls intermixed with experimentals, experi- mentals can be compared with a known under similar test circum- st ances.
Restricting comparisons to items contained in a blocked single test eliminates variability caused by test -to -test differences. This can in- clude, but is not restricted to, equipment drift or modifications, the use of different equipment for different tests, subtle changes in test procedures, different atmospheric conditions at the time of testing, or any possible changes (often not known by the experimenter) that can occur between two separate tests.
The addition of control materials to a test also provides insight into the performance of the test vehicle. Since the performance of the controls is known, any deviations indicate a problem with the test vehicle. This helps identify equipment malfunctions or trends that would otherwise be interpreted as valid test results on experimental materials.
Another technique for locating and controlling variability as well as equipment malfunctions is control charting. A set of materials is tested daily. The results are platted and compared with the history estab- lished for the materials. Each test station has its own particular control
RCA Review Vol. 43 March 1982 255
chart procedure. The measurements are manipulated with software packages using statistical control techniques. A plot for each measure- ment is made with boundaries for normal behavior indicated. Excur- sions beyond the normal limits can then be investigated.
Disc -to -disc and stylus -to -stylus differences can introduce variability or erroneous conclusions depending upon the test being performed. Tests are blocked such that these effects are spread across all groups in the test. Each test must he individually reviewed before testing to insure that the effects of all known varaibilities have been minimized.
Stress -chamber condit ions also influence the results of carrier -dis- tress testing. The face -up side of each disc in the stress chamber exhibits higher carrier distress than the face down side. Another factor is that the side played first after stress exhibits higher carrier distress than the side played second. To balance these effects, discs from each group are placed half with a particular side face up and half with that side down during stressing. When both sides are being played, half of the plays are started with side A and then side B and half of the plays are started with side B and then side A. These blocking techniques spread the effects across groups uniformly.
256 RCA Review Vol. 43 March 1982

Patents Issued to RCA Inventors-Fourth Quarter 1981
October
A. A. Ahmed Amplifier With Cross -Over Current Control (4,297,644) C. B. Carroll and H. G. Scheible Method for Preparing Stylus Lapping Discs (4,297,312) D. R. Carter, C. E. Doner, F. G. Hammersand, and J. R. Tomcavage Circumferentially Apertured Cylindrical Grid for Electron Tube (4,295,077) A. G. Chressanthis, B. P. Gaffney, and H. M. Halpern Digital CFAR Signal Processor for Phase Coded Radars (4,293,856) R. B. Comizzoli and R. D. Vibronek Method of Detecting a Thin Insulating Film Over a Conductor (4,296,370) A. T. Crowley Digitally Adjustable Phase Shifting Circuit (4,295,098) R. J. D'Amato Color Picture Tube Having Improved Corrugated Apertured Mask (4,293,791) R. Denning, M. A. Spak, and B. Polhemus Method of Applying Thin Metal Deposits to a Substrate (4,297,393) D. L. Dodds Television Display Error Correction (4,296,359) W. V. Fitzgerald, Jr. Vertical Deflection Circuit (4,293,803) J. Hettiger Keyed Noise Filter in a Television Receiver (4,295,161) J. Hettiger Keying Signal Generator Responsive to Plural Input Signals (4,295,163) M. V. Hoover Class AB Push -Pull FET Amplifiers (4,296,382) P. K. Hsieh and R. M. Vaccarella Level Shift Circuit (4,295,065) S. T. Hsu Method of Manufacturing Bulk CMOS Integrated Circuits (4,295,266) S. T. Hsu Electrically Programmable Control Gate Injected Floating Gate Solid State Memory Transistor and Method of Making Same (4,297,719) E. O. Keizer and G. A. Alphonse System for Measuring Stylus Shoe Length (4,296,371) H. G. Kiess and B. K. Binggeli Readout of Electrostatically Stored Information (4,296,478) P. R. Koons and J. M. Neilson Method of Treating SIPOS Passivated High Voltage Semiconductor Device (4,297,149) H. W. Kuzminski Color Picture Tube Having Improved Slit Type Shadow Mask and Method of Making Same (4,296,189) W. A. Lagoni Signal Processing Circuit Having a Non -Linear Transfer Function (4,295,160) A. J. Leidich Class AB Push -Pull Quasi -Linear Amplifiers (4,295,101) E. W. Maby, H. Kawamoto, and P. V. Valembois Ion Implanted Stylus (4,296, 144) M. E. Malchow Temperature -Sensitive Voltage Divider (4,295,088) J. J. Matta and A. Skalina Feed System for a Circularly Polarized Tetra -Coil Antenna (4,295,1 44) J. E. Nicholson and P. C. Wilmarth Television Receiver Chassis Adapted to be Compatible With Different Tuner and Cabinet Configurations (4,297,726) N. Nikolayuk Circularly Polarized Slotted Pylon Antenna (4,297,706) P. Nyul and F. R. Hughes Method of Bonding Two Parts Together and Article Produced Thereby (4,295,151) R. W. Paglione Apparatus and Method for Application of Radioactive and Microwave Energy to the Body (4,292,960) S. M. Perlow Impedance Transformation Network (4,295,107) F. R. Ragland, Jr. Mercury Arc Lamp Having Communicating Mercury Reservoir (4,295,074) D. L. Roberts Color Picture Tube Having Improved Slit Type Shadow Mask (4,293,792) R. L. Schelhorn Composite Substrate (4,296,272) R. L. Shanley, 2nd and J. Hettiger Failure Compensated Automatic Kinescope Beam Current Limiter (4,295,166) D. R. Silcox and J. L. Doster Filament Winding Apparatus (4,297,095) B. W. Siryj, C. R. Horton, and R. D. Scott Thermal Processor in an Apparatus for Developing Photographic Film (4,293,212) B. W. Siryj Solar Tracking Apparatus (4,295,621) S. A. Steckler and A. R. Balaban Circuit Arrangement for Multiplexing an Input Function and an Output Function at a Single Terminal (4,293,870) F. Sterzer Serrodyning System Employing an Adjustable Phase Shifting Circuit (4,297,641)
RCA Review Vol. 43 March 1982 257
J. Thornhill, Jr. and R. B. Elder Earth Self -Orienting Apparatus (4,292,861) R. L. Truesdell and M. D. Ross Apparatus for Measuring the Characteristics of a Wideband Electromechanical Recording System Having a Transformer (4,295,216) H. R. Warren Magnetic Recording With Reduced Cross -Talk and Interchannel Time Displacement (4,296,430) P. C. Wilmarth Color Television Receiver Degaussing Circuit (4,295,078) H. A. Wittlinger and C. P. Salerno Postion Sensing and Display Means (4,294,321) G. S. Zorbalas Motor Speed Control Circuit (4,296,446)
November
V. Auerbach Fault -Tolerant Interface Circuit for Parallel Digital Bus (4,298,982) J. Y. Avins Incremental Encoder (4,300,039) W. E. Barnette and E. C. Fox Compensation Apparatus for a Servo System With Periodic Command Signals (4,300,226) A. E. Bell, A. Bloom, R. A. Bartolini, and W. J. Burke Thin Protective Overcoat Layer for Optical Video Disc (4,300,143) A. E. Bell Replicable Optical Recording Medium (4,300,227) T. L. Credelle and R. A. Gange Beam Clean Up Structure for Flat Panel Display Devices (4,298,819) P. Datta Conductive Molding Composition and Discs Therefrom (4,299,736) W. F. Dietz Horizontal Deflection Circuit and Power Supply With Regulation By Hori- zontal Output Transistor Turn -Off Delay Control (4,301 ,394) M. Ettenberg and C. J. Nuese III -V Direct-Bandgap Semiconductor Optical Filter (4,300,811) T. J. Faith, Jr. Laminated Conducting Film on an Integrated Circuit Substrate and Method of Forming the Laminate (4,302,498) R. H. Godfrey and J. O. Peck Cathode -Ray Tube Screen Border Improvement (4,300,070) L. A. Harwood Transistor Protection Circuit (4,302,792) R. Herman Printed Circuit Board Support Structure (4,301,495) T. B. Howard, Jr. Etching Tank in Which the Solution Circulates By Convection (4,302,273) L. K. Hung and A. Bloom Water -Based Photoresists Using Stilbene Compounds as Crosslinking Agents (4,299,910) M. R. Johns Antenna Array With Impedance Matching Using Mutual Coupling (4,301,458) P. R. Knight Horizontal Deflection Generator and Driver Circuit (4,298,830) D. W. Luz Power Supply and Deflection Circuit With Raster Size Compensation (4,298,829) G. A. Mattson Tape Cartridge (4,301,976) H. E. McCandless Electron Gun (4,298,818) M. L. McNeely Apparatus for Molding Recorded Discs (4,302,1 75) R. A. Nolan Color Picture Tube Having Improved Slit Type Shadow Mask and Method of Making Same (4,300,069) J. I. Nubani Method for Testing Panel -To -Funnel Sealing Layer of a Cathode -Ray Tube (4,302, 725) W. G. Rudy Method for Vaporizing Getter Material in a Vacuum Electron Tube (4,302,063) O. H. Schade, Jr.Current Regulating Circuitry (4,300,091) O. H. Schade, Jr. Reference Potential Generating Circuits (4,302,718) H. M. Scott Switching Regulator With Independent Feedback Path Filter (4,298,892) V. Stachejko U -Shaped IRIS Design Exhibiting Capacitive Reactance in Heavily Loaded Rectangular Waveguide (4,301 ,430)
December
J. Y. Avins Incremental Encoder for Measuring Positions of Objects Such as Rotating Shafts (4,308,500) T. A. Bridgewater Continuous Tuning Arrangement for a Multiband Television Receiver (4,307,467) J. E. Carnes and M. H. Woods Nonvolatile Semiconductor Memory Device and Method of Its Manufacture (4,307,411) C. B. Carroll and R. E. Schneller Frontplate and Shadow Mask Assemblies for a Modular Flat Panel Display Device (4,308,484)
258 RCA Review Vol. 43 March 1982

AUTHORS
T. J. Christopher Preemphasis and Clipping Apparatus for Reducing Distortions (4,306,256) J. A. Clanton Skylight Cover (4,307,549) J. F. Clark Self -Heated Solenoid (4,306,704) C. B. Dieterich VideoDisc System (4,308,557) R. D. Faulkner and R. E. McHose Focusing Structure for Photomultiplier Tubes (4,306,171) R. A. Gange Line Cathode Structure Having Recessed Geometry (4,308,486) E. A. Goldberg Frequency Synthesizer Incorporating Digital Frequency Translator (4,303,893) N. F. Gubitose and M. J. Zelinka Method of and Apparatus for Outgassing Raw Material Used to Grow Crystals (4,305,725) L. M. Hughes and K. L. George Spindle Retracting Mechanism for Disc Record Player (4,305,145) L. M. Hughes and F. R. Stave Disc Player Having Disc Stabilizing Apparatus (4,305,146) J. L. Ibaugh Photomultiplier Tube Having a Photocurrent Collector (4,306,188) H. C. Johnson Ranging Radar Including a Modulating Reflector (4,306,236) H. Khajezadeh MNOS Memory Device and Method of Manufacture (4,305,086) H. P. Kleinknecht and W. A. Bosenberg Optically Testing the Lateral Dimensions of a Pattern (4,303,341) N. Kucharewski IC Clamping Circuit (4,307,306) A. J. Leidich Amplifier Circuit Having Controllable Gain (4,305,044) J. A. Madajewski and T. S. Mickowski Kelvin Test Fixture for Electrically Contacting Minature, Two Terminal, Leadless, Electrical Components (4,308,498) T. A. Marett, Jr. Television Display System Incorporating a Coma Corrected Deflection Yoke (4,305,055) J. R. Matey and C. R. Corson Video Disc Signal Surface Imaging Apparatus (4,307,419) A. F. McDonie Method for Expeditiously Processing a Sodium -Potassium -Cesium - Antimony Photocathode (4,305,972) K. W. McGlashan Permeable Corrector for Deflection Yokes (4,307,363) M. J. Mindel and J. C. Rustman Video Disc Player System for Correlating Stylus Position With Information Previously Detected From Disc (4,307,418) J. R. Nelson Gas Adsorption Apparatus for Determining the Gaseous Surface Area of a Material (4,305,291) E. J. Nossen Symbols Communication System (4,306.308) A. J. Pierfederici Plasma Etching Device and Process (4,304,983) W. R. Roach and W. C. Henderson Asymmetrical Radiation Exposure of Spin Coated Photoresist to Obtain Uniform Thickness Coating Used to Replicate Spiral Grooves in
Plastic Substrate (4,306,013) W. R. Roach and D. Meyerhofer Uniform Light Exposure of Positive Photoresist for Replicating Spiral Groove in Plastic Substrate (4,308,337) F. W. Spong Multilayer Record Blank for Use in Optical Recording (4,305,081) J. W. Stephens and K. Yang Horizontal Stability Measurement Apparatus (4,303,939) D. N. Thomson Envelope Detector Using Balanced Mixer (4,307,3471 C. A. Weaver Method for the Manufacture of Stampers (4,305,795) M. L. Whitehurst Method for the Manufacture of Capacitive Electronic Discs (4,305, 791) D. H. Willis Raster Distortion Corrected Deflection Circuit (4,305,023) R. E. Wilson Low Power Switch Closure Sensing Circuit (4,303,907)
RCA Review Vol. 43 March 1982 259

AUTHORS
Gerard A. Alphonse attended New York University where he obtained the B.S.E.E. degree in 1958 and the M.S.E.E. degree in 1959. In 1963, he attended the Polytechnic Institute of Brooklyn under a grant from RCA Laboratories and received his Ph.D. in Electrophysics in p 1967. Dr. Alphonse has been a member of the technical staff at the RCA Laboratories since June 1959, and a faculty member at LaSalle since 1967. His work at RCA has included the development of superconductive mem- ories, for which he received an "Outstanding Research Award" from RCA. His other research activities have included photochromic memories, acoustooptics, holography, electrooptics, and ultrasonic imaging. He is currently doing research on videodisc recording.
Dr. Alphonse holds 16 U.S. patents, and is a faculty member in the Evening Division of LaSalle College in Philadelphia, where he is at present serving as Chairman of the Electronic Physics Department. In Cctober 1975 he was appointed as a consultant to the Engineering Science and Analysis Section of the Engineering Divison of NSF for a period of two years. He is a senior member of the IEEE, a member of the American Institute of Physics, the Optical Society of America, Eta Kappa Nu, Tau Beta Pi, Sigma Xi, and the Franklin Institute.
William E. Barnette received a B.S. Degree in Electrical Engineering from the University of Delaware in 1953. Between 1953 and 1961, he attended graduate courses in Princeton University and the University of Pennsylva- nia. In 1953 he joined the Technical Staff of the RCA Laboratories, Princeton, NJ, where his initial work was in color television circuitry and the development of wide band -width linear and logarithmic amplifiers for a high resolution radar. This work was followed by research in the field of microminature decoding devices for selective communications. For this work he received a Laboratories' Achievement Award. Between 1960 and 1974 Mr. Barnette was involved with work on submarine communications, Project Pangloss, which later become Project Sanguine. Also during this time period he became part of the Project Lightning team where he contributed to the development of a -c powered tunnel -diode computer circuitry operating at frequencies up to 450 MHz. More recent assignments have included CATV systems developmert and camera devel- opment for the Holotape Selectavision project. In the latter part of the 1970's, Mr. Barnette was involved in developing an optical video disc for the Broadcast Division. Also, he was part of a team which received a Laboratories' Achieve- ment Award for the development of the TK 47 automatic camera. The recent work on the Optical Disc Reader was done as a member of the Manufacturing Systems and Technology Research Laboratory.
Mr. Barnette is a member of the IEEE and Sigma Xi.
260 RCA Review Vol. 43 March 1982

AUTHORS
Donald P. Barton received an M.S. Degree in Operations Research from Rutgers in 1977. He worked as a techni- cian on BMEWS in 1961 and 1962, was a field engineer on flight simulators from 1963 to 1971, and worked as a digital design engineer from 1974 to 1980 (1978-1979 with GSD). His current interest is in information systems design and he is presently a member of the technical staff in the VideoDisc Systems Evaluation Research Group at RCA Laboratories.
Russell R. Barton studied at Princeton University under an RCA Merit Scholarship, receiving a B.S.E.E. with honors in 1973. While an undergraduate, he studied the feasibility of electric cars powered by conventional lead - acid batteries, and conducted electric vehicle tests for 0.,151 ESB. He received Masters and Ph.D. degrees in Opera- tions Research from Cornell University in 1975 and 1978, respectively. From 1975 to 1978 he worked as a con- sultant on operations research problems for the Depart- ments of Justice, Transportation, Labor, and the Army. His doctoral thesis was a study of statistical failure rate techniques applied to the analysis of exoffender behavior. In 1978, he joined RCA Laboratories where he has worked on a variety of projects, including VideoDisc testing, satellite reliability analysis, organizational effectiveness, and decomposition solutions for large network problems.
Dr. Barton is a member of Eta Kappa Nu, Sigma Xi, the Operations Research Society of America, and the American Statistical Association.
Marvin Blecker received the B.S. and M.S.degrees in Mathematics (1967) and an M.S. degree in Electrical Engineering -Systems Science (1970) from the Polytech- nic Institute of Brooklyn. In 1967, Mr. Blecker began his career as a systems engineer with the Space Division of ' the General Electric Company. He joined the Federal Reserve Bank of N.Y. in 1971 as a systems analyst and, fa
in 1973, was employed as a Member of the Technical Staff of RCA Laboratories. In these three positions, his dle accomplishments included problem analysis and solution through the application of mathematical modeling, simulation, optimization and systems design techniques. Application areas included electronic con- sumer products, communication satellites, econometrics, air and marine traffic systems, and ground data handling systems. He was appointed Manager, Management Information Systems at RCA Laboratories in February 1976 and became Head, Systems Analysis Research in April 1978. In 1979, he became Head, Systems Evaluation Research in the VideoDisc Systems Research Laboratory, his current position. In this role, he has formulated and directed research and development programs in test and process control systems for the VideoDisc product. He has managed the design, implementation and operation of the RCA Laboratories' VideoDisc research testing center. Mr. Blecker is a member of the Institute of Management Sciences, IEEE, Pi Mu Epsilon, and Sigma Xi.
RCA Review Vol. 43 March 1982 261

Pabitra Datta received a B.S. degree in Physics and Chemistry from Gauhati University, Assam, India in June 1960, a M.S. degree in Physical Chemistry from Drexel University, Philadelpha, PA in 1962, and a Ph.D. degree in Physical Chemistry from Case -Western Reserve Uni- versity in 1965. He spent two years of post doctoral work at New York State University at Stony Brook, NY. He joined Addressograph Multigraph Corporation as senior chemist and was promoted to staff scientist within two years. He joined RCA Laboratories as Member of the Technical Staff in 1974. His research interests are surface chemistry, photo- chemistry, plasma deposition, and physical properties of plastics. He has 15 issued U.S. patents and 12 publications in these areas. He is one of the principal inventors of RCA conductive capacitance discs.
He received three RCA Laboratories' Outstanding Achievement Awards and an RCA Corporation David Sarnoff Award for Outstanding Technical Achievement.
Edgar J. Denlinger received the BS degree in Engineer- ing Science from Pennsylvania State University, Univer- sity Park, in 1961 and the MS and PhD degrees in Electrical Engineering from the University of Pennsylva- nia, Philadelphia, in 1964 and 1969, respectively. From 1961 to 1963 he was in the RCA Graduate Study Pro- gram while working in the RCA Applied Research De- partment, Camden, NJ. Until 1965, he was engaged in research on solid-state traveling -wave masers, supercon- ducting magnets, and experimental transistors. From 1965 to 1967 he held a University of Pennsylvania Research Assistantship during which he did research on a bulk -effect oscillator. From 1967 to 1973 he was a Staff Member at Lincoln Laboratories, Massachusetts Institute of Technology, Lexington, working in the areas of microwave integrated circuits, phased -array antennas, and air traffic control. Since April 1973, he has been a Member of Technical Staff at RCA Laboratories, Princeton, NJ, engaged in research on millimeter -wave avalanche diodes, microwave integrated circuits, PIN and mixer diodes, low -noise receivers, and avalanche diode amplifiers. For his work on solid-state airborne weather radar, he received an RCA Laboratories Outstanding Achievement Award in 1979. He holds five patents.
Dr. Denlinger is a member of IEEE, Sigma Xi, Tau Beta Pi, Sigma Tau, and Phi Kappa Phi. He is Chairman of the Princeton Chapter of the IEEE MTT/ED Group.
K. F. Etzold received his B.S. in Physics from the City College of New York in 1963, the M.S. from New York University in 1965 and the Ph.D. in Solid State Physics, also from New York University, in 1973. He has done research on ultrasonic imaging for medical diagnostic applications and has recently investigated the properties / of piezoelectric transducers for VideoDisc mastering. He was involved in both the design of new devices and optical techniques for their evaluation. The article de- scribes the hardware designed in support of his analytical activities and he received an achievement award in 1981 for this work. He also received achievment awards in 1974 and 1978 for research in medical
262 RCA Review Vol. 43 March 1982

AUTHORS
imaging and for improved silicon wafer cutting technology, respectively. He is
a member of the American Physical Society.
David A. Furst received his B.S. degree in Physics from the State University of New York at Stony Brook in
1971 and his M.S. degree in 'hysics from Rutgers Uni- versity in 1973. He did research in thermal conductivity of superconducting materials in pursuing his graduate degree. He taught physics at Rutgers University, Hunter J f College of CUNY, and Middlesex County College prior to joining RCA Laboratories in 1975. From 1975 to 1979 rjL he was involved in materials research concerned with Ala improvements in the electron guns of television kine- scopes. Concurrently with the project, he began his involvement in materials research concerned with the development of an electrode for the VideoDisc stylus. In 1980 he was awarded an RCA Laboratories Outstanding Achieve- ment Award "For contributions to a team effort in the development of a mass produced, durable VideoDisc stylus electrode." Mr. Furst is a member of the
American Physical Society and the American Vacuum Society.
Istvan Gorog is Head of the Manufacturing Research Group ín the Manufacturing Systems and Technology Research Laboratory of RCA Laboratories, Princeton, NJ. In this capacity he directs and carries out research and development primarily in the areas of instrumenta- tion, process control, and applied physics relevant to color kinescope and VideoDisc manufacturing. He re- ceived the BSc (1961), MSc (1962), and PhD (1964) degrees in Electrical Engineering from the University of California at Berkeley. Dr. Gorog joined RCA Laborato- ries, Princeton, NJ, in 1964, as a Member of Technical Staff. His main area of interest has been electro -optical systems. His research activities at RCA have included lasers and their applications; holography; optical communications; the investigation of prerecorded -video recording and playback techniques; laser deflection and modulations; photochromic, cathodochromic, and elec- trochromic devices; and a wide variety of display systems. He has also been interested in the analysis of image transmission and display in terms of the quantitative descriptors of human visual perception. This work included the initiation of an experimental Fsychophysics program at RCA Laboratories. He initiated and has been responsible for all optical reading, recording, and instrumentation efforts related to the RCA VideoDisc program. During 1968 he was on leave from RCA as a National Science Foundation Postdoctoral Fellow at the Laboratori Nazionali di Frascati and the European Space Re- search Institute in Frascati, Italy. There he worked on the problems of production of high -temperature plasmas by laser irradiation of solid targets and scattering of laser radiation by collective plasma fluctuations.
Dr. Gorog has been granted 15 U.S. patents, and has several patent applications pending both in this country and abroad. He is a member of the American Physical Society and of Eta Kappa Nu.
RCA Review Vol. 43 March 1982 263

Joseph Guarracini received a BS in ME in 1948, an MS in Physics in 1954, and has done subsequent graduate work at the University of Pennsylvania. His early work r was done at the National Bureau of Standards and the Harry Diamond Laboratories in Washington, DC. He joined RCA in 1956, working first on airborne fire control .40 and later on the Tiros I satellite. In 1962, he joined RCA Laboratories, Princeton, NJ, where his activities have ranged from computer memory design to magnetic disc -r drives and, for the past eleven years, various projects - connected with the VideoDisc system.
Mr. Guarracini is a member of the American Physical Society and the American Society of Mechanical Engineers.
Robert W. Jebens received a BS with Distinction in Physics from Worcester Polytechnic Institute in 1960. He started his graduate work in physical metallurgy at Cornell University and finished at Rutgers University, receiving an MS in Physics in 1963. Mr. Jeben's first year in industry was at Melpar, Inc., where he was /y involved in research in integrated circuits and the trans- port properties of semiconductors. He joined RCA Lab- oratories late in 1963 and worked for the first two years on thin-film transistors, integrated circuits, and the use of synchronous detection techniques. From 1965 to 1973 Mr. Jebens was deeply involved with the RCA SelectaVision VideoDisc effort. He had project leader responsibility for the development of the precision master grove -cutting machine, the electron -beam recorder, and master processing and replication. Since 1973, Mr. Jebens has been working on a high -density optical recording project for TV -broadcast applications. Most of Mr. Jeben's career at RCA has been involved with interdisciplinary systems work, usually with a mechanical system that includes optics, materials, and electronics.
Mr. Jebens received an RCA Laboratories Award for Outstanding Achieve- ment in 1967 for ingenuity and versatility in the development of techniques for the generation of precision -masking' and high -density -recording apparatus, and another in 1970 for contribution to a team effort in the development and use of sophisticated techniques and apparatus for high -resolution electron - beam recording and electromechanical recording. He also received a Special Award in 1973 in recognition of outstanding research leading toward the development of the RCA SelectaVision VideoDisc. Mr. Jebens is the holder of three patents, one of which is the electron -beam -recorder mechanism used in the VideoDisc project. He is a member of Sigma Xi and the American Institute of Physics.
Hiro Kawamoto received his BS in Electronics in 1961 from Kyoto University in Kyoto, Japan. He received his Masters in 1966 and Ph.D. in 1970, both in Electrical Engineering and Computer Sciences from the University of California, Berkeley. From 1964 to 1966 he was a Fulbright Exchange Visitor from Japan to the United States. In 1970, he was an Acting Assistant Professor at the Department of Electrical Engineering and Computer Sciences of the University of California, Berkeley. In 1970, he joined RCA Laboratories at Princeton, NJ,
264 RCA Review Vol. 43 March 1962

AUTHORS
where he worked on microwave TRAPATT devices and the CED Videodisc System. In 1980, he joined Sony Corporation of America as a General Manager of Marketing Development and Product Planning. In November 1981, he was appointed General Manager of the Sony Consumer Electronics Laboratories, newly established in Paramus, New Jersey.
Dr. Kawamoto is a contributor to "Carbon -Polymer Composites", a book which will be published by Marcel Dekker in 1982. He holds 20 US and Japanese patents, including three patents that are implemented in the CED Videodisc System. He is a member of Sigma Xi and Eta Kappa Nu. He is a
member of the Administration Committee of the Consumer Electronics group of the IEEE and served as Vice Chairman for the Electro shows held in New York in 1979 and 1981. He is also Founder and Chairman of the Board *of
Trustees of Princeton Community Japanese Language School.
B. T. Khuri-Yakub was born in Beirut, Lebanon in 1948. He received the B. E. from the American University of Beirut in 1970, the M.S. from Dartmouth College in 1972, and the Ph.D. from Stanford University in 1975, all in Electrical Engineering. Since receiving his Ph.D. he has been at the E. L. Ginzton Lab of Stanford University where he is presently a Senior Research Associate. In 1980 he co-founded KYS, Inc., a consulting company dealing with custom design of specialized acoustic trans- ducers.
Michael Luri received a B.S. in physics from Brooklyn College in 1959, an M.S. in physics from Rutgers Uni- versity in 1961, and a Dr. Eng. Sci. from Newark College of Engineering in 1967. His thesis concerned the prep- aration of pure, high density samples of inert gases for f+i'
NMR studies. In 1961 he joined Gulton Industries, Inc., \ ` to work on high temperature dielectric and ceramic ma- terials, and aerospace power systems, particularly stor- age batteries and associated electronics. He left in 1963 to teach electrical engineering at the New Jersey Institute J' of Technology (Newark College) and to work for a doctorate. During his four years teaching there, he was an outside consultant in the field of vibration analysis of machinery, and held summer positions, first with Gulton Industries, then with RCA Astro -Electronics where he worked on TV circuits for the TOS weather satellite. He left his teaching position to take a post as Senior Research Fellow at the National Physical Laboratory in England, working on spatial filtering and the measurement of small motions by holography and interferometry. In 1968 he joined RCA Laboratories doing research on noise in holographic systems, and applications of holography to video recording. He has contributed to the development of several optical, electronic, and computer -controlled systems. He was Project Leader for the development of a laser player system for testing RCA VideoDiscs. Recently, he worked on the architecture and design of a computer -controlled broadcast TV camera. His present interest is robotics and automation.
Dr. Lurie has received three RCA Outstanding Achievement Awards, the David Sarnoff Award in Science, and the Journal Award of the Society of Motion Picture and Television Engineers. The computer- controlled TV camera to which he contributed won an Emmy award for technical excellence. He is
RCA Review Vol. 43 March 1982 265

on the patent review board for Applied Optics, and is a member of the Optical Society of America, the Institute of Electrical and Electronics Engineers, Eta Kappa Nu, Tau Beta Pi, and Sigma Xi.
Paul W. Lyons received a B.S. Degree in Electronic Engineering from Monmouth College. He joined RCA Laboratories Systems Design Research activity in 1972 working primarily on color television research projects including accelerated life testing, power supply and de- flection systems, and projection television systems. He joined the VideoDisc Systems Research Laboratory in 1979 to work on VideoDisc calibration systems. He has been Manager, VideoDisc Testing Center in Princeton since August, 1980.
Mr. Lyons is a member of Eta Kappa Nu.
Dennis Matthies received a B.S. degree (cum laude) from the Rensselaer Polytechnic Institute Department of Physics in 1968. His graduate education at Princeton University concentrated on device physics. He earned a M.A. degree in 1969, a M.S. degree in 1970, and a Ph.D. degree in 1973. Dr. Matthies joined RCA Laboratories in 1968 and began work on the VideoDisc project at that time. He has made contributions in the areas of concep- tion and development of coated and carbon filled VideoDiscs, surface lubrication, stylus fabrication, prod- uct testing, and quality control. Dr. Matthies' work has been recognized by awards for outstanding achievement in 1979 for a team effort which developed "analytical techniques and preparative procedures leading to superior surface quality of VideoDiscs" and in 1970 for contributions to a team effort in "devising and improving storage media processes for high density recording." Dr. Matthies has also made contributions to the technologies of liquid crystals, holography, electron -beam lithography, x-ray lithography, radiation damage in electronic devices, and plasma chemistry.
Dr. Matthies is a member of the Sigma Xi Honor Society, the Sigma Pi Sigma Physics Honor Society, and the Eta Kappa Nu Electrical Engineering Honor Society. He holds five United States patents.
Herbert I. Moss received his BS degree with honors in Chemistry in 1953, from the University of Louisville, KY, and his PhD degree from Indiana University, Blooming- ton, IN, in 1960. His thesis was on "The Vapor Pressures of the Binary Molten Salt Systems; Potassium Chloride - Cadmium Chloride, and Potassium Chloride -Zinc Chlo- ride." From 1953 to 1956 he served as a Teaching Assistant in chemistry and from 1956 to 1959 as a f1M'
Research Assistant in chemistry at Indiana University. In 1959 he joined RCA Laboratories, Princeton, NJ, where he worked on thin-film and large -area photovoltaic research until 1963. Dr. Moss has made significant contributions in the field of II -VI compound film photovoltaics. Since 1963 he has been engaged in work on the pressure
266 RCA Review Vol. 43 March 1982

AUTHORS
sintering (hot pressing) of electronic, magnetic, and optically active materials. This work has been concerned with such materials as ferrites and magnetic alloys for video magnetic record/playback heads, III -V and II -VI compound semiconductors, photochromic materials such as CaF2, chalcogenide spinels, lead telluride alloys for thermoelectric applications, lanthanum hexaboride for electron -emitting cathodes, and lead zirconate-lead titanate piezoelectric ma- terials for VideoDisc recordings. The pressure -sintering work has led to a
patented design for a die that permits operation with graphite at pressures ten times greater than can be withstood by previous graphite dies. Recently, Dr. Moss has been involved in the growth of single -crystal ferrite tor video magnetic recording/playback heads, the pressure sintering of Si3N4, and projects concerned with sapphire and diamond styli for VideoDisc recording and playback.
Dr. Moss is a member of the American Chemical Society, Electrochemical Society, American Ceramic Society, American Powder Metallurgy Institute, and Sigma Xi, and is listed in American Men and Women of Science. He received an RCA Laboratories Outstanding Achievement Award in 1969 for his work on video magnetic heads.
Richard W. Nosker joined RCA in Camden as a freshman co-op in 1961. He moved to RCA Laboratories in 1964, and received the BSEE from the University of Cincinnati (1 - in 1965. He received the Ph.D. from Princeton University in EE (solid state) in 1970, with the support of a David Sarnoff Fellowship. Since 1966, he has worked on VideoDisc. In the early years, he worked in a variety of areas such as master preparation and electroforming, and analytical studies of electron beam scattering in i photoresist. For nearly a decade, he has concentrated on the mechanics and chemistry of the stylus-disc interface. These studies have involved the friction, lubrication, and wear of the sliding components, the mechanical deformations at the interface and the resulting effects on signal recovery, and stylus dynamics and resultant disc deformations. During the 1978-79 academic year, Dr. Nosker was at Imperial College of Science and Technology in London, England, where he studied the bulk deformation and yield of polymers at very high strain rates. He has received three RCA Laboratories Outstanding Achievement Awards, and is a member of the American Physical Society.
Richard C. Palmer received the BEE degree from the University of Virginia in 1943 and did subsequent grad- uate work in Physics at the Stevens Institute of Technol- ogy. After one year with the General Electric Co., Sche- nectady, NY and two years with the Tennessee -Eastman Corp., Oak Ridge, Tenn., he joined the Allen B. DuMont v -
Laboratories where he worked in the fields of television studio equipment, television cameras, color television, phototubes, and television display devices, He joined the RCA Laboratories as a Member of the Technical Staff in 1960, and has pursued research in the fields of television displays and VideoDisc systems.
Mr. Palmer served. on Panel 12 of the National Television Systems Commit -
RCA Review Vol. 43 March 1982 267

tee and on various committees of the IRE and has been granted over 20 patents. He has received three RCA Laboratories Outstanding Achievement Awards and is a member of IEEE, Sigma Xi, and Tau Beta Pi Societies.
Harry L. Pinch earned the B.S. degree in 1951 from the City College of New York and the Ph.D. in 1955 from the Pennsylvania State University, both in chemistry. He has been a member of the technical staff at RCA Laborato- ries, Princeton, N. J. since 1957. He has done materials research on phosphor films, magnetic films, solid state laser host crystals, magnetic semiconductors, garnet "bubble" films and high resistance cermet films. His present areas of concern are the deposition and metal- lurgy of the VideoDisc stylus electrode.
He is a member of the American Vacuum Society and the American Chemical Society.
Karen Pitts' background is in applied mathematics and statistics. She hold a B.S. in mathematics from St. Olaf College in Minnesota and an M.S. in Operations Re- search and Systems Analysis from the University of North Carolina at Chapel Hill. Since 1976, she has been in- volved in statistical experimental design, data analysis, mathematical modeling, and systems analysis for RCA Laboratories. Ms. Pitts has worked on projects for the Solid State, Americom, SelectaVision, and consumer Electronics Divisions of RCA. She is a member of the -- _ American Statistial Association, the Society for Women Engineers, and writes a column for the Caucus for Women in Statistics.
John H. Reisner, Jr., received a B.S. in Physics, Summa Cum Laude, from Davidson College in 1939. He pursued his graduate study in Physics at the University of Virginia, receiving an M.S. in 1941 and a Ph.D. in 1943. In 1943, he joined RCA, Camden, NJ, where he worked on crys- tallography and quartz resonators. In 1945, he trans- ferred to the Scientific Insruments Section of RCA to work on electron optical instrumentation, and in 1948 he was appointed leader of the research and advanced development group. In this position, he supervised and actively participated in the development of five generations of electron micro- scope prototypes, which were the forerunners of over 1300 commercial instruments. In 1941, he transferred to RCA Laboratoties at Princeton, NJ, to work on electron -beam recording of VideoDisc masters. This project was brought to a successful conclusion with real-time recording and one -hour playing time in 1977. He then turned to the development of improved electro- mechanical recording devices and techniques for recording, which has con- tinued to the present. For contributions to the VideoDisc program, he has received three RCA Achievement Awards.
In 1980, he was appointed a Fellow of the Technical Staff. He is a Fellow of
268 RCA Review Vol. 43 March 1982

AUTHORS
the American Physical Society and of the AAAS. He is a past president of the Electron Microscopy Society of America and a member of Phi Beta Kappa, Sigma Xi, Sigma Pi Sigma, Omicron Delta Kappa, and the Raven Society of the University of Virginia.
Rabah Shahbender received the B.E.E. from Cairo Uni- versity, Cairo, Egypt, the M.S.E.E. from Washington Uni- versity, St. Louis, Missouri, and the Ph.D. from the Uni- versity of Illinois. From 1946 lo 1948, he worked for the Anglo-Egyptian Oilfields Ltd. in seismic exploration. From 1951 to 1955, he was on the staff of Honeywell Controls Division where he conducted research in the behavior of nonlinear closed loop systems. He joined RCA in Cam- den, New Jersey, in 1955 and worked in the areas of adaptive systems, nonlinear filters, electron beam de- vices, ultrasonic devices, and airborne fire control systems. He transferred to RCA Laboratories, Princeton, NJ, in 1959, and has been active in the area of digital devices and systems. In 1961, he was appointed Head, Digital Re- search. Dr. Shahbender received the SFIPS Best Paper Award in 1963, IR - 100 Awards in 1964 and 1969, and RCA Laboratories' Achievement Awards in 1960 and 1963. From 1963 to 1966, he was Chairman of the Department of Electronic Physics at La Salle College, Evening Division.
Dr. Shahbender is a Fellow of IEEE, a member of AAAS, Sigma Xi and Eta Kappa Nu, and a Fellow of the University of Illinois.
Robert E. Simms entered the US Army in 1965. He -
served as a Radar instructor at Fort Monmouth, NJ, and later was responsible for the operation of a forward air navigation radar system in Vietnam. In 1968, he worked re. .
for the General Electric Company and in 1969 for General Instruments. From 1970 to June 1972, he attended Pennsylvania State University, majoring in Electrical En- gineering. He received the degree of Associate in Engi- i
neering in 1975. He joined RCA Laboratories in 1972, r 1 f
working first on the electron -beam disc recorder. When the decision was made to master VideoDiscs electromechanically, he was responsible for converting the electron -beam recorder to a scanning electron microscope that could be used to nondestructively examine the surface of VideoDisc masters. Beginning in 1978, he worked on VideoDisc cutterheads, including manufacturing techniques and specialized fixtures. He was respon- sible for training production personnel and for setting up an operating cutter - head production area. He is presently working on optimizing cutterheads and is responsible for the resharpening of the diamond cutter used in the VideoDisc cutterhead.
He has received two RCA Laboratories outstanding achievement awards and is a member of the Tau Alpha Pi national honorary society.
RCA Review Vol. 43 March 1982 269

Ronald T. Smith joined RCA Laboratories as a Research Technician in 1963 after receiving a BS in Physics from Moravian College of Bethlehem, Pa. He has studied as a part-time graduate student in the Department of Materials Science of the University of Pennsylvania completing three courses and the basis for a Masters Thesis. The .. Masters Thesis work has involved the solving of the f crystal structure of YWO2CI. He is presently a member of the Materials Characterization Group specializing in sin- /
A gle-crystal x-ray diffraction studies. This area includes Laue, Weissenberg, pole -figure, and diffractometry techniques as well as computerrelated data reduction programming. He has recently concentrated on the means for the characterization and qualitative comparison of thin films.
Philip Stein holds a Bachelor of Arts degree in Physics from Columbia College and a Master of Science degree in Measurement Science from George Washington Uni- versity. He is a member of the technical staff assigned to the Manufacturing and Product Assurance group, Ad- vanced Systems Laboratory at RCA Laboratories, Prince- - ton, New Jersey. He specializes in the use of measure- ment science and statistics for making high quality mea- surements both in the laboratory setting and in manufac- turing. He has wide experience in the use of small com- puters for measurements, including fifteen years with the National Bureau of Standards, and he consulted extensively in that field before joining RCA.
Raymond L. Truesdell received a B.S. degree in Electri- cal Engineering from Pratt Institute in June 1954 and has been associated with RCA since that time. From 1954 to 1968 he worked at RCA facilities in Camden, NJ and was primarly involved in the design of AM/FM stimulus equip- ment and magnetic recording. He joined RCA Laborato- J - ries in 1969 to work on VideoDisc systems research. This work involved development of the research model VideoDisc player and presently involves VideoDisc cut- terhead testing techniques. He received an RCA Labo- ratories Outstanding Achievement Award in 1978 for "a team effort on tracking performance of the VideoDisc pickup."
John Valachovic joined RCA Astro -Electronics in 1959 working on the Tiros, Nimbus, and other weather space- craft. In 1967, he transferred to RCA Laboratories, Princeton, NJ, to work for the Material Research Group. In 1971, he started work on the VideoDisc program, in particular, the electron -beam recorder and applications of the scanning electron microscope. He also headed a development area working on the improvement and man- ufacturing of mechanical cutterheads. Mr. Valachovic has received several Achievement Awards.
270 RCA Review Vol. 43 March 1982
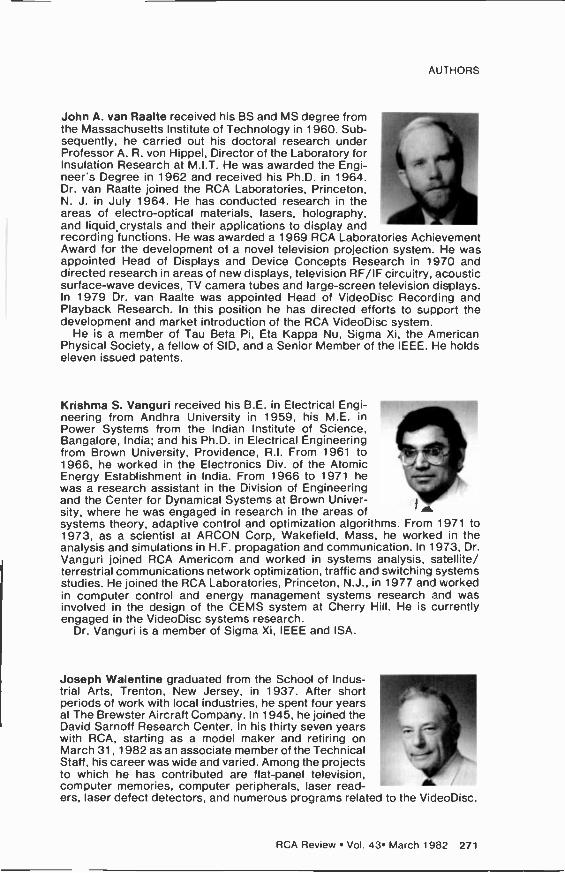
AUTHORS
John A. van Raalte received his BS and MS degree from the Massachusetts Institute of Technology in 1960. Sub- sequently, he carried out his doctoral research under Professor A. R. von Hippel, Director of the Laboratory forI,
Ask Insulation Research at M.I.T. He was awarded the Engi- neer's Degree in 1962 and received his Ph.D. in 1964. Dr. van Raalte joined the RCA Laboratories, Princeton, 1. N. J. in July 1964. He has conducted research in the areas of electro -optical materials, lasers, holography, and liquid, crystals and their applications to display and recording functions. He was awarded a 1969 RCA Laboratories Achievement Award for the development of a novel television projection system. He was appointed Head of Displays and Device Concepts Research in 1970 and directed research in areas of new displays, television RF/IF circuitry, acoustic surface -wave devices, TV camera tubes and large -screen television displays. In 1979 Dr. van Raalte was appointed Head of VideoDisc Recording and Playback Research. In this position he has directed efforts to support the development and market introduction of the RCA VideoDisc system.
He is a member of Tau Beta Pi, Eta Kappa Nu, Sigma Xi, the American Physical Society, a fellow of SID, and a Senior Member of the IEEE. He holds eleven issued patents.
Krishma S. Vanguri received his B.E. in Electrical Engi- neering from Andhra University in 1959, his M.E. in Power Systems from the Indian Institute of Science, Bangalore, India; and his Ph.D. in Electrical Engineering from Brown University, Providence, R.I. From 1961 to 1966, he worked in the Electronics Div. of the Atomic Energy Establishment in India. From 1966 to 1971 he was a research assistant in the Division of Engineering and the Center for Dynamical Systems at Brown Univer- sity, where he was engaged in research in the areas of systems theory, adaptive control and optimization algorithms. From 1971 to 1973, as a scientist at ARCON Corp, Wakefield, Mass, he worked in the analysis and simulations in H.F. propagation and communication. In 1973, Dr. Vanguri joined RCA Americom and worked in systems analysis, satellite/ terrestrial communications network optimization, traffic and switching systems studies. He joined the RCA Laboratories, Princeton, N.J., in 1977 and worked in computer control and energy management systems research and was involved in the design of the GEMS system at Cherry Hill. He is currently engaged in the VideoDisc systems research.
Dr. Vanguri is a member of Sigma Xi, IEEE and ISA.
Joseph Walentine graduated from the School of Indus- trial Arts, Trenton, New Jersey, in 1937. After short periods of work with local industries, he spent four years at The Brewster Aircraft Company. In 1945, he joined the David Sarnoff Research Center. In his thirty seven years with RCA, starting as a model maker and retiring on March 31, 1982 as an associate member of the Technical Staff, his career was wide and varied. Among the projects to which he has contributed are flat -panel television, ití computer memories, computer peripherals, laser read- ers, laser defect detectors, and numerous programs related to the VideoDisc.
RCA Review Vol. 43 March 1982 271

Chin -Chun Wang received his B.S. degree (1955) in Chemical Engineering from the National Taiwan Univer- sity, Taiwan, China, the M.S. degree (1959) in Chemical Engineering from Kansas State University, and Ph.D. degree (1962) in Physical Chemistry from Colorado State University. From 1962 to 1963 he received post -doctoral training in physical chemistry at the University of Kansas. In 1963 Dr. Wang joined the research staff of RCA Laboratories where he has been engaged in research on .* synthesis and characterization of a wide variety of elec- tronic materals, including wide-bandgap III -V semiconductors, ferromagnetic transition -metal oxides, refractory dielectrics, thin-film polymers, and thin-film photoconductors. Many of these studies have led to the realization of practical devices in the areas of photoemission, electro -optics, video systems, and integrated electronics. Dr. Wang's specialized research interest and experi- ence are in the fields of (1) crystal growth and vapor -phase deposition of electronic materials, (2) thermodynamics and kinetics of thin-film systems, (3) physics and chemistry of surfaces and thin films, and (4) vacuum science and technology. Dr. Wang received five RCA Laboratories Achievement Awards and was appointed a Fellow of the Technical Staff in 1973.
Dr. Wang is a member of the American Chemical Society, American Physical Society, American Vacuum Society, The Electrochemical Society, Sigma Xi, Sigma Pi Sigma, and Phi Lambda Upsilon. He is listed in American Men of Science, Leading Men in the United States of America, Who's Who in the East, and International Biography of Contemporary Achievement.
C. A. Whybark joined RCA Service Co. in 1955. He served as an electronics instructor, a technical writer and editor, and a field engineer on projects Boresight, Pan - gloss, and Sanguine. He was a design engineer for NASA on the Houston Solar Simulator Project, and later worked on SelectaVision Holotape and VideoDisc Projects. He transferred to RCA Laboratories, Princeton, NJ, in 1973, where he has contributed to the design and building of c S+'. three generations of VideoDisc recorders. He presently has responsibility for operation of the Laboratories' elec- tromechanical recorder lathe.
He received a Meritorius Service Award as an instructor and two for contributions to the VideoDisc program.
Richard Williams received the AB in Chemistry from Miami University and his PhD in Physical Chemistry from Harvard University. He joined RCA Laboratories in Princeton, New Jersey, in 1958, and is now a Fellow of the Laboratories. Dr. Williams has worked in the fields of - liquid crystals, semiconductor -electrolyte interfaces, in- ternal photoemission, properties of electrons on the sur- face of liquid helium, and crystallized suspensions of polystyrene microspheres. He discovered the domain structure produced in nematic liquid crystals by appli- cation of an electric field, a structure that was subsequently named "Williams domains." He demonstrated that most compound semiconductors, in contact with an electrolyte solution, decompose on illumination and formulated the currently accepted model to explain this. In addition, this work showed that the semiconductor -electrolyte system is often a close approximation to an
272 RCA Review Vol. 43 March 1982

AUTHORS
ideal blocking contact and can be used to establish extraordinarily high electric fields in semiconductors. Thus it became possible to make the first observation of the Franz-Keldysh electro -optic effect and to elucidate the mechanism of dielectric breakdown in CdS and ZnO. Dr. Williams also pioneered in the use of internal photoemission as a tool for determining the properties of metal -semiconductor and metal -insulator interfaces, and dem- onstrated both electron and hole photoemission. This was used to establish the energy -band relations at the silicon-Si02 interface and to determine the concentration and properties of electron traps in the oxide. Together with a colleague, he developed the corona charge method for observing effects of very high electric fields in Si02. This was used to determine the dielectric breakdown field strength of oxide and to observe the motion of impurity ions in the oxide at room temperature. Scanning photoemission measurements were used to show that there are often lateral inhomogeneities in the distri- bution of impurity ions in the oxide and to relate this to device failure.
Dr. Williams has received several achievement awards at RCA Laboratories and shared in the David Sarnoff Team Award in Science in 1969. He was a visiting scientist at the RCA Zurich Laboratory in 1963, a Fulbright Lecturer in Sao Carlos, Brazil, a summer school lecturer at Instituto Politecnico Nacional in Mexico, and a visiting lecturer at Princeton University. He is a Fellow of the American Physical Society and a Corresponding Member of the Brazilian Academy of Sciences. Dr. Williams is now working on methods for energy storage and applications of solar energy.
J. Rogers Woolston received the BSE degree from Princeton University in 1955, in a combined program of electrical engineering and physics. He spent the sum- mers of 1952 and 1953 at RCA Laboratories, and the following summer at Bell Telephone Laboratories, work- ing primarily on semiconductor devices. Since 1955 he has been with RCA Laboratories, working initially on materials research in both thermoelectrics and interme- tallic compound semiconductors. He received a U.S. Patent on a power transistor design, and designed and developed the first successful Czochralski growth apparatus for GaAs. In 1958 he became a member of the Materials Characterization Research Laboratory where he specialized on various aspects of solids mass spectrog- raphy and on computer processing of analytical data. This experience in- cluded the design, development and improvement of equipment and tech- niques for thermal vaporization analysis and rf spark -source analysis. In addition, he developed many programs for the RCA 601 and Spectra 70 computers as aids to both analysis and research with the MS7 mass spectro- graph, and for xray diffractometry. He designed special-purpose interfaces for RCA's time-sharing system to automate the collection of data for analytical instrumentation. In 1973 he helped found the Laboratory Automation Activity. In 1978, Mr. Woolston joined the Manufacturing Systems and Technology Laboratory where he designed automation systems for a wide range of manufacturing applications. In 1979 he was selected to be part of the newly - formed Systems Evaluation Research Laboratory where he is currently in- volved in the design of automation systems for the manufacturing and testing of VideoDisc discs and styli. He was one of the designers of the VideoDisc Test Center at RCA Laboratories.
In 1973 he received an RCA Outstanding Achievement Award for his work on computerized data acquisition of analytical data. Mr. Woolston is a member of the American Society for Mass Spectrometry and has served on several of its sub -committees.
RCA Review Vol. 43 March 1982 273


-

i
i

-

I