Studies into the Formation of PBDEs and PBDD/Fs in the Iron Ore Sintering Process
1
Emissions of PCDD/Fs, PBDD/Fs, dioxin like-PCBs and PAHs
from a cement plant using a long-term monitoring
system
Juan A. Conesaa*, Nuria Ortuñoa, Esteban Abadb, Joan Rivera-Austruib
a Chemical Engineering Department. University of Alicante. P.O. Box 99, 03080 Alicante, Spain. Phone: +(34) 96 590 38 67 Fax: +(34) 96 590 38 26 b Laboratory of Dioxins, Environmental Chemistry Department, IDAEA-CSIC, Jordi Girona 18-26, Barcelona 08034, Spain
*Author email address: [email protected]
ABSTRACT
The aim of the present work was to assess the emission of different persistent organic
pollutants from a cement plant over a period of one year, under normal operational
conditions. Thus, a long-term sampling device was installed in the clinker kiln stack of the
cement plant. The factory uses petroleum coke as primary fuel, but also alternative fuels
such as solid recovered fuel (SRF), automotive shredder residue (ASR), sewage sludge,
waste tires, and meat and bone meal (MBM) wastes, with an energy substitution level of
about 40 %. Both PCDD/Fs (together with dl-PCBs) and PBDD/Fs were continuously
sampled, with a total of ten samples collected in 2-4 week periods. Also, PAHs were
sampled during one-week periods, in order to evaluate their emissions in three different
samples. The emission levels throughout the year were much lower than the set legal limits
in all substances, being < 10 pg I-TEQ /Nm3 in the case of PCDD/Fs. The data obtained
allowed calculation of updated emission factors for the cement sector, which were 8.5 ng I-
TEQ/ton clinker for PCDD/Fs and 3.2 ng WHO-TEQ/ton clinker for PCBs. With respect to
the congener distribution, 2,3,7,8-TCDF accounts for 60 to 68 % of the total toxicity for

2
PCDD/Fs, and in PBDD/F emissions, a clear predominance of octa-substituted species (both
dioxin and furan) was found.
Keywords: waste; co-combustion; stack sampling; brominated pollutants; dioxin like-
PCBs.
1. INTRODUCTION
Waste management comprises a set of operations, such as the collection,
transport, recovery and disposal of waste, including the supervision of such operations
and the after-care of disposal sites (European Commission, 2008). These operations are
carried out in order to give the most appropriate destination to the waste produced in a
particular area according to their characteristics and marketing opportunities, cost
treatment and legal regulations (Conesa et al., 2011).
In the cement industry, there is a need for using solid wastes as supplementary
fuel or as raw material substitute, as it is known to achieve a complete and safe
destruction of wastes, with a simultaneous benefit of getting energy (Conesa et al.,
2008). A great variety of wastes are currently used as supplementary fuels in cement
kilns (Rahman et al., 2015; Rodrigues and Joekes, 2011). Basic research is still needed
because the wastes are actually burned, but the thermal decomposition of such wastes
has not always been studied from a scientific point of view (Conesa et al., 2011). Under
adequate conditions, concrete can be used for encapsulation of waste materials such as
tyres, plastics and glasses (Rodrigues and Joekes, 2011).
The reduction on the emission of POPs regulated by the Stockholm Convention
concerns the control of 26 substances consisting of pesticides, industrial chemicals, and
3
unintentional by-products, such as hexachlorobenzene (HCB), pentachlorobenzene,
polychlorinated naphthalenes and the highly toxic polychlorinated dibenzo-p-dioxins
(PCDDs), polychlorinated dibenzofurans (PCDFs) and polychlorinated biphenyls
(PCBs) (UNEP, 2009). In the Convention, there is a mention to the sources “that have
the potential for comparatively high formation and release of these chemicals to the
environment”; the list includes waste incineration plants, cement kilns coprocessing
hazardous wastes, pulp production, and some thermal processes in the metallurgical
industry.
PCDD/Fs have been the target of several studies in the last decades and are well
known as unintentionally generated POPs, which pose serious health and environmental
risks on a global scale (Du et al., 2010; UNEP Chemicals, 2005). Their brominated
homologues (PBDD/Fs) present the same structure but are halogenated with bromine
atoms instead of chlorine atoms and therefore have similar properties and effects to
PCDD/F (Birnbaum et al., 2003; Conesa and Ortuño, 2014; Olsman et al., 2007).
In comparison to PCDD/Fs, little is known about the occurrence and levels of
emissions of the brominated species, maybe due to their analytical difficulties, (Du et
al., 2010; Hagberg, 2009). PBDD/Fs have been found in matrices such as air, sediments,
marine products, and human adipose samples (Choi et al., 2003; Li et al., 2008;
Malmvärn et al., 2005; Wang and Chang-Chien, 2007). Since the use of brominated
flame retardants (BFRs) became extensive, especially for polybrominated diphenyl
ethers (PBDEs) and tetrabromobisphenol A (TBBPA), more brominated sources are
available and there is an increased chance of PBDD/F formation in both natural
environment and industrial processes (Du et al., 2010; Ortuño et al., 2014b). According
4
to the United Nations Environment Programme, the unintentional formation and
emission of brominated POPs/by-products (such as PBDD/Fs) from cement kilns were
not studied or reported in 2010 (UNEP, 2010), and this is still true today since there are
no studies available on this topic in literature.
Different studies have investigated the environmental impact of alternative fuels
in the cement industry. In 2004, cement plants in EU 27 countries mostly complied with
the emission limit of 100 pg I-TEQ/Nm3 set for incineration and co-incineration plants,
independently of the thermal substitution rate (European Commission, 2000; Rivera-
Austrui et al., 2014). In Spain, measurements from the period 2000-2003 at 41 kilns
using different waste fuels showed that the emission values were similar for plants using
only conventional fuel and other plants using alternative fuels (Fabrellas et al., 2004). In
2011, Conesa et al. found much lower values (5 pg I-TEQ/Nm3) than the limit set by the
European regulations when monitoring a clinker kiln fired with solid recovered fuel
(SRF) from municipal solid waste, and no correlation was found between SRF feeding
rate and dioxin emissions (Conesa et al., 2011). Other studies on the effect of increasing
the alternative fuel feeding rate reported no direct influence on dioxin and furan
emissions when using tyres and sewage sludge (Conesa et al., 2008) or meat meal and
tires (Abad et al., 2004). Meat and bone meal has been revealed to be the best
alternative fuel option in places as Australia (Rahman et al., 2015). In addition, a
comparative life cycle assessment has been carried out on the use of sewage sludge in
clinker production (Valderrama et al., 2013), and a significant environmental
improvement has been detected, compared to the non-substitution scenario. A global
mass balance of dioxins in a cement plant indicated that there is a net destruction of
such pollutants (Li et al., 2015). Wurst and Prey (2003) and Karstensen (2008) indicated

5
that the material used as fuel in industrial furnaces was not responsible for the dioxin
emissions. The conditions of the furnace (very high temperature, good mixing and
excess oxygen) make the cement kiln factory an ideal place to get a very good
combustion.
PCDD/F emissions might vary significantly over time, showing considerably
higher values under unstable conditions such as plant start-up or shut-down (Löthgren
and Van Bavel, 2005; Tejima et al., 2007; Wang et al., 2007). However, the
aforementioned studies were almost all based on PCDD/F analysis from short-term
manual sampling measurements in the clinker kiln stack. Online determination of
PCDD/Fs and dl-PCBs in the stack would be desirable, but is not feasible with current
technology (Rivera-Austrui et al., 2014).
A continuous monitoring system presents many advantages in comparison to
short-term sampling. On the one hand the data is obtained in a continuous sampling of
flue gas covering the total operation periods, being therefore more representative. On
the other hand, larger sample volumes are involved in the analysis, allowing to lower
LODs, enhancing the capacity to characterize profile information (Rivera-Austrui et al.,
2014).
Other authors (Vicaretti et al., 2012) highlight the limitations of long-term
sampling, as is the fact that emission levels detected in 15-30 days campaigns, when
unsteady operating conditions can occur, as start-up and shut down, are not immediately
comparable to the typical levels in a 6-8 h, when operating conditions are normally
more stable. Moreover, there are often differences observed in the congener profiles
between short- and long-term campaigns. Furthermore, as the main objective of the

6
present work is to assess the emission levels in normal plant operation, this limitation is
of minor importance.
The present study presents a report on the emissions of long-term monitoring of
PCDD/Fs, dl-PCBs, PBDD/Fs and PAHs (polycyclic aromatic hydrocarbons) in a
clinker kiln stack. The sampling was extended over one year of normal operational use
of the cement plant, considering this time period would be sufficiently long to get a
representative view of the emission levels of the plant. As far as we know, there is no
study that considers long-term sampling and analysis of brominated dioxins and furans
from a cement plant. In this way, the present study will allow: to characterize the
pollutant emissions from a cement plant, providing new information especially with
regard to PBDD/F emissions; to obtain a more comprehensive and representative
emission profile, compared to a short-term sampling, using a long-term monitoring
device for one whole year; to calculate more realistic and updated average emission
factors for the cement industry; and to evaluate whether the use of alternative fuels has
an influence on the emissions of persistent organic pollutants.
2. MATERIALS AND METHODS
2.1.Case study
The factory has a production capacity of 150 t/h of clinker and uses petroleum coke as
primary fuel, but also alternative fuels like SRF (solid recovered fuel), ASR
(automotive shredder residue), sewage sludge, waste tyres, and meat and bone meal
7
wastes, with an energy substitution level of about 40 %. The 71 m rotary kiln is
equipped with an 8-stage cyclone pre-heater of 76 m high, and the flue gas treatment
consists of a battery of baghouse filters working at a maximum temperature of 170 ºC.
The work started with the installation of a long-term sampling device in the clinker
kiln stack. The monitoring of PCDD/F, dl-PCB, PBDD/F and PAH emissions started in
August 2013, and emission samples were regularly collected and sent to the laboratory
for further analysis.
2.2.Sampling campaigns
The study consisted of a total of 13 samples: ten samples (named DIOXIN1 to
DIOXIN10) collected in 2-4 week periods, for the determination of PCDD/Fs, dl-PCBs
and PBDD/Fs; and three samples (named PAH1 to PAH3) collected during one-week
periods, for the determination of PAHs. Table 1 shows the most important data of the
different samplings done, together with the percentages of the different fuels fed to the
clinker furnace (percentages are energy-based).
The automatic long-term sampling device is a DioxinMonitoringSystem®
(MonitoringSystems, Austria) and works according to the dilution method described in
EN-1948:1 (CEN, 2006). Some of the advantages of this particular method are dry
sampling (avoids humidity condensation inside the filter or adsorber), complete
sampling of the dust fraction with high efficiency, use of low sampling temperatures
(prevents further reactions, losses or formation, to occur) and measuring with two
probes at two different positions (avoids traversing). The system has been described in
detail previously (Rivera-Austrui et al., 2014; Steiner, 2003) and allows the continuous

8
isokinetic sampling for periods of up to several weeks, in contrast to 6-8 hour manual
sampling methods. The sampling system was set up to automatically stop when the flue
gas was below 70 °C for 4 min, and restart once this value had been above 70 °C for
15 min, in order to avoid sampling during plant outages.
At the end of each sampling period, the cartridge containing the adsorbent media (a
corrugated particle filter and two dry polyurethane foams separated by a layer of 20 g of
Amberlite XAD-2 resin) was sent to the laboratory for further analysis together with the
sampling data (average filter temperature, relative flue gas humidity, oxygen content
and sampling volumes, among others). The whole sampling process was controlled by
the addition of a mixture of the standard solutions over the XAD-2 resin. During
PCDD/F, PBDD/F and dl-PCB sampling EN-1948SS, P48-SS (Wellington
Laboratories, Canada), and EF-5410 (Cambridge Isotope Laboratories, USA) standards
were used containing: 4000 pg of both 13C-1,2,3,7,8-PeCDF and 13C-1,2,3,7,8,9-
HxCDF, and 8000 pg of 13C-1,2,3,4.7,8,9-HpCDF for PCDD/Fs; 10000 pg of each
of 13C-PCB-60, 13C-PCB-127 and 13C-PCB-159 for dl-PCBs; 4000 pg 13C-2,4,6,8-
TBDF for PBDD/Fs. For PAH sampling, deuterated PAHs were used as sampling
standards, specifically 150 µL of standard solution L429-SS (Dr. Ehrenstorfer-Schäfers,
Germany) containing 20 µg of each fluorine-d10 and p-terphenyl-d10.

9
Table 1. Details on the different samplings done together with the rates of alternative fuels fed to the clinker furnace (percentages are energy-1
based). 2
3
DIOXIN1 DIOXIN2 DIOXIN3 DIOXIN4 DIOXIN5 DIOXIN6 DIOXIN7 DIOXIN8 DIOXIN9 DIOXIN10 PAH1 PAH2 PAH3
Instalation date 06/08/2013 18/09/2013 30/10/2013 15/01/2014 03/02/2014 21/02/2014 18/03/2014 09/04/2014 30/04/2014 20/06/2014 15/11/2013 11/03/2014 13/06/2014Sampling time (days) 43 42 16 19 18 18 22 21 16 34 6 7 7Filter temp (ºC) 49 51 49 48 48 48 48 50 50 53 48 49 54sampled flue gas (m3,nc,wet) 549.6 876.1 375.8 584.7 508.8 546.0 638.3 524.7 503.0 578.8 130.0 208.9 178.6 (m3,nc,dry, 10% O2) 375.9 646.6 294.2 515.7 457.9 471.7 545.7 434.4 457.2 448.0 104.1 174.9 147.9Clinker production (Tn) 70289 97003 46703 60702 50954 49123 60503 56577 44238 88924 16110 24114 18890
% Petroleum coke 40.4 35.7 47.1 56.5 61.7 60.3 59.0 64.2 61.7 62.7 62.0 55.9 58.2
% meat and bone meal 6.0 5.1 2.1 3.0 1.8 1.4 2.0 1.3 2.8 1.0 3.9 0.9 5.4
% tyre 8.4 7.4 7.3 5.3 13.6 9.1 8.9 7.8 6.5 4.0 7.3 6.7 2.0
% sewage sludge 5.4 4.8 3.3 4.4 3.6 2.9 3.5 4.0 3.2 4.4 3.0 3.1 4.6
% automotive shdreder waste 1.4 0.7 0.2 0.0 0.0 0.5 2.6 3.0 3.5 0.5 0.6 4.4 0.0
% solid recovered fuel 38.4 46.4 40.0 30.8 19.3 25.9 24.1 19.6 22.2 27.4 23.3 28.9 29.8
sum % alternative fuels 59.6 64.3 52.9 43.5 38.3 39.7 41.0 35.8 38.3 37.3 38.0 44.1 41.8Fuel
mix
(ene
rgy-
base
d %
)
10
2.3.Analytical procedure
2.3.1. Dioxins and dioxin like compounds
The analytical procedure used for the analysis of these pollutants has been adapted
from a previous work (Rivera-Austrui et al., 2012). Sampling media (segmented
polyurethane foams, Amberlite and filter) were spiked with labelled compounds,
submitted to acid digestion with 3 M HCl and then Soxhlet extracted with toluene
(Merck, Germany) for 24 h. Acid treatment with 3 M HCl for 2 h is necessary in order
to break the matrix and remove PCDD/Fs and dl-PCBs from the particulate matter.
Prior to extraction, sampling adsorbent media were spiked with different standard
solutions containing: 4000 pg of tetra- to hexa-labeled compounds and 8000 pg of
hepta- to octa-labeled compounds for PCDD/Fs (EN-1948ES standard solution,
Wellington Laboratories, Canada) and 10000 pg of each labeled congener for dl-PCB
(P48-W-ES standard solution, Wellington Laboratories, Canada). Also 40 µL of the
standard mixture EDF-5408 (Cambridge Isotope Laboratories, USA) was used to verify
the extraction of brominated dioxins and furans. An aliquot of 5 % of the extract is used
for PCDD/F and PCB analysis (Rivera-Austrui et al., 2012), while an aliquot of 50 %
was used for PBDD/F analysis, since lower levels of these contaminants were expected.
For chlorinated species analysis, clean-up and fractionation of the aliquot consisted of
a prior manual step (acidic/basic silica column) followed by an automated clean-up step
on a Power Prep™ system (FMS, Inc., USA). Prior to the injection, a mixture of the
labelled recovery standard solutions EN-1948IS and P48-RS (Wellington Laboratories,
Canada) was added to the samples, containing 400 pg of 13C-1,2,3,4-TCDD and 13C-

11
1,2,3,7,8,9-HxCDD, and 1000 pg of each labelled PCB-70, PCB-111, and PCB-170,
respectively. Samples were analyzed in an Agilent gas chromatograph fitted with a DB-
5MS or DB-XLB fused silica column (J&W Scientific, USA) for PCDD/Fs and dl-
PCBs respectively, coupled to an Autospec Premier high resolution mass spectrometer
(Waters, UK).
For brominated dioxin and furan analysis, the extracts were purified using a Power
Prep system with silica gel, alumina, and active carbon pre-packed columns, with the
addition of a previous acidic silica JUMBO column as an extra clean-up step. The
extracts were concentrated in a rotary evaporator and with a gentle stream of nitrogen,
and EDF-5409 (Cambridge Isotope Laboratories, USA) was added as recovery
standard, containing 5000 pg of 13C-1,2,3,7,8,9-HxBDD and 2000 pg of 13C-1,2,3,7,8-
PeBDF. Analysis was performed by gas chromatography coupled to high resolution
mass spectrometry (HRGC-HRMS) using an Autospec Ultima NT mass spectrometer
(Waters, UK) as explained in previous work (Ortuño et al., 2014a), using a DB-5MS
capillary column (15m x 0,25mm x 0,10µm). PBDD/F recoveries were all within the
limits stated by the US EPA method 1613 (see Table S1 in the Supplementary material).
Identification and quantification of the analytes were performed according to the
isotope dilution method. For the analysis of the brominated species, samples were
protected from light, using amber quartz or aluminium foil, in order to minimize
photodegradation.

12
2.3.2. Polycyclic aromatic hydrocarbons (PAHs)
To determine the concentration of PAHs in the samples, an internal standard (5 µl of
deuterated PAH Mix 26, Dr. Ehrenstorfer, Germany) was added to the resin before
Soxhlet extraction for 24 h in a mixture of dichloromethane-hexane (1:1), following the
U.S. EPA method 3540C (US EPA, 1996). The extract was purified by eluting the
sample through a manual activated silica column.
The clean extract was concentrated in a rotary evaporator and with a moderate stream
of nitrogen up to 1.5 ml. Lastly, 3 µl of a solution 2000 µg/ml anthracene-d10 was
spiked to the vials as a recovery standard. These compounds were analyzed by HRGC-
MS in the SCAN mode in an Agilent system (6890N gas chromatograph coupled to a
5973N mass spectrometer), with an HP5-MS column (30 m x 0.25 mm i.d. x 0.25 mm)
using the U.S. EPA method 8270D as reference (US EPA, 2007). The identification and
quantification was carried out for the 16 priority PAHs established by the U.S. EPA
(1998).
3. RESULTS AND DISCUSSION
Table 2 presents the results of the analysis of the chlorinated contaminants obtained in
the campaigns shown before in Table 1. Table 3 presents the corresponding brominated
dioxin and furan emissions. Emission values are expressed in the basis of normal cubic
meters (Nm3); the total amounts are expressed in toxicity units (I-TEQ for dioxins and
WHO-TEQ for PCBs) and are referred to the volume of stack gas (pg/Nm3) and to the
amount of clinker produced (ng/ton clinker).
13
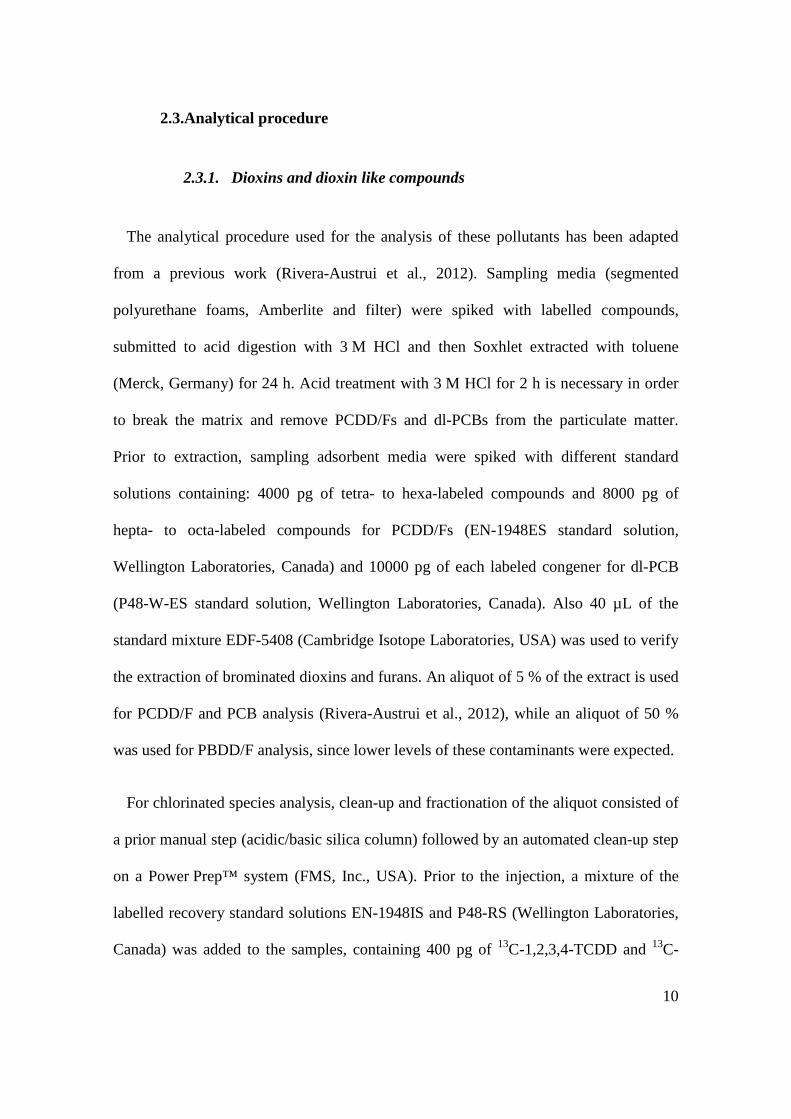
Table 2. PCDD/F and dl-PCB concentrations in 10 sampling periods, referred to the volume of stack gas (pg/Nm3) and to the amount of clinker
produced (ng/ton clinker).
DIOXIN1 DIOXIN2 DIOXIN3 DIOXIN4 DIOXIN5 DIOXIN6 DIOXIN7 DIOXIN8 DIOXIN9 DIOXIN10
PCDD/Fs (pg/Nm3) 2,3,7,8-TCDF 64.6 47.7 14.0 28.3 11.2 17.1 20.8 11.9 6.09 40.0 1,2,3,7,8-PeCDF 3.80 3.25 0.75 1.93 0.75 2.07 1.48 0.67 0.39 2.98 2,3,4,7,8-PeCDF 4.08 2.84 0.74 2.46 0.90 0.87 1.18 0.63 0.40 3.05 1,2,3,4,7,8-HxCDF 0.51 0.29 0.08 0.39 0.10 0.38 0.19 0.11 0.11 0.55 1,2,3,6,7,8-HxCDF 0.43 0.30 0.09 0.32 0.08 0.22 0.15 0.09 0.10 0.50 2,3,4,6,7,8-HxCDF 0.40 0.20 0.06 0.32 0.09 0.12 0.14 0.10 0.10 0.59 1,2,3,7,8,9-HxCDF 0.08 0.11 0.07 0.10 0.08 0.10 0.08 0.12 0.12 0.09 1,2,3,4,6,7,8-HpCDF 0.46 0.18 0.07 0.29 0.26 0.25 0.22 0.28 0.26 0.39 1,2,3,4,7,8,9-HpCDF 0.32 0.03 0.07 0.23 0.26 0.25 0.22 0.28 0.26 0.27 OCDF 1.60 0.07 0.10 1.16 1.31 1.27 1.10 1.38 1.31 1.34 2,3,7,8-TCDD 0.79 0.70 0.16 0.26 0.16 0.12 0.31 0.15 0.07 0.32 1,2,3,7,8-PeCDD 0.18 0.12 0.07 0.11 0.06 0.09 0.06 0.06 0.06 0.31 1,2,3,4,7,8-HxCDD 0.08 0.04 0.06 0.10 0.06 0.08 0.06 0.07 0.05 0.19 1,2,3,6,7,8-HxCDD 0.19 0.08 0.06 0.14 0.06 0.08 0.07 0.07 0.04 0.28 1,2,3,7,8,9-HxCDD 0.11 0.02 0.07 0.10 0.07 0.08 0.07 0.07 0.04 0.18 1,2,3,4,6,7,8-HpCDD 0.88 0.46 0.10 0.61 0.27 0.58 0.48 0.34 0.26 0.71 OCDD 1.60 0.69 0.16 1.16 1.31 1.27 1.10 1.38 1.31 1.34
TOTAL PCDD/Fs I-TEQ (pg/Nm3) 9.77 7.23 2.05 4.63 1.85 2.53 3.17 1.80 0.99 6.41
TOTAL PCDD/Fs I-TEQ (ng/ton clinker) 20.46 15.14 4.30 9.70 3.88 5.30 6.64 3.77 2.08 13.42
dl-PCBs (pg /Nm3) PCB-81 53.7 45.2 34.8 65.9 45.5 18.3 41.8 25.2 18.8 109.8 PCB-77 476 398 300 714 182 192 356 428 199 1543 PCB-126 20.6 16.7 9.13 20.7 6.51 4.37 15.9 8.49 4.50 34.5 PCB-169 0.88 0.32 0.19 0.78 0.47 0.43 0.43 0.62 0.45 2.22 PCB-123 90.8 72.1 83.0 119 47.4 42.8 80.8 61.7 44.1 223

14
PCB-118 420 240 182 367 200 88.1 311 242 90.9 711 PCB-114 9.63 5.47 3.68 6.87 3.23 1.73 5.62 3.48 1.79 13.5 PCB-105 146 78.7 53.3 112 54.3 28.6 97.4 73.6 29.5 192 PCB-167 29.5 16.5 10.3 22.2 10.5 7.51 26.4 19.9 7.75 49.9 PCB-156 39.9 20.1 9.04 17.8 9.43 5.78 22.7 17.5 5.97 46.7 PCB-157 10.0 5.14 2.98 7.55 2.78 2.17 6.94 4.53 2.24 15.5 PCB-189 5.30 2.43 0.77 2.60 0.96 0.50 2.99 2.23 0.51 5.69
TOTAL PCBs WHO-TEQ (pg/Nm3) 2.22 1.78 0.99 2.23 0.72 0.48 1.70 0.95 0.50 3.79
TOTAL PCBs WHO-TEQ (ng/ton clinker) 4.65 3.72 2.07 4.68 1.50 1.01 3.56 1.99 1.04 7.93
Table 3. PBDD/F concentrations in 10 sampling periods, referred to the volume of stack gas (pg/Nm3) and to the amount of clinker produced
(ng/ton clinker).
DIOXIN1 DIOXIN2 DIOXIN3 DIOXIN4 DIOXIN5 DIOXIN6 DIOXIN7 DIOXIN8 DIOXIN9 DIOXIN10 PBDD/Fs (pg /Nm3) 2,3,7,8-TBDF 0.33 0.22 0.08 0.16 0.02 0.03 0.33 0.18 0.10 0.28 2,4,6,8-TBDF 0.63 0.53 0.07 0.11 0.06 0.10 0.15 0.10 0.03 0.00 1,2,3,7,8-PeBDF 0.10 0.09 0.23 0.04 0.002 0.05 0.08 0.01 0.10 0.03 2,3,4,7,8-PeBDF 0.11 0.09 0.31 0.03 0.003 0.04 0.07 0.004 0.08 0.06 1,2,3,4,7,8-HxBDF 0.18 0.20 0.27 0.02 0.01 0.02 0.03 0.01 0.06 0.13 1,2,3,4,6,7,8-HpBDF 0.39 0.40 0.47 0.15 0.05 0.12 0.11 0.05 0.04 0.18 OBDF 2.80 1.48 2.39 2.02 2.15 1.81 0.59 0.75 1.19 1.76 2,3,7,8-TBDD 0.02 0.03 0.04 0.003 0.001 0.004 0.04 0.02 0.004 0.01 1,2,3,7,8-PeBDD 0.04 0.05 0.15 0.004 0.002 0.01 0.004 0.004 0.003 0.06
1,2,3,4,7,8+1,2,3,6,7,8-HxBDD 0.43 0.34 0.82 0.01 0.01 0.02 0.02 0.01 0.01 0.23
1,2,3,7,8,9-HxBDD 0.10 0.16 0.28 0.01 0.01 0.01 0.01 0.01 0.01 0.02 1,2,3,4,6,7,8-HpBDD 0.48 0.41 0.78 0.24 0.35 0.12 0.23 0.12 0.37 0.12 OBDD 0.31 0.25 0.56 0.48 0.31 0.16 0.17 0.24 0.24 0.68
TOTAL PBDD/Fs I-TEQ (pg/Nm3) 0.21 0.20 0.44 0.05 0.01 0.04 0.12 0.05 0.08 0.14

15
TOTAL PBDD/Fs I-TEQ (ng/ton clinker) 0.45 0.42 0.91 0.10 0.03 0.09 0.25 0.10 0.16 0.29

16
The UNEP PCDD/Fs Toolkit (UNEP, 2005) assigns an emission factor of 50 ng I-
TEQ per ton of cement to all dry kilns and wet kilns where dust collector temperature is
held below 200 ºC. In this study, considering an estimated average emission factor of
2094 Nm3/ton clinker (value given by the cement plant factory), the emission factors are
8.5 ng I-TEQ/ton clinker for PCDD/Fs and 3.2 ng WHO-TEQ/ton clinker for PCBs,
both results are well below the value proposed by the United Nations. This is in
accordance with that observed in previous studies in the Spanish cement industry, where
real emission factors were found to be in the range 2.5 – 14.5 ng I-TEQ/ton clinker
(Fabrellas et al., 2005; Rivera-Austrui et al., 2014). On the other hand, an average value
for PBDD/Fs of 0.23 ng I-TEQ (equivalent)/ ton clinker can be given.
Figure 1 shows a comparison of the levels of PCDD/Fs, PBDD/Fs and PCBs, together
with the percentage of alternative fuels fed to the furnace during each sampling period.
The legal PCDD/F emission limit established in the Industrial Emissions Directive
(European Commission, 2010) has also been depicted in the figure to help put the data
into perspective.

17
Figure 1. Comparison of the emissions (ng/Nm3) of PCDD/Fs, PBDD/Fs and PCBs
during all sampling periods.
The results of the PCDD/F emissions can be compared to the emission limit of
100 pg/Nm3 set by the Industrial Emissions Directive (European Commission, 2010),
and is clear that the emission is in all cases very low, independently of the conditions of
the fuel mixtures fed to the clinker furnace. This behaviour has already been observed in
other factories in Spain, and reported by several authors (Abad et al., 2004; Fabrellas et
al., 2005; Rovira et al., 2010; Schuhmacher et al., 2004). The fact that the use of
alternative feedstocks is not related with an increase in dioxin emissions has also been
observed by others (Abad et al., 2004; Conesa et al., 2008; Conesa et al., 2011;
Fabrellas et al., 2005; Karstensen, 2008).

18
Figure 2 presents the congener distribution of PCDD/Fs obtained in all sampling
periods. A clear predominance of furans can be observed, specially of the 2,3,7,8-TCDF
that accounts for 60-68 % for the total toxicity of the different samples.
Figure 2. Congener distribution of PCDD/Fs obtained in all sampling periods.
The use of longer sampling periods and the large sample volume analyzed leads to a
major capacity for robust profile determination; very few congener values are below the
LOD. At first glance, there is a clear predominance of 2,3,7,8-TCDF and OCDD, as
previously reported for other clinker kilns (Abad et al., 2004; Ames et al., 2012; Rivera-
Austrui et al., 2014), independently of the use of alternative fuel. A recent study of the
emission of these compounds in China, reported that tetra- and hexachlorinated furans
were the two most abundant homologue groups, and that the homologue concentration
decreased with rising chlorine number for dioxin (Chen et al., 2014).
0%
10%
20%
30%
40%
50%
60%
70%
80%
90%
100%
DIOXIN1 DIOXIN2 DIOXIN3 DIOXIN4 DIOXIN5 DIOXIN6 DIOXIN7 DIOXIN8 DIOXIN9 DIOXIN10
OCDD
1,2,3,4,6,7,8-HpCDD
1,2,3,7,8,9-HxCDD
1,2,3,6,7,8-HxCDD
1,2,3,4,7,8-HxCDD
1,2,3,7,8-PeCDD
2,3,7,8-TCDD
OCDF
1,2,3,4,7,8,9-HpCDF
1,2,3,4,6,7,8-HpCDF
1,2,3,7,8,9-HxCDF
2,3,4,6,7,8-HxCDF
1,2,3,6,7,8-HxCDF
1,2,3,4,7,8-HxCDF
2,3,4,7,8-PeCDF
1,2,3,7,8-PeCDF
2,3,7,8-TCDF

19
Regarding dl-PCBs, Table 2 shows that the predominant congeners were PCB-118,
PCB-105, PCB-123 and PCB-77, precisely the same congeners shown in previous
studies of clinker kiln emissions (Rivera-Austrui et al., 2014).
On the other hand, PBDD/F emissions are not regulated by law in any country. Table
3 shows that for every sampling period, PBDD/F emission values were at least three
orders of magnitude below the limit established by the European Directive 2010/75/EU
for their chlorinated analogues. Total PBDD/F emission values ranged from 0.01 to 0.44
pg I-TEQ/Nm3, which are equivalent to 0.03 and 0.91 ng I-TEQ/ton clinker,
respectively. Because in the cement plant there is not availability of bromine, this rather
low value is expected; the only materials that might contain a slight amount of bromine
are automotive shredder residue or perhaps sewage sludge, but in very low amounts.
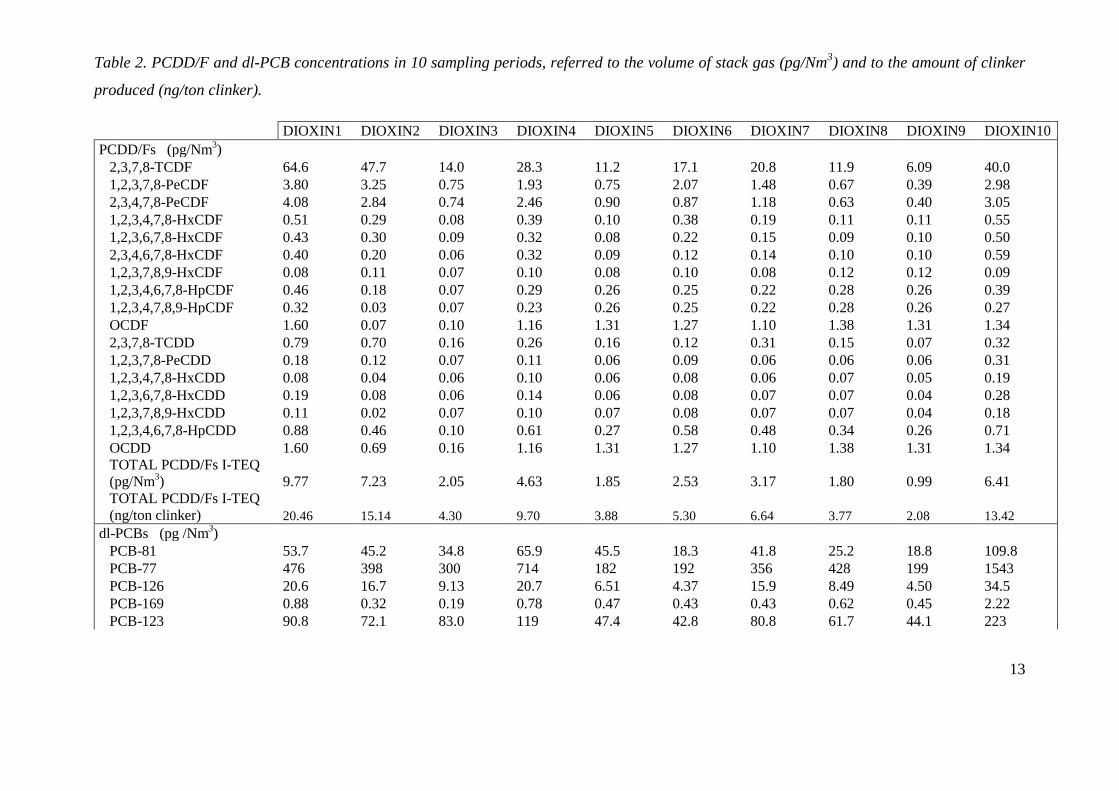
Figure 3 presents the congener distribution in the emission of brominated dioxins and
furans. In this case, a clear predominance of octa-substituted species (both dioxin and
furan) is found, followed by the emission of 1,2,3,4,6,7,8-HpBDD. In all sampling
periods a furan/dioxin ratio higher than one was measured, as it has been observed in
different incineration processes (Conesa and Ortuño, 2014). Only one more research
paper analyzing brominated dioxin emissions from cement kilns has been found (Yang
et al., 2012), but PBDE contaminated soils where fed to the kiln, which makes the
comparison difficult.
20
Figure 3. Congener distribution of PBDD/Fs obtained in all sampling periods.
Sixteen PAHs were analyzed, which are designated as priority pollutants by the U.S.
EPA, including seven that are considered carcinogenic: (benzo(a)anthracene,
benzo(b)fluoranthene, benzo(k)fluoranthene, benzo(a)pyrene, chrysene,
dibenzo(ah)anthracene, and indeno(1,2,3-cd)pyrene (US EPA, 1998). Of these
compounds, four have also been listed as substances subjected to emission reduction in
Europe: benzo(b)fluoranthene, benzo(k)fluoranthene, benzo(a)pyrene, and indeno(1,2,3-
cd)pyrene (European Council, 2004). The results are shown in Table 4 (see Table 1 for
details on the conditions of the sampling). The limit of detection of all PAHs (0.01 µg)
was set as the lowest detectable amount of compound, and was calculated by analysing
different standards with decreasing PAH concentrations.
0%
10%
20%
30%
40%
50%
60%
70%
80%
90%
100%
DIOXIN1 DIOXIN2 DIOXIN3 DIOXIN4 DIOXIN5 DIOXIN6 DIOXIN7 DIOXIN8 DIOXIN9 DIOXIN10
OBDD
1,2,3,4,6,7,8-HpBDD
1,2,3,7,8,9-HxBDD
1,2,3,4,7,8+1,2,3,6,7,8-HxBDD
1,2,3,7,8-PeBDD
2,3,7,8-TBDD
OBDF
1,2,3,4,6,7,8-HpBDF
1,2,3,4,7,8-HxBDF
2,3,4,7,8-PeBDF
1,2,3,7,8-PeBDF
2,4,6,8-TBDF
2,3,7,8-TBDF
21
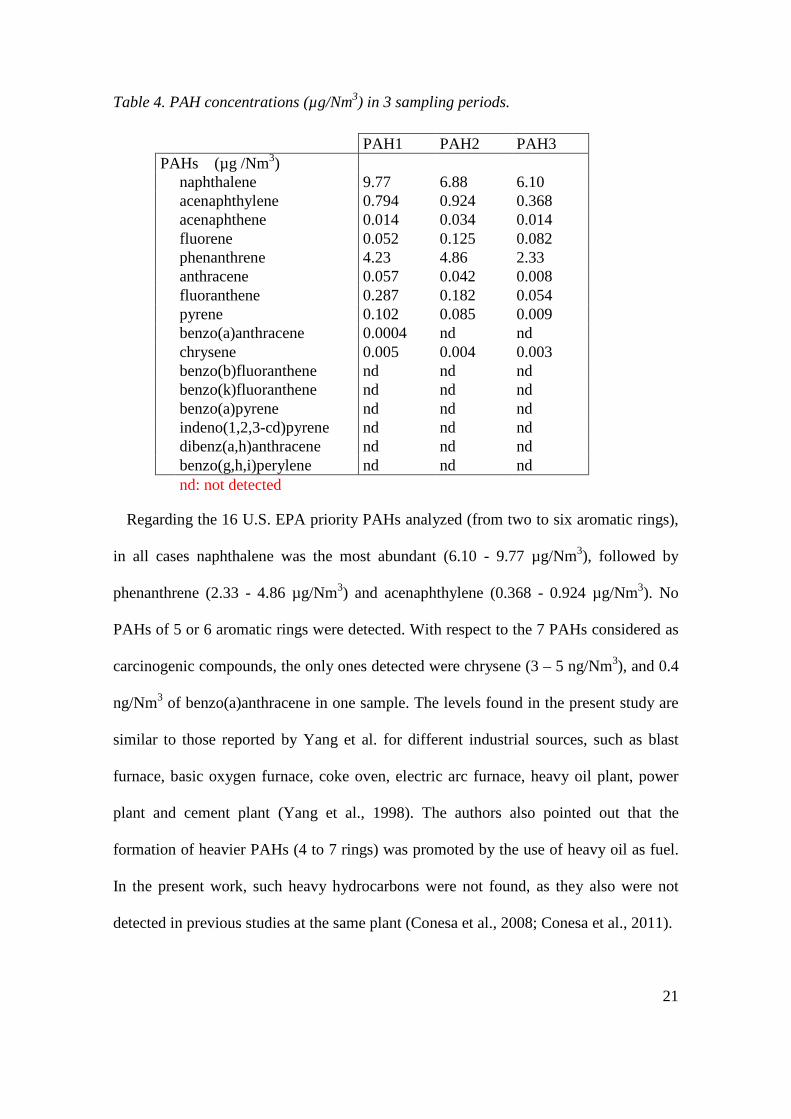
Table 4. PAH concentrations (µg/Nm3) in 3 sampling periods.
PAH1 PAH2 PAH3 PAHs (µg /Nm3) naphthalene 9.77 6.88 6.10 acenaphthylene 0.794 0.924 0.368 acenaphthene 0.014 0.034 0.014 fluorene 0.052 0.125 0.082 phenanthrene 4.23 4.86 2.33 anthracene 0.057 0.042 0.008 fluoranthene 0.287 0.182 0.054 pyrene 0.102 0.085 0.009 benzo(a)anthracene 0.0004 nd nd chrysene 0.005 0.004 0.003 benzo(b)fluoranthene nd nd nd benzo(k)fluoranthene nd nd nd benzo(a)pyrene nd nd nd indeno(1,2,3-cd)pyrene nd nd nd dibenz(a,h)anthracene nd nd nd benzo(g,h,i)perylene nd nd nd
nd: not detected
Regarding the 16 U.S. EPA priority PAHs analyzed (from two to six aromatic rings),
in all cases naphthalene was the most abundant (6.10 - 9.77 µg/Nm3), followed by
phenanthrene (2.33 - 4.86 µg/Nm3) and acenaphthylene (0.368 - 0.924 µg/Nm3). No
PAHs of 5 or 6 aromatic rings were detected. With respect to the 7 PAHs considered as
carcinogenic compounds, the only ones detected were chrysene (3 – 5 ng/Nm3), and 0.4
ng/Nm3 of benzo(a)anthracene in one sample. The levels found in the present study are
similar to those reported by Yang et al. for different industrial sources, such as blast
furnace, basic oxygen furnace, coke oven, electric arc furnace, heavy oil plant, power
plant and cement plant (Yang et al., 1998). The authors also pointed out that the
formation of heavier PAHs (4 to 7 rings) was promoted by the use of heavy oil as fuel.
In the present work, such heavy hydrocarbons were not found, as they also were not
detected in previous studies at the same plant (Conesa et al., 2008; Conesa et al., 2011).
22
The different samples collected in the present study yielded similar PAH amounts.
The legal limit set by the Waste Incineration Directive for total organic carbon (TOC) is
10 mg/Nm3, which includes the PAHs analyzed here (European Commission, 2000).
With total values ranging 0.009 – 0.015 mg/Nm3, it can be concluded that their
contribution to the emission of TOC is very slight.
In addition, no correlation was observed between the emission of any of the pollutants
measured and the degree of substitution with alternative fuels.
4. PRINCIPAL COMPONENT ANALYSIS
Two different Principal Component Analysis (PCA) were performed in the present
work, in an attempt to find correlations between the studied parameters, by using the
commercial software SPSS 15.0. On the one hand, the different concentrations of
PCDD/Fs obtained in each sampling series, together with the corresponding percentage
of petroleum coke, tires, meat and bone meal, sewage sludge, automotive shredder
waste and solid recovered fuel were subjected to a principal component analysis. This
procedure was used in a previous work in order to analyze the correlation between the
emissions and the alternative fuels (Conesa et al., 2008). This kind of method gives us
an overview of the dominant patterns and can be used for the classification of groups.
Note that during PCA the data table is pre-processed before the analysis, in such a way
that, when the variables are measured with different units (as is the case in the present
PCA), each element is divided by its variance, in order to standardize the observations.
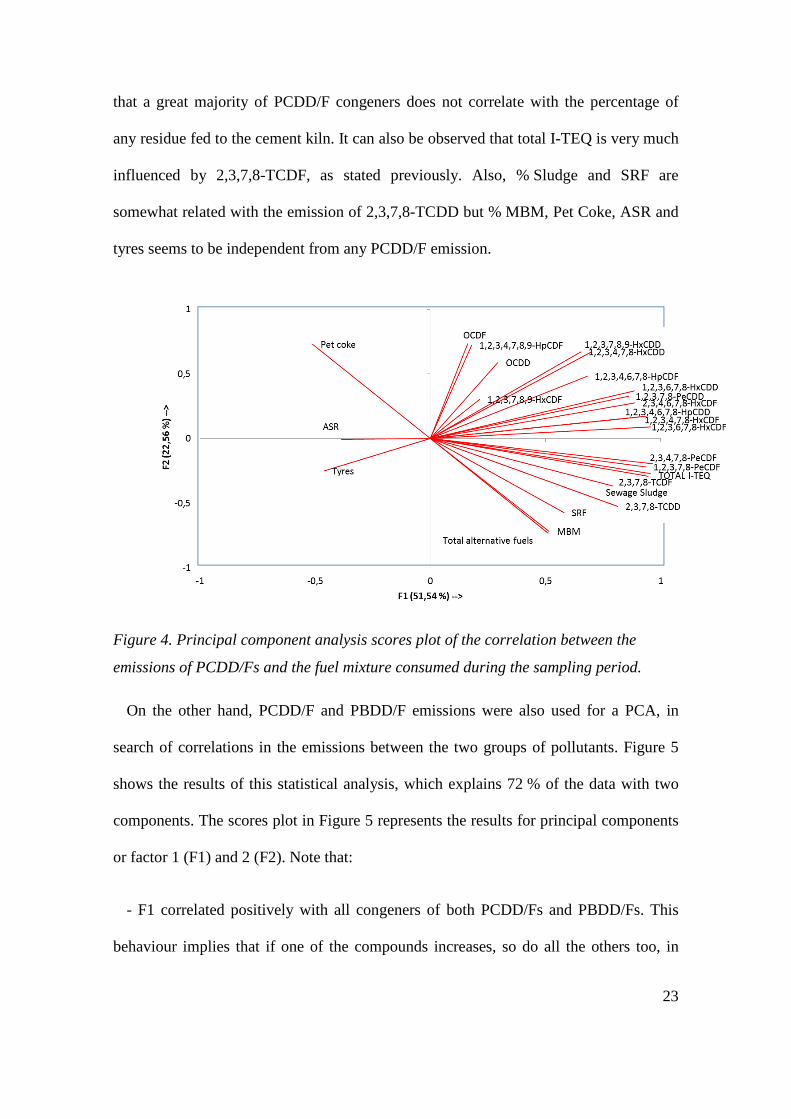
Figure 4 shows the scores plot of the PCA for this data. The PCA is able to explain
more than 74 % of the data with only two components. In Figure 4 it can be observed
23
that a great majority of PCDD/F congeners does not correlate with the percentage of
any residue fed to the cement kiln. It can also be observed that total I-TEQ is very much
influenced by 2,3,7,8-TCDF, as stated previously. Also, % Sludge and SRF are
somewhat related with the emission of 2,3,7,8-TCDD but % MBM, Pet Coke, ASR and
tyres seems to be independent from any PCDD/F emission.
Figure 4. Principal component analysis scores plot of the correlation between the
emissions of PCDD/Fs and the fuel mixture consumed during the sampling period.
On the other hand, PCDD/F and PBDD/F emissions were also used for a PCA, in
search of correlations in the emissions between the two groups of pollutants. Figure 5
shows the results of this statistical analysis, which explains 72 % of the data with two
components. The scores plot in Figure 5 represents the results for principal components
or factor 1 (F1) and 2 (F2). Note that:
- F1 correlated positively with all congeners of both PCDD/Fs and PBDD/Fs. This
behaviour implies that if one of the compounds increases, so do all the others too, in

24
such a way that there are runs with almost all the congeners above or under their
respective averages.
- F2 is, in general, correlated positively with PBDD/Fs and negatively with PCDD/Fs.
In this way, emission data can be divided into two different groups; one group
incorporating most of the PCDD/Fs and the other containing PBDD/Fs.
Figure 5. Principal component analysis scores plot for the correlation between the
emissions of PCDD/Fs and PBDD/Fs.
The positive correlation with F1 in this PCA denotes that the emission of these two
groups of pollutants have a similar behaviour, increasing or decreasing at the same time,
i.e., the samples (periods of time) presenting high levels of PCDD/Fs also present a high
levels of PBDD/Fs. This is true for all congeners but not in the same extent (depending
on the specific value of the coefficients).

25
Nevertheless, F2 statistically distinguishes two different groups (chlorinated and
brominated); this indicates that the production or destruction for each group is due to
different reasons (for example in different locations of the cement kiln) system in such a
way that there is a statistical difference between them. It is worth mentioning that there
is a clear segregation in the plot of the congeners with low-substitution degree, and only
the more substituted species are mixed in the scores plot.
5. CONCLUSIONS
After taking samples over a year of operation of a cement factory using a long-term
sampling device, we can conclude that the emission levels throughout the year are much
lower than the legal limits set for all substances, being < 10 pg I-TEQ /Nm3 in the case
of PCDD/Fs.
The data obtained allowed calculation of updated emission factors for the cement
sector, which resulted to be 8.5 ng I-TEQ/ton clinker for PCDD/Fs and 3.2 ng WHO-
TEQ/ton clinker for PCBs. Average emission of PBDD/Fs is 0.23 ng I-TEQ
(equivalent)/ ton clinker.
With respect to the congener distribution, 2,3,7,8-TCDF accounts for 60-68 % for the
total toxicity for PCDD/Fs, and in PBDD/F emissions, a clear predominance of octa-
substituted species (both dioxin and furan) is found.
No correlation was observed between the emission of any of the pollutants measured
and the degree of substitution with alternative fuels. Brominated and chlorinated dioxins
and furans have a similar behaviour, increasing or decreasing at the same time.

26
6. ACKNOWLEDGEMENTS
Support for this work was provided by CEMEX ESPAÑA, S.A., a company owned
by the CEMEX group (http://www.cemex.com). Authors acknowledge the financial
support for this work provided by the following projects: Ministry of Economy and
Competitiveness (Spain): CTQ2013-41006-R, Autonomous Community of Valencia
Government (Spain): PROMETEOII/2014/007.
REFERENCES
Abad E, Martínez K, Caixach J, Rivera J. Polychlorinated dibenzo-p-dioxin/polychlorinated dibenzofuran releases into the atmosphere from the use of secondary fuels in cement kilns during clinker formation. Environmental Science and Technology 2004; 38: 4734-4738.
Ames M, Zemba S, Green L, Botelho MJ, Gossman D, Linkov I, et al. Polychlorinated dibenzo(p)dioxin and furan (PCDD/F) congener profiles in cement kiln emissions and impacts. The Science of the total environment 2012; 419: 37-43.
Birnbaum LS, Staskal DF, Diliberto JJ. Health effects of polybrominated dibenzo-p-dioxins (PBDDs) and dibenzofurans (PBDFs). Environment International 2003; 29: 855-860.
CEN. EN 1948:1-3. Stationary source emissions. Determination of the mass concentration of PCDDs/PCDFs and dioxin-like PCBs. In: CEN, editor. European Committee for Standardization, Brussels, 2006.
Conesa JA, Gálvez A, Mateos F, Martín-Gullón I, Font R. Organic and inorganic pollutants from cement kiln stack feeding alternative fuels. Journal of Hazardous Materials 2008; 158: 585-592.
Conesa JA, Ortuño N. Analysis of the brominated dioxin and furan emission congener pattern from different sources. Organohalogen Compounds 2014; 76: 198-201.
Conesa JA, Rey L, Egea S, Rey MD. Pollutant Formation and Emissions from Cement Kiln Stack Using a Solid Recovered Fuel from Municipal Solid Waste. Environmental Science & Technology 2011; 45: 5878-5884.
Chen T, Guo Y, Li X, Lu S, Yan J. Emissions behavior and distribution of polychlorinated dibenzo-p-dioxins and furans (PCDD/Fs) from cement kilns in China. Environmental Science and Pollution Research 2014; 21: 4245-4253.

27
Choi JW, Fujimaki S, Kitamura K, Hashimoto S, Ito H, Suzuki N, et al. Polybrominated dibenzo-p-dioxins, dibenzofurans, and diphenyl ethers in Japanese human adipose tissue. Environmental Science and Technology 2003; 37: 817-821.
Du B, Zheng M, Tian H, Liu A, Huang Y, Li L, et al. Occurrence and characteristics of polybrominated dibenzo-p-dioxins and dibenzofurans in stack gas emissions from industrial thermal processes. Chemosphere 2010; 80: 1227-1233.
European Commission. Directive 2000/76/EC of the European Parliament and of the Council of 4 December 2000 on the incineration of waste. In: European Commission, editor, DOUE L 332 91 - 111, 2000, pp. 91 - 111.
European Commission. Directive 2008/98/EC of the European Parliament and of the Council of 19 November 2008 on waste and repealing certain Directives. In: EUROPEAN COMMISSION, editor, OJEC L 312 - 3, 2008, pp. 3-30.
European Commission. Directive 2010/75/EU of the European Parliament and of the Council of 24 November 2010 on industrial emissions (integrated pollution prevention and control) (Recast). In: European Commission, editor. Official Journal of the European Commission. L 334. European Comission, Brussels, 2010, pp. 17 - 119.
European Council. Regulation (EC) N° 850/2004 of the European Parliament and of the Council of 29 April 2004 on Persistent Organic Pollutants and amending Directive 79/117/EEC. In: European Council, editor. 850/2004, DOUE L 158 7-49, 2004, pp. 7-49.
Fabrellas B, Larranzabal D, Matínez MA, Sanz P, Ruiz ML, Abad E, et al. Global Assesment of PCDD/F emissions from the Spanish cement sector. Effect of conventional/alternative fuels. Organohalogen Compounds 2004; 28: 249-254.
Fabrellas B, Ruiz ML, Martinez MA, De la torre A. The Spanish dioxin inventory: Evaluation of dioxin and furan emissions generated in the Spanish cement sector during 2003-2004 period. The influence of the alternative fuels use. Cemento-Hormigon 2005; 76: 60-69.
Hagberg J. Analysis of brominated dioxins and furans by high resolution gas chromatography/high resolution mass spectrometry. Journal of Chromatography A 2009; 1216: 376-384.
Karstensen KH. Formation, release and control of dioxins in cement kilns. Chemosphere 2008; 70: 543-560.
Li H, Feng J, Sheng G, Lü S, Fu J, Peng P, et al. The PCDD/F and PBDD/F pollution in the ambient atmosphere of Shanghai, China. Chemosphere 2008; 70: 576-583.
Li Y, Chen T, Zhang J, Meng W, Yan M, Wang H, et al. Mass balance of dioxins over a cement kiln in China. Waste Management 2015; 36: 130-135.
Löthgren CJ, Van Bavel B. Dioxin emissions after installation of a polishing wet scrubber in a hazardous waste incineration facility. Chemosphere 2005; 61: 405-412.

28
Malmvärn A, Zebühr Y, Jensen S, Kautsky L, Greyerz E, Nakano T, et al. Identification of polybrominated dibenzo-p-dioxins in blue mussels (Mytilus edulis) from the Baltic Sea. Environmental Science and Technology 2005; 39: 8235-8242.
Olsman H, Engwall M, Kammann U, Klempt M, Otte J, Van Bavel B, et al. Relative differences in aryl hydrocarbon receptor-mediated response for 18 polybrominated and mixed halogenated dibenzo-p-dioxins and -furans in cell lines from four different species. Environmental Toxicology and Chemistry 2007; 26: 2448-2454.
Ortuño N, Conesa JA, Moltó J, Font R. De Novo Synthesis of Brominated Dioxins and Furans. Environmental Science & Technology 2014a; 48: 7959-7965.
Ortuño N, Moltó J, Conesa JA, Font R. Formation of brominated pollutants during the pyrolysis and combustion of tetrabromobisphenol A at different temperatures. Environmental Pollution 2014b; 191: 31-37.
Rahman A, Rasul MG, Khan MMK, Sharma S. Recent development on the uses of alternative fuels in cement manufacturing process. Fuel 2015; 145: 84-99.
Rivera-Austrui J, Martínez K, Adrados MA, Abalos M, Abad E. Analytical approach and occurrence for the determination of mass concentration of PCDD/PCDF and dl-PCB in flue gas emissions using long-term sampling devices. Science of the Total Environment 2012; 435-436: 7-13.
Rivera-Austrui J, Martinez K, Marco-Almagro L, Abalos M, Abad E. Long-term sampling of dioxin-like substances from a clinker kiln stack using alternative fuels. Science of the Total Environment 2014; 485–486: 528-533.
Rodrigues FA, Joekes I. Cement industry: sustainability, challenges and perspectives. Environmental Chemistry Letters 2011; 9: 151-166.
Rovira J, Mari M, Nadal M, Schuhmacher M, Domingo JL. Partial replacement of fossil fuel in a cement plant: Risk assessment for the population living in the neighborhood. Science of the Total Environment 2010; 408: 5372-5380.
Schuhmacher M, Domingo JL, Garreta J. Pollutants emitted by a cement plant: Health risks for the population living in the neighborhood. Environmental Research 2004; 95: 198-206.
Steiner T. Long-term monitoring in the frame of the new European guideline EN1948-1. Organohalogen Compounds 2003; 66: 787-790.
Tejima H, Nishigaki M, Fujita Y, Matsumoto A, Takeda N, Takaoka M. Characteristics of dioxin emissions at startup and shutdown of MSW incinerators. Chemosphere 2007; 66: 1123-1130.
UNEP. Standardized toolkit for identification and quantification of dioxin and furan releases. UNEP Chemicals, Geneva, Switzerland, 2005.
UNEP. Stockholm Convention on Persistent Organic Pollutants. In: Programme UNE, editor. United Nations Environment Programme, Geneva, Switzerland, 2009.
29
UNEP. Supporting document for technical review of the implications of recycling commercial penta and octabromodiphenyl ethers. Stockholm Convention document for 6th POP Reviewing Committee meeting. In: Programme UNE, editor. (UNEP/POPS/POPRC.6/INF/6). United Nations Environment Programme, Geneva, Switzerland, 2010.
UNEP Chemicals. Standardized toolkit for identification and quantification of dioxin and furan releases, Geneva, Switzerland, 2005.
US EPA. Method 3540C. Soxhlet extraction. In: US EPA, editor. SW-846. United States Environmental Protection Agency, Office of Solid Waste, Washington, D.C., 1996.
US EPA. Handbook for air toxic emission inventory development. Volume I: Stationary sources. In: US EPA, editor. EPA-454/B-98-002. United States Environmental Protection Agency, Office of Air Quality Planning and Standards, Research Triangle Park, NC 27711, 1998.
US EPA. Method 8270D. Semivolatile organic compounds by GC/MS. Test Methods for Evaluating Solid Waste Physical/Chemical Methods (SW-846). United States Environmental Protection Agency. Office of Solid Waste, Washington, D.C., 2007.
Valderrama C, Granados R, Cortina JL, Gasol CM, Guillem M, Josa A. Comparative LCA of sewage sludge valorisation as both fuel and raw material substitute in clinker production. Journal of Cleaner Production 2013; 51: 205-213.
Vicaretti M, Mosca S, Guerriero E, Rotatori M. Long-term automated sampling of PCDD/PCDF flue gas: current status and critical issues. Environmental Science and Pollution Research 2012; 19: 1896-1907.
Wang L-C, Chang-Chien G-P. Characterizing the Emissions of Polybrominated Dibenzo-p-dioxins and Dibenzofurans from Municipal and Industrial Waste Incinerators. Environmental Science & Technology 2007; 41: 1159-1165.
Wang LC, Hsi HC, Chang JE, Yang XY, Chang-Chien GP, Lee WS. Influence of start-up on PCDD/F emission of incinerators. Chemosphere 2007; 67: 1346-1353.
Wurst F, Prey T. Dioxin emissions when using alternative fuels in the cement industry. ZKG International 2003; 56: 74-77.
Yang HH, Lee WJ, Chen SJ, Lai SO. PAH emission from various industrial stacks. Journal of Hazardous materials 1998; 60: 159-174.
Yang Y, Huang Q, Tang Z, Wang Q, Zhu X, Liu W. Deca-Brominated Diphenyl Ether Destruction and PBDD/F and PCDD/F Emissions from Coprocessing deca-BDE Mixture-Contaminated Soils in Cement Kilns. Environmental Science & Technology 2012; 46: 13409-13416.

30


![Our Mission - pcdd.org Report-2010 pictures a… · Web viewA word from PCDD. Annual Report [2010] 7. Annual Report 2010During the year 2010 PCDD consolidated its fruitful partnerships](https://static.fdocuments.in/doc/165x107/5e08e4b45659d7779a512b94/our-mission-pcdd-report-2010-pictures-a-web-viewa-word-from-pcdd-annual-report.jpg)