Emissions of carbon dioxide and methane from fields ...
9
Emissions of carbon dioxide and methane from fields fertilized with digestate from an agricultural biogas plant** Robert Czubaszek* and Agnieszka Wysocka-Czubaszek Department of Environmental Protection and Management, Białystok University of Technology, Wiejska 45 A, 15-351 Białystok, Poland Received March 20, 2017; accepted November 9, 2017 Int. Agrophys., 2018, 32, 29-37 doi: 10.1515/intag-2016-0087 *Corresponding author e-mail: [email protected] **This work was financially supported by the Ministry of Science and Higher Education as part of the project S/WBiIŚ/01/17. Abstract. Digestate from biogas plants can play impor- tant role in agriculture by providing nutrients, improving soil structure and reducing the use of mineral fertilizers. Still, less is known about greenhouse gas emissions from soil during and after digestate application. The aim of the study was to estimate the emissions of carbon dioxide (CO 2 ) and methane (CH 4 ) from a field which was fertilized with digestate. The gas fluxes were measured with the eddy covariance system. Each day, the eddy covariance system was installed in various places of the field, depending on the dominant wind direction, so that each time the results were obtained from an area where the digestate was distributed. The results showed the relatively low impact of the studied gases emissions on total greenhouse gas emissions from agriculture. Maximum values of the CO 2 and CH 4 fluxes, 79.62 and 3.049 µmol s -1 m -2 , respectively, were observed during digestate spread- ing on the surface of the field. On the same day, the digestate was mixed with the topsoil layer using a disc harrow. This resulted in increased CO 2 emissions the following day. Intense minerali- zation of digestate, observed after fertilization may not give the expected effects in terms of protection and enrichment of soil organic matter. K e y w o r d s: agricultural biogas plant, digestate, greenhouse gases (GHG) emissions INTRODUCTION In Poland, the contribution of agriculture to national emissions of greenhouse gases (GHG) expressed as CO 2 equivalent is about 8%. Among GHG, the highest contribu- tion is that of nitrous oxide (N 2 O) – 51.2%, then methane (CH 4 ) – 45.8% and carbon dioxide (CO 2 ) – 3%. The main sources of N 2 O emissions are agricultural soils and manure management, with shares of 70 and 13%, respectively. Most CH 4 originates from enteric fermentation (88.4%) and about 11.4% is related to manure management. The rest of the emissions come from the field burning of agriculture residues, but their share is only 0.2% (NCEM, 2016). As one of the European Member States, Poland has committed itself to increase the share of renewable energy sources in energy production and to reduce GHG emis- sions. Although agriculture is responsible for a relatively small amount of GHG emissions, it may play a crucial role in decreasing N 2 O emissions, and it can be one of the main sectors responsible for increasing the share of renew- able energy sources in the production of energy. Currently, most practiced livestock production systems produce large amounts of biodegradable wastes. These have a negative impact on the environment. Anaerobic digestion of these wastes for biogas production has many benefits: energy savings, reduction of the GHG emissions, as well as air/ water pollution diminishment and end-products use as fer- tilizers (Möller and Stinner, 2009; Stinner et al., 2008). In biogas plants, organic matter is transformed by anaerobic digestion into biogas (renewable energy source) and digestate (potential fertilizer). Biogas is a mixture of CH 4 , CO 2 and some trace gases, and can be used to pro- duce electricity and heat. In agriculture-based digesters, manures, energy crops and the organic fraction of house- hold wastes are used. The co-digestion of manure with organic-rich substrates increases biogas production and improves the profitability of the process. The addition of co-substrates enhances the C/N ratio, which stabilizes digestion and results in good digestate fertilizer quality (Braun and Wellinger, 2003). © 2018 Institute of Agrophysics, Polish Academy of Sciences
Transcript of Emissions of carbon dioxide and methane from fields ...
Emissions of carbon dioxide and methane from fields fertilized with digestate from an agricultural biogas plant**
Robert Czubaszek* and Agnieszka Wysocka-Czubaszek
Department of Environmental Protection and Management, Białystok University of Technology, Wiejska 45 A,15-351 Białystok, Poland
Received March 20, 2017; accepted November 9, 2017
Int. Agrophys., 2018, 32, 29-37doi: 10.1515/intag-2016-0087
*Corresponding author e-mail: [email protected]**This work was financially supported by the Ministry of Science and Higher Education as part of the project S/WBiIŚ/01/17.
A b s t r a c t. Digestate from biogas plants can play impor-tant role in agriculture by providing nutrients, improving soil structure and reducing the use of mineral fertilizers. Still, less is known about greenhouse gas emissions from soil during and after digestate application. The aim of the study was to estimate the emissions of carbon dioxide (CO2) and methane (CH4) from a field which was fertilized with digestate. The gas fluxes were measured with the eddy covariance system. Each day, the eddy covariance system was installed in various places of the field, depending on the dominant wind direction, so that each time the results were obtained from an area where the digestate was distributed. The results showed the relatively low impact of the studied gases emissions on total greenhouse gas emissions from agriculture. Maximum values of the CO2 and CH4 fluxes, 79.62 and 3.049 µmol s-1 m-2, respectively, were observed during digestate spread-ing on the surface of the field. On the same day, the digestate was mixed with the topsoil layer using a disc harrow. This resulted in increased CO2 emissions the following day. Intense minerali-zation of digestate, observed after fertilization may not give the expected effects in terms of protection and enrichment of soil organic matter.
K e y w o r d s: agricultural biogas plant, digestate, greenhouse gases (GHG) emissions
INTRODUCTION
In Poland, the contribution of agriculture to national emissions of greenhouse gases (GHG) expressed as CO2 equivalent is about 8%. Among GHG, the highest contribu-tion is that of nitrous oxide (N2O) – 51.2%, then methane (CH4) – 45.8% and carbon dioxide (CO2) – 3%. The main sources of N2O emissions are agricultural soils and manure management, with shares of 70 and 13%, respectively. Most CH4 originates from enteric fermentation (88.4%) and
about 11.4% is related to manure management. The rest of the emissions come from the field burning of agriculture residues, but their share is only 0.2% (NCEM, 2016).
As one of the European Member States, Poland has committed itself to increase the share of renewable energy sources in energy production and to reduce GHG emis-sions. Although agriculture is responsible for a relatively small amount of GHG emissions, it may play a crucial role in decreasing N2O emissions, and it can be one of the main sectors responsible for increasing the share of renew-able energy sources in the production of energy. Currently, most practiced livestock production systems produce large amounts of biodegradable wastes. These have a negative impact on the environment. Anaerobic digestion of these wastes for biogas production has many benefits: energy savings, reduction of the GHG emissions, as well as air/water pollution diminishment and end-products use as fer-tilizers (Möller and Stinner, 2009; Stinner et al., 2008).
In biogas plants, organic matter is transformed by anaerobic digestion into biogas (renewable energy source) and digestate (potential fertilizer). Biogas is a mixture of CH4, CO2 and some trace gases, and can be used to pro-duce electricity and heat. In agriculture-based digesters, manures, energy crops and the organic fraction of house-hold wastes are used. The co-digestion of manure with organic-rich substrates increases biogas production and improves the profitability of the process. The addition of co-substrates enhances the C/N ratio, which stabilizes digestion and results in good digestate fertilizer quality (Braun and Wellinger, 2003).
© 2018 Institute of Agrophysics, Polish Academy of Sciences

R. CZUBASZEK and A. WYSOCKA-CZUBASZEK30
Agricultural utility and the environmental impacts of the digestate depend on many factors. Among these are choice of substrate, the technology adopted and the opera-tional practices (Agostini et al., 2016). Notwithstanding these factors, the use of anaerobic digestates has a posi-tive effect on soil physical properties through reduction of bulk density, increase of hydraulic conductivity and enhancement of moisture retention capacity (Nkoa, 2014). Digestate has higher pH, mineral nitrogen content, lower organic nitrogen content, lower total organic content com-pared to untreated manure (Anderson-Glenna and Morken, 2013). During anaerobic digestion, total nutrient content remains the same, but their respective forms are changed into inorganic forms that are readily available to plants (Crolla et al., 2013).
When planning the use of digestate as a fertilizer, it should be noted that it may still be a source of GHG. These gases can be produced and emitted during digestate storage and during its spreading upon the field. GHG emissions of a post-fermentation sediment have been studied by many authors. In most cases, digestate was found to have emitted lower amounts of the CH4 during storage than did untreated slurry (Chadwick et al., 2011). However, if the hydrau-lic retention time (HRT) of the digestion was too short, an increase in CH4 emissions was observed (Amon et al., 2002; Sommer et al., 2000). In this situation, places where digestate is stored should have a gas-tight cover to collect CH4 for electricity production and to prevent CH4, as well as NH3 and N2O emissions (Clemens et al., 2006).
Digestate can be applied using various types of equip-ment, but the most suitable methods of application are those that minimize the surface area exposed to air and en- sure contact with the topsoil, e.g. trailing hoses, trailing-shoes and injection (Lukehurst et al., 2010). Wulf et al. (2002) showed lowest GHG emissions after trailing hose application of digestate, followed by immediate shallow incorporation. The much cheaper, but not recommended method, is splash plate application. This is because of the risk of odour emissions and loss of nutrients through runoff and volatilization (Crolla et al., 2013).
Usually, in studies on emissions from fields ferti-lized with organic fertilizers, the chamber method is used (Clemens et al., 2006, Johansen et al., 2013; Rodhe et al., 2015). In this method, chambers are placed on the soils after digestate application. In this way, only a small part of the field is tested and the moment of the digestate distribu-tion on the field is overlooked. Therefore, in order to more fully characterize the effect of the application of organic fertilizers (including digestate), on the environment, me- thods which can be operated continuously, hence allows to measure GHG fluxes with very high frequency before, dur-ing and just after application, for example eddy covariance technique should be used.
The eddy covariance (EC) method is an example of a micrometeorological technique applied to quantify sur- face fluxes densities of many trace gases. The main advan-tage of the EC method compared to other methods is its spatial scale of integration, ranging from several square meters, to a hectare and more, depending on measurement height. Furthermore, EC measures fluxes directly, in con-trast to methods where the flux is deduced from the change of concentration over time inside an enclosure (Eugster and Merbold, 2015).
Micrometeorological techniques such as EC have already been used for research on GHG emissions asso- ciated with biogas production, e.g. Baldé et al. (2016) used an open-path laser to measure CH4 concentrations over the digestate storage place. Application of this kind of meth-ods, e.g. the EC technique, in the research on the use of digestate will enable the assessment of GHG emissions, not only during storage of this material or after its introduction into the soil, but also in the time of its spreading. This may be particularly important in the case of CH4, the emissions of which after application to soil are usually short-lived because the diffusion of oxygen into the manure on the soil surface inhibits CH4 formation (Chadwick et al., 2011).
The eddy covariance technique may be particularly use-ful when the digestate is distributed across the field using a splash plate method. It is known that this technique can result in very uneven spreading with regard to the appli-cation rate (Eickenscheidt et al., 2014). In this situation, the range of EC measurements, covering a large area of the field, will allow an avoidance of underestimation or over-estimation of emissions – a situation which can occur when using the chamber method.
The aim of the research presented in this work was to determine the emissions of CO2 and CH4 from a field being fertilized with digestate originating from biogas produc-tion. Measurements were made via the eddy covariance (EC) method, and special attention was paid to the period when digestate was applied on the field surface.
MATERIALS AND METHODS
The study was conducted on an arable field located near to Ryboły village, in the Podlaskie voivodship, in the north-eastern part of Poland (Fig. 1). The study site has a rectangular shape with an area of about 25 ha and is covered with triticale.
The soil was classified as Luvisols (WRB, 2015) and had a texture of loamy sand (determined on the basis of the hydrometer method), a pH of 5.2±0.2 (measured in 1:25 soil/water suspension with a HQ40D meter, Hach, USA), low organic carbon content of 7.28±0.82 g kg-1 (measured with a TOC-L analyzer equipped with SSM-5000A Solid Sample Combustion Unit, Shimadzu, Japan) and total nitrogen of 0.92±0.07 g kg-1 (measured with a VAP50s analyzer, Gerhardt, Germany). The C/N ratio was equal to 7.9±0.8 (Table 1).

EMISSIONS OF CO2 AND CH4 FROM FIELDS FERTILIZED WITH DIGESTATE 31
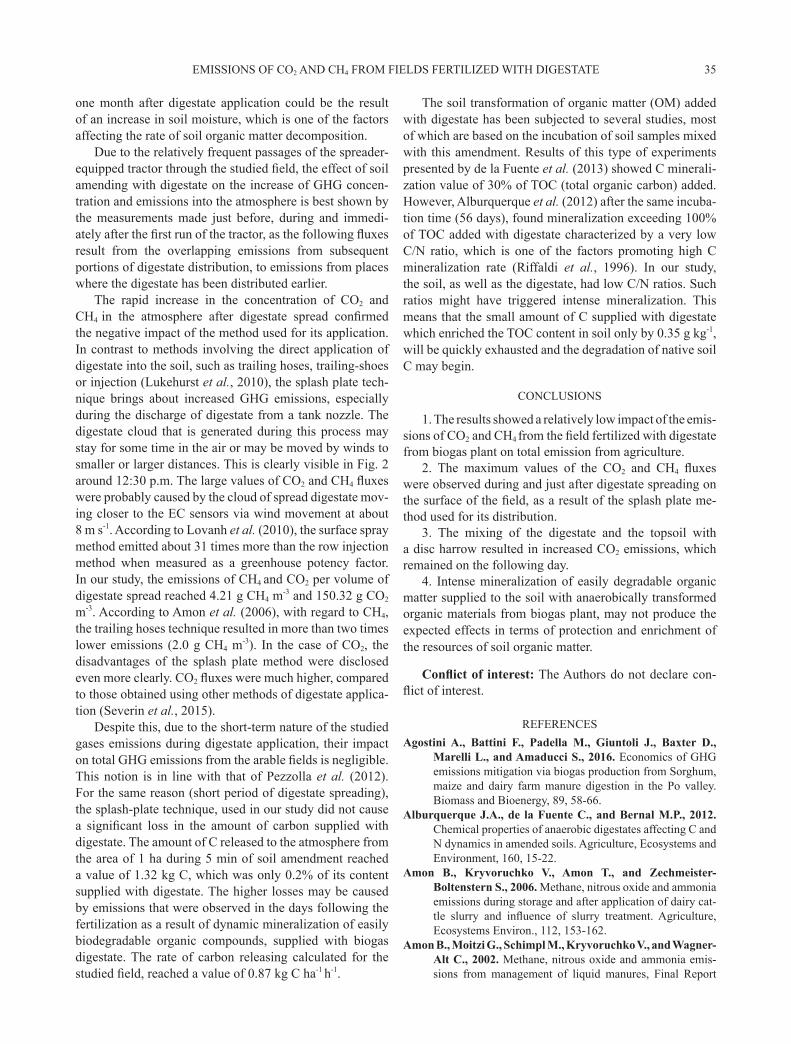
The research was carried out in the period from 22 June 2015 to 15 September 2015, and included a total of 10 campaigns covering various phases of triticale growth and tillage operations on the test field. Among these were the time of triticale harvest, the moment of digestate applica-tion and the time after plowing (Table 2). The digestate was distributed on August 5 from 11:00 a.m. with splash plate technique in an amount of approx. 30 m3 ha-1. The tractor, equipped with an 30 m3 spreader, moved in the N-S direc-tion at a speed of about 9 km h-1, giving a spread width of about 14 m. The first passage was about 30 m from the EC installation site. Further passages moved away from this place in the eastern direction. Considering tractor speed and spread width, the releasing of one tank in the field took about 5 min. The ride to the biogas plant, digestate reload and return to the field took about 15 min, so the spreader-equipped tractor crossed the EC footprint every 20-30 min (Fig. 2). After reaching the eastern boundary of the field, the fertilization was continued from the EC installation point and covered the western part of the field. The diges-tate spread all over the field ended around 7:00 p.m. In the late afternoon, the distribution of the digestate to the soil with a disc harrow also started.
The digestate had the characteristics typical for material produced by anaerobic decomposition of organic matter during biogas production in agricultural biogas plants fed with maize silage (Table 3). It had total solids (TS) con-tent of 6.4±0.1 % (determined via the weight method by oven-drying at 105°C), volatile solids (VS) content equal to 76.8±0.4 % (determined via the weight method by igni-tion at 550°C in a muffle furnace), pH of 8.1±0.1, high electrical conductivity of 4.6±0.3 mS cm-1 and oxidation-reduction potential (Eh) equal to -199.3±5.5 mV (all three parameters measured with a HQ40D meter, Hach, USA). It had organic carbon content of 26.2±0.1 g kg-1 (measured with a TOC-L analyzer equipped with SSM-5000A Solid Sample Combustion Unit, Shimadzu, Japan), nitrogen con-tent of 3.8±0.1 g kg-1 (measured with a VAP50s analyzer, Gerhardt, Germany) and phosphorus content of 0.5±0.1 g kg-1 (measured via the vanadate-molybdate method after sample mineralization in a microwave oven (ETHOS One, Milestone, Italy)).
The fluxes of CO2 and CH4 were measured with an EC system which consisted of LI-7500A and LI-7700 (LI-COR Biosciences, USA), open-path analyzers to mea- sure CO2/H2O and CH4 concentrations, respectively and sonic anemometer (WindMaster, GILL, UK) to measure
Fig. 1. Location of study field and wind roses of wind direction (°).
Ta b l e 1. Basic soil properties
Soil textureSoil fraction (mm) pH C N C/N
0.05-2 0.002-0.05 <0.002 H2O KCl
76±1 22±1 2±1 5.2±0.2 4.4±0.2 7.28±0.82 0.92±0.07 7.90±0.8
Soil texture – content of soil fraction (%), pH – reaction, C – total organic carbon (g kg-1), N – total nitrogen (g kg-1).
R. CZUBASZEK and A. WYSOCKA-CZUBASZEK32
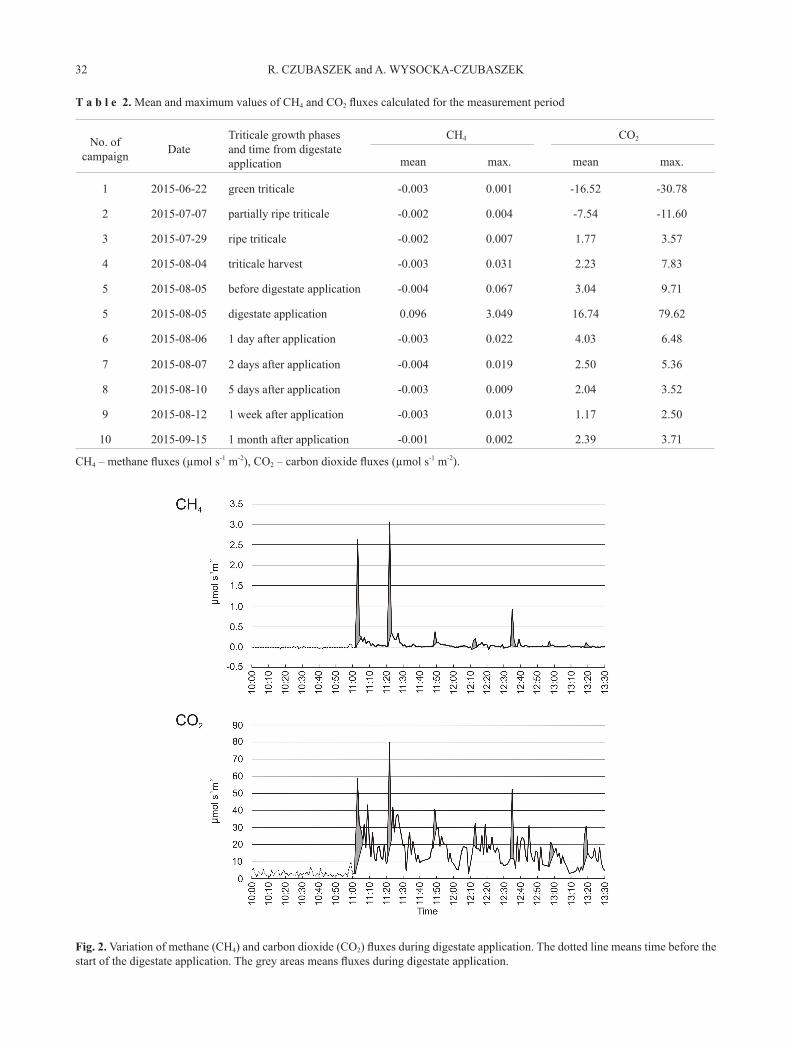
T a b l e 2. Mean and maximum values of CH4 and CO2 fluxes calculated for the measurement period
No. of campaign Date
Triticale growth phases and time from digestate application
CH4 CO2
mean max. mean max.
1 2015-06-22 green triticale -0.003 0.001 -16.52 -30.78
2 2015-07-07 partially ripe triticale -0.002 0.004 -7.54 -11.60
3 2015-07-29 ripe triticale -0.002 0.007 1.77 3.57
4 2015-08-04 triticale harvest -0.003 0.031 2.23 7.83
5 2015-08-05 before digestate application -0.004 0.067 3.04 9.71
5 2015-08-05 digestate application 0.096 3.049 16.74 79.62
6 2015-08-06 1 day after application -0.003 0.022 4.03 6.48
7 2015-08-07 2 days after application -0.004 0.019 2.50 5.36
8 2015-08-10 5 days after application -0.003 0.009 2.04 3.52
9 2015-08-12 1 week after application -0.003 0.013 1.17 2.50
10 2015-09-15 1 month after application -0.001 0.002 2.39 3.71
CH4 – methane fluxes (µmol s-1 m-2), CO2 – carbon dioxide fluxes (µmol s-1 m-2).
Fig. 2. Variation of methane (CH4) and carbon dioxide (CO2) fluxes during digestate application. The dotted line means time before the start of the digestate application. The grey areas means fluxes during digestate application.

EMISSIONS OF CO2 AND CH4 FROM FIELDS FERTILIZED WITH DIGESTATE 33
three-dimensional wind speed, wind direction and sonic temperature. Data was measured with a frequency of 10 Hz. Each test day, the EC system was installed in various places in the field, depending on the wind direction, so that each time the results were obtained from an area where the digestate was applied. The study area is an elongated rec-tangle and placing a set of EC in one location for a longer time, e.g. in the middle of the field, would result in obtain-ing fluxes from outside the area of interest. In order to have a sufficient fetch which represents the study site, all sen-sors were fixed 220 cm above the ground, which resulted in a footprint length of 156-172 m on the day of soil treatment. The measurements were done between 10:00 a.m. and 2:00 p.m. in order to minimize the diurnal variation in flux patterns in each test day. The choice of the hourly interval was the result of earlier observation of the wind conditions. These were, at this time interval, the most stable in terms of speed and direction. In the morning, the wind was usu-ally very weak, while in the afternoon, it changed direction. However, we realize that the relatively short measurement period reduced the amount of important information related to gas exchange, especially after fertilization. During all measurements, friction velocity (u*) was above 0.15 m s-1, and during digestate application, its mean value was equal to 0.37 m s-1, with average wind speed of 3.7 m s-1.
The data from the EC sensors were recorded using a data logger (Xlite 9210 Datalogger, Sutron, USA). In order to refine the final GHG emissions from the study field, their fluxes were calculated for periods of 1 and 5 min using the EddyPro 5 software package. The period of 1 min refers to fluxes obtained during digestate application. The following calculation procedures were applied: spectral corrections (Moncrieff et al., 2004, 1997); compensation for density fluctuations (Webb et al., 1980); sonic tempe-rature correction for humidity (Van Dijk et al., 2004); time lag adjustment; coordinator rotation; block averaging and statistical tests (Vickers and Mahrt, 1997). The footprint was estimated according to Kljun et al. (2004).
During flux measurements, the microclimate of the study field was analyzed with the following set of sen- sors connected to the data logger: pyranometer sensor (LI-200SL-50, LI-COR, USA), quantum sensor (LI-190SL- 50, LI-COR, USA), net radiometer (NR Lite2, Kipp& Zonen, the Netherlands), air temperature and relative humidity probe (HMP155, Vaisala, Finland), three soil heat flux plates (HFP01, Hukseflux, the Netherlands), three soil
temperature and water content sensors (Hydra Probe II, Stevens Water Monitoring System Inc., USA). Meteo data were recorded every 1 min. The radiation sensors and T/RH probe were installed at heights of 1.6 and 2 m above the ground, respectively. The sensors of soil temperature and water content were inserted vertically into soil surface and heat plates were installed at a depth of 5 cm.
RESULTS AND DISCUSSION
Research on GHG emissions from the field fertilized with digestate was conducted on different days, but in simi-lar weather conditions (Table 4), which had a significant impact on studied GHG emissions. In almost the entire study period, the air temperature exceeded 30°C, and only on the first and last days was it lower than 20°C. The end of July and the beginning of August was also very balanced in terms of solar radiation quantity supplied to the field surface. Partially cloudy weather, manifesting in lower val-ues of global radiation (Rg) and photosynthetically active radiation (PPFD), occurred only on July 29 and September 15. Solar conditions influenced the soil environment of the study field. The temperature of the soil surface, after triticale harvest, reached 35-40°C, while the value of soil heat flux, in some cases exceeded 60 W m-2. This can lead to higher emissions and to higher soil respiration rates resulting from increased microbial metabolism (Oertel et al., 2016). At the same time, soil moisture was very low, and it only it surpassed 0.1 m3 m-3 on July 29. This was particularly important in the case of CH4, the production of which in the soil requires anaerobic conditions, but under aerobic conditions, the soils become CH4 sinks (Fiedler et al., 2005).
In the beginning of the research, GHG emissions, espe-cially CO2, were closely related to the grain maturity degree of the triticale growing in the study field. On the first day of measurements (June 22), the triticale was still green, and the CO2 fluxes were impacted mainly through the assimi-lation that is associated with the photosynthesis process. As a result of this activity, a negative value of CO2 fluxes from the soil was observed (Table 2). Two weeks later (July 7), a large part of the triticale crop showed signs of matu-rity and carbon uptake by plants was less intense, but still exceeded soil respiration. On the next campaign (July 29), the triticale grain was ripe, which resulted in positive values of CO2 fluxes. On August 4, after the triticale harvest, CO2
fluxes slightly increased. This could have been the result of
Ta b l e 3. Physical and chemical properties of digestate
TS VS pH Eh EC C N P C/N
6.4±0.1 76.8±0.4 8.1±0.1 -199.3±5.5 14.6±0.3 26.2±1.7 3.8±0.1 0.5±0.1 6.9±0.5
TS – total solids (%), VS – volatile solids (% of TS), pH – reaction, Eh – oxidation / reduction potential (mV), EC – electrical con-ductivity (mS cm-1), C – total organic carbon (g kg-1), N – total nitrogen content (g kg-1), P – total phosphorus content (g kg-1); C, N, P concentration reported on fresh mass basis.

R. CZUBASZEK and A. WYSOCKA-CZUBASZEK34
the increased air turbulence at ground level after direct soil exposure to the atmosphere (Gerosa et al., 2014). Similar values of the CO2 fluxes were found on the next day, in the morning, when the digestate was spread on the soil. The emissions of the second studied gas, CH4 observed in the same period, were insignificant or had negative values (net consumption).
The application of digestate began at 11:00 a.m. on August 5. Almost immediately, very high values of the studied gas fluxes were observed. These reached 58.67 and 2.627 µmol s-1 m-2 for CO2 and CH4, respectively (Fig. 2). Maximum values in the graphs relate to the moment when the spreader-equipped tractor was passing the measuring station. Therefore, it reflects two sources of emissions, one resulting from the digestate spreading and the other result-ing from the combustion of diesel fuel. The further course of the graph (up to the next peak at 11:22 a.m.) shows only the emissions related to digestate application. After recal-culating fluxes on the mass unit, values of 54.1 kg CO2 ha-1 h-1 and 38.8 kg CO2 ha-1 h-1 for emissions from digestate and from the operation of the tractor engine, respectively, were seen to have been reached.
The flux values measured after spreader passing re- mained at an elevated level for a short period (about 6 min), and then gradually decreased, almost reaching the values observed before the spreading. Another passage caused a further sharp increase in emissions. This can be seen for both test gases, but more clearly in the case of CH4. This confirms the results obtained by other authors on the agri-cultural use of organic fertilizers. The emissions of CH4
occur immediately after the application of organic fertiliz-ers and quickly decline because of the high adverse effect
of oxygen on the process of methanogenesis (Chadwick and Pain, 1997, Chadwick et al., 2000). The diffusion of this gas from the atmosphere to the fertilized soil restrains the production of CH4. In addition, Kirchmannn and Lundvall (1993) and Sommer et al. (1996) showed negligi-ble emissions of CH4 resulting from the rapid decline of the content of volatile fatty acids in the organic fertilizer used in the field.
Increased CO2 emissions just after fertilization were also observed in other studies (Pezzolla et al., 2012; Severin et al., 2015) and were mainly induced by intensive decom-position of organic carbon, when easily degradable organic substances were added to the soil. This resulted in changes in the microbial activity due to the appearance of assimila-ble C and N in the soil. De Nobili et al. (2001) found that the majority of soil microorganisms willingly use the newly added substrates, which leads to an increase in microbial activity and, consequently, accelerates the decomposition of organic matter.
CO2 emissions after 2.5 h from digestate application were only slightly higher than those observed before fer-tilization, but on the next day, increased flux values were found (Table 2). The reason for such increased day-after emissions of CO2 could be the incorporation of the spread digestate into the topsoil (utilizing a disc harrow), made in the evening of the day of fertilizer application. Tillage increases CO2 efflux by aeration and by the destruction of the macro-aggregates, which physically protect soil organic matter against release (Grandy and Robertson, 2007). The increased CO2 emissions remained just one day and then decreased to the level that was observed on the field after triticale harvest. A slight increase in emissions observed
T a b l e 4. Microclimatic conditions during the measurement period
No. of campaign Date Ta RH Rg Rn PPFD SWC SHF St
1 2015-06-22 18.10 57.43 609.36 394.41 1252 0.058 21.17 20.19
2 2015-07-07 24.63 40.91 770.92 508.79 1614 0.005 23.18 29.55
3 2015-07-29 21.12 46.62 321.31 206.67 658 0.114 13.64 21.03
4 2015-08-04 30.63 33.96 608.97 396.56 1382 0.059 61.02 36.71
5 2015-08-05 31.09 30.29 671.66 476.78 1298 0.048 51.87 35.61
6 2015-08-06 31.99 34.05 732.91 453.60 1575 0.029 54.54 38.96
7 2015-08-07 31.18 37.46 669.12 383.19 1399 0.019 40.09 36.52
8 2015-08-10 26.69 55.56 722.55 380.48 1529 0.009 37.68 36.20
9 2015-08-12 32.62 27.86 620.20 343.54 1010 0.026 54.54 42.40
10 2015-09-15 19.62 74.07 325.45 209.28 706 0.067 30.59 21.96
Ta – air temperature (°C), RH – air relative humidity (%), Rg – solar radiation (W m-2), Rn – net radiation (W m-2), PPFD – photo- synthetic photon flux density (µmol m-2 s-1), SWC – soil water content (m3 m-3), SHF – soil heat flux (W m-2), St – soil surface tempe- rature (°C).
EMISSIONS OF CO2 AND CH4 FROM FIELDS FERTILIZED WITH DIGESTATE 35
one month after digestate application could be the result of an increase in soil moisture, which is one of the factors affecting the rate of soil organic matter decomposition.
Due to the relatively frequent passages of the spreader-equipped tractor through the studied field, the effect of soil amending with digestate on the increase of GHG concen-tration and emissions into the atmosphere is best shown by the measurements made just before, during and immedi-ately after the first run of the tractor, as the following fluxes result from the overlapping emissions from subsequent portions of digestate distribution, to emissions from places where the digestate has been distributed earlier.
The rapid increase in the concentration of CO2 and CH4 in the atmosphere after digestate spread confirmed the negative impact of the method used for its application. In contrast to methods involving the direct application of digestate into the soil, such as trailing hoses, trailing-shoes or injection (Lukehurst et al., 2010), the splash plate tech-nique brings about increased GHG emissions, especially during the discharge of digestate from a tank nozzle. The digestate cloud that is generated during this process may stay for some time in the air or may be moved by winds to smaller or larger distances. This is clearly visible in Fig. 2 around 12:30 p.m. The large values of CO2 and CH4 fluxes were probably caused by the cloud of spread digestate mov-ing closer to the EC sensors via wind movement at about 8 m s-1. According to Lovanh et al. (2010), the surface spray method emitted about 31 times more than the row injection method when measured as a greenhouse potency factor. In our study, the emissions of CH4 and CO2 per volume of digestate spread reached 4.21 g CH4 m-3 and 150.32 g CO2 m-3. According to Amon et al. (2006), with regard to CH4, the trailing hoses technique resulted in more than two times lower emissions (2.0 g CH4 m-3). In the case of CO2, the disadvantages of the splash plate method were disclosed even more clearly. CO2 fluxes were much higher, compared to those obtained using other methods of digestate applica-tion (Severin et al., 2015).
Despite this, due to the short-term nature of the studied gases emissions during digestate application, their impact on total GHG emissions from the arable fields is negligible. This notion is in line with that of Pezzolla et al. (2012). For the same reason (short period of digestate spreading), the splash-plate technique, used in our study did not cause a significant loss in the amount of carbon supplied with digestate. The amount of C released to the atmosphere from the area of 1 ha during 5 min of soil amendment reached a value of 1.32 kg C, which was only 0.2% of its content supplied with digestate. The higher losses may be caused by emissions that were observed in the days following the fertilization as a result of dynamic mineralization of easily biodegradable organic compounds, supplied with biogas digestate. The rate of carbon releasing calculated for the studied field, reached a value of 0.87 kg C ha-1 h-1.
The soil transformation of organic matter (OM) added with digestate has been subjected to several studies, most of which are based on the incubation of soil samples mixed with this amendment. Results of this type of experiments presented by de la Fuente et al. (2013) showed C minerali-zation value of 30% of TOC (total organic carbon) added. However, Alburquerque et al. (2012) after the same incuba-tion time (56 days), found mineralization exceeding 100% of TOC added with digestate characterized by a very low C/N ratio, which is one of the factors promoting high C mineralization rate (Riffaldi et al., 1996). In our study, the soil, as well as the digestate, had low C/N ratios. Such ratios might have triggered intense mineralization. This means that the small amount of C supplied with digestate which enriched the TOC content in soil only by 0.35 g kg-1, will be quickly exhausted and the degradation of native soil C may begin.
CONCLUSIONS
1. The results showed a relatively low impact of the emis-sions of CO2 and CH4 from the field fertilized with digestate from biogas plant on total emission from agriculture.
2. The maximum values of the CO2 and CH4 fluxes were observed during and just after digestate spreading on the surface of the field, as a result of the splash plate me- thod used for its distribution.
3. The mixing of the digestate and the topsoil with a disc harrow resulted in increased CO2 emissions, which remained on the following day.
4. Intense mineralization of easily degradable organic matter supplied to the soil with anaerobically transformed organic materials from biogas plant, may not produce the expected effects in terms of protection and enrichment of the resources of soil organic matter.
Conflict of interest: The Authors do not declare con-flict of interest.
REFERENCESAgostini A., Battini F., Padella M., Giuntoli J., Baxter D.,
Marelli L., and Amaducci S., 2016. Economics of GHG emissions mitigation via biogas production from Sorghum, maize and dairy farm manure digestion in the Po valley. Biomass and Bioenergy, 89, 58-66.
Alburquerque J.A., de la Fuente C., and Bernal M.P., 2012. Chemical properties of anaerobic digestates affecting C and N dynamics in amended soils. Agriculture, Ecosystems and Environment, 160, 15-22.
Amon B., Kryvoruchko V., Amon T., and Zechmeister-Boltenstern S., 2006. Methane, nitrous oxide and ammonia emissions during storage and after application of dairy cat-tle slurry and influence of slurry treatment. Agriculture, Ecosystems Environ., 112, 153-162.
Amon B., Moitzi G., Schimpl M., Kryvoruchko V., and Wagner- Alt C., 2002. Methane, nitrous oxide and ammonia emis-sions from management of liquid manures, Final Report

R. CZUBASZEK and A. WYSOCKA-CZUBASZEK36
2002. On behalf of “Federal Ministry of Agriculture, Forestry, Environmental and Water Management” and “Federal Ministry of Education, Science and Culture”, Vienna, Austria.
Anderson-Glenna M. and Morken J., 2013. Greenhouse gas emissions from on-farm digestate storage facilities. Tel-Tek report no. 2213040-1, Norway.
Baldé H., VanderZaag A.C., Burtt S.D., Wagner-Riddle C., Crolla A., Desjardins R.L., and MacDonald D.J., 2016. Methane emissions from digestate at an agricultural biogas plant. Bioresource Technol., 216, 914-922.
Braun R. and Wellinger A., 2003. Potential of Co-digestion. IEA Bioenergy, Task 37. Available from: http://www.iea-biogas.net /_download/publi- task37/Potential%20of%20Codigestion%20short%20 Brosch221203.pdf
Chadwick D.R. and Pain B.F., 1997. Methane fluxes following slurry applications to grassland soils: laboratory experi-ments, Agric. Ecosyst. Environ., 63, 51-60.
Chadwick D.R., Pain B.F., and Brookman S.K.E., 2000. Nitrous oxide and methane emissions following application of animal manures to grassland, J. Environ. Qual., 29, 277-287.
Chadwick D., Sommer S., Thorman R., Fangueiro D., Cardenas L., Amon B., and Misselbrook T., 2011. Manure management: Implications for greenhouse gas emissions, Animal Feed Science and Technology, 166-167, 514-531.
Clemens J., Trimborn M., Weiland P., and Amon B., 2006. Mitigation of greenhouse gas emissions by anaerobic diges-tion of cattle slurry. Agriculture, Ecosystems Environ., 112, 171-177.
Crolla A., Kinsley C., and Pattey E., 2013. Land application of digestate. in: The biogas handbook. Science, production and application. Woodhead Publishing Series in Energy: Number 52.
De la Fuente C., Alburquerque J.A., Clemente R., and Bernal M.P., 2013. Soil C and N mineralisation and agricultural value of the products of an anaerobic digestion system. Biol. Fertil. Soils, 49, 313-322.
De Nobili M., Contin M., Mondini C., and Brookes P.C., 2001. Soil microbial biomass is triggered into activity by trace amounts of substrate. Soil Biol. Biochem., 33, 1163-1170.
Eickenscheidt T., Freibauer A., Heinichen J., Augustin J., and Drösler M., 2014. Short-term effects of biogas digestate and cattle slurry application on greenhouse gas emissions affected by N availability from grasslands on drained fen peatlands and associated organic soils. Biogeosciences, 11, 6187-6207.
Eugster W. and Merbold L., 2015. Eddy covariance for quanti-fying trace gas fluxes from soils. Soil, 1, 187-205.
Fiedler S., Höll B.S., and Jungkunst H.F., 2005. Methane bud- get of a Black Forest spruce ecosystem considering soil pat-tern. Biogeochemistry, 76, 1-20.
Gerosa G., Finco A., Boschetti F., Brenna S., and Marzuoli R., 2014. Measurements of soil carbon dioxide emissions from two maize agroecosystems at harvest under different tillage conditions, The Scientific World Journal, Vol. 2014, 1-12.
Grandy A.S. and Robertson G., 2007. Land-use intensity effects on soil organic carbon accumulation rates and mechanisms. Ecosystems, 10, 59-74.
Johansen A., Carter M. S., Jensenc E. S., Hauggard-Nielsen H., and Ambus P., 2013. Effects of digestate from anaero-bically digested cattle slurry and plant materials on soil microbial community and emission of CO2 and N2O. Applied Soil Ecol., 63, 36-44.
Kirchmannn H. and Lundvall A., 1993. Relationship between N immobilisation and volatile fatty acids in soil after applica-tion of pig and cattle slurry. Biol. Fertil. Soils, 15, 161-164.
Kljun N., Calanca P., Rotach M.W., and Schmid H.P., 2004. A simple parameterization for flux footprint predictions. Boundary Layer Meteorol., 112, 503-523.
Lovanh N., Warren J., and Sistani K., 2010. Determination of ammonia and greenhouse gas emissions from land applica-tion of swine slurry: A comparison of three application methods. Bioresource Technol., 101, 1662-1667.
Lukehurst C. T., Frost P., and Al Seadi T., 2010. Utilisation of digestate from biogas plants as biofertiliser. IEA Bioenergy, Task 37. Available from: http://task37.ieabioenergy.com/files/daten-redaktion/download/publi-task37/Digestate_Brochure_Revised_12-2010.pdf [Accessed 19 March 2017].
Moncrieff J.B., Masheder J.M., de Bruin H., Elbers J., Friborg T., Heusinkveld B., Kabat P., Scott S., Soegaard S., and Verhoef A., 1997. A system to measure surfaceflux momen-tum, sensible heat, water vapor and carbon dioxide. J. Hydrol., 188-189, 589-611.
Moncrieff J.B., Clement R., Finnigan J., and Meyers T., 2004. Averaging, detrending and filtering of eddy covariance time series. In: Handbook of Micrometeorology: A Guide for Surface Flux Measurements (Eds X. Lee, W.J. Massman, B.E. Law). Kluwer Academic, Dordrecht, The Netherlands.
Möller K. and Stinner W., 2009. Effects of different manuring systems with and without biogas digestion on soil mineral nitrogen content and on gaseous nitrogen losses (ammonia, nitrous oxides). European J. Agronomy, 30, 1-16.
NCEM, 2016. Poland’s National Inventory Report 2016. Greenhouse Gas Inventory for 1988-2014. Available from:http://www.kobize.pl/uploads/materialy/materialy_do_pobrania/krajowa_inwenta-ryzacja_emisji/NIR_2016_ POL_05.2016.pdf.
Nkoa R., 2014. Agricultural benefits and environmental risks of soil fertilization with anaerobic digestates: a review. Agronomy for Sustainable Development. Springer Verlag/EDP Sciences/INRA, 34(2), 473-492.
Oertel C., Matschullat J., Zurbaa K., Zimmermanna F., and Erasmi S., 2016. Greenhouse gas emissions from soils – A review. Chemie der Erde, 76, 327-352.
Pezzolla D., Bol R., Gigliotti G., Sawamoto T., López A.L., Cardenas L., and Chadwick D., 2012. Greenhouse gas (GHG) emissions from soils amended with digestate derived from anaerobic treatment of food waste. Rapid Commun. Mass Spectrom., 26, 2422-2430.
Riffaldi R., Saviozzi A., and Levi-Minzi R., 1996. Carbon min-eralization kinetics as influenced by soil properties. Biol. Fertil. Soils, 22, 293-298.
Rodhe L.K.K., Ascue J., Willén A., Vegerfors Persson B., and Nordberg A., 2015. Greenhouse gas emissions from stor-age and field application of anaerobically digested and non-digested cattle slurry. Agriculture, Ecosystems Environ., 199, 358-368.

EMISSIONS OF CO2 AND CH4 FROM FIELDS FERTILIZED WITH DIGESTATE 37
Severin M., Fuß R., Well R., Garlipp F., and Van den Weghe H., 2015. Soil, slurry and application effects on greenhouse gas emissions. Plant Soil Environ., 61, 8, 344-351.
Sommer S.G., Petersen S.O., and Sogaard H.T., 2000. Greenhouse gas emission from stored livestock slurry. J. Environ. Qual., 29, 744-751.
Sommer S.G., Sherlock R.R., and Khan R.Z., 1996. Nitrous oxide and methane emissions from pig slurry amended soils, Soil Biol. Biochem., 28, 1541-1544.
Stinner W., Möller K., and Leithold G., 2008. Effects of biogas digestion of clover/grassleys, cover crops and crop residues on nitrogen cycle and crop yield in organic stockless farm-ing systems. European J. Agronomy, 29, 125-134.
Van Dijk A., Moene A.F., and de Bruin H.A.R., 2004. The Principles of Surface Flux Physics: Theory, Practice and
Description of the ECPack Library. Meteorology and Air Quality Group, Wageningen University, Wageningen, The Netherlands.
Vickers D. and Mahrt L., 1997. Quality control and flux sam-pling problems for tower and aircraft data. J. Atmos. Oceanic Technol., 14, 512-526.
Webb E.K., Pearman G.I., and Leuning R., 1980. Correction of flux measurements for density effects due to heat and water vapour transfer. Quat. J. R. Met. Soc., 106, 85-100.
WRB, 2015. World reference base for soil resources 2014. Update 2015. World soil resources reports No. 106, FAO, Rome.
Wulf S., Maeting M., and Clemens J., 2002. Application tech-nique and slurry co-fermentation effects on ammonia, nitrous oxide, and methane emissions after spreading: II. Greenhouse gas emissions. J Environ Qual., 31(6), 1795-1801.