Emission Trading in India: A Study of Two Schemes · 1 Emission Trading in India: A Study of Two...
46
Emission Trading in India: A Study of Two Schemes Kaushik Ranjan Bandyopadhyay Associate Professor, Department of Business Sustainability, TERI University Working Paper Series Vol. 2016-03 January 2016 The views expressed in this publication are those of the author(s) and do not necessarily reflect those of the Institute. No part of this article may be used reproduced in any manner whatsoever without written permission except in the case of brief quotations embodied in articles and reviews. For information, please write to the Institute. Asian Growth Research Institute
Transcript of Emission Trading in India: A Study of Two Schemes · 1 Emission Trading in India: A Study of Two...

Emission Trading in India: A Study of Two Schemes
Kaushik Ranjan Bandyopadhyay
Associate Professor, Department of Business Sustainability,
TERI University
Working Paper Series Vol. 2016-03
January 2016
The views expressed in this publication are those of the author(s) and
do not necessarily reflect those of the Institute.
No part of this article may be used reproduced in any manner
whatsoever without written permission except in the case of brief
quotations embodied in articles and reviews. For information, please
write to the Institute.
Asian Growth Research Institute

Emission Trading in India: A Study of Two Schemes
Kaushik Ranjan Bandyopadhyay
Associate Professor, Department of Business Sustainability, TERI University
CONTENTS
Extended Abstract.…………………………………………………………………....... .1
Keywords………………………………………………………………………………….1
Scheme 1: Emission Trading Scheme in India on Respiratory Solid
Particulate Matter (RSPM)………………………….…………….....2
1.1 Introduction……………..…………………………………...………………..........2
1.2 Piloting the Innovative Market Mechanism……….......………………………….4
1.3 How the Scheme Works? ...........…………………………..…………………..…..........6
1.4 Relevant Institution and Decision Process……………......……..……………..……..7
Scheme 2: Perform, Achieve and Trade (PAT)………………………………..9
2.1 Introduction……………………………………………………………………………….....9
2.2 Understanding the Perform, Achieve and Trade (PAT) Scheme…………….....12
2.2.1 Evolution of the PAT Scheme….…………………………………………..……….13
2.2.2 Target setting methodology……..…………………………………………..….…..15
2.3 Computing Potential CO2 Abatement..…...……………...……………...…….…….28
2.4 Institutional Structure for PAT Mechanism ………………………………...….29
2.5 Measurement & Verification under PAT Scheme: A Snapshot……………......30
2.6 PAT: Current Status………………………………………..……………………..32
2.7 PAT and Potential of Linking with International Carbon Markets……………34
2.7.1 PAT: Synergy with CDM market.…………………………….…….……...….34
2.7.2 PAT: Synergy with bilateral offsets………….……………...………………...36
2.8 Conclusion…………………………………………………………….…………….38
Acknowledgments….……………..……………………………….………………....…....41
References…………………………………………………………...…………….41

1
Emission Trading in India: A Study of Two Schemes
Kaushik Ranjan Bandyopadhyay
Associate Professor, Department of Business Sustainability, TERI University
Extended Abstract
The paper reviews two schemes in India that have some degree of resemblance with the
market based emission trading mechanism like EU-ETS. The first scheme is an
innovative emission trading scheme on an air pollutant namely respiratory solid
particulate matter (RSPM) with serious potential health implication. The scheme has
been piloted in industrial clusters of three polluting states in India (Gujarat, Maharashtra
and Tamilnadu). Although the scheme is not on CO2, this happens to be the first of its
kind emission trading system in a developing country that mimics the EU-ETS system.
The scheme shifts away from the traditional command and control regulation where the
industrial point sources have to comply with the norms set by the Central Pollution
Control Board (CPCB) or else pay a high penalty. It instead sets a pollution target for an
area based on ambient air quality standard and allocates permits to industrial point
sources that would then be traded based on gains or shortfalls from compliance after
verification. For setting the baseline and verification the scheme relies on a continuous
emission monitoring system (CEMS) that provides real-time information on emission
and resolves much of the problems that are otherwise prevalent with spot checking and
also minimises the problem that potentially arises with suspicious or wrong reporting by
third-party auditors. The second scheme known as Perform Achieve and Trade (PAT)
scheme is a flagship programme of the Bureau of Energy Efficiency, Ministry of Power,
Government of India, under the National Mission on Enhanced Energy Efficiency
(NMEEE). The programme also resembles a cap and trade mechanism and involves
trading in energy saving certificates between energy intensive industrial production
units identified as designated consumers (DCs). Although the scheme does not involve
any direct trading based on absolute or relative CO2 emissions but the potential unit of
energy saved (expressed in tonnes of oil equivalent) could easily be converted into CO2
emission equivalent. The scheme has the potential to pave the way for creating a more
holistic market for emission trading in India. The scheme also holds lot of promises in
linking with the international carbon offsets market through adjustments and
harmonisation in monitoring, reporting and verification (MRV). In the light of this, the
paper also provides a review of the operation and institutional mechanism of the scheme
and explores the potential in its linking with other international carbon offsetting
schemes.
Keywords: emission trading, air pollution, energy efficiency
JEL codes: Q490, Q480, Q530, Q580
2
Scheme 1: Emission Trading Scheme in India on Respiratory Solid
Particulate Matter (RSPM)
1.1 Introduction
The high influxes of population to urban areas, change in consumption patterns and
unplanned urban and industrial development have led to unabated increase in air
pollution in urban metropolitan cities in India. The problem has been exacerbated due to
inadequacy of pollution control measures, lack of proper enforcement of laws and
regulations, increasing desertification, and decreasing vegetation cover1. As per an
earlier conservative estimate of The Ministry of Environment and Forests (MoEF) air
pollution contributed to nearly 40,351 premature deaths spread across 36 cities of India
in 1995 itself. The total economic loss attributed to air pollution in these cities for the
year was estimated as US$1,310 million (Greenstone and Shah, 2013). Another new set
of findings from Global Burden of Disease Report indicate that outdoor air pollution has
reportedly become the fifth largest killer in India after high blood pressure, indoor air
pollution, tobacco smoking, and poor nutrition,. The report says that about 620,000
premature deaths occur in India from air pollution-related diseases each year.2
The urban air quality database brought out by WHO in 2014 reaffirms that most
Indian cities are becoming death traps because of high particulate matter (PM) levels
due to air pollution. Furthermore, Indian cities have highest levels of PM10 and PM2.5
(particles with diameter of 10 microns and 2.5 microns) when compared to other cities.
If one, however, considers National Ambient Air Quality Standards (NAAQS) as a
benchmark to compare the air quality across Indian cities—then 60 cities would comply
with the PM 2.5 standard and 21 cities would comply with PM10 standard (out of 124
Indian cities as considered in urban air quality database of WHO)3 . This is owing to the
1.http://cpcb.nic.in/upload/Newsletters/Newsletters_64_COVER,%20SOFT,%20BACK,%20EDITO
RIAL%20HAPs%20Newsletter.pdf (last accessed 9 February 2015)
2 http://www.downtoearth.org.in/content/air-pollution-killing-620000-indians-every-year-global-
burden-disease-report (last accessed 10 February 2015)
3 http://www.downtoearth.org.in/news/who-estimate-on-air-pollution-shows-indian-cities-are-death-
traps-44283 (last accessed 10 February 2015)

3
fact that Indian NAAQS are three to four times lax compared to WHO guidelines.
Indian NAAQS for PM10 is 60 µg/cum, and for PM2.5 it is 40 µg/cum, whereas the
WHO guidelines for PM10 is 20 µg/cum and for PM2.5, it is 10 µg/cum. So one can
easily gauge how unsafe it is to breathe even after meeting the national standards. Most
large Indian cities violate NAAQS for RSPM (60 μg/m3)4.
While the potential spill-over of air pollution on human health is well recognized,
regulating air pollution always remains a challenge especially because of a plethora of
economic activities that create air pollution. These include, among others, transport,
industry and electricity production, which, otherwise are crucial from the point of view
of augmenting economic growth. Hence, the impact of stringent regulation using
traditional command and control models could potentially have an adverse impact in
terms of lowering living standards (Greenstone et al., 2011).
Indian environmental regulation has traditionally been based on command and
control. Central Pollution Control Board (CPCB) usually has been setting strict
guidance for industrial emissions. State Pollution Control Board enforces standards,
required to be at least as stringent as central guidance. Figure 1 below shows how the
traditional regulation based on command and control actually works. However, the
enforcement and compliance in the traditional regulation system has largely remained
weak. In some cases there had also been intervention by court system through public
interest litigation (PIL) filed against pollution. Noted among the PILs that have been
filed in the context of pollution is M.C. Mehta vs. Union of India where the Supreme
Court of India held that air pollution in Delhi caused by vehicular emissions violates
right to life under Article 21 of the Indian Constitution and directed all commercial
vehicles operating in Delhi to switch to CNG fuel mode for safeguarding health of the
people.5 More recently in 9 February 2015, the Delhi High Court sought responses of
the government, the city pollution panel and civic agencies of the national capital on the
4 http://www.downtoearth.org.in/content/who-estimate-air-pollution-shows-indian-cities-are-death-
traps (last accessed 10 February 2015)
5 For more details on different PILs filed in the context of pollution see -
http://cpcb.nic.in/upload/Newsletters/Newsletters_17_2002.pdf (last accessed 11 February 2015)
http://www.downtoearth.org.in/content/who-estimate-air-pollution-shows-indian-cities-are-death-traps

4
issue of air pollution here which it has taken up suo motu as a public interest litigation
(PIL).6
Figure 1: Traditional Command and Control
1.2 Piloting the Innovative Market Mechanism
As difficulties have been encountered in the context of checking and abating air
pollution through the usual enforcement methods, the Union Ministry of Environment
and Forests (MoEF) has introduced a market-based mechanism in 2011 on a pilot basis
to reduce air pollution. It is called the Emissions Trading Scheme (ETS). The proposed
ETS meant for ‘particulate matter’ would be the first of its kind in the world. The
ministry has initiated the pilot in industrial areas of three states—Gujarat, Maharashtra
and Tamil Nadu—with the aim of improving overall ambient air quality. The scheme is
in its nascent stage and the results of pilots would be used to determine its feasibility in
other parts of the country.
Three states were chosen for the pilots because they have maximum number of
industries and critically polluted areas. The states and the participant clusters are
indicated below-
-Gujarat (Surat, Narol, Ahmedabad, Sachin Industrial Cluster)
-Maharashtra (Aurangabad, Jalna, Chandrapur, Domivali, Kolhapur)
-Tamil Nadu (Chennai Greater Metropolitan Area: Ambattur, Chennai, Marainalai,
Sriperumpudur and Tiruvallur)
6 http://articles.economictimes.indiatimes.com/2015-02-09/news/58967754_1_air-pollution-
delhi-high-court-environment-pollution (last accessed 11 February 2015)

5
A detailed questionnaire had been designed to gather information on the condition
of pollution abatement equipment, the level of particulate concentration presently
produced by industry and to estimate marginal abatement costs at the industry and
cluster level. The pilot project was essentially a two-part exercise. The first part
involved devising and testing of continuous emissions monitoring systems (CEMS),
which would provide real time data on industrial pollution to regulators. The second
part proposes using the data generated on the basis of CEMS as the basis for a market-
based regulatory programme. For setting the cap, the pilot project would collect
baseline data, compute the existing level of emissions and then set the cap at some
percentage below that.
The concern with a spot-check design as it existed under a strict command and
control regime is that - 1) it could not match the transparency and fairness of a system
based on continuous monitoring; 2) it would not have the rigor to earn the confidence of
market participants. As pollution based ETS requires adequate real time monitoring of
total emissions which is acceptable to regulators, participating industries and public, the
role of continuous emissions monitoring system (CEMS) becomes crucial in ensuring
effective measurement, recording and standardised reporting of specified air emissions
and other parameters. Installation of CEMS, however, might be expensive for industries,
albeit monitoring is accurate for a range of pollutants. It can also be used in a number of
industries such as power, steel, cement, chemical fertilisers and petrochemicals,
pharmaceuticals, boilers and incinerators and paper. One issue that becomes crucial
while implementing CEMS is the requirement of a common guideline with specification
for calibration for CEMS type and results of different types of imported equipment to
check for disparities and ensuring uniformity in results. In that context, the Tamil Nadu
Pollution Control Board has started an initiative to develop and standardise a basic
platform so that there are no disparities in the results (see CPCB, 2013 for detailed
guideline on CEMS).
A collaborative study has also been carried out in the state of Gujarat to examine the
truthfulness of auditors as there were concerns about third party audit especially because
of the conflict of interest that arises as the pollution auditors are essentially paid by the
firm hiring them (Greenstone and Shah, 2013). A two year experiment has been carried

6
out by assigning select 233 out of 473 audit-eligible plants in two most populous cities
of Gujarat namely Surat and Ahmedabad to audit treatments with an objective to curb
such a conflict by altering the market structure for environmental audits of industrial
plants and to incentivize accurate reporting on pollutants. The experiments led to three
main findings. First, the status quo system based on spot checking through third party
audit has been observed as largely corrupted with auditors systematically reporting plant
emissions just below the standard, although true emissions were typically higher.
Second, the treatment caused auditors to report more truthfully and substantially
lowered the fraction of plants that were falsely reported as compliant with pollution
standards. Third, treatment plants, in turn, reduced their pollution emissions. The result
suggested that reformed incentives for third-party auditors could improve their reporting
and make regulation more effective (Duflo et. al, 2013). The preliminary results from
this evaluation were also shared with Gujarat Pollution Control Board (GPCB) officials
and third-party auditors to which the auditors suggested that adopting parts of the
modified audit programme permanently would improve the quality of work they are
currently providing (Greenstone and Shah, 2013).
1.3 How the Scheme Works?
Figure 2 shows how the emission trading system functions. The scheme allows the
regulators—central and state pollution control boards—to set a cap on the aggregate
level of pollution permitted in an industrial area, and then allow the industries to self-
regulate to ensure that pollution does not exceed this cap. Industries that emit excess
pollutants can buy permits from industries that would be overachieving targets in a
similar manner as in the carbon trading system. Although regulator sets total emissions
amount but does not decide what any particular source will emit. Industries face price
for their emissions and can buy and sell permits to emit under the cap. Price of
emissions makes pollution costly and gives incentive to cut back. Industries have the
flexibility to design own compliance strategy either through abatement process and/or
technology changes or through permit trading. Flexibility allows units with low cost of
reductions to emit less and sell their right to emit to others, lowering overall compliance
costs. Auctioning would be considered as the preferred method of allocation of permits to

7
show that the government is establishing a right to emissions and to send clear price signals
to participating units from the very start of the scheme.
Figure 2: Functioning of the emission trading system
Source: Duflo et al (2010)
There is, however, one complication in linking NAAQS and ambient air quality to
the cap is that the former refers to the total level of pollutants in an area, which is a
function of all local sources (of which industry is a fraction and transport and others
play a significant role) as well as more distant sources whose pollutants are transmitted
through meteorological forces. Therefore, a simpler method is to rely on estimating how
much industries covered by the pilot are currently contributing and then setting a target
below that.
1.4 Relevant Institution and Decision Process
The pilot emissions trading scheme involves collaboration amongst many parties.
• The scheme had been taken up under the authority of the Ministry of
Environment & Forests (MoEF), Government of India.
• The Central Pollution Control Board (CPCB) advises on technical aspects of the
scheme implementation.
8
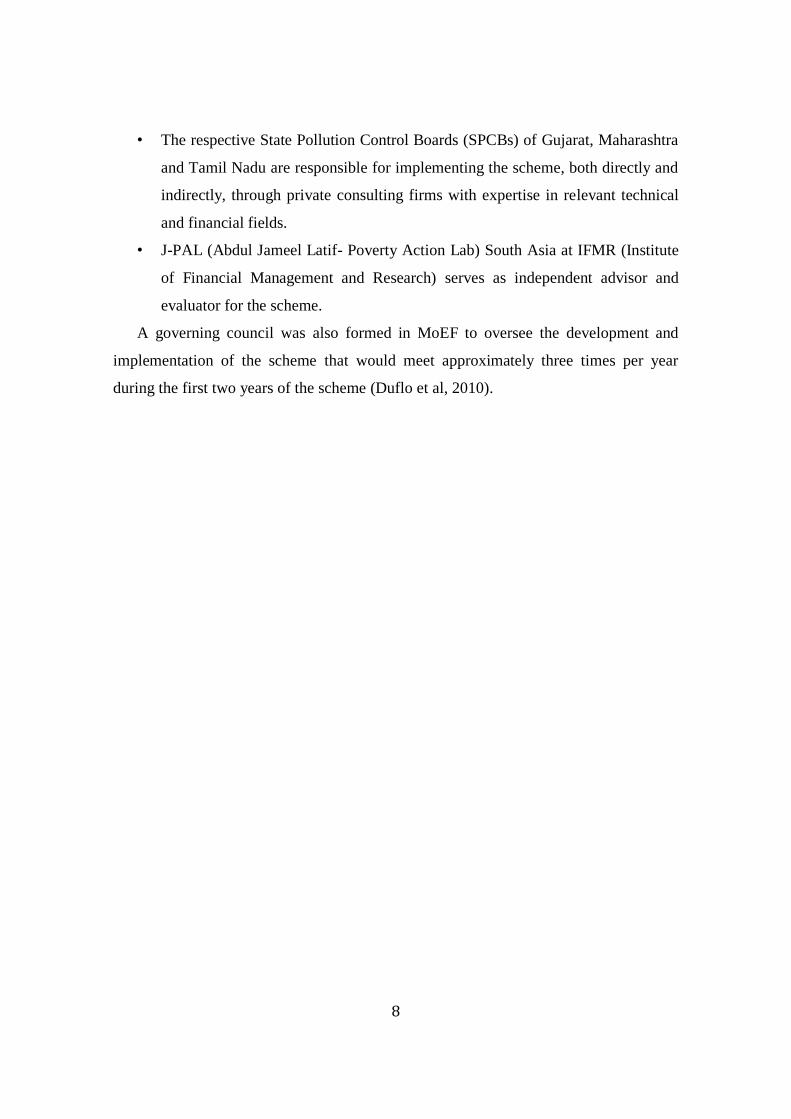
• The respective State Pollution Control Boards (SPCBs) of Gujarat, Maharashtra
and Tamil Nadu are responsible for implementing the scheme, both directly and
indirectly, through private consulting firms with expertise in relevant technical
and financial fields.
• J-PAL (Abdul Jameel Latif- Poverty Action Lab) South Asia at IFMR (Institute
of Financial Management and Research) serves as independent advisor and
evaluator for the scheme.
A governing council was also formed in MoEF to oversee the development and
implementation of the scheme that would meet approximately three times per year
during the first two years of the scheme (Duflo et al, 2010).

9
Scheme 2: Perform, Achieve and Trade (PAT)
2.1 Introduction
India is a democratic country with varying endowment of resources and biodiversity
that spreads across 29 states. With a population of over 1.2 billion of people India is
unequivocally the most populous democracy in the world. The growing population
coupled with the country’s aspiration to reach a double digit growth in order to drive the
lion’s share of people above the poverty line has also been driving India’s quintessential
energy consumption. The lion’s share of India’s energy consumption is made up of fossil
fuels and the country is also a net energy importer which comprises largely of crude oil
(Government of India, 2014). The dependence on fossil fuels, on the one hand, accounts
for rapidly growing CO2 emission and on the other hand puts immense pressure on
India’s balance of payment. The latter problem has become especially critical with
increasing speculation and volatility in the world oil markets in the recent years.
Interestingly South Asia including India also happens to be on the receiving end when it
comes to bearing the brunt of the repercussions of global warming with most of its coastal
areas under constant threat of being submerged and the region as a whole being prone to
erratic weather conditions and climate variation triggered by global warming (Ahmed and
Supachalasai, 2014)
Table 1 based on simple Kaya Decomposition delineates the key factors that drive the
growth of CO2 emissions in India namely the population, per capita GDP, energy
intensity of GDP and carbon intensity of energy (considering 1990 as a base year).
Table 1: Decomposition of India’s CO2 emission
Index
(reference year 1990 = 100) 1990 1995 2000 2005 2010 2011 2012
CO2 emissions 100 133 169 205 301 315 337
Population 100 110 120 130 139 141 142
GDP per capita (GDP at PPP#) 100 116 143 184 256 269 279
Energy intensity (TPES*/GDP) 100 95 84 72 64 63 63
Carbon intensity (CO2/TPES) 100 110 117 120 132 133 135
PPP stands for purchasing power parity; * TPES stands for total Primary Energy Supply.
Source: IEA (2014).

10
India’s biggest challenge lies in decoupling the CO2 emission from the its much
needed rapid economic growth that is crucial for lifting the poor above poverty line and
reducing the proneness to multifarious vulnerabilities. An appropriate way to address that
challenge, as evinced by the Kaya decomposition, is by a combination of reduction in
energy intensity of GDP coupled with reducing usage of carbon intensive fuel in the
energy mix without compromising on the growth trajectory. In other words, this implies
achieving the desired national growth objectives through a qualitative change in growth
process by accounting for ecological sustainability. The qualitative change could be
brought about by devising efficient and cost-effective strategies for energy efficiency
through end user demand side management (DSM), changing the energy mix, deploying
appropriate technologies for both adaptation and mitigation of greenhouse gases
emissions and engineering new and innovative forms of market, regulatory and voluntary
mechanisms to promote sustainable development (BEE, 2012).
Realizing the dire need of an ecologically sensitive and climate benign growth process,
India Government came out with its flagship National Action Plan on Climate Change
(NAPCC) released by the Hon’ble Prime Minister on 30th June, 2008. NAPCC outlines
Eight National Missions, representing multi-pronged, long-term and integrated strategies
for achieving key goals in the context of climate change. Figure 3 below indicates the
eight missions.
The International Energy Agency (IEA) in its World Energy Outlook, 2010 delineated
various options that are available to implement cumulative abatement of 1.8 Giga tonnes
of CO2 emission that would be necessary for India to reach a CO2 concentration to 450
ppm (parts per million) from the Business as Usual Scenario (see Figure 4). This volume
of abatement, as underscored by IEA, could be potentially achieved in India by
implementing various options between 2010 to 2035, of which energy efficiency would
account for 51 percent of the share in that abatement.
Furthermore energy efficiency is an inexpensive and a no-regret option that is easily
scalable when compared to the development of large-scale power plants. Given the fact
that it is crucial to treat each unit of energy saved and hence avoided generation on par
with each unit of energy generated, encouraging industry and consumers to use energy

11
more efficiently ought to be regarded as the first policy choice in the path towards
energy security and energy for all.
Figure 3: Eight National Missions under the National Action Plan on
Climate Change
Source: BEE, 2012
Figure 4: Cumulative CO2 emission abatement from current policy scenario to
450ppm scenario
Source: IEA (2010)

12
In view of the crucial role that energy efficiency could play in energy security and
the future CO2 abatement, the National Mission for Enhanced Energy Efficiency
(NMEEE), a key mission amongst the eight national missions of NAPCC, has been
garnered to promote innovative policy and regulatory regimes, financing mechanisms,
and business models that facilitates in creating and sustaining markets for energy
efficiency with clear deliverables to be achieved in a transparent and time bound
manner (BEE, 2012). The task of implementation of the mission has been entrusted on
Bureau of Energy Efficiency under the aegis of Ministry of Power. The NMEEE
comprises of four new initiatives which are:
• Perform Achieve and Trade (PAT): A market based mechanism to enhance cost
effectiveness of improvements in energy efficiency in energy-intensive large industries
and facilities, through certification of energy savings that could be traded.
• Market Transformation for Energy Efficiency (MTEE): Accelerating the shift to
energy efficient appliances in designated sectors through innovative measures to make the
products more affordable
• Energy Efficiency Financing Platform (EEFP): Creation of mechanisms that would
help finance demand side management programmes in all sectors by capturing future
energy savings.
• Framework for Energy Efficient Economic Development (FEEED): Developing
fiscal instruments to promote energy efficiency
2.2 Understanding the Perform, Achieve and Trade (PAT) Scheme
PAT scheme, in simple terms, is a market based instrument that mimics a cap and
trade mechanism and is intended to enhance cost-effectiveness of improvement in energy
efficiency in energy intensive large industries and facilities through issuance and trading
on energy saving certificates (ESCerts) between over-performing and under-performing
units in energy intensive industries, identified as designated energy consumers. The
ESCerts will be traded on trading platform created in the two power exchanges namely
Power Exchange Indian Limited (PXIL) and Indian Energy Exchange (IEX). Figure 5
below shows the mechanism diagrammatically.

13
Figure 5: A snapshot of the mechanism of the PAT Scheme
*SEC stands for specific energy consumption
With the introduction of PAT scheme, India also turns out to be the first developing
country to implement a market based mechanism that relies on trading of energy saving
certificates. The programme would facilitate in scaling up energy efficiency in targeted
industries while allowing for increased production and energy consumption to cater to the
needs of the much needed growth (Singh, 2013).
2.2.1 Evolution of the PAT Scheme
The foundation of the PAT scheme lies in the Energy Conservation Act (ECA) of
2001. The ECA provides for the legal framework, institutional arrangement and a
regulatory mechanism to initiate energy efficiency related services in the country. The
ECA also led to creation of Bureau of Energy Efficiency (BEE) by Ministry of Power in
2002 as the institution to provide the national policy framework and direction for energy
efficiency initiatives including advisory services. The stage-wise evolution of the PAT
scheme since the inception of ECA is shown in Figure 6. The ECA empowers the Indian
Government to single out energy intensive industries as Designated Consumers (DCs) and
establish mandatory energy conservation or savings target for them. The Designated

14
Consumers, as notified under ECA, account for 25% of the national gross domestic
product (GDP) and about 45% of commercial energy use in India. The list of DCs that
had been identified in the schedule pertaining to ECA 2001 is given below in Table 2.
Figure 6: Stage-wise Evolution of the PAT Scheme
Source: Singh (2013)
Table 2: Designated consumers in the schedule of Energy Conservation Act 2001
S.N Sector S.N. Sector
1 Aluminium 9 Chemicals
2 Fertilizers 10 Railways
3 Iron and Steel 11 Port Trust
4 Cement 12 Transport Sector (industries and
services)
5 Pulp and paper 13
Petrochemicals, Gas Crackers,
Naphtha Crackers and Petroleum
Refineries
6 Chlor Alkali 14
Thermal Power Stations, hydro
power stations, electricity
transmission companies and
distribution companies
7 Sugar 15 Commercial buildings or
establishments
8 Textile
Source: http://powermin.nic.in/upload/pdf/ecact2001.pdf (last accessed 10 December
2015)

15
Only 8 of the aforementioned identified sectors comprising of 478 DCs have been
included in the first cycle of the PAT scheme that began from 2012 and will end in 2015
and the choice is driven by the magnitude of energy consumption, the energy intensity
and large variation in energy consumption patterns across each of these eight sectors.
The DCs considered together account for about 231 MMTOE (million metric tons of oil
equivalent) of energy consumption annually as per 2007-08 data which is about 54% of
the total energy consumed in the country (BEE, 2011). The minimum annual energy
consumption and the distribution of designated consumers across 8 sectors are depicted
in Table 3. In the second cycle of PAT Scheme post-2015, there may be a revision in
the number of DCs as more sectors get included.
Table3: Minimum annual energy consumption and number of DCs in select sectors
Sector Minimum annual energy consumption for
the DC (tonnes of oil equivalent) No. of DCs
Aluminium 7500 10
Cement 30000 85
Chlor-alkali 12000 22
Fertiliser 30000 29
Iron and steel 30000 67
Pulp and paper 30000 31
Textile 3000 90
Thermal power plant 30000 144
Total 478
Source: BEE (2012)
2.2.2 Target setting methodology
The background work towards creation of the PAT mechanism has been carried out
by BEE. In the design phase BEE has consulted all the key stakeholders that include
extensive discussion with the DCs through workshops besides sector and plant level
meetings to solicit comments particularly on the following aspect:
a) Methodology for establishing the baseline energy consumption

16
b) Methodology for target setting for each sector
c) The process of measurement and verification, in particular the verification
agencies that need to be appointed by BEE for this purpose.
d) The manner in which trading of the certificates can be encouraged, in particular
instruments that could increase liquidity in the system.
The consultations were aimed at enhancing awareness and industry-readiness; placate
concerns about the scheme’s objectives especially the concerns raised by industries that
are sceptical. The complete step-wise implementation process that has been followed by
BEE for the PAT scheme beginning from constituting a steering committee for PAT till
notifying the rules and targets for DCs is shown in Figure 7. Besides BEE, the industry
body of India namely Confederation of Indian Industry (CII) and Federation of Indian
Chambers of Commerce and Industry (FICCI) also organised stakeholder consultation for
their industry members.
Figure 7: Steps towards Implementation of the PAT Scheme
Source: BEE (2012)

17
Basis of fixing an energy consumption norm for DCs
As per Section 14(g) of EC Act, 2001, the central government can stipulate energy
usage norms for designated consumers. In the process of stipulating energy usage norms,
sector-specific studies had been carried out by BEE. The studies depict wide variations in
specific energy consumption (SEC) within an industrial sector and thus hints on the large
energy-savings potential in a sector (see Table 4 for the bandwidth across various sectors).
The wide bandwidth also reflects on the dispersion in the energy-saving possibilities
at the plant level (that could be attributed to variation in vintage, production capacity,
raw material quality, and product-mix). In fact, the lower the SEC i.e. the higher the
energy efficiency, the lower the energy-savings potential. The lack of homogeneity due
to lack of uniformity in SEC within a sector makes it problematic to specify a single
benchmark SEC for the sector as a whole, as the benchmark would obviously turn out to
be high for older plants if it is set at the level of newer plants; on the other hand the
newer plants will find it very easy to attain the benchmark if it is set at the level of older
plants. Thus, it is more useful if the SEC improvement norm is set at the individual
plant level. These SEC improvement targets would be contingent upon trend of energy
consumption and energy-savings potential of the plants. In view of this, the energy
efficiency improvement targets fixed in case of PAT are “unit or plant specific”. Each
unit i.e. DC is mandated to reduce its SEC by a certain proportion or value (value of
SEC is expressed in metric ton of oil equivalent per unit of the product), based on its
baseline SEC within the sectoral bandwidth.

18
Table 4: Variations in Specific Energy Consumption across sectors
Sector Range of SECs
Aluminium 15875-17083 kwh/T*(Smelter)
3.28-4.12 mkcal/T of Alumina (Refinery)
Cement 66-127 kwh/T of clinker (Thermal)
665-900 kcal/kg (Electrical)
Chlor-alkali 2300-2600 kwh/T of caustic soda
Fertiliser 5.86-9.11 Gcal/T of urea (Thermal)
Iron and steel
6.15-8.18 Gcal/T (Integrated Steel)
4.4-7.6 Gcal/T (Sponge Iron Thermal)
72-135 kwh/T (Sponge Iron Electrical)
Pulp and paper 25.3-121GJ/T
Textile 3000-16,100 kcal/kg (Thermal)
0.25-10 kwh/kg (Electrical)
Thermal power plant 2300-3400 kcal/kwh
Source: BEE (2011);
*T stands for metric tonnes of oil equivalent
The step-wise approach to setting a target for SEC reduction (see Figure 8) involves:
1) defining the plant boundary; 2) reviewing the present energy scenario; and 3) setting
the baseline and eventually setting the target for SEC reduction.
Figure 8: Schematic Presentation of the Steps in Setting the Target of Energy Saving for DCs

19
The plant boundary is selected in such a way that the total energy input and the
above defined product output is fully captured and the SEC of an unit is calculated
based on Gate-to-Gate concept (as shown in Figure 9 below) with the following
formula:
Specific energy consumption (SEC) = net energy input into the designated consumers’
boundary /total quantity of output exported from the designated consumers’ boundary
While calculating the total energy input to the plant, all energy sources is converted into
single unit i.e. toe (metric ton of oil equivalent) using standard engineering conversion
formula. Energy used through renewable energy sources is not accounted for.
Furthermore any energy consumption related to major construction work is also excluded
as this energy does not go as an input in production.
Figure 9: Designating the Plant Boundary and computing SEC
Source: Diddi, 2011
The plant boundary consists of the entire plant excluding colony, residential complex
and transportation system. In case of Iron & Steel, Aluminium and Cement sector mining
operations are excluded from the plant boundary. The plant boundary so decided would
be constant for the entire PAT cycle.
The base line SEC is calculated based on the submission of the details of production
and energy consumption for 5 years by DCs from 2005-06 to 2009-10 through notified
form. Along with that some other sector-specific information is also collected on the

20
process technology, process flow, raw material, product mix etc. The reported SEC
through notified form is then normalised (usually for capacity utilisation or plant load
factor). The base line SEC is eventually calculated by taking the average of normalized
SEC from 2007-8 to 2009-10 and 2009-10 would be considered as base year. To avoid
double counting in total energy consumption by designated sectors, thermal power sector
is left out and considered separately as the power plant sector is also supplying electricity
to other designated industrial sectors (Bhattacharya and Kapoor, 2012).
The target has been defined under the PAT mechanism as a percentage reduction of
SEC from baseline value to that of target year and the target year for the first PAT cycle is
2014-15. The national energy saving targets under PAT cycle 1 is 6.686 million tonnes of
oil equivalent apportioned first across 8 sectors in proportion to their relative energy use
to ensure that the sectoral reduction is equal, in percentage terms, to the percentage of the
energy consumption of all covered plants in a sector to the overall energy consumption of
all covered plants. The sectoral targets are further disaggregated among the designated
consumers (478 in the first PAT Cycle) after taking into account their historical energy
consumption, sustainability of trading market and other related issues. The lowest
percentage target is given to the best performing plant. Hence, if the best performing plant
has X% target to reduce SEC, the other plants would be having (plant SEC/best SEC)
times X% (see Figure 10 for an illustration of plant-level target setting for pulp and paper
industry). The X can be numerically calculated keeping in view of total energy saving in a
target year. If a sector has wide variations in process technology and raw material, then
DCs would be grouped or clustered as per their similarities and the same methodology
would be applied.
The absolute energy saving at the end of three years is estimated as:
Pbase (SECbase – SECtarget)
where Pbase = Production quantity at the base year
The steps towards target setting and estimation of energy savings could thus be
summarised as below:
1. Selecting the Baseline Year: 2009-10

21
2. Baseline Production (Pbase): Calculating Arithmetic Average of 2007-8,
2008-9 & 2009-10 from the reported data
3. Baseline CU% (CUbase) : Avg. of 2007-8, 2008-9 & 2009-10 (CU stands
for capacity utilization)
4. Normalization of SEC is done by incorporating the normalization factor
based on capacity utilisation (if required)
5. Baseline SEC (SECbase) : Calculating Arithmetic Average of 2007-8, 2008-
9 & 2009-10 from the normalised SEC data
6. Target SEC (SECtarget): SEC as estimated in 2014-15 (with or without
normalization)
7. Target : % reduction from SECbase
8. Estimation of energy savings
Figure 10: Illustration of Plant Level Target Setting for Pulp and Paper Industry
Source: Garnaik (2011)
S
E
C
Numbers of DCs

22
Table 5 indicates the reported energy consumption and energy saving target in PAT
Cycle1 and Figure 11 below indicates the national savings target under PAT Cycle 1 (in
percentage). Table 6 further shows the distribution of state-wise target energy savings.
The targeted energy saving for the states have been computed from the targeted energy
savings of all the DCs for all the sectors of a particular state.
Table 5: Reported Energy Consumption and Energy Saving Target in PAT Cycle 1
Source: Verma et. al (2013)
Figure 11: National Energy Saving Target under PAT (in percentage)
Source: BEE (2012)
S
N Sector
No. of Identified
DCs in PAT
Cycle 1
Reported Energy
Consumption in PAT
Cycle 1 (million toe)
Energy Saving Target
under PAT Cycle-1
(million toe)
1 Aluminium 10 7.71 0.456
2 Chlor-Alkali 22 0.88 0.054
3 Textile 90 1.20 0.066
4 Pulp & Paper 31 2.09 0.119
5 Iron and Steel 67 25.32 1.486
6 Fertiliser 29 8.20 0.478
7 Cement 85 15.01 0.816
8
Thermal Power
Plants 144 104.56 3.211
Total 478 164.97 6.686

23
Issuance of ESCerts
An ESCert is an instrument that is issued by Ministry of Power/BEE for a one ton of
oil equivalent of energy savings achieved by the designated consumer, over and above
the target savings. The number of ESCerts which would be issued depends upon the
quantum of energy saved at the target year. The process involved in issuing and
promoting trading of ESCerts could be summarised as below:
1) Verification of the SEC of the DCs both in the baseline and target years by a BEE
accredited verification agency known as Designated Energy Auditors (DEA) hired
by DCs.
2) Issuance of ESCerts only to those DCs who exceed the target efficiency levels,
that is who achieves in achieving lower SEC than the targeted SEC. The
quantification of energy savings for issuance of targets would be based on the
report provided by DEA
3) Trading the ESCerts by overachieving DCs with underachieving DCs (who
failed to meet the target by undertaking appropriate measures). Each certificate
will be unique tradable commodity and the trading can be carried out bilaterally
between any two DCs (within or across the designated sectors) or on special
platforms for their trading created in power exchanges namely Indian Energy
Exchange (IEX) and Power Exchange of India (PXIL). First ESCerts is
supposed to be issued after completion of one financial year in 2013-14.
4) Ensuring compliance and organizing reconciliation of ESCerts will be
undertaken by BEE in association with the two Power Exchanges.

24
Table 6: Target Energy Saving and Number of Identified DCs in Different States
States Number of identified DCs Target Energy Savings
(in ton of oil equivalent)
Andhra Pradesh 39 370789
Assam 7 83177
Bihar 3 47473
Chattisgarh 38 641897
Delhi 4 62937
Goa 5 14387
Gujarat 54 592781
Haryana 7 269734
Jharkhand 11 521098
Karnataka 20 223964
Kerala 9 14685
Madhya Pradesh 24 500453
Maharashtra 45 790354
Orissa 28 541192
Puducherry 2 1146
Punjab 22 337123
Rajasthan 58 358656
Tamil Nadu 41 395365
Tripura 3 7050
Uttar Pradesh 27 395225
Uttarakhand 2 7090
West Bengal 17 472740
Himachal Pradesh 10 29044
Meghalaya 2 6035
Source: Verma et al (2013)
For sectors (other than thermal power sector):
Number of ESCerts that would be issued = (SEC notified for target year- SEC achieved
in target year) × (production in baseline year).
For thermal power plant sector (Kumar and Aggarwala, 2013):
Number of ESCerts that would be issued = {(heat rate notified for target year- heat rate
achieved in target year) × production in baseline year in million kWh}/10

25
The entire process could be represented schematically as in Figure 12.
Figure 12: A Simplified Schematic Representation of the Process towards Issuance
of ESCerts
DCs who would fail to achieve the target by the time frame would be imposed a fine
or penalty for the non-compliance as per the provision of the EC Act. The financial
penalty for non-compliance is linked to the degree of non-compliance, so that

26
underperformers can buy certificates for some amount and pay a penalty for the rest.
The proposed penalty is equal to the (fixed amount = Rs 10 lakh) + [(Target saving) ×
(% Actual unachieved) × (Current Price of 1 tonne of oil equivalent)] The diagrammatic
illustration of the working of ESCerts trading is given in Figure 13.
The diagrammatic illustration of the working of ESCerts trading is given in Figure
13.
Figure 13: Diagrammatic Representation of Targets, Compliance, ESCerts and
Penalty
Source: BEE (2012)
The calculation can be illustrated by an example:
SEC in baseline: 10 toe/unit of production (tonnes of oil equivalent per unit of
production)
Baseline Production: 10000 units
Target: 4% reduction in SEC
SEC at the end of 2014-15: 9.6 toe/unit of production
For ESCerts or Penalty:
• Reduction requirement: 4000 toe
• Case1 (Achieved SEC = 9.8): -2000 toe (Penalty)
• Case2 (Achieved SEC = 9.4): +2000 toe (ESCerts)

27
In case of compliance (say up to 80%) by purchase of ESCerts (equivalent to 1600
mtoe)
Monetary Value of ESCerts (A) = 1600 × (X) INR (depending on the price of 1
tonne of crude oil which is assumed here as X)
Compliance for the remaining Rest 20% by Paying Penalty for 400 MTOE
(Calculated)
Upfront penalty 1000000 INR (As per the Energy Conservation Act)
Non-compliance Penalty 400 X INR
Total Penalty Value (B)
(1000000+400 X) INR
Total Monetary Implications to DC= (A + B) INR
*INR: Indian rupee
As indicated above, the Energy Savings Certificates (ESCerts) will be traded on
special trading platforms to be created in the two power exchanges (IEX and PXIL).
The exchanges are also supposed to maintain data on traded prices, traded volumes, and
trends. Transfer agents or depositories shall hold the ESCerts in electronic form and
provide client services in relation to ESCerts. The lifetime of ESCerts potentially affects
its price. Thus, shorter compliance period and hence life time certificates tend to
increase the transaction cost and may potentially distort market prices because the
market will tend to respond to short term forces of demand and supply (Bhattacharyya,
2012) . The BEE has therefore allowed the option to a DC who has been issued the
ESCerts during the current PAT cycle to use it for the purpose of banking until the next
PAT compliance cycle and the ESCerts issued in the first compliance period shall
remain valid till the completion of the following compliance period (Ministry of Power,
2012) This would also facilitate in building investor confidence and market stability
(BEE, 2011). In case the market has surplus ESCerts there could be a possibility of
auctions/ buy-back of ESCerts to ensure price stability. Apart from this there is a
provision of getting advanced ESCerts in between two PAT cycles and at the end of
each financial year, however the targets assigned to them will also be revised
accordingly (Verma et. al, 2013).
28
2.3 Computing Potential CO2 Abatement
An important issue that deserves mention at this point is how one can translate this
energy savings into abated CO2 emission. For each DCs, CO2 emission reduction with
respect to apportioned targeted total savings in terms of SEC can be calculated and the
same method can be applied for the whole sector by relying on sectoral apportionment
based on share of relative energy consumption across sector (thermal power sector is
considered separately). By adding the CO2 emission reductions of the different sectors
covered under the PAT scheme, the total CO2 emission reduction can be calculated.
The formula that can be used for calculating CO2 emission from reducing the usage of a
fuel is given as below:
CO2 emission reduced (tonnes of CO2) = Avoided energy purchase × Emission factors
For grid based electricity the emission factor could be obtained from Central Electricity
Authority (CEA) and for other fuels it could be obtained from IPCC emission factor
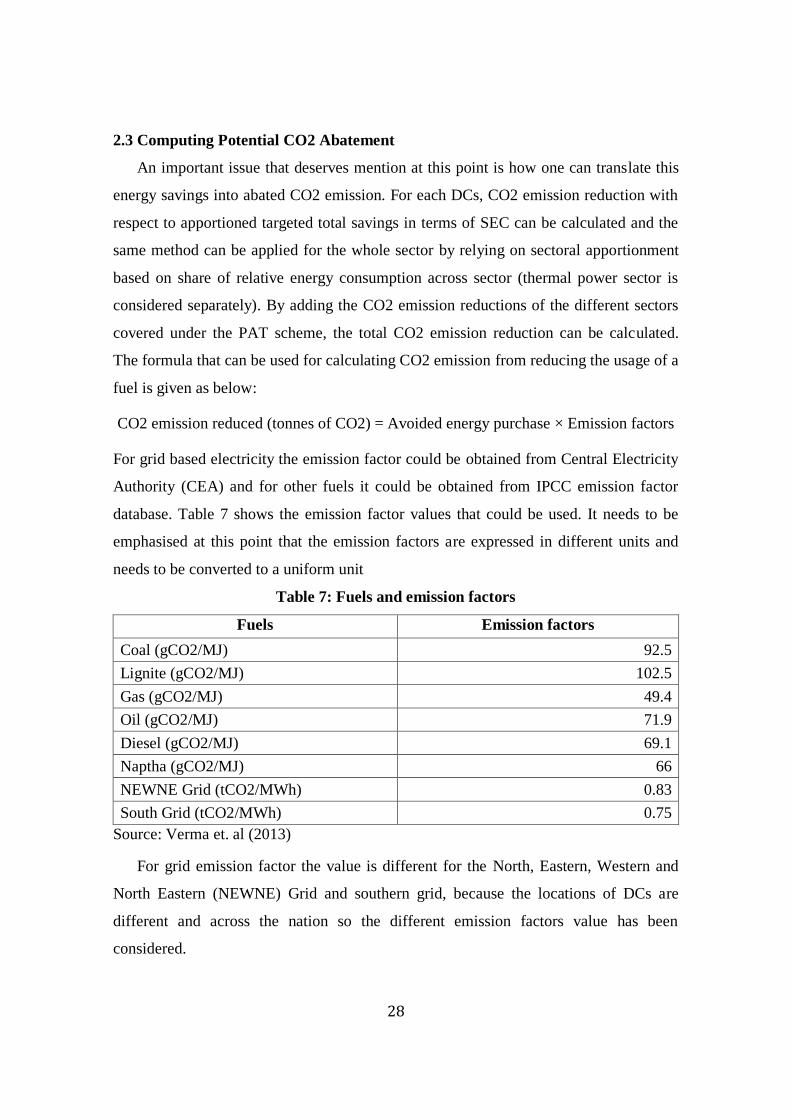
database. Table 7 shows the emission factor values that could be used. It needs to be
emphasised at this point that the emission factors are expressed in different units and
needs to be converted to a uniform unit
Table 7: Fuels and emission factors
Fuels Emission factors
Coal (gCO2/MJ) 92.5
Lignite (gCO2/MJ) 102.5
Gas (gCO2/MJ) 49.4
Oil (gCO2/MJ) 71.9
Diesel (gCO2/MJ) 69.1
Naptha (gCO2/MJ) 66
NEWNE Grid (tCO2/MWh) 0.83
South Grid (tCO2/MWh) 0.75
Source: Verma et. al (2013)
For grid emission factor the value is different for the North, Eastern, Western and
North Eastern (NEWNE) Grid and southern grid, because the locations of DCs are
different and across the nation so the different emission factors value has been
considered.

29
2.4 Institutional Structure for PAT Mechanism
In the institutional design for PAT, the role of scheme administrator and regulator is
being executed by the Bureau of Energy Efficiency (BEE) (which has been constituted
under the provision of the Energy Conservation Act, 2001) and the Central Electricity
Regulatory Commission (CERC), apex body in matters related to regulations governing
the electricity sector, respectively. CERC provides the umbrella regulations for
governing the functioning of PAT Mechanism. BEE acts in its capacity to set the energy
efficiency targets, publish protocols and procedures for implementation of the PAT
Mechanism. BEE also undertakes the accreditation and empanelment of Designated
Energy Auditors (DEA). The DEA are independent entities, accredited by BEE, who are
responsible for carrying out monitoring, verification, and reporting of energy efficiency
projects undertaken by Designated Consumers under the PAT Mechanism.
The Designated Consumers (DCs) would have the obligations to fulfill the annual
energy savings targets and the total compliance targets. For this purpose, they either can
undertake energy efficiency initiatives or can engage in Obligations and/or ESCerts
Trading. The DCs would be responsible annually for monitoring and reporting their
energy efficiency status to the BEE and ESCerts will be awarded to DC only if the
energy savings in the particular year exceed the annual savings target.
BEE can initiate compliance checks against any DC at any point of time preferably
upon submission of annual monitoring report. BEE will recommend the DEA for the
compliance check and in case of compliance checks; the Designated Consumers would
be responsible for communication and cooperation with the DEA and for suitable
compensation of the DEA for its services.
The existing power Exchanges namely Power Exchange India Limited (PXIL) and
Indian Energy Exchange (IEX) will provide a neutral electronic platform to all
designated consumers for trading Obligation and ESCerts in a fair manner without any
information asymmetry. Both PXIL and IEX will have interface with BEE and EESL
(Energy Efficiency Service Limited), Banks and Clearing and Settlement system to
enable seamless transactions of the tradable instruments.

30
In case of non-compliance the State Designated Agencies (SDA) as constituted in
accordance with the Energy Conservation Act, 2001 will act as the body responsible for
adjudicating matters related to penalizing the Designated Consumers for noncompliance.
Market Makers, Brokerage, Consulting firms, Financial Institutions, Financiers would
have their own roles to play as the entire mechanism attains greater depth and liquidity
in due course of time, wherein these entities would help the market to stabilize and
sustain in the longer run.
Figure 14 below indicates the stakeholders in the PAT Scheme.
Figure 14: Key Stakeholders in the PAT Scheme
Source: Tata Strategic Management Group (2014)
2.5 Measurement & Verification under PAT Scheme: A Snapshot
As defined earlier, the baseline SEC would be estimated based on the reported data
of DCs through the mandatory reporting system of annual energy consumption and
quantity produced. As it is a self-declared data, this would form the basis of establishing
baseline SEC. As the baseline SEC is on gate-to-gate basis, there is no such
measurement involved in any sub-system or sub-process of the plant.
After submission of Form 1 containing reported data on annual energy consumption
and Form A as performance assessment document, the Designated Consumer has to hire

31
an accredited energy auditor, from the list of BEE empanelled accredited energy
auditors7 for the verification of these forms.
Accredited energy auditor (AEA/DEA) will verify Form 1 and Form A by
conducting baseline energy audit in the DCs. The baseline energy audit conducted by
the DEA is aimed at knowing the energy performance of various key equipments,
energy balance, energy saving potential, various energy conservation options
implemented in the plant etc.
DEA shall submit certificate of verification through Form B to BEE within 3
months from the last day of the financial year. This process is mandatory after the last
financial of the cycle, whereas designated consumer can submit these documents after
verification in the voluntary phase for issuance of ESCerts. A positive recommendation
shall be submitted only if the proposed project activity complies with all the
requirements stipulated under the PAT scheme. The verification by DEA of project
documentation provided by the project DC shall be based upon both quantitative and
qualitative information on SEC. Quantitative information comprises the reported
numbers in the monitoring report submitted to the DEA. Qualitative information
comprises information on internal management controls, calculation procedures, and
procedures for transfer, frequency of SEC reports, and review and internal audit of
calculations and data. In addition to reviewing the monitoring documentation, the DEA
shall confirm that the project DC has complied with requests, if any, made during
validation. The verification report submitted by DEA in form B further goes through an
independent review and ex-post determination by BEE in a year of the energy
consumption norms and standards achieved in year out of three year compliance period.
This known as ‘check verification’ and this is also done through AEA.
There would not be any M&V during the intermediate years i.e. between 2012 &
2015. However, each DC would be required to submit the annual energy consumption
7 Accreditation of DEAs is undertaken by BEE under appropriate rules/ regulations in this regard.
The designated energy auditor shall be a legal entity and that it can function legally, enter into
contracts, make decisions independently, and may be sued for failure to perform as agreed in the
contract. DEA will have appropriate legal and financial liabilities for all its actions under the PAT
scheme and such liabilities will be an integral part of the accreditation.

32
through the ‘Form-1’ to BEE. Apart from this, one to two energy audits by ‘Accredited
energy auditors’ will be conducted by DCs as per the provision of EC Act, 2001. These
would form a basis of M&V system in the target year. The entire scheme of M & V
involved in the PAT activity could be schematically represented in Figure 15.
Figure 15: PAT Activity and M&V Flowchart
Source: BEE (2012)
2.6 PAT: Current Status
As reported by Reconnect energy8 based on a press release by BEE, there has been
satisfactory progress in the PAT scheme and the Bureau of Energy Efficiency (BEE)
appears to have actively taken the scheme forward. The first PAT cycle (2012-15) is
going to end in March 2015. The online PAT Net platform providing the foundation for
8 This section draws heavily on- http://reconnectenergy.com/blog/2015/01/preliminary-analysis-of-
pat-scheme/ (accessed January 14, 2015)

33
carrying out trading in ESCerts is at its final stage and consultants have been invited to
review the framework for ESCerts trading.
The final verification of the energy saving done is due followed by issuance of
ESCerts. The final verification and certification will be done by Accredited Energy
Auditors (AEA). After the verification, ESCerts will be issued.
From Figure 16 based on the recent press release, one can make out that demand is
likely to be seen in the first cycle. However, given that 50% of the DCs are yet to meet
the target, it would be worthwhile and interesting to watch the first round of ESCerts
market as the scheme is still in a nascent stage.
Figure 16: The status of PAT
The price of an ESCert will also attract the market which is variable in nature and
depends upon the market price of coal, gas & crude oil. The price of an ESCerts
determined by BEE for the year 2011-12 was Rs.10, 154.

34
2.7 PAT and Potential of Linking with International Carbon Markets
PAT mechanism has been set in place with the objective of improving industrial
energy efficiency in India. Given the potential benefit that India could derive from the
scheme in terms of energy security and cost curtailment or saving, the Government is
committed to implementing the proposed Mandatory Energy Efficiency PAT scheme
irrespective of any international climate change agreement (CII, 2011). Thus, the
Specific Energy Consumption (SEC) reduction targets under the PAT mechanism
neither create any international obligations nor are they directly intended to put any
overall cap on energy consumption.
The PAT mechanism also has a carbon emission reduction potential as a co-benefit
of the targeting of energy savings and calculations with respect to its potential in terms
of carbon abatement has been already illustrated in the previous section. Such energy
saving and concomitant emission reduction would be possible if the country has
increased access to capital and clean-technology. In that context, offset-based finance
like CDM provides a link between projects in developing countries and compliance-
based trading schemes, as there is no direct relationship otherwise between the
provision of funds and the underlying emission reduction performance.
The earlier research (Janardhanan and Srivastava, 2012) in understanding the
potential in linking the PAT mechanism with international offsets suggests that some
modifications in the rules and regulations of the PAT scheme may make it
institutionally compatible with CDM or bilateral offset mechanisms.
2.7.1 PAT: Synergy with CDM market
PAT has the potential to reduce around 98 million tonnes of CO2 per year (Garnaik,
2011). This potential could be exploited to finance the PAT scheme by exploiting the
carbon offsets market. Although the institutional mechanism for data collection,
monitoring and verification and reporting are in place, there are some grey areas that
need to be addressed before linking PAT to international carbon offsets.
The foremost among the challenges is addressing the criterion of ‘additionality’ in
approval of CDM projects i.e. whether the emission reduction that would happen (in

35
case a project or Programme of Activities gets approved as a CDM project) is additional
to what is stipulated by the legal and regulatory framework. There could be a serious
problem here in terms of demonstrating additionality in case of PAT because the
emission reduction is simply a co-benefit of a nationally determined target for SEC
reduction and in that sense it is not additional.
Additionally, the monitoring, reporting and verification (MRV) framework under
PAT, as mentioned before, is not directly geared towards reducing CO2 emission, hence
additional information and data needs to be collected on that count. Albeit not an
impossible task, such extension or inclusion would be clearly contingent upon
government’s willingness and approval.
The problem may get compounded when it comes to question of accessing data.
Currently the data and information on SECs of DCs are available to DCs, DEA
(Designated Energy Auditor), SDA (State Designated Authority) only through login
requirement whereas the CDM project design documents (PDDs) are open access
material and easily available on the designated website of UNFCCC. In case of PAT,
the DEAs that are involved in verifying or check-verifying are accredited by BEE
whereas the validating agency in case of CDM known as Designated Operational Entity
(DOE) are recognised by CDM Executive board through a different mechanism. Thus a
synergy has to be drawn in the processes so as to make PAT scheme eligible for offsets
under CDM.
It may also be too problematic to attempt an ex-ante allocation (crediting in advance
of the scheme on the basis of forecast energy efficiency improvement pertaining to PAT
scheme). The problem might be serious if there is over-allocation of CERs. Unless there
is harmonisation between the PAT Cycle and the issuance of CERs through an ex-post
crediting after say a PAT cycle is completed, the problem cannot be resolved.

36
2.7.2 PAT: Synergy with bilateral offsets
Among the various proposals for new market mechanisms that have been
deliberated upon, Bilateral Offset Credit Mechanism (BOCM) has been considered as
an option to facilitate the linking of PAT with international carbon offsets. The proposal
on BOCM had been submitted to UNFCCC by the Government of Japan in February,
2011. The primary differentiator of BOCM, as underscored by the Government of Japan,
is that the scheme would make faster diffusion of low carbon technology products and
services possible as compared to CDM which has not observed any significant
technology transfer (Das, 2011). The functioning of the BOCM is shown in Figure 17
Figure 17: Bilateral Offset Credit Mechanism
Source: http://pub.iges.or.jp/modules/envirolib/upload/4167/attach/IGES_Ninomiya_Asian_Carbon_Forum_Bankok.pdf (last accessed January 15, 2014)
As per the Japanese proposal, Japan would support projects in developing countries
that involve installation of low carbon technologies or involving low carbon products
and services. This would enable the host countries to reduce emissions and the emission
reduction would be counted under Japan’s emission reduction pledges. The computation
involved in balancing support on the technology and finance front with flow of offsets
would be contingent upon the mutually developed and agreed methodologies.
PAT scheme is focussed on targeted SEC reduction through reduced consumption of
fossil fuels and electricity within the designated boundary. The reduced consumption

37
and hence avoided production of fossil fuels could be translated to actual or avoided
emission reduction by using relevant emission coefficients of fuel (as illustrated before).
Hence, the compliance with the targeted energy saving norms and concomitant emission
reduction would require additional investment and installation of state of the art
technologies. This is where BOCM has the potential to contribute as a market
mechanism when it comes to both finance and technology. However, attempt to link the
two schemes would face methodology and policy related challenges besides the issue of
policy and political willingness to go for such linking at the first instance.
The primary methodological challenge would be to synergise the notion of offsets as
proposed in BOCM with that of emission reduction through targeted SEC reduction and
whether the institutional mechanism and the methodology to determine the latter would
be in synergy with what BOCM proposes as an institution mechanism for verification of
offsets. As the PAT mechanism has not been originally designed as an international
offset mechanism the institutional architecture is ideally suited to measure and address
domestic energy saving targets and may not necessarily hold good in its usual form
when ESCerts are used as instruments of international offsets. Additionally there exist
no components in the methodology especially in MRV mechanism pertaining to PAT
scheme that could make it compatible with MRV pertaining to BOCM or any other
international emission trading scheme, for that matter (IGES, 2012).
Furthermore, calculation of the offsets ought to be over and above the overall energy
saving targets that the PAT mechanism intends to achieve. Hence ESCerts would first
have to be accepted as meeting domestic energy saving objectives under National
Mission for Enhanced Energy Efficiency (NMEEE) and then as offsets under BOCM.
That essentially opens the room for double counting, as ESCerts are counted twice –
first, in meeting India’s domestic energy saving targets and second, accounted for in
meeting Japan’s or for that matter any other developed country’s emission reduction in
such bilateral offsets. Questions may not arise if PAT is completely delinked from
India’s international pledges to reduce emissions but with the Lima COP meeting
emphasising on firming up intended nationally determined contribution (INDCs)91011
9http://www.iiea.com/blogosphere/the-lima-call-to-action-and-the-role-of-national-pledges (last
accessed January 15, 2015)

38
India may well be inclined to count ESCerts towards meeting its domestic emission
reduction pledges. In that case such linking could be thrown open to question.
Another critical issue that has been deliberated widely is whether BOCM would be
equally acceptable at the level of international climate negotiations as well as in a host
country with equal credibility as CDM (IGES, 2012). In absence of clarity on that, the
basic purpose of BOCM to provide flexibility to Japan in addressing its emission
reduction pledges at lower costs would come to grief.
2.8 Conclusion
The biggest challenge that a country like India faces is decoupling its economic
growth from the concomitant growth in CO2 emission. An avenue to improve the
growth process without compromising on environmental quality and without
augmenting the spillover on global warming is through enhancement of energy
efficiency. In fact energy efficiency is considered as a least costly and no-regret option
when it comes to mitigating the impact on global warming. India’s National Action plan
on Climate Change (NAPCC) has a key component focusing on energy efficiency
known as the National Mission for Enhanced Energy Efficiency (NMEEE). Under the
umbrella of NMEEE, PAT has been introduced as a market based mechanism to
enhance industrial energy efficiency across energy intensive industrial sectors.
Considered in terms of CO2 emission, PAT has the potential to reduce 98 million
tonnes of CO2 annually (Garnaik, 2011). In the first cycle ranging from 2012 to 2015,
PAT has the target energy saving potential of 6.68 million tonnes of oil equivalent
spread across 8 highly energy intensive industries and in the second cycle there would
be both widening and deepening of the scheme with more energy-intensive sectors
(listed under the Energy Conservation Act 2001) to be brought under the scheme. The
mechanism involves target savings in terms of Specific Energy Consumption (SECs) set
across the level of unit or plant known as designated consumer and involves issuance of
10
http://www.business-standard.com/article/current-affairs/javadekar-warns-against-doing-away-with-interests-of-poor-at-lima-climate-talks-114121000140_1.html (last accessed January 15, 2015)
11 http://mitigationpartnership.net/intended-nationally-determined-contributions-indcs (last accessed
January 15, 2015)

39
energy saving certificates (ESCerts) for those who exceed the targeted savings. These
ESCerts could be traded either bilaterally by an over-achieving DC with an under-
achieving DC or could be bought by the under-achiever from power trading exchanges
(IEX and PXIL) that would be the depository of the certificates in electronic form. The
mechanism mimics a cap and trade mechanism but does not involve any absolute
emission reduction, albeit the unit of energy saving certificate in terms of tonnes of oil
equivalent could be equated to avoided unit of energy consumption and hence avoided
production. Currently, no such equivalence or fungibility exists between a unit of
emission reduction and a unit of energy saving certificate but is not difficult to bring out
such equivalence. An illustration has also been given in this paper on how one can
compute the potential emission reduction.
Market-based mechanisms have their inherent advantages as compared to command
and control, fiscal measures or other regulatory approaches for GHG mitigation such as
technology or performance standards and feed-in tariffs. The key advantages lie in their
ability to attain an emissions goal in a cost-effective manner and simultaneously
providing incentives for innovation and technology transfer. Beyond the benefits in
terms of cost-saving, these mechanisms also act as a potential source of revenue for the
governments. However there are certain gray areas that deserves due attention. These
includes: i) technical readiness, including coverage, monitoring and verification and
establishing registries; ii) policy readiness, including setting clear goals, choosing
appropriate instruments and distributing benefits; and iii) institutional and legal
readiness, including establishing responsibility for collection of data, issuance of
allowances or certificates or credits, and handling legal compliance issues (Aasrud,
Baron and Karousakis, 2010).
It is in these grey areas that coordination and harmonisation might be necessary
when it comes to integrating and linking any two market mechanism with potential for
generating carbon offsets. The paper has delved into a discussion of some of these
challenges of linking the ESCert based PAT scheme with CDM and with bilateral
offsets proposed by the Japanese Government. The PAT scheme is in its first cycle and

40
is just beginning to trade in ESCerts.12
Once the trading is successfully completed in the
first cycle without many hiccups it would be possible to throw better light in terms of
fungibility of ESCerts with other instruments relating to carbon offsets and hence
comment on the future of such linking.
12 As of November 2015, the roles and responsibilities of the entities involved and ESCerts exchange
regulation have been finalized and the PATNet portal that will record trading and other activities
involving ESCerts have been upgraded ( for more details see- http://knowledgeplatform.in/wp-
content/uploads/2015/11/Presentation-on-ESCerts-Trading.pdf, last accessed on 08 January 2016)

41
Acknowledgments
This work was supported by the Japan Society for the Promotion of Science (JSPS)
KAKENHI Grant Number 25340155.
References
Ahmed, M., and Supachalasai S. (2014) ‘Assessing the Cost of Climate Change and
Adaptation in South Asia’, Asian Development bank, available at
<http://adb.org/sites/default/files/pub/2014/assessing-costs-climate-change-and-
adaptation-south-asia.pdf > last accessed 10 January 2015
Aasrud, A., Baron R. and Karousakis K. (2010), ‘Market Readiness: Building Block for
Market Approaches’, Organisation for Economic Cooperation and Development
(OECD): Paris, available at < http://www.oecd.org/env/cc/46563135.pdf>
last accessed 11 January 2015
Bhattacharya, T. and Kapoor R. (2012), ‘Energy Saving Instrument-ESCert in India’,
Renewable and Sustainable Energy Reviews, Vol. 16, p 1311-1316, available at
<http://www.teriin.org/projects/nfa/pdf/Energy_Saving_Certificates.pdf>
last accessed 22 December 2014
Bureau of Energy Efficiency (2011), ‘PAT Consultation Document’, Ministry Of Power,
Government of India, available at –
<http://beeindia.in/NMEEE/PAT%20Consultation%20Document_10Jan2011.pdf>
last accessed 13 January 2015.
Bureau of Energy Efficiency (2012), ‘Perform Achieve and Trade’, Ministry of Power,
July. available at
<http://www.creda.in/sites/default/files/page-
document/PAT%20Booklet.pdf#overlay-context=energy-conservation-act-2001>
last accessed 18 December 2014
Central Pollution Control Board (2013), ‘Specifications and Guidelines for Continuous
Emissions Monitoring Systems (CEMS) for PM Measurement with Special
Reference to Emission Trading Programs’, available at
< http://cpcb.nic.in/upload/NewItems/NewItem_202_CEMS_Specs_v21-11-
13v_cpcb.pdf > last accessed 11 January 2015
Confederation of Indian Industry (2011), ‘Analysis of the Potential of Mandatory
Trading in Energy Savings Certificate to Drive Energy Efficiency in the Indian
Industrial Sector’, available at

42
< http://www.cii.in/webcms/Upload/Mandatory%20Report_Final.pdf >
last accessed 11 January 2015
Das, Kasturi (2011), ‘Technology Transfer under the Clean Development Mechanism:
An empirical Study of 1000 Projects’, Governance for Clean Development Working
Paper 14, available at
<http://www.tyndall.ac.uk/sites/default/files/gcd_workingpaper014.pdf>
last accessed 12 January 2015
Diddi, Saurabh (2011), ‘ Target Setting’, Capacity Building Workshop for State
Designated Agencies on Perform, Achieve and Trade Mechanism held in New Delhi
in 9th August, available at
<http://www.powerexindia.com/PAT/Presentations/9August2011/Target%20Setting
%20.pdf> last accessed 12 January 2015.
Duflo, E., Greenstone M., Pande R. and Ryan N. (2013), ‘Truth-telling by Third-party
Auditors and the Response of Polluting Firms: Experimental Evidence from India’,
The Quarterly Journal of Economics, vol. 128, no. 4, pp 1499-1545.
Duflo, E. Greenstone M., Pande R. and Ryan N. (2010), ‘Towards an Emissions
Trading Schemes for Air Pollutants in India : A Concept Note’, Ministry of
Environment and Forest, Government of India, available at
<http://www.moef.nic.in/downloads/public-information/towards-an-emissions-
trading-scheme-for-air-pollutants.pdf>last accessed 10 January 2015.
Government of India (2014), ‘Energy Statistics’, Ministry of Statistics and Programme
Implementation (MoSPI), New Delhi, available at
<http://mospi.nic.in/mospi_new/upload/Energy_stats_2014.pdf > last accessed 15
January 2015
Garnaik, S.P. (2011), ‘Perform, Achieve and Trade: BEE Experience’, available at
<http://www.iipnetwork.org/PAT-ppt_BEE%20Doc%209.pdf> last accessed 10
January 2015
Greenstone M., Krishnan A., Pande R., Ryan N. and Sudarshan A. (2011), ‘Improving
Human Health through a Market Friendly Emission Scheme’, available at
< http://www.hks.harvard.edu/fs/rpande/papers/market_health_benefits-3.pdf > last
accessed 11 January 2015.
Greenstone M., and Shah H. (2013), ‘Making Environmental Regulation Effective:
Experimental Evidence from India’, available at
< http://www.povertyactionlab.org/doc/e2a-2013-greenstone-shah > last accessed 12
January 2015.

43
International Energy Agency (2014), ‘CO2 emission from Fuel Combustion Highlights’,
IEA: Paris, available at
< http://www.iea.org/publications/freepublications/publication/co2-emissions-from-
fuel-combustion-highlights-2014.html> last accessed 12 December 2014
International Energy Agency (2010), ‘World Energy Outlook 2010’, Paris, available at
< http://www.worldenergyoutlook.org/media/weo2010.pdf > last accessed 20
December 2014
International Institute of Sustainable Development (2014), ‘10 Big Ideas for Making
Energy Efficiency Bankable in India’, available at
<http://www.iisd.org/publications/10-big-ideas-making-energy-efficiency-bankable-
india> last accessed 28 December 2014
Janardhanan N. K. and Srivastava M. K. (2012), ‘MRV Challenges of Integrating
National Initiatives into International Mechanisms: A Case of Perform, Achieve and
Trade Mechanism in India’, IGES Working paper, available at
<http://pub.iges.or.jp/modules/envirolib/view.php?docid=4170> last accessed 13
January 2015
Kumar, R. and Aggarwala A. (2013), ‘A Sustainable Energy Efficiency Solution in
Power Plant by Implementation of Perform, Achieve and Trade (PAT) Mechanism’,
Open Journal of Energy Efficiency, Vol. 2, pp 154-162, available at
<www.researchgate.net/540eeb6e0cf2f2b29a3c7778.pdf> last accessed 10 January
2015
Ministry of Power (2012), PAT Rules, Notification G.S.R. 269(E), Government of India,
New Delhi, March 30, available at
<http://www.creda.in/sites/default/files/page-
document/PAT_Rules_English.PDF#overlay-context=energy-conservation-act-
2001> last accessed 25 December 2014
Singh, Neelam (2013), ‘Creating Market Support for Energy Efficiency: India’s
Perform, Achieve and Trade Scheme’, Inside Stories, January, Climate &
Development Knowledge Network’, available at
<http://cdkn.org/resource/creating-market-support-for-energy-efficiency-indias-
perform-achieve-and-trade-scheme/ > last accessed 05 January 2015
Tata Strategic Management Group (2014), ‘Energy Efficiency in India: PAT Scheme-
The Way Ahead’, knowledge paper released at the Energy Management and
Excellence Summit in July, available at
<http://www.tsmg.com/download/reports/EE_in_India_PAT_The_Way_Ahead.pdf
> last accessed 02 January 2015

44
Upadhyay, P (2010), ‘Is Emission Trading a Possible Policy Option for India’, Climate
Policy , Vol. 10, no. 5, pp 560-574, available at
<http://www.ingentaconnect.com/content/tandf/cpol/2010/00000010/00000005/art0
0006?crawler=true> last accessed 12 January 2015
Verma, P., Verma A., Bhaskar M. S. (2013), ‘ Indian Energy Saving Certificate
(ESCert) Scheme Towards Addressing Climate Change Issues’, International
Journal of Environmental Science: Development and Monitoring (IJESDM), Vol. 4,
No. 3, available at <http://www.ripublication.com/ijesdmspl/ijesdmv4n3_07.pdf>
last accessed 28 December 2014